Making the Most of Alarms as a Layer of ProtectionLayer of Protection Analysis . Layer of Protection...
16
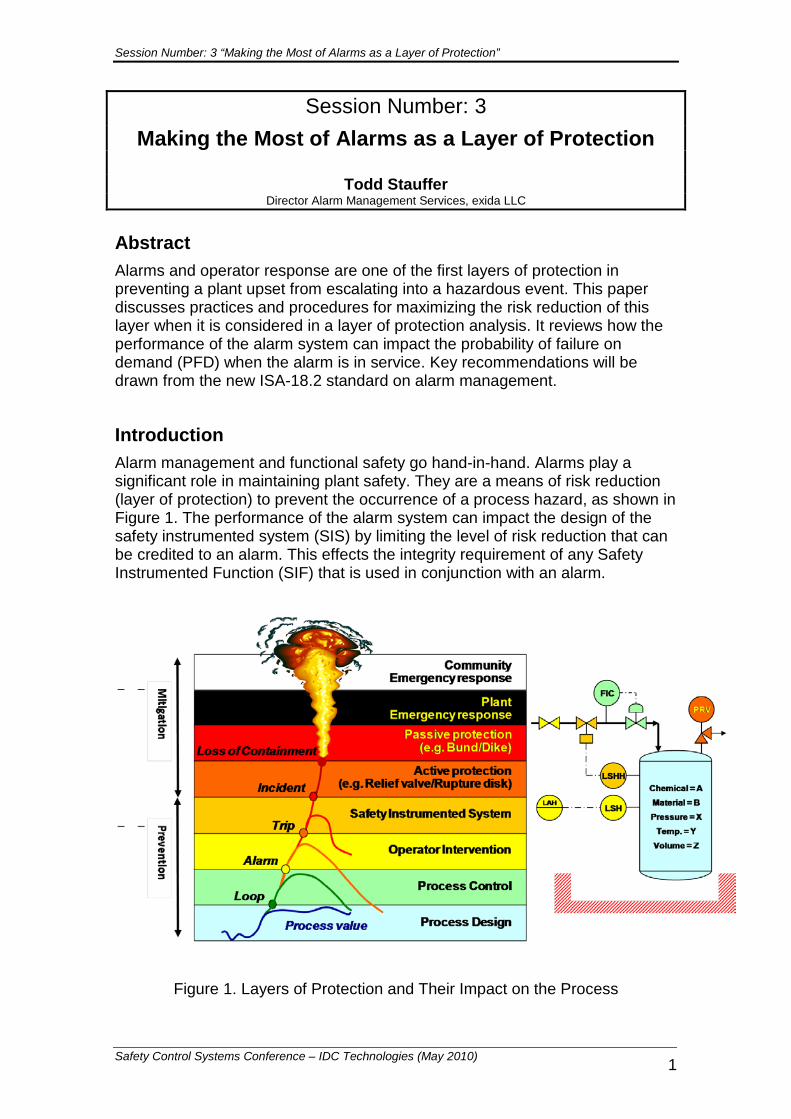
Session Number: 3 “Making the Most of Alarms as a Layer of Protection” Safety Control Systems Conference – IDC Technologies (May 2010) 1 Session Number: 3 Making the Most of Alarms as a Layer of Protection Todd Stauffer Director Alarm Management Services, exida LLC Abstract Alarms and operator response are one of the first layers of protection in preventing a plant upset from escalating into a hazardous event. This paper discusses practices and procedures for maximizing the risk reduction of this layer when it is considered in a layer of protection analysis. It reviews how the performance of the alarm system can impact the probability of failure on demand (PFD) when the alarm is in service. Key recommendations will be drawn from the new ISA-18.2 standard on alarm management. Introduction Alarm management and functional safety go hand-in-hand. Alarms play a significant role in maintaining plant safety. They are a means of risk reduction (layer of protection) to prevent the occurrence of a process hazard, as shown in Figure 1. The performance of the alarm system can impact the design of the safety instrumented system (SIS) by limiting the level of risk reduction that can be credited to an alarm. This effects the integrity requirement of any Safety Instrumented Function (SIF) that is used in conjunction with an alarm. Figure 1. Layers of Protection and Their Impact on the Process
Transcript of Making the Most of Alarms as a Layer of ProtectionLayer of Protection Analysis . Layer of Protection...
Session Number: 3 “Making the Most of Alarms as a Layer of Protection”
Safety Control Systems Conference – IDC Technologies (May 2010) 1
Session Number: 3 Making the Most of Alarms as a Layer of Protection
Todd Stauffer
Director Alarm Management Services, exida LLC
Abstract Alarms and operator response are one of the first layers of protection in preventing a plant upset from escalating into a hazardous event. This paper discusses practices and procedures for maximizing the risk reduction of this layer when it is considered in a layer of protection analysis. It reviews how the performance of the alarm system can impact the probability of failure on demand (PFD) when the alarm is in service. Key recommendations will be drawn from the new ISA-18.2 standard on alarm management.
Introduction Alarm management and functional safety go hand-in-hand. Alarms play a significant role in maintaining plant safety. They are a means of risk reduction (layer of protection) to prevent the occurrence of a process hazard, as shown in Figure 1. The performance of the alarm system can impact the design of the safety instrumented system (SIS) by limiting the level of risk reduction that can be credited to an alarm. This effects the integrity requirement of any Safety Instrumented Function (SIF) that is used in conjunction with an alarm.
Figure 1. Layers of Protection and Their Impact on the Process
Session Number: 3 “Making the Most of Alarms as a Layer of Protection”
Safety Control Systems Conference – IDC Technologies (May 2010) 2
When alarms fail as a layer of protection, catastrophic accidents, such as Milford Haven (UK), Texas City (USA), and Buncefield (UK) can be the result. At the Buncefield Oil Depot, a failure of a tank level sensor prevented its associated high level alarm from being annunciated to the operator. As the level in the tank reached its ‘ultimate’ high level, a second protection layer, an independent safety switch, failed to trigger an alarm to notify the operator and failed to initiate a trip which would have automatically closed the valve to shut off the incoming flow. The tank overflow and ensuing fire resulted in a £1 billion (1.6 billion USD) loss [1]. The need for alarms may be identified during functional safety lifecycle design activities such as Process Hazard Analysis (PHA), Layer of Protection Analysis (LOPA), and Safety Requirements Specification (SRS) development [2]. This paper focuses on alarm management considerations of Safety IPL Alarms, which are those alarms that are identified during a LOPA. The general principles in this paper, however, pertain to any alarm that helps to reduce risk - qualitatively or quantitatively.
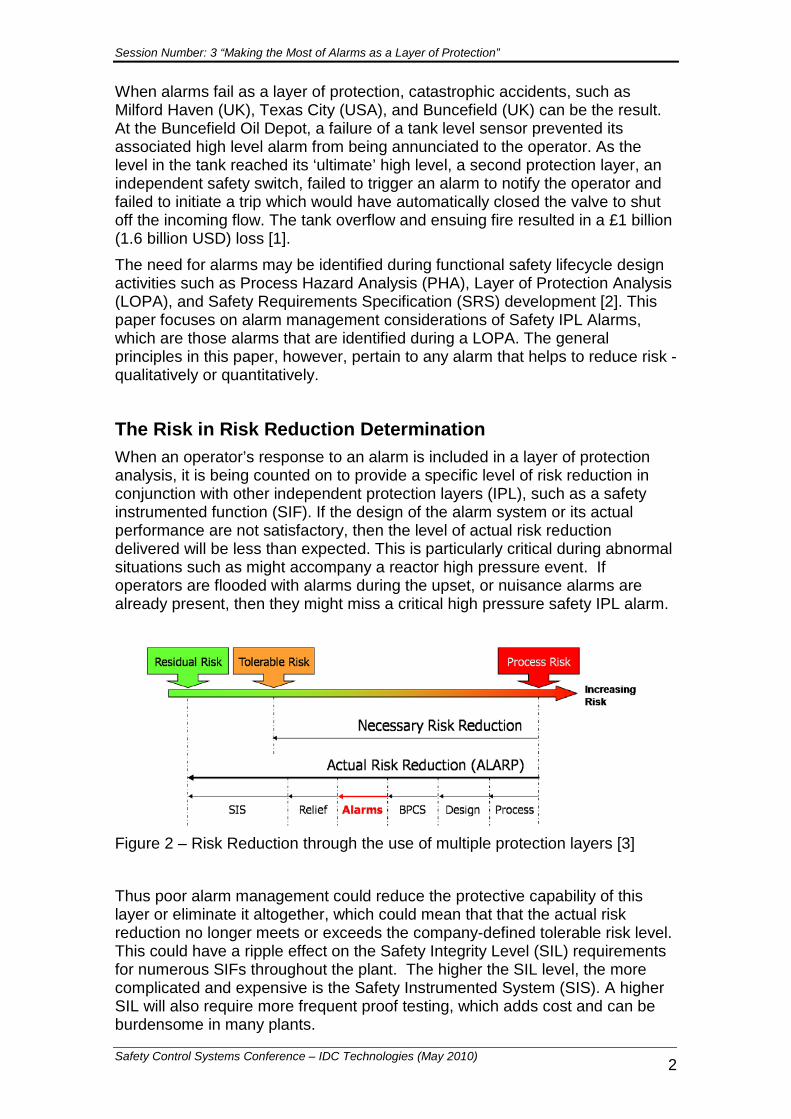
The Risk in Risk Reduction Determination When an operator’s response to an alarm is included in a layer of protection analysis, it is being counted on to provide a specific level of risk reduction in conjunction with other independent protection layers (IPL), such as a safety instrumented function (SIF). If the design of the alarm system or its actual performance are not satisfactory, then the level of actual risk reduction delivered will be less than expected. This is particularly critical during abnormal situations such as might accompany a reactor high pressure event. If operators are flooded with alarms during the upset, or nuisance alarms are already present, then they might miss a critical high pressure safety IPL alarm.
Figure 2 – Risk Reduction through the use of multiple protection layers [3] Thus poor alarm management could reduce the protective capability of this layer or eliminate it altogether, which could mean that that the actual risk reduction no longer meets or exceeds the company-defined tolerable risk level. This could have a ripple effect on the Safety Integrity Level (SIL) requirements for numerous SIFs throughout the plant. The higher the SIL level, the more complicated and expensive is the Safety Instrumented System (SIS). A higher SIL will also require more frequent proof testing, which adds cost and can be burdensome in many plants.
Session Number: 3 “Making the Most of Alarms as a Layer of Protection”
Safety Control Systems Conference – IDC Technologies (May 2010) 3
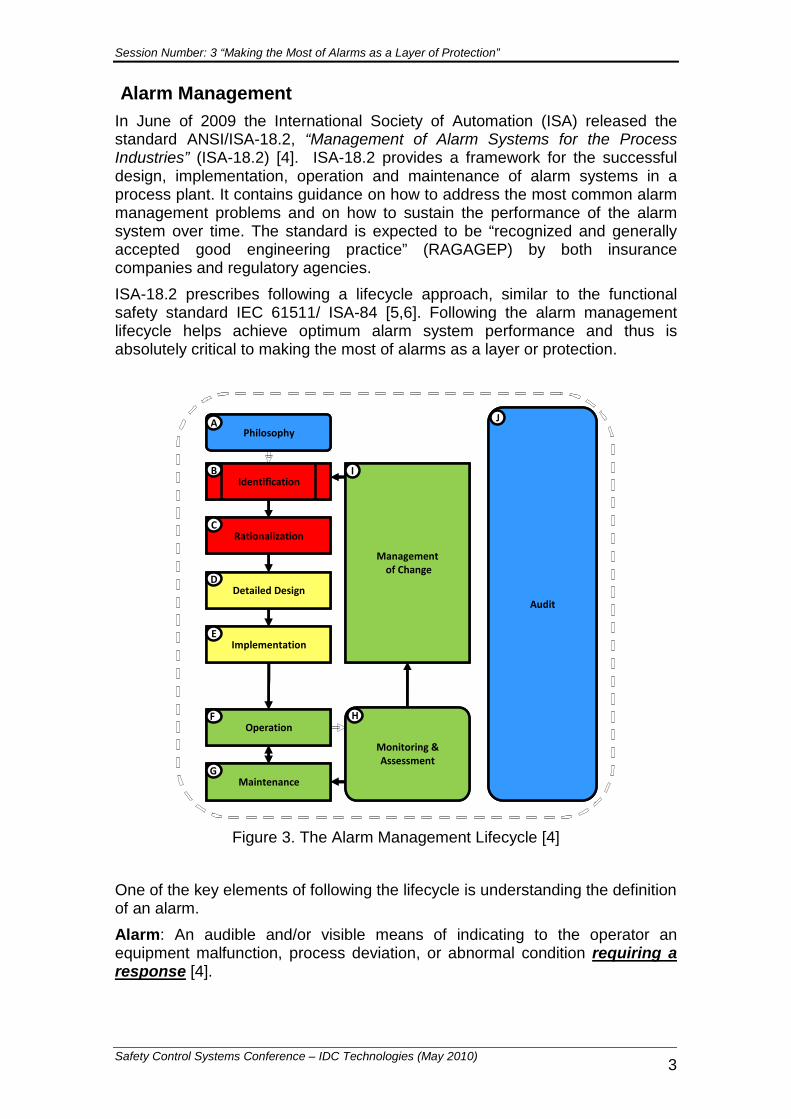
Alarm Management In June of 2009 the International Society of Automation (ISA) released the standard ANSI/ISA-18.2, “Management of Alarm Systems for the Process Industries” (ISA-18.2) [4]. ISA-18.2 provides a framework for the successful design, implementation, operation and maintenance of alarm systems in a process plant. It contains guidance on how to address the most common alarm management problems and on how to sustain the performance of the alarm system over time. The standard is expected to be “recognized and generally accepted good engineering practice” (RAGAGEP) by both insurance companies and regulatory agencies. ISA-18.2 prescribes following a lifecycle approach, similar to the functional safety standard IEC 61511/ ISA-84 [5,6]. Following the alarm management lifecycle helps achieve optimum alarm system performance and thus is absolutely critical to making the most of alarms as a layer or protection.
Monitoring & Assessment
Philosophy
Audit
Rationalization
Identification
Detailed Design
Implementation
Maintenance
Operation
Managementof Change
D
C
E
A J
B
G
HF
I
Monitoring & Assessment
Philosophy
Audit
Rationalization
Identification
Detailed Design
Implementation
Maintenance
Operation
Managementof Change
D
C
E
A J
B
G
HF
I
Figure 3. The Alarm Management Lifecycle [4]
One of the key elements of following the lifecycle is understanding the definition of an alarm. Alarm: An audible and/or visible means of indicating to the operator an equipment malfunction, process deviation, or abnormal condition requiring a response
[4].
Session Number: 3 “Making the Most of Alarms as a Layer of Protection”
Safety Control Systems Conference – IDC Technologies (May 2010) 4
An important principle of ISA-18.2 is that an alarm requires a response. This means if the operator does not need to respond, then there should not be an alarm. Following this cardinal rule will help eliminate many potential alarm management issues, leading to improved performance.
Similarities and Difference between Alarms and SIFs A typical petrochemical plant has a small number of safety instrumented functions, but may have hundreds or thousands of alarms in the Basic Process Control System (BPCS). Each safety instrumented function is evaluated individually and is designed and verified to address a specific hazard. An alarm is also evaluated individually, but because all alarms are processed by the operator before the associated action is taken, the alarm system must also be evaluated as a whole. The alarm load on the operator, the presence of nuisance alarms (analogous to spurious trips), and the relative distribution of alarm priorities, have been shown to have a significant impact on the probability that an operator will take the correct action when an alarm is annunciated. Alarms and SIFs share a common purpose of helping to reduce the risk of unwanted events. They are both assigned a criticality – priority for alarms, and safety integrity level for SIFs. They can work together to reduce risk or can be used in an either / or relationship. Many practitioners consider whethe an alarm should be upgraded to a form of automatic protection, or whether a trip should be downgraded to alarm status. [7]
Layer of Protection Analysis Layer of Protection Analysis is one of the most commonly used techniques for risk assessment in the functional safety lifecycle. The primary goal of a LOPA is to determine if there are adequate protective devices or features in the process to produce a tolerable risk level. These protective devices or features are called Protection Layers or Independent Protection Layers (IPLs). Examples of potential protection layers include the basic process control system (BPCS), operator intervention, the mechanical integrity of a vessel, physical relief devices, and a safety instrumented function. For an operator response to alarm to be considered an independent protection layer (IPL), it must meet several criteria.
• Specific – The alarm must be specifically designed to prevent the consequences under consideration.
• Auditable – It should be proof tested and maintained. Audits of operation are necessary to ensure that the specified level of risk reduction is being achieved.
• Independent – The alarm must operate completely independently of all other protection layers; no common equipment can be shared with other protection layers.
• Dependable – The alarm must be able to dependably prevent the consequence from occuring. [8]
Session Number: 3 “Making the Most of Alarms as a Layer of Protection”
Safety Control Systems Conference – IDC Technologies (May 2010) 5
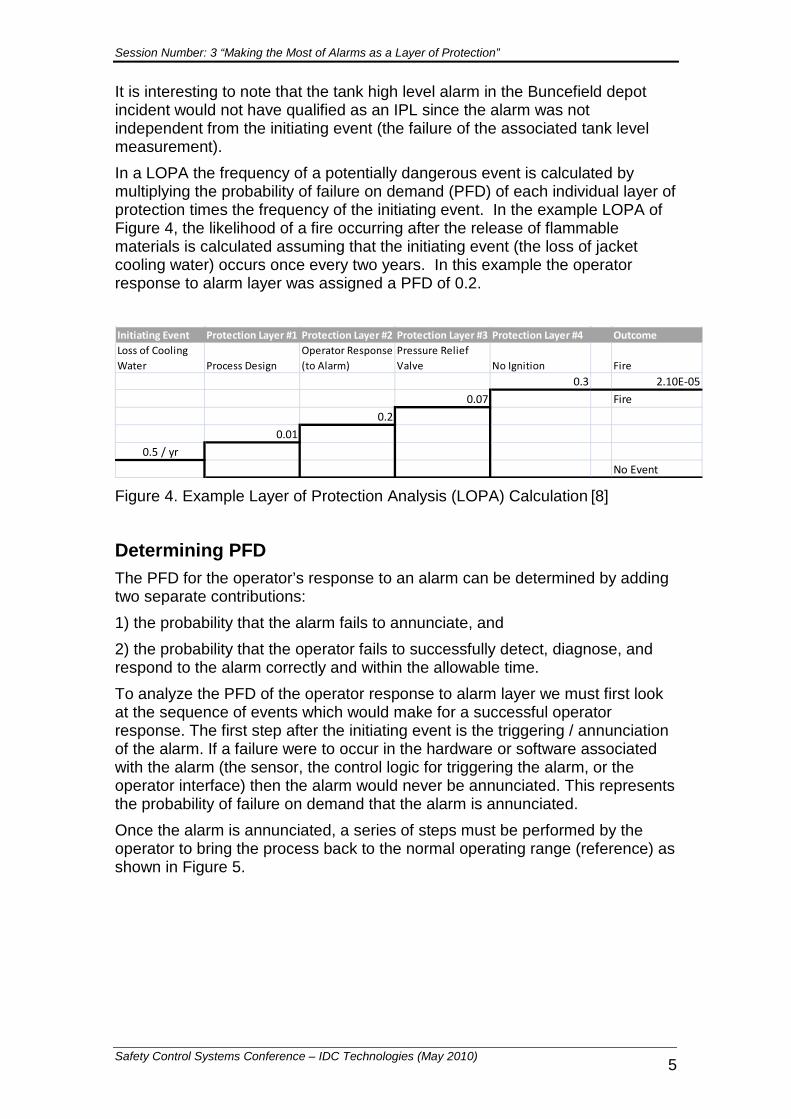
It is interesting to note that the tank high level alarm in the Buncefield depot incident would not have qualified as an IPL since the alarm was not independent from the initiating event (the failure of the associated tank level measurement). In a LOPA the frequency of a potentially dangerous event is calculated by multiplying the probability of failure on demand (PFD) of each individual layer of protection times the frequency of the initiating event. In the example LOPA of Figure 4, the likelihood of a fire occurring after the release of flammable materials is calculated assuming that the initiating event (the loss of jacket cooling water) occurs once every two years. In this example the operator response to alarm layer was assigned a PFD of 0.2. Initiating Event Protection Layer #1 Protection Layer #2 Protection Layer #3 Protection Layer #4 OutcomeLoss of Cooling Water Process Design
Operator Response (to Alarm)
Pressure Relief Valve No Ignition Fire
0.3 2.10E-05
0.07 Fire
0.2
0.01
0.5 / yr
No Event Figure 4. Example Layer of Protection Analysis (LOPA) Calculation [8]
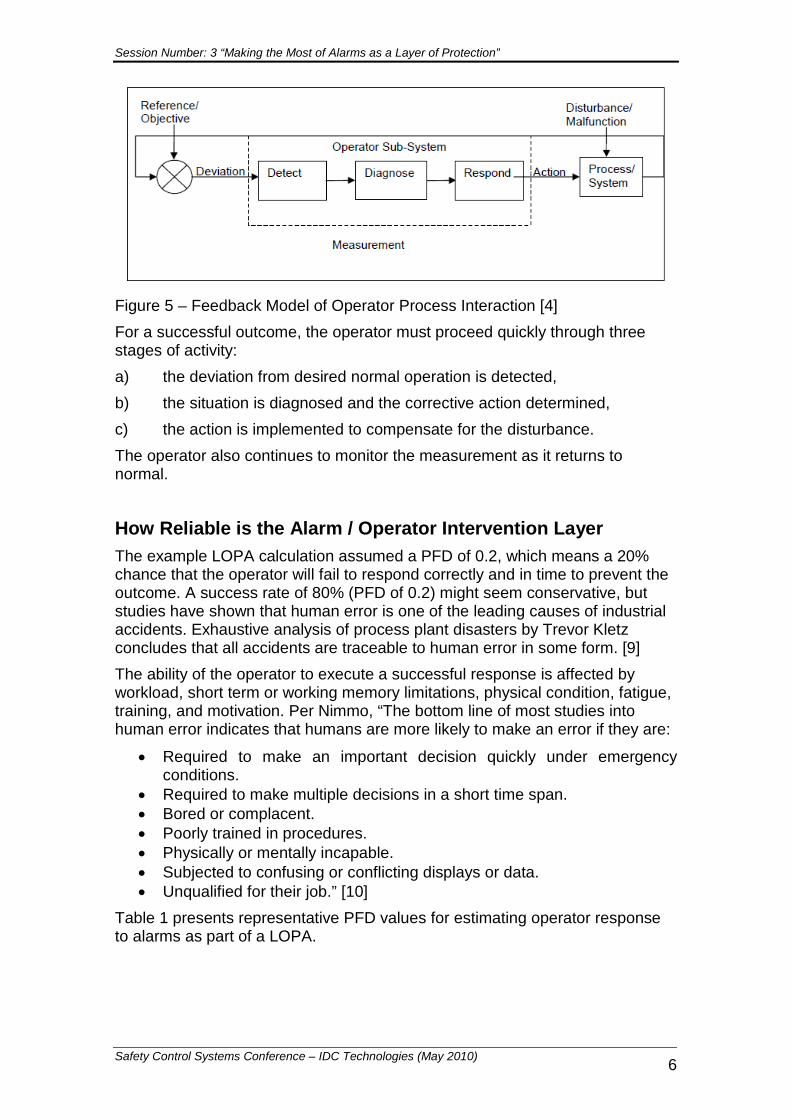
Determining PFD The PFD for the operator’s response to an alarm can be determined by adding two separate contributions: 1) the probability that the alarm fails to annunciate, and 2) the probability that the operator fails to successfully detect, diagnose, and respond to the alarm correctly and within the allowable time. To analyze the PFD of the operator response to alarm layer we must first look at the sequence of events which would make for a successful operator response. The first step after the initiating event is the triggering / annunciation of the alarm. If a failure were to occur in the hardware or software associated with the alarm (the sensor, the control logic for triggering the alarm, or the operator interface) then the alarm would never be annunciated. This represents the probability of failure on demand that the alarm is annunciated. Once the alarm is annunciated, a series of steps must be performed by the operator to bring the process back to the normal operating range (reference) as shown in Figure 5.
Session Number: 3 “Making the Most of Alarms as a Layer of Protection”
Safety Control Systems Conference – IDC Technologies (May 2010) 6
Figure 5 – Feedback Model of Operator Process Interaction [4] For a successful outcome, the operator must proceed quickly through three stages of activity: a) the deviation from desired normal operation is detected, b) the situation is diagnosed and the corrective action determined, c) the action is implemented to compensate for the disturbance. The operator also continues to monitor the measurement as it returns to normal.
How Reliable is the Alarm / Operator Intervention Layer The example LOPA calculation assumed a PFD of 0.2, which means a 20% chance that the operator will fail to respond correctly and in time to prevent the outcome. A success rate of 80% (PFD of 0.2) might seem conservative, but studies have shown that human error is one of the leading causes of industrial accidents. Exhaustive analysis of process plant disasters by Trevor Kletz concludes that all accidents are traceable to human error in some form. [9] The ability of the operator to execute a successful response is affected by workload, short term or working memory limitations, physical condition, fatigue, training, and motivation. Per Nimmo, “The bottom line of most studies into human error indicates that humans are more likely to make an error if they are:
• Required to make an important decision quickly under emergency conditions.
• Required to make multiple decisions in a short time span. • Bored or complacent. • Poorly trained in procedures. • Physically or mentally incapable. • Subjected to confusing or conflicting displays or data. • Unqualified for their job.” [10]
Table 1 presents representative PFD values for estimating operator response to alarms as part of a LOPA.

Session Number: 3 “Making the Most of Alarms as a Layer of Protection”
Safety Control Systems Conference – IDC Technologies (May 2010) 7
Category Description Probability that Operator
responds successfully
PFD SIL
1 Normal Operator Response – In order for an operator to respond normally to a dangerous situation, the following criteria should be true:
• Ample indications exist that there is a condition requiring a shutdown
• Operator has been trained in proper response • Operator has ample time (> 20 minutes) to
perform the shutdown • Operator is ALWAYS monitoring the process
(relieved for breaks)
90% 0.1 1
2 Drilled Response – All of the conditions for a normal operator intervention are satisfied and a “drilled response” program is in place at the facility.
• Drilled response exists when written procedures, which are strictly followed, are drilled or repeatedly trained by the operations staff.
• The drilled set of shutdowns forms a small fraction of all alarms where response is so highly practiced that its implementation is automatic
• This condition is RARELY achieved in most process plants
99% 0.01 2
3 Response Unlikely / Unreliable – ALL of the conditions for a normal operator intervention probability have NOT been satisfied
0% 1.0 0
Table 1 – Simplified Technique for Estimating Operator Response [8]
Reviewing this table shows that there are specific conditions that must be met for a PFD of 0.1 or 0.01 to be appropriate. It is very rare that conditions in a process plant would be conducive to claiming a 0.01 PFD. A survey of the literature shows some that there is some variation in recommended PFD. EEMUA 191, which also provides performance-based guidelines, recommends not using a PFD below 0.01 for any operator action, even if it is multiple alarmed and very simple [11]. The IEC 61511 / ISA 84 standard also provides PFD recommendations that can be used for performing a LOPA (shown in Table 2).
Session Number: 3 “Making the Most of Alarms as a Layer of Protection”
Safety Control Systems Conference – IDC Technologies (May 2010) 8
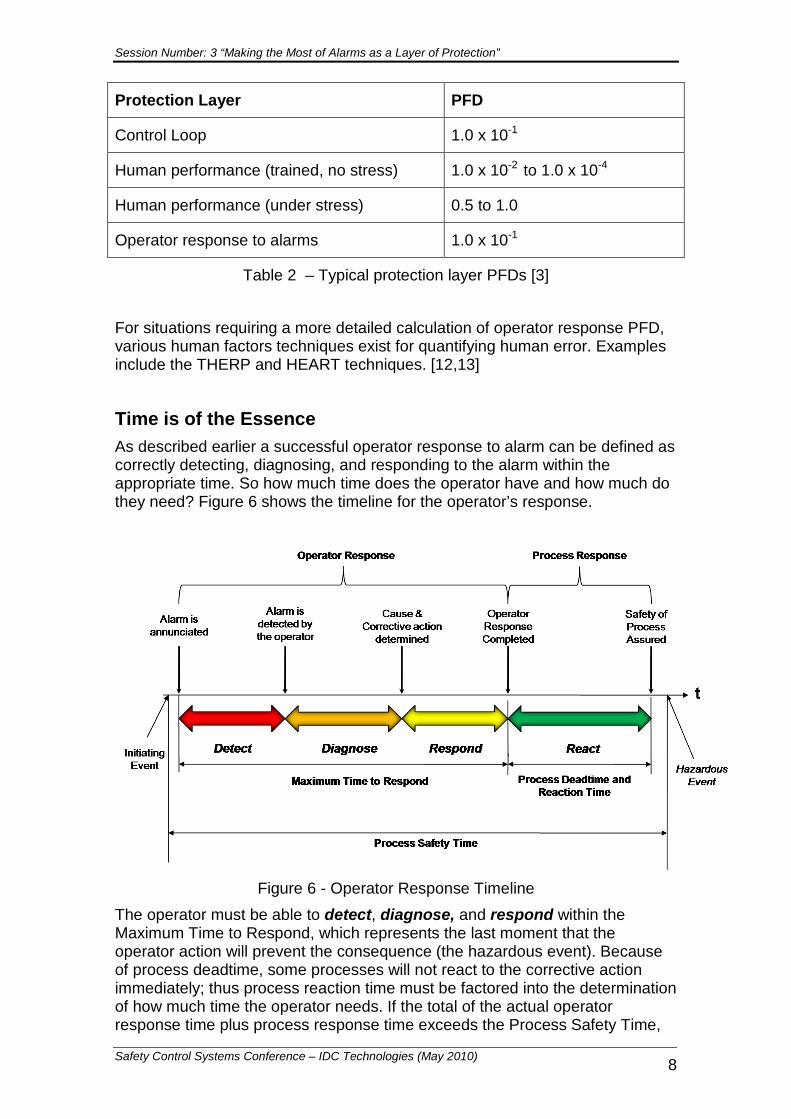
Protection Layer PFD
Control Loop 1.0 x 10⁻¹
Human performance (trained, no stress) 1.0 x 10⁻² to 1.0 x 10⁻⁴
Human performance (under stress) 0.5 to 1.0
Operator response to alarms 1.0 x 10⁻¹
Table 2 – Typical protection layer PFDs [3] For situations requiring a more detailed calculation of operator response PFD, various human factors techniques exist for quantifying human error. Examples include the THERP and HEART techniques. [12,13]
Time is of the Essence As described earlier a successful operator response to alarm can be defined as correctly detecting, diagnosing, and responding to the alarm within the appropriate time. So how much time does the operator have and how much do they need? Figure 6 shows the timeline for the operator’s response.
Figure 6 - Operator Response Timeline
The operator must be able to detect, diagnose, and respond within the Maximum Time to Respond, which represents the last moment that the operator action will prevent the consequence (the hazardous event). Because of process deadtime, some processes will not react to the corrective action immediately; thus process reaction time must be factored into the determination of how much time the operator needs. If the total of the actual operator response time plus process response time exceeds the Process Safety Time,
Session Number: 3 “Making the Most of Alarms as a Layer of Protection”
Safety Control Systems Conference – IDC Technologies (May 2010) 9
which is the time between the initiating event and occurrence of the hazardous event, then the alarm plus operator action has failed as a layer protection. Therefore a key requirement for a Safety IPL alarm to be valid is
t Detect, Diagnose, & Respond + t Deadtime < t Process Safety Time.
It is also important to define a minimum operator response time, which is the minimum amount of time that must be provided to the operator for them to respond to any alarm in the system. This parameter can vary from 10 to 30 minutes depending upon company operation and the time required to carry out the alarm response actions. If the operator must leave the control room to go out into the field or work with an outside operator, then the minimum response time will need to reflect this. In some cases an operator activity analysis may be required to set the minimum operator response time. During a LOPA, it is important to factor the operator response time into the analysis. Comparing the process safety time for the hazardous event to the minimum operator response time is a good first step to determine whether an alarm can be used as a layer of protection. If the process safety time is not greater than the minimum operator response time, preferably by 5 minutes or more, then the alarm will not likely make it as an IPL.
t Process Safety Time > t Minimum Operator Response Time In a high pressure event, the process safety time may be short (on the order of 30 seconds), which would preclude the use of operator intervention and dictate the need for an automated protection response. One company has set a minimum operator response time of 10 minutes and prescribed that any alarm which has a process safety time of less than 10 minutes cannot be claimed as a layer of protection (PFD = 1.0). In some cases it is possible to adjust the alarm limit (setpoint) to increase the time available for the operator so that it is greater than the minimum operator response time.
t Detect, Diagnose, & Respond > t Minimum Operator Response Time
Adjusting the alarm limit can have significant tradeoffs. Setting the alarm limit closer to the normal operating conditions will provide the operator with greater time to respond, but may result in nuisance alarms under some operating conditions. The occurrence of nuisance alarms can reduce the operator’s confidence in the alarm and affect the probability that they would initiate the required actions in the event of a genuine alarm. Setting the alarm limit closer to the consequence threshold maintains the operator’s confidence in the alarm, but affects the probability that the operator would complete the required action in time.
How to Optimize the PFD of the Alarm Following the alarm management lifecycle in ISA-18.2 is critical to optimizing the probability of failure on demand of the operator’s response to an alarm.

Session Number: 3 “Making the Most of Alarms as a Layer of Protection”
Safety Control Systems Conference – IDC Technologies (May 2010) 10
Following the recommendations extracted from ISA-18.2 presented below will help minimize the amount of time required to detect, diagnose and respond, which helps deliver the maximum risk reduction possible.
Maintenance and Testing to Ensure Alarm Integrity Periodic maintenance and testing are critical to ensuring the integrity of a safety IPL alarm. Alarms should be proof tested at the frequency that is necessary to deliver the appropriate PFD. The interval selected is dependent on the criticality of the alarm in question and the statistical likelihood of the alarm failing. Because of their criticality, safety IPL alarms should be considered for inclusion in a site-wide mechanical integrity program, such as what would be required by OSHA PSM 1910.119 (j)(1)(v). Associated instrumentation may be classified as OSHA PSM critical. Safety IPL alarms should be tested according to written test procedures and their results reviewed and clearly documented. Whenever possible, testing of Safety IPL alarms should include verification of correct operator response. One of the findings from the Buncefield investigation was that the design and location of the independent high level safety switch made it difficult to test. It also highlighed the importance of being able to verify alarm integrity. According to the investigation “the detection of ultimate high liquid level in storage tanks often relies on a switch mounted on the roof of the tank (or on the uppermost level of the tank wall). The operation of the switch cannot be tested fully in situ other than by raising the liquid level in the tank to the ultimate high level. Any other means of testing will leave a number of potential failure modes uncovered and so leave the switch in a faulty state unbeknownst to the operator or maintenance staff.” [1] Classification helps Manage Critical Alarms Alarms that have been credited with risk reduction should be assigned to an appropriate classification (such as critical to Process Safety) during the rationalization stage of the alarm management lifecycle. Classification allows groups of alarms with similar characteristics and requirements for training, testing, documentation, data retention, reporting, or management of change to be lumped together for easier management. According to ISA-18.2, alarm classes and their associated requirements should be defined in an alarm philosophy document. Rationalize the Alarm Database to ensure that every alarm is needed and prioritized The modern DCS makes it extremely easy to add alarms without significant effort or cost. This has led to alarm overload in the control room and a proliferation of nuisance alarms. Alarm rationalization is the process of finding the minimum set of alarms that are needed to keep the process safe and in the normal operating range. Rationalization entails reviewing potential or existing alarms to justify that they meet the criteria for being an alarm. It includes defining and documenting the design attributes (such as priority, limit, type and
Session Number: 3 “Making the Most of Alarms as a Layer of Protection”
Safety Control Systems Conference – IDC Technologies (May 2010) 11
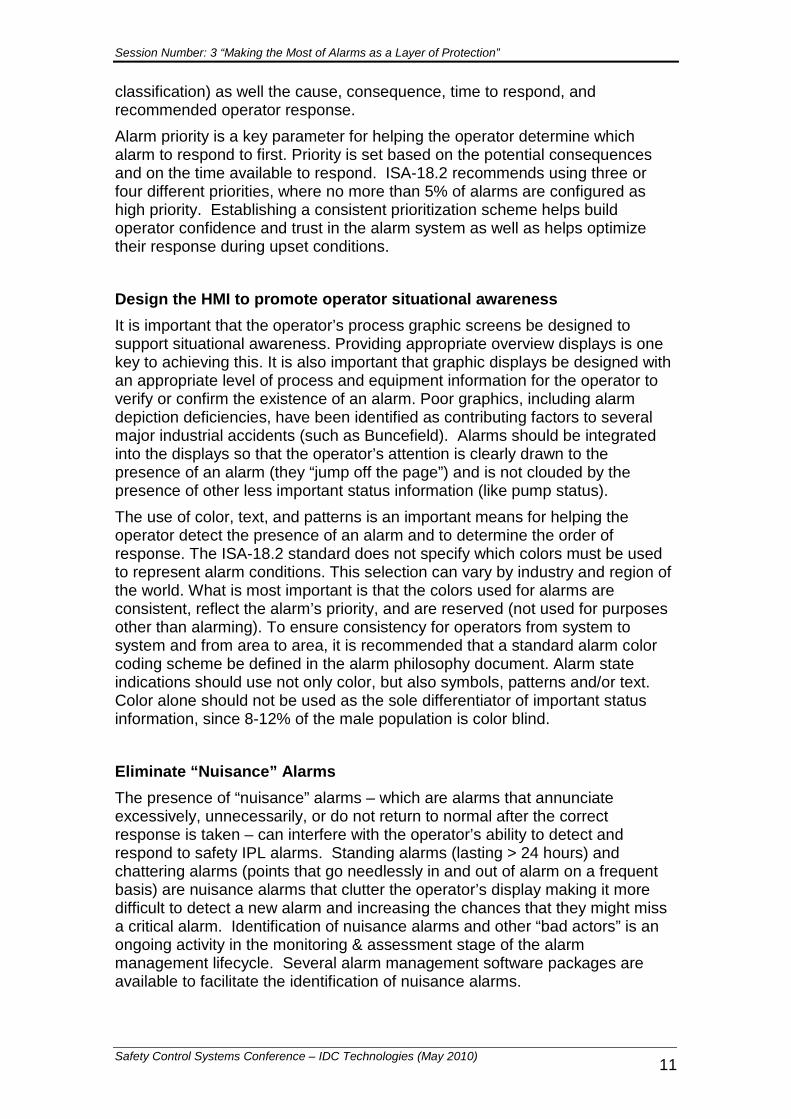
classification) as well the cause, consequence, time to respond, and recommended operator response. Alarm priority is a key parameter for helping the operator determine which alarm to respond to first. Priority is set based on the potential consequences and on the time available to respond. ISA-18.2 recommends using three or four different priorities, where no more than 5% of alarms are configured as high priority. Establishing a consistent prioritization scheme helps build operator confidence and trust in the alarm system as well as helps optimize their response during upset conditions. Design the HMI to promote operator situational awareness It is important that the operator’s process graphic screens be designed to support situational awareness. Providing appropriate overview displays is one key to achieving this. It is also important that graphic displays be designed with an appropriate level of process and equipment information for the operator to verify or confirm the existence of an alarm. Poor graphics, including alarm depiction deficiencies, have been identified as contributing factors to several major industrial accidents (such as Buncefield). Alarms should be integrated into the displays so that the operator’s attention is clearly drawn to the presence of an alarm (they “jump off the page”) and is not clouded by the presence of other less important status information (like pump status). The use of color, text, and patterns is an important means for helping the operator detect the presence of an alarm and to determine the order of response. The ISA-18.2 standard does not specify which colors must be used to represent alarm conditions. This selection can vary by industry and region of the world. What is most important is that the colors used for alarms are consistent, reflect the alarm’s priority, and are reserved (not used for purposes other than alarming). To ensure consistency for operators from system to system and from area to area, it is recommended that a standard alarm color coding scheme be defined in the alarm philosophy document. Alarm state indications should use not only color, but also symbols, patterns and/or text. Color alone should not be used as the sole differentiator of important status information, since 8-12% of the male population is color blind. Eliminate “Nuisance” Alarms The presence of “nuisance” alarms – which are alarms that annunciate excessively, unnecessarily, or do not return to normal after the correct response is taken – can interfere with the operator’s ability to detect and respond to safety IPL alarms. Standing alarms (lasting > 24 hours) and chattering alarms (points that go needlessly in and out of alarm on a frequent basis) are nuisance alarms that clutter the operator’s display making it more difficult to detect a new alarm and increasing the chances that they might miss a critical alarm. Identification of nuisance alarms and other “bad actors” is an ongoing activity in the monitoring & assessment stage of the alarm management lifecycle. Several alarm management software packages are available to facilitate the identification of nuisance alarms.
Session Number: 3 “Making the Most of Alarms as a Layer of Protection”
Safety Control Systems Conference – IDC Technologies (May 2010) 12
Figure 7. Using Tools to Identify Nuisance Alarms
Once nuisance alarms are identified, they are returned to the Rationalization stage of the lifecycle where they are reviewed and redesigned as necessary. Poor configuration practices are one of the leading causes of nuisance alarms. Effective use of alarm deadbands and on / off-delays can reduce or eliminate them. An ASM study found that diligent use of on-off delays was able to help reduce the number of alarms by 45 – 90% [14]. Having an unrationalized alarm configuration can also contribute to nuisance alarms. Practice Makes Perfect For alarms to be effective it is critical that the operator know what to do in the event of the alarm and that they have confidence in the alarm system. Training on how to respond to safety IPL alarms is especially important as these alarms will not occur frequently and because they are most likely to occur during a major plant upset. As shown in Table 1, operator training is clearly linked to the level of risk reduction that can be achieved. Training the operator as part of process simulation can create a “drilled response” where corrective action is so-well reinforced that it is automatic. Make Alarm Response Procedures available online The ISA-18.2 standard recommends that the information documented during alarm rationalization (cause, consequence, operator action, time to respond) be made available to the operator. This information can be indispensable for helping diagnose the problem and determine the best response. Online access to this information provided in context is more effective than the use of paper documents. Minimize Alarm Load on the Operator by Monitoring Alarm System Performance Monitoring of alarm system performance is critical to maintaining the integrity of safety IPL alarms and ensuring a successful operator response. Alarm overload is a main reason why operators “miss” alarms. The PFD of a safety IPL alarm cannot be determined without an understanding of the overall performance of the alarm system. As one might expect the higher the alarm

Session Number: 3 “Making the Most of Alarms as a Layer of Protection”
Safety Control Systems Conference – IDC Technologies (May 2010) 13
rate the lower the probability of the operator successful responding to an individual alarm. An example of this is shown in Figure 8.
Figure 8 – Operator Probability of Response vs Alarm Load [15]
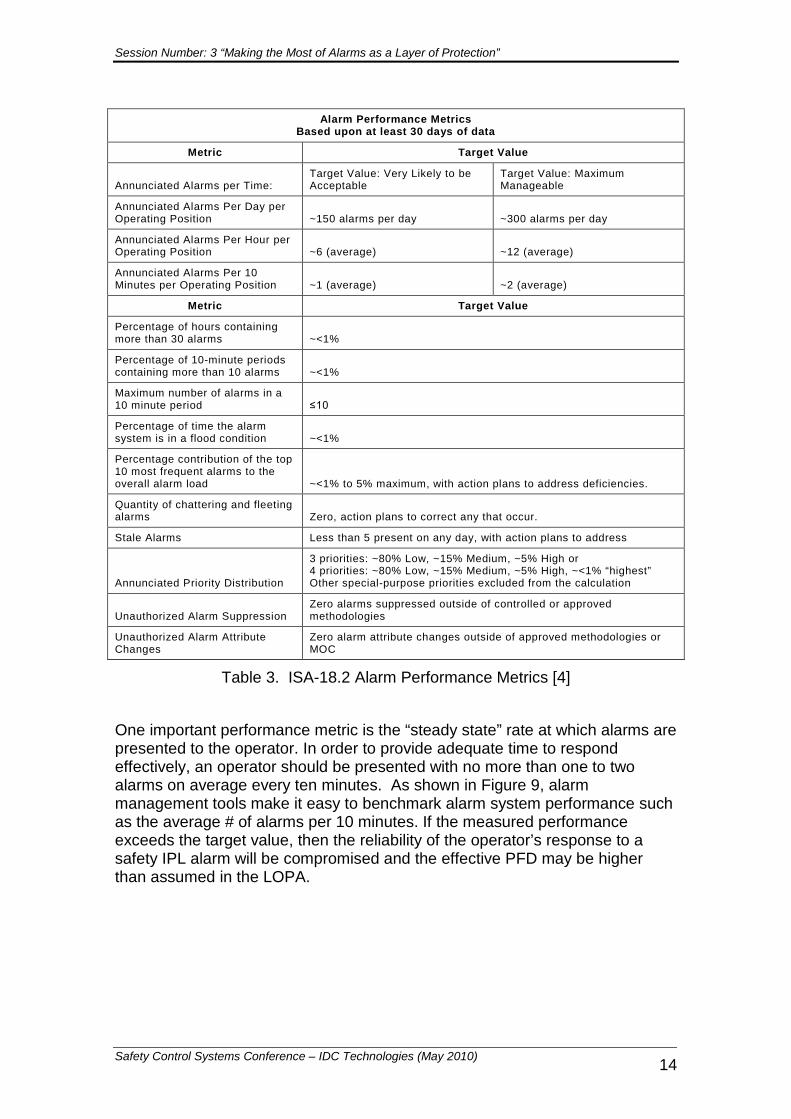
Benchmarking alarm system performance and comparing to key performance indicators is an ongoing activity during the Monitoring and Assessment stage. Recommended alarm system performance metrics as defined by ISA-18.2 are shown in Table 3.
Session Number: 3 “Making the Most of Alarms as a Layer of Protection”
Safety Control Systems Conference – IDC Technologies (May 2010) 14
Alarm Performance Metrics
Based upon at least 30 days of data
Metric Target Value
Annunciated Alarms per Time: Target Value: Very Likely to be Acceptable
Target Value: Maximum Manageable
Annunciated Alarms Per Day per Operating Position ~150 alarms per day ~300 alarms per day
Annunciated Alarms Per Hour per Operating Position ~6 (average) ~12 (average)
Annunciated Alarms Per 10 Minutes per Operating Position ~1 (average) ~2 (average)
Metric Target Value
Percentage of hours containing more than 30 alarms ~<1%
Percentage of 10-minute periods containing more than 10 alarms ~<1%
Maximum number of alarms in a 10 minute period ≤10
Percentage of time the alarm system is in a flood condition ~<1%
Percentage contribution of the top 10 most frequent alarms to the overall alarm load ~<1% to 5% maximum, with action plans to address deficiencies.
Quantity of chattering and fleeting alarms Zero, action plans to correct any that occur.
Stale Alarms Less than 5 present on any day, with action plans to address
Annunciated Priority Distribution
3 priorities: ~80% Low, ~15% Medium, ~5% High or 4 priorities: ~80% Low, ~15% Medium, ~5% High, ~<1% “highest” Other special-purpose priorities excluded from the calculation
Unauthorized Alarm Suppression Zero alarms suppressed outside of controlled or approved methodologies
Unauthorized Alarm Attribute Changes
Zero alarm attribute changes outside of approved methodologies or MOC
Table 3. ISA-18.2 Alarm Performance Metrics [4]
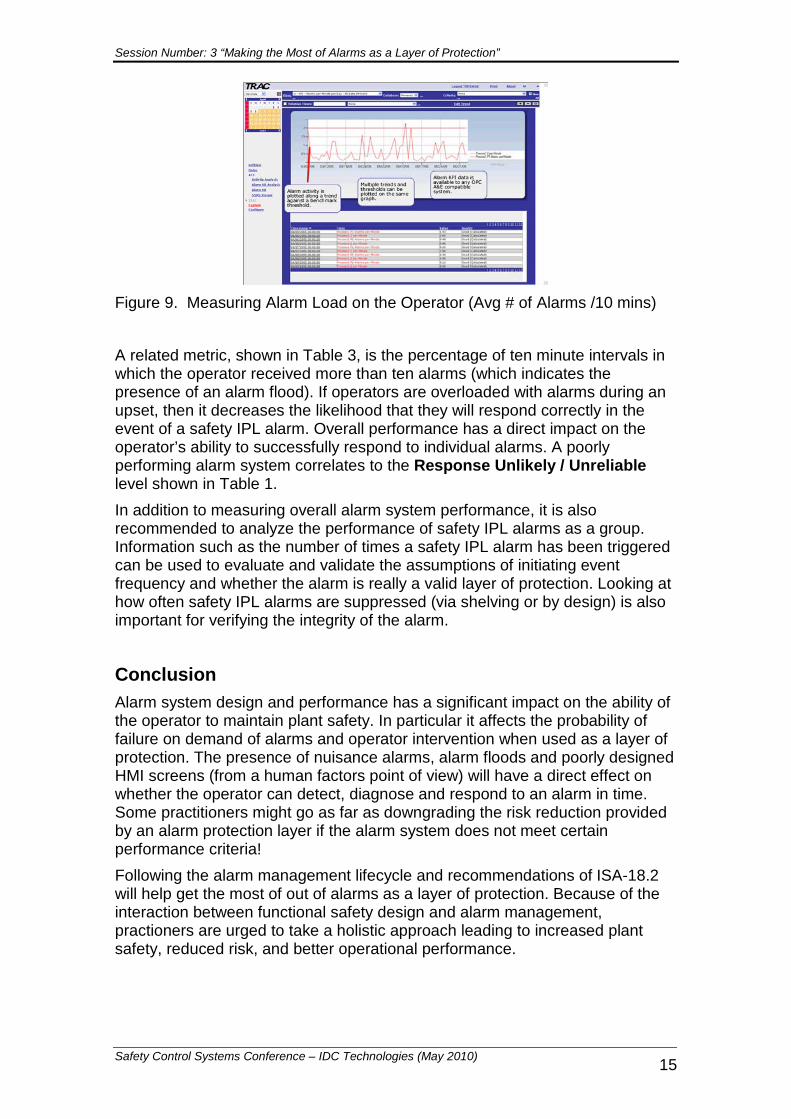
One important performance metric is the “steady state” rate at which alarms are presented to the operator. In order to provide adequate time to respond effectively, an operator should be presented with no more than one to two alarms on average every ten minutes. As shown in Figure 9, alarm management tools make it easy to benchmark alarm system performance such as the average # of alarms per 10 minutes. If the measured performance exceeds the target value, then the reliability of the operator’s response to a safety IPL alarm will be compromised and the effective PFD may be higher than assumed in the LOPA.
Session Number: 3 “Making the Most of Alarms as a Layer of Protection”
Safety Control Systems Conference – IDC Technologies (May 2010) 15
Figure 9. Measuring Alarm Load on the Operator (Avg # of Alarms /10 mins) A related metric, shown in Table 3, is the percentage of ten minute intervals in which the operator received more than ten alarms (which indicates the presence of an alarm flood). If operators are overloaded with alarms during an upset, then it decreases the likelihood that they will respond correctly in the event of a safety IPL alarm. Overall performance has a direct impact on the operator’s ability to successfully respond to individual alarms. A poorly performing alarm system correlates to the Response Unlikely / Unreliable level shown in Table 1. In addition to measuring overall alarm system performance, it is also recommended to analyze the performance of safety IPL alarms as a group. Information such as the number of times a safety IPL alarm has been triggered can be used to evaluate and validate the assumptions of initiating event frequency and whether the alarm is really a valid layer of protection. Looking at how often safety IPL alarms are suppressed (via shelving or by design) is also important for verifying the integrity of the alarm.
Conclusion Alarm system design and performance has a significant impact on the ability of the operator to maintain plant safety. In particular it affects the probability of failure on demand of alarms and operator intervention when used as a layer of protection. The presence of nuisance alarms, alarm floods and poorly designed HMI screens (from a human factors point of view) will have a direct effect on whether the operator can detect, diagnose and respond to an alarm in time. Some practitioners might go as far as downgrading the risk reduction provided by an alarm protection layer if the alarm system does not meet certain performance criteria! Following the alarm management lifecycle and recommendations of ISA-18.2 will help get the most of out of alarms as a layer of protection. Because of the interaction between functional safety design and alarm management, practioners are urged to take a holistic approach leading to increased plant safety, reduced risk, and better operational performance.

Session Number: 3 “Making the Most of Alarms as a Layer of Protection”
Safety Control Systems Conference – IDC Technologies (May 2010) 16
References 1. “The Buncefield Investigation” -
www.buncefieldinvestigation.gov.uk/reports/index.htm 2. Stauffer, T., Sands, N., and Dunn, D., “Get a Life(cycle)! Connecting
Alarm Management and Safety Instrumented Systems” ISA Safety & Security Symposium (2010).
3. ANSI/ISA-84.00.01-2004 Part 3 (IEC 61511-3 Mod) “Functional Safety: Safety Instrumented Systems for the Process Industry Sector- Part 3”
4. ANSI/ISA-18.2-2009 “Management of Alarm Systems for the Process Industries”.
5. ANSI/ISA-84.00.01-2004 Part 1 (IEC 61511-1 Mod) “Functional Safety: Safety Instrumented Systems for the Process Industry Sector”.
6. Stauffer, T., Sands, N., and Dunn, D., “Alarm Management and ISA-18 – A Journey, Not a Destination” Texas A&M Instrumentation Symposium (2010).
7. Timms, C.R., “How to Achieve 90% of the Gain Without Too Much Pain”, Measurement + Control, May 2004.
8. Marszal, E. and Scharpf, E. “Safety Integrity Level Selection”. ISA (2002) 9. Kletz, Trevor A., “What Went Wrong: Case Histories of Process Plant
Disasters Fourth Edition, Gulf Publishing Co., 1999. 10. Nimmo, I., “The Operator as IPL,” Hydrocarbon Engineering, September
2005. 11. EEMUA (2007), Alarm Systems: “A Guide to Design, Management and
Procurement Edition 2”. The Engineering Equipment and Materials Users Association.
12. Swain, A.D & Gutterman, H.E., “Handbook of Human Reliability Analysis with Emphasis on Nuclear Power Plant Applications”, NUREG/CR-1278, Albaquerque, NM, Sandia National Laboratories, 1983.
13. Williams, J.C., “A data-based method for addressing and reducing human error performance”, IEEE Conference on Human Factors in Nuclear Power, Monterey, CA, 436-450, June 1988.
14. Zapata, R. and P. Andow, “Reducing the Severity of Alarm Floods”, Proceedings, Honeywell Users Group Americas Symposium 2008, Honeywell, Phoenix, Ariz (2008)
15. Brown, N., “Alarm Management / The EEMUA Guidelines in Practice”, Measurement + Control, May 2003.
16. Stauffer, T, and Hatch, D., “Saved by the Bell: Using Alarm Management to make Your Plant Safer”, exida, 2009