
Making the Cut: Slicing Through Food Service Energy Costs · 2_Title Slide Making the Cut: Slicing...
64
2_Title Slide Making the Cut: Slicing Through Food Service Energy Costs With Cutting-edge Technologies Better Buildings Summit Tuesday, May 10, 2016 11:15 AM-12:30 PM
Transcript of Making the Cut: Slicing Through Food Service Energy Costs · 2_Title Slide Making the Cut: Slicing...

2_Title Slide
Making the Cut: Slicing Through Food Service Energy Costs With Cutting-edge Technologies Better Buildings Summit Tuesday, May 10, 2016 11:15 AM-12:30 PM

Agenda
11:15 Welcome & Introductions 11:20 David Zabrowski, The Food Service Technology Center 11:35 Jay Fiske, Powerhouse Dynamics 11:50 George Huettel, Ecova 12:05 Group Discussion/Q&A
2

Today’s Presenters
3
David Zabrowski The Food Service Technology Center
Jay Fiske Powerhouse Dynamics
George Huettel Ecova

How Restaurants Use Energy and Water David Zabrowski

©2016 PG&E Food Service Technology Center
MAKING THE CUT: SLICING THROUGH FOOD SERVICE ENERGY COSTS
May 10, 2016

©2016 PG&E Food Service Technology Center ©2016 PG&E Food Service Technology Center

©2016 PG&E Food Service Technology Center
FOOD PREP35%
HVAC28%
LIGHTING13%
REFRIG6%
SANITATION18%
An example of the total energy breakdown (BTU) in a full service restaurant.
FSTC studies all the ways restaurants use energy and water

©2016 PG&E Food Service Technology Center
More than 3 Billion CFM…
…exhausted from
Commercial Kitchens in the U.S.

©2016 PG&E Food Service Technology Center
…dominated by single-speed systems!

©2016 PG&E Food Service Technology Center
Hotel Kitchen 3:00 PM No appliance use…but exhaust at 100%
Front Line
Back Line

©2016 PG&E Food Service Technology Center
With and Without Melink
0
2
4
6
8
10
12
14
16
12:0
0 AM
1:15
AM
2:30
AM
3:45
AM
5:00
AM
6:15
AM
7:30
AM
8:45
AM
10:0
0 AM
11:1
5 AM
12:3
0 PM
1:45
PM
3:00
PM
4:15
PM
5:30
PM
6:45
PM
8:00
PM
9:15
PM
10:3
0 PM
11:4
5 PM
Time
kW
With Melink 5.3 kWW/O Melink 14 kWExhaust and Makeup Fan Power
Avg. Reduction = 8.7 kW
DVC 5.3 kW DVC 14 kW
Without DVC

©2016 PG&E Food Service Technology Center
CAUTION:
The CKV system must work effectively as single-speed system
before DCV is applied.

©2016 PG&E Food Service Technology Center

©2016 PG&E Food Service Technology Center
What the Eye Sees! 8-Ft Wall Mounted
Canopy Hood

©2016 PG&E Food Service Technology Center
What the Camera Sees

©2016 PG&E Food Service Technology Center
Research Project RP 1202 Effect of Appliance Diversity And Position On
Commercial Kitchen Hood Performance

©2016 PG&E Food Service Technology Center
Three Nuggets

©2016 PG&E Food Service Technology Center
Push Back
©2016 PG&E Food Service Technology Center
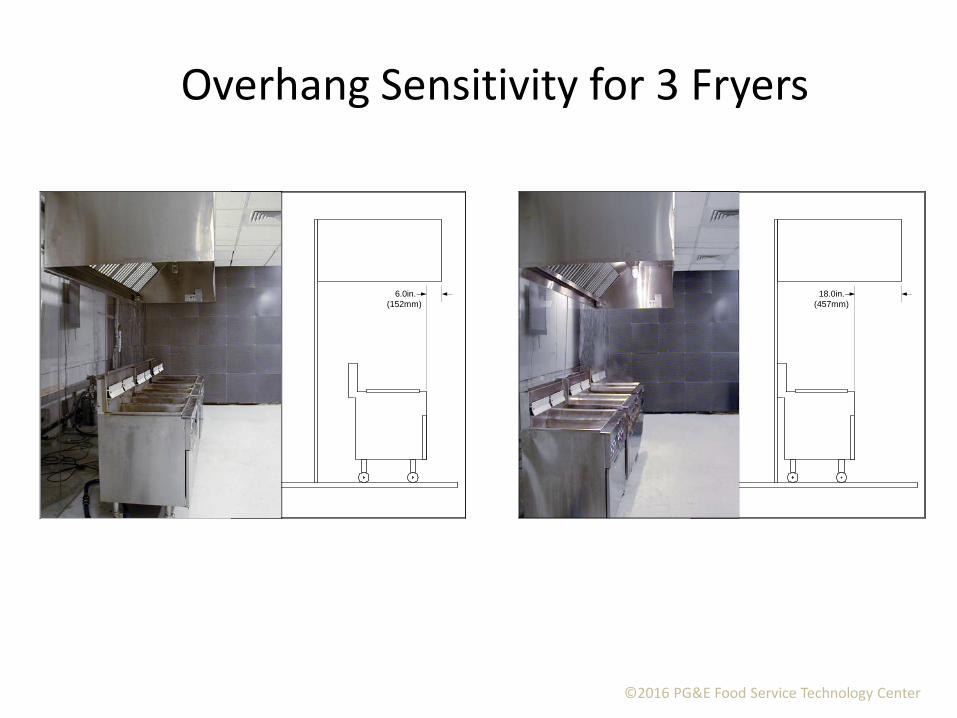
18.0in.(457mm)
6.0in.(152mm)
Overhang Sensitivity for 3 Fryers

©2016 PG&E Food Service Technology Center
Overhang Sensitivity for 3 Fryers at 2400 cfm (240 cfm/ft)
18 inches of Front Overhang 6 inches of Front Overhang

©2016 PG&E Food Service Technology Center
Add Side Panels
A bit more stainless steel can be cheap insurance!

©2016 PG&E Food Service Technology Center
Multiple configurations of appliances under various 10-ft. wall canopy hoods (approx. 90 tests)
with and without partial side panels
30% reduction in airflow!
290
200
0
50
100
150
200
250
300
350
No Panels Partial Panels
Exha
ust
Rat
e (c
fm/ft
)

©2016 PG&E Food Service Technology Center
Side Panels Pass the Test!

©2016 PG&E Food Service Technology Center
Bigger Hood

©2016 PG&E Food Service Technology Center
Not enough overhang!

©2016 PG&E Food Service Technology Center
Optimize Your Hood
(Guides available at Fishnick.com)
Then…add DCKV

©2016 PG&E Food Service Technology Center
Technical Feature: ASHRAE Journal February 2013

©2016 PG&E Food Service Technology Center
Corporate Cafeteria

©2016 PG&E Food Service Technology Center
0.0
0.5
1.0
1.5
2.0
2.5
3.0
3.5
12:00
AM2:0
0 AM
4:00 A
M6:0
0 AM
8:00 A
M10
:00 AM
12:00
PM
2:00 P
M4:0
0 PM
6:00 P
M8:0
0 PM
10:00
PM
12:00
AM
Time of Day
Ave
rage
Ene
rgy
Rat
e (k
W)
Exhaust Fan 1 (4000 CFM) Exhaust Fan 2 (4500 CFM) Make-Up Air
Exhaust System (w/o EMS)

©2016 PG&E Food Service Technology Center
Exhaust System (with EMS)
0.0
0.5
1.0
1.5
2.0
2.5
3.0
3.5
12:00
AM
2:00 A
M
4:00 A
M
6:00 A
M
8:00 A
M
10:00
AM
12:00
PM
2:00 P
M
4:00 P
M
6:00 P
M
8:00 P
M
10:00
PM
12:00
AM
Time of Day
Ave
rage
Ene
rgy
Rat
e (k
W)
Exhaust Fan 1 (4000 CFM) Exhaust Fan 2 (4500 CFM) Make-Up Fan

©2016 PG&E Food Service Technology Center
Exhaust System with EMS & DCKV
0.0
0.5
1.0
1.5
2.0
2.5
3.0
3.5
12:00
AM
2:00 A
M
4:00 A
M
6:00 A
M
8:00 A
M
10:00
AM
12:00
PM
2:00 P
M
4:00 P
M
6:00 P
M
8:00 P
M
10:00
PM
12:00
AM
Time of Date
Aver
age
Ener
gy R
ate
(kW
)
KEF-1 (4000 CFM) KEF-2 (4500 CFM) Make-Up AirOrginal KEF-1 Orginal KEF-2 Orginal Make-Up Air

©2016 PG&E Food Service Technology Center
Total Daily Fan Energy
0
20
40
60
80
100
120
140
160
180
200
Original System Original System with EMS Retrofit System withController
Dai
ly F
an E
nerg
y (k
Wh/
day)
$3250 savings @ $0.10/kWh$4875/yr @ $0.15/kWh

©2016 PG&E Food Service Technology Center
Climate Effect
0
50,000
100,000
150,000
200,000
250,000
300,000
350,000
400,000
450,000
Los
Ange
les
San
Fran
cisc
o
Chi
cago
Fairb
anks
New
Yor
k
Phoe
nix
Atla
nta
Mia
mi
Hea
ting/
Coo
ling
Load
(kB
tu/y
r)
Cooling
Heating
1000 cfm Outdoor Air 24 hour per dayHeated to 65FCooled to 76F
70% RH

©2016 PG&E Food Service Technology Center
DCKV Typical energy/cost savings total 40 to 50%
Case Studies available at:

©2016 PG&E Food Service Technology Center
DCKV-ROI Recap:
• The larger the exhaust airflow (in cfm), the greater the energy savings potential.
• DCKV works best with a mixed duty cookline. • The CKV system must work effectively as single-
speed system before DCKV is applied. • Effective commissioning of a DCKV system will
maximize its performance. • And in the future, the DCKV system should
communicate/integrate with the EMS system.

©2016 PG&E Food Service Technology Center ©2016 PG&E Food Service Technology Center

SiteSage: Arby’s Corporate Case Study Jay Fiske

www.powerhousedynamics.com
Page 38
Can you find the lost profits in this picture?
and the thermostats set to 70 degrees?
and the cooler compressor running
non-stop?
and the exhaust fan on?
Your guests won’t arrive for 3 hours - so why is every light in your restaurant turned on?

www.powerhousedynamics.com
Page 39
Restaurants spend 3 times more on energy per sq. ft.
than other businesses
Energy costs unknown until the bill arrives - long after anything can be done
Are there any other products or services you buy
this way?
Reactive equipment repairs are 3 times as expensive as planned
repairs
According to PRSM, proactive repairs average ~ $200 vs. $600+ for reactive
Do you get notified before
equipment fails?

www.powerhousedynamics.com
Page 40
Real-time monitoring to
identify operational
inefficiencies
Centralized, easy to use
HVAC & other controls
Analytics address
equipment performance
Integration with equipment from other companies
for advanced control &
diagnostics
Energy Management Success: It’s Not Just About Energy

www.powerhousedynamics.com
Page 41
Components of an Energy- and Asset-Management Solution
SiteSage Assets

www.powerhousedynamics.com
Page 42
Arby’s Case Study
• SiteSage installed in all 970+ US corporate-owned stores after competitive evaluation
• Energy savings alone deliver payback in <2 years • Enterprise HVAC Control + HVAC Analytics
• Positioned as Energy Management and Food Safety Platform
• Kitchen equipment vendors interface with SiteSage as part of Arby’s Smart Kitchen initiative
• SiteSage is also used as repository for all equipment asset data
• Arby’s has reported a >15% reduction in restaurant energy costs across the chain
"We have been very impressed by the capabilities of SiteSage. Not only will the system enable us to get HVAC costs under control, but it will also help identify problems with both rooftop cooling units and refrigeration equipment.” - Arby’s SVP

www.powerhousedynamics.com
Page 43
Gateway Cook & Hold Oven with wireless module
Gateway •Connects to Internet
SiteSage software •Stores data and automates Beef Sheet HACCP Report
Wireless Module •Connects to Cook & Hold control board
•Sends data wirelessly to Gateway
Implemented Solution with SiteSage
Arby’s Case Study: Automating Food Safety Reporting

www.powerhousedynamics.com
Page 44
Implemented Solution with SiteSage
• System generates real-time data on cooking roast
• Automates creation of HACCP Beef Sheet Report & emails report daily
Arby’s Case Study: Automating Food Safety Reporting

www.powerhousedynamics.com
Page 45
Remote control of
HVAC & other equipment
Rooting out inefficiencies: • Off-hours usage • Water leaks • Underperforming
equipment
Enhanced asset management: • Advanced fault
warnings • Condition –
based maintenance
… also provides: • Enhanced Food Safety
• Improved guest comfort
• Increased staff productivity
Energy Management Success: It’s Not Just About Energy

www.powerhousedynamics.com
Page 46
Thank you!

Leverage Data, Technology and Services to Reduce Operating Costs George Huettel

total energy and sustainability management
MAKING THE CUT: SLICING THROUGH FOOD SERVICE ENERGY COSTS Leverage Data, Technology and Services to reduce operating costs

49
Today’s Agenda • Strategic Process
• Solid Foundation in Data
• Identify Opportunities
• Take Action
• Continually Monitor
• Client Examples
• Q&A

50
Implement a Strategic Process
• Analyze data to reveal resource saving opportunities
• Identify operational patterns to provide insight into cost drivers and outlier sites
• Take Action by implementing changes and modifying operational procedures
• Monitor, track, and report on cost and operational data and trends to ensure solutions are sustainable
Collaborative engagement with clients guides the energy program towards a best practice, continuous energy improvement approach.
Life-cycle approach
51
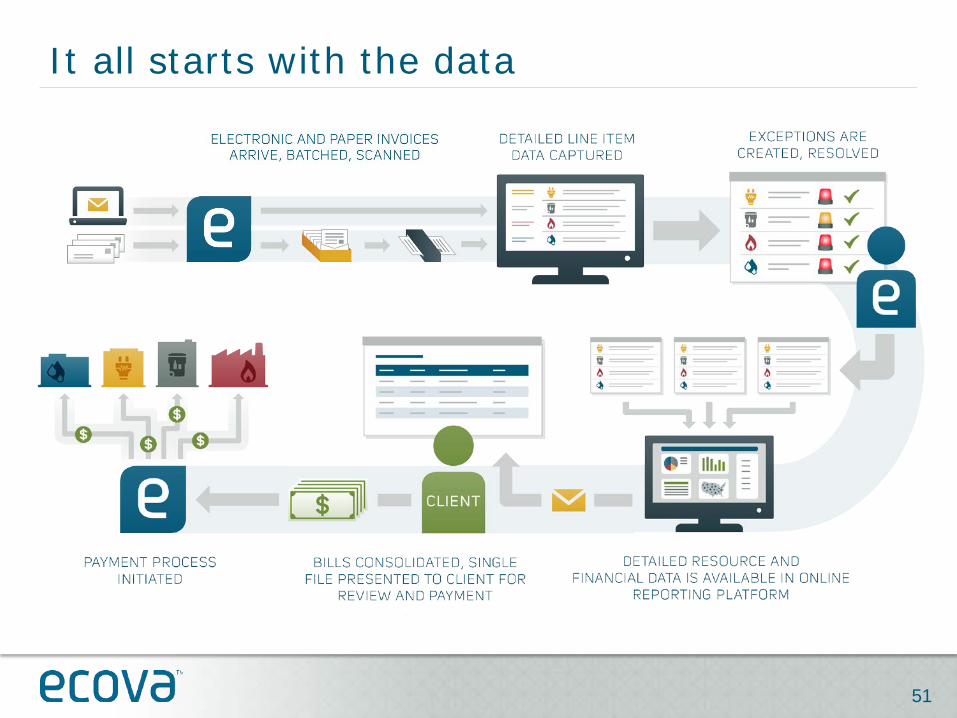
It all starts with the data

52
Extend to site level meter data Asset level measurement of energy usage
Track Operating Costs by Asset
Analyze Equipment Performance

53
Resource Performance Reporting
• Benchmarking Reports – comparing sites nationwide and against industry peers
• Trending Reports – comparing sites to past performance
• Cost drivers – Identify what is influencing energy cost
• Weather and calendar normalized comparison of sites on both a per service and combined kBtu basis to identify performance trends and Outliers
Benchmark, Trend and Analysis Reports

54
Identify Energy Cost Drivers What’s really behind year over year performance changes Identify impact on energy usage absent of weather, utility rates and other important factors

55
Identify Outliers and Energy Usage Trends Determine where to focus resources of time, manpower and capital

56
Determine optimum course of action Leverage expertise to make sense of all the data
Energy Management
Services

57
Implement Continuous Monitoring
Primary Components
• Service Call Response • Alarm Management • Workflow Management • Designated toll-free number and email
address to the 24/7/365 OCC • Web-based Ticket Activity and Performance
Dashboard
Key Benefits
• More effective maintenance and repair operations through improved issue tracking/reporting
• Improved first-call resolution through accurate diagnoses and description of equipment issues
• Improved visibility into facility operations & better documentation of equipment performance
EMS Data & Alarms
Energy Outliers
Service Request
Alarm Mgmt
Call Mgmt (CSR)
Proactive Mgmt Ticketing System
Support Specialist Remote
Resolution
Service Dispatch Activity
Dashboard

58
Automated Business Rules Engine
• Implement advanced analysis of site data, EMS programmed alarms and advanced system alerts
• Create Business Rules to process and identify meaningful issues, analyze their impact and prioritize actions
• Reduce alarms, site activity, energy and maintenance costs
WHEN THIS HAPPENS
DO THIS

59
Example – Slicing through Alarm Data 2015 Statistics
• 403,170 alarms processed
• 70,260 determined actionable
• 59,610 processed by OCC
• 7,470 Avoided Service Dispatch
• Issues resolved without a dispatch
• Ecova Building Specialists provide remote resolution
• 3,180 Avoided Risk of Product Loss
• Issues resolved by early service dispatch resolution
• Timely identification eliminates food safety product loss event
• Annual cost avoidance is $1.83 million in 2015

60
Example – Slicing through Operational Data

61
Example – Slicing through Energy Data
• Detailed breakdown of electricity usage
• Heat lamps use nearly as much energy as the WIC and WIF combined, and 2nd unit can be turned off overnight
• Waffle irons use approximately 4.5% of the total electricity use
• Walk-in freezer doors are left open often
• Ventilation and refrigeration are significant opportunities

62
Summary
• Reduce energy consumption and operational costs
• Maintain a comfortable store environment
• Ensure Product Quality, Food Safety and Compliance
• Leverage People, Process and Technology
• Correlate Energy and Site performance • Identify and investigate Outlier Sites
• Identify and prioritize under-performing assets
• Implement Intelligent Dispatch • Reduce service dispatch quantity
• Minimize onsite service technician time
Program Objectives

Discussion/Q&A

Thank you!
Contact Information:
64
• Adam Spitz: [email protected]
• David Zabrowski: [email protected]
• Jay Fiske: [email protected]
• George Huettel: [email protected]