Making Sense of Complementary Health Insurance (CHI)
26
ANALYSIS OF THE HEALTH SYSTEM IN SLOVENIA Making Sense of Complementary Health Insurance Final Report
-
Upload
truongcong -
Category
Documents
-
view
215 -
download
2
Transcript of Making Sense of Complementary Health Insurance (CHI)

ANALYSIS OF THE HEALTH SYSTEM IN SLOVENIA
Making Sense ofComplementaryHealth InsuranceFinal Report
Making Sense of Complementary Health Insurance (CHI)
Final Report 15th October 2015

Making Sense of Complementary Health Insurance (CHI)
Written by:
Steve Thomas Centre for Health Policy and Management, Trinity College Dublin
Sarah Thomson WHO Barcelona Office for Health System Strengthening, Division of Health Systems and Public Health, WHO Europe Tamás Evetovits WHO Barcelona Office for Health System Strengthening, Division of Health Systems and Public Health, WHO Europe

Contents
List of tables and figures .......................................................................................................................... i
Acknowledgments ................................................................................................................................... ii
List of Abbreviations .............................................................................................................................. iii
Introduction ............................................................................................................................................ 1
Option 1: Abolishing co-payments .......................................................................................................... 3
Option 2: Replacing CHI with public compulsory prepayment ............................................................... 3
Option 3: Better regulation and oversight of CHI ................................................................................... 5
Population, service and cost coverage ............................................................................................... 6
Transaction costs ................................................................................................................................ 7
Market structure and conduct .......................................................................................................... 10
CHI premiums.................................................................................................................................... 13
Discussion.............................................................................................................................................. 14
Other roles for CHI and private insurers ............................................................................................... 15
References ............................................................................................................................................ 18

i
List of tables and figures
Tables
Table 1: SWOT Analysis - CHI in Slovenia Table 2: Illustrative example of new HIIS rates associated with phasing out co-payments Table 3: Variants of the proposed levy for health and long term care, monthly premium in € Table 4: CHI in five European countries, 2011 (€ million) Table 5: Monthly premia for CHI (€), April 2015
Figures
Figure 1: CHI membership and average premia, 2006-2014 Figure 2: CHI coverage of the relevant population, 2007-2014 Figure 3: Revenues and costs across the CHI industry (€), 2006-2014 Figure 4: Profits and non-claim costs in the CHI industry (€), 2006-2014 Figure 5: Membership across the three private health insurers, 2006-2014 Figure 6: The number of members aged over 75 across the private insurers Figure 7: The proportion of those aged over 75 in the portfolio of each private insurer

ii
Acknowledgments The extensive support and comments of the Slovenian local working group were highly appreciated in the development of this report, namely Dušan Jošar, Eva Zver, Boris Kramberger, Stane Vencelj, Davor Dominkus, Franc Klužer, Elda Gregorič Rogelj. The authors wish to thank them for all their insight and facilitation of data gathering.

iii
List of abbreviations CHI Complementary health insurance EU European Union HIIS Health Insurance Institute of Slovenia UHC Universal health coverage

1
Introduction Complementary Health Insurance (CHI) in the Slovenian health care system fully covers the cost of co-payments for a very large share of the population. In doing so it provides financial protection to households from co-payments and allows the public sector to shift costs on to households without apparently creating much unmet need. At the same time, CHI adds to the complexity of the system, incurs transaction costs (including those related to CHI profits, CHI administration costs and government regulation costs) and charges flat-rate premiums which are regressive. This balance of factors needs to be explored fully to identify possible options for ensuring that CHI helps contribute to national objectives for health care financing. Key objectives for health care financing relate to raising sufficient revenues to provide or purchase appropriate levels of care, ensuring access to a comprehensive range of needed services without financial hardship and pooling risks across different subsections of the population (Normand and Thomas 2008). Other considerations also typically relate to the efficiency of revenue generation and administration, the quality of care financed and the transparency and simplicity of financing mechanisms (Kutzin 2008). To provide a foundation for considering the options a SWOT analysis is presented which outlines the strengths, weaknesses, opportunities and threats involved with CHI (Table 1). The analysis is populated by key features of the Slovenian system, points of evidence and also relates to the financing objectives presented. The SWOT analysis highlights that a nuanced approach will need to be taken to any reform of CHI and its role. Given the problems with public funding over the austerity period and the health system’s overreliance on payroll contributions, CHI has played a key role in raising and pooling funding from households to minimise the financial burden and other problems associated with co-payments. Consequently, any intervention needs to be considered carefully. The cure proposed needs to be better than the cause or the status quo will be the best default option. One potential threat of intervention would be to undermine the private insurance industry to such an extent that large sections of the population do not have financial protection from co-payments (unless the government is willing to replace CHI with public funding), which would in all likelihood lead to a more inequitable and inefficient health financing system and prove hugely unpopular. With this risk in mind, the following options are considered below: Option 1: Abolishing co-payments Option 2: Replacing CHI with public compulsory pre-payment Option 3: Better regulation and oversight of CHI The structure of the remainder of this report follows the presentation and assessment of each of these options. Finally, a concluding section highlights the key dimensions of choice for the Government.

2
Table 1: SWOT Analysis - CHI in Slovenia
Strengths 1. CHI protects people against the negative
effects of co-payments which would otherwise be substantial.
2. CHI allows the public sector to shift costs on to the private sector in a way that does not create unmet need.
3. CHI premia appear at present to be largely affordable by the vast majority of the population.
4. CHI administrative costs are low by international standards.
5. The current risk equalisation scheme helps reduce risk selection.
Weaknesses 1. CHI premia are flat rate and hence
regressive. Poor households pay as much as rich households. Larger households pay more.
2. CHI incurs transaction costs associated with insurer profits and administrative costs and, indirectly, the costs of government regulation.
3. There is some evidence of oligopolistic pricing which is inefficient.
4. Current risk equalisation mechanisms do not remove the incentive to risk select.
5. CHI makes the system more complex and there is currently little information and transparency on its performance.
6. CHI may remove an incentive for HIIS to control costs/create efficiencies.
Opportunities 1. Could the CHI market be reformed to
ensure CHI provides good financial protection for all households and is financed more equitably?
2. Could the resources consumed by CHI transaction costs be lowered?
3. Could the market be more transparent for regulatory authorities and consumers?
Threats 1. If the public system continues to shift costs
on to the private sector: a. The financing of the system may
become more regressive (as a larger portion of the overall funding comes from flat-rate premia).
b. The increasing flat-rate premia may become less affordable to poorer households who then drop cover and face co-payments.
2. CHI transaction costs may continue to rise over time reducing the administrative efficiency and affordability of this option, particularly because of new solvency requirements.
3. Any attempt to remove CHI would threaten fiscal sustainability without a plan to mitigate the impact of co-payments, which would require significant additional public funding.

3
Option 1: Abolishing co-payments
Perhaps the simplest solution to the problems caused by CHI is to abolish all co-payments, except where such charges support appropriate referral. Removing co-payments for care would immediately remove the need for households to purchase CHI to protect themselves from the burden of out-of-pocket payments. This would then remove any problems or potential problems associated with affordability of VHI premia, high transaction costs and any enduring risk selection (see later analysis). It would help secure universal access to services. It would also increase the transparency and simplicity of the system, making it more efficient and perhaps more acceptable to households. In several European Union (EU) member states, co-payments are minimal and primary care and inpatient care are free at the point of use. Shifting away from co-payments to publicly financed services has been a significant theme for other high-income countries pursuing and achieving universal health coverage (UHC) (Lu et al 2007), such as South Korea. Nevertheless, such transitions are rarely achieved in one phase and require persistence and significant budgetary commitment. Abolishing co-payments would in all likelihood lead to the disappearance of the CHI market for cover of co-payments (though not for supplementary voluntary health insurance). It would also create a significant funding gap. Given the good financial protection that CHI currently provides, the impact of the economic crisis on household income and the identified need for additional health finances it would be imperative for the government to find sufficient resources to fund the equivalent of CHI claims of around €400 million. This may be challenging to achieve in one step and may be better as a longer term strategy once the fiscal space allows. Additional public revenue could be raised in a range of ways, as discussed briefly under Option 2 and more fully in an accompanying report (Evaluating Health Financing).
Option 2: Replacing CHI with public compulsory prepayment
If the government is not satisfied with the performance of the CHI market and chooses not to abolish co-payments it could establish its own prepayment scheme. CHI covering co-payments would be replaced by compulsory payments through a new prepayment fund managed by HIIS. Instead of paying for CHI, people or households would be required to contribute to the new prepayment fund on a monthly or annual basis. There are two important advantages to this option. First, there would be no need to generate profits and cover would be provided by a single entity, so transaction costs would be lower than under CHI. Second, coverage would be truly universal, across the whole of the

4
population. However, it would also be likely to lead to considerable loss of employment in the private insurance industry1 and cause substantial stakeholder opposition (including potential legal challenges) from private insurers. The currently very small market for other forms of voluntary health insurance cover would not be affected. CHI claims currently amount to €404 million. Any attempt to replace CHI must find an alternative way to raise this revenue, as well as trying to channel these funds into the health system in a more efficient, equitable and sustainable manner. €404 million would require an average annual prepayment of €262 per individual already covered by HIIS (compared to an average CHI premium of around €330 in 2014). This revenue could be raised on a flat-rate basis, as in the CHI market. However, to abolish the CHI market – with all the risks and opposition this entails – and yet maintain its regressive approach to financing would be a missed opportunity. The political and implementation costs of replacing CHI would be extremely high in relation to the relatively marginal benefits gained. For this reason, we recommend that this option should involve financing based on ability to pay (i.e. linked to income). The most straightforward income-based option, with the lowest transaction costs, would be to use the existing HIIS payment system and simply extend it to cover compulsory pre-payment for co-payments. Total HIIS revenues in 2014 were between €2.3 and €2.4 billion. Additional revenues from contributions to cover CHI claim costs would need to be around 17.5% higher than current HIIS funding levels (€2.3 billion). The financial implications of a uniform jump of 17.5% in HIIS contribution rates are modelled in Table 2.
Table 2: Illustrative example of new HIIS rates associated with phasing out co-payments
HIIS group Numbers 2014
2014 average paid monthly
contributions (€)
Monthly rates to cover compulsory pre-
payment or abolition of
co-payments (€)
Formal sector employed 719,510 203 238
- employers 719,510 104 123
- employee 719,510 98 115
Self-employed 70,315 129 152
Farmers 12,819 40 46
ZPIZ for pensioners 547,513 56 65
Unemployed 19,931 104 122
Insured by paragraph 20. 70,821 20 24
Insured by paragraph 21. 53,065 28 33
Rest * 47,421 44 52 Source: Modelling based on HIIS data, 2015
1 Insurance Europe (2013) estimate that the Slovenian insurance industry employs around 6,000 people.
Estimates of employment related to health insurance are around 600.

5
If the potential unpopularity of simply increasing HIIS contribution rates (especially among richer households) is an issue, then the government could consider an alternative income-based approach – one that is less redistributive, such as the government’s proposed ‘levy’ for additional financing of compulsory health insurance and long-term care (Table 3). Table 3: Variants of the proposed levy for health and long-term care, monthly premium (€)
Level of income Variant 1 Variant 2 Variant 3
Below 60% average income 14 15 15
From 60% to 140% average income 17.5 18 18.5
From 140% to 200% average income 24.5 26.5 28
Above 200% average income 30 30.5 31
Financial outcome (€ million per year) 310.4 307.4 308.8 Source: Ministry of Health, 2015 Notes: i) A 4
th variant was included in the original proposal which is a flat-rate levy. Further, the costs are slightly out
of date in relation to the size of funding required (and therefore the prepayment rates to be charged are also too low) but these can be updated on the same banded basis.
ii) Variants 2 and 3 exclude segments of the population from contributions, thus resulting in lower financial outcomes than Variant 1.
Option 3: Better regulation and oversight of CHI
It may be thought that the above options are not achievable in the short run and that CHI is an indispensable part of the health care financing infrastructure. This is because of the dangers of households having to face out-of-pocket payments and the difficulties in raising sufficient revenue from the current system that is so dependent on payroll contributions. In such circumstances, it could be that the government’s best policy is to improve its regulation of the CHI sector to guarantee optimal performance. Key objectives will be to guarantee affordability for the population, to mitigate regressivity of financing and to evaluate and promote efficiency. Key performance metrics would be set out for the insurance industry on the understanding that good performance will not lead to remedial government intervention or reform to correct for the lack of market competition. Points of focus for regulation would then be monitoring population coverage to ensure financial protection from co-payments, monitoring price movements to ensure affordability, monitoring the efficiency of financing through CHI in relation to claims costs as a proportion of overall premia and in relation to risk selection and equalisation. With recent health financing in Slovenia relying more on CHI it is important to evaluate how well the CHI sector is performing and to what extent it can be improved by effective regulation. The authors assess key metrics below.
6
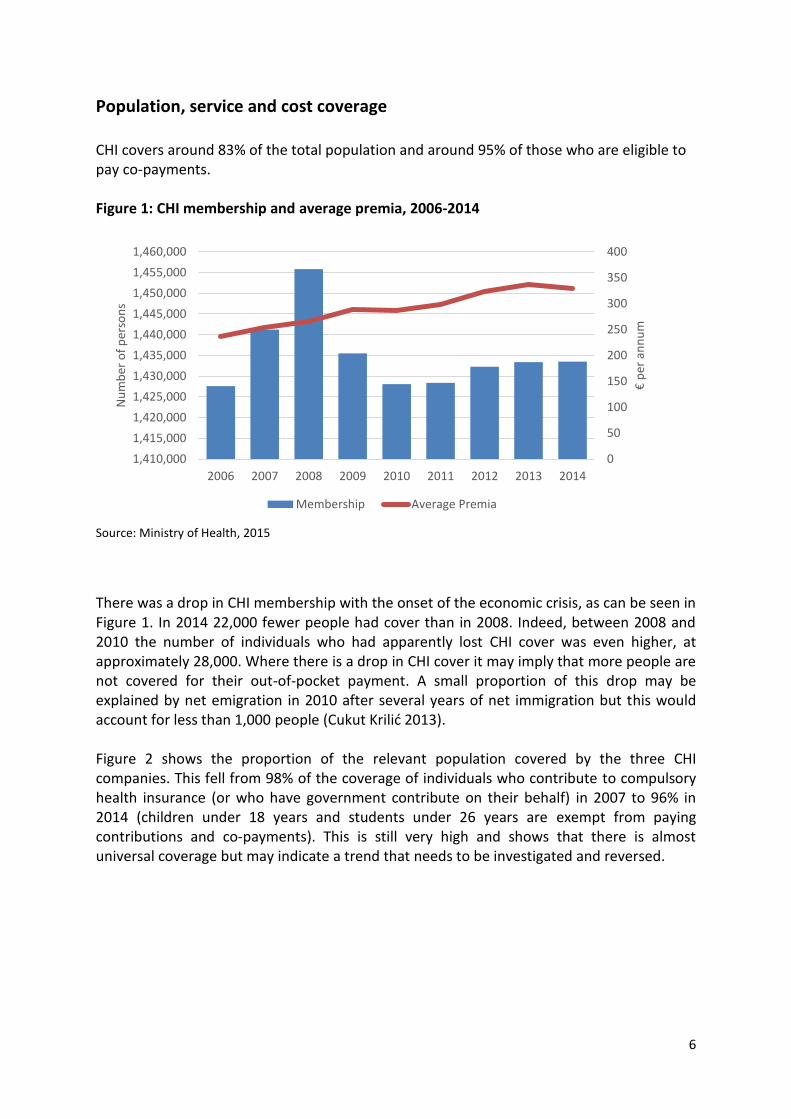
Population, service and cost coverage
CHI covers around 83% of the total population and around 95% of those who are eligible to pay co-payments. Figure 1: CHI membership and average premia, 2006-2014
Source: Ministry of Health, 2015
There was a drop in CHI membership with the onset of the economic crisis, as can be seen in Figure 1. In 2014 22,000 fewer people had cover than in 2008. Indeed, between 2008 and 2010 the number of individuals who had apparently lost CHI cover was even higher, at approximately 28,000. Where there is a drop in CHI cover it may imply that more people are not covered for their out-of-pocket payment. A small proportion of this drop may be explained by net emigration in 2010 after several years of net immigration but this would account for less than 1,000 people (Cukut Krilić 2013). Figure 2 shows the proportion of the relevant population covered by the three CHI companies. This fell from 98% of the coverage of individuals who contribute to compulsory health insurance (or who have government contribute on their behalf) in 2007 to 96% in 2014 (children under 18 years and students under 26 years are exempt from paying contributions and co-payments). This is still very high and shows that there is almost universal coverage but may indicate a trend that needs to be investigated and reversed.
0
50
100
150
200
250
300
350
400
1,410,000
1,415,000
1,420,000
1,425,000
1,430,000
1,435,000
1,440,000
1,445,000
1,450,000
1,455,000
1,460,000
2006 2007 2008 2009 2010 2011 2012 2013 2014
€ p
er a
nn
um
Nu
mb
er o
f p
erso
ns
Membership Average Premia

7
Figure 2: CHI coverage of the relevant population, 2007-2014
Source: Adapted from Insurance Supervisory Agency 2015
It has been reported by government sources that the government started to pay out-of-pocket payments directly for those who were no longer able to take out CHI. It is not clear to what extent this is true. What is also unclear is whether these two factors account for the entire drop in coverage. Those who have lost cover will tend to be those who can least afford out-of-pocket payments (unless there has been migration). They then may be impacted by having to pay directly for care, where not covered by the state, in terms of delaying seeking care, potential impoverishment and unmet need. CHI policies provide full reimbursement of the co-payments they cover. CHI’s share of private spending on health (around 48% in 2013) is the second highest in Europe (after France, 59%) and the sixth highest in the world. This suggests it does very well in covering gaps in publicly financed coverage. However, Slovenia lags behind France in this respect and it may therefore be useful to see whether the CHI market could be encouraged to provide cover for other health care activities that incur significant out-of-pocket payments, such as dentistry. Dental costs are one of the few causes of unmet need and financial hardship in Slovenia according to EU-SILC data on unmet need and analysis of financial protection carried out by WHO. Identifying where and why gaps in coverage occur must be a priority for government action. This information could be obtained through surveys.
Transaction costs
The average insurance premium shows a persistent upward trend in recent years (Figure 1). From 2006 to 2013 the average premium increased by €93 per policy or 40%, although there was a slight drop in price from 2013 to 2014. It appears that austerity had little impact on
0%
10%
20%
30%
40%
50%
60%
70%
80%
90%
100%
2007 2008 2009 2010 2011 2012 2013 2014
Co
vera
ge
VZA
TZZ
AS

8
price levels. However, similar patterns of price increases for CHI were found throughout Europe.
To understand the reason for premia escalation, it is useful to explore the relationship between premia income and claim costs and this is shown in Figure 3. This helps analyse the efficiency of CHI in health care financing. The gap between revenue and claims costs indicates the transaction cost of using CHI for this key role in health care financing. Where it is growing it indicates inefficiency, given the same numbers are covered but with higher administrative costs, and may in due course undermine the affordability of CHI, particularly for poorer households.
Figure 3: Revenues and costs across the CHI industry (€), 2006-2014
Source: Ministry of Health, 2015
Figure 3 shows how claims costs rose between 2007 and 2013 and then fell slightly in 2014 (as a result of lower costs of provision which is partly dictated by government pricing policy and what is covered). Premia revenues rose before the crisis but fell slightly in 2010 and 2014. The gap between revenues and costs rose sharply before the crisis reaching a peak of around €70 million in 2009. The crisis had the effect of initially reducing the gap between net premia and claims costs. Nevertheless, this gap has started to open up again and profits and non-claims are trending upwards, accounting in 2014 for around €70 million, returning to 2009 levels. Figure 4 shows a breakdown of the difference between premium income and claims expenditure, indicating that much of it is due to actual operating costs rather than profits. However, official profit levels may not fully represent the difference between revenues and costs.
0
10,000,000
20,000,000
30,000,000
40,000,000
50,000,000
60,000,000
70,000,000
80,000,000
0
100,000,000
200,000,000
300,000,000
400,000,000
500,000,000
600,000,000
2006 2007 2008 2009 2010 2011 2012 2013 2014
Dif
fere
nce
Rev
enu
es a
nd
co
sts
Net Premia Claims Difference

9
Figure 4: Profits and non-claim costs in the CHI industry (€), 2006-2014
Source: Ministry of Health, 2015
Still, compared to other countries that devote similar resources to CHI, Slovenia’s transaction costs are actually very low (Table 4). This may not be surprising as Slovenian insurers do not purchase care and so should have smaller administrative costs. Interestingly, France with a very similar role for CHI (i.e. cover of co-payments with limited purchasing) has a slightly worse claims ratio of 83%, implying that Slovenian CHI is currently performing well in this respect. Nevertheless, there are indications that the claims ratio in Slovenia is falling to around 85% in 2014 from a peak of 90% in 2010. Furthermore, there are concerns that new requirements for solvency may actually push up transaction costs further, though the extent of this is not yet fully understood. Table 4: CHI in five European countries, 2011 (€ million)
Premia Claims Difference Claims paid as a % of premium income
Belgium 1,308 904 404 69%
Finland 218 170 48 78%
France (2011) 9,501 7,239 2,262 76%
France (2013) 10,300 8,533 1,767 83%
Portugal 540 452 88 84%
Slovenia 429 375 54 87% Source: Adapted from Insurance Europe (2014)
-10,000,000
0
10,000,000
20,000,000
30,000,000
40,000,000
50,000,000
60,000,000
70,000,000
2006 2007 2008 2009 2010 2011 2012 2013 2014
Profits Non-claim Costs

10
Rising transaction costs should be a focus for regulation, to ensure CHI continues to be affordable for everyone and the CHI market is administratively efficient. It should also be a focus for better monitoring, so that the market is more transparent for regulatory authorities and consumers. In a truly competitive market, insurers would automatically correct prices downwards when their cost base is reduced. A helpful piece of regulation would be to set a minimum claims ratio so that insurers must spend a minimum share of premium income on health care costs. This would limit transaction costs and help secure affordability in the CHI market. The government should also tighten reporting requirements.
Market structure and conduct
The membership trends of private health insurers in Slovenia between 2006 and 2014 are shown in Figure 5. There are only three private health insurers in the CHI market, making it an oligopolistic market. The key theoretical features of such an oligopolistic market are that there is little price competition, prices tend to move together and never downwards, and advertising, branding and add-ons tend to be the main mode of competition, alongside growing margins.
Figure 5: Membership across the three private health insurers, 2006-2014
Source: Ministry of Health, 2015 Notes: VZA - Vzajemna, Mutual Health Insurance Company
TZZ - Triglav zdravstvena zavarovalnica (Triglav Health Insurance Company), Inc.
AS - Adriatic Slovenica (AS Health Insurance Company), Inc.
0
100,000
200,000
300,000
400,000
500,000
600,000
700,000
800,000
900,000
1,000,000
2006 2007 2008 2009 2010 2011 2012 2013 2014
VZA TZZ AS

11
As noted, overall CHI coverage has not changed hugely (see Figure 1). Yet there has been some redistribution of membership across the private health insurers. Membership of VZA, the largest and oldest firm, has fallen steadily largely in favour of TZZ. International literature implies that it is the young and healthy that tend to switch and the old and unwell that do not (Royalty et al. 1999, Van Dijk 2008, Strombom 2002). Private health insurers may well compete to attract low-cost segments of the population to boost their own profitability.
In this light, it is interesting to note the coverage trends of those aged over 75 in Slovenia, which on average are the highest cost and potentially (without robust risk adjustment) the least profitable group. TZZ expanded strongly into younger age groups between 2006 and 2010, with the average age of a member decreasing from 40.3 to 39.5 years of age. TZZ has also managed down the proportion of those aged over 75 in its portfolio between 2006 and 2013 (see Figures 6 and 7). In contrast, VZA coverage of the over 75s has continued to expand until it has more than two thirds of all those covered in this age group. Figure 6: The number of members aged over 75 across the private insurers
Source: Ministry of Health, 2015 Notes: V - Vzajemna, Mutual Health Insurance Company
TZ - Triglav zdravstvena zavarovalnica (Triglav Health Insurance Company), Inc.
AS - Adriatic Slovenica (AS Health Insurance Company), Inc.
0
20,000
40,000
60,000
80,000
100,000
120,000
140,000
2006 2007 2008 2009 2010 2011 2012 2013 2014
V
TZ
AS

12
Figure 7: The proportion of those aged over 75 in the portfolio of each private insurer
Source: Ministry of Health, 2015 Notes: VZA - Vzajemna, Mutual Health Insurance Company
TZZ - Triglav zdravstvena zavarovalnica (Triglav Health Insurance Company), Inc.
AS - Adriatic Slovenica (AS Health Insurance Company), Inc.
This is not a unique phenomenon. Evidence from Ireland shows that not only is there a market for the young and healthy but also that there are deliberate strategies for insurers not to encourage the old (Thomas and Darker 2013). Insurers whose focus is on the young and healthy may well approach a maximum market size beyond which they are disinterested in expansion for fear of taking on too many higher-risk customers. A typical pattern would then be that all insurers are careful not to give price incentives for older people to switch. Consequently, they tend to raise their prices around the same time. This is the case in the Slovenia context, with prices being typically very similar and tending to move together. Current prices for CHI (in April 2015) are shown in Table 5. The monthly premia are within 75 cents of each other, a difference of 3%. AS and TZZ prices are slightly higher than VZA and this may be a form of risk selection.
Table 5: Monthly premia for CHI (€), April 2015
Vzajemna Triglav Adriatic
3 % discount 26,79 27,51 27,49
Basic premium 27,62 28,36 28,34
Source: Ministry of Health, 2015
In this scenario the insurers are playing a zero-sum game with very little benefit to society as a whole as they compete for those members that are more profitable. It also allows them to generate profits through cream-skimming rather than by operating efficiently. To limit such activities it is necessary to have an effective risk equalisation scheme. If this is working well,
0%
2%
4%
6%
8%
10%
12%
14%
16%
2006 2007 2008 2009 2010 2011 2012 2013 2014
VZA TZZ AS

13
then the competition in the market will be less focused on attracting the younger healthier groups and more on trying to minimise operating costs. The evidence from the Slovenian experience of risk equalisation is that there are regular payments from TZZ and AS to VZA, as would be appropriate given their risk profiles. Nevertheless, such payments are quite small, being only €12 million in 2014. This is equal to around 3% of total revenue from premia. As such, it is unlikely to remove the incentive for cream skimming. There may well then be need to revisit the risk equalisation formula so that dumping costly patients on VZA is disincentivised. The most basic risk adjusters used to risk equalise premia are based on age and sex. They are easy to collect and monitor, but are poor measures of expected health care costs (Ellis, 2007). As a consequence, payments based on these factors are usually poor at reducing incentives for risk selection. More sophisticated models involve measures of health risk as predictors: utilisation-based adjusters (such as hospital admissions, length of hospital stay) or clinical diagnoses or even pharmacy data.
Improving the risk equalisation formula should be a focus for government action, to ensure the CHI market operates efficiently. Economists agree that robust risk equalisation is vital to effective competition where premiums are community rated. Stronger risk equalisation would help to bring down insurer transaction costs.
CHI premiums
It is clear that the flat-rate premia offered by CHI are regressive. They take no account of income or ability to pay. The fact that CHI coverage is almost universal implies that poorer households are currently purchasing it, which may produce some hardship. Where there has been a slight drop in coverage, as noted earlier, then this may indicate that such payments are impacting on coverage decisions and there may then be exposure to co-payments and potential unmet need. From the analysis of financial protection included in the Health Expenditure Review (see separate report) it is apparent that financial protection in the system has been very good but is getting slightly worse, probably as a consequence of austerity and associated unemployment and falling wages. Yet levels of unmet need still appear to be low according to EU-SILC data (2013).
One possible way to counteract regressivity and avoid poorer households deciding to give up cover would be to change the payment method for CHI. Ideally, payments would be made according to ability to pay. This may not be practical given that CHI would then need to know income data which, although held by government, may be confidential. Also, while it would be popular among poorer households and larger households, who would pay less or the same for CHI as at present, it would be unpopular among richer households, who would pay more for CHI than they currently do. Alternatively, lessons could be drawn from other countries. For instance, in France, where CHI plays a very similar role covering co-payments, the authorities introduced two measures to help poorer people afford CHI (Chevreul et al 2010). In 2000, the CMU Act (couverture maladie universelle) provided free CHI to individuals whose annual income was below

14
€7,521 (as of January 2010). This is mainly financed through a tax on CHI business (€1.8 billion in 2009). In 2008, this covered 7% of the population. Further, in order to help people at the margin of the CMU income ceiling to access CHI, a voucher scheme was created in 2004 by the Health Insurance Reform Act. Financial assistance in the form of a “health cheque” (cheque santé) is offered to people whose income is below a ceiling. The amount offered depends on the person’s age. In 2010, it ranged from €100 per year for people aged under 25 years to €400 for people aged above 60. In 2008, it was €220 on average. Such an option in the Slovenian system could well be worth exploring with funds generated by a tax on CHI business targeted at households according to their income. Gaining a better understanding of the affordability of CHI should be a priority for government. This would enable the government to develop effective policies to ensure good financial protection for all households and improve equity in financing CHI.
The previous options entail political risks (especially Options 1 and 2, which will effectively abolish the market for CHI covering co-payments) or may be constrained by fiscal policy. Even the regulatory option requires additional resources to boost current performance evaluation and information systems and potentially a new tariff to improve equity which may also be resisted. Consequently, government may wish to do nothing. While this strategy will not risk undermining the current strengths of population coverage from co-payments, it will also fail to address the existing weaknesses of CHI’s role in the system, many of which could be tackled through better regulation.
Discussion
Complementary health insurance in Slovenia achieves very high coverage and premiums appear to be largely affordable. It provides financial protection to households from co-payments and a safety valve for public financing during financial crisis. Nevertheless, it is complex and regressively financed and the number of subscribers has fallen in recent years, while transactions costs and insurer profits have risen. It is also lacking in transparency. If the government feels that radical reform is needed to meet national health policy objectives, then it could consider removing the need for people to buy CHI covering co-payments. This could be done by abolishing co-payments (Option 1) or replacing CHI with a public compulsory prepayment option (Option 2).
Both of these options have merit – they would lower transaction costs at a system level, enhancing administrative efficiency. Depending on how they were implemented, they could also improve transparency and equity in financing (by linking payment to income). However, they both present significant political risks in comparison to Option 3, by provoking opposition from private insurers (and others). They also raise additional challenges for the government.

15
Both options would have a major impact on the CHI market, probably resulting in large job losses. However, Option 1 could be phased in over a period of time, which would give the industry time to adapt and develop new products.
Both options raise the question of how to bridge the funding gap – of around €400 million – created by the demise of CHI covering co-payments (Option 2) and the abolition of co-payments (Option 1). This is a fundamental issue for the government to consider given short-term fiscal constraints and the longer-term importance of broadening the public revenue base.
If additional public funding cannot be found to fully bridge this gap, and costs are shifted onto households, health system performance is likely to suffer.
Alternatively, better regulation and oversight of the CHI market (Option 3) would help mitigate the weaknesses of CHI while preserving its strengths. Investing in policy-relevant analysis, improving reporting requirements, introducing a minimum claims ratio and strengthening risk equalisation would enhance transparency, help to lower transaction costs and ensure the market operates more efficiently. With better analysis and information, the government would also be able to introduce effective policies to make CHI financing more affordable and equitable and ensure that CHI continues to provide good financial protection for all households.
CHI’s share of private spending on health (around 48% in 2013) is the second highest in Europe (after France, 59%) and the sixth highest in the world. This suggests it does very well in covering gaps in publicly financed coverage. However, Slovenia lags behind France in this respect and it may therefore be useful to see whether the CHI market could be encouraged to provide cover for other health care activities that incur significant out-of-pocket payments, such as dentistry. Dental costs are one of the few causes of unmet need and hardship in Slovenia. Because of these additional political risks, and because decisions about increasing public spending may be largely beyond the control of the Ministry of Health, better regulation and oversight can address the shortcomings of the CHI market.
Other roles for CHI and private insurers
One strategy that has been put forward by some stakeholders is to change the role of private health insurers to become purchasers of all health care services and so to introduce competition for purchasing HIIS benefits. While it may seem at first sight that there could be potential benefits to be had by introducing competition into the health care purchasing process, the evidence argues against tangible benefits from this option in Slovenia, for the following reasons:
1. Economies of scale and small population: Typically, purchasers of care tend to perform better when they are larger. They can then exploit economies of scale. Interestingly, after a period of consolidation and merger the Dutch system settled down into four main insurance groups covering a total population of 16 million (Ryan, Thomas and

16
Normand 2009). This implies economies of scale were gravitating towards 1 scheme per 4 million people. Given the small size of the population in Slovenia, just over 2 million, it is unlikely that the country is large enough to sustain large enough competing insurers to capture available economies of scale. The current single health care purchaser, HIIS, is more appropriate.
2. Inefficient complexity:
a. Additional regulatory costs – In 2006 the Netherlands moved from a system of compulsory and competitive multiple sickness funds for two-thirds of the population to a universal system operated by private insurers. The Dutch government had to employ an additional 600 civil servants to administer and regulate the new system because of its complexity (Okma, Marmor & Oberlander 2011)
b. Increased transaction costs (duplication) – Typically, systems that rely on multiple purchasers have higher transaction costs (WHA 2011). Part of this is because there needs to be duplication of capacity to purchase care (across several insurers). This is also partly related to the complexity of parallel negotiations (and the need for profit-making if commercial insurers are involved).
3. Cost escalation: International evidence is unequivocal in highlighting that the most
expensive health care systems globally are those that rely on private insurers as the main purchasers of health care (the Netherlands, Switzerland, the US) (McPake, Normand and Smith 2013). The Dutch experience shows very rapid cost escalation once the new system had bedded down, running at more than 5% ahead of inflation (Thomas and Darker 2013). Much of this relates to the failure to drive down producer prices and an increase in activity in the system.
4. It is challenging to remove incentives for risk selection and associated inefficiency:
Even with a very sophisticated risk equalisation scheme the Netherlands systems has not removed the incentive for insurers to cream skim. Insurers still risk select, sometimes on the basis of consumer choice of additional voluntary health insurance coverage (Thomas and Darker 2013). While profits can be had from creaming skimming, there are few incentives for insurers to drive down the cost of care. Cream skimming is in effect a zero-sum game with no aggregate benefit to the health care system. Such distractions are not present in a single purchasing system. The information requirements and transaction costs associated with developing a robust risk equalisation mechanism are substantial.
5. Equity: A system in which health financing is based on ability to pay may result in two-
tier access with associated high levels of unmet need. If contributions are not related to income, they will be regressive. While it may be possible for government to compensate for such inequities with a system of subsidies for the worse off, the system will be complex (see above, problems with regulation and transaction costs).
6. Transparency: One of the potential advantages of a system financed through payroll
taxes earmarked for health is that the population appreciates seeing where their funds are going and so it may be acceptable to pay more funding (McPake, Normand and

17
Smith 2013). Where there is more complexity, this lack of transparency may undermine the acceptability of health care funding.
7. Choice of provider: an unexpected consequence of introducing selective contracting in
the Netherlands is that there is now less choice of health care provider (Okma & Crivelli 2010).
It is clear from the international evidence that introducing purchaser competition – especially if purchasers are private insurers with little or no experience of purchasing – will lead to a rise in transaction costs and may also lead to cost escalation, inequity, inefficiency and less transparency.

18
References
Chevreul K, Durand-Zaleski I, Bahrami S, Hernández-Quevedo C and Mladovsky P. (2010) France: Health system review. Health Systems in Transition, 12(6): 1–291. Cukut Krilić S, Novak T, Jurišić B (2013): Dynamic Historical Analysis of Longer Term Migratory, Labour Market and Human Capital Processes in Slovenia. Country report developed within the project. ‘SEEMIG Managing Migration and Its Effects – Transnational Actions Towards Evidence Based Strategies’. http://www.seemig.eu/downloads/outputs/SEEMIGHistoricalAnalysisSlovenia.pdf Ellis, R. P. (2007) Risk Adjustment in Health Care Markets: Concepts and Applications, in Financing Health Care: New Ideas for a Changing Society (eds M. Lu and E. Jonsson), Wiley-VCH Verlag GmbH & Co. KGaA, Weinheim, Germany. Insurance Europe (2014). Statistics No 50: European Insurance in Figures (dataset). Published 6 January 2015. Kutzin J (2008) Health financing policy: A guide for decision-makers. Copenhagen: WHO Regional office for Europe. Lu J-f, Leung G, Kwon S, Tin K, van Doorslaer E, O’Donnell O. (2007). Horizontal equity in healthcare utilisation – evidence from 3 high-income Asian economies. Social Science and Medicine 64(1):199-212. McPake B, Normand C and Smith S. (2013) Health Economics: An International Perspective. Routledge. 3rd Edition. Okma, K., & Crivelli, L. (2010). Six countries, six reform models: the healthcare reform experience of Israel, The Netherlands, New Zealand, Singapore, Switzerland and Taiwan. Singapore: World Scientific Publishers. Okma, K. G. H., Marmor, T. R., & Oberlander, J. (2011). Managed Competition for Medicare? Sobering Lessons from the Netherlands. New England Journal of Medicine, 365(4), 287–289. doi:10.1056/NEJMp1106090
Royalty AB, Solomon N. (1999) Health Plan Choice: Price Elasticities in a Managed Competition Setting Health Plan Choice Price Elasticities in a Managed Competition Setting. J Hum Resour.; 34(1):1–41. Ryan, P., S. Thomas, and C. Normand. (2009) Translating Dutch: challenges and opportunities in reforming health financing in Ireland. Irish Journal of Medical Sciences, 178: p. 245-8. Strombom BA, Buchmueller TC, Feldstein PJ. (2002) Switching costs, price sensitivity and health plan choice. J Health Econ. Jan;21(1):89–116. Thomas S, Darker C. (2013) Which is the right model of Universal Health Insurance for Ireland? In, editor Tom O'Connor, Integrated Care for Ireland in an International Context. Challenges for Policy, Institutions and Specific Service User Needs, Cork, Oak Tree Press.

19
Van Dijk M, Pomp M, Douven R, Laske-Aldershof T, Schut E, de Boer W, et al. (2008) Consumer price sensitivity in Dutch health insurance. Int J Health Care Finance Econ. Dec;8(4):225–44. WHA. (2011). Sustainable health financing structures and universal coverage: 64th World Health Assembly agenda item 13.4. Retrieved from http://www.sciencedirect.com/science?_ob=RedirectURL&_method=externObjLink&_locator=url&_issn=01406736&_origin=article&_zone=art_page&_plusSign=%2B&_targetURL=http%253A%252F%252Fapps.who.int%252Fgb%252Febwha%252Fpdf_files%252FWHA64%252FA64_R9-en.pdf