Making Puget Sound Work for People: An … 3_02...Making Puget Sound Work for People: An...
64
Making Puget Sound Work for People: Making Puget Sound Work for People: An Introduction to Ecosystem Services An Introduction to Ecosystem Services World Resources Institute NOAA Fisheries The Nature Conservancy March 4, 2008 World Resources Institute
Transcript of Making Puget Sound Work for People: An … 3_02...Making Puget Sound Work for People: An...
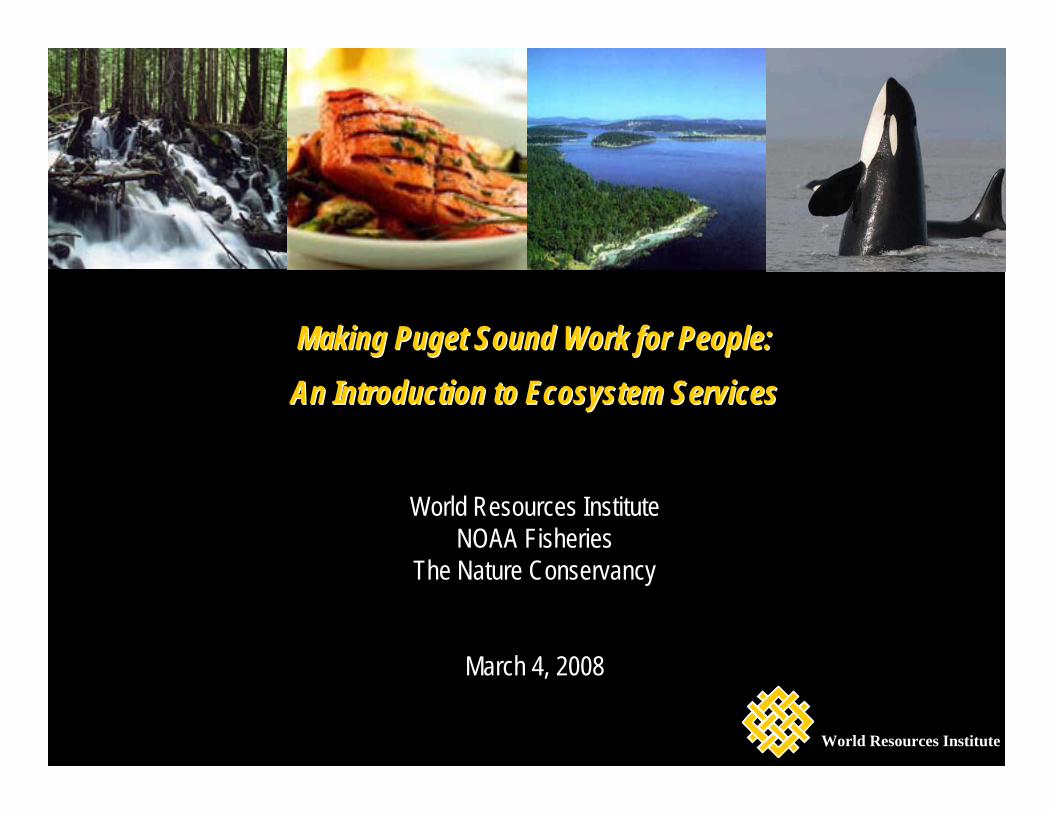
Making Puget Sound Work for People: Making Puget Sound Work for People: An Introduction to Ecosystem ServicesAn Introduction to Ecosystem Services
World Resources InstituteNOAA Fisheries
The Nature Conservancy
March 4, 2008
World Resources Institute

Protecting and Restoring Puget SProtecting and Restoring Puget Soundound’’ssNatural CapitalNatural Capital
How can the concept of ecosystem services help sharpen our
objectives and prioritize our
actions?

Protecting and Restoring Puget SProtecting and Restoring Puget Soundound’’ssNatural CapitalNatural Capital
• Mapping current ecosystem services (TNC)
• Understanding how ecosystem function affects services provided (NOAA Fisheries)
• Prioritizing ecosystem services and identifying strategies to sustain them (WRI)

World Resources Institute (WRI)World Resources Institute (WRI)
A nonA non--profit environmental think tank profit environmental think tank that transforms ideas into action that transforms ideas into action
to protect the planet and improve peopleto protect the planet and improve people’’s livess lives

WRI has played a pivotal role in many environmental achievementsWRI has played a pivotal role in many environmental achievements
People and ecosystems
Climate and energy
Sustainable enterprise
Institutions and governance
•• Millennium Ecosystem AssessmentMillennium Ecosystem Assessment•• Global Forest WatchGlobal Forest Watch•• Global Environment FacilityGlobal Environment Facility
•• Greenhouse Gas Protocol Greenhouse Gas Protocol •• U.S. Climate Action PartnershipU.S. Climate Action Partnership•• First carbon offset with AES (1989)First carbon offset with AES (1989)
•• Green Power Market Development GroupGreen Power Market Development Group•• New VenturesNew Ventures
•• Partnership for Principle 10Partnership for Principle 10•• Access initiativeAccess initiative

Workshop agendaWorkshop agenda
Introducing Ecosystem ServicesIntroducing Ecosystem Services
The Ecosystem Services ApproachThe Ecosystem Services Approach
The Puget Sound Action AgendaThe Puget Sound Action Agenda

Water filtration plant
What is this?What is this?
$6 billion $2.7 billion
www.zenon.com

Storm protection system
What is this?What is this?
www.magazine.noaa.gov

$5.2 billion annual tourism industry (Puget Sound)
What is this?What is this?

CulturalNon-material
benefits obtained from ecosystems
RegulatingBenefits obtained
from control of natural processes
by ecosystems
ProvisioningGoods produced or provided by
ecosystems
3 categories of ecosystem services3 categories of ecosystem services

What was the Millennium Ecosystem Assessment (MA)?What was the Millennium Ecosystem Assessment (MA)?
Photo courtesy of USDA NRCS
Largest assessment of health of ecosystems
ever undertaken
Provide authoritativesource of information to
decision-makers
Photo courtesy of USDA NRCS
Photo courtesy of USDA NRCS Photo courtesy of USDA NRCS
1360 experts from 95 countries over 4 years;
peer reviewed
Partnership of UN agencies, five conventions, business,
and NGOsVNU <www.vnu.com>
Examined links between ecosystems and human
well-being

Capture fisheriesWild foodsBiomass fuelGenetic resourcesBiochemicalsFresh water
Air quality regulationClimate regulationErosion regulationWater purificationPest regulationPollinationNatural hazard regulation
Spiritual valuesAesthetic values
What do we know about the status of the worldWhat do we know about the status of the world’’s ecosystem s ecosystem services?services?
Degraded EnhancedMixed
Provisioning
Cultural
Regulating
CropsLivestockAquaculture
Carbon sequestration
TimberFiber
Water regulationDisease regulation
Recreation & ecotourism

Factors that cause changes in one or more direct drivers
WhatWhat’’s driving ecosystem change?s driving ecosystem change?
Indirect drivers
Direct drivers Factors—natural or manmade—that cause changes in an ecosystem and its ability to supply services
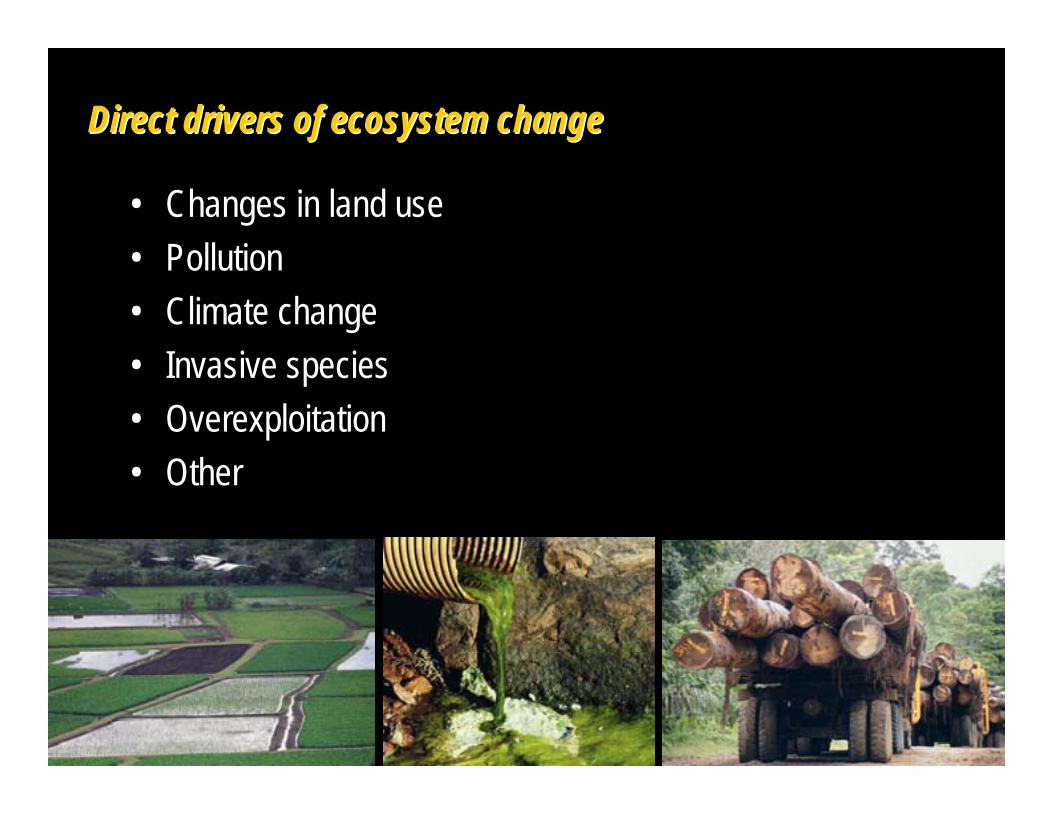
• Changes in land use• Pollution• Climate change• Invasive species• Overexploitation• Other
Direct drivers of ecosystem changeDirect drivers of ecosystem change
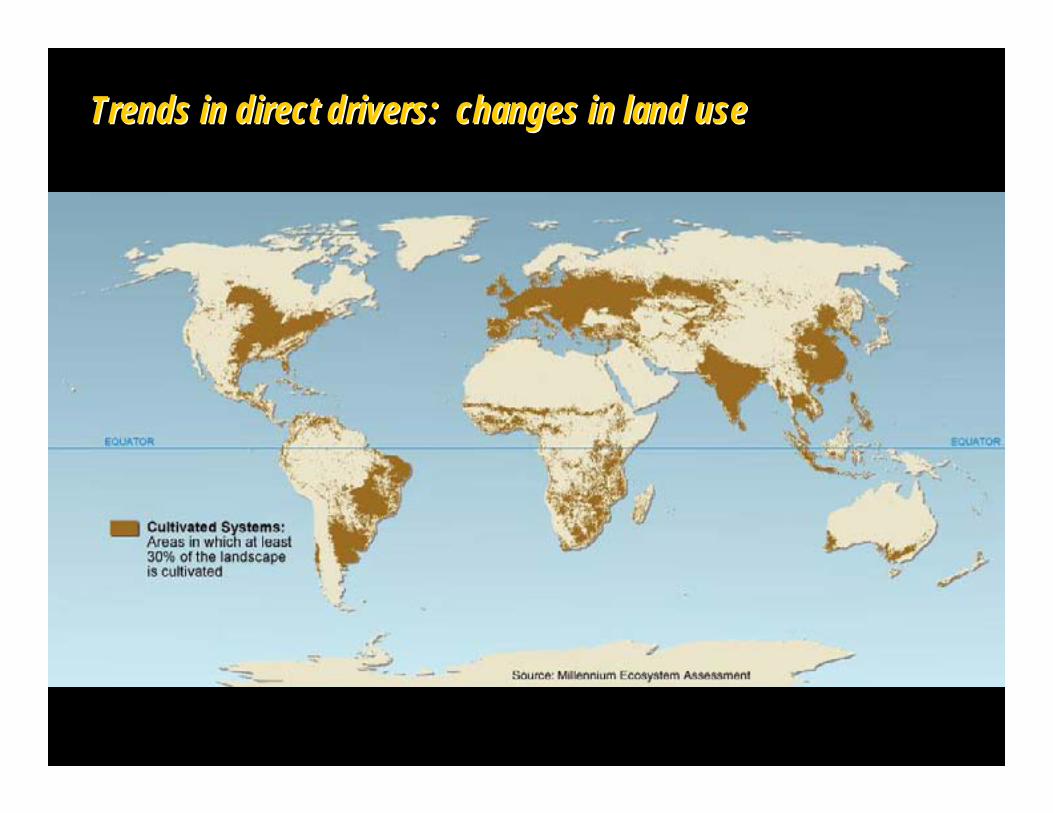
Trends in direct drivers: changes in land useTrends in direct drivers: changes in land use

Trends in direct drivers: changes in land useTrends in direct drivers: changes in land use

DRAFT Change in Forest Cover (1991 to 2001) Threat MapChange in Forest Cover (1991 to 2001) Threat Map DRAFT

Trends in direct drivers: pollutionTrends in direct drivers: pollution

Trends in direct drivers: climate changeTrends in direct drivers: climate change
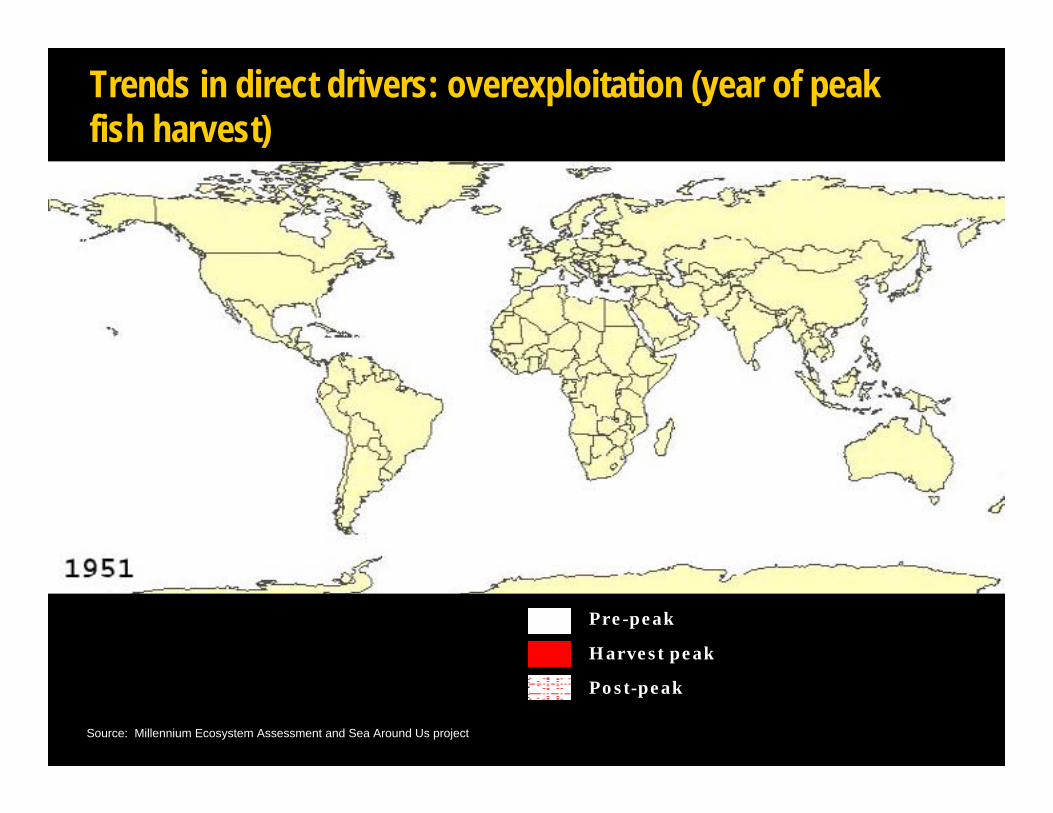
Trends in direct drivers: overexploitation (year of peak fish harvest)
Harvest peak
Pre-peak
Post-peak
Source: Millennium Ecosystem Assessment and Sea Around Us project
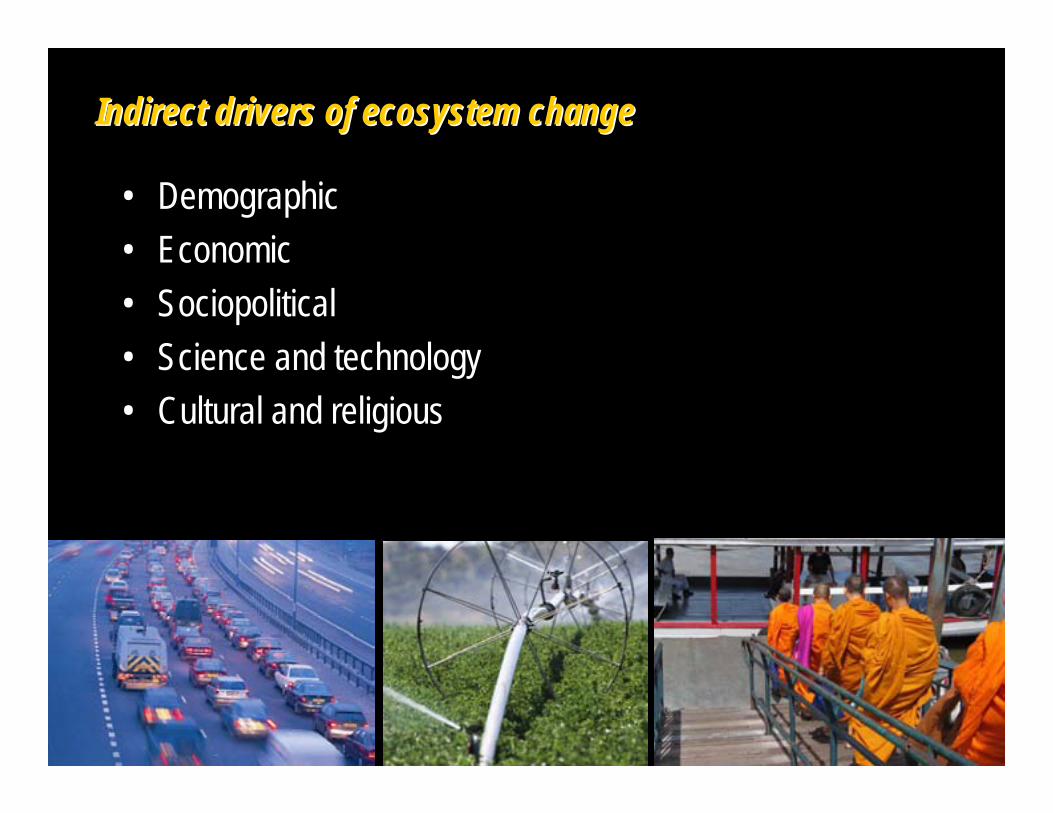
• Demographic• Economic• Sociopolitical• Science and technology• Cultural and religious
Indirect drivers of ecosystem changeIndirect drivers of ecosystem change

Central Puget Sound Urban Growth Simulation 1940-2000
Trends in indirect drivers: demographicTrends in indirect drivers: demographic
Source: Urban Ecology Research Laboratory, “Central Puget Sound Urban Growth Simulation,” Land Cover Change Models, University of Washington
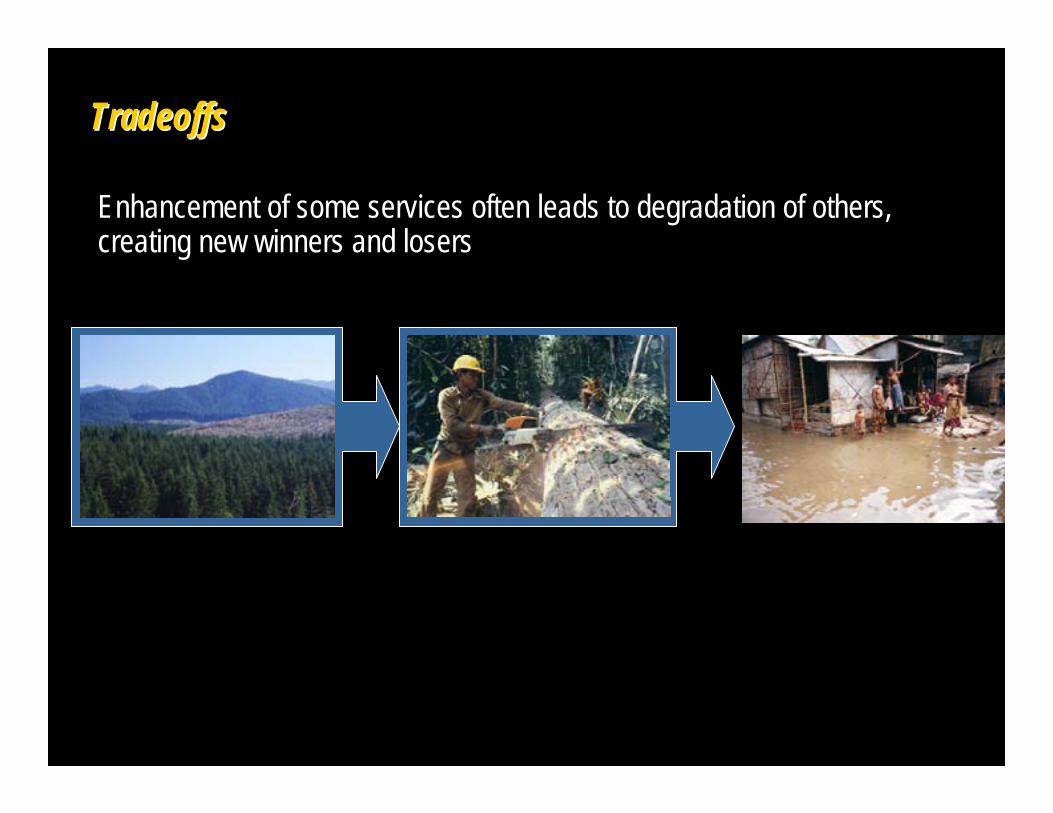
Enhancement of some services often leads to degradation of others, creating new winners and losers
Tradeoffs Tradeoffs

Workshop agendaWorkshop agenda
Introducing Ecosystem ServicesIntroducing Ecosystem Services
The Ecosystem Services ApproachThe Ecosystem Services Approach
The Puget Sound Action AgendaThe Puget Sound Action Agenda
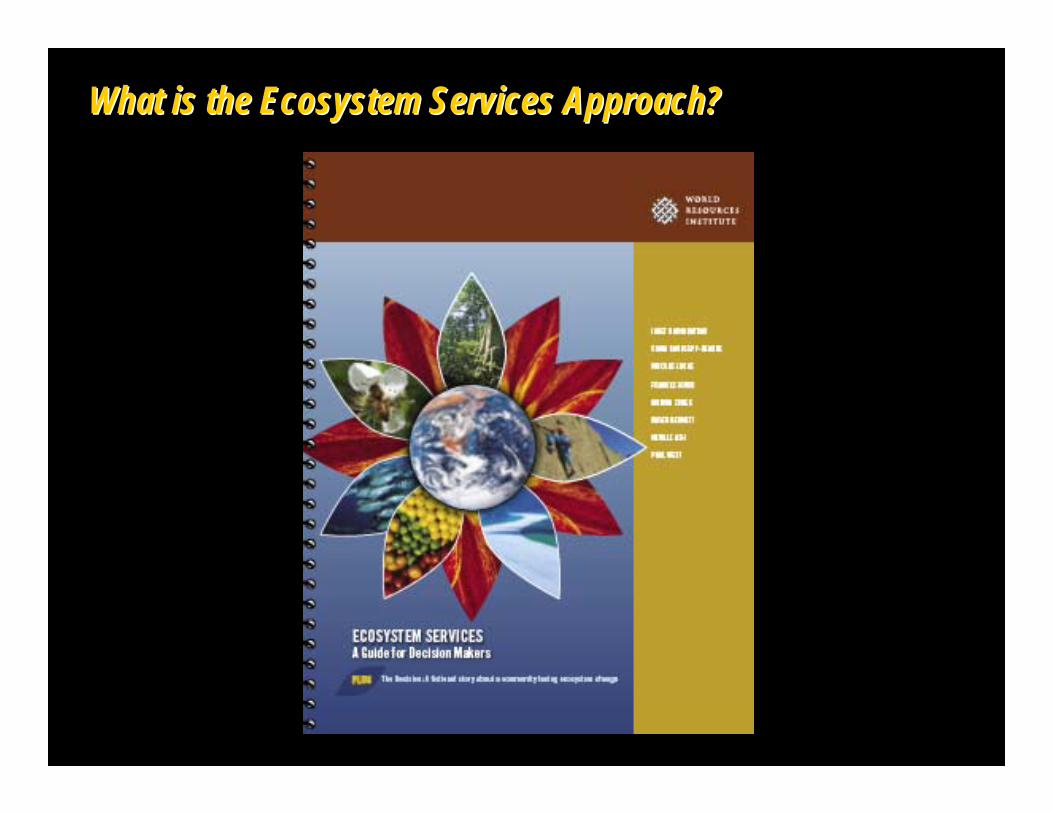
What is the Ecosystem Services Approach?What is the Ecosystem Services Approach?

Methods of the Ecosystem Services ApproachMethods of the Ecosystem Services Approach
• Ecosystem service prioritization
• Trends analyses
• Ecosystem service mapping
• Economic valuation
• Scenario planning
• Portfolio of policy options

WhoWho’’s using an Ecosystem Services Approach?s using an Ecosystem Services Approach?

Ecosystem services prioritizationEcosystem services prioritization
What: Exercise to identify those ecosystem services most relevant to decision-makers’ goals
Why: Prioritize subsequent analysisEnsure stakeholder values recognizedFamiliarize with ecosystem services
Who: Decision-makersStakeholder representatives

Dependence Dependence DependenceProvisioning
Crops ○ - Livestock ● - Capture fisheries Aquaculture Wild foods ○ + Timber and other wood fibers ● + Other fibers (e.g., cotton, hemp, silk) Biomass fuel ○ ● + Fresh water ● ● - Genetic resources ○ ○ ? Biochemicals, natural medicines, and' pharmaceuticals ○ +
RegulatingAir quality regulation ? ? Global climate regulation ○ ● + Regional/local climate regulation ○ ○ + Water regulation ● ● - Erosion regulation ○ ○ - Water purification and waste treatment ○ - Disease regulation Pest regulation Pollination Natural hazard regulation
CulturalRecreation and ecotourism ● + Ethical values ○ +
Ecosystem services Impact Impact
CustCompany operationsSuppliers
Key criteria for identifying priorities
• Dependence
• Impact
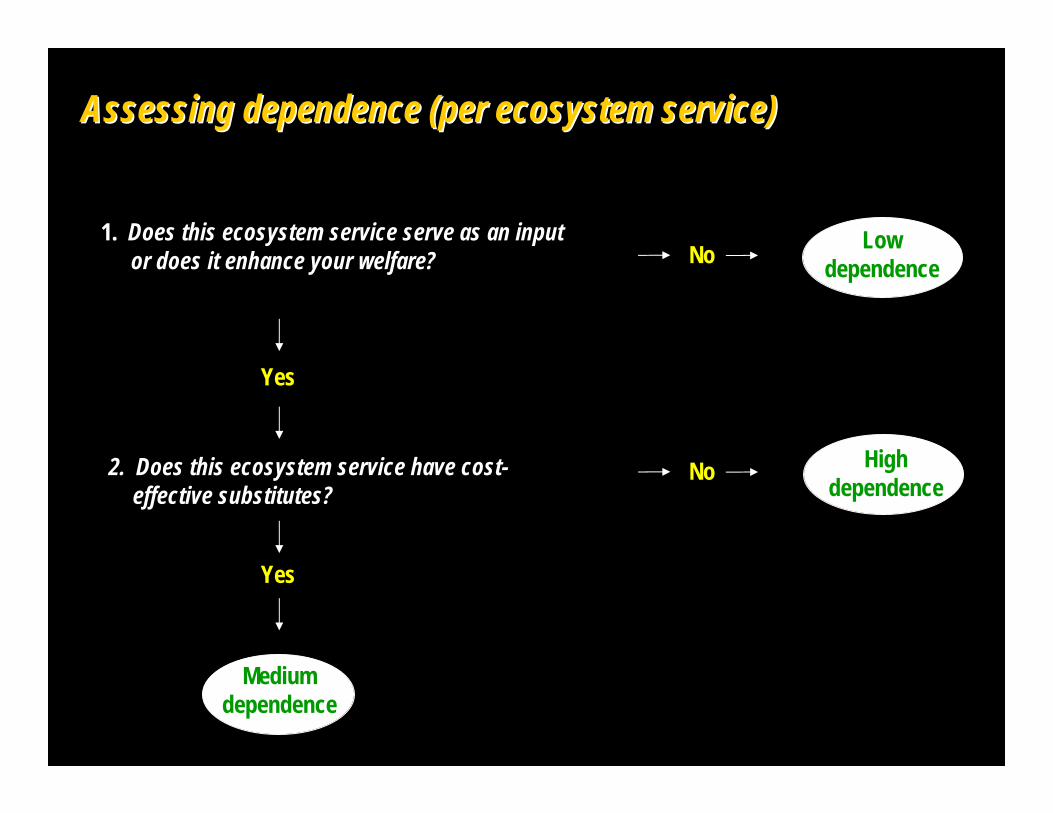
Assessing dependence (per ecosystem service)Assessing dependence (per ecosystem service)
1. Does this ecosystem service serve as an input or does it enhance your welfare?
2. Does this ecosystem service have cost-effective substitutes?
Yes
Yes
No
No
Low dependence
High dependence
Medium dependence

Assessing impact (per ecosystem service)Assessing impact (per ecosystem service)
3. Do you affect the quantity or quality of this ecosystem service?
Yes
No
No
Low impact
Medium impact
High impact
4. Does your impact limit or enhance the ability of others to benefit from this ecosystem service?
Yes • Large share
• Short supply relative to demand
• Nearing threshold

World Resources Institute
Ecosystem servicesDependent
uponDependent
uponDependent
upon Im pactProvisioning
Crops -Livestock -Capture fisheriesAquacultureW ild foods +Timber +Cotton, hemp, silk, etcBiomass fuel +Fresh water -Genetic resources ?Biochemicals, natural medicines and' pharmaceuticals
+
RegulatingAir quality regulation ? ?Climate regulation +W ater regulation -Erosion regulation -W ater purification and waste treatment -Disease regulationPest regulationPollinationNatural hazard regulation
CulturalSpiritual, relig ious, or cultural heritage values +/-Recreation, ecotourism , or aesthetic values +/-
Some impact or dependence
Significant impact or dependence+ Positive im pact
– Negative impact
* The business unit, facility, geographic operations, or product line being reviewed in the ESR
Im pact Im pact
M ajor custom ers Com pany operations*Key input suppliers
Priority ecosystem services: MondiPriority ecosystem services: Mondi
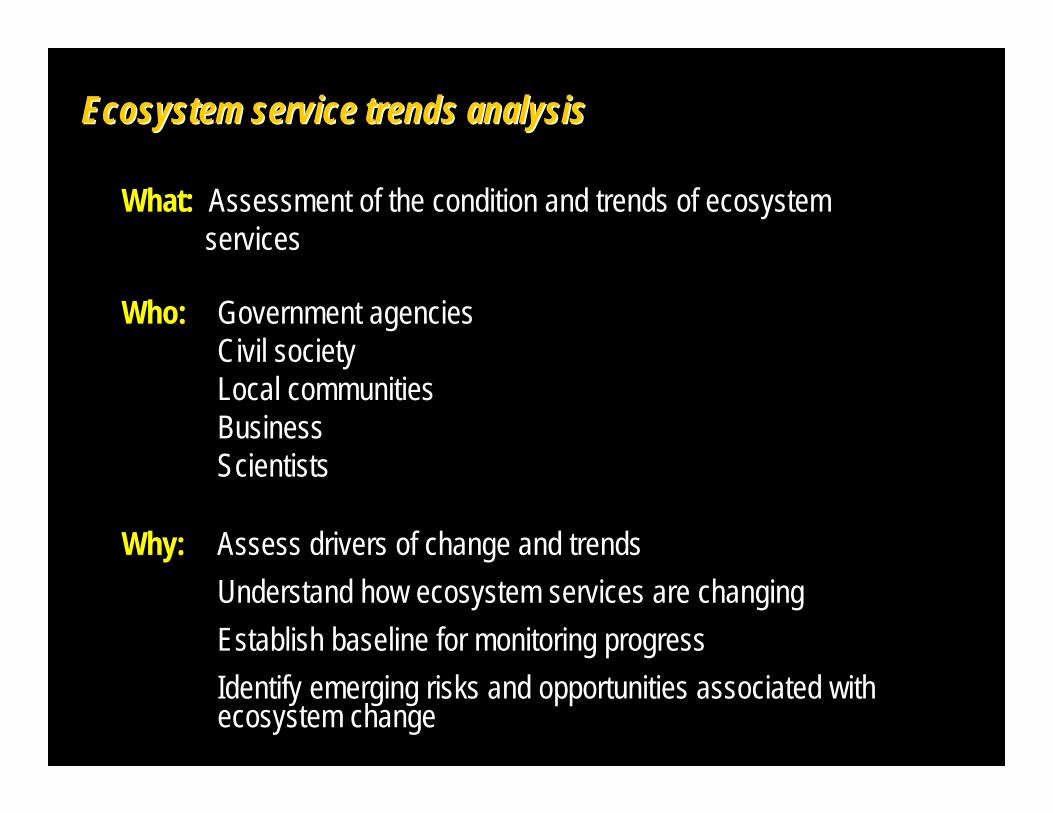
Ecosystem service trends analysis Ecosystem service trends analysis
What: Assessment of the condition and trends of ecosystem services
Why: Assess drivers of change and trendsUnderstand how ecosystem services are changingEstablish baseline for monitoring progressIdentify emerging risks and opportunities associated with ecosystem change
Who: Government agenciesCivil societyLocal communitiesBusinessScientists

Ecosystem service trends analysisEcosystem service trends analysis
Trends in the ecosystem service• Supply and demand• Quantity and quality• Present and future
Direct drivers• Changes in land use• Pollution• Climate change• Invasive species• Overexploitation• Other
Indirect drivers• Demographic• Economic• Sociopolitical• Scientific & technological• Cultural and religious
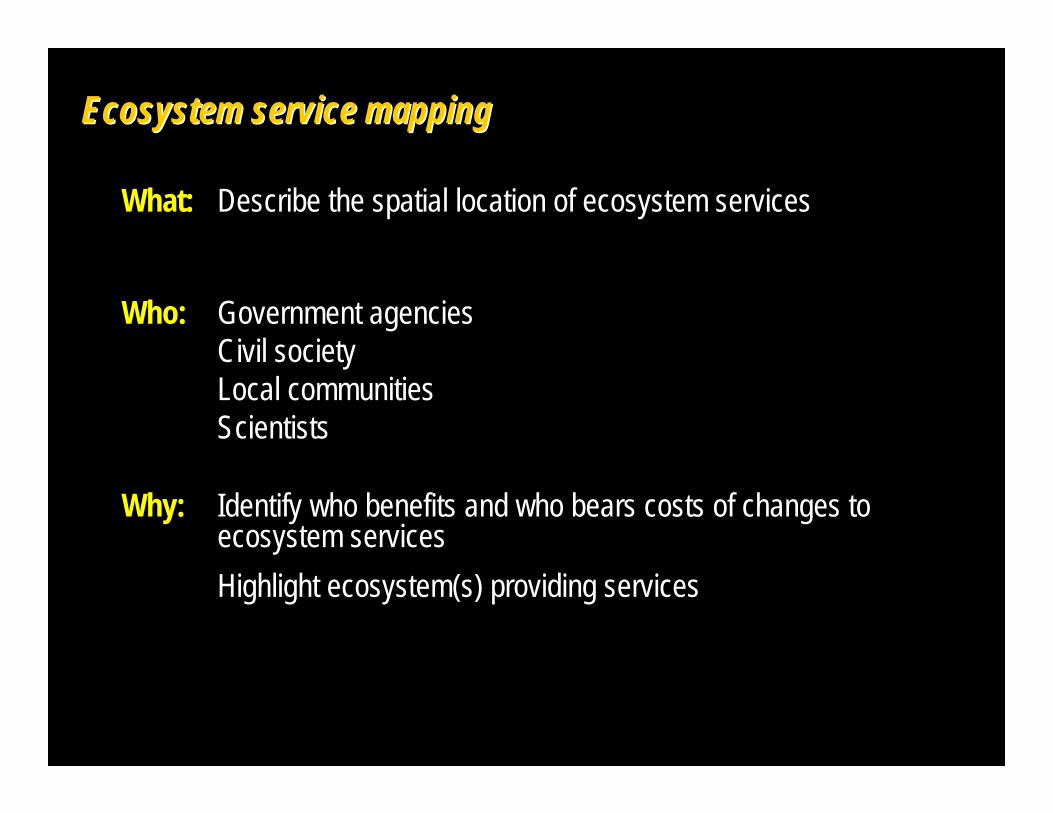
Ecosystem service mapping Ecosystem service mapping
What: Describe the spatial location of ecosystem services
Why: Identify who benefits and who bears costs of changes to ecosystem servicesHighlight ecosystem(s) providing services
Who: Government agenciesCivil societyLocal communitiesScientists

NaturesNatures’’Benefits in Benefits in Kenya: an Kenya: an Atlas of Atlas of Ecosystems Ecosystems and Human and Human WellWell--BeingBeing
Ecosystem services mappingEcosystem services mapping

Nairobi
Aberdare Range
Aberdare Range Mt KenyaMt Kenya
More than 75% of households rely on surface water
Population dependent on surface water
Ecosystem service mappingEcosystem service mapping
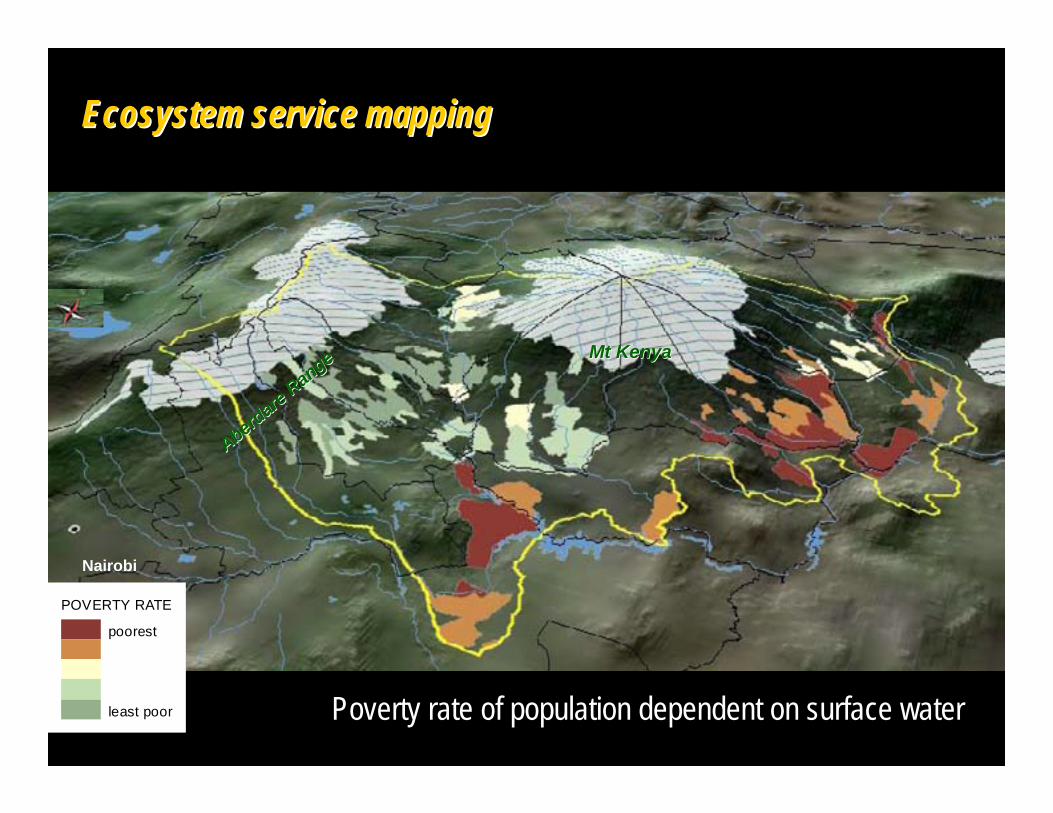
POVERTY RATE
poorest
least poor
Nairobi
Aberdare Range
Aberdare Range Mt KenyaMt Kenya
Poverty rate of population dependent on surface water
Ecosystem service mappingEcosystem service mapping

Ecosystem services mappingEcosystem services mapping
Sources: Kenya Central Bureau of Statistics, International Water Management Institute, Africover – Food and Agriculture Organization of the United Nations, Kenya National Environment Management Authority, and World Conservation Monitoring Centre.
Mt. Kenya
Meru NationalPark
Aberdare Range
Tana R.
Tana
R.

Willamette, OR
© 2007. All rights reserved.
Ecosystem service mappingEcosystem service mapping

Economic Economic valauationvalauation
What: Assign quantitative economic value to ecosystem services, including non marketed services
Why: 1. Communicate the value of ecosystem services
2. Compare the cost-effectiveness of an investment
3. Evaluate the impacts of development policies
4. Build markets for ecosystem services
Who: Government agenciesCivil societyLocal communitiesEconomists
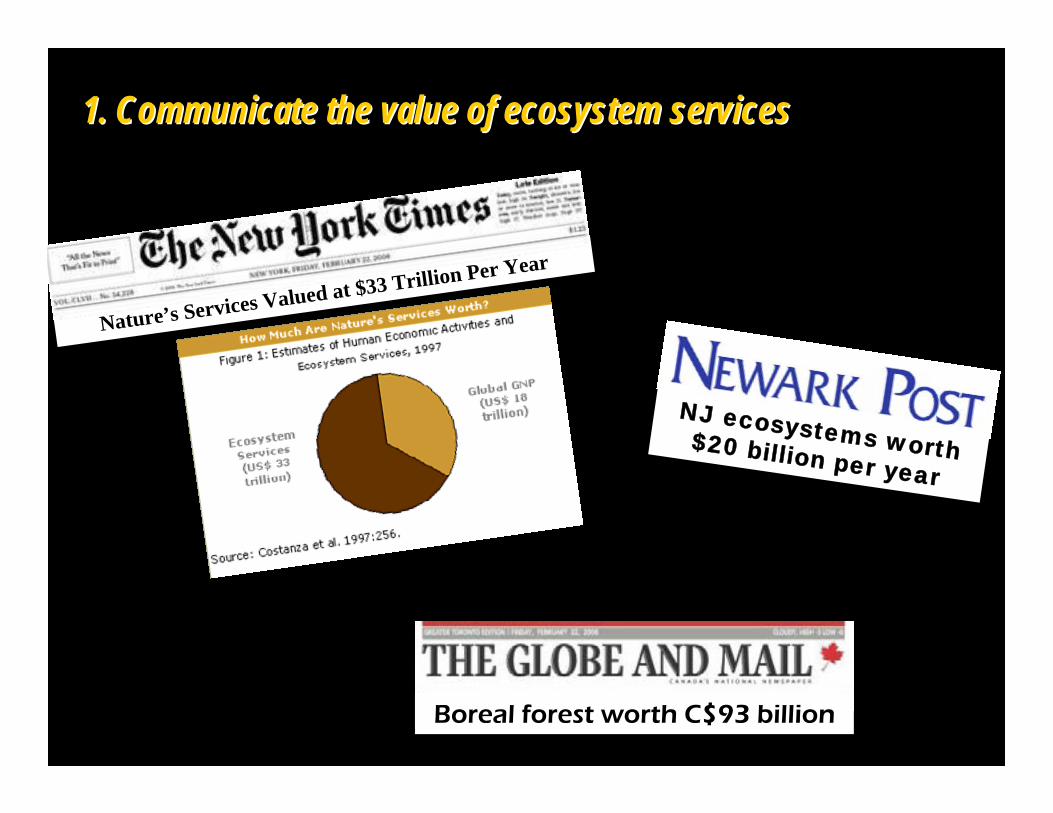
1. Communicate the value of ecosystem services1. Communicate the value of ecosystem services
Nature’s Services Valued at $33 Trillion Per Year
Boreal forest worth C$93 billion
NJ ecosystems worth $20 billion per year

1. Communicate the value of ecosystem services1. Communicate the value of ecosystem services
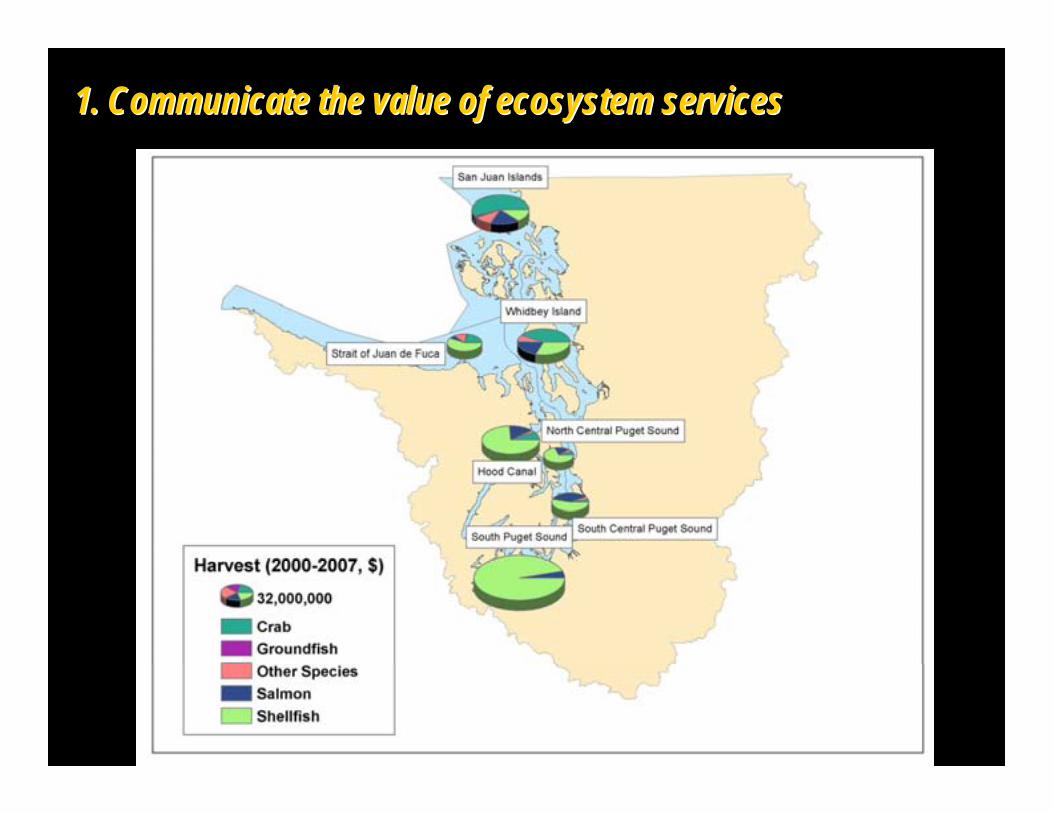
1. Communicate the value of ecosystem services1. Communicate the value of ecosystem services
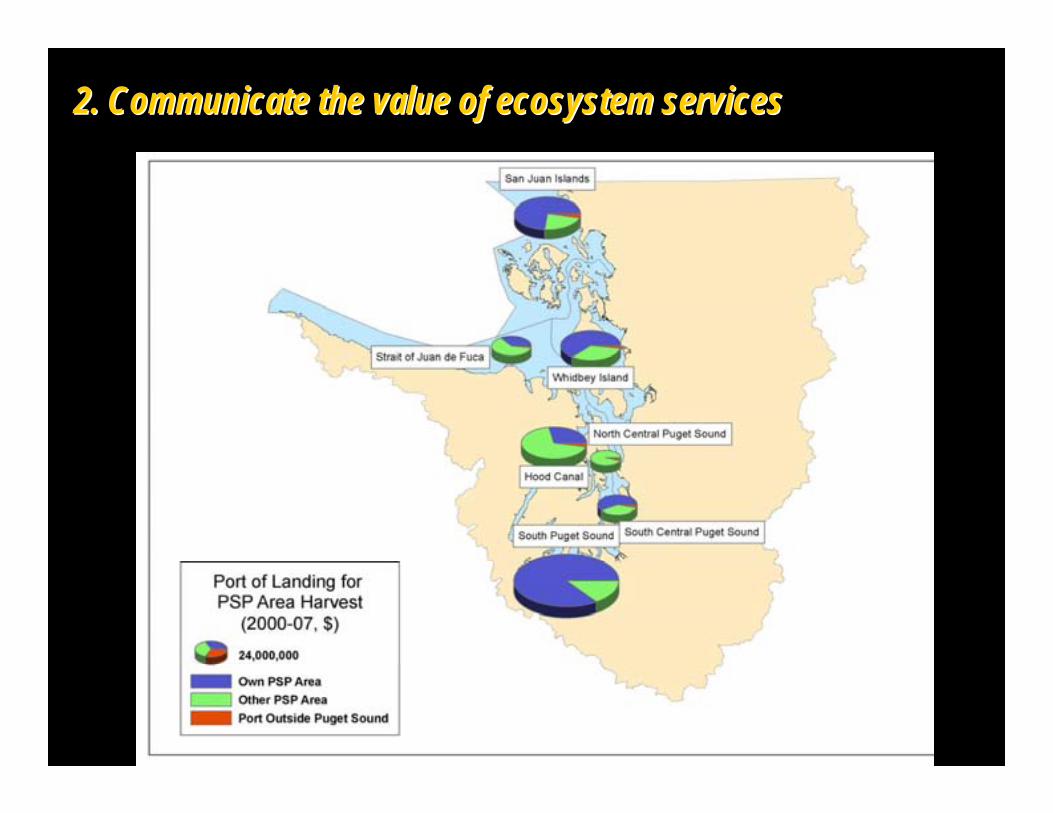
2. Communicate the value of ecosystem services2. Communicate the value of ecosystem services
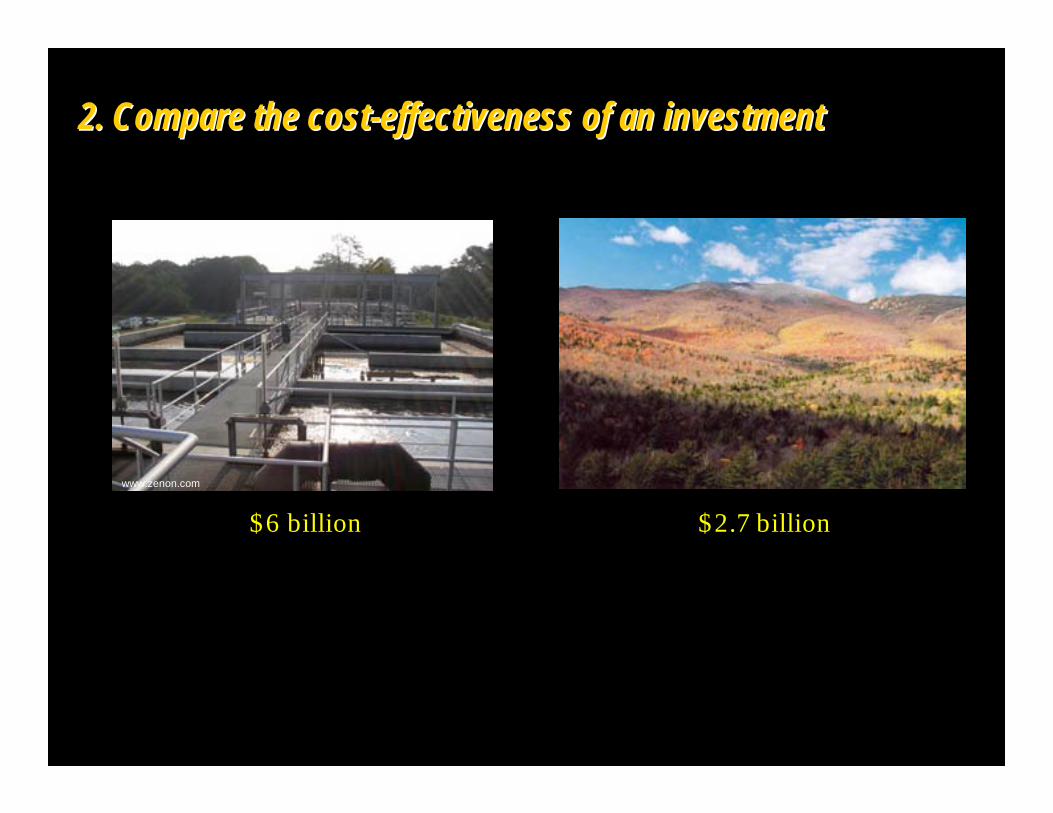
2. Compare the cost2. Compare the cost--effectiveness of an investmenteffectiveness of an investment
$6 billion $2.7 billion
www.zenon.com
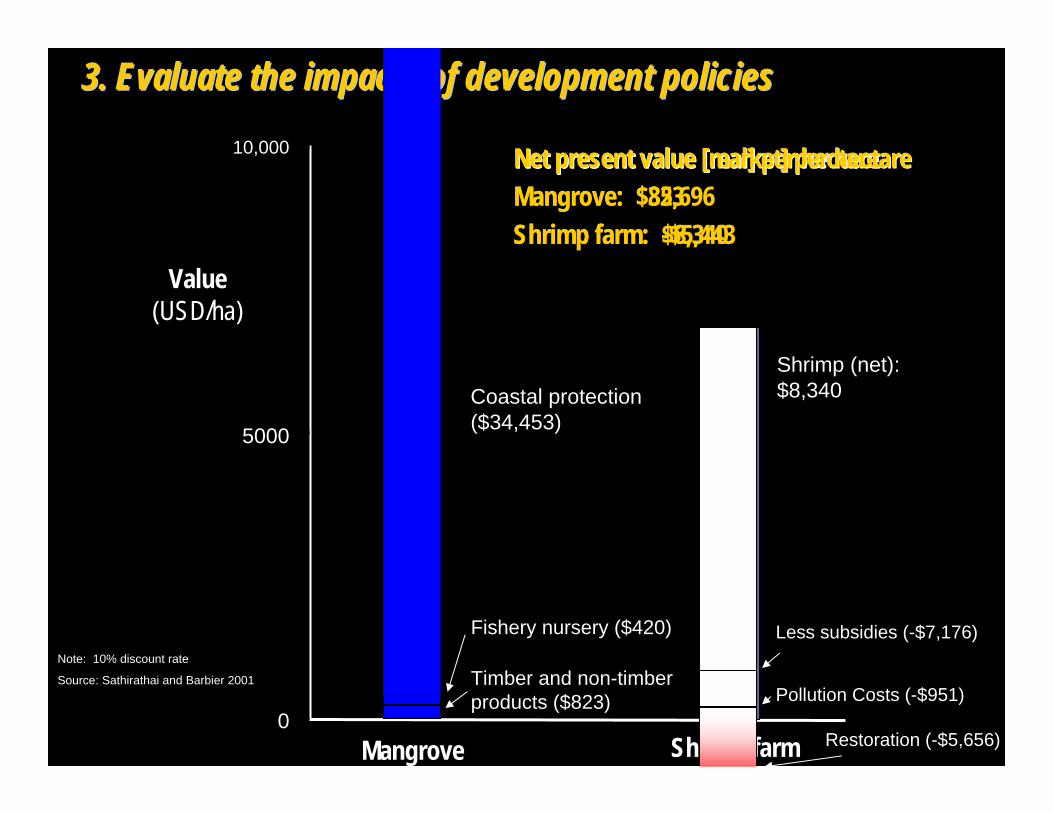
3. Evaluate the impacts of development policies3. Evaluate the impacts of development policies
Net present value [real] per hectare Net present value [real] per hectare Mangrove: $35,696Shrimp farm: -$5,443
Value(USD/ha)
0
5000
10,000
Mangrove Shrimp farm
Coastal protection ($34,453)
Shrimp (net): $8,340
Less subsidies (-$7,176)
Timber and non-timber products ($823)
Fishery nursery ($420)
Pollution Costs (-$951)
Restoration (-$5,656)
Net present value [market] per hectareNet present value [market] per hectareMangrove: $823Shrimp farm: $8,340
Note: 10% discount rate
Source: Sathirathai and Barbier 2001

4. Build markets for ecosystem services4. Build markets for ecosystem services

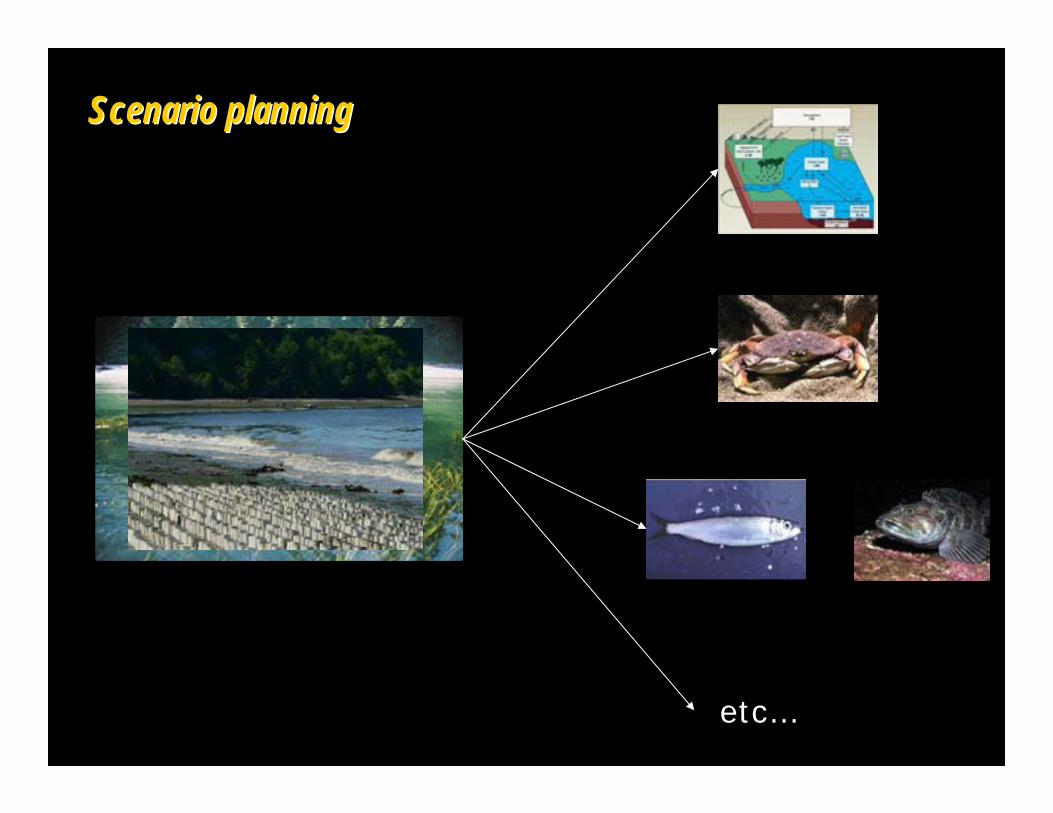
Scenario Planning Scenario Planning
What: Develop set of plausible alternative futures about what might happen under particular assumptions
Why: Understand implications of different policy choices for ecosystems
Create a platform to talk across interest groups, disciplines, and philosophies
Build trust and cooperation and resolve conflicts
Who: Government agenciesCivil societyLocal communitiesBusiness

Scenarios Planning Scenarios Planning -- example BC Hydroexample BC Hydro
Watershed management under future climate: Chinook
Hadley
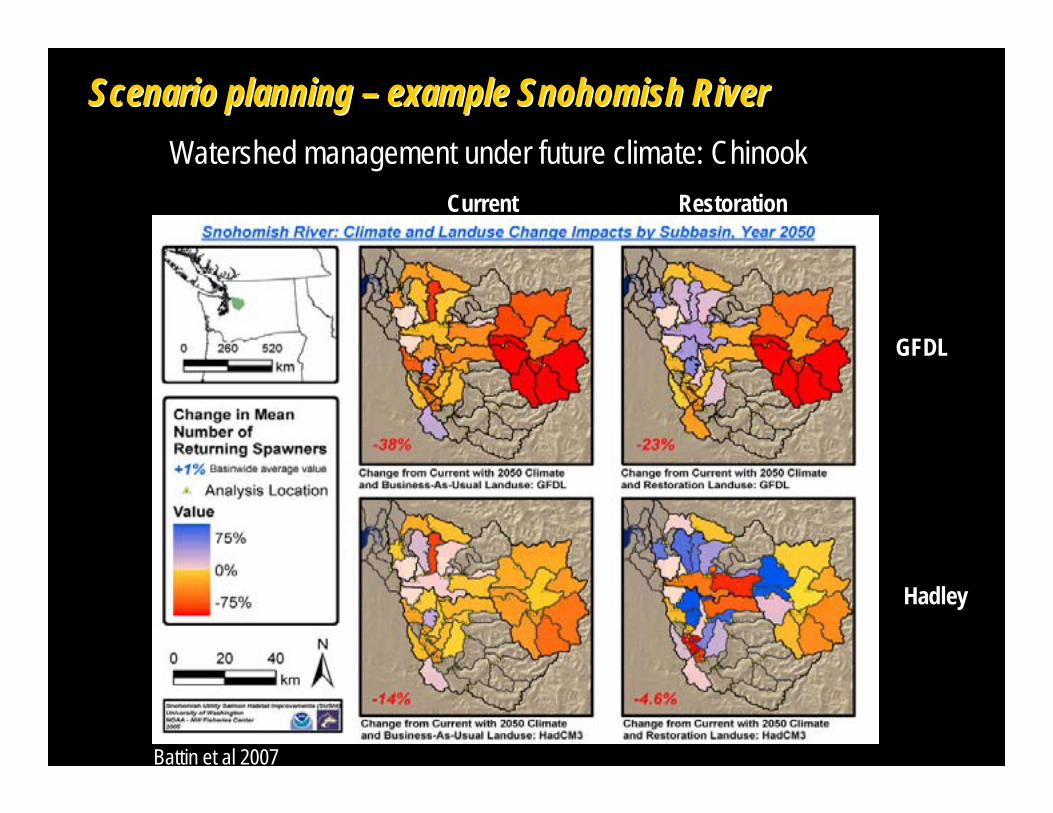
Battin et al 2007
Scenario planning Scenario planning –– example Snohomish Riverexample Snohomish River
Current Restoration
GFDL
Hadley
etc…
Scenario planningScenario planning
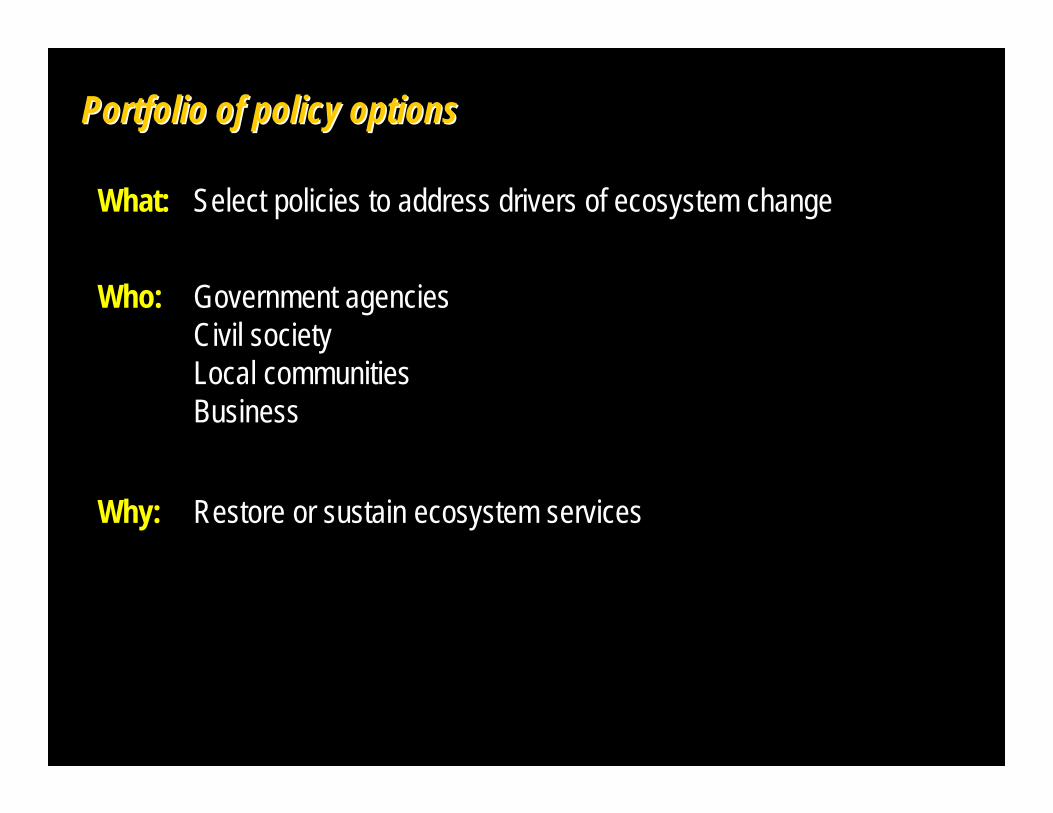
Portfolio of policy optionsPortfolio of policy options
What: Select policies to address drivers of ecosystem change
Why: Restore or sustain ecosystem services
Who: Government agenciesCivil societyLocal communitiesBusiness

Portfolio of policy options Portfolio of policy options -- Illustrative examplesIllustrative examples
Economic and fiscal incentives
• Green levies and fees
Sector policies and plans
• Land-use zoning
National and sub-national policies and plans
• Technology/manufacturing standards
Examples
Governance • Cross-governmental and multi-stakeholder partnerships
Policy type
• Protected areas
• Subsidy reform
• Cap-and-trade programs
• Certification schemes• Ecosystem mimicry
• New financing structures
• Payment for ecosystem services
• Government procurement policies
Workshop agendaWorkshop agenda
Introducing Ecosystem ServicesIntroducing Ecosystem Services
The Ecosystem Services ApproachThe Ecosystem Services Approach
The Puget Sound Action AgendaThe Puget Sound Action Agenda
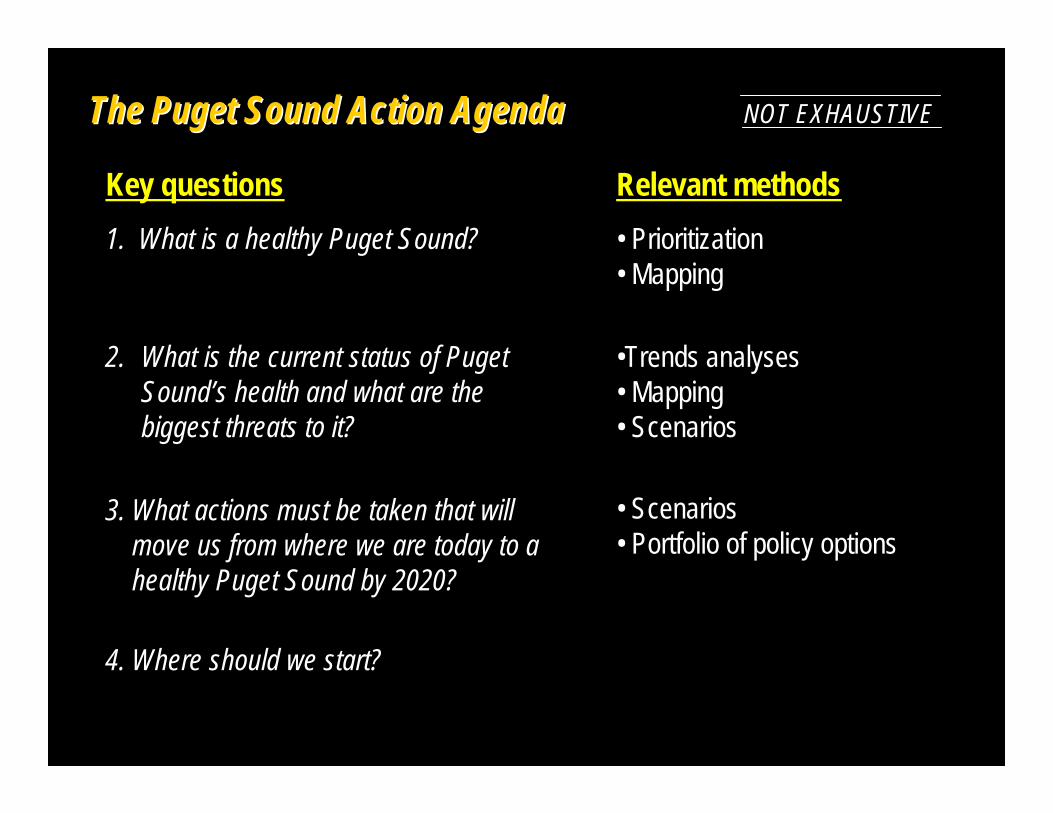
The Puget Sound Action AgendaThe Puget Sound Action Agenda
Key questions Relevant methods
4. Where should we start?
3. What actions must be taken that willmove us from where we are today to ahealthy Puget Sound by 2020?
• Scenarios• Portfolio of policy options
•Trends analyses• Mapping• Scenarios
2. What is the current status of Puget Sound’s health and what are the biggest threats to it?
1. What is a healthy Puget Sound? • Prioritization• Mapping
NOT EXHAUSTIVE

Questions? Questions?

Breakout Session QuestionsBreakout Session Questions
1. Which 5-7 ecosystem services in the Puget Sound region are the highest priority?
2. Which ecosystem functions provide these priority services?
3. Which ecosystem service methods could help inform the Puget Sound Action Agenda (by September)?

Thank youThank you
World Resources Institute

Sources and sinks of carbonSources and sinks of carbon
World Resources Institute
100% = 480 gigatons of carbonCarbon flow over past two centuries
100% = 7.9 gigatons of carbon per yearAnnual carbon flow in 1990s
Source: Millennium Ecosystem Assessment
0
1 0 0
Sources Sinks
Land useLand use
42%42%
Fossil fuelsFossil fuels
58%58%
AtmosphereAtmosphere
39%39%
OceansOceans
26%26%
Land useLand use
35%35%
0
1 0 0
Sources Sinks
Land useLand use
20%20%
Fossil fuelsFossil fuels
80%80%
AtmosphereAtmosphere
40%40%
OceansOceans
25%25%
Land useLand use
35%35%

Evaluate the impacts of development policiesEvaluate the impacts of development policies
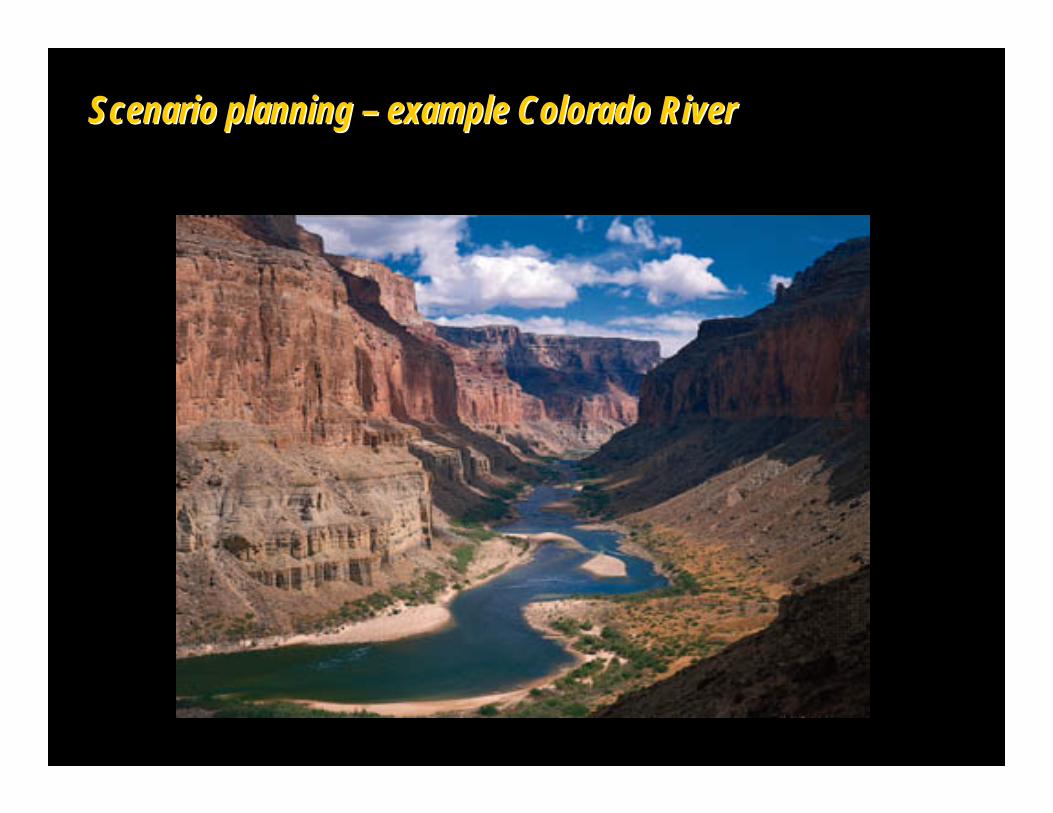
Scenario planning Scenario planning –– example Colorado Riverexample Colorado River

Provisioningservices
Regulatingservices
Supportingservices
Culturalservices
Ecologicalengineeringcapacity &knowledge
Provisioningservices
Regulatingservices
Supportingservices
Culturalservices
Ecologicalengineeringcapacity &knowledge
Provisioningservices
Regulatingservices
Supportingservices
Culturalservices
Ecologicalengineeringcapacity &knowledge
Provisioningservices
Regulatingservices
Supportingservices
Culturalservices
Ecologicalengineeringcapacity &knowledge
Dry Future The Market Rules
Powell’s Prophecy A Delta and Estuary Once More
1
0
-1
1
0
-1
1
0
-1
1
0
-1
Colorado Scenario TradeColorado Scenario Trade--offsoffs
Source: Mark LellouchSonoran Institute
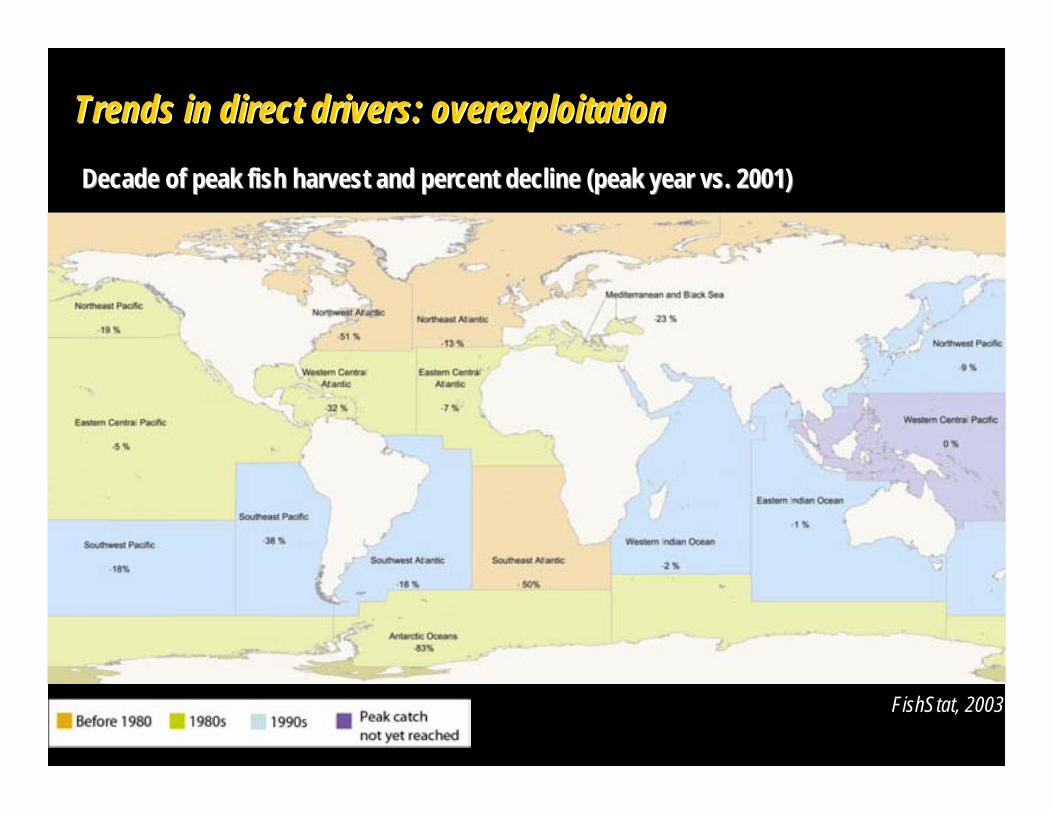
Trends in direct drivers: overexploitationTrends in direct drivers: overexploitation
Decade of peak fish harvest and percent decline (peak year vs. 2Decade of peak fish harvest and percent decline (peak year vs. 2001)001)
FishStat, 2003