Making PowerPoint Slides - United Nations Research ...httpInfoFiles... · Agricultural dumping •...
17
Transcript of Making PowerPoint Slides - United Nations Research ...httpInfoFiles... · Agricultural dumping •...

36.4% poor live in rural area on < US$1/day.
Agriculture is subsistence & about 70% of the population is involved
Low soil productivity hence low yield
Deforestation & Environmental Degradation is high (495,662 km2 Affected).
Climate change aggravates the issue
Green Environment is threatened. How?
Introduction
Green Economy & Sustainable Development: Bringing back the social dimensions. UNRISD Conference, Geneva. 2

Developed world Sub-Saharan Africa20% CO2
Resilience threatened
• Trade-distorting subsidies• Agricultural dumping• Land Grab (NFC in MUST)
• Neglect• Debt Overhang• Low funding (R&D)• Poor policy implementation• Low literacy level

data was obtained from the Community-Based Forest Management Initiative of the Ondo State Ministry of Agriculture and Rural Development in 2010. Data was obtained through random sampling technique
Three Forest reserves were used. These are Idanre FR (Latitude-06.91900 & Longitude- 005.19680); Oluwa FR (Latitude-06.85394 & Longitude- 004.56545); and Oyinmo FR ( Latitude-07.36628 & Longitude- 005.64787).
Data from 452 respondents within the forests enclaves was analysed.
Methodology
Green Economy & Sustainable Development: Bringing back the social dimensions. UNRISD Conference, Geneva. 4

Analytical TechniquePoverty Analysis was done using the Foster, Greer
and Thorbecke (FGT).
Determinant of welfare was obtained through the conventional model of household economic behaviour under constrained utility maximization:
yi /zi = 0 +∑β1i Xi + ∑β2i Ci + εi
Methodology Cont’d
Green Economy & Sustainable Development: Bringing back the social dimensions. UNRISD Conference, Geneva. 5
q
i
q
i
q
i
q
i
ii
severityPovertyZyz
nP
depthorgapPovertyZyz
nP
countheadorincidencePovertynq
Zyz
nPwhen
Zyz
nP
1
2
2
1
1
1
1
0
0
1
1,2
1,1
1,0
1

Decile Mean PCE Expenditure distribution (%)
12345678910
233.34555.12834.59939.00
1435.371915.602002.682559.472726.542899.22
1.453.465.185.838.9211.9012.4315.8916.9318.01
TotalMean
2/3 MPCE
16100.931610.091073.39
100
Results and Discussion
Green Economy & Sustainable Development: Bringing back the social dimensions. UNRISD Conference, Geneva. 6
: Computed from CBFMS Field Survey Data (July - September, 2003).
Table 1: Per Capita Expenditure Distribution

Gender P0 P1 P2
Male 0.252 0.206 0.162Female 0.316 0.218 0.143All 0.370 0.253 0.121
Results and Discussion
Green Economy & Sustainable Development: Bringing back the social dimensions. UNRISD Conference, Geneva. 7
Table 2: Poverty by Gender
Source: Computed from survey data analysis
Forest reserve P0 P1 P2
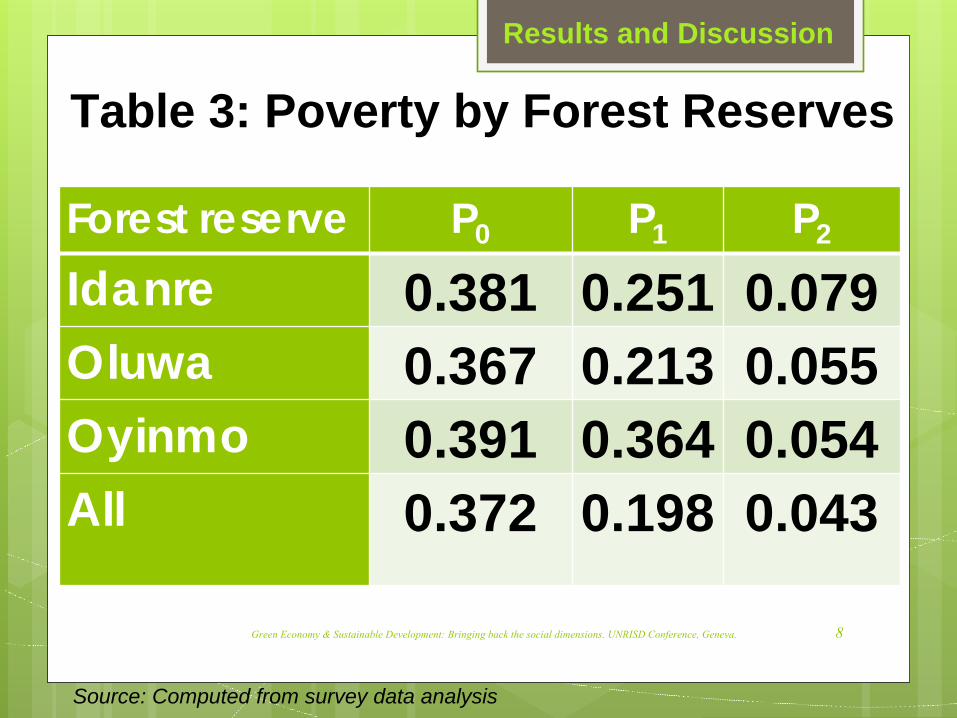
Idanre 0.381 0.251 0.079Oluwa 0.367 0.213 0.055Oyinmo 0.391 0.364 0.054All 0.372 0.198 0.043
Results and Discussion
Green Economy & Sustainable Development: Bringing back the social dimensions. UNRISD Conference, Geneva. 8
Source: Computed from survey data analysis
Table 3: Poverty by Forest Reserves

Variable � OLS Fixed Effects
Coefficient t-value coefficient t-valueConstant 1.2431*** 5.476 - -Age 0.4986 1.362 .0152** 1.460Household size -.0953* -.1.3123 -.0184** -3.0223Marital Status .0229 .1.3264 .0353* 1.7468
Primary Edu. -.0141* -.1116 -.2168 .3243Secondary Edu .0237 .4056 .0522 1.4342Tertiary Edu. .1280 .2260 .0388 .5796
Farming -.1420** -.2254 .1003 .7353Safe water .0149 .223 .0263 .3552Safe Toilet .3761* ** 0.744 .0601 2.1223Idanre FR -.176 -3.247 - -Oluwa FR -.254** -1.177 - -Oyinmo FR -.316 -1.964 - -Diagnostics R2 = .245; Adj. R2 = .2718 R2= .4021; Adj.= .3837
Results and Discussion
9
Table 4: Determinants of rural poverty among Male headed Household
Source: Data analysis result *, **, and *** = Level of significance at 10%, 5% and 1%

Variable OLS Fixed EffectsCoefficient t-value coefficient t-value
Constant 1.795*** 4.352 - -
Age .103 1.307 .014*** 3.501
Household size -.046** -5.204 -.064** -5.071
Marital Status -.223* -2.868 -.301** -1.082
Primary Edu. .011 .044 .027* .362
Secondary Edu .084 2.055 .204 2.430
Tertiary Edu. -.136 -1.129 -.232 -2.020
Farming -.308*** -3.282 .128*** 1.384
Safe water .0149 .223 .0263 .3552
Safe Toilet .3761** 0.744 .0601 2.1223
Idanre FR .1223 * 1.8432 - -
Oluwa FR .1298 1.4115 - -
Oyinmo FR .1311*** 1.2702 - -
Diagnostics R2 = .2054; Adj. R2 = .1826 R2= .4730; Adj.= .3449
Results and Discussion
10
Table 5: Determinants of rural poverty among female headed Household
Source: Data analysis result *, **, and *** = Level of significance at 10%, 5% and 1%

VariableOLS
Coefficient t-value
Constant 2.341*** 2.112Age 312* 1.428Gender .120 .325Household size -.152** -2.543Marital status -.604** -1.367Prim-education -.232 -.843Sec –education .421 0.633Ter-education .134 .192Farming -.350*** -1.238Safe water .085*** 2.035Safe toilet -.534 -1.151Diagnostics R2 = 0.3914; Adj.R2 = 0.2167
Results and Discussion
11
Table 6: Determinants of rural welfare among Idanre FR households
Source: Data analysis result *, **, and *** = Level of significance at 10%, 5% and 1%

VariableOLS
Coefficient t-valueConstant 1.460** 3.033Age .122*** .616Gender .210 .115Household size -.222** -1.154Marital status -.265 -.458Prim-edu -.324* -.654Sec –edu 1.110 0.541Ter-educ .182 .222Farming -.171*** -.168Safe water .129 2.123Safe toilet -.617 -2.143Diagnostics R2 = 0.2422; Adj.R2 = 0.2018;
Results and Discussion
12
Table 7:Determinants of rural welfare among Oluwa FR households
Source: Data analysis result *, **, and *** = Level of significance at 10%, 5% and 1%
VariableOLS
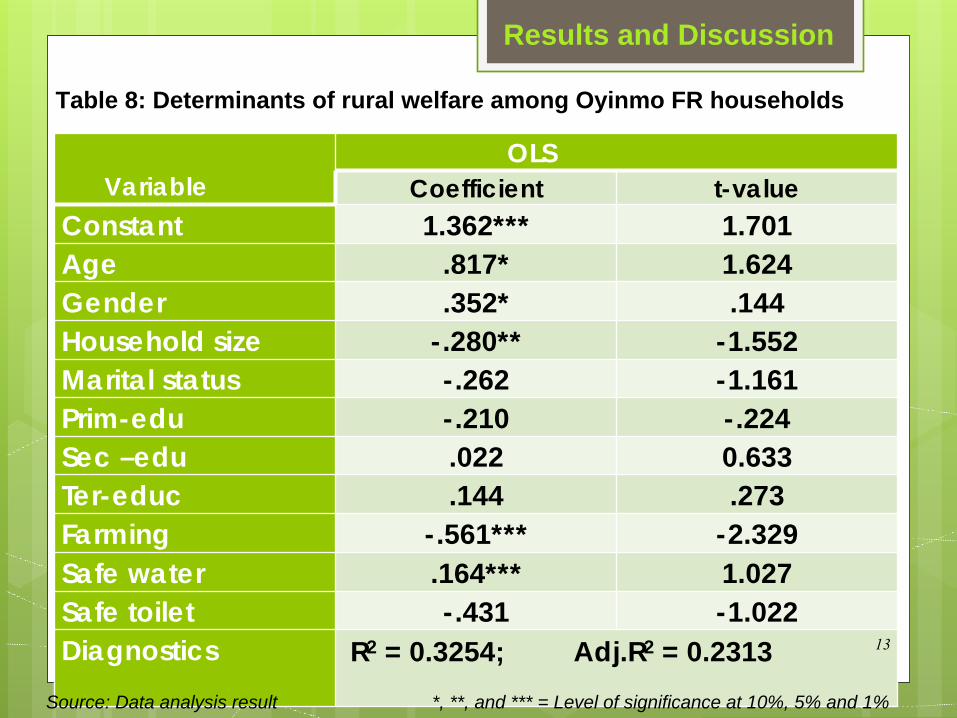
Coefficient t-valueConstant 1.362*** 1.701Age .817* 1.624Gender .352* .144Household size -.280** -1.552Marital status -.262 -1.161Prim-edu -.210 -.224Sec –edu .022 0.633Ter-educ .144 .273Farming -.561*** -2.329Safe water .164*** 1.027Safe toilet -.431 -1.022Diagnostics R2 = 0.3254; Adj.R2 = 0.2313
Results and Discussion
Table 8: Determinants of rural welfare among Oyinmo FR households
13
Source: Data analysis result *, **, and *** = Level of significance at 10%, 5% and 1%

Indices
Ose- Oba FA
Ondo East FA
Uso- Owo FA
Idanre FR
Oluwa FR
Oyinmo FR Total
Shannon- Weiner index (H') 2.66 2.54 2.75 2.68 2.73 2.51 3.39Evenness (E) 0.52 0.51 0.52 0.44 0.44 0.46 0.46No of species 18 17 19 20 20 17 52No of Families 15 16 12 17 21 15 28No of stem/ha 168 148 196 432 468 232 1644
Results and Discussion
14
Source: CBFMS Report, 2010. Note: FA means Natural forest area i.e free area outside of reserves.
Table 9: Biodiversity indices for natural forest in the study areas
Forest reserve P0 P1 P2Idanre 0.381 0.251 0.079Oluwa 0.367 0.213 0.055Oyinmo 0.391 0.364 0.054All 0.372 0.198 0.043

Country Level- Reducing deforestation in the area and Nigeria at large must incorporate social welfare programs for poverty reduction. - National agriculture must be redefined. Needs to change from eco-efficiency to sustainable consumption and production. - Agricultural policy must be inclusive in its formulation and implementation- investment in innovations that increase efficiency and decouple economic growth from the use of natural resources is necessary.
- Carbon marketing- REDD should be explored. However, caution must be exercised. Why?
Recommendation
15

Developed world Sub Saharan Africa
Multilateral organisation (W
B, WTO
etc.) &
international NG
Os should
assist and protect
20% CO2
Recommendation
• Food production• Trade dumping• Land Grabbing

Thank you
Green Economy & Sustainable Development: Bringing back the social dimensions. UNRISD Conference, Geneva. 17