Making Our High Schools Work
68
Making Our High Schools Work A Five-Year Project Summary of The Houston A+ Challenge Regional Collaborative for High School Redesign June 2, 2008 Scott Van Beck Executive Director Houston A+ Challenge Lynn Parsons Parsons Associates Project Coordinator
-
Upload
houston-a-challenge -
Category
Documents
-
view
215 -
download
0
description
A five-year project summary of the Houston A+ Challenge Regional Collaborative for High School Redesign. Includes a 68-page report as well as recommendations for policymakers. (2008, Houston A+ Challenge)
Transcript of Making Our High Schools Work
Making Our High Schools
Work
A Five-Year Project Summary ofThe Houston A+ Challenge
Regional Collaborativefor High School Redesign
June 2, 2008
Scott Van BeckExecutive Director
Houston A+ Challenge
Lynn ParsonsParsons Associates
Project Coordinator

ACKNOWLEDGEMENTS
Houston A+ Challenge would like to thank the Annenberg Foundation and the Brown Foundation, whose generosity and partnership have allowed the Regional Collaborative for High School Redesign to flourish in Houston. In addition, Houston A+ Challenge would like to recognize the innovative district leaders who have encouraged the work of the Collaborative in myriad ways. And finally, this paper is dedicated to the dozens of school leaders and hundreds of classroom teachers who have participated in the high school improvement work of the Collaborative over the past five years. Your willingness to learn and grow as professionals has impacted thousands of students in ways that will endure for the rest of their lives.
© 2008 Houston A+ Challenge, all rights reserved.

TABLE OF CONTENTS Executive Summary
i
Prologue: Organization of our work around the Four Arenas of Change ii Visual 1: Wagner’s Four Arenas of Change
iii
History and Overview: Context 1 The project that got us started 1 Who we are 1 How we worked together 1 Table 1: Demographic Comparisons of Sixteen High Schools 2 The District, state, and federal contexts 3 Table 2: Revenue Sources for All District Funds
3
What We Have Accomplished: Culture 4 Professional Learning Communities 4 Visual 2: Building Shared Responsibilities for Student Learning 4 Personalized relationships 5 Collaborative leadership 6
What We Have Accomplished: Conditions 7 Time for adult learning and collaboration 7 Smaller learning communities 8 Instructional support staff
8
What We Have Accomplished: Competencies
10
What We Have Accomplished: Student Learning 11 Visual 3: What we have learned in the four arenas of change 11 Table 3: Campus TAKS Changes 2003-07
12
Our proposal: Sustaining and Deepening Our Work 14 Visual 4: Where do we go from here? Deepening and sustaining our work
15
Proposed Board action 16 Sample Proposed Board Resolution Language
17
Attachment 1: Houston A+ Challenge Regional Collaborative for High School Redesign
19
Attachment 2: Collaborative Activities
23
Attachment 3: References, Resources and Influences
25
Attachment 4: School-by-School Accomplishments: Culture, Conditions, Competencies and Student Learning
27
Attachment 5: AEIS Longitudinal Data (2002-2007) for Project Schools
40
Attachment 6: School-by-School Statement of Needs Attachment 7: Summary of Needs Identified by Campuses
53
59
Making Our High Schools Work Houston A+ Challenge, June 2, 2008 i
EXECUTIVE SUMMARY For the past five years, the campus leaders and teachers from 16 high schools in four Houston-area school districts have been working in collaboration to redesign their structures and services, in order to offer more a more personalized, rigorous and relevant education for more than 32,000 students. As the project period ends, the principals of these high schools, in collaboration with Houston A+ Challenge, have written this report to document key accomplishments in improving the school culture, learning conditions, professional competencies and student achievement in Houston-area schools: ● School Culture
o Establishment of Professional Learning Communities that are focused on collaborative reflection, goal-setting and results rather than intentions
o Personalization of relationships among students and staff o Establishment of collaborative leadership
● Learning Conditions o Establishment of time during the school day for teacher planning and
collaboration o Creation of smaller learning communities within the school to provide a
more personalized experience for students o Creation of new staff positions for direct support of teacher instruction
● Professional Competencies o Improvement of professional and instructional skills through training for all
staff members in support of all changes listed above ● Student Achievement
o Improvement in student performance on the Texas Assessment of Knowledge and Skills (TAKS) and other success indicators
In addition, this report presents a number of recommendations to district administrators and policymakers seeking to sustain and accelerate the transformational change that is needed for our high schools: ● Maintain a relentless focus on instructional improvement
o Set high expectations for teachers to provide high-quality instruction and assessment, while offering monitoring, feedback and support
o Provide sufficient support personnel to work directly with teachers o Provide campus leaders with tools, time and training to monitor, coach
and model good instruction o Modify Board policies to support best practices in both instruction and
human resources ● Support instruction-focused Professional Learning Communities
o Continue to deepen understanding and commitment to PLCs o Support PLCs with time, resources and professional development
● Expand personalized learning opportunities for students o Continue developing personalized environments and structures which
ensure that no student “falls through the cracks” Sample resolution language is included, to encourage School Boards seeking to support the ten areas identified as critical for deepening and sustaining this work.

Making Our High Schools Work Houston A+ Challenge, June 2, 2008 ii
PROLOGUE: Organization of Our Work around the Four Arenas of Change
During the five years that the high schools in Aldine, Alief, Humble and Spring Branch have been working together as the Houston A+ Challenge Regional Collaborative for High School Redesign, our most powerful tool has been the Four Arenas of Change Model—or “the 4 Cs”—developed by Tony Wagner, co-director of the Change Leadership Group at the Harvard Graduate School of Education.
Dr. Wagner posits that in order to understand and affect deep, sustained change in any organization, we must think about the change in at least four different interacting “arenas.” If we focus on change in only one arena and fail to think about its impact on the other three, our change will likely not be successful and sustained.
These Arenas of Change serve as a guide for educators who are engaged in the work of school change, and they also provide a framework through which to analyze the results. We used this model to examine what our schools currently look like and to frame our ideas about what is needed in order to move our schools to what they can become. The Four Arenas for Change—as pictured on the next page are:
Context—the new skills needed by students for work, learning and citizenship
Culture—the shared values, beliefs, assumptions and behaviors about students, teachers, learning and leadership
Conditions—the external “architecture” that must be in place to support learning—such as time for learning and collaboration, clear expectations, physical space and staffing
Competencies—the repertoire of skills and knowledge that positively impacts student learning and is supported by high-quality staff development
The body of our white paper will be organized according to the four arenas of change, since change—restructuring, redesigning, improving leadership and teaching and learning—has been the primary emphasis of our five-year project. There are two caveats necessary for readers and users of this paper:
1. We are defining “Context” more inclusively than Wagner. When we discuss context in the first section of the paper (History and Overview), we are including all of the contextual background within which our change efforts have taken place—the grant initiative that started us; the demographics that make us alike and different; the structures and activities we used during the work itself; and the district, state and federal expectations and constraints that impacted our work.
2. Given the interactive nature of the model, we must acknowledge from the
beginning that placing any bit of information or data in any one category is

Making Our High Schools Work Houston A+ Challenge, June 2, 2008 iii
nearly impossible. We can discuss profound changes in our organizational cultures, but we recognize the importance of the competencies for collaboration we had to develop through staff development and the ways in which our campus conditions had to be modified to support the cultural changes. We can discuss changes in the student learning environment—such as the formation of smaller learning communities—but we recognize that those structures are only successful where we have also seen changes in the teachers’ competencies to interact more personally with students and changes in the school culture to include a shared belief that personalizing learning environments results in deeper student learning.
Visual 1: Wagner’s Four Arenas of Change We invite you to read not only the summary of our accomplishments and recommendations in the body of this paper, but also the more detailed stories of our work found in the attachments and in the individual school portfolios developed by each of the 16 campuses participating in the collaborative network. We have worked hard and established our high schools on a trajectory of success. We are committed to continuing the work on that path, but we know that we will reach our goals more quickly if we have your support. We hope you will join us!


Making Our High Schools Work Houston A+ Challenge, June 2, 2008 1
HISTORY AND OVERVIEW: CONTEXT
The Project that Got Us Started In 2001, the Carnegie Corporation of New York and the Bill and Melinda Gates Foundation funded the Houston Schools for a New Society initiative, aimed at reforming all 24 of Houston ISD’s high schools in a partnership with Houston A+ Challenge. Beginning in the 2003-2004 school year, through funding from The Annenberg Foundation and The Brown Foundation, Houston A+ Challenge expanded the project into other districts in the Houston metropolitan region. Four school districts wrote successful applications to become part of the Houston A+ Challenge Regional Collaborative for High School Redesign: Aldine, Alief, Humble and Spring Branch. There are 16 high schools within those districts that have chosen to be part of this project. Each district received up to $100,000 per year for five years, to be shared among the participating high schools in the district. (Attachment 1 provides a more detailed historical overview.) Who We Are The 16 high schools in this collaborative range in size this year from 3,100 students (Atascocita HS, which opened in 2006 in Humble ISD) to 750 students (Kerr HS in Alief, a school of choice), although the average is more than 2,000 students. On average, the student population (AEIS, 2006-07) is about 20% African American, 40% Hispanic, and 30% White, with an average of 45% of the students being eligible for free or reduced lunch. However, the demographic population figures range from 83% Hispanic (Northbrook) to 83% White (Kingwood) and from 84% free or reduced lunch (Aldine 9th) to 5% at Kingwood. (Table 1 on the next page lists each school with more detailed information.) How We Worked Together Most campuses received less than $25,000 each year, funds that were most commonly used to support professional development activities and substitutes (or “released time”) for staff members to collaborate and plan together. Campus administrators used personnel and funding already available from their districts or other state and federal grants to support the changes and improvements initiated as a result of the grant. The real work—and accrued benefits of the collaborative network occurred within the framework of collaborative activities. Members of the collaborative participated in: ● Monthly collaborative meetings. The principal and one assistant principal
from each campus gathered to learn collaboratively, share ideas and practice collaborative tools to support the redesign effort on their campuses.
● Cross-site visits to every campus each fall. Teams composed of teachers and administrators from each of the participating campuses spent a day in each host school, visiting as many classrooms as possible—typically 70 to 80 during the day—and looking for evidence of the school’s progress in the area of the focus question devised by the school. The data collected during the

Making Our High Schools Work Houston A+ Challenge, June 2, 2008 2
Table 1: Demographic Comparisons of 16 Collaborative High Schools (Academic Excellence Indicator System, 2006-07)
Afr-Amer Hispanic White Eco. Dis. Enrollment
Aldine HS (10-12) 22.5% 71.1% 4.3% 74.3% 2230 Aldine Aldine Ninth Grade School 21.9% 73.5% 2.4% 83.9% 876
Elsik HS (10-12) and Elsik Ninth Grade Center 40.5% 43.7% 4.3% 52.5% 4312
Hastings HS (10-12) and Hastings Ninth Grade Center
37.9% 44.7% 5.2% 54.5% 4228
Kerr HS (9-12) 15.7% 21.1% 13.6% 35.0% 762
Alief
Taylor HS (9-12) 43.3% 39.6% 5.6% 50.6% 2785
Atascosita HS (9-12) 23.7% 19.2% 53.4% 16.8% 2249
Humble HS (9-12) 32.1% 34.0% 30.6% 39.2% 2762
Kingwood HS (10-12)* 3.5% 9.4% 83.1% 5.2% 4073
Humble
Kingwood Park HS (9-10)** (Not open in 2006-07)
Memorial HS (9-12) 1.1% 12.8% 75.4% 10.4% 2241
Northbrook HS (9-12) 8.3% 83.5% 5.9% 82.9% 1817
Spring Woods HS (9-12) 10.1% 63.5% 21.3% 64.0% 2063
Spring Branch
Stratford HS (9-12) 11.7% 15.9% 61.2% 20.5% 1967 *10-12 for 2007, becoming 9-12 for 2008-09 **9-10 for 2007-08, 9-11 for 2008-09, 9-12 for 2009-10
day was presented to the host school for their use in continuous planning and improvement.
● January Leadership Conferences. Teams of up to 20 people from each campus were invited to learn together about issues facing them in high school redesign.
● End-of year Leadership Conferences. Teams from each campus (1) reviewed the year’s progress, (2) shared ideas and information across schools, and (3) developed their action plans for the next year.
All of these activities were designed to provide opportunities for members to share their own best practices (and disappointments) and learn first-hand from other practitioners what was actually working. In addition to learning from each other, participants studied the works of leaders in high school reform, reading books and articles, and listening to presentations. (Attachments 2 and 3 provide more information.) The District, State, and Federal Contexts Each of the 16 high schools in the collaborative worked within the context of district, state and federal expectations and constraints: ● District: All of the four districts have maintained high expectations for the
performance of their students at the same time that their budgets have shrunk. Most districts have had one or more district-wide initiatives during
Making Our High Schools Work Houston A+ Challenge, June 2, 2008 3
the past five years in which high schools were expected to participate; most use some form of locally-defined, district-wide student assessment; and most have some form of district-wide expected student outcomes based on the state standards. All four of the districts have also experienced significant belt-tightening during this period, meaning that the high schools have been expected to do more with less. One of the four districts, Humble ISD, also has continued to experience significant growth resulting in the opening of additional high schools.
● State: The expectations and constraints of the state are similar to those of the districts: high expectations and shrinking resources. The state’s student performance standards—the Texas Essential Knowledge and Skills (TEKS)—continue to be refined and strengthened along with student graduation requirements. The “bar” on the state assessment—Texas Assessment of Knowledge and Skills (TAKS)—continues to rise, adding to the challenge for high schools whose students came up through a time with somewhat lower expectations. While the state’s expectations for student outcomes has been steadily rising, the state’s share of funding to districts has been decreasing, leaving districts to turn to their local taxpayers for additional resources necessary just to stay even.
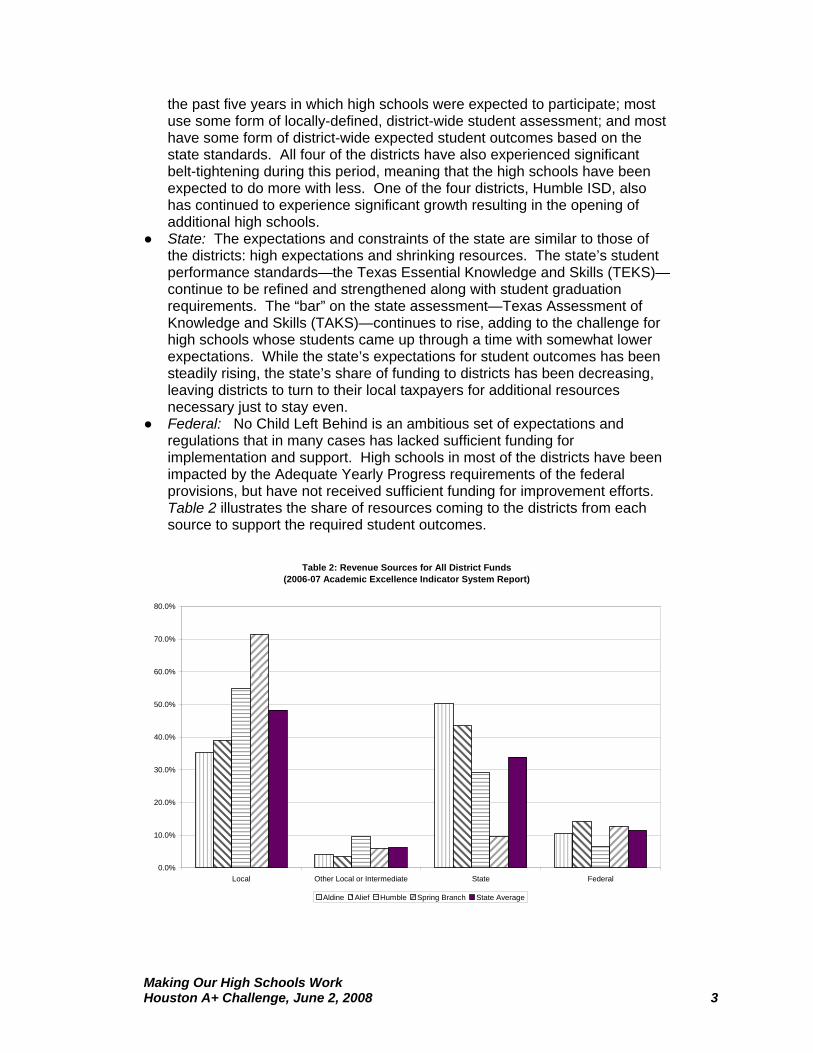
● Federal: No Child Left Behind is an ambitious set of expectations and regulations that in many cases has lacked sufficient funding for implementation and support. High schools in most of the districts have been impacted by the Adequate Yearly Progress requirements of the federal provisions, but have not received sufficient funding for improvement efforts. Table 2 illustrates the share of resources coming to the districts from each source to support the required student outcomes.
Table 2: Revenue Sources for All District Funds
(2006-07 Academic Excellence Indicator System Report)
0.0%
10.0%
20.0%
30.0%
40.0%
50.0%
60.0%
70.0%
80.0%
Local Other Local or Intermediate State Federal
Aldine Alief Humble Spring Branch State Average

Making Our High Schools Work Houston A+ Challenge, June 2, 2008 4
WHAT WE HAVE ACCOMPLISHED: CULTURE
Tony Wagner defines culture as “the shared values, beliefs, assumptions, and behaviors about students, teachers, learning, and leadership.” This arena of change is perhaps the most difficult to accomplish and the most difficult to assess. How do you know “culture” when you see it? How do you get human beings to shift their values, beliefs and assumptions to align with others in their organization? How do you change “the way we’ve always done it”? Professional Learning Communities The high schools in the collaborative network have changed the cultures of their campuses in two primary ways. First, all campuses are becoming collaborative Professional Learning Communities (PLCs), a major shift from the ways schools have traditionally done business. In the traditional model, teachers operated more or less as independent contractors, working in isolation from one another behind closed doors in their classrooms and without formal avenues for sharing their successes. Within the context of federal and state standards for student outcomes and district-wide curricula and common assessments, it became increasingly important that teachers and other members of the school staff commit to working and learning collaboratively to ensure that all students receive equally high levels of instruction and achieve high levels of performance. The concept of PLC is rooted in many business theorists, most notably Peter Senge, but Rick DuFour was the first major educator to apply the theory in an educational setting. Many others have followed and the PLC model that this collaborative has used, developed by Conzemius and O’Neall in Building Shared Responsibility for Student Learning is shown below. In this model, the primary characteristics of Professional Learning Communities are (1) having a common focus (vision, mission, values, and goals), (2) reflecting frequently about data-based results, and (3) operating collaboratively and interdependently. In other words, it’s not sufficient to merely meet and be “nice” to one another: PLC requires that collaboration be deep, meaningful, driven by a common focus and data-based. In the theory of action shown below, if PLCs operate in that manner, leadership will become a shared responsibility and the school and its students will experience continuously improving results.
Leadership =Shared
Responsibility
ContinuouslyImproving
Results
FOCUS
REFLECTION COLLABORATION
PLC
Visual 2: Building Shared Responsibility for Student Learning (Conzemius and O’Neall)
In order to promote this cultural shift, most campuses have altered the conditions of their teachers’ work days to create time in which they can meet to further this work and/or have reorganized the entire school structure to create new kinds of working teams which have naturally-occurring common foci and

Making Our High Schools Work Houston A+ Challenge, June 2, 2008 5
common data. Furthermore, most schools have invested heavily in training to develop the staff members’ competencies for developing a common focus, reflecting on data, and working collaboratively. While business and industry has long recognized the need for collaborative team planning, and development, and after-action, data-based reviews, this represents a huge cultural shift for schools. A walk through any of the 16 high schools in the network will reveal evidence of the development of Professional Learning Communities. You will see teams of teachers analyzing data and working together on plans, and hear their high level of professional discourse as they discuss their students’ work. Even if you don’t see team meetings in session, you will see and hear the results of this collaboration: “data walls” throughout the school displaying the targets and performance of students on campus, district, and state assessments; common lessons with clearly-stated student expectations; signage and hallway conversations demonstrating the school’s common language and shared commitment to continuous improvement. Personalized Relationships The second major cultural change for all campuses in the collaborative network has been a major effort to personalize the relationships between students and the adults in their schools. Breaking Ranks II: Strategies for Leading High School Reform is published by the National Association of Secondary School Principals, and it identifies a personalized school environment as one of the three major characteristics of successful high schools. (Professional Learning Communities and personalized instruction are the other two.) In The Silent Epidemic: Perspectives of high school dropouts, a national study commissioned by the Bill and Melinda Gates Foundation, the top two reasons for leaving school cited by dropouts were lack of connection to the school and a perception that school is boring or not motivating. Lack of academic success was a distant fourth. As in the case of PLCs, it is not enough to give lip service to working on more personalized relationships with students. It takes persistence and patience to change a culture which traditionally viewed teachers as the “fountain of knowledge” and the students as passive recipients. It takes creativity and concentration to re-connect disengaged students with their teachers and with the school itself. Every campus started by creating some variation of a student advisory period—a change in conditions. During these periods, the staff member assigned to a small group of students provided a variety of activities designed primarily to allow the students and teachers to get to know each other better (both personally and academically) and to establish more personalized relationships and trust. The goals are that every student in the school should be known well by at least one adult, and that that adult should act as an advocate for the student. However, the time alone was not sufficient to nurture more personalized student-staff relationships, and campuses continue to struggle with the organization and content of those periods. Again, staff training (most typically through a national curriculum called Capturing Kids’ Hearts) was necessary for many staff members to develop the competencies necessary for forming positive, appropriate relationships with students.

Making Our High Schools Work Houston A+ Challenge, June 2, 2008 6
Another initiative for most campuses has been an effort to personalize the students’ relationship with the school itself—their “connectedness”—through the development of a wider variety of school activities along with processes to encourage students to become active. Traditional activities and clubs—athletics, music, National Honor Society—often fail to attract the very students who are most in need of connection with the school, so the schools have become very inventive in helping students create new clubs devoted to their individual tastes—Anime, roller-blading and Harry Potter, to name a few. When students are connected with a group of peers around a shared interest, they are more likely to become connected to the academic program of the school itself. This cultural shift will also be evident as you visit the schools. You will hear students talking to teachers about their lives outside of school, as well as their academic goals and post-secondary dreams. You will see notices in the hallways about new student organizations being formed to allow every student to participate more fully in the life of the school. Every student you stop in the hall should be able to tell you the name of at least one adult in the school whom he or she believes personally cares about his or her success. While there are other more subtle changes occurring in the high schools’ cultures, these two major changes—collaborative culture and personalized student relationships—are well-established and have created a fertile environment for continuous improvement. (See Attachment 4 for specific campus-by-campus accomplishments in changing culture.) Collaborative leadership This shift to a collaborative culture has been evident not only within schools, but also in the relationship among the leadership of the 16 campuses and four districts in the collaborative network. Prior to the establishment of this project, schools in different districts—and in some cases even schools within the same districts—rarely communicated with each other about substantive matters. As leaders, we were rarely willing to share anything other than our most successful practices, and we generally believed that other schools or other districts were so different that we could not learn anything from them. As a result of the work of the leadership of the 16 campuses during the monthly meetings, the biannual leadership conferences, and the cross-campus visits, every individual member would tell you today that the single most valuable outcome of our participation in the professional learning community which this collaborative network has become has been the opportunity to share and learn from each other, to share both triumphs and failures, and to do everything within the focused, reflective, collaborative framework. The combination of a change in conditions (a monthly block of time set aside for our own learning), changes in our own competencies (the tools and knowledge we gained about our selves, our schools, and work), and changes in our own culture as high school administrators has allowed each of us to become more effective leaders.
Making Our High Schools Work Houston A+ Challenge, June 2, 2008 7
WHAT WE HAVE ACCOMPLISHED: CONDITIONS
Tony Wagner defines “conditions” as the external “architecture” that must be in place to support learning—like time for learning and collaboration, clear expectations, physical space, and staffing. This is the arena of change that is the most directly under the control of the building and district administration. Therefore, changing and reorganizing school structures is frequently where school reforms have started—and unfortunately that is frequently where they have stopped. As we have learned during the five years of our work, changing a schedule or organizing differently will have no positive impact on teaching or learning unless attention is paid to the ways in which those changes affect the school culture or the different competencies that staff members may need in order to be successful within the new structure.
The high schools in the collaborative network have changed the conditions on their campuses in three primary ways: they have provided structured time for their teachers’ learning and collaboration, they have created new organizational structures for students and teachers to ensure a more personalized learning environment, and they have provided new kinds of support personnel to support deeper and more sustained improvements in teaching and learning.
Time for Adult Learning and Collaboration
We have already alluded to the structured time provided by each campus for teachers to form Professional Learning Communities. By state law, all teachers must have at least one period a day with no instructional assignments for “planning and conferencing.” Most campuses have created teacher schedules that allow all teachers from the same department (English, Math, etc.) or even the same subject (English I, Algebra II, etc.) to be “off” at the same time each day, and they have also required that teachers meet as a team at least once a week (or more in some schools). However, team meetings in the past tended to be more about activities and “administrivia” with little focus on teaching and learning. Furthermore, there was frequently very little true collaboration, no common data to analyze, and no attempt at reaching agreement about what students should actually know and be able to do as a result of their instruction. Campus leaders have now provided teachers with clearer expectations—another kind of condition—about the expected outcomes of their collaborative processes as well as training about how to accomplish them. Business and industry have long recognized the importance of collaborative planning and consider “meetings” for this purpose a significant part of the work to be performed. Many teachers and the taxpayers who pay their salaries have long considered teaching—the actual classroom performance—as the only real work of teachers, and have insisted that teachers should do their planning “after school”—which was seen as a solo activity. By providing time during the school day for collaborative learning and planning, we are demonstrating the value we place on it, and we are seeing the benefits in stronger instruction and better student performance.

Making Our High Schools Work Houston A+ Challenge, June 2, 2008 8
Smaller Learning Communities
The changes in conditions which have received the most attention are the new organizational structures for students—categorized most commonly as “smaller learning communities.” When this project began in 2003, Humble, Elsik, Hastings and Kingwood High Schools—four campuses in our group of 16—were ranked 4th, 5th, 6th and 7th in size among the 1,700 high schools in the state. All four high schools at that time included two physical campuses: a ten-twelve campus and a ninth grade center, but the 10-12 campuses themselves housed about 3000 students and the ninth grade centers about 1,000. The other campuses in the collaborative—all 9-12 campuses—had enrollments closer to 2,000 students. Almost all of the experts in high school reform agree that when schools are smaller, students are more likely to feel more connected to the school, and their learning environments and experiences are more personalized to meet their individual needs.
Recognizing the economies of scale cited by many districts who would rather build one large high school than two smaller ones with duplicative staff and services, experts have long recommended restructuring large high schools we into smaller learning communities, each staffed by their own administrators, counselors and core teachers. Several schools in the collaborative network have reorganized in variations of smaller learning communities—most notably in Aldine and in Humble, with Humble ISD making a district-wide commitment to this model—and are experiencing benefits for both teachers and students. Students are generally benefiting from the fact that their administrators, counselors, and teachers have fewer total students, and students report in surveys and interviews that they believe their teachers know them better and care about them more than in previous years. In most schools there are also structures encouraging students within the communities to participate in community activities so that they are more likely to develop positive peer relations. Teachers in these communities are also given additional planning time during the school day when they are expected to meet with other teachers in the community—not just the ones who teach the same things they do, but ones who share the same students. Conversations in these Professional Learning Communities focus more on the needs of individual students—their behavior and their academic progress—than on the delivery of instruction which is the focus of departmental meetings. As we have seen in other discussions, changes in conditions resulting in smaller learning communities necessitated changes in school culture and required some different teacher competencies, especially in thinking about cross-disciplinary instruction that has become more possible and probable within the communities as teachers from different departments learn to plan together.
Instructional Support Staff
The third example of changes in conditions has been the addition of new kinds of staff positions to support instruction. These positions have different titles in different schools and districts—instructional coaches, interventionists, school improvement specialists—but they are generally filled by expert teachers who are given very few or no regular instructional duties so they can work directly with

Making Our High Schools Work Houston A+ Challenge, June 2, 2008 9
teachers to improve the quality of instruction in the schools. Our traditional models of professional development—large-group meetings held several times a year—are giving way to “just in time” training, where teachers are getting support on a daily or weekly basis that immediately impacts their teaching.
Our current accountability system holds students primarily accountable by withholding promotion and diplomas from those who cannot pass the TAKS. At the same time, we recognize that in order to hold students accountable for learning, we must first hold teachers accountable for ensuring that every student is receiving the same high-quality instruction that requires thinking and learning at the same high levels.. While the principal has always been considered the nominal “instructional leader” on each campus, it is unrealistic to expect that principals of schools with 150 to 200 teachers can actually monitor, supervise, and support each teacher in improving his or her instructional delivery. It would be difficult to find a business or industry that expects supervisors to have more than 100 “direct reports,” but that has been the expectation in education. Schools that are employing these additional support staff are reporting significant changes in the quality of instruction that are beginning to pay off in terms of ultimate student performance. Teachers are having to abandon the old culture of isolation for one in which transparency and continuous improvement are valued, and they are developing new competencies as a result of the support they are being given.
(See Attachment 4 for specific individual campus accomplishments in changing school conditions.)

Making Our High Schools Work Houston A+ Challenge, June 2, 2008 10
WHAT WE HAVE ACCOMPLISHED: COMPETENCIES
Tony Wagner defines competencies as the repertoire of skills and knowledge that positively impacts student learning and is supported by high-quality professional development. It is important to note that as we look at the four arenas of change, we are focusing on changes in how the school and the adults in the school change. Competencies in this model refer to adult competencies rather than to student learning. The ultimate intent and outcome of everything we do is focused on student competencies, skills, and knowledge.
As we have described in all of the previous sections, new competencies have become needed for the adults in our schools as we have changed the culture and conditions within which we work. Therefore, most of the professional development provided for staff members over the last five years of this project has been aimed at supporting these change areas. Among the 16 high schools we have provided professional development about: ● Culture
o Professional Learning Communities o Personalizing relationships with students o Understanding students in poverty o Managing student behavior
● Conditions o Team planning and collaboration o Smaller learning communities o Providing instructional support o Leadership
● Competencies o Instructional design and planning o Formative assessment in the classroom o Literacy across the curriculum o Using data to guide decisions
(See Attachment 4 for specific individual campus accomplishments in changing the competencies of adults in the schools.)

Making Our High Schools Work Houston A+ Challenge, June 2, 2008 11
WHAT WE HAVE ACCOMPLISHED: STUDENT LEARNING
As we have described in previous sections, we believe we have made significant strides in impacting the culture, conditions, and competencies of the adults in our high schools. Teachers are collaborating to analyze data and improve instruction and all the adults in every building are working to personalize the learning environment and improve their relationships with students. The visual below depicts our accomplishments within the framework of the four arenas of change. It is obvious in this model that accomplishments in one arena are almost always linked to accomplishments in one or more other arenas.
CULTURE COMPETENCIES
CONDITIONS
Curriculum
InstructionAssessment
STUDENTLEARNING
Professional Learning Communities
Personalized student learning environments--Smaller learning communities/academies--Advisories/homerooms--Extended learning/tutorials during the school day
Teacher planning/collaboration during the school day
--Common grade level/department
--Common students--cross-disciplinary
Personalized learning environments--Student-staff relationships--Students "connected" to the school
Instructional su
pport perso
nnel
--Instructional c
oaches, specialis
ts
CONTEXTHouston A+ grant--Funds--Collaborative network
Available district resources--Funds--PersonnelState/district expectations--NCLB/TAKS--District initiatives
CONTEXT
Collaborative, cross-district leadership
Visual 3: What we have learned in the Four Arenas of Change
At the same time, we are seeing modest gains in student achievement, and we still have a lot of work to do. When you look at the core of the four arenas of change you see “Student Learning,” summarized as the cycle of Curriculum, Instructional and Assessment. The state accountability system focuses on the TAKS test, a summative measure of students’ traditional academic learning. The table on the next page shows the average improvements in TAKS scores for each campus from the 2003-04 school year to 2006-07. (2007-08 data will not be available for several months.)

Making Our High Schools Work Houston A+ Challenge, June 2, 2008 12
Table 3: Campus TAKS Changes: 2003-2007
All tests taken Reading and Social Studies
Math and Science
Aldine
24.0 24.7 25.1
Aldine 9
25.1 10.2 6.0
Hastings
20.0 14.8 20.8
Elsik
17.0 16.6 18.0
Taylor
17.2 12.9 15.2
Kerr
24.4 8.1 19.1
Humble
12.2 16.2 8.8
Kingwood
24.2 8.8 18.6
Memorial
19.8 9.4 14.1
Spring Woods
18.6 17.1 20.4
Northbrook
25.2 16.9 25.4
Stratford
16.6 12.7 14.2
Average
20.4 14.0 17.1
Range
12.2 to 25.2 8.1 to 24.7 6.0 to 25.4
Attachment 5 presents a school-by-school summary of changes in AEIS indicators—not only the TAKS score gains summarized above, but also dropout and high school completion rates, in addition to demographics from 2002-03 (the year before our project began) through 2006-07 (the fourth year of the Collaborative). Despite all of these gains, all but one of the high schools is still rated “Academically Acceptable” rather than “Recognized” or “Exemplary.” (Kerr High School, an alternative school of choice in Alief is “Recognized,” but joined the collaborative only in the last year.) We also are attempting to collect different kinds of data that demonstrate other gains that are being made by the teachers and students that are not necessarily demonstrated on the TAKS. Attachment 4 also presents some of the other ways to look at the differences that we are making in students’ lives.
Making Our High Schools Work Houston A+ Challenge, June 2, 2008 13
OUR PROPOSAL: SUSTAINING AND DEEPENING OUR WORK Each high school has worked for the past five years—independently and collaboratively—to redesign and restructure our schools, and we are proud of the significant changes we have made in the culture, conditions and competencies of our schools and staff. All of these are necessary preconditions for the transformational improvement that is yet to occur. We—the leaders of the 16 campuses in the Houston A+ Challenge Regional Collaborative for High School Redesign—believe that now is the critical time to narrow our focus and zero in on the quality of instruction and assessment inside the classroom. As shown in the visual on the next page, we believe that we will make the advances that we are seeking in student learning if we can maintain our progress in the following three areas: Focus on Instructional Improvement We need to focus on instruction in real and concrete ways. ● We must hold teachers accountable for the quality of the instruction and
assessment they provide to students, while providing both the monitoring and feedback necessary to identify individual needs and the support they need for improvement.
● We need sufficient support personnel who are highly skilled and have sufficient time to work directly with teachers in their classrooms, modeling high-quality instruction and supporting teachers as they learn new methods and strategies.
● If our campus leaders are going to be instructional leaders in more than name only, they must have tools, time and training of their own to effectively monitor the quality of classroom instruction and provide the level of supervision necessary to ensure that every student receives equal and excellent teaching.
● Board policies about things like grading, homework, award of credit, student schedules and staff schedules must be reviewed and revised to reflect the latest research and best practices.
● Board policies and local procedures about hiring practices, supervision and evaluation procedures should be revised to emphasize demonstrated skills and success in terms of actual student performance. Furthermore, the process for replacing teachers who are consistently unable to support student learning should be streamlined so that students do not languish for an entire year with a poor teacher.
Professional Learning Communities We need to continue and deepen our understanding of and commitment to instruction-focused Professional Learning Communities. ● Teachers need sufficient time during the school day—as part of their regular
“work”—to collaboratively analyze data, plan high-level instruction, and reflect on student work.
● A student schedule with a weekly “late arrival” or “early release” can provide an additional period when all staff members can collaborate across departments on school-wide issues.

Making Our High Schools Work Houston A+ Challenge, June 2, 2008 14
● Professional development must be tied to the learning needs of individual campuses and individual Professional Learning Communities, and should be delivered during the regular school day whenever possible.
Personalized Learning Environment We need to continue developing creative structures that will break down our large, impersonal high schools into smaller learning communities. ● This restructuring must maintain a focus on ensuring that every student is
well-known on a personal level by one or more caring adults, and that no student “falls through the cracks.”
● Weekly advisement periods built into the student schedule can provide a structure within which each teacher can provide more personalized support for a small group of students.
WHERE DO WE GO FROM HERE?The culture, competencies, and conditions are in place for making
significant gains in student learning.
Curriculum
InstructionAssessment
STUDENTLEARNING
Professio
nal L
earning
Com
munit
ies
Teacher c
ollaboration
during
the s
chool d
ay
Personalized learning environmentsStudents connected to the school
Instructional support personnel
Leadership focus on instruction
Visual 4: Where do we go from here? Deepening and sustaining our work
The five-year grant from Houston A+ Challenge is at an end, although the combined leadership of the 16 campuses—having seen the value of our own learning and collaboration—have requested that the Collaborative be maintained by Houston A+ Challenge to allow continued cross-district dialogue around high school improvement efforts. Still, the burden—and the opportunity—for continuing the work that has been started now falls to the schools themselves,

Making Our High Schools Work Houston A+ Challenge, June 2, 2008 15
and to their districts. In Attachment 6, each campus has identified ways in which their own districts can continue or add to their progress, and in Attachment 7 we have summarized those needs across all campuses. However, as we address this paper to the combined leadership of the four districts, there are some key recommendations that we encourage all four districts to adopt. The recommendations are directed to our immediate leaders—the superintendents and staff of the four school districts—and to our policy-makers—the school board members entrusted by the public to make policy and budgetary decisions on behalf of the students in their districts. We recognize the very real constraints of the context within which we are making these recommendations—increasing state and federal regulations and shrinking funding. But we also are urgently aware of the responsibility we have to our communities, our parents, and—most importantly—the young men and women we are preparing to take our places in the not-so-distant future.

Making Our High Schools Work Houston A+ Challenge, June 2, 2008 16
Proposed Board Action Within the context of what we have learned and what we have accomplished, we recommend that each Board of Trustees consider adopting a resolution addressing the ten areas listed below. Sample Board resolution language begins on the following page. The high school principals in each district have personalized the resolution to address the specific status and needs of each district and will deliver a copy of that proposal directly to their Board Presidents and Superintendents. I. Commitment of funding, personnel and support for structures and conditions
including: • Daily teacher planning time • Weekly student early release or late arrival (for teacher collaboration) • Weekly advisement periods for students
II. Support for professional development (released time and funds) that is: • Collaboratively designed to meet individual campus needs • Provided at teacher team level • Enhanced by supportive resources • Inclusive of principals as instructional leaders
III. Support for smaller learning communities IV. Revision of Board policies to address staff accountability V. Revision of Board policies to reflect best practices in:
• Grading, homework, credits • Student scheduling • Staff scheduling
VI. Support for full-time instructional coaches in each core instructional area on every high school campus
VII. Support for additional budget flexibility for campus principals VIII. Commitment of discretionary funds to support:
• Parent involvement • School-wide literacy • Student incentives • Student involvement in activities
IX. Commitment of central office departments to support campuses through: • Revision of internal rules to enhance flexibility and support • Development of new campus support services • Decreasing principal time off-campus
X. Convening of annual hearings about high school status

Making Our High Schools Work Houston A+ Challenge, June 2, 2008 17
SAMPLE PROPOSED BOARD RESOLUTION LANGUAGE We, the Board of Trustees of __________ Independent School District, pledge our commitment to ensuring that every high school student in our district achieves the learning standards established by the state and graduates with the skills and knowledge necessary to be a successful, productive member of the community. We further commit ourselves to providing the level of support necessary for our high schools to carry out our pledge to make every student successful. In support of this pledge, we direct the Superintendent to: ● Develop a plan for providing the funding, personnel and other support for
structures and conditions likely to ensure student success in our high schools; namely,
o Daily planning time for teacher collaboration about data, instructional planning and student work,
o Weekly early release (or late arrival) student schedules that permit the entire high school staff to work collaboratively on cross-disciplinary and school-wide issues, and
o Student schedules that provide for at least weekly periods of time for advisement and/or academic intervention aimed at ensuring that each student’s individual needs are being met.
• Develop a plan for providing sufficient support for professional development on each campus, including released time and funds for travel, consultant fees and substitutes. The professional development should:
o Be designed collaboratively with each campus to ensure that it meets not only district needs, but also specific campus needs,
o Be provided as much as possible in small increments at the teacher team level, during the school day during common planning time, and include evaluation of its effectiveness in changing staff behaviors and outcomes,
o Be enhanced by the purchase of professional books, software, and other resources in support of extended staff learning, and
o Include support for principals as instructional leaders. • Develop a plan for providing the funding, personnel and other support for
smaller learning communities designed to ensure that each student is known well by one or more adults in the school and maintains a sense of “connectedness” with the school and learning.
• Revise current Board policies to address staff accountability for delivering high-quality instruction and other services that students need to be successful. Board policies and local procedures should address:
o Hiring practices, supervision and evaluation procedures that emphasize demonstrated skills and success in terms of actual student performance, and
o Processes that make it easier to replace teachers who are consistently unable to support student learning.
● Revise current Board policies to reflect current best practices regarding: o Grading, homework and award of credit, o Student scheduling, and o Staff scheduling.

Making Our High Schools Work Houston A+ Challenge, June 2, 2008 18
• Develop a plan for providing the funding and personnel units necessary to provide at least one full-time instructional coach in each core instructional area on every high school campus.
• Provide additional budget flexibility to campus principals to allow them to reallocate current funds for personnel as well as other operating expenses to better meet the unique needs of their campuses.
• Allocate additional discretionary funds in each campus’s budget to support the provision of:
o Parent involvement activities, o School-wide literacy activities, o Student incentives and rewards, and o Student activities designed to increase student involvement in the
school. • Clearly communicate the Superintendent’s intent that all central office
departments to do whatever it takes to support campuses in their mission, including:
o Working to revise internal rules and procedures to ensure the highest level of both flexibility and support,
o Working collaboratively with the campuses to develop new kinds of services to support them,
o Creating new forms of communication and training in order to decrease the amount of time principals and other campus leaders need to be off-campus at meetings.
• Hold at least annual hearings at which high schools are invited to present the outcomes of their work, including:
o State and district accountability data, o Assessments of teacher delivery of highly effective instruction, o Student, teacher and administrative surveys and other data about the
effectiveness of the school for student learning.
Making Our High Schools Work Houston A+ Challenge, June 2, 2008 Attachment 1 - Page 19
ATTACHMENT 1
HOUSTON A+ CHALLENGE REGIONAL COLLABORATIVE FOR HIGH SCHOOL REDESIGN
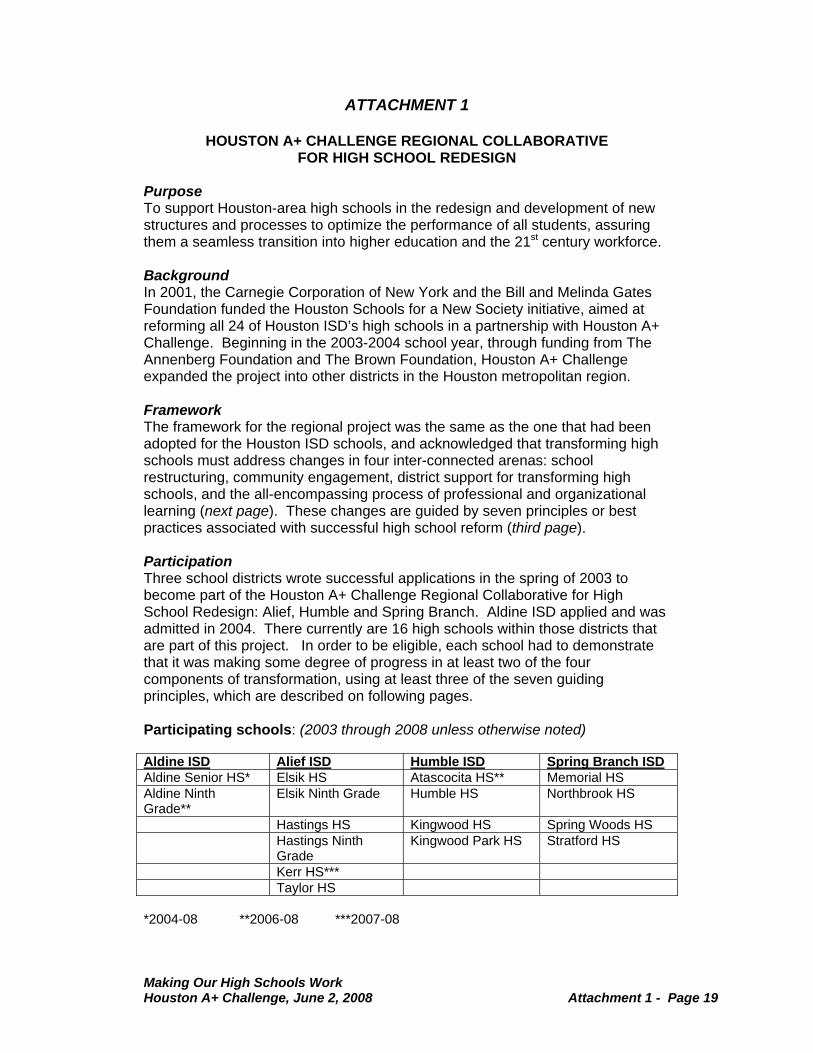
Purpose To support Houston-area high schools in the redesign and development of new structures and processes to optimize the performance of all students, assuring them a seamless transition into higher education and the 21st century workforce. Background In 2001, the Carnegie Corporation of New York and the Bill and Melinda Gates Foundation funded the Houston Schools for a New Society initiative, aimed at reforming all 24 of Houston ISD’s high schools in a partnership with Houston A+ Challenge. Beginning in the 2003-2004 school year, through funding from The Annenberg Foundation and The Brown Foundation, Houston A+ Challenge expanded the project into other districts in the Houston metropolitan region. Framework The framework for the regional project was the same as the one that had been adopted for the Houston ISD schools, and acknowledged that transforming high schools must address changes in four inter-connected arenas: school restructuring, community engagement, district support for transforming high schools, and the all-encompassing process of professional and organizational learning (next page). These changes are guided by seven principles or best practices associated with successful high school reform (third page). Participation Three school districts wrote successful applications in the spring of 2003 to become part of the Houston A+ Challenge Regional Collaborative for High School Redesign: Alief, Humble and Spring Branch. Aldine ISD applied and was admitted in 2004. There currently are 16 high schools within those districts that are part of this project. In order to be eligible, each school had to demonstrate that it was making some degree of progress in at least two of the four components of transformation, using at least three of the seven guiding principles, which are described on following pages. Participating schools: (2003 through 2008 unless otherwise noted) Aldine ISD Alief ISD Humble ISD Spring Branch ISD Aldine Senior HS* Elsik HS Atascocita HS** Memorial HS Aldine Ninth Grade**
Elsik Ninth Grade Humble HS Northbrook HS
Hastings HS Kingwood HS Spring Woods HS Hastings Ninth
Grade Kingwood Park HS Stratford HS
Kerr HS*** Taylor HS *2004-08 **2006-08 ***2007-08

Making Our High Schools Work Houston A+ Challenge, June 2, 2008 Attachment 1 - Page 20
Funding Grant funds flowed through the Houston A+ Challenge at the rate of $100,000 per year per district for five years, with continuation based on annual reviews of performance. Agreements In order to be funded, each district agreed: • to collaborate with one or more external partners • that a district representative would participate in at least four meetings of the
Houston A+ Challenge Regional Senior Fellows • that the high school principals would participate in monthly collaborative
network meetings • that the high school principals would consider joining the Houston A+
Challenge New Visions in Leadership Academy • that the high school leadership teams would participate in three network
activities each year

Making Our High Schools Work Houston A+ Challenge, June 2, 2008 Attachment 1 - Page 21
TRANSFORMING HIGH SCHOOLS
Transforming high schools requires profound change at many differing levels. The redesign projects attempted to address changes in the following four components: • Professional and Organization Learning: Provide ongoing, sustained, and
focused professional development to teachers, administrators, central office staff, parents, and community members
• School Restructuring: Align all components of the school with the vision and guiding principles
• Community Engagement: Involve all stakeholders in activities developed to support the school and district restructuring
• District Change and Support for Transforming High Schools: Create a climate that encourages risk-taking, innovation, and support. Schools will have autonomy to make choices based on individual campus needs.
Professional and OrganizationLearning
SchoolRestructuring
CommunityEngagement
District Changeand Support
for TransformingHigh Schools

Making Our High Schools Work Houston A+ Challenge, June 2, 2008 Attachment 1 - Page 22
GUIDING PRINCIPLES The schools in the Houston A+ Challenge Regional High Collaborative for High School Redesign demonstrated commitment to seven guiding principles: I. High Expectations
• Set clear, fair and high academic and conduct standards for all students.
II. Personalization • Create small units with the ideal size being 300 students. • Provide a personal adult advocate for each student throughout the high
school.
III. Coherency • Utilize project-based learning, portfolios and exhibitions as assessment
tools. • Connect student learning with real-world experiences. • Use a variety of instructional strategies to accommodate individual
learning styles.
IV. Time And Resources • Institute flexible allocation of available resources including people, time,
facilities and money. • Allow common planning time for teachers with their colleagues.
V. Technology • Integrate technology into the teaching and learning process. • Create web-based systems at the district to display curriculum, student
grades and attendance reports. • Provide accessible, effective internal and external communication
systems.
VI. Professional Development • Implement whole-school professional learning communities. • Develop relationships with business and community organizations to build
real-world experience for principals and teachers. • Build relationships with higher education to enhance student
performance.
VII. Leadership • Give community members, parents, teachers, and students input into
decision making. • Establish professional development for principals around leading and
managing change. • Ensure that district administrators support school principals’ restructuring
plans.

Making Our High Schools Work Houston A+ Challenge, June 2, 2008 Attachment 2 – Page 23
ATTACHMENT 2
NETWORK COLLABORATIVE ACTIVITIES
Over the past five years, high schools in the Houston A+ Challenge Regional Collaborative have participated in:
Monthly collaborative meetings The principal and one assistant principal from each campus met monthly to learn from one another, share ideas and practice collaborative tools to support the redesign effort on their campuses.
Cross-site visits to every campus in the fall Ten-member teams composed of teachers and administrators from each participating campus visited another network campus each fall. Each of the schools identified a “focus question” for the visit about a particular issue they were facing. The teams spent a day in each host school, visiting as many classrooms as possible—typically 70 to 80 during the day—and looking for evidence of the school’s progress in the area of the focus question. Data collected during the day was presented to the host school for their use in continuous planning and improvement. January Leadership Conference Ten-member teams from each campus were invited to learn together about issues facing them in high school redesign:
• January 2005: Teams spent a day looking at and talking about a wide variety of models of smaller learning communities. Houston ISD high schools were also invited to send teams. One-hundred sixth-five registrants heard about South Grand Prairie High School (Grand Prairie, TX), which has five “career academies” and was named a "New American High School National Showcase Site" by the U.S. Department of Education. Lee High School in Houston ISD also discussed its process of creating ten semi-autonomous, thematic, small learning communities. In smaller break-out sessions with more opportunities for discussion, schools from Houston ISD, Humble ISD and Spring Branch ISD discussed their work and the issues associated with the creation of smaller learning communities and small schools.
• January 2006: Campus teams spent the morning with the Houston A+ Challenge Portfolio Group, working on each campus’s portfolio to document their progress for the current year’s work. In the afternoon, breakout sessions were designed to provide an introduction to eight areas of professional development that might be incorporated into a campus or district professional development plan for 2006-07. Participants were asked to reflect on each session’s value to their own learning as well as its value to other members of their campus staff. Reflections were used at the following network collaborative meeting to begin work on the shared professional development plan.
• January 2007: Tony Wagner from Harvard University’s Change Leadership Group addressed the whole group to share his ideas about school change. School administrators had been studying his book Change Leadership all year, so Dr. Wagner continued to work with the

Making Our High Schools Work Houston A+ Challenge, June 2, 2008 Attachment 2 – Page 24
school administrators for the rest of day to deepen their learning. At the same time, 25 different workshops detailing best practices from each of the 15 high schools in the network were provided to the other members of the school teams. Teams met at the end of the day to reflect on their learning and plan how to use what they learned.
• January 2008: All 16 high schools shared portfolios documenting their work over the last five years. Each portfolio addressed the following questions:
o Who are we? o What have we accomplished? o What impact are we having on student learning? o Where will we go next?
Schools presented their work to their peers and received feedback that will be used in making final changes to the documents.
Year-End Leadership Conference Ten-member teams from each campus were invited to (1) review the year’s progress, (2) share ideas and information across schools, and (3) develop their action plans for the next year.
• Year-End Conference 2005: Dr. Cheryl Craig and Dr. Lynn Parsons facilitated a general session during which each campus team developed a theory of action and began planning for development of a school portfolio to document their progress.
• Year-End Conference 2006: Campuses shared their portfolios with others and used a consultancy protocol to provide feedback and suggestions for improvement.
• Year-End Conference 2007: Campus teams continued to work on their portfolios. Participants engaged in cross-school dialog about issues and best practices using a structured protocol called Open Space Technology.
Individual campus reviews In addition to these collaborative network events, the project coordinator met individually with each principal at their campuses to review and finalize the campus action plan (in the fall) and to review documented progress on the action plan (in the spring).

Making Our High Schools Work Houston A+ Challenge, June 2, 2008 Attachment 3 – Page 25
ATTACHMENT 3
REFERENCES, RESOURCES AND INFLUENCES Bernhardt, Victoria L. The School Portfolio Toolkit: A planning, implementation,
and evaluation guide for continuous school improvement. Larchmont, NY: Eye on Education, 2002.
Bridgeland, John M., Dilulio, J.J., and Morison, K.B. The Silent EPIDEMIC:
Perspectives of High School Dropouts. A report by Civic Enterprises in association with Peter D. Hart Research Associates for the Bill and Melinda Gates Foundation, March 2006.
Breaking Ranks II: Strategies for Leading High School Reform Reston, VS:
National Association of Secondary School Principals, 2004. Conzemius, Anne and O’Neill, Jan Building Shared Responsibility for Student
Learning. Alexandria, VA: Association for Supervision and Curriculum Development, 2001.
Conzemius, Anne and O’Neill, Jan The Handbook for SMART School Teams.
Bloomington, IN: National Educational Service, 2002. Cushman, Kathleen, “Documenting Whole-School Change in Essential Schools.”
Horace, 1996, 12(3). DuFour, Richard and Eaker, Robert Professional Learning Communities at
Work. Bloomington, IN: National Educational Service, 1998. DuFour, Richard, DuFiour, Rebecca, Eaker, Robert, and Karhanek, Gayle
Whatever It Takes: How Professional Learning Communities Respond When Kids Don’t Learn. Bloomington, IN: National Educational Service, 2004.
Eaker, Robert, DuFour, Richard, and DuFour, Rebecca Getting Started:
Reculturing Schools to Become Professional Learning Communities. Bloomington, IN: Solution Tree, 2002
Murphy, Carlene “Finding Time for Faculties to Study Together.” Journal of Staff
Development, 1997, 18 (3). Protocols from the National School Reform Faculty
(http://www.nsrfharmony.org/protocols.html) Reeves, Douglas B. Accountability in Action: A Blueprint for Learning
Organizations Denver, CO: Advanced Learning Centers, 2000. Schlechty, Philip Working on the Work: An Action Plan for Teachers, Principals,
and Superintendents Jossey-Bass, 2002.

Making Our High Schools Work Houston A+ Challenge, June 2, 2008 Attachment 3 – Page 26
Sizer, Theodore R. Horace’s School: Redesigning the American High School Boston: Houghton-Mifflin, 1992.
Wagner, Tony, Kegan, R., Lahey, L., Lemons, R. W., Garnier, J., Helsing, D.,
Howell, A., Rasmussen, H. Change Leadership. San Francisco, CA: John Wiley & Sons, 2006.
Wagner, Tony, “Leadership for Learning: An Action Theory of School Change”
Phi Delta Kappan, 2001, 82(5), 378-383. Wagner, Tony “Rigor on Trial.” Education Week, January 11, 2006.
Making Our High Schools Work Houston A+ Challenge, June 2, 2008 Attachment 4 – Page 27
ATTACHMENT 4
SCHOOL-BY-SCHOOL ACCOMPLISHMENTS: CULTURE, CONDITIONS, COMPETENCIES
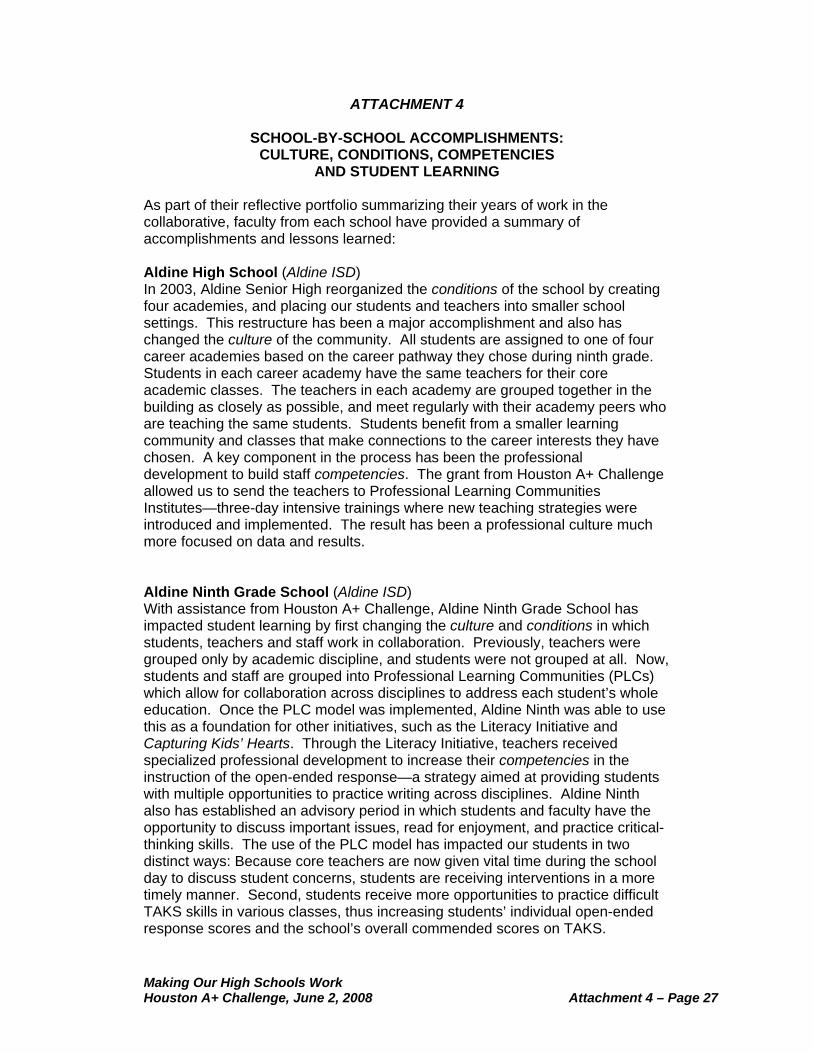
AND STUDENT LEARNING As part of their reflective portfolio summarizing their years of work in the collaborative, faculty from each school have provided a summary of accomplishments and lessons learned: Aldine High School (Aldine ISD) In 2003, Aldine Senior High reorganized the conditions of the school by creating four academies, and placing our students and teachers into smaller school settings. This restructure has been a major accomplishment and also has changed the culture of the community. All students are assigned to one of four career academies based on the career pathway they chose during ninth grade. Students in each career academy have the same teachers for their core academic classes. The teachers in each academy are grouped together in the building as closely as possible, and meet regularly with their academy peers who are teaching the same students. Students benefit from a smaller learning community and classes that make connections to the career interests they have chosen. A key component in the process has been the professional development to build staff competencies. The grant from Houston A+ Challenge allowed us to send the teachers to Professional Learning Communities Institutes—three-day intensive trainings where new teaching strategies were introduced and implemented. The result has been a professional culture much more focused on data and results. Aldine Ninth Grade School (Aldine ISD) With assistance from Houston A+ Challenge, Aldine Ninth Grade School has impacted student learning by first changing the culture and conditions in which students, teachers and staff work in collaboration. Previously, teachers were grouped only by academic discipline, and students were not grouped at all. Now, students and staff are grouped into Professional Learning Communities (PLCs) which allow for collaboration across disciplines to address each student’s whole education. Once the PLC model was implemented, Aldine Ninth was able to use this as a foundation for other initiatives, such as the Literacy Initiative and Capturing Kids’ Hearts. Through the Literacy Initiative, teachers received specialized professional development to increase their competencies in the instruction of the open-ended response—a strategy aimed at providing students with multiple opportunities to practice writing across disciplines. Aldine Ninth also has established an advisory period in which students and faculty have the opportunity to discuss important issues, read for enjoyment, and practice critical-thinking skills. The use of the PLC model has impacted our students in two distinct ways: Because core teachers are now given vital time during the school day to discuss student concerns, students are receiving interventions in a more timely manner. Second, students receive more opportunities to practice difficult TAKS skills in various classes, thus increasing students’ individual open-ended response scores and the school’s overall commended scores on TAKS.
Making Our High Schools Work Houston A+ Challenge, June 2, 2008 Attachment 4 – Page 28
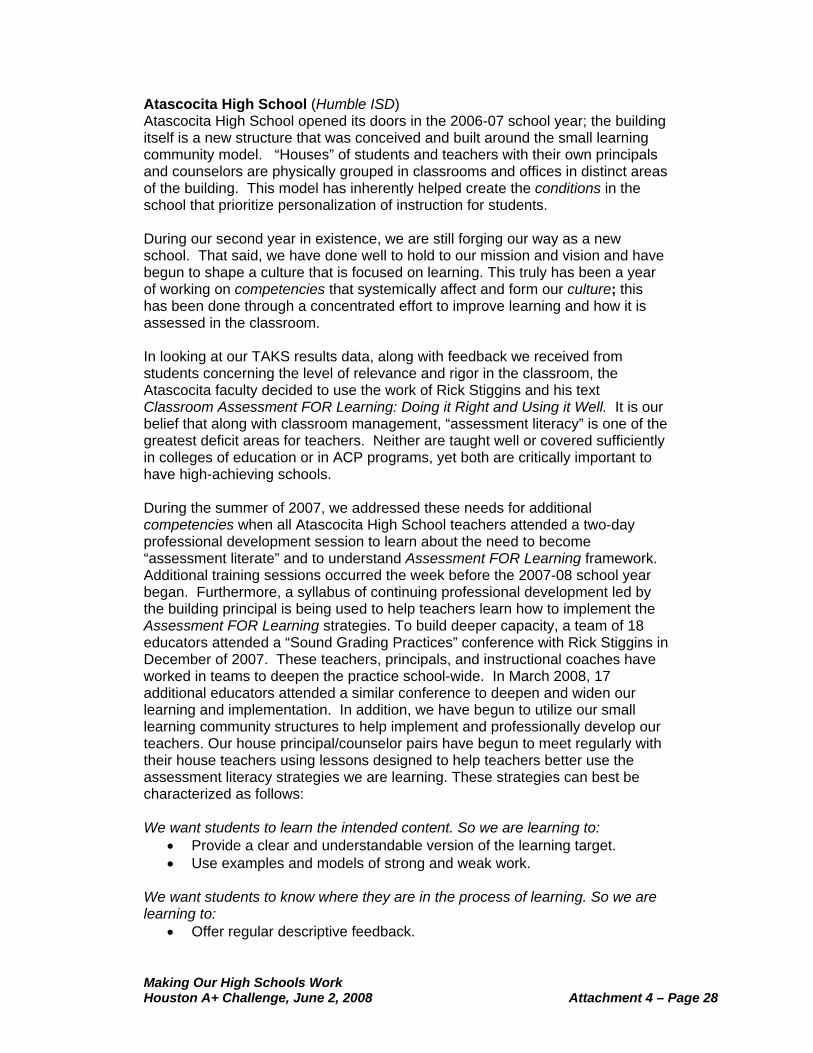
Atascocita High School (Humble ISD) Atascocita High School opened its doors in the 2006-07 school year; the building itself is a new structure that was conceived and built around the small learning community model. “Houses” of students and teachers with their own principals and counselors are physically grouped in classrooms and offices in distinct areas of the building. This model has inherently helped create the conditions in the school that prioritize personalization of instruction for students. During our second year in existence, we are still forging our way as a new school. That said, we have done well to hold to our mission and vision and have begun to shape a culture that is focused on learning. This truly has been a year of working on competencies that systemically affect and form our culture; this has been done through a concentrated effort to improve learning and how it is assessed in the classroom. In looking at our TAKS results data, along with feedback we received from students concerning the level of relevance and rigor in the classroom, the Atascocita faculty decided to use the work of Rick Stiggins and his text Classroom Assessment FOR Learning: Doing it Right and Using it Well. It is our belief that along with classroom management, “assessment literacy” is one of the greatest deficit areas for teachers. Neither are taught well or covered sufficiently in colleges of education or in ACP programs, yet both are critically important to have high-achieving schools. During the summer of 2007, we addressed these needs for additional competencies when all Atascocita High School teachers attended a two-day professional development session to learn about the need to become “assessment literate” and to understand Assessment FOR Learning framework. Additional training sessions occurred the week before the 2007-08 school year began. Furthermore, a syllabus of continuing professional development led by the building principal is being used to help teachers learn how to implement the Assessment FOR Learning strategies. To build deeper capacity, a team of 18 educators attended a “Sound Grading Practices” conference with Rick Stiggins in December of 2007. These teachers, principals, and instructional coaches have worked in teams to deepen the practice school-wide. In March 2008, 17 additional educators attended a similar conference to deepen and widen our learning and implementation. In addition, we have begun to utilize our small learning community structures to help implement and professionally develop our teachers. Our house principal/counselor pairs have begun to meet regularly with their house teachers using lessons designed to help teachers better use the assessment literacy strategies we are learning. These strategies can best be characterized as follows:
We want students to learn the intended content. So we are learning to:
• Provide a clear and understandable version of the learning target. • Use examples and models of strong and weak work.
We want students to know where they are in the process of learning. So we are learning to:
• Offer regular descriptive feedback.

Making Our High Schools Work Houston A+ Challenge, June 2, 2008 Attachment 4 – Page 29
• Teach students to self-assess and set goals. We want to be sure students know how to get better. So we are learning to:
• Design lessons to focus on one aspect of quality at a time. • Teach students focused revision. • Engage students in self-reflection. • Let students keep track of and share their learning.
Currently, the faculty is working hard to create clear learning targets in student-friendly language and to implement the above strategies. Principals gather evidence of implementation using Classroom Walkthrough Training methods, and feedback is given to teachers to help them improve. It is our school-wide goal that using these strategies will improve the success rate of all students passing all courses from 79% last year to 90% this year. Our impact on student learning is just beginning. Since this is our fourth semester and we are just beginning our efforts to become assessment literate and to use sound grading practices, we do not yet have the data to demonstrate effects on student learning. However, our failure rate in fall 2007 dropped 4%, and we hope to reach our goal of 90% passing rates across the school by May 2008. Important to note is the existing research on using Assessment for Learning strategies, which includes sound grading practices. When implemented deeply and throughout the learning environment, the expected impact on student learning and achievement is powerful (Bloom, 1984; Black and William, 1998; Meisels, et. Al., 2003; Rodriguez, 2004; Hattie and Timperley, 2007). A summary of the average gains noted in the research are seen below:
• 35 Percentile Point gain on achievement tests • 2-4 Grade Equivalent gain • 100 SAT Score Points • 5 ACT Composite Score Points
Elsik High School (Alief ISD) This year, Elsik High School focused on providing activities aimed at improving the student culture of engagement and connection by launching the Ramapolooza and Lunch with Leaders programs to encourage students to participate in University Interscholastic League or after-school activities. We are anxious to have our end-of-year data to verify our position. This focus on creating multiple opportunities for students to connect to school has made an impact. For the first time ever, 17 Elsik students have advanced to the state history fair. In the last two years, more than 60 Elsik students will have participated in the Texas Forensic Association Speech and Debate competition. Our art program has blossomed to include 60 new members in the Art National Honor Society, nine medals out of 16 at the Texas Art Education Association’s Visual Art Scholastic Event, and an Elsik High School student artist recently won the American Vision award in the Scholastic Art and Writing competition. In the last four years, we have increased the number of Teen Leadership classes—which has directly impacted our Pals and Student Council enrollment and

Making Our High Schools Work Houston A+ Challenge, June 2, 2008 Attachment 4 – Page 30
participation. It is our belief that these positive student connections will have a positive effect on student achievement. Elsik High School also has been able to address teacher competencies by offering differentiated professional development for teachers depending on the teacher’s area of need. Elsik recently was awarded a Houston A+ Challenge Replication grant in collaboration with Hastings High School, which has allowed teachers to receive additional professional development in best practices and professional consultations with Doug Reeves’ Leadership and Learning Center. In an effort to increase our graduation rate, this grant has provided the funding to support and provide academic interventions to a “small learning community” of seniors, enabling them to graduate. Elsik High School and Elsik Ninth Grade Center have been working hard this year to “Bridge the Bayou” that separates us. Though linked as one school, the two campuses in the past have functioned as two separate entities due to physical separation. The effort to correct this problem and help seam the divide between the campuses began in July of 2007 with Elsik’s Leadership Retreat. Held annually, this retreat allows key campus leaders the opportunity to regroup before the start of the school year to reflect on the past year, and create goals for the coming year. For the first time this year, Elsik Ninth Grade was invited to participate. Important relationships were formed, and the campuses developed goals together so that students who are drawn to attend Elsik will feel continuity from grades nine through twelve. The campuses have worked together more than ever this year to continue the feeling of “oneness”. Principals and assistant principals from both campuses meet to collaborate on administrative practices. Counselors communicate often in regard to educating students about credits and graduation in order to ensure smooth transition of students to the main campus. Librarians plan book clubs and literacy events involving students from both campuses to promote continued enjoyment of literature. The AVID coordinator and teachers work with the Ninth Grade Center to identify and qualify students for the AVID program once they reach the main campus. Through these and other efforts, students from the Ninth Grade Center are making connections with students and staff members at the main campus and are developing a feeling of belonging not to Elsik Ninth Grade Center or Elsik Main, but to ELSIK. Our accomplishment in student achievement, as determined by state assessment, has been increased TAKS scores in Social Studies and ELA in the past four years. We have seen a small increase in overall math scores, though we did not keep pace with the state. We also have seen an increase in the number of students enrolled in Pre-AP/AP classes and in the numbers of students taking AP test and the PSAT in the last four years. Elsik Ninth Grade Center (Alief ISD) We have seen tremendous growth in our efforts to create a culture of collaboration focused on student learning at Elsik Ninth Grade Center. One of our most important measures of student learning is the Campus Common Assessments (CCA), collaboratively created by our core content teachers. These assessments give us important information about student learning and instructional focus. Since our doors opened 10 years ago, we have created the

Making Our High Schools Work Houston A+ Challenge, June 2, 2008 Attachment 4 – Page 31
conditions for a collaborative learning environment; however, since our involvement with the Houston A+ Challenge Network, we have developed our competencies and established a stronger collaborative culture at Elsik Ninth Grade Center. Core departments are very comfortable sharing CCA data with one another to make instructional decisions by analyzing the needs of the students. There has been a shift away from meetings driven by “administrivia” items, toward meetings focusing on the alignment of curriculum, instruction and assessment. Elsik Ninth Grade teachers understand the importance of creating the assessments first, and then designing instruction that connects the content to these assessments. Changing the culture by creating meaningful and productive relationships between adults and students has been another positive highlight of our work over the past five years. The Capturing Kids’ Hearts philosophy and professional development, in addition to our work with the district’s Above and Beyond initiative, has supported our efforts to provide a supportive, transitional environment for incoming ninth graders. Each year, visitors from other schools participating in the Houston A+ Challenge Regional High Schools Network have observed our campus learning environment and provided us with very positive feedback about the relationships they observed between students and adults. In previous years, the establishment of student advisory time provided a structure within the school day to focus on non-academic issues that affect student learning. This year, without having the advisory period, we have noticed that we are struggling to find the time during the day to focus on these important issues. We are proud of our improvement in TAKS scores. First-time ninth graders at Elsik Ninth Grade Center have consistently scored at or above the state’s mastery average on the Reading TAKS. From 2005-2007, our subgroups have improved significantly in Reading. Although our Math TAKS scores remain an area of concern, we have seen growth since 2005 in the Campus, African American, At-Risk, and Economically Disadvantaged groups. We attribute much of this success to the intervention programs that we have been able to provide with staffing from the district. We are able to provide additional support for every student not successful on the 8th grade Reading TAKS and most of the students not successful on 8th grade Math TAKS. We are confident that our interventions will lead to continued improvement on the TAKS and in campus academic performance, as we continue to refine these programs. We also have begun to discuss how the reading interventionists can partner with the math interventionists to create a literacy instructional component within math intervention classes. Hastings High School (Alief ISD) Hastings High School has been and remains committed to a mission and vision of data-based decision-making and school-wide literacy. We are determined to improve teacher effectiveness and raise student achievement by implementing initiatives and interventions that will increase rigor and relevance in our curriculum and instruction. This year, Hastings High School has experienced significant changes—the largest being a change in conditions from a block schedule to a seven-period day, which has been an immense adjustment for our

Making Our High Schools Work Houston A+ Challenge, June 2, 2008 Attachment 4 – Page 32
staff and our students. We also have new campus leadership—leadership which is dedicated to continuing the journey to academic success. Our staff understands that “stretch” gains are necessary to improve our state accountability rating and to meet the Adequate Yearly Progress standards required by No Child Left Behind. Therefore, TAKS interventions and strategies are a priority in Math and Science. Targeted students in all grade levels are provided TAKS tutorials. Special interventions also are offered to all of our seniors, in an effort to improve our graduation and completion rate. A computer-based instructional program has been implemented during the day and after school to keep students on track to graduate within four years. Hastings continues to demonstrate a commitment to professional development to address specific staff competencies. We are committed to supporting campus-wide literacy through Textperts training, and to continuing to build teacher-student relationships through the PAWS committee. Along with literacy and building relationships, special education inclusion teachers are receiving additional training through the Region IV BISI grant to strengthen on-level instruction and engagement. We are committed to improving the student culture and increasing student involvement through clubs and activities such as CLUE, Senior Breakfasts, Council of Clubs and Round Table discussions. Our PALS, STARS and Student Council members have taken an active role in promoting student involvement and student leadership. Furthermore, Hastings is also focused on building safety and maintaining a climate conducive to learning. Our focus includes restricting access to the building, using RAPTOR to identify visitors, enforcing the ID policy, and utilizing hall sweeps to decrease tardiness. We have continued to work on building positive relationships among staff and students through various programs such as CHAMPS, Safe and Civil Schools and Capturing Kids’ Hearts. Hastings Ninth Grade Center (Alief ISD) Houston A+ Challenge provided direction and feedback that enabled the Hastings Ninth Grade Center to further refine its focus on strong relationships among all stakeholders in order to enhance student learning. The grant funded staff training for one of the strongest initiatives for impacting the school culture through relationship-building—the Flippen Group’s program, Capturing Kids’ Hearts. As a result of staff participation in Capturing Kids’ Hearts, there is strong staff buy-in (97%) to the premise that building strong relationships with students and peers creates an atmosphere of trust and a classroom environment where learning can take place. Without Houston A+ Challenge funding, it may not have been possible for such a large number of staff members to be trained each year in this intensive three-day workshop. The Hastings Ninth Grade Center is a campus with a devoted staff that understands that building strong relationships creates an environment that can enhance student learning. Hastings Ninth Grade Center is a campus where staff embraces collaborative planning, instruction and assessment. The staff is

Making Our High Schools Work Houston A+ Challenge, June 2, 2008 Attachment 4 – Page 33
trained to make data-driven decisions. Our efforts have paid off in terms of test scores that approach, and in some cases exceed, the state averages for attendance, by creating a welcoming, caring environment where student success can occur. Humble High School (Humble ISD) At Humble High School, we have emphasized a change in our culture through the implementation of Professional Learning Communities (PLCs). All administrators, instructional coaches and key teaching staff have attended PLC conferences to increase their competencies and ensure that our work is collaborative, focused on our common goals, and focused on data about results, rather than intentions. We also have addressed the students’ needs for more personalized learning environments by providing student advisory periods twice a week and by offering tutorials during the school day. Houston A+ Challenge has supported Humble ISD's efforts through grant funding and coaching provided via the Regional High School Collaborative to establish small learning communities at Humble High School—a change in conditions that has been adopted by our entire district. Humble High School’s existing facility has been retrofitted to partition smaller groups of students and faculty into "houses," or small learning communities. Houston A+ Challenge also has enabled us to address staff competencies through a variety of additional professional development: ● University of Texas DANA Center training: A total of 40 educators, including
instructional coaches and administrators, attended this training over the five-year grant period.
● Region IV Consultants for Four Core Areas: Region IV consultants met with teachers at least once per month for 10 months to improve instruction in all four core areas.
● Substitutes for TEKS Collaboration: We provided substitutes for teachers to work on scope and sequence, deconstructing the TEKS and planning common assessments.
● Assessment for Learning Conference: One administrator and four teachers participated in Rick Stiggins’ Assessment for Learning Conference in Portland, Oregon.
● Instructional Coaches: Instructional Coaches attended the Instructional Coaching Conference. They also received annual stipends from the grant for the model of instructional practices in the classrooms, additional disaggregation of data and Critical Friends Group work.
Kerr High School (Alief ISD) The culture of Kerr High School has changed through participation in the Houston A+ Challenge Regional Collaborative for High School Redesign. Kerr focused on two interventions to encourage students to take more responsibility and ownership of their learning: rigor and relevance of curriculum, and student goal setting. Before the school year started, the entire staff participated in day-long training on rigor and relevance. During the training, staff members created

Making Our High Schools Work Houston A+ Challenge, June 2, 2008 Attachment 4 – Page 34
a common definition of rigor and began a year-long focus on implementing more rigor and relevance into the curriculum. The culture also has been affected by focusing on personalizing relationships with students. Twenty-two staff members attended the Capturing Kids’ Hearts conference in order to build capacity around encouraging solid relationships with students. As a result, student advisory periods have become more effective and structured around goal-setting and reflection on growth and success. The success of the two interventions (rigor/relevance and goal setting) only could occur with the ability to adapt the conditions of our school. Analyzing the rigor and relevance of the curriculum required that teachers have a consistent, structured time to collaborate. This was achieved through weekly Professional Learning Community periods (Wednesdays, 1:30-3:00). Each department met as a group to assess the curriculum and make changes. In addition, each month the entire faculty met to spotlight the work being done on rigor and relevance in a different department. This sharing time has provided school-wide awareness of the unique aspects of each department and a holistic picture of the school’s strengths. Also, the daily schedule was adapted to lengthen the student advisory period to 25 minutes. This allowed more time for in-depth advisory activities focusing on goal-setting and reflection. The Houston A+ Challenge initiatives have resulted in the growth of our teacher competencies in a number of areas. Teachers are now actively analyzing curriculum for rigor and relevance and making changes and modifications as needed to make the curriculum interesting as well as challenging for students. Teachers also are leading structured goal-setting activities and academic reflection activities during advisory. They are applying the mentoring approaches from Capturing Kids’ Hearts to cement their personal relationships with students. Since Kerr joined the Houston A+ Challenge network in the final year of the five-year project, the collective data reflecting the effect of our initiatives is not complete. Anecdotal evidence indicates that the goal-setting initiative has had an impact on student learning. During the English/Language Arts TAKS testing in March, 75% of our students were still testing at noon, an indication that students did take the exam much more seriously than in the past. Student interviews indicate that students perceive Kerr as a ‘family’ and teachers as supports rather than barriers to success. Kingwood High School (Humble ISD) The mission of Kingwood High School is to create a collaborative learning environment that is supportive, challenging and disciplined, resulting in lifelong learners whose exemplary performance is a credit to themselves and their community. Since Kingwood High School opened its doors, it has upheld a tradition of excellence in academics and athletics. KHS has been awarded the Lone Star Cup five times and most recently was named on the Texas Business Education Coalition Honor Roll for the 2006-2007 school year. Even with such accolades, Kingwood High School continues to seek ways to become even better.

Making Our High Schools Work Houston A+ Challenge, June 2, 2008 Attachment 4 – Page 35
The culture of Professional Learning Communities (PLCs) is an integral part of what makes Kingwood High School successful. Weekly time is scheduled for faculty and staff to collaborate on best practices for the classroom as well as the campus, and to reflect on and celebrate our accomplishments. Some of the key benefits of our PLCs are increased leadership capacity among the staff, shared ownership of campus initiatives and inclusion of all stakeholders. Nancy Cozad, a teacher of 11 years states, “The time we spend in PLC's is priceless. Having a guaranteed time to sit down with our teaching team to discuss upcoming lessons, share difficulties and successes, and to build relationships has been critical to my becoming a better teacher. I also greatly appreciate the other opportunities to come together as a faculty for meetings, celebrations, and the like. I can't imagine teaching at a school without PLC time." Time at Kingwood High School is devoted to academic and effective learning for both students and adults, because we firmly believe that “no significant learning happens in the absence of a significant relationship” (James Comer). At the heart of our personalized learning efforts are our smaller learning communities (SLCs). This SLC structure enables staff members to foster relationships with students and parents that aide in the overall development of each child. A critical change in conditions has been the modified block bell schedule that was created at Kingwood High School in the mid-90s and has since been replicated at schools across the nation. This flexible schedule allows for differentiation of instruction for both student and adult learning. Through a state waiver, we have utilized this schedule to carve out our Professional Learning Community time on Thursday mornings for the past seven years. As PLCs were implemented, we simultaneously began the process of developing our SLCs. Research indicates that SLCs create a more personalized learning experience and foster student connectedness, thereby promoting academic, social and emotional growth. In 2001, we divided our student body alphabetically into subgroups of approximately 400 students, and assigned an assistant principal/counselor team to each SLC. Each SLC was then further subdivided into grade-level advisories of 18 students facilitated by an advisor who remains with those students until their graduation. This structure provides each student consistent relationships with at least three adults on campus who care about and know that student well. At Kingwood High School, we recognize that adult learning—the continuous improvement of staff competencies—is critical to the success of student learning. Therefore, it is essential to have a strong link between curricular and staff development. Ongoing professional development and collaboration time are provided during the school day as well as through other venues to improve our skills and simultaneously build leadership capacity of all of our staff. Because of our fundamental belief in the power and expertise of our staff, there also must be a support system in place for them as they strive to refine their instructional practices. This support system includes:
• Assistant Principals who are actively involved in instructional leadership. Each assistant principal works with specific departments to promote quality instruction and learning.

Making Our High Schools Work Houston A+ Challenge, June 2, 2008 Attachment 4 – Page 36
• Instructional Coaches who meet regularly with their respective assistant principals and classroom teachers to discuss and share best practices. Coaches also mentor new teachers, visit classrooms, invite teachers to observe their own teaching, and assist with lesson planning.
• An Academic Associate who coordinates all testing. This person disaggregates data for the instructional coaches as well as individual teachers so that instructional decisions are data-driven.
• A Smaller Learning Community Coordinator who assists with advisory curriculum development, planning and training, and who facilitates service learning efforts across the curriculum and throughout the district.
• An Instructional Leadership Team made up of all Department Chairs, Instructional Coaches and Assistant Principals. This group meets to discuss managerial concerns and facilitate campus-wide adult learning.
• Campus Development Plan Facilitators who meet with their self-selected teams regularly throughout the school year to implement Kingwood High School’s campus development plan that is established during the summer for the upcoming school year.
Students are more likely to succeed when they feel connected to school. Critical requirements for feeling connected include high academic rigor and expectations coupled with support for learning, positive adult-student relationships, and physical and emotional safety. Through the New Visions in Leadership Academy, yearly site visits, and monthly Regional High School Network meetings, Houston A+ Challenge has laid a foundation of learning at Kingwood High School that will serve us well into the future. Thanks to their generous funding we have been guided and empowered on our journey to become:
• Collaborative – Staff members have learned and implemented the true sense of collaboration through opportunities provided by Houston A+ Challenge.
• Supportive – A personalized learning environment has been created that is supported by small learning communities for students and professional learning communities for educators.
• Challenging – Houston A+ Challenge has placed us at the feet of the masters of educational reform. Houston A+ Challenge also has caused us to constantly question educational traditions and the status quo.
• Disciplined – Kingwood High School understands the significance of having a mission and vision, and the importance of following through with it.
• Resulting in lifelong learners – Kingwood High School embraces learning not only for students, but also for adults.
Kingwood Park High School (Humble ISD) Since 2003, most of our staff has been trained in Capturing Kids’ Hearts as a result of our involvement with the Houston A+ Challenge Regional Collaborative for High School Redesign. The culture of our school has improved because of this initiative. Fewer students are being referred for discipline because teachers have developed specific competencies to use as proactive measures to deter

Making Our High Schools Work Houston A+ Challenge, June 2, 2008 Attachment 4 – Page 37
disciplinary issues. As teachers who attended the training returned to campus, their enthusiasm was contagious. We have established a team of teachers who volunteered to perpetuate these techniques within our staff. They organize different activities that remind teachers of Capturing Kids’ Hearts strategies. Through continuous collaboration, Capturing Kids’ Hearts methods are kept at the forefront of our culture. We will continue sending staff members to this training until all have been trained. Kingwood Park High School currently has math and science instructional coaches and next year plans to add English and social studies coaches. Our instructional coaches have had a huge impact on instruction. As we grow into a four-year high school, teachers require a lot of assistance in developing new curriculum. The student population at our school also is changing and teachers need to incorporate new instructional strategies and interventions in order to better serve these students. This past year our staff almost doubled in size and will continue to grow over the next couple of years. Many of these new teachers will require support adjusting to the school or even teaching in general. Instructional coaches help serve all of the above needs and ultimately improve student learning. Memorial High School (Spring Branch ISD) Our first area of accomplishment as a result of our involvement in the Houston A+ Challenge Regional Collaborative for High School Redesign involves the conditions we have created for our freshmen. Because of our focus on freshmen, we have established a freshman-only lunch period and a mandatory study hall for freshmen immediately after lunch. When this was first instituted, the study hall was not that popular. Now, because of the 4X4 class schedule requirements, we are allowing some freshmen to not enroll in study hall next year if they want to use the time to take fine arts classes. Surprisingly, only about 40 freshmen are doing this. The study hall has become popular and is considered an important part of the freshman transition to high school. We also have focused a great deal of energy on helping students be more successful with Algebra I. All Algebra I teachers have a common planning period. They meet weekly to discuss scope, sequence and best practices. This planning time enables them to improve as teachers, which translates to better success for their students. Additionally, their planning time is during the freshman study hall. When the teachers are not meeting, they are able to tutor their students. Before TAKS, teachers also are able to host additional TAKS practice with their weaker students during this time. Another wildly successful practice developed through participation in the Regional Collaborative is freshman report card pick-up night. Sometime after the first six weeks (usually early November), we have an open house for freshman parents only. Teachers and parents alike really enjoy this event. Teachers receive a dinner and compensation for their time. Parents appreciate the opportunity to come to school and meet with all their children’s teachers at one convenient time and location.

Making Our High Schools Work Houston A+ Challenge, June 2, 2008 Attachment 4 – Page 38
Spring Woods High School (Spring Branch ISD) Houston A+ Challenge has helped up improve our campus culture and communication by supporting our Tiger TV class. Because of this support, Tiger TV has allowed students to teach the weekly advisory lesson, hold open public forums on issues related to teens, and create and tape bus evacuation drills for the school and district. The emphasis on communication and student-driven activities has created a more collaborative environment on our campus. We also have utilized grant funds to support our parent programming by providing food at these meetings. We have conducted meetings with our Latino parents with great success. The Houston A+ Challenge grant also helped us modify our learning conditions by implementing a house model with our 9th grade students this year. From the preliminary data the results look good for us to meet our goals. The grant supported this endeavor by providing opportunities for professional development, campus visits and technical support. We have also been able to purchase advisory booklets to use during our weekly advisory classes. Teachers have improved their competencies through our partnership with Houston A+ Challenge. The primary initiatives have been around the campus visit, Ruby Payne Training and Advanced Placement training. The teachers who have attended the Winter and Summer Leadership Retreats have described not only how much they learned about other schools and what they are doing but also about new ideas to start at our school. Over the last five years we have increased the number of students taking AP classes and tests by more than 200%. When we started this grant we had 50 students taking 56 exams. This year, we had 256 students taking 510 tests. We also have trained all of our teachers in AP and Pre-AP courses during the summer. Our TAKS scores have steadily increased over the last five years. Although we are not where we would like to be in math and science, we have grown a great deal from where we started. The focus questions and feedback from the campus site visits have served as valuable benchmarks on our growth. Stratford High School (Spring Branch ISD) The primary accomplishments at Stratford High School over the past five years have been in the area of social-emotional learning. Both students and faculty have been impacted by the ideas and programs that have been implemented. As a result of involvement with the Houston A+ Challenge Regional Collaborative, students have benefited from two key programs that have created a common connection between students, faculty and staff: Spartan Time and Link Crew. Spartan Time has given Stratford the opportunity to build weekly lessons into the school day on character development, community service, safety and security, and team building. As a result, we have seen more students interested in starting and joining clubs, as more teachers involved with student groups in extracurricular activities. Community Service opportunities associated with Spartan Time groups have grown from one a year to three a year. Link

Making Our High Schools Work Houston A+ Challenge, June 2, 2008 Attachment 4 – Page 39
Crew, a freshman mentoring program, is now a part of our beginning–of-the-year Fish Camp, and more upperclassmen are applying to be mentors. Both of these programs have helped to created stronger bonds between students, teachers and the school, as shown in semester surveys and weekly feedback emails. Over the past five years, teachers have benefited from the Houston A+ Challenge grant through numerous professional development sessions focused on Professional Learning Communities (PLCs) and social-emotional learning. Teachers are expected to meet in academic teams to plan and analyze data, and teachers have initiated book studies and offered suggestions for speakers to address campus issues focusing on reaching at-risk students, diversity in learning styles and gang awareness. Because the common goal of each PLC is to meet the needs of students in order to increase academic achievement, teachers have developed common goals – team planning, intervention steps and common assessments, to name a few. In addition to growing closer to the PLC model, the professional development also has had a positive impact in the campus climate and faculty morale, as shown in survey results, attendance at faculty activities and overall school attendance rates. New leadership at Stratford has further developed many characteristics of the PLC model to work towards building positive relationships throughout the building. Taylor High School (Alief ISD) Over the past five years, Taylor High School has become an increasingly more effective Professional Learning Community. Our campus leadership team and many of our teachers have attended Houston A+ Challenge leadership trainings, seminars and professional development opportunities. On our campus, the impact of our participation in the Regional Collaborative is evident as we use our learning to guide our weekly PLC meetings at Taylor. Collaboration has become a huge component of Taylor’s commitment to student learning and achievement. The culture of the school is centered on professional collaboration, teaching and learning, and staff taking advantage of each others’ strengths. Students at Taylor have benefited from the collaborative process of their teachers. Although we are still struggling to get our TAKS math and science scores up, our students are learning at higher levels. Taylor has made significant academic gains each year it has been partnered with Houston A+ Challenge. Some of our accomplishments are:
• Stronger academic teams • Greater emphasis on professional development for teachers • One-third of our staff has attended the Capturing Kids’ Hearts
professional development • Increased emphasis on teaching & learning • Decreased drop-out rate • Increased graduation rate • Improved daily attendance • Increased senior scholarships awarded (over $3 million last year) • Safer learning environment (fighting and violence is down, significantly)

Cam
pus
Cha
n ge
2002
-03
2003
-04
2004
-05
2005
-06
2006
-07
03 to
04
04 to
05
05 to
06
06 to
07
03 to
07
All
Stu
dent
s
21.0
%33
.0%
35.0
%44
.0%
47.0
%12
.02.
09.
03.
026
.0 A
frica
n A
mer
ican
15
.0%
24.0
%22
.0%
34.0
%37
.0%
9.0
(2.0
)12
.03.
022
.0 H
ispa
nic
20
.0%
33.0
%36
.0%
45.0
%48
.0%
13.0
3.0
9.0
3.0
28.0
Whi
te
40.0
%51
.0%
51.0
%70
.0%
59.0
%11
.00.
019
.0(1
1.0)
19.0
Eco
nom
ical
ly D
isad
vant
aged
19
.0%
32.0
%34
.0%
42.0
%44
.0%
13.0
2.0
8.0
2.0
25.0
All
Stu
dent
s
58.0
%71
.0%
70.0
%82
.0%
86.0
%13
.0(1
.0)
12.0
4.0
28.0
Afri
can
Am
eric
an
55.0
%71
.0%
70.0
%81
.0%
87.0
%16
.0(1
.0)
11.0
6.0
32.0
His
pani
c
58.0
%69
.0%
69.0
%81
.0%
85.0
%11
.00.
012
.04.
027
.0 W
hite
68
.0%
85.0
%74
.0%
90.0
%89
.0%
17.0
(11.
0)16
.0(1
.0)
21.0
Eco
nom
ical
ly D
isad
vant
aged
56
.0%
69.0
%69
.0%
80.0
%84
.0%
13.0
0.0
11.0
4.0
28.0
All
Stu
dent
s
32.0
%46
.0%
52.0
%58
.0%
59.0
%14
.06.
06.
01.
027
.0 A
frica
n A
mer
ican
22
.0%
35.0
%37
.0%
48.0
%47
.0%
13.0
2.0
11.0
(1.0
)25
.0 H
ispa
nic
31
.0%
46.0
%54
.0%
60.0
%62
.0%
15.0
8.0
6.0
2.0
31.0
Whi
te
54.0
%63
.0%
73.0
%80
.0%
64.0
%9.
010
.07.
0(1
6.0)
10.0
Eco
nom
ical
ly D
isad
vant
aged
30
.0%
44.0
%50
.0%
58.0
%58
.0%
14.0
6.0
8.0
0.0
28.0
All
Stu
dent
s
68.0
%83
.0%
86.0
%87
.0%
90.0
%15
.03.
01.
03.
022
.0 A
frica
n A
mer
ican
65
.0%
83.0
%82
.0%
85.0
%87
.0%
18.0
(1.0
)3.
02.
022
.0 H
ispa
nic
67
.0%
82.0
%87
.0%
87.0
%91
.0%
15.0
5.0
0.0
4.0
24.0
Whi
te
79.0
%97
.0%
94.0
%94
.0%
98.0
%18
.0(3
.0)
0.0
4.0
19.0
Eco
nom
ical
ly D
isad
vant
aged
65
.0%
81.0
%85
.0%
85.0
%89
.0%
16.0
4.0
0.0
4.0
24.0
All
Stu
dent
s
32.0
%47
.0%
49.0
%55
.0%
58.0
%15
.02.
06.
03.
026
.0 A
frica
n A
mer
ican
25
.0%
43.0
%38
.0%
44.0
%52
.0%
18.0
(5.0
)6.
08.
027
.0 H
ispa
nic
31
.0%
45.0
%49
.0%
56.0
%59
.0%
14.0
4.0
7.0
3.0
28.0
Whi
te
51.0
%70
.0%
79.0
%81
.0%
74.0
%19
.09.
02.
0(7
.0)
23.0
Eco
nom
ical
ly D
isad
vant
aged
30
.0%
45.0
%47
.0%
52.0
%56
.0%
15.0
2.0
5.0
4.0
26.0
All
Stu
dent
s
0.9%
0.8%
1.3%
1.2%
4.2%
(0.1
)0.
5(0
.1)
3.0
3.3
Afri
can
Am
eric
an
0.9%
0.8%
1.2%
1.7%
5.6%
(0.1
)0.
40.
53.
94.
7 H
ispa
nic
0.
9%1.
0%1.
5%1.
0%3.
9%0.
10.
5(0
.5)
2.9
3.0
Whi
te
1.4%
0.0%
1.2%
1.3%
3.1%
(1.4
)1.
20.
11.
81.
7 E
cono
mic
ally
Dis
adva
ntag
ed
0.5%
0.1%
0.7%
0.6%
2.7%
(0.4
)0.
6(0
.1)
2.1
2.2
All
Stu
dent
s
94.0
%93
.8%
93.7
%92
.3%
(0.2
)(0
.1)
(1.4
)(1
.7)
Afri
can
Am
eric
an
93.0
%95
.6%
93.6
%89
.6%
2.6
(2.0
)(4
.0)
(3.4
) H
ispa
nic
95
.1%
92.6
%94
.3%
92.7
%(2
.5)
1.7
(1.6
)(2
.4)
Whi
te
88.5
%92
.5%
85.7
%95
.2%
4.0
(6.8
)9.
56.
7 E
cono
mic
ally
Dis
adva
ntag
ed
94.5
%95
.9%
93.8
%93
.1%
1.4
(2.1
)(0
.7)
(1.4
) A
frica
n A
mer
ican
27
.8%
26.5
%25
.4%
24.3
%22
.5%
(1.3
)(1
.1)
(1.1
)(1
.8)
(5.3
) H
ispa
nic
60
.6%
63.3
%65
.8%
68.1
%71
.1%
2.7
2.5
2.3
3.0
10.5
Whi
te
7.2%
6.2%
6.0%
4.9%
4.3%
(1.0
)(0
.2)
(1.1
)(0
.6)
(2.9
) E
cono
mic
ally
Dis
adva
ntag
ed
63.0
%68
.7%
70.7
%71
.6%
74.3
%5.
72.
00.
92.
711
.3To
tal N
umbe
r of S
tude
nts
2180
2203
2191
2218
2230
23(1
2)27
1250
Dat
a fr
om th
e A
cade
mic
Exc
elle
nce
Indi
cato
r Sys
tem
200
2-03
thro
ugh
2006
-07
Hou
ston
A+
Cha
lleng
e R
egio
nal C
olla
bora
tive
for H
igh
Scho
ol R
edes
ign
Perc
enta
ge P
oint
Cha
nge
All
test
s ta
ken
Stud
ent
Com
posi
tion
Aldine
Aldine High School (Joined the Collaborative in 2004-05)
Dis
tric
tSc
hool
Yea
rG
roup
Indi
cato
rC
ampu
s
TAK
S R
eadi
ng/E
LA
TAK
S M
athe
mat
ics
TAK
S So
cial
St
udie
s
TAK
S Sc
ienc
e
Ann
ual
Dro
pout
Rat
e,
gr. 7
-12
Com
plet
ion
Rat
e I,
gr. 9
-12
*Dro
pout
rate
s be
twee
n 20
03 a
nd 2
006
are
not c
ompa
rabl
e du
e to
def
initi
onal
diff
eren
ces
Making Our High Schools WorkHouston A+ Challenge, June 2, 2008 Attachment 4 -- Page 40

Cam
pus
Cha
n ge
2002
-03
2003
-04
2004
-05
2005
-06
2006
-07
03 to
04
04 to
05
05 to
06
06 to
07
03 to
07
Dat
a fr
om th
e A
cade
mic
Exc
elle
nce
Indi
cato
r Sys
tem
200
2-03
thro
ugh
2006
-07
Hou
ston
A+
Cha
lleng
e R
egio
nal C
olla
bora
tive
for H
igh
Scho
ol R
edes
ign
Perc
enta
ge P
oint
Cha
nge
Dis
tric
tSc
hool
Yea
rG
roup
Indi
cato
rC
ampu
s
All
Stu
dent
s
49.0
%55
.0%
69.0
%66
.0%
61.0
%6.
014
.0(3
.0)
(5.0
)12
.0 A
frica
n A
mer
ican
37
.0%
42.0
%55
.0%
58.0
%57
.0%
5.0
13.0
3.0
(1.0
)20
.0 H
ispa
nic
51
.0%
58.0
%72
.0%
68.0
%62
.0%
7.0
14.0
(4.0
)(6
.0)
11.0
Whi
te
72.0
%72
.0%
79.0
%65
.0%
67.0
%0.
07.
0(1
4.0)
2.0
(5.0
) E
cono
mic
ally
Dis
adva
ntag
ed
48.0
%55
.0%
67.0
%66
.0%
61.0
%7.
012
.0(1
.0)
(5.0
)13
.0 A
ll S
tude
nts
76
.0%
84.0
%89
.0%
95.0
%89
.0%
8.0
5.0
6.0
(6.0
)13
.0 A
frica
n A
mer
ican
74
.0%
81.0
%85
.0%
96.0
%87
.0%
7.0
4.0
11.0
(9.0
)13
.0 H
ispa
nic
76
.0%
84.0
%90
.0%
94.0
%90
.0%
8.0
6.0
4.0
(4.0
)14
.0 W
hite
89
.0%
92.0
%93
.0%
100.
0%94
.0%
3.0
1.0
7.0
(6.0
)5.
0 E
cono
mic
ally
Dis
adva
ntag
ed
74.0
%84
.0%
88.0
%94
.0%
89.0
%10
.04.
06.
0(5
.0)
15.0
All
Stu
dent
s
53.0
%58
.0%
72.0
%67
.0%
62.0
%5.
014
.0(5
.0)
(5.0
)9.
0 A
frica
n A
mer
ican
40
.0%
42.0
%58
.0%
59.0
%57
.0%
2.0
16.0
1.0
(2.0
)17
.0 H
ispa
nic
56
.0%
62.0
%76
.0%
69.0
%63
.0%
6.0
14.0
(7.0
)(6
.0)
7.0
Whi
te
74.0
%74
.0%
81.0
%64
.0%
72.0
%0.
07.
0(1
7.0)
8.0
(2.0
) E
cono
mic
ally
Dis
adva
ntag
ed
53.0
%57
.0%
71.0
%67
.0%
62.0
%4.
014
.0(4
.0)
(5.0
)9.
0 A
ll S
tude
nts
A
frica
n A
mer
ican
H
ispa
nic
W
hite
E
cono
mic
ally
Dis
adva
ntag
ed
All
Stu
dent
s
Afri
can
Am
eric
an
His
pani
c
Whi
te
Eco
nom
ical
ly D
isad
vant
aged
A
ll S
tude
nts
0.
1%0.
1%0.
3%0.
4%1.
5%0.
00.
20.
11.
11.
4 A
frica
n A
mer
ican
0.
0%0.
4%0.
4%0.
0%0.
9%0.
40.
0(0
.4)
0.9
0.9
His
pani
c
0.0%
0.0%
0.2%
0.6%
1.6%
0.0
0.2
0.4
1.0
1.6
Whi
te
1.4%
0.0%
1.5%
0.0%
2.3%
(1.4
)1.
5(1
.5)
2.3
0.9
Eco
nom
ical
ly D
isad
vant
aged
0.
1%0.
1%0.
3%0.
3%1.
2%0.
00.
20.
00.
91.
1 A
ll S
tude
nts
93
.0%
93.0
%92
.1%
88.2
%0.
0(0
.9)
(3.9
)(4
.8)
Afri
can
Am
eric
an
93.2
%94
.5%
93.3
%86
.5%
1.3
(1.2
)(6
.8)
(6.7
) H
ispa
nic
92
.7%
91.9
%91
.5%
88.9
%(0
.8)
(0.4
)(2
.6)
(3.8
) W
hite
93
.0%
90.3
%89
.1%
87.0
%(2
.7)
(1.2
)(2
.1)
(6.0
) E
cono
mic
ally
Dis
adva
ntag
ed
93.8
%93
.8%
92.6
%88
.8%
0.0
(1.2
)(3
.8)
(5.0
) A
frica
n A
mer
ican
27
.1%
26.2
%23
.2%
20.4
%21
.9%
(0.9
)(3
.0)
(2.8
)1.
5(5
.2)
His
pani
c
63.4
%64
.9%
71.2
%73
.4%
73.5
%1.
56.
32.
20.
110
.1 W
hite
5.
4%6.
8%3.
6%4.
6%2.
4%1.
4(3
.2)
1.0
(2.2
)(3
.0)
Eco
nom
ical
ly D
isad
vant
aged
74
.5%
73.6
%80
.3%
78.2
%83
.9%
(0.9
)6.
7(2
.1)
5.7
9.4
Tota
l Num
ber o
f Stu
dent
s90
290
189
389
887
6(1
)(8
)5
(22)
(26)
Nin
th G
rade
Stu
dent
s do
not
take
TA
KS
Soci
al S
tudi
es a
nd S
cien
ce te
sts
Aldine
Aldine Ninth Grade School (Joined the Collaborative in 2006-07)
TAK
S M
athe
mat
ics
TAK
S So
cial
St
udie
s
TAK
S Sc
ienc
e
Ann
ual
Dro
pout
Rat
e,
gr. 7
-12
Com
plet
ion
Rat
e I,
gr. 9
-12
Stud
ent
Com
posi
tion
All
test
s ta
ken
TAK
S R
eadi
ng/E
LA
*Dro
pout
rate
s be
twee
n 20
03 a
nd 2
006
are
not c
ompa
rabl
e du
e to
def
initi
onal
diff
eren
ces
Making Our High Schools WorkHouston A+ Challenge, June 2, 2008 Attachment 4 -- Page 41

Cam
pus
Cha
n ge
2002
-03
2003
-04
2004
-05
2005
-06
2006
-07
03 to
04
04 to
05
05 to
06
06 to
07
03 to
07
Dat
a fr
om th
e A
cade
mic
Exc
elle
nce
Indi
cato
r Sys
tem
200
2-03
thro
ugh
2006
-07
Hou
ston
A+
Cha
lleng
e R
egio
nal C
olla
bora
tive
for H
igh
Scho
ol R
edes
ign
Perc
enta
ge P
oint
Cha
nge
Dis
tric
tSc
hool
Yea
rG
roup
Indi
cato
rC
ampu
s
All
Stu
dent
s
28.0
%34
.0%
38.0
%43
.0%
46.0
%6.
04.
05.
03.
018
.0 A
frica
n A
mer
ican
23
.0%
28.0
%33
.0%
37.0
%40
.0%
5.0
5.0
4.0
3.0
17.0
His
pani
c
20.0
%26
.0%
32.0
%38
.0%
42.0
%6.
06.
06.
04.
022
.0 W
hite
48
.0%
56.0
%56
.0%
60.0
%72
.0%
8.0
0.0
4.0
12.0
24.0
Eco
nom
ical
ly D
isad
vant
aged
23
.0%
28.0
%33
.0%
38.0
%42
.0%
5.0
5.0
5.0
4.0
19.0
All
Stu
dent
s
63.0
%68
.0%
69.0
%83
.0%
78.0
%5.
01.
014
.0(5
.0)
15.0
Afri
can
Am
eric
an
64.0
%69
.0%
67.0
%85
.0%
79.0
%5.
0(2
.0)
18.0
(6.0
)15
.0 H
ispa
nic
55
.0%
63.0
%66
.0%
78.0
%76
.0%
8.0
3.0
12.0
(2.0
)21
.0 W
hite
76
.0%
83.0
%76
.0%
92.0
%93
.0%
7.0
(7.0
)16
.01.
017
.0 E
cono
mic
ally
Dis
adva
ntag
ed
58.0
%64
.0%
66.0
%80
.0%
77.0
%6.
02.
014
.0(3
.0)
19.0
All
Stu
dent
s
38.0
%43
.0%
50.0
%50
.0%
54.0
%5.
07.
00.
04.
016
.0 A
frica
n A
mer
ican
29
.0%
34.0
%43
.0%
43.0
%46
.0%
5.0
9.0
0.0
3.0
17.0
His
pani
c
29.0
%35
.0%
43.0
%45
.0%
50.0
%6.
08.
02.
05.
021
.0 W
hite
57
.0%
64.0
%74
.0%
64.0
%76
.0%
7.0
10.0
(10.
0)12
.019
.0 E
cono
mic
ally
Dis
adva
ntag
ed
33.0
%37
.0%
45.0
%45
.0%
51.0
%4.
08.
00.
06.
018
.0 A
ll S
tude
nts
75
.0%
85.0
%87
.0%
87.0
%87
.0%
10.0
2.0
0.0
0.0
12.0
Afri
can
Am
eric
an
77.0
%86
.0%
85.0
%86
.0%
87.0
%9.
0(1
.0)
1.0
1.0
10.0
His
pani
c
65.0
%79
.0%
85.0
%84
.0%
84.0
%14
.06.
0(1
.0)
0.0
19.0
Whi
te
92.0
%92
.0%
94.0
%95
.0%
99.0
%0.
02.
01.
04.
07.
0 E
cono
mic
ally
Dis
adva
ntag
ed
73.0
%82
.0%
84.0
%86
.0%
86.0
%9.
02.
02.
00.
013
.0 A
ll S
tude
nts
35
.0%
45.0
%51
.0%
54.0
%57
.0%
10.0
6.0
3.0
3.0
22.0
Afri
can
Am
eric
an
30.0
%39
.0%
44.0
%49
.0%
52.0
%9.
05.
05.
03.
022
.0 H
ispa
nic
24
.0%
37.0
%46
.0%
47.0
%49
.0%
13.0
9.0
1.0
2.0
25.0
Whi
te
62.0
%73
.0%
72.0
%77
.0%
88.0
%11
.0(1
.0)
5.0
11.0
26.0
Eco
nom
ical
ly D
isad
vant
aged
30
.0%
40.0
%47
.0%
49.0
%52
.0%
10.0
7.0
2.0
3.0
22.0
All
Stu
dent
s
2.9%
1.5%
2.9%
3.4%
5.5%
(1.4
)1.
40.
52.
12.
6 A
frica
n A
mer
ican
2.
1%1.
0%2.
5%3.
1%6.
0%(1
.1)
1.5
0.6
2.9
3.9
His
pani
c
4.2%
2.2%
4.0%
4.2%
5.8%
(2.0
)1.
80.
21.
61.
6 W
hite
1.
6%1.
1%2.
2%1.
9%3.
2%(0
.5)
1.1
(0.3
)1.
31.
6 E
cono
mic
ally
Dis
adva
ntag
ed
2.4%
1.1%
2.4%
2.3%
5.3%
(1.3
)1.
3(0
.1)
3.0
2.9
All
Stu
dent
s
90.8
%86
.9%
84.8
%83
.0%
(3.9
)(2
.1)
(1.8
)(7
.8)
Afri
can
Am
eric
an
92.6
%89
.0%
86.1
%83
.9%
(3.6
)(2
.9)
(2.2
)(8
.7)
His
pani
c
88.0
%80
.4%
80.1
%78
.8%
(7.6
)(0
.3)
(1.3
)(9
.2)
Whi
te
91.5
%93
.3%
84.8
%94
.0%
1.8
(8.5
)9.
22.
5 E
cono
mic
ally
Dis
adva
ntag
ed
90.1
%86
.0%
86.6
%82
.1%
(4.1
)0.
6(4
.5)
(8.0
) A
frica
n A
mer
ican
35
.7%
35.7
%37
.3%
39.4
%37
.9%
0.0
1.6
2.1
(1.5
)2.
2 H
ispa
nic
37
.9%
40.5
%41
.1%
41.0
%44
.7%
2.6
0.6
(0.1
)3.
76.
8 W
hite
10
.1%
8.3%
7.0%
6.1%
5.2%
(1.8
)(1
.3)
(0.9
)(0
.9)
(4.9
) E
cono
mic
ally
Dis
adva
ntag
ed
34.1
%38
.6%
48.1
%52
.9%
54.5
%4.
59.
54.
81.
620
.4To
tal N
umbe
r of S
tude
nts
4077
4068
4238
4487
4228
(9)
170
249
(259
)15
1
Com
plet
ion
Rat
e I,
gr. 9
-12
Hastings High School (Includes scores from Hastings Ninth Grade Center)
Alief
All
test
s ta
ken
TAK
S R
eadi
ng/E
LA
TAK
S M
athe
mat
ics
TAK
S So
cial
St
udie
s
TAK
S Sc
ienc
e
Ann
ual
Dro
pout
Rat
e,
gr. 7
-12
Stud
ent
Com
posi
tion
*Dro
pout
rate
s be
twee
n 20
03 a
nd 2
006
are
not c
ompa
rabl
e du
e to
def
initi
onal
diff
eren
ces
Making Our High Schools WorkHouston A+ Challenge, June 2, 2008 Attachment 4 -- Page 42

Cam
pus
Cha
n ge
2002
-03
2003
-04
2004
-05
2005
-06
2006
-07
03 to
04
04 to
05
05 to
06
06 to
07
03 to
07
Dat
a fr
om th
e A
cade
mic
Exc
elle
nce
Indi
cato
r Sys
tem
200
2-03
thro
ugh
2006
-07
Hou
ston
A+
Cha
lleng
e R
egio
nal C
olla
bora
tive
for H
igh
Scho
ol R
edes
ign
Perc
enta
ge P
oint
Cha
nge
Dis
tric
tSc
hool
Yea
rG
roup
Indi
cato
rC
ampu
s
All
Stu
dent
s
26.0
%28
.0%
32.0
%40
.0%
41.0
%2.
04.
08.
01.
015
.0 A
frica
n A
mer
ican
22
.0%
23.0
%27
.0%
36.0
%41
.0%
1.0
4.0
9.0
5.0
19.0
His
pani
c
19.0
%21
.0%
27.0
%35
.0%
36.0
%2.
06.
08.
01.
017
.0 W
hite
47
.0%
49.0
%46
.0%
57.0
%65
.0%
2.0
(3.0
)11
.08.
018
.0 E
cono
mic
ally
Dis
adva
ntag
ed
23.0
%24
.0%
28.0
%36
.0%
39.0
%1.
04.
08.
03.
016
.0 A
ll S
tude
nts
61
.0%
65.0
%66
.0%
80.0
%78
.0%
4.0
1.0
14.0
(2.0
)17
.0 A
frica
n A
mer
ican
64
.0%
68.0
%70
.0%
83.0
%82
.0%
4.0
2.0
13.0
(1.0
)18
.0 H
ispa
nic
54
.0%
58.0
%61
.0%
76.0
%74
.0%
4.0
3.0
15.0
(2.0
)20
.0 W
hite
75
.0%
79.0
%73
.0%
84.0
%90
.0%
4.0
(6.0
)11
.06.
015
.0 E
cono
mic
ally
Dis
adva
ntag
ed
58.0
%61
.0%
64.0
%78
.0%
77.0
%3.
03.
014
.0(1
.0)
19.0
All
Stu
dent
s
34.0
%36
.0%
43.0
%46
.0%
50.0
%2.
07.
03.
04.
016
.0 A
frica
n A
mer
ican
27
.0%
28.0
%34
.0%
41.0
%46
.0%
1.0
6.0
7.0
5.0
19.0
His
pani
c
26.0
%31
.0%
39.0
%41
.0%
45.0
%5.
08.
02.
04.
019
.0 W
hite
54
.0%
53.0
%64
.0%
64.0
%70
.0%
(1.0
)11
.00.
06.
016
.0 E
cono
mic
ally
Dis
adva
ntag
ed
31.0
%32
.0%
39.0
%43
.0%
47.0
%1.
07.
04.
04.
016
.0 A
ll S
tude
nts
71
.0%
80.0
%84
.0%
87.0
%86
.0%
9.0
4.0
3.0
(1.0
)15
.0 A
frica
n A
mer
ican
75
.0%
81.0
%87
.0%
89.0
%87
.0%
6.0
6.0
2.0
(2.0
)12
.0 H
ispa
nic
63
.0%
75.0
%80
.0%
82.0
%84
.0%
12.0
5.0
2.0
2.0
21.0
Whi
te
84.0
%90
.0%
93.0
%93
.0%
96.0
%6.
03.
00.
03.
012
.0 E
cono
mic
ally
Dis
adva
ntag
ed
68.0
%77
.0%
81.0
%85
.0%
85.0
%9.
04.
04.
00.
017
.0 A
ll S
tude
nts
35
.0%
41.0
%45
.0%
52.0
%52
.0%
6.0
4.0
7.0
0.0
17.0
Afri
can
Am
eric
an
29.0
%37
.0%
41.0
%51
.0%
50.0
%8.
04.
010
.0(1
.0)
21.0
His
pani
c
27.0
%33
.0%
37.0
%45
.0%
46.0
%6.
04.
08.
01.
019
.0 W
hite
60
.0%
65.0
%66
.0%
68.0
%78
.0%
5.0
1.0
2.0
10.0
18.0
Eco
nom
ical
ly D
isad
vant
aged
31
.0%
35.0
%41
.0%
47.0
%50
.0%
4.0
6.0
6.0
3.0
19.0
All
Stu
dent
s
2.1%
2.8%
3.0%
3.9%
6.6%
0.7
0.2
0.9
2.7
4.5
Afri
can
Am
eric
an
1.3%
1.9%
2.5%
3.2%
6.3%
0.6
0.6
0.7
3.1
5.0
His
pani
c
3.4%
3.5%
3.7%
5.0%
7.9%
0.1
0.2
1.3
2.9
4.5
Whi
te
1.8%
2.9%
2.3%
3.6%
5.6%
1.1
(0.6
)1.
32.
03.
8 E
cono
mic
ally
Dis
adva
ntag
ed
1.4%
2.5%
2.1%
3.4%
5.8%
1.1
(0.4
)1.
32.
44.
4 A
ll S
tude
nts
89
.4%
85.9
%84
.9%
78.6
%(3
.5)
(1.0
)(6
.3)
(10.
8) A
frica
n A
mer
ican
92
.0%
89.7
%88
.2%
76.1
%(2
.3)
(1.5
)(1
2.1)
(15.
9) H
ispa
nic
83
.9%
80.7
%81
.5%
76.5
%(3
.2)
0.8
(5.0
)(7
.4)
Whi
te
89.9
%90
.5%
75.0
%82
.5%
0.6
(15.
5)7.
5(7
.4)
Eco
nom
ical
ly D
isad
vant
aged
90
.5%
84.9
%87
.1%
77.0
%(5
.6)
2.2
(10.
1)(1
3.5)
Afri
can
Am
eric
an
36.4
%37
.2%
38.1
%41
.2%
40.5
%0.
80.
93.
1(0
.7)
4.1
His
pani
c
41.0
%42
.7%
42.9
%41
.1%
43.7
%1.
70.
2(1
.8)
2.6
2.7
Whi
te
7.3%
6.5%
6.2%
5.3%
4.3%
(0.8
)(0
.3)
(0.9
)(1
.0)
(3.0
) E
cono
mic
ally
Dis
adva
ntag
ed
37.8
%40
.7%
48.8
%51
.4%
52.5
%2.
98.
12.
61.
114
.7To
tal N
umbe
r of S
tude
nts
4239
4079
4216
4469
4312
(160
)13
725
3(1
57)
73
Alief
All
test
s ta
ken
TAK
S R
eadi
ng/E
LA
TAK
S M
athe
mat
ics
TAK
S So
cial
St
udie
s
TAK
S Sc
ienc
e
Ann
ual
Dro
pout
Rat
e,
gr. 7
-12
Com
plet
ion
Rat
e I,
gr. 9
-12
Elsik High School (Includes scores from Elsik Ninth Grade Center)
Stud
ent
Com
posi
tion
*Dro
pout
rate
s be
twee
n 20
03 a
nd 2
006
are
not c
ompa
rabl
e du
e to
def
initi
onal
diff
eren
ces
Making Our High Schools WorkHouston A+ Challenge, June 2, 2008 Attachment 4 -- Page 43

Cam
pus
Cha
n ge
2002
-03
2003
-04
2004
-05
2005
-06
2006
-07
03 to
04
04 to
05
05 to
06
06 to
07
03 to
07
Dat
a fr
om th
e A
cade
mic
Exc
elle
nce
Indi
cato
r Sys
tem
200
2-03
thro
ugh
2006
-07
Hou
ston
A+
Cha
lleng
e R
egio
nal C
olla
bora
tive
for H
igh
Scho
ol R
edes
ign
Perc
enta
ge P
oint
Cha
nge
Dis
tric
tSc
hool
Yea
rG
roup
Indi
cato
rC
ampu
s
All
Stu
dent
s
26.0
%32
.0%
35.0
%41
.0%
42.0
%6.
03.
06.
01.
016
.0 A
frica
n A
mer
ican
19
.0%
27.0
%31
.0%
36.0
%37
.0%
8.0
4.0
5.0
1.0
18.0
His
pani
c
19.0
%21
.0%
25.0
%32
.0%
36.0
%2.
04.
07.
04.
017
.0 W
hite
44
.0%
54.0
%58
.0%
57.0
%62
.0%
10.0
4.0
(1.0
)5.
018
.0 E
cono
mic
ally
Dis
adva
ntag
ed
21.0
%26
.0%
29.0
%37
.0%
38.0
%5.
03.
08.
01.
017
.0 A
ll S
tude
nts
62
.0%
71.0
%69
.0%
83.0
%76
.0%
9.0
(2.0
)14
.0(7
.0)
14.0
Afri
can
Am
eric
an
61.0
%76
.0%
72.0
%88
.0%
80.0
%15
.0(4
.0)
16.0
(8.0
)19
.0 H
ispa
nic
55
.0%
59.0
%61
.0%
76.0
%69
.0%
4.0
2.0
15.0
(7.0
)14
.0 W
hite
71
.0%
81.0
%79
.0%
92.0
%85
.0%
10.0
(2.0
)13
.0(7
.0)
14.0
Eco
nom
ical
ly D
isad
vant
aged
58
.0%
66.0
%64
.0%
81.0
%73
.0%
8.0
(2.0
)17
.0(8
.0)
15.0
All
Stu
dent
s
37.0
%41
.0%
46.0
%47
.0%
49.0
%4.
05.
01.
02.
012
.0 A
frica
n A
mer
ican
27
.0%
35.0
%40
.0%
43.0
%43
.0%
8.0
5.0
3.0
0.0
16.0
His
pani
c
28.0
%28
.0%
35.0
%38
.0%
41.0
%0.
07.
03.
03.
013
.0 W
hite
56
.0%
64.0
%69
.0%
66.0
%72
.0%
8.0
5.0
(3.0
)6.
016
.0 E
cono
mic
ally
Dis
adva
ntag
ed
31.0
%34
.0%
40.0
%43
.0%
46.0
%3.
06.
03.
03.
015
.0 A
ll S
tude
nts
77
.0%
81.0
%85
.0%
83.0
%86
.0%
4.0
4.0
(2.0
)3.
09.
0 A
frica
n A
mer
ican
76
.0%
82.0
%87
.0%
84.0
%86
.0%
6.0
5.0
(3.0
)2.
010
.0 H
ispa
nic
70
.0%
71.0
%77
.0%
79.0
%82
.0%
1.0
6.0
2.0
3.0
12.0
Whi
te
85.0
%90
.0%
98.0
%91
.0%
95.0
%5.
08.
0(7
.0)
4.0
10.0
Eco
nom
ical
ly D
isad
vant
aged
72
.0%
78.0
%81
.0%
82.0
%84
.0%
6.0
3.0
1.0
2.0
12.0
All
Stu
dent
s
37.0
%46
.0%
49.0
%52
.0%
52.0
%9.
03.
03.
00.
015
.0 A
frica
n A
mer
ican
31
.0%
39.0
%45
.0%
48.0
%47
.0%
8.0
6.0
3.0
(1.0
)16
.0 H
ispa
nic
29
.0%
34.0
%36
.0%
42.0
%43
.0%
5.0
2.0
6.0
1.0
14.0
Whi
te
53.0
%71
.0%
69.0
%71
.0%
72.0
%18
.0(2
.0)
2.0
1.0
19.0
Eco
nom
ical
ly D
isad
vant
aged
32
.0%
40.0
%41
.0%
49.0
%48
.0%
8.0
1.0
8.0
(1.0
)16
.0 A
ll S
tude
nts
0.
4%1.
5%2.
2%3.
1%5.
2%1.
10.
70.
92.
14.
8 A
frica
n A
mer
ican
0.
3%0.
7%1.
0%2.
2%3.
6%0.
40.
31.
21.
43.
3 H
ispa
nic
0.
9%3.
0%3.
7%4.
8%8.
0%2.
10.
71.
13.
27.
1 W
hite
0.
0%1.
1%2.
6%1.
1%3.
6%1.
11.
5(1
.5)
2.5
3.6
Eco
nom
ical
ly D
isad
vant
aged
0.
5%1.
6%2.
2%2.
5%4.
9%1.
10.
60.
32.
44.
4 A
ll S
tude
nts
90
.5%
89.1
%86
.9%
82.4
%(1
.4)
(2.2
)(4
.5)
(8.1
) A
frica
n A
mer
ican
92
.5%
91.2
%89
.5%
87.0
%(1
.3)
(1.7
)(2
.5)
(5.5
) H
ispa
nic
86
.3%
83.6
%81
.8%
72.0
%(2
.7)
(1.8
)(9
.8)
(14.
3) W
hite
91
.6%
93.6
%86
.7%
93.5
%2.
0(6
.9)
6.8
1.9
Eco
nom
ical
ly D
isad
vant
aged
90
.8%
87.2
%88
.1%
78.0
%(3
.6)
0.9
(10.
1)(1
2.8)
Afri
can
Am
eric
an
40.1
%40
.2%
40.1
%42
.3%
43.3
%0.
1(0
.1)
2.2
1.0
3.2
His
pani
c
36.0
%36
.1%
37.4
%38
.0%
39.6
%0.
11.
30.
61.
63.
6 W
hite
10
.4%
9.9%
9.0%
7.6%
5.6%
(0.5
)(0
.9)
(1.4
)(2
.0)
(4.8
) E
cono
mic
ally
Dis
adva
ntag
ed
32.6
%37
.1%
45.4
%48
.5%
50.6
%4.
58.
33.
12.
118
.0To
tal N
umbe
r of S
tude
nts
2387
2933
2781
2724
2745
546
(152
)(5
7)21
358
Com
plet
ion
Rat
e I,
gr. 9
-12
Alief
Taylor High School
Stud
ent
Com
posi
tion
All
test
s ta
ken
TAK
S R
eadi
ng/E
LA
TAK
S M
athe
mat
ics
TAK
S So
cial
St
udie
s
TAK
S Sc
ienc
e
Ann
ual
Dro
pout
Rat
e,
gr. 7
-12
*Dro
pout
rate
s be
twee
n 20
03 a
nd 2
006
are
not c
ompa
rabl
e du
e to
def
initi
onal
diff
eren
ces
Making Our High Schools WorkHouston A+ Challenge, June 2, 2008 Attachment 4 -- Page 44

Cam
pus
Cha
n ge
2002
-03
2003
-04
2004
-05
2005
-06
2006
-07
03 to
04
04 to
05
05 to
06
06 to
07
03 to
07
Dat
a fr
om th
e A
cade
mic
Exc
elle
nce
Indi
cato
r Sys
tem
200
2-03
thro
ugh
2006
-07
Hou
ston
A+
Cha
lleng
e R
egio
nal C
olla
bora
tive
for H
igh
Scho
ol R
edes
ign
Perc
enta
ge P
oint
Cha
nge
Dis
tric
tSc
hool
Yea
rG
roup
Indi
cato
rC
ampu
s
All
Stu
dent
s
62.0
%64
.0%
71.0
%84
.0%
85.0
%2.
07.
013
.01.
023
.0 A
frica
n A
mer
ican
56
.0%
57.0
%57
.0%
80.0
%84
.0%
1.0
0.0
23.0
4.0
28.0
His
pani
c
50.0
%52
.0%
61.0
%73
.0%
77.0
%2.
09.
012
.04.
027
.0 W
hite
69
.0%
74.0
%80
.0%
90.0
%88
.0%
5.0
6.0
10.0
(2.0
)19
.0 E
cono
mic
ally
Dis
adva
ntag
ed
56.0
%57
.0%
64.0
%78
.0%
81.0
%1.
07.
014
.03.
025
.0 A
ll S
tude
nts
87
.0%
89.0
%89
.0%
99.0
%98
.0%
2.0
0.0
10.0
(1.0
)11
.0 A
frica
n A
mer
ican
91
.0%
90.0
%89
.0%
99.0
%98
.0%
(1.0
)(1
.0)
10.0
(1.0
)7.
0 H
ispa
nic
84
.0%
86.0
%87
.0%
99.0
%97
.0%
2.0
1.0
12.0
(2.0
)13
.0 W
hite
90
.0%
93.0
%93
.0%
99.0
%97
.0%
3.0
0.0
6.0
(2.0
)7.
0 E
cono
mic
ally
Dis
adva
ntag
ed
80.0
%85
.0%
88.0
%99
.0%
98.0
%5.
03.
011
.0(1
.0)
18.0
All
Stu
dent
s
70.0
%75
.0%
82.0
%89
.0%
91.0
%5.
07.
07.
02.
021
.0 A
frica
n A
mer
ican
64
.0%
64.0
%74
.0%
81.0
%89
.0%
0.0
10.0
7.0
8.0
25.0
His
pani
c
58.0
%65
.0%
71.0
%85
.0%
84.0
%7.
06.
014
.0(1
.0)
26.0
Whi
te
75.0
%82
.0%
90.0
%91
.0%
94.0
%7.
08.
01.
03.
019
.0 E
cono
mic
ally
Dis
adva
ntag
ed
64.0
%67
.0%
77.0
%85
.0%
86.0
%3.
010
.08.
01.
022
.0 A
ll S
tude
nts
94
.0%
97.0
%97
.0%
99.0
%99
.0%
3.0
0.0
2.0
0.0
5.0
Afri
can
Am
eric
an
93.0
%99
.0%
99.0
%(9
3.0)
99.0
(99.
0)99
.06.
0 H
ispa
nic
91
.0%
94.0
%96
.0%
99.0
%3.
02.
0(9
6.0)
99.0
8.0
Whi
te
98.0
%98
.0%
96.0
%99
.0%
0.0
(2.0
)(9
6.0)
99.0
1.0
Eco
nom
ical
ly D
isad
vant
aged
93
.0%
96.0
%97
.0%
98.0
%3.
01.
0(9
7.0)
98.0
5.0
All
Stu
dent
s
72.0
%74
.0%
76.0
%86
.0%
87.0
%2.
02.
010
.01.
015
.0 A
frica
n A
mer
ican
60
.0%
77.0
%71
.0%
91.0
%84
.0%
17.0
(6.0
)20
.0(7
.0)
24.0
His
pani
c
60.0
%66
.0%
59.0
%71
.0%
81.0
%6.
0(7
.0)
12.0
10.0
21.0
Whi
te
85.0
%88
.0%
84.0
%96
.0%
87.0
%3.
0(4
.0)
12.0
(9.0
)2.
0 E
cono
mic
ally
Dis
adva
ntag
ed
66.0
%69
.0%
66.0
%80
.0%
82.0
%3.
0(3
.0)
14.0
2.0
16.0
All
Stu
dent
s
0.3%
0.7%
0.0%
0.1%
40.0
%0.
4(0
.7)
0.1
39.9
39.7
Afri
can
Am
eric
an
0.0%
0.0%
0.0%
0.0%
80.0
%0.
00.
00.
080
.080
.0 H
ispa
nic
0.
8%0.
6%0.
0%0.
0%60
.0%
(0.2
)(0
.6)
0.0
60.0
59.2
Whi
te
0.6%
1.1%
0.0%
0.0%
0.0%
0.5
(1.1
)0.
00.
0(0
.6)
Eco
nom
ical
ly D
isad
vant
aged
0.
0%0.
5%0.
0%0.
0%0.
0%0.
5(0
.5)
0.0
0.0
0.0
All
Stu
dent
s
97.4
%98
.6%
97.5
%98
.6%
1.2
(1.1
)1.
11.
2 A
frica
n A
mer
ican
10
0.0%
100.
0%94
.7%
95.2
%0.
0(5
.3)
0.5
(4.8
) H
ispa
nic
10
0.0%
100.
0%10
0.0%
96.8
%0.
00.
0(3
.2)
(3.2
) W
hite
94
.7%
96.7
%96
.4%
100.
0%2.
0(0
.3)
3.6
5.3
Eco
nom
ical
ly D
isad
vant
aged
10
0.0%
100.
0%10
0.0%
100.
0%0.
00.
00.
00.
0 A
frica
n A
mer
ican
14
.2%
13.9
%13
.7%
15.4
%15
.7%
(0.3
)(0
.2)
1.7
0.3
1.5
His
pani
c
22.4
%21
.5%
24.4
%22
.8%
21.1
%(0
.9)
2.9
(1.6
)(1
.7)
(1.3
) W
hite
24
.4%
18.7
%15
.4%
13.7
%13
.6%
(5.7
)(3
.3)
(1.7
)(0
.1)
(10.
8) E
cono
mic
ally
Dis
adva
ntag
ed
25.4
%26
.3%
31.5
%34
.4%
35.0
%0.
95.
22.
90.
69.
6To
tal N
umbe
r of S
tude
nts
713
729
745
768
762
1616
23(6
)49
Alief
All
test
s ta
ken
Ann
ual
Dro
pout
Rat
e,
gr. 7
-12
Com
plet
ion
Rat
e I,
gr. 9
-12
Kerr High School (Joined the Collaborative in 2007-08)
TAK
S R
eadi
ng/E
LA
TAK
S M
athe
mat
ics
TAK
S So
cial
St
udie
s
TAK
S Sc
ienc
e
Stud
ent
Com
posi
tion
*Dro
pout
rate
s be
twee
n 20
03 a
nd 2
006
are
not c
ompa
rabl
e du
e to
def
initi
onal
diff
eren
ces
Making Our High Schools WorkHouston A+ Challenge, June 2, 2008 Attachment 4 -- Page 45

Cam
pus
Cha
n ge
2002
-03
2003
-04
2004
-05
2005
-06
2006
-07
03 to
04
04 to
05
05 to
06
06 to
07
03 to
07
Dat
a fr
om th
e A
cade
mic
Exc
elle
nce
Indi
cato
r Sys
tem
200
2-03
thro
ugh
2006
-07
Hou
ston
A+
Cha
lleng
e R
egio
nal C
olla
bora
tive
for H
igh
Scho
ol R
edes
ign
Perc
enta
ge P
oint
Cha
nge
Dis
tric
tSc
hool
Yea
rG
roup
Indi
cato
rC
ampu
s
All
Stu
dent
s
38.0
%46
.0%
44.0
%56
.0%
43.0
%8.
0(2
.0)
12.0
(13.
0)5.
0 A
frica
n A
mer
ican
23
.0%
29.0
%30
.0%
42.0
%36
.0%
6.0
1.0
12.0
(6.0
)13
.0 H
ispa
nic
23
.0%
33.0
%34
.0%
44.0
%38
.0%
10.0
1.0
10.0
(6.0
)15
.0 W
hite
47
.0%
57.0
%54
.0%
69.0
%59
.0%
10.0
(3.0
)15
.0(1
0.0)
12.0
Eco
nom
ical
ly D
isad
vant
aged
19
.0%
28.0
%28
.0%
37.0
%35
.0%
9.0
0.0
9.0
(2.0
)16
.0 A
ll S
tude
nts
70
.0%
77.0
%70
.0%
87.0
%84
.0%
7.0
(7.0
)17
.0(3
.0)
14.0
Afri
can
Am
eric
an
62.0
%69
.0%
64.0
%84
.0%
85.0
%7.
0(5
.0)
20.0
1.0
23.0
His
pani
c
54.0
%64
.0%
62.0
%81
.0%
78.0
%10
.0(2
.0)
19.0
(3.0
)24
.0 W
hite
79
.0%
84.0
%75
.0%
91.0
%92
.0%
5.0
(9.0
)16
.01.
013
.0 E
cono
mic
ally
Dis
adva
ntag
ed
49.0
%64
.0%
58.0
%78
.0%
78.0
%15
.0(6
.0)
20.0
0.0
29.0
All
Stu
dent
s
47.0
%54
.0%
58.0
%62
.0%
50.0
%7.
04.
04.
0(1
2.0)
3.0
Afri
can
Am
eric
an
32.0
%36
.0%
40.0
%49
.0%
45.0
%4.
04.
09.
0(4
.0)
13.0
His
pani
c
34.0
%42
.0%
48.0
%51
.0%
45.0
%8.
06.
03.
0(6
.0)
11.0
Whi
te
57.0
%65
.0%
70.0
%75
.0%
63.0
%8.
05.
05.
0(1
2.0)
6.0
Eco
nom
ical
ly D
isad
vant
aged
28
.0%
34.0
%40
.0%
45.0
%42
.0%
6.0
6.0
5.0
(3.0
)14
.0 A
ll S
tude
nts
81
.0%
86.0
%87
.0%
88.0
%87
.0%
5.0
1.0
1.0
(1.0
)6.
0 A
frica
n A
mer
ican
74
.0%
82.0
%78
.0%
85.0
%87
.0%
8.0
(4.0
)7.
02.
013
.0 H
ispa
nic
68
.0%
74.0
%80
.0%
79.0
%82
.0%
6.0
6.0
(1.0
)3.
014
.0 W
hite
88
.0%
91.0
%93
.0%
93.0
%93
.0%
3.0
2.0
0.0
0.0
5.0
Eco
nom
ical
ly D
isad
vant
aged
62
.0%
71.0
%75
.0%
78.0
%83
.0%
9.0
4.0
3.0
5.0
21.0
All
Stu
dent
s
49.0
%56
.0%
60.0
%66
.0%
50.0
%7.
04.
06.
0(1
6.0)
1.0
Afri
can
Am
eric
an
32.0
%36
.0%
43.0
%51
.0%
41.0
%4.
07.
08.
0(1
0.0)
9.0
His
pani
c
34.0
%38
.0%
45.0
%51
.0%
46.0
%4.
07.
06.
0(5
.0)
12.0
Whi
te
60.0
%69
.0%
73.0
%82
.0%
68.0
%9.
04.
09.
0(1
4.0)
8.0
Eco
nom
ical
ly D
isad
vant
aged
31
.0%
36.0
%39
.0%
47.0
%42
.0%
5.0
3.0
8.0
(5.0
)11
.0 A
ll S
tude
nts
0.
2%1.
0%1.
0%0.
7%5.
1%0.
80.
0(0
.3)
4.4
4.9
Afri
can
Am
eric
an
0.0%
1.0%
0.4%
0.6%
5.0%
1.0
(0.6
)0.
24.
45.
0 H
ispa
nic
0.
4%1.
0%1.
8%0.
9%7.
4%0.
60.
8(0
.9)
6.5
7.0
Whi
te
0.2%
0.8%
1.0%
0.6%
3.5%
0.6
0.2
(0.4
)2.
93.
3 E
cono
mic
ally
Dis
adva
ntag
ed
0.0%
1.6%
1.2%
0.7%
6.1%
1.6
(0.4
)(0
.5)
5.4
6.1
All
Stu
dent
s
94.7
%92
.8%
92.5
%84
.5%
(1.9
)(0
.3)
(8.0
)(1
0.2)
Afri
can
Am
eric
an
97.0
%96
.3%
94.9
%80
.6%
(0.7
)(1
.4)
(14.
3)(1
6.4)
His
pani
c
93.2
%91
.4%
91.7
%80
.1%
(1.8
)0.
3(1
1.6)
(13.
1) W
hite
95
.0%
91.6
%92
.3%
88.6
%(3
.4)
0.7
(3.7
)(6
.4)
Eco
nom
ical
ly D
isad
vant
aged
89
.9%
87.4
%90
.7%
79.2
%(2
.5)
3.3
(11.
5)(1
0.7)
Afri
can
Am
eric
an
19.4
%21
.5%
23.5
%27
.0%
32.1
%2.
12.
03.
55.
112
.7 H
ispa
nic
20
.7%
22.3
%23
.8%
25.5
%34
.0%
1.6
1.5
1.7
8.5
13.3
Whi
te
55.9
%52
.6%
49.4
%44
.0%
30.6
%(3
.3)
(3.2
)(5
.4)
(13.
4)(2
5.3)
Eco
nom
ical
ly D
isad
vant
aged
22
.7%
23.7
%25
.4%
30.3
%39
.2%
1.0
1.7
4.9
8.9
16.5
Tota
l Num
ber o
f Stu
dent
s38
0940
9342
9445
3327
6228
420
123
9(1
771)
(104
7)
Humble
Humble High SchoolA
ll te
sts
take
n
TAK
S R
eadi
ng/E
LA
TAK
S M
athe
mat
ics
TAK
S So
cial
St
udie
s
TAK
S Sc
ienc
e
Ann
ual
Dro
pout
Rat
e,
gr. 7
-12
Com
plet
ion
Rat
e I,
gr. 9
-12
Stud
ent
Com
posi
tion
*Dro
pout
rate
s be
twee
n 20
03 a
nd 2
006
are
not c
ompa
rabl
e du
e to
def
initi
onal
diff
eren
ces
Making Our High Schools WorkHouston A+ Challenge, June 2, 2008 Attachment 4 -- Page 46

Cam
pus
Cha
n ge
2002
-03
2003
-04
2004
-05
2005
-06
2006
-07
03 to
04
04 to
05
05 to
06
06 to
07
03 to
07
Dat
a fr
om th
e A
cade
mic
Exc
elle
nce
Indi
cato
r Sys
tem
200
2-03
thro
ugh
2006
-07
Hou
ston
A+
Cha
lleng
e R
egio
nal C
olla
bora
tive
for H
igh
Scho
ol R
edes
ign
Perc
enta
ge P
oint
Cha
nge
Dis
tric
tSc
hool
Yea
rG
roup
Indi
cato
rC
ampu
s
All
Stu
dent
s
64.0
%75
.0%
80.0
%84
.0%
86.0
%11
.05.
04.
02.
022
.0 A
frica
n A
mer
ican
45
.0%
58.0
%58
.0%
58.0
%65
.0%
13.0
0.0
0.0
7.0
20.0
His
pani
c
46.0
%61
.0%
69.0
%72
.0%
76.0
%15
.08.
03.
04.
030
.0 W
hite
66
.0%
76.0
%81
.0%
85.0
%88
.0%
10.0
5.0
4.0
3.0
22.0
Eco
nom
ical
ly D
isad
vant
aged
38
.0%
62.0
%60
.0%
60.0
%65
.0%
24.0
(2.0
)0.
05.
027
.0 A
ll S
tude
nts
87
.0%
92.0
%93
.0%
96.0
%97
.0%
5.0
1.0
3.0
1.0
10.0
Afri
can
Am
eric
an
75.0
%89
.0%
84.0
%89
.0%
89.0
%14
.0(5
.0)
5.0
0.0
14.0
His
pani
c
82.0
%85
.0%
92.0
%91
.0%
94.0
%3.
07.
0(1
.0)
3.0
12.0
Whi
te
88.0
%92
.0%
94.0
%96
.0%
97.0
%4.
02.
02.
01.
09.
0 E
cono
mic
ally
Dis
adva
ntag
ed
67.0
%81
.0%
85.0
%90
.0%
87.0
%14
.04.
05.
0(3
.0)
20.0
All
Stu
dent
s
71.0
%81
.0%
86.0
%87
.0%
89.0
%10
.05.
01.
02.
018
.0 A
frica
n A
mer
ican
57
.0%
63.0
%66
.0%
69.0
%70
.0%
6.0
3.0
3.0
1.0
13.0
His
pani
c
53.0
%70
.0%
77.0
%79
.0%
82.0
%17
.07.
02.
03.
029
.0 W
hite
72
.0%
82.0
%88
.0%
89.0
%91
.0%
10.0
6.0
1.0
2.0
19.0
Eco
nom
ical
ly D
isad
vant
aged
43
.0%
68.0
%71
.0%
65.0
%69
.0%
25.0
3.0
(6.0
)4.
026
.0 A
ll S
tude
nts
93
.0%
97.0
%98
.0%
98.0
%97
.0%
4.0
1.0
0.0
(1.0
)4.
0 A
frica
n A
mer
ican
91
.0%
88.0
%96
.0%
90.0
%96
.0%
(3.0
)8.
0(6
.0)
6.0
5.0
His
pani
c
88.0
%96
.0%
96.0
%93
.0%
96.0
%8.
00.
0(3
.0)
3.0
8.0
Whi
te
94.0
%97
.0%
98.0
%98
.0%
97.0
%3.
01.
00.
0(1
.0)
3.0
Eco
nom
ical
ly D
isad
vant
aged
89
.0%
92.0
%91
.0%
87.0
%92
.0%
3.0
(1.0
)(4
.0)
5.0
3.0
All
Stu
dent
s
77.0
%83
.0%
86.0
%92
.0%
90.0
%6.
03.
06.
0(2
.0)
13.0
Afri
can
Am
eric
an
59.0
%63
.0%
69.0
%68
.0%
75.0
%4.
06.
0(1
.0)
7.0
16.0
His
pani
c
60.0
%72
.0%
76.0
%82
.0%
85.0
%12
.04.
06.
03.
025
.0 W
hite
79
.0%
84.0
%87
.0%
93.0
%91
.0%
5.0
3.0
6.0
(2.0
)12
.0 E
cono
mic
ally
Dis
adva
ntag
ed
63.0
%60
.0%
63.0
%74
.0%
78.0
%(3
.0)
3.0
11.0
4.0
15.0
All
Stu
dent
s
0.0%
0.3%
0.2%
0.2%
1.5%
0.3
(0.1
)0.
01.
31.
5 A
frica
n A
mer
ican
0.
0%0.
0%1.
0%0.
0%2.
3%0.
01.
0(1
.0)
2.3
2.3
His
pani
c
0.0%
0.4%
0.3%
0.0%
4.4%
0.4
(0.1
)(0
.3)
4.4
4.4
Whi
te
0.0%
0.3%
0.2%
0.2%
1.2%
0.3
(0.1
)0.
01.
01.
2 E
cono
mic
ally
Dis
adva
ntag
ed
0.0%
0.0%
0.9%
0.7%
3.9%
0.0
0.9
(0.2
)3.
23.
9 A
ll S
tude
nts
96
.4%
96.3
%96
.1%
96.2
%(0
.1)
(0.2
)0.
1(0
.2)
Afri
can
Am
eric
an
100.
0%96
.0%
100.
0%93
.3%
(4.0
)4.
0(6
.7)
(6.7
) H
ispa
nic
98
.2%
94.2
%98
.3%
92.9
%(4
.0)
4.1
(5.4
)(5
.3)
Whi
te
96.1
%96
.3%
95.9
%96
.5%
0.2
(0.4
)0.
60.
4 E
cono
mic
ally
Dis
adva
ntag
ed
94.1
%82
.4%
95.0
%90
.9%
(11.
7)12
.6(4
.1)
(3.2
) A
frica
n A
mer
ican
2.
2%2.
4%2.
4%3.
5%3.
5%0.
20.
01.
10.
01.
3 H
ispa
nic
6.
7%7.
4%7.
8%8.
5%9.
4%0.
70.
40.
70.
92.
7 W
hite
87
.3%
86.5
%86
.1%
84.1
%83
.1%
(0.8
)(0
.4)
(2.0
)(1
.0)
(4.2
) E
cono
mic
ally
Dis
adva
ntag
ed
2.3%
2.5%
3.3%
6.0%
5.2%
0.2
0.8
2.7
(0.8
)2.
9To
tal N
umbe
r of S
tude
nts
3827
3739
3940
4108
4073
(88)
201
168
(35)
246
Stud
ent
Com
posi
tion
TAK
S So
cial
St
udie
s
TAK
S Sc
ienc
e
Humble
All
test
s ta
ken
TAK
S R
eadi
ng/E
LA
TAK
S M
athe
mat
ics
Kingwood High School (Includes scores from Kingwood Ninth Grade Campus)
Ann
ual
Dro
pout
Rat
e,
gr. 7
-12
Com
plet
ion
Rat
e I,
gr. 9
-12
*Dro
pout
rate
s be
twee
n 20
03 a
nd 2
006
are
not c
ompa
rabl
e du
e to
def
initi
onal
diff
eren
ces
Making Our High Schools WorkHouston A+ Challenge, June 2, 2008 Attachment 4 -- Page 47

Cam
pus
Cha
n ge
2002
-03
2003
-04
2004
-05
2005
-06
2006
-07
03 to
04
04 to
05
05 to
06
06 to
07
03 to
07
Dat
a fr
om th
e A
cade
mic
Exc
elle
nce
Indi
cato
r Sys
tem
200
2-03
thro
ugh
2006
-07
Hou
ston
A+
Cha
lleng
e R
egio
nal C
olla
bora
tive
for H
igh
Scho
ol R
edes
ign
Perc
enta
ge P
oint
Cha
nge
Dis
tric
tSc
hool
Yea
rG
roup
Indi
cato
rC
ampu
s
All
Stu
dent
s
66.0
% A
frica
n A
mer
ican
50
.0%
His
pani
c
57.0
% W
hite
74
.0%
Eco
nom
ical
ly D
isad
vant
aged
49
.0%
All
Stu
dent
s
92.0
% A
frica
n A
mer
ican
89
.0%
His
pani
c
90.0
% W
hite
94
.0%
Eco
nom
ical
ly D
isad
vant
aged
88
.0%
All
Stu
dent
s
72.0
% A
frica
n A
mer
ican
59
.0%
His
pani
c
64.0
% W
hite
80
.0%
Eco
nom
ical
ly D
isad
vant
aged
58
.0%
All
Stu
dent
s
92.0
% A
frica
n A
mer
ican
85
.0%
His
pani
c
88.0
% W
hite
97
.0%
Eco
nom
ical
ly D
isad
vant
aged
78
.0%
All
Stu
dent
s
71.0
% A
frica
n A
mer
ican
58
.0%
His
pani
c
58.0
% W
hite
81
.0%
Eco
nom
ical
ly D
isad
vant
aged
51
.0%
All
Stu
dent
s
Afri
can
Am
eric
an
His
pani
c
Whi
te
Eco
nom
ical
ly D
isad
vant
aged
A
ll S
tude
nts
90
.5%
Afri
can
Am
eric
an
82.6
% H
ispa
nic
83
.5%
Whi
te
93.7
% E
cono
mic
ally
Dis
adva
ntag
ed
81.0
% A
frica
n A
mer
ican
23
.7%
His
pani
c
19.2
% W
hite
53
.4%
Eco
nom
ical
ly D
isad
vant
aged
16
.8%
Tota
l Num
ber o
f Stu
dent
s22
49
All
test
s ta
ken
TAK
S R
eadi
ng/E
LA
TAK
S M
athe
mat
ics
Atascocita High School (Opened and joined the Collaborative in 2006-07)
Humble
Stud
ent
Com
posi
tion
TAK
S So
cial
St
udie
s
TAK
S Sc
ienc
e
Ann
ual
Dro
pout
Rat
e,
gr. 7
-12
Com
plet
ion
Rat
e I,
gr. 9
-12
*Dro
pout
rate
s be
twee
n 20
03 a
nd 2
006
are
not c
ompa
rabl
e du
e to
def
initi
onal
diff
eren
ces
Making Our High Schools WorkHouston A+ Challenge, June 2, 2008 Attachment 4 -- Page 48

Cam
pus
Cha
n ge
2002
-03
2003
-04
2004
-05
2005
-06
2006
-07
03 to
04
04 to
05
05 to
06
06 to
07
03 to
07
Dat
a fr
om th
e A
cade
mic
Exc
elle
nce
Indi
cato
r Sys
tem
200
2-03
thro
ugh
2006
-07
Hou
ston
A+
Cha
lleng
e R
egio
nal C
olla
bora
tive
for H
igh
Scho
ol R
edes
ign
Perc
enta
ge P
oint
Cha
nge
Dis
tric
tSc
hool
Yea
rG
roup
Indi
cato
rC
ampu
s
All
Stu
dent
s
74.0
%85
.0%
83.0
%87
.0%
90.0
%11
.0(2
.0)
4.0
3.0
16.0
Afri
can
Am
eric
an
43.0
%44
.0%
43.0
%58
.0%
67.0
%1.
0(1
.0)
15.0
9.0
24.0
His
pani
c
43.0
%57
.0%
54.0
%62
.0%
69.0
%14
.0(3
.0)
8.0
7.0
26.0
Whi
te
79.0
%89
.0%
88.0
%91
.0%
93.0
%10
.0(1
.0)
3.0
2.0
14.0
Eco
nom
ical
ly D
isad
vant
aged
42
.0%
58.0
%50
.0%
52.0
%61
.0%
16.0
(8.0
)2.
09.
019
.0 A
ll S
tude
nts
85
.0%
94.0
%91
.0%
97.0
%98
.0%
9.0
(3.0
)6.
01.
013
.0 A
frica
n A
mer
ican
77
.0%
75.0
%71
.0%
100.
0%99
.0%
(2.0
)(4
.0)
29.0
(1.0
)22
.0 H
ispa
nic
68
.0%
76.0
%75
.0%
87.0
%92
.0%
8.0
(1.0
)12
.05.
024
.0 W
hite
87
.0%
97.0
%93
.0%
98.0
%98
.0%
10.0
(4.0
)5.
00.
011
.0 E
cono
mic
ally
Dis
adva
ntag
ed
66.0
%73
.0%
73.0
%84
.0%
87.0
%7.
00.
011
.03.
021
.0 A
ll S
tude
nts
83
.0%
90.0
%90
.0%
90.0
%93
.0%
7.0
0.0
0.0
3.0
10.0
Afri
can
Am
eric
an
67.0
%47
.0%
43.0
%64
.0%
79.0
%(2
0.0)
(4.0
)21
.015
.012
.0 H
ispa
nic
55
.0%
70.0
%69
.0%
70.0
%79
.0%
15.0
(1.0
)1.
09.
024
.0 W
hite
87
.0%
93.0
%93
.0%
94.0
%95
.0%
6.0
0.0
1.0
1.0
8.0
Eco
nom
ical
ly D
isad
vant
aged
57
.0%
68.0
%67
.0%
60.0
%71
.0%
11.0
(1.0
)(7
.0)
11.0
14.0
All
Stu
dent
s
97.0
%98
.0%
98.0
%99
.0%
99.0
%1.
00.
01.
00.
02.
0 A
frica
n A
mer
ican
10
0.0%
88.0
%88
.0%
100.
0%89
.0%
(12.
0)0.
012
.0(1
1.0)
(11.
0) H
ispa
nic
89
.0%
91.0
%90
.0%
94.0
%97
.0%
2.0
(1.0
)4.
03.
08.
0 W
hite
98
.0%
99.0
%99
.0%
100.
0%99
.0%
1.0
0.0
1.0
(1.0
)1.
0 E
cono
mic
ally
Dis
adva
ntag
ed
92.0
%86
.0%
87.0
%94
.0%
95.0
%(6
.0)
1.0
7.0
1.0
3.0
All
Stu
dent
s
82.0
%91
.0%
90.0
%93
.0%
93.0
%9.
0(1
.0)
3.0
0.0
11.0
Afri
can
Am
eric
an
56.0
%10
0.0%
71.0
%67
.0%
67.0
%44
.0(2
9.0)
(4.0
)0.
011
.0 H
ispa
nic
53
.0%
71.0
%68
.0%
76.0
%77
.0%
18.0
(3.0
)8.
01.
024
.0 W
hite
88
.0%
94.0
%94
.0%
96.0
%96
.0%
6.0
0.0
2.0
0.0
8.0
Eco
nom
ical
ly D
isad
vant
aged
47
.0%
71.0
%69
.0%
68.0
%66
.0%
24.0
(2.0
)(1
.0)
(2.0
)19
.0 A
ll S
tude
nts
0.
4%0.
3%0.
7%0.
9%1.
3%(0
.1)
0.4
0.2
0.4
0.9
Afri
can
Am
eric
an
0.0%
0.0%
5.3%
2.4%
7.3%
0.0
5.3
(2.9
)4.
97.
3 H
ispa
nic
2.
2%1.
5%1.
7%4.
5%5.
2%(0
.7)
0.2
2.8
0.7
3.0
Whi
te
0.1%
0.1%
0.5%
0.2%
30.0
%0.
00.
4(0
.3)
29.8
29.9
Eco
nom
ical
ly D
isad
vant
aged
1.
5%0.
5%2.
0%3.
4%2.
1%(1
.0)
1.5
1.4
(1.3
)0.
6 A
ll S
tude
nts
97
.9%
96.7
%96
.2%
95.9
%(1
.2)
(0.5
)(0
.3)
(2.0
) A
frica
n A
mer
ican
10
0.0%
100.
0%83
.3%
0.0
(16.
7)(8
3.3)
(100
.0)
His
pani
c
89.4
%92
.3%
85.5
%84
.0%
2.9
(6.8
)(1
.5)
(5.4
) W
hite
99
.4%
97.0
%98
.1%
98.2
%(2
.4)
1.1
0.1
(1.2
) E
cono
mic
ally
Dis
adva
ntag
ed
90.5
%96
.1%
77.8
%87
.2%
5.6
(18.
3)9.
4(3
.3)
Afri
can
Am
eric
an
1.3%
1.4%
1.5%
1.3%
1.1%
0.1
0.1
(0.2
)(0
.2)
(0.2
) H
ispa
nic
14
.4%
14.2
%14
.1%
14.4
%12
.8%
(0.2
)(0
.1)
0.3
(1.6
)(1
.6)
Whi
te
73.0
%73
.4%
72.6
%73
.3%
75.4
%0.
4(0
.8)
0.7
2.1
2.4
Eco
nom
ical
ly D
isad
vant
aged
9.
7%10
.9%
10.7
%11
.7%
10.4
%1.
2(0
.2)
1.0
(1.3
)0.
7To
tal N
umbe
r of S
tude
nts
2056
2170
2225
2297
2241
114
5572
(56)
185
Stud
ent
Com
posi
tion
Spring Branch
All
test
s ta
ken
TAK
S R
eadi
ng/E
LA
TAK
S M
athe
mat
ics
TAK
S So
cial
St
udie
s
TAK
S Sc
ienc
e
Ann
ual
Dro
pout
Rat
e,
gr. 7
-12
Com
plet
ion
Rat
e I,
gr. 9
-12
Memorial High School
*Dro
pout
rate
s be
twee
n 20
03 a
nd 2
006
are
not c
ompa
rabl
e du
e to
def
initi
onal
diff
eren
ces
Making Our High Schools WorkHouston A+ Challenge, June 2, 2008 Attachment 4 -- Page 49
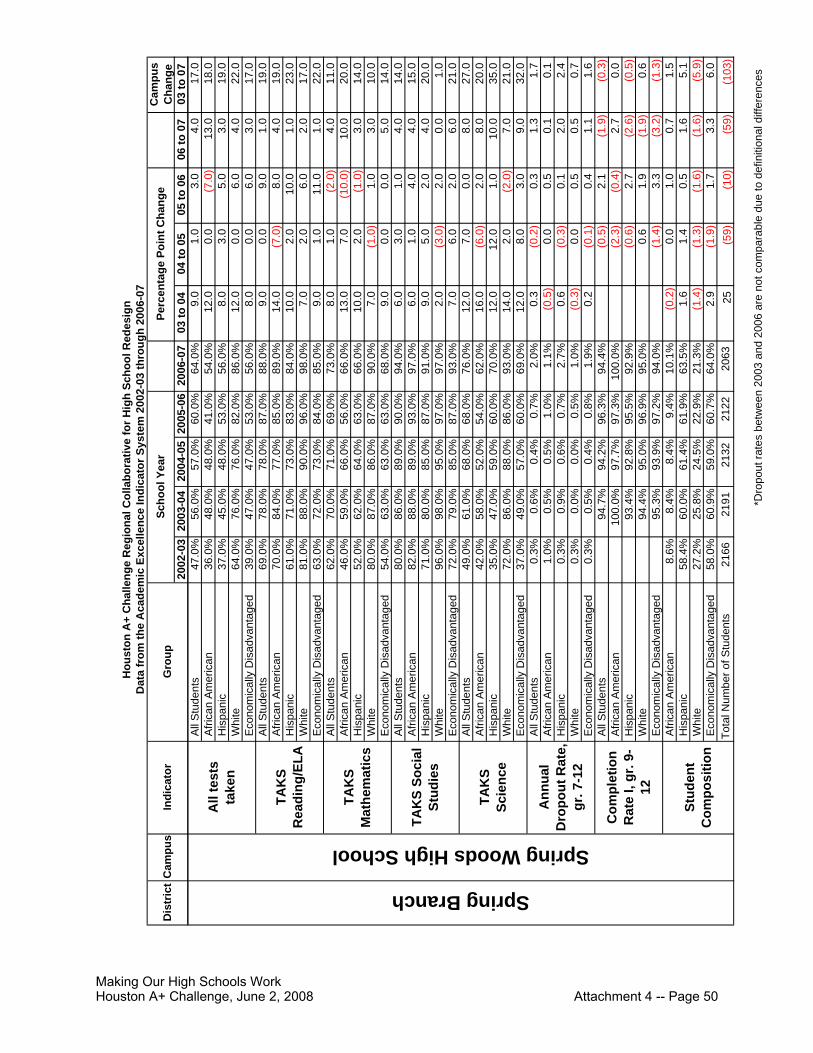
Cam
pus
Cha
n ge
2002
-03
2003
-04
2004
-05
2005
-06
2006
-07
03 to
04
04 to
05
05 to
06
06 to
07
03 to
07
Dat
a fr
om th
e A
cade
mic
Exc
elle
nce
Indi
cato
r Sys
tem
200
2-03
thro
ugh
2006
-07
Hou
ston
A+
Cha
lleng
e R
egio
nal C
olla
bora
tive
for H
igh
Scho
ol R
edes
ign
Perc
enta
ge P
oint
Cha
nge
Dis
tric
tSc
hool
Yea
rG
roup
Indi
cato
rC
ampu
s
All
Stu
dent
s
47.0
%56
.0%
57.0
%60
.0%
64.0
%9.
01.
03.
04.
017
.0 A
frica
n A
mer
ican
36
.0%
48.0
%48
.0%
41.0
%54
.0%
12.0
0.0
(7.0
)13
.018
.0 H
ispa
nic
37
.0%
45.0
%48
.0%
53.0
%56
.0%
8.0
3.0
5.0
3.0
19.0
Whi
te
64.0
%76
.0%
76.0
%82
.0%
86.0
%12
.00.
06.
04.
022
.0 E
cono
mic
ally
Dis
adva
ntag
ed
39.0
%47
.0%
47.0
%53
.0%
56.0
%8.
00.
06.
03.
017
.0 A
ll S
tude
nts
69
.0%
78.0
%78
.0%
87.0
%88
.0%
9.0
0.0
9.0
1.0
19.0
Afri
can
Am
eric
an
70.0
%84
.0%
77.0
%85
.0%
89.0
%14
.0(7
.0)
8.0
4.0
19.0
His
pani
c
61.0
%71
.0%
73.0
%83
.0%
84.0
%10
.02.
010
.01.
023
.0 W
hite
81
.0%
88.0
%90
.0%
96.0
%98
.0%
7.0
2.0
6.0
2.0
17.0
Eco
nom
ical
ly D
isad
vant
aged
63
.0%
72.0
%73
.0%
84.0
%85
.0%
9.0
1.0
11.0
1.0
22.0
All
Stu
dent
s
62.0
%70
.0%
71.0
%69
.0%
73.0
%8.
01.
0(2
.0)
4.0
11.0
Afri
can
Am
eric
an
46.0
%59
.0%
66.0
%56
.0%
66.0
%13
.07.
0(1
0.0)
10.0
20.0
His
pani
c
52.0
%62
.0%
64.0
%63
.0%
66.0
%10
.02.
0(1
.0)
3.0
14.0
Whi
te
80.0
%87
.0%
86.0
%87
.0%
90.0
%7.
0(1
.0)
1.0
3.0
10.0
Eco
nom
ical
ly D
isad
vant
aged
54
.0%
63.0
%63
.0%
63.0
%68
.0%
9.0
0.0
0.0
5.0
14.0
All
Stu
dent
s
80.0
%86
.0%
89.0
%90
.0%
94.0
%6.
03.
01.
04.
014
.0 A
frica
n A
mer
ican
82
.0%
88.0
%89
.0%
93.0
%97
.0%
6.0
1.0
4.0
4.0
15.0
His
pani
c
71.0
%80
.0%
85.0
%87
.0%
91.0
%9.
05.
02.
04.
020
.0 W
hite
96
.0%
98.0
%95
.0%
97.0
%97
.0%
2.0
(3.0
)2.
00.
01.
0 E
cono
mic
ally
Dis
adva
ntag
ed
72.0
%79
.0%
85.0
%87
.0%
93.0
%7.
06.
02.
06.
021
.0 A
ll S
tude
nts
49
.0%
61.0
%68
.0%
68.0
%76
.0%
12.0
7.0
0.0
8.0
27.0
Afri
can
Am
eric
an
42.0
%58
.0%
52.0
%54
.0%
62.0
%16
.0(6
.0)
2.0
8.0
20.0
His
pani
c
35.0
%47
.0%
59.0
%60
.0%
70.0
%12
.012
.01.
010
.035
.0 W
hite
72
.0%
86.0
%88
.0%
86.0
%93
.0%
14.0
2.0
(2.0
)7.
021
.0 E
cono
mic
ally
Dis
adva
ntag
ed
37.0
%49
.0%
57.0
%60
.0%
69.0
%12
.08.
03.
09.
032
.0 A
ll S
tude
nts
0.
3%0.
6%0.
4%0.
7%2.
0%0.
3(0
.2)
0.3
1.3
1.7
Afri
can
Am
eric
an
1.0%
0.5%
0.5%
1.0%
1.1%
(0.5
)0.
00.
50.
10.
1 H
ispa
nic
0.
3%0.
9%0.
6%0.
7%2.
7%0.
6(0
.3)
0.1
2.0
2.4
Whi
te
0.3%
0.0%
0.0%
0.5%
1.0%
(0.3
)0.
00.
50.
50.
7 E
cono
mic
ally
Dis
adva
ntag
ed
0.3%
0.5%
0.4%
0.8%
1.9%
0.2
(0.1
)0.
41.
11.
6 A
ll S
tude
nts
94
.7%
94.2
%96
.3%
94.4
%(0
.5)
2.1
(1.9
)(0
.3)
Afri
can
Am
eric
an
100.
0%97
.7%
97.3
%10
0.0%
(2.3
)(0
.4)
2.7
0.0
His
pani
c
93.4
%92
.8%
95.5
%92
.9%
(0.6
)2.
7(2
.6)
(0.5
) W
hite
94
.4%
95.0
%96
.9%
95.0
%0.
61.
9(1
.9)
0.6
Eco
nom
ical
ly D
isad
vant
aged
95
.3%
93.9
%97
.2%
94.0
%(1
.4)
3.3
(3.2
)(1
.3)
Afri
can
Am
eric
an
8.6%
8.4%
8.4%
9.4%
10.1
%(0
.2)
0.0
1.0
0.7
1.5
His
pani
c
58.4
%60
.0%
61.4
%61
.9%
63.5
%1.
61.
40.
51.
65.
1 W
hite
27
.2%
25.8
%24
.5%
22.9
%21
.3%
(1.4
)(1
.3)
(1.6
)(1
.6)
(5.9
) E
cono
mic
ally
Dis
adva
ntag
ed
58.0
%60
.9%
59.0
%60
.7%
64.0
%2.
9(1
.9)
1.7
3.3
6.0
Tota
l Num
ber o
f Stu
dent
s21
6621
9121
3221
2220
6325
(59)
(10)
(59)
(103
)
Spring Branch
Spring Woods High School
Stud
ent
Com
posi
tion
All
test
s ta
ken
Ann
ual
Dro
pout
Rat
e,
gr. 7
-12
Com
plet
ion
Rat
e I,
gr. 9
-12
TAK
S R
eadi
ng/E
LA
TAK
S M
athe
mat
ics
TAK
S So
cial
St
udie
s
TAK
S Sc
ienc
e
*Dro
pout
rate
s be
twee
n 20
03 a
nd 2
006
are
not c
ompa
rabl
e du
e to
def
initi
onal
diff
eren
ces
Making Our High Schools WorkHouston A+ Challenge, June 2, 2008 Attachment 4 -- Page 50

Cam
pus
Cha
n ge
2002
-03
2003
-04
2004
-05
2005
-06
2006
-07
03 to
04
04 to
05
05 to
06
06 to
07
03 to
07
Dat
a fr
om th
e A
cade
mic
Exc
elle
nce
Indi
cato
r Sys
tem
200
2-03
thro
ugh
2006
-07
Hou
ston
A+
Cha
lleng
e R
egio
nal C
olla
bora
tive
for H
igh
Scho
ol R
edes
ign
Perc
enta
ge P
oint
Cha
nge
Dis
tric
tSc
hool
Yea
rG
roup
Indi
cato
rC
ampu
s
All
Stu
dent
s
27.0
%37
.0%
44.0
%48
.0%
52.0
%10
.07.
04.
04.
025
.0 A
frica
n A
mer
ican
16
.0%
33.0
%35
.0%
39.0
%41
.0%
17.0
2.0
4.0
2.0
25.0
His
pani
c
24.0
%34
.0%
41.0
%46
.0%
51.0
%10
.07.
05.
05.
027
.0 W
hite
50
.0%
54.0
%71
.0%
71.0
%75
.0%
4.0
17.0
0.0
4.0
25.0
Eco
nom
ical
ly D
isad
vant
aged
26
.0%
36.0
%43
.0%
47.0
%50
.0%
10.0
7.0
4.0
3.0
24.0
All
Stu
dent
s
56.0
%70
.0%
78.0
%82
.0%
80.0
%14
.08.
04.
0(2
.0)
24.0
Afri
can
Am
eric
an
59.0
%75
.0%
77.0
%88
.0%
81.0
%16
.02.
011
.0(7
.0)
22.0
His
pani
c
53.0
%68
.0%
76.0
%81
.0%
78.0
%15
.08.
05.
0(3
.0)
25.0
Whi
te
77.0
%79
.0%
95.0
%90
.0%
93.0
%2.
016
.0(5
.0)
3.0
16.0
Eco
nom
ical
ly D
isad
vant
aged
54
.0%
68.0
%77
.0%
82.0
%78
.0%
14.0
9.0
5.0
(4.0
)24
.0 A
ll S
tude
nts
40
.0%
52.0
%55
.0%
60.0
%64
.0%
12.0
3.0
5.0
4.0
24.0
Afri
can
Am
eric
an
28.0
%44
.0%
41.0
%49
.0%
44.0
%16
.0(3
.0)
8.0
(5.0
)16
.0 H
ispa
nic
36
.0%
51.0
%53
.0%
59.0
%64
.0%
15.0
2.0
6.0
5.0
28.0
Whi
te
61.0
%62
.0%
78.0
%79
.0%
80.0
%1.
016
.01.
01.
019
.0 E
cono
mic
ally
Dis
adva
ntag
ed
40.0
%53
.0%
54.0
%61
.0%
62.0
%13
.01.
07.
01.
022
.0 A
ll S
tude
nts
77
.0%
83.0
%86
.0%
87.0
%86
.0%
6.0
3.0
1.0
(1.0
)9.
0 A
frica
n A
mer
ican
69
.0%
76.0
%92
.0%
98.0
%93
.0%
7.0
16.0
6.0
(5.0
)24
.0 H
ispa
nic
74
.0%
82.0
%84
.0%
85.0
%85
.0%
8.0
2.0
1.0
0.0
11.0
Whi
te
88.0
%92
.0%
97.0
%97
.0%
92.0
%4.
05.
00.
0(5
.0)
4.0
Eco
nom
ical
ly D
isad
vant
aged
75
.0%
83.0
%84
.0%
86.0
%85
.0%
8.0
1.0
2.0
(1.0
)10
.0 A
ll S
tude
nts
34
.0%
42.0
%51
.0%
55.0
%61
.0%
8.0
9.0
4.0
6.0
27.0
Afri
can
Am
eric
an
29.0
%30
.0%
47.0
%45
.0%
60.0
%1.
017
.0(2
.0)
15.0
31.0
His
pani
c
28.0
%39
.0%
46.0
%53
.0%
59.0
%11
.07.
07.
06.
031
.0 W
hite
62
.0%
61.0
%81
.0%
85.0
%89
.0%
(1.0
)20
.04.
04.
027
.0 E
cono
mic
ally
Dis
adva
ntag
ed
30.0
%40
.0%
48.0
%53
.0%
59.0
%10
.08.
05.
06.
029
.0 A
ll S
tude
nts
1.
2%1.
1%2.
0%1.
7%5.
9%(0
.1)
0.9
(0.3
)4.
24.
7 A
frica
n A
mer
ican
1.
0%0.
0%0.
0%2.
1%5.
5%(1
.0)
0.0
2.1
3.4
4.5
His
pani
c
1.3%
1.5%
2.4%
1.6%
6.1%
0.2
0.9
(0.8
)4.
54.
8 W
hite
1.
2%0.
0%1.
3%1.
1%3.
9%(1
.2)
1.3
(0.2
)2.
82.
7 E
cono
mic
ally
Dis
adva
ntag
ed
1.3%
0.8%
2.0%
1.2%
4.5%
(0.5
)1.
2(0
.8)
3.3
3.2
All
Stu
dent
s
94.8
%88
.4%
89.8
%81
.6%
(6.4
)1.
4(8
.2)
(13.
2) A
frica
n A
mer
ican
10
0.0%
91.7
%89
.7%
74.1
%(8
.3)
(2.0
)(1
5.6)
(25.
9) H
ispa
nic
93
.9%
86.2
%89
.2%
80.9
%(7
.7)
3.0
(8.3
)(1
3.0)
Whi
te
93.5
%95
.9%
93.3
%88
.6%
2.4
(2.6
)(4
.7)
(4.9
) E
cono
mic
ally
Dis
adva
ntag
ed
95.3
%89
.2%
90.3
%80
.3%
(6.1
)1.
1(1
0.0)
(15.
0) A
frica
n A
mer
ican
8.
4%7.
9%7.
8%8.
5%8.
3%(0
.5)
(0.1
)0.
7(0
.2)
(0.1
) H
ispa
nic
77
.0%
78.7
%81
.1%
81.9
%83
.5%
1.7
2.4
0.8
1.6
6.5
Whi
te
10.2
%9.
8%8.
2%6.
8%5.
9%(0
.4)
(1.6
)(1
.4)
(0.9
)(4
.3)
Eco
nom
ical
ly D
isad
vant
aged
71
.1%
76.0
%79
.0%
78.6
%82
.9%
4.9
3.0
(0.4
)4.
311
.8To
tal N
umbe
r of S
tude
nts
2108
2119
2038
1956
1817
11(8
1)(8
2)(1
39)
(291
)
Spring Branch
Northbrook High SchoolA
ll te
sts
take
n
TAK
S R
eadi
ng/E
LA
TAK
S M
athe
mat
ics
TAK
S So
cial
St
udie
s
TAK
S Sc
ienc
e
Ann
ual
Dro
pout
Rat
e,
gr. 7
-12
Com
plet
ion
Rat
e I,
gr. 9
-12
Stud
ent
Com
posi
tion
*Dro
pout
rate
s be
twee
n 20
03 a
nd 2
006
are
not c
ompa
rabl
e du
e to
def
initi
onal
diff
eren
ces
Making Our High Schools WorkHouston A+ Challenge, June 2, 2008 Attachment 4 -- Page 51

Cam
pus
Cha
n ge
2002
-03
2003
-04
2004
-05
2005
-06
2006
-07
03 to
04
04 to
05
05 to
06
06 to
07
03 to
07
Dat
a fr
om th
e A
cade
mic
Exc
elle
nce
Indi
cato
r Sys
tem
200
2-03
thro
ugh
2006
-07
Hou
ston
A+
Cha
lleng
e R
egio
nal C
olla
bora
tive
for H
igh
Scho
ol R
edes
ign
Perc
enta
ge P
oint
Cha
nge
Dis
tric
tSc
hool
Yea
rG
roup
Indi
cato
rC
ampu
s
All
Stu
dent
s
72.0
%76
.0%
81.0
%85
.0%
85.0
%4.
05.
04.
00.
013
.0 A
frica
n A
mer
ican
37
.0%
31.0
%40
.0%
42.0
%56
.0%
(6.0
)9.
02.
014
.019
.0 H
ispa
nic
52
.0%
56.0
%64
.0%
72.0
%71
.0%
4.0
8.0
8.0
(1.0
)19
.0 W
hite
78
.0%
85.0
%88
.0%
92.0
%93
.0%
7.0
3.0
4.0
1.0
15.0
Eco
nom
ical
ly D
isad
vant
aged
44
.0%
45.0
%56
.0%
60.0
%61
.0%
1.0
11.0
4.0
1.0
17.0
All
Stu
dent
s
86.0
%91
.0%
91.0
%97
.0%
96.0
%5.
00.
06.
0(1
.0)
10.0
Afri
can
Am
eric
an
65.0
%74
.0%
73.0
%91
.0%
87.0
%9.
0(1
.0)
18.0
(4.0
)22
.0 H
ispa
nic
70
.0%
82.0
%87
.0%
91.0
%92
.0%
12.0
5.0
4.0
1.0
22.0
Whi
te
91.0
%95
.0%
94.0
%99
.0%
99.0
%4.
0(1
.0)
5.0
0.0
8.0
Eco
nom
ical
ly D
isad
vant
aged
66
.0%
76.0
%79
.0%
93.0
%89
.0%
10.0
3.0
14.0
(4.0
)23
.0 A
ll S
tude
nts
84
.0%
86.0
%90
.0%
89.0
%89
.0%
2.0
4.0
(1.0
)0.
05.
0 A
frica
n A
mer
ican
49
.0%
52.0
%59
.0%
53.0
%62
.0%
3.0
7.0
(6.0
)9.
013
.0 H
ispa
nic
66
.0%
68.0
%76
.0%
82.0
%76
.0%
2.0
8.0
6.0
(6.0
)10
.0 W
hite
88
.0%
91.0
%95
.0%
94.0
%95
.0%
3.0
4.0
(1.0
)1.
07.
0 E
cono
mic
ally
Dis
adva
ntag
ed
59.0
%63
.0%
74.0
%68
.0%
69.0
%4.
011
.0(6
.0)
1.0
10.0
All
Stu
dent
s
95.0
%96
.0%
98.0
%98
.0%
99.0
%1.
02.
00.
01.
04.
0 A
frica
n A
mer
ican
80
.0%
89.0
%87
.0%
92.0
%93
.0%
9.0
(2.0
)5.
01.
013
.0 H
ispa
nic
87
.0%
88.0
%94
.0%
96.0
%98
.0%
1.0
6.0
2.0
2.0
11.0
Whi
te
97.0
%99
.0%
99.0
%99
.0%
99.0
%2.
00.
00.
00.
02.
0 E
cono
mic
ally
Dis
adva
ntag
ed
82.0
%91
.0%
89.0
%93
.0%
94.0
%9.
0(2
.0)
4.0
1.0
12.0
All
Stu
dent
s
78.0
%81
.0%
85.0
%89
.0%
91.0
%3.
04.
04.
02.
013
.0 A
frica
n A
mer
ican
41
.0%
41.0
%46
.0%
52.0
%66
.0%
0.0
5.0
6.0
14.0
25.0
His
pani
c
63.0
%59
.0%
73.0
%73
.0%
84.0
%(4
.0)
14.0
0.0
11.0
21.0
Whi
te
82.0
%88
.0%
92.0
%95
.0%
96.0
%6.
04.
03.
01.
014
.0 E
cono
mic
ally
Dis
adva
ntag
ed
47.0
%55
.0%
61.0
%70
.0%
71.0
%8.
06.
09.
01.
024
.0 A
ll S
tude
nts
0.
5%0.
4%0.
4%0.
6%1.
5%(0
.1)
0.0
0.2
0.9
1.0
Afri
can
Am
eric
an
0.7%
1.4%
0.7%
0.6%
3.1%
0.7
(0.7
)(0
.1)
2.5
2.4
His
pani
c
1.4%
1.2%
0.3%
1.1%
3.1%
(0.2
)(0
.9)
0.8
2.0
1.7
Whi
te
0.3%
0.3%
0.5%
0.6%
80.0
%0.
00.
20.
179
.479
.7 E
cono
mic
ally
Dis
adva
ntag
ed
0.7%
1.1%
0.0%
1.5%
2.8%
0.4
(1.1
)1.
51.
32.
1 A
ll S
tude
nts
96
.5%
95.0
%96
.6%
94.8
%(1
.5)
1.6
(1.8
)(1
.7)
Afri
can
Am
eric
an
92.3
%95
.8%
84.0
%84
.8%
3.5
(11.
8)0.
8(7
.5)
His
pani
c
90.0
%90
.4%
96.1
%83
.9%
0.4
5.7
(12.
2)(6
.1)
Whi
te
97.5
%95
.0%
97.1
%97
.4%
(2.5
)2.
10.
3(0
.1)
Eco
nom
ical
ly D
isad
vant
aged
91
.7%
88.7
%91
.8%
82.3
%(3
.0)
3.1
(9.5
)(9
.4)
Afri
can
Am
eric
an
5.7%
5.7%
7.3%
11.6
%11
.7%
0.0
1.6
4.3
0.1
6.0
His
pani
c
14.5
%16
.5%
16.0
%15
.7%
15.9
%2.
0(0
.5)
(0.3
)0.
21.
4 W
hite
66
.1%
65.0
%65
.3%
60.9
%61
.2%
(1.1
)0.
3(4
.4)
0.3
(4.9
) E
cono
mic
ally
Dis
adva
ntag
ed
11.8
%14
.6%
15.6
%19
.7%
20.5
%2.
81.
04.
10.
88.
7To
tal N
umbe
r of S
tude
nts
2122
2059
1916
2034
1967
(63)
(143
)11
8(6
7)(1
55)
Spring Branch
Stratford High School
Stud
ent
Com
posi
tion
TAK
S So
cial
St
udie
s
TAK
S Sc
ienc
e
Ann
ual
Dro
pout
Rat
e,
gr. 7
-12
Com
plet
ion
Rat
e I,
gr. 9
-12
All
test
s ta
ken
TAK
S R
eadi
ng/E
LA
TAK
S M
athe
mat
ics
*Dro
pout
rate
s be
twee
n 20
03 a
nd 2
006
are
not c
ompa
rabl
e du
e to
def
initi
onal
diff
eren
ces
Making Our High Schools WorkHouston A+ Challenge, June 2, 2008 Attachment 4 -- Page 52

Making Our High Schools Work Houston A+ Challenge, June 2, 2008 Attachment 6 – Page 53
ATTACHMENT 6
SCHOOL-BY-SCHOOL STATEMENT OF NEEDS
Recognizing that direct grant funding from Houston A+ Challenge is in its final year, each campus leadership team was asked to provide:
• A description of general needs for continuation (not changes or additions) of the current level of district support
• A description of needs for other support, identified primarily as a Policy Change, Budget Flexibility/Reallocation, or Other District Support
• A brief summary of the need Using this framework, the following are the needs reported by each school: Aldine High School (Aldine ISD) Needs for continuation of current support: As the only school in Aldine ISD to implement small learning communities, we have had tremendous support from the district. The common planning periods offered to core teachers have become a district-wide initiative. Partnering with Houston A+ Challenge has allowed us to send teachers to professional development opportunities, and it is our vision that we would continue to have financial support in this area. In addition, it has been very beneficial to us to meet with administrators from other districts and other high schools, to see how SLCs are implemented elsewhere; this collaboration needs to continue. Needs for other support: Because the integrity of small learning communities relies on keeping teachers and students grouped exclusively within one academy, Aldine High School could benefit from greater budget flexibility and reallocations of extra teacher units. Extra teaching units would allow for pure academy placement of students and teachers, rather than sharing a teacher between academies. Aldine Ninth Grade Center (Aldine ISD) In order to maintain the progress we have seen at Aldine Ninth, our school will need to continue training the remaining staff in the practices of Capturing Kids’ Hearts. We also would like to continue our refresher training in open-ended response instruction with Jill Aufill from the Abydos Learning Center (New Jersey Writing Project in Texas) for last year’s staff, and provide full training for any new teachers who may join us in the 2008-2009 academic year. In order for this to become a reality, our school will need funds to pay for both training and substitutes. Atascocita High School (Humble ISD) Principals need to be the leaders of the Professional Learning Community in their high schools. As such, the greatest need a principal has is the autonomy to
Making Our High Schools Work Houston A+ Challenge, June 2, 2008 Attachment 6 – Page 54
professionally develop his or her faculty to meet the school’s mission and vision. For example, in order to close achievement gaps and elevate learning, principals need the ability and support to implement deep and meaningful changes concerning learning in the classroom. Since deep change usually means bucking the status quo, it is likely to be met with resistance from inside and outside the school, no matter how carefully the change is planned. This is where district-level support becomes integral and essential for a school. When changes become implemented and disequilibrium occurs, the opinion of the changes often reach school boards and superintendents. When the principal’s change process is based on sound and research-based practices, receiving district-level support becomes invaluable. Concerning needs from the district level, district policy changes must occur to allow the changes needed to increase learning at the campus level. For example, teachers must be assessment literate in order for learning to deepen and for achievement to increase significantly. Quality assessment is synonymous with quality instruction. However, most district grading policies (late work penalties, zeros for cheating, deductions on grades for suspended students) and reporting of learning via averages instead of by the TEKS or learning targets are counter to what best and effective practice dictate. If we want quality high schools and off-the-chart breakthroughs in achievement, we have to make the changes systemically, and that cannot occur when policies actually thwart those efforts. This is a tremendous need to be met at the district level. Elsik High School (Alief ISD) Needs for continuation of current support:
• Continuation of funds to support professional development for teachers, leadership development for assistant principals, student interventions and literacy initiatives.
• Support to continue programs that will help increase student connections with Elsik High Schools, such as Lunch with Leaders and our Ramapolooza initiatives.
Needs for other support:
• Support for a study hall or TAKS tutorial period during the 7th period day and additional funding to support student interventions for student achievement.
Elsik Ninth Grade Center (Alief ISD) Needs for continuation of current activities funded through grant:
• Extra duty pay for teachers to collaborate during summer months on creating common assessments and aligned instructional units.
• Extra duty pay for teachers providing student academic assistance in the afternoons through after-school academies.
• Materials and snacks for students in our after-school academies. • Funding for Campus Literacy Day—a day set aside for reading for the fun
of it!—where we provide a book and activities for everyone in the building.
Making Our High Schools Work Houston A+ Challenge, June 2, 2008 Attachment 6 – Page 55
• Additional professional development, both onsite and offsite. Currently provided by the district:
• Early release time for collaboration. • Math, Reading and Lead Interventionist. • AISD Professional Development. • Extended day bus transportation • Extra duty pay for collaboration and academic assistance • Computer-aided instructional software
Needs for other support:
• Extra duty pay or flex time for larger after-school academic assistance and disciplinary program to target students.
• Full-time Math Instructional Specialist. • Additional staff members to facilitate an Academic Academy during the
school day for credit recovery, re-teach/reassessment, completion of incomplete work for students who cannot or will not stay after school.
• Schedule that allows periods for study halls or advisories, from which targeted students can be pulled for academic assistance.
• Revised grading policies to reflect current research on fair and equitable grading.
Hastings High School (Alief ISD) Needs for continuation of current support:
• Campus professional development. • Student interventions, manipulatives and student connection activities. • Literature to be used for book studies within the English department.
Hastings Ninth Grade Center (Alief ISD) Needs for continuation of current support:
• Maintain a focus on meaningful relationships to enhance student learning. • Retain trained staff. • Train new staff. • Funds to continue training.
Humble High School (Humble ISD) Needs for continuation of current support:
• Funding for stipends that would be used to pay personnel (such as Instructional Coaches) to do additional duties outside of regular job description.
• Funding to bring in experts to conduct site-based workshops for teachers to address deficiencies and exposed more teachers to best practices.
• Maintenance of Professional Learning Communities as we grow and utilize those parameters more frequently.
• Training to introduce new staff to what it means to participate in a PLC.

Making Our High Schools Work Houston A+ Challenge, June 2, 2008 Attachment 6 – Page 56
Needs for other support:
• Houston A+ Challenge grant money was seed money used to begin and enhance initiatives. The campus now needs district support to sustain the programming that has been put into place. Humble High School should be given consideration to receive a larger budget based on unique needs (more support required for Special Education, ESL, etc.)
Kerr High School Needs for other support:
• With Kerr’s limited budget, funding for maintenance and development of teacher skills and initiatives are often limited. Kerr faculty would like to see a small professional development allocation provided to Kerr in order to maintain some of the teacher skill development in the areas of rigor and relevance that we have begun. One way that we might accomplish this is to shift some of the student travel expenses for district and state University Interscholastic League from the campus level to district level, thus allowing that money to be used exclusively for professional development or teacher training within the school’s areas of focus and aligned with district instructional initiatives.
• Continued support of a scheduling system that allows time for student advisory classes at Kerr is another way that the district could continue to support some of the initiatives started through the Houston A+ Challenge network. In advisories, many of the initiatives are directly impacting students—goal-setting activities and relationship-building activities are done in advisory on a school-wide basis. These affect the culture of the school by allow teachers to serve as mentors and goal-setting coaches for students.
• Retaining the early release on Wednesdays in order for teachers and other campus staff to conduct Professional Learning Community planning and discussion is another policy that the district should maintain. To demonstrate a belief in the value of instructional dialogue among staff, the district should provide the structures to support that learning.
Kingwood Park High School (Humble ISD) Needs for other support:
• Capturing Kids’ Hearts is a huge part of our school culture. We utilize our Houston A+ Challenge funding to pay for this training. Almost all of our staff has been trained, and it is our goal to send everyone to Capturing Kids’ Hearts training. This is critical to maintaining our positive school culture and reducing the amount of discipline referrals. By building relationships with our students, we will ultimately increase their success. Kingwood Park High School needs continued funding to reach our goal of establishing a culture and environment that is conducive to learning.
Memorial High School (Spring Branch ISD) Needs for continuation of current support:

Making Our High Schools Work Houston A+ Challenge, June 2, 2008 Attachment 6 – Page 57
• Ability to keep Algebra I classes small and allow Algebra I teachers a common planning period in addition to their conference period.
• Ability to pay for the freshman report card pick-up night, including stipends and dinner for the teachers.
Needs for other support:
• A schedule that has regular teacher planning time built in weekly or twice monthly.
Spring Woods High School (Spring Branch ISD) Needs for other support:
• The greatest need is the continued financial support for the programs that we have started. Gear Up was the primary supporter for our 9th grade initiative, but as these students move up to 10th grade there won’t be any money to continue some of the things that we’ve been doing with Capturing Kids’ Hearts, college trips or summer programming. We also need funding for our Cub Camp and Senior Seminar.
• Funding to continue offering food at parents’ grade-level meetings. Provision of food has increased our parent attendance greatly and has allowed us to draw in some of our non-traditional parents to meetings. This is a valuable communications piece that has helped up us greatly.
• Networking has been a huge part of our experience with Houston A+ Challenge. Opportunities to continue monthly or quarterly Houston A+ Challenge network meetings in the future would be very valuable. Guest speakers and a focus on specific learning also would be very valuable. One all-day retreat in the summer would be a way to allow campuses to see and hear about best practices that are going on throughout our network.
• Continued site visits through the network would give us a valuable benchmark assessment on our progress towards meeting specific goals.
• Continued professional development opportunities such as the Reforming Schools Summer Institute and the National Speaker Series are important to maintain as the education landscape changes.
• Houston A+ Challenge should work with districts to effect change in Austin. State legislators may not listen to superintendents and board members, but they do listen to organizations that are tied to the business community at large. Houston A+ Challenge could leverage its reputation as a reform group to push for more effective change that is supported by its partner districts and local companies.
Stratford High School (Spring Branch ISD) Needs for continuation of current support:
• Stratford needs to continue funding the work of the Spartan Time committee and Link Crew team. The Spartan Time committee’s strength is that it is made up of teachers who meet in the summer to plan for 30 Spartan Time sessions which meet over the course of the year. The committee also meets periodically throughout the year to go over weekly feedback emails and end-of-semester surveys. The same need applies

Making Our High Schools Work Houston A+ Challenge, June 2, 2008 Attachment 6 – Page 58
for the Link Crew leaders who need to meet, plan and train students over the summer.
• Professional development centered on Professional Learning Community concepts needs to be continued, and the campus leadership needs to devote more time to the implementation and monitoring of PLC programs.
Needs for other support: ● Budget flexibility/reallocations to:
o Allow the principal the flexibility to have a series of late start or early release days to facilitate common planning.
o Allow the principal to have more input in reallocating certain non-teacher positions to meet the individual needs of the campus.
o Allocate money specifically for social-emotional programs at the campus level.
● Other district support: o Ask the Calendar Planning committee to consider early release
days at the end of each six weeks for team planning. (This is a strategy that is done in other districts.)
o Offer professional development specifically based on the PLC model to encourage common vocabulary and common learning goals.
Taylor High School (Alief ISD) Description of general needs and other support:
• Taylor sincerely appreciates Houston A+ Challenge and Alief ISD for their commitment to student achievement, and for their dedication to the professional growth of administrators and teachers.
• We would like to request that the current level of district support remain in place, and that additional support be provided for staffing units. We believe that smaller class sizes allow teachers to reach the struggling learner in a more personal way. We also believe that smaller class sizes allow teachers to build the quality relationships that are needed in the high-poverty, high-need schools.
• We also believe that the campus administration should have increased autonomy related to budget flexibility and the reallocation of funds. Each campus has unique needs, and therefore should be allowed to make decisions that will affect the individual campus and not the campus across the district.
• We would like to see the Curriculum Department consider our campuses individual needs for professional development. During the 2007-2008 school year, Taylor missed AYP and did not meet TAKS accountability in math. Therefore, our campus professional development needs should be tailored to meet these needs and not focusing solely on district-wide initiatives.
• Additionally, we would like to see Alief ISD continue its partnership with Houston A+ Challenge so that more faculty can receive the high-quality professional development that the organization offers.

Making Our High Schools Work Houston A+ Challenge, June 2, 2008 Attachment 7 – Page 59
ATTACHMENT 7
SUMMARY OF NEEDS IDENTIFIED BY CAMPUSES
After each campus identified its specific needs (described in Attachment 6), the members of the collaborative met and agreed on the following summary of needs that would help support our continued improvement.
CONTINUATION OF CURRENT SUPPORT FROM THE DISTRICT Scheduling
• Common planning periods • Early release time for collaborative planning • Time for campus leadership to devote to implementation and monitoring
of PLC Programs
Staffing • Interventionists
Extra duty/sub pay • Extra duty pay for collaboration and academic assistance
Professional development
• Address needs of both teachers and leadership • Address specific topics, such as:
o Student interventions o Literacy o Professional development centered around PLC concepts
• Continue to update training of current and new staff Programs supporting student connections
• Student clubs and organizations • Student events
Resources
• Computer-aided instructional software Other district services
• Extended day bus transportation

Making Our High Schools Work Houston A+ Challenge, June 2, 2008 Attachment 7 – Page 60
POLICY CHANGES Grading policies
• Revise policies to reflect fair and equitable grading processes in line with best practices
Campus schedule
• Allow for advisories or study halls during the school day from which targeted students could be pulled for academic assistance
• Create a schedule that has regular teacher planning time at least weekly • Principal flexibility to have a series of late start or early release days to
facilitate common planning
BUDGET INCREASES Professional development
• Travel and sub pay • On-site and off-site registration and travel • Support for collaborative activities provided through Houston A+
Challenge Additional teachers
• Smaller learning communities • Full time instructional specialists • New smaller learning communities for credit recovery, re-teaching and
reassessment • Reduce class size and improve student-teacher relationships
Extra duty/sub pay
• Summer collaboration and program development • After-school tutorials • Larger after-school academic and behavioral assistance for students • Stipends for instructional coaches above and beyond current duties • Subs to allow teachers to visit other campuses and attend Houston A+
Challenge best practices meetings Student interventions
• Student incentives to support student achievement • TAKS intervention classes during the school day) • 9th grade initiative activities for students, like college trips, summer
programming, and freshmen orientation camps • Allocate money specifically for social – emotional programs at the
campus level Resources
• Materials and snacks for after-school tutorials • Books for campus-wide reading or book studies • Math manipulatives and other specialized materials to support instruction • Food to maintain motivation for parent meetings

Making Our High Schools Work Houston A+ Challenge, June 2, 2008 Attachment 7 – Page 61
BUDGET FLEXIBILITY/REALLOCATION
Professional development
• Allow flexibility to shift categories of travel and professional development funding to fit campus needs
General campus autonomy
• Allow campuses to make individual decisions best for their needs • Allow the principal to have more input in reallocating certain non-teacher
positions to meet the individual needs of the campus
OTHER CENTRAL OFFICE SUPPORT Support for initiatives in best practices
• Support individual campus efforts to implement new practices that are in line with research but may not be “traditional”
Differentiated professional development
• Consider individual campus needs when planning district professional development, or allow some campuses to not participate
• Partner with Houston A+ Challenge to provide higher quality professional development
• Offer Professional development specifically based on the PLC model to encourage common vocabulary and common learning goals
District calendar
• Ask the Calendar Planning committee to consider early release days at the end of each six weeks for common team planning