Making Money from This Year's Hurricane Season - Use Options!
13
EQUITY RESEARCH Lehman Brothers does and seeks to do business with companies covered in its research reports. As a result, investors should be aware that the firm may have a conflict of interest that could affect the objectivity of this report. Customers of Lehman Brothers in the United States can receive independent, third-party research on the company or companies covered in this report, at no cost to them, where such research is available. Customers can access this independent research at www.lehmanlive.com or can call 1-800-2LEHMAN to request a copy of this research. Investors should consider this report as only a single factor in making their investment decision. PLEASE SEE ANALYST(S) CERTIFICATION(S) ON PAGE 6 AND IMPORTANT DISCLOSURES BEGINNING ON PAGE 7 1 Investment conclusion We expect P&C insurance stocks could be volatile in anticipation of an active 2006 hurricane season. As a result, we believe investors could position themselves to benefit from this volatility through the options market. In this note we propose a straddle opportunity, in which investors could benefit from certain P&C stocks meaningfully rising or falling. Summary We believe concern over losses from an active 2006 hurricane season could cause P&C insurance stocks to pull back, in the short-term. Alternatively, if hurricane losses in 2006 are not severe, P&C insurance stocks could rally, based on larger than expected preservation of book value. We believe this potential volatility in P&C insurance stocks could provide an attractive opportunity for investors to purchase at-the-money straddles. However, because hurricane intensity and location of hurricane landfall are not possible to predict and these factors can have significant impact on which (re)insurers incur larger loss, we recommend investors purchase a basket of at-the-money straddles. The P&C insurance stocks that have either moderate or large exposure to hurricanes and relatively liquid options are: MRH, RE, ALL, ACE, and CB. While CB has limited exposure to hurricanes, it could be affected if any hurricanes hit the Northeastern U.S. MRH Oct 15 straddles can be purchased for $3.35 and finish in the money if the stock closes above $18.35 or below $11.65 (+/-23%). RE Oct 90 straddles were offered at $10.80 as of last night’s close and the position breaks even if the stock finishes above $100.80 or below $79.20 as of the October 20 expiration (+/-12%). ALL Oct 55 straddles can be purchased for $5.80 and would be profitable if ALL closes above $60.80 or below $49.20 at expiration (+/- 10%). Investors can also purchase ACE Nov 55 straddles for $7.30. These would finish in the money if the stock closes above $62.30 or below $47.70 on October 20 (+/-14%). In case of CB, the Nov 50 straddles could be purchased for $5.30 and would lose money only if CB remains range-bound between $44.70 and $55.30 (+/-11%). Hurricane Volatility. Hurricanes represent risk to book value to P&C insurers and reinsurers. Recent forecasts for 2006 indicate expectations for an active hurricane season. We believe concern over losses from an active 2006 hurricane season could cause P&C insurance stocks to pull back, in the short-term. Alternatively, if hurricane losses in 2006 are not severe, P&C insurance stocks could rally, based on larger than expected preservation of book value. Insurers we cover with exposure relative to book value from Atlantic hurricanes in our view: • Most exposure: RNR, PRE, RE, and MRH. • Moderate exposure: ALL, ACGL, AHL, XL, and ACE. • Least exposure: STA, PGR, SAFC, CB, and AIG. The Case for Higher Realized Volatility. We compare 6-month implied volatility (the volatility implied for a six-month period) at the beginning of the hurricane season with the “ex-post 6-month realized volatility” (the volatility actually realized during the respective six month period) at the end of these hurricane seasons to identify instances when it would have been profitable to be long gamma in 2004 and 2005 (Figure 1). While the lack of listed options having 6 month maturities for several of the P&C May 23, 2006 Insurance/Non-Life Industry Overview Hurricane Option Strategy Jay Gelb, CFA Ryan Renicker 1.212.526.1561 1.212.526.9425 [email protected] [email protected] North America Financial Services Insurance/Non-Life Sector View: New: 1-Positive Old: 1-Positive
-
Upload
ryan-renicker -
Category
Business
-
view
790 -
download
4
description
Actionable trade ideas for stock market investors and traders seeking alpha by overlaying their portfolios with options, other derivatives, ETFs, and disciplined and applied Game Theory for hedge fund managers and other active fund managers worldwide. Ryan Renicker, CFA
Transcript of Making Money from This Year's Hurricane Season - Use Options!

EQUITY RESEARCH
Lehman Brothers does and seeks to do business with companies covered in its research reports. As a result, investors should be aware that the firm may have a conflict of interest that could affect the objectivity of this report. Customers of Lehman Brothers in the United States can receive independent, third-party research on the company or companies covered in this report, at no cost to them, where such research is available. Customers can access this independent research at www.lehmanlive.com or can call 1-800-2LEHMAN to request a copy of this research. Investors should consider this report as only a single factor in making their investment decision.
PLEASE SEE ANALYST(S) CERTIFICATION(S) ON PAGE 6 AND IMPORTANT DISCLOSURES BEGINNING
ON PAGE 7
1
Investment conclusion
We expect P&C insurance stocks could be volatile in anticipation of an active 2006 hurricane season. As a result, we believe investors could position themselves to benefit from this volatility through the options market. In this note we propose a straddle opportunity, in which investors could benefit from certain P&C stocks meaningfully rising or falling.
Summary
We believe concern over losses from an active 2006 hurricane season could cause P&C insurance stocks to pull back, in the short-term. Alternatively, if hurricane losses in 2006 are not severe, P&C insurance stocks could rally, based on larger than expected preservation of book value.
We believe this potential volatility in P&C insurance stocks could provide an attractive opportunity for investors to purchase at-the-money straddles. However, because hurricane intensity and location of hurricane landfall are not possible to predict and these factors can have significant impact on which (re)insurers incur larger loss, we recommend investors purchase a basket of at-the-money straddles.
The P&C insurance stocks that have either moderate or large exposure to hurricanes and relatively liquid options are: MRH, RE, ALL, ACE, and CB. While CB has limited exposure to hurricanes, it could be affected if any hurricanes hit the Northeastern U.S.
MRH Oct 15 straddles can be purchased for $3.35 and finish in the money if the stock closes above $18.35 or below $11.65 (+/-23%). RE Oct 90 straddles were offered at $10.80 as of last night’s close and the position breaks even if the stock finishes above $100.80 or below $79.20 as of the October 20 expiration (+/-12%).
ALL Oct 55 straddles can be purchased for $5.80 and would be profitable if ALL closes above $60.80 or below $49.20 at expiration (+/-10%). Investors can also purchase ACE Nov 55 straddles for $7.30. These would finish in the money if the stock closes above $62.30 or below $47.70 on October 20 (+/-14%).
In case of CB, the Nov 50 straddles could be purchased for $5.30 and would lose money only if CB remains range-bound between $44.70 and $55.30 (+/-11%).
Hurricane Volatility. Hurricanes represent risk to book value to P&C insurers and reinsurers. Recent forecasts for 2006 indicate expectations for an active hurricane season. We believe concern over losses from an active 2006 hurricane season could cause P&C insurance stocks to pull back, in the short-term. Alternatively, if hurricane losses in 2006 are not severe, P&C insurance stocks could rally, based on larger than expected preservation of book value. Insurers we cover with exposure relative to book value from Atlantic hurricanes in our view:
• Most exposure: RNR, PRE, RE, and MRH. • Moderate exposure: ALL, ACGL, AHL, XL, and ACE. • Least exposure: STA, PGR, SAFC, CB, and AIG.
The Case for Higher Realized Volatility. We compare 6-month implied volatility (the volatility implied for a six-month period) at the beginning of the hurricane season with the “ex-post 6-month realized volatility” (the volatility actually realized during the respective six month period) at the end of these hurricane seasons to identify instances when it would have been profitable to be long gamma in 2004 and 2005 (Figure 1). While the lack of listed options having 6 month maturities for several of the P&C
May 23, 2006
Insurance/Non-Life Industry Overview Hurricane Option Strategy
Jay Gelb, CFA Ryan Renicker1.212.526.1561 1.212.526.9425
[email protected] [email protected]
North AmericaFinancial Services
Insurance/Non-Life
Sector View: New: 1-Positive Old: 1-Positive

EQUITY RESEARCH
2
names prevents comparison across the universe, we find that P&C stocks with moderate to high exposure to hurricanes tended to have higher realized volatility over the six months of the hurricane season than what was originally implied at the beginning of the period. Figure 1. Implied vs Subsequent Realized Volatility in 2004-05
Ticker Hurricane Exposure
Implied Vol
(5/31/05)
Realized Vol (11/30/05)
Implied Vol
(5/28/04)
Realized Vol
(11/30/04)
Current 6-month Implied
MRH Highest N/A 46.7% N/A 15.5% N/APRE Highest N/A 22.4% N/A 15.2% 19.0%RE Highest 18.8% 20.5% 22.1% 20.6% N/ARNR Highest 21.8% 32.0% N/A 23.0% N/AXL Moderate 18.4% 27.5% 23.0% 18.6% 19.2%ACE Moderate 22.7% 22.2% N/A 27.0% 23.7%ACGL Moderate N/A 22.1% N/A 20.2% 18.8%ALL Moderate 14.8% 17.6% 20.4% 16.1% 16.8%AIG Least 24.5% 15.2% 22.4% 26.4% 27.3%CB Least 18.5% 17.7% 22.3% 20.3% 19.3%HIG Least 20.4% 17.5% 25.2% 22.7% 22.2%PGR Least N/A 21.8% N/A 18.0% 21.8%SAFC Least 18.5% 16.0% 21.6% 17.9% 18.9%STA Least 19.6% 18.2% 22.7% 24.0% 20.6% Source: Lehman Brothers, OptionMetrics Since the beginning of 2006, price-to-book multiples for P&C insurers have been under pressure, possibly a reflection of investor concern over hurricane losses. In the event that there are fewer property losses this year, there is a possibility of multiple expansion in these names. We believe this factor, coupled with the stocks’ relatively low implied volatility, implies that straddles purchased ahead of this year’s hurricane season could be a profitable strategy as the stocks could have substantial moves in either direction. This could occur in the event of either an active hurricane season or one that causes significantly lower losses than expected. Figure 2. Multiple Compression in 2006
1.35
1.40
1.45
1.50
1.55
1.60
Jan-0
6
Feb-06
Mar-06
Apr-06
P&C Composite Multiple (P/B)
Source: Lehman Brothers, Factset Upcoming Catalysts. There are several possible catalysts in the near term, which could draw investor attention to the 2006 hurricane season.
May 31: The CSU team updates its 2006 Hurricane Forecast June: Hurricane season begins
Investment Conclusion. We believe average implied volatility on P&C insurers is not pricing in hurricane risk sufficiently, providing an attractive opportunity for investors to purchase at-the-money straddles. While option liquidity in this space remains a constraint, MRH, RE, ALL, ACE, and CB are P&C stocks we identify as having relatively liquid options. While CB has limited exposure to hurricanes, it could be affected if any hurricanes hit the Northeastern U.S., which are at “high risk” this year, according to Accuweather meteorologists. Since the impact (or lack of impact) of the 2006 hurricane season varies due to unique geographic exposures – and the magnitude and location of hurricane landfalls is uncertain – we recommend investors take a long volatility position on all of these stocks. For instance, MRH Oct 15 straddles can be purchased for $3.40 and finish in the money if the stock closes above $18.40 or below $11.60. RE Oct 90 straddles were offered at $10.70 as of last night’s close and the position is profitable if the stock
EQUITY RESEARCH
3
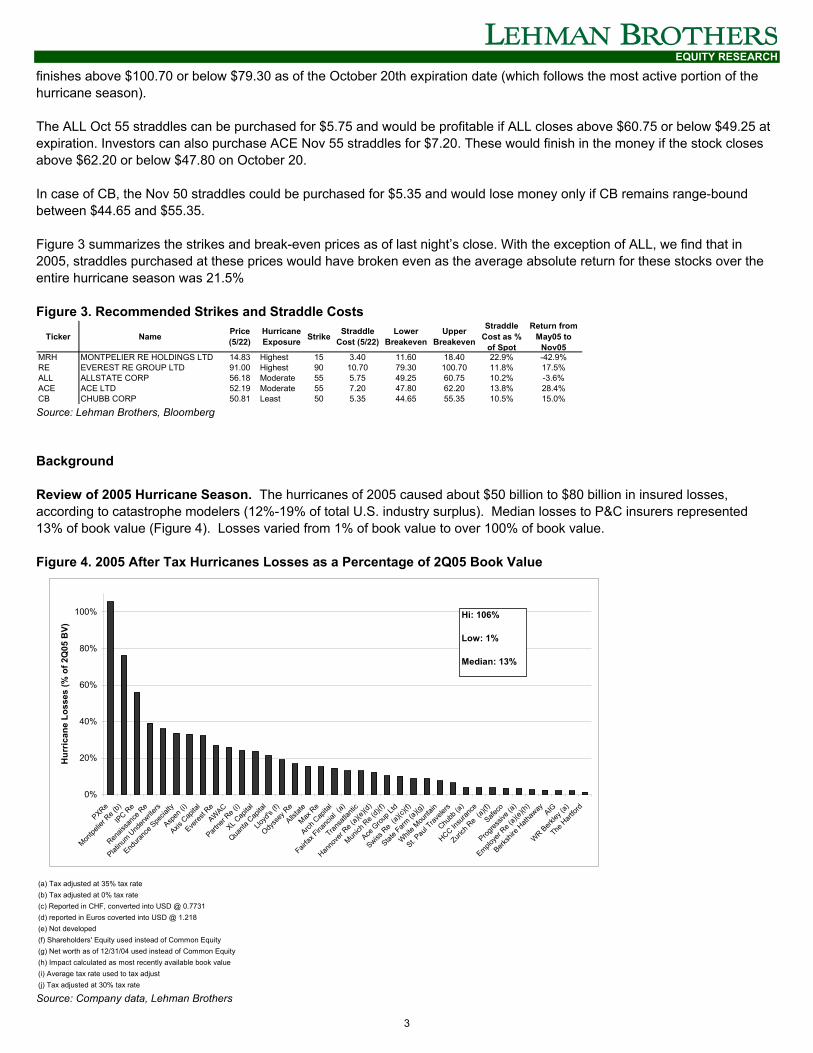
finishes above $100.70 or below $79.30 as of the October 20th expiration date (which follows the most active portion of the hurricane season). The ALL Oct 55 straddles can be purchased for $5.75 and would be profitable if ALL closes above $60.75 or below $49.25 at expiration. Investors can also purchase ACE Nov 55 straddles for $7.20. These would finish in the money if the stock closes above $62.20 or below $47.80 on October 20. In case of CB, the Nov 50 straddles could be purchased for $5.35 and would lose money only if CB remains range-bound between $44.65 and $55.35. Figure 3 summarizes the strikes and break-even prices as of last night’s close. With the exception of ALL, we find that in 2005, straddles purchased at these prices would have broken even as the average absolute return for these stocks over the entire hurricane season was 21.5% Figure 3. Recommended Strikes and Straddle Costs
Ticker Name Price (5/22)
Hurricane Exposure Strike Straddle
Cost (5/22)Lower
BreakevenUpper
Breakeven
Straddle Cost as %
of Spot
Return from May05 to
Nov05MRH MONTPELIER RE HOLDINGS LTD 14.83 Highest 15 3.40 11.60 18.40 22.9% -42.9%RE EVEREST RE GROUP LTD 91.00 Highest 90 10.70 79.30 100.70 11.8% 17.5%ALL ALLSTATE CORP 56.18 Moderate 55 5.75 49.25 60.75 10.2% -3.6%ACE ACE LTD 52.19 Moderate 55 7.20 47.80 62.20 13.8% 28.4%CB CHUBB CORP 50.81 Least 50 5.35 44.65 55.35 10.5% 15.0% Source: Lehman Brothers, Bloomberg Background Review of 2005 Hurricane Season. The hurricanes of 2005 caused about $50 billion to $80 billion in insured losses, according to catastrophe modelers (12%-19% of total U.S. industry surplus). Median losses to P&C insurers represented 13% of book value (Figure 4). Losses varied from 1% of book value to over 100% of book value. Figure 4. 2005 After Tax Hurricanes Losses as a Percentage of 2Q05 Book Value
(a) Tax adjusted at 35% tax rate(b) Tax adjusted at 0% tax rate(c) Reported in CHF, converted into USD @ 0.7731(d) reported in Euros coverted into USD @ 1.218(e) Not developed(f) Shareholders' Equity used instead of Common Equity(g) Net worth as of 12/31/04 used instead of Common Equity(h) Impact calculated as most recently available book value(i) Average tax rate used to tax adjust(j) Tax adjusted at 30% tax rate
0%
20%
40%
60%
80%
100%
PXRe
Montpe
lier R
e (b)
IPC Re
Renais
sanc
e Re
Platinu
m Und
erwrite
rs
Endura
nce S
pecia
lty
Aspen
(i)
Axis C
apita
l
Everes
t Re
AWAC
Partne
r Re (
i)
XL Cap
ital
Quanta
Cap
ital
Lloyd
's (f)
Odyss
ey R
e
Allstate
Max R
e
Arch C
apita
l
Fairfax
Financ
ial (a
)
Transa
tlanti
c
Hanno
ver R
e (a)(
e)(d)
Munich
Re (
d)(f)
Ace G
roup L
td
Swiss R
e (a)
(c)(f)
State F
arm (a
)(g)
Whit
e Mou
ntain
St. Pau
l Trav
elers
Chubb
(a)
HCC Insu
rance
Zurich
Re
(a)(f)
Safeco
Progres
sive (
a)
Employe
r Re (
a)(e)(
h)
Berksh
ire H
athaw
ay AIG
WR Berk
ley (a
)
The H
artfor
d
Hur
rican
e Lo
sses
(% o
f 2Q
05 B
V)
Hi: 106%
Low: 1%
Median: 13%
Source: Company data, Lehman Brothers

EQUITY RESEARCH
4
Realized Volatility Relatively Low in 2004, High in 2005. We use absolute one-day returns of insurance stocks to gauge the magnitude of the impact the 2005 hurricanes had on these companies’ shares. In addition, the average of the daily absolute returns over each month can be used as an estimate of the profitability of an options strategy whereby investors would have gone long volatility in insurance names by purchasing options on each stock, and delta-hedging their positions at the close of each day (long gamma). We find insurers did not experience exceptionally high volatility in response to the 2004 hurricane season (Figure 5), which was a rather active season – particularly for Florida – with four major hurricanes (Cat 3 or higher) making landfall (hurricanes Charley, Frances, Ivan, Jeanne). The only month with unusually high volatility was October, owing to the Spitzer investigation into insurance brokers. However, the 2005 hurricane season generated much higher realized volatility for insurance stocks having high exposure to hurricanes, given the significantly larger damage to insured properties in the Gulf of Mexico coastal regions (hurricanes Dennis, Katrina, Rita, Wilma). Figure 5. Average Absolute Returns For P&C Insurers
0.0%
0.5%
1.0%
1.5%
2.0%
2.5%
Jan-0
4
Mar-04
May-04
Jul-0
4
Sep-04
Nov-04
Jan-0
5
Mar-05
May-05
Jul-0
5
Sep-05
Nov-05
Jan-0
6
Mar-06
Daily Absolute Return - Highest ExposureDaily Absolute Return - Moderate Exposure
Source: Lehman Brothers, Bloomberg Heightened Risk Expectations Post Katrina. We use the change in short term implied volatility for options on P&C insurers as an index of the level of risk expectations priced in by the options market. The spread of the weighted average implied volatilities of P&C insurers over S&P 500 implied volatility is a measure of the incremental risk specific to stocks with exposure to hurricanes. In 2005, we find that implied volatility for P&C stocks relative to the market reached its trough at the end of August. However, following hurricane Katrina’s landfall, there was a re-pricing of risk expectations for P&C options across the board (Figure 6). In fact, implied volatility for insurers with the highest exposure to hurricanes began to trade at a premium relative to the implied volatility for insurers having a moderate exposure. We caveat that the information content of implied volatility for stocks with the highest exposure to hurricanes be taken with the proverbial pinch of salt, given the lack of liquidity in these options. Figure 6. P&C Insurer Implied Volatility Relative to S&P 500
0%
5%
10%
15%
20%
25%
Jan-0
4
Mar-04
May-04
Jul-0
4
Sep-04
Nov-04
Jan-0
5
Mar-05
May-05
Jul-0
5
Sep-05
Nov-05
Jan-0
6
Mar-06
May-06
Implied Vol Spread to Market - Highest ExposureImplied Vol Spread to Market - Moderate Exposure
Source: Lehman Brothers, Bloomberg In recent months, the implied volatility spread for insurers with the highest risk exposure has been declining, which could indicate that the options market is not pricing in hurricane risk sufficiently. As the onset of the 2006 hurricane season approaches, with outlooks released (and increasing media attention or headline risks surfacing), there is likely to be elevated

EQUITY RESEARCH
5
investor attention to this risk and, we believe, another re-pricing of implied volatility, even in the absence of an immediate change in realized vols. Hurricane Forecasts for 2006. NOAA (National Oceanic and Atmospheric Administration) released its 2006 hurricane forecast yesterday (May 22), saying it expects the 2006 hurricane season to be more active than average, but less active than 2005. The NOAA forecasts 13-16 named storms (average=11) to form in the Atlantic basin during the six-month season, which officially begins on June 1. The NOAA expects 8-10 of these storms to become hurricanes (average=6), with 4-6 (average= 2) of them intense hurricanes (category 3 or higher). NOAA expects an above average active hurricane season due to warmer ocean water combined with lower wind shear, weaker easterly trade winds, and a more favorable wind pattern in the mid-levels of the atmosphere are the factors that collectively will favor the development of storms in greater numbers and to greater intensity. The Colorado State University (CSU) team led by Dr. William Gray also expects the 2006 hurricane season to be more active than average, but less active than 2005. The NOAA and CSU forecasts are mostly in line. (Figure 7). NOAA does not predict the probability of hurricanes making landfall because this depends on short-term factors that can not be predicted. However, based on historical statistics, NOAA estimates 2-4 hurricanes could make landfall in the U.S in 2006. Notably, the NOAA and CSU tend to be conservative in their forecasts. Figure 8 shows the NOAA and CSU forecasts versus the actual number of hurricanes and major hurricanes from 2003-2005. Figure 7. 2006 Hurricane Season Outlook Vs 2005
2005NOAA CSU Actual
Number Named Storms 13-16 17 28Number Hurricanes 8-10 9 15Numerb Major Hurricanes (Cat 3 or higher) 4-6 5 7
Source: NOAA, Colorado State University, Lehman Brothers research. Figure 8. NOAA And CSU Forecasts Vs Actual
Atlantic Hurricanes Major Hurricanes Atlantic HurricanesMajor Hurricanes Atlantic Hurricanes Major Hurricanes2005 7-9 3-5 7 3 15 72004 6-8 2-4 8 3 9 62003 6-9 2-4 8 3 7 2
NOAA Prediction ActualCSU April Prediction
Source: NOAA, Colorado State University, Lehman Brothers research. As a result of increased expected hurricane activity, many insurers as well as catastrophe modeling firms are recalibrating their catastrophe models to include assumptions for increased frequency and severity of hurricanes. RMS, a catastrophe modeling firm, expects that updates to its 2006 hurricane model could result in at least a 50% increase in Atlantic hurricane loss expectations following the devastating 2005 storm results. EQECAT, another catastrophe modeler, adjusted its catastrophe model increasing expected loss frequency in the U.S. from Atlantic hurricanes by 40%. EQECAT’s severity assumptions increased 25% for both a 1 in 50 year event and a 1 in 100 year event; however, adjustments to EQECAT’s assumptions varied by region (Figure 9). Both EQECAT and RMS expect at least another five years of increased hurricane activity. Figure 9. Changes to EQECAT’s Catastrophe Models, By Region
Total Average FL OnlyGulf of Mexico,
excluding FL GA, NC, and SC VA to NYIncreases in Frequency 40% 60% 20% 40% 30%Increases in Severity:
1 in 50 year event 25% 40% 15% 25% 15%1 in 100 year event 25% 25% 10% 25% 10%
Source: EQECAT, Lehman Brothers Dr. William Gray (CSU) is considered one of the leading experts on patterns of hurricane activity. The Colorado State University team’s most recent hurricane forecast (April) expects the 2006 hurricane season to be more active than average, but less active than 2005. The team forecasts 17 named storms (average 9.6) to form in the Atlantic basin during the six-

EQUITY RESEARCH
6
month season, which officially begins on June 1. The team expects nine of these storms to become hurricanes, with five of them intense hurricanes (category 3 or higher). The CSU team provided probabilities of at least one major storm (category 3 or higher) making landfall in a coastal region in 2006:
• U.S. coastline: 81% (average for last century is 52%); • U.S. east coast and Florida: 64% (average for last century is 31%); • U.S. Gulf coast from Florida panhandle: 47% (average for last century is 30%); and • Caribbean: above average risk.
Analyst Certification: We, Jay Gelb, CFA and Ryan Renicker, hereby certify (1) that the views expressed in this research Industry Note accurately reflect our personal views about any or all of the subject securities or issuers referred to in this Industry Note and (2) no part of our compensation was, is or will be directly or indirectly related to the specific recommendations or views expressed in this Industry Note. Other Team Members: Hawken, Brennan 1.212.526.8190 [email protected] Pagluica, Sarah 1.212.526.9947 [email protected] Mallick, Devapriya 1.212.526.5429 [email protected]

EQUITY RESEARCH
7
Important Disclosures: ACE Limited (ACE) $ 52.51 (19-May-2006) 2-Equal weight / 1-Positive Rating and Price Target Chart:
1-03 4-03 7-03 10-03 1-04 4-04 7-04 10-04 1-05 4-05 7-05 10-05 1-06 4-06 7-06 10-060.00
4.00
8.00
12.00
16.00
20.00
24.00
28.00
32.00
36.00
40.00
44.00
48.00
52.00
56.00
60.00
Source: FactSet
ACE LIMITEDAs of 16-May-2006
Currency = USD
Closing Price Price TargetRecommendation Change Drop Coverage
Currency=$ Date Closing Price Rating Price Target 03-Jan-06 54.54 57.00 14-Nov-05 56.57 57.00 07-Oct-05 47.96 48.00 30-Jun-05 44.85 44.00 13-Apr-05 40.06 42.00 13-Apr-05 40.06 2-Equal weight
Date Closing Price Rating Price Target 01-Feb-05 43.87 0.00 01-Feb-05 43.87 Dropped 16-Jul-04 42.28 42.00 10-Jun-04 41.98 40.00 10-Jun-04 41.98 3-Underweight
FOR EXPLANATIONS OF RATINGS REFER TO THE STOCK RATING KEYS LOCATED ON THE PAGE FOLLOWING THE LAST PRICE CHART.
Lehman Brothers Inc. and/or an affiliate expects to receive or intends to seek compensation for investment banking services from ACE Limited within the next 3 months. Lehman Brothers Inc and/or an affiliate trade regularly in the shares of ACE Limited. Lehman Brothers Inc. has received non-investment banking related compensation from ACE Limited within the last 12 months. ACE Limited is or during the past 12 months has been an investment banking client of Lehman Brothers Inc. and/or an affiliate. ACE Limited is or during the last 12 months has been a non-investment banking client (securities related services) of Lehman Brothers Inc.
Risks Which May Impede the Achievement of the Price Target: Similar to other property/casualty insurers, ACE Limited faces risks from a return to a soft property/casualty market, catastrophes and other large losses, and rising interest rates. Risks to ACE that could impede the stock from achieving our price target include further adverse loss development in its asbestos reserves. The company also could suffer from uncollectible reinsurance balances.

EQUITY RESEARCH
8
Important Disclosures Continued: Allstate Corp. (ALL) $ 56.39 (19-May-2006) 1-Overweight / 1-Positive Rating and Price Target Chart:
1-03 4-03 7-03 10-03 1-04 4-04 7-04 10-04 1-05 4-05 7-05 10-05 1-06 4-06 7-06 10-060.004.008.00
12.0016.0020.0024.0028.0032.0036.0040.0044.0048.0052.0056.0060.0064.0068.0072.00
Source: FactSet
ALLSTATE CORP.As of 16-May-2006
Currency = USD
Closing Price Price TargetRecommendation Change Drop Coverage
Currency=$ Date Closing Price Rating Price Target 11-Jan-06 55.55 65.00 03-Jan-06 54.73 65.00 20-Oct-05 53.02 65.00 21-Jul-05 61.20 70.00 30-Jun-05 59.75 66.00 13-Apr-05 54.50 63.00 13-Apr-05 54.50 1-Overweight 01-Feb-05 50.93 0.00
Date Closing Price Rating Price Target 01-Feb-05 50.93 Dropped 22-Oct-04 46.83 54.00 09-Sep-04 46.50 2-Equal weight 27-Aug-04 47.69 2-Equal weight 17-Oct-03 40.05 52.00 17-Oct-03 40.05 1-Overweight 13-Aug-03 35.89 50.00 13-Aug-03 35.89 2-Equal weight
FOR EXPLANATIONS OF RATINGS REFER TO THE STOCK RATING KEYS LOCATED ON THE PAGE FOLLOWING THE LAST PRICE CHART.
Lehman Brothers Inc. and/or an affiliate has managed or co-managed within the past 12 months a 144A and/or public offering of securities for Allstate Corp.. Lehman Brothers Inc. and/or an affiliate has received compensation for investment banking services from Allstate Corp. in the past 12 months. Lehman Brothers Inc. and/or an affiliate expects to receive or intends to seek compensation for investment banking services from Allstate Corp. within the next 3 months. Lehman Brothers Inc and/or an affiliate trade regularly in the shares of Allstate Corp.. Lehman Brothers Inc. has received non-investment banking related compensation from Allstate Corp. within the last 12 months. Allstate Corp. is or during the past 12 months has been an investment banking client of Lehman Brothers Inc. and/or an affiliate. Allstate Corp. is or during the last 12 months has been a non-investment banking client (securities related services) of Lehman Brothers Inc.
Risks Which May Impede the Achievement of the Price Target: There are several risks that could prevent Allstate from achieving our price target. The major risk for the stock is a return to a soft personal lines insurance market, which could cause a contraction in the stock's multiple. Second, the company has substantial exposure to natural catastrophe losses, owing to its large homeowners insurance business. Also, Allstate is subject to numerous lawsuits that we attribute in part to it being a large, highly visible corporation.

EQUITY RESEARCH
9
Important Disclosures Continued: Chubb Corp. (CB) $ 50.36 (19-May-2006) 1-Overweight / 1-Positive Rating and Price Target Chart:
1-03 4-03 7-03 10-03 1-04 4-04 7-04 10-04 1-05 4-05 7-05 10-05 1-06 4-06 7-06 10-060.00
4.00
8.00
12.00
16.00
20.00
24.00
28.00
32.00
36.00
40.00
44.00
48.00
52.00
56.00
60.00
Source: FactSet
CHUBB CORP.As of 16-May-2006
Currency = USD
Closing Price Price TargetRecommendation Change Drop Coverage
Currency=$ Date Closing Price Rating Price Target 25-Apr-06 50.97 58.00 19-Apr-06 49.50 55.00 03-Jan-06 48.90 55.00 14-Nov-05 49.06 55.00 27-Jul-05 44.63 47.50 30-Jun-05 42.80 46.00
Date Closing Price Rating Price Target 13-Apr-05 39.77 45.00 13-Apr-05 39.77 1-Overweight 01-Feb-05 38.27 0.00 01-Feb-05 38.27 Dropped 13-Aug-03 32.85 41.00 13-Aug-03 32.85 1-Overweight
FOR EXPLANATIONS OF RATINGS REFER TO THE STOCK RATING KEYS LOCATED ON THE PAGE FOLLOWING THE LAST PRICE CHART.
Lehman Brothers Inc and/or an affiliate trade regularly in the shares of Chubb Corp..
Risks Which May Impede the Achievement of the Price Target: Similar to other property/casualty insurers, Chubb faces risks from a return to a soft property/casualty market, catastrophes and other large losses, and rising interest rates. Risks to Chubb that could impede the stock from achieving our price target include adverse prior-period loss-reserve development in areas such as its homeowners, directors and officers, and errors and omissions lines, as well as asbestos. In addition, Chubb Financial Solutions could suffer operating losses as the company exits this business.

EQUITY RESEARCH
10
Important Disclosures Continued: Everest Re Group (RE) $ 91.04 (19-May-2006) 1-Overweight / 1-Positive Rating and Price Target Chart:
1-03 4-03 7-03 10-03 1-04 4-04 7-04 10-04 1-05 4-05 7-05 10-05 1-06 4-06 7-06 10-060.00
8.00
16.00
24.00
32.00
40.00
48.00
56.00
64.00
72.00
80.00
88.00
96.00
104.00
112.00
120.00
128.00
Source: FactSet
EVEREST RE GROUPAs of 16-May-2006
Currency = USD
Closing Price Price TargetRecommendation Change Drop Coverage
Currency=$ Date Closing Price Rating Price Target 25-Apr-06 90.00 105.00 03-Jan-06 100.81 120.00 14-Nov-05 107.34 120.00 14-Nov-05 107.34 1-Overweight 25-Jul-05 94.68 95.00 30-Jun-05 93.00 92.00
Date Closing Price Rating Price Target 19-Apr-05 84.11 90.00 13-Apr-05 84.75 92.00 22-Nov-04 83.97 101.00 22-Nov-04 83.97 2-Equal weight 10-Nov-04 82.46 0.00
FOR EXPLANATIONS OF RATINGS REFER TO THE STOCK RATING KEYS LOCATED ON THE PAGE FOLLOWING THE LAST PRICE CHART.
Lehman Brothers Inc and/or an affiliate trade regularly in the shares of Everest Re Group.
Risks Which May Impede the Achievement of the Price Target: The risks for RE include asbestos exposure and the company not reserving adequately for unexpected future losses; weather and non-weather catastrophes; future terrorist acts; regulatory fines and sanctions; and prices falling faster than expected.

EQUITY RESEARCH
11
Important Disclosures Continued: Montpelier Re Holdings (MRH) $ 15.12 (19-May-2006) 2-Equal weight / 1-Positive Rating and Price Target Chart:
5-03 8-03 11-03 2-04 5-04 8-04 11-04 2-05 5-05 8-05 11-05 2-06 5-060.00
4.00
8.00
12.00
16.00
20.00
24.00
28.00
32.00
36.00
40.00
44.00
Source: FactSet
MONTPELIER RE HOLDINGSAs of 16-May-2006
Currency = USD
Closing Price Price TargetRecommendation Change Drop Coverage
Currency=$ Date Closing Price Rating Price Target 14-Mar-06 16.43 17.00 14-Mar-06 16.43 2-Equal weight
Date Closing Price Rating Price Target 09-Dec-05 17.31 0.00
FOR EXPLANATIONS OF RATINGS REFER TO THE STOCK RATING KEYS LOCATED ON THE PAGE FOLLOWING THE LAST PRICE CHART.
Lehman Brothers Inc. and/or an affiliate has managed or co-managed within the past 12 months a 144A and/or public offering of securities for Montpelier Re Holdings. Lehman Brothers Inc. and/or its affiliates beneficially owns 1% or more of any class of common equity securities of Montpelier Re Holdings as of the end of last month. Lehman Brothers Inc and/or an affiliate trade regularly in the shares of Montpelier Re Holdings.
Risks Which May Impede the Achievement of the Price Target: The risks for MRH include the company not reserving adequately for unexpected future losses; weather and non-weather catastrophes; future terrorist acts; regulatory fines and sanctions; interest-rate fluctuations; and prices falling faster than expected.
Other Material Conflicts: Lehman Brothers Inc. or an affiliate has received compensation for investment banking services from the subject company within the past 12 months.
Lehman Brothers Inc. or an affiliate expects to receive or intends to seek compensation for investment banking services from the subject company within the next three months.
The subject company is or during the past 12 months has been an investment banking client of Lehman Brothers Inc.

EQUITY RESEARCH
12
Important Disclosures Continued: The analysts responsible for preparing this report have received compensation based upon various factors including the firm's total revenues, a portion of which is generated by investment banking activities Company Name Ticker Price (19-May-2006) Stock / Sector Rating ACE Limited ACE $ 52.51 2-Equal weight / 1-Positive Allstate Corp. ALL $ 56.39 1-Overweight / 1-Positive Chubb Corp. CB $ 50.36 1-Overweight / 1-Positive Everest Re Group RE $ 91.04 1-Overweight / 1-Positive Montpelier Re Holdings MRH $ 15.12 2-Equal weight / 1-Positive Sector Coverage Universe Below is the list of companies that constitute the sector coverage universe: ACE Limited (ACE) Allstate Corp. (ALL) American International Group (AIG) Aon Corporation (AOC) Arch Capital Group Ltd. (ACGL) Arthur J. Gallagher & Co. (AJG) Aspen Insurance Holdings (AHL) Chubb Corp. (CB) Everest Re Group (RE) Marsh & McLennan Cos. (MMC) Montpelier Re Holdings (MRH) PartnerRe Ltd. (PRE) Progressive Corp. (PGR) RenaissanceRe Holdings (RNR) SAFECO Corp (SAFC) St. Paul Travelers Cos. (STA) Willis Group Holdings Ltd. (WSH) XL Capital Ltd. (XL) Guide to Lehman Brothers Equity Research Rating System: Our coverage analysts use a relative rating system in which they rate stocks as 1-Overweight, 2-Equal weight or 3-Underweight (see definitions below) relative to other companies covered by the analyst or a team of analysts that are deemed to be in the same industry sector (the “sector coverage universe”). To see a list of the companies that comprise a particular sector coverage universe, please go to www.lehman.com/disclosures In addition to the stock rating, we provide sector views which rate the outlook for the sector coverage universe as 1-Positive, 2-Neutral or 3-Negative (see definitions below). A rating system using terms such as buy, hold and sell is not the equivalent of our rating system. Investors should carefully read the entire research report including the definitions of all ratings and not infer its contents from ratings alone. Stock Rating 1-Overweight - The stock is expected to outperform the unweighted expected total return of the sector coverage universe over a 12-month investment horizon. 2-Equal weight - The stock is expected to perform in line with the unweighted expected total return of the sector coverage universe over a 12- month investment horizon. 3-Underweight - The stock is expected to underperform the unweighted expected total return of the sector coverage universe over a 12- month investment horizon. RS-Rating Suspended - The rating and target price have been suspended temporarily to comply with applicable regulations and/or firm policies in certain circumstances including when Lehman Brothers is acting in an advisory capacity in a merger or strategic transaction involving the company. Sector View 1-Positive - sector coverage universe fundamentals/valuations are improving. 2-Neutral - sector coverage universe fundamentals/valuations are steady, neither improving nor deteriorating. 3-Negative - sector coverage universe fundamentals/valuations are deteriorating. Distribution of Ratings: Lehman Brothers Equity Research has 1832 companies under coverage. 43% have been assigned a 1-Overweight rating which, for purposes of mandatory regulatory disclosures, is classified as Buy rating, 32% of companies with this rating are investment banking clients of the Firm. 40% have been assigned a 2-Equal weight rating which, for purposes of mandatory regulatory disclosures, is classified as Hold rating, 6% of companies with this rating are investment banking clients of the Firm. 17% have been assigned a 3-Underweight rating which, for purposes of mandatory regulatory disclosures, is classified as Sell rating, 61% of companies with this rating are investment banking clients of the Firm. This material has been prepared and/or issued by Lehman Brothers Inc., member SIPC, and/or one of its affiliates (“Lehman Brothers”) and has been approved by Lehman Brothers International (Europe), authorized and regulated by the Financial Services Authority, in connection with its distribution in the European Economic Area. This material is distributed in Japan by Lehman Brothers Japan Inc., and in Hong Kong by Lehman Brothers Asia Limited. This material is distributed in Australia by Lehman Brothers Australia Pty Limited, and in Singapore by Lehman Brothers Inc., Singapore Branch (“LBIS”). Where this material is distributed by LBIS, please note that it is intended for general circulation only and the recommendations contained herein does not take into account the specific investment objectives, financial situation or particular needs of any particular person. An investor should consult his Lehman Brothers’ representative regarding the suitability of the product and take into account his specific investment objectives, financial situation or particular needs before he makes a commitment to purchase the investment product. This material is distributed in Korea by Lehman Brothers International (Europe) Seoul Branch.

EQUITY RESEARCH
13
This document is for information purposes only and it should not be regarded as an offer to sell or as a solicitation of an offer to buy the securities or other instruments mentioned in it. No part of this document may be reproduced in any manner without the written permission of Lehman Brothers. With the exception of disclosures relating to Lehman Brothers, this research report is based on current public information that Lehman Brothers considers reliable, but we make no representation that it is accurate or complete, and it should not be relied on as such. In the case of any disclosure to the effect that Lehman Brothers Inc. or its affiliates beneficially own 1% or more of any class of common equity securities of the subject company, the computation of beneficial ownership of securities is based upon the methodology used to compute ownership under Section 13(d) of the United States' Securities Exchange Act of 1934. In the case of any disclosure to the effect that Lehman Brothers Inc. and/or its affiliates hold a short position of at least 1% of the outstanding share capital of a particular company, such disclosure relates solely to the ordinary share capital of the company. Accordingly, while such calculation represents Lehman Brothers’ holdings net of any long position in the ordinary share capital of the company, such calculation excludes any rights or obligations that Lehman Brothers may otherwise have, or which may accrue in the future, with respect to such ordinary share capital. Similarly such calculation does not include any shares held or owned by Lehman Brothers where such shares are held under a wider agreement or arrangement (be it with a client or a counterparty) concerning the shares of such company (e.g. prime broking and/or stock lending activity). Any such disclosure represents the position of Lehman Brothers as of the last business day of the calendar month preceding the date of this report. This material is provided with the understanding that Lehman Brothers is not acting in a fiduciary capacity. Opinions expressed herein reflect the opinion of Lehman Brothers and are subject to change without notice. The products mentioned in this document may not be eligible for sale in some states or countries, and they may not be suitable for all types of investors. If an investor has any doubts about product suitability, he should consult his Lehman Brothers representative. The value of and the income produced by products may fluctuate, so that an investor may get back less than he invested. Value and income may be adversely affected by exchange rates, interest rates, or other factors. Past performance is not necessarily indicative of future results. If a product is income producing, part of the capital invested may be used to pay that income. © 2006 Lehman Brothers. All rights reserved. Additional information is available on request. Please contact a Lehman Brothers entity in your home jurisdiction. Lehman Brothers policy for managing conflicts of interest in connection with investment research is available at www.lehman.com/researchconflictspolicy. Ratings, earnings per share forecasts and price targets contained in the Firm's equity research reports covering U.S. companies are available at www.lehman.com/disclosures. Complete disclosure information on companies covered by Lehman Brothers Equity Research is available at www.lehman.com/disclosures.