Making a Difference · Making a Difference Local Government Authorities, Including Business Units...
153
Making a Difference Local Government Authorities, Including Business Units and Other State Entities 2007-2008 REPORT OF THE AUDITOR-GENERAL No. 1 of 2009 VOLUME ONE May 2009
Transcript of Making a Difference · Making a Difference Local Government Authorities, Including Business Units...

Phone (03) 6226 0100Fax (03) 6226 0199email [email protected] www.audit.tas.gov.au
Address Ground Floor, 144 Macquarie Street, HobartPostal Address GPO Box 851, Hobart 7001Office Hours 8.30am to 5pm Monday to Friday
Making a Difference Local Government Authorities, Including Business Units and Other State Entities 2007-2008
RepoRt of the AuditoR-GeneRAl no. 1 of 2009
VoluMe one
May 2009
Local Governm
ent Authorities, Including Business Units and O
ther State Entities 2007–2008 Repo
Rt of th
e Aud
itoR-G
eneR
Al n
o.1 of 2009 Volu
Me o
ne M
ay 2009

AUDIT MANDATE AND STANDARDS APPLIED
MANDATE
Section 17(1) of the Audit Act 2008 states that “… An accountable authority other than the Auditor-General, as soon as possible and within 45 days after the end of each financial year, is to prepare and forward to the Auditor-General a copy of the financial statements for that financial year which are complete in all material respects. …”
Under the provisions of section 18, the Auditor-General:
“...(1) is to audit the financial statements and any other information submitted by a State entity or an audited subsidiary of a State entity under section 17(1).
Under the provisions of section 19, the Auditor-General:
“...(1) is to prepare and sign an opinion on an audit carried out under section 18(1) in accordance with requirements determined by the Australian Auditing and Assurance Standards.
(2) is to provide the opinion prepared and signed under subsection (1), and any formal communication of audit findings that is required to be prepared in accordance with the Australian Auditing and Assurance Standards, to the State entity’s appropriate Minister and provide a copy to the relevant accountable authority.
STANDARDS APPLIED
Section 31 specifies that:
‘… The Auditor-General is to perform the audits required by this or any other Act in such a manner as the Auditor-General thinks fit having regard to –
(a) the character and effectiveness of the internal control and internal audit of the relevant State entity or audited subsidiary of a State entity; and
(b) the Australian Auditing and Assurance Standards. …’
The auditing standards referred to are Australian Auditing Standards as produced by the Australian Auditing and Assurance Standards Board.
ThE RoLE of ThE AUDIToR-GENERAL
The roles and responsibilities of the Auditor-General, and therefore the Tasmanian Audit Office, are set out in the Audit Act 2008.
Our major responsibility is to conduct financial or ‘attest’ audits of the annual financial reports of State entities. As defined by the Act, State entity includes all public sector entities including those established under the Local Government Act 1993. It includes an agency, council, Government Business Enterprise, State-owned Company, State Authority, Corporations established by the Water and Sewerage Corporations Act 2008 and the governing body of any corporation, body of persons or institution that are appointed by a Minister or by the Governor. We also audit those elements of the Treasurer’s Annual Financial Report which report on financial transactions in the Public Account, the General Government financial report and the Whole of Government financial report.
Audits of financial reports are designed to add credibility to assertions made by accountable authorities in preparing financial reports, enhancing their value to end users. Also, the existence of such audits provides a constant stimulus to State entities to ensure sound financial management.
In the main accountable authorities prepare financial reports consistent with Accounting Standards and other mandatory financial reporting requirements in Australia. On occasion reports are “special purpose financial reports” such as the Public Account Statements. In all cases our audits are conducted in accordance with Australian Auditing Standards.
Following a financial audit, we issue a variety of reports to State entities and report periodically to the Parliament. In combination these reports give opinions on the truth and fairness of financial reports, and comment on compliance with certain laws, regulations and Government directives. They may comment on financial prudence, probity and waste, and recommend operational improvements.
We also conduct performance audits and compliance audits. Performance audits examine whether a State entity is carrying out its activities effectively and doing so economically and efficiently and in compliance with relevant laws. Audits may cover all or part of a State entity’s operations, or consider particular issues across a number of State entities.
Compliance audits are aimed at ensuring compliance with directives, regulations and appropriate internal control procedures. Audits focus on selected systems (including information technology systems), account balances or projects.
Performance and compliance audits are reported separately and at different times of the year, whereas outcomes from financial statement audits are included in one of the regular volumes of the Auditor-General’s reports to the Parliament normally tabled in May and November each year. In doing so the Auditor-General is providing information to the Parliament to assist both the House of Assembly and the Legislative Council in their review of the performance of Executive Government.
Accountable authorities are provided with opportunity to comment on any matters reported. Where they choose to do so, their responses are detailed within the reports.

2009PARLIAMENT OF TASMANIA
REPORT OF THEAUDITOR-GENERAL
No. 1 of 2009
Volume One
Local Government Authorities, Including Business Units
and Other State Entities 2007-2008
May 2009
Presented to both Houses of Parliament in accordance with the requirements of Section 29 of the Audit Act 2008
By Authority:Government Printer, Tasmania
2009 (No. 4)
1

© Crown in Right of the State of Tasmania May 2009
Auditor-General’s reports are available from the Tasmanian Audit Offi ce, HOBART. This report and other recent reports published by the Offi ce can be accessed via the Offi ce’s home page. For further information, please contact:
Tasmanian Audit Offi ceGPO Box 851HobartTASMANIA 7001
Phone: (03) 6226 0100Fax: (03) 6226 0199Email: [email protected] Page: http://www.audit.tas.gov.au
This report is printed on recycled paper.
ISSN 1327 2608
2

19 May 2009
President Legislative Council HOBART
SpeakerHouse of AssemblyHOBART
Dear Sirs
In accordance with the requirements of Section 29 of the Audit Act 2008, I have pleasure in presenting my Report on the audit of the fi nancial statements of Local Government Authorities and other State entities for the year ended 30 June 2008, as well as three State entities that reported at 31 December 2008.
Yours sincerely
H M BlakeAuditor-General

FOREWORD
Local government councils in Tasmania are responsible for the delivery of a range of services to the community. To enable them to do so, in the fi nancial year ended 30 June 2008, councils generated total revenues of $770m, including rates of $434m, incurred expenditure of $714m and managed infrastructure and other non-current assets recorded at $7 026m. To enable the community to assess the fi nancial stewardship of councils, two essential accountability arrangements exist; the budget process and timely and accurate fi nancial reporting.
This Report summarises the results of external audit work conducted on all 29 Tasmanian councils, two local government business units and the three bulk water authorities. Specifi cally we note many councils continue to budget for defi cits. To ensure long term fi nancial sustainability, we would expect a council to, as a minimum, budget for a break-even operating result and then to meet its budget expectation. This Report also notes that improvements are needed in the timeliness and quality of fi nancial reporting.
Included again this year are summaries comparing the fi nancial performance of all councils. This highlights that 17 councils incurred operating defi cits which is essentially unchanged from the position reported in 2007 when operating defi cits were incurred by 18 councils. This Report will be tabled at a time when councils are preparing budgets for 2009-10. The fi nancial information, ratios and comparative performance provided will be useful to all councils as they determine levels of expenditure and rating for that period.
Also included in this Report are summaries of the fi nancial results of six other State entities including the University of Tasmania and of the fi nal six months fi nancial activities of TAFE Tasmania. The University is a signifi cant business in the Tasmanian context more so now following its integration with the Australian Maritime College. Its operating surplus of $7.310m was reasonable in the context of expected unrealised declines in its investment portfolio.
HM BlakeAuditor-General19 May 2009
4 Foreword

TABLE OF CONTENTS
1. FOREWORD 4
2. INTRODUCTION 6
3. MATTERS OF SIGNIFICANCE AND FOLLOW UP OF MATTERS PREVIOUSLY REPORTED 7
4. TIMELINESS AND QUALITY OF FINANCIAL STATEMENTS 15
5. BASIS FOR SETTING AUDIT FEES 20
6. AUDITS DISPENSED WITH 24
7. LOCAL GOVERNMENT RATING 26
8. LOCAL GOVERNMENT COMPARATIVE ANALYSIS 27
9. LOCAL GOVERNMENT BUSINESS UNITS 39
Copping Refuse Disposal Site Joint Authority 39
Dulverton Regional Waste Management Authority 45
10. LOCAL GOVERNMENT WATER AUTHORITIES 53
Cradle Coast Water 61
Esk Water Authority 69
Hobart Regional Water Authority 77
11. OTHER STATE ENTITIES REPORTING AT 30 JUNE 2008 87
Local Government Association of Tasmania 87
Rivers and Water Supply Commission 95
The Nominal Insurer 103
12. OTHER STATE ENTITIES REPORTING AT 31 DECEMBER 2008 108
University of Tasmania 108
Theatre Royal Management Board 118
TAFE Tasmania 124
13. APPENDIX 1 - GUIDE TO USING THIS REPORT 130
14. APPENDIX 2 - ENGAGEMENT LETTER 135
15. APPENDIX 3 - AUDIT STATUS 143
16. APPENDIX 4 - LIST OF ACRONYMS AND ABBREVIATIONS 144
17. APPENDIX 5 - RECENT REPORTS 145
18. INDEX 146
VISION & VALUES 149
5

INTRODUCTION
This Report deals with the outcomes from fi nancial statement audits of Local Government Authorities, other public bodies and three public bodies with 31 December 2008 balance dates. In addition a comparative analysis covering all councils and water authorities is again included.
FORMAT OF THE REPORT
Unless specifi cally indicated, comments in this Report are current as at 16 April 2009.
The Report is based on the administrative arrangements set out under the provisions of the Administrative Arrangements Act 1990 as at 30 June 2008 and has been prepared in accordance with the following classifi cations:
• Introduction
• Matters of Signifi cance and Follow-Up of Matters Previously Reported
• Timeliness and Quality of Financial Statements
• Basis for Setting Audit Fees
• Audits Dispensed With
• Local Government Rating
• Local Government Comparative Analysis
• Local Government Business Units
• Local Government Water Authorities
• Other State Entities reporting at 30 June 2008
• Other State Entities reporting at 31 December 2008.
This classifi cation does not attempt to recognise any lines of responsibility that some Authorities have through Ministerial Departments to the appropriate Minister, however the Portfolio or Responsible Minister is stated in each case, except in the case of Local Government Authorities, including Water Authorities, where the Responsible Minister is the Minister for Local Government.
Local Government Authorities have been grouped in the body of this report in line with categories used in the annual Measuring Council Performance in Tasmania Report published by the Local Government Offi ce. Individual chapters for each of Tasmania’s 29 Councils appear in Volume 2 of this report. The responsible minister for Local Government Authorities is the Minister for Local Government.
ENGAGEMENT LETTER
Included in our Report is an engagement letter addressed to the Speaker of the House of Assembly and to the President of the Legislative Council, see Appendix 2.
The purpose of this letter is to detail the approach that we will follow in the conduct of audits required to be performed by us pursuant to the provisions of the Audit Act 2008 (The Audit Act) which updates a previous letter included in our Report No 1 in June 2006. It is not a requirement that we detail this information but we regard it as good practice to do so and it should provide the President, the Speaker and Members of the Legislative Council and the House of Assembly with an understanding of how audit work is conducted by our Offi ce.
6 Introduction

MATTERS OF SIGNIFICANCE AND FOLLOW-UP OF MATTERS PREVIOUSLY REPORTED
This Report contains analysis of fi nancial information of local government authorities and other State entities.
The accompanying text summarises signifi cant matters identifi ed from our analysis of the fi nancial statements. A cross reference to the relevant detailed report is provided. Not included are fi nancial and reporting matters that are common across State entities, such as timeliness of reporting, because these are dealt with separately in this volume.
Our Report includes details of matters raised with entity management during the course of audits, but only where the matter(s) raised was signifi cant. The rationale for inclusion or otherwise rests on our perception of the public interest in each point and the need to confi ne comments to those matters that have more than a managerial dimension. Also included are a comparison of water entities and a brief report following legal advice obtained regarding local government rating. A section is again included here following up matters reported in previous Reports to Parliament.
MATTERS IDENTIFIED IN PREVIOUS REPORTS
This section summarises actions arising from matters highlighted in audits completed prior to 30 June 2008 and, where relevant, audits for the current period.
Valuation of Long-lived Property, Plant and Equipment (30 June 2007 Financial Statements)
- June 2008 Report No. 1, Page 10
In our previous report on fi nancial statements in 2006-07, for a number of reporting entities, we raised concerns with management over the valuation basis adopted. This was chiefl y in relation to the carrying of long-lived assets at cost, or where the previous valuation was some years old. The concern here was that fi nancial reports may not show a true and fair view, or present fairly, in all material respects, the true fi nancial position.
Concerns were raised formally with the following entities:
• Circular Head Council – June 2008 Report No. 1, Page 90,
• Dorset Council – June 2008 Report No. 1, Page 103,
• Huon Valley Council – June 2008 Report No. 1, Page 130,
• Meander Valley Council – June 2008 Report No. 1, Page 156.
These entitles were encouraged to review their individual valuation basis for long-lived Property, plant and equipment, to ensure they continue to present fairly their fi nancial position.
Circular Head CouncilThe revaluation of transport infrastructure, water and sewerage as at 30 June 2008 resulted in an increase of $25.810m in the asset values recorded by Council. This represented an increase of 35.19% in the value of Property, plant and equipment. Revaluations were effective 30 June 2008 and did not, therefore, impact the depreciation charges in the Income Statement.
7 Matters of Signifi cance and Follow up of Matters Previously Reported

Dorset CouncilIn 2007-08 Council undertook revaluations of its land and building assets, sewerage infrastructure and stormwater infrastructure, resulting in a revaluation increment of $1.724m.
Huon Valley CouncilCouncil undertook a full revaluation of its major asset classes of roads, water, bridges, sewerage and stormwater in 2007-08 which contributed $41.277m to the increase in Property, plant and equipment and Reserves. Of the remaining assets reported at fair value, Land and buildings are scheduled for revaluation in 2008–09.
Meander Valley CouncilCouncil continued its revaluation program and undertook a review of land, buildings, bridges and stormwater in 2007-08. These contributed $11.803m to the increase in Property, plant and equipment and Reserves.
MATTERS ARISING FROM CURRENT AUDITS
Local Government Comparative Analysis(30 June 2008 Financial Statements)
In addition to the matters raised below, a number of other items are commented on in the Local Government Comparative Analysis section of this Report.
Recurring Defi cits in Local Government Authorities(30 June 2008 Financial Statements)
A number of councils continue to incur defi cits before capital grants, contributions and revaluation increments. This position cannot be sustained over the medium to long term and action is needed to increase revenues or reduce costs to the point where all costs are covered from normal operating revenues. In the relevant sections of this Report we have noted defi cits at the following entities:
• Central Coast Council *
• Central Highlands Council **
• Derwent Valley Council
• Devonport City Council *
• Flinders Council **
• Glamorgan Spring Bay Council
• Glenorchy City Council **
• Hobart City Council *
• Kentish Council *
• Northern Midlands Council *
• Sorell Council **
• Southern Midlands Council **
8 Matters of Signifi cance and Follow up of Matters Previously Reported

All of these councils recorded a defi cit for a minimum of three successive fi nancial years. Those noted above with a “*” budgeted for an operating defi cit before capital grants and contributions. Those with “**” budgeted for an overall defi cit, irrespective of additional capital grants and contributions. To ensure long-term fi nancial sustainability, we would expect a council, as a minimum, to budget for a break-even operating result before capital grants, contributions and revaluation increments.
Maintenance of Infrastructure Assets in Local Government Authorities(30 June 2008 Financial Statements)
As in previous reports we raised concerns for a number of reporting entities over their level of reinvestment in infrastructure assets. We expected to fi nd asset replacement programs consistent with depreciation charges being incurred. For a council, for example, a low level of reinvestment in existing infrastructure assets indicates that council may not be suffi ciently rating to maintain the current level of infrastructure and services. The Capital expenditure to depreciation and Capital expenditure on existing assets to depreciation ratios in the Financial Analysis section of each reporting entity within this Report provides detailed comments where relevant.
The following entities all recorded a Capital expenditure on existing assets to depreciation ratios below the benchmark of 100%:
• Brighton Council *
• Burnie City Council *
• Central Coast Council *
• Central Highlands Council *
• Clarence City Council *p
• Derwent Valley Council
• Devonport City Council *
• Dorset Council *
• Esk Water Authority *p
• Flinders Council *
• George Town Council *p
• Glenorchy City Council *p
• Hobart City Council
• Kentish Council
• Kingborough Council *
• Latrobe Council *
• Launceston City Council *
• Meander Valley Council *
• Sorell Council *
• Southern Midlands Council *
• Waratah-Wynyard Council
• West Coast Council p
A low ratio in a single year may not be a cause for concern, especially where there is a strategic capital works program or positive history of suffi cient investment. However, those noted above with a “*” recorded, for a minimum of three successive fi nancial years, a ratio below the benchmark for the existing capital expenditure to depreciation ratio. Such a trend may indicate insuffi cient investment to maintain the entities’ asset base. Those noted with “p” have a strategic capital works program.
9 Matters of Signifi cance and Follow up of Matters Previously Reported

Ensuring fair values remain current(30 June 2008 Financial Statements)
For a number of years we have been concerned about accounting and asset management practices by councils associated with long-lived infrastructure assets such as roads, bridges, water, sewerage, drainage, land and buildings. AASB 116 Property, Plant and Equipment requires entities measuring Property, plant and equipment at fair value to carry out revaluations with suffi cient regularity to ensure that the carrying amount does not differ materially from that which would be determined using fair value at reporting date.
While we accept that it is not practical or cost effective for all entities to revalue assets annually, the use of appropriate indexes, applied as an interim measure, can ensure compliance with the requirements of AASB 116. In the absence of annual revaluations or indexing, the carrying amount of assets at fair value has the potential to become materially understated. Ideally assets should be revalued every three to fi ve years.
In the relevant sections of this Report we raised concerns in respect of 2007-08 for the following entities:
Councils
• Brighton Council
• Sorell Council
• West Coast Council
Those charged with governance of state sector entities are responsible for ensuring that application of Australian Accounting Standards results in fi nancial reports fairly presenting in all material respects or giving a true and fair view. They must take steps to ensure that the model they apply for recognising long-lived assets results in a true and fair view at each balance date.
US Sub-prime Market Downturn(30 June 2008 Financial Statements)
In Report No.2 of 2008 tabled in November 2008, we highlighted concerns regarding investments in Collateralised Debt Obligations (CDOs) for three audits still underway at that time. These audits have since been completed and we are now in a position to provide updated information as follows:
Council Valuation Date Face Value Write Down Fair Value
$’000s $’000s $’000s
Circular Head 28 February 2009 4 500 4 382 117Huon Valley 30 September 2008 4 000 3 218 782Sorell 30 September 2008 500 296 204
Australian Accounting Standard AASB 110 Events after the Balance Date required the unfavourable unrealised decline in value of these investments to be recognised in the respective council’s fi nancial report. At the respective reporting dates, although the fair value of the investments had fallen and the market was illiquid, all councils were still receiving interest instalments.
While the above councils were negatively impacted by investing in CDOs, we note they did not contravene the broad investment guidelines in the Local Government Act 1993. In addition, councils must comply with the Trustee Act 1898, which also provides broad guidelines and criteria that a trustee should take into account when investing. As part of a compliance audit we plan to assess whether council investment policies have due regard for these factors.
10 Matters of Signifi cance and Follow up of Matters Previously Reported

Bushfi re Funding, Break O’Day Council (30 June 2008 Financial Statements)
During 2006-07 Council received $0.419m in trust to administer Community Recovery Initiatives in relation to the December 2006 East Coast bushfi res. These funds formed part of the total fi nancial assistance distribution administered by the Red Cross, Department of Economic Development and Tourism and Council.
The trust funds did not form part of Council operations and were to be distributed in accordance with the Community Recovery Fund Deed of Agreement. The majority of the funds were received from the State government, $0.416m, with the balance comprising donations from various sources.
The following table shows the Income Statement relating to the Community Recovery Grant funds for the period ended 30 June 2008. The total income of $0.419m was recorded in Council’s cash balance and as a liability (trust funds held) at 30 June 2007. A total of $0.233m was expended during 2007-08 on projects and activities related to the recovery of the community from the bushfi res, leaving available funds of $0.186m at 30 June 2008. These funds were recorded in Council’s cash balance and as a liability at this date.
Community Recovery Grant for the December 2006 East Coast Bushfi resIncome Statement for the Period Ended 30 June 2008
Income $’000s
Grants 416 Donations 3
Total Income 419
Expenditure
Community Recovery Funding Tier 2 - F Bradley 10 Community Recovery Funding Tier 2 - Blue Seas 7 Community Recovery Funding Tier 2 - White Sands 10 Recovery Engagement Strategy 1 Local Engagement in Recovery Activities 8 St Marys Emergency Services Centre 49 Beaumaris hinterland fuel risk reduction 3 Fire Defence Preparation and Recovery Info Sheets 1 Fire Fighter Recognition 1 Fire Control Property Management Planning 7 Scamander Mouth Public Amenities Part A 29 Cornwall Park Amenities - Shelter and BBQ 22 Resident’s fi re stories publication 10 Disaster Recovery Co-Ordinator Expenses 75
Total Expenditure 233
Available Funds 186
11 Matters of Signifi cance and Follow up of Matters Previously Reported

The trust funds received by Council were utilised, as approved by the Affected Area Recovery Committee (AARC), for the benefi t of the Break O’Day community affected by the bushfi res.
AARC was established to develop and co-ordinate a recovery plan and to assist Local Government in the long-term recovery of communities impacted by the East Coast Bushfi res of December 2006 and to facilitate the effective co-ordination of recovery through information sharing and collective decision making.
AARC adopted a Recovery Plan and part of the plan was to form a Community Recovery Reference Group (CRRG) and appoint a Disaster Recovery Co-ordinator. The Recovery Plan was developed following community planning forums and outlined a number of broad strategies which targeted issues raised by the community. The CRRG was formed to assist in the recovery process and was made up of community members.
In consultation with the Disaster Recovery Co-ordinator, the CRRG determined what projects should be put forward to AARC for funding approval. Once AARC had approved the project, either the Disaster Recovery Co ordinator or Council were responsible for the project until completion.
The remaining trust funds, $0.186m, are due to be expended on the committed projects listed in the table below. All projects are due to be completed in 2008–09, except for the Beaumaris to Scamander Multi Use Path. The acquisition of land required for construction of the path is yet to be fi nalised.
Committed Project Balances $’000s
Community Recovery Funding Tier 2 - Murfet 10 Local Engagement in Recovery Activities 9 Fire Recovery Event 4 Economic Recovery - Event support 2 St Marys Emergency Services Centre - GST Component - TFS 5 Community Training and Skill Development 5 2 x Sat Phones 2 Cornwall Park Amenities - DA fees 1 Four Mile Creek Management Plan 5 Four Mile Creek Playground Fence 10 Four Mile Creek Outdoor Noticeboard 1 Four Mile Creek Gravel Pathway 3 St Marys Pergola 13 Fire Defence Preparation and Recovery Info Sheets 1 Beaumaris to Scamander Multi Use Path Planning (in Wages) 14 Beaumaris to Scamander Multi Use Path Construction 85
Total Committed Balances 169
Balance of Funds to be Expended 17
12 Matters of Signifi cance and Follow up of Matters Previously Reported
AUDIT FINDINGS 2007-08 INCLUDING STATE ENTITIES REPORTING AT 31 DECEMBER 2008
The comments in this section apply to our audits of all State entities, not just the entities covered by this Report.
As part of the overall audit process, management letters noting any signifi cant, moderate, or minor audit fi nding are sent to the relevant accountable authority. Where appropriate, management letters are also forwarded at the conclusion of interim audits. In many instances, shortcomings were reviewed by management and policies, procedures or practices improved prior to fi nalisation of the audit. However, where they remain outstanding, responses or further action being undertaken was noted. Matters raised are considered in forming our audit opinions and noted for review in the next audit cycle.
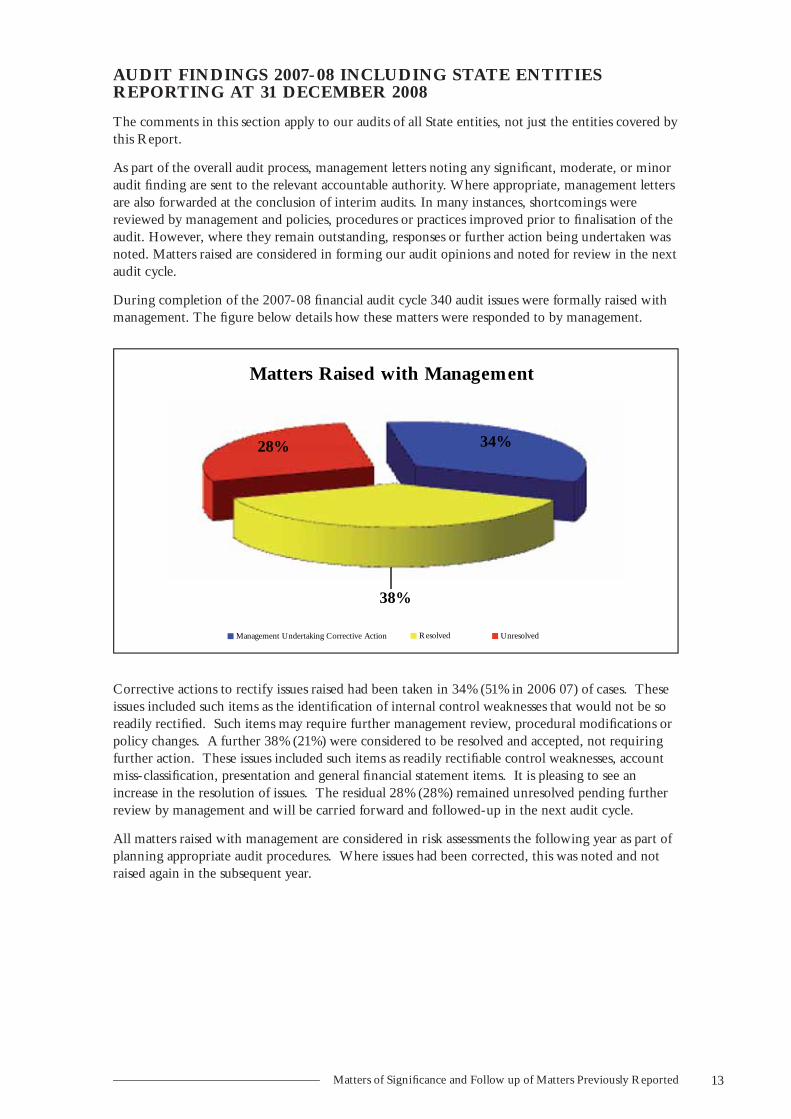
During completion of the 2007-08 fi nancial audit cycle 340 audit issues were formally raised with management. The fi gure below details how these matters were responded to by management.
Corrective actions to rectify issues raised had been taken in 34% (51% in 2006 07) of cases. These issues included such items as the identifi cation of internal control weaknesses that would not be so readily rectifi ed. Such items may require further management review, procedural modifi cations or policy changes. A further 38% (21%) were considered to be resolved and accepted, not requiring further action. These issues included such items as readily rectifi able control weaknesses, account miss-classifi cation, presentation and general fi nancial statement items. It is pleasing to see an increase in the resolution of issues. The residual 28% (28%) remained unresolved pending further review by management and will be carried forward and followed-up in the next audit cycle.
All matters raised with management are considered in risk assessments the following year as part of planning appropriate audit procedures. Where issues had been corrected, this was noted and not raised again in the subsequent year.
34%
38%
28%
Matters Raised with Management
Management Undertaking Corrective Action Resolved Unresolved
13 Matters of Signifi cance and Follow up of Matters Previously Reported

To assist us in the identifi cation of trends and management of audit risk, we categorised audit issues raised with management as follows:
The area with the greatest proportion of audit issues at 24% was employee expenses. In most cases this related to the management of excessive leave balances and the preparation and disclosure of annual and long service leave. Issues in this area doubled in proportion to 2006-07 (12%).
Non-current physical assets rated second at 18%. The most common matter raised within this category was in relation to appropriate and timely valuation of non-current physical assets. This area ranked fi rst in 2006-07 (18%) and remains a key area of concern.
Equal third were audit issues relating to revenue and receivables and expenditure and accounts payable at 14%. Revenue and receivable matters related to internal control weaknesses, revenue recognition and procedures relating to debtors and provisions for impairment. Revenue and receivable matters increased marginally from the 2006-07 proportion of 12%. Expenditure and accounts payable matters related to internal control weaknesses, including adequateness of supporting documentation, and procedures relating to capturing year end creditors. There has been an increase in expenditure and accounts payable issues from the 2006-07 comparison of 9%.
Cash & Financing 9% Expenditure & Accounts
Payable 14%
Employee Expenses 24%
Financial Management Practice Manual
4% Financial Statement Related Issue 8%
Information Systems 2%
Liabilities 2%
Non-Current Physical Assets 18%
Other 5%
Revenue & Receivables 14%
Issue By Category
Cash & Financing Expenditure & Accounts Payable Employee Expenses
Financial Management Practice Manual Financial Statement Related Issue Information Systems
Liabilities Non-Current Physical Assets Other
Revenue & Receivables
P
14 Matters of Signifi cance and Follow up of Matters Previously Reported

TIMELINESS AND QUALITY OF FINANCIAL STATEMENTS
STATUTORY FINANCIAL REPORTING REQUIREMENTS
Local Government Councils
Pursuant to the Local Government Act 1993 council General Managers are required to prepare fi nancial statements within 90 days after the end of the fi nancial year, being no later than 30 September, and submit them to us as soon as practicable. There was no legislated requirement for the audit to be completed within a specifi ed timeframe but in all cases we endeavoured to complete the audits in time for papers to be distributed in advance of Council annual general meetings, which must be held by no later than 15 December.
Local Government Joint Authorities
The fi nancial reporting requirements for Joint Authorities are the same as those for local government councils.
Other State entities
Financial reporting requirements vary depending on the nature of the entity and their establishing legislation. Details are provided for each entity later in this Chapter.
STATE ENTITIES REPORTING AT 30 JUNE 2008
This Report contains the results of three State entities whose audits were not completed in time for inclusion in our Report No 2 tabled in November 2008. These entities, and their performance in meeting their statutory fi nancial reporting requirements, were:
Local Government Association of Tasmania (LGAT)
The Local Government Act 1993 requires LGAT to prepare an annual fi nancial statement by 31 August and submit this to the Auditor-General. Draft fi nancial statements were received on 31 August 2008 with signed fi nancial statements received on 22 January 2009 and the audit report issued on the same day.
LGAT did not meet its statutory fi nancial reporting requirements.
Rivers and Water Supply Commission (RWSC)
RWSC was required to complete its annual fi nancial statements and submit them for audit by 15 August 2008. This requirement was satisfi ed with signed statements received on 15 August 2008. However, adjustments were identifi ed by the audit process resulting in fi nal signed fi nancial statements being received on 29 October 2008 and an unqualifi ed audit report was issued on 30 October 2008.
The Nominal Insurer
The Workers Rehabilitation and Compensation Act 1988 (1988 Act) requires the Nominal Insurer to provide to the Auditor-General fi nancial statements within 45 days after the end of the fi nancial year. Signed fi nancial statements were received on 18 December 2008 and an unqualifi ed audit report was issued on the same day.
The Nominal Insurer did not meet its statutory fi nancial reporting deadline.
15 Timeliness and Quality of Financial Statements

STATE ENTITIES REPORTING AT 31 DECEMBER 2008
This Report contains the results of three State entities which reported at 31 December 2008. These entities, and their performance in meeting their statutory fi nancial reporting requirements, were:
TAFE Tasmania
TAFE Tasmania’s statutory balance date is 30 June. As an entity reporting under the Financial Management and Audit Act 1999, it was required to prepare fi nancial statements for audit within 45 days. However, TAFE ceased operations on 31 December 2008 and there was no statutory requirement for the TAFE Board to prepare fi nancial statements at this date or to have them audited. However, consistent with good practice statements were prepared. Signed fi nancial statements were received on 27 March 2009 and an unqualifi ed audit report was issued on the same day.
Theatre Royal Management Board
The Theatre Royal Management Act 1986 requires the Board to complete fi nancial statements by no later than 31 March. Financial statements for the year ended 31 December 2008 were signed on 4 March 2008 and an unqualifi ed audit report was issued on 5 March 2008. The Board met its statutory fi nancial reporting deadline.
University of Tasmania
The University of Tasmania Act 1992 requires the University Council to complete its annual report, including its fi nancial statements, by 30 June each year. Signed fi nancial statements were received on 13 February 2009 and an unqualifi ed audit report was issued on 20 February 2009.
Completion of the fi nancial report by the University’s fi nance staff for approval by the University Council by 13 February was signifi cantly earlier than prior years.
LOCAL GOVERNMENT JOINT AUTHORITIES
The table below summarises the performance by fi ve Joint Authorities included in this Report in satisfying their legislated fi nancial reporting requirement.
Submission of fi nancial statements for audit by Local Government Joint Authorities for the 2007-08 fi nancial year
Joint Authority Date initial
signed statements
received by Audit
Date amended
or re-signed
statements
received by Audit
Date of audit
report
Comment
Copping Refuse Disposal 4 November n/a* 18 December 1
Dulverton Regional
Waste Management 19 January 2009 n/a 19 January 2009 2
Cradle Coast Water 18 August n/a 7 October 3
Esk Water 27 August n/a 11 September 3
Hobart Regional Water 26 September n/a 26 September 3
n/a – not applicable
Comments
1. Copping did not meet its statutory fi nancial reporting deadline. 2. Dulverton did not meet its statutory fi nancial reporting deadline and changes were required to
the statements initially submitted for audit.3. All three bulk water authorities satisfi ed their statutory fi nancial reporting deadlines.
16 Timeliness and Quality of Financial Statements

LOCAL GOVERNMENT COUNCILS
The table below summarises the performance by Tasmania’s 29 councils in satisfying their legislated fi nancial reporting requirement.
Submission of fi nancial statements for audit by Local Government Councils for the 2007-08 fi nancial year
Council Date initial
signed
statements
received by
Audit
Date amended
or re-signed
statements
received by
Audit
Date of audit
report
Comment
Cities
Burnie 29 September 6 November 20 November 1
Clarence 26 September 25 October 4 November 1
Devonport 30 October n/a 13 November 2
Glenorchy 24 September n/a 24 September 3
Hobart 10 September n/a 16 October 3
Launceston 30 September n/a 13 October 3
Large Urban/Rural
Central Coast 15 August 28 August 9 September 3
Circular Head 15 October 27 March 09 27 March 09 2
Huon Valley 30 September 30 October 30 October 1
Kingborough 25 August 29 September 20 October 3
Meander Valley 25 September 12 November 17 November 1
Waratah-Wynyard 2 September 5 September 17 September 3
West Tamar 19 August 28 August 9 September 3
Medium Rural
Brighton 30 October n/a 26 November 2
Derwent Valley 30 September 21 November 21 November 1
Dorset 8 September 2 December 3 December 1
George Town 20 October 5 December 15 December 2
Latrobe 26 November n/a 11 December 2
Northern Midlands Council 21 November 18 December 19 January 2
Sorell 1 October 22 December 23 December 4
West Coast 30 September 23 October 31 October 1
Smaller Rural
Break O’Day 26 September 23 October 31 October 1
Central Highlands 23 September 25 November 26 November 1
Flinders 3 December n/a 8 December 2
Glamorgan S/Bay 29 September 20 November 21 November 1
Kentish 31 August 12 November 13 November 1
King Island 24 September 2 November 14 November 1
Southern Midlands 29 September 3 November 6 November 1
Tasman 28 September 28 November 29 November 1
Comments
1. These Councils all satisfi ed their legislated responsibilities but the fi nancial statements submitted required amendment prior to fi nal completion and audit.
2. These Councils submitted their fi nancial statements late therefore failing to comply with the Local Government Act 1993.
3. These Councils satisfi ed their legislated fi nancial reporting requirements. 4. This Council was marginally late in meeting the 30 September deadline for submitting its
fi nancial statements. However, the fi nancial statements submitted required amendment prior to fi nal completion and audit.
17 Timeliness and Quality of Financial Statements

In summary:
Eight councils, two Joint Authorities and two other State entities failed to meet their statutory fi nancial reporting deadlines.
The fi nancial statements of 22 councils, one Joint Authority and two other State entities required amendment prior to audit completion. The amendments were initiated either by management or by the audit process.
This high level of failure to comply with statutory reporting requirements and the still higher number of occasions where fi nancial statements required amendment is disappointing. This is particularly so bearing in mind that the new Audit Act 2008 (the Audit Act) will require all State entities (including councils and Joint Authorities) to submit fi nancial statements for audit within 45 days.
Fortunately the Audit Act provides for transitional arrangements for those State entities not currently required to submit statements within 45 days. These State entities will not be bound by this requirement until the fi nancial year commencing after 30 June 2010. Therefore,
• State entities with a 30 June balance date – must submit their June 2011 fi nancial statements within 45 days, and
• State entities with a December balance date, must submit their December 2011 fi nancial statements within 45 days.
Steps taken by Audit to facilitate earlier fi nancial reporting
We continue to assist State entities to achieve early fi nancial reporting. This is done in a number of ways including:
• Where possible early planning of audits. As part of planning audits discussions are held with management and where relevant those charged with governance and agreements reached on fi nancial reporting and auditing timeframes. These are always aimed at completion within statutory reporting deadlines.
• In the case of entities to which the transitional arrangements will apply (primarily councils), audit plans are proposing gradual tightening of completion timeframes so that by 2011 the revised deadlines can be achieved.
• Preparation of detailed completion timeframes for components of the fi nancial statements.
• Where fi nancial systems allow, conducting audit testing of selected balances prior to balance date thus minimising work post balance date.
The success of these measures was evident at the University of Tasmania where completion of the fi nancial statements was brought forward from 14 April in 2008 to 13 February in 2009
Another initiative, now in its 11th year, is awards for the best working papers supporting fi nancial statements. Separate awards are made for the different types of public sector entities. The purposes of effective fi nancial statement working papers include:
• A framework for the compilation of fi nancial statements by current and future preparers
• A central reference to the evidence required to support transactions, balances and estimates disclosed in the fi nancial statements
• A trail between the entity’s fi nancial records for the year and the fi nancial statements for the year, which can be followed by persons having a quality assurance function
• A record of the quality control processes employed in the preparation of the fi nancial statements.
18 Timeliness and Quality of Financial Statements

This process assists our staff in the conduct of audits and, more importantly, assists entity accounting staff in the timely completion of accurate and quality assured statements. At recently held client seminars awards were presented to the following for 2007-08 fi nancial year:
Annual Working Paper Awards
Category Overall Winner Highly Commended
AgenciesDepartment of Primary
Industries and WaterDepartment of Premier and
Cabinet
Local Government Central Coast CouncilWest Tamar Council and
Hobart City Council
Government Business Enterprises and State-owned companies
Metro TasmaniaMotor Accident Insurance Board
Statutory Authorities and other State entities
TAFE Tasmania n/a
19 Timeliness and Quality of Financial Statements

BASIS FOR SETTING AUDIT FEES
BACKGROUND
In my November 2008 report I advised that I would provide information regarding proposed 2008-09 fees together with a more detailed analysis of the methodology used to determine them. Audit fees are not charged for performance audits, compliance audits or investigations.
LEGISLATIVE REQUIREMENTS – Part 4 Division 1 - Functions as to the State, State entities, subsidiaries and related entities
Section 27 of the Audit Act 2008 (Audit Act) provides that:
“(1) The Auditor-General is to determine whether a fee is to be charged for an audit carried out by the Auditor-General under this Division and, if so –
(a) the amount of that fee; and
(b) the accountable authority liable to pay that fee.”
In relation to the tabling of Auditor-General’s reports on fi nancial statements of State entities the Audit Act also requires the following at section 29(3):
“(3) A report under subsection (1) is to describe the basis on which audit fees are calculated.”
DETERMINATION
We have determined that an audit fee will be charged for the audits of the fi nancial statements of all State entities other than the University of Tasmanian Foundation Inc.
PRINCIPLE FOR AUDIT FEE DETERMINATION
Fees are set for each commensurate with the size, complexity and risks of the engagement. These factors affect the mix of staff we assign to each audit and therefore the overall fee. Staff are assigned charge rates for use in determining the allocation of work on the audit and in computing the fee.
There is an expectation that audits of similar complexity and risks will have a similar mix of staff.
PRINCIPLE FOR DETERMINING CHARGE RATES
Charge rates are based on the principle of the offi ce being able to recover its costs of operation. Charge rates comprise two parts, direct salary cost and overhead recovery. To this base fee we add direct travel costs attributable to each audit. Other incidentals are covered by the overhead rate. Fees advised to the clients are all inclusive before GST.
20 Basis for Setting Audit Fees

BASIS OF FEES
Fees are calculated on the basis that:
• current accounting systems will be operating throughout the year with a satisfactory appraisal of internal control
• no errors or issues requiring signifi cant additional audit work will be encountered
• the standard period-end general ledger reconciliations will be available at the commencement of our year-end audit
• assistance for our staff will be provided with respect to reasonable requests for additional schedules and analysis throughout the audit
• agreed timetables will be met within reason, particularly with regards to the preparation of the fi nancial statements
• the fi nancial statements presented for audit are complete and do not require ongoing changes/adjustments
• additional work (including new accounting standards or issues associated with key risks and other matters arising) will be billed separately if it cannot be absorbed into the existing fee
• the nature of the Entity’s business and scale of operations will be similar to that of the previous fi nancial year
• fees incorporate fi nancial disclosure and other specifi c audit related advice not resulting in material additional audit work.
Additional audit work, including the audit of grant acquittals and similar compliance or regulatory statements, will be discussed and negotiated with client fi nancial management staff as required. Work performed will be in accordance with applicable auditing standards.
ADDITIONAL AUDIT FEES
If the circumstances outlined under the section headed “Basis of Fees” change in a year, we would seek additional fees from the client. Any future impact of agreed additional fees would be assessed in terms of the ongoing audit fee.
ADJUSTMENT TO FEES
In recognition that the major component of our costs are salary or salary related, fees will generally be adjusted annually in accordance with increases in Average Weekly Ordinary Time Earnings (AWOTE) as published by the Australian Bureau of Statistics each May.
Fees may be adjusted beyond the above in the following circumstances:
• Changes to the size and nature of the entity and its operations.
• Changes to the risks associated with a particular engagement.
• Changes to accounting and auditing standards requiring greater effort on our part.
• Unavoidable increases in costs of maintaining our Offi ce.
21 Basis for Setting Audit Fees
TRANSPARENCY OF INDIVIDUAL AUDIT FEES
We have chosen to make the fee setting process for individual State entities more transparent. As a consequence, our staff are now required to explain:
• the specifi c factors taken into account in proposing the fee (particularly the risk assessment)
• the assumptions upon which the fee is based in terms of, for example, the standard of the client’s control environment, coverage of internal audit, quality of working papers and so on
• what is included in the fee and what is not included
• what specifi c actions the client could take to reduce the level of its audit fee in the future
• the processes for agreeing additional fees if circumstances change or the assumptions upon which the fee is based are not met.
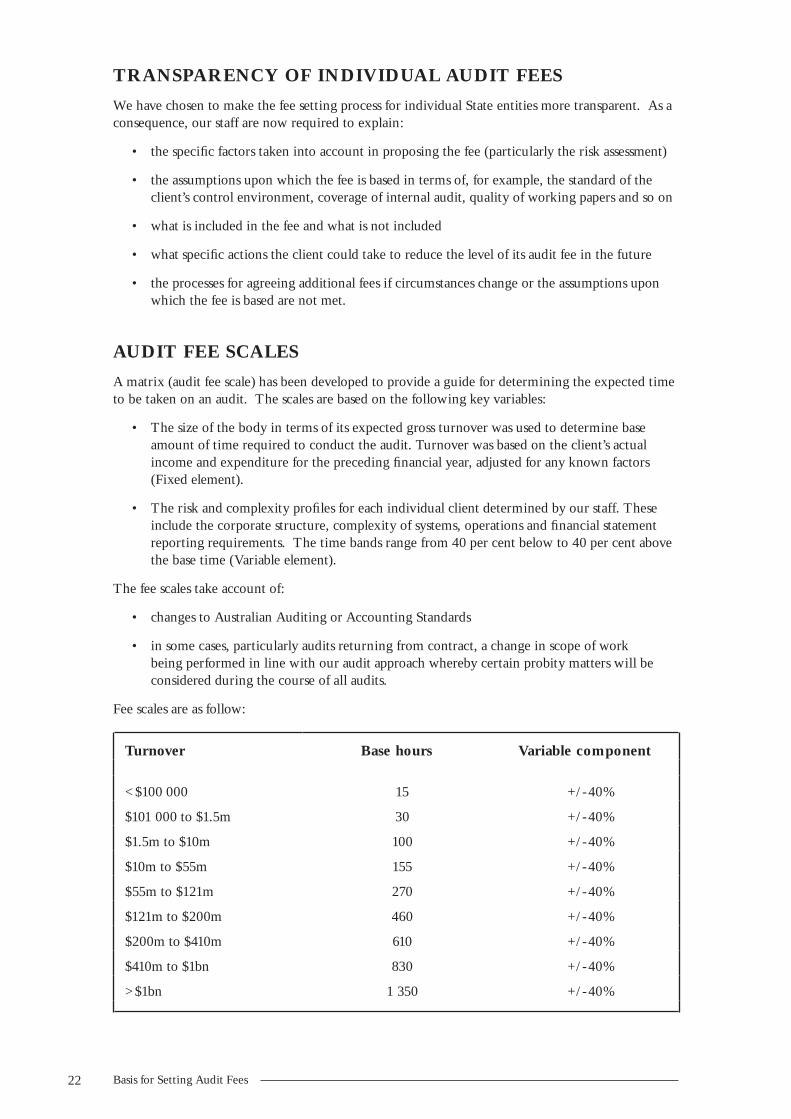
AUDIT FEE SCALES
A matrix (audit fee scale) has been developed to provide a guide for determining the expected time to be taken on an audit. The scales are based on the following key variables:
• The size of the body in terms of its expected gross turnover was used to determine base amount of time required to conduct the audit. Turnover was based on the client’s actual income and expenditure for the preceding fi nancial year, adjusted for any known factors (Fixed element).
• The risk and complexity profi les for each individual client determined by our staff. These include the corporate structure, complexity of systems, operations and fi nancial statement reporting requirements. The time bands range from 40 per cent below to 40 per cent above the base time (Variable element).
The fee scales take account of:
• changes to Australian Auditing or Accounting Standards
• in some cases, particularly audits returning from contract, a change in scope of work being performed in line with our audit approach whereby certain probity matters will be considered during the course of all audits.
Fee scales are as follow:
Turnover Base hours Variable component
<$100 000 15 +/-40%
$101 000 to $1.5m 30 +/-40%
$1.5m to $10m 100 +/-40%
$10m to $55m 155 +/-40%
$55m to $121m 270 +/-40%
$121m to $200m 460 +/-40%
$200m to $410m 610 +/-40%
$410m to $1bn 830 +/-40%
>$1bn 1 350 +/-40%
22 Basis for Setting Audit Fees

Bandings are based on current cost experience in conducting audits.
After applying the above model, the hours to undertake the audit are allocated according to the staff mix necessary to conduct the audit. The respective charge rates of staff are then applied to the allocated hours so as to determine a dollar amount (the audit fee). Where applicable, travel and other direct costs (out of pocket expenses) are added to the audit fee on a full cost recovery basis.
FEE SETTING
It is important to emphasise that the fee scales only provide a framework within which we set the actual fees charged to individual clients.
The level of fee, and any increase, experienced by individual clients will therefore vary according to local circumstances and the risks each body faces.
In certain circumstances, for example where a client faces a particular challenge to manage high risks or there are particular local circumstances, a fee may fall outside the appropriate bands. In these cases, the audit fee will be determined in discussion between our staff and client management, to refl ect our assessment of risk and the extent and complexity of the audit work required.
SKILL-RELATED FEE SCALES
In certain circumstances, we may need to use staff with specialist skills in order to review specifi c local issues. The Offi ce encourages the appropriate use of senior and specialist staff on the more complex parts of audits and recognises that additional costs may be incurred.
To facilitate the use of appropriately skilled staff, the actual fee charged will be determined in discussion between our staff and the client management to refl ect the size, complexity or any particular diffi culties in respect of the audit work required.
ADDITIONAL AUDIT WORK
In carrying out additional audit work, including government grant acquittals and other similar returns, the Offi ce will recover, in respect of such work, an amount that covers the full cost of the relevant work undertaken.
The actual fees to be charged will be determined in discussion between our staff and client management to refl ect the size, complexity or any particular diffi culties in respect of the audit in question. Fees will have regard to the time taken, the audit staff assigned and their respective charge rates.
Higher rates may be appropriate for certain pieces of work in order to allocate individuals with specialist knowledge. In such circumstances the client would be consulted in advance.
23 Basis for Setting Audit Fees

AUDITS DISPENSED WITH
Sections 18 (2) & (3) of the Audit Act 2008 (Audit Act) provide the Auditor-General with the discretion to dispense with certain audits. The sections read as follows:
(2) Despite subsection (1), the Auditor-General may, in respect of a particular fi nancial year, dispense, subject to any conditions that the Auditor-General may determine, with all or any part of the audit of a particular State entity or the audits of State entities included in a category or class of State entity specifi ed by the Auditor-General, if the Auditor-General considers that it is appropriate in the circumstances.
The defi nition in this Act of a “State entity” is an extremely broad defi nition and captures, for example, the many entities that receive grant funding from the State Government.
(3) The Auditor-General must consult with the Treasurer before exercising the power conferred by subsection (2).
Effective on the date of this Report, we have dispensed with the following specifi c audits or categories of audits:
Specifi c audits
Drainage Trusts
• Brittons Swamp Drainage Trust
• Cheshunt Drainage Trust
• Egg Lagoon Drainage Trust
• Elizabeth Macquarie Irrigation Trust
• Forthside Irrigation Water Trust
• Lake Nowhere-Else Dam/Whitehawk Creek Irrigation Trust
• Lawrenny Irrigation Trust
• Lower Georges River Works Trust
• Mowbray Swamp Drainage Trust
• Richmond Irrigation Trust
• Togari Drainage Trust
Registration Boards
• Board of Architects
• Chiropractors and Osteopaths Registration Board
• Dental Board of Tasmania
• Dental Prosthetists Registration Board
• Medical Council of Tasmania
• Medical Radiation Science Professionals Registration Board
• Nursing Board of Tasmania
• Optometrists Registration Board
• Pharmacy Board of Tasmania
• Physiotherapists Registration Board
• Plumbers and Gasfi tters Registration Board
• Podiatrists Registration Board
• Psychologists Registration Board
24 Audits Dispensed With

In the previous fi nancial year, we dispensed with the audit of Davy Point Drainage Trust, Don River Irrigation Water Trust, Lobster Rivulet Drainage Trust and the Western Creek Drainage Trust. These are not now included in the above list because we are experiencing diffi culties establishing their ongoing existence. Until this has been established, the audits revert to our offi ce. We note that the Minister has exempted the Lower Georges River Works Trust from submitting fi nancial statements until September 2009 for the fi nancial period November 2007 to June 2009 as the Trust was only formed in November 2007.
Categories of audits and Non-Government Organisations
The Defi nition of State entities encompasses public bodies and Non Government Organisations that traditionally are in receipt of Government grants. Agencies managing these grants are subject to the provisions of Treasurer’s Instruction 709 – “Grant Management Framework”.
The requirements of Treasurer’s Instruction 709 are such that reporting and auditing requirements are appropriate and we consider them satisfactory. It is our intention to keep the status quo, that is, those agencies dispensing the funds will be responsible for implementing and monitoring the requirements of the above Treasurer’s Instruction.
As a result, separate audits of these entities were not conducted by our Offi ce and we have not specifi cally dispensed with these audits.
We consulted with the Treasurer in determining the audits dispensed with in this report.
25 Audits Dispensed With

LOCAL GOVERNMENT RATING
INTRODUCTION
In our previous report ( June 2008 Report No.1, page 52) we noted that some councils may have made more than one general rate, thereby breaching Section 90 of the Local Government Act 1993 (the Act). We recommended at the time that, where a council wishes to vary its general rate using the provisions of section 107(1), it seeks appropriate legal advice to ensure the wording of its rate resolutions comply with the requirements of the Act.
COUNCIL AUDITS FOR 2007-08
In instances where we considered that a council’s rate resolution might be in contravention of the requirements of the Act, we sought a specifi c legal opinion for each of those councils.
Based upon the legal advice received, three councils were in contravention of the Act. The issues concerned incorrectly setting a maximum amount payable in respect of a general rate under Section 107 of the Act, not setting a general rate on all rateable land in accordance with Section 90(1) of the Act and no evidence of a general rate having been struck also in accordance with Section 90(1) of the Act. Our recommendation to those councils was that they seek legal advice on setting of their rates, in particular general rates, to ensure compliance with the provisions of the Act.
In addition, a more recent review of all rate resolutions, and subject to further audit work, we noted the following possible errors for all councils to consider when setting 2009-10 rates:
• Setting of rates under incorrect sections of the Act
• Setting of rates under repealed sections of the Act
SECTOR REVIEW
Because of the three contraventions noted, we have decided to conduct an audit of all councils’ rating resolutions for 2008 – 2009 to ascertain compliance of those resolutions with the rating provisions (Part 9) of the Act. As part of this audit, we will consider reservations noted by some councils to what they apparently regard as restrictions currently inherent in the rating provisions in the Act that have, in their view, contributed to some rating resolutions being made.
26 Local Government Rating

LOCAL GOVERNMENT COMPARATIVE ANALYSIS
INTRODUCTION
Comparative analysis covering fi nancial and other information and ratios for all Tasmanian Councils has been compiled with results provided in four appendices to this Chapter. The information provided is for the fi nancial year ended 30 June 2008. The appendices have been presented with councils grouped as either major cities; other urban and large rural; and other rural.
This is the third year that this analysis has been included in this Report. While only one year’s data is provided, comparison with prior years is showing a high degree of consistency in the various ratios between years.
The Appendices are:
1. Demographics
2. Income Statements
3. Employee Costs
4. Balance Sheets.
Our analysis of the appendices is of a general nature and should be read in conjunction with the individual Chapters on each council that are contained in this Report.
When considering the various ratios and observations reported in this Chapter, it needs to be borne in mind that they are only indicators of performance or of fi nancial position. The various ratios should not be considered in isolation. However, taken together various ratios can indicate good or poor fi nancial condition or performance. It is also important to consider these ratios over time. The analysis below only considers performance for the single 2007-08 fi nancial year.
An example of why a single indicator should not be considered in isolation is the ratio of expenditure in a fi nancial year on non current assets compared to depreciation charged in that year. Our target for this ratio is 100% because we would anticipate infrastructure investment to approximate the annual depreciation charge. A council or councils could be less than 100% for a variety of reasons and still be adequately managing their asset replacement plans due to other factors such as their maintenance programs or the timing of asset replacement based on long term asset management plans. Also, a ratio well above 100% may not necessarily indicate be a good result because expenditure in a particular year may be due to one-off expenditure for a new asset funded, for example, by government grants. In addition, this ratio should probably be assessed over more than one fi nancial period which is done in individual council chapters.
Operating sustainability
The following fi ve graphs summarise key ratios highlighting important aspects of the consolidated fi nancial performance over the past two years. In general, the ratios indicate:
27 Local Government Comparitive Analysis

Operating Margin
0.95
0.96
0.97
0.98
0.99
1.00
2007 2008
The Operating margin was marginally below one in each of the past two years. At a detailed level, the income statement noted on Appendix 2 reveals 17 (2006-07; 18) of the 29 Tasmanian councils failed to achieve at least a break even benchmark with breakeven or better being indicated by an operating margin of one or greater than one. In my view, councils should, at a minimum, budget, and operate, to break even and to avoid operating defi cits. Doing so would enable councils to generate suffi cient revenue to fulfi l their operating requirements. This should include rating to cover annual depreciation charges.
Another measure of a council’s operating capability is the “Underlying result” ratio. This ratio provides a measure of the strength of the operating result. The higher the ratio, the stronger the result. On a consolidated basis, the ratio was negative in both years indicating an operating defi cit that cannot be sustained in the longer term. The ratio is calculated by dividing the net operating surplus by operating revenue.
Underlying Result Ratio
(2.0%)
(1.5%)
(1.0%)
(0.5%)
0.0%
2007 2008
Self Financing Ratio
20%
21%
22%
23%
24%
25%
26%
27%
2007 2008
The “Self fi nancing” ratio is a measure of councils’ ability to fund the replacement of assets from cash generated from operations. The ratio is calculated by dividing cash fl ows from operating activities (taken from the Cash Flow Statement) by operating revenue. The high ratio in both years indicates a greater capacity for councils collectively to generate cash from their operating revenue and, therefore, to fund asset replacement or repay debt.
Councils’ Own source revenues represent operating revenue other than recurrent grants. Expressing Own source revenues as a percentage of total operating revenues indicates a council’s ability to generate its own funding, without relying on recurrent government grants. On a consolidated basis, Tasmania’s council generated approximately 80% of their revenues from their own sources although, in general terms, the Own source revenue ratios on Appendix 2 highlight that smaller councils generate lower amounts of Own source revenues in percentage terms.
Own Source Revenue
70.00%
73.00%
76.00%
79.00%
82.00%
85.00%
2007 2008
Current Ratio
3.00
3.20
3.40
3.60
3.80
4.00
2007 2008
Normal convention suggests that the current ratio, being total current assets divided by total current liabilities, should be greater than one. Collectively, the ratio in both years was well above this benchmark with, individually no council having a ratio of less than one at 30 June 2008. Individually the ratios varied between 1.0, Glamorgan Spring Bay, and Flinders, 21.5.
28 Local Government Comparitive Analysis

Overall, we note that councils exhibiting an operating margin of less than one, a negative underlying result and a low self fi nancing ratio may be experiencing, or could in the future experience, fi nancial diffi culty. Appendix 2 indicates that every council in Tasmania has a positive Self fi nancing ratio, but 16 councils have a negative Underlying result and 17 had negative Operating margins.
Demographics
The Tasmanian population, as recorded by the Australian Bureau of Statistic – Regional Population Growth, increased by 3 419 (or 0.7%) from 2005-06 year to 2006-07. Across the State, populations of each municipal area varies considerably, ranging from 877 (2005-06, 881) at Flinders to 64 931 (2005-06, 64 620) at Launceston. The major cities’ populations represent 42.58% (210 074) (2007; 42.7% and 209 163) of the total population, but only cover 2.9% of the State area in square kilometres (1 986). Conversely, the 13 rural councils combined population represents 13.4% (66 168) (2007; 13.4% and 65 818) of the total population, but cover 59.7% of the State’s area in square kilometres (40 474).
As noted in previous years, Rural councils can face diffi culties in providing and maintaining services because they do not have access to the higher ratepayer base of larger councils. This is highlighted in the number of rateable valuations per square kilometre ratio which refl ects the population and area disparity between the councils already referred to.
Income Statements
Income statement information was extracted from audited Financial Statements for the fi nancial year 2007-08.
The combined net Surplus totalled $55 937m, an increase of 35.3% from 2006-07 ($41.328m) and included:
• $29.426m (2006-07, $28.911m) in capital grant funding
• $46.565m (2006-07, $35.363m) in contributed assets, mainly through subdivisions
• $2.416m insurance recovery relating to a signifi cant fi re claim
• $1.519m (2006-07; $7.420m) in non-current asset adjustments, comprising asset write-offs, $4.727m, less recognition adjustments, $2.706m, and revaluation increment reversals, $3.540m
• offset by a further $7.897m in unrealised losses from three councils investing in Collateralised Debt Obligations (CDOs).
Excluding these items, it could be argued that, on an “operating” basis, for the year ended 30 June 2008 councils recorded a combined defi cit of $16.092m (2006-07; $15.526m).
Revenue raising capacities
Councils in Tasmania generated $434.289m (2006-07; $407.362m) in rates for the 2007-08 year. Major cities and other urban and larger rural councils, in general, obtain a greater percentage of their operating revenue from rates. This is refl ected in the rate revenue to operating revenue ratio. In contrast, councils that have a lower rate to operating revenue ratio, receive a higher percentage of recurrent grant revenue. It is noted that there are six councils (2006-07, six) with rate revenue to operating revenue ratios of less than 50% meaning that they are heavily reliant on recurrent grant funding. Five of these councils also have the lowest average rates per rateable valuation although they have generated relatively high rate revenues per head of population.
29 Local Government Comparitive Analysis

Councils’ own source revenues represent operating revenue other than recurrent grants. Expressing own source revenues as a percentage of total operating revenues indicates a council’s ability to generate its own funding, without relying on recurrent government grants. In general terms, the resulting ratios on Appendix 2 highlight that, consistent with ratios discussed previously, smaller councils generate lower amounts of own source revenues in percentage terms.
Also reported on Appendix 2 are the ratios of operating (or recurrent) grants per head of population and operating grants compared to operating revenues. These ratios confi rm previous observations that smaller councils are more reliant on recurrent operating grants. To illustrate this point, rural councils’ grants per head of population are considerably greater than other councils, for example Flinders, $1 696 and Tasman, $1 359 compared to Hobart, $24 or West Tamar, $116.
Depreciation coverage
The depreciation to operating revenue ratio provides an indication of the extent to which a council is funding, from current revenues, its future asset replacement through depreciation. There is no benchmark for this ratio except that, as previously noted, we anticipate that councils should at least budget to breakeven on an operating basis therefore fully covering annual depreciations charges.
In general the ratio of depreciation to current revenues for major cities and other urban councils was around the average of 25.7% (2006-07; 26.5%) with the total average for all councils being 26.5%. However, there are considerable fl uctuations in the other rural council percentages, these varying between 11.5% at Tasman, which has a comparatively low infrastructure assets base with non-current infrastructure assets per head of population of $6 923, to 52.1% at Central Highlands where the non current infrastructure assets per head of population was $50 196. This highlights the importance of having long term asset management plans and budgeting to ensure that operating revenues are suffi cient to cover all operating costs, including depreciation. It is acknowledged that the latter will be more diffi cult in regional communities with signifi cant infrastructure.
However, it is inappropriate to consider this ratio in isolation with further discussion about this when reviewing the depreciation to capital expenditure ratios later in this Chapter.
Employee Costs
Appendix 3 summarises Employee costs, Employee entitlements and Full Time Equivalents (FTE’s) for each council.
Councils in Tasmania employed 3 661 (2006-07; 3 664) FTE’s at 30 June 2008 and incurred employee costs of $226.820m (2006-07; $217.246m) for the 2007-08 fi nancial year. Average employee costs per FTE vary from a high of $69 000 per FTE to a low of $43 000 per FTE with the average being $59 000.
Councils’ FTEs per 1 000 head of population also varies with smaller rural councils having lower population bases and higher ratios. Both Flinders and Tasman Councils have ratios well above twenty FTEs per 1 000 head of population due to their small populations. The average for all councils was 9.2 FTE per 1000 head of population.
At 30 June 2008, the amount of annual, long service and some sick leave accrued by councils for their employees totalled $48.933m (2006-07; $47.908m). On a per FTE basis this equated to $12 793 with variations between councils ranging from $6 522 per FTE at Flinders to $21 967 at Derwent Valley. While the average balance of $12 793 appears reasonable, many councils hold balances for some employees well above two year’s entitlements. This has been acknowledged by those councils who are working to reduce their balances.
Balance Sheet
Comments here are made by reference to Appendix 4.
30 Local Government Comparitive Analysis

Management of working capital
On the basis that a working capital ratio of one or better is effective, all but one councils manage their working capital (total current assets less total current liabilities expressed as a ratio greater or less than 1) effectively with most exhibiting a ratio of well above one at 30 June 2008. This ratio provides an indication as to whether or not an entity can meet its short term commitments from existing current assets.
Glamorgan Spring Bay is the only council below the benchmark. At 30 June 2008, it had negative working capital of $45 000 (current liabilities exceeded current assets by this amount) resulting in a ratio of 0.97.
It is noted however, that all councils have large or reasonably large bank and investment balances some of which may be committed to future capital projects. Details are provided in individual chapters.
Management of infrastructure and other non-current assets
Included in Total non-current assets, which amounted to $7.026bn (2006-07; $6.225bn), are Infrastructure assets controlled by councils at 30 June 2008 totalling $6.579bn (2006-07; $5.812bn). This included $2.564bn of Roads and bridges infrastructure, $667.403m of Water infrastructure and $803.456m in Sewerage infrastructure. These balances indicate the signifi cant responsibility local government have in managing infrastructure assets in the provision of services to all Tasmanians.
In 2007-08 payments made by councils for property, plant and equipment totalled $178.938m (2006-07; $169.440m) and depreciation charged on these assets totalled $172.758m (2006-07; $163.159m). A useful measure to assess the extent to which a council is adequately investing in its non-current asset base is expenditure on these assets expressed as a percentage of depreciation with an ideal target of 100%. However, a better measure for this ratio is to express expenditure on existing assets as a percentage of depreciation.
For all councils, the average of total capital expenditure to depreciation ratio was 125.2% (2006-07; 103.86%) indicating that most councils are re-investing in their non-current assets at an appropriate rate. However, some councils stand out as being below the target of 100% particularly major cities. In each case, further details are provided in individual council chapters of this Report.
Another indicator which can be used to assess whether or not a council is adequately re-investing in its non current asset base is to compare rate revenue to non current infrastructure assets. This ratio indicates the level of rating undertaken in relation to the infrastructure bases being managed by each council. The higher the ratio the better. Lower ratios are noted in the rural councils possibly indicating that these councils are under-rating. As noted previously under the Income Statement discussion of this Chapter, the smaller rural councils have a greater dependence on grant funding and have lower rate revenue per rateable valuation.
The analysis of non-current infrastructure assets per square kilometre and per head of population confi rms the concentration of infrastructure and people in the major cities and larger urban areas. Rural councils manage a lower level of infrastructure assets, but across a larger geographical area.
The ratio of non-current infrastructure assets per rateable valuation indicates that each rateable valuation supports a fairly consistent level of infrastructure. We have not analysed why it is that some councils, for example Tasman, $4 636, Glamorgan Spring Bay, $10 437, Burnie, $31 764, and King Island, $32 004, vary signifi cantly from the average of $20 626.
31 Local Government Comparitive Analysis

Management of debt
We have included in our analysis relevant ratios around debt management because how councils manage debt and associated interest costs can have short and long term impacts on rating strategies and asset replacement programs. Inter-generational equity also needs to be considered as does the impact of asset replacement programs and any effect of proposed new initiatives.
A review of the debt service ratio and the cost of debt for each council indicated that, based on established benchmarks, the majority of councils are managing their debt appropriately. Kingborough has the highest cost of debt, 10.8%, due to several interest only loans with interest rates well above current market rates. This Council has investigated early settlement of these loans, but would incur costs equal to interest charges over the remaining loan terms. The fi nal interest only loan will be settled in 2011 12.
It is noted that Meander Valley, Northern Midlands, Central Highlands and Flinders Councils did not hold any loan debt at 30 June 2008.
The indebtedness ratio compliments the current ratio and illustrates a council’s ability to meet longer term commitments. The ratio compares non-current liabilities to a council’s own source revenue, the lower the percentage the stronger a council’s position to meet longer term liabilities. Those councils with ratios well above the average of 22.6% were holding higher levels of non-current borrowings at 30 June 2008. However, the ratios indicate all councils can meet future longer term debt commitments.
Rate debts owing to councils at 30 June 2008 totalled $13.237m (2006-07; $11.824m) with an average per council of $456 000. Expressing rate debtors as a percentage of rates raised indicates that, in general, councils are recovering outstanding rate debts in a reasonable timeframe. Flinders Council at 14.6% had the highest ratio. It is noted, however, that all councils have signifi cant power under the Local Government Act 1993 to recover rate debts against a property.
32 Local Government Comparitive Analysis

DEMOGRAPHICS – 2007-08
Council Population
Area in Square
Kilometres
Population Per Square Kilometre
Number of Rateable
Valuations
Number of Rateable Valuations Per Square Kilometre
Average Rateable
Valuations Per
Head of Population
Clarence 51 173 377 135.7 24 061 64.9 0.5
Glenorchy 44 250 120 368.8 22 604 190.4 0.5
Hobart 49 720 78 639.1 29 137 377.2 0.6
Launceston 64 931 1 411 46.0 35 003 25.1 0.5
Brighton 14 791 171 86.5 6 465 38.9 0.4
Burnie 19 692 610 32.3 10 381 17.1 0.5
Central Coast 21 253 931 22.8 11 050 12.0 0.5
Derwent Valley 9 770 4 104 2.4 5 211 1.3 0.5
Devonport 24 961 111 224.9 13 128 119.0 0.5
Huon Valley 14 628 5 498 2.7 9 872 1.8 0.7
Kingborough 32 228 719 44.8 16 267 23.2 0.5
Meander Valley 19 124 3 320 5.8 9 851 3.0 0.5
Northern Midlands 12 482 5 126 2.4 6 795 1.3 0.6
Sorell 12 428 583 21.3 8 199 14.2 0.7
Waratah-Wynyard 13 889 3 526 3.9 7 977 2.3 0.6
West Tamar 21 833 690 31.6 11 279 16.6 0.5
Break O’Day 6 234 3 521 1.8 6 555 1.9 1.1
Central Highlands 2 315 7 976 0.3 3 877 0.5 1.7
Circular Head 8 228 4 891 1.7 5 190 1.1 0.6
Dorset 7 245 3 223 2.2 5 363 1.7 0.7
Flinders 877 1 994 0.4 1 368 0.7 1.6
George Town 6 740 653 10.3 4 587 7.1 0.7
Glamorgan Spring Bay 4 383 2 522 1.7 5 513 2.2 1.3
Kentish 6 052 1 155 5.2 3 589 3.3 0.6
King Island 1 723 1 094 1.6 1 702 1.6 1.0
Latrobe 9 071 600 15.1 5 628 9.6 0.6
Southern Midlands 5 871 2 611 2.2 3 667 1.4 0.6
Tasman 2 301 659 3.5 3 308 5.2 1.5
West Coast 5 148 9 575 0.5 4 814 0.5 0.9
Total 493 341 67 849 7.3 282 441
Average per Council 17 012 2 340 59 9,739 32.6 0.8
Average Population per square kilometre for Tasmania 7.27
Average Rateable properties per square kilometere 4.16
Average Rateable properties per Head of Population 0.57
Source
Population fi gures derived from Australian Bureau of Statistics - Regional Population Growth, Australia 2006-07.
Local Government areas taken from ABS website “2001 Census Community Profi le Series” Statistics estimated at 30 June 2005.
Rateable properties obtained from Valuer-General’s offi ce as at 1 July 2007
33 Local Government Comparitive Analysis

INCOME STATEMENT – 2007-08
Oper
atin
g R
even
ue
Non-O
per
atin
g R
even
ue
Tota
l R
even
ue
Oper
atin
g Exp
enditure
Non-O
per
atin
g Exp
enditure
Tota
l Exp
enditure
Surp
lus/
(D
efi c
it)
Surp
lus/
(D
efi c
it)
to
Tota
l R
even
ue
Oper
atin
g Su
rplu
s/
(Defi
cit)
Oper
atin
g M
argin
Council $’000s $’000s $’000s $’000s $’000s $’000s $’000s % No.
Clarence 58 147 11 445 69 592 58 884 - 58 884 10 708 15.4 ( 737) 0.99
Glenorchy 62 697 2 062 64 759 68 599 - 68 599 (3 840) (5.9) (5 902) 0.91
Hobart 95 474 8 028 103 502 102 913 - 102 913 589 0.6 (7 439) 0.93
Launceston 93 173 8 322 101 495 91 878 - 91 878 9 617 9.5 1 295 1.01
Brighton 13 737 1 182 14 919 11 903 - 11 903 3 016 20.2 1 834 1.15
Burnie 35 984 3 981 39 965 35 705 2,464 38 169 1 796 4.5 279 1.01
Central Coast 23 731 2 838 26 569 26 517 - 26 517 52 0.2 (2 786) 0.89
Derwent Valley 10 713 316 11 029 10 897 - 10 897 132 1.2 ( 184) 0.98
Devonport 37 321 4 700 42 021 39 999 - 39 999 2 022 4.8 (2 678) 0.93
Huon Valley 19 916 2 254 22 170 17 773 3,218 20 991 1 179 5.3 2 143 1.12
Kingborough 35 033 13 547 48 580 36 580 - 36 580 12 000 24.7 (1 547) 0.96
Meander Valley 17 988 2 479 20 467 18 223 - 18 223 2 244 11.0 ( 235) 0.99
Northern Midlands 14 575 1 662 16 237 15 698 - 15 698 539 3.3 (1 123) 0.93
Sorell 13 934 1 209 15 143 14 135 296 14 431 712 4.7 ( 201) 0.99
Waratah-Wynyard 15 300 2 655 17 955 16 637 - 16 637 1 318 7.3 (1 337) 0.92
West Tamar 20 467 4 786 25 253 18 911 2,263 21 174 4 079 16.2 1 556 1.08
Break O’Day 11 920 575 12 495 10 735 - 10 735 1 760 14.1 1 185 1.11
Central Highlands 5 762 424 6 186 6 801 - 6 801 ( 615) (9.9) (1 039) 0.85
Circular Head 14 184 144 14 328 12 679 4,383 17 062 (2 734) (19.1) 1 505 1.12
Dorset 12 012 584 12 596 12 352 - 12 352 244 1.9 ( 340) 0.97
Flinders 3 614 0 3 614 4 223 - 4 223 ( 609) (16.9) ( 609) 0.86
George Town 10 643 1 957 12 600 9 415 - 9 415 3 185 25.3 1 228 1.13
Glamorgan Spring Bay 10 184 1 139 11 323 10 902 - 10 902 421 3.7 ( 718) 0.93
Kentish 7 451 1 297 8 748 8 444 - 8 444 304 3.5 ( 993) 0.88
King Island 5 373 1 095 6 468 5 245 - 5 245 1 223 18.9 128 1.02
Latrobe 11 241 1 678 12 919 10 608 - 10 608 2 311 17.9 633 1.06
Southern Midlands 7 789 1 284 9 073 8 515 - 8 515 558 6.2 ( 726) 0.91
Tasman 7 343 2 128 9 471 6 894 - 6 894 2 577 27.2 449 1.07
West Coast 9 625 882 10 507 9 358 - 9 358 1 149 10.9 267 1.03
Total 685 331 84 653 769 984 701 423 12 624 714 047 55 937 (16 092)
Average per Council 23 632 2 919 26 551 24 187 435 24 622 1 929 7.1 ( 555) 0.99
Non operating revenue and expenditure include capital grants, contributed assets and revaluation and impairment adjustments.
34 Local Government Comparitive Analysis

Under
lyin
g R
esult
Self F
inan
cing
Rat
io
Rat
e R
even
ue
Rat
e R
even
ue
to
Oper
atin
g R
even
ue
Ave
rage
Rat
e Per
R
atea
ble
Val
uat
ion
Rat
e R
even
ue
Per
H
ead o
f Popula
tion
Counci
ls’ O
wn
Sourc
e R
even
ue
Counci
ls’ O
wn
Sourc
e R
even
ue
to
Oper
atin
g R
even
ue
Oper
atin
g G
over
nm
ent
Gra
nts
Oper
atin
g G
rants
per
H
ead o
f popula
tion
Oper
atin
g G
over
nm
ent
Gra
nts
to
Oper
atin
g R
even
ue
Dep
reci
atio
n t
o
Oper
atin
g R
even
ue
% % $’000s % $ $ $’000s % $’000s $ % %
(1.3) 29.2 43 951 75.6 1 795 859 55 948 96.2 2 199 43 3.8 24.0
(9.4) 20.5 39 194 62.5 1 716 886 54 987 87.7 7 710 174 12.3 27.3
(7.8) 16.6 64 951 68.0 2 213 1 306 94 272 98.7 1 202 24 1.3 21.4
1.4 28.0 62 144 66.7 1 754 957 87 621 94.0 5 552 86 6.0 23.1
13.4 33.1 8 202 59.7 1 232 555 11 785 85.8 1 952 132 14.2 19.5
0.8 28.3 22 884 63.6 2 190 1 162 33 078 91.9 2 906 148 8.1 28.1
(11.7) 20.2 14 179 59.7 1 269 667 20 459 86.2 3 272 154 13.8 29.9
(1.7) 24.4 6 649 62.1 1 245 681 8 633 80.6 2 080 213 19.4 23.4
(7.2) 15.9 25 205 67.5 1 908 1 010 34 807 93.3 2 514 101 6.7 25.0
10.8 31.5 9 896 49.7 978 677 15 567 78.2 4 349 297 21.8 17.6
(4.4) 22.9 24 206 69.1 1 452 751 32 010 91.4 3 023 94 8.6 31.1
(1.3) 32.7 10 560 60.2 1 057 552 14 487 80.5 3 501 183 19.5 29.2
(7.7) 38.4 7 899 54.2 1 145 633 11 213 76.9 3 362 269 23.1 33.9
1.4 34.5 9 087 65.2 1 096 731 11 707 84.0 2 227 179 16.0 32.2
(8.7) 20.1 9 589 62.7 1 196 690 12 777 83.5 2 523 182 16.5 21.3
7.6 30.9 13 097 64.0 1 141 600 17 935 87.6 2 532 116 12.4 23.8
9.9 36.2 6 666 55.9 1 010 1 069 8 969 75.2 2 951 473 24.8 23.1
(18.0) 34.3 2 685 46.6 689 1 160 3 724 64.6 2 038 880 35.4 52.1
10.6 31.2 7 313 51.6 1 404 889 11 652 82.1 2 532 308 17.9 19.1
(2.8) 25.1 6 251 52.0 1 159 863 8 879 73.9 3 133 432 26.1 36.6
(16.9) 24.6 973 26.9 703 1 109 2 127 58.9 1 487 1 696 41.1 39.2
11.5 26.2 6 175 58.0 1 329 916 8 943 84.0 1 700 252 16.0 21.3
(7.1) 17.7 6 720 66.0 1 199 1 533 8 983 88.2 1 201 274 11.8 18.8
(13.3) 24.6 4 244 57.0 1 098 701 5 535 74.3 1 916 317 25.7 34.4
2.4 20.2 1 952 36.3 1 146 1 133 3 832 71.3 1 541 894 28.7 23.6
5.6 15.9 7 148 63.6 1 239 788 10 095 89.8 1 146 126 10.2 21.8
(9.3) 29.1 3 543 45.5 951 603 5 014 64.4 2 775 473 35.6 39.6
6.1 28.6 2 838 38.6 826 1 233 4 217 57.4 3 126 1 359 42.6 11.5
2.8 27.9 6 088 63.4 1 260 1 183 7 895 82.2 1 730 336 18.0 21.7
434 289 78 180
(1.5) 26.5 14 975 57.7 1 290 893 20 936 81.5 2 696 352 18.5 26.7
35 Local Government Comparitive Analysis

BALANCE SHEET – 2007-08
Curr
ent A
sset
s
Curr
ent
Lia
bilit
ies
Work
ing
Cap
ital
Curr
ent
Rat
io
Non-C
urr
ent
Ass
ets
Non C
urr
ent
Lia
bilit
ies
Deb
t Ser
vice
Rat
io
Council $000 $000 $’000s No. $’000s $’000s %
Clarence 55 230 20 763 34 467 2.7 546 042 13 224 5.2
Glenorchy 15 898 12 945 2 953 1.2 669 473 19 705 9.1
Hobart 49 688 19 608 30 080 2.5 983 496 26 900 2.0
Launceston 71 948 47 901 24 047 1.5 1 138 776 21 092 3.9
Brighton 4 597 2 840 1 757 1.6 129 359 2 297 6.1
Burnie 20 577 6 707 13 870 3.1 331 046 20 141 6.9
Central Coast 9 466 4 359 5 107 2.2 306 054 2 164 0.6
Derwent Valley 3 596 2 917 679 1.2 82 801 1 662 7.0
Devonport 11 265 6 204 5 061 1.8 385 078 9 270 6.2
Huon Valley 8 556 1 916 6 640 4.5 142 422 1 495 1.1
Kingborough 23 248 5 672 17 576 4.1 432 835 1 627 0.4
Meander Valley 15 193 2 019 13 174 7.5 224 911 2 409 -
Northern Midlands 6 725 1 936 4 789 3.5 204 321 108 -
Sorell 8 843 3 100 5 743 2.9 123 966 6 708 10.7
Waratah-Wynyard 7 334 3 192 4 142 2.3 125 270 2 804 5.1
West Tamar 13 793 2 913 10 880 4.7 206 909 1 552 2.4
Break O’Day 7 899 2 517 5 382 3.1 98 620 2 687 5.0
Central Highlands 5 606 820 4 786 6.8 116 271 31 -
Circular Head 5 386 1 735 3 651 3.1 107 850 648 1.2
Dorset 13 016 1 970 11 046 6.6 100 975 1 846 2.7
Flinders 7 529 351 7 178 21.5 34 940 174 -
George Town 4 430 1 743 2 687 2.5 99 872 3 151 7.7
Glamorgan Spring Bay 2 021 2 066 ( 45) 1.0 58 587 2 265 4.1
Kentish 3 540 1 378 2 162 2.6 67 445 2 257 3.0
King Island 4 391 1 117 3 274 3.9 54 503 906 3.9
Latrobe 2 296 1 856 440 1.2 96 428 1 936 3.2
Southern Midlands 6 858 1 162 5 696 5.9 82 174 1 178 2.9
Tasman 2 676 2 073 603 1.3 16 657 1 541 5.0
West Coast 4 774 2 829 1 945 1.7 58 969 1 633 5.1
Total 396 379 166 609 229 770 7 026 050 153 411
Average per Council 13 668 5 745 7 923 3.7 242 278 5 290 3.8
36 Local Government Comparitive Analysis

Cost
of D
ebt
Indeb
tednes
s R
atio
Rat
e D
ebto
rs
Rat
e D
ebto
rs t
o R
ates
Rai
sed
Pay
men
ts for
Pro
per
ty,
Pla
nt &
Equip
men
t
Dep
reci
atio
n $
000
Cap
ital
Expen
diture
to
Dep
reci
atio
n R
atio
Rat
e R
even
ue
to N
on-
Curr
ent In
fras
truct
ure
A
sset
s
Non-C
urr
ent
Infr
astr
uct
ure
Ass
ets
per
Squar
e K
ilom
etre
Non-C
urr
ent
Infr
astr
uct
ure
Ass
ets
per
Hea
d o
f Popula
tion
Non-C
urr
ent
Infr
astr
uct
ure
Ass
ets
per
Rat
eable
Val
uat
ion
% % $’000s % $’000s % % $ $ $
6.2 23.6 2 670 6.1 10 038 13 968 71.9 8.9 1 315 109 9 689 20 250
6.7 35.8 955 2.4 9 945 17 094 58.2 6.6 4 963 825 13 461 26 076
6.4 28.5 1 003 1.5 13 778 20 475 67.3 7.2 11 654 177 18 236 30 893
5.7 24.1 1 669 2.7 29 895 21 512 139.0 5.9 752 028 16 342 29 951
6.9 19.5 116 1.4 4 730 2 673 177.0 6.9 692 441 8 005 17 792
6.0 56.9 915 4.0 8 948 10 099 88.6 6.9 542 656 16 810 31 674
3.9 10.6 326 2.3 9 089 7 095 128.1 5.0 307 329 13 463 25 615
6.6 19.3 396 6.0 2 881 2 508 114.9 9.0 17 942 7 537 13 792
6.5 26.6 686 2.7 8 171 9 338 87.5 7.1 3 179 432 14 139 26 720
7.4 9.6 362 3.7 8 188 3 510 233.3 6.9 25 904 9 736 14 079
10.8 5.1 529 2.2 6 893 10 901 63.2 5.9 571 690 12 754 24 656
- 17.2 287 2.7 4 774 5 249 91.0 4.9 64 697 11 232 21 497
- 1.0 348 4.4 5 348 4 938 108.3 3.9 39 857 16 368 29 610
5.1 57.3 296 3.3 4 829 4 491 107.5 7.7 202 139 9 482 14 217
5.2 21.9 69 0.7 3 790 3 257 116.4 8.4 32 509 8 253 14 293
6.6 8.7 556 4.2 5 683 4 879 116.5 7.0 272 712 8 619 16 387
5.8 29.9 280 4.2 4 718 2 759 171.0 6.8 27 988 15 808 14 929
- 0.8 157 5.8 3 296 3 002 109.8 2.3 14 568 50 196 29 803
6.7 5.6 134 1.8 5 167 2 711 190.6 7.4 20 272 12 050 19 031
6.1 20.8 93 1.5 5 184 4 400 117.8 6.2 31 158 13 861 18 621
- 8.2 142 14.6 664 1 416 46.9 2.8 17 523 39 841 25 246
6.4 35.2 76 1.2 5 155 2 268 227.3 6.6 143 195 13 873 20 126
6.2 25.2 236 3.5 2 325 1 911 121.7 11.5 23 205 13 352 10 437
5.9 40.8 35 0.8 3 515 2 565 137.0 6.5 56 329 10 750 16 837
6.2 23.6 130 6.7 2 111 1 266 166.7 3.6 49 819 31 632 32 004
6.5 19.2 151 2.1 3 751 2 455 152.8 8.1 147 833 9 778 15 378
6.6 23.5 292 8.2 2 369 3 085 76.8 4.4 30 518 13 572 21 397
7.5 36.5 167 5.9 2 356 846 278.5 17.8 24 173 6 923 4 636
6.1 20.7 161 2.6 1 347 2 087 64.5 10.3 6 159 11 455 12 209
13 237 178 938 172 758
5.5 22.6 456 3.8 6 170 5 957 125.2 7.0 869 903 15 076 20 626
37 Local Government Comparitive Analysis

EMPLOYEE COSTS – 2007-08
Tota
l E
mplo
yee
Cost
s
FT
E’s
Ave
rage
Cost
per
FT
E
FT
E p
er 1
000
Popula
tion
Tota
l Lab
our
Cost
s to
Oper
atin
g
Rev
enue
Tota
l Lab
our
Cost
s to
Oper
atin
g
Expen
dit
ure
Pro
vis
ions
for
Em
plo
yee
Enti
tlem
ents
Em
plo
yee
Enti
tlem
ents
per
FT
E
Council $’000s No. $’000s No. % % $’000s $
Clarence 14 446 243 59 4.7 24.8 24.5 2 711 11 156
Glenorchy 21 431 310 69 7.0 34.2 31.2 5 523 17 816
Hobart 39 446 581 68 11.7 41.3 38.3 9 204 15 842
Launceston 30 762 471 65 7.3 33.0 33.5 7 159 15 200
Brighton 3 326 60 55 4.1 24.2 27.9 673 11 217
Burnie 13 113 223 59 11.3 36.4 36.7 1 867 8 372
Central Coast 9 115 176 52 8.3 38.4 34.4 2 419 13 744
Derwent Valley 2 598 60 43 6.1 24.3 23.8 1 318 21 967
Devonport 14 052 205 69 8.2 37.7 35.1 2 636 12 859
Huon Valley 8 305 143 58 9.8 41.7 46.7 953 6 664
Kingborough 10 157 181 56 5.6 29.0 27.8 1 688 9 326
Meander Valley 4 830 73 66 3.8 26.9 26.5 1 001 13 712
Northern Midlands 4 691 74 63 5.9 32.2 29.9 1 027 13 878
Sorell 4 977 85 59 6.8 35.7 35.2 840 9 882
Waratah-Wynyard 4 374 82 53 5.9 28.6 26.3 996 12 146
West Tamar 5 891 97 61 4.4 28.8 31.2 1 418 14 619
Break O’Day 3 871 64 60 10.3 32.5 36.1 798 12 469
Central Highlands 1 857 33 56 14.3 32.2 27.3 570 17 273
Circular Head 3 244 57 57 6.9 22.9 25.6 639 11 211
Dorset 3 286 53 62 7.3 27.4 26.6 1 005 18 962
Flinders 1 227 23 53 26.2 34.0 29.1 150 6 522
George Town 2 870 46 62 6.8 27.0 30.5 556 12 087
Glamorgan Spring Bay 3 078 46 67 10.5 30.2 28.2 481 10 457
Kentish 1 531 29 53 4.8 20.5 18.1 231 7 966
King Island 1 622 32 51 18.6 30.2 30.9 565 17 656
Latrobe 3 256 54 60 6.0 29.0 30.7 613 11 352
Southern Midlands 2 765 46 60 7.8 35.5 32.5 796 17 304
Tasman 3 373 58 58 25.2 45.9 48.9 382 6 586
West Coast 3 326 56 59 10.9 34.6 35.6 714 12 750
Total 226 820 3 661 48 933
Average per Council 7 821 126 59 9.2 31.7 31.4 1 687 12 793
38 Local Government Comparitive Analysis

LOCAL GOVERNMENTBUSINESS UNITS
COPPING REFUSE DISPOSAL SITE JOINT AUTHORITY
INTRODUCTION
The Copping Refuse Disposal Site Joint Authority was established as a joint authority under Section 30 of the Local Government Act 1993 and gazetted on 1 March 2001. The Authority’s principal objective is the management and operation of the landfi ll at Copping in accordance with the Development Proposal and Environmental Management Plan (DP&EMP) and associated permit conditions issued by the Environmental Management and Pollution Control Board.
The Authority is jointly owned by the Clarence City, Sorell and Tasman Councils.
The principal objectives of the Authority are to manage a putrescibles landfi ll disposal site which conforms to the DP&EMP and permit conditions, and to manage the Balance Area. It must successfully manage the landfi ll disposal site business and Balance Area by:
• operating effi ciently in accordance with sound commercial practice
• maximising the net worth of the Authority’s assets
• operating the site to maximise benefi ts to member Councils.
Rule 43(2) of the Authority’s constitution obligates the three owner Councils to contribute equity injections until such time as the Authority becomes fi nancially independent.
Key Activities
The Authority’s key activities in 2007-08 were:
• the lease of the site with Clarence, Sorell and Tasman Councils was fi nalised
• the Lutana Waste Transfer Station development continued on schedule and on budget to support the 2008-09 Corporate Plan
• a total of 51 904 tonnes of waste was deposited at the landfi ll site, which was 3,000 tonnes down from the previous year. The landfi ll is licensed for 104000 tonnes per annum.
Local Government Board Review
The Local Government Board commenced a review of the Authority during the year. The outcome of the review is expected in 2008-09.
AUDIT OF THE 2007-08 FINANCIAL STATEMENTS
Signed fi nancial statements were received on 4 November 2008 and an unqualifi ed audit report was issued on 18 December 2008.
The audit was completed satisfactorily with no major outsatnding issues other than the late submission of fi nancial statements.
The analysis in this Chapter covers 2006-07 and 2007-08, the period that the Authority was audited by the Auditor-General.
39 Copping Refuse Disposal Site Joint Authority

FINANCIAL RESULTS
The fi ve graphs summarise key ratios highlighting important aspects of the Authority’s fi nancial performance over the past two years. In general, the ratios indicate:
Operating Margin
-
0.20
0.40
0.60
0.80
1.00
1.20
1.40
1.60
2007 2008
The Operating margin fell below the expected benchmark of one in the current year and was well above one in the prior period. An Operating margin below the benchmark indicates an authority might not be generating suffi cient revenue to fulfi l its operating requirements. Without these costs the authority’s loss would have been $0.046m.
The negative result in 2007-08 was largely due to back-payment of lease rent expenses totalling $0.760m due to the member Councils ($0.456m Clarence City Council, $0.228m Sorell Council and $0.076m Tasman Council) for the fi nancial years 2001-2007. The Authority had not paid these lease amounts to the above Councils due to unresolved legal issues with the lease contract, which were resolved in 2007-08.
Current Ratio
-
2.00
4.00
6.00
8.00
10.00
2007 2008
The Current ratio was above the benchmark in both 2007 and 2008 indicating that the Authority was able to meet all short-term liabilities.
INCOME STATEMENT
2007-08 2006-07$’000s $’000s
Operating revenue 1 545 1 682 Interest revenue 188 151 Other revenue 317 214 Total Revenue 2 050 2 047
Employee Costs 257 279 Borrowing costs 259 189 Depreciation 185 144 Other operating expenses 2 155 916 Total Expenses 2 856 1 528
Net Profi t (Loss) ( 806) 519
40 Copping Refuse Disposal Site Joint Authority

Comment
The Net Loss of $0.806m was largely a result of the back-payment of lease rent expenses of $0.760m paid to the member Councils for the fi nancial years 2001-2007 and recognition of $0.294m site operating lease payments for the current year. Increased borrowing costs also contributed to the loss due to higher interest costs on borrowings held by the Authority in 2007-08. In addition depreciation expenses increased by approximately $0.041m, transport costs increased by $0.037m and site maintenance costs also rose by $0.004m. A further contributing factor to the operating loss was a reduction in waste received by approximately 3000 tonnes leading to operating revenue falling $0.450m below budget. The Authority, in conjunction with member Councils, will further consider strategies to ensure the long term sustainability of its operations during the 2008-09 year.
Although the Authority made a loss in the current fi nancial year, it still has an accumulated surplus and is expected will be able to continue to pay its debts as and when they fall due. The Authority, in conjunction with member Councils, will further consider strategies to ensure the long-term sustainability of its operations during the 2008-09 year.
BALANCE SHEET
2007-08 2006-07$’000s $’000s
Cash 998 3 112 Receivables 142 288 Prepayments & Accruals 168 76 Total Current Assets 1 308 3 476
Payables 24 182 Borrowings 220 207 Total Current Liabilities 244 389
Working Capital 1 064 3 087
Property, plant and equipment 3 245 2 278 Other 100 100 Total Non-Current Assets 3 345 2 378
Borrowings 3 702 3 921 Total Non-Current Liabilities 3 702 3 921
Net Assets 707 1 544
Contributed Capital 24 55 Reserves 627 627 Retained profi ts 56 862 Total Equity 707 1 544
Comment
In the two years to 2007-08 the Authority traded with positive net assets. The situation deteriorated signifi cantly in the current fi nancial year due to:
• lease payments to member Councils which occurred in 2007-08 but related to previous years
• higher interest charges
• increases in Other operating costs
41 Copping Refuse Disposal Site Joint Authority

• reduction in waste received by approximately 3,000 tonnes leading to operating revenue falling $0.450m below budget.
Cash consisted of cash at bank, cash on hand and short-term bank deposits at 30 June 2008 was $0.998m. Cash decreased from the previous year due to the lease payment to member Councils discussed previously.
A decrease in Total Current Assets of $2.169m occurred due to the reduction Cash as a result of lease payments made to Councils and asset purchases. This resulted in a corresponding increase in Property, plant and equipment of $0.967m.
CASH POSITION
2007-08 2006-07$’000s $’000s
Receipts from customers 2 244 1 916 Payments to suppliers and employees ( 2 746) ( 1 441)Interest received 188 151 Borrowing costs ( 259) ( 189)GST paid ( 152) ( 1)Cash from (used in) operations ( 725) 436
Payments for property, plant and equipment ( 1 152) ( 1 010)Cash (used in) investing activities ( 1 152) ( 1 010)
Proceeds from borrowings 0 1 000 Repayment of borrowings ( 206) ( 162)Contribution from (refunds to) owners ( 31) ( 19)Cash from (used in) fi nancing activities ( 237) 819
Net increase (decrease) in cash ( 2 114) 245
Cash at the beginning of the year 3 112 2 867 Cash at end of the year 998 3 112
Comment
Cash from operations was negative for 2007-08 due to the lease payments made to Councils as discussed in the Income Statement section of this Chapter. The lease payment, along with the GST payments, investments in property, plant and equipment and debt repayment led to a decrease in cash held from the prior year of $2.114m.
In 2006-07, the Authority received loan proceeds of $1.000m and paid $1.010m for plant and equipment for operational purposes.
Payments for property, plant and equipment totalled $2.162m for the two years under review. Additions to non-current assets include the ongoing development of the medical waste treatment plant, the purchase of two new trailers, waste compactors and other minor equipment purchases.
42 Copping Refuse Disposal Site Joint Authority

FINANCIAL ANALYSIS
Bench Mark 2007-08 2006-07
Financial Performance
Result from operations ($’000s) ( 806 ) 519 Operating margin >1.0 0.72 1.34
Financial Management
Current ratio >1 5.36 8.94 Indebtedness ratio 181% 192%
Debt to equity 554.7% 267.4%Debt to total assets 84.3% 70.5%Interest cover >2 (2.11) 3.75 Cost of debt 7.5% 6.6% 4.6%Debt service ratio 22.7% 17.1%
Debt collection 30 days 34 62 Creditor turnover 30 days 3 34
Capital expenditure/depreciation >100% 623% 701%
Other Information
Staff numbers (FTEs) 2 2Average staff costs ($’000s) 129 140Average leave balance per FTE ($’000s) 0 0
Comment
Financial Performance ratios show that the Authority recorded an operating surplus in 2006-07, with a loss recorded in 2007-08 resulting in an Operating margin below the benchmark of one in the current year.
In 2007-08 there was a signifi cant reduction in the Authority’s current ratio. This was caused by a reduction in cash held as a result of the lease and other payments mentioned previously.
Debt to equity and total assets increased during 2007-08 primarily as a result of the reduction in cash held. Debt to equity ratio is a concern, a ratio of more than 500% indicates that the Authority’s operations are signifi cantly debt funded. This is a situation the Member Councils need to keep under review.
The Indebtedness ratio measures non current liabilities divided by own source revenue. A lower value for this ratio would indicate less concern for being highly levered. The ratio of 181% reduced by 5.73% compared to 192% in 2007. A high ratio would indicate more concern the Authority is likely to be less solvent. It was noted previously that Rule 43(2) of the Authority’s constitution obligates the three owner Councils to contribute equity injections until such time as the Authority becomes fi nancially independent.
The Cost of debt is still under the benchmark however it increased during 2007-08. This was due to the increase in average debt as at 30 June 2008.
Debt collection was above the 30 day benchmark for 2006-07 (51 days) but below benchmark for 2008-07 (25 days). The high ratio in the previous year was a refl ection of more than one month’s charges that were outstanding in relation to a number of the Authority’s larger clients.
43 Copping Refuse Disposal Site Joint Authority

Creditor turnover ratio improved signifi cantly during 2007-08. This is a refl ection of improved administration. The Authority has a policy of paying outstanding creditors within a 30-day period.
Capital expenditure to depreciation ratio was signifi cantly above 100% in both years, indicating that the Authority invested suffi ciently in maintaining assets.
Average staff costs reduced during 2007-08 compared to the previous year. This was primarily due to one-off bonus payments made in 2006-07. Average staff costs were determined using two FTEs, however the Authority had three part-time employees on short-term contract and one casual employee. Consequently, the Average staff costs appears higher.
44 Copping Refuse Disposal Site Joint Authority

DULVERTON REGIONAL WASTE MANAGEMENT AUTHORITY
INTRODUCTION
The Dulverton Regional Waste Management Authority (DRWMA/Authority) was established as a joint authority under Section 38 of the Local Government Act 1993 effective from 1 January 1995. The Authority was established for the purpose of conducting a licensed waste disposal landfi ll.
The Devonport City, Central Coast, Latrobe and Kentish Councils are the four participants in the Authority. Each of the four Councils initially made contributions by way of loans to the Authority in proportion to their populations.
During 2004-05, the Authority’s governance structure was changed to provide for the separation of the roles and functions of the Board and Council representatives. Previously, representatives from each of the participating Councils governed the Authority. In December 2005, the Council representatives appointed three directors. In accordance with the Authority’s revised rules, the Board may perform all the functions and exercise all of the powers of the Authority except those which are to be performed by the representatives or participating Councils.
Each participating Council is now represented by two persons who are appointed to vote on its behalf as a participating Council at representatives’ meetings. The powers and duties of the representatives are outlined in the rules of the Authority and include:
• review of the Board’s performance
• appointment, suspension and dismissal of directors
• approval of the Authority’s strategic plan, annual plan and budget.
During 2006-07 an agreement was reached between the Board and member councils that their loan debt would be converted into contributed capital.
AUDIT OF THE 2007-08 FINANCIAL STATEMENTS
Draft fi nancial statements were received on 31 October 2008, signed fi nancial statements were received on 19 January 2009 and an unqualifi ed audit report was issued on the same day.
The audit was completed with satisfactory results with no major issues outstanding other than the late submission of fi nancial statements.
FINANCIAL RESULTS
The following fi ve graphs summarise key ratios highlighting important aspects of the Authority’s fi nancial performance over the past four years. In general, the ratios indicate:
45 Dulverton Regional Waste Management Authority

( 500)
0
500
1 000
1 500
2 000
2005 2006 2007 2008
Profit Before Tax
The Authority is a for-profi t entity and is expected to generate profi ts, pay tax and provide dividends to its owner councils. As the graph indicates, the entity restructure and review of waste disposal charges in 2005-06 resulted in improved profi tability.
The Current ratio was more than adequate and indicated the Authority was able to meet all short-term liabilities.
0.00
0.50
1.00
1.50
2.00
2.50
2005 2006 2007 2008
Current Ratio
FINANCIAL POSITION
In 2004-05, we raised concerns that the fi nancial position of the Authority was declining due to revenue from operations not meeting operating and capital requirements. The Authority recorded negative working capital and negative equity in 2004-05 and 2005-06 due to the fi rst-time recognition of a provision for tip rehabilitation under revised accounting standards. In response to these issues and to improved governance arrangements referred to earlier in this Chapter, the Authority appointed new independent directors to manage the operations of the waste management facility. The new directors increased waste disposal rates, appointed a new Chief Executive Offi cer and renegotiated key supplier contracts.
The Authority achieved positive working capital during 2006-07 and converted the member Council loan debt to contributed capital which resulted in a positive equity balance at 30 June 2007. These improvements appear to have established the foundation for greater fi nancial stability and sustainability in future years. This is confi rmed by the Authority’s performance in 2007-08 with improved working capital and net asset position.
46 Dulverton Regional Waste Management Authority

INCOME STATEMENT
2007-08 2006-07 2005-06 2004-05$’000s $’000s $’000s $’000s
Operating revenue 2 707 2 175 1 980 1 508 Total Revenue 2 707 2 175 1 980 1 508
Employee costs 159 231 157 192 Borrowing costs 64 87 92 69 Depreciation 243 153 124 111 Other operating expenses 1 552 1 440 1 531 1 527 Total Expenses 2 018 1 911 1 904 1 899
Profi t (Loss) before: 689 264 76 ( 391)
Rehabilitation provision reassessment 290 1 419 0 0 Profi t (Loss) before taxation 979 1 683 76 ( 391)
Income tax expense 294 505 23 ( 114)Net Profi t (Loss) 685 1 178 53 ( 277)
Comment
The Authority’s Profi t (Loss) before Rehabilitation provision reassessment gradually improved over the period under review, from a loss of $0.391m in 2004-05 to a profi t of $0.689m in 2007-08. A profi t from operating activities indicates that the Authority is generating suffi cient revenue to fulfi l its operating requirements, including coverage of its depreciation charges. The main movements in revenue and expense items are discussed below.
Operating revenue increased by $1.199m in the period under review. This increase was due to a combination of increases to the Council rate (59% increase) and Special waste rate (68% increase). The decision to increase rates was made by the Authority in response to signifi cant losses in 2003-04 and 2004-05. The higher rates are designed to enable the Authority to meet its operating and capital requirements. The major item included in Operating revenue was Council waste charges of $1.403m, 52% of total operating revenue (2006-07, $1.245m, 57%). The balance of revenue consisted of industrial and controlled waste charges, interest and sundry revenue.
Employee costs decreased from $0.192m in 2004-05 to $0.159m in 2007-08. During 2004-05, the Authority commenced the employment of staff to undertake day-to-day operations. At the end of the fi nancial year, one employee resigned and was not replaced in 2005-06. During 2006-07 the remaining operational staff were made redundant following a decision to outsource the operations of the waste facility to a contractor. The only staff directly employed by the Authority are the CEO and personal assistant.
Borrowing costs represent payments to external fi nancial institutions and interest on Council loans. 2006-07 was the last year in which interest was paid Councils due to the conversion of the loan debt to equity. The Authority’s obligation under a fi nance lease also ceased during 2006-07. The Authority continued to service loans from external fi nancial institutions.
Depreciation charges increased by $0.132m (or 118.9%) in the period under review. This increase was largely due to an independent revaluation of land and buildings effective from 31 March 2007 however the full impact was not felt until 2007-08.
Other operating expenses increased by $0.025m (or 1.64%) in the period under review. The increase refl ected a general increase in costs across all of the Authority’s activities. The material items included in Other operating expenses were:
47 Dulverton Regional Waste Management Authority

• daily cover , waste placement and contractor charges, (2007-08, $0.804m; 2006-07, $0.705m)
• administration and overheads, ($0.377m; $0.174m)
• consultancy services, ($0.100m; $0.094m)
The Authority provides for a provision for rehabilitation and aftercare of the waste disposal landfi ll site. The provision is based on costs to be incurred in future years under current legislative requirements. The provision at 30 June 2006 included costs associated with the ongoing rehabilitation of the landfi ll for its estimated 20 year life. During 2006-07 it was determined that the provision should only include costs associated with the rehabilitation of the currently utilised portion of the landfi ll which will be progressively rehabilitated as cells are completed. The environmental protection notice requires rehabilitation on a two yearly basis. Aftercare for the site, including monitoring, management, fi nancing of contingent liabilities and maintenance, consistent with prior years, is also included in the provision.
The impact of the reassessments resulted in write-backs to the provision of $0.290m in 2007-08 and $1.419m in 2006-07. In determining the provision, future costs are discounted to present values at balance date. As the liability is based on discounted future costs, the unwinding of the provision, (2007-08, nil, 2006-07, $0.080m; 2005-06, $0.159m) is recognised as an Other operating expense each year.
The movement in Income tax expense correlates with the year-end Profi t/(Loss) before taxation. The tax impact of the reassessment of the provision for rehabilitation and aftercare was to partially reverse the Authority’s deferred tax asset, resulting in an assessable temporary difference for tax purposes for 2007-08 and 2006-07. Tax is payable to the participating Councils.
48 Dulverton Regional Waste Management Authority

BALANCE SHEET
2007-08 2006-07 2005-06 2004-05$’000s $’000s $’000s $’000s
Cash 535 171 57 87 Receivables 506 322 332 262 Prepayments 45 0 0 0 Total Current Assets 1 086 493 389 349
Payables 214 152 331 407 Current tax liabilities 144 75 ( 26) ( 26)Borrowings 140 34 89 193 Provisions - employee benefi ts 14 7 8 4 Total Current Liabilities 512 268 402 578
Working Capital 574 225 ( 13) ( 229)
Property, plant and equipment 5 274 4 493 2 094 2 112 Other 423 509 982 1 020 Total Non-Current Assets 5 697 5 002 3 076 3 132
Borrowings 835 304 1 384 1 473 Provisions - employee benefi ts 1 4 6 3 Provisions - rehabilitation 1 380 1 670 3 009 2 850 Other 841 831 168 167 Total Non-Current Liabilities 3 057 2 809 4 567 4 493
Net Assets 3 214 2 418 ( 1 504) ( 1 590)
Contributed Capital 1 747 1 747 701 768 Reserves 2 229 2 117 420 387 (Accumulated losses) ( 762) ( 1 446) ( 2 625) ( 2 745)Total Equity 3 214 2 418 ( 1 504) ( 1 590)
Comment
In the fi rst two years under review the Authority traded with negative equity. The situation has since improved signifi cantly, with the Authority reporting a Total equity balance of $3.214m at 30 June 2008. The increase in Total Equity of $4.804m over the period under review was due to:
• surpluses after tax of $1.916m (2007-08, $0.685m; 2006-07, $1.178m; 2005-06, $0.053m)
• asset revaluation increments of $1.842m ($0.112m; $1.696m; $0.034m)
• conversion of member Council loan to contributed capital of $1.046m.
Cash increased by $0.448m over the period under review, which refl ected the Authority’s improved fi nancial position.
The Authority applies the revaluation model to its property, plant and equipment assets, which results in the assets being recorded at fair value. Property, plant and equipment increased by $3.162m in the period under review due primarily to the revaluation of assets. A signifi cant revaluation was undertaken by an independent valuer during 2006-07 which resulted in an increase in asset values of $2.429m with the majority of the increase relating to the land, landfi ll and composting facility, $2.380m.
49 Dulverton Regional Waste Management Authority

Total Borrowings decreased by $0.691m during the period under review which refl ected new loan borrowings of $0.720m offset by principal loan repayments made of $0.365m and a decrease of $1.046m in non-current Borrowings during 2006-07 as a result of the conversion of member Council loan debt to contributed capital.
As discussed in the Income Statement section, every year the Authority must review future costs and discount the provision for rehabilitation and aftercare to present value. During the period under review, the provision decreased by $1.470m. This movement was a result of net decreases due to reassessments of $1.709m offset by an increase due to the unwinding of the discount of $0.239m.
The balance of Other non-current assets represents deferred tax assets. Of the years under review, the most signifi cant movement was a decrease of $0.473m in 2006-07 which was due predominantly to the provision for rehabilitation and aftercare being reassessed.
The balance of Other non-current liabilities represents deferred tax liabilities. Of the years under review, the most signifi cant movement was an increase of $0.663m in 2006-07 which was mainly due to the impact of the revaluation of property, plant and equipment assets, $0.733m.
CASH POSITION
2007-08 2006-07 2005-06 2004-05$’000s $’000s $’000s $’000s
Receipts from customers 2 724 2 396 2 246 1 848 Payments to suppliers and employees ( 1 940) ( 1 994) ( 1 938) ( 1 771)Interest received 35 11 4 3 Borrowing costs ( 51) ( 87) ( 92) ( 69)Taxation paid ( 178) 0 0 ( 26)Cash from (used in) operations 590 326 220 ( 15)
Payments for property, plant and equipment ( 864) ( 123) ( 57) ( 210)Cash (used in) investing activities ( 864) ( 123) ( 57) ( 210)
Proceeds from borrowings 720 0 0 400 Repayment of borrowings ( 83) ( 89) ( 193) ( 92)Cash from (used in) fi nancing activities 637 ( 89) ( 193) 308
Net increase (decrease) in cash 363 114 ( 30) 83
Cash at the beginning of the year 171 57 87 4 Cash at end of the year 534 171 57 87
Comment
Cash generated from operations was positive for the last three years under review refl ecting the increase in waste disposal rates, as discussed in the Income Statement section of this Chapter.
Payments for property, plant and equipment totalled $1.254m for the four years under review. Additions to non-current assets included works on leachate lagoons and cell development, security fencing, cover waste and minor plant and equipment purchases. The high payments in 2007-08, $0.864m, were mainly due to the Stage 4 cell development.
In December 2004, the Authority received loan proceeds of $0.400m to purchase land, and for other operational purposes. An additional loan of $0.720m was taken out in 2007-08 to enable the construction of a new waste cell.
50 Dulverton Regional Waste Management Authority

FINANCIAL ANALYSIS
Bench Mark 2007-08 2006-07 2005-06 2004-05
Financial Performance
Result from operations ($’000s) 689 264 76 ( 391 )EBIT ($’000s) 753 351 168 ( 322 )Operating margin >1.0 1.34 1.14 1.04 0.79 Return on assets 12.3% 7.8% 4.8% (11.6%)Return on equity 12% 24.3% n/a n/a n/a
Financial Management
Current ratio >1 2.12 1.84 0.97 0.60 Indebtedness ratio 112.9% 129.1% 230.7% 297.9%
Debt to equity 30.3% 14.0% n/a n/aDebt to total assets 14.4% 6.2% 42.5% 47.9%Interest cover >2 11.77 4.03 1.83 (4.67)Cost of debt 7.5% 9.7% 9.6% 5.9% 5.1%Debt service ratio 5.0% 8.1% 14.4% 10.7%
Debt collection 30 days 69 54 61 64 Creditor turnover 30 days 32 35 76 86
Capital expenditure/depreciation 100% 356% 80% 46% 189%
Other Information
Staff numbers (FTEs) 2 2 3 4Average staff costs ($’000s) 80 116 52 48Average leave balance per FTE
($’000s) 8 6 5 2
n/a – some ratios are not applicable due to the negative equity situation existing prior to 30 June 2007
Comment
For the reasons noted previously, the fi nancial performance ratios show that the Authority recorded operating surpluses in the last three years under review resulting in Operating margins above benchmark. An operating defi cit of $0.391m was recorded in 2004-05 resulting in a negative Operating margin.
A signifi cant improvement in the Authority’s current ratio occurred in 2007-08. This was a combination of decreased Payables at year end and increased cash held as a result of the increments in waste service charges.
Debt to total assets decreased in 2006-07 primarily as a result of increased asset values following the revaluation of property, plant and equipment and the conversion of Council loans to equity. The percentage increased to 14.4% in 2007-08 due to a new loan for $0.720m. This loan also caused an increase in the Debt to equity ratio in 2007-08.
Interest cover improved signifi cantly over the period under review, which refl ected the Authority’s improved fi nancial result. The Cost of debt was relatively high in 2006-07, at 9.6%, due to the conversion of Council debt to equity, which resulted in a reduction in the average debt balance at 30 June 2007. The interest paid to Councils for 2006-07 of $0.065m was still included as a borrowing cost. The high cost of debt in 2007-08, 9.7%, was due to interest charged on insurance
51 Dulverton Regional Waste Management Authority

premiums paid by instalments and the impact of a part-year of interest charges on the new loan of $0.720m drawn down in October 2007. The Debt service decreased from 2005-06 due to the reduction in interest and principal repayments combined with increased operating revenue.
Debt collection ratio was signifi cantly above benchmark for all years under review. There are no doubts over the collectability of debts, rather the high ratio was a refl ection that more than one month’s charges were outstanding for a number of the Authority’s larger clients.
Creditor turnover improved signifi cantly since 2005-06. This was a refl ection of improved administration management following the restructure of the Authority. The Authority has a policy of paying outstanding creditors within a 30-day period.
Capital expenditure to depreciation ratio was below 100% in 2005-06 and 2006-07 which suggested that the Authority might not have invested suffi ciently in maintaining assets. In response, the Board completed a fi ve-year strategic plan to address future infrastructure requirements. The ratio in 2007-08 increased signifi cantly above the benchmark as result of the expenditure on the Stage 4 cell development, as noted in the Cash Position section.
Average staff costs and Average staff entitlements vary throughout the period under review due to the numerous staff changes and restructuring of the Authority’s operations. Average staff costs during 2006-07 were artifi cially infl ated. There were only two staff employed at the end of the year, but the expense for the year included wage and redundancy payments to operational staff.
52 Dulverton Regional Waste Management Authority

LOCAL GOVERNMENT WATER AUTHORITIES
INTRODUCTION
Section 30 of the Local Government Act 1993 (the Local Government Act) enables councils to establish a single authority or a joint authority with one or more councils. A single or joint authority may be established to:
• carry out any scheme, work or undertaking
• provide facilities or services and
• perform any functions or exercise any powers of a council under the Act or any other relevant legislation.
Currently there are three joint water authorities operating in Tasmania:
• Cradle Coast Water (CCW)
• Esk Water Authority (Esk) and
• Hobart Regional Water Authority (Hobart).
These authorities are also referred to as bulk water authorities.
Water and Sewerage Reform
On 25 February 2008, the Treasurer announced that State Cabinet had approved implementation of the Ministerial Water and Sewerage Taskforce’s recommendations to reform the water and sewerage sector in Tasmania. Under the reforms, three new local government owned and regionally based entities would be created together with a common service provider subsidiary company.
The Water and Sewerage Corporations Act 2008 (the Water Act) was proclaimed on 13 June 2008. The purposes of the Water Act are to:
• provide for matters relating to the establishment and governance of three Regional Corporations, each having as its primary purpose the provision of water and sewerage services to its region, owned by the constituent councils of that region
• establish a Common Services Corporation owned by the three Regional Corporations
• vest the water and sewerage assets, rights and liabilities of councils and bulk water authorities in the Regional Corporations and the Common Services Corporation
• make provision for the transfer of water and sewerage employees of councils and employees of bulk water authorities to the Regional Corporations and the Common Services Corporation.
The Water Act provides for the establishment of an economic regulatory framework for the water and sewerage industry, including the establishment of a licensing regime and providing for the regulation of prices, customer service standards and performance monitoring of that industry and for related matters.
The new corporations commenced minimal operations on 1 January 2009 with a target date of 1 July 2009 for the full transfer of water and sewerage assets, liabilities and staff. Full transition to the new water pricing and servicing standards is not expected until January 2012.
53 Local Government Water Authorities

An independent fi rm was appointed to conduct due diligence associated with the water and sewerage reform. The process commenced with three trial councils, prior to a broader process across all councils and bulk water authorities. The process was to be fi nalised in December 2008, but has been delayed to February 2009.
A common chair and three other common directors have been appointed to the three Regional Corporations. In addition, two regionally based directors have been appointed to each of the three Regional Corporations. The common chair and the three Chief Executive Offi cers of the Regional Corporations, who now been appointed, are the directors of the Common Services Corporation. The Chief Executive Offi cer of the Common Services Corporation has also been appointed.
With the full transfer of bulk water assets, other associated assets and liabilities and staff, by each water Authority on 1 July 2009 to the new Regional Corporations, I expect the fi nancial statements prepared at 30 June 2009 will be each Authority’s fi nal statements and for the Authority’s to be wound up.
Owner Councils
The owner councils of these three Authorities are noted in the table below.
CCW Esk HobartCentral Coast George Town BrightonCircular Head Launceston City Clarence CityDevonport City Meander Valley Glenorchy CityKentish West Tamar Hobart CityLatrobe KingboroughWaratah-Wynyard Sorell
Southern MidlandsDerwent Valley
Councils which do not currently participate in the three existing Authorities, operating arrangements on their own account, are:
• Break O’Day
• Burnie City
• Central Highlands
• Dorset
• Flinders Island
• Glamorgan Spring Bay, although in June 2007 it signed a long term operation and maintenance agreement with Hobart Water
• Huon Valley
• King Island
• Northern Midlands
• Tasman and
• West Coast.
This Chapter analyses comparative performance with separate Chapters for each Authority following this summary.
54 Local Government Water Authorities

FINANCIAL RESULTS
INCOME STATEMENTS FOR THE FINANCIAL YEAR ENDED 30 JUNE 2008
CCW Esk Hobart$’000s $’000s $’000s
Sales revenue 9 579 9 845 25 225 Other operating revenue 1 125 954 5 684 Total Revenue 10 704 10 799 30 909
Borrowing costs 1 349 0 2 359 Depreciation 2 338 3 077 6 369 Other operating expenses 5 524 4 588 17 474 Total Expenses 9 211 7 665 26 202
Profi t before: 1 493 3 134 4 707
Change in fair value of fi nancial instruments 0 0 35 Defi ned benefi t superannuation actuarial gains 0 0 0 Asset revaluation increments to offset previously
recognised decrements 0 487 0
Profi t before taxation 1 493 3 621 4 742
Income tax expense 448 1 087 1 463 Net profi t after taxation 1 045 2 534 3 279
Comment
The majority of Operating revenue (85.2%) is received from bulk water sales, with constituent councils being the major customers. I note that all the three Authorities continue to charge water at prices below the maximum recommended by the Government Prices Oversight Commission (GPOC) in a review competed in June 2007. However, as the owner councils are also the major customers, increased prices resulting in greater profi ts, would be returned in a corresponding increase in dividends.
Esk repaid the balance of its debt in 2005-06 resulting in no Borrowing costs this fi nancial year. Hobart and CCW have adopted a different strategy on borrowings and both maintain specifi c levels of debt
The Authorities manage signifi cant infrastructure assets with all three recognising these assets at fair value. Depreciation charges comprise a signifi cant expense for each Authority, refl ecting the signifi cant carrying value of their infrastructure.
On average, Other operating expenses represented 53% (Hobart 57%, CCW 52% and Esk 42%) of Operating revenue, the major items being cost of sales and employee expenses.
As expected, being monopoly suppliers, all three Authorities recorded net profi ts before taxation and non-operating adjustments which averaged 18% of Operating revenue with Esk receiving the best return, 29%, followed by Hobart, 15%, and CCW, 14%. To a large extent this refl ects Esk’s
55 Local Government Water Authorities

lower operating costs, because it incurs no Borrowing costs and because it earns higher interest revenue relative to the other two.
To a large extent the tax expenses reported represent tax effect amounts arising from temporary differences between the tax and accounting values of specifi ed assets and liabilities and carried forward tax losses. Only Hobart pays tax which it has elected to do despite it having tax losses available to it.
BALANCE SHEETS AS AT 30 JUNE 2008
CCW Esk Hobart$’000s $’000s $’000s
Cash and investments 1 761 12 260 6 228 Receivables and prepayments 639 607 7 728 Inventories 241 256 1 158 Other 175 970 98 Total Current Assets 2 816 14 093 15 212
Payables 391 316 3 613 Borrowings 0 0 13 798 Provision for dividend 0 0 1 600 Provisions superannuation 510 65 839 Provisions - employee benefi ts 527 354 1 175 Current tax liability and other 1 030 566 329 Total Current Liabilities 2 458 1 301 21 354
Working Capital 358 12 792 ( 6 142)
Property, plant and equipment 110 881 119 973 309 986 Deferred tax assets, intangibles and other 3 998 4 834 1 254 Total Non-Current Assets 114 879 124 807 311 240
Borrowings 21 900 0 19 400 Provisions - superannuation 532 1 986 3 522 Provisions - employee benefi ts 79 23 214 Deferred tax liabilities 13 160 23 502 48 639 Total Non-Current Liabilities 35 671 25 511 71 775
Net Assets 79 566 112 088 233 323
Capital 0 81 548 0 Reserves 64 297 28 724 217 874 Retained earnings 15 269 1 816 15 449 Total Equity 79 566 112 088 233 323
56 Local Government Water Authorities

Comment
The Receivables and prepayments balance for Hobart Water was considerably greater than the other two Authorities, with the balance of $7.728m primarily comprising amounts owing by Joint Authority members who pay on 90 day terms.
As noted previously in the Income Statement section of this Chapter, all three Authorities manage signifi cant assets, the majority of which are water infrastructure assets related to the treatment and supply of bulk water. All three record infrastructure assets at fair value.
The three Authorities manage their capital differently as evidenced by:
• CCW relies on a mix of retained earnings, revaluation reserves and debt of $21.900m
• Hobart relying on a mix of retained earnings, revaluation reserves, and debt of $33.198m and
• Esk now relying only on equity in the form of retained earnings including Capital of $81.548m (contributed by the Rivers and Water Supply Commission $72.377m, Launceston City Council $8.682m and Meander Valley Council $0.489m on formation of Esk) and revaluation reserves.
It is understood that CCW and Hobart use debt to an extent in recognition of the need to recognise inter-generational equity, in that future users of their water and other services should be expected to pay for those services in the form of interest charges. To some extent this is also caused by differing approaches to long-term asset management and replacement. The consequences of these differing approaches result in varying fi nancial performance, as demonstrated by the Financial Analysis detailed later in this Chapter.
57 Local Government Water Authorities

CASH FLOW STATEMENTS FOR THE FINANCIAL YEAR ENDED 30 JUNE 2008
CCW Esk Hobart$’000s $’000s $’000s
Receipts from customers 11 254 10 217 31 728 Payments to suppliers and employees ( 6 150 ) ( 4 585 ) ( 19 156 )Interest received 42 709 1 126 Borrowing costs ( 1 296 ) 0 ( 2 937 )Income tax paid 0 0 ( 1 438 )Cash from operations 3 850 6 341 9 323
Payments for PP&E ( 3 984 ) ( 1 200 ) ( 9 887 )Proceeds from sale of PP&E 147 59 262 Payments to terminate derivatives 0 0 66 Cash (used in) investing activities ( 3 837 ) ( 1 141 ) ( 9 559 )
Proceeds from borrowings 14 808 0 11 400 Repayment of borrowings ( 14 531 ) 0 ( 11 400 )Dividends paid ( 650 ) ( 1 807 ) ( 3 400 )Cash (used in) fi nancing activities ( 373 ) ( 1 807 ) ( 3 400 )
Net increase in cash ( 360 ) 3 393 ( 3 636 )
Cash at the beginning of the year 2 121 8 867 9 864 Cash at end of the year 1 761 12 260 6 228
Comment
All three Authorities had positive cash fl ows from operations primarily due to their monopoly status, which allows the determination of water prices to cover all operating expenses including depreciation and a profi t margin on operations.
The cash generated from operations is used primarily to fund capital works and purchases and provide dividends to the constituent councils. In relation to borrowings, as noted previously, both Hobart and CCW holding debt at specifi c levels, with proceeds and repayments offsetting.
Both Hobart and CCW recorded decreases in their cash position, but both undertook signifi cant capital works during the period. Esk increased it cash balance signifi cantly, but the cash surpluses it is generating will be used to undertake future capital projects, including the construction of a replacement treatment plant at Distillery Creek with an estimated cost of $10.200m.
58 Local Government Water Authorities

FINANCIAL ANALYSIS FOR THE FINANCIAL YEAR ENDED 30 JUNE 2008
Bench Mark CCW Esk Hobart
Financial Performance
Result from operations ($’000s) 1 493 3 134 4 707 EBIT ($’000s) 2 842 3 621 7 101 Operating margin >1.0 1.16 1.41 1.18 Return on assets* 4.5-7% 2.6% 2.7% 2.2%Return on equity 1.4% 2.4% 1.4%Underlying result ratio 13.9% 33.5% 15.3%Self fi nancing ratio 36.0% 58.7% 30.2%
Financial Management
Debt to equity 27.5% n/a 14.8%Debt to total assets 18.6% n/a 10.2%Interest cover >3 2.1 n/a 3.0 Current ratio >1 1.1 10.8 0.7 Indebtness ratio 333.2% 236.2% 232.2 Cost of debt 7.5% 6.2% n/a 7.1%Debt service ratio 148% n/a 12%Debt collection** 30 days 22 23 102 Creditor turnover 30 days 20 28 34
Capital expenditure/depreciation 100% 170% 39% 155%
Returns to Owners
Dividends paid or payable ($’000s) 745 1 835 3 200 Dividend payout ratio 50% 71.3% 72.4% 97.6%Dividend to equity ratio 1.0% 1.7% 1.4%Income tax paid or payable ($’000s) 0 0 1 269 Effective tax rate 30% 0.0% 0.0% 26.8%Total return ($’000s) 745 1 835 4 469 Total return on equity ratio 1.0% 1.7% 2.0%
Other Information
Staff numbers (FTE) 31 25 102 Average staff costs ($’000s) 76 64 77 Average leave balance per FTE ($’000s) 20 14 13
* Target based on GPOC assessment** Hobart’s debt collection policy is to collect bulk water invoices on 30 to 90 days
59 Local Government Water Authorities

Comment
As noted in the Income Statement section of this Chapter, all three Authorities as monopoly suppliers generate solid profi ts. The profi tability of these Authorities is further illustrated by the strong Underlying result ratio. However, as the Authorities are not setting prices in line with the maximum recommended by GPOC, the Return on assets and Return on equity ratios are below benchmark. However, as the owner councils are also the major customers, the lower returns are offset by lower costs for bulk water.
The Self fi nancing ratios indicate the Authorities’ ability to generate strong cash fl ows from their operations in comparison to operating revenues. The cash generated is required to meet future capital funding requirements due to the Authorities managing signifi cant long-life infrastructure assets. Operating cash fl ows are also utilises to pay dividends and build up cash reserves.
The Debt to equity and Debt to total assets ratios refl ect the capital management approaches of each Authority, as noted previously. Both Hobart and CCW maintain a specifi c level of debt as part of their fi nancing strategies. Both Hobart and CCW Cost of debt and interest cover ratios are within benchmark. CCW’s Debt servicing ratio is distorted by its cash fl ows showing loan repayments during 2007-08 of $14.531m, offset by new borrowings of $14.808m.
Esk has strong working capital, as refl ected by the current ratio, due to a high cash balance and no current borrowing obligations. CCW’s current ratio is also above the benchmark, but does not include any current borrowings, as it has moved to interest only debt. Hobart has a current ratio below the benchmark, however the ratio is distorted by current-liabilities including $13.798m in borrowings that will be refi nanced in 2008-09. In general, each entity is confi dent it has the ability to meet short-term liabilities as they arise.
The Indebtedness ratio indicates each Authorities’ non current-liabilities are manageable compared to the revenue being generated.
The nature of the long life infrastructure assets managed by each Authority is driven by strategic asset management plans that included asset replacement schedules based on the age profi le of their assets. Consequently, capital expenditure in any particular year may fl uctuate, as illustrated by each Authority’s capital expenditure/depreciation ratio.
Each entity is making a positive return to owners based on profi ts after tax being generated. Hobart is distributing nearly all its after tax profi t as indicated by its Dividend payout ratio of 97.6%, with both Esk and CCW above 70%. In relation to tax, only Hobart is making a tax payment, although it has carried forward tax losses.
60 Local Government Water Authorities

CRADLE COAST WATER
INTRODUCTION
The North West Water Authority (the Authority) was established by the Minister for Local Government on 10 August 1999 as a Joint Authority of the Circular Head, Waratah-Wynyard, Central Coast, Devonport City, Latrobe and Kentish Councils under Section 38 of the Local Government Act 1993.
In accordance with the North West Water (Arrangements) Act 1997 the then Minister for Primary Industries, Water and Environment published a notice in the Gazette on 9 August 1999 transferring to the Authority all the prescribed property, obligations and liabilities of the North West Regional Water Authority.
In December 2001, the Authority changed its name from the North West Water Authority to Cradle Coast Water.
A fi ve-person Board of Management administers the Authority, and is responsible under its Rules to a Governance Board made up of representatives from the six owner councils.
While the directors of the Authority have determined that Cradle Coast Water is a not-for-profi t entity for fi nancial reporting purposes, a view that is contrary to my opinion that the Authority meets the criteria for classifi cation as a for-profi t entity, the fi nancial statements comply with the requirements for reporting as a for-profi t entity.
AUDIT OF THE 2007-08 FINANCIAL STATEMENTS
Signed fi nancial statements were received on 18 August 2008, and an unqualifi ed audit report was issued on 7 October 2008.
The audit was completed satisfactorily with no major issues outstanding.
FINANCIAL RESULTS
The following fi ve graphs summarise key ratios highlighting important aspects of the Authority’s fi nancial performance over the past four years. In general, the ratios indicate:
1 000
1 100
1 200
1 300
1 400
1 500
2005 2006 2007 2008
Profit Before Tax
The Authority is expected to generate profi ts, pay tax and provide dividends to its owner councils. As the graph indicates, over the past four years, it has consistently generated profi ts before tax.
61 Cradle Coast Water

The Return on equity was below expectation and was the result of the Authority not setting a commercial rate of return (7%) as recommended by Government Prices Oversight Commission. However, as the member councils are both the owner and major customer, reduced return on equity arising from lower profi ts is offset by lower prices for the purchase of water.
1.0%
1.5%
2.0%
2.5%
2005 2006 2007 2008
Return on Equity
10%
11%
12%
13%
14%
15%
16%
2005 2006 2007 2008
Underlying Result Ratio
The Underlying result ratio indicates the Authority’s profi t remained fairly consistent with increases in revenue over the four year period. As a monopoly supplier of bulk water, the Authority is able to price water sales to ensure a specifi c return.
The Authority is generating strong operating cash fl ows when compared to its total operating revenue. This result is expected as the Authority has a signifi cant infrastructure base valued at fair value and is ensuring its pricing is meeting all operating expenses including depreciation. The Authority is generating suffi cient cash to contribute to future infrastructure requirements.
20%
25%
30%
35%
40%
2005 2006 2007 2008
Self Financing Ratio
0.40
0.60
0.80
1.00
1.20
1.40
2005 2006 2007 2008
Current Ratio
The Current ratio fl uctuated around the benchmark of one. At 30 June 2008, the positive ratio was enhanced by the Authority adopting interest only borrowings, resulting in no current liability for borrowings. The Authority is confi dent it is able to meet all short-term liabilities.
62 Cradle Coast Water

INCOME STATEMENT
2007-08 2006-07 2005-06 2004-05$’000s $’000s $’000s $’000s
Sales revenue 9 579 9 168 8 278 8 284 Interest revenue 42 49 63 29 Other operating revenue 1 082 892 461 591 Total Revenue 10 703 10 109 8 802 8 904
Borrowing costs 1 349 1 328 1 366 1 321 Depreciation 2 338 2 125 1 353 1 339 Cost of sales (less depreciation) 2 226 2 118 1 961 2 084 Other operating expenses 3 298 3 238 2 874 2 816 Total Expenses 9 211 8 809 7 554 7 560
Profi t before taxation 1 492 1 300 1 248 1 344
Income tax expense 448 390 374 403 Net Profi t 1 044 910 874 941
Comment
Relative to turnover, the Authority recorded solid operating profi ts before tax in all four years under review. In each of the four years, the profi t before tax exceeded 13% of Total Revenue.
The majority of the Authority’s revenue was derived from bulk water sales to municipal consumers. Sales revenue increased by $1.295m (or 15.6%) over the period under review, primarily due to an increase in water charges. The price per megalitre (ml) increased from $0.204 per ml for 2004-05 year to $0.222 ml for 2006-07, an increase of 9.02% with a further increase in 2007-08 in line with the Corporate Plan, bringing the price per ml to $0.229. Water consumption over the 2004-05 to 2006-07 period increased by 316 mls (or 2.09%), however, during the 2007-08 year there was a 2 213 ml decrease in water usage to 13 212 mls.
The major component of Other operating revenue was external contract works, which increased by $0.458m over the period under review. This was primarily due to demand for irrigation water by farmers for extra crops and fl uoridation upgrades increasing with dryer weather conditions.
Depreciation expense increased by $0.999m or 75% during the period under review, as a result of the substantial hike in infrastructure assets arising from the revaluation completed in 2005-06. It was noted that the abnormally high revaluation increment in that year was a refl ection on the nature of prior years’ valuations, which consisted of updating for new assets capitalised, without factoring in increases in costs for existing assets. Depreciation expense during the 2007-08 year totalled $2.338m, equating to a 10% increase on the preceding period with a signifi cant increase in depreciation expense expected for the 2008-09 year due to the 30 June 2008 revaluation and additions made during the current year.
The table below illustrates the depreciation charge increased in line with movements in property, plant and equipment balances. The percentage for 2005-06 was lower due to the revaluation at 30 June 2006, which did not impact the depreciation expense until the 2006-07.
63 Cradle Coast Water

2007-08 2006-07 2005-06 2004-05$’000s $’000s $’000s $’000s
Depreciation 2 338 2 125 1 353 1 339 Property, plant and equipment - average* 104 382 95 140 77 327 62 258 Depreciation as percentage of average PPE 2.24% 2.23% 1.75% 2.15%
*average based on opening and closing written down value
Cost of sales represents the production costs associated with collecting, conserving and treating water to a saleable point. Historically, cost of sales varied between 23% and 29% of sales revenue, and the percentages for the period under review were within that range. Depreciation is recorded as a separate item in the Income Statement, but the Authority included a portion of depreciation as a ‘cost of sales’ within its fi nancial statements.
Other operating expenses include administration, occupancy and distribution expenses, as well as the external contract work costs noted previously. Distribution expenses for the 2006-07 were impacted by the increased volumes and the need to supplement some water supplies from alternative systems, with electricity for pumping up $0.161m. The 2005-06 total included some expenditure relating to projects and investigations undertaken during that year, largely focusing on future developments and opportunities for the Authority, which contributed to the higher overall expense in that period. The 2007-08 year only saw a minor increase in operating expenses of $0.061m (or 2%) on the prior year as a result of the decreased demand for water.
64 Cradle Coast Water

BALANCE SHEET
2007-08 2006-07 2005-06 2004-05$’000s $’000s $’000s $’000s
Cash 1 761 2 121 1 390 1 088 Receivables 639 576 502 516 Inventories 241 179 162 128 Other 175 236 240 218 Total Current Assets 2 816 3 112 2 294 1 950
Payables 391 363 283 361 Interest bearing liabilities 0 1 417 60 2 207 Provisions – superannuation 510 464 227 206 Provisions – employee entitlements 527 474 440 392 Deferred income 208 0 0 0 Other 822 738 773 774 Total Current Liabilities 2 458 3 456 1 783 3 940
Working Capital 358 ( 344) 511 ( 1 990)
Property, plant and equipment 110 881 97 882 92 397 62 257 Deferred tax asset 3 998 4 104 4 061 5 685 Total Non-Current Assets 114 879 101 986 96 458 67 942
Interest bearing liabilities 21 900 20 414 21 831 19 091 Provisions – superannuation 532 532 613 685 Provisions – employee entitlements 79 92 78 82 Deferred tax equivalent liability 13 160 9 402 7 338 41 Total Non-Current Liabilities 35 671 30 440 29 860 19 899
Net Assets 79 566 71 202 67 109 46 053
Reserves 64 297 56 327 52 520 31 583 Retained earnings 15 269 14 875 14 589 14 470 Total Equity 79 566 71 202 67 109 46 053
Comment
Total Equity increased during the period under review by $33.513m. Retained profi ts increased by $0.799m whilst Reserves increased by $32.714m. The increase in Reserves was attributed to revaluation increments during 2005-06 of $20.937m, 2006-07 of $3.807m and 2007-08 $11.385m. These revaluations were offset by an associated adjustment in the Deferred tax liability arising on revaluations of 2005-06 $6.281m, 2006-07 $1.142m and 2007-08 of $3.415m.
The Authority’s Cash balance at 30 June 2008 comprised cash at bank and on hand of $0.096m and short term investments of $1.664m.
As noted previously, the Authority manages signifi cant long life infrastructure assets. Property, plant and equipment represent approximately 94% of all the Authority’s assets. It applies a fair value basis of valuation, based on an optimised deprival valuation methodology (current replacement cost). A full revaluation of infrastructure assets was performed on 30 June 2008 by the Australian Valuation Offi ce (AVO).
Property, plant and equipment increased by $12.999m in 2007-08, due primarily to new assets acquired, $4.050m, and asset revaluation increments, $11.385m, offset by depreciation of $2.338m.
65 Cradle Coast Water

The 2005-06 revaluation increment of $29.484m represented an increase of 50% on the 2004-05 carrying value of infrastructure assets, which was a refl ection on the nature of prior years’ valuations, as noted in previous comments on depreciation. The 2006-07 revaluation included a 7% indexation factor to approximate increases in construction costs. The 2007-08 revaluation was performed on 30 June 2008 by the AVO and related to the treatment plants and pipelines. The revaluation also resulted in a $3.293m increase in accumulated depreciation in addition to the annual depreciation charge of $2.093m.
Total Interest bearing liabilities at 30 June 2008 were $21.900m. This was an increase of $0.602m (or 2.8%) over the period under review. In November 2007, three of the four pre-existing Tascorp loans were consolidated into a new loan. During 2007-08 all of the Tascorp loans were on an interest only basis (repayable on maturity) and thus not included in current liabilities for that year.
The net deferred tax balance changed from a net tax asset of $5.644m in 2004-05 to a net tax liability of $3.277m in 2005-06, with further increases to a net tax liability position of $5.298m at 30 June 2007 and $9.162m at 30 June 2008. The primary cause of this was recognition of deferred tax liabilities relating to the asset revaluation increment previously referred to, which were offset against the revaluation increment in the asset revaluation reserve.
CASH POSITION
2007-08 2006-07 2005-06 2004-05$’000s $’000s $’000s $’000s
Receipts from customers 11 254 10 674 9 200 9 458 Payments to suppliers and employees ( 6 150) ( 5 824) ( 5 459) ( 5 312)Interest received 42 44 63 29 Borrowing costs ( 1 296) ( 1 347) ( 1 366) ( 1 319)Cash from operations 3 850 3 547 2 438 2 856
Payments for property, plant and equipment ( 3 984) ( 2 219) ( 2 087) ( 2 677)Proceeds from sale of property, plant and
equipment 147 87 102 93 Cash (used in) investing activities ( 3 837) ( 2 132) ( 1 985) ( 2 584)
Proceeds from borrowings 14 808 800 2 800 5 300 Repayment of borrowings ( 14 531) ( 860) ( 2 207) ( 5 327)Dividends paid ( 650) ( 624) ( 744) ( 629)Cash (used in) fi nancing activities ( 373) ( 684) ( 151) ( 656)
Net increase (decrease) in cash ( 360) 731 302 ( 384)
Cash at the beginning of the year 2 121 1 390 1 088 1 472 Cash at end of the year 1 761 2 121 1 390 1 088
Comment
The Authority generated strong Cash from operations, totalling $12.691m, due to it being a monopoly supplier that sets pricing to cover all operating expenses including deprecation and a profi t margin on its operations.
The Authority reinvested Cash from operations into Property, plant and equipment ($10.967m over the period) and paid dividends of $2.647m. Its cash position improved from the beginning of 2004-05 and 2007-08 by $0.289m (or 19.6%). However, this improvement included $0.783m net infl ow of borrowings over the period.
66 Cradle Coast Water

Payments for property, plant and equipment in 2007-08, $3.984m, included the refurbishment of fi ve reservoirs, additions to treatment plants and pipelines, including the Victoria Bridge work platform. In 2006-07, the Authority constructed a new pump station at Turners Beach linking the Forth water system to Ulverstone, and substantially refurbished the Barrington treatment plant and reservoir. Capital expenditure projects for 2005-06 included a major upgrade of the Forth pump station, relining of several reservoirs and acquisition of telemetry infrastructure from Burnie City Council.
FINANCIAL ANALYSIS
Bench Mark 2007-08 2006-07 2005-06 2004-05
Financial Performance
Result from operations ($’000s) 1 492 1 300 1 248 1 344 EBIT ($’000s) 2 841 2 628 2 614 2 665 Operating margin >1.0 1.16 1.15 1.17 1.18Return on assets 2.6% 2.6% 3.1% 3.9%Return on equity 1.4% 1.3% 1.5% 2.2%Underlying result ratio 13.9% 12.9% 14.2% 15.1%Self fi nancing ratio 36.0% 35.1% 27.7% 32.1%
Financial Management
Current ratio >1 1.1 0.9 1.3 0.5 Indebtedness ratio 333.3% 301.1% 339.2% 223.5%Debt to equity 27.5% 30.7% 32.6% 46.2%Debt to total assets 18.6% 20.8% 22.2% 30.5%Interest cover >2 2.1 2.0 1.9 2.0 Cost of debt 7.5% 6.2% 6.1% 6.3% 6.2%Debt service ratio 148% 22% 41% 75%
Debt collection 30 days 22 21 21 21 Creditor turnover 30 days 20 25 20 23
Capital expenditure/depreciation >100% 170% 104% 154% 200%
Returns to Owners
Dividends payable ($’000s) 745 650 624 744 Dividend payout ratio 50% 71.4% 71.4% 71.4% 79.1%Dividend to equity ratio 1.0% 0.9% 1.1% 1.7%Income tax paid or payable ($’000s) 0 0 0 0 Total return ($’000s) 745 650 624 744 Total return to equity ratio 1.0% 0.9% 1.1% 1.7%
Other Information
Staff numbers (FTEs) 31 29 28 27 Average staff costs ($’000s) 76 80 62 64
Average leave balance per FTE ($’000s) 20 20 19 17
Comment
The Financial Performance ratios show that the Authority recorded operating profi ts in the four years under review resulting in Operating margins above benchmark.
67 Cradle Coast Water

Return on assets ratio was low, with the Authority operating in a capital intensive industry. As noted in reviews by the Government Prices Oversight Commission, the return on equity remains below that expected for a commercial rate of return (7%). Prices are set by the Joint Authority. The result is that water users, including member Councils, effectively receive subsidies from the owners of the Authority.
Working Capital, as refl ected by the current ratio, was signifi cantly infl uenced by the current portion of borrowings, which fl uctuated signifi cantly over the four years and this was refl ected in the ratio. The underlying trend, however, was positive with current assets compared to current liabilities excluding borrowings showing signifi cant improvement over the four years. It is noted that $13.791m of the Authority’s loan portfolio were due to mature in February 2008, with these borrowings renewed into a consolidated loan in November 2007. The Authority’s intention in managing loan debt was to achieve a better cost of funds outcome.
Indebtedness ratio indicates CCW’s non-current liabilities were, on average, three times greater than Total Revenue generated in a fi nancial period. The high ratio was impacted by CCW holding loan principal $21.900m and making interest payments only. As CCW is a monopoly supplier and has confi dence in its ability to generate operating revenue, the higher than usual Indebtness ratio is considered manageable. The Authority consider the higher Indebtness ratio allows it to self-fund its capital works.
Debt to equity and Debt to total assets ratios decreased over the period, again primarily as a result of revaluations impacting on the carrying amount of assets and the corresponding increase in reserves.
The change in Debt service ratio from 41% in 2005-06 to 22% in 2006-07 refl ected the debt rollover of $2.207m in 2005-06 and $0.860m in 2006-07. The ratio in 2007-08 dramatically increased to 148% as a result of $13.791m in Tascorp loans being re-fi nanced during November 2007. The increase refl ected the Authority’s increased capital works program and the Board’s philosophy in funding asset renewal.
Capital expenditure to depreciation ratio was above the benchmark of 100% for each of the four years under review indicating that the Authority continues to invest suffi ciently in infrastructure assets to maintain them at least at their current standard. The downward trend over the three years between 2004-05 and 2006-07 refl ected increased replacement cost of assets which impacts on depreciation expense.
Dividends paid were in accordance with Part 3A of the Local Government Act 1993, and in line with the Authority’s policy of maintaining a payout ratio of 50% of after tax profi ts.
With substantial prior year tax losses to absorb current profi ts, no tax payments were made in the years under review.
Average employee costs fl uctuated over the four year period under review and included a:
• decrease in 2005-06 due to it being an exceptionally wet year resulting in lower overtime by plant operators and the Authority took the best part of the fi nancial year to replace an employee
• signifi cant increase in 2006-07 due to a wage review and employees being offered individual contracts, overtime increased by 16% due to 2006-07 being one of the driest years on record and an unusually high movement in the superannuation liability balance at 30 June
• 10% pay increase in 2007-08 for the majority of employees under a new employment agreement.
68 Cradle Coast Water

ESK WATER AUTHORITY
INTRODUCTION
Esk Water Authority (Esk Water/the Authority) was declared a Joint Authority by the Minister for Local Government on 25 June 1997. The Authority commenced operations on 1 July 1997 and had transferred to it all bulk water assets, property, rights, obligations and liabilities of North Esk Regional Water Supply Scheme, West Tamar Water Supply Scheme, Launceston City Council and the Meander Valley Council following enactment of the Northern Regional Water (Arrangements) Act 1997.
The Authority is a bulk water business servicing the Launceston/Tamar Valley region in Northern Tasmania and is owned and controlled by Launceston City, West Tamar, Meander Valley and George Town Councils. Representatives from each of the four owner councils serve on the Joint Authority. The Authority appointed an independent management board comprised of four directors, to manage the resources of the Authority and be responsible for the collection, treatment, conservation and supply of water in bulk. The Chief Executive Offi cer is appointed by the directors and is not a member of the management board
The Authority is subject to periodic reviews by the Government Prices Oversight Commission (GPOC) which recommends maximum prices and pricing principles for each of the three Tasmanian bulk water supply authorities.
AUDIT OF THE 2007-08 FINANCIAL STATEMENTS
Signed fi nancial statements were received on 27 August 2008 and an unqualifi ed audit report was issued on 11 September 2008.
The audit was completed satisfactorily with no major issues outstanding.
FINANCIAL RESULTS
The following fi ve graphs summarise key ratios highlighting important aspects of the Authority’s fi nancial performance over the past four years. In general, the ratios indicate:
2 000
2 500
3 000
3 500
2005 2006 2007 2008
Profit Before Tax
The Authority is a “for profi t” entity and is expected to generate profi ts, pay tax and provide dividends to its owner councils. As the graph indicates, over the past four years, the Authority consistently generated profi ts before tax.
69 Esk Water Authority

The Return on equity was below expectation and was the result of the Authority not setting a commercial rate of return (7%) as recommended by GPOC. However, as the member councils are both the owner and major customer, reduced return on equity arising from lower profi ts were offset by lower prices for the purchase of water. 1.8%
2.0%
2.2%
2.4%
2.6%
2005 2006 2007 2008
Return on Equity
20%
24%
28%
32%
36%
2005 2006 2007 2008
Underlying Result Ratio
The Underlying result ratio indicated the Authority’s profi t remained consistent with increases in revenue over the four year period. As a monopoly supplier of bulk water, the Authority is able to price water sales to ensure a specifi c return.
The Authority generated strong operating cash fl ows compared to its Total Revenue. This result was expected as the Authority has a signifi cant infrastructure base valued at fair value and ensures its pricing meets all operating expenses including depreciation. The Authority generated suffi cient cash to contribute to future infrastructure requirements. The cash fl ow was assisted by the Authority being debt free and not having to pay interest on borrowings. 40%
45%
50%
55%
60%
65%
2005 2006 2007 2008
Self Financing Ratio
-
2
4
6
8
10
12
14
2005 2006 2007 2008
Current Ratio
The Current ratio was more than adequate and indicated the Authority was able to meet all short-term liabilities.
70 Esk Water Authority

INCOME STATEMENT
2007-08 2006-07 2005-06 2004-05$’000s $’000s $’000s $’000s
Sales revenue 9 845 9 804 9 039 9 008 Interest revenue 753 459 377 258 Other operating revenue 201 214 264 265 Total Revenue 10 799 10 477 9 680 9 531
Borrowing costs 0 0 118 120 Depreciation 3 077 2 665 2 788 2 485 Cost of sales (less depreciation) 2 732 2 502 2 264 2 368 Other operating expenses 1 834 1 890 1 598 1 876 (Loss) on disposal of assets 22 135 686 39 Total Expenses 7 665 7 192 7 454 6 888
Profi t before: 3 134 3 285 2 226 2 643
Asset revaluation increments to offset previously recognised decrements 487 311 1 668
Asset contributions 0 0 769 0
Profi t before taxation 3 621 3 596 2 996 3 311
Income tax expense 1 087 1 082 900 995 Net Profi t 2 534 2 514 2 096 2 316
Comment
Relative to turnover, Esk Water recorded a signifi cant Profi t before taxation in each of the four years under review, with the profi t representing 31% to 35% of Total Revenue.
The majority of the Authority’s revenue is obtained from the sale of bulk water to municipal, industrial and wayside consumers. Sales revenue increased by $0.837m (or 9.29%) over the period under review, primarily due to an increase in water charges. The Authority levies a fi xed charge for each customer as well as a variable price per kilolitre. The price per kilolitre increased from $0.3000 for the 2004-05 year to $0.3270 for 2007-08, an increase of 9.00%. Water consumption over the same period remained stable with 15 516 megalitres in 2004-05 to 15 540 megalitres during 2007-08.
Interest revenue increased by $0.495m (or 191.80%) over the four year period due to a corresponding increase in cash balances held. A review of the cash position analysis below provides further information on the $9.167m increase in cash over the period under review.
Borrowing costs were eliminated following the repayment of Authority loans in June 2006.
The Authority manages signifi cant physical asset infrastructure. The utilisation of various treatment plants, reservoirs and pipeline systems has resulted in a signifi cant annual depreciation expense. Depreciation is approximately 40% of the Authority’s Total Expenses. The table below illustrates the depreciation charge has increased in line with movements in Property, plant and equipment balances, with the Depreciation percentage remaining fairly constant.
71 Esk Water Authority

2007-08 2006-07 2005-06 2004-05$’000s $’000s $’000s $’000s
Depreciation 3 077 2 665 2 788 2 485 Property, plant and equipment - average* 119 973 109 354 103 854 112 987 Depreciation as percentage of average PPE 2.56% 2.44% 2.68% 2.20%
* average based on opening and closing written down value
Cost of sales represents the production costs associated with collecting, conserving and treating the water to a saleable point. Over the fi rst three years under review the Authority maintained cost of sales at approximately 26% of Sales revenue. In 2007-08 the percentage increased to 28% due to additional treatment costs associated with a blue/green algae outbreak in the South Esk River and additional pump maintenance at the Trevallyn Pump Station.
Other operating expenses included administration, engineering and distribution expenses. Employee costs are allocated across a number of operations and are included in both Cost of sales and Other operating expenses.
72 Esk Water Authority

BALANCE SHEET
2007-08 2006-07 2005-06 2004-05$’000s $’000s $’000s $’000s
Cash 12 260 8 867 5 744 6 355 Receivables 607 542 695 153 Inventories 256 231 230 210 Other 970 857 917 870 Total Current Assets 14 093 10 497 7 586 7 588
Payables 316 96 185 329 Interest bearing liabilities 0 0 0 2 000 Provisions – superannuation 65 62 61 56 Provisions – employee entitlements 354 321 305 342 Other 566 349 353 409 Total Current Liabilities 1 301 828 904 3 136
Working Capital 12 792 9 669 6 682 4 452
Property, plant and equipment 119 973 109 354 103 854 112 987 Deferred tax asset 4 830 5 614 6 250 6 842 Other 4 4 5 5 Total Non-Current Assets 124 807 114 972 110 109 119 834
Deferred tax liabilities 23 502 19 632 17 276 19 415 Provisions – superannuation 1 986 1 977 1 734 1 292 Provisions – employee entitlements 23 18 11 582 Total Non-Current Liabilities 25 511 21 627 19 021 21 289
Net Assets 112 088 103 014 97 770 102 997
Capital 81 548 81 548 81 548 81 548 Reserves 28 724 20 401 15 931 21 865 Retained Earnings (Accumulated Losses) 1 816 1 065 291 ( 416)Total Equity 112 088 103 014 97 770 102 997
Comment
Total Equity increased during the period under review by $9.091m (or 8.8%), comprising increases in Retained earnings of $2.232m and Reserves of $6.859m. The increase in retained earnings includes profi ts during the period less dividend paid to owners. The increase in reserves comprises asset revaluation increments during the period less a corresponding adjustment to the Deferred tax liability.
The Authority’s Cash balance at 30 June 2008 comprised cash at bank and on hand of $0.139m and short term investments of $12.121m. The strong cash position resulted in the positive Working Capital position for each year under review. This position was strengthened by the Authority repaying all loan debt in 2005-06.
As noted previously, the Authority manages signifi cant long-life infrastructure assets. Property, plant and equipment represent approximately 86% of the Authority’s total assets. The Authority applies a fair value basis of valuation based on a deprival valuation methodology (depreciated replacement cost), with the last full revaluation of assets undertaken in 2005-06. To ensure the currency of the asset values, the Authority applied an index to its infrastructure assets based on
73 Esk Water Authority

advice received from the Australian Valuation Offi ce (AVO) in 2007-08. The next full revaluation is schedule to occur effective 30 June 2009.
I concur with the current accounting policies applied by the Authority in relation to its infrastructure assets. Relevant and current asset information is vital in managing an operation with a strong reliance on long-life infrastructure assets.
Deferred tax is provided on all temporary differences at the Balance Sheet date between the tax bases of assets and liabilities and their carrying amount for fi nancial reporting purposes. Deferred tax liabilities are recognised for all taxable temporary differences caused primarily by accounting for asset revaluations. Deferred tax assets are recognised for all deductible temporary differences, such as bringing to account annual leave, long service leave and provisions for superannuation liabilities, plus the benefi ts of unused tax losses (2007-08, $4.014m).
Whilst the Authority does not currently make tax payments due to carry forward losses, it is considered probable that suffi cient future taxable profi ts will be generated to enable the Deferred tax asset to be utilised.
CASH POSITION
2007-08 2006-07 2005-06 2004-05$’000s $’000s $’000s $’000s
Receipts from customers 10 217 10 560 9 082 9 904 Payments to suppliers and employees ( 4 585) ( 4 601) ( 4 489) ( 4 155)Interest received 709 462 371 260 Borrowing costs 0 0 ( 120) ( 120)Cash from operations 6 341 6 421 4 844 5 889
Payments for property, plant and equipment ( 1 200) ( 1 594) ( 1 926) ( 1 013)Proceeds from sale of property, plant and
equipment 59 61 79 48Cash (used in) investing activities ( 1 141) ( 1 533) ( 1 847) ( 965)
Repayment of borrowings 0 0 ( 2 000) 0 Dividends paid ( 1 807) ( 1 765) ( 1 608) ( 1 662)Cash (used in) fi nancing activities ( 1 807) ( 1 765) ( 3 608) ( 1 662)
Net increase (decrease) in cash 3 393 3 123 ( 611) 3 262
Cash at the beginning of the year 8 867 5 744 6 355 3 093 Cash at end of the year 12 260 8 867 5 744 6 355
Comment
The Authority generates strong Cash from operations due to it being a monopoly supplier that sets its pricing to cover all operating expenses including depreciation and a profi t margin on its operations. Despite the Authority reinvesting Cash from operations into Property, plant and equipment of $5.733m over the period, repayment of debt, $2.000m, and paying dividends of $6.842m, its cash position increased over the four year period under review by $9.167m.
It is expected the current cash surplus generated from operations over the past four years will be used to undertake future capital projects, including the construction of a replacement treatment plant at Distillery Creek with an estimated cost of $10.200m.
74 Esk Water Authority

FINANCIAL ANALYSIS
BenchMark 2007-08 2006-07 2005-06 2004-05
Financial Performance
Result from operations ($’000s) 3 134 3 285 2 226 2 643 EBIT ($’000s) 3 621 3 596 3 114 3 431 Operating margin >1.0 1.41 1.46 1.30 1.38 Return on assets 2.7% 3.0% 2.5% 2.9%Return on equity 2.4% 2.5% 2.1% 2.3%Underlying result ratio 33.5% 34.3% 31.0% 34.7%Self fi nancing ratio 58.7% 61.3% 50.0% 61.8%
Financial Management
Current ratio >1 10.83 12.68 8.39 2.42 Indebtedness ratio 236.2% 206.4% 196.5% 223.4%Debt to equity n/a n/a n/a 1.9%Debt to total assets n/a n/a n/a 1.6%Interest cover >2 n/a n/a 26.4 28.6Cost of debt 7.5% n/a n/a n/a 6.0%Debt service ratio n/a n/a 1.2% 1.3%
Debt collection 30 days 23 20 28 6 Creditor turnover 30 days 28 10 18 38
Capital expenditure/depreciation >100% 39% 60% 69% 41%
Returns to Owners
Dividends paid or payable ($’000s) 1 835 1 783 1 625 1 761 Dividend payout ratio 50% 72.4% 70.9% 77.5% 76.0%Dividend to equity ratio 1.7% 1.8% 1.6% 1.8%Total return ($’000s) 1 835 1 783 1 625 1 761 Total return to equity ratio 1.7% 1.8% 1.6% 1.8%
Other Information
Staff numbers (FTEs) 25 25 25 25Average staff costs ($’000s) 64 69 56 59Average leave balance per FTE ($’000s) 14 12 12 13
Comment
The Financial Performance ratios show that the Authority recorded operating profi ts in each of the four years under review resulting in positive Operating margins. The profi tability of the Authority was further illustrated by the strong Underlying result ratio.
Self fi nancing ratio indicates the Authority’s ability to generate strong cash fl ows from it operations in comparison to its Total Revenue. The cash generated is required to meet future capital funding requirements due to the Authority managing signifi cant long-life infrastructure assets.
Return on assets ratio was low. As noted in reviews by GPOC, the Return on equity remains below that expected for a commercial rate of return, 7%. Prices are set by the Joint Authority. The result was that water users, specifi cally member Councils, effectively received subsidies.
75 Esk Water Authority

Current ratio was above benchmark in all years under review. The repayment of the Authority’s debt during 2005-06 substantially strengthened its working capital position. As there was no debt since 30 June 2006, the Debt ratios no longer apply.
Debt collection was below benchmark for all years under review which refl ected the Authority’s good debt recovery procedures.
Creditor turnover remained below the benchmark over the past three years due to prompt payments to suppliers.
Capital expenditure to depreciation ratio was below the benchmark in each of the years under review. This is not unexpected as the Authority completed a strategic asset management plan that included an asset replacement schedule based on the age profi le of its assets. This plan highlighted that a major asset replacement is due near 2040, when two major pipelines will theoretically reach the end of their useful lives. It is expected that the Capital expenditure ratio will remain well below 100% as the Authority generates cash to fund major asset replacement.
The Return to equity ratio has been below expectation in each of the four years under review. This is attributable to the Authority:
• carrying forward tax losses and not making any tax payments
• setting pricing below expected commercial returns recommended by GPOC (as discussed previously). Profi ts are not maximised reducing the amount available for distribution as a dividend. However, as the members councils are both the owners and major customers of the Authority, reduced dividends are offset by lower prices for the purchase of water.
The Authority paid, or will pay, dividends totalling $7.004m for the four year period under review. It has a dividend payout policy of the lesser of the prior year dividend indexed for CPI or 100% of profi t after tax for the year. The policy aims to retain equity within the Authority to fi nance future asset replacements. A further calculation is performed each year to ensure that this formula does not result in any Council being fi nancially disadvantaged. See comment previously about adequateness of cash holdings.
Average staff costs fl uctuated over the four year period under review. The Authority paid EBA increments in each year, but movements in the superannuation liability in each year skewed the average. The 2006-07 average of $0.064m included a superannuation liability increase of $0.245m, whilst the 2005-06 average of $0.056m included a liability decrease of $0.128m. Based upon salary and wages only the payroll average increased from $0.059m for 2004-05 to $0.061m for 2007-08.
76 Esk Water Authority

HOBART REGIONAL WATER AUTHORITY
INTRODUCTION
The Hobart Regional Water Authority (the Authority or Hobart Water) was established under section 38 of the Local Government Act 1993 following the enactment of the Hobart Regional Water (Arrangement) Act 1996. This Act transferred all the assets, property, rights and liabilities of the former Hobart Regional Water Board to the Authority effective 1 January 1997.
The Authority is a Joint Authority trading under the name of Hobart Water. It is a commercial business owned by the eight constituent councils in the Hobart Regional Water District, which comprises the cities of Hobart, Clarence and Glenorchy as well as the municipal areas of Kingborough, Sorell, Brighton, Derwent Valley and Southern Midlands. An independent board of management is responsible for the conduct of business and affairs of the Authority. Its core business is to provide bulk water supplies to its customers. The scope of activities includes:
• collection and treatment of raw water to the required standard
• bulk transport of treated water to reticulation storages or networks
• planning, development and management of headworks
• sale of bulk water on a commercial basis.
In addition to these core activities, the Authority also provides services under contract to Derwent Valley Council in respect to operations and maintenance of their water and waste water reticulation system. In June 2007, Hobart Water signed a long term operation and maintenance agreement with Glamorgan Spring Bay Council to provide water and waste water services.
AUDIT OF THE 2007-08 FINANCIAL STATEMENTS
Signed fi nancial statements were received on 26 September 2008 and an unqualifi ed audit report was issued on the same day.
The audit was completed satisfactorily with no major issues outstanding.
FINANCIAL RESULTS
The following fi ve graphs summarise key ratios highlighting important aspects of the Authority’s fi nancial performance over the past four years. In general, the ratios indicate:
3 000
3 500
4 000
4 500
5 000
5 500
6 000
2005 2006 2007 2008
Profit Before Tax
The Authority is a “for profi t” entity and is expected to generate profi ts, pay tax and provide dividends to its owner councils. As the graph indicates, over the past four years, the Authority has consistently generated profi ts before tax.
77 Hobart Regional Water Authority

The Return on equity was below expectation and was the result of the Authority not setting a commercial rate of return (7%) as recommended by Government Prices Oversight Commission (GPOC). However, as the member councils are both the owner and major customer, reduced return on equity arising from lower profi ts was offset by lower prices for the purchase of water.
0.0% 0.5% 1.0% 1.5% 2.0% 2.5% 3.0% 3.5%
2005 2006 2007 2008
Return on Equity
10%
15%
20%
25%
2005 2006 2007 2008
Underlying Result RatioThe Underlying result ratio indicated, over the last two years, the Authority’s profi t decreased, whilst operating revenue increased. As a monopoly supplier of bulk water, the Authority should price water sales to ensure a specifi c return. If the Underlying result ratio excluded the impact of actuarial gains or losses and fi nancial instrument gains, the movement in the ratios would not have been as volatile (for example, the ratio for 2005-06 of 23.2% would have been 19.2%).
The Authority generated strong operating cash fl ows compared to its Total Revenue. This result was expected as the Authority has a signifi cant infrastructure base valued at fair value and ensured its pricing was meeting all operating expenses including depreciation. The Authority generated suffi cient cash to contribute to future infrastructure requirements. 20%
25%
30%
35%
40%
45%
2005 2006 2007 2008
Self Financing Ratio
0.00
0.30
0.60
0.90
1.20
1.50
2005 2006 2007 2008
Current RatioThe Current ratio in the fi rst three year under review was adequate as current assets exceeded current liabilities. In 2007-08, the ratio deteriorated due to a reduction in cash (refer Cash Position analysis below), increased current Borrowings payable in 2008-09 and the recognition of a current liability for a dividend payment. However, the Authority was confi dent it is able to meet all short-term liabilities.
78 Hobart Regional Water Authority

INCOME STATEMENT
2007-08 2006-07 2005-06 2004-05$’000s $’000s $’000s $’000s
Sales revenue 25 225 24 320 22 810 22 793 Other operating revenue 5 684 3 114 2 190 1 126 Total Revenue 30 909 27 434 25 000 23 919
Borrowing costs 2 359 2 379 2 448 2 432 Depreciation 6 369 5 999 5 228 5 182 Other operating expenses 17 474 14 053 12 516 11 444 Total Expenses 26 202 22 431 20 192 19 058
Profi t before: 4 707 5 003 4 808 4 861
Change in fair value of fi nancial instruments 35 381 633 0 Defi ned benefi t superannuation actuarial
gain / (loss) 0 0 466 ( 542)Profi t before taxation 4 742 5 384 5 907 4 319
Income tax expense 1 463 1 652 1 773 1 324 Net Profi t 3 279 3 732 4 134 2 995
Comment
Relative to turnover, Hobart Water recorded a signifi cant Profi t before taxation in each of the four years under review, with the profi t consistently representing 15% to 24% of Total revenue. The 2006-07 net profi t includes the one-off effect of the addition of a new Cambridge pipeline, which had to be relocated by a third-party. The third-party contributed $0.735m, included in Other revenue, to the costs of the new pipeline.
The majority of the Authority’s revenue is obtained from the sale of bulk water to municipalities in the greater Hobart area. Bulk water sales to constituent councils represented almost 83% of sales revenue for the current year, down from 91% in the prior year, 93% in 2005-06 and over 97% in the 2004-05 year. This percentage decrease is attributed to:
• revenue from a contract with Derwent Valley Council for Hobart Water to provide operations and maintenance services, which increased operating revenue from other sources
• revenue from Clarence City Council customer contributions during 2007-08 of $1.160m.
Water sales fl uctuate in accordance with consumption and it is noted that recent years’ fi gures refl ect drier conditions, leading to increasing consumption. Sales revenue increased by $2.432m (or 10.67%) over the period under review. The following graph details water consumption expressed in mega litres over the period under review. Bulk water consumption in 2005-06 was low because there was above average rainfall from September 2005 to December 2005.
79 Hobart Regional Water Authority

32,000
34,000
36,000
38,000
40,000
42,000
44,000
2004-05 2005-06 2006-07 2007-08
Meg
alitre
s (M
L's)
Total Bulk & Off-peak Water Consumption
Bulk water consumption Off-peak water consumption
In the past, the Authority undertook derivative trading as part of managing its debt. From 2005-06, it moved to a less active approach to debt management which was aimed at reducing, and eventually eliminating, derivatives. However, from its existing portfolio of derivative instruments, the Authority generates interest income and incurs interest expense. In 2007-08 interest received from this activity amounted to $0.476m, down from $1.381m in 2006-07, $1.568m in 2005-06 and $1.721m in 2004-05. Similarly, interest expense in 2007-08 was $0.454m, down from $1.504m in 2006-07, $1.801m in 2005-06 and $1.977m in 2004-05. The downward trend is due to the gradual maturity and close out of the derivatives as the Authority implements its policy of eliminating all derivatives. Four swaps were closed out during the 2006-07 year, by payment of $0.176m. The overall decrease in Borrowing costs attributable to derivatives is offset to some degree by increased interest on the underlying debt portfolio.
Borrowing costs shown in the Income Statement are net of the interest expense on the underlying debt portfolio, swap interest expense, swap interest revenue and debt management costs.
The Authority manages signifi cant physical asset infrastructure. The utilisation of various treatment plants, reservoirs and pipeline systems results in a signifi cant annual depreciation expense. Depreciation is approximately 26% of the Authority’s Total Expenses. The table below illustrates the depreciation charge as a percentage of Property Plant and Equipment has fallen from 3.03% to 2.11%. This fall is attributed to some asset lives being extended. Dam lives were extended from 140 years to 200 years and pipelines were extended from 80 years to 100 years.
2007-08 2006-07 2005-06 2004-05$’000s $’000s $’000s $’000s
Depreciation 6 369 5 999 5 228 5 182 Property, plant and equipment - average* 301 446 233 929 175 148 170 997 Depreciation as percentage of average PPE 2.11% 2.56% 2.98% 3.03%
* average based on opening and closing written down value
Depreciation expense remained largely consistent from 2004-05 to 2005-06. On the basis of independent advice, Hobart Water revalued its major classes of Non-current assets as at 1 July 2006 on the basis of current replacement values and this resulted in an increase in asset values of $104.009m. This revaluation led to the increased depreciation expense for that year offset by the extension of depreciation lives noted above.
80 Hobart Regional Water Authority

In addition, all Infrastructure, land and buildings were indexed at 30 June 2007 and 30 June 2008 to maintain current values. This also contributed to the increase in depreciation expense in the last two years.
Other operating expenses include employee costs, royalties and direct costs of power and chemicals used in treatment. These costs generally fl uctuate in line with water sales averaging around 53% of operating revenue. Other operating expenses for 2007-08 are above this level due mainly to the impact of increasing power and consulting service costs as a result of Glamorgan Spring Bay Council’s operation and maintenance contract and additional capital services to Derwent Valley Council during the year. The additional cost of services to Glamorgan Spring Bay Council and Derwent Valley Council were both offset by increased revenues.
AASB 119 Employee Benefi ts requires the defi ned benefi t superannuation liability to be calculated using a discount rate equal to the government bond rate. This resulted in a defi ned benefi t actuarial expense of $0.542m recognised in 2004-05. In 2005-06, there was a decrease in the net liability and a defi ned benefi t actuarial gain of $0.466m was recognised due to an increase in the government bond rate.
Hobart Water has amended its accounting policy for recognition of actuarial gains and losses on the defi ned benefi t superannuation plan. In accordance with accounting standard AASB 119 Employee Benefi ts, Hobart Water elected to recognise actuarial gains and losses on defi ned benefi t plans directly through retained earnings. Adoption of this accounting treatment was intended to assist in managing reported earnings volatility caused by external factors such as long-term government bond rates and the share market. The actuarial loss in 2007-08 was $0.123m down from $0.359m loss in 2006-07.
81 Hobart Regional Water Authority

BALANCE SHEET
2007-08 2006-07 2005-06 2004-05$’000s $’000s $’000s $’000s
Cash 6 228 9 864 9 582 8 191 Receivables and prepayments 7 728 7 010 6 451 6 154 Inventories 1 158 1 143 1 126 1 053 Derivative fi nancial instruments 98 129 0 0 Total Current Assets 15 212 18 146 17 159 15 398
Payables 3 613 3 312 2 313 2 232 Borrowings 13 798 11 400 7 000 9 900 Derivative fi nancial instruments 0 0 428 0 Provision for dividend 1 600 0 1 600 0 Provisions – superannuation 839 636 377 615 Provisions – employee entitlements 1 175 986 790 748 Current tax liability 329 536 733 0 Total Current Liabilities 21 354 16 870 13 241 13 495
Working Capital ( 6 142) 1 276 3 918 1 903
Property, plant and equipment 309 986 290 502 174 696 172 374 Intangibles 1 254 1 150 1 510 1 715 Total Non-Current Assets 311 240 291 652 176 206 174 089
Borrowings 19 400 21 798 26 198 23 298 Provisions – superannuation 3 522 3 514 3 574 4 188 Provisions – employee entitlements 214 174 177 160 Deferred tax liabilities 48 639 43 750 9 881 8 728 Total Non-Current Liabilities 71 775 69 236 39 830 36 374
Net Assets 233 323 223 692 140 294 139 618
Reserves 217 874 212 411 130 333 128 059 Retained earnings 15 449 11 281 9 961 11 559 Total Equity 233 323 223 692 140 294 139 618
Comment
Total Equity rose by $93.705m or 67% over the period under review due to increases in:
• Retained earnings of $3.890m. The increase in retained earnings includes profi ts during the period less dividends paid to owners
• Reserves of $89.815m. The increase in reserves comprises asset revaluation increments during the period less the corresponding adjustment to the Deferred tax liability.
Cash in all four years consisted of both the general cash bank accounts and the cash management account held with Tasmanian Public Finance Corporation (Tascorp). The majority of cash held is for future capital programs. An amount of cash is also held to cover operating, tax and dividend payments. Reasons for the decrease are outlined in the Cash Position section of this Chapter.
Receivables for 2007-08 comprised normal bulk water accounts to the Joint Authority members and other water customers, accrued interest and other receivables. The increase in Receivables
82 Hobart Regional Water Authority

in 2007-08 is mainly due to $0.534m outstanding from Clarence City Council for the Howrah Warrane Augmentation Project.
Prior to 30 June 2008, the Authority’s Board of Management declared a fi nal dividend, based on the 2007-08 operating results of $1.600m, which, based on the timing of the decision, was recorded as a liability at balance date. The decision on the fi nal dividend plus the interim dividend of $1.600m resulted in a total dividend of $3.200m for the 2007-08 year. In the 2004-05, 2005-06 and 2006-07 years, the fi nal dividends were declared after balance date and only disclosed as a note to the fi nancial statements. The provision for dividend balance in 2005-06 relates to an interim dividend, which was not paid prior to balance date. Detailed information on dividend payments is included in the Financial Analysis section.
Total borrowings remained consistent over the four year period, totalling $33.198m. The allocation between current and non-current represents borrowing due to be repaid in a particular year. The Authority reborrowed the corresponding debt repaid, to maintain a specifi c capital debt amount.
The Authority’s current Provisions – employee entitlements increased by $0.427m or 57% over the period under review due to wage and salary indexation and higher staff levels. The Financial Analysis section of this Chapter notes that full time equivalent employees (FTEs) increased over the period under review by 32 or 46%.
As noted previously, during 2006-07, Hobart Water re-valued its major classes of non-current assets on the basis of current replacement values as at 1 July 2006. This resulted in an increase in asset values of $104.009m. In addition to this, Property, plant and equipment was subject to indexation as at 30 June 2007, which increased net asset values by a further $11.766m. In 2007-08 all Infrastructure, Land and Buildings were indexed to maintain current values, this resulted in an increase in asset values of $16.133m. These transactions are refl ected in the movement in the asset revaluation reserve but net of the impacts of these revaluations of the Authority’s deferred taxation liability.
The Deferred tax liability varies from year to year according to the profi t before taxation and timing differences, including the effect of asset revaluations and indexations. In line with the increase in non-current assets of $19.588m, the net deferred tax liability increased by $4.889m. Income tax paid during 2007-08 amounted to $1.438m (2006-07, $1.329m, 2005-06, $0.637m) and a Current tax liability of $0.329m ($0.536m, $0.733m) was recognised as at 30 June 2008.
83 Hobart Regional Water Authority

CASH POSITION
2007-08 2006-07 2005-06 2004-05$’000s $’000s $’000s $’000s
Receipts from customers 31 728 27 648 25 172 23 748 Payments to suppliers and employees ( 19 156) ( 14 562) ( 13 733) ( 12 179)Interest received 651 770 612 391 Borrowing costs ( 2 462) ( 2 418) ( 2 437) ( 2 374)Income tax paid ( 1 438) ( 1 329) ( 637) 0 Cash from operations 9 323 10 109 8 977 9 586
Payments for property, plant and equipment ( 9 887) ( 5 781) ( 4 411) ( 3 026)Proceeds from sale of property, plant and
equipment 262 130 225 313 Payments to terminate derivative fi nancial
instruments 66 ( 176) 0 0 Cash (used in) investing activities ( 9 559) ( 5 827) ( 4 186) ( 2 713)
Proceeds from borrowings 11 400 12 000 9 900 15 000 Repayment of borrowings ( 11 400) ( 12 000) ( 9 900) ( 15 000)Dividends paid ( 3 400) ( 4 000) ( 3 400) ( 2 800)Cash (used in) fi nancing activities ( 3 400) ( 4 000) ( 3 400) ( 2 800)
Net increase (decrease) in cash ( 3 636) 282 1 391 4 073
Cash at the beginning of the year 9 864 9 582 8 191 4 118 Cash at end of the year 6 228 9 864 9 582 8 191
Comment
The Authority generates strong Cash from operations due to it being a monopoly supplier that sets its pricing to cover all operating expenses including depreciation and a profi t margin on its operations. Over the four year period, Cash from operations totalled $37.995m, and was used to fund payments for Property, plant and equipment of $23.105m and pay dividends of $13.600m.
In gross terms however, interest received has declined due to lower investments held which is the primary reason for the lower cash generated from operations in 2007-08 contributing to the overall decline in cash balance at 30 June 2008.
Payments for property, plant and equipment over the period include capital works undertaken in relation to the:
• Bryn Estyn, dams and pipelines
• Bryn Estyn treatment plant switchboard upgrade and the lime system upgrade
• Howrah-Warrane augmentation project which included new pump stations, reservoir and pipelines.
The high level of capital expenditure in 2007-08 was reason for the decline in cash holdings at 30 June 2008 leading to a lower working capital ratio.
84 Hobart Regional Water Authority

FINANCIAL ANALYSIS
Bench Mark 2007-08 2006-07 2005-06 2004-05
Financial Performance
Result from operations ($’000s) 4 707 5 003 4 808 4 861 EBIT ($’000s) 7 101 7 763 8 355 6 751 Operating margin >1.0 1.18 1.22 1.24 1.26 Return on assets 2.2% 3.1% 4.4% 3.7%Return on equity 1.4% 2.1% 3.0% 2.2%Underlying result ratio 15.3% 19.6% 23.6% 18.1%Self fi nancing ratio 30.2% 36.6% 35.9% 40.1%
Financial Management
Indebtedness ratio 232.2% 252.4% 159.3% 152.1%Debt to equity 14.2% 14.8% 23.7% 23.8%Debt to total assets 10.2% 10.7% 17.2% 17.5%Interest cover >2 3.0 3.5 3.9 3.1 Current ratio >1 0.7 1.1 1.3 1.1 Cost of debt 7.5% 7.1% 7.2% 7.4% 7.3%Debt service ratio 10% 10% 11% 10%
Debt collection 30 days 102 93 92 86 Creditor turnover 30 days 34 46 21 16
Capital expenditure/depreciation >100% 155% 96% 84% 58%
Returns to Owners
Dividends paid or payable ($’000s) 3 200 3 400 4 000 3 400 Dividend payout ratio 50% 97.6% 91.1% 96.8% 113.5%Dividend to equity ratio 1.4% 1.9% 2.9% 2.5%Income tax paid or payable ($’000s) 1 269 1 241 1 370 0 Effective tax rate 30% 26.8% 23.0% 23.2% 0.0Total return ($’000s) 4 469 4 641 5 370 3 400 Total return on equity ratio 2.0% 2.6% 3.8% 2.5%
Other Information
Staff numbers (FTEs) 102 90 79 70 Average staff costs ($’000s) 77 72 76 73Average leave balance per FTE ($’000s) 13 12 12 13
Comment
Hobart Water consistently recorded sound operating margins which were generally better than the benchmark. However, due to its large asset and equity base, and because Hobart Water continued to charge for water at prices below the maximum recommended by the Water Regulator, returns on assets and on equity were low.
Current ratio remained above the benchmark due primarily to the Authority’s strong cash position for each of the years except for 2007-08 when the ratio deteriorated due to the reduction in cash (refer Cash Position analysis), increased current borrowings payable in 2008-09 and the recognition of a current liability for a dividend payment. However, the Authority is confi dent it is able to meet
85 Hobart Regional Water Authority

all short-liabilities, as its current policy of maintaining a specifi c debt level will result in no cash outfl ows relating loan borrowings in 2008-09.
Debt service ratio consistently declined over the past four years mainly due to decreasd Borrowing costs as a result of a decline in the Authority’s derivatives. The Authority is expected to reduce and eventually eliminate derivatives. Cost of debt ratio remained steady.
Water sales to member councils are billed quarterly resulting in the high Debt collection ratio. The Authority experiences no diffi culty collecting these debts.
Capital expenditure to depreciation ratio was low in 2004-05 due to the timing of capital projects. It moved close to the benchmark in 2005-06, and just below the benchmark of 100% in 2006-07, due to increased expenditure on capital projects. Capital expenditure exceeded benchmark in 2007-08 due to capital works undertaken in relation to Bryn Estyn treatment plant switchboard upgrade, the lime system upgrade and the Howrah-Warrane augmentation project which included new pump stations, reservoir and pipelines. This is consistent with the Authority’s planned capital expenditure programs.
The Authority declared a dividend on its operating results in each of the four years under review.
Increased employee numbers refl ected growth in new business opportunities, in particular the Derwent Valley Council and Glamorgan Spring Bay Council operations and maintenance contracts.
86 Hobart Regional Water Authority

OTHER STATE ENTITIESREPORTING AT 30 JUNE 2008
LOCAL GOVERNMENT ASSOCIATION OF TASMANIA
INTRODUCTION
Founded in 1911, the Local Government Association of Tasmania (LGAT) is an incorporated body under the Local Government Act 1993.
LGAT is the peak body for local government in Tasmania and is part of a national network of associations. It is funded by councils and by other income earned through projects sponsored on behalf of local government, and a range of services and sponsorships. A General Management Committee (GMC) of eight members provides oversight to LGAT operations.
The objectives of LGAT are to:
• promote the effi cient administration and operation of local government in the State of Tasmania
• represent and protect the interests, rights and privileges of members of LGAT
• foster and promote relationships between local government in Tasmania and with the government of Tasmania and the Commonwealth of Australia
• provide support services to members of LGAT.
Since December 1999, LGAT has provided administrative support to LGAT Assist (formerly named LGAT Welfare Fund). The LGAT Assist board of directors is appointed by the LGAT GMC.
LGAT Assist provides local government employees with support and assistance during times of health, fi nancial and general personal diffi culty. Support and assistance include:
• low interest loans to council employees who are employed on a permanent basis and who are members of Quadrant Superannuation
• access to fi nancial counselling to assist with household management
• three bursaries annually, to enable council employees or their dependents to attend the University of Tasmania (conditions apply)
• non-refundable grants in cases of extraordinary fi nancial hardship.
Financial results of LGAT Assist are reported separately in the fi nancial statements of LGAT. Two years comparative data has been included in this Report because this year is the fi rst we have included LGAT.
AUDIT OF THE 2007-08 FINANCIAL STATEMENTS
Draft fi nancial statements were received on 31 August 2008. Signed fi nancial statements were received on 22 January 2009. The Local Government Act 1993 requires LGAT to prepare annual fi nancial statements by 31 August and submit this to the Auditor General. An unqualifi ed audit report was issued on 22 January 2009.
The audit was completed satisfactorily with no other major issues outstanding.
87 Local Government Association of Tasmania

FINANCIAL RESULTS – LGAT
The following three graphs summarise key ratios highlighting important aspects of LGAT’s fi nancial performance over the past 2 years. In general, the ratios indicate:
Operating Margin
-
0.20
0.40
0.60
0.80
1.00
1.20
1.40
1.60
2007 2008
The Operating margin was above the expected benchmark of one in both years, which indicates LGAT is generating suffi cient revenue to fulfi l its operating requirements.
The positive Underlying result ratio provides a measure of the strength of the operating result. In 2006-07, Council recorded an Underlying result ratio of 30.7% which represented a strong operating surplus in that year. The decline in 2007-08, while still positive, was due to a drop in grant funds received.
Underlying Result Ratio
2007 2008 ( 2.0%)
8.0%
18.0%
28.0%
38.0%
Current Ratio
- 1.00 2.00 3.00 4.00 5.00 6.00 7.00 8.00 9.00
2007 2008
The Current ratio was above the benchmark of greater than one in both years indicating that LGAT was able to meet all short-term liabilities. The decrease in the Current ratio in 2007-08 was mainly due to the placement of $2.000m in a long-term investment. The decrease was also due to a government grant of $0.502m (includes GST) received in June 2008 being recognised as a current liability. The grant funding is to be distributed to regional authorities to fund the Household Hazardous Waste Pilot Collection Program starting in 2008-09.
88 Local Government Association of Tasmania

INCOME STATEMENT – LGAT
2007-08 2006-07General General
$’000s $’000s
Grants 164 720 Subscriptions 881 835 Investment income 200 76 Other operating income 314 345 Total Revenue 1 559 1 976
Depreciation 28 27 Employee costs 635 650 Other operating expenses 690 692 Total Expenses 1 353 1 369
Surplus 206 607
Comment
In 2007-08 LGAT recorded a surplus of $0.206m, compared to a surplus of $0.607m in 2006-07. The decrease in operating surplus was mainly due to less grants received in 2007-008. Grant revenue fl uctuates from year to year dependent on the projects funded by the Commonwealth and State governments and administered by LGAT.
Revenue from subscription represents annual subscription payments from member councils. The amount of subscription each council contributes is based on the assessed annual value of the land in council’s municipal area as advised by the Valuer General. An increase of 5.5% in subscriptions for the 2007-08 year was approved at LGAT’s Annual General Meeting in June 2007 to ensure the fi nancial security of the Association.
Investment income increased signifi cantly from the prior year due mainly to higher interest rates in 2007-08 and alternative investment arrangements being made to maximise interest.
Depreciation and Other operating expenses remained consistent with the prior year. The slight decrease in Employee expenses during the 2007-08 year was mainly due to the departure of a number of contractual employees upon completion of assigned projects. This was offset by annual wage and salary award increases for remaining employees.
89 Local Government Association of Tasmania

BALANCE SHEET – LGAT
2007-08 2006-07General General
$’000s $’000s
Cash Assets 1 180 2 449 Receivables 125 83 Total Current Assets 1 305 2 532
Payables 265 135 Unexpended grants 531 108 Provisions 110 64 Total Current Liabilities 906 307
Working Capital 399 2 225
Financial assets 2 000 0 Property, plant and equipment 92 88 Intangibles 8 1 Total Non-Current Assets 2 100 89
Provisions 25 47 Total Non-Current Liabilities 25 47
Net Assets 2 474 2 267
Accumulated surplus - General 2 474 2 267 Total Equity 2 474 2 267
Comment
Total Equity increased over the period of review due to net surplus of $0.206m recorded in 2007-08.
Cash assets of $1.180m, together with non-current Financial assets of $2.000m, increased by $0.731m in 2007-08 due mainly to a Government grant of $0.456m obtained from the Department of Environment, Parks, Heritage and the Arts. This grant will fund the Household Hazardous Waste Pilot Collection Program starting in 2008-09, which is to deliver and promote long-term improved management outcomes for hazardous waste in Tasmania. LGAT, as the coordinator of the Program, will distribute 90% of the funding to regional authorities and retain the remaining to provide administration support. As at 30 June 2008, this grant had been recognised as a current liability of LGAT, ie. unexpended grants, to refl ect the nature of funding for this program.
Non-current Financial cash assets of $2.000m were investments which included Principal Protected Yield accrual notes securities, $1.500m, and AUD Floating Rate Medium- term Notes, $0.500m. Those alternative investment arrangements were made in 2007-08 to maximise interest with funds being reinvested.
Receivables were higher in 2007-08 mainly due to higher registration fees and sponsorships outstanding at year end in relation to the Annual conference held in late June 2008.
Similarly, Payables increased in 2007-08 due mainly to invoices outstanding for the annual conference suppliers at year end. The increase was also due to a higher GST liability arising from grant funding (including GST) received in June 2008 with regard to the Household Hazardous Waste Pilot Collection.
90 Local Government Association of Tasmania

The increase in current provisions for employee benefi ts in 2007-08 was consistent with wage and salary award increases and was also due to an employee becoming eligible for long service leave benefi t during the next 12 months.
CASH POSITION – LGAT
2007-08 2006-07General General
$’000s $’000s
General receipts 1 300 1 284 Government funding 586 131 Interest received 204 133 Payments to suppliers ( 709) ( 923)Payments to employees ( 611) ( 642)Cash from (used in) operations 770 ( 17)
Payments for property, plant and equipment ( 50) ( 17)Proceeds from sale of property, plant and equipment 11 1 Cash (used in) investing activities ( 39) ( 16)
Net increase (decrease) in cash 731 ( 33)
Cash at the beginning of the year 2 449 2 482 Cash at end of the year 3 180 2 449
Comment
Cash improved over the period due predominantly to the government grant of $0.502m (including GST) received in June 2008 from the Department of Environment, Parks, Heritage and the Arts discussed previously.
The decrease in Payments to suppliers in 2007-08 was due to timing differences as the annual conference was held in late June 2008 and expenses associated with the conference were invoiced at a later date.
Interest received increased from the prior year due mainly to higher interest rates in 2007-08 and alternative investment arrangements being made to maximise interest on funds invested.
91 Local Government Association of Tasmania

FINANCIAL ANALYSIS – LGAT
Bench Mark 2007-08 2006-07
General General
Financial Performance
Result from operations ($’000s) 206 607 Operating margin >1.0 1.15 1.44 Underlying result ratio 13.2% 30.7%
Financial Management
Current ratio >1 1.4 8.2 Debt collection 30 days 30 20 Creditor turnover 30 days 104 56
Other Information
Staff numbers (FTEs) 10 11 Average staff costs ($’000s) 64 59 Average leave balance per FTE ($’000s) 14 10
Comment
The fi nancial performance ratios show that LGAT recorded operating surpluses in both years under review, resulting in Operating margins above benchmark and positive Underlying result ratios.
LGAT’s Current ratio was above the benchmark in both years indicating it is able to meet all short-term liabilities when they fall due. The lower ratio in 2007-08 was due to the investment in non-current fi nancial assets in that fi nancial year.
LGAT Creditor turnover remained well above the benchmark for the period. This resulted from high number of invoices outstanding at year end due to the annual conference being held in late June. The increase in the Debt collection ratio was also a result of the annual conference with higher registrations fees and sponsorships outstanding as at 30 June 2008.
Average staff costs and Average leave per FTE increased over the period, consistent with wage and salary award increases.
92 Local Government Association of Tasmania

INCOME STATEMENT – LGAT ASSIST
2007-08 2006-07Assist Assist
$’000s $’000s
Investment income 81 75 Other operating income 2 2 Total Revenue 83 77
Other operating expenses 73 52 Total Expenses 73 52
Surplus 10 25
Comment
In 2007-08 LGAT Assist recorded a surplus of $0.010m, compared to a surplus of $0.025m in 2006-07. The decrease in operating surplus was mainly due to an increase in non-refundable welfare grants payments to eligible local government employees.
BALANCE SHEET – LGAT ASSIST
2007-08 2006-07Assit Assist
$’000s $’000s
Cash Assets 698 677 Receivables 4 3 Financial assets 265 300 Total Current Assets 967 980
Payables 5 7 Total Current Liabilities 5 7
Working Capital 962 973
Financial assets 162 141 Total Non-Current Assets 162 141
Provisions 0 0 Total Non-Current Liabilities 0 0
Net Assets 1 124 1 114
Accumulated surplus 1 124 1 114 Total Equity 1 124 1 114
Comment
Total equity increased over the period of review due to net surplus of $0.010m recorded in 2007-08.
Assets and liabilities were fairly consistent over the two year. Cash assets represent monies of the Association identifi ed as the former LGAT Welfare Fund (established in 1999) and carried forward
93 Local Government Association of Tasmania

to LGAT Assist. These monies are used for the purposes discussed in the Introduction section of this Chapter. The current and non-current fi nancial assets are loans advanced to eligible council employees to provide fi nancial support.
CASH POSITION – LGAT ASSIST
2007-08 2006-07Assist Assist
$’000s $’000s
General receipts 2 2 Government funding 0 0 Interest received 80 75 Payments to suppliers ( 71) ( 51)Payments to employees 0 0 Cash from operations 11 26
Loans Advanced ( 455) ( 380)Repayments of Loans Advanced 464 420 Cash from fi nancing activities 9 40
Net increase in cash 20 66
Cash at the beginning of the year 678 612 Cash at end of the year 698 678
Comment
Cash remained consistent over the two years.
FINANCIAL ANALYSIS – LGAT ASSIST
Bench Mark 2007-08 2006-07
Assist Assist
Financial Performance
Result from operations ($’000s) 10 25 Operating margin >1.0 1.14 1.48 Underlying result ratio 12.0% 32.5%Self fi nancing ratio 13.3% 33.8%
Financial Management
Current ratio >1 193.4 140.0 Creditor turnover 30 days 35 39
Comment
The Financial Performance ratios show LGAT Assist recorded operating surpluses in each year of the review, resulting in Operating margins above benchmark and positive Underlying result ratios.
Current ratio was well above the benchmark in each year indicating it was able to meet all short-term liabilities when they fell due.
94 Local Government Association of Tasmania

RIVERS AND WATER SUPPLY COMMISSION
INTRODUCTION
The Rivers and Water Supply Commission (the Commission or RWSC) operates under the Rivers and Water Supply Commission Act 1999. The Commission comprises four members appointed by the Governor. It operates solely within the water supply industry.
The Commission undertakes a number of activities and functions. These include:
• the administration of water districts in accordance with Section 5(2) of the Rivers and Water Supply Commission Act 1999
• the management of property of the Crown or the Commission and other property related to the administration of such districts
• the provision of project management and development services in the commercial water industry and related industries
• such other functions related to the commercial water industry as the Minister directs.
The Commission owns and operates the South-East Irrigation Scheme supplying irrigated water to farmers along the Coal River from Craigbourne Dam to Richmond and via pipeline supply through to Cambridge.
During 2003-04 the Minister appointed the Commission as the responsible water entity for the Clyde Irrigation Scheme. This scheme came into operation in the 2004-05 fi nancial year. Whilst the Commission has taken over responsibility for the Clyde Irrigation Scheme, the Clyde Water Trust continues as a separate independent entity and remains the owner of the Clyde Irrigation Scheme assets.
The Commission owns the scheme infrastructure of the Cressy-Longford and Winnaleah Irrigation Schemes, which are now managed for the Commission by irrigators of these schemes via Cressy-Longford Irrigation Scheme Limited and Winnaleah Irrigation Scheme Limited respectively. These are two private companies owned by the Commission.
The Commission ceased to administer the Meander Valley Irrigation Scheme during the 2004-05 fi nancial year. At 30 June 2005 the Commission sold its properties to the then Department of Primary Industries, Water and Environment (DPIWE) to facilitate the private consortium development of the proposed Meander Dam.
In February 2006 the then Minister for Primary Industries and Water issued a Ministerial Direction to the Commission under section 6(2) of the Rivers and Water Supply Commission Act 1999 to undertake the function of construction and operation of a dam on the Meander River for the purposes of irrigation and a mini hydro electric station. The Meander Dam commenced operation during 2007-08 and the total cost of the project was $38.650m. This was funded by a combination of borrowings, equity contributions from government and internal funds. Impairment losses for this project amounted to $6.977m for the year ended 30 June 2008.
AASB 136 Impairment of Assets prescribes that the carrying value of assets be no more than their recoverable amount. Recoverable amount is the higher of an asset’s fair value less costs to sell and its value in use. RWSC engaged an external specialist to model the value of the future cash fl ows expected to be generated from the Meander Dam. This resulted in the impairment of $6.977m.
The Commission also owns the following water supply schemes:
95 Rivers and Water Supply Commission

• Prosser River Water Supply Scheme - operated and administered by the Glamorgan Spring Bay Council, supplying water in bulk to the Orford and Barton Avenue areas of Glamorgan Spring Bay and to the Triabunna Woodchip Mill and other smaller industries
• Togari Water Scheme - supplying water for stock and dairy sheds for 45 properties within the Togari District.
The Commission also operates three drainage and river improvement schemes throughout the State, including the Welcome and Montagu River Schemes and the Furneaux Drainage Scheme.
The Responsible Minister is the Minister for Primary Industries and Water.
AUDIT OF THE 2007-08 FINANCIAL STATEMENTS
Initial signed fi nancial statements were received on 15 august 2008, with fi nal signed fi nancial statements were received on 29 October 2008 and an unqualifi ed audit report was issued on 30 October 2008.
The audit was completed satisfactorily with no major issues outstanding other than the late submission of fi nancial statements.
FINANCIAL RESULTS
The Commission made losses in three of the past four years with 2007-08 being an exception due to the money received from the sale of water rights following commissioning of the Meander Dam.
In previous fi nancial years the Commission operated at net losses despite receipt of subsidies from the State Government. To a large extent these losses arose from asset impairments.
( 5 000) ( 4 000) ( 3 000) ( 2 000) ( 1 000)
0 1 000 2 000 3 000 4 000 5 000
2004-05 2005-06 2006-07 2007-08
$'00
0s
Year
Net Profit/(Loss) before tax
The main reason for the increase in net assets, as shown below, was the State and Commonwealth capital contributions towards the Meander Dam project and the profi t generated in 2007-08.
0 2 000 4 000 6 000 8 000
10 000 12 000 14 000 16 000 18 000 20 000
2004-05 2005-06 2006-07 2007-08
$'00
0s
Year
Net Assets
96 Rivers and Water Supply Commission

INCOME STATEMENT
2007-08 2006-07 2005-06 2004-05$’000s $’000s $’000s $’000s
Irrigation rights 10 126 441 0 0Water rates and charges 1 503 1 371 1 199 922 State Government interest contribution 1 040 201 365 567 Other operating revenue 937 126 220 89 Gain on sale of assets 11 44 15 655 Total Revenue 13 617 2 183 1 799 2 233
Empoyee expenses 92 395 254 287 Borrowing costs* 52 251 423 648 Depreciation 544 683 758 684 Write-down of assets 194 149 27 855 Impairment losses 6 977 2 071 1 530 2 197 Other operating expenses 1 273 983 709 756 Total Expenses 9 132 4 532 3 701 5 427
Profi t (Loss) before: 4 485 ( 2 349) ( 1 902) ( 3 194)
Derecognition of deferred tax asset 0 ( 1 529) 0 0 Profi t (Loss) before Taxation: 4 485 ( 3 878) ( 1 902) ( 3 194)
Income tax (benefi t) 0 0 ( 571) ( 958)Net Profi t (Loss) 4 485 ( 3 878) ( 1 331) ( 2 236)
* Borrowing costs of $1.493m were capitalised (2006-07, $0.340m).
Comment
The Commission’s operations resulted in both before and after tax losses in three of the four years under review, due to insuffi cient revenue earned from water and irrigation schemes. Losses were generated even after excluding the signifi cant impairment losses (discussed later). An exception to this was 2007-08, where additional water charges including the sale of irrigation rights were possible with the Meander Dam project coming on line during that year. The additional revenue from this source totalled $9.805m. This additional revenue however was signifi cantly offset by an increase in the impairment of the Meander Dam and associated infrastructure based on projected forward water revenues.
There were 24 000 megalitres of irrigation rights available for allocation, 7 000 of which were sold during 2007-08 for $1 000 each. The ownership of the irrigation right license permanently passes to the purchaser upon full payment of the license.
Due to the low probability of future taxable profi ts, an income tax benefi t was not recognised in 2007-08.
As designated by the Department of Treasury and Finance the annual contribution from Government is treated as part capital contribution to equity and part interest revenue, on the basis that such funding is made for the purpose of meeting capital costs of borrowing undertaken to fund the construction of the Commission’s irrigation schemes. In 2007-08 the revenue contribution was $1.040m, considerably higher than in prior years and was aimed at funding higher interest costs incurred as a result of borrowings to pay for the Meander Dam. The equity contribution was $1.675m which is discussed further under the Balance Sheet section.
97 Rivers and Water Supply Commission

Other signifi cant changes in line items in the Income Statement over the period included:
• Other operating revenue increased $0.811m from 2006-07 to 2007-08 due to fi rst time recognition of water stock, $0.450m; interest on Meander River irrigation 10 year fi xed plans, $0.121m; and electricity generation, $0.108m.
• Employee expenses increasing by $0.108m or 37% from 2004-05 to 2006-07 due to increased activity associated with the Meander Dam project, and subsequently decrease in 2007-08 once the project was completed.
• Borrowing costs reduced in line with the reduction in Commission loans. During the construction phase interest on borrowings needed for the Meander Dam project were capitalised, $1.493m in 2007-08 ($0.340m, 2006-07).
• Depreciation included an increase in dam depreciation from 2006-07 to 2007-08 of $0.153m, offset by a decrease in water infrastructure depreciation of $0.286m. The decrease in water infrastructure depreciation resulted from the infrastructure balance for 2007-08 being lower for the major part of 2007-08 than the balance for 2006-07.
• Impairment losses of $12.775m over the period. These impairments (asset write downs) arise from application of accounting standard AASB 136 Impairment of Assets. Under this accounting standard, where an indicator of impairment of a Commission asset or assets was identifi ed, the Commission, which is a “for profi t” entity for accounting purposes, is required to ensure that the carrying values of its assets do not exceed their recoverable amount determined on a discounted cash fl ow basis. Because of the low revenue from the Commission’s schemes, the recoverable amount of the schemes’ assets continues to be signifi cantly less than their carrying amount. These write-downs increased signifi cantly in 2007-08 to $6.977m as a result of forward projections in the sale of water rights from the Meander Dam.
98 Rivers and Water Supply Commission

BALANCE SHEET
2007-08 2006-07 2005-06 2004-05$’000s $’000s $’000s $’000s
Cash 2 013 1 094 446 210 Receivables 3 887 2 127 669 181 Investments 1 081 607 2 592 454 Water stock 490 165 171 171 Total Current Assets 7 471 3 993 3 878 1 016
Payables 803 2 631 742 121 Unearned revenue 893 6 301 2 900 0 Borrowings 991 4 475 3 311 2 440 Employee Provisions 69 192 169 144 Total Current Liabilities 2 756 13 599 7 122 2 705
Working Capital 4 715 ( 9 606) ( 3 244) ( 1 689)
Property, plant and equipment 36 778 30 489 14 332 6 547 Other 426 426 1 955 1 385 Total Non-Current Assets 37 204 30 915 16 287 7 932
Borrowings 24 087 10 546 1 000 4 305 Employee Provisions 338 394 358 419 Total Non-Current Liabilities 24 425 10 940 1 358 4 724
Net Assets 17 494 10 369 11 685 1 519
Reserves 965 0 0 0 Accumulated losses ( 23 187) ( 27 672) ( 23 794) ( 22 462)Government Contributions - State 37 116 35 941 33 379 23 981 Government contributions - Commonwealth 2 600 2 100 2 100 0 Total Equity 17 494 10 369 11 685 1 519
Comment
Total Equity increased from $1.519m at 30 June 2005 to $17.494m at 30 June 2008. While a number of balances varied compared to the position at 30 June 2005, the main reasons for this $15.975m improvement were:
• State capital contribution for irrigation loan repayments which enabled the Commission to repay debt of a similar amount
• State capital contribution towards the Meander Dam project, offset by
• Commonwealth capital contribution towards the Meander Dam project, offset by
• Net Losses over the period.
99 Rivers and Water Supply Commission

A number of other balances on the Balance Sheet varied over the period under review, for the following reasons:
• Receivables for 2007-08 comprised:
• fi xed repayment plan, $3.056m (2006-07, Nil)
• accrued revenue, $0.459m (2006-07, $1.410m)
• debtors, $0.327m (2006-07, $0.739).
• Fixed repayment plan is related to the water sales and irrigation rights for the Meander Dam. Purchasers of the Meander Dam irrigation rights can enter into 5 or 10 year fi xed repayment plans.
• The sale of the Meander Dam water irrigation rights represents unearned revenues giving rise to the $0.893m current liability. These sales are in relation to the purchase of future rights to be supplied with water for irrigation purposes and are in the form of an agreement
• Property, plant and equipment increased $30.231m over the four year period due mainly to the Meander Dam project. The total cost of the project was $38.650m. Impairment losses for this project amounted to $6.977m for the year ended 30 June 2008.
• Borrowings and payables increased by $19.782m due mainly to the Meander Dam project
• Non-current employee provision primarily represented the Commission’s superannuation liability.
• Reserves increased by $0.965m as a result of the revaluing of the following assets; Prosser River Water Supply Scheme assets ($0.538m), South East Irrigation Scheme assets ($0.170m), Togari Water Supply assets ($0.018m) and the Winnaleah Irrigation Scheme assets ($0.240m).
100 Rivers and Water Supply Commission

CASH POSITION
2007-08 2006-07 2005-06 2004-05$’000s $’000s $’000s $’000s
Receipts from customers 4 792 3 401 3 612 1 037 Payments to suppliers and employees ( 3 243) ( 1 196) ( 824) ( 1 120)Interest received 45 57 45 24 Borrowing costs ( 55) ( 260) ( 423) ( 648)Contribution from State government 688 554 365 567 Other 407 46 607 151 Cash from operations 2 634 2 602 3 382 11
Payments for property, plant and equipment ( 13 038) ( 17 256) ( 3 393) ( 77)Proceeds from sale of property, plant and
equipment 66 44 15 655 Cash from (used in) investing activities ( 12 972) ( 17 212) ( 3 378) 578
Capital contribution from Government 1 675 2 561 4 797 2 196 Proceeds from borrowings 26 195 31 295 1 135 206 Repayment of borrowings ( 16 137) ( 20 584) ( 3 562) ( 2 851)Cash from (used in) fi nancing activities 11 733 13 272 2 370 ( 449)
Net increase (decrease) in cash 1 395 ( 1 338) 2 374 140
Cash at the beginning of the year 1 700 3 038 664 524 Cash at end of the year 3 095 1 700 3 038 664
Comment
This Chapter noted previously that Borrowings of over $25.000m were made available for the construction of the Meander Dam and a further equity contribution was made to assist the Commission to service debt. Part of the amount made available was expended by the Department of Primary Industries and Water on behalf of the Commission, with the Commission recording the asset on its Balance Sheet and the funding as contributions recorded directly in Equity. This transaction did not therefore impact either the Income Statement or the Cash Flow Statement. For this reason, these funds do not appear as cash receipts in the table above.
Reasons for variations in receipts and payments, as well cash balances refl ect comments made previously in the Income Statement and Balance Sheet sections of this Chapter.
101 Rivers and Water Supply Commission

FINANCIAL ANALYSIS
Bench Mark 2007-08 2006-07 2005-06 2004-05
Financial Performance
Result from operations ($’000s) 4 485 ( 2 349 ) ( 1 902 ) ( 3 194 )
EBIT ($’000s) 4 537 ( 2 098 ) ( 1 479 ) ( 2 546 )Operating margin >1.0 0.38 0.37 0.48 0.29 Return on assets 11.4% (7.6%) (10.2%) (9.3%)Return on equity 32.2% (35.2%) (20.2%) (11.9%)
Financial Management
Debt to equity 143.4% 144.9% 36.9% 444.0%Debt to total assets 56.1% 43.0% 21.4% 75.4%Interest cover >2 87.3 (8.4) (3.5) (3.9)Current ratio >1 2.71 0.29 0.54 0.38 Cost of debt 7.5% 0.3% 2.6% 7.7% 9.5%Debt collection 30 days 89 189 96 13
Returns to Government
Dividends paid or payable ($’000s) 0 0 0 0 Income tax paid or payable ($’000s) 0 0 0 0 Total return to the State ($’000s) 0 0 0 0
Other Information
Staff numbers (FTE) 8 12 7 4 Average staff costs ($’000s) 53 61 55 71 Average leave balance per FTE ($’000s) 50 49 75 139
Comment
Impairment losses in all four years substantially contributed to the negative Results from operations in three of those years. Excluding these write-downs the Results from operations would have been a gain of $11.462m in 2007-08 and losses of $0.278m for 2006-07, $0.372m for 2005-06 and $0.997m for 2004-05.
Debt collection days increased signifi cantly due to the inclusion of large invoices for Meander Dam irrigation rights, due in June 2007. These reduced in 2008 as a result of the Meander Dam project being completed.
Current ratio was well above the benchmark in 2007-08, due mainly to revenues being earned from the Meander Dam project.
As the Commission previously made signifi cant losses there were no payments of taxes or dividends.
102 Rivers and Water Supply Commission

THE NOMINAL INSURER
INTRODUCTION
The Nominal Insurer is an independent statutory body established under section 121 of the Workers Rehabilitation and Compensation Act 1988 (the Act). Its main purpose is to ensure that injured workers are not disadvantaged in circumstances where employers or licensed insurers are unable to fulfi l their legal obligations.
Membership of the Nominal Insurer’s board comprises representatives of licensed insurers (3), self-insurers (1), the Responsible Minister (1) and the Treasurer (1). Its core activity is to manage claims lodged under the workers compensation legislation. Recently, its function was extended to address the collapse of the HIH Group, injuries arising from an act of terrorism and an increase in weekly compensation payments for injuries dating back to July 2001.
The Nominal Insurer operates four separate accounts set-up for specifi c purposes. Financial statements were prepared on an aggregate basis combining the four accounts into one report.
The Responsible Minister is the Minister for Justice.
AUDIT OF THE 2007-08 FINANCIAL STATEMENTS
Signed fi nancial statements were received on 18 December 2008 and an unqualifi ed audit report was issued on the same day.
The Act requires the Nominal Insurer to provide to the Auditor-General fi nancial statements within 45 days after the end of the fi nancial year. Furthermore, the Act requires the Responsible Minister to table the annual report, which incorporates fi nancial statements, in each House of Parliament within 4 months after the end for the fi nancial year.
Other than non-compliance with statutory reporting deadlines, the audit was completed with satisfactorily with no other major issues outstanding.
103 Nominal Insurer

FINANCIAL RESULTS
The Nominal Insurer continues to collect suffi cient amounts of contributions and levies to cover its legal responsibilities and repay funds borrowed to meet is obligations following the collapse of the HIH Group. Monies recovered from the liquidation of the HIH Group of insurance companies further contributed to the reduction of the Nominal Insurer’s debt.
INCOME STATEMENT
2007-08 2006-07 2005-06$’000s $’000s $’000s
Insurers’ contributions 5 256 5 426 5 632 Adjustment to dividend from liquidator 736 1 402 1 794 Reimbursements and recoveries 31 158 2 079 Interest 6 11 19 GST refunds 0 20 43 Total Revenue 6 029 7 017 9 567
Claims 575 214 6 783 Redemptions 38 169 96 Administration expenses 95 88 97 Interest 601 962 1 322 Total Expenses 1 309 1 433 8 353
Net Surplus 4 720 5 584 1 214
Comment
The Nominal Insurer is not an insurance company, as it does not enter into insurance contracts with policyholder nor does it receive insurance premiums or provide reinsurance. Its operations are funded by:
• contributions from licensed insurers and self-insurers
• a levy on all policy holders, self-insurers and government agencies
• recoveries from failed insurers and employers.
Surpluses reported over the past three years totalled $11.518m and were used predominantly to repay money borrowed to cover liabilities of the collapsed HIH Group. It is important to understand that the Nominal Insurer does note have profi t generation as its prime objective and any surpluses will ultimately be refunded to the licensed insurers and self-insurers in proportion to their contributions.
Insurers’ contributions are the main source of income and comprise contributions from licensed insurers and self-insurers and levies collected from policy holders, self-insurers and government agencies. The amount collected remained relatively steady over the past three years.
The Nominal Insurer has claims as accreditation against companies within the former HIH Group (HIH Casualty and General Insurance Limited, FAI General Insurance Company Limited and CIC Insurance Company Limited). Estimated future recoveries are reassessed by the HIH Group liquidator annually. The amount expected to be recovered (recognised in Receivables on the Balance Sheet) is then adjusted based on the advice. This adjustment may result in either recognition of additional revenue or write-back of previously recognised income. Adjustment to dividend from liquidator over the past three years refl ected the reassessment of future recoveries upwards by $3.932m in total. It is unlikely that the estimated dividend will increase much further
104 Nominal Insurer

in future years although the complexity of the liquidation process, involving numerous factors, makes this diffi cult to estimate.
Income from reimbursements and recoveries of $0.031m ($0.158m in 2006-07) was less than the 2005-06 total of $2.079m due in part to a one-off payment of $1.978m received that year from the HIH Group liquidator.
Claims expenses reduced signifi cantly when compared with $6.783m in 2005-06. The reduction was due to the assignment of liability to CGU Insurance Limited (CGU) for all existing and future claims in respect of the HIH Group for a one-off payment of $6.287m made by the Nominal Insurer in July 2005.
BALANCE SHEET
2007-08 2006-07 2005-06$’000s $’000s $’000s
Cash 180 886 455 Receivables 3 092 5 269 4 612 Other receivable 1 0 14 Total Current Assets 3 273 6 155 5 081
Total Assets 3 273 6 155 5 081
Outstanding claims 600 480 659 Borrowings 4 949 12 648 17 785 Provisions 40 40 40 Other payable 0 1 1 Total Current Liabilities 5 589 13 169 18 485
Outstanding claims 784 806 0 Total Non-Current Liabilities 784 806 0
Total Liabilities 6 373 13 975 18 485
Net Liabilities ( 3 100) ( 7 820) ( 13 404)
Insurance funds (Defi cit) ( 3 100) ( 7 820) ( 13 404)Equity(Defi cit) ( 3 100) ( 7 820) ( 13 404)
Comment
Surpluses in the last three years contributed to the reduction in Equity Defi cit from $13.404m to $3.100m. The negative equity is expected to continue reducing through collections of special contributions and recoveries from the HIH Group liquidation.
The Nominal Insurer does not hold large amounts of cash as collections of contributions and dividends received are used to repay borrowings and settle claims. In the current year, the Cash balance dropped to $0.180m mainly due to repayments of borrowings.
The current year’s Receivables balance reduced by $2.177m, refl ecting payments received of $2.913m during the year and the increase in the estimated dividend from the liquidator of $0.736m.
Total Outstanding claims remained steady over the past three years.
105 Nominal Insurer

Contingent Asset
Following the HIH collapse, The Nominal Insurer provided workers compensation payments to claimants of the former HIH Group as the insurer of last resort, resulting in around $37.600m being paid out. The Nominal Insurer has funded these payments through borrowings. In 2004 the State Government assigned liability for all existing and future claims in respect of the HIH Group to CGU. This effectively capped The Nominal Insurers liability to HIH Group claimants.
As mentioned previously, estimated future recoveries are reassessed by the HIH Group liquidator annually. The Nominal Insurer has the power under legislation to charge a levy on insurance premiums to recoup any shortfall between claims paid and the estimated recovery from the liquidator. Until a call to raise a levy is made, the amount is not recognised as a receivable on the balance sheet. Instead, a contingent asset is disclosed within the notes to the fi nancial report. The amount cannot be reliably measured due to fl uctuating loan balances, variable loan interest rates, fl uctuating claims, fl uctuating recoveries and fl uctuating insurance levies raised on insurance premiums in any given year. The table below shows the estimated contingent asset:
2007-08 2006-07 2005-06$’000s $’000s $’000s
Borrowings at 30 June 4 949 12 648 17 785 Less expected divided to be received from the liquidator of HIH Group ( 3 092) ( 5 269) ( 4 612)Contingent Asset 1 857 7 379 13 173
CASH POSITION
2007-08 2006-07 2005-06$’000s $’000s $’000s
Insurers’ contribution 5 256 5 427 5 632 Reimbursement from offi cial liquidator 2 913 1 402 1 794 Claims recovery 31 142 97 Reinsurance recovery 0 15 1 979 Interest received 6 11 19 Claims expenses ( 459) ( 213) ( 6 777)Step-down provision payments ( 39) ( 169) ( 96)Payments to suppliers and employees ( 89) ( 89) ( 90)Other ( 25) 5 Cash from operations 7 594 6 531 2 535
Repayment of borrowings ( 7 699) ( 5 138) ( 8 027)Interest paid ( 601) ( 962) ( 1 322)Cash (used in) fi nancing activities ( 8 300) ( 6 100) ( 3 349)
Net increase (decrease) in cash ( 706) 431 ( 814)
Cash at the beginning of the year 886 455 1 268 Cash at end of the year 180 886 454
106 Nominal Insurer

Comment
As mentioned previously, the Nominal Insurer utilises cash collected from insurers and the HIH liquidator to pay claims, repay its borrowings and cover administration costs.
Cash from operations increased by $5.062m in the current year and was mainly due to higher proceeds from the liquidation of the HIH Group. The higher receipts allowed the Nominal Insurer to repay a further $7.699m of its debt. In total, the Nominal Insurer repaid $20.864m of borrowings over the last three years. Overall, cash held decreased by $0.707m to $0.180m.
FINANCIAL ANALYSIS
Bench Mark 2007-08 2006-07 2005-06
Financial Performance
Result from operations ($’000s) 4 720 5 584 1 214 Operating margin >1.0 4.61 4.90 1.15
Financial Management
Debt to equity (159.6%) (161.7%) (132.7%)Debt to total assets (151.2%) (205.5%) (350.0%)Interest cover >2 8 6 1 Current ratio >1 0.59 0.47 0.27 Cost of debt 7.5% 6.8% 6.3% 7.4%
Comment
The Financial Performance ratios showed the Nominal Insurer recorded operating surpluses in all three years under review. The Operating margin indicated strong surpluses each year, but as mentioned earlier, surpluses generated were used to reduce the negative equity and any remaining surpluses will ultimately be refunded to contributors.
Following the collapse of the HIH Group, the Nominal Insurer borrowed funds to meet its newly assumed obligations. This resulted in unusual levels of Debt to equity, Debt to total assets and Current ratios. Regardless, these ratios improved over the period under review as a result of repayments made during the past three years.
Both the Interest cover and Cost of debt ratios were above the benchmark. The Interest cover ratio indicated that the Nominal Insurer was more than capable of meeting its interest payments.
107 Nominal Insurer

OTHER STATE ENTITIESREPORTING AT 31 DECEMBER 2008
UNIVERSITY OF TASMANIA
INTRODUCTION
The University of Tasmania (the University) is administered under the provisions of the University of Tasmania Act 1992. The University relies predominantly on Commonwealth support for its recurring activities.
During 2008 the Australian Maritime College (AMC) was established as an Institute within the University. AMC has a fully owned subsidiary, AMC Search Limited. The integration resulted through the passing of the Maritime Legislation Amendment Act 2007, with all AMC assets and liabilities transferred to the University, effective 1 January 2008.
The Consolidated fi nancial report comprises the fi nancial statements of the University, being the parent entity, and entities under its control during the fi nancial year. The controlled entities are University of Tasmania Foundation Inc, UTAS Innovation Limited, AMC Search Limited and Southern Ice Porcelain Pty Ltd.
The Commonwealth Department of Education, Employment and Workplace Relations (DEEWR) set fi nancial reporting guidelines that Universities must adhere to. These requirements are consistent with Australian Accounting Standards and the University complies with these guidelines and standards.
The University reports on a calendar year basis, hence the fi nancial results relate to the year ended 31 December 2008. The results reported in this Chapter relate to the University’s consolidated fi nancial performance.
The Responsible Minister is the Minister for Education and skills.
AUDIT OF THE 2008 FINANCIAL STATEMENTS
Signed fi nancial statements were received on 13 February 2009 and an unqualifi ed audit report was issued on 20 February 2009. Completion of the fi nancial report by the University’s fi nance staff for approval by the University Council by 13 February 2009 was signifi cantly earlier than prior years.
The audits of the University’s fi nancial statements, and those of its various subsidiary entities, were completed successfully with no material matters outstanding.
FINANCIAL RESULTS
The following fi ve graphs summarise key ratios highlighting important aspects of the University’s fi nancial performance over the past four years. In general, the ratios indicate:
108 University of Tasmania

0.92
0.96
1.00
1.04
1.08
1.12
2005 2006 2007 2008
Operating Margin
The Operating margin was above or close to the expected benchmark of one in all four years. It was low in 2008 predominantly due to investment losses on the University’s investment portfolio.
The Underlying results ratio moved in line with the Operating margin. The ratio is derived from the Net Surplus before taxation and AMC integration divided by operating revenue.
Underlying Result Ratio
1.0%
6.0%
11.0%
16.0%
21.0%
2005 2006 2007 2008
Self Financing Ratio
10%
12%
14%
16%
18%
20%
2005 2006 2007 2008
The Self fi nancing ratio increased in each year of the review period. The ratio is derived from the net operating cash fl ow divided by operating revenues and assists to measure the University’s ability to fund the replacement of assets from operational cash fl ows. The improvement was, to a large extent, due to the University’s net operating cash fl ow increasing over the period.
The Own source revenue percentage shows that the University generated the majority of its operating revenue from Commonwealth funding with the percentage decreasing to 40% in 2008 (2005, 41%).
36%
38%
40%
42%
Own Source Revenue
2005 2006 2007 2008
Current Ratio
3.00
3.50
4.00
4.50
5.00
5.50
6.00
2005 2006 2007 2008
The Current ratio was above the benchmark of one in all four years indicating that the University was able to meet all short-term liabilities.
109 University of Tasmania

INCOME STATEMENT
2008 2007 2006 2005$’000s $’000s $’000s $’000s
State government grants 19 512 17 901 9 691 9 437 Commonwealth grants 241 123 210 295 174 430 159 301 Higher Education Contributions scheme 48 513 42 737 42 870 41 744 User charges and fees 49 513 38 743 36 732 34 293 Other operating revenue 48 043 30 348 33 804 24 122 Investment revenue 23 282 27 279 22 576 16 495 Non-operating revenue 3 170 802 ( 1 536) 921 Total Revenue 433 156 368 105 318 567 286 313
Academic salary costs 116 139 93 889 83 195 77 503 Non-academic salary costs 96 365 80 701 71 407 64 665 Depreciation 16 810 14 846 16 022 15 817 Repairs and maintenance 16 592 13 937 11 705 12 685 Investment losses 51 031 13 162 0 0 Other operating expenses 128 909 100 617 85 708 81 817 Total Expenses 425 846 317 152 268 037 252 487
Net surplus before taxation 7 310 50 953 50 530 33 826
Income Tax Expense 3 ( 2) 2 10 Net surplus after taxation and before
AMC integration 7 307 50 955 50 528 33 816
Income recognised upon integration with AMC 62 775 0 0 0
Surplus for the year 70 082 50 955 50 528 33 816
Comment
When assessing the University’s fi nancial performance, it needs to be borne in mind that the operating result includes revenues for capital, infrastructure, reasearch and other restricted purposes. In accordance with Accounting Standards, the University records all grant revenue as income at the time it controls the receipt, irrespective of whether the grant is for an operating, capital or other purpose. In this regard, the University includes in the notes to its fi nancial statements (note 14 Equity) details of funds earned that may not be “operational” in nature.
In 2008 the net surplus before tax decreased by $43.643m (or 86%) due primarily to revenue increasing by $54.931m or 15% and expenditure increasing by $98.574m or 32%. During the period 2005 to 2007, the University enjoyed considerable growth in revenues, increasing by $68.630m or 24%. At the same time, expenditure growth was controlled increasing by $51.503m or 20% over this period resulting in the net surplus before tax increasing by $17.127m or 51%. The explanations for these variances are detailed below.
110 University of Tasmania

Details include:
2008 2007
$’000s $’000s
Capital grants note (i) 23 449 2 000Restricted funds note (ii) 804 30 466Balance of operating result note (iii) (16 943) 18 487Net surplus before taxation 7 310 50 953
Note (i): Capital grants were $23.449m of Capital Development pool monies from the Commonwealth Government for specifi c capital projects (2007, $2.000m). In 2008 capital grants consisted of $5.993m Capital Development Pool funds (2007, $2.000m), $11.456m from Better Universities Renewal Fund and $6.000m from the State Government for the Health Sciences Co-location project.
Note (ii): In the main this represented cash fl ows generated from research grant funds, which have still to be expended for the purposes intended. The timing of receipt of such grants will impact the extent of operating surplus existing at a point in time, in this case 31 December. During the 2007 fi nancial year the University generated approximately $8.583m more in research funds received than had been spent and $19.650m for non-research contracts, including the Integrated Marine Observing System (IMOS). However, the commitment to spend these monies for the appropriate purposes remains. Also included in the $30.466m was $2.565m being the net surplus in that year generated by the University Foundation Inc. These surpluses are also ‘restricted’. The income generated from these sources dropped in 2008 due to the impact of the IMOS on the result, due to early receipt funding in 2007. The net result of IMOS on restricted funds in 2008 was a defi cit of $3.605m (2007, $20.779m).
Note (iii): The balance of the operating result included investment income. In 2007 investment gain was $14.117m. The University enjoyed strong investment returns in 2007 due to the strength of the Australian equities markets. The 2008 operating result was signifi cantly impacted by the performance of fi nancial markets in 2008, with a net investment loss of $27.490m.
Further analysis of the Income Statement indicates that:
• State government grants remained relatively consistent in 2008 and included a State government grant of $6.000m toward the Health Sciences Co-location project. The increase of $8.210m between 2006 and 2007 was due primarily to increased funding of $3.309m from the Tasmanian Institute of Agricultural Research and $3.819m in relation to asset transfers from the State Government under the SmartFarms project
• Commonwealth grant funds represented the University’s major source of funding comprising 59% of total revenue (2007, 59%; 2006, 54%; 2005, 56%)
• User charges and fees primarily included fee-paying overseas students and accommodation charges. The increase in User charges and fees of $10.770m between 2007 and 2008 related mainly to increased fee-paying overseas students of $6.761m (included AMC of $3.000m) and increased accommodation charges of $3.362m (included AMC of $2.000m)
• Other operating revenue included consultancy and contract research, donations and bequests, investment income, scholarships and prizes and miscellaneous income. The increase in other operating revenue of $17.436m in 2008, related primarily, to increased contract revenue of $2.931m, increased industry and other research of $2.238m, increased miscellaneous revenue of $4.269m and a refund which related to the GST treatment of accommodation services of $2.847m.
• Staff costs represented 57% of Total Expense before accounting for investment losses (2007, 57%; 2006, 58%; 2005, 56%). The increase in Academic staff and Non-Academic staff salary costs over the period 2005 to 2007 was $32.422m or 22.81%, which primarily related to:
• higher direct costs, due to enterprise bargaining increases and adjustments to staff superannuation liabilities
111 University of Tasmania

• an increase in the number of full time equivalent employees (FTEs). FTEs increased by 88 in 2007 which, at an average salary cost of $85 000 (see Financial Analysis section of this Chapter) resulted in an increase of $7.480m or 4.84% in 2007
• the increase in Academic staff and Non-Academic staff salary between 2007 and 2008 was $37.914m or 21.72%, which primarily related to:
• the integration of AMC, previously mentioned. FTEs increased by 209, which amounted to increased salaries of approximately $17.770m, based on 2007 salaries
• employees received a 4.5% increase for 2008
• the impact of a reduction in the discount rate at 31 December 2008, which increased the present value of the non-current portion of the long service leave and superannuation provisions by $6.213m
• Depreciation increased in 2008 primarily due to the addition of property, plant and equipment from the integration of AMC of $49.226m. Depreciation decreased by $1.176m in 2007 mainly due to the depreciation rate for buildings reducing from 2.0% to 1.33%, effective from 1 January 2007. The depreciation rate was changed after a review was performed on the depreciation rates of land and buildings, subsequent to a revaluation undertaken in 2006
• Repairs and maintenance expenses remained relatively consistent over the period of review. Repairs and maintenance expenses increased by $2.655m in 2008 due primarily to buildings of $32.512m and equipment of $8.977m acquired in relation to the integration with AMC, mentioned previously
• Other operating expenses included scholarships and prizes, non-capitalised equipment and maintenance, travel and staff development, consumables, consultancy services and other expenditure. The increase in Other operating expenses in 2008 was primarily due to increases of $13.849m in consultancy services and research sub-contractors (included IMOS of $10.000m and AMC of $1.000m)), $3.147m in consumables (AMC, $1.200m) and $2.430m in scholarships and prizes
• in addition, there were net investment losses in 2008 due to the down turn in the market of $27.749m.
112 University of Tasmania

BALANCE SHEET
2008 2007 2006 2005$’000s $’000s $’000s $’000s
Cash 16 365 23 259 27 792 11 008 Receivables 16 388 18 688 8 937 9 590 Financial assets at fair value 213 079 198 081 166 089 137 969 Inventories 691 636 170 161 Non current assets held for sale 0 0 0 11 265 Other 6 229 5 062 3 447 4 120 Total Current Assets 252 752 245 726 206 435 174 113
Payables 16 813 13 358 10 171 15 678 Provisions 22 598 19 253 18 482 17 334 Other 13 368 12 536 11 067 8 607 Total Current Liabilities 52 779 45 147 39 720 41 619
Working Capital 199 973 200 579 166 715 132 494
Investments 2 059 2 764 2 764 1 395 Property, plant and equipment 438 132 358 589 355 531 286 350 Other 12 408 9 261 8 230 9 973 Total Non-Current Assets 452 599 370 614 366 525 297 718
Provisions 31 860 25 647 25 099 26 373 Total Non-Current Liabilities 31 860 25 647 25 099 26 373
Net Assets 620 712 545 546 508 141 403 839
Restricted Funds 93 047 92 243 61 778 45 511 Reserves 239 529 234 445 247 995 194 221 Retained surpluses 288 136 218 858 198 368 164 107 Total Equity 620 712 545 546 508 141 403 839
Comment
Over the period under review Total Equity improved strongly growing by $216.873m or 53.70%. This was primarily due to:
• Net surpluses after taxation but before AMC integration of $108.790m. As noted under the Income Statement section of this Chapter, much of this resulted from the receipt of special purpose or other restricted funds of $47.536m during the period under review
• Revaluations of Non-current assets over this period totalling $45.308m
• Net assets recognised upon the initial integration with AMC of $62.775m.
Movements in other Balance Sheet line items between 2005 and 2008 are summarised below:
• Cash and Financial assets at fair value increased by $8.104m in 2008 due to funding received not yet spent. The cash and fi nancial assets on hand increased by $27.459m between 2006 and 2007 due to Commonwealth funding received not yet spent and strong investment returns. The University’s strong investment and cash position results in a healthy net working capital of $199.973m. However, this is before taking into account commitments for capital works, research obligations and other restrictions on University resources referred to under the Income Statement section
113 University of Tasmania

• Receivables increased by $9.751m between 2006 and 2007 primarily due to a receivable due from DEEWR (IMOS) of $8.295m not present in 2006. Receivables remained relatively consistent in 2008
• Non-current assets held for sale, $11.265m in 2005, represented properties owned by the University, which were used to provide accommodation to students. These properties were disposed of during 2006
• Property, plant and equipment increased by $79.543m in 2008 and by $151.782m over the period. Land was revalued upward by $4.950m in 2008 and there were additions totalling $91.905m, which primarily comprised:
• property, plant and equipment of $49.226m due to the integration of AMC, mentioned previously
• work in progress totalling $33.544m, due mainly to the Health Sciences Co-Location project. At 31 December 2008 the University was committed to further expenditure of $23.011m in relation to this project
• plant and equipment additions totalling $6.809m primarily consisted of scientifi c and administrative equipment and motor vehicles
• additions to libraries amounted to $2.302m, partly offset by
• Depreciation charges of $16.807m and disposals of $0.505m.
• Payables increased by $3.455m in 2008 mainly attributable to increased trade creditors and accruals of $1.049m and increased accrued salaries and wages of $1.912m.
• Total Provisions, consisted of annual leave, long service leave and superannuation, remained reasonably constant over the period 2005 to 2007. The increase of $9.558m in 2008 was primarily due to higher staff numbers, increased salaries and a reduction in the discount rate at 31 December 2008, which increased the present value of the non-current portion of long service leave and superannuation provisions.
114 University of Tasmania

CASH POSITION
2008 2007 2006 2005$’000s $’000s $’000s $’000s
State government grants 21 463 15 872 10 660 10 380 Commonwealth grants and funding 292 159 240 096 212 648 199 861 Receipts from customers 111 688 82 809 81 991 68 009 Payments to suppliers and employees ( 368 756) ( 297 923) ( 267 607) ( 241 770)Investment Income 24 849 27 333 19 343 9 772 Cash from operations 81 403 68 187 57 035 46 252
Payments for fi nancial assets ( 64 145) ( 45 208) ( 26 266) ( 27 158)Payments for property, plant and equipment ( 39 503) ( 28 381) ( 31 466) ( 15 999)Proceeds from sale of property, plant and
equipment 1 140 545 13 989 923 Cash acquired on integration with AMC 15 061 0 0 0 Other investing cash fl ows ( 850) 324 3 492 ( 1 463)Cash (used in) investing activities ( 88 297) ( 72 720) ( 40 251) ( 43 697)
Net increase (decrease) in cash ( 6 894) ( 4 533) 16 784 2 555
Cash at the beginning of the year 23 259 27 792 11 008 8 453 Cash at end of the year 16 365 23 259 27 792 11 008
Comment
Cash from operations increased by $13.216m in 2008. Commonwealth grants and User charges and fees increased signifi cantly for the reasons outlined in the Income Statement section of this Chapter. The increases in receipts was partially offset by increases in staff costs and Other operating expenses.
The University invests surplus Cash from operations in fi nancial assets.
The majority of payments for Property, plant and equipment comprised plant and equipment, library acquisitions and work in progress in relation to buildings, mentioned previously in the Balance Sheet section.
Proceeds from sale of Property, plant and equipment decreased by $13.444m between 2006 and 2007 due to the sale of non-current investment properties which were held for sale in 2005 and disposed of in 2006.
The integration with AMC resulted in Cash acquired on integration with AMC of $15.061m being recognised in 2008.
As noted previously, while the University appears to have high cash holdings at year end, a signifi cant portion of the cash and investment funds are committed to future projects, research or are held for restricted purposes.
115 University of Tasmania

FINANCIAL ANALYSIS
Bench Mark 2008 2007 2006 2005
Financial Performance
Result from operations before tax ($’000s) 4 140 50 151 52 066 32 905Operating margin >1.0 0.95 1.07 1.11 1.06 State grants as a % of operating income 5% 5% 3% 4%Commonwealth grants as a % of 59% 62% 59% 59%operating incomeHECS as a % of operating income 12% 13% 14% 16%Underlying results ratio 2% 14% 16% 12%Self fi nancing ratio 19% 19% 18% 16%Own source revenue ($’000) 172 521 139 909 134 446 117 575Indebtness ratio 18% 18% 19% 29%
Salaries and related expenditure as a % of 50 - 70% 52% 51% 52% 53%
Operating income
Financial Management
Current ratio >1.0 4.79 5.44 5.20 4.18 Debt collection 30 days 31 36 32 36 Creditor turnover 30 days 27 26 25 26
Other Information
Academic teaching staff numbers 1 093 951 871 796 Total staff numbers (FTEs)
(including casual staff ) 2 269 2 060 1 972 1 865 Average staff costs ($’000s) 94 85 78 76 Average leave balance per FTE (‘000s) 12 13 13 12 Student Load 14 426 13 463 13 300 12 712
Comment
The University recorded a surplus from operations in each of the four years under review. The Operating margin equalled or exceeded the benchmark rate, except in 2008.
The University is dependant upon grant funding, with approximately 71% of its revenue being obtained through Commonwealth grants and HECS payments in 2008. However, the University has made a concerted effort to increase revenue from other sources such as User fees and charges, particularly overseas fee-paying students. This source of revenue totalled $35.439m in 2008 (2007, $28.678; 2006, $26.502m).
As previously noted, salaries and related expenditure were the University’s major cost. This increased by 21.7% in the current year, but remained consistent as a percentage of total expenditure over the four years. The higher costs were primarily attributable to higher staffi ng levels due to the integration with AMC and enterprise bargaining increases, which were linked to increases in student numbers and research activity. Academic staff numbers increased by 142, or 14.9%, over the period due to increased student numbers of 963.
Average staff costs increased in line with enterprise bargaining increases applicable to both general and academic staff and a reduction in the discount rate at 31 December 2008, which increased the
116 University of Tasmania

present value of the non-current portion of the long service leave and superannuation provisions, previously mentioned.
Current ratio was well above benchmark. This was because the majority of investments were current in nature.
Debt collection and Creditor turnover were within the benchmarks and indicated, the University managed this component of its working capital effectively.
RESULTS OF SUBSIDIARY ENTITIES
University of Tasmania Foundation Inc (the Foundation)
The Foundation operated at a defi cit of $3.068m (2007, surplus of $2.565m). This result was due to investment losses of $2.861m in 2008 compared to investments gains of $1.716m in 2007. Net Assets at 31 December 2008 totalled $23.054m (2007, $26.122m).
UTAS Innovation Ltd (UTIL)
UTIL reported an operating loss of $0.382m in 2008, (2007, profi t $0.008m). Operating losses were also reported for the years ended 31 December 2005 and 2006, being $0.126m and $0.022m, respectively. In addition, its Balance Sheet at 31 December 2008 had negative Equity of $0.511m. As noted in its fi nancial statements, UTIL’s ability to continue as a going concern is dependent upon on-going support from the University, which indicated it will underwrite UTIL’s operations.
Following a GST audit by the Australian Taxation Offi ce (ATO) in 2005, UTIL received amended business activity statements (BAS) seeking additional GST in relation to penalties and interest. In 2008, the ATO partly agreed to UTIL’s position regarding its GST liabilities and UTIL incurred additional GST payments totalling $150 880. On 27 November 2008, the ATO partly agreed to the company’s position regarding its GST liabilities, and it is now incumbent on the company to provide further evidence and quantifi cation of amounts. As at 31 December 2008, the amount claimed by the ATO was $127 693 (2007, $343 183).
Subsequent to 31 December 2008, the ATO accepted UTIL’s assessment of GST payable as $20 193. In addition, the ATO will reconsider the issue related to the general interest charge.
It is the University’s intention to wind back UTIL to a shelf company. The University has transferred its business activities back to the University to administer.
AMC Search Ltd (AMC Search)
AMC Search operated at a surplus of $1.001m (2007, $0.814m). Net assets at 31 December 2008 totalled $3.925m (2007, $3.534m).
Southern Ice Porcelain Pty Ltd
This company operated at a surplus of $6 000 on a turnover of $14 000 (2007, defi cit of $4 000 on turnover of $2 000). Net assets at 31 December 2008 totalled $48 000 (2007, $42 000).
117 University of Tasmania

THEATRE ROYAL MANAGEMENT BOARD
INTRODUCTION
The functions of the Theatre Royal Management Board (the Board) include the management of the Theatre Royal (the Theatre) as a place of theatre and performing arts and to arrange for, organise and promote performing arts in the Theatre and other places in Tasmania.
The Responsible Minister is the Minister for Environment, Parks Heritage and the Arts.
AUDIT OF THE YEAR ENDED 31 DECEMBER 2008 FINANCIAL STATEMENTS
Financial statements for the year ended 31 December 2008 were signed on the 4 March 2008 and an unqualifi ed audit report was issued on the 5 March 2008.
The fi nancial statements include the comment that the Theatre is economically dependent on administration and programme grants from the State government so that it can continue as a going concern and pay its debts as and when they fall due. As a result, the fi nancial statements were prepared on the basis that the Board is a going concern.
In the 31 December 2006 fi nancial statements an error was found and corrected. The error related to the incorrect application of an accounting standard relating to accounting for capital grants. This was subsequently adjusted the capital grant shown after determining the normal operating result.
The audit was completed with satisfactorily with no major issues outstanding.
FINANCIAL RESULTS
The following fi ve graphs summarise key ratios highlighting important aspects of the Board’s fi nancial performance over the past four years. In general, the ratios indicate:
Operating Margin
0.98 1.00 1.02 1.04 1.06 1.08 1.10 1.12 1.14 1.16 1.18 1.20
2005 2006 2007 2008
The Operating margin exceeded the benchmark of one in each of the four years under review. This implies that the Board maintained and improved its fi nancial effectiveness over the review period.
The Underlying result ratio was positive for each year of the review period. This was a direct result of annual surpluses being generated. To ensure long-term fi nancial sustainability, we would expect the Board to produce, at a minimum, a break-even operating result.
Underlying Result Ratio
0.0%
5.0%
10.0%
15.0%
20.0%
2005 2006 2007 2008
118 Theatre Royal Management Board

Self Financing Ratio
0%
20%
40%
60%
80%
100%
2005 2006 2007 2008
The Self fi nancing ratio, whilst fl uctuating over the period of review, was positive but showed a signifi cant decrease in 2007-08. The ratio is derived from the net operating cash fl ow divided by operating revenue and assists measurement of the Board’s ability to fund the replacement of assets from operational cash fl ows.
The Own source revenue percentage shows that, while declining, the Board continued to generate the majority of its operating revenue from its own sources. Funding from Grants was 15% in 2007-08 (2004-05, 9%).
Own Source Revenue
78%
80%
82%
84%
86%
88%
90%
92%
2005 2006 2007 2008
Current Ratio
-
1.00
2.00
3.00
4.00
5.00
6.00
2005 2006 2007 2008
The Current ratio was above the benchmark of one in all four years indicating that the Board was able to meet all short-term liabilities.
119 Theatre Royal Management Board

INCOME STATEMENT
2008 2007 2006 2005$000s $000s $000s $000s
Government grants 287 273 175 119 User charges and fees 760 585 442 562 Other operating revenue 853 765 619 652 Non-operating revenue 2 1 1 5 Total Revenue 1 902 1 624 1 237 1 338
Borrowing costs 0 1 2 2 Depreciation 75 30 16 19 Salaries and related expenses 786 591 540 531 Entrepreneurial ventures 492 437 370 456 Other operating expenses 366 310 243 254 Total Expenses 1 719 1 369 1 171 1 262
Surplus before: 183 255 66 76
Capital grant - building improvements 0 0 1 095 0 Capital grant - new seating 500 0 0 0 Surplus for the year 683 255 1 161 76
Comment
The Board recorded total Surpluses before capital items of $0.580m indicating that it generated suffi cient revenue to fulfi l its operating requirements, including coverage of its depreciation charges. A defi cit for Entrepreneurial ventures of $0.119m in 2008 ($0.015m surplus, 2007) was predominately the reason for a lower Surplus in 2008. Surpluses totalled $2.175m for the period and included Capital grants of $1.595m
User charges and fees increased by $0.198m over the period of review and $0.175m in 2008. The movement in the year was primarily due to increased Salaries recovered, $0.139m, Hire of venues, $0.057m and Theatre hire income, $0.035m.
Other operating revenue increased by $0.201m over the period of review and $0.088m in 2008. The movement was due to increased sales in box offi ce income, $0.083m, Interest, $0.047m, Income from catering, $0.028m which was offset by a decrease of $0.080m in Entrepreneurial Venture revenue. Although there were fewer shows in 2008, 44 (2007, 54) the attendance was higher by 10 593 people (2008, 66 192; 2007, 55 629). Interest income rose due to higher cash holdings relating to Government grants received but not immediately committed and higher interest rates.
Depreciation increased by $0.056m over the period of review and $0.045m in 2008. This was due to a full year of depreciation for the Loading dock, $0.223m, commissioned in September 2007. In general, operating expenses increased during the year in line with the utilisation of the Theatre for its ordinary program activities and its Entrepreneurial program.
Capital grants for the period of review $1.595m provided by the State government included an upgrade of the Theatre Royal building, $1.095m, and upgrade of seating, $0.500m.
While the Board returned positive results for the four years under review after grants it remains dependent upon Government support, at least in the foreseeable future.
120 Theatre Royal Management Board

BALANCE SHEET
2008 2007 2006 2005$000s $000s $000s $000s
Cash 1 291 1 449 906 189 Receivables 32 43 202 22 Inventories 3 3 3 3 Other 7 8 6 4 Total Current Assets 1 333 1 503 1 117 218
Property, plant and equipment 12 16 22 32 Work in progress 520 263 338 0 Leasehold improvements 658 609 19 0 Total Non-Current Assets 1 190 888 379 32
Payables 238 313 169 85 Borrowings 0 0 4 6 Provisions 13 62 56 48 Grants received in advance 0 500 0 0 Other- deferred income 0 1 9 3 Total Current Liabilities 251 876 238 142
Provisions 79 6 3 11 Borrowings 0 0 0 4 Total Non-Current Liabilities 79 6 3 15
Net Assets 2 193 1 509 1 255 93
Retained surpluses 2 192 1 508 1 254 92 Reserves 1 1 1 1 Total Equity 2 193 1 509 1 255 93
Comment
Total Equity increased by $1.092m or 45% in the current year and by $2.100m since 2005. The major contributors to the increase were the annual surpluses generated by the Board.
Cash increased by $1.102m over the period of review despite a $0.158m decrease in 2008. Cash comprised both cash at bank and short-term bank deposits. The large cash balance in 2007 was mainly due to a $0.500m Capital grant held and subsequently expended in 2008.
Receivables were fairly consistent over the period of review except for the increase in 2006 of $0.180m. This increase was due to the timing of an invoice to the then Department of Tourism, Arts and the Environment for $0.143m at year end.
Work in progress, $0.520m, and Leasehold improvements, $0.658m, were recognised in relation to the Board’s leasehold upgrade works program. The total funding for the leasehold improvements was $1.600m of which $7 110 was the total leasehold improvements commitments outstanding as at 31 December 2008.
Payables increased over the period of review by $0.153m but decreased in 2008 by $0.075m. This was due to a large decrease in advance ticket sales and a fall in trade creditors due to timing issues.
Grants received in advance related to the seating upgrade project of $0.500m, of which $8 500 remained as a commitment at 31 December 2008.
121 Theatre Royal Management Board

CASH POSITION
2008 2007 2006 2005$000s $000s $000s $000s
Government grants 286 773 1 276 119 Receipts from customers 2 011 1 102 874 1 178 Payments to suppliers and employees ( 2 155) ( 852) ( 1 101) ( 1 242)Interest received 77 64 38 8 Interest paid 0 ( 1) ( 2) ( 2)Cash from (used in) operations 219 1 086 1 085 61
Payments for property, plant and equipment ( 5) ( 6) ( 6) ( 3)Payments for leasehold improvements ( 371) ( 533) ( 357) 0 Proceeds from sale of property, plant and
equipment 0 0 0 4 Cash from (used in) investing activities ( 376) ( 539) ( 363) 1
Repayment of borrowings 0 ( 4) ( 6) ( 6)Cash (used in) fi nancing activities 0 ( 4) ( 6) ( 6)
Net increase (decrease) in cash ( 157) 543 716 56
Cash at the beginning of the year 1 448 905 189 133 Cash at end of the year 1 291 1 448 905 189
Comment
Over the four years under review cash increased from $0.189m in 2005 to $1.291m in 2008. This increase was primarily due to increased activity from Entrepreneurial ventures and from Government grants.
122 Theatre Royal Management Board

FINANCIAL ANALYSIS
Bench Mark 2008 2007 2006 2005
Financial Performance
Result from operations ($’000s) 183 255 65 71 (before capital grant)Operating margin >1.0 1.11 1.19 1.06 1.06 Underlying result ratio 9.6% 15.7% 5.3% 5.7%Self fi nancing ratio 11.5% 66.9% 87.7% 4.6%Own source revenue ($’000s) 1 615 1 351 1 062 1 219
Financial Management
Current ratio >1 5.31 1.72 4.69 1.54
Comment
Financial Performance ratios showed the Board recorded surpluses before Capital items in all four years under review. Operating margins were above benchmark level of one for each of the years under review refl ecting positive results from operations. The Underlying result ratio fl uctuated between years and refl ected the movements in the Board’s operating results.
The Self-fi nancing ratio shows the level of the Board’s ability to fund the replacement of assets from cash generated from operations. In other words, an entity is expected to generate enough cash from its operations to meet depreciation expense in order to provide for future capital investments. While in 2008 the ratio showed a decline in the Board’s ability to generate Cash from operations, it remained positive, although in recent years signifi cant capital works were funded by Grants.
In 2008, the Current ratio increased from 1.72 to 5.31 as a result of the seating upgrade funding of $0.500m, which was included in current liabilities in 2007. This was recorded as revenue in 2008.
123 Theatre Royal Management Board

TAFE TASMANIA
INTRODUCTION
TAFE Tasmania (TAFE) was established under the TAFE Tasmania Act 1997 as a provider of vocational and further education. It was managed by a board of fi ve directors appointed by the Government.
TAFE was the largest registered training organisation in Tasmania. It provided vocational education and training at 21 major training campuses throughout the State.
Under the Education and Training (Repeals and Transitional Provisions) Bill 2008, the TAFE Tasmania Act 1997 was repealed effective 31 December 2008.
Under the Tasmania Tomorrow initiative, from 1 January 2009, three new statutory authorities were created from state secondary colleges and TAFE. Each of these organisations will be focused on a specifi c role. These statutory authorities are:
• The Tasmanian Academy which is focused on academic learning, with a curriculum and academic pathway for year 11 and 12 students seeking university entrance
• The Tasmanian Polytechnic which is focused on practical learning, with a vocational pathway, supported by academic courses as well, for both year 11/12 and mature – aged students seeking employment outcomes or university articulation
• The Tasmanian Skills Institute which is focused on skills development for employees in enterprises, in line with their enterprise’s skills needs.
The fi nancial statements which form the basis for this Chapter were those prepared for the six months ended 31 December 2008, the fi nal statements prepared by TAFE. The assets, liabilities, contracts and staff of TAFE were transferred to the Tasmanian Polytechnic and the Tasmanian Skills Institute commencing 1 January 2009. It is not intended that the Tasmanian Academy receive a transfer of any assets, liabilities, contracts or staff from TAFE. The assets and liabilities were to be transferred at TAFE’s net book values.
Despite the transfer of assets and liabilities from TAFE on 1 January 2009, the classifi cation of assets and liabilities on the Balance Sheet remained relevant as if TAFE were to continue operating and consistent with how the new entities are likely to classify these assets and liabilities. In addition, the fi nancial report at 31 December 2008 was prepared on a going concern basis.
At 31 December 2008, TAFE accessed 87% (30 June 2008, 83%) of its funds via a Purchase Agreement with the Minister for Education and relied on capital funds from Commonwealth and State Government sources to develop, maintain and refurbish its non-fi nancial assets.
TAFE provided concessions and exemptions of service fees for students under various circumstances. These fees were not recorded in student fees revenue and no expense was recognised for revenue foregone. Concessions were 26% of the gross value of student fees as at 31 December 2008 (30 June 2008, 30%).
TAFE also provided commercial services on a fee for service basis. Delivery programs included commercial training and retail trading as a by product of certain training activities such as in the restaurant industry.
The level of training provided in a number of TAFE programs, including enrolled nursing, electro technology, plumbing, motor body, children’s services and the mining sector, was increased to support industry-generated demand for training. In addition, there was growth in a range of pathways programs and support for students with literacy and numeracy needs.
As at 31 December 2008 the Responsible Minister was the Minister for Education and Skills.
124 TAFE

AUDIT OF THE FINANCIAL STATEMENTS FOR THE SIX MONTH PERIOD ENDED 31 DECEMBER 2008
Signed fi nancial statements were received on 27 March 2009 and an unqualifi ed audit report was issued on the same day.
The fi nal audit as at 31 December 2008 was completed satisfactorily with no major issues outstanding.
FINANCIAL RESULTS
In fi nancial terms TAFE was classifi ed as a not-for-profi t entity and was likely to operate at a defi cit before accounting for capital investment grants, which was primarily due to TAFE not being funded for depreciation. As noted previously, TAFE relied on capital funds from Commonwealth and State Government sources to develop, maintain and refurbish its non-fi nancial assets with these funds primarily received via capital investment grants. Annual surpluses and defi cits fl uctuated depending on the timing of the Purchase agreement recurrent funding which was provided on a calendar year basis. For the 6 month period to 31 December 2008 TAFE operated at a Defi cit before capital funding of $4.949m, a decrease of $2.726m compared to the 12 month period to 30 June 2008. This is due partly to the timing of cash fl ows from recurrent funding.
TAFE’s balance sheet was reasonably healthy with equity increasing by $7.711m between 30 June 2008 and 31 December 2008, mainly due to revaluation increments in relation to land and buildings. Over this period TAFE’s net working capital remained positive ranging from $5.252m to $3.752m meaning that it was in a good position to meet its current commitments.
Because 31 December was a shortened fi nancial reporting period and due to it being the last fi nancial report prepared by TAFE, the analysis of the following pages covers only the two most recent fi nancial reporting periods.
INCOME STATEMENT
6 Months 12 months31-Dec-08 30-Jun-08
$’000s $’000s
Purchase agreement recurrent funding 47 188 75 969 Other government revenue 4 032 6 621 User charges, fees and fi nes 2 158 7 071 Commercial services 5 035 9 677 Other operating revenue 720 1 540 Gain on sale of non-current assets 0 0 Total Revenue 59 133 100 878
Employee expenses 45 096 79 227 Depreciation 4 358 7 757 Other operating expenses 15 800 25 942 Loss on sale of non-current assets 1 348 357 Total Expenses 66 602 113 283
(Defi cit) before: ( 7 469) ( 12 405)
Capital funding 2 520 4 730 (Defi cit) for the year ( 4 949) ( 7 675)
125 TAFE

Comment
TAFE’s fi nancial performance for the current fi nancial period was analysed on a pro rata basis against 6/12th of the 30 June 2008 fi nancial year.
TAFE recorded Defi cits before capital funding in the two periods under review, these defi cits indicate TAFE was not generating suffi cient revenue to fulfi l all of its operating requirements, primarily coverage of its depreciation charges.
The Defi cit before capital funding of $7.469m appears high compared to the previous full fi nancial year of $12.405m. There is a combination of reasons for this including:
• User charges, fees and fi nes revenue were well down on what might have been expected for a six month period. This was because Fees for enrolments, a major part of this revenue source, are predominantly collected in the fi rst half of the calendar year, due to up front payment requirements
• Employee expenses appeared high when compared to the previous 12 month period. This was in the main due to:
• higher levels of staff due to greater student activity and commercial courses. The Financial Analysis section of this Chapter notes that full time equivalent employees (FTEs) increased by 32 which at an average staff cost of $0.041m represents additional employee costs of $1.312m
• wage increases of 4.0% for administration and clerical staff effective 27 November and 5.09% for teaching staff in October. These increases were relatively consistent from year to year
• Depreciation expenses were high primarily due to building revaluation increments of $15.321m at 30 June 2008
• Other operating expenses were high in the six month period due to increased expenditure for information technology (IT) infrastructure and equipment. In addition one-off transition costs were incurred in relation to the Tasmania Tomorrow Reforms previously mentioned.
Capital funding received totalled $2.520m which primarily related to the following major capital projects: Alanvale Campus redevelopment, $0.290m; Burnie Campus redevelopment, $0.565m; multi-site infrastructure upgrades, $0.380m and IT infrastructure development, $0.550m.
The loss on sale of non-current assets arose because land and buildings which comprised the Queenstown campus of TAFE were owned by the Crown. The written down value of the land and buildings was $1.641m, prior to being transferred back to the Crown. The Crown subsequently transferred these assets to the West Coast Council.
126 TAFE

BALANCE SHEET
31-Dec-08 30-Jun-08$000s $000s
Cash 5 818 7 814 Receivables 2 613 3 653 Inventories 415 491 Asset held for sale 0 320 Other 1 654 285 Total Current Assets 10 500 12 563
Property, plant and equipment 220 630 210 171 Total Non-Current Assets 220 630 210 171
Payables 1 826 2 737 Provisions 4 118 3 747 Other 804 827 Total Current Liabilities 6 748 7 311
Provisions 10 942 9 765 Other 683 612 Total Non-Current Liabilities 11 625 10 377
Net Assets 212 757 205 046
Reserves 101 898 89 238 Accumulated defi cits ( 24 734) ( 19 785)Contributed equity 135 593 135 593 Total Equity 212 757 205 046
Comment
Total Equity increased by $7.711m or 4% due to:
• land and building revaluations of $13.162m
• land and buildings transferred to the Crown of $0.502m
• the defi cit for the six months of $4.949m.
The main factors which contributed to movements in the balances of assets and liabilities were:
• Cash consisted of cash on hand and short term investments. Cash decreased by $1.996m due to negative cash from operations of $1.347m and net investing activities of $0.649m. See Cash Position section of this Chapter
• Receivables decreased by $1.040m or 28% due to the 31 December balance being representative of the end of a calendar or teaching year, which resulted in most student fees having been paid
• Assets held for sale decreased by $0.320m due to TAFE disposing of approximately 2.904 hectares of the 15.814 hectares of land on which its campus at Alanvale in Launceston was situated during the prior year
127 TAFE

• Property, plant and equipment increased by $10.459m due to capital additions and transfers from work in progress (WIP) of $8.802m and revaluation increments of $13.162m, offset by capital disposals of $7.147m and depreciation expense of $4.358m
• Other assets increased by $1.369m or 480% due primarily to prepaid expenses having increased by $1.392m. This was due to the requirement to pay in advance for a number of annual expenses relating to the 2009 calendar year
• Provisions increased by $1.550m or 11% due primarily to wage and salary indexation, higher staff numbers and a reduction in the discount rates at 31 December 2008, which increased the present value of the non-current portion of the long service leave and superannuation provisions
• Payables decreased by $0.911m or 33% due primarily to the net GST payable to the ATO having reduced by $0.491m and timing differences in relation to payables.
CASH POSITION
6 Months 12 months31-Dec-08 30-Jun-08
$’000s $’000s
Government grants 51 220 82 589 Receipts from customers 14 450 27 768 Interest received 595 686 Payments to suppliers and employees ( 67 612) ( 112 322)Cash (used in) operations ( 1 347) ( 1 279)
Receipts from government - capital 2 520 4 730 Payments for property, plant and equipment ( 3 286) ( 4 222)Income in advance from sale of assets 0 650 Proceeds from sale of property, plant and equipment 117 607Cash from (used in) investing activities ( 649) 1 765
Net increase (decrease) in cash ( 1 996) 486
Cash at the beginning of the year 7 814 7 328 Cash at end of the year 5 818 7 814
Comment
Cash position decreased by $1.996m due to:
• operating cash payments exceeding operating cash receipts by $1.347m. This is consistent with the operating performance reported in the Income Statement section of this Chapter.
• net investments in Property, plant and equipment of $0.649m.
Reasons for other movements are consistent with explanations provided in the Income Statement and Balance Sheet section of this Chapter.
Payments for property, plant and equipment in the six month period to 31 December 2008 primarily represented spending on replacement of aging IT infrastructure.
Income in advance from sale of assets in the prior year related to funds received in advance for assets held for sale, previously mentioned.
128 TAFE

FINANCIAL ANALYSIS
Bench 6 Months 12 monthsMark 31-Dec-08 30-Jun-08
Financial Performance
Result from operations ($’000s) ( 7 469) ( 12 405)Operating margin >1.0 0.91 0.89 Self fi nancing ratio ( 0.02) ( 0.01)Current ratio >1.0 1.56 1.72 Debt collection 30 days 60 76 Creditor turnover 30 days 17 30 Underlying result ratio % ( 12.6%) ( 12.3%)Indebtness ratio 73.5% 56.7%Own source revenue ($’000s) 7 913 18 288
Other Information
Self-suffi ciency % 12 16 Government funding % 92 92 Staff numbers (FTEs)* - total 1 109 1 077Admin and teaching support (FTEs)* 512 575Delivery (FTEs)* (teaching) 597 501Average staff costs ($’000s) 81 74Average leave balance per FTE ($’000s) 12 12Student enrolments at 31 December 36 000 36 569
* Excludes casual staff
Comment
Results from operations shows a defi cit for both periods for the reasons explained earlier in this Chapter.
TAFE’s working capital remained above the benchmark of one in both years.
The calculation of the Debt collection days was adjusted to refl ect a full year’s operation. Debt collection days were above the benchmark due to an increase in student activity, in particular debtors within the 60 to 90 days category. The decrease in the current period was due to a lower receivables balance as previously mentioned.
Creditor turnover decreased due to lower Payables at period end and increased expenditure during the period.
Indebtedness ratio is the ratio improved due to own source revenue decreasing from 18% to 13% in the current period.
The negative result in the Underlying result ratio refl ects the defi cits incurred by TAFE mainly due to the depreciation charge not being fully funded.
Staff numbers increased due to an increase in student activity and a greater demand for training courses, this also had an impact on the average staff costs.
129 TAFE

APPENDIX 1 – GUIDE TO USING THIS REPORT
This Report is prepared under Section 57 (1) of the Financial Management and Audit Act 1990, which requires the Auditor-General, on or before 31 December in each year to report to Parliament in writing on the audit of Government departments and public bodies in respect of the preceding fi nancial year. The issue of more than one report now satisfi es this requirement each year.
During the 2008 calendar year two reports were tabled:
• Report No. 1 of 2008 tabled on 19 June 2008 – this Report dealt with June 2007 fi nancial statement audits incomplete at the time of tabling the November 2007 report, and fi nancial statement audits with 31 December 2007 balance dates
• Report No. 2 of 2008 tabled on 18 November 2008 – this Report dealt with those audits of fi nancial statements of entities with a 30 June 2008 fi nancial year-end completed on 31 October 2008.
This Report now covers the 30 June 2008 audits of the fi nancial statements of Local
Government Authorities not completed at 31 October 2008 and Other Public Bodies incomplete at the time of the 18 November 2008 Report and the audits of entities with a 31 December 2008 balance date.
Where relevant, entities are provided with the opportunity to comment on any of the matters reported. Where they choose to do so, entity responses are detailed within that particular section.
FORMAT OF THE FINANCIAL ANALYSIS
Each entity’s fi nancial performance is analysed by discussing the Income Statement, Balance Sheet and Cash Flow Statement (noted as Cash Position), supplemented by fi nancial analysis applying the indicators documented in the Financial Analysis section of this Report. The layout of some of these primary statements has been amended from the audited statements to, where appropriate:
• make the statements more relevant to the nature of the entity’s business
• highlight the entity’s net working capital, which is a useful measure of liquidity.
STATUS OF AUDITS
All audits for the year ended 30 June 2008 have been completed. All audits with a 31 December 2008 have been completed and are included in this Report.
Appendix 2 provides details of the status of all audits that remained out standing in my November 2008 Report.
FINANCIAL ANALYSIS
The following tables illustrate the methods of calculating:
• performance indicators used in the individual fi nancial analysis sections of this Report, together with a number of benchmarks used to measure fi nancial performance
• additional performance indicators used in the local government comparative analysis.
130 Appendix 1 – Guide to using this Report

Financial PerformanceIndicator Benchmark1 Method of Calculation
Financial PerformanceResult from operations ($’000s) Operating Revenue less Operating ExpensesEarnings Before Interest and
Tax (EBIT) ($’000s)Result from Operating Activities before
Gross Interest Expense and before taxEarnings Before Interest, Tax,
Depreciation and Amortisation (EBITDA) ($’000s)
Result from Ordinary Activities before Tax, before Gross Interest Expense, Depreciation and Amortisation
Operating margin >1.0 Operating Revenue divided by Operating Expenses
Return on assets EBIT divided by Average Total AssetsReturn on equity Result from Ordinary Activities after
Taxation divided by Average Total EquityReturn on investments 5.5% Net Investment income divided by Average
Investments
Financial ManagementDebt to equity Debt divided by Total EquityDebt to total assets Debt divided by Total AssetsInterest cover – EBIT >3 EBIT divided by Gross Interest ExpenseInterest cover – Funds from
Operations>3 Cash from Operations plus Gross Interest
Expense divided by Gross Interest ExpenseCurrent ratio >1 Current Assets divided by Current LiabilitiesLeverage ratio Total Assets divide by Shareholders’ EquityCost of debt 7.5% Gross Interest Expense divided by Average
Borrowings (include fi nance leases)Debt service ratio Borrowing costs plus Repaid borrowings
divided by Operating revenueDebt collection 30 days Receivables divided by billable Revenue
multiplied by 365Creditor turnover 30 days Payables divided by credit purchases
multiplied by 365Capital expenditure/
depreciation100% Payments for Property, plant and equipment
divided by Depreciation expensesCapital expenditure on existing
assets/depreciation *Payments for Property, plant and equipment
on existing assets divided by Depreciation expenses
Returns to GovernmentDividends paid or payable
($’000s)Dividends paid or payable that relate to the
year subject to analysisDividend payout ratio 50% Dividend divided by Result from Ordinary
Activities after TaxDividend to equity ratio Dividend paid or payable divided by Average
Total EquityIncome tax paid or payable
($’000s)Income Tax paid or payable that relates to the
year subject to analysisEffective tax rate 30% Income Tax paid or payable divided by Result
form Ordinary Activities before TaxTotal return to the State
($’000s)Dividends plus Income Tax and Loan
Guarantee feesTotal return to equity ratio Total Return divided by Average Equity
131 Appendix 1 – Guide to using this Report

Financial PerformanceIndicator Benchmark1 Method of CalculationOther InformationEmployee costs (2) as a % of
operating system*Total employee costs divided by Total
Operating ExpensesEmployee costs expensed
($’000s) *Total employee costs per Income Statement
Employee costs capitalised ($’000s) *
Capitalised employee costs
Staff numbers FTEs Effective full time equivalentsAverage staff costs (2) ($’000s) Total employee expenses (including
capitalised employee costs) divided by Staff Numbers
Average leave per FTE ($’000s) Total employee annual and long service leave entitlements divided by Staff Numbers
LOCAL GOVERNMENT ANALYSIS
Financial PerformanceIndicator Benchmark1* Method of CalculationUnderlying Result Ratio
Self Financing Ratio Net Operating Cash Flows divided by Operating Revenue
Council’s Own Revenue Total Revenue less Total Grant Revenue, Contributed Assets and Asset Revaluation Adjustments
Indebtedness Ratio Non Current Liabilities divided by Own Source Revenue
* Relevant to local government authorities.1 Benchmarks vary depending on the nature of the business being analysed. For the purposes of this Report, a single generic
benchmark has been applied.
2 Employee costs include capitalised employee costs, where applicable, plus oncosts.
An explanation of the performance indicators is provided below:
• Result from operations – summarises revenue transactions and expense transactions incurred in the same period of time and calculates the difference
• Earnings before income tax (EBIT) – measures how well an entity can earn a profi t, regardless of how it is fi nanced (debt or equity) and before it has to meet external obligations such as income tax. This is a measure of how well it goes about its core business
• Earnings before income tax, depreciation and amortisation (EBITDA) – measures how well an entity can generate funds without the effects of fi nancing (debt or equity), depreciation and amortisation and before it has to meet external obligations such as income tax. This measure is of particular relevance in cases of entities with large amounts of non-current assets as the distortionary accounting and fi nancing effects on the entity’s earnings are removed, enabling comparisons to be made across different entities and sectors
• Operating margin – this ratio serves as an overall measure of operating effectiveness
• Return on assets – measures how effi ciently management used assets to earn profi t. If assets are used effi ciently, they earn profi t for the entity. The harder the assets work at generating revenues, and thus profi t, the better the potential return for the owners
132 Appendix 1 – Guide to using this Report

• Return on equity – measures the return the entity has made for the shareholders on their investment
• Return on investments – measures how effective management have been in earning interest income from available investment assets
• Debt to equity – an indicator of the risk of the entity’s capital structure in terms of the amount sourced from borrowings and the amount from Government
• Debt to total assets – an indicator of the proportion of assets that are fi nanced through borrowings
• Interest cover – EBIT – an indicator of the ability to meet periodic interest payments from current profi t (before interest expense). The level of interest cover gives a guide of how much room there is for interest payments to be maintained in the face of interest rate increases or reduced profi tability
• Interest cover – Funds from operations – examines the exposure or risk in relation to debt, an indicator of the ability to meet periodic interest payments from funds from operations (before interest expense). The level of interest cover gives a guide of how much room there is for interest payments to be maintained in the face of interest rate increases or reduced funds from operations
• Current ratio – current assets should exceed current liabilities by a ‘considerable’ margin. It is a measure of liquidity that shows an entity’s ability to pay its short term debts
• Leverage ratio – measures the proportion of equity funding in the asset base
• Cost of debt – refl ects the average interest rate applicable to debt
• Debt service ratio – indicates the capacity of the entity to service debt by repaying principal as well as interest on borrowings
• Debt collection – indicates how effectively the entity uses debt collection practices to ensure timely receipt of monies owed by its customers
• Creditors turnover – indicates how extensively the entity utilises credit extended by suppliers
• Capital expenditure/depreciation – indicates whether the entity is maintaining its physical capital by reinvesting in or renewing non-current assets (caution should be exercised when interpreting this ratio for entities with signifi cant asset balances at cost as the level of depreciation may be insuffi cient)
• Dividends paid or payable – payment by the entity to its shareholders (whether paid or declared as a payable)
• Dividend payout ratio – the amount of dividends relative to the entity’s net income
• Dividend to equity – the relative size an entity’s dividend payments to shareholders’ equity. A low dividend to equity ratio may indicate that profi ts are being retained by the entity to fund capital expenditure
• Income tax paid or payable – tax payments (paid or payable) by the entity to the State
• Effective tax rate – is the actual rate of tax paid on profi ts
• Total return to the State – is the funds paid to the Owners consisting of income tax, dividends and guarantee fees
• Total return to equity ratio – measures the Government’s return on its investment in the entity
133 Appendix 1 – Guide to using this Report

• Employee costs as a percentage of operating expenses indicates the relative signifi cance of employee costs compared to other operating expenses
• Staff numbers FTEs – as at the end of the reporting period the number of staff employed expressed as full-time equivalents (FTEs)
• Average staff costs – measures the average cost of employing staff in the entity for the year
• Average leave balance per FTE ($’000s) – indicates the extent of unused leave at balance date
• Underlying results ratio - this ratio provides a measure of the strength of the operating result. The higher the ratio, the stronger the result. Negative results indicate an operating defi cit , that can not be sustained in the longer term
• Self fi nancing ratio – this is a measure of council’s ability to fund the replacement of assets from cash generated from operations
• Council’s own revenue – represents revenue generated by a council’ through its own operations. It excludes any external government funding, contributed assets and revaluation adjustments
• Indebtedness ratio – compliments the liquidity ratio and illustrates a council’s ability to meet longer term commitments.
* Michael Gibbins, Financial accounting; an integrated approach (Nelson College Indigenous, 2006, page 696).
The above indicators are used because they are commonly applied to the evaluation of fi nancial performance. Care should be taken in interpreting these measures, as by defi nition they are only indicators, and they should not be read in isolation.
The Capital expenditure on existing assets/depreciation ratio used for councils should be treated with some caution as the amount of capital expenditure on existing assets has largely been provided by the respective councils and not subject to audit.
134 Appendix 1 – Guide to using this Report

APPENDIX 2 – ENGAGEMENT LETTER
PresidentLegislative CouncilHobart
SpeakerHouse of AssemblyHobart
Dear PresidentDear Speaker
In my June 2006 Report No 1 I included as an appendix an engagement letter between myself and the Parliament. The commencement of the Audit Act 2008 (the Audit Act) on 1 March 2009 requires me to update that engagement letter which is the purpose for this appendix.
This engagement letter details the approach that I will follow in the conduct of audits required to be performed by me under the Audit Act. As noted in my June 2006 Report, it is not a requirement that I detail this information but I regard it as good practice to do so and it should provide the President, the Speaker and Members of the Legislative Council and the House of Assembly with an understanding on how audit work is conducted by my Offi ce. This letter also details my responses to other provisions in the Audit Act. In addition to preparing this engagement letter, on 2 March 2009 I wrote to all State entities advising them of the implications of the Audit Act as it impacts them.
Our Purpose
My Offi ce has determined its ‘purpose’ as being:
“To provide independent assurance to the Parliament and Community on the performance and accountability of the Tasmanian Public Sector.”
In so doing, we aim to Strive, Lead and Excel: To Make a Difference. We strive to achieve our purpose by conducting, in accordance with Australian Auditing Standards, four categories of audit work: fi nancial attest, performance and compliance audits and investigations.
Financial Statement (or attest) Audits
An attest audit is one where an auditor reports on assertions prepared by an accountable authority on a set of fi nancial statements. For example, an accountable authority would assert that fi nancial statements were prepared in accordance with Australian Accounting standards and relevant legislation. The auditor attests to the assertion made.
My fi nancial statement audits are conducted in accordance with the provisions of the Audit Act and other relevant Tasmanian legislation with the objective of auditing the Whole of Government Financial Report, the General Government Financial Report, the Public Account Statements, and the annual fi nancial statements of all State entities. The Audit Act defi nes a “State entity” as being an agency, council, Government Business Enterprise, State-owned Company, State Authority, Corporations established by the Water and Sewerage Corporations Act 2008 and the governing body of any corporation, body of persons or institution that are appointed by a Minister or by the Governor.
135 Appendix 2 – Engagement Letter

Financial reporting arrangements
The Audit Act requires accountable authorities to submit fi nancial statements for their State entity to me as soon as possible and within 45 days of the end of the fi nancial year and that the fi nancial statements be “complete in all material respects”. This section also provides for me to determine whether the fi nancial statements submitted are complete in all material respects. I have determined that “complete in all material respects” means that the fi nancial statements must:
1. Be signed by the accountable authority at the time they are submitted.
2. Comply with relevant legislative requirements governing the State entity being audited.
3. Comply with Australian Accounting Standards. In the case of government departments, compliance with the Department of Treasury and Finance’s model fi nancial statements will satisfy this requirement.
Where a State entity, for example a subsidiary of a State-owned Company, wishes to prepare a special purpose fi nancial report, this will be acceptable subject to appropriate disclosures in the report and the lack of users of the fi nancial report who cannot demand information normally made available in a general purpose fi nancial report.
However, I note the Audit Act provides for transitional arrangements for those State entities not currently required to submit statements within 45 days. These State entities will not be bound by the 45 day submission requirement until the fi nancial year commencing after 30 June 2010. In the main these transitional arrangements apply to Local Government Councils and any joint authorities or companies established by them, State-owned companies, the University of Tasmania and some Statutory Authorities.
Financial auditing arrangements
Having carried out an audit of the fi nancial statements of a State entity I am required to prepare and sign an opinion based on that audit and provide it to the State entity’s responsible Minister with a copy to the relevant accountable authority. Where the Australian Auditing and Assurance Standards also require the preparation of a formal communication of audit fi ndings (such as a Management Letter), a copy of that communication is to accompany the opinion.
I am required to fi nalise my audit opinions within 45 days of receiving the fi nancial statements from the accountable authority. This 45 day period commences if I am satisfi ed that the fi nancial statements submitted are “complete in all material respects”.
There are two new requirements here:
• Firstly, I will now be forwarding my signed audit opinion to the responsible Minister as well as, which I do currently, to the accountable authority and I will also forward to this Minister my management letter. Where there is an interim management letter, this will also be forwarded to the Minister as well as to the accountable authority.
• Secondly, the timeframes for me to complete my audits of fi nancial statements has been brought forward such that, for State entities with a 30 June balance date, from 30 June 2011, every fi nancial statement audit of every State entity must be completed by 30 September. Due to the transitional arrangements already referred to, for 30 June 2009, this will only impact those State entities that are currently required to submit fi nancial statements to my Offi ce within 45 days of balance date (mainly government departments, Government Business Enterprises and some Statutory Authorities).
Compliance with auditing standards
The Audit Act requires that, that in the conduct of fi nancial statement audits, I do so in accordance with Australian Auditing Standards. As a result, my audit opinion on every set of fi nancial statements will make clear, within the scope and opinion sections, the following:
136 Appendix 2 – Engagement Letter

1. The scope of my audit and of my opinion – which will specify the:
• fi nancial period covered
• components of the statements being audited
• fact that it is management’s, or if there is a board of directors, the directors’, responsibility to prepare the fi nancial statements being audited. I will also note that, for for-profi t entities, it is the responsibility of the directors to confi rm that the fi nancial statements comply with International Financial Reporting Standards where such standards have in fact been complied with
• fact that I have conducted an independent audit of the fi nancial statements with the purpose of expressing an opinion thereon to the Parliament, Shareholders, Council, Board or Public Body that may be nominated in relevant legislation
• fact that I am independent of the entity whose fi nancial statements are being audited.
I will also note that my independent opinion is based on the facts that:
• my audit was conducted in accordance with Australian Auditing Standards
• the audit procedures conducted were designed to:
o provide me with reasonable assurance that the fi nancial statements are free of material misstatement
o examine, on a test basis, evidence supporting the amounts and other disclosures in the fi nancial statements
o evaluate accounting policies and signifi cant accounting estimates
o enable me to form an opinion whether, in all material respects, the fi nancial statements are presented fairly, in all material respects, in accordance with Australian Accounting Standards and the requirements of the relevant legislation (normally the Financial Management Act 1990) and
o enable me to form an opinion whether the fi nancial statements present a view which is consistent with my understanding of the entity’s fi nancial position, fi nancial performance, changes in equity and its cash fl ows.
2. Opinion – I shall report in accordance with Australian Auditing Standard 700 The Auditor’s Report on a General Purpose Financial Report whether or not the fi nancial statements present fairly, in all material respects:
• the entity’s fi nancial position at a point in time and
• its fi nancial performance, changes in equity and cash fl ows for the specifi ed period for which the fi nancial statements were prepared in accordance with Australian Accounting Standards and in compliance with the requirements of the relevant legislation.
It will be clear whether or not my opinion is qualifi ed or unqualifi ed. In addition, the following will also be clear:
• to whom my opinion is addressed
• the particular fi nancial statements encompassed by my opinion and
• the date of my opinion.
If during the course of fi nancial statement audits any of the following are detected:
137 Appendix 2 – Engagement Letter

• material aspects of non-compliance with Australian Accounting Standards and fi nancial irregularity (including internal control weaknesses); or
• any other specifi c matters required to be addressed by the Audit Act and other relevant legislation,
these matters will be reported, as appropriate, to the management or those charged with governance of the entity, the relevant Minister and, where signifi cant, to both houses of Parliament. However, my audit procedures are not specifi cally designed to identify matters such as these.
In conducting audits of fi nancial statements, my Offi ce applies an integrated public sector audit methodology called IPSAM. This methodology complies with all Australian Auditing Standards. In addition, it includes audit procedures relating to the appropriateness of use of public resources that are not required by the standards but which I consider important in a public sector context. Where relevant, these procedures examine probity, propriety and compliance matters.
The Audit Act requires that my Reports to Parliament on the outcomes from fi nancial statement audit work conducted include particulars of any major change of approach made by me in relation to the extent or character of the audit function which I will do when any change occurs.
Inherent Limitations of any fi nancial statement audit
Because of the test nature and other inherent limitations of an audit, together with the inherent limitations of any system of internal control, there is an unavoidable risk that even some material misstatements; fraud or irregularity may remain undiscovered.
Acquittances
The Audit Act authorises me to audit acquittance statements. These are normally prepared by State entities under agreements with the Commonwealth where they are required to prepare fi nancial reports acquitting funding received and how it was spent. Another example is audits of acquittances prepared Australian Financial Services licenses. Such audits are completed in accordance with the appropriate Australian Auditing or Assurance Standards.
Performance audits, compliance audits and investigations
The Audit Act gives me the authority to conduct performance audits, compliance audits and investigations.
Such audits are normally “Direct Reporting Engagement”. In the case of a performance audit, this means an engagement where the auditor directly undertakes the evaluation or measurement of an activity to report on the economy, effi ciency or effectiveness of that activity.
In the case of a compliance audit, this means an engagement where the auditor directly evaluates an entity’s compliance with requirements as measured by the suitable criteria and expresses a conclusion to the intended users in a compliance report.
In the case of an investigation, the nature of the engagement will determine whether or not it is an assertion based engagement or a direct reporting engagement.
Performance Audits
A performance audit examines the economy, effi ciency or effectiveness of a State entity, a number of State entities, a part of a State entity or a subsidiary of a State entity. These audits extend beyond the examination of the fi nancial affairs and transactions of an entity to encompass issues considered of signifi cance to the Parliament.
Note also that my Offi ce may carry out an examination or investigation examining the effi ciency, effectiveness and economy within which a related entity of a State entity performs functions on
138 Appendix 2 – Engagement Letter

behalf of the State entity in partnership, or jointly with the State entity; or as a delegate or agent of the State entity.
Performance audits are conducted in accordance with Australian Standard on Assurance Engagements ASAE 3500 Performance Engagements.
Compliance Audits
Compliance audits examine the compliance of a State entity, or a subsidiary of a State entity, with written laws or its own internal policies. The process normally involves testing a representative sample of compliance matters across public sector entities and our recommendations often highlight solutions that can be applied across the public sector.
Compliance audits are conducted in accordance with Australian Standard on Assurance Engagements ASAE 3100 Compliance Engagements.
Other investigations or audits
The Audit Act also provides the authority for me to:
• examine the accounting and fi nancial management information systems of the Treasurer, a State entity or a subsidiary of a State entity to determine their effectiveness in achieving or monitoring program results
• investigate any matter relating to the accounts of the Treasurer, a State entity or a subsidiary of a State entity and
• investigate any matter relating to public money or other money, or to public property or other property.
This includes the ability of my Offi ce to, what I refer to as, “follow the dollar”, i.e., my Offi ce is able to investigate State entities or private sector entities relating to the expenditure of public money, other money or to the management of public property or other property.
I may also carry out any audit that the Treasurer requests me to carry out and, where a grant or advance of money is made by the Government to a person for a specifi c purpose, the Treasurer may request me to audit the accounts of that person to ascertain whether the money granted or advanced was expended in accordance with the purposes of the grant or advance.
These audits or investigations will be conducted in accordance with which ever Australian auditing or assurance standard is relevant to the particular assignment.
Conducting audits
The Audit Act establishes authority for me to employ staff in the Tasmanian Audit Offi ce and for me to engage other suitable persons to carry out the whole or a part of an audit or investigation. In most cases my Offi ce conducts audits although contractors perform some audits, or parts of audits.
For each performance audit I establish an advisory committee to assist me and my staff in performing the particular project. Members of the advisory committee are drawn from my staff, entity representatives and independent experts in the matter being audited.
Reporting to the Parliament
Audits of fi nancial statements
The Audit Act requires me to report annually to the Parliament on the outcomes of fi nancial statement audits completed. It is my current practice to report twice per annum, in May/June and in November. These reports will also include, where I consider a matter of suffi cient importance
139 Appendix 2 – Engagement Letter

to have attention drawn to it, any case in which the functions of an accountable authority were not adequately and properly performed.
In addition to commenting on matters identifi ed and recommendations arising from audits, I plan to continue the practice of providing independent analysis of entity performance, primarily of fi nancial performance, in these reports to the Parliament.
I must, in writing, notify the Treasurer and any Minister responsible for the activity to which the report relates, of my intention to submit the report to Parliament, at least 5 days before the report is to be submitted.
It is my practice to include in its entirety, or in an agreed summary form, any comments provided by the Secretary, Mayor or Chief Executive Offi cer of a State entity on the report when still in draft form.
The Audit Act requires that I describe the basis on which audit fees charged for conducting audits of fi nancial statements are calculated. This will be done annually.
The Audit Act permits me to table a report when Parliament is not sitting. It is my intention to try to always report when at least one of the two houses is sitting.
Performance and Compliance Audits and Investigations (examinations)
Under the Audit Act I may prepare and sign a report on an examination carried out. It will only be in exceptional circumstances where I conduct an examination and then not publicly report the outcome. Having completed an examination, I may submit the resulting report to both Houses of Parliament or to the Public Accounts Committee. It will normally be my practice to report to both Houses of Parliament.
Before signing a report proposed to be tabled, I must –
• give a summary of fi ndings to the Treasurer, accountable authority or related entity of a State entity, as the case may require, and any other person who, in my opinion, has a special interest in the report and
• by written notice, invite the Treasurer, accountable authority or related entity of a State entity or that other person, as the case may require, to make submissions or comments on the content of the summary of fi ndings before a specifi ed day, being a day not less than 3 working days after the summary of fi ndings is given to the Treasurer, accountable authority, related entity of a State entity or person.
In addition, I must include in the report any submissions or comments made before the specifi ed day, or a fair summary of them.
The Audit Act permits me to table a report when Parliament is not sitting. It is my intention to try to always report when at least one of the two houses is sitting.
Commenting on Government Policy
It is a convention of my Offi ce that I will not comment on Government policy in reports to Parliament nor in any other manner. However, circumstances may arise where an audit examines and comments on the application of, or the outcomes of, Government policy.
140 Appendix 2 – Engagement Letter

Adding Value
I will also seek to maximise the value to the State entity, the Government and the Parliament of all audit work including where appropriate the framing of recommendations to address:
• improvements in the framework of accountability including internal controls
• opportunities for cost savings and effi ciency gains and
• recognition of good practice in use by State entities.
Power to dispense with audits of certain public bodies
In consultation with the Treasurer, I may dispense with all, or any part of, the audit of the fi nancial statements of a particular State entity or of State entities included in a category or class specifi ed by me. I can only do so if I consider that it is appropriate in the circumstances. Such dispensation of an audit may be in respect of a particular fi nancial year and subject to any conditions determined by me. The decision to dispense with an audit is only made where I am satisfi ed that existing fi nancial reporting arrangements are satisfactory and that the alternative auditing arrangements are appropriate.
I am required to detail in a report to Parliament those State entities or categories of State entities the audits of which I have dispensed with.
Independence
Professional independence is a concept fundamental to the conduct of an audit requiring me to approach my work with integrity and objectivity. I must both be, and be seen to be, free of any interest that is incompatible with objectivity. It is essential therefore that I be independent of the State entities being audited and free of interest that could be incompatible with integrity and objectivity.
The independence of the Auditor-General is directly addressed in the Audit Act which authorises and requires me to act independently in relation to the performance of my functions. The Audit Act also provides that I am not subject to direction from anyone in relation to my audit functions, including any decision as to whether or not an audit is to be conducted, how an audit is to conducted or in relation to the content of any report arising from an audit.
Confi dentiality
The Audit Act places confi dentiality requirements on a person who is, or who has been: the Auditor General, a person employed in the Tasmanian Audit Offi ce, a person appointed to assist the Auditor General in a particular matter, an authorised person, the independent auditor of the Tasmanian Audit Offi ce or an auditor engaged to conduct a review of effi ciency and effectiveness of the Tasmanian Audit Offi ce.
It requires that these persons are to maintain confi dentiality with respect to all matters that come to their knowledge during the course of their employment or duties under the Audit Act or any other written law and that those persons must not communicate any of these matters to anyone except when required under the administration of the Audit Act or another written law or required under any proceedings of the Audit Act, other written Law or the Criminal Code.
However, this does not apply to the communication of information to the Public Accounts Committee, the House of Assembly or Legislative Council, or any other body established by the House of Assembly or Legislative Council to investigate the activities of one or more State entities or subsidiaries of State entities.
141 Appendix 2 – Engagement Letter

The Audit Act also provides that a person who receives a summary of audit fi ndings on an audit of a State entity must maintain confi dentiality regarding all matters within the summary and must not: communicate any of the information within the summary to anyone; copy or reproduce any of the information within the summary unless it is in connection with making submissions or comments to me or in connection with obtaining legal advice on those matters.
Annual work plan
The Audit Act requires me to consult with the Public Accounts Committee in relation to my annual work plan with the plan to ultimately be transmitted to the Speaker of the House of Assembly and to the President of the Legislative Council by no later than 30 June each fi nancial year.
The plan will include details of the fi nancial, performance and compliance audit work planned for the following 12 month period commencing 1 July. Once I know that the plan has been tabled, I will be placing the plan on my Offi ce’s website.
Relationship with the Public Accounts Committee
Section 6 of the Public Accounts Committee Act 1970 details the functions of the PAC as being:
1. The Committee must inquire into, consider and report to the Parliament on any matter referred to the Committee by either House relating to –
a) The management, administration or use of public sector fi nances; or
b) The accounts of any public authority or other organisation controlled by the State or in which the State has an interest.
2. The Committee may inquire into, consider and report to the Parliament on –
a) Any matter arising in connection with public sector fi nances that the Committee considers appropriate; and
b) Any matter referred to the Committee by the Auditor-General.
The PAC has objectives similar to those of my Offi ce as a result of which I meet with it from time to time to discuss its activities and projects, my reports, my planned projects, the operations of my Offi ce and related matters. This as a healthy relationship aimed at effective public sector management. The requirement in the Audit Act for me to consult with the PAC regarding my work plan reinforces this relationship.
I trust this “engagement letter” provides each Member of Parliament with information to assist them to understand my role and how audits are conducted. Members are encouraged to contact me or my Offi ce on 6226 0100 if further information is required.
Yours sincerely
H M BlakeAuditor-General19 May 2009
142 Appendix 2 – Engagement Letter

APPENDIX 3 – AUDIT STATUS
Financial statementsTimeliness of audit opinion issue from
balance date
Entity
Signed Financial Statements
Received Cle
ar o
pin
ion
issu
ed Audit opinion signed <
8 w
eeks
8 to
10
wee
ks
10 t
o 1
2 w
eeks
12 t
o 1
4 w
eeks
14 t
o 1
6 w
eeks
> 1
6 w
eeks
ALL AUDITS INCLUDED IN REPORT NO. 1 OF 2009
OTHER PUBLIC BODIES
Other Public Bodies
Nominal Insurer 18 December 2008 P 22 December 2008 •
Rivers and Water Supply Commission 15 August 2008 P 30 October 2008 •
LOCAL GOVERNMENT AUTHORITIES
City Councils
Clarence City Council 26 September 2008 P 4 November 2008 •
Glenorchy City Council 26 September 2008 P 26 September 2008 •
Hobart City Council 10 September 2008 P 16 October 2008 •
Launceston City Council 30 September 2008 P 13 October 2008 •
Devonport City Council 26 October 2008 P 13 November 2008 •
Burnie City Council 29 September 2008 P 14 November 2008 •
Urban and Large Rural Councils
Central Coast Council 15 August 2008 P 9 September 2008 •
Circular Head Council 15 October 2008 P 27 March 2009 •
Huon Valley Council 30 September 2008 P 31 October 2008 •
Kingborough Council 25 August 2008 P 20 October 2008 •
Meander Valley Council 28 September 2008 P 17 November 2008 •
Waratah-Wynyard Council 2 September 2008 P 17 September 2008 •
West Tamar Council 19 August 2008 P 9 September 2008 •
Medium Rural Councils
Brighton Council 21 October 2008 P 26 November 2008 •
Derwent Valley Council 30 September 2008 P 21 November 2008 •
Dorset Council 8 September 2008 P 3 December 2008 •
George Town Council 20 October 2008 P 15 December 2008 •
Latrobe Council P 11 December 2008 •
Northern Midlands Council 21 October 2008 P 19 January 2009 •
Sorell Council 30 September 2008 P 23 December 2008 •
West Coast Council 30 September 2008 P 26 November 2008 •
Other Rural Councils
Break O’Day Council 29 September 2008 P 31 October 2008 •
Central Highlands Council 22 September 2008 P 26 November 2008 •
Flinders Council 19 November 2008 P 5 December 2008 •
Glamorgan-Spring Bay Council 29 September 2008 P 21 November 2008 •
Kentish Council 30 September 2008 P 13 November 2008 •
King Island Council 24 September 2008 P 14 November 2008 •
Southern Midlands Council 29 September 2008 P 7 November 2008 •
Tasman Council 29 September 2008 P 23 December 2008 • •
Local Government Business Units
Copping Refuse Disposal Site Joint Authority 4 November 2008 P 22 December 2008 •
Dulverton Regional Waste Management Authority 19 January 2009 P 19 January 2009 •
Local Government Water Authorities
Cradle Coast Water 8 September 2008 P 7 October 2008 •
Esk Water Authority 27 August 2008 P 11 September 2008 •
Hobart Regional Water Authority 18 September 2008 P 26 September 2008 •
Local Government Other
Local Government Association of Tasmania 1 September 2008 P 22 January 2009 •
ALL AUDITS - 31 DECEMBER 2008 BALANCE DATES
OTHER PUBLIC BODIES
Other Public Bodies
Theatre Royal Management Board 4 March 2009 P 5 March 2009 •
UTAS 13 February 2009 P 20 February 2009 •
143 Appendix 3 – Audit Status

APPENDIX 4 – ACRONYMS & ABBREVIATIONS
AARC Affected Area Recovery Committee
AASB Australian Accounting Standards Board
AAV Assessed Annual Valuation
AIFRS Australian Equivlents to International Financial Reporting Standards
AMC Australian Maritime College
ATO Australian Tax Offi ce
AUD Australian Dollar
AVO Australian Valuation Offi ce
BAC Burnie Airport Corporation
BSE Burnie Sports and Events
CCW Cradle Coast Water
CDO Collateralised Debt Obligation
CGU CGU Insurance Limited
CPI Consumer Price Index
CRRG Community Recovery Reference Group
DEEWR Department of Education, Employment and Workplace Relations
DHHS Department of Health and Human Services
DPAC Department of Premier and Cabinet
DPIW Department of Primary Industries and Water
DPIWE Department of Primary Industries, Water and Environment
DP&EMP Development Proposal and Environmental Management Plan
DRWMA Dulverton Regional Waste Management Authority
EBA Enterprise Bargaining Agreement
EBIT Earnings Before Interest and Tax
EBITDA Earnings Before Interest, Tax, Depreciation and Amortisation
EMPHC Esperance Multi Purpose Health Centre
ESK Esk Water Authority
FMAA Financial Management and Audit Act 1990
FTE Full Time Equivalents
GBE Government Business Enterprise
GMC General Management Committee
GPOC Government Prices Oversight Commission
GST Goods and Services Tax
HECS Higher Education Contribution Scheme
HIH HIH Insurance Ltd
ICN Integrated Community Network
ISDN Integrated Services Digital Network
IT Information Technology
LGAT Local Government Association of Tasmania
MPS Tasman Multipurpose Service
PPE Property, Plant and Equipment
SOC State Owned Company
TFS Tasmania Fire Service
TNI The Nominal Insurer
UTIL UTAS Innovation Ltd
WIP Work in Progress
144 Appendix 4 – List of Acronyms and Abbreviations

APPENDIX 5 – RECENT REPORTS
YEAR REPORT TITLE
2009 Special Report No. 78 Management of threatened species2008 Special Report No. 77 Food safety: safe as eggs?
2008Report of the Auditor-General No. 2 of 2008 - Government Departments and
Public Bodies 2007-20082008 Special Report No. 76 Complaint handling in local government
2008Report of the Auditor-General Report No. 1 of 2008 - Local Government
Authorities, Superannuation Funds and Other Public Bodies 2006-20072008 Special Report No. 75 Executive termination payments2008 Special Report No. 74 Follow-up audits2008 Special Report No. 73 Timeliness in the Magistrates Court2008 Special Report No. 72 Public sector performance information
Auditor-General’s reports are available from the Tasmanian Audit Offi ce. These and other published reports can be accessed via the Offi ce’s homepage. http://www.audit.tas.gov.au
145 Appendix 5 – Recent Reports

AAcronyms And Abbreviations, V1-144
Amc Search Ltd (Amc Search), V1-117
Annual Working Paper Awards, V1-19
Audits Dispensed With, V1-24
Audit Fee Scales, V1-22
Audit Findings, V1-13
Audit Status, V1-143
BBasis For Setting Audit Fees, V1-20
Break O’day Council, V1-10, V1-17, V2-177
Brighton Council, V1-9, V1-10, V1-17, V2-114
Burnie City Council, V1-9, V1-17, V2-4
CCentral Coast Council, V1-8, V1-9, V1-17, V1-19, V2-57
Central Highlands Council, V1-8, V1-9, V1-16, V1-17, V2-188
Circular Head Council, V1-7, V1-10, V1-17, V2-66
City Councils, V2-4
Clarence City Council, V1-9, V1-17, V2-14
Copping Refuse Disposal Site Joint Authority, V1-16, V1-39
Cradle Coast Water, V1-16, V1-61
DDerwent Valey Council, V1-8, V1-9, V1-17, V2-122
Devonport City Council, V1-8, V1-9, V1-17, V2-22
Dorset Council, V1-7, V1-8, V1-9, V1-17, V2-129
Drainage Trusts, V1-24
Dulverton Regional Waste Management Authority, V1-16, V1-45
EEngagement Letter, V1-6, V1-135
Ensuring Fair Values Remain Current, V1-10
Esk Water Authority, V1-9, V1-16, V1-69
FFlinders Council, V1-8, V1-9, V1-17, V2-195
Foreword, V1-4
Format Of The Financial Analysis, V1-130
Format Of The Report, V1-6
GGeorge Town Council, V1-9, V1-17, V2-137
Glamorgan Spring Bay Council, V1-8, V1-17, V2-201
Glenorchy City Council, V1-8, V1-9, V1-17, V2-31
Guide To Using This Report, V1-130
HHobart City Council, V1-8, V1-9, V1-17, V1-19, V2-39
Hobart Regional Water Authority, V1-16, V1-77
Huon Valley Council, V1-7, V1-8, V1-10, V1-17, V2-75
IIntroduction, V1-6
Issue By CaTegory, V1-14
INDEX
146 Index

KKentish Council, V1-8, V1-9, V1-17, V2-209
Kingborough Council, V1-9, V1-17, V2-82
King Island Council, V1-17, V2-218
LLaunceston City Council, V1-9, V1-17, V2-47
Larger Urban/Rural Councils, V2-57
Latrobe Council, V1-9, V1-17, V2-145
Local Government Association Of Tasmania, V1-15, V1-87
Local Government Business Units, V1-39
Local Government Comparative Analysis, V1-8, V1-27
Local Government Councils, V1-15, V1-16
Local Government Joint Authorities, V1-15, V1-16
Local Government Rating, V1-25
Local Government Water Authorities, V1-53
MMaintenance Of Infrastructure Assets In Local Government Authorities, V1-9
Matters Arising From Current Audits, V1-8
Matters Identifi ed In Previous Reports, V1-7
Matters Raised With Management, V1-13
Matters Of Signifi cance And Follow-Up Of Matters Previously Reported, V1-7
Meander Valley Council, V1-7, V1-8, V1-9, V1-17, V2-90
Medium Rural Councils, V2-114
Metro Tasmania, V1-19
Motor Accidents Insurance Board, V1-19
NNominal Insurer (The), V1-15, V1-103
Northern Midlands Council, V1-8, V1-17, V2-152
OOther State Entities Reporting At 31 December 2008, V1-108
Other State Entities Reporting At 30 June 2008, V1-15, V1-87
PPremier And Cabinet (Department Of ), V1-19
Primary Industries And Water (Department Of ), V1-19
RRecent Reports, V1-145
Recurring Defi cits In Local Government Authorities, V1-8
Registration Boards, V1-24
Rivers And Water Supply Commission, V1-15, V1-95
SSmaller Rural Councils, V2-177
Sorell Council, V1-8, V1-9, V1-10, V1-17, V2-161
Southern Ice Porcelain Pty Ltd, V1-117
Southern Midlands Council, V1-8, V1-9, V1-17, V2-226
State Entities Reporting At 30 June 2008, V1-15
State Entities Reporting At 31 December 2008, V1-16
Status Of Audits, V1-130
Statutory Financial Reporting Requirements, V1-15
Steps Taken By Audit To Facilitate Earlier Financial Reporting, V1-18
147 Index

TTafe Tasmania, V1-16, V1-19, V1-124
Tasman Council, V1-17, V2-235
Theatre Royal Management Board, V1-16, V1-118
Timeliness And Quality Of Financial StatemeNts, V1-15
UUniversity Of Tasmania, V1-16, V1-108
University Of Tasmania Foundation Inc (The Foundation), V1-117
Utas Innovation Ltd (Util), V1-117
Us Sub-Prime Market Downturn, V1-10
VValuation Of Long-Lived Property, Plant And Equipment, V1-7
WWarratah-Wynyard Council, V1-9, V1-17, V2-98
Water And Sewerage Reform, V1-53
West Coast Council, V1-9, V1-10, V1-17, V2-169
West Tamar Council, V1-17, V1-19, V2-106
148 Index

Our Vision
STRIVE | LEAD | EXCEL | TO MAKE A DIFFERENCE
Our Purpose
To provide independent assurance to the Parliament and Community on the performance and accountability of the Tasmanian Public sector
Availability of reports
Auditor-General’s reports are available from the Tasmanian Audit Offi ce, HOBART. This report and other recent reports published by the Offi ce can be accessed via the Offi ce’s home page. For further information please contact:
Tasmanian Audit Offi ceGPO Box 851HobartTASMANIA 7001
Phone: (03) 6226 0100, Fax (03) 6226 0199Email: [email protected] Page: http://www.audit.tas.gov.au
This report is printed on recycled paper.
Cover picture: Hobart City Council by Sean ReardonBack cover picture: Glenorchy City Council by Sean Reardon
© Crown in Right of the State of Tasmania May 2009
149 Visions & Values

AUDIT MANDATE AND STANDARDS APPLIED
MANDATE
Section 17(1) of the Audit Act 2008 states that “… An accountable authority other than the Auditor-General, as soon as possible and within 45 days after the end of each financial year, is to prepare and forward to the Auditor-General a copy of the financial statements for that financial year which are complete in all material respects. …”
Under the provisions of section 18, the Auditor-General:
“...(1) is to audit the financial statements and any other information submitted by a State entity or an audited subsidiary of a State entity under section 17(1).
Under the provisions of section 19, the Auditor-General:
“...(1) is to prepare and sign an opinion on an audit carried out under section 18(1) in accordance with requirements determined by the Australian Auditing and Assurance Standards.
(2) is to provide the opinion prepared and signed under subsection (1), and any formal communication of audit findings that is required to be prepared in accordance with the Australian Auditing and Assurance Standards, to the State entity’s appropriate Minister and provide a copy to the relevant accountable authority.
STANDARDS APPLIED
Section 31 specifies that:
‘… The Auditor-General is to perform the audits required by this or any other Act in such a manner as the Auditor-General thinks fit having regard to –
(a) the character and effectiveness of the internal control and internal audit of the relevant State entity or audited subsidiary of a State entity; and
(b) the Australian Auditing and Assurance Standards. …’
The auditing standards referred to are Australian Auditing Standards as produced by the Australian Auditing and Assurance Standards Board.
ThE RoLE of ThE AUDIToR-GENERAL
The roles and responsibilities of the Auditor-General, and therefore the Tasmanian Audit Office, are set out in the Audit Act 2008.
Our major responsibility is to conduct financial or ‘attest’ audits of the annual financial reports of State entities. As defined by the Act, State entity includes all public sector entities including those established under the Local Government Act 1993. It includes an agency, council, Government Business Enterprise, State-owned Company, State Authority, Corporations established by the Water and Sewerage Corporations Act 2008 and the governing body of any corporation, body of persons or institution that are appointed by a Minister or by the Governor. We also audit those elements of the Treasurer’s Annual Financial Report which report on financial transactions in the Public Account, the General Government financial report and the Whole of Government financial report.
Audits of financial reports are designed to add credibility to assertions made by accountable authorities in preparing financial reports, enhancing their value to end users. Also, the existence of such audits provides a constant stimulus to State entities to ensure sound financial management.
In the main accountable authorities prepare financial reports consistent with Accounting Standards and other mandatory financial reporting requirements in Australia. On occasion reports are “special purpose financial reports” such as the Public Account Statements. In all cases our audits are conducted in accordance with Australian Auditing Standards.
Following a financial audit, we issue a variety of reports to State entities and report periodically to the Parliament. In combination these reports give opinions on the truth and fairness of financial reports, and comment on compliance with certain laws, regulations and Government directives. They may comment on financial prudence, probity and waste, and recommend operational improvements.
We also conduct performance audits and compliance audits. Performance audits examine whether a State entity is carrying out its activities effectively and doing so economically and efficiently and in compliance with relevant laws. Audits may cover all or part of a State entity’s operations, or consider particular issues across a number of State entities.
Compliance audits are aimed at ensuring compliance with directives, regulations and appropriate internal control procedures. Audits focus on selected systems (including information technology systems), account balances or projects.
Performance and compliance audits are reported separately and at different times of the year, whereas outcomes from financial statement audits are included in one of the regular volumes of the Auditor-General’s reports to the Parliament normally tabled in May and November each year. In doing so the Auditor-General is providing information to the Parliament to assist both the House of Assembly and the Legislative Council in their review of the performance of Executive Government.
Accountable authorities are provided with opportunity to comment on any matters reported. Where they choose to do so, their responses are detailed within the reports.

Phone (03) 6226 0100Fax (03) 6226 0199email [email protected] www.audit.tas.gov.au
Address Ground Floor, 144 Macquarie Street, HobartPostal Address GPO Box 851, Hobart 7001Office Hours 8.30am to 5pm Monday to Friday
Making a Difference Local Government Authorities, Including Business Units and Other State Entities 2007-2008
RepoRt of the AuditoR-GeneRAl no. 1 of 2009
VoluMe one
May 2009
Local Governm
ent Authorities, Including Business Units and O
ther State Entities 2007–2008 Repo
Rt of th
e Aud
itoR-G
eneR
Al n
o.1 of 2009 Volu
Me o
ne M
ay 2009