MAKAR Carbon Measurement Project · 2016-07-11 · Embodied carbon Embodied carbon represents the...
29
MAKAR Carbon Measurement Project: An embodied carbon study of House Units 1 and 2 at Fodderty, Highland manufactured and erected for the Highlands Small Communities Housing Trust A report prepared for MAKAR Ltd Author Dr Jennifer Monahan School of Environmental Sciences University of East Anglia Norwich NR4 7TJ July 2014
Transcript of MAKAR Carbon Measurement Project · 2016-07-11 · Embodied carbon Embodied carbon represents the...
MAKAR Carbon Measurement Project:
An embodied carbon study of House Units 1 and 2 at Fodderty,
Highland manufactured and erected for the Highlands Small
Communities Housing Trust
A report prepared for MAKAR Ltd
Author Dr Jennifer Monahan
School of Environmental Sciences
University of East Anglia
Norwich
NR4 7TJ
July 2014
i
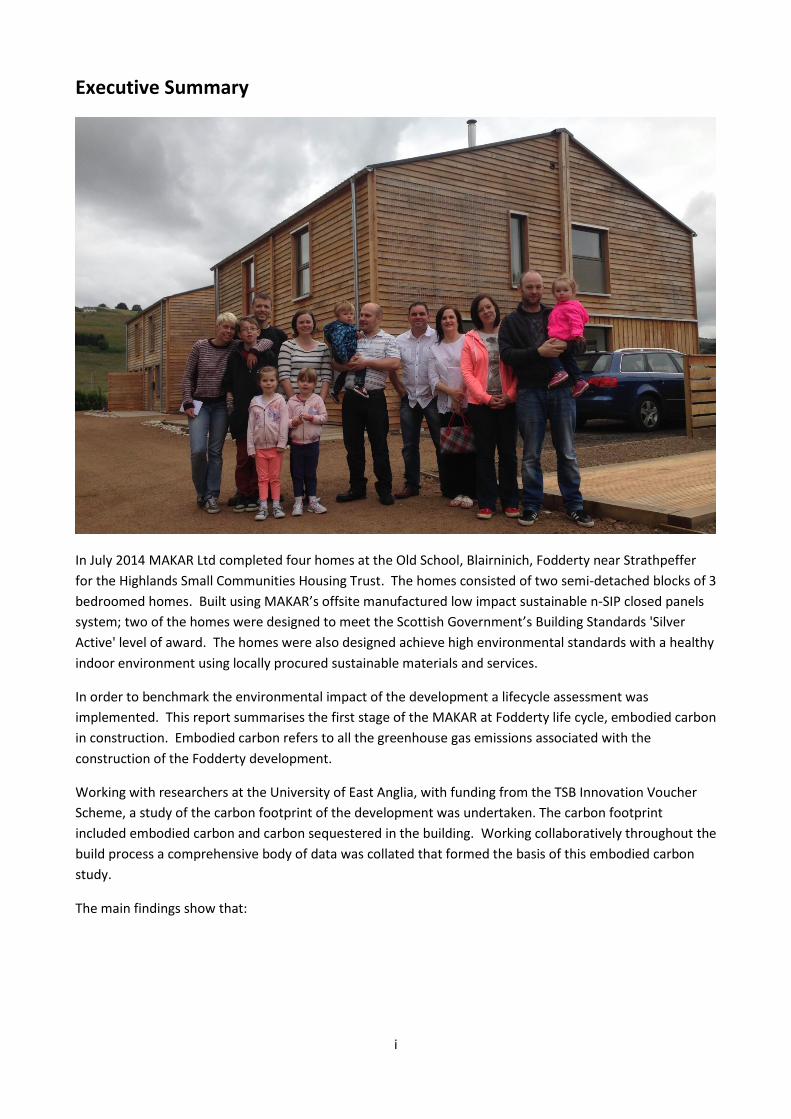
Executive Summary
In July 2014 MAKAR Ltd completed four homes at the Old School, Blairninich, Fodderty near Strathpeffer
for the Highlands Small Communities Housing Trust. The homes consisted of two semi-detached blocks of 3
bedroomed homes. Built using MAKAR’s offsite manufactured low impact sustainable n-SIP closed panels
system; two of the homes were designed to meet the Scottish Government’s Building Standards 'Silver
Active' level of award. The homes were also designed achieve high environmental standards with a healthy
indoor environment using locally procured sustainable materials and services.
In order to benchmark the environmental impact of the development a lifecycle assessment was
implemented. This report summarises the first stage of the MAKAR at Fodderty life cycle, embodied carbon
in construction. Embodied carbon refers to all the greenhouse gas emissions associated with the
construction of the Fodderty development.
Working with researchers at the University of East Anglia, with funding from the TSB Innovation Voucher
Scheme, a study of the carbon footprint of the development was undertaken. The carbon footprint
included embodied carbon and carbon sequestered in the building. Working collaboratively throughout the
build process a comprehensive body of data was collated that formed the basis of this embodied carbon
study.
The main findings show that:
ii
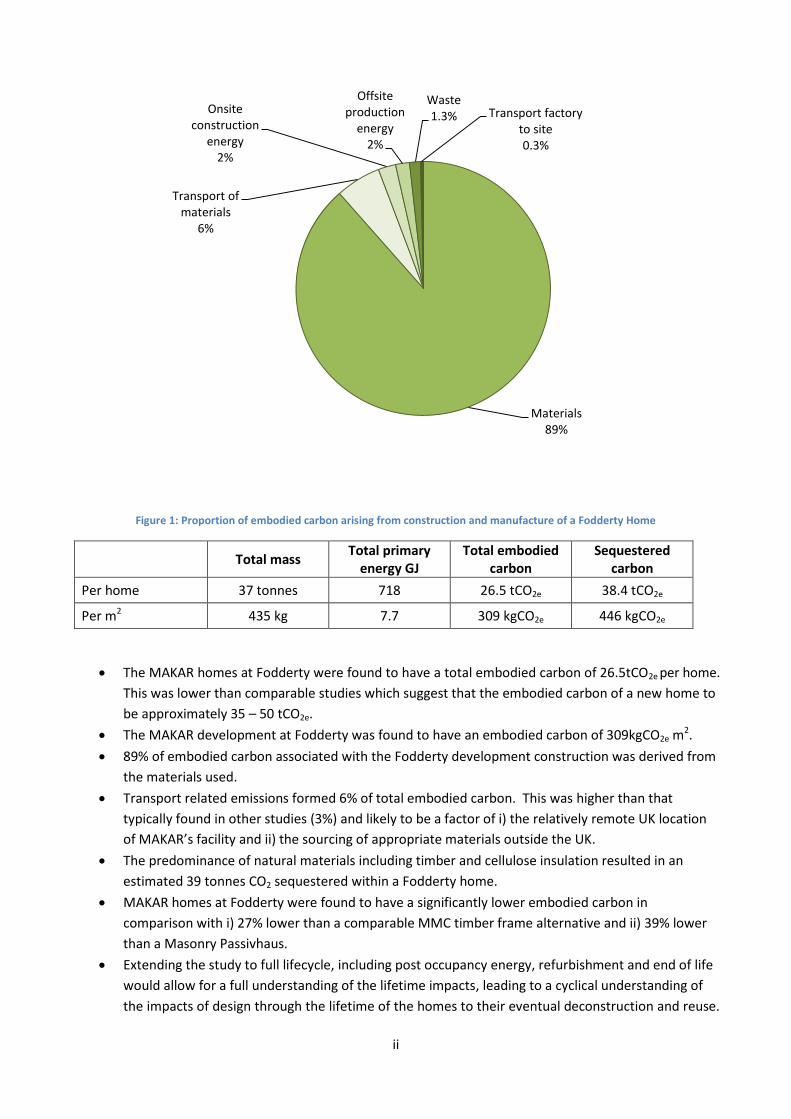
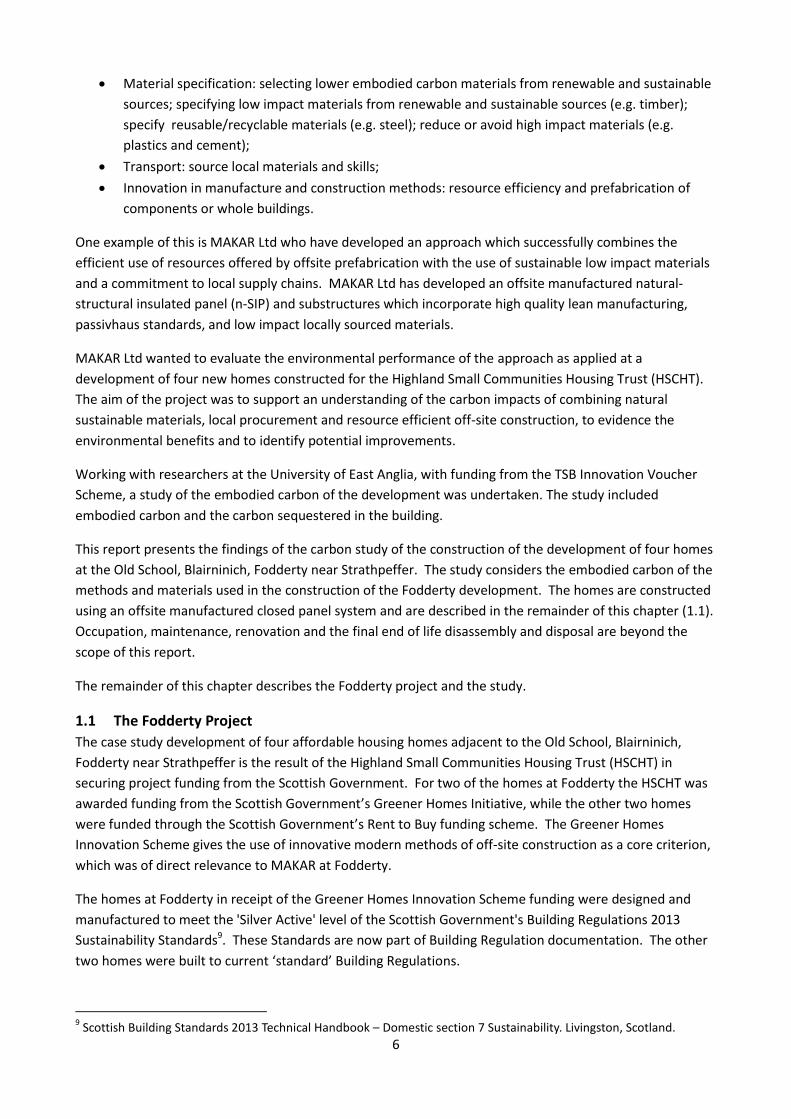
Figure 1: Proportion of embodied carbon arising from construction and manufacture of a Fodderty Home
Total mass Total primary
energy GJ Total embodied
carbon Sequestered
carbon
Per home 37 tonnes 718 26.5 tCO2e 38.4 tCO2e
Per m2 435 kg 7.7 309 kgCO2e 446 kgCO2e
The MAKAR homes at Fodderty were found to have a total embodied carbon of 26.5tCO2e per home.
This was lower than comparable studies which suggest that the embodied carbon of a new home to
be approximately 35 – 50 tCO2e.
The MAKAR development at Fodderty was found to have an embodied carbon of 309kgCO2e m2.
89% of embodied carbon associated with the Fodderty development construction was derived from
the materials used.
Transport related emissions formed 6% of total embodied carbon. This was higher than that
typically found in other studies (3%) and likely to be a factor of i) the relatively remote UK location
of MAKAR’s facility and ii) the sourcing of appropriate materials outside the UK.
The predominance of natural materials including timber and cellulose insulation resulted in an
estimated 39 tonnes CO2 sequestered within a Fodderty home.
MAKAR homes at Fodderty were found to have a significantly lower embodied carbon in
comparison with i) 27% lower than a comparable MMC timber frame alternative and ii) 39% lower
than a Masonry Passivhaus.
Extending the study to full lifecycle, including post occupancy energy, refurbishment and end of life
would allow for a full understanding of the lifetime impacts, leading to a cyclical understanding of
the impacts of design through the lifetime of the homes to their eventual deconstruction and reuse.
Materials89%
Transport of materials
6%
Onsite construction
energy2%
Offsite production
energy2%
Waste1.3% Transport factory
to site0.3%

iii
The Fodderty embodied carbon study has highlighted the importance of embodied carbon in the
construction sector. The MAKAR approach at Fodderty has demonstrated that carefully combining natural
materials specification, responsible local procurement with a resource efficient off-site manufacturing
process can radically reduce the embodied energy in new homes and enhance the positive environmental
impact of new homes.
1
Contents Glossary ............................................................................................................................................................. 3
1 Introduction ............................................................................................................................................... 5
1.1 The Fodderty Project ......................................................................................................................... 6
2 About embodied carbon, lifecycle assessment and the carbon footprint of buildings ............................ 7
2.1 What is embodied energy, embodied carbon and carbon sequestration? ....................................... 7
2.1.1 Embodied energy (MJ) ............................................................................................................... 7
2.1.2 Embodied carbon (Carbon emissions kg CO2e) .......................................................................... 8
2.1.3 Carbon sequestration (kgCO2) ................................................................................................... 8
2.2 About lifecycle assessment and calculating the carbon footprint of buildings ................................. 9
3 About the Fodderty case study ............................................................................................................... 10
3.1 Goal and purpose of the Fodderty study......................................................................................... 10
3.2 Scope of the Study ........................................................................................................................... 10
3.2.1 The MAKAR n-SIP closed panel system ................................................................................... 11
3.2.2 The Fodderty system boundary ............................................................................................... 13
3.2.3 Data collection and conversion ............................................................................................... 14
4 Results ..................................................................................................................................................... 16
4.1 Inventory ......................................................................................................................................... 16
4.2 Embodied energy ............................................................................................................................. 16
4.3 Carbon ............................................................................................................................................. 18
4.3.1 Embodied carbon (Carbon emissions kg CO2e) ........................................................................ 18
4.3.2 Carbon sequestered in the Fodderty homes (kgCO2) .............................................................. 21
5 How does MAKAR at Fodderty compare? ............................................................................................... 22
6 Conclusions, recommendations and next stages .................................................................................... 24

2
Preface
MAKAR Ltd (incorporating Neil Sutherland Architects) is an integrated design, manufacture and assembly
business located at Torbreck on the outskirts of Inverness. The business was established in 2002 by Neil
Sutherland. It currently produces about 20 houses per year and has a workforce of 30 people. See
www.makar.co.uk for more details.
The Highlands Small Communities Housing Trust (HSCHT) – www.hscht.co.uk – is a registered charity, based
in Inverness, which was set up in 1998 to help rural communities secure long term solutions to their local
housing needs. The Trust undertakes a range of activities including the provision of highly sustainable
affordable homes.
3
Glossary
Boundary
Set of criteria that specify which processes are part of the lifecycle system under study.
Carbon dioxide equivalent (CO2e)
A universal unit of measurement used to indicate the global warming potential of a greenhouse gas, expressed in terms of the global warming potential of one unit of carbon dioxide. It is used to evaluate the releasing (or avoiding releasing) of different greenhouse gases against a common basis.
Carbon footprint
The amount of greenhouse gas emissions produced by a specific activity or production system.
Carbon sequestration
The storage of carbon that has been recently removed from the atmosphere, for example through photosynthesis and consumption of plants by animals and then stored in products manufactured from biogenic materials such as wood, straw or animal fibre.
Direct GHG emissions
Emissions from sources that are owned or controlled by the manufacturer or company of product or activity under study.
Embodied energy
All the energy consumed in each lifecycle stage of a product or activity including that used in winning raw materials, the processing and manufacture of products, maintenance and repair and end of life disposal.
Embodied carbon
Embodied carbon represents the carbon emissions (expressed as kg CO2 or kg CO2e) emitted as a result of primary energy use at each stage in a building’s lifetime.
Emission factor
The amount of greenhouse gas emitted expressed as CO2e relative to a unit of activity, for example kgCO2e per kg of material.
Functional unit
Quantified performance of a product or activity used as a reference unit. In buildings this can be whole building, area, volume or heat loss per unit area.
Greenhouse gases (GHGs)
Gases in the atmosphere, both natural and anthropogenic, that absorb and emit radiation at specific wavelengths within the spectrum of infrared radiation emitted by the Earth’s surface, atmosphere and clouds. GHGs include carbon dioxide (CO2), methane (CH4), nitrous oxide (N2O), hydrofluoro-carbons (HFCs), perfluorocarbons (PFCs) and sulphur hexafluoride (SF6).
Indirect GHG emissions
Emissions that are a consequence of the operations of the manufacturer or company of product or activity under study, but occur from sources owned or controlled by another company.
Lifecycle assessment (LCA)
Compilation and evaluation of all input and output flows and potential environmental impacts of a system throughout its lifecycle.
4
Modern methods of construction (MMC)
Methods of construction which provide an efficient production process to provide more products of better quality using fewer resources. Including pre-fabrication and offsite manufacturing.
Offsite manufacture
The part of the production process of a building that occurs away from the building site under factory conditions.
Primary data
Observed data (emissions data, activity data or emission factors) collected from specific facilities owned or operated by the reporting company or a company in its supply chain.
Primary energy
Primary energy is the total fuel used to generate heat and power. In the UK 2.6 units of primary energy are assumed to be associated with each unit of delivered electricity consumed.
Proxy data
Primary or secondary data related to a similar (but not representative) input, process, or activity to the one in the inventory, which can be used in lieu of representative data if unavailable. These existing data are directly transferred or generalised to the input/process of interest without adaptation.
Scope
GHG Protocol definition which defines the operational boundaries in relation to indirect and direct GHG emissions.
Secondary data
Generic or industry average data from published sources that are representative of a company’s operations, activities, or products.
Tonne km
Standard unit of goods moved, calculated by multiplying the load (in tonnes) by the distance it travels (in km).
5
1 Introduction The growing importance of environmental issues, such as climate change, has created the need to evaluate
the impacts of the things that we produce, including buildings and the materials and components that they
are made from.
Whilst there have been great advances in reducing the energy demand of our buildings in use far less
attention has been given to that associated with the construction. A significant amount of energy is
consumed and carbon emitted in the construction, refurbishment and eventual deconstruction of a
building. The extraction, processing, manufacture, transportation, use and eventual disposal of a material,
component or product used in the construction of a building requires energy and produces many
environmental impacts, including carbon emissions. These impacts are the hidden, or embodied, impacts.
They are not insignificant but are typically ignored.
A recent report by the Department for Business Innovation and Skills (BIS)1 estimated the UK construction
sector to be responsible for 16% of the UK’s total carbon emissions, attributed to materials and products,
transport and construction. Significantly, the report found the construction industry has the ability to
influence (directly and indirectly) nearly 300MtCO2, which clearly represents an untapped opportunity for
achieving the UK’s climate change targets. Yet embodied carbon is not in general practise a consideration
when designing, specifying and constructing a building.
For most buildings the carbon emitted during the buildings operational lifetime accounts for the 80 – 90%
of the buildings lifetime carbon footprint2. However, in low energy or energy self-sufficient buildings the
relative importance of embodied carbon changes3’4’5. In low energy buildings the proportion of embodied
carbon may increase to 60% or more of the whole lifecycle carbon6. Although significantly less energy is
used during their occupation, additional energy is required during the manufacture of additional insulation
and the often greater mass of materials used. There is a growing but still small body of studies on the
embodied carbon of construction of housing in the UK. Studies that are available suggest the embodied
carbon of a new home to be approximately 35 – 50 tonnes CO2e.7
’8
Potential solutions to reducing the embodied carbon of new homes can be achieved by careful design,
specification and sourcing of materials and innovation in construction methods. These can include:
Design: compact built form, smaller lighter mass buildings;
1 BIS. (2010). estimating the amount of CO2 emissions that the construction industry can influence: Supporting
materials for the Low Carbon Construction IGT report. London: HMSO 2 Ramesh, T., Prakash, R., & Shukla, K. K. (2010). Life cycle energy analysis of buildings: An overview. Energy and
Buildings, 42(10), 1592-1600. 3 Dahlstrom, O., Sornes, K., Eriksen, S. T., & Hertwich, E. G. (2012). Life cycle assessment of a single-family residence
built to either conventional- or passive house standard. Energy and Buildings, 54(0), 470-479 4 Winther, B. N., & Hestnes, A. G. (1999). Solar versus green: The analysis of a Norwegian row house. Solar Energy,
66(6), 387-393. 5 Thormark, C. (2002). A low energy building in a life cycle - Its embodied energy, energy need for operation and
recycling potential. Building and Environment, 37(4), 429-435. 6 Cuellar-Franca, R. M., & Azapagic, A. (2012). Environmental impacts of the UK residential sector: Life cycle
assessment of houses. Building and Environment, 54(0), 86-99. 7 Monahan, J., & Powell, J. C. (2011). An embodied carbon and energy analysis of modern methods of construction in
housing: A case study using a lifecycle assessment framework. Energy and Buildings, 43(1), 179-188. 8 Hacker JN, De Saulles TP, Minson AJ , and Holmes MJ (2008): Embodied and operational carbon dioxide emissions
from housing: A case study on the effects of thermal mass and climate change. Energy and Buildings V 40(3) 375-384.
6
Material specification: selecting lower embodied carbon materials from renewable and sustainable
sources; specifying low impact materials from renewable and sustainable sources (e.g. timber);
specify reusable/recyclable materials (e.g. steel); reduce or avoid high impact materials (e.g.
plastics and cement);
Transport: source local materials and skills;
Innovation in manufacture and construction methods: resource efficiency and prefabrication of
components or whole buildings.
One example of this is MAKAR Ltd who have developed an approach which successfully combines the
efficient use of resources offered by offsite prefabrication with the use of sustainable low impact materials
and a commitment to local supply chains. MAKAR Ltd has developed an offsite manufactured natural-
structural insulated panel (n-SIP) and substructures which incorporate high quality lean manufacturing,
passivhaus standards, and low impact locally sourced materials.
MAKAR Ltd wanted to evaluate the environmental performance of the approach as applied at a
development of four new homes constructed for the Highland Small Communities Housing Trust (HSCHT).
The aim of the project was to support an understanding of the carbon impacts of combining natural
sustainable materials, local procurement and resource efficient off-site construction, to evidence the
environmental benefits and to identify potential improvements.
Working with researchers at the University of East Anglia, with funding from the TSB Innovation Voucher
Scheme, a study of the embodied carbon of the development was undertaken. The study included
embodied carbon and the carbon sequestered in the building.
This report presents the findings of the carbon study of the construction of the development of four homes
at the Old School, Blairninich, Fodderty near Strathpeffer. The study considers the embodied carbon of the
methods and materials used in the construction of the Fodderty development. The homes are constructed
using an offsite manufactured closed panel system and are described in the remainder of this chapter (1.1).
Occupation, maintenance, renovation and the final end of life disassembly and disposal are beyond the
scope of this report.
The remainder of this chapter describes the Fodderty project and the study.
1.1 The Fodderty Project
The case study development of four affordable housing homes adjacent to the Old School, Blairninich,
Fodderty near Strathpeffer is the result of the Highland Small Communities Housing Trust (HSCHT) in
securing project funding from the Scottish Government. For two of the homes at Fodderty the HSCHT was
awarded funding from the Scottish Government’s Greener Homes Initiative, while the other two homes
were funded through the Scottish Government’s Rent to Buy funding scheme. The Greener Homes
Innovation Scheme gives the use of innovative modern methods of off-site construction as a core criterion,
which was of direct relevance to MAKAR at Fodderty.
The homes at Fodderty in receipt of the Greener Homes Innovation Scheme funding were designed and
manufactured to meet the 'Silver Active' level of the Scottish Government's Building Regulations 2013
Sustainability Standards9. These Standards are now part of Building Regulation documentation. The other
two homes were built to current ‘standard’ Building Regulations.
9 Scottish Building Standards 2013 Technical Handbook – Domestic section 7 Sustainability. Livingston, Scotland.
7
MAKAR has a strong ethos in relation to the Highland economy and making use of regional sourced
construction materials, components and services wherever possible. In designing the Fodderty homes the
selection of all materials, components and services would be made in a pragmatic manner with a full
consideration of the following criteria:
Natural renewable materials used with organic finishes to reduce off-gassing;
Durability over an extended period for low maintenance and long life;
Cost and affordability;
Environmental characteristics including location of sourcing, toxicity, embodied energy, etc;
Local materials used where possible to reduce embodied energy and advantage local economies;
Recycled materials to be incorporated where possible;
Aesthetics – colour, texture and beauty.
Recognising that construction choices can have extensive and potentially positive effects on the local
economy of remote regions like that of the Scottish Highlands careful attention was given to the sourcing of
construction approaches, materials and components. Criteria included: reduce material miles, use
renewable materials, avoid complex and energy intensive manufacturing processes and have low embodied
energy during production and use.
The use of timber from sustainably managed Highland forests has a far ranging positive influence on the
regions environment and economy. The use of finite raw materials was avoided in favour of those from
local renewable and recycled sources including cellulose insulation which was used to insulate floor, wall
and roof closed panel elements to achieve to achieve a breathing wall construction. The construction
makes full use of locally grown timber certified sourced processed and fabricated in to components locally
including:
Structural components, joists, beams and posts;
External finishes: cladding, soffit fascia decking;
Internal finishes: flooring; staircases, cills, skirtings and other internal fittings and finishes.
Furthermore, none of the timber was treated in any way and the larch cladding was air dried rather than
kiln dried avoiding additional energy and emissions. The softwood used structurally was, however, kiln
dried.
This report consists of 6 chapters. The following provides an overview of the methods used and describes
how the study was carried out. The following chapter presents the results of the carbon footprint of the
Fodderty home including embodied carbon and sequestered carbon. A comparison of the results of the
Fodderty homes with a more conventional offsite timber frame construction and a masonry passivhaus is
given. The final chapter discusses the results and suggests recommendations and draws conclusions.
2 About embodied carbon, lifecycle assessment and the carbon footprint of
buildings
2.1 What is embodied energy, embodied carbon and carbon sequestration?
2.1.1 Embodied energy (MJ)
At its simplest embodied energy can be defined as all the energy consumed in each lifecycle stage of a
building, including that used in winning raw materials, the processing and manufacture of all the materials
8
and components of a building its construction, maintenance, refurbishment and disposal. By convention it
is measured as primary energy10. It has two components, direct energy and indirect energy. Direct energy
is the use of fuels in machinery, electricity production, heat production, processing equipment and
transport. Indirect energy is the energy consumed in the manufacturing of materials and products and the
production of equipment tools and so on. Embodied energy is typically expressed in units of Megajoules
(MJ) or kilowatt hours (kWh). In addition to process energy directly combusted as fuel, energy can also
include feedstock energy. Feedstock energy describes the use of fossil fuels as a raw material in the
manufacture of some materials. For example, gas and oil are raw materials in the manufacture of plastics.
In this study all primary energy (from fossil and renewable sources) was included. Feedstock energy was
excluded.
2.1.2 Embodied carbon (Carbon emissions kg CO2e)
Embodied carbon represents the carbon emissions (expressed as kg CO2 or kg CO2e11 ) emitted as a result of
primary energy use at each stage in a buildings lifetime. Though often used synonymously, embodied
energy and embodied carbon are not quite analogous. Embodied carbon can also include other sources of
emissions such as CO2 from chemical processes such as the carbonation of lime in cement production, HFC
blowing agents used in the production of insulation or nitrous oxide from fertilizer manufacture. Emissions
also occur at end of life if certain materials, such as plastics or timber, when burnt release their carbon
content atmosphere, or when biological based materials (e.g. plant or animal fibres) are landfilled resulting
in emissions of methane.
2.1.3 Carbon sequestration (kgCO2)
Natural materials are often presented as a special case in the context of embodied carbon due to their,
often though not always, low embodied energy and their ability to sequester carbon.
Natural (also referred to as bio-genic or bio-based) materials such as wood, straw or hemp, or wool are
renewable materials that take up atmospheric CO2 during photosynthesis or growth, locking it up, as
carbon material within their biomass (termed ‘biogenic’ carbon or sequestered carbon 12). This
sequestered carbon may act as temporary carbon storage when it is incorporated into products or things
such as buildings. In accounting for embodied carbon it has been argued that this sequestered carbon
could be thought of as being a carbon reduction or ‘negative emission’13. So, in simple terms a carbon
10
Primary energy is the gross total of fuels used to generate heat and power and factors in the efficiency of conversion. In the UK 2.6 units of primary energy are assumed to be associated with each unit of delivered electricity consumed (DEFRA Climate Change Agreements Operations Manual August 2013 V2 10.4.2. p 67).
11 Embodied carbon is usually quantified in units of kilograms or tonnes of carbon (kg CO2) or carbon equivalent (CO2e).
In fact you may have seen three different but related units of measure used, carbon (C), carbon dioxide (CO2) and carbon dioxide equivalent (CO2e). Carbon (C) is the fraction of carbon in CO2. To obtain carbon (C) divide CO2 by 12/44 to get to C. CO2e is a more complete measure of all greenhouse gases (including carbon dioxide (CO2), methane (CH4), nitrous oxide (N2O), hydrofluorocarbons (HFCs), perfluorocarbons (PFCs), and sulphur hexafluoride (SF6)). It enables the calculation of all the different greenhouse gases based on the amount of warming (termed global warming potential, GWP) that a given amount of a specific greenhouse gas may cause using amount carbon dioxide (CO2) as a reference. For example, CO2, as the reference gas, has a GWP of 1 and methane has a GWP of 25. So, reducing 1 tonne of methane is the equivalent to 25tCO2 or, to follow scientific convention, 25tCO2e. Emissions are given in different metric units, million tonnes (Mt), Tonnes (t), kilograms (kg) or grams (g).
12 Biogenic carbon is the carbon sequestered by a plant or animal based material during its growth derived from
atmospheric CO2 and converted into biomass and released at end of life <100 years. 13
Brandão, M., Levasseur, A., Kirschbaum, M. F., Weidema, B., Cowie, A., Jørgensen, S., . Chomkhamsri, K. (2013). Key issues and options in accounting for carbon sequestration and temporary storage in life cycle assessment and carbon footprinting. The International Journal of Life Cycle Assessment, 18(1), 230-240.
9
footprint accounting for the net carbon arising from a product or building would be a result of the
embodied carbon minus the carbon sequestered and temporarily stored in biogenic material.
Given the contentiousness of reporting a single net carbon figure in this analysis sequestered carbon in
biogenic materials is reported separately in section 4.3.2. The methodology for calculating sequestration
complied with the recently published BS EN 16449 14.
2.2 About lifecycle assessment and calculating the carbon footprint of buildings
One of the principal techniques used to quantify the environmental impacts of products and materials is
lifecycle assessment (LCA). LCA is a framework and is standardised according to international standards
(ISO 14040 2006). The LCA framework consists of four parts:
1. Goal, scope and definition;
2. Inventory analysis;
3. Impact assessment;
4. Interpretation.
The first part sets out the scope of the study, including defining the functional unit15, the system boundary,
what is to be included and excluded, the level of detail required and how the environmental impacts will be
allocated. These are all dependent on the intended purpose of the study and can vary considerably
between different studies.
The second part, the life cycle inventory (LCI) involves the compilation of an inventory of all the items
(materials, fuels, electricity, transport and waste, etc) that are imported/exported in the production of the
product (in this case the home) under study. This stage is iterative with the data constantly being updated
and added to as more is learnt about the system under study.
The third part, the impact assessment (LCIA) evaluates the significance of the relevant environmental
impacts suing the data collected in the LCI. The inventory data is characterised by converting into relevant
outputs (for example MJ of energy or kgCO2e for global warming potential (GWP). It provides information in
the relevant form for the final interpretation phase or where the results are summarised to answer the
questions set out in the first part, the goal and scope.
The method used in this assessment complied with The European Committee for Standardisation Technical
Committee 350 (TC/CEN 350) recently developed voluntary standards explicitly for buildings, BS EN 15978 16 and BS EN 15804 for construction products17.
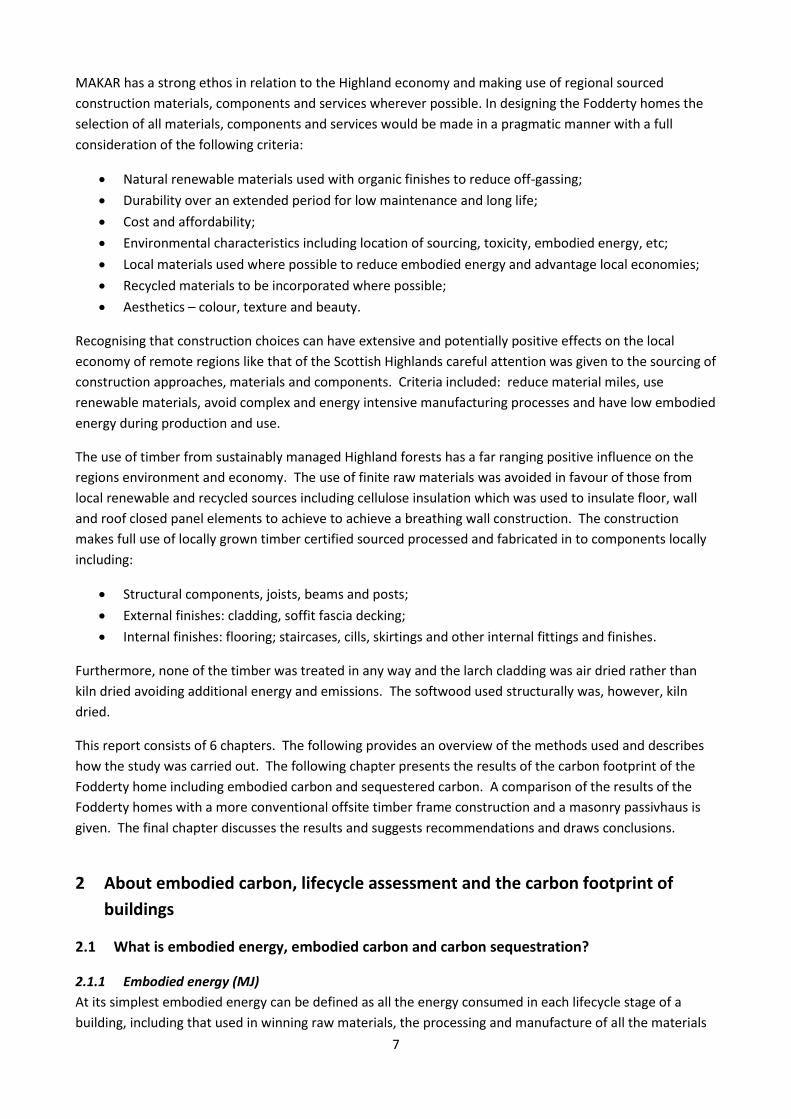
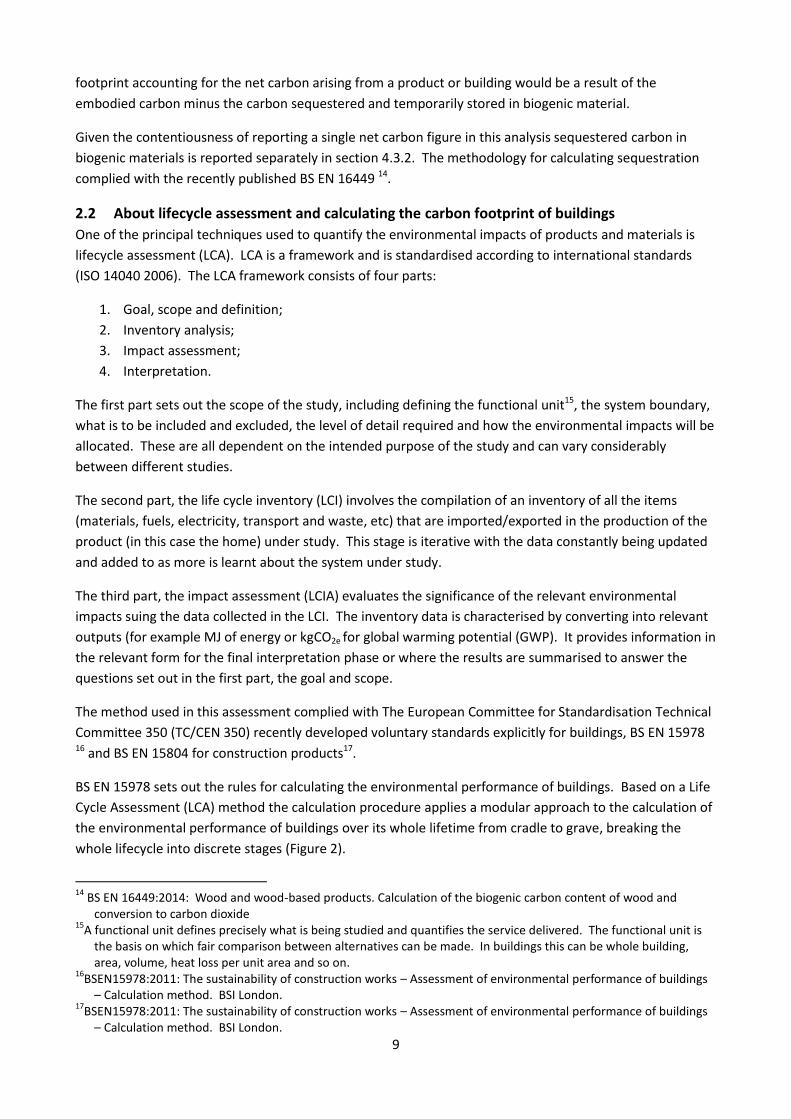
BS EN 15978 sets out the rules for calculating the environmental performance of buildings. Based on a Life
Cycle Assessment (LCA) method the calculation procedure applies a modular approach to the calculation of
the environmental performance of buildings over its whole lifetime from cradle to grave, breaking the
whole lifecycle into discrete stages (Figure 2).
14
BS EN 16449:2014: Wood and wood-based products. Calculation of the biogenic carbon content of wood and conversion to carbon dioxide
15A functional unit defines precisely what is being studied and quantifies the service delivered. The functional unit is
the basis on which fair comparison between alternatives can be made. In buildings this can be whole building, area, volume, heat loss per unit area and so on.
16BSEN15978:2011: The sustainability of construction works – Assessment of environmental performance of buildings
– Calculation method. BSI London. 17
BSEN15978:2011: The sustainability of construction works – Assessment of environmental performance of buildings – Calculation method. BSI London.
10
Figure 2: Lifecycle stages of a building derived from BSEN 15978
The assessment focused on the product stage (modules A1 – A 3) and the construction stage (modules A4 –
A 5). Whilst the work reported here is limited to the cradle to construction boundary later work will
consider the remaining lifecycle stages (modules B and C occupation and end of life). A post occupancy
study monitoring of energy use is planned.
The carbon footprint includes the embodied carbon (as kgCO2e). An account is also given of the carbon
sequestered in the home.
The calculation method involved compiling an inventory of all relevant inputs and outputs into the building
and applying a characterization factor to convert these inputs (in relevant units) to GHG emissions (in kg
CO2e).
3 About the Fodderty case study The following section describes the study and provides more detail on how the study was carried out.
3.1 Goal and purpose of the Fodderty study
The principal goal of the study was to quantify the carbon footprint of a MAKAR Fodderty home to
benchmark the embodied carbon, estimate the carbon sequestered in the home and to evaluate the
carbon footprint in comparison with other conventional
housing construction methods and approaches.
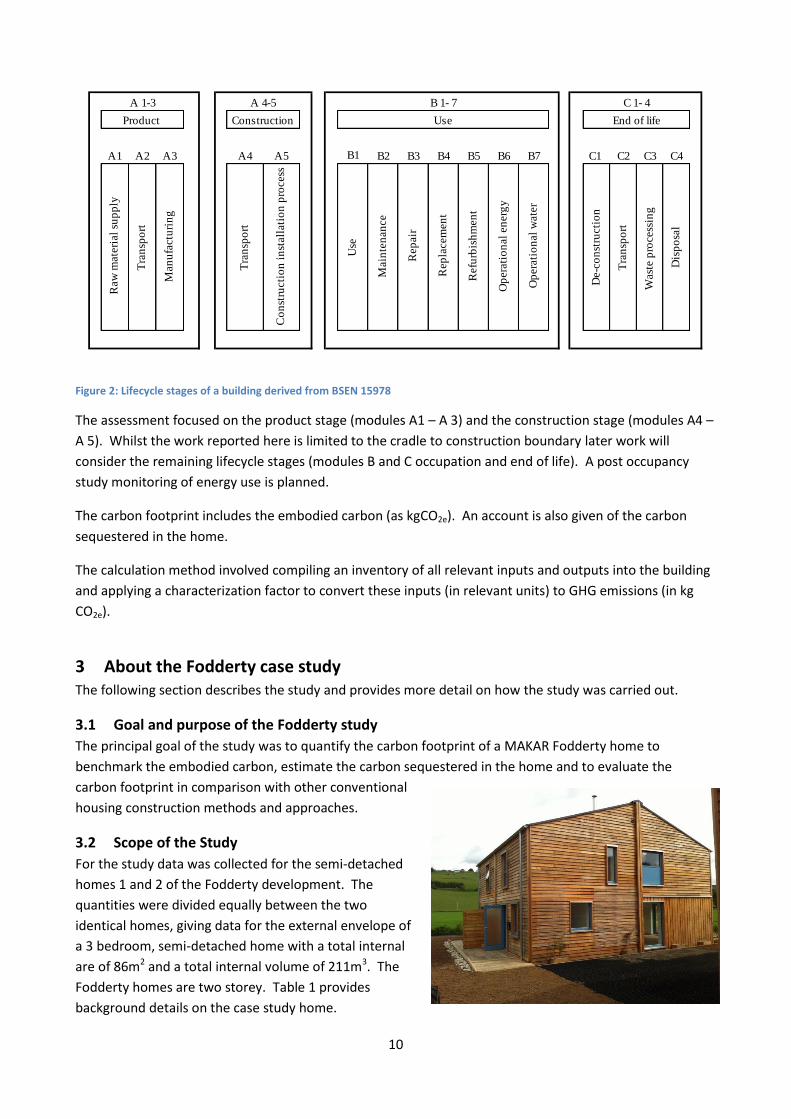
3.2 Scope of the Study
For the study data was collected for the semi-detached
homes 1 and 2 of the Fodderty development. The
quantities were divided equally between the two
identical homes, giving data for the external envelope of
a 3 bedroom, semi-detached home with a total internal
are of 86m2 and a total internal volume of 211m3. The
Fodderty homes are two storey. Table 1 provides
background details on the case study home.
A1 A2 A3 A4 A5 B1 B2 B3 B4 B5 B6 B7 C1 C2 C3 C4
Raw
mate
rial
sup
ply
Tra
nsp
ort
Man
ufa
ctu
rin
g
Tra
nsp
ort
Co
nst
ructi
on
in
stall
ati
on
pro
cess
Use
Main
ten
an
ce
Rep
air
Rep
lacem
en
t
Refu
rbis
hm
en
t
Op
era
tio
nal
en
erg
y
Op
era
tio
nal
wate
r
De-c
on
stru
cti
on
Tra
nsp
ort
Wast
e p
rocess
ing
Dis
po
sal
C 1- 4
End of life
A 1-3
Product
A 4-5
Construction
B 1- 7
Use
11
Table 1: Key design parameters for case study home
Location Highlands, Scotland, Europe
Number of floors 2
Internal floor area (incl. 3 bedrooms) 86m2
Internal volume 211 m3
Load bearing frame Timber
Area m2 U-value
Total envelope 232.4
Wall 147.84 0.16
Roof 43.249 0.14
Floor 41.28 0.15
Airtightness achieved 3.84 m3/m2/h
Annual estimated energy demand (space heating) 35.21kWh/m2
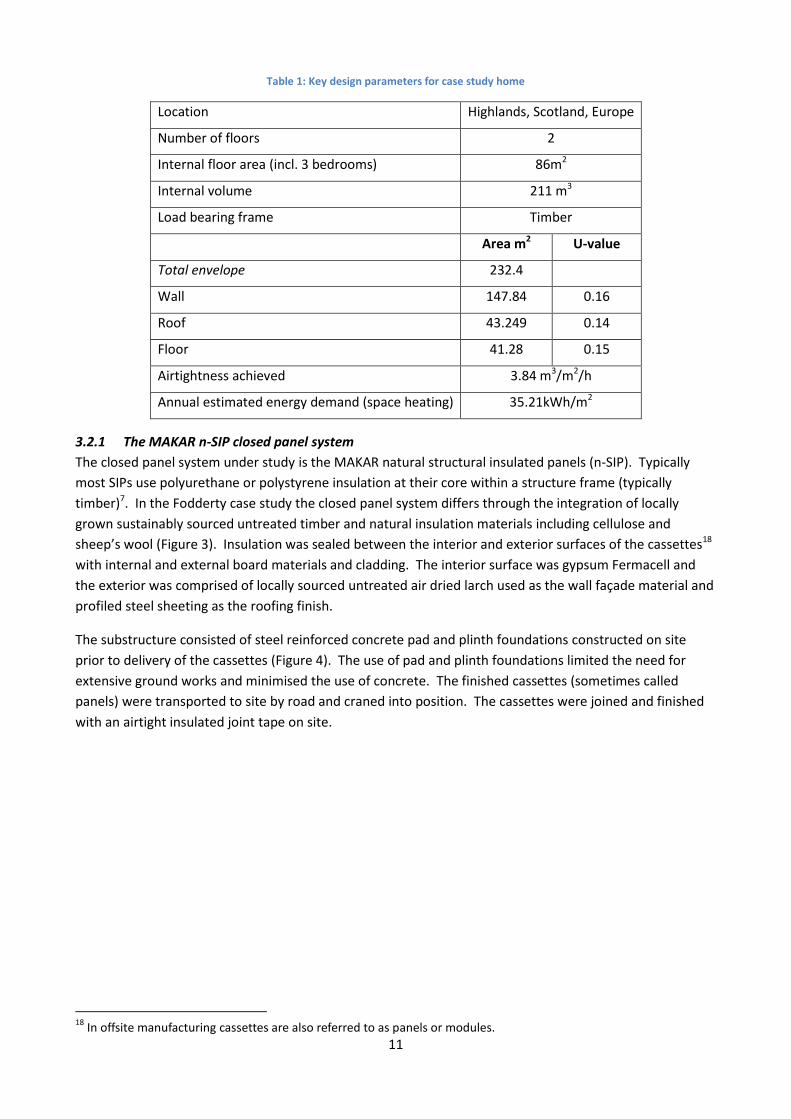
3.2.1 The MAKAR n-SIP closed panel system
The closed panel system under study is the MAKAR natural structural insulated panels (n-SIP). Typically
most SIPs use polyurethane or polystyrene insulation at their core within a structure frame (typically
timber)7. In the Fodderty case study the closed panel system differs through the integration of locally
grown sustainably sourced untreated timber and natural insulation materials including cellulose and
sheep’s wool (Figure 3). Insulation was sealed between the interior and exterior surfaces of the cassettes18
with internal and external board materials and cladding. The interior surface was gypsum Fermacell and
the exterior was comprised of locally sourced untreated air dried larch used as the wall façade material and
profiled steel sheeting as the roofing finish.
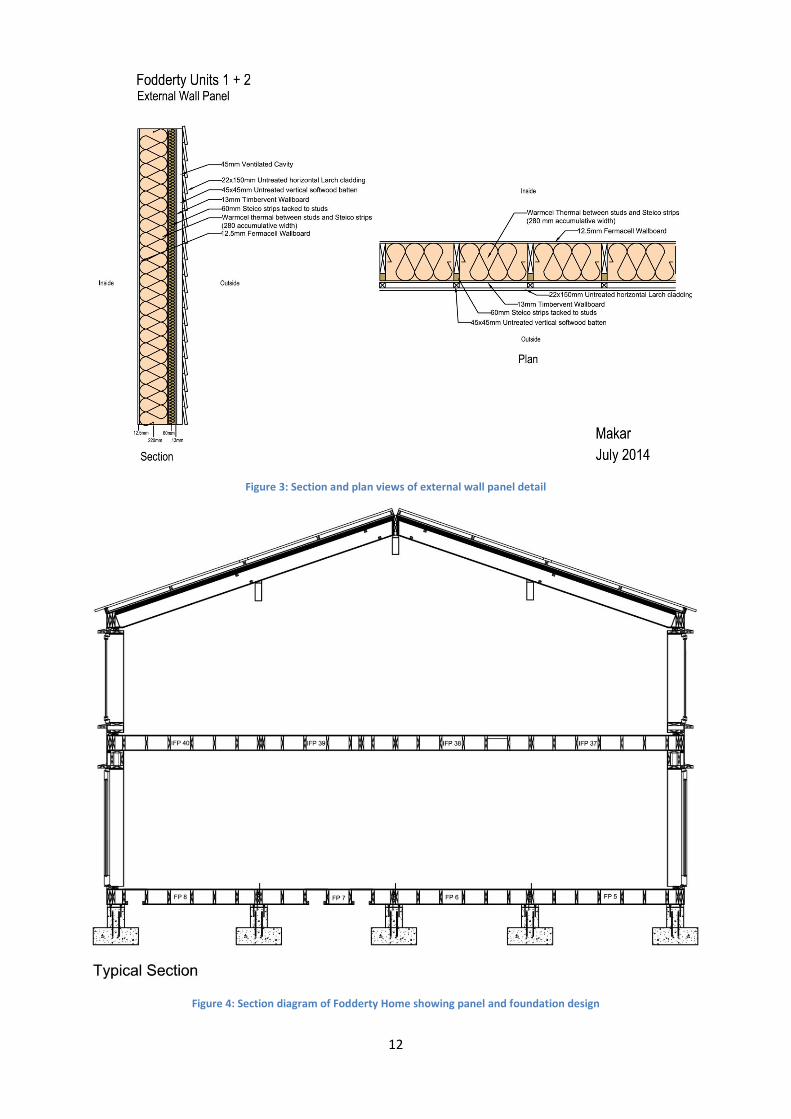
The substructure consisted of steel reinforced concrete pad and plinth foundations constructed on site
prior to delivery of the cassettes (Figure 4). The use of pad and plinth foundations limited the need for
extensive ground works and minimised the use of concrete. The finished cassettes (sometimes called
panels) were transported to site by road and craned into position. The cassettes were joined and finished
with an airtight insulated joint tape on site.
18
In offsite manufacturing cassettes are also referred to as panels or modules.
12
Figure 3: Section and plan views of external wall panel detail
Figure 4: Section diagram of Fodderty Home showing panel and foundation design
13
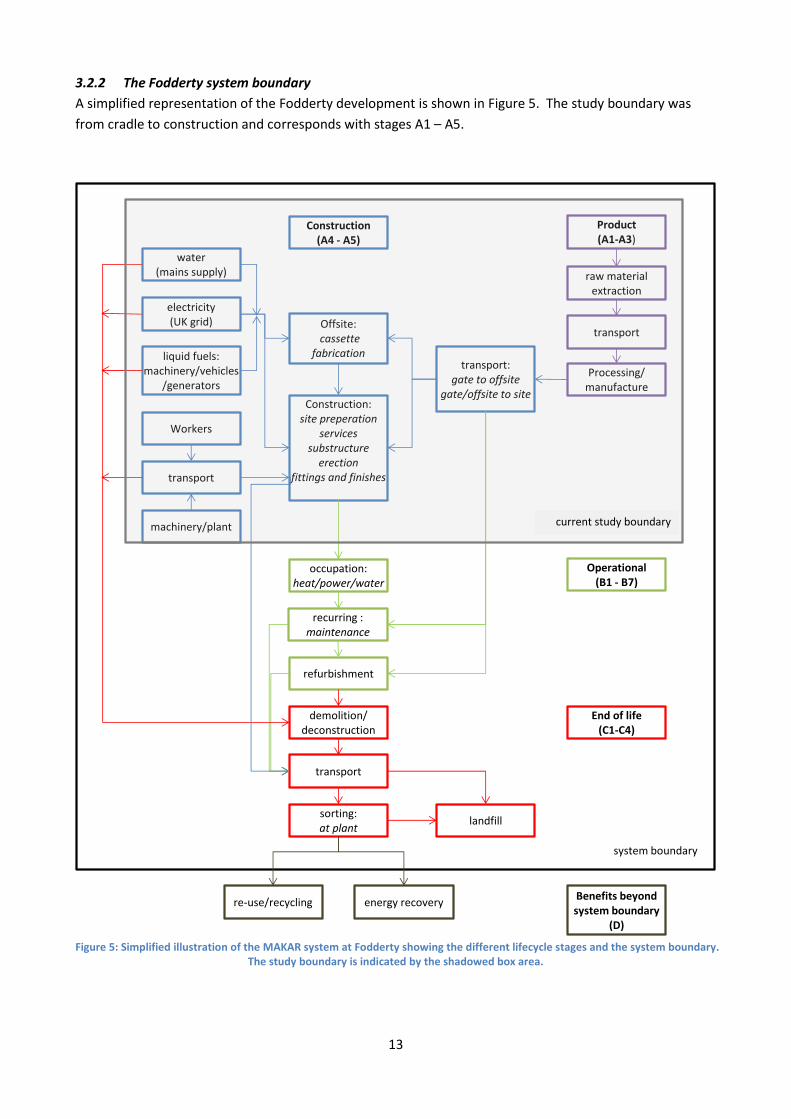
3.2.2 The Fodderty system boundary
A simplified representation of the Fodderty development is shown in Figure 5. The study boundary was
from cradle to construction and corresponds with stages A1 – A5.
Figure 5: Simplified illustration of the MAKAR system at Fodderty showing the different lifecycle stages and the system boundary.
The study boundary is indicated by the shadowed box area.
Construction(A4 - A5)
Workers
transport
machinery/plant
electricity(UK grid)
water(mains supply)
liquid fuels:machinery/vehicles
/generators
Offsite:cassette
fabrication
Construction:site preperation
servicessubstructure
erectionfittings and finishes
transport:gate to offsite
gate/offsite to site
Product(A1-A3)
raw material extraction
transport
Processing/ manufacture
occupation:heat/power/water
recurring :maintenance
refurbishment
Operational(B1 - B7)
demolition/ deconstruction
End of life(C1-C4)
sorting:at plant
energy recovery
landfill
re-use/recyclingBenefits beyondsystem boundary
(D)
system boundary
transport
current study boundary
14
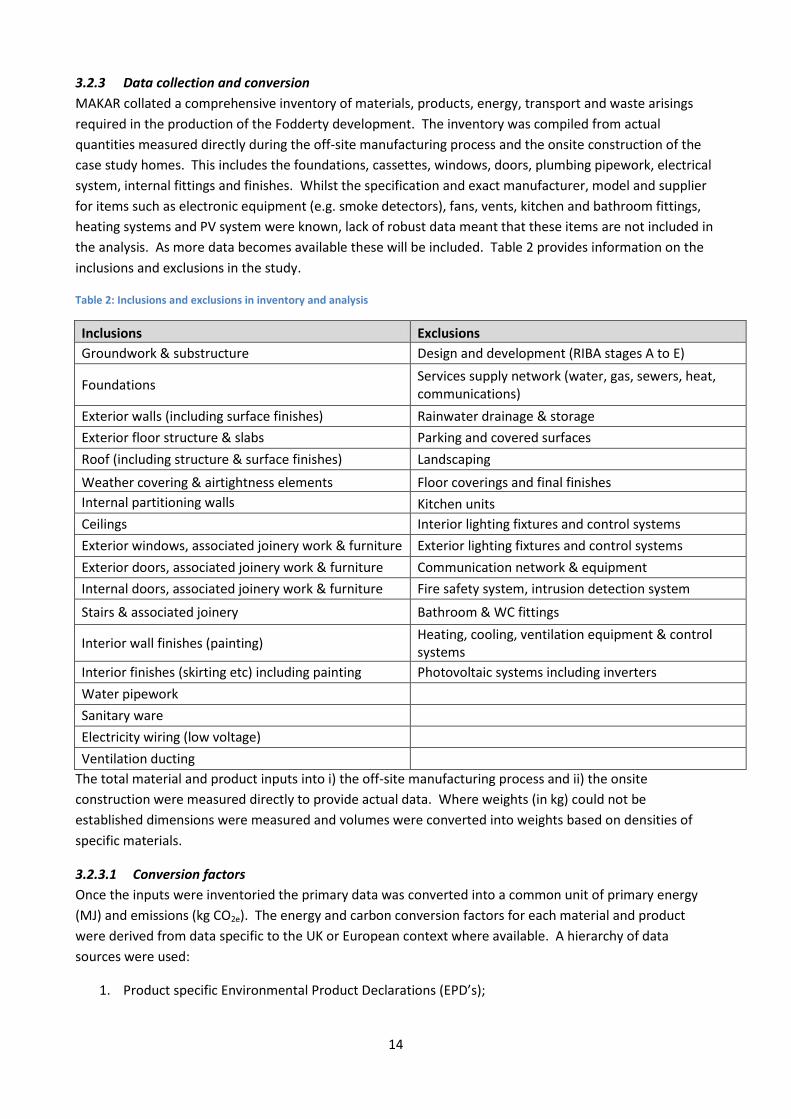
3.2.3 Data collection and conversion
MAKAR collated a comprehensive inventory of materials, products, energy, transport and waste arisings
required in the production of the Fodderty development. The inventory was compiled from actual
quantities measured directly during the off-site manufacturing process and the onsite construction of the
case study homes. This includes the foundations, cassettes, windows, doors, plumbing pipework, electrical
system, internal fittings and finishes. Whilst the specification and exact manufacturer, model and supplier
for items such as electronic equipment (e.g. smoke detectors), fans, vents, kitchen and bathroom fittings,
heating systems and PV system were known, lack of robust data meant that these items are not included in
the analysis. As more data becomes available these will be included. Table 2 provides information on the
inclusions and exclusions in the study.
Table 2: Inclusions and exclusions in inventory and analysis
Inclusions Exclusions
Groundwork & substructure Design and development (RIBA stages A to E)
Foundations Services supply network (water, gas, sewers, heat, communications)
Exterior walls (including surface finishes) Rainwater drainage & storage
Exterior floor structure & slabs Parking and covered surfaces
Roof (including structure & surface finishes) Landscaping
Weather covering & airtightness elements Floor coverings and final finishes
Internal partitioning walls Kitchen units
Ceilings Interior lighting fixtures and control systems
Exterior windows, associated joinery work & furniture Exterior lighting fixtures and control systems
Exterior doors, associated joinery work & furniture Communication network & equipment
Internal doors, associated joinery work & furniture Fire safety system, intrusion detection system
Stairs & associated joinery Bathroom & WC fittings
Interior wall finishes (painting) Heating, cooling, ventilation equipment & control systems
Interior finishes (skirting etc) including painting Photovoltaic systems including inverters
Water pipework
Sanitary ware
Electricity wiring (low voltage)
Ventilation ducting
The total material and product inputs into i) the off-site manufacturing process and ii) the onsite
construction were measured directly to provide actual data. Where weights (in kg) could not be
established dimensions were measured and volumes were converted into weights based on densities of
specific materials.
3.2.3.1 Conversion factors
Once the inputs were inventoried the primary data was converted into a common unit of primary energy
(MJ) and emissions (kg CO2e). The energy and carbon conversion factors for each material and product
were derived from data specific to the UK or European context where available. A hierarchy of data
sources were used:
1. Product specific Environmental Product Declarations (EPD’s);
15
2. Lifecycle inventory data bases (e.g. Ecoinvent,19 European reference Lifecycle Database20);
3. Product manufacturer’s associations LCI databases;
4. Generic open access databases (e.g. The University of Bath’s Inventory of Carbon and Energy21).
Where no data could be found substitute proxy data was used based on either the main material
constituent if a mixed material product or derived from other sources. Life cycle assessments and carbon
footprinting is an iterative process, as more products have EPD’s the quality of data will improve the
accuracy of studies.
For summary purposes the materials were also categorized under main materials and sub groups:
Metals (Aluminium and steel);
Minerals (Concrete, gypsum, mineral/glass wool);
Plastics (Nylon, polyethylene, polyurethane, PVC);
Timber (Solid timber and timber boards and wood based products);
Natural materials (Animal or plant fibre).
3.2.3.2 The Functional Unit
All developments vary in their scope and scale, the functional unit enables comparisons to be made on an
equivalent basis. The functional unit for the Fodderty study was defined as 1m2 of usable floor area. i.e.
how much CO2e is associated with each m2 of Gross Internal Floor Area?
3.2.3.3 Energy
The inventory also included all energy inputs in the construction of the case study homes, both off-site
manufacturing and onsite construction. Energy consumption of i) offsite manufacturing of cassettes and ii)
onsite construction energy was included. Energy use was measured directly in units of litres for liquid fuels
and kWh for electricity. Conversion factors for primary energy and GHG emissions used factors published
by UK Government22.
3.2.3.4 Transport
Transport is difficult to account for, materials and products often undergo complex journeys often over
large distances using multiple transport modes. Transportation of materials, products from factory gate to i)
the off-site manufacturing facility and then transport of finished cassettes to site or ii) from factory gate
direct to site was accounted for where possible. To provide a consistent unit transport was defined in units
of tonne/km. It was assumed that transportation was by road or by international shipping. It was assumed
no rail or air transport was used. Conversion factors for transport were applied for energy 23and carbon
emissions24.
19
R. Frischknecht, G. Rebitzer, The ecoinvent database system: a comprehensive web-based LCA database, Journal of Cleaner Production 13 (13–14) (2005) 1337–1343.
20 http://eplca.jrc.ec.europa.eu/ELCD3/index.xhtml
21 Hammond, G. and C. Jones, Embodied energy and carbon in construction materials. Proceedings of the Institution of
Civil Engineers: Energy, 2008. 161: p. 87-98. 22
DEFRA Greenhouse Gas Conversion Factor Repository http://www.ukconversionfactorscarbonsmart.co.uk/ 23
Source: Ecoinvent 2.2 database and LIPASTO 2011 http://lipasto.vtt.fi/yksikkopaastot/tavaraliikennee/tieliikennee/padiesjakelue.htm
24 Defra / DECC's GHG Conversion Factors for Company Reporting
16
3.2.3.5 Waste
An inventory of waste produced and its disposal routes during manufacturing and construction was also
compiled. The total quantities of waste were relatively insignificant. To facilitate comparison in future or
other studies waste arising from i) the offsite manufacturing process and ii) from onsite construction were
included in the analysis.
The waste was separated into three different streams: wood waste for combustion in factory woodburners
or elsewhere; wood waste for export to pellet manufacturer; general mixed recycling; non-recyclables.
All wood waste was measured in weight. General mixed recycling and non-recyclables were estimated by
volume. General mixed recycling included cardboard, paper, plastic tubes and bottles. Non-recyclables
included dust, plastic wrapping and packaging, empty adhesive tubes, workers lunch debris. It was
assumed the waste was collected in a 4.6m3 capacity skip, filled to 75% of capacity with uncompacted
content. A volume to weight conversion factor of 0.21 tonnes per m3 was used 25. All on site construction
waste (soil, subsoil and aggregates) were retained and reused on site.
4 Results This chapter summarises the main findings of the study. This includes a summarised inventory of all the
materials, energy and transport for the construction of the Fodderty homes. The remainder of the results
are given as carbon including embodied carbon. The final section gives the results for sequestered carbon.
4.1 Inventory
A summarised inventory of all inputs including materials, energy (kg), transport (tkm) and outputs as waste
with quantities, embodied carbon and embodied energy is given in Table 3.
4.2 Embodied energy
The Fodderty home required a grand total of 718GJ primary energy to produce. This equates to
approximately 8.3GJ per m2 of floor area.
Recent reviews of available studies have found a very wide range of between 1.2 – 16.4 GJ per m2 for the
primary energy used in production 26. The results for this study fall mid-range. However, published studies
are notoriously inconsistent, with different boundaries, calculation methods, data and conversion factors
used. The Fodderty study was comprehensive in its data collection and this analysis includes a wider range
of elements (i.e. decorative finishes, internal fittings, electrical system and water distribution).
The remainder of this report presents the results of the carbon footprint (using either kg or tonnes of CO2e).
25
http://www.wrap.org.uk/sites/files/wrap/WRAP%20tool%20volume%20to%20mass%20conversion%20factors1.xls 26
Yung, P., K.C. Lam, and C. Yu 2013: An audit of life cycle energy analyses of buildings. Habitat International. 39(0): p. 43-54
17
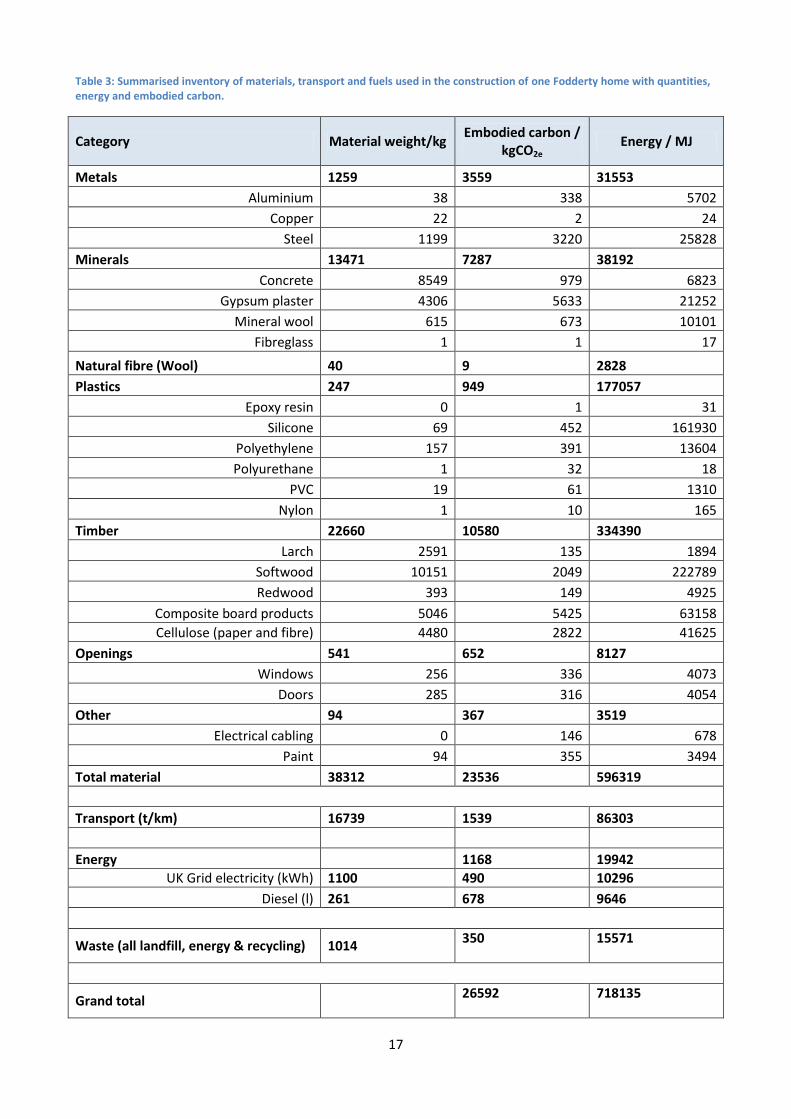
Table 3: Summarised inventory of materials, transport and fuels used in the construction of one Fodderty home with quantities, energy and embodied carbon.
Category Material weight/kg Embodied carbon /
kgCO2e Energy / MJ
Metals 1259 3559 31553
Aluminium 38 338 5702
Copper 22 2 24
Steel 1199 3220 25828
Minerals 13471 7287 38192
Concrete 8549 979 6823
Gypsum plaster 4306 5633 21252
Mineral wool 615 673 10101
Fibreglass 1 1 17
Natural fibre (Wool) 40 9 2828
Plastics 247 949 177057
Epoxy resin 0 1 31
Silicone 69 452 161930
Polyethylene 157 391 13604
Polyurethane 1 32 18
PVC 19 61 1310
Nylon 1 10 165
Timber 22660 10580 334390
Larch 2591 135 1894
Softwood 10151 2049 222789
Redwood 393 149 4925
Composite board products 5046 5425 63158
Cellulose (paper and fibre) 4480 2822 41625
Openings 541 652 8127
Windows 256 336 4073
Doors 285 316 4054
Other 94 367 3519
Electrical cabling 0 146 678
Paint 94 355 3494
Total material 38312 23536 596319
Transport (t/km) 16739 1539 86303
Energy 1168 19942
UK Grid electricity (kWh) 1100 490 10296
Diesel (l) 261 678 9646
Waste (all landfill, energy & recycling) 1014 350 15571
Grand total
26592 718135
18
4.3 Carbon
4.3.1 Embodied carbon (Carbon emissions kg CO2e)
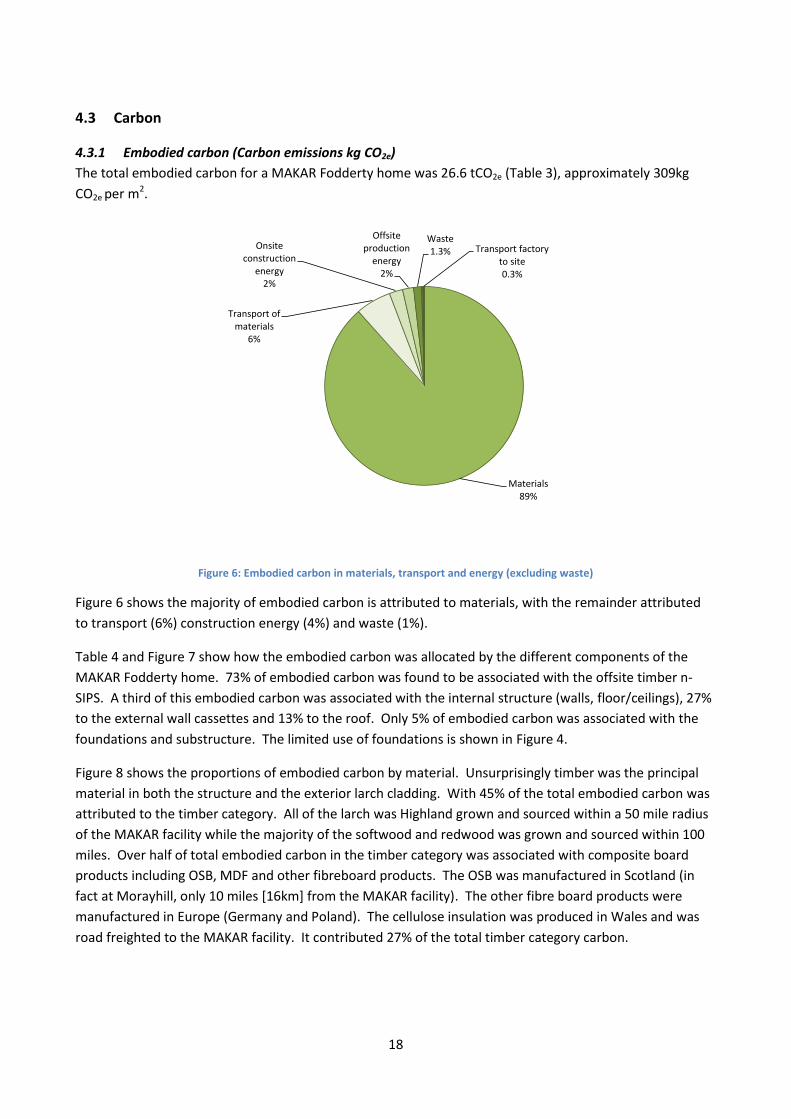
The total embodied carbon for a MAKAR Fodderty home was 26.6 tCO2e (Table 3), approximately 309kg
CO2e per m2.
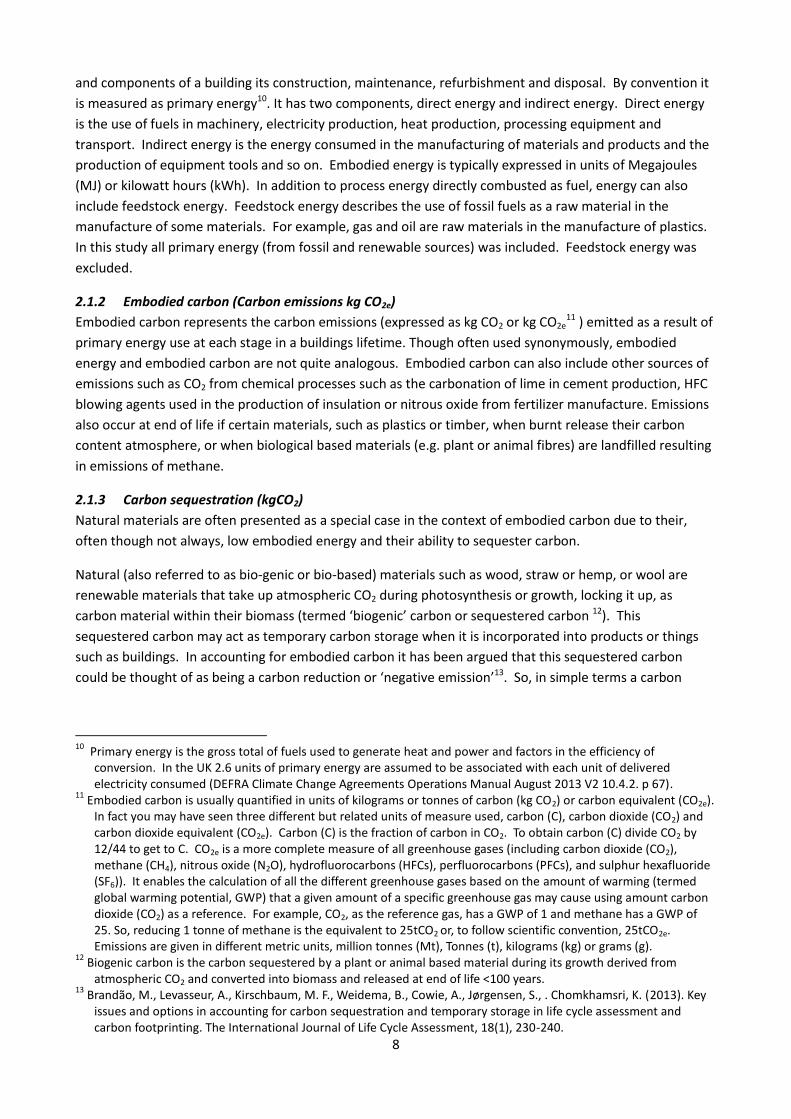
Figure 6: Embodied carbon in materials, transport and energy (excluding waste)
Figure 6 shows the majority of embodied carbon is attributed to materials, with the remainder attributed
to transport (6%) construction energy (4%) and waste (1%).
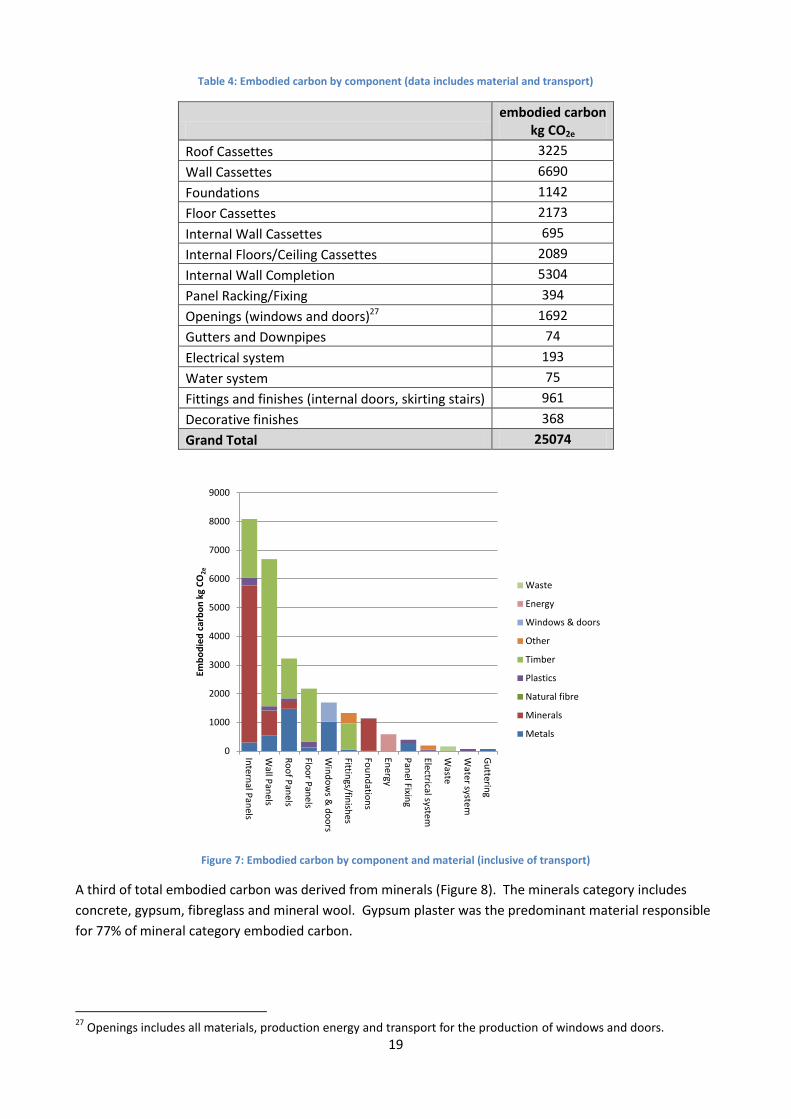
Table 4 and Figure 7 show how the embodied carbon was allocated by the different components of the
MAKAR Fodderty home. 73% of embodied carbon was found to be associated with the offsite timber n-
SIPS. A third of this embodied carbon was associated with the internal structure (walls, floor/ceilings), 27%
to the external wall cassettes and 13% to the roof. Only 5% of embodied carbon was associated with the
foundations and substructure. The limited use of foundations is shown in Figure 4.
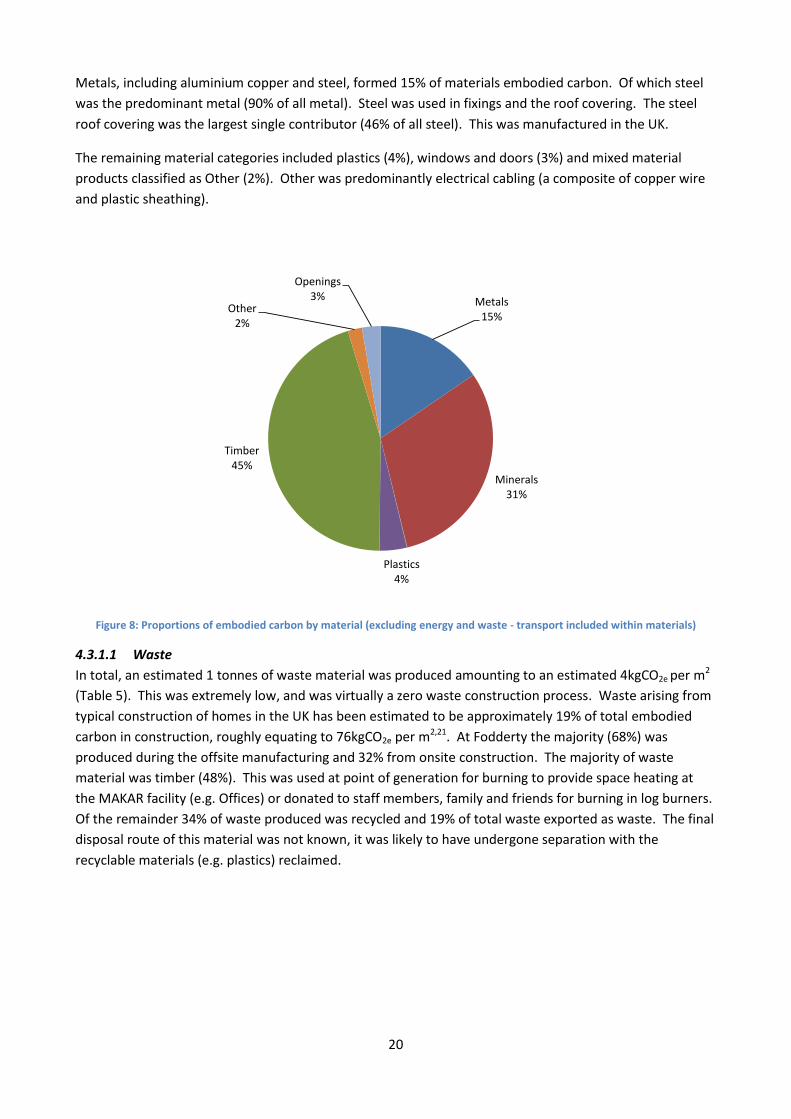
Figure 8 shows the proportions of embodied carbon by material. Unsurprisingly timber was the principal
material in both the structure and the exterior larch cladding. With 45% of the total embodied carbon was
attributed to the timber category. All of the larch was Highland grown and sourced within a 50 mile radius
of the MAKAR facility while the majority of the softwood and redwood was grown and sourced within 100
miles. Over half of total embodied carbon in the timber category was associated with composite board
products including OSB, MDF and other fibreboard products. The OSB was manufactured in Scotland (in
fact at Morayhill, only 10 miles [16km] from the MAKAR facility). The other fibre board products were
manufactured in Europe (Germany and Poland). The cellulose insulation was produced in Wales and was
road freighted to the MAKAR facility. It contributed 27% of the total timber category carbon.
Materials89%
Transport of materials
6%
Onsite construction
energy2%
Offsite production
energy2%
Waste1.3% Transport factory
to site0.3%
19
Table 4: Embodied carbon by component (data includes material and transport)
embodied carbon kg CO2e
Roof Cassettes 3225
Wall Cassettes 6690
Foundations 1142
Floor Cassettes 2173
Internal Wall Cassettes 695
Internal Floors/Ceiling Cassettes 2089
Internal Wall Completion 5304
Panel Racking/Fixing 394
Openings (windows and doors)27 1692
Gutters and Downpipes 74
Electrical system 193
Water system 75
Fittings and finishes (internal doors, skirting stairs) 961
Decorative finishes 368
Grand Total 25074
Figure 7: Embodied carbon by component and material (inclusive of transport)
A third of total embodied carbon was derived from minerals (Figure 8). The minerals category includes
concrete, gypsum, fibreglass and mineral wool. Gypsum plaster was the predominant material responsible
for 77% of mineral category embodied carbon.
27
Openings includes all materials, production energy and transport for the production of windows and doors.
0
1000
2000
3000
4000
5000
6000
7000
8000
9000
Intern
al Pan
els
Wall P
anels
Ro
of P
anels
Floo
r Pan
els
Win
do
ws &
do
ors
Fittings/fin
ishes
Fou
nd
ation
s
Energy
Pan
el Fixing
Electrical system
Waste
Water system
Gu
ttering
Emb
od
ied
car
bo
n k
g C
O2e
Waste
Energy
Windows & doors
Other
Timber
Plastics
Natural fibre
Minerals
Metals
20
Metals, including aluminium copper and steel, formed 15% of materials embodied carbon. Of which steel
was the predominant metal (90% of all metal). Steel was used in fixings and the roof covering. The steel
roof covering was the largest single contributor (46% of all steel). This was manufactured in the UK.
The remaining material categories included plastics (4%), windows and doors (3%) and mixed material
products classified as Other (2%). Other was predominantly electrical cabling (a composite of copper wire
and plastic sheathing).
Figure 8: Proportions of embodied carbon by material (excluding energy and waste - transport included within materials)
4.3.1.1 Waste
In total, an estimated 1 tonnes of waste material was produced amounting to an estimated 4kgCO2e per m2
(Table 5). This was extremely low, and was virtually a zero waste construction process. Waste arising from
typical construction of homes in the UK has been estimated to be approximately 19% of total embodied
carbon in construction, roughly equating to 76kgCO2e per m2,21. At Fodderty the majority (68%) was
produced during the offsite manufacturing and 32% from onsite construction. The majority of waste
material was timber (48%). This was used at point of generation for burning to provide space heating at
the MAKAR facility (e.g. Offices) or donated to staff members, family and friends for burning in log burners.
Of the remainder 34% of waste produced was recycled and 19% of total waste exported as waste. The final
disposal route of this material was not known, it was likely to have undergone separation with the
recyclable materials (e.g. plastics) reclaimed.
Metals15%
Minerals31%
Plastics4%
Timber45%
Other2%
Openings3%
21
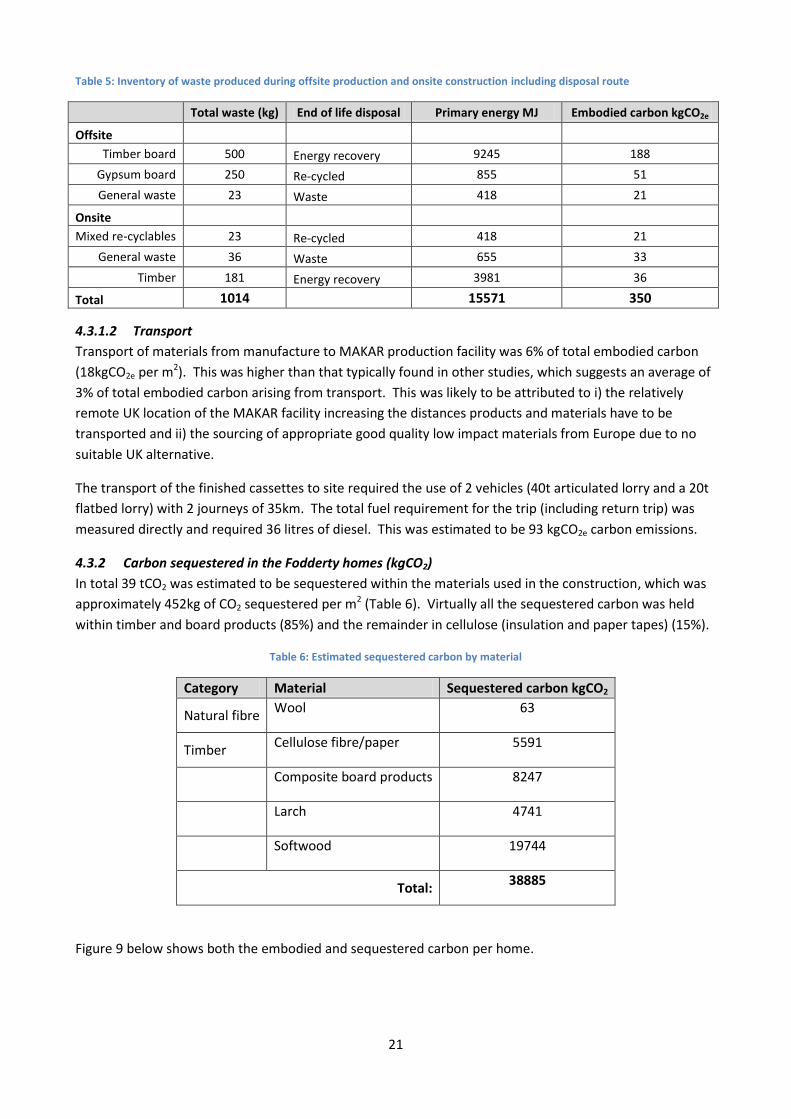
Table 5: Inventory of waste produced during offsite production and onsite construction including disposal route
Total waste (kg) End of life disposal Primary energy MJ Embodied carbon kgCO2e
Offsite
Timber board 500 Energy recovery 9245 188
Gypsum board 250 Re-cycled 855 51
General waste 23 Waste 418 21
Onsite
Mixed re-cyclables 23 Re-cycled 418 21
General waste 36 Waste 655 33
Timber 181 Energy recovery 3981 36
Total 1014
15571 350
4.3.1.2 Transport
Transport of materials from manufacture to MAKAR production facility was 6% of total embodied carbon
(18kgCO2e per m2). This was higher than that typically found in other studies, which suggests an average of
3% of total embodied carbon arising from transport. This was likely to be attributed to i) the relatively
remote UK location of the MAKAR facility increasing the distances products and materials have to be
transported and ii) the sourcing of appropriate good quality low impact materials from Europe due to no
suitable UK alternative.
The transport of the finished cassettes to site required the use of 2 vehicles (40t articulated lorry and a 20t
flatbed lorry) with 2 journeys of 35km. The total fuel requirement for the trip (including return trip) was
measured directly and required 36 litres of diesel. This was estimated to be 93 kgCO2e carbon emissions.
4.3.2 Carbon sequestered in the Fodderty homes (kgCO2)
In total 39 tCO2 was estimated to be sequestered within the materials used in the construction, which was
approximately 452kg of CO2 sequestered per m2 (Table 6). Virtually all the sequestered carbon was held
within timber and board products (85%) and the remainder in cellulose (insulation and paper tapes) (15%).
Table 6: Estimated sequestered carbon by material
Category Material Sequestered carbon kgCO2
Natural fibre Wool 63
Timber Cellulose fibre/paper 5591
Composite board products 8247
Larch 4741
Softwood 19744
Total: 38885
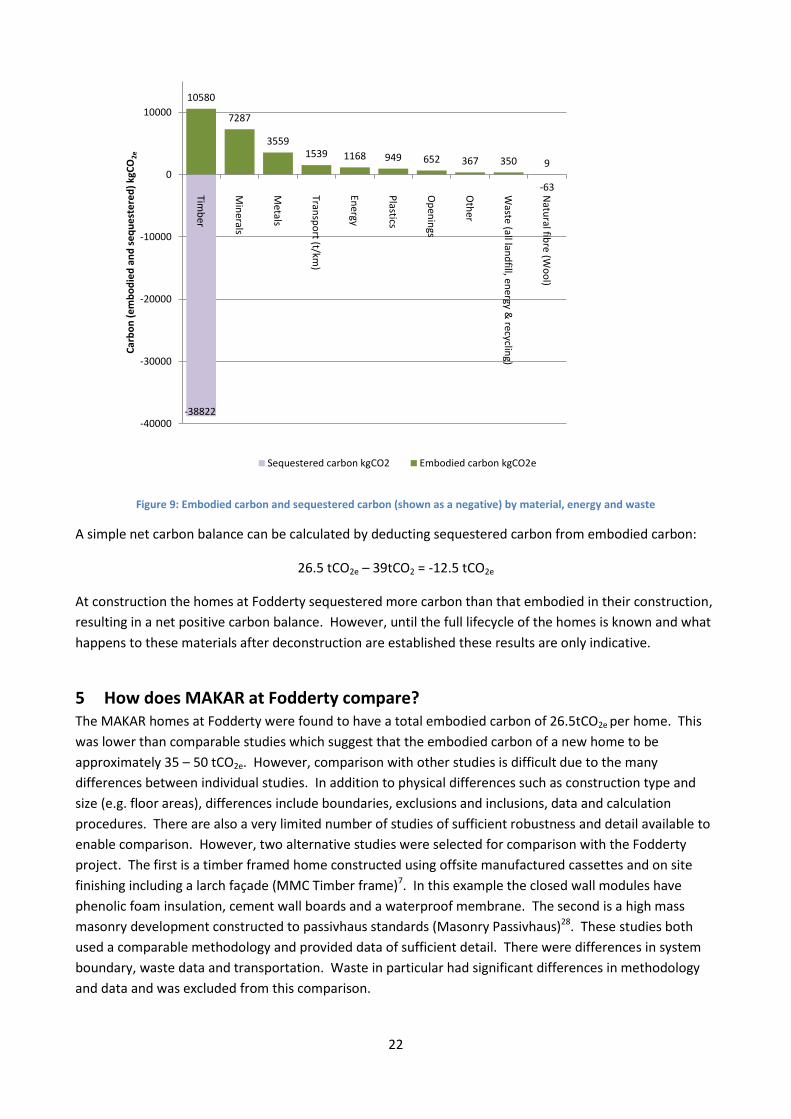
Figure 9 below shows both the embodied and sequestered carbon per home.
22
Figure 9: Embodied carbon and sequestered carbon (shown as a negative) by material, energy and waste
A simple net carbon balance can be calculated by deducting sequestered carbon from embodied carbon:
26.5 tCO2e – 39tCO2 = -12.5 tCO2e
At construction the homes at Fodderty sequestered more carbon than that embodied in their construction,
resulting in a net positive carbon balance. However, until the full lifecycle of the homes is known and what
happens to these materials after deconstruction are established these results are only indicative.
5 How does MAKAR at Fodderty compare? The MAKAR homes at Fodderty were found to have a total embodied carbon of 26.5tCO2e per home. This
was lower than comparable studies which suggest that the embodied carbon of a new home to be
approximately 35 – 50 tCO2e. However, comparison with other studies is difficult due to the many
differences between individual studies. In addition to physical differences such as construction type and
size (e.g. floor areas), differences include boundaries, exclusions and inclusions, data and calculation
procedures. There are also a very limited number of studies of sufficient robustness and detail available to
enable comparison. However, two alternative studies were selected for comparison with the Fodderty
project. The first is a timber framed home constructed using offsite manufactured cassettes and on site
finishing including a larch façade (MMC Timber frame)7. In this example the closed wall modules have
phenolic foam insulation, cement wall boards and a waterproof membrane. The second is a high mass
masonry development constructed to passivhaus standards (Masonry Passivhaus)28. These studies both
used a comparable methodology and provided data of sufficient detail. There were differences in system
boundary, waste data and transportation. Waste in particular had significant differences in methodology
and data and was excluded from this comparison.
-38822
-63
10580
7287
35591539 1168 949 652 367 350 9
-40000
-30000
-20000
-10000
0
10000
Timb
er
Min
erals
Metals
Transp
ort (t/km
)
Energy
Plastics
Op
enin
gs
Oth
er
Waste (all lan
dfill, en
ergy & recyclin
g)
Natu
ral fibre (W
oo
l)
Car
bo
n (
em
bo
die
d a
nd
se
qu
est
ere
d)
kgC
O2e
Sequestered carbon kgCO2 Embodied carbon kgCO2e
23
Due the differences between the different studies the following comparison is only indicative of the
comparative carbon emissions of the MAKAR Fodderty development. It does not allow for robust
conclusions to be drawn.
The following results shown refer only to the cradle to construction of the structure and exclude fittings,
finishes, services and energy technology. Consequently, to facilitate this comparison, the Fodderty figure is
289kgCO2e rather than the 309 kgCO2e shown elsewhere in this report.
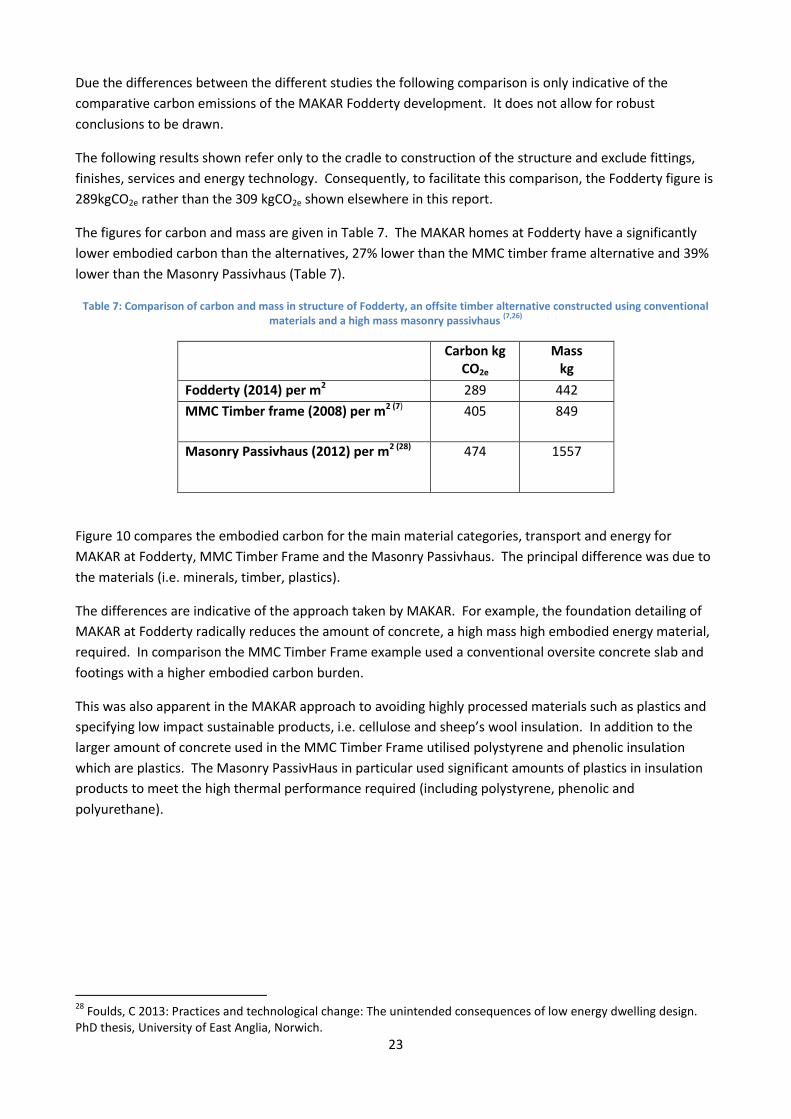
The figures for carbon and mass are given in Table 7. The MAKAR homes at Fodderty have a significantly
lower embodied carbon than the alternatives, 27% lower than the MMC timber frame alternative and 39%
lower than the Masonry Passivhaus (Table 7).
Table 7: Comparison of carbon and mass in structure of Fodderty, an offsite timber alternative constructed using conventional materials and a high mass masonry passivhaus
(7,26)
Carbon kg CO2e
Mass kg
Fodderty (2014) per m2 289 442
MMC Timber frame (2008) per m2 (7) 405 849
Masonry Passivhaus (2012) per m2 (28) 474 1557
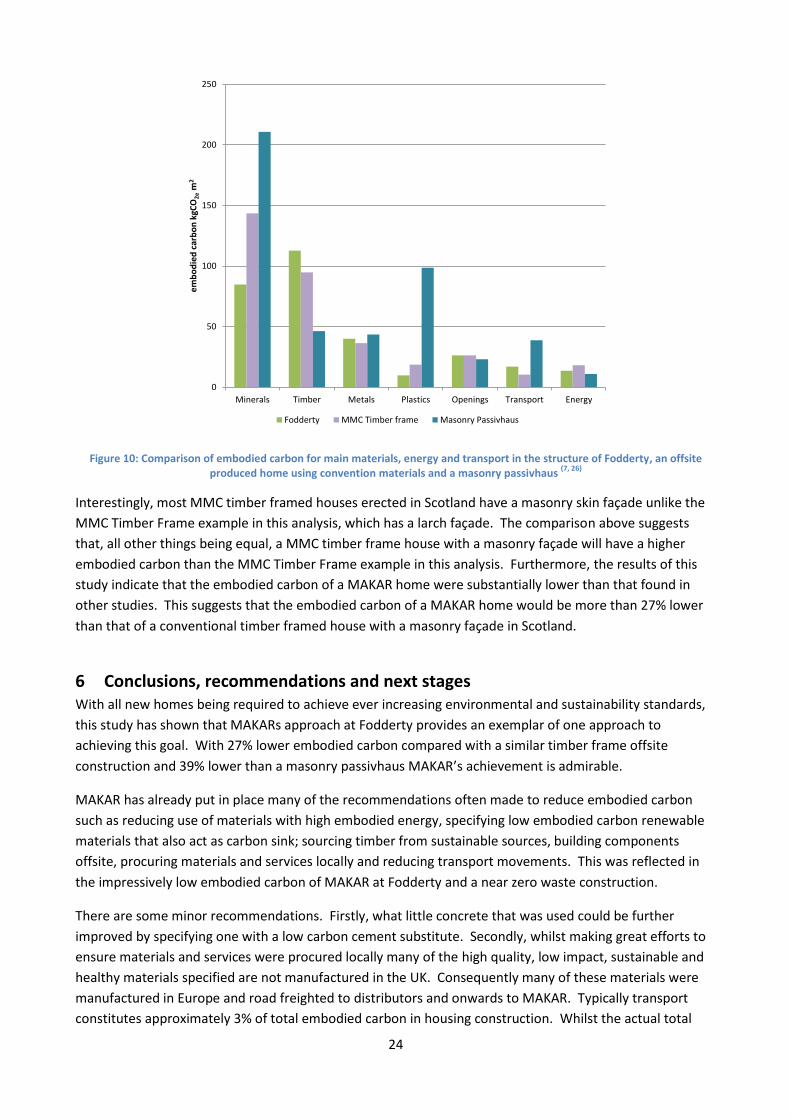
Figure 10 compares the embodied carbon for the main material categories, transport and energy for
MAKAR at Fodderty, MMC Timber Frame and the Masonry Passivhaus. The principal difference was due to
the materials (i.e. minerals, timber, plastics).
The differences are indicative of the approach taken by MAKAR. For example, the foundation detailing of
MAKAR at Fodderty radically reduces the amount of concrete, a high mass high embodied energy material,
required. In comparison the MMC Timber Frame example used a conventional oversite concrete slab and
footings with a higher embodied carbon burden.
This was also apparent in the MAKAR approach to avoiding highly processed materials such as plastics and
specifying low impact sustainable products, i.e. cellulose and sheep’s wool insulation. In addition to the
larger amount of concrete used in the MMC Timber Frame utilised polystyrene and phenolic insulation
which are plastics. The Masonry PassivHaus in particular used significant amounts of plastics in insulation
products to meet the high thermal performance required (including polystyrene, phenolic and
polyurethane).
28
Foulds, C 2013: Practices and technological change: The unintended consequences of low energy dwelling design. PhD thesis, University of East Anglia, Norwich.
24
Figure 10: Comparison of embodied carbon for main materials, energy and transport in the structure of Fodderty, an offsite produced home using convention materials and a masonry passivhaus
(7, 26)
Interestingly, most MMC timber framed houses erected in Scotland have a masonry skin façade unlike the
MMC Timber Frame example in this analysis, which has a larch façade. The comparison above suggests
that, all other things being equal, a MMC timber frame house with a masonry façade will have a higher
embodied carbon than the MMC Timber Frame example in this analysis. Furthermore, the results of this
study indicate that the embodied carbon of a MAKAR home were substantially lower than that found in
other studies. This suggests that the embodied carbon of a MAKAR home would be more than 27% lower
than that of a conventional timber framed house with a masonry façade in Scotland.
6 Conclusions, recommendations and next stages With all new homes being required to achieve ever increasing environmental and sustainability standards,
this study has shown that MAKARs approach at Fodderty provides an exemplar of one approach to
achieving this goal. With 27% lower embodied carbon compared with a similar timber frame offsite
construction and 39% lower than a masonry passivhaus MAKAR’s achievement is admirable.
MAKAR has already put in place many of the recommendations often made to reduce embodied carbon
such as reducing use of materials with high embodied energy, specifying low embodied carbon renewable
materials that also act as carbon sink; sourcing timber from sustainable sources, building components
offsite, procuring materials and services locally and reducing transport movements. This was reflected in
the impressively low embodied carbon of MAKAR at Fodderty and a near zero waste construction.
There are some minor recommendations. Firstly, what little concrete that was used could be further
improved by specifying one with a low carbon cement substitute. Secondly, whilst making great efforts to
ensure materials and services were procured locally many of the high quality, low impact, sustainable and
healthy materials specified are not manufactured in the UK. Consequently many of these materials were
manufactured in Europe and road freighted to distributors and onwards to MAKAR. Typically transport
constitutes approximately 3% of total embodied carbon in housing construction. Whilst the actual total
0
50
100
150
200
250
Minerals Timber Metals Plastics Openings Transport Energy
em
bo
die
d c
arb
on
kgC
O2e
m2
Fodderty MMC Timber frame Masonry Passivhaus
25
embodied carbon in transport was not high, in comparison with other studies it was found to be higher
than average at MAKAR’s Fodderty development. This was likely to be a consequence of the overall greater
transportation miles associated with the remote location of MAKAR’s base relative to the place of
manufacture of materials and components, and is beyond MAKAR’s control. It may also be a consequence
of the comprehensive and accurate data collected. Other studies base their estimates on assumptions
which could lead to an underestimation of transport related embodied carbon.
This embodied carbon study represents a first step towards a full lifecycle assessment of MAKAR at
Fodderty. A final recommendation is to expand the embodied carbon study boundary to the other lifecycle
stages. A post occupancy evaluation to assess the energy demand and householders view of their homes is
planned. Understanding the relationship between construction and the later stages including
refurbishment and end of life are also critical. For example, determining refurbishment or end of life
carbon can be significant in answering questions such as is it worth investing in measures at the design/
manufacturing stage in order to reduce embodied carbon at the end of life. This can be done by designing
the cassettes to be dismantled for reconfiguration, refurbishment and reuse, or deconstructed into
separate materials for recycling. MAKAR is already designing cassettes (panels) so that they can be
deconstructed and re-used. They are inherently repairable and adaptable.
MAKAR at Fodderty has also demonstrated that significant volumes of carbon can be sequestered in new
homes. However, claims of homes acting as carbon sinks are only valid for as long as those materials
remain in circulation. Understanding the later lifecycle stages and how the MAKAR system can be
improved to facilitate deconstruction and reuse could suggest ways to achieve the transition towards a
circular economy29 in construction.
29
A circular economy is an alternative to a traditional linear economy (make, use, dispose) in which we keep resources in use for as long as possible, extract the maximum value from them whilst in use, then recover and regenerate products and materials at the end of each service life.