Major Project (Ramit)
62
Investment Opportunities in Indian Telecom Infrastructure Sector Major Project report Submitted by: Ramit Malhotra In partial fulfillment for the Degree of MBA (Infrastructure) Submitted to: Department o f Po licy Studies TERI University Pl o t No. 10 Instituti onal A rea Vasant Kunj, New Delhi-70 INDIA 25 th , May 2009
Transcript of Major Project (Ramit)
882019 Major Project (Ramit)
httpslidepdfcomreaderfullmajor-project-ramit 162
Investment Opportunities in IndianTelecom Infrastructure Sector
Major Project report
Submitted byRamit Malhotra
In partial fulfillment for the Degree of MBA (Infrastructure)
Submitted toDepartment o f Policy Studies
TERI UniversityPlot No 10 Institutional AreaVasant Kunj New Delhi-70
INDIA
25 th May 2009
882019 Major Project (Ramit)
httpslidepdfcomreaderfullmajor-project-ramit 262
Declaration
This report has been prepared by Ramit Malhotra student of MBA (Infrastructure
program at TERI University
The Report has been prepared based on the information and documents made available
by ABC Limited It includes certain statements estimates and projections made by
promoters of the company Actual results may vary from the projected results contained
herein It should be recognized that projections of future events are inherently subject to
significant economic regulatory policy and competitive uncertainties or other force
majeure circumstances and that actual results for the periods covered thereby may vary
materially from the projected results There cannot be any assurance that the
assumptions or data upon which these projections have been based are accurate or that
the results contained in the projections will be realized
No representation warranty or undertaking (expressed or implied) is made and noresponsibility is accepted by me or PricewaterhouseCoopers or TERI University as to
the accuracy adequacy completeness or reasonableness of the facts opinions
estimates forecasts projections or other information set forth in this report or the
underlying assumptions on which they are based or the accurac y of any computer model
used and nothing contained herein is or shall be relied upon as a promise or
representation regarding the future events or performance of the project
882019 Major Project (Ramit)
httpslidepdfcomreaderfullmajor-project-ramit 362
TERI UniversityFINAL REPORT SUBMISSION FORM
1 Name of the student Ramit Malhotra
2 Program MBA (Infrastructure)
3 Name of the Internal Supervisor from TERI University Dr Saon Ray
4 Name of the external supervisor from Mrs Sakshi Marwah
5 Title of the research project Inves tment Opportunitiesin Indian TelecomInfrastructure Sector
6 Date of completion of project
Signature of the student
Signature of external guide Signature of internal guide
Name and des ignation Name and des ignation
Date Date
882019 Major Project (Ramit)
httpslidepdfcomreaderfullmajor-project-ramit 462
Acknowledgement
I offer my reverences to TERI University by whose efforts I have been able to complete
my major project at PricewaterhouseCoopers
The persons who shaped my efforts and provided the guidance to me are none other than
my renowned faculty members Dr Saon Ray Dr Kaushik Deb and Dr Neeraj Khera I
feel highly privileged to express my sincere regards and gratitude to them for their
dynamic leadership guidance careful supervision invaluable suggestions and liberal
attitude during the course of my dissertation
Also my endeavors at this project could not have been satisfactorily completed without
the active participation and co-operation of Mr Deepak Mahurkar Mr Manish Bhagla
Mr K Ramachanran and Mrs Sakshi Marwah I am really thankful to them for their
guidance and co-operation
I also acknowledge and express my deepest gratitude to all the team members of PwC
GRID for guiding me throughout the project I am indebted to them for extending their
valuable guidance comments suggestions and inspiration for this project
(RAMIT MALHOTRA)
882019 Major Project (Ramit)
httpslidepdfcomreaderfullmajor-project-ramit 562
Table of Contents
ABBREVIATIONS I
ABSTRACT II
LIST OF TABLES IV
LIST OF FIGURES IV
1 INTRODUCTION 1
2 OBJECTIVES 5
3 LITERATURE REVIEW 6
31 INTERNATIONAL EXPERIENCE IN INFRASTRUCTURE SHARING 6
32 DOMESTIC TELECOM MARKET ASSESSMENT 9 33 TELECOM MARKET - COMPETITIVE LANDSCAPE 11 34 TELECOM INFRASTRUCTURE OVERVIEW 13 35 TELECOM INFRASTRUCTURE - DOMESTIC MARKET 15 36 TELECOM INFRASTRUCTURE MARKET - COMPETITIVE LANDSCAPE 16
4 BUSINESS PLAN 19
41 PASSIVE INFRASTRUCTURE 19 42 INFRASTRUCTURE SHARING 19 43 INT RODUCTION TO THE BUSINESS 20 44 BUSINESS PROPOSAL 21 47 EXPANSION SCHEDULE 24 48 PROPOSED SERVICES 24 49 PROPOSED ORGANIZATIONAL STRUCTURE 25
5 METHODOLOGY 27
6 OBSERVATIONS AND ANALYSIS 31
61 DEAL DIAGRAM 31 62 FUNDING PLAN 32 63 RESULTS 32 64 SENSITIVITY ANALYSIS 34
7 RISK ASSESSMENT 39
8 CONCLUSION 41
REFERENCES 46
ANNEXURES 47
882019 Major Project (Ramit)
httpslidepdfcomreaderfullmajor-project-ramit 662
i
ABBREVIATIONS
ARPU Average Revenue per User BOO Build Own OperateBTS Base Trans-receiver StationCDMA Code Division Multiple AccessCOAI Cellular Operators Association of IndiaDoT Department of TelecommunicationsDSCR Debt Service Coverage RatioEBITDA Earnings Before Interest Tax Deprec iation and AmortizationEIRR Equity Internal Rate of ReturnFCFE Free Cash Flow to EquityFDI Foreign Direct InvestmentGBS Ground Based Site
GBT Ground Based TowerGSM Global System for Mobile CommunicationIP Infrastructure ProviderIRR Internal Rate of ReturnIT Information TechnologyLFCF Levered Free Cash Flow to FirmLOI Letter of IntentMSI Managed Services InfrastructureNOC Network Operat ing CentrePAT Profit After TaxPIRR Project Internal Rate of Return
QoS Quality of ServiceTRAI Teleco m Regulatory Authority of IndiaROA Return on AssetROE Return on EquityRTS Roof Top SiteRTT Roof Top TowerSLA Service Level AgreementSLM Straight Line MethodTRAI Teleco m Regulatory Authority of IndiaUFCF Unlevered Free Cash Flow to FirmVPN Virtual Private Network WACC Weighted Average Cost of CapitalWC Working CapitalWLL Wireless Local Loop
882019 Major Project (Ramit)
httpslidepdfcomreaderfullmajor-project-ramit 762
ii
ABSTRACTIndian telecom industry was dominated by government organization till 1991 after which
many private players have entered into this market Since its liberalization the industry
has experienced impressive growth because of strong demand investor friendlyregulatory schemes and strengthening economy At present India is the second largest
mobile market in the world and is also among the fastest growing mobile markets
globally The total number of mobile subscribers in India (ie the subscriber base) has
crossed 300 million with 30049 million subscribers as on 31st March 2008 (TRAI
database)
With increase in market competition and pressure on margins telecom service providers
are being forced to increase their focus on marketing and customer acquisition This has
led to opportunities in passive infrastructure outsourcing to independent third party
infrastructure providers and also sharing the infrastructure with other service providers
Recently Telecom Regulatory Authority of India has awarded new licenses to new
players such as Unitech Swan Telecom and S Tel Limited The significant expansion
plans of the new entrants and their need to optimize investments so that they can compete
with existing players will further drive the demand of passive infrastructure in the
country
ABC Limited is an independent infrastructure provider company which proposes to buildown and operate passive infrastructure sites for telecom service providers ABC Limited
is planning to raise capital to start its operation in FY 10 Based on the details regarding
capital expenditure operating expenditures and future expansion plans of ABC Limited
provided by the promoter of the company a detailed financial model has been prepared
and key financial ratios has been estimated to assess the financial feasibility and returns
on investment
Total investment required to meet the target of around 12000 tower sites (both GBT and
RTT) is estimated to be INR 36343 million ABC has planned to raise 70 of required
capital through long term debt and remaining as equity Results of financial model shows
that IRR for such project will be more than 18 and equity IRR will be around 36
provided that ABC will meet the above target of 12000 tower sites by FY14 Project IRR
is very sensitive to Capital costs tenancy ratio and monthly tariff for each site On the
882019 Major Project (Ramit)
httpslidepdfcomreaderfullmajor-project-ramit 862
iii
other hand equity IRR is sensitive to loan moratorium period and interest rate on long
term debt The project will generate enough cash flows to cover its debt obligation and
also to generate high return on equity invested
882019 Major Project (Ramit)
httpslidepdfcomreaderfullmajor-project-ramit 962
iv
LIST OF TABLESTable 31 Telecom Circles 17 Table 41 Expansion Plan 31
Table 61 Funding Proposal 39 Table 62 Income Statement 39 Table 63 Balance Sheet 40 Table 64 Key financial ratios 40 Table 65 Profitability ratios 41 Table 66 F inancial returns 41 Table 91 Expected Tenancy Ratios 50 Table 92 GBT and RTT Capital Cost 51 Table 93 Operating Costs 52 Table 94 Long term debt 52 Table 95 GBT and RTT Tariff 53 Table 96 Life of the project 53 Table 97 Profit amp loss acco unt statement 54 Table 98 Balance sheets 55 Table 99 Cash flow statements 56
LIST OF FIGURES
Figure 3-1 Growth of Subscriber base 10 Figure 3-2 Mobile Penetration Rate 10 Figure 3-3 Market Share 11
Figure 3-4 Licensed Circles 12 Picture 3 1 Telecom Tower 14 Figure 3-5 Telecom Infrastructure Market Players 16 Figure 3-6 Telecom Tower Growth Scenario 17 Figure 6-1 Project IRR vs GBT and RTT CAPEX 35 Figure 6-2 Project IRR vs GBT Tariff 36 Figure 6-3 Project IRR vs RTT Tariff 36 Figure 6-4 Project IRR vs Tenancy ratio for RTT sites and GBT sites 37 Figure 6-5 Equity IRR vs long term debt interest rate for different leverage level 37 Figure 6-6 Equity IRR vs long term debt repayment period at different level of moratorium periods 38
882019 Major Project (Ramit)
httpslidepdfcomreaderfullmajor-project-ramit 1062
1
1 INTRODUCTION
ABC Ltd 1 is an Infrastructure Provider company that builds owns operates and
maintains passive network infrastructure on a shared basis for mobile telecom operators
and ITES providers The Company was formed in Jan 2009 Its objective is to provide
network design and planning network deployment network operations amp maintenance
infrastructure management application management and professional services to telecom
operators and enterprises
The company is planning to raise capital in the form of equity and debt to start its
operation by Aug 09 The purpose of this project is to prepare detailed financial model
for assessment of feasibility of such projects building scenarios and sensitivity charts
calculation of risk and returns associated with the project and valuation of ABC Limited
subjected to present and expected future market conditions
ABCrsquos vision is to provide world class managed infrastructure amp allied services to the
service providers to optimize their service delivery capability In the initial years of
operation the company will focus on telecom sector with almost 100 of its proposed
capital expenditure till FY 14 earmarked for developing and owning passive
infrastructure for sharing among mobile service providers
Passive Telecom Infrastructure Sharing
Mobile networks have base stations (or cell sites) which have active and passive
infrastructure components Active components include the antenna trans-receivers
switches feeder cables Node B and microwave radio equipments Passive (or non-electronic) components include the land tower shelter air-conditioning equipment
diesel electric generator battery electrical supply technical premises and easements
pylons etc Passive infrastructure in a mobile network essentially involves acquiring land
1 Actual name o f the company is no t stated as per the instructions given by external supervisor
882019 Major Project (Ramit)
httpslidepdfcomreaderfullmajor-project-ramit 1162
2
setting up towers and electrical and civil works that needs to be in place before operators
can install the active infrastructure which brings mobile services to the consumers In a
typical cell site build-out almost 65 of the total cost is attributed to passive
infrastructure and 35 to active infrastructure In this report passive cell siteinfrastructure has also been henceforth referred to as towers or sites
Mobile operators are required to setup more and more BTS (cell) sites due to the
exponential growth of mobile subscribers in India (currently growing at almost 152
million subscribers a month) and limited availability of spectrum B and C Circles (where
traffic density may not be as high as metros and Circle A) are expected to drive future
subscriber growth and requirements for cell sites will be higher to ensure greater
coverage
To cover large stretch of almost 65000 Kilometers of national highways additional
18000 towers (one tower for every 3 Kilometers of highway) will be required in near
future to ensure better connectivity Proposed build out of 3G networks are expected to
further drive substantial growth in the number of towers over the next few years
However creating new infrastructure by each operator separately leads to duplicating
huge capital investments It also contributes to mushroom growth of telecom towers and
deteriorating skylines in urban areas which has already led to some local municipal and
state governments to regulate and restrict the erection of new mobile towers
The continued pressure on cellular tariffs higher infrastructure costs for network
deployment particularly in semi-urban and rural areas and compelling need to reduce
time to market for network roll outs have led operators to share and even outsource theirinfrastructure requirements from third party infrastructure providers like ABC GTL and
Indus towers
2 As published in ET 8 th May 09 Edition
882019 Major Project (Ramit)
httpslidepdfcomreaderfullmajor-project-ramit 1262
3
Sharing promotes capital efficiency as it allows more than one service provider to
leverage and ride on common infrastructure In its simplest form it involves two or more
operators jointly using the common passive infrastructure in a cell site While viewed
largely as a measure to reduce CAPEX and operating expense such sharing also leads toimprovement of service quality (by ensuring site space for service providers and reducing
black spots) and the environment (by reducing number of cell sites and towers)
In outsourcing operators take passive infrastructure and tower space from third party
infrastructure companies on a monthly rental basis to host their radio and transmission
equipments Outsourcing provides significant benefits to operators It enables them to
save on capital expenditure (it actually converts CAPEX into OPEX in the form of lease
rentals) and focus on their core activities of sales marketing and branding while leavingthe cumbersome task of managing the site development process and site operation and
maintenance to third parties who exclusively deal with such activities
Active infrastructure sharing is not popular across the globe for several reasons the most
important being increased inter dependency among competing service providers
However tower sharing and outsourcing of tower ownership is an accepted practice in
many developed markets In countries like USA UK and Australia there are
independently owned tower companies who rent tower space to various mobile operators
The United States has arguably the most developed independent mobile tower market
with independent tower companies owning over half of all mobile towers in that country
Mobile tower owners generate revenue by owning the towers and leasing space on the
towers to mobile telecommunications operators under long-term contracts Under this
business model ownership of the base station equipments coupled to the towers is
retained by the mobile telecommunications operators In addition to rental payments
mobile tower owners generally receive a fee for installing customers base station
equipment on the tower Mobile tower owners also receive services revenue for
operations and maintenance of the passive infrastructure Regulators all over the world
favor passive sharing of infrastructure
882019 Major Project (Ramit)
httpslidepdfcomreaderfullmajor-project-ramit 1362
4
The concept of passive infrastructure sharing is increasingly gaining market acceptance
in India So far it has been largely limited to bilateral sharing between operators in the
form of barter where the operators split the site related CAPEX and OPEX costs The
available information suggests that about 25 of the existing 90000 tower sites in Indiaare currently being shared for passive infrastructure predominantly in rural areas and
small towns
ABC Limited is expecting to get shortlisted by Department of Telecom for setting up
passive cellular infrastructure in rural areas with support from the Universal Services
Obligations (USO) Fund The recent announcements by some operators like Bharti
Hutch (Vodafone) Reliance Idea for mutual sharing of infrastructure through new
companies and entry of third party infrastructure providers has further expanded the
tower market in India
Results of detailed financial model indicate that with given expansion plans and
assumptions ABC will create value for its shareholders investors clients and promoters
The project is expected to generate high cash flows which will be sufficient enough to
pay back its debt liabilities and to generate and equity IRR of 36
882019 Major Project (Ramit)
httpslidepdfcomreaderfullmajor-project-ramit 1462
5
2 OBJECTIVES
The scope of work for this Study project involves the following
Market assessment for Indian telecom Infrastructure sector
Collection of data related to capital and operating costs (from promoter)
Forecasting operating costs
Preparation of detailed financial model
Calculation of UFCF ( Unlevered Free Cash Flows) LFCF (Levered Free Cash
Flows)
Estimation of Project and Equity IRRrsquos
Preparation of balance sheet PampL and cash flow statement for expected life
cycle of project
Sensitivity analysis and Scenario analysis
882019 Major Project (Ramit)
httpslidepdfcomreaderfullmajor-project-ramit 1562
6
3 LITERATURE REVIEW
31 International Experience in Infrastructure Sharing
Different countries have adopted different approaches in order to safeguard the level of
competitive independence between co-operating operators Measures include mandating
a distinct and differentiated cost base between operators the development of different
business plans marketing and distribution strategies and the independent development or
acquisition of content and services Requiring the independent control over the respective
frequency resources of each operator is also an important competitive safeguard
In the EU for example operators are allowed to share infrastructure as long as they
maintain full operational control of their network Sharing the radio access network is
permitted but sharing frequencies and the core network is not In particular the databases
used to administer subscriber and interconnection information are required to be kept
separate Exemptions however are generally granted in special cases which advance the
objectives of government policy and the economic benefits to the consumers of the
services It is important to note that any infrastructure sharing agreement could also be
subject to review by the EC Commission under Article 81 of the EC Treaty andor the EC
Merger Regulation
USA
In USA the number of wireless service subscribers has increased from 1284 million to
2433 million between December 2001 and December 2007 representing an increase of
approximately 88 and market penetration of approximately 70 The tower business in
USA is a $5 billion industry consolidated around four large players -- American Tower
(ATC) Crown Castle International (CCI ) SBA Communications (SBAC ) and GlobalSignal (GSL ) which control 40 of the approximately 210000 (P amp Lisa 2009) towers
across the US The primary business of these companies involves leasing antenna space
on multi-tenant communications sites to a variety of wireless carriers including radio and
3 Source CTIA-The Wireless Association Website
882019 Major Project (Ramit)
httpslidepdfcomreaderfullmajor-project-ramit 1662
7
television broadcast companies under long-term lease contracts Typically these leases
are long-term (five to 10 year) contracts with renewal terms at the option of the customer
Some co mpanies offer tower related services on a limited basis including site acquisition
zoning and permitting services and structural analysis services and project managementof antenna installations that support their site leasing operations and the addition of new
tenants and equipment on their sites
Towers are a relatively scarce asset in USA as zoning laws often do not permit a new
tower to be built in the immediate vicinity of an existing tower Tenant churn tends to be
low as towers are an integral part of the networks of the wireless service providers
Tenants own their own equipment (and therefore bear the technology risk) generally
handle installation and maintenance and pay for electricity and most ongoing assets
greatly simplifying the tower business model
Germany
In Germany the main concern faced by the regulator involved a possible threat to the
competitive independence of potential 3G operators that could result from a tight
integration of the networks as a result of infrastructure sharing Infrastructure Sharing is
allowed only if the mobile systems can be independently operated for example if they
can be shut down or maintained independently by software and that no customer data is
shared (OECD report 2004) In Germany the sharing of antennae and sites is relatively
common however the sharing of transmission management equipment and core
networks is not commonly done (Vogelsang 2002)
Sweden
In Sweden the regulator has agreed to allow significant infrastructure sharing for 3G
operators Each operator only has to cover 30 of the customers while for the remaining
70 infrastructure can be shared This is the approach being taken by the Europolitan
companies Vodafone Hi3G and Orange which jointly own 3G Infrastructure Services
However with competition concerns the regulator only allows radio components such as
antennas cables and base station electronics to be shared (Khurram Mahmood 2008)
882019 Major Project (Ramit)
httpslidepdfcomreaderfullmajor-project-ramit 1762
8
Singapore
In the case of Singapore the regulatorrsquos infrastructure sharing approach is guided by the
primary policy goal of encouraging facilities-based competition Under the current
regulatory framework licensees are generally not required to share any infrastructure that
it controls with its competitors Each licensee is expected to build or lease the use of the
infrastructure it requires Notwithstanding this however infrastructure sharing is
mandated in areas where there are clear space and operating constraints For 2G and 3G
licensees such matters relate to infrastructure in the Mass Rapid Transit and underground
road tunnels The regulator has also allowed the co-location of base stations and sharing
of transmission towers and masts to reduce the impact on the environment and to
minimize the inconvenience to building owners and residents (IDA 2009)
Malaysia
Taking a different approach in Malaysia operators owning network facilities have been
encouraged by the regulator to share infrastructure as a means of lowering costs and
expanding coverage as well as to avoid a duplication of resources To this effect a
Memorandum of Understanding to share infrastructure has been executed between the
mobile operators To further catalyze infrastructure sharing the concept of a third party
provider of facilities is also being promoted in Malaysia Under this concept of a third
party will build the infrastructure and lease capacity or space to existing se rvice
providers This concept not only provides ready-made sites but will also help reduce the
numbers of telecommunication towers that have to be dealt with by local authorities
(MAXIS 2009)
882019 Major Project (Ramit)
httpslidepdfcomreaderfullmajor-project-ramit 1862
9
32 Domestic Telecom Market assessment
The Indian Telecom Industry-Historical perspective
The Indian telecommunication industry was originally a government controlled
monopoly comprising three state owned operators
MTNL (which provided wire-line services in Mumbai and Delhi metropolitan
areas)
DOT (which provided wire-line services to rest of the country)
VSNL (which provided international services)
Liberalization started in 1991 with opening up of mobile services to private sectorparticipation The country was divided into 23 circles comprising of four metropol9otan
areas (Chennai Delhi Kolkata and Mumbai) and 19 other circles broadly defined by
parameters of states (K 2008) These 19 non-metropolitan circles have been categorized
as A B and C circles in descending order of their revenue generation potential (as
shown below)
Table 31 Telecom Circles
MetropolitanAreas Circle A Circle B Circle C
Delhi ChennaiMumbai Kolkata
Gujarat KarnatakaAP Tamil NaduMaharashtra
Punjab Kera laHaryana UP (West)Rajasthan UP(East) MP WestBengal
HP JampK North-East OrissaAssam Bihar
In 1997 TRAI was formed for regulating the operations and policy making process of
Indian telecommunication sector Since its liberalization India has experienced sustained
and impressive growth in its telecommunication sector primarily because of progressive
regulatory regime strong demand for mobile telecommunication services and
strengthening economy The country has achieved distinction of having worldrsquos lowest
tariff fastest growth ion subscriber base and availability of some of the cheapest mobile
handsets
882019 Major Project (Ramit)
httpslidepdfcomreaderfullmajor-project-ramit 1962
10
Figure 3-1 Growth of Subscriber base
Growth of Subscriber base
050
100150200250300350
1998 1999 2000 2001 2002 2003 2004 2005 2006 2007 2008
Year
M i l l i o n
Source Telecom Regulatory Authority of India Database
India is the second largest mobile market in the world is also among the fastest growing
mobile markets globally The total number of mobile subscribers in India (ie the
subscriber base) has crossed 300 million with 30049 million subscribers as on 31st
March 2008 The growth of subscriber base during the past decade (1998-2008) is
indicated above in a chart
Figure 3-2 Mobile Penetration Rate
0 10 20 30 40 50 60 70 80 90 100
North-East ( C)Assam (C)
Bihar ( C)Jammu amp Kashmir (C)
Orissa (C)Him achal Pradesh (C)
Uttar Pradesh ( B)Madhya Pradesh (B)
Rajastan (B)Haryana (B)
Punjab (B)West Bengal (B)
Kerala (B)Maharashtra (A)
Gujarat (A)Tamil Nadu (A)
Andhra Pradesh (A)Karnataka (A)
Kolkata (Metro)Chennai (Metro)Mumbai (Metro)
Delhi (Metro)
Source TRAI and PwC DatabaseNote As on Dec 08
882019 Major Project (Ramit)
httpslidepdfcomreaderfullmajor-project-ramit 2062
11
Indian telecom industry has experienced a high growth rate in Metros and class A circles
with coverage reaching around 90 and 35 respectively However coverage in the
Class B and Class C cities is still low at 15-25 Growth in Class B and Class C circles
has concentrated in urban area while penetration in rural area remains lower Thus futuregrowth is likely to come largely from Class B and C circles and rural areas Keeping this
in view larger players like Bharti Airtel Limited Reliance Communications Limited and
Bharat Sanchar Nigam Limited (BSNL) are largely focusing on increasing their
geographical coverage in Class B and C c ircles
33 Telecom Market- Competitive landscape
Figure 3-3 Market Share
Bharti2668
BSNLMTNL1908
Reliance1971
Vodafone661
Tata1047
Idea1033
Aircel457
Spice181
BPL056
HFCL013
Shyam005
Market Share
Source TRAI and Pw C Database
Indian mobile sector is largely concentrated with top 4 market players (Bharti Airtel
Reliance Communication Vodafone Essar and BSNL) out of 10 capturing almost three-
fourth of the entire market This is also partly on account of the fact that these four
operators have their presence in a larger number of circles as compared with other
players
882019 Major Project (Ramit)
httpslidepdfcomreaderfullmajor-project-ramit 2162
12
Figure 3-4 Lice nsed Circles
0
5
10
15
20
25
Licensed Circles (Dec 07) New Circles (Sep 08)
Source TRAI and CRISIL Database
The competition in Indian telecom sector is expected to intensify in near future because
recently new licenses have been granted to some of the existing operators for new circles
and also to new entrants like Unitech Datacom Swan Telecom and Stel These new
players are expected to capture the rural and semi-urban cities of C ircle B and Circle C as
they are now expected to grow at a much faster rate Shorter network rollout time and
competitiveness in the industry will force these entrants to start the ir operation as early as
possible Tower companies like ABC will allow incumbents to start operations in a
particular region just by installing their electronics on the ready-to-use towers thereby
significantly shortening the ro llout time
Moreover a rapidly increasing subscriber base and spectrum crunch would force the
existing telecom operators to maintain the minimum level of QoS Thus to retain existing
subscribers by preventing subscriber churn operators will require additional
infrastructure in their existing areas of operation to be able to offer better QoS This will
also result in increase in demand for telecom infrastructure in the existing markets
(Ramachanran 2009)
882019 Major Project (Ramit)
httpslidepdfcomreaderfullmajor-project-ramit 2262
13
34 Telecom Infrastructure Overview
Passive infrastructure is one of the most important components of a mobile network It
has been a critical area of operations for telecom companies in the past However with
increasing competition posing an urgent need for telecom companies to expand their
coverage and sharpen their focus on core operations so that they can sustain and improve
their market position passive infrastructure has assumed the status of an independent
industry during the past few years The industry (COAI) estimates that there will be a
requirement of around 350000 towers for 500 million subscribers by 2010 (COAI
2009)
Each site has active and passive infrastructure components Active components includethe antenna trans-receivers switches feeder cables Node B and microwave radio
equipments Passive (or non-electronic) components include the land tower shelter air-
conditioning equipment diesel electric generator battery electrical supply technical
premises and easements pylons etc Passive infrastructure in a mobile network
essentially involves acquiring land setting up towers and electrical and civil works that
needs to be in place before operators can install the active infrastructure which brings
mobile services to the consumers In a typical cell site build-out almost 65 of the total
cost is attributed to passive infrastructure and 35 to active infrastructure
(Ramachanran 2009)In this report passive cell site infrastructure has also been
henceforth referred to as towers or sites
The components of a typical base station are shown below
882019 Major Project (Ramit)
httpslidepdfcomreaderfullmajor-project-ramit 2362
14
Picture 3 1 Telecom Tower
Telecom towers are broadly classified on the basis of their placement as Ground-basedand Roof-top
1 Ground-Based Tower Ground-based towers (GBTs) are taller (typically 200 to 400
feet) and are mostly used in rural and semi-urban areas because of the easy
availability of real-estate space there GBTs involve a capital expenditure in the range
882019 Major Project (Ramit)
httpslidepdfcomreaderfullmajor-project-ramit 2462
15
of Rs 3 to 4 million depending on the height of the tower land prices etc
(Ramachanran 2009)
2 Roof-Top Tower (RTT) Roof-top towers (RTTs) are generally placed on the roofsof high-rise buildings They are shorter (than GBTs) and more common in urban and
highly populated areas where there is paucity of real-estate space Typically these
involve a capital expenditure of Rs 15 to 2 million (Ramachanran 2009)
The height of a telecom tower determines the number of antennas that can be
accommodated which in turn determines the capacity of the towers apart from factors
such as location and geographica l conditions (wind speeds type of terrain etc)
35 Telecom Infrastructure- Domestic market
In India there are broadly two kinds of operators in the tower infrastructure industry
Tower infrastructure subsidiaries
Reliance Infratel Limited
Bharti Infratel Limited
Indus Towers Limited
Wireless TT Info Services Limited (WTTIL)
Independent tower infrastructure companies (ITICs)
GTL Infrastructure
Xcel Telecom
Essar Telecom Infrastructure
Aster Infrastructure
Bharat Telemast
882019 Major Project (Ramit)
httpslidepdfcomreaderfullmajor-project-ramit 2562
16
These companies have their business model based largely on contract or anticipatory
approaches Under the contract approach tower companies set up tower sites going by
the requirements of the telecom operators and the terms of the contract are specified
beforehand in the MSAs signed by the two parties Under the anticipatory approachhowever tower companies set up tower infrastructure at sites with reasonable demand
potential and subsequently invite telecom operators to set up their network on these
towers The latter model involves higher business risks as the tower company may not be
able to achieve reasonable tenancy for its tower infrastructure and at profitable terms
BPTL proposes to follow contract approach for its business model
36 Telecom Infrastructure market- Competitive landscape
Figure 3-5 Telecom Infrastructure Market Players
038058154
365692
10381692
26923269
0 20000 40000 60000 80000 100000
Aster InfrastructureAmerican Towers
Essar Telec om Infrastructure
GTL In frastructureWi reles s TT In fo Services Limited
Bharti Infratel Limited
Reli anc e Communications Limitedrsquos
OthersInd us To wers Limited
Number of Towers
Market Players
Source Telecom Regulatory Authority of India and ICRANote Others include tower por tfolios of BSNL MTNL Sistema Shyam Teleservices Aircel etc
In Indian Telecom Infrastructure market competition has intensified significantly with
several players spinning of their tower portfolio and independent operators expanding
their operations
882019 Major Project (Ramit)
httpslidepdfcomreaderfullmajor-project-ramit 2662
17
Bharti Airtel Limited Reliance Communications Limited and Tata Teleservices Limited
have hived off their tower assets into separate tower infrastructure subsidiaries namely
Bharti Infratel Limited Reliance Infratel Limited and Wireless TT Infoservices Limited
respectively Also Bharti Infratel Limited together with Vodafone Essar Limited and IdeaCellular Limited in a joint- venture agreement has created Indiarsquos largest tower
infrastructure company ndash Indus Towers Limited which has an estimated portfolio of
around 88000 towers (Anjan V amp N 2009) Whereas in past few years number of
independent tower infrastructure companies have ventured into the domestic telecom
tower industry These include GTL Infrastructure Limited Essar Telecom Infrastructure
Limited Xcel Telecom Private Limited (American Towers) Tower Vision India Private
Limited Aster Infrastructure Private Limited TVS Interconnect Systems Limited etc
Figure 3-6 Telecom Tower Growth Scenario
0
100
200
300
400
500
600
700
2008 2009 2010 2011 2012 T e
l e c o m
T o w e r s
( T h o u s a n
d s )
Source Telecom Regulatory Authority of IndiaAssumptions Subscriber growth rate of 28 till 2011-12
1400 subscribe per site
As shown above it is expected that in next 4-5 years there will be a requirement of
additional 85000 towers (both GBT and RTT) each year to meet the subscriber base of
800 million by 2011-12 (PwC 2009) This shows that huge investment have to be made
in Indian telecom Infrastructure sector in near future Now since both passive and active
882019 Major Project (Ramit)
httpslidepdfcomreaderfullmajor-project-ramit 2762
18
infrastructure sharing is a llowed (except spectrum) Independent service providers will be
benefited Increase in subscriber base introduction of new technologies like 3G Wi-max
etc and increase in market healthy market competition in telecom services sector will
drive the growth in telecom infrastructure sector
882019 Major Project (Ramit)
httpslidepdfcomreaderfullmajor-project-ramit 2862
19
4 BUSINESS PLAN
41 Passive Infrastructure
Mobile networks have base stations (or cell sites) which have active and passive
infrastructure components Active components include the antenna trans-receivers
switches feeder cables Node B and microwave radio equipments Passive (or non-
electronic) components include the land tower shelter air-conditioning equipment
diesel electric generator battery electrical supply technical premises and easements
pylons etc Passive infrastructure in a mobile network essentially involves acquiring land
setting up towers and electrical and civil works that needs to be in place before operators
can install the active infrastructure which brings mobile services to the consumers In atypical cell site build-out almost 65 of the total cost is attributed to passive
infrastructure and 35 to active infrastructure
42 Infrastructure Sharing
Mobile operators are required to setup more and more BTS (cell) sites due to the
exponential growth of mobile subscribers in India (currently growing at almost 15 4
million subscribers a month) and limited availability of spectrum B and C Circles (wheretraffic density may not be as high as metros and Circle A) are expected to drive future
subscriber growth and requirements for cell sites will be higher to ensure greater
coverage
However creating new infrastructure by each operator separately leads to d uplicat ing
huge capital investments It also contributes to mushroom growth of telecom towers and
deteriorating skylines in urban areas which has already led to some local municipal and
state governments to regulate and restrict the erection of new mobile towers
The continued pressure on cellular tariffs higher infrastructure costs for network
deployment particularly in semi-urban and rural areas and compelling need to reduce
4 As published in ET 8 th May 09 Edition
882019 Major Project (Ramit)
httpslidepdfcomreaderfullmajor-project-ramit 2962
20
time to market for network roll outs have led operators to share and even outsource their
infrastructure requirements from third party infrastructure providers like BPTL GTL and
Indus towers It promotes capital efficiency as it allows more than one service provider to
leverage and ride o n common infrastructure In its simplest form it involves two or moreoperators jointly using the common passive infrastructure in a cell site While viewed
largely as a measure to reduce capital and operating expense such sharing also leads to
improvement of service q uality (by ensuring site space for service providers and reducing
black spots) and the environment (by reducing number of cell sites and towers)
In outsourcing operators take passive infrastructure and tower space from third party
infrastructure companies on a monthly rental basis to host their radio and transmission
equipments Outsourcing provides significant benefits to operators It enables them tosave on capital expenses (it actually converts capital expense into operating expense in
the form of lease rentals) and focus on their core activities of sales marketing and
branding while leaving the cumbersome task of managing the site development process
and site operation and maintenance to third parties who exclusively deal with such
activities
The concept of passive infrastructure sharing is increasingly gaining market acceptancein India So far it has been largely limited to bilateral sharing between operators in the
form of barter where the operators split the site related CAPEX and OPEX costs The
available information suggests that about 25 of the existing 90000 tower sites in India
are currently being shared for passive infrastructure predominantly in rural areas and
small towns
43 Introduction to the business
BPTL is an Infrastructure Provider company that builds owns operates and maintains
passive network infrastructure on a shared basis for mobile telecom operators and ITES
providers Its objective is to provide network design and planning network deployment
882019 Major Project (Ramit)
httpslidepdfcomreaderfullmajor-project-ramit 3062
21
network operations amp maintenance infrastructure management application management
and professional services to teleco m operators and enterprises
The company is planning to raise capital in the form of equity and debt to start its
operation by Aug 09 ABC rsquos vision is to provide world class managed infrastructure ampallied services to the service providers to optimize their service delivery capability In the
initial years of operation the company will focus on telecom sector with almost 100 of
its proposed capital expenditure till FY 14 earmarked for developing and owning passive
infrastructure for sharing among mobile service providers
44 Business Proposal
ABC will provide passive telecom infrastructure on build own operate (BOO) basis inboth ground based (GBS) as well as roof-top sites (RTS) It will undertake full range of
responsibilities in building owning and maintaining the sites and will serve as a single
window one-stop-shop provider of infrastructure services Typical responsibilities are
summarized below
Site planning keeping in view the network rollout plans of prospective customers
Site acquisition including entering into long-term agreements with land owners
Obtaining of necessary regulatory approvals
Erect ion and commissioning of tower and allied equipment
Provision of support services such as back-up power air-conditioning and
security
Provision of turnkey solutions to telecom companies such as sourcing of
equipment testing and maintenance
882019 Major Project (Ramit)
httpslidepdfcomreaderfullmajor-project-ramit 3162
22
Bharat Telemast Private Limited will identify the sites required for setting up the Passive
infrastructure by first of all getting a commitment from one operator who is called as
ldquoAnchor Operatorrdquo Then Bharat Telemast will go ahead to lease (or) buy out the site as
appropriate and commences construction of the cellular sites But the Cellular site will betypically designed for three to four operators While construction is in progress the
marketing team will work towards getting the second and third operator But care will be
taken in such a way that at least two operators are available at the time of completion of
construction
45 Sources of revenue
1 Infrastructure Provisioning Fees ndash fee paid by the operators on a monthly basisWith annual escalation
2 Site lease rental ndash Paid at actual on a monthly basis
3 Operations and maintenance charges Paid on a monthly basis
4 The contract also provides a fixed annual escalator
46 Attractiveness of business model
Stable and predictable cash flow business Once a tower asset is rented out it
usually generates a stable and predictable cash flow in the form of tower rentals
from occupants over the term of the MSA between the two parties
Low working capital requirement ABC rsquos business model is also characterized
by low working capital requirements as most of the operating expenses (such aselectricity and fuel and other variable operating expenses) are reimbursable by the
tenants on actual basis Moreover BPTL is may also be able to get rentals for the
towers in advance and also obtain better credit terms from their suppliers thus
further improving their working capital cycle
882019 Major Project (Ramit)
httpslidepdfcomreaderfullmajor-project-ramit 3262
23
High incremental profitability The operating costs associated with this
business are largely fixed in nature Thus each increment in tenancy is
accompanied by a minimal increase in costs This leads to a more thanproportionate increase in profits for every increase in occupancy
Reduction in capital investments due to present market conditions Due to
present market situation average capital requirement for RTT and GBT sites have
dropped from 2 million and 4 million to 15 million and 33 million ABC wishes
to grab this opportunity which will result in competitive advantage in near future
Extensive usage While on an average a GSM BTS can handle around 100-
1100 subscribers but in the case of high usage areas the figure can be as low as
600-700 subscribers which means a larger number of cell sites would be required
for the same area Moreover the country has the problem of spectrum scarcity
which increases the requirement of towers to maintain a reasonable leve l of
service quality
New entrants Many operators including Vodafone Essar Limited Idea Cellular
Limited Aircel Cellular Limited and Sistema Shyam Teleservices Limited have
received licenses as well spectrum in new circles which would enable them to
become pan-India operators in the next one-two years Also new licenses have
been issued to new players such as Unitech Swan Telecom and S Tel Limited
Given the significant expansion plans of new entrants over the medium term and
the need for them to optimize investments in order to maintain returns demand
for towers is expected to report a sharp increase
Shorter rollout time Indian telecom industry is highly competitive and doing
business for new entrant may not be easy Shorter network-rollout time would be
a critical success factor for the new entrants and a longer rollout time could meanloss of substantial market share to other operators Tower companies allow
players to start operations in a particular region just by installing their electronics
on the ready-to-use towers thereby significantly shortening the rollout time
New technologies 3G services are already launched in the country and to
augment their services various operators plan to launch Wi-Max services as soon
882019 Major Project (Ramit)
httpslidepdfcomreaderfullmajor-project-ramit 3362
24
as they receive additional spectrum from Government This would further
increase the demand for sharing of passive infrastructure
47
Expansion Schedule
BPTL would rollout both RTT and GBT sites of which the RTT sites GBT sites
normally would have a tower height of 50 meters or 60 meters depending on the need for
additional height for installation of microwave antennae based on the location of the site
and number of tenants on the cell site Details of BPTLrsquos expansion plan are summarized
below
Table 41 Expansion PlanExpansion Schedule 2009-10 2010-11 2011-12 2012-13 20013-14
GBT
Addition 210 700 1400 2450 3850
Total 210 910 2310 4760 8610
RTT
Addition 90 300 600 1050 1650
Total 90 390 990 2040 3690
48 Proposed Services
As indicated earlier ABC proposes to provide passive telecom infrastructure on a
sharing co-location basis to cellular operators The sites would either be Ground Based
Sites (GBS) or Roof Top Sites (RTS) As the sites are meant for co-location of the active
components of two to three operators they would be built to either 2-Tenant or 3-Tenant
specifications
The different components of the passive infrastructure facility and the related services
that would be offered by BPTL to the operators are as under
Infrastructure provisioning comprising
882019 Major Project (Ramit)
httpslidepdfcomreaderfullmajor-project-ramit 3462
25
Communication tower built to host multiple antennae
Weather-proof communication shelter with air-conditioning and power backup
arrangement
Diesel generating set and battery bank for power backup
A mobile standby generator to act as backup in case o f breakdown
Warehousing facility
Infrastructure operations and maintenance including
Regular operations and maintenance of the facility
Security of all the equipments at the site at all timesA dedicated team of technicians for a group of 40-50 sites to ensure effect ive and
efficient functioning of the components at all times
49 Proposed Organizational Structure
A senior management team will work under the leadership of the ldquoChief Operations
Officerrdquo who will be responsible for smooth implementation of proj ect activities He willalso assist the managing director in marketing This team will coordinate with Stallion
Telecom Pvt Ltd which will take over the role of procuring Capital Equipments
Senior management will consists of project manager infrastructure manager commercial
manager and head (legal and company affairs Apart from this there will be a requirement
Chief OperatingOfficer
Project Manager Infrastructure
Manager
Commercial
Manager (projects)
Head (Legal and
Company Affairs)
882019 Major Project (Ramit)
httpslidepdfcomreaderfullmajor-project-ramit 3562
26
of security sentries (3 per GBT site) supervisors (one for every 10 sites) and cluster
manager (one for every 50 sites)
Bharat Telemast will carry out the complete Project execution with the assistance of third party ldquoQuality control organizationrdquo and a third party ldquoProject management teamrdquo
Quality control and project management activities will be o utsourced to a third party
882019 Major Project (Ramit)
httpslidepdfcomreaderfullmajor-project-ramit 3662
27
5 METHODOLOGY
The changing face of infrastructure services creates a complex situation which demands
greater understanding of roles of competition regulatory structures and modes of
financing Knowledge of such things is a key decisive factor in building confidence
among investors promoters and government In project finance the project its assets
contract and cash flows are separated from promoter in order to permit credit appraisal
or loan to the project
As part of the financial feasibility analysis a series of related financial statements based
on projected sources and uses of funds during the development and operating phaseproject were created Financial statements consist of expenses associated with
development activities including capital costs like acquisition of land for GBT sites cost
of tower generator shelter batteries etc Most of the data regarding capital costs are
obtained from the promoter of ABC Limited All these capital costs related details are
provided in annexure 1
Assumption regarding depreciation capital structure operating expenses expansion
schedule tenancy ratios tariff or rent operatorrsquos fees and loan amortization schedule are
obtained from professional accountants Promoter and bankers of ABC Limited
Due to unknown factors that could influence the cost of towers or fees associated with
completing the project (soft costs) contingency costs were estimated at 5 of hard and
soft costs respectively If contingency is set too low developers could easily encounter
funding shortfalls upon slight changes in market forces All other costs were estimated
based on talking with industry professionals (Promoters)
A detailed financial model was prepared based on existing accounting standards and
following financial ratios were estimated
882019 Major Project (Ramit)
httpslidepdfcomreaderfullmajor-project-ramit 3762
28
EBITDA margin Profit and loss accounts for the estimated project period (15
Years) were prepared based on which estimated earnings before interests tax
depreciat ion and amortization were calculated for each year Detailed PampL
balance sheet and cash flow statements are provided in annexure 2 3 and 4
EBITDA = Total Revenue ndash (Variable expenses + Fixed Expenses)
EBITDA margin = EBITDA Total Revenue
PAT margin PAT is calculated by subtracting interests pa id on capital debt and
working capital debt depreciation and applicable corporate income tax from
EBITDA
PAT = EBITDA ndash Interest Payable ndash Depreciation ndash Income tax
PAT margin = PATTotal Revenue
Working Capital Working capital requirement is calculated by subtract ing
current liabilities from current assets Current assets are estimated based on 30
days cash requirement and current liabilities are estimated as half of salary
monthly expenses
WC = Current Assets ndash Current Liabilities
UFCF It is defined as the free cash flows available to the firm if the firm has
zero debt liability Purpose of ca lculat ing UFCF for project period is to determinethe project IRR
UFCF = PAT + Depreciation + Interest (tax adjusted) + Release of WC + Salvage
value of the assets ndash CAPEX ndash Change in WC
882019 Major Project (Ramit)
httpslidepdfcomreaderfullmajor-project-ramit 3862
29
LCFF It is defined as the cash floes available to the firm after paying interests on
long term and short term debts
LCFF = UFCF ndash Interest (tax adjusted)
FCFE It is defined as the free cash flow available to equity holders It is
determined to ca lculate equity IRR for equity investors It also includes the tax
benefits which are available as per the Income Tax Act
FCFE PAT + Depreciation + Salvage Value ndash Equity Investment ndash Long term debt
repayment
PIRR Project IRR is defined as the discount rate at which NPV (Net Present
Value) of UFCF is zero It is calculated by using following formula
UFCF 1 (1+PIRR) 0+ UFCF 2 (1+PIRR) 1+ UFCF 3 (1+PIRR) 2+ helliphelliphelliphelliphelliphellip = 0
UFCF 1 = UFCF at the end of first year of operation
UFCF 2 = UFCF at the end of second year of operation
PIRR = Project IRR
EIRR Equity IRR is defined as the discount rate at which NPV of FCFE is zero
It is calculated by using following formula
FCFE1 (1+EIRR) 0+ FCFE 2 (1+EIRR) 1+ FCFE 3 (1+EIRR) 2+ helliphelliphelliphelliphelliphellip = 0
FCFE1 = FCFE at the end of first year of operation
FCFE2 = FCFE at the end of seco nd year of operation
EIRR = Equity IRR
882019 Major Project (Ramit)
httpslidepdfcomreaderfullmajor-project-ramit 3962
30
WACC It is de fined as the percentage of return expected by the investors who
otherwise would have earned some return by investing in some other project
WACC = Cost of Debt (Debt Capital) + Cost of equity (Equity Capital)
882019 Major Project (Ramit)
httpslidepdfcomreaderfullmajor-project-ramit 4062
882019 Major Project (Ramit)
httpslidepdfcomreaderfullmajor-project-ramit 4162
32
62 Funding planAs the telecom sites are rolled out over a 5 year period till FY 2014 investment will be
required for each year ABC Limited will start generating profits from FY 10 only Such
internally generated cash accruals will be ploughed back into the business to meet part of
the project cost Investment required for each year is tabulated below
Table 61 Funding ProposalMillion INR FY 10 FY 11 FY 12 FY 13 FY 14
GBT Tower (Additional) Nos 210 700 1400 2450 3850
RTT Tower (Additional) Nos 90 300 600 1050 1650DE ratio 233 233 233 233 233
Additional CAPEX 83892 279374 558748 977809 1536557
Debt 58725 195562 391124 684466 1075590
Equity 25168 83812 167624 293343 460967
63 Results
Based on assumptions given in Annexure 1 a detailed financial model was preparedResults of the financial model such as PampL account Balance Sheet and cash flow
statements are provided in Annexure 2 3 and 4 Forecasts for the key financial figures for
first five years are provided in the Table below
Forecasts
Table 62 Income StatementMillion INR FY-10 FY11 FY12 FY-13 FY-14
Sales 7124 50511 156766 347476 667700
Cost of sales 1950 13852 39252 87612 170021
Gross 5174 36659 117514 259864 497679
7263 7258 7496 7479 7454
Admin costs 112 179 190 203 216
882019 Major Project (Ramit)
httpslidepdfcomreaderfullmajor-project-ramit 4262
33
Finance cost 0 021 7401 31330 77725
Taxation 170 4233 14536 29073 53547
PAT 2454 19458 59470 122096 223267
As shown in Table above during the expansion period revenue will grow exponentially
In the first year of operation ABC will earn a revenue of INR 7124 million from 300
(210 GBT and 90 RTT) sites with a tenancy ratio of 15 for GBS and 17 for RTS In the
first 2 years of operation the company will not pay any interest on long term debt due to
2 years moratorium period Major cost associated with the project is depreciation due to
which PAT is lower than the operating profits But cash flows to the firm are enough to
result in reasonable returns
Table 63 Balance Shee tYear ending Mar-10 Mar-11 Mar-12 Mar-13 Mar-14
AssetsGross Block 75742 328216 833164 1716823 3105430Accumulated depreciation 2439 15208 51125 128287 271212Net Block 73303 313009 782040 1588536 2834219Net Working Capital 064 241 620 1335 2515Cash Balance 12979 72089 216513 488856 947982
Total Assets 86346 385339 999172 2078727 3784715LiabilitiesEquity 25168 108980 276604 569947 1030914Reserves amp Surplus 2454 21912 81381 203477 426745Long term Debt 58725 254286 640722 1304302 2325171WC Borrowings - 161 465 1001 1886Total Liabilities 86346 385339 999172 2078727 3784715
Note All figures are in Million INR
Table 64 Key financial ratiosMar-11 Mar-12 Mar-13 Mar-14 Mar-15
Revenue Growth 60902 21036 12165 9216 3890EBITDA Growth 62061 22161 12132 9158 4020
PAT Growth 69293 20564 10531 8286 2955
As shown in table above increase in EBITDA is higher than that of revenue This is due
to better operational efficiency of ABCrsquos management and economies of scale S imilarly
882019 Major Project (Ramit)
httpslidepdfcomreaderfullmajor-project-ramit 4362
34
increase in PAT is lesser than that of EBITDA because of high depreciation and interest
expenses
Table 65 Pr ofitability r atios
Mar-11 Mar-12 Mar-13 Mar-14 Mar-15
EBITDA Margin 7222 7484 7473 7450 7520
PAT Margin 3852 3794 3514 3344 3119Return on Net Worth 622 760 769 788 1087
Key profitability ratios are shown in table above Return on net worth in the initial years
is lower because of the ambitious expansion plans of ABC Limited Thereafter return on
net worth increases with increase in PAT
Returns on Investment
Table 66 Financial returnsFinancial Indicators
Project IRR 1813Equity IRR 3609
64 Sensitivity Analysis
A sensitivity analysis has been carried out on the project financials to determine theimpact of key variables on the financial indicators namely
Project IRR
The key variables on which sensitivity analysis have been carried out areCapital expenditure for GBS and RTS1st and 2 nd tenant tariff for GBS1st and 2 nd tenant tariff for RTSTenancy Ratio
Similarly sensitivity analysis has been carried out forEquity IRR
The key variables on which sensitivity analysis have been carried out for EIRR are
Capital structure and interest rate for capital debtRepayment period and moratorium period
882019 Major Project (Ramit)
httpslidepdfcomreaderfullmajor-project-ramit 4462
35
The impact on the financial indicators is shown below
Figure 6-1 Project IRR vs GBT and RTT CAPEX
As shown in Figure 6-1 project IRR is more sensitive to change in CAPEX of RTT sitesas compared to change in CAPEX of GBT sites because tenancy ratio and tariff for RTTsites are higher than those of GBT sites
882019 Major Project (Ramit)
httpslidepdfcomreaderfullmajor-project-ramit 4562
36
Figure 6-2 Project IRR vs GBT Tariff for 1 st tenant (X-axis) and 2 nd tenant (right-hand side)
As shown in Figure 6-2 project IRR varies linearly with GBT tariff In the best casescenario when GBT tariff for 1 st tenant is INR 34000month and GBT tariff for secondtenant is INR 26000month Project IRR is 2101
Figure 6-3 Project IRR vs RTT Tariff for 1 st tenant (X-axis) and 2 nd tenant (right-hand side)
As shown in Figure 6-2 project IRR varies linearly with RTT tariff In the best casescenario when RTT tariff for 1 st tenant is INR 24000month and RTT tariff for second
882019 Major Project (Ramit)
httpslidepdfcomreaderfullmajor-project-ramit 4662
37
tenant is INR 20000month Project IRR is 1932 Project IRR is more sensitivetowards RTT tariff than GBT tariff because in practical business situation RTT siteshave a tenancy ratio of more than two due to which effect of tariff for 1 st tenant almostget nullified after few years
Figure 6-4 Project IRR vs Tenancy ratio for RTT sites (X-axis) and GBT sites
As shown in Figure 6-4 project IRR is very sensitive to tenancy ratio In the best casescenario where GBT sites have a tenancy ratio of 2 and RTT sites have a tenancy ratio of 3 project IRR can be as high as 20
Figure 6-5 Equity IRR vs long term debt interest rate for different leverage level
882019 Major Project (Ramit)
httpslidepdfcomreaderfullmajor-project-ramit 4762
38
As shown in figure 6-5 equity IRR is more sensitive to interest rate on long term debt forhigh level of leverage (lower debt equity ratio) because as the debt equity ratio increasesinterest paid on long term debt also increases significantly
Figure 6-6 Equity IRR vs long term debt repayment period at different level of moratoriumperiods
As shown in figure 6-6 Equity IRR increases with increase in moratorium period anddebt repayment period The variation is from 1654 to 60 for worst case and best casescenarios
882019 Major Project (Ramit)
httpslidepdfcomreaderfullmajor-project-ramit 4862
39
7 RISK ASSESSMENTRisk Mitigation strategyExecution Risk
(Project management landacquisition etc)
Management of ABC has proven expertise in
telecom infrastructure rollout and has executedvarious projects with large telecom operators andMNC vendorsABCrsquos top management team consists of a groupof professionals drawn from leading telecomInfrastructure Company who have immenseexpertise and experience in rolling out telecominfrastructure projects
Market Risk (No entry barriers operators may
share infrastructure betweenthemselves large players withhigh capital may increasecompetition)
India has a huge potential for telecominfrastructure market With increasing
competition falling tariffs and pressure onmargins telecom service providers are beingforced to increase their focus on marketing andreduce their expensesExperienced management healthy capital back-up effective presence in the telecominfrastructure market and value added services atrelatively lesser cost will help ABC to meet theset targets
Financing Risk
(Availability of equity capitalavailability of long term debtinterest rate and moratoriumperiod)
ABC is seeking private equity partner to secure
equity capital Company has already entered intoNDA with 2 major investorsLong term debt at an interest rate of 125 canbe easily arranged because of the credibility of the promoters in the marketMany other similar firms like Indus and GTLhave already secured long term debt for amoratorium period of 2 years Promoters of ABCLimited are confident to secure a long term debtwith a moratorium period of 2 years and apayback period of 8 years
ABC Limited would minimize the workingcapital requirements of its business by securingrentals and operating revenues in advance fromits clients and or by suitably structuring itspayment liabilities to match its cash inflows
Commercial Risk (Tenancy ratio and tariff forGBS and RTS)
ABC would aim to enter into long term contractswith the ldquoanchor tenantrdquo operator and thenrollout the infrastructure so that at least single
882019 Major Project (Ramit)
httpslidepdfcomreaderfullmajor-project-ramit 4962
40
occupancy of each site is ensured at all t imesPromoters will use its knowledge of the businessand its expertise to identify and roll out sites inlocations which have strong multi- tenancypotential to minimize occupancy risk
Revenue Risk (Operating fees may decreasecredit worthiness of the clientsdelay in payment of rentals)
As per the industry sources till now not even asingle operator have dishonored the long termlease contractThe credit risk is diversified as there will bemultiple operatorsABC would aggressively market to get 3G andWiFi broadcasters to use the sites and earnadditional revenues in addition to the assumedrevenue streams
Natural Calamities Risk The Company shall maintain insurance for thesites against these risks and the cost of insurancewill be priced in and passed on to the tenants
882019 Major Project (Ramit)
httpslidepdfcomreaderfullmajor-project-ramit 5062
41
8 CONCLUSION
India is the fastest growing wireless telecom market in the world The continuing
growth in the number of wireless subscribers and MoUs and increasing trend of
outsourcing of business processes to India has led to growing demand for large
investments in the telecom infrastructure in the country
However with increasing competition falling tariffs and pressure on margins
telecom service providers are being forced to increase their focus on marketing
customer acquisitions and branding and minimize their efforts and overheads in
project management and asset acquisition
Further with rising prices of steel cement and real estate the cost of developing
and owning passive infrastructure is increasingly becoming a costly proposition
for most operators and service providers
The compulsion on the part of service providers to reduce their operating costs
and capital expenditure requirements has led to opportunities in passiveinfrastructure outsourcing to independent third party infrastructure providers and
also sharing the infrastructure with other service providers It is expected that
cellular operators will outsource their communications site infrastructure needs as
a means of accelerating access to their markets and preserving capital rather than
constructing and operating their own communications sites and maintaining their
own communications sites service and deve lopment capabilities
Passive infrastructure is highly capital intensive and an integral part of the cellular
service providersrsquo networks Yet being a simple and low technology asset it is
amenable to outsourcing and sharing By transferring the responsibility of
ownership development and maintenance of passive infrastructure service
882019 Major Project (Ramit)
httpslidepdfcomreaderfullmajor-project-ramit 5162
42
providers have an opportunity to transfer a substantial part of their business risk to
third parties
Most telecom operators are facing capacity constraints on their networksCoverage obligations increasing pressure to improve network quality and
competition has led to aggressive roll out plans by existing cellular operators
Installation of cell sites has become a cumbersome process as there are a number
of clearances required and involves labor-intensive micro management
Availability of ready infrastructure from third party providers would enable the
operators to reduce their time to market and accelerate their access to their
customers Cellular service providers generally want to move quickly when
adding more sites and co-location on an existing site is always faster than
building
Ownership and maintenance of telecom towers and other infrastructure by third
parties is an established practice in developed nations like USA and is
increasingly gaining market acceptance in India
The Indian government is seriously considering promoting the infrastructure
sharing route between the telecom operator and private players to achieve future
national tele-density targets and improve rural telecom penetration
ABC being an independent entity with no business conflicts with other service
providers in the telecom space will be best positioned and have an early mover
advantage to capitalize on this emerging opportunity
Further the task of operating and maintaining the passive infrastructure in the cell
is increasingly becoming a cumbersome exercise for the service providers to
handle ABCrsquos composite offering to build passive infrastructure for the cellular
operators and also operate and maintain them will provide a turnkey solution to
address the infrastructure needs of the service providers
882019 Major Project (Ramit)
httpslidepdfcomreaderfullmajor-project-ramit 5262
43
The business model proposed to be followed by ABC is fairly simple with stable
and predictable cash flows as is the case with the business model of the tower
renting companies in USA Most contracts are long term for a period 10 or moreyears with annual price escalators generally ranging from 3 to 4 However
wireless carriers normally tend to renew rentals because suitable alternative sites
may not exist or be available and repositioning a site in a carrierrsquos network is
expensive and may adverse ly affect network quality
Site ownership and operations is a ldquoscalerdquo business operating administration
marketing expenses etc do not rise as quickly as revenues when portfolios are
expanded Incremental operating costs associated with adding wireless tenants to
a communications site are minimal Therefore as additional tenants are added to a
site the substantial majority of incremental revenue contributes to margin
expansion Most tower companies have high EBITDA margins as may be seen
from the financial indicators of some of the tower rental companies in USA
It is expected that site location and capacity price and quality of service and
successful execution of contracts will be the most significant competitive factors
in this business
ABCrsquos revenue and returns on investment will be primarily driven by its ability
to
o Increase the utilization of the space and infrastructure capacity owned by it by
increasing the number of tenants per site and renting out to maximum number
of users As discussed above return on capital employed (PIRR and EIRR) arevery sensitive to tenancy ratio In worst case scenario project IRR can be as
low as 8 and in the best case scenario it can be as high as 20
o Develop acquire sites of strategic importance and high growth potential that
will enable them to secure better commercial terms from users and attract
more number of tenants Infrastructure provisioning fees rentals for sites are
882019 Major Project (Ramit)
httpslidepdfcomreaderfullmajor-project-ramit 5362
44
extremely location sensitive There is a potential to acquire more land than
that of required to capitalize on the increase in real estate prices
o Develop sites in a cost effective manner ABC would consider purchasing
land only for those GBS sites which have sufficient demand and arestrategically located Else for most of its sites land will be leasehold As
shown above returns (PIRR and EIRR) are very sensitive to capital costs In
the worst case scenario project IRR can be as low as 15 whereas it can as
high as 27 in the best case scenario
o Negotiate and secure long term contracts with good credit quality users with
built in price escalation provisions to mitigate financing risk
o Leverage and secure long term financing at attractive terms and involve in
active treasury management to keep low financing cost Results of the
sensitivity analysis indicate that equity IRR can be as high as 60 foe a
moratorium period of 4 years and interest rate of 10
o Minimize working capital requirements
o Maintain low operating and administration expense
o Secure better OampM margins from operators and retain a healthy share of it in
ABC
o Maintain high service standards and build strong customer relationships
The business would have the potential to capture new revenue opportunities
around the existing assets As demand for towers is expected to grow and as
operators migrate to speedier next-generation wireless technologies they will
need the towers and associated passive infrastructure to transmit their new
services in addition to their existing offerings In addition to increasing capacity
and coverage and improving the quality of their networks cellular serviceproviders are deploying high speed data networks driving incremental demand of
sites The business therefore has potential upsides in the form of adding
customers (tenants) in wireless broadband third generation (ldquo3Grdquo) and wireless
data capabilities and also other incremental value propositions by way of hosting
882019 Major Project (Ramit)
httpslidepdfcomreaderfullmajor-project-ramit 5462
45
Billboards Hoardings etc in some of the high visible sites owned and maintained
by it
Based on the assumptions and subject to satisfactory resolution of the key risks
factors project cash flows will be able to meet debt service obligations
This business model is a lucrative investment option for a private equity player
because valuation of each site will increase in the coming years due to
improvement in market conditions increase in the value of land and increase in
the demand for passive infrastructure in rural and semi-urban areas
882019 Major Project (Ramit)
httpslidepdfcomreaderfullmajor-project-ramit 5562
46
REFERENCESAnjan G V A amp N M (2009) telecom infrastructure industry in india GurgaonICRA
Bessler W Norsworthy J amp Shusterman T (2001 12 1) Mergers in the UStelecommunications industry and market valuationeffects IEEE p 288
COAI (2009 march 14) Subscriber Figures Retrieved march 14 2009 fromCOAIcom httpwwwcoaicomstatisticsphp
IDA (2009 march 23) Highlights Retrieved march 23 2009 from idagovsghttpwwwidagovsghomeindexaspx
K R (2008) Time for new business model Delhi Cybermedia
MAXIS (2009 march 8) the malaysian telecommunications industry Retrieved march9 2009 from maxiscommyhttpwwwmaxiscommypersonalabout_usinvestorprospectusprospectus4pdf
P J amp Lisa A (2009) Stimulas spending and American Telecom Industry USACoracle group
PwC (2009 march 12) Indian Telecom Industry Gurgaon Harayana IndiaRamachanran (2009 march 1) Investment in Telecom Infrastructure sector (M RInterviewer)
Vogelsang I (2002) The German Telecommunications Reform Verein fuumlr Socialpolitik (p 26) Innsbruck Boston Press
882019 Major Project (Ramit)
httpslidepdfcomreaderfullmajor-project-ramit 5662
47
ANNEXURES
ANNEXURE 1 Key Assumptions
The occupancy of each site by single two three operators for green-field sites is assumed
to be as follows
Table 91 Expected Tenancy RatiosFY 10 FY 11 FY 12 FY 13 FY 14 FY15
GBT Tenant
Ratio 150 150 170 170 170 200
Single Operator 50 50 30 30 30 0
Two Operator 50 50 70 70 70 100
RTT Tenant
Ratio 170 170 200 200 200 250
Single Operator 30 30 0 0 0 0
Two Operator 70 70 100 100 100 50
Three Operator 0 0 0 0 0 50
From FY 15 onwards tenancy ratio of 2 and 25 for GBT and RTT sites is cons idered
882019 Major Project (Ramit)
httpslidepdfcomreaderfullmajor-project-ramit 5762
48
Capital costs related assumptions are tabulated below
Table 92 GBT and RTT Capital Cost
The lease rentals for RTT sites are reimbursed from the operators and therefore have not
been factored in the revenues as well as the expense For GBT sites land purchase cost of
035 millions assumed which has been escalated by 6 annually to determine the
salvage value of assets
GBT Capital Costs
Million
INR
Delivery cost of Ground Based
Tower (GBT)063
Delivery cost of Generator 030
Civil Work 040Shelter 012
Electrical Works 030
Other Equipments (UPS Battery
etc)045
Construction cost 045
Land 035
Contingency amp Financial Charges 035Total cost 335
RTT Capital Costs
Million
INR
Delivery cost of Roof Top
Tower (RTT) 030
Delivery cost of Generator 020
Civil Work 020Shelter 012
Electrical Works 030
Other Equipments (UPS
Battery etc) 030
Construction cost -
Land -
Contingency amp FinancialCharges 008
Total cost 150
882019 Major Project (Ramit)
httpslidepdfcomreaderfullmajor-project-ramit 5862
49
Ope rating costs related assumptions are tabulated below
Table 93 Operating CostsOperating Costs
Security Sentries (INRMonth) 4000
Supervisors (INRMonth) 6000
Cluster Manager One for Fifty Towers (INRMonth) 15000
Annual increase 500
Number of Security Sentries per tower 300
Number of supervisors per tower 010
Number of C luster manager per tower 002
Fixed Expenses
Selling amp Maintenance (INRMonth) 4000000
Annual Escalation 5
Administration overhead (INRMonth) 10000000Annual Escalation 7
AMC Cost of Generator 15 (cost of generator)
Annual Escalation (AMC) 3
For RTT sites security sentries are not required because it will be the responsibility of
the site owner A supervisor will for every 10 sites and a cluster manager for every 50
sites will be required
882019 Major Project (Ramit)
httpslidepdfcomreaderfullmajor-project-ramit 5962
50
Table 94 Long term debtInterest Rate 125 per annum
Moratorium 2 years
Repayment Period 8 years
Tariff related assumptions and date of operations are tabulated below
Table 95 GBT and RTT Tariff Table 96 Life of the projectTariff Plan
Tariff (INRMonth)
No of
operators GBT RTT
1 28000 18000
2 22000 14000
3 0 12000
Annual
increase 3 3
Commercial Operation Date 1-Aug-09
Quarter Ending 30-Sep-09
FY ending COD 31-Mar-10
Project life years 15
End of commercial
operations31-Aug-24
Quarter ending commercial
operations30-Sep-24
FY ending comme rcial
operations31-Mar-25
882019 Major Project (Ramit)
httpslidepdfcomreaderfullmajor-project-ramit 6062
51
Annexure 2 Profit amp Loss accountsTable 97 Profit amp loss account statement
Income Statement (MNINR)Year ending Mar-10 Mar-11 Mar-12 Mar-13 Mar-14 Mar-15
RevenueGBT 406350 28811 89080 197447 379409 527015Operator Fees (GBT) 1411 10004 30678 67998 130664 179664RTT 1209 8575 27269 60443 116146 164264
Operator Fees (RTT) 440 3121 9739 21587 41481 56466Net Revenue 7124 50511 156766 347476 667700 927410
Expenses
VariableSecurity Sentries 1355 9790 28339 64033 125433 158238Supervisors 097 699 2024 4574 8959 11303Cluster Manager 048 350 10 12 2287 4480 5651AMC Cost of Generator 450 3013 7877 16719 31148 54541Sub-total 1950 13852 39252 87612 170021 229734
Fixed
Selling amp Maintenance(INRMonth) 032 050 053 056 058 061
Administration overhead(INRMonth) 080 128 137 147 157 168
Sub-total 112 179 190 203 216 230
EBITDA 5062 36480 117324 259661 497464 697447
Interest on LT loan - - 7341 31200 77479 156198Interest on ST loan - 021 060 130 245 361
EBDT 5062 36459 109923 228331 419739 540888Depreciation 2439 12769 35917 77162 142925 174006
EBT 2624 23691 74006 151169 276814 366881Income Tax 170 4233 14536 29073 53547 77634
PAT 2454 19458 59470 122096 223267 289247
882019 Major Project (Ramit)
httpslidepdfcomreaderfullmajor-project-ramit 6162
52
Annexure 3 Balance sheet
Table 98 B alance sheetsYearend Balance Sheet (MNINR)Year ending Mar-10 Mar-11 Mar-12 Mar-13 Mar-14 Mar-15
AssetsGross Block 75742 328216 833164 1716823 3105430 3105430Accumulated depreciation 2439 15208 51125 128287 271212 445218Net Block 73303 313009 782040 1588536 2834219 2660212Net Working Capital 064 241 620 1335 2515 3707Cash Balance 12979 72089 216513 488856 947982 1294734Total Assets 86346 385339 999172 2078727 3784715 3958653
LiabilitiesEquity 25168 108980 276604 569947 1030914 1030914Reserves amp Surplus 2454 21912 81381 203477 426745 715992Long term Debt 58725 254286 640722 1304302 2325171 2208967WC Borrowings - 161 465 1001 1886 2780Total Liabilities 86346 385339 999172 2078727 3784715 3958653
882019 Major Project (Ramit)
httpslidepdfcomreaderfullmajor-project-ramit 6262
Annexure 4 Cash flow statement
Table 99 Cash flow statements
Year ending Mar-10 Mar-11 Mar-12 Mar-13 Mar-14 Mar-15
InflowsPAT 2454 19458 59470 122096 223267 289247Depreciation 2439 12769 35917 77162 142925 174006Tax adjusted interest - 014 4959 20991 52076 104895Release of WC - - - - - -Salvage Value - - - - - -Sub-Total 4893 32241 100345 220249 418268 568148
OutflowsCapex 75742 252474 504948 883659 1388607 -Change in WorkingCapital 064 177 379 715 1180 1192
Sub-Total 75806 252651 505327 884374 1389787 1192
UFCF (70913) (220410) (404982) (664125) (971519) 566956LFCF (70913) (220424) (409940) (685116) (1023595) 462062
882019 Major Project (Ramit)
httpslidepdfcomreaderfullmajor-project-ramit 462
Acknowledgement
I offer my reverences to TERI University by whose efforts I have been able to complete
my major project at PricewaterhouseCoopers
The persons who shaped my efforts and provided the guidance to me are none other than
my renowned faculty members Dr Saon Ray Dr Kaushik Deb and Dr Neeraj Khera I
feel highly privileged to express my sincere regards and gratitude to them for their
dynamic leadership guidance careful supervision invaluable suggestions and liberal
attitude during the course of my dissertation
Also my endeavors at this project could not have been satisfactorily completed without
the active participation and co-operation of Mr Deepak Mahurkar Mr Manish Bhagla
Mr K Ramachanran and Mrs Sakshi Marwah I am really thankful to them for their
guidance and co-operation
I also acknowledge and express my deepest gratitude to all the team members of PwC
GRID for guiding me throughout the project I am indebted to them for extending their
valuable guidance comments suggestions and inspiration for this project
(RAMIT MALHOTRA)
882019 Major Project (Ramit)
httpslidepdfcomreaderfullmajor-project-ramit 562
Table of Contents
ABBREVIATIONS I
ABSTRACT II
LIST OF TABLES IV
LIST OF FIGURES IV
1 INTRODUCTION 1
2 OBJECTIVES 5
3 LITERATURE REVIEW 6
31 INTERNATIONAL EXPERIENCE IN INFRASTRUCTURE SHARING 6
32 DOMESTIC TELECOM MARKET ASSESSMENT 9 33 TELECOM MARKET - COMPETITIVE LANDSCAPE 11 34 TELECOM INFRASTRUCTURE OVERVIEW 13 35 TELECOM INFRASTRUCTURE - DOMESTIC MARKET 15 36 TELECOM INFRASTRUCTURE MARKET - COMPETITIVE LANDSCAPE 16
4 BUSINESS PLAN 19
41 PASSIVE INFRASTRUCTURE 19 42 INFRASTRUCTURE SHARING 19 43 INT RODUCTION TO THE BUSINESS 20 44 BUSINESS PROPOSAL 21 47 EXPANSION SCHEDULE 24 48 PROPOSED SERVICES 24 49 PROPOSED ORGANIZATIONAL STRUCTURE 25
5 METHODOLOGY 27
6 OBSERVATIONS AND ANALYSIS 31
61 DEAL DIAGRAM 31 62 FUNDING PLAN 32 63 RESULTS 32 64 SENSITIVITY ANALYSIS 34
7 RISK ASSESSMENT 39
8 CONCLUSION 41
REFERENCES 46
ANNEXURES 47
882019 Major Project (Ramit)
httpslidepdfcomreaderfullmajor-project-ramit 662
i
ABBREVIATIONS
ARPU Average Revenue per User BOO Build Own OperateBTS Base Trans-receiver StationCDMA Code Division Multiple AccessCOAI Cellular Operators Association of IndiaDoT Department of TelecommunicationsDSCR Debt Service Coverage RatioEBITDA Earnings Before Interest Tax Deprec iation and AmortizationEIRR Equity Internal Rate of ReturnFCFE Free Cash Flow to EquityFDI Foreign Direct InvestmentGBS Ground Based Site
GBT Ground Based TowerGSM Global System for Mobile CommunicationIP Infrastructure ProviderIRR Internal Rate of ReturnIT Information TechnologyLFCF Levered Free Cash Flow to FirmLOI Letter of IntentMSI Managed Services InfrastructureNOC Network Operat ing CentrePAT Profit After TaxPIRR Project Internal Rate of Return
QoS Quality of ServiceTRAI Teleco m Regulatory Authority of IndiaROA Return on AssetROE Return on EquityRTS Roof Top SiteRTT Roof Top TowerSLA Service Level AgreementSLM Straight Line MethodTRAI Teleco m Regulatory Authority of IndiaUFCF Unlevered Free Cash Flow to FirmVPN Virtual Private Network WACC Weighted Average Cost of CapitalWC Working CapitalWLL Wireless Local Loop
882019 Major Project (Ramit)
httpslidepdfcomreaderfullmajor-project-ramit 762
ii
ABSTRACTIndian telecom industry was dominated by government organization till 1991 after which
many private players have entered into this market Since its liberalization the industry
has experienced impressive growth because of strong demand investor friendlyregulatory schemes and strengthening economy At present India is the second largest
mobile market in the world and is also among the fastest growing mobile markets
globally The total number of mobile subscribers in India (ie the subscriber base) has
crossed 300 million with 30049 million subscribers as on 31st March 2008 (TRAI
database)
With increase in market competition and pressure on margins telecom service providers
are being forced to increase their focus on marketing and customer acquisition This has
led to opportunities in passive infrastructure outsourcing to independent third party
infrastructure providers and also sharing the infrastructure with other service providers
Recently Telecom Regulatory Authority of India has awarded new licenses to new
players such as Unitech Swan Telecom and S Tel Limited The significant expansion
plans of the new entrants and their need to optimize investments so that they can compete
with existing players will further drive the demand of passive infrastructure in the
country
ABC Limited is an independent infrastructure provider company which proposes to buildown and operate passive infrastructure sites for telecom service providers ABC Limited
is planning to raise capital to start its operation in FY 10 Based on the details regarding
capital expenditure operating expenditures and future expansion plans of ABC Limited
provided by the promoter of the company a detailed financial model has been prepared
and key financial ratios has been estimated to assess the financial feasibility and returns
on investment
Total investment required to meet the target of around 12000 tower sites (both GBT and
RTT) is estimated to be INR 36343 million ABC has planned to raise 70 of required
capital through long term debt and remaining as equity Results of financial model shows
that IRR for such project will be more than 18 and equity IRR will be around 36
provided that ABC will meet the above target of 12000 tower sites by FY14 Project IRR
is very sensitive to Capital costs tenancy ratio and monthly tariff for each site On the
882019 Major Project (Ramit)
httpslidepdfcomreaderfullmajor-project-ramit 862
iii
other hand equity IRR is sensitive to loan moratorium period and interest rate on long
term debt The project will generate enough cash flows to cover its debt obligation and
also to generate high return on equity invested
882019 Major Project (Ramit)
httpslidepdfcomreaderfullmajor-project-ramit 962
iv
LIST OF TABLESTable 31 Telecom Circles 17 Table 41 Expansion Plan 31
Table 61 Funding Proposal 39 Table 62 Income Statement 39 Table 63 Balance Sheet 40 Table 64 Key financial ratios 40 Table 65 Profitability ratios 41 Table 66 F inancial returns 41 Table 91 Expected Tenancy Ratios 50 Table 92 GBT and RTT Capital Cost 51 Table 93 Operating Costs 52 Table 94 Long term debt 52 Table 95 GBT and RTT Tariff 53 Table 96 Life of the project 53 Table 97 Profit amp loss acco unt statement 54 Table 98 Balance sheets 55 Table 99 Cash flow statements 56
LIST OF FIGURES
Figure 3-1 Growth of Subscriber base 10 Figure 3-2 Mobile Penetration Rate 10 Figure 3-3 Market Share 11
Figure 3-4 Licensed Circles 12 Picture 3 1 Telecom Tower 14 Figure 3-5 Telecom Infrastructure Market Players 16 Figure 3-6 Telecom Tower Growth Scenario 17 Figure 6-1 Project IRR vs GBT and RTT CAPEX 35 Figure 6-2 Project IRR vs GBT Tariff 36 Figure 6-3 Project IRR vs RTT Tariff 36 Figure 6-4 Project IRR vs Tenancy ratio for RTT sites and GBT sites 37 Figure 6-5 Equity IRR vs long term debt interest rate for different leverage level 37 Figure 6-6 Equity IRR vs long term debt repayment period at different level of moratorium periods 38
882019 Major Project (Ramit)
httpslidepdfcomreaderfullmajor-project-ramit 1062
1
1 INTRODUCTION
ABC Ltd 1 is an Infrastructure Provider company that builds owns operates and
maintains passive network infrastructure on a shared basis for mobile telecom operators
and ITES providers The Company was formed in Jan 2009 Its objective is to provide
network design and planning network deployment network operations amp maintenance
infrastructure management application management and professional services to telecom
operators and enterprises
The company is planning to raise capital in the form of equity and debt to start its
operation by Aug 09 The purpose of this project is to prepare detailed financial model
for assessment of feasibility of such projects building scenarios and sensitivity charts
calculation of risk and returns associated with the project and valuation of ABC Limited
subjected to present and expected future market conditions
ABCrsquos vision is to provide world class managed infrastructure amp allied services to the
service providers to optimize their service delivery capability In the initial years of
operation the company will focus on telecom sector with almost 100 of its proposed
capital expenditure till FY 14 earmarked for developing and owning passive
infrastructure for sharing among mobile service providers
Passive Telecom Infrastructure Sharing
Mobile networks have base stations (or cell sites) which have active and passive
infrastructure components Active components include the antenna trans-receivers
switches feeder cables Node B and microwave radio equipments Passive (or non-electronic) components include the land tower shelter air-conditioning equipment
diesel electric generator battery electrical supply technical premises and easements
pylons etc Passive infrastructure in a mobile network essentially involves acquiring land
1 Actual name o f the company is no t stated as per the instructions given by external supervisor
882019 Major Project (Ramit)
httpslidepdfcomreaderfullmajor-project-ramit 1162
2
setting up towers and electrical and civil works that needs to be in place before operators
can install the active infrastructure which brings mobile services to the consumers In a
typical cell site build-out almost 65 of the total cost is attributed to passive
infrastructure and 35 to active infrastructure In this report passive cell siteinfrastructure has also been henceforth referred to as towers or sites
Mobile operators are required to setup more and more BTS (cell) sites due to the
exponential growth of mobile subscribers in India (currently growing at almost 152
million subscribers a month) and limited availability of spectrum B and C Circles (where
traffic density may not be as high as metros and Circle A) are expected to drive future
subscriber growth and requirements for cell sites will be higher to ensure greater
coverage
To cover large stretch of almost 65000 Kilometers of national highways additional
18000 towers (one tower for every 3 Kilometers of highway) will be required in near
future to ensure better connectivity Proposed build out of 3G networks are expected to
further drive substantial growth in the number of towers over the next few years
However creating new infrastructure by each operator separately leads to duplicating
huge capital investments It also contributes to mushroom growth of telecom towers and
deteriorating skylines in urban areas which has already led to some local municipal and
state governments to regulate and restrict the erection of new mobile towers
The continued pressure on cellular tariffs higher infrastructure costs for network
deployment particularly in semi-urban and rural areas and compelling need to reduce
time to market for network roll outs have led operators to share and even outsource theirinfrastructure requirements from third party infrastructure providers like ABC GTL and
Indus towers
2 As published in ET 8 th May 09 Edition
882019 Major Project (Ramit)
httpslidepdfcomreaderfullmajor-project-ramit 1262
3
Sharing promotes capital efficiency as it allows more than one service provider to
leverage and ride on common infrastructure In its simplest form it involves two or more
operators jointly using the common passive infrastructure in a cell site While viewed
largely as a measure to reduce CAPEX and operating expense such sharing also leads toimprovement of service quality (by ensuring site space for service providers and reducing
black spots) and the environment (by reducing number of cell sites and towers)
In outsourcing operators take passive infrastructure and tower space from third party
infrastructure companies on a monthly rental basis to host their radio and transmission
equipments Outsourcing provides significant benefits to operators It enables them to
save on capital expenditure (it actually converts CAPEX into OPEX in the form of lease
rentals) and focus on their core activities of sales marketing and branding while leavingthe cumbersome task of managing the site development process and site operation and
maintenance to third parties who exclusively deal with such activities
Active infrastructure sharing is not popular across the globe for several reasons the most
important being increased inter dependency among competing service providers
However tower sharing and outsourcing of tower ownership is an accepted practice in
many developed markets In countries like USA UK and Australia there are
independently owned tower companies who rent tower space to various mobile operators
The United States has arguably the most developed independent mobile tower market
with independent tower companies owning over half of all mobile towers in that country
Mobile tower owners generate revenue by owning the towers and leasing space on the
towers to mobile telecommunications operators under long-term contracts Under this
business model ownership of the base station equipments coupled to the towers is
retained by the mobile telecommunications operators In addition to rental payments
mobile tower owners generally receive a fee for installing customers base station
equipment on the tower Mobile tower owners also receive services revenue for
operations and maintenance of the passive infrastructure Regulators all over the world
favor passive sharing of infrastructure
882019 Major Project (Ramit)
httpslidepdfcomreaderfullmajor-project-ramit 1362
4
The concept of passive infrastructure sharing is increasingly gaining market acceptance
in India So far it has been largely limited to bilateral sharing between operators in the
form of barter where the operators split the site related CAPEX and OPEX costs The
available information suggests that about 25 of the existing 90000 tower sites in Indiaare currently being shared for passive infrastructure predominantly in rural areas and
small towns
ABC Limited is expecting to get shortlisted by Department of Telecom for setting up
passive cellular infrastructure in rural areas with support from the Universal Services
Obligations (USO) Fund The recent announcements by some operators like Bharti
Hutch (Vodafone) Reliance Idea for mutual sharing of infrastructure through new
companies and entry of third party infrastructure providers has further expanded the
tower market in India
Results of detailed financial model indicate that with given expansion plans and
assumptions ABC will create value for its shareholders investors clients and promoters
The project is expected to generate high cash flows which will be sufficient enough to
pay back its debt liabilities and to generate and equity IRR of 36
882019 Major Project (Ramit)
httpslidepdfcomreaderfullmajor-project-ramit 1462
5
2 OBJECTIVES
The scope of work for this Study project involves the following
Market assessment for Indian telecom Infrastructure sector
Collection of data related to capital and operating costs (from promoter)
Forecasting operating costs
Preparation of detailed financial model
Calculation of UFCF ( Unlevered Free Cash Flows) LFCF (Levered Free Cash
Flows)
Estimation of Project and Equity IRRrsquos
Preparation of balance sheet PampL and cash flow statement for expected life
cycle of project
Sensitivity analysis and Scenario analysis
882019 Major Project (Ramit)
httpslidepdfcomreaderfullmajor-project-ramit 1562
6
3 LITERATURE REVIEW
31 International Experience in Infrastructure Sharing
Different countries have adopted different approaches in order to safeguard the level of
competitive independence between co-operating operators Measures include mandating
a distinct and differentiated cost base between operators the development of different
business plans marketing and distribution strategies and the independent development or
acquisition of content and services Requiring the independent control over the respective
frequency resources of each operator is also an important competitive safeguard
In the EU for example operators are allowed to share infrastructure as long as they
maintain full operational control of their network Sharing the radio access network is
permitted but sharing frequencies and the core network is not In particular the databases
used to administer subscriber and interconnection information are required to be kept
separate Exemptions however are generally granted in special cases which advance the
objectives of government policy and the economic benefits to the consumers of the
services It is important to note that any infrastructure sharing agreement could also be
subject to review by the EC Commission under Article 81 of the EC Treaty andor the EC
Merger Regulation
USA
In USA the number of wireless service subscribers has increased from 1284 million to
2433 million between December 2001 and December 2007 representing an increase of
approximately 88 and market penetration of approximately 70 The tower business in
USA is a $5 billion industry consolidated around four large players -- American Tower
(ATC) Crown Castle International (CCI ) SBA Communications (SBAC ) and GlobalSignal (GSL ) which control 40 of the approximately 210000 (P amp Lisa 2009) towers
across the US The primary business of these companies involves leasing antenna space
on multi-tenant communications sites to a variety of wireless carriers including radio and
3 Source CTIA-The Wireless Association Website
882019 Major Project (Ramit)
httpslidepdfcomreaderfullmajor-project-ramit 1662
7
television broadcast companies under long-term lease contracts Typically these leases
are long-term (five to 10 year) contracts with renewal terms at the option of the customer
Some co mpanies offer tower related services on a limited basis including site acquisition
zoning and permitting services and structural analysis services and project managementof antenna installations that support their site leasing operations and the addition of new
tenants and equipment on their sites
Towers are a relatively scarce asset in USA as zoning laws often do not permit a new
tower to be built in the immediate vicinity of an existing tower Tenant churn tends to be
low as towers are an integral part of the networks of the wireless service providers
Tenants own their own equipment (and therefore bear the technology risk) generally
handle installation and maintenance and pay for electricity and most ongoing assets
greatly simplifying the tower business model
Germany
In Germany the main concern faced by the regulator involved a possible threat to the
competitive independence of potential 3G operators that could result from a tight
integration of the networks as a result of infrastructure sharing Infrastructure Sharing is
allowed only if the mobile systems can be independently operated for example if they
can be shut down or maintained independently by software and that no customer data is
shared (OECD report 2004) In Germany the sharing of antennae and sites is relatively
common however the sharing of transmission management equipment and core
networks is not commonly done (Vogelsang 2002)
Sweden
In Sweden the regulator has agreed to allow significant infrastructure sharing for 3G
operators Each operator only has to cover 30 of the customers while for the remaining
70 infrastructure can be shared This is the approach being taken by the Europolitan
companies Vodafone Hi3G and Orange which jointly own 3G Infrastructure Services
However with competition concerns the regulator only allows radio components such as
antennas cables and base station electronics to be shared (Khurram Mahmood 2008)
882019 Major Project (Ramit)
httpslidepdfcomreaderfullmajor-project-ramit 1762
8
Singapore
In the case of Singapore the regulatorrsquos infrastructure sharing approach is guided by the
primary policy goal of encouraging facilities-based competition Under the current
regulatory framework licensees are generally not required to share any infrastructure that
it controls with its competitors Each licensee is expected to build or lease the use of the
infrastructure it requires Notwithstanding this however infrastructure sharing is
mandated in areas where there are clear space and operating constraints For 2G and 3G
licensees such matters relate to infrastructure in the Mass Rapid Transit and underground
road tunnels The regulator has also allowed the co-location of base stations and sharing
of transmission towers and masts to reduce the impact on the environment and to
minimize the inconvenience to building owners and residents (IDA 2009)
Malaysia
Taking a different approach in Malaysia operators owning network facilities have been
encouraged by the regulator to share infrastructure as a means of lowering costs and
expanding coverage as well as to avoid a duplication of resources To this effect a
Memorandum of Understanding to share infrastructure has been executed between the
mobile operators To further catalyze infrastructure sharing the concept of a third party
provider of facilities is also being promoted in Malaysia Under this concept of a third
party will build the infrastructure and lease capacity or space to existing se rvice
providers This concept not only provides ready-made sites but will also help reduce the
numbers of telecommunication towers that have to be dealt with by local authorities
(MAXIS 2009)
882019 Major Project (Ramit)
httpslidepdfcomreaderfullmajor-project-ramit 1862
9
32 Domestic Telecom Market assessment
The Indian Telecom Industry-Historical perspective
The Indian telecommunication industry was originally a government controlled
monopoly comprising three state owned operators
MTNL (which provided wire-line services in Mumbai and Delhi metropolitan
areas)
DOT (which provided wire-line services to rest of the country)
VSNL (which provided international services)
Liberalization started in 1991 with opening up of mobile services to private sectorparticipation The country was divided into 23 circles comprising of four metropol9otan
areas (Chennai Delhi Kolkata and Mumbai) and 19 other circles broadly defined by
parameters of states (K 2008) These 19 non-metropolitan circles have been categorized
as A B and C circles in descending order of their revenue generation potential (as
shown below)
Table 31 Telecom Circles
MetropolitanAreas Circle A Circle B Circle C
Delhi ChennaiMumbai Kolkata
Gujarat KarnatakaAP Tamil NaduMaharashtra
Punjab Kera laHaryana UP (West)Rajasthan UP(East) MP WestBengal
HP JampK North-East OrissaAssam Bihar
In 1997 TRAI was formed for regulating the operations and policy making process of
Indian telecommunication sector Since its liberalization India has experienced sustained
and impressive growth in its telecommunication sector primarily because of progressive
regulatory regime strong demand for mobile telecommunication services and
strengthening economy The country has achieved distinction of having worldrsquos lowest
tariff fastest growth ion subscriber base and availability of some of the cheapest mobile
handsets
882019 Major Project (Ramit)
httpslidepdfcomreaderfullmajor-project-ramit 1962
10
Figure 3-1 Growth of Subscriber base
Growth of Subscriber base
050
100150200250300350
1998 1999 2000 2001 2002 2003 2004 2005 2006 2007 2008
Year
M i l l i o n
Source Telecom Regulatory Authority of India Database
India is the second largest mobile market in the world is also among the fastest growing
mobile markets globally The total number of mobile subscribers in India (ie the
subscriber base) has crossed 300 million with 30049 million subscribers as on 31st
March 2008 The growth of subscriber base during the past decade (1998-2008) is
indicated above in a chart
Figure 3-2 Mobile Penetration Rate
0 10 20 30 40 50 60 70 80 90 100
North-East ( C)Assam (C)
Bihar ( C)Jammu amp Kashmir (C)
Orissa (C)Him achal Pradesh (C)
Uttar Pradesh ( B)Madhya Pradesh (B)
Rajastan (B)Haryana (B)
Punjab (B)West Bengal (B)
Kerala (B)Maharashtra (A)
Gujarat (A)Tamil Nadu (A)
Andhra Pradesh (A)Karnataka (A)
Kolkata (Metro)Chennai (Metro)Mumbai (Metro)
Delhi (Metro)
Source TRAI and PwC DatabaseNote As on Dec 08
882019 Major Project (Ramit)
httpslidepdfcomreaderfullmajor-project-ramit 2062
11
Indian telecom industry has experienced a high growth rate in Metros and class A circles
with coverage reaching around 90 and 35 respectively However coverage in the
Class B and Class C cities is still low at 15-25 Growth in Class B and Class C circles
has concentrated in urban area while penetration in rural area remains lower Thus futuregrowth is likely to come largely from Class B and C circles and rural areas Keeping this
in view larger players like Bharti Airtel Limited Reliance Communications Limited and
Bharat Sanchar Nigam Limited (BSNL) are largely focusing on increasing their
geographical coverage in Class B and C c ircles
33 Telecom Market- Competitive landscape
Figure 3-3 Market Share
Bharti2668
BSNLMTNL1908
Reliance1971
Vodafone661
Tata1047
Idea1033
Aircel457
Spice181
BPL056
HFCL013
Shyam005
Market Share
Source TRAI and Pw C Database
Indian mobile sector is largely concentrated with top 4 market players (Bharti Airtel
Reliance Communication Vodafone Essar and BSNL) out of 10 capturing almost three-
fourth of the entire market This is also partly on account of the fact that these four
operators have their presence in a larger number of circles as compared with other
players
882019 Major Project (Ramit)
httpslidepdfcomreaderfullmajor-project-ramit 2162
12
Figure 3-4 Lice nsed Circles
0
5
10
15
20
25
Licensed Circles (Dec 07) New Circles (Sep 08)
Source TRAI and CRISIL Database
The competition in Indian telecom sector is expected to intensify in near future because
recently new licenses have been granted to some of the existing operators for new circles
and also to new entrants like Unitech Datacom Swan Telecom and Stel These new
players are expected to capture the rural and semi-urban cities of C ircle B and Circle C as
they are now expected to grow at a much faster rate Shorter network rollout time and
competitiveness in the industry will force these entrants to start the ir operation as early as
possible Tower companies like ABC will allow incumbents to start operations in a
particular region just by installing their electronics on the ready-to-use towers thereby
significantly shortening the ro llout time
Moreover a rapidly increasing subscriber base and spectrum crunch would force the
existing telecom operators to maintain the minimum level of QoS Thus to retain existing
subscribers by preventing subscriber churn operators will require additional
infrastructure in their existing areas of operation to be able to offer better QoS This will
also result in increase in demand for telecom infrastructure in the existing markets
(Ramachanran 2009)
882019 Major Project (Ramit)
httpslidepdfcomreaderfullmajor-project-ramit 2262
13
34 Telecom Infrastructure Overview
Passive infrastructure is one of the most important components of a mobile network It
has been a critical area of operations for telecom companies in the past However with
increasing competition posing an urgent need for telecom companies to expand their
coverage and sharpen their focus on core operations so that they can sustain and improve
their market position passive infrastructure has assumed the status of an independent
industry during the past few years The industry (COAI) estimates that there will be a
requirement of around 350000 towers for 500 million subscribers by 2010 (COAI
2009)
Each site has active and passive infrastructure components Active components includethe antenna trans-receivers switches feeder cables Node B and microwave radio
equipments Passive (or non-electronic) components include the land tower shelter air-
conditioning equipment diesel electric generator battery electrical supply technical
premises and easements pylons etc Passive infrastructure in a mobile network
essentially involves acquiring land setting up towers and electrical and civil works that
needs to be in place before operators can install the active infrastructure which brings
mobile services to the consumers In a typical cell site build-out almost 65 of the total
cost is attributed to passive infrastructure and 35 to active infrastructure
(Ramachanran 2009)In this report passive cell site infrastructure has also been
henceforth referred to as towers or sites
The components of a typical base station are shown below
882019 Major Project (Ramit)
httpslidepdfcomreaderfullmajor-project-ramit 2362
14
Picture 3 1 Telecom Tower
Telecom towers are broadly classified on the basis of their placement as Ground-basedand Roof-top
1 Ground-Based Tower Ground-based towers (GBTs) are taller (typically 200 to 400
feet) and are mostly used in rural and semi-urban areas because of the easy
availability of real-estate space there GBTs involve a capital expenditure in the range
882019 Major Project (Ramit)
httpslidepdfcomreaderfullmajor-project-ramit 2462
15
of Rs 3 to 4 million depending on the height of the tower land prices etc
(Ramachanran 2009)
2 Roof-Top Tower (RTT) Roof-top towers (RTTs) are generally placed on the roofsof high-rise buildings They are shorter (than GBTs) and more common in urban and
highly populated areas where there is paucity of real-estate space Typically these
involve a capital expenditure of Rs 15 to 2 million (Ramachanran 2009)
The height of a telecom tower determines the number of antennas that can be
accommodated which in turn determines the capacity of the towers apart from factors
such as location and geographica l conditions (wind speeds type of terrain etc)
35 Telecom Infrastructure- Domestic market
In India there are broadly two kinds of operators in the tower infrastructure industry
Tower infrastructure subsidiaries
Reliance Infratel Limited
Bharti Infratel Limited
Indus Towers Limited
Wireless TT Info Services Limited (WTTIL)
Independent tower infrastructure companies (ITICs)
GTL Infrastructure
Xcel Telecom
Essar Telecom Infrastructure
Aster Infrastructure
Bharat Telemast
882019 Major Project (Ramit)
httpslidepdfcomreaderfullmajor-project-ramit 2562
16
These companies have their business model based largely on contract or anticipatory
approaches Under the contract approach tower companies set up tower sites going by
the requirements of the telecom operators and the terms of the contract are specified
beforehand in the MSAs signed by the two parties Under the anticipatory approachhowever tower companies set up tower infrastructure at sites with reasonable demand
potential and subsequently invite telecom operators to set up their network on these
towers The latter model involves higher business risks as the tower company may not be
able to achieve reasonable tenancy for its tower infrastructure and at profitable terms
BPTL proposes to follow contract approach for its business model
36 Telecom Infrastructure market- Competitive landscape
Figure 3-5 Telecom Infrastructure Market Players
038058154
365692
10381692
26923269
0 20000 40000 60000 80000 100000
Aster InfrastructureAmerican Towers
Essar Telec om Infrastructure
GTL In frastructureWi reles s TT In fo Services Limited
Bharti Infratel Limited
Reli anc e Communications Limitedrsquos
OthersInd us To wers Limited
Number of Towers
Market Players
Source Telecom Regulatory Authority of India and ICRANote Others include tower por tfolios of BSNL MTNL Sistema Shyam Teleservices Aircel etc
In Indian Telecom Infrastructure market competition has intensified significantly with
several players spinning of their tower portfolio and independent operators expanding
their operations
882019 Major Project (Ramit)
httpslidepdfcomreaderfullmajor-project-ramit 2662
17
Bharti Airtel Limited Reliance Communications Limited and Tata Teleservices Limited
have hived off their tower assets into separate tower infrastructure subsidiaries namely
Bharti Infratel Limited Reliance Infratel Limited and Wireless TT Infoservices Limited
respectively Also Bharti Infratel Limited together with Vodafone Essar Limited and IdeaCellular Limited in a joint- venture agreement has created Indiarsquos largest tower
infrastructure company ndash Indus Towers Limited which has an estimated portfolio of
around 88000 towers (Anjan V amp N 2009) Whereas in past few years number of
independent tower infrastructure companies have ventured into the domestic telecom
tower industry These include GTL Infrastructure Limited Essar Telecom Infrastructure
Limited Xcel Telecom Private Limited (American Towers) Tower Vision India Private
Limited Aster Infrastructure Private Limited TVS Interconnect Systems Limited etc
Figure 3-6 Telecom Tower Growth Scenario
0
100
200
300
400
500
600
700
2008 2009 2010 2011 2012 T e
l e c o m
T o w e r s
( T h o u s a n
d s )
Source Telecom Regulatory Authority of IndiaAssumptions Subscriber growth rate of 28 till 2011-12
1400 subscribe per site
As shown above it is expected that in next 4-5 years there will be a requirement of
additional 85000 towers (both GBT and RTT) each year to meet the subscriber base of
800 million by 2011-12 (PwC 2009) This shows that huge investment have to be made
in Indian telecom Infrastructure sector in near future Now since both passive and active
882019 Major Project (Ramit)
httpslidepdfcomreaderfullmajor-project-ramit 2762
18
infrastructure sharing is a llowed (except spectrum) Independent service providers will be
benefited Increase in subscriber base introduction of new technologies like 3G Wi-max
etc and increase in market healthy market competition in telecom services sector will
drive the growth in telecom infrastructure sector
882019 Major Project (Ramit)
httpslidepdfcomreaderfullmajor-project-ramit 2862
19
4 BUSINESS PLAN
41 Passive Infrastructure
Mobile networks have base stations (or cell sites) which have active and passive
infrastructure components Active components include the antenna trans-receivers
switches feeder cables Node B and microwave radio equipments Passive (or non-
electronic) components include the land tower shelter air-conditioning equipment
diesel electric generator battery electrical supply technical premises and easements
pylons etc Passive infrastructure in a mobile network essentially involves acquiring land
setting up towers and electrical and civil works that needs to be in place before operators
can install the active infrastructure which brings mobile services to the consumers In atypical cell site build-out almost 65 of the total cost is attributed to passive
infrastructure and 35 to active infrastructure
42 Infrastructure Sharing
Mobile operators are required to setup more and more BTS (cell) sites due to the
exponential growth of mobile subscribers in India (currently growing at almost 15 4
million subscribers a month) and limited availability of spectrum B and C Circles (wheretraffic density may not be as high as metros and Circle A) are expected to drive future
subscriber growth and requirements for cell sites will be higher to ensure greater
coverage
However creating new infrastructure by each operator separately leads to d uplicat ing
huge capital investments It also contributes to mushroom growth of telecom towers and
deteriorating skylines in urban areas which has already led to some local municipal and
state governments to regulate and restrict the erection of new mobile towers
The continued pressure on cellular tariffs higher infrastructure costs for network
deployment particularly in semi-urban and rural areas and compelling need to reduce
4 As published in ET 8 th May 09 Edition
882019 Major Project (Ramit)
httpslidepdfcomreaderfullmajor-project-ramit 2962
20
time to market for network roll outs have led operators to share and even outsource their
infrastructure requirements from third party infrastructure providers like BPTL GTL and
Indus towers It promotes capital efficiency as it allows more than one service provider to
leverage and ride o n common infrastructure In its simplest form it involves two or moreoperators jointly using the common passive infrastructure in a cell site While viewed
largely as a measure to reduce capital and operating expense such sharing also leads to
improvement of service q uality (by ensuring site space for service providers and reducing
black spots) and the environment (by reducing number of cell sites and towers)
In outsourcing operators take passive infrastructure and tower space from third party
infrastructure companies on a monthly rental basis to host their radio and transmission
equipments Outsourcing provides significant benefits to operators It enables them tosave on capital expenses (it actually converts capital expense into operating expense in
the form of lease rentals) and focus on their core activities of sales marketing and
branding while leaving the cumbersome task of managing the site development process
and site operation and maintenance to third parties who exclusively deal with such
activities
The concept of passive infrastructure sharing is increasingly gaining market acceptancein India So far it has been largely limited to bilateral sharing between operators in the
form of barter where the operators split the site related CAPEX and OPEX costs The
available information suggests that about 25 of the existing 90000 tower sites in India
are currently being shared for passive infrastructure predominantly in rural areas and
small towns
43 Introduction to the business
BPTL is an Infrastructure Provider company that builds owns operates and maintains
passive network infrastructure on a shared basis for mobile telecom operators and ITES
providers Its objective is to provide network design and planning network deployment
882019 Major Project (Ramit)
httpslidepdfcomreaderfullmajor-project-ramit 3062
21
network operations amp maintenance infrastructure management application management
and professional services to teleco m operators and enterprises
The company is planning to raise capital in the form of equity and debt to start its
operation by Aug 09 ABC rsquos vision is to provide world class managed infrastructure ampallied services to the service providers to optimize their service delivery capability In the
initial years of operation the company will focus on telecom sector with almost 100 of
its proposed capital expenditure till FY 14 earmarked for developing and owning passive
infrastructure for sharing among mobile service providers
44 Business Proposal
ABC will provide passive telecom infrastructure on build own operate (BOO) basis inboth ground based (GBS) as well as roof-top sites (RTS) It will undertake full range of
responsibilities in building owning and maintaining the sites and will serve as a single
window one-stop-shop provider of infrastructure services Typical responsibilities are
summarized below
Site planning keeping in view the network rollout plans of prospective customers
Site acquisition including entering into long-term agreements with land owners
Obtaining of necessary regulatory approvals
Erect ion and commissioning of tower and allied equipment
Provision of support services such as back-up power air-conditioning and
security
Provision of turnkey solutions to telecom companies such as sourcing of
equipment testing and maintenance
882019 Major Project (Ramit)
httpslidepdfcomreaderfullmajor-project-ramit 3162
22
Bharat Telemast Private Limited will identify the sites required for setting up the Passive
infrastructure by first of all getting a commitment from one operator who is called as
ldquoAnchor Operatorrdquo Then Bharat Telemast will go ahead to lease (or) buy out the site as
appropriate and commences construction of the cellular sites But the Cellular site will betypically designed for three to four operators While construction is in progress the
marketing team will work towards getting the second and third operator But care will be
taken in such a way that at least two operators are available at the time of completion of
construction
45 Sources of revenue
1 Infrastructure Provisioning Fees ndash fee paid by the operators on a monthly basisWith annual escalation
2 Site lease rental ndash Paid at actual on a monthly basis
3 Operations and maintenance charges Paid on a monthly basis
4 The contract also provides a fixed annual escalator
46 Attractiveness of business model
Stable and predictable cash flow business Once a tower asset is rented out it
usually generates a stable and predictable cash flow in the form of tower rentals
from occupants over the term of the MSA between the two parties
Low working capital requirement ABC rsquos business model is also characterized
by low working capital requirements as most of the operating expenses (such aselectricity and fuel and other variable operating expenses) are reimbursable by the
tenants on actual basis Moreover BPTL is may also be able to get rentals for the
towers in advance and also obtain better credit terms from their suppliers thus
further improving their working capital cycle
882019 Major Project (Ramit)
httpslidepdfcomreaderfullmajor-project-ramit 3262
23
High incremental profitability The operating costs associated with this
business are largely fixed in nature Thus each increment in tenancy is
accompanied by a minimal increase in costs This leads to a more thanproportionate increase in profits for every increase in occupancy
Reduction in capital investments due to present market conditions Due to
present market situation average capital requirement for RTT and GBT sites have
dropped from 2 million and 4 million to 15 million and 33 million ABC wishes
to grab this opportunity which will result in competitive advantage in near future
Extensive usage While on an average a GSM BTS can handle around 100-
1100 subscribers but in the case of high usage areas the figure can be as low as
600-700 subscribers which means a larger number of cell sites would be required
for the same area Moreover the country has the problem of spectrum scarcity
which increases the requirement of towers to maintain a reasonable leve l of
service quality
New entrants Many operators including Vodafone Essar Limited Idea Cellular
Limited Aircel Cellular Limited and Sistema Shyam Teleservices Limited have
received licenses as well spectrum in new circles which would enable them to
become pan-India operators in the next one-two years Also new licenses have
been issued to new players such as Unitech Swan Telecom and S Tel Limited
Given the significant expansion plans of new entrants over the medium term and
the need for them to optimize investments in order to maintain returns demand
for towers is expected to report a sharp increase
Shorter rollout time Indian telecom industry is highly competitive and doing
business for new entrant may not be easy Shorter network-rollout time would be
a critical success factor for the new entrants and a longer rollout time could meanloss of substantial market share to other operators Tower companies allow
players to start operations in a particular region just by installing their electronics
on the ready-to-use towers thereby significantly shortening the rollout time
New technologies 3G services are already launched in the country and to
augment their services various operators plan to launch Wi-Max services as soon
882019 Major Project (Ramit)
httpslidepdfcomreaderfullmajor-project-ramit 3362
24
as they receive additional spectrum from Government This would further
increase the demand for sharing of passive infrastructure
47
Expansion Schedule
BPTL would rollout both RTT and GBT sites of which the RTT sites GBT sites
normally would have a tower height of 50 meters or 60 meters depending on the need for
additional height for installation of microwave antennae based on the location of the site
and number of tenants on the cell site Details of BPTLrsquos expansion plan are summarized
below
Table 41 Expansion PlanExpansion Schedule 2009-10 2010-11 2011-12 2012-13 20013-14
GBT
Addition 210 700 1400 2450 3850
Total 210 910 2310 4760 8610
RTT
Addition 90 300 600 1050 1650
Total 90 390 990 2040 3690
48 Proposed Services
As indicated earlier ABC proposes to provide passive telecom infrastructure on a
sharing co-location basis to cellular operators The sites would either be Ground Based
Sites (GBS) or Roof Top Sites (RTS) As the sites are meant for co-location of the active
components of two to three operators they would be built to either 2-Tenant or 3-Tenant
specifications
The different components of the passive infrastructure facility and the related services
that would be offered by BPTL to the operators are as under
Infrastructure provisioning comprising
882019 Major Project (Ramit)
httpslidepdfcomreaderfullmajor-project-ramit 3462
25
Communication tower built to host multiple antennae
Weather-proof communication shelter with air-conditioning and power backup
arrangement
Diesel generating set and battery bank for power backup
A mobile standby generator to act as backup in case o f breakdown
Warehousing facility
Infrastructure operations and maintenance including
Regular operations and maintenance of the facility
Security of all the equipments at the site at all timesA dedicated team of technicians for a group of 40-50 sites to ensure effect ive and
efficient functioning of the components at all times
49 Proposed Organizational Structure
A senior management team will work under the leadership of the ldquoChief Operations
Officerrdquo who will be responsible for smooth implementation of proj ect activities He willalso assist the managing director in marketing This team will coordinate with Stallion
Telecom Pvt Ltd which will take over the role of procuring Capital Equipments
Senior management will consists of project manager infrastructure manager commercial
manager and head (legal and company affairs Apart from this there will be a requirement
Chief OperatingOfficer
Project Manager Infrastructure
Manager
Commercial
Manager (projects)
Head (Legal and
Company Affairs)
882019 Major Project (Ramit)
httpslidepdfcomreaderfullmajor-project-ramit 3562
26
of security sentries (3 per GBT site) supervisors (one for every 10 sites) and cluster
manager (one for every 50 sites)
Bharat Telemast will carry out the complete Project execution with the assistance of third party ldquoQuality control organizationrdquo and a third party ldquoProject management teamrdquo
Quality control and project management activities will be o utsourced to a third party
882019 Major Project (Ramit)
httpslidepdfcomreaderfullmajor-project-ramit 3662
27
5 METHODOLOGY
The changing face of infrastructure services creates a complex situation which demands
greater understanding of roles of competition regulatory structures and modes of
financing Knowledge of such things is a key decisive factor in building confidence
among investors promoters and government In project finance the project its assets
contract and cash flows are separated from promoter in order to permit credit appraisal
or loan to the project
As part of the financial feasibility analysis a series of related financial statements based
on projected sources and uses of funds during the development and operating phaseproject were created Financial statements consist of expenses associated with
development activities including capital costs like acquisition of land for GBT sites cost
of tower generator shelter batteries etc Most of the data regarding capital costs are
obtained from the promoter of ABC Limited All these capital costs related details are
provided in annexure 1
Assumption regarding depreciation capital structure operating expenses expansion
schedule tenancy ratios tariff or rent operatorrsquos fees and loan amortization schedule are
obtained from professional accountants Promoter and bankers of ABC Limited
Due to unknown factors that could influence the cost of towers or fees associated with
completing the project (soft costs) contingency costs were estimated at 5 of hard and
soft costs respectively If contingency is set too low developers could easily encounter
funding shortfalls upon slight changes in market forces All other costs were estimated
based on talking with industry professionals (Promoters)
A detailed financial model was prepared based on existing accounting standards and
following financial ratios were estimated
882019 Major Project (Ramit)
httpslidepdfcomreaderfullmajor-project-ramit 3762
28
EBITDA margin Profit and loss accounts for the estimated project period (15
Years) were prepared based on which estimated earnings before interests tax
depreciat ion and amortization were calculated for each year Detailed PampL
balance sheet and cash flow statements are provided in annexure 2 3 and 4
EBITDA = Total Revenue ndash (Variable expenses + Fixed Expenses)
EBITDA margin = EBITDA Total Revenue
PAT margin PAT is calculated by subtracting interests pa id on capital debt and
working capital debt depreciation and applicable corporate income tax from
EBITDA
PAT = EBITDA ndash Interest Payable ndash Depreciation ndash Income tax
PAT margin = PATTotal Revenue
Working Capital Working capital requirement is calculated by subtract ing
current liabilities from current assets Current assets are estimated based on 30
days cash requirement and current liabilities are estimated as half of salary
monthly expenses
WC = Current Assets ndash Current Liabilities
UFCF It is defined as the free cash flows available to the firm if the firm has
zero debt liability Purpose of ca lculat ing UFCF for project period is to determinethe project IRR
UFCF = PAT + Depreciation + Interest (tax adjusted) + Release of WC + Salvage
value of the assets ndash CAPEX ndash Change in WC
882019 Major Project (Ramit)
httpslidepdfcomreaderfullmajor-project-ramit 3862
29
LCFF It is defined as the cash floes available to the firm after paying interests on
long term and short term debts
LCFF = UFCF ndash Interest (tax adjusted)
FCFE It is defined as the free cash flow available to equity holders It is
determined to ca lculate equity IRR for equity investors It also includes the tax
benefits which are available as per the Income Tax Act
FCFE PAT + Depreciation + Salvage Value ndash Equity Investment ndash Long term debt
repayment
PIRR Project IRR is defined as the discount rate at which NPV (Net Present
Value) of UFCF is zero It is calculated by using following formula
UFCF 1 (1+PIRR) 0+ UFCF 2 (1+PIRR) 1+ UFCF 3 (1+PIRR) 2+ helliphelliphelliphelliphelliphellip = 0
UFCF 1 = UFCF at the end of first year of operation
UFCF 2 = UFCF at the end of second year of operation
PIRR = Project IRR
EIRR Equity IRR is defined as the discount rate at which NPV of FCFE is zero
It is calculated by using following formula
FCFE1 (1+EIRR) 0+ FCFE 2 (1+EIRR) 1+ FCFE 3 (1+EIRR) 2+ helliphelliphelliphelliphelliphellip = 0
FCFE1 = FCFE at the end of first year of operation
FCFE2 = FCFE at the end of seco nd year of operation
EIRR = Equity IRR
882019 Major Project (Ramit)
httpslidepdfcomreaderfullmajor-project-ramit 3962
30
WACC It is de fined as the percentage of return expected by the investors who
otherwise would have earned some return by investing in some other project
WACC = Cost of Debt (Debt Capital) + Cost of equity (Equity Capital)
882019 Major Project (Ramit)
httpslidepdfcomreaderfullmajor-project-ramit 4062
882019 Major Project (Ramit)
httpslidepdfcomreaderfullmajor-project-ramit 4162
32
62 Funding planAs the telecom sites are rolled out over a 5 year period till FY 2014 investment will be
required for each year ABC Limited will start generating profits from FY 10 only Such
internally generated cash accruals will be ploughed back into the business to meet part of
the project cost Investment required for each year is tabulated below
Table 61 Funding ProposalMillion INR FY 10 FY 11 FY 12 FY 13 FY 14
GBT Tower (Additional) Nos 210 700 1400 2450 3850
RTT Tower (Additional) Nos 90 300 600 1050 1650DE ratio 233 233 233 233 233
Additional CAPEX 83892 279374 558748 977809 1536557
Debt 58725 195562 391124 684466 1075590
Equity 25168 83812 167624 293343 460967
63 Results
Based on assumptions given in Annexure 1 a detailed financial model was preparedResults of the financial model such as PampL account Balance Sheet and cash flow
statements are provided in Annexure 2 3 and 4 Forecasts for the key financial figures for
first five years are provided in the Table below
Forecasts
Table 62 Income StatementMillion INR FY-10 FY11 FY12 FY-13 FY-14
Sales 7124 50511 156766 347476 667700
Cost of sales 1950 13852 39252 87612 170021
Gross 5174 36659 117514 259864 497679
7263 7258 7496 7479 7454
Admin costs 112 179 190 203 216
882019 Major Project (Ramit)
httpslidepdfcomreaderfullmajor-project-ramit 4262
33
Finance cost 0 021 7401 31330 77725
Taxation 170 4233 14536 29073 53547
PAT 2454 19458 59470 122096 223267
As shown in Table above during the expansion period revenue will grow exponentially
In the first year of operation ABC will earn a revenue of INR 7124 million from 300
(210 GBT and 90 RTT) sites with a tenancy ratio of 15 for GBS and 17 for RTS In the
first 2 years of operation the company will not pay any interest on long term debt due to
2 years moratorium period Major cost associated with the project is depreciation due to
which PAT is lower than the operating profits But cash flows to the firm are enough to
result in reasonable returns
Table 63 Balance Shee tYear ending Mar-10 Mar-11 Mar-12 Mar-13 Mar-14
AssetsGross Block 75742 328216 833164 1716823 3105430Accumulated depreciation 2439 15208 51125 128287 271212Net Block 73303 313009 782040 1588536 2834219Net Working Capital 064 241 620 1335 2515Cash Balance 12979 72089 216513 488856 947982
Total Assets 86346 385339 999172 2078727 3784715LiabilitiesEquity 25168 108980 276604 569947 1030914Reserves amp Surplus 2454 21912 81381 203477 426745Long term Debt 58725 254286 640722 1304302 2325171WC Borrowings - 161 465 1001 1886Total Liabilities 86346 385339 999172 2078727 3784715
Note All figures are in Million INR
Table 64 Key financial ratiosMar-11 Mar-12 Mar-13 Mar-14 Mar-15
Revenue Growth 60902 21036 12165 9216 3890EBITDA Growth 62061 22161 12132 9158 4020
PAT Growth 69293 20564 10531 8286 2955
As shown in table above increase in EBITDA is higher than that of revenue This is due
to better operational efficiency of ABCrsquos management and economies of scale S imilarly
882019 Major Project (Ramit)
httpslidepdfcomreaderfullmajor-project-ramit 4362
34
increase in PAT is lesser than that of EBITDA because of high depreciation and interest
expenses
Table 65 Pr ofitability r atios
Mar-11 Mar-12 Mar-13 Mar-14 Mar-15
EBITDA Margin 7222 7484 7473 7450 7520
PAT Margin 3852 3794 3514 3344 3119Return on Net Worth 622 760 769 788 1087
Key profitability ratios are shown in table above Return on net worth in the initial years
is lower because of the ambitious expansion plans of ABC Limited Thereafter return on
net worth increases with increase in PAT
Returns on Investment
Table 66 Financial returnsFinancial Indicators
Project IRR 1813Equity IRR 3609
64 Sensitivity Analysis
A sensitivity analysis has been carried out on the project financials to determine theimpact of key variables on the financial indicators namely
Project IRR
The key variables on which sensitivity analysis have been carried out areCapital expenditure for GBS and RTS1st and 2 nd tenant tariff for GBS1st and 2 nd tenant tariff for RTSTenancy Ratio
Similarly sensitivity analysis has been carried out forEquity IRR
The key variables on which sensitivity analysis have been carried out for EIRR are
Capital structure and interest rate for capital debtRepayment period and moratorium period
882019 Major Project (Ramit)
httpslidepdfcomreaderfullmajor-project-ramit 4462
35
The impact on the financial indicators is shown below
Figure 6-1 Project IRR vs GBT and RTT CAPEX
As shown in Figure 6-1 project IRR is more sensitive to change in CAPEX of RTT sitesas compared to change in CAPEX of GBT sites because tenancy ratio and tariff for RTTsites are higher than those of GBT sites
882019 Major Project (Ramit)
httpslidepdfcomreaderfullmajor-project-ramit 4562
36
Figure 6-2 Project IRR vs GBT Tariff for 1 st tenant (X-axis) and 2 nd tenant (right-hand side)
As shown in Figure 6-2 project IRR varies linearly with GBT tariff In the best casescenario when GBT tariff for 1 st tenant is INR 34000month and GBT tariff for secondtenant is INR 26000month Project IRR is 2101
Figure 6-3 Project IRR vs RTT Tariff for 1 st tenant (X-axis) and 2 nd tenant (right-hand side)
As shown in Figure 6-2 project IRR varies linearly with RTT tariff In the best casescenario when RTT tariff for 1 st tenant is INR 24000month and RTT tariff for second
882019 Major Project (Ramit)
httpslidepdfcomreaderfullmajor-project-ramit 4662
37
tenant is INR 20000month Project IRR is 1932 Project IRR is more sensitivetowards RTT tariff than GBT tariff because in practical business situation RTT siteshave a tenancy ratio of more than two due to which effect of tariff for 1 st tenant almostget nullified after few years
Figure 6-4 Project IRR vs Tenancy ratio for RTT sites (X-axis) and GBT sites
As shown in Figure 6-4 project IRR is very sensitive to tenancy ratio In the best casescenario where GBT sites have a tenancy ratio of 2 and RTT sites have a tenancy ratio of 3 project IRR can be as high as 20
Figure 6-5 Equity IRR vs long term debt interest rate for different leverage level
882019 Major Project (Ramit)
httpslidepdfcomreaderfullmajor-project-ramit 4762
38
As shown in figure 6-5 equity IRR is more sensitive to interest rate on long term debt forhigh level of leverage (lower debt equity ratio) because as the debt equity ratio increasesinterest paid on long term debt also increases significantly
Figure 6-6 Equity IRR vs long term debt repayment period at different level of moratoriumperiods
As shown in figure 6-6 Equity IRR increases with increase in moratorium period anddebt repayment period The variation is from 1654 to 60 for worst case and best casescenarios
882019 Major Project (Ramit)
httpslidepdfcomreaderfullmajor-project-ramit 4862
39
7 RISK ASSESSMENTRisk Mitigation strategyExecution Risk
(Project management landacquisition etc)
Management of ABC has proven expertise in
telecom infrastructure rollout and has executedvarious projects with large telecom operators andMNC vendorsABCrsquos top management team consists of a groupof professionals drawn from leading telecomInfrastructure Company who have immenseexpertise and experience in rolling out telecominfrastructure projects
Market Risk (No entry barriers operators may
share infrastructure betweenthemselves large players withhigh capital may increasecompetition)
India has a huge potential for telecominfrastructure market With increasing
competition falling tariffs and pressure onmargins telecom service providers are beingforced to increase their focus on marketing andreduce their expensesExperienced management healthy capital back-up effective presence in the telecominfrastructure market and value added services atrelatively lesser cost will help ABC to meet theset targets
Financing Risk
(Availability of equity capitalavailability of long term debtinterest rate and moratoriumperiod)
ABC is seeking private equity partner to secure
equity capital Company has already entered intoNDA with 2 major investorsLong term debt at an interest rate of 125 canbe easily arranged because of the credibility of the promoters in the marketMany other similar firms like Indus and GTLhave already secured long term debt for amoratorium period of 2 years Promoters of ABCLimited are confident to secure a long term debtwith a moratorium period of 2 years and apayback period of 8 years
ABC Limited would minimize the workingcapital requirements of its business by securingrentals and operating revenues in advance fromits clients and or by suitably structuring itspayment liabilities to match its cash inflows
Commercial Risk (Tenancy ratio and tariff forGBS and RTS)
ABC would aim to enter into long term contractswith the ldquoanchor tenantrdquo operator and thenrollout the infrastructure so that at least single
882019 Major Project (Ramit)
httpslidepdfcomreaderfullmajor-project-ramit 4962
40
occupancy of each site is ensured at all t imesPromoters will use its knowledge of the businessand its expertise to identify and roll out sites inlocations which have strong multi- tenancypotential to minimize occupancy risk
Revenue Risk (Operating fees may decreasecredit worthiness of the clientsdelay in payment of rentals)
As per the industry sources till now not even asingle operator have dishonored the long termlease contractThe credit risk is diversified as there will bemultiple operatorsABC would aggressively market to get 3G andWiFi broadcasters to use the sites and earnadditional revenues in addition to the assumedrevenue streams
Natural Calamities Risk The Company shall maintain insurance for thesites against these risks and the cost of insurancewill be priced in and passed on to the tenants
882019 Major Project (Ramit)
httpslidepdfcomreaderfullmajor-project-ramit 5062
41
8 CONCLUSION
India is the fastest growing wireless telecom market in the world The continuing
growth in the number of wireless subscribers and MoUs and increasing trend of
outsourcing of business processes to India has led to growing demand for large
investments in the telecom infrastructure in the country
However with increasing competition falling tariffs and pressure on margins
telecom service providers are being forced to increase their focus on marketing
customer acquisitions and branding and minimize their efforts and overheads in
project management and asset acquisition
Further with rising prices of steel cement and real estate the cost of developing
and owning passive infrastructure is increasingly becoming a costly proposition
for most operators and service providers
The compulsion on the part of service providers to reduce their operating costs
and capital expenditure requirements has led to opportunities in passiveinfrastructure outsourcing to independent third party infrastructure providers and
also sharing the infrastructure with other service providers It is expected that
cellular operators will outsource their communications site infrastructure needs as
a means of accelerating access to their markets and preserving capital rather than
constructing and operating their own communications sites and maintaining their
own communications sites service and deve lopment capabilities
Passive infrastructure is highly capital intensive and an integral part of the cellular
service providersrsquo networks Yet being a simple and low technology asset it is
amenable to outsourcing and sharing By transferring the responsibility of
ownership development and maintenance of passive infrastructure service
882019 Major Project (Ramit)
httpslidepdfcomreaderfullmajor-project-ramit 5162
42
providers have an opportunity to transfer a substantial part of their business risk to
third parties
Most telecom operators are facing capacity constraints on their networksCoverage obligations increasing pressure to improve network quality and
competition has led to aggressive roll out plans by existing cellular operators
Installation of cell sites has become a cumbersome process as there are a number
of clearances required and involves labor-intensive micro management
Availability of ready infrastructure from third party providers would enable the
operators to reduce their time to market and accelerate their access to their
customers Cellular service providers generally want to move quickly when
adding more sites and co-location on an existing site is always faster than
building
Ownership and maintenance of telecom towers and other infrastructure by third
parties is an established practice in developed nations like USA and is
increasingly gaining market acceptance in India
The Indian government is seriously considering promoting the infrastructure
sharing route between the telecom operator and private players to achieve future
national tele-density targets and improve rural telecom penetration
ABC being an independent entity with no business conflicts with other service
providers in the telecom space will be best positioned and have an early mover
advantage to capitalize on this emerging opportunity
Further the task of operating and maintaining the passive infrastructure in the cell
is increasingly becoming a cumbersome exercise for the service providers to
handle ABCrsquos composite offering to build passive infrastructure for the cellular
operators and also operate and maintain them will provide a turnkey solution to
address the infrastructure needs of the service providers
882019 Major Project (Ramit)
httpslidepdfcomreaderfullmajor-project-ramit 5262
43
The business model proposed to be followed by ABC is fairly simple with stable
and predictable cash flows as is the case with the business model of the tower
renting companies in USA Most contracts are long term for a period 10 or moreyears with annual price escalators generally ranging from 3 to 4 However
wireless carriers normally tend to renew rentals because suitable alternative sites
may not exist or be available and repositioning a site in a carrierrsquos network is
expensive and may adverse ly affect network quality
Site ownership and operations is a ldquoscalerdquo business operating administration
marketing expenses etc do not rise as quickly as revenues when portfolios are
expanded Incremental operating costs associated with adding wireless tenants to
a communications site are minimal Therefore as additional tenants are added to a
site the substantial majority of incremental revenue contributes to margin
expansion Most tower companies have high EBITDA margins as may be seen
from the financial indicators of some of the tower rental companies in USA
It is expected that site location and capacity price and quality of service and
successful execution of contracts will be the most significant competitive factors
in this business
ABCrsquos revenue and returns on investment will be primarily driven by its ability
to
o Increase the utilization of the space and infrastructure capacity owned by it by
increasing the number of tenants per site and renting out to maximum number
of users As discussed above return on capital employed (PIRR and EIRR) arevery sensitive to tenancy ratio In worst case scenario project IRR can be as
low as 8 and in the best case scenario it can be as high as 20
o Develop acquire sites of strategic importance and high growth potential that
will enable them to secure better commercial terms from users and attract
more number of tenants Infrastructure provisioning fees rentals for sites are
882019 Major Project (Ramit)
httpslidepdfcomreaderfullmajor-project-ramit 5362
44
extremely location sensitive There is a potential to acquire more land than
that of required to capitalize on the increase in real estate prices
o Develop sites in a cost effective manner ABC would consider purchasing
land only for those GBS sites which have sufficient demand and arestrategically located Else for most of its sites land will be leasehold As
shown above returns (PIRR and EIRR) are very sensitive to capital costs In
the worst case scenario project IRR can be as low as 15 whereas it can as
high as 27 in the best case scenario
o Negotiate and secure long term contracts with good credit quality users with
built in price escalation provisions to mitigate financing risk
o Leverage and secure long term financing at attractive terms and involve in
active treasury management to keep low financing cost Results of the
sensitivity analysis indicate that equity IRR can be as high as 60 foe a
moratorium period of 4 years and interest rate of 10
o Minimize working capital requirements
o Maintain low operating and administration expense
o Secure better OampM margins from operators and retain a healthy share of it in
ABC
o Maintain high service standards and build strong customer relationships
The business would have the potential to capture new revenue opportunities
around the existing assets As demand for towers is expected to grow and as
operators migrate to speedier next-generation wireless technologies they will
need the towers and associated passive infrastructure to transmit their new
services in addition to their existing offerings In addition to increasing capacity
and coverage and improving the quality of their networks cellular serviceproviders are deploying high speed data networks driving incremental demand of
sites The business therefore has potential upsides in the form of adding
customers (tenants) in wireless broadband third generation (ldquo3Grdquo) and wireless
data capabilities and also other incremental value propositions by way of hosting
882019 Major Project (Ramit)
httpslidepdfcomreaderfullmajor-project-ramit 5462
45
Billboards Hoardings etc in some of the high visible sites owned and maintained
by it
Based on the assumptions and subject to satisfactory resolution of the key risks
factors project cash flows will be able to meet debt service obligations
This business model is a lucrative investment option for a private equity player
because valuation of each site will increase in the coming years due to
improvement in market conditions increase in the value of land and increase in
the demand for passive infrastructure in rural and semi-urban areas
882019 Major Project (Ramit)
httpslidepdfcomreaderfullmajor-project-ramit 5562
46
REFERENCESAnjan G V A amp N M (2009) telecom infrastructure industry in india GurgaonICRA
Bessler W Norsworthy J amp Shusterman T (2001 12 1) Mergers in the UStelecommunications industry and market valuationeffects IEEE p 288
COAI (2009 march 14) Subscriber Figures Retrieved march 14 2009 fromCOAIcom httpwwwcoaicomstatisticsphp
IDA (2009 march 23) Highlights Retrieved march 23 2009 from idagovsghttpwwwidagovsghomeindexaspx
K R (2008) Time for new business model Delhi Cybermedia
MAXIS (2009 march 8) the malaysian telecommunications industry Retrieved march9 2009 from maxiscommyhttpwwwmaxiscommypersonalabout_usinvestorprospectusprospectus4pdf
P J amp Lisa A (2009) Stimulas spending and American Telecom Industry USACoracle group
PwC (2009 march 12) Indian Telecom Industry Gurgaon Harayana IndiaRamachanran (2009 march 1) Investment in Telecom Infrastructure sector (M RInterviewer)
Vogelsang I (2002) The German Telecommunications Reform Verein fuumlr Socialpolitik (p 26) Innsbruck Boston Press
882019 Major Project (Ramit)
httpslidepdfcomreaderfullmajor-project-ramit 5662
47
ANNEXURES
ANNEXURE 1 Key Assumptions
The occupancy of each site by single two three operators for green-field sites is assumed
to be as follows
Table 91 Expected Tenancy RatiosFY 10 FY 11 FY 12 FY 13 FY 14 FY15
GBT Tenant
Ratio 150 150 170 170 170 200
Single Operator 50 50 30 30 30 0
Two Operator 50 50 70 70 70 100
RTT Tenant
Ratio 170 170 200 200 200 250
Single Operator 30 30 0 0 0 0
Two Operator 70 70 100 100 100 50
Three Operator 0 0 0 0 0 50
From FY 15 onwards tenancy ratio of 2 and 25 for GBT and RTT sites is cons idered
882019 Major Project (Ramit)
httpslidepdfcomreaderfullmajor-project-ramit 5762
48
Capital costs related assumptions are tabulated below
Table 92 GBT and RTT Capital Cost
The lease rentals for RTT sites are reimbursed from the operators and therefore have not
been factored in the revenues as well as the expense For GBT sites land purchase cost of
035 millions assumed which has been escalated by 6 annually to determine the
salvage value of assets
GBT Capital Costs
Million
INR
Delivery cost of Ground Based
Tower (GBT)063
Delivery cost of Generator 030
Civil Work 040Shelter 012
Electrical Works 030
Other Equipments (UPS Battery
etc)045
Construction cost 045
Land 035
Contingency amp Financial Charges 035Total cost 335
RTT Capital Costs
Million
INR
Delivery cost of Roof Top
Tower (RTT) 030
Delivery cost of Generator 020
Civil Work 020Shelter 012
Electrical Works 030
Other Equipments (UPS
Battery etc) 030
Construction cost -
Land -
Contingency amp FinancialCharges 008
Total cost 150
882019 Major Project (Ramit)
httpslidepdfcomreaderfullmajor-project-ramit 5862
49
Ope rating costs related assumptions are tabulated below
Table 93 Operating CostsOperating Costs
Security Sentries (INRMonth) 4000
Supervisors (INRMonth) 6000
Cluster Manager One for Fifty Towers (INRMonth) 15000
Annual increase 500
Number of Security Sentries per tower 300
Number of supervisors per tower 010
Number of C luster manager per tower 002
Fixed Expenses
Selling amp Maintenance (INRMonth) 4000000
Annual Escalation 5
Administration overhead (INRMonth) 10000000Annual Escalation 7
AMC Cost of Generator 15 (cost of generator)
Annual Escalation (AMC) 3
For RTT sites security sentries are not required because it will be the responsibility of
the site owner A supervisor will for every 10 sites and a cluster manager for every 50
sites will be required
882019 Major Project (Ramit)
httpslidepdfcomreaderfullmajor-project-ramit 5962
50
Table 94 Long term debtInterest Rate 125 per annum
Moratorium 2 years
Repayment Period 8 years
Tariff related assumptions and date of operations are tabulated below
Table 95 GBT and RTT Tariff Table 96 Life of the projectTariff Plan
Tariff (INRMonth)
No of
operators GBT RTT
1 28000 18000
2 22000 14000
3 0 12000
Annual
increase 3 3
Commercial Operation Date 1-Aug-09
Quarter Ending 30-Sep-09
FY ending COD 31-Mar-10
Project life years 15
End of commercial
operations31-Aug-24
Quarter ending commercial
operations30-Sep-24
FY ending comme rcial
operations31-Mar-25
882019 Major Project (Ramit)
httpslidepdfcomreaderfullmajor-project-ramit 6062
51
Annexure 2 Profit amp Loss accountsTable 97 Profit amp loss account statement
Income Statement (MNINR)Year ending Mar-10 Mar-11 Mar-12 Mar-13 Mar-14 Mar-15
RevenueGBT 406350 28811 89080 197447 379409 527015Operator Fees (GBT) 1411 10004 30678 67998 130664 179664RTT 1209 8575 27269 60443 116146 164264
Operator Fees (RTT) 440 3121 9739 21587 41481 56466Net Revenue 7124 50511 156766 347476 667700 927410
Expenses
VariableSecurity Sentries 1355 9790 28339 64033 125433 158238Supervisors 097 699 2024 4574 8959 11303Cluster Manager 048 350 10 12 2287 4480 5651AMC Cost of Generator 450 3013 7877 16719 31148 54541Sub-total 1950 13852 39252 87612 170021 229734
Fixed
Selling amp Maintenance(INRMonth) 032 050 053 056 058 061
Administration overhead(INRMonth) 080 128 137 147 157 168
Sub-total 112 179 190 203 216 230
EBITDA 5062 36480 117324 259661 497464 697447
Interest on LT loan - - 7341 31200 77479 156198Interest on ST loan - 021 060 130 245 361
EBDT 5062 36459 109923 228331 419739 540888Depreciation 2439 12769 35917 77162 142925 174006
EBT 2624 23691 74006 151169 276814 366881Income Tax 170 4233 14536 29073 53547 77634
PAT 2454 19458 59470 122096 223267 289247
882019 Major Project (Ramit)
httpslidepdfcomreaderfullmajor-project-ramit 6162
52
Annexure 3 Balance sheet
Table 98 B alance sheetsYearend Balance Sheet (MNINR)Year ending Mar-10 Mar-11 Mar-12 Mar-13 Mar-14 Mar-15
AssetsGross Block 75742 328216 833164 1716823 3105430 3105430Accumulated depreciation 2439 15208 51125 128287 271212 445218Net Block 73303 313009 782040 1588536 2834219 2660212Net Working Capital 064 241 620 1335 2515 3707Cash Balance 12979 72089 216513 488856 947982 1294734Total Assets 86346 385339 999172 2078727 3784715 3958653
LiabilitiesEquity 25168 108980 276604 569947 1030914 1030914Reserves amp Surplus 2454 21912 81381 203477 426745 715992Long term Debt 58725 254286 640722 1304302 2325171 2208967WC Borrowings - 161 465 1001 1886 2780Total Liabilities 86346 385339 999172 2078727 3784715 3958653
882019 Major Project (Ramit)
httpslidepdfcomreaderfullmajor-project-ramit 6262
Annexure 4 Cash flow statement
Table 99 Cash flow statements
Year ending Mar-10 Mar-11 Mar-12 Mar-13 Mar-14 Mar-15
InflowsPAT 2454 19458 59470 122096 223267 289247Depreciation 2439 12769 35917 77162 142925 174006Tax adjusted interest - 014 4959 20991 52076 104895Release of WC - - - - - -Salvage Value - - - - - -Sub-Total 4893 32241 100345 220249 418268 568148
OutflowsCapex 75742 252474 504948 883659 1388607 -Change in WorkingCapital 064 177 379 715 1180 1192
Sub-Total 75806 252651 505327 884374 1389787 1192
UFCF (70913) (220410) (404982) (664125) (971519) 566956LFCF (70913) (220424) (409940) (685116) (1023595) 462062
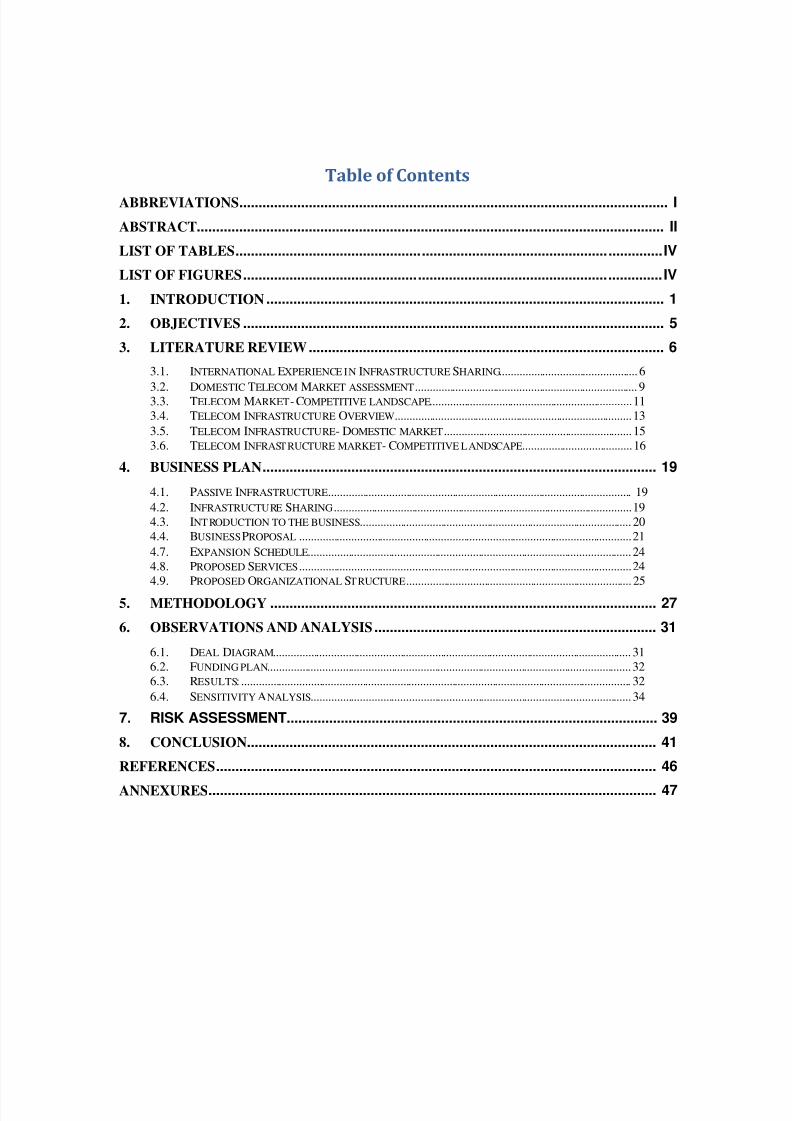
882019 Major Project (Ramit)
httpslidepdfcomreaderfullmajor-project-ramit 562
Table of Contents
ABBREVIATIONS I
ABSTRACT II
LIST OF TABLES IV
LIST OF FIGURES IV
1 INTRODUCTION 1
2 OBJECTIVES 5
3 LITERATURE REVIEW 6
31 INTERNATIONAL EXPERIENCE IN INFRASTRUCTURE SHARING 6
32 DOMESTIC TELECOM MARKET ASSESSMENT 9 33 TELECOM MARKET - COMPETITIVE LANDSCAPE 11 34 TELECOM INFRASTRUCTURE OVERVIEW 13 35 TELECOM INFRASTRUCTURE - DOMESTIC MARKET 15 36 TELECOM INFRASTRUCTURE MARKET - COMPETITIVE LANDSCAPE 16
4 BUSINESS PLAN 19
41 PASSIVE INFRASTRUCTURE 19 42 INFRASTRUCTURE SHARING 19 43 INT RODUCTION TO THE BUSINESS 20 44 BUSINESS PROPOSAL 21 47 EXPANSION SCHEDULE 24 48 PROPOSED SERVICES 24 49 PROPOSED ORGANIZATIONAL STRUCTURE 25
5 METHODOLOGY 27
6 OBSERVATIONS AND ANALYSIS 31
61 DEAL DIAGRAM 31 62 FUNDING PLAN 32 63 RESULTS 32 64 SENSITIVITY ANALYSIS 34
7 RISK ASSESSMENT 39
8 CONCLUSION 41
REFERENCES 46
ANNEXURES 47
882019 Major Project (Ramit)
httpslidepdfcomreaderfullmajor-project-ramit 662
i
ABBREVIATIONS
ARPU Average Revenue per User BOO Build Own OperateBTS Base Trans-receiver StationCDMA Code Division Multiple AccessCOAI Cellular Operators Association of IndiaDoT Department of TelecommunicationsDSCR Debt Service Coverage RatioEBITDA Earnings Before Interest Tax Deprec iation and AmortizationEIRR Equity Internal Rate of ReturnFCFE Free Cash Flow to EquityFDI Foreign Direct InvestmentGBS Ground Based Site
GBT Ground Based TowerGSM Global System for Mobile CommunicationIP Infrastructure ProviderIRR Internal Rate of ReturnIT Information TechnologyLFCF Levered Free Cash Flow to FirmLOI Letter of IntentMSI Managed Services InfrastructureNOC Network Operat ing CentrePAT Profit After TaxPIRR Project Internal Rate of Return
QoS Quality of ServiceTRAI Teleco m Regulatory Authority of IndiaROA Return on AssetROE Return on EquityRTS Roof Top SiteRTT Roof Top TowerSLA Service Level AgreementSLM Straight Line MethodTRAI Teleco m Regulatory Authority of IndiaUFCF Unlevered Free Cash Flow to FirmVPN Virtual Private Network WACC Weighted Average Cost of CapitalWC Working CapitalWLL Wireless Local Loop
882019 Major Project (Ramit)
httpslidepdfcomreaderfullmajor-project-ramit 762
ii
ABSTRACTIndian telecom industry was dominated by government organization till 1991 after which
many private players have entered into this market Since its liberalization the industry
has experienced impressive growth because of strong demand investor friendlyregulatory schemes and strengthening economy At present India is the second largest
mobile market in the world and is also among the fastest growing mobile markets
globally The total number of mobile subscribers in India (ie the subscriber base) has
crossed 300 million with 30049 million subscribers as on 31st March 2008 (TRAI
database)
With increase in market competition and pressure on margins telecom service providers
are being forced to increase their focus on marketing and customer acquisition This has
led to opportunities in passive infrastructure outsourcing to independent third party
infrastructure providers and also sharing the infrastructure with other service providers
Recently Telecom Regulatory Authority of India has awarded new licenses to new
players such as Unitech Swan Telecom and S Tel Limited The significant expansion
plans of the new entrants and their need to optimize investments so that they can compete
with existing players will further drive the demand of passive infrastructure in the
country
ABC Limited is an independent infrastructure provider company which proposes to buildown and operate passive infrastructure sites for telecom service providers ABC Limited
is planning to raise capital to start its operation in FY 10 Based on the details regarding
capital expenditure operating expenditures and future expansion plans of ABC Limited
provided by the promoter of the company a detailed financial model has been prepared
and key financial ratios has been estimated to assess the financial feasibility and returns
on investment
Total investment required to meet the target of around 12000 tower sites (both GBT and
RTT) is estimated to be INR 36343 million ABC has planned to raise 70 of required
capital through long term debt and remaining as equity Results of financial model shows
that IRR for such project will be more than 18 and equity IRR will be around 36
provided that ABC will meet the above target of 12000 tower sites by FY14 Project IRR
is very sensitive to Capital costs tenancy ratio and monthly tariff for each site On the
882019 Major Project (Ramit)
httpslidepdfcomreaderfullmajor-project-ramit 862
iii
other hand equity IRR is sensitive to loan moratorium period and interest rate on long
term debt The project will generate enough cash flows to cover its debt obligation and
also to generate high return on equity invested
882019 Major Project (Ramit)
httpslidepdfcomreaderfullmajor-project-ramit 962
iv
LIST OF TABLESTable 31 Telecom Circles 17 Table 41 Expansion Plan 31
Table 61 Funding Proposal 39 Table 62 Income Statement 39 Table 63 Balance Sheet 40 Table 64 Key financial ratios 40 Table 65 Profitability ratios 41 Table 66 F inancial returns 41 Table 91 Expected Tenancy Ratios 50 Table 92 GBT and RTT Capital Cost 51 Table 93 Operating Costs 52 Table 94 Long term debt 52 Table 95 GBT and RTT Tariff 53 Table 96 Life of the project 53 Table 97 Profit amp loss acco unt statement 54 Table 98 Balance sheets 55 Table 99 Cash flow statements 56
LIST OF FIGURES
Figure 3-1 Growth of Subscriber base 10 Figure 3-2 Mobile Penetration Rate 10 Figure 3-3 Market Share 11
Figure 3-4 Licensed Circles 12 Picture 3 1 Telecom Tower 14 Figure 3-5 Telecom Infrastructure Market Players 16 Figure 3-6 Telecom Tower Growth Scenario 17 Figure 6-1 Project IRR vs GBT and RTT CAPEX 35 Figure 6-2 Project IRR vs GBT Tariff 36 Figure 6-3 Project IRR vs RTT Tariff 36 Figure 6-4 Project IRR vs Tenancy ratio for RTT sites and GBT sites 37 Figure 6-5 Equity IRR vs long term debt interest rate for different leverage level 37 Figure 6-6 Equity IRR vs long term debt repayment period at different level of moratorium periods 38
882019 Major Project (Ramit)
httpslidepdfcomreaderfullmajor-project-ramit 1062
1
1 INTRODUCTION
ABC Ltd 1 is an Infrastructure Provider company that builds owns operates and
maintains passive network infrastructure on a shared basis for mobile telecom operators
and ITES providers The Company was formed in Jan 2009 Its objective is to provide
network design and planning network deployment network operations amp maintenance
infrastructure management application management and professional services to telecom
operators and enterprises
The company is planning to raise capital in the form of equity and debt to start its
operation by Aug 09 The purpose of this project is to prepare detailed financial model
for assessment of feasibility of such projects building scenarios and sensitivity charts
calculation of risk and returns associated with the project and valuation of ABC Limited
subjected to present and expected future market conditions
ABCrsquos vision is to provide world class managed infrastructure amp allied services to the
service providers to optimize their service delivery capability In the initial years of
operation the company will focus on telecom sector with almost 100 of its proposed
capital expenditure till FY 14 earmarked for developing and owning passive
infrastructure for sharing among mobile service providers
Passive Telecom Infrastructure Sharing
Mobile networks have base stations (or cell sites) which have active and passive
infrastructure components Active components include the antenna trans-receivers
switches feeder cables Node B and microwave radio equipments Passive (or non-electronic) components include the land tower shelter air-conditioning equipment
diesel electric generator battery electrical supply technical premises and easements
pylons etc Passive infrastructure in a mobile network essentially involves acquiring land
1 Actual name o f the company is no t stated as per the instructions given by external supervisor
882019 Major Project (Ramit)
httpslidepdfcomreaderfullmajor-project-ramit 1162
2
setting up towers and electrical and civil works that needs to be in place before operators
can install the active infrastructure which brings mobile services to the consumers In a
typical cell site build-out almost 65 of the total cost is attributed to passive
infrastructure and 35 to active infrastructure In this report passive cell siteinfrastructure has also been henceforth referred to as towers or sites
Mobile operators are required to setup more and more BTS (cell) sites due to the
exponential growth of mobile subscribers in India (currently growing at almost 152
million subscribers a month) and limited availability of spectrum B and C Circles (where
traffic density may not be as high as metros and Circle A) are expected to drive future
subscriber growth and requirements for cell sites will be higher to ensure greater
coverage
To cover large stretch of almost 65000 Kilometers of national highways additional
18000 towers (one tower for every 3 Kilometers of highway) will be required in near
future to ensure better connectivity Proposed build out of 3G networks are expected to
further drive substantial growth in the number of towers over the next few years
However creating new infrastructure by each operator separately leads to duplicating
huge capital investments It also contributes to mushroom growth of telecom towers and
deteriorating skylines in urban areas which has already led to some local municipal and
state governments to regulate and restrict the erection of new mobile towers
The continued pressure on cellular tariffs higher infrastructure costs for network
deployment particularly in semi-urban and rural areas and compelling need to reduce
time to market for network roll outs have led operators to share and even outsource theirinfrastructure requirements from third party infrastructure providers like ABC GTL and
Indus towers
2 As published in ET 8 th May 09 Edition
882019 Major Project (Ramit)
httpslidepdfcomreaderfullmajor-project-ramit 1262
3
Sharing promotes capital efficiency as it allows more than one service provider to
leverage and ride on common infrastructure In its simplest form it involves two or more
operators jointly using the common passive infrastructure in a cell site While viewed
largely as a measure to reduce CAPEX and operating expense such sharing also leads toimprovement of service quality (by ensuring site space for service providers and reducing
black spots) and the environment (by reducing number of cell sites and towers)
In outsourcing operators take passive infrastructure and tower space from third party
infrastructure companies on a monthly rental basis to host their radio and transmission
equipments Outsourcing provides significant benefits to operators It enables them to
save on capital expenditure (it actually converts CAPEX into OPEX in the form of lease
rentals) and focus on their core activities of sales marketing and branding while leavingthe cumbersome task of managing the site development process and site operation and
maintenance to third parties who exclusively deal with such activities
Active infrastructure sharing is not popular across the globe for several reasons the most
important being increased inter dependency among competing service providers
However tower sharing and outsourcing of tower ownership is an accepted practice in
many developed markets In countries like USA UK and Australia there are
independently owned tower companies who rent tower space to various mobile operators
The United States has arguably the most developed independent mobile tower market
with independent tower companies owning over half of all mobile towers in that country
Mobile tower owners generate revenue by owning the towers and leasing space on the
towers to mobile telecommunications operators under long-term contracts Under this
business model ownership of the base station equipments coupled to the towers is
retained by the mobile telecommunications operators In addition to rental payments
mobile tower owners generally receive a fee for installing customers base station
equipment on the tower Mobile tower owners also receive services revenue for
operations and maintenance of the passive infrastructure Regulators all over the world
favor passive sharing of infrastructure
882019 Major Project (Ramit)
httpslidepdfcomreaderfullmajor-project-ramit 1362
4
The concept of passive infrastructure sharing is increasingly gaining market acceptance
in India So far it has been largely limited to bilateral sharing between operators in the
form of barter where the operators split the site related CAPEX and OPEX costs The
available information suggests that about 25 of the existing 90000 tower sites in Indiaare currently being shared for passive infrastructure predominantly in rural areas and
small towns
ABC Limited is expecting to get shortlisted by Department of Telecom for setting up
passive cellular infrastructure in rural areas with support from the Universal Services
Obligations (USO) Fund The recent announcements by some operators like Bharti
Hutch (Vodafone) Reliance Idea for mutual sharing of infrastructure through new
companies and entry of third party infrastructure providers has further expanded the
tower market in India
Results of detailed financial model indicate that with given expansion plans and
assumptions ABC will create value for its shareholders investors clients and promoters
The project is expected to generate high cash flows which will be sufficient enough to
pay back its debt liabilities and to generate and equity IRR of 36
882019 Major Project (Ramit)
httpslidepdfcomreaderfullmajor-project-ramit 1462
5
2 OBJECTIVES
The scope of work for this Study project involves the following
Market assessment for Indian telecom Infrastructure sector
Collection of data related to capital and operating costs (from promoter)
Forecasting operating costs
Preparation of detailed financial model
Calculation of UFCF ( Unlevered Free Cash Flows) LFCF (Levered Free Cash
Flows)
Estimation of Project and Equity IRRrsquos
Preparation of balance sheet PampL and cash flow statement for expected life
cycle of project
Sensitivity analysis and Scenario analysis
882019 Major Project (Ramit)
httpslidepdfcomreaderfullmajor-project-ramit 1562
6
3 LITERATURE REVIEW
31 International Experience in Infrastructure Sharing
Different countries have adopted different approaches in order to safeguard the level of
competitive independence between co-operating operators Measures include mandating
a distinct and differentiated cost base between operators the development of different
business plans marketing and distribution strategies and the independent development or
acquisition of content and services Requiring the independent control over the respective
frequency resources of each operator is also an important competitive safeguard
In the EU for example operators are allowed to share infrastructure as long as they
maintain full operational control of their network Sharing the radio access network is
permitted but sharing frequencies and the core network is not In particular the databases
used to administer subscriber and interconnection information are required to be kept
separate Exemptions however are generally granted in special cases which advance the
objectives of government policy and the economic benefits to the consumers of the
services It is important to note that any infrastructure sharing agreement could also be
subject to review by the EC Commission under Article 81 of the EC Treaty andor the EC
Merger Regulation
USA
In USA the number of wireless service subscribers has increased from 1284 million to
2433 million between December 2001 and December 2007 representing an increase of
approximately 88 and market penetration of approximately 70 The tower business in
USA is a $5 billion industry consolidated around four large players -- American Tower
(ATC) Crown Castle International (CCI ) SBA Communications (SBAC ) and GlobalSignal (GSL ) which control 40 of the approximately 210000 (P amp Lisa 2009) towers
across the US The primary business of these companies involves leasing antenna space
on multi-tenant communications sites to a variety of wireless carriers including radio and
3 Source CTIA-The Wireless Association Website
882019 Major Project (Ramit)
httpslidepdfcomreaderfullmajor-project-ramit 1662
7
television broadcast companies under long-term lease contracts Typically these leases
are long-term (five to 10 year) contracts with renewal terms at the option of the customer
Some co mpanies offer tower related services on a limited basis including site acquisition
zoning and permitting services and structural analysis services and project managementof antenna installations that support their site leasing operations and the addition of new
tenants and equipment on their sites
Towers are a relatively scarce asset in USA as zoning laws often do not permit a new
tower to be built in the immediate vicinity of an existing tower Tenant churn tends to be
low as towers are an integral part of the networks of the wireless service providers
Tenants own their own equipment (and therefore bear the technology risk) generally
handle installation and maintenance and pay for electricity and most ongoing assets
greatly simplifying the tower business model
Germany
In Germany the main concern faced by the regulator involved a possible threat to the
competitive independence of potential 3G operators that could result from a tight
integration of the networks as a result of infrastructure sharing Infrastructure Sharing is
allowed only if the mobile systems can be independently operated for example if they
can be shut down or maintained independently by software and that no customer data is
shared (OECD report 2004) In Germany the sharing of antennae and sites is relatively
common however the sharing of transmission management equipment and core
networks is not commonly done (Vogelsang 2002)
Sweden
In Sweden the regulator has agreed to allow significant infrastructure sharing for 3G
operators Each operator only has to cover 30 of the customers while for the remaining
70 infrastructure can be shared This is the approach being taken by the Europolitan
companies Vodafone Hi3G and Orange which jointly own 3G Infrastructure Services
However with competition concerns the regulator only allows radio components such as
antennas cables and base station electronics to be shared (Khurram Mahmood 2008)
882019 Major Project (Ramit)
httpslidepdfcomreaderfullmajor-project-ramit 1762
8
Singapore
In the case of Singapore the regulatorrsquos infrastructure sharing approach is guided by the
primary policy goal of encouraging facilities-based competition Under the current
regulatory framework licensees are generally not required to share any infrastructure that
it controls with its competitors Each licensee is expected to build or lease the use of the
infrastructure it requires Notwithstanding this however infrastructure sharing is
mandated in areas where there are clear space and operating constraints For 2G and 3G
licensees such matters relate to infrastructure in the Mass Rapid Transit and underground
road tunnels The regulator has also allowed the co-location of base stations and sharing
of transmission towers and masts to reduce the impact on the environment and to
minimize the inconvenience to building owners and residents (IDA 2009)
Malaysia
Taking a different approach in Malaysia operators owning network facilities have been
encouraged by the regulator to share infrastructure as a means of lowering costs and
expanding coverage as well as to avoid a duplication of resources To this effect a
Memorandum of Understanding to share infrastructure has been executed between the
mobile operators To further catalyze infrastructure sharing the concept of a third party
provider of facilities is also being promoted in Malaysia Under this concept of a third
party will build the infrastructure and lease capacity or space to existing se rvice
providers This concept not only provides ready-made sites but will also help reduce the
numbers of telecommunication towers that have to be dealt with by local authorities
(MAXIS 2009)
882019 Major Project (Ramit)
httpslidepdfcomreaderfullmajor-project-ramit 1862
9
32 Domestic Telecom Market assessment
The Indian Telecom Industry-Historical perspective
The Indian telecommunication industry was originally a government controlled
monopoly comprising three state owned operators
MTNL (which provided wire-line services in Mumbai and Delhi metropolitan
areas)
DOT (which provided wire-line services to rest of the country)
VSNL (which provided international services)
Liberalization started in 1991 with opening up of mobile services to private sectorparticipation The country was divided into 23 circles comprising of four metropol9otan
areas (Chennai Delhi Kolkata and Mumbai) and 19 other circles broadly defined by
parameters of states (K 2008) These 19 non-metropolitan circles have been categorized
as A B and C circles in descending order of their revenue generation potential (as
shown below)
Table 31 Telecom Circles
MetropolitanAreas Circle A Circle B Circle C
Delhi ChennaiMumbai Kolkata
Gujarat KarnatakaAP Tamil NaduMaharashtra
Punjab Kera laHaryana UP (West)Rajasthan UP(East) MP WestBengal
HP JampK North-East OrissaAssam Bihar
In 1997 TRAI was formed for regulating the operations and policy making process of
Indian telecommunication sector Since its liberalization India has experienced sustained
and impressive growth in its telecommunication sector primarily because of progressive
regulatory regime strong demand for mobile telecommunication services and
strengthening economy The country has achieved distinction of having worldrsquos lowest
tariff fastest growth ion subscriber base and availability of some of the cheapest mobile
handsets
882019 Major Project (Ramit)
httpslidepdfcomreaderfullmajor-project-ramit 1962
10
Figure 3-1 Growth of Subscriber base
Growth of Subscriber base
050
100150200250300350
1998 1999 2000 2001 2002 2003 2004 2005 2006 2007 2008
Year
M i l l i o n
Source Telecom Regulatory Authority of India Database
India is the second largest mobile market in the world is also among the fastest growing
mobile markets globally The total number of mobile subscribers in India (ie the
subscriber base) has crossed 300 million with 30049 million subscribers as on 31st
March 2008 The growth of subscriber base during the past decade (1998-2008) is
indicated above in a chart
Figure 3-2 Mobile Penetration Rate
0 10 20 30 40 50 60 70 80 90 100
North-East ( C)Assam (C)
Bihar ( C)Jammu amp Kashmir (C)
Orissa (C)Him achal Pradesh (C)
Uttar Pradesh ( B)Madhya Pradesh (B)
Rajastan (B)Haryana (B)
Punjab (B)West Bengal (B)
Kerala (B)Maharashtra (A)
Gujarat (A)Tamil Nadu (A)
Andhra Pradesh (A)Karnataka (A)
Kolkata (Metro)Chennai (Metro)Mumbai (Metro)
Delhi (Metro)
Source TRAI and PwC DatabaseNote As on Dec 08
882019 Major Project (Ramit)
httpslidepdfcomreaderfullmajor-project-ramit 2062
11
Indian telecom industry has experienced a high growth rate in Metros and class A circles
with coverage reaching around 90 and 35 respectively However coverage in the
Class B and Class C cities is still low at 15-25 Growth in Class B and Class C circles
has concentrated in urban area while penetration in rural area remains lower Thus futuregrowth is likely to come largely from Class B and C circles and rural areas Keeping this
in view larger players like Bharti Airtel Limited Reliance Communications Limited and
Bharat Sanchar Nigam Limited (BSNL) are largely focusing on increasing their
geographical coverage in Class B and C c ircles
33 Telecom Market- Competitive landscape
Figure 3-3 Market Share
Bharti2668
BSNLMTNL1908
Reliance1971
Vodafone661
Tata1047
Idea1033
Aircel457
Spice181
BPL056
HFCL013
Shyam005
Market Share
Source TRAI and Pw C Database
Indian mobile sector is largely concentrated with top 4 market players (Bharti Airtel
Reliance Communication Vodafone Essar and BSNL) out of 10 capturing almost three-
fourth of the entire market This is also partly on account of the fact that these four
operators have their presence in a larger number of circles as compared with other
players
882019 Major Project (Ramit)
httpslidepdfcomreaderfullmajor-project-ramit 2162
12
Figure 3-4 Lice nsed Circles
0
5
10
15
20
25
Licensed Circles (Dec 07) New Circles (Sep 08)
Source TRAI and CRISIL Database
The competition in Indian telecom sector is expected to intensify in near future because
recently new licenses have been granted to some of the existing operators for new circles
and also to new entrants like Unitech Datacom Swan Telecom and Stel These new
players are expected to capture the rural and semi-urban cities of C ircle B and Circle C as
they are now expected to grow at a much faster rate Shorter network rollout time and
competitiveness in the industry will force these entrants to start the ir operation as early as
possible Tower companies like ABC will allow incumbents to start operations in a
particular region just by installing their electronics on the ready-to-use towers thereby
significantly shortening the ro llout time
Moreover a rapidly increasing subscriber base and spectrum crunch would force the
existing telecom operators to maintain the minimum level of QoS Thus to retain existing
subscribers by preventing subscriber churn operators will require additional
infrastructure in their existing areas of operation to be able to offer better QoS This will
also result in increase in demand for telecom infrastructure in the existing markets
(Ramachanran 2009)
882019 Major Project (Ramit)
httpslidepdfcomreaderfullmajor-project-ramit 2262
13
34 Telecom Infrastructure Overview
Passive infrastructure is one of the most important components of a mobile network It
has been a critical area of operations for telecom companies in the past However with
increasing competition posing an urgent need for telecom companies to expand their
coverage and sharpen their focus on core operations so that they can sustain and improve
their market position passive infrastructure has assumed the status of an independent
industry during the past few years The industry (COAI) estimates that there will be a
requirement of around 350000 towers for 500 million subscribers by 2010 (COAI
2009)
Each site has active and passive infrastructure components Active components includethe antenna trans-receivers switches feeder cables Node B and microwave radio
equipments Passive (or non-electronic) components include the land tower shelter air-
conditioning equipment diesel electric generator battery electrical supply technical
premises and easements pylons etc Passive infrastructure in a mobile network
essentially involves acquiring land setting up towers and electrical and civil works that
needs to be in place before operators can install the active infrastructure which brings
mobile services to the consumers In a typical cell site build-out almost 65 of the total
cost is attributed to passive infrastructure and 35 to active infrastructure
(Ramachanran 2009)In this report passive cell site infrastructure has also been
henceforth referred to as towers or sites
The components of a typical base station are shown below
882019 Major Project (Ramit)
httpslidepdfcomreaderfullmajor-project-ramit 2362
14
Picture 3 1 Telecom Tower
Telecom towers are broadly classified on the basis of their placement as Ground-basedand Roof-top
1 Ground-Based Tower Ground-based towers (GBTs) are taller (typically 200 to 400
feet) and are mostly used in rural and semi-urban areas because of the easy
availability of real-estate space there GBTs involve a capital expenditure in the range
882019 Major Project (Ramit)
httpslidepdfcomreaderfullmajor-project-ramit 2462
15
of Rs 3 to 4 million depending on the height of the tower land prices etc
(Ramachanran 2009)
2 Roof-Top Tower (RTT) Roof-top towers (RTTs) are generally placed on the roofsof high-rise buildings They are shorter (than GBTs) and more common in urban and
highly populated areas where there is paucity of real-estate space Typically these
involve a capital expenditure of Rs 15 to 2 million (Ramachanran 2009)
The height of a telecom tower determines the number of antennas that can be
accommodated which in turn determines the capacity of the towers apart from factors
such as location and geographica l conditions (wind speeds type of terrain etc)
35 Telecom Infrastructure- Domestic market
In India there are broadly two kinds of operators in the tower infrastructure industry
Tower infrastructure subsidiaries
Reliance Infratel Limited
Bharti Infratel Limited
Indus Towers Limited
Wireless TT Info Services Limited (WTTIL)
Independent tower infrastructure companies (ITICs)
GTL Infrastructure
Xcel Telecom
Essar Telecom Infrastructure
Aster Infrastructure
Bharat Telemast
882019 Major Project (Ramit)
httpslidepdfcomreaderfullmajor-project-ramit 2562
16
These companies have their business model based largely on contract or anticipatory
approaches Under the contract approach tower companies set up tower sites going by
the requirements of the telecom operators and the terms of the contract are specified
beforehand in the MSAs signed by the two parties Under the anticipatory approachhowever tower companies set up tower infrastructure at sites with reasonable demand
potential and subsequently invite telecom operators to set up their network on these
towers The latter model involves higher business risks as the tower company may not be
able to achieve reasonable tenancy for its tower infrastructure and at profitable terms
BPTL proposes to follow contract approach for its business model
36 Telecom Infrastructure market- Competitive landscape
Figure 3-5 Telecom Infrastructure Market Players
038058154
365692
10381692
26923269
0 20000 40000 60000 80000 100000
Aster InfrastructureAmerican Towers
Essar Telec om Infrastructure
GTL In frastructureWi reles s TT In fo Services Limited
Bharti Infratel Limited
Reli anc e Communications Limitedrsquos
OthersInd us To wers Limited
Number of Towers
Market Players
Source Telecom Regulatory Authority of India and ICRANote Others include tower por tfolios of BSNL MTNL Sistema Shyam Teleservices Aircel etc
In Indian Telecom Infrastructure market competition has intensified significantly with
several players spinning of their tower portfolio and independent operators expanding
their operations
882019 Major Project (Ramit)
httpslidepdfcomreaderfullmajor-project-ramit 2662
17
Bharti Airtel Limited Reliance Communications Limited and Tata Teleservices Limited
have hived off their tower assets into separate tower infrastructure subsidiaries namely
Bharti Infratel Limited Reliance Infratel Limited and Wireless TT Infoservices Limited
respectively Also Bharti Infratel Limited together with Vodafone Essar Limited and IdeaCellular Limited in a joint- venture agreement has created Indiarsquos largest tower
infrastructure company ndash Indus Towers Limited which has an estimated portfolio of
around 88000 towers (Anjan V amp N 2009) Whereas in past few years number of
independent tower infrastructure companies have ventured into the domestic telecom
tower industry These include GTL Infrastructure Limited Essar Telecom Infrastructure
Limited Xcel Telecom Private Limited (American Towers) Tower Vision India Private
Limited Aster Infrastructure Private Limited TVS Interconnect Systems Limited etc
Figure 3-6 Telecom Tower Growth Scenario
0
100
200
300
400
500
600
700
2008 2009 2010 2011 2012 T e
l e c o m
T o w e r s
( T h o u s a n
d s )
Source Telecom Regulatory Authority of IndiaAssumptions Subscriber growth rate of 28 till 2011-12
1400 subscribe per site
As shown above it is expected that in next 4-5 years there will be a requirement of
additional 85000 towers (both GBT and RTT) each year to meet the subscriber base of
800 million by 2011-12 (PwC 2009) This shows that huge investment have to be made
in Indian telecom Infrastructure sector in near future Now since both passive and active
882019 Major Project (Ramit)
httpslidepdfcomreaderfullmajor-project-ramit 2762
18
infrastructure sharing is a llowed (except spectrum) Independent service providers will be
benefited Increase in subscriber base introduction of new technologies like 3G Wi-max
etc and increase in market healthy market competition in telecom services sector will
drive the growth in telecom infrastructure sector
882019 Major Project (Ramit)
httpslidepdfcomreaderfullmajor-project-ramit 2862
19
4 BUSINESS PLAN
41 Passive Infrastructure
Mobile networks have base stations (or cell sites) which have active and passive
infrastructure components Active components include the antenna trans-receivers
switches feeder cables Node B and microwave radio equipments Passive (or non-
electronic) components include the land tower shelter air-conditioning equipment
diesel electric generator battery electrical supply technical premises and easements
pylons etc Passive infrastructure in a mobile network essentially involves acquiring land
setting up towers and electrical and civil works that needs to be in place before operators
can install the active infrastructure which brings mobile services to the consumers In atypical cell site build-out almost 65 of the total cost is attributed to passive
infrastructure and 35 to active infrastructure
42 Infrastructure Sharing
Mobile operators are required to setup more and more BTS (cell) sites due to the
exponential growth of mobile subscribers in India (currently growing at almost 15 4
million subscribers a month) and limited availability of spectrum B and C Circles (wheretraffic density may not be as high as metros and Circle A) are expected to drive future
subscriber growth and requirements for cell sites will be higher to ensure greater
coverage
However creating new infrastructure by each operator separately leads to d uplicat ing
huge capital investments It also contributes to mushroom growth of telecom towers and
deteriorating skylines in urban areas which has already led to some local municipal and
state governments to regulate and restrict the erection of new mobile towers
The continued pressure on cellular tariffs higher infrastructure costs for network
deployment particularly in semi-urban and rural areas and compelling need to reduce
4 As published in ET 8 th May 09 Edition
882019 Major Project (Ramit)
httpslidepdfcomreaderfullmajor-project-ramit 2962
20
time to market for network roll outs have led operators to share and even outsource their
infrastructure requirements from third party infrastructure providers like BPTL GTL and
Indus towers It promotes capital efficiency as it allows more than one service provider to
leverage and ride o n common infrastructure In its simplest form it involves two or moreoperators jointly using the common passive infrastructure in a cell site While viewed
largely as a measure to reduce capital and operating expense such sharing also leads to
improvement of service q uality (by ensuring site space for service providers and reducing
black spots) and the environment (by reducing number of cell sites and towers)
In outsourcing operators take passive infrastructure and tower space from third party
infrastructure companies on a monthly rental basis to host their radio and transmission
equipments Outsourcing provides significant benefits to operators It enables them tosave on capital expenses (it actually converts capital expense into operating expense in
the form of lease rentals) and focus on their core activities of sales marketing and
branding while leaving the cumbersome task of managing the site development process
and site operation and maintenance to third parties who exclusively deal with such
activities
The concept of passive infrastructure sharing is increasingly gaining market acceptancein India So far it has been largely limited to bilateral sharing between operators in the
form of barter where the operators split the site related CAPEX and OPEX costs The
available information suggests that about 25 of the existing 90000 tower sites in India
are currently being shared for passive infrastructure predominantly in rural areas and
small towns
43 Introduction to the business
BPTL is an Infrastructure Provider company that builds owns operates and maintains
passive network infrastructure on a shared basis for mobile telecom operators and ITES
providers Its objective is to provide network design and planning network deployment
882019 Major Project (Ramit)
httpslidepdfcomreaderfullmajor-project-ramit 3062
21
network operations amp maintenance infrastructure management application management
and professional services to teleco m operators and enterprises
The company is planning to raise capital in the form of equity and debt to start its
operation by Aug 09 ABC rsquos vision is to provide world class managed infrastructure ampallied services to the service providers to optimize their service delivery capability In the
initial years of operation the company will focus on telecom sector with almost 100 of
its proposed capital expenditure till FY 14 earmarked for developing and owning passive
infrastructure for sharing among mobile service providers
44 Business Proposal
ABC will provide passive telecom infrastructure on build own operate (BOO) basis inboth ground based (GBS) as well as roof-top sites (RTS) It will undertake full range of
responsibilities in building owning and maintaining the sites and will serve as a single
window one-stop-shop provider of infrastructure services Typical responsibilities are
summarized below
Site planning keeping in view the network rollout plans of prospective customers
Site acquisition including entering into long-term agreements with land owners
Obtaining of necessary regulatory approvals
Erect ion and commissioning of tower and allied equipment
Provision of support services such as back-up power air-conditioning and
security
Provision of turnkey solutions to telecom companies such as sourcing of
equipment testing and maintenance
882019 Major Project (Ramit)
httpslidepdfcomreaderfullmajor-project-ramit 3162
22
Bharat Telemast Private Limited will identify the sites required for setting up the Passive
infrastructure by first of all getting a commitment from one operator who is called as
ldquoAnchor Operatorrdquo Then Bharat Telemast will go ahead to lease (or) buy out the site as
appropriate and commences construction of the cellular sites But the Cellular site will betypically designed for three to four operators While construction is in progress the
marketing team will work towards getting the second and third operator But care will be
taken in such a way that at least two operators are available at the time of completion of
construction
45 Sources of revenue
1 Infrastructure Provisioning Fees ndash fee paid by the operators on a monthly basisWith annual escalation
2 Site lease rental ndash Paid at actual on a monthly basis
3 Operations and maintenance charges Paid on a monthly basis
4 The contract also provides a fixed annual escalator
46 Attractiveness of business model
Stable and predictable cash flow business Once a tower asset is rented out it
usually generates a stable and predictable cash flow in the form of tower rentals
from occupants over the term of the MSA between the two parties
Low working capital requirement ABC rsquos business model is also characterized
by low working capital requirements as most of the operating expenses (such aselectricity and fuel and other variable operating expenses) are reimbursable by the
tenants on actual basis Moreover BPTL is may also be able to get rentals for the
towers in advance and also obtain better credit terms from their suppliers thus
further improving their working capital cycle
882019 Major Project (Ramit)
httpslidepdfcomreaderfullmajor-project-ramit 3262
23
High incremental profitability The operating costs associated with this
business are largely fixed in nature Thus each increment in tenancy is
accompanied by a minimal increase in costs This leads to a more thanproportionate increase in profits for every increase in occupancy
Reduction in capital investments due to present market conditions Due to
present market situation average capital requirement for RTT and GBT sites have
dropped from 2 million and 4 million to 15 million and 33 million ABC wishes
to grab this opportunity which will result in competitive advantage in near future
Extensive usage While on an average a GSM BTS can handle around 100-
1100 subscribers but in the case of high usage areas the figure can be as low as
600-700 subscribers which means a larger number of cell sites would be required
for the same area Moreover the country has the problem of spectrum scarcity
which increases the requirement of towers to maintain a reasonable leve l of
service quality
New entrants Many operators including Vodafone Essar Limited Idea Cellular
Limited Aircel Cellular Limited and Sistema Shyam Teleservices Limited have
received licenses as well spectrum in new circles which would enable them to
become pan-India operators in the next one-two years Also new licenses have
been issued to new players such as Unitech Swan Telecom and S Tel Limited
Given the significant expansion plans of new entrants over the medium term and
the need for them to optimize investments in order to maintain returns demand
for towers is expected to report a sharp increase
Shorter rollout time Indian telecom industry is highly competitive and doing
business for new entrant may not be easy Shorter network-rollout time would be
a critical success factor for the new entrants and a longer rollout time could meanloss of substantial market share to other operators Tower companies allow
players to start operations in a particular region just by installing their electronics
on the ready-to-use towers thereby significantly shortening the rollout time
New technologies 3G services are already launched in the country and to
augment their services various operators plan to launch Wi-Max services as soon
882019 Major Project (Ramit)
httpslidepdfcomreaderfullmajor-project-ramit 3362
24
as they receive additional spectrum from Government This would further
increase the demand for sharing of passive infrastructure
47
Expansion Schedule
BPTL would rollout both RTT and GBT sites of which the RTT sites GBT sites
normally would have a tower height of 50 meters or 60 meters depending on the need for
additional height for installation of microwave antennae based on the location of the site
and number of tenants on the cell site Details of BPTLrsquos expansion plan are summarized
below
Table 41 Expansion PlanExpansion Schedule 2009-10 2010-11 2011-12 2012-13 20013-14
GBT
Addition 210 700 1400 2450 3850
Total 210 910 2310 4760 8610
RTT
Addition 90 300 600 1050 1650
Total 90 390 990 2040 3690
48 Proposed Services
As indicated earlier ABC proposes to provide passive telecom infrastructure on a
sharing co-location basis to cellular operators The sites would either be Ground Based
Sites (GBS) or Roof Top Sites (RTS) As the sites are meant for co-location of the active
components of two to three operators they would be built to either 2-Tenant or 3-Tenant
specifications
The different components of the passive infrastructure facility and the related services
that would be offered by BPTL to the operators are as under
Infrastructure provisioning comprising
882019 Major Project (Ramit)
httpslidepdfcomreaderfullmajor-project-ramit 3462
25
Communication tower built to host multiple antennae
Weather-proof communication shelter with air-conditioning and power backup
arrangement
Diesel generating set and battery bank for power backup
A mobile standby generator to act as backup in case o f breakdown
Warehousing facility
Infrastructure operations and maintenance including
Regular operations and maintenance of the facility
Security of all the equipments at the site at all timesA dedicated team of technicians for a group of 40-50 sites to ensure effect ive and
efficient functioning of the components at all times
49 Proposed Organizational Structure
A senior management team will work under the leadership of the ldquoChief Operations
Officerrdquo who will be responsible for smooth implementation of proj ect activities He willalso assist the managing director in marketing This team will coordinate with Stallion
Telecom Pvt Ltd which will take over the role of procuring Capital Equipments
Senior management will consists of project manager infrastructure manager commercial
manager and head (legal and company affairs Apart from this there will be a requirement
Chief OperatingOfficer
Project Manager Infrastructure
Manager
Commercial
Manager (projects)
Head (Legal and
Company Affairs)
882019 Major Project (Ramit)
httpslidepdfcomreaderfullmajor-project-ramit 3562
26
of security sentries (3 per GBT site) supervisors (one for every 10 sites) and cluster
manager (one for every 50 sites)
Bharat Telemast will carry out the complete Project execution with the assistance of third party ldquoQuality control organizationrdquo and a third party ldquoProject management teamrdquo
Quality control and project management activities will be o utsourced to a third party
882019 Major Project (Ramit)
httpslidepdfcomreaderfullmajor-project-ramit 3662
27
5 METHODOLOGY
The changing face of infrastructure services creates a complex situation which demands
greater understanding of roles of competition regulatory structures and modes of
financing Knowledge of such things is a key decisive factor in building confidence
among investors promoters and government In project finance the project its assets
contract and cash flows are separated from promoter in order to permit credit appraisal
or loan to the project
As part of the financial feasibility analysis a series of related financial statements based
on projected sources and uses of funds during the development and operating phaseproject were created Financial statements consist of expenses associated with
development activities including capital costs like acquisition of land for GBT sites cost
of tower generator shelter batteries etc Most of the data regarding capital costs are
obtained from the promoter of ABC Limited All these capital costs related details are
provided in annexure 1
Assumption regarding depreciation capital structure operating expenses expansion
schedule tenancy ratios tariff or rent operatorrsquos fees and loan amortization schedule are
obtained from professional accountants Promoter and bankers of ABC Limited
Due to unknown factors that could influence the cost of towers or fees associated with
completing the project (soft costs) contingency costs were estimated at 5 of hard and
soft costs respectively If contingency is set too low developers could easily encounter
funding shortfalls upon slight changes in market forces All other costs were estimated
based on talking with industry professionals (Promoters)
A detailed financial model was prepared based on existing accounting standards and
following financial ratios were estimated
882019 Major Project (Ramit)
httpslidepdfcomreaderfullmajor-project-ramit 3762
28
EBITDA margin Profit and loss accounts for the estimated project period (15
Years) were prepared based on which estimated earnings before interests tax
depreciat ion and amortization were calculated for each year Detailed PampL
balance sheet and cash flow statements are provided in annexure 2 3 and 4
EBITDA = Total Revenue ndash (Variable expenses + Fixed Expenses)
EBITDA margin = EBITDA Total Revenue
PAT margin PAT is calculated by subtracting interests pa id on capital debt and
working capital debt depreciation and applicable corporate income tax from
EBITDA
PAT = EBITDA ndash Interest Payable ndash Depreciation ndash Income tax
PAT margin = PATTotal Revenue
Working Capital Working capital requirement is calculated by subtract ing
current liabilities from current assets Current assets are estimated based on 30
days cash requirement and current liabilities are estimated as half of salary
monthly expenses
WC = Current Assets ndash Current Liabilities
UFCF It is defined as the free cash flows available to the firm if the firm has
zero debt liability Purpose of ca lculat ing UFCF for project period is to determinethe project IRR
UFCF = PAT + Depreciation + Interest (tax adjusted) + Release of WC + Salvage
value of the assets ndash CAPEX ndash Change in WC
882019 Major Project (Ramit)
httpslidepdfcomreaderfullmajor-project-ramit 3862
29
LCFF It is defined as the cash floes available to the firm after paying interests on
long term and short term debts
LCFF = UFCF ndash Interest (tax adjusted)
FCFE It is defined as the free cash flow available to equity holders It is
determined to ca lculate equity IRR for equity investors It also includes the tax
benefits which are available as per the Income Tax Act
FCFE PAT + Depreciation + Salvage Value ndash Equity Investment ndash Long term debt
repayment
PIRR Project IRR is defined as the discount rate at which NPV (Net Present
Value) of UFCF is zero It is calculated by using following formula
UFCF 1 (1+PIRR) 0+ UFCF 2 (1+PIRR) 1+ UFCF 3 (1+PIRR) 2+ helliphelliphelliphelliphelliphellip = 0
UFCF 1 = UFCF at the end of first year of operation
UFCF 2 = UFCF at the end of second year of operation
PIRR = Project IRR
EIRR Equity IRR is defined as the discount rate at which NPV of FCFE is zero
It is calculated by using following formula
FCFE1 (1+EIRR) 0+ FCFE 2 (1+EIRR) 1+ FCFE 3 (1+EIRR) 2+ helliphelliphelliphelliphelliphellip = 0
FCFE1 = FCFE at the end of first year of operation
FCFE2 = FCFE at the end of seco nd year of operation
EIRR = Equity IRR
882019 Major Project (Ramit)
httpslidepdfcomreaderfullmajor-project-ramit 3962
30
WACC It is de fined as the percentage of return expected by the investors who
otherwise would have earned some return by investing in some other project
WACC = Cost of Debt (Debt Capital) + Cost of equity (Equity Capital)
882019 Major Project (Ramit)
httpslidepdfcomreaderfullmajor-project-ramit 4062
882019 Major Project (Ramit)
httpslidepdfcomreaderfullmajor-project-ramit 4162
32
62 Funding planAs the telecom sites are rolled out over a 5 year period till FY 2014 investment will be
required for each year ABC Limited will start generating profits from FY 10 only Such
internally generated cash accruals will be ploughed back into the business to meet part of
the project cost Investment required for each year is tabulated below
Table 61 Funding ProposalMillion INR FY 10 FY 11 FY 12 FY 13 FY 14
GBT Tower (Additional) Nos 210 700 1400 2450 3850
RTT Tower (Additional) Nos 90 300 600 1050 1650DE ratio 233 233 233 233 233
Additional CAPEX 83892 279374 558748 977809 1536557
Debt 58725 195562 391124 684466 1075590
Equity 25168 83812 167624 293343 460967
63 Results
Based on assumptions given in Annexure 1 a detailed financial model was preparedResults of the financial model such as PampL account Balance Sheet and cash flow
statements are provided in Annexure 2 3 and 4 Forecasts for the key financial figures for
first five years are provided in the Table below
Forecasts
Table 62 Income StatementMillion INR FY-10 FY11 FY12 FY-13 FY-14
Sales 7124 50511 156766 347476 667700
Cost of sales 1950 13852 39252 87612 170021
Gross 5174 36659 117514 259864 497679
7263 7258 7496 7479 7454
Admin costs 112 179 190 203 216
882019 Major Project (Ramit)
httpslidepdfcomreaderfullmajor-project-ramit 4262
33
Finance cost 0 021 7401 31330 77725
Taxation 170 4233 14536 29073 53547
PAT 2454 19458 59470 122096 223267
As shown in Table above during the expansion period revenue will grow exponentially
In the first year of operation ABC will earn a revenue of INR 7124 million from 300
(210 GBT and 90 RTT) sites with a tenancy ratio of 15 for GBS and 17 for RTS In the
first 2 years of operation the company will not pay any interest on long term debt due to
2 years moratorium period Major cost associated with the project is depreciation due to
which PAT is lower than the operating profits But cash flows to the firm are enough to
result in reasonable returns
Table 63 Balance Shee tYear ending Mar-10 Mar-11 Mar-12 Mar-13 Mar-14
AssetsGross Block 75742 328216 833164 1716823 3105430Accumulated depreciation 2439 15208 51125 128287 271212Net Block 73303 313009 782040 1588536 2834219Net Working Capital 064 241 620 1335 2515Cash Balance 12979 72089 216513 488856 947982
Total Assets 86346 385339 999172 2078727 3784715LiabilitiesEquity 25168 108980 276604 569947 1030914Reserves amp Surplus 2454 21912 81381 203477 426745Long term Debt 58725 254286 640722 1304302 2325171WC Borrowings - 161 465 1001 1886Total Liabilities 86346 385339 999172 2078727 3784715
Note All figures are in Million INR
Table 64 Key financial ratiosMar-11 Mar-12 Mar-13 Mar-14 Mar-15
Revenue Growth 60902 21036 12165 9216 3890EBITDA Growth 62061 22161 12132 9158 4020
PAT Growth 69293 20564 10531 8286 2955
As shown in table above increase in EBITDA is higher than that of revenue This is due
to better operational efficiency of ABCrsquos management and economies of scale S imilarly
882019 Major Project (Ramit)
httpslidepdfcomreaderfullmajor-project-ramit 4362
34
increase in PAT is lesser than that of EBITDA because of high depreciation and interest
expenses
Table 65 Pr ofitability r atios
Mar-11 Mar-12 Mar-13 Mar-14 Mar-15
EBITDA Margin 7222 7484 7473 7450 7520
PAT Margin 3852 3794 3514 3344 3119Return on Net Worth 622 760 769 788 1087
Key profitability ratios are shown in table above Return on net worth in the initial years
is lower because of the ambitious expansion plans of ABC Limited Thereafter return on
net worth increases with increase in PAT
Returns on Investment
Table 66 Financial returnsFinancial Indicators
Project IRR 1813Equity IRR 3609
64 Sensitivity Analysis
A sensitivity analysis has been carried out on the project financials to determine theimpact of key variables on the financial indicators namely
Project IRR
The key variables on which sensitivity analysis have been carried out areCapital expenditure for GBS and RTS1st and 2 nd tenant tariff for GBS1st and 2 nd tenant tariff for RTSTenancy Ratio
Similarly sensitivity analysis has been carried out forEquity IRR
The key variables on which sensitivity analysis have been carried out for EIRR are
Capital structure and interest rate for capital debtRepayment period and moratorium period
882019 Major Project (Ramit)
httpslidepdfcomreaderfullmajor-project-ramit 4462
35
The impact on the financial indicators is shown below
Figure 6-1 Project IRR vs GBT and RTT CAPEX
As shown in Figure 6-1 project IRR is more sensitive to change in CAPEX of RTT sitesas compared to change in CAPEX of GBT sites because tenancy ratio and tariff for RTTsites are higher than those of GBT sites
882019 Major Project (Ramit)
httpslidepdfcomreaderfullmajor-project-ramit 4562
36
Figure 6-2 Project IRR vs GBT Tariff for 1 st tenant (X-axis) and 2 nd tenant (right-hand side)
As shown in Figure 6-2 project IRR varies linearly with GBT tariff In the best casescenario when GBT tariff for 1 st tenant is INR 34000month and GBT tariff for secondtenant is INR 26000month Project IRR is 2101
Figure 6-3 Project IRR vs RTT Tariff for 1 st tenant (X-axis) and 2 nd tenant (right-hand side)
As shown in Figure 6-2 project IRR varies linearly with RTT tariff In the best casescenario when RTT tariff for 1 st tenant is INR 24000month and RTT tariff for second
882019 Major Project (Ramit)
httpslidepdfcomreaderfullmajor-project-ramit 4662
37
tenant is INR 20000month Project IRR is 1932 Project IRR is more sensitivetowards RTT tariff than GBT tariff because in practical business situation RTT siteshave a tenancy ratio of more than two due to which effect of tariff for 1 st tenant almostget nullified after few years
Figure 6-4 Project IRR vs Tenancy ratio for RTT sites (X-axis) and GBT sites
As shown in Figure 6-4 project IRR is very sensitive to tenancy ratio In the best casescenario where GBT sites have a tenancy ratio of 2 and RTT sites have a tenancy ratio of 3 project IRR can be as high as 20
Figure 6-5 Equity IRR vs long term debt interest rate for different leverage level
882019 Major Project (Ramit)
httpslidepdfcomreaderfullmajor-project-ramit 4762
38
As shown in figure 6-5 equity IRR is more sensitive to interest rate on long term debt forhigh level of leverage (lower debt equity ratio) because as the debt equity ratio increasesinterest paid on long term debt also increases significantly
Figure 6-6 Equity IRR vs long term debt repayment period at different level of moratoriumperiods
As shown in figure 6-6 Equity IRR increases with increase in moratorium period anddebt repayment period The variation is from 1654 to 60 for worst case and best casescenarios
882019 Major Project (Ramit)
httpslidepdfcomreaderfullmajor-project-ramit 4862
39
7 RISK ASSESSMENTRisk Mitigation strategyExecution Risk
(Project management landacquisition etc)
Management of ABC has proven expertise in
telecom infrastructure rollout and has executedvarious projects with large telecom operators andMNC vendorsABCrsquos top management team consists of a groupof professionals drawn from leading telecomInfrastructure Company who have immenseexpertise and experience in rolling out telecominfrastructure projects
Market Risk (No entry barriers operators may
share infrastructure betweenthemselves large players withhigh capital may increasecompetition)
India has a huge potential for telecominfrastructure market With increasing
competition falling tariffs and pressure onmargins telecom service providers are beingforced to increase their focus on marketing andreduce their expensesExperienced management healthy capital back-up effective presence in the telecominfrastructure market and value added services atrelatively lesser cost will help ABC to meet theset targets
Financing Risk
(Availability of equity capitalavailability of long term debtinterest rate and moratoriumperiod)
ABC is seeking private equity partner to secure
equity capital Company has already entered intoNDA with 2 major investorsLong term debt at an interest rate of 125 canbe easily arranged because of the credibility of the promoters in the marketMany other similar firms like Indus and GTLhave already secured long term debt for amoratorium period of 2 years Promoters of ABCLimited are confident to secure a long term debtwith a moratorium period of 2 years and apayback period of 8 years
ABC Limited would minimize the workingcapital requirements of its business by securingrentals and operating revenues in advance fromits clients and or by suitably structuring itspayment liabilities to match its cash inflows
Commercial Risk (Tenancy ratio and tariff forGBS and RTS)
ABC would aim to enter into long term contractswith the ldquoanchor tenantrdquo operator and thenrollout the infrastructure so that at least single
882019 Major Project (Ramit)
httpslidepdfcomreaderfullmajor-project-ramit 4962
40
occupancy of each site is ensured at all t imesPromoters will use its knowledge of the businessand its expertise to identify and roll out sites inlocations which have strong multi- tenancypotential to minimize occupancy risk
Revenue Risk (Operating fees may decreasecredit worthiness of the clientsdelay in payment of rentals)
As per the industry sources till now not even asingle operator have dishonored the long termlease contractThe credit risk is diversified as there will bemultiple operatorsABC would aggressively market to get 3G andWiFi broadcasters to use the sites and earnadditional revenues in addition to the assumedrevenue streams
Natural Calamities Risk The Company shall maintain insurance for thesites against these risks and the cost of insurancewill be priced in and passed on to the tenants
882019 Major Project (Ramit)
httpslidepdfcomreaderfullmajor-project-ramit 5062
41
8 CONCLUSION
India is the fastest growing wireless telecom market in the world The continuing
growth in the number of wireless subscribers and MoUs and increasing trend of
outsourcing of business processes to India has led to growing demand for large
investments in the telecom infrastructure in the country
However with increasing competition falling tariffs and pressure on margins
telecom service providers are being forced to increase their focus on marketing
customer acquisitions and branding and minimize their efforts and overheads in
project management and asset acquisition
Further with rising prices of steel cement and real estate the cost of developing
and owning passive infrastructure is increasingly becoming a costly proposition
for most operators and service providers
The compulsion on the part of service providers to reduce their operating costs
and capital expenditure requirements has led to opportunities in passiveinfrastructure outsourcing to independent third party infrastructure providers and
also sharing the infrastructure with other service providers It is expected that
cellular operators will outsource their communications site infrastructure needs as
a means of accelerating access to their markets and preserving capital rather than
constructing and operating their own communications sites and maintaining their
own communications sites service and deve lopment capabilities
Passive infrastructure is highly capital intensive and an integral part of the cellular
service providersrsquo networks Yet being a simple and low technology asset it is
amenable to outsourcing and sharing By transferring the responsibility of
ownership development and maintenance of passive infrastructure service
882019 Major Project (Ramit)
httpslidepdfcomreaderfullmajor-project-ramit 5162
42
providers have an opportunity to transfer a substantial part of their business risk to
third parties
Most telecom operators are facing capacity constraints on their networksCoverage obligations increasing pressure to improve network quality and
competition has led to aggressive roll out plans by existing cellular operators
Installation of cell sites has become a cumbersome process as there are a number
of clearances required and involves labor-intensive micro management
Availability of ready infrastructure from third party providers would enable the
operators to reduce their time to market and accelerate their access to their
customers Cellular service providers generally want to move quickly when
adding more sites and co-location on an existing site is always faster than
building
Ownership and maintenance of telecom towers and other infrastructure by third
parties is an established practice in developed nations like USA and is
increasingly gaining market acceptance in India
The Indian government is seriously considering promoting the infrastructure
sharing route between the telecom operator and private players to achieve future
national tele-density targets and improve rural telecom penetration
ABC being an independent entity with no business conflicts with other service
providers in the telecom space will be best positioned and have an early mover
advantage to capitalize on this emerging opportunity
Further the task of operating and maintaining the passive infrastructure in the cell
is increasingly becoming a cumbersome exercise for the service providers to
handle ABCrsquos composite offering to build passive infrastructure for the cellular
operators and also operate and maintain them will provide a turnkey solution to
address the infrastructure needs of the service providers
882019 Major Project (Ramit)
httpslidepdfcomreaderfullmajor-project-ramit 5262
43
The business model proposed to be followed by ABC is fairly simple with stable
and predictable cash flows as is the case with the business model of the tower
renting companies in USA Most contracts are long term for a period 10 or moreyears with annual price escalators generally ranging from 3 to 4 However
wireless carriers normally tend to renew rentals because suitable alternative sites
may not exist or be available and repositioning a site in a carrierrsquos network is
expensive and may adverse ly affect network quality
Site ownership and operations is a ldquoscalerdquo business operating administration
marketing expenses etc do not rise as quickly as revenues when portfolios are
expanded Incremental operating costs associated with adding wireless tenants to
a communications site are minimal Therefore as additional tenants are added to a
site the substantial majority of incremental revenue contributes to margin
expansion Most tower companies have high EBITDA margins as may be seen
from the financial indicators of some of the tower rental companies in USA
It is expected that site location and capacity price and quality of service and
successful execution of contracts will be the most significant competitive factors
in this business
ABCrsquos revenue and returns on investment will be primarily driven by its ability
to
o Increase the utilization of the space and infrastructure capacity owned by it by
increasing the number of tenants per site and renting out to maximum number
of users As discussed above return on capital employed (PIRR and EIRR) arevery sensitive to tenancy ratio In worst case scenario project IRR can be as
low as 8 and in the best case scenario it can be as high as 20
o Develop acquire sites of strategic importance and high growth potential that
will enable them to secure better commercial terms from users and attract
more number of tenants Infrastructure provisioning fees rentals for sites are
882019 Major Project (Ramit)
httpslidepdfcomreaderfullmajor-project-ramit 5362
44
extremely location sensitive There is a potential to acquire more land than
that of required to capitalize on the increase in real estate prices
o Develop sites in a cost effective manner ABC would consider purchasing
land only for those GBS sites which have sufficient demand and arestrategically located Else for most of its sites land will be leasehold As
shown above returns (PIRR and EIRR) are very sensitive to capital costs In
the worst case scenario project IRR can be as low as 15 whereas it can as
high as 27 in the best case scenario
o Negotiate and secure long term contracts with good credit quality users with
built in price escalation provisions to mitigate financing risk
o Leverage and secure long term financing at attractive terms and involve in
active treasury management to keep low financing cost Results of the
sensitivity analysis indicate that equity IRR can be as high as 60 foe a
moratorium period of 4 years and interest rate of 10
o Minimize working capital requirements
o Maintain low operating and administration expense
o Secure better OampM margins from operators and retain a healthy share of it in
ABC
o Maintain high service standards and build strong customer relationships
The business would have the potential to capture new revenue opportunities
around the existing assets As demand for towers is expected to grow and as
operators migrate to speedier next-generation wireless technologies they will
need the towers and associated passive infrastructure to transmit their new
services in addition to their existing offerings In addition to increasing capacity
and coverage and improving the quality of their networks cellular serviceproviders are deploying high speed data networks driving incremental demand of
sites The business therefore has potential upsides in the form of adding
customers (tenants) in wireless broadband third generation (ldquo3Grdquo) and wireless
data capabilities and also other incremental value propositions by way of hosting
882019 Major Project (Ramit)
httpslidepdfcomreaderfullmajor-project-ramit 5462
45
Billboards Hoardings etc in some of the high visible sites owned and maintained
by it
Based on the assumptions and subject to satisfactory resolution of the key risks
factors project cash flows will be able to meet debt service obligations
This business model is a lucrative investment option for a private equity player
because valuation of each site will increase in the coming years due to
improvement in market conditions increase in the value of land and increase in
the demand for passive infrastructure in rural and semi-urban areas
882019 Major Project (Ramit)
httpslidepdfcomreaderfullmajor-project-ramit 5562
46
REFERENCESAnjan G V A amp N M (2009) telecom infrastructure industry in india GurgaonICRA
Bessler W Norsworthy J amp Shusterman T (2001 12 1) Mergers in the UStelecommunications industry and market valuationeffects IEEE p 288
COAI (2009 march 14) Subscriber Figures Retrieved march 14 2009 fromCOAIcom httpwwwcoaicomstatisticsphp
IDA (2009 march 23) Highlights Retrieved march 23 2009 from idagovsghttpwwwidagovsghomeindexaspx
K R (2008) Time for new business model Delhi Cybermedia
MAXIS (2009 march 8) the malaysian telecommunications industry Retrieved march9 2009 from maxiscommyhttpwwwmaxiscommypersonalabout_usinvestorprospectusprospectus4pdf
P J amp Lisa A (2009) Stimulas spending and American Telecom Industry USACoracle group
PwC (2009 march 12) Indian Telecom Industry Gurgaon Harayana IndiaRamachanran (2009 march 1) Investment in Telecom Infrastructure sector (M RInterviewer)
Vogelsang I (2002) The German Telecommunications Reform Verein fuumlr Socialpolitik (p 26) Innsbruck Boston Press
882019 Major Project (Ramit)
httpslidepdfcomreaderfullmajor-project-ramit 5662
47
ANNEXURES
ANNEXURE 1 Key Assumptions
The occupancy of each site by single two three operators for green-field sites is assumed
to be as follows
Table 91 Expected Tenancy RatiosFY 10 FY 11 FY 12 FY 13 FY 14 FY15
GBT Tenant
Ratio 150 150 170 170 170 200
Single Operator 50 50 30 30 30 0
Two Operator 50 50 70 70 70 100
RTT Tenant
Ratio 170 170 200 200 200 250
Single Operator 30 30 0 0 0 0
Two Operator 70 70 100 100 100 50
Three Operator 0 0 0 0 0 50
From FY 15 onwards tenancy ratio of 2 and 25 for GBT and RTT sites is cons idered
882019 Major Project (Ramit)
httpslidepdfcomreaderfullmajor-project-ramit 5762
48
Capital costs related assumptions are tabulated below
Table 92 GBT and RTT Capital Cost
The lease rentals for RTT sites are reimbursed from the operators and therefore have not
been factored in the revenues as well as the expense For GBT sites land purchase cost of
035 millions assumed which has been escalated by 6 annually to determine the
salvage value of assets
GBT Capital Costs
Million
INR
Delivery cost of Ground Based
Tower (GBT)063
Delivery cost of Generator 030
Civil Work 040Shelter 012
Electrical Works 030
Other Equipments (UPS Battery
etc)045
Construction cost 045
Land 035
Contingency amp Financial Charges 035Total cost 335
RTT Capital Costs
Million
INR
Delivery cost of Roof Top
Tower (RTT) 030
Delivery cost of Generator 020
Civil Work 020Shelter 012
Electrical Works 030
Other Equipments (UPS
Battery etc) 030
Construction cost -
Land -
Contingency amp FinancialCharges 008
Total cost 150
882019 Major Project (Ramit)
httpslidepdfcomreaderfullmajor-project-ramit 5862
49
Ope rating costs related assumptions are tabulated below
Table 93 Operating CostsOperating Costs
Security Sentries (INRMonth) 4000
Supervisors (INRMonth) 6000
Cluster Manager One for Fifty Towers (INRMonth) 15000
Annual increase 500
Number of Security Sentries per tower 300
Number of supervisors per tower 010
Number of C luster manager per tower 002
Fixed Expenses
Selling amp Maintenance (INRMonth) 4000000
Annual Escalation 5
Administration overhead (INRMonth) 10000000Annual Escalation 7
AMC Cost of Generator 15 (cost of generator)
Annual Escalation (AMC) 3
For RTT sites security sentries are not required because it will be the responsibility of
the site owner A supervisor will for every 10 sites and a cluster manager for every 50
sites will be required
882019 Major Project (Ramit)
httpslidepdfcomreaderfullmajor-project-ramit 5962
50
Table 94 Long term debtInterest Rate 125 per annum
Moratorium 2 years
Repayment Period 8 years
Tariff related assumptions and date of operations are tabulated below
Table 95 GBT and RTT Tariff Table 96 Life of the projectTariff Plan
Tariff (INRMonth)
No of
operators GBT RTT
1 28000 18000
2 22000 14000
3 0 12000
Annual
increase 3 3
Commercial Operation Date 1-Aug-09
Quarter Ending 30-Sep-09
FY ending COD 31-Mar-10
Project life years 15
End of commercial
operations31-Aug-24
Quarter ending commercial
operations30-Sep-24
FY ending comme rcial
operations31-Mar-25
882019 Major Project (Ramit)
httpslidepdfcomreaderfullmajor-project-ramit 6062
51
Annexure 2 Profit amp Loss accountsTable 97 Profit amp loss account statement
Income Statement (MNINR)Year ending Mar-10 Mar-11 Mar-12 Mar-13 Mar-14 Mar-15
RevenueGBT 406350 28811 89080 197447 379409 527015Operator Fees (GBT) 1411 10004 30678 67998 130664 179664RTT 1209 8575 27269 60443 116146 164264
Operator Fees (RTT) 440 3121 9739 21587 41481 56466Net Revenue 7124 50511 156766 347476 667700 927410
Expenses
VariableSecurity Sentries 1355 9790 28339 64033 125433 158238Supervisors 097 699 2024 4574 8959 11303Cluster Manager 048 350 10 12 2287 4480 5651AMC Cost of Generator 450 3013 7877 16719 31148 54541Sub-total 1950 13852 39252 87612 170021 229734
Fixed
Selling amp Maintenance(INRMonth) 032 050 053 056 058 061
Administration overhead(INRMonth) 080 128 137 147 157 168
Sub-total 112 179 190 203 216 230
EBITDA 5062 36480 117324 259661 497464 697447
Interest on LT loan - - 7341 31200 77479 156198Interest on ST loan - 021 060 130 245 361
EBDT 5062 36459 109923 228331 419739 540888Depreciation 2439 12769 35917 77162 142925 174006
EBT 2624 23691 74006 151169 276814 366881Income Tax 170 4233 14536 29073 53547 77634
PAT 2454 19458 59470 122096 223267 289247
882019 Major Project (Ramit)
httpslidepdfcomreaderfullmajor-project-ramit 6162
52
Annexure 3 Balance sheet
Table 98 B alance sheetsYearend Balance Sheet (MNINR)Year ending Mar-10 Mar-11 Mar-12 Mar-13 Mar-14 Mar-15
AssetsGross Block 75742 328216 833164 1716823 3105430 3105430Accumulated depreciation 2439 15208 51125 128287 271212 445218Net Block 73303 313009 782040 1588536 2834219 2660212Net Working Capital 064 241 620 1335 2515 3707Cash Balance 12979 72089 216513 488856 947982 1294734Total Assets 86346 385339 999172 2078727 3784715 3958653
LiabilitiesEquity 25168 108980 276604 569947 1030914 1030914Reserves amp Surplus 2454 21912 81381 203477 426745 715992Long term Debt 58725 254286 640722 1304302 2325171 2208967WC Borrowings - 161 465 1001 1886 2780Total Liabilities 86346 385339 999172 2078727 3784715 3958653
882019 Major Project (Ramit)
httpslidepdfcomreaderfullmajor-project-ramit 6262
Annexure 4 Cash flow statement
Table 99 Cash flow statements
Year ending Mar-10 Mar-11 Mar-12 Mar-13 Mar-14 Mar-15
InflowsPAT 2454 19458 59470 122096 223267 289247Depreciation 2439 12769 35917 77162 142925 174006Tax adjusted interest - 014 4959 20991 52076 104895Release of WC - - - - - -Salvage Value - - - - - -Sub-Total 4893 32241 100345 220249 418268 568148
OutflowsCapex 75742 252474 504948 883659 1388607 -Change in WorkingCapital 064 177 379 715 1180 1192
Sub-Total 75806 252651 505327 884374 1389787 1192
UFCF (70913) (220410) (404982) (664125) (971519) 566956LFCF (70913) (220424) (409940) (685116) (1023595) 462062
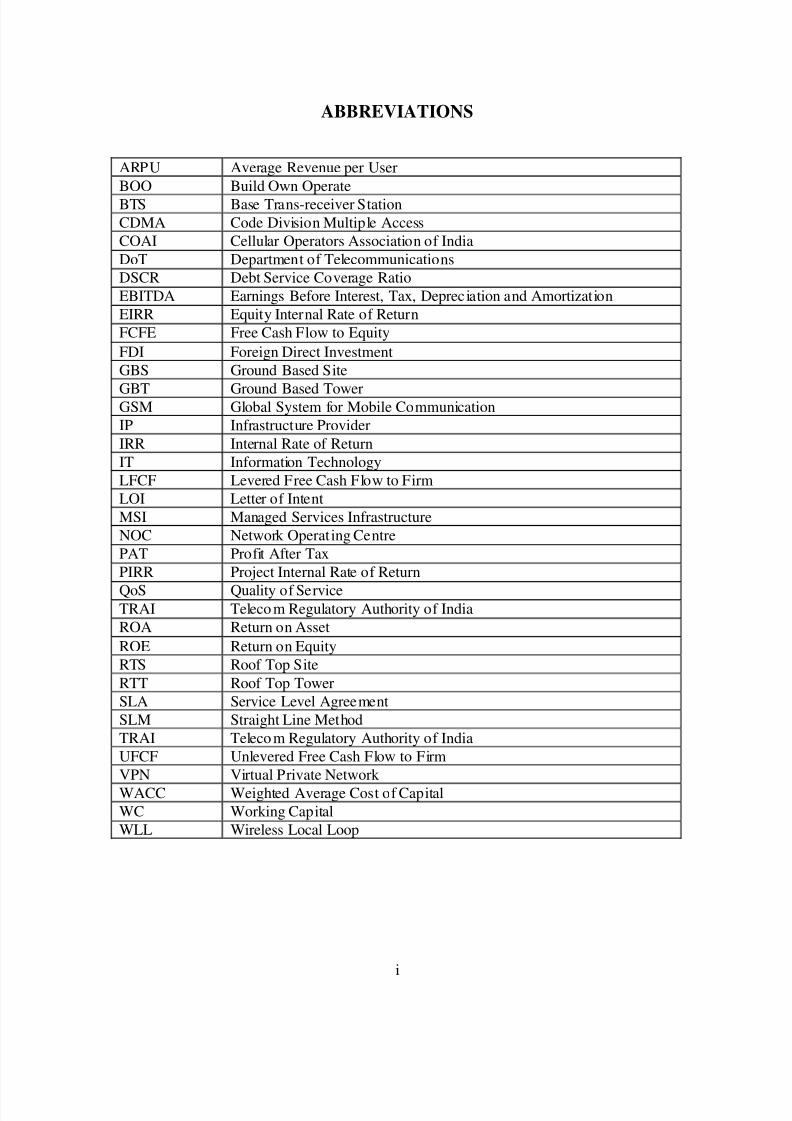
882019 Major Project (Ramit)
httpslidepdfcomreaderfullmajor-project-ramit 662
i
ABBREVIATIONS
ARPU Average Revenue per User BOO Build Own OperateBTS Base Trans-receiver StationCDMA Code Division Multiple AccessCOAI Cellular Operators Association of IndiaDoT Department of TelecommunicationsDSCR Debt Service Coverage RatioEBITDA Earnings Before Interest Tax Deprec iation and AmortizationEIRR Equity Internal Rate of ReturnFCFE Free Cash Flow to EquityFDI Foreign Direct InvestmentGBS Ground Based Site
GBT Ground Based TowerGSM Global System for Mobile CommunicationIP Infrastructure ProviderIRR Internal Rate of ReturnIT Information TechnologyLFCF Levered Free Cash Flow to FirmLOI Letter of IntentMSI Managed Services InfrastructureNOC Network Operat ing CentrePAT Profit After TaxPIRR Project Internal Rate of Return
QoS Quality of ServiceTRAI Teleco m Regulatory Authority of IndiaROA Return on AssetROE Return on EquityRTS Roof Top SiteRTT Roof Top TowerSLA Service Level AgreementSLM Straight Line MethodTRAI Teleco m Regulatory Authority of IndiaUFCF Unlevered Free Cash Flow to FirmVPN Virtual Private Network WACC Weighted Average Cost of CapitalWC Working CapitalWLL Wireless Local Loop
882019 Major Project (Ramit)
httpslidepdfcomreaderfullmajor-project-ramit 762
ii
ABSTRACTIndian telecom industry was dominated by government organization till 1991 after which
many private players have entered into this market Since its liberalization the industry
has experienced impressive growth because of strong demand investor friendlyregulatory schemes and strengthening economy At present India is the second largest
mobile market in the world and is also among the fastest growing mobile markets
globally The total number of mobile subscribers in India (ie the subscriber base) has
crossed 300 million with 30049 million subscribers as on 31st March 2008 (TRAI
database)
With increase in market competition and pressure on margins telecom service providers
are being forced to increase their focus on marketing and customer acquisition This has
led to opportunities in passive infrastructure outsourcing to independent third party
infrastructure providers and also sharing the infrastructure with other service providers
Recently Telecom Regulatory Authority of India has awarded new licenses to new
players such as Unitech Swan Telecom and S Tel Limited The significant expansion
plans of the new entrants and their need to optimize investments so that they can compete
with existing players will further drive the demand of passive infrastructure in the
country
ABC Limited is an independent infrastructure provider company which proposes to buildown and operate passive infrastructure sites for telecom service providers ABC Limited
is planning to raise capital to start its operation in FY 10 Based on the details regarding
capital expenditure operating expenditures and future expansion plans of ABC Limited
provided by the promoter of the company a detailed financial model has been prepared
and key financial ratios has been estimated to assess the financial feasibility and returns
on investment
Total investment required to meet the target of around 12000 tower sites (both GBT and
RTT) is estimated to be INR 36343 million ABC has planned to raise 70 of required
capital through long term debt and remaining as equity Results of financial model shows
that IRR for such project will be more than 18 and equity IRR will be around 36
provided that ABC will meet the above target of 12000 tower sites by FY14 Project IRR
is very sensitive to Capital costs tenancy ratio and monthly tariff for each site On the
882019 Major Project (Ramit)
httpslidepdfcomreaderfullmajor-project-ramit 862
iii
other hand equity IRR is sensitive to loan moratorium period and interest rate on long
term debt The project will generate enough cash flows to cover its debt obligation and
also to generate high return on equity invested
882019 Major Project (Ramit)
httpslidepdfcomreaderfullmajor-project-ramit 962
iv
LIST OF TABLESTable 31 Telecom Circles 17 Table 41 Expansion Plan 31
Table 61 Funding Proposal 39 Table 62 Income Statement 39 Table 63 Balance Sheet 40 Table 64 Key financial ratios 40 Table 65 Profitability ratios 41 Table 66 F inancial returns 41 Table 91 Expected Tenancy Ratios 50 Table 92 GBT and RTT Capital Cost 51 Table 93 Operating Costs 52 Table 94 Long term debt 52 Table 95 GBT and RTT Tariff 53 Table 96 Life of the project 53 Table 97 Profit amp loss acco unt statement 54 Table 98 Balance sheets 55 Table 99 Cash flow statements 56
LIST OF FIGURES
Figure 3-1 Growth of Subscriber base 10 Figure 3-2 Mobile Penetration Rate 10 Figure 3-3 Market Share 11
Figure 3-4 Licensed Circles 12 Picture 3 1 Telecom Tower 14 Figure 3-5 Telecom Infrastructure Market Players 16 Figure 3-6 Telecom Tower Growth Scenario 17 Figure 6-1 Project IRR vs GBT and RTT CAPEX 35 Figure 6-2 Project IRR vs GBT Tariff 36 Figure 6-3 Project IRR vs RTT Tariff 36 Figure 6-4 Project IRR vs Tenancy ratio for RTT sites and GBT sites 37 Figure 6-5 Equity IRR vs long term debt interest rate for different leverage level 37 Figure 6-6 Equity IRR vs long term debt repayment period at different level of moratorium periods 38
882019 Major Project (Ramit)
httpslidepdfcomreaderfullmajor-project-ramit 1062
1
1 INTRODUCTION
ABC Ltd 1 is an Infrastructure Provider company that builds owns operates and
maintains passive network infrastructure on a shared basis for mobile telecom operators
and ITES providers The Company was formed in Jan 2009 Its objective is to provide
network design and planning network deployment network operations amp maintenance
infrastructure management application management and professional services to telecom
operators and enterprises
The company is planning to raise capital in the form of equity and debt to start its
operation by Aug 09 The purpose of this project is to prepare detailed financial model
for assessment of feasibility of such projects building scenarios and sensitivity charts
calculation of risk and returns associated with the project and valuation of ABC Limited
subjected to present and expected future market conditions
ABCrsquos vision is to provide world class managed infrastructure amp allied services to the
service providers to optimize their service delivery capability In the initial years of
operation the company will focus on telecom sector with almost 100 of its proposed
capital expenditure till FY 14 earmarked for developing and owning passive
infrastructure for sharing among mobile service providers
Passive Telecom Infrastructure Sharing
Mobile networks have base stations (or cell sites) which have active and passive
infrastructure components Active components include the antenna trans-receivers
switches feeder cables Node B and microwave radio equipments Passive (or non-electronic) components include the land tower shelter air-conditioning equipment
diesel electric generator battery electrical supply technical premises and easements
pylons etc Passive infrastructure in a mobile network essentially involves acquiring land
1 Actual name o f the company is no t stated as per the instructions given by external supervisor
882019 Major Project (Ramit)
httpslidepdfcomreaderfullmajor-project-ramit 1162
2
setting up towers and electrical and civil works that needs to be in place before operators
can install the active infrastructure which brings mobile services to the consumers In a
typical cell site build-out almost 65 of the total cost is attributed to passive
infrastructure and 35 to active infrastructure In this report passive cell siteinfrastructure has also been henceforth referred to as towers or sites
Mobile operators are required to setup more and more BTS (cell) sites due to the
exponential growth of mobile subscribers in India (currently growing at almost 152
million subscribers a month) and limited availability of spectrum B and C Circles (where
traffic density may not be as high as metros and Circle A) are expected to drive future
subscriber growth and requirements for cell sites will be higher to ensure greater
coverage
To cover large stretch of almost 65000 Kilometers of national highways additional
18000 towers (one tower for every 3 Kilometers of highway) will be required in near
future to ensure better connectivity Proposed build out of 3G networks are expected to
further drive substantial growth in the number of towers over the next few years
However creating new infrastructure by each operator separately leads to duplicating
huge capital investments It also contributes to mushroom growth of telecom towers and
deteriorating skylines in urban areas which has already led to some local municipal and
state governments to regulate and restrict the erection of new mobile towers
The continued pressure on cellular tariffs higher infrastructure costs for network
deployment particularly in semi-urban and rural areas and compelling need to reduce
time to market for network roll outs have led operators to share and even outsource theirinfrastructure requirements from third party infrastructure providers like ABC GTL and
Indus towers
2 As published in ET 8 th May 09 Edition
882019 Major Project (Ramit)
httpslidepdfcomreaderfullmajor-project-ramit 1262
3
Sharing promotes capital efficiency as it allows more than one service provider to
leverage and ride on common infrastructure In its simplest form it involves two or more
operators jointly using the common passive infrastructure in a cell site While viewed
largely as a measure to reduce CAPEX and operating expense such sharing also leads toimprovement of service quality (by ensuring site space for service providers and reducing
black spots) and the environment (by reducing number of cell sites and towers)
In outsourcing operators take passive infrastructure and tower space from third party
infrastructure companies on a monthly rental basis to host their radio and transmission
equipments Outsourcing provides significant benefits to operators It enables them to
save on capital expenditure (it actually converts CAPEX into OPEX in the form of lease
rentals) and focus on their core activities of sales marketing and branding while leavingthe cumbersome task of managing the site development process and site operation and
maintenance to third parties who exclusively deal with such activities
Active infrastructure sharing is not popular across the globe for several reasons the most
important being increased inter dependency among competing service providers
However tower sharing and outsourcing of tower ownership is an accepted practice in
many developed markets In countries like USA UK and Australia there are
independently owned tower companies who rent tower space to various mobile operators
The United States has arguably the most developed independent mobile tower market
with independent tower companies owning over half of all mobile towers in that country
Mobile tower owners generate revenue by owning the towers and leasing space on the
towers to mobile telecommunications operators under long-term contracts Under this
business model ownership of the base station equipments coupled to the towers is
retained by the mobile telecommunications operators In addition to rental payments
mobile tower owners generally receive a fee for installing customers base station
equipment on the tower Mobile tower owners also receive services revenue for
operations and maintenance of the passive infrastructure Regulators all over the world
favor passive sharing of infrastructure
882019 Major Project (Ramit)
httpslidepdfcomreaderfullmajor-project-ramit 1362
4
The concept of passive infrastructure sharing is increasingly gaining market acceptance
in India So far it has been largely limited to bilateral sharing between operators in the
form of barter where the operators split the site related CAPEX and OPEX costs The
available information suggests that about 25 of the existing 90000 tower sites in Indiaare currently being shared for passive infrastructure predominantly in rural areas and
small towns
ABC Limited is expecting to get shortlisted by Department of Telecom for setting up
passive cellular infrastructure in rural areas with support from the Universal Services
Obligations (USO) Fund The recent announcements by some operators like Bharti
Hutch (Vodafone) Reliance Idea for mutual sharing of infrastructure through new
companies and entry of third party infrastructure providers has further expanded the
tower market in India
Results of detailed financial model indicate that with given expansion plans and
assumptions ABC will create value for its shareholders investors clients and promoters
The project is expected to generate high cash flows which will be sufficient enough to
pay back its debt liabilities and to generate and equity IRR of 36
882019 Major Project (Ramit)
httpslidepdfcomreaderfullmajor-project-ramit 1462
5
2 OBJECTIVES
The scope of work for this Study project involves the following
Market assessment for Indian telecom Infrastructure sector
Collection of data related to capital and operating costs (from promoter)
Forecasting operating costs
Preparation of detailed financial model
Calculation of UFCF ( Unlevered Free Cash Flows) LFCF (Levered Free Cash
Flows)
Estimation of Project and Equity IRRrsquos
Preparation of balance sheet PampL and cash flow statement for expected life
cycle of project
Sensitivity analysis and Scenario analysis
882019 Major Project (Ramit)
httpslidepdfcomreaderfullmajor-project-ramit 1562
6
3 LITERATURE REVIEW
31 International Experience in Infrastructure Sharing
Different countries have adopted different approaches in order to safeguard the level of
competitive independence between co-operating operators Measures include mandating
a distinct and differentiated cost base between operators the development of different
business plans marketing and distribution strategies and the independent development or
acquisition of content and services Requiring the independent control over the respective
frequency resources of each operator is also an important competitive safeguard
In the EU for example operators are allowed to share infrastructure as long as they
maintain full operational control of their network Sharing the radio access network is
permitted but sharing frequencies and the core network is not In particular the databases
used to administer subscriber and interconnection information are required to be kept
separate Exemptions however are generally granted in special cases which advance the
objectives of government policy and the economic benefits to the consumers of the
services It is important to note that any infrastructure sharing agreement could also be
subject to review by the EC Commission under Article 81 of the EC Treaty andor the EC
Merger Regulation
USA
In USA the number of wireless service subscribers has increased from 1284 million to
2433 million between December 2001 and December 2007 representing an increase of
approximately 88 and market penetration of approximately 70 The tower business in
USA is a $5 billion industry consolidated around four large players -- American Tower
(ATC) Crown Castle International (CCI ) SBA Communications (SBAC ) and GlobalSignal (GSL ) which control 40 of the approximately 210000 (P amp Lisa 2009) towers
across the US The primary business of these companies involves leasing antenna space
on multi-tenant communications sites to a variety of wireless carriers including radio and
3 Source CTIA-The Wireless Association Website
882019 Major Project (Ramit)
httpslidepdfcomreaderfullmajor-project-ramit 1662
7
television broadcast companies under long-term lease contracts Typically these leases
are long-term (five to 10 year) contracts with renewal terms at the option of the customer
Some co mpanies offer tower related services on a limited basis including site acquisition
zoning and permitting services and structural analysis services and project managementof antenna installations that support their site leasing operations and the addition of new
tenants and equipment on their sites
Towers are a relatively scarce asset in USA as zoning laws often do not permit a new
tower to be built in the immediate vicinity of an existing tower Tenant churn tends to be
low as towers are an integral part of the networks of the wireless service providers
Tenants own their own equipment (and therefore bear the technology risk) generally
handle installation and maintenance and pay for electricity and most ongoing assets
greatly simplifying the tower business model
Germany
In Germany the main concern faced by the regulator involved a possible threat to the
competitive independence of potential 3G operators that could result from a tight
integration of the networks as a result of infrastructure sharing Infrastructure Sharing is
allowed only if the mobile systems can be independently operated for example if they
can be shut down or maintained independently by software and that no customer data is
shared (OECD report 2004) In Germany the sharing of antennae and sites is relatively
common however the sharing of transmission management equipment and core
networks is not commonly done (Vogelsang 2002)
Sweden
In Sweden the regulator has agreed to allow significant infrastructure sharing for 3G
operators Each operator only has to cover 30 of the customers while for the remaining
70 infrastructure can be shared This is the approach being taken by the Europolitan
companies Vodafone Hi3G and Orange which jointly own 3G Infrastructure Services
However with competition concerns the regulator only allows radio components such as
antennas cables and base station electronics to be shared (Khurram Mahmood 2008)
882019 Major Project (Ramit)
httpslidepdfcomreaderfullmajor-project-ramit 1762
8
Singapore
In the case of Singapore the regulatorrsquos infrastructure sharing approach is guided by the
primary policy goal of encouraging facilities-based competition Under the current
regulatory framework licensees are generally not required to share any infrastructure that
it controls with its competitors Each licensee is expected to build or lease the use of the
infrastructure it requires Notwithstanding this however infrastructure sharing is
mandated in areas where there are clear space and operating constraints For 2G and 3G
licensees such matters relate to infrastructure in the Mass Rapid Transit and underground
road tunnels The regulator has also allowed the co-location of base stations and sharing
of transmission towers and masts to reduce the impact on the environment and to
minimize the inconvenience to building owners and residents (IDA 2009)
Malaysia
Taking a different approach in Malaysia operators owning network facilities have been
encouraged by the regulator to share infrastructure as a means of lowering costs and
expanding coverage as well as to avoid a duplication of resources To this effect a
Memorandum of Understanding to share infrastructure has been executed between the
mobile operators To further catalyze infrastructure sharing the concept of a third party
provider of facilities is also being promoted in Malaysia Under this concept of a third
party will build the infrastructure and lease capacity or space to existing se rvice
providers This concept not only provides ready-made sites but will also help reduce the
numbers of telecommunication towers that have to be dealt with by local authorities
(MAXIS 2009)
882019 Major Project (Ramit)
httpslidepdfcomreaderfullmajor-project-ramit 1862
9
32 Domestic Telecom Market assessment
The Indian Telecom Industry-Historical perspective
The Indian telecommunication industry was originally a government controlled
monopoly comprising three state owned operators
MTNL (which provided wire-line services in Mumbai and Delhi metropolitan
areas)
DOT (which provided wire-line services to rest of the country)
VSNL (which provided international services)
Liberalization started in 1991 with opening up of mobile services to private sectorparticipation The country was divided into 23 circles comprising of four metropol9otan
areas (Chennai Delhi Kolkata and Mumbai) and 19 other circles broadly defined by
parameters of states (K 2008) These 19 non-metropolitan circles have been categorized
as A B and C circles in descending order of their revenue generation potential (as
shown below)
Table 31 Telecom Circles
MetropolitanAreas Circle A Circle B Circle C
Delhi ChennaiMumbai Kolkata
Gujarat KarnatakaAP Tamil NaduMaharashtra
Punjab Kera laHaryana UP (West)Rajasthan UP(East) MP WestBengal
HP JampK North-East OrissaAssam Bihar
In 1997 TRAI was formed for regulating the operations and policy making process of
Indian telecommunication sector Since its liberalization India has experienced sustained
and impressive growth in its telecommunication sector primarily because of progressive
regulatory regime strong demand for mobile telecommunication services and
strengthening economy The country has achieved distinction of having worldrsquos lowest
tariff fastest growth ion subscriber base and availability of some of the cheapest mobile
handsets
882019 Major Project (Ramit)
httpslidepdfcomreaderfullmajor-project-ramit 1962
10
Figure 3-1 Growth of Subscriber base
Growth of Subscriber base
050
100150200250300350
1998 1999 2000 2001 2002 2003 2004 2005 2006 2007 2008
Year
M i l l i o n
Source Telecom Regulatory Authority of India Database
India is the second largest mobile market in the world is also among the fastest growing
mobile markets globally The total number of mobile subscribers in India (ie the
subscriber base) has crossed 300 million with 30049 million subscribers as on 31st
March 2008 The growth of subscriber base during the past decade (1998-2008) is
indicated above in a chart
Figure 3-2 Mobile Penetration Rate
0 10 20 30 40 50 60 70 80 90 100
North-East ( C)Assam (C)
Bihar ( C)Jammu amp Kashmir (C)
Orissa (C)Him achal Pradesh (C)
Uttar Pradesh ( B)Madhya Pradesh (B)
Rajastan (B)Haryana (B)
Punjab (B)West Bengal (B)
Kerala (B)Maharashtra (A)
Gujarat (A)Tamil Nadu (A)
Andhra Pradesh (A)Karnataka (A)
Kolkata (Metro)Chennai (Metro)Mumbai (Metro)
Delhi (Metro)
Source TRAI and PwC DatabaseNote As on Dec 08
882019 Major Project (Ramit)
httpslidepdfcomreaderfullmajor-project-ramit 2062
11
Indian telecom industry has experienced a high growth rate in Metros and class A circles
with coverage reaching around 90 and 35 respectively However coverage in the
Class B and Class C cities is still low at 15-25 Growth in Class B and Class C circles
has concentrated in urban area while penetration in rural area remains lower Thus futuregrowth is likely to come largely from Class B and C circles and rural areas Keeping this
in view larger players like Bharti Airtel Limited Reliance Communications Limited and
Bharat Sanchar Nigam Limited (BSNL) are largely focusing on increasing their
geographical coverage in Class B and C c ircles
33 Telecom Market- Competitive landscape
Figure 3-3 Market Share
Bharti2668
BSNLMTNL1908
Reliance1971
Vodafone661
Tata1047
Idea1033
Aircel457
Spice181
BPL056
HFCL013
Shyam005
Market Share
Source TRAI and Pw C Database
Indian mobile sector is largely concentrated with top 4 market players (Bharti Airtel
Reliance Communication Vodafone Essar and BSNL) out of 10 capturing almost three-
fourth of the entire market This is also partly on account of the fact that these four
operators have their presence in a larger number of circles as compared with other
players
882019 Major Project (Ramit)
httpslidepdfcomreaderfullmajor-project-ramit 2162
12
Figure 3-4 Lice nsed Circles
0
5
10
15
20
25
Licensed Circles (Dec 07) New Circles (Sep 08)
Source TRAI and CRISIL Database
The competition in Indian telecom sector is expected to intensify in near future because
recently new licenses have been granted to some of the existing operators for new circles
and also to new entrants like Unitech Datacom Swan Telecom and Stel These new
players are expected to capture the rural and semi-urban cities of C ircle B and Circle C as
they are now expected to grow at a much faster rate Shorter network rollout time and
competitiveness in the industry will force these entrants to start the ir operation as early as
possible Tower companies like ABC will allow incumbents to start operations in a
particular region just by installing their electronics on the ready-to-use towers thereby
significantly shortening the ro llout time
Moreover a rapidly increasing subscriber base and spectrum crunch would force the
existing telecom operators to maintain the minimum level of QoS Thus to retain existing
subscribers by preventing subscriber churn operators will require additional
infrastructure in their existing areas of operation to be able to offer better QoS This will
also result in increase in demand for telecom infrastructure in the existing markets
(Ramachanran 2009)
882019 Major Project (Ramit)
httpslidepdfcomreaderfullmajor-project-ramit 2262
13
34 Telecom Infrastructure Overview
Passive infrastructure is one of the most important components of a mobile network It
has been a critical area of operations for telecom companies in the past However with
increasing competition posing an urgent need for telecom companies to expand their
coverage and sharpen their focus on core operations so that they can sustain and improve
their market position passive infrastructure has assumed the status of an independent
industry during the past few years The industry (COAI) estimates that there will be a
requirement of around 350000 towers for 500 million subscribers by 2010 (COAI
2009)
Each site has active and passive infrastructure components Active components includethe antenna trans-receivers switches feeder cables Node B and microwave radio
equipments Passive (or non-electronic) components include the land tower shelter air-
conditioning equipment diesel electric generator battery electrical supply technical
premises and easements pylons etc Passive infrastructure in a mobile network
essentially involves acquiring land setting up towers and electrical and civil works that
needs to be in place before operators can install the active infrastructure which brings
mobile services to the consumers In a typical cell site build-out almost 65 of the total
cost is attributed to passive infrastructure and 35 to active infrastructure
(Ramachanran 2009)In this report passive cell site infrastructure has also been
henceforth referred to as towers or sites
The components of a typical base station are shown below
882019 Major Project (Ramit)
httpslidepdfcomreaderfullmajor-project-ramit 2362
14
Picture 3 1 Telecom Tower
Telecom towers are broadly classified on the basis of their placement as Ground-basedand Roof-top
1 Ground-Based Tower Ground-based towers (GBTs) are taller (typically 200 to 400
feet) and are mostly used in rural and semi-urban areas because of the easy
availability of real-estate space there GBTs involve a capital expenditure in the range
882019 Major Project (Ramit)
httpslidepdfcomreaderfullmajor-project-ramit 2462
15
of Rs 3 to 4 million depending on the height of the tower land prices etc
(Ramachanran 2009)
2 Roof-Top Tower (RTT) Roof-top towers (RTTs) are generally placed on the roofsof high-rise buildings They are shorter (than GBTs) and more common in urban and
highly populated areas where there is paucity of real-estate space Typically these
involve a capital expenditure of Rs 15 to 2 million (Ramachanran 2009)
The height of a telecom tower determines the number of antennas that can be
accommodated which in turn determines the capacity of the towers apart from factors
such as location and geographica l conditions (wind speeds type of terrain etc)
35 Telecom Infrastructure- Domestic market
In India there are broadly two kinds of operators in the tower infrastructure industry
Tower infrastructure subsidiaries
Reliance Infratel Limited
Bharti Infratel Limited
Indus Towers Limited
Wireless TT Info Services Limited (WTTIL)
Independent tower infrastructure companies (ITICs)
GTL Infrastructure
Xcel Telecom
Essar Telecom Infrastructure
Aster Infrastructure
Bharat Telemast
882019 Major Project (Ramit)
httpslidepdfcomreaderfullmajor-project-ramit 2562
16
These companies have their business model based largely on contract or anticipatory
approaches Under the contract approach tower companies set up tower sites going by
the requirements of the telecom operators and the terms of the contract are specified
beforehand in the MSAs signed by the two parties Under the anticipatory approachhowever tower companies set up tower infrastructure at sites with reasonable demand
potential and subsequently invite telecom operators to set up their network on these
towers The latter model involves higher business risks as the tower company may not be
able to achieve reasonable tenancy for its tower infrastructure and at profitable terms
BPTL proposes to follow contract approach for its business model
36 Telecom Infrastructure market- Competitive landscape
Figure 3-5 Telecom Infrastructure Market Players
038058154
365692
10381692
26923269
0 20000 40000 60000 80000 100000
Aster InfrastructureAmerican Towers
Essar Telec om Infrastructure
GTL In frastructureWi reles s TT In fo Services Limited
Bharti Infratel Limited
Reli anc e Communications Limitedrsquos
OthersInd us To wers Limited
Number of Towers
Market Players
Source Telecom Regulatory Authority of India and ICRANote Others include tower por tfolios of BSNL MTNL Sistema Shyam Teleservices Aircel etc
In Indian Telecom Infrastructure market competition has intensified significantly with
several players spinning of their tower portfolio and independent operators expanding
their operations
882019 Major Project (Ramit)
httpslidepdfcomreaderfullmajor-project-ramit 2662
17
Bharti Airtel Limited Reliance Communications Limited and Tata Teleservices Limited
have hived off their tower assets into separate tower infrastructure subsidiaries namely
Bharti Infratel Limited Reliance Infratel Limited and Wireless TT Infoservices Limited
respectively Also Bharti Infratel Limited together with Vodafone Essar Limited and IdeaCellular Limited in a joint- venture agreement has created Indiarsquos largest tower
infrastructure company ndash Indus Towers Limited which has an estimated portfolio of
around 88000 towers (Anjan V amp N 2009) Whereas in past few years number of
independent tower infrastructure companies have ventured into the domestic telecom
tower industry These include GTL Infrastructure Limited Essar Telecom Infrastructure
Limited Xcel Telecom Private Limited (American Towers) Tower Vision India Private
Limited Aster Infrastructure Private Limited TVS Interconnect Systems Limited etc
Figure 3-6 Telecom Tower Growth Scenario
0
100
200
300
400
500
600
700
2008 2009 2010 2011 2012 T e
l e c o m
T o w e r s
( T h o u s a n
d s )
Source Telecom Regulatory Authority of IndiaAssumptions Subscriber growth rate of 28 till 2011-12
1400 subscribe per site
As shown above it is expected that in next 4-5 years there will be a requirement of
additional 85000 towers (both GBT and RTT) each year to meet the subscriber base of
800 million by 2011-12 (PwC 2009) This shows that huge investment have to be made
in Indian telecom Infrastructure sector in near future Now since both passive and active
882019 Major Project (Ramit)
httpslidepdfcomreaderfullmajor-project-ramit 2762
18
infrastructure sharing is a llowed (except spectrum) Independent service providers will be
benefited Increase in subscriber base introduction of new technologies like 3G Wi-max
etc and increase in market healthy market competition in telecom services sector will
drive the growth in telecom infrastructure sector
882019 Major Project (Ramit)
httpslidepdfcomreaderfullmajor-project-ramit 2862
19
4 BUSINESS PLAN
41 Passive Infrastructure
Mobile networks have base stations (or cell sites) which have active and passive
infrastructure components Active components include the antenna trans-receivers
switches feeder cables Node B and microwave radio equipments Passive (or non-
electronic) components include the land tower shelter air-conditioning equipment
diesel electric generator battery electrical supply technical premises and easements
pylons etc Passive infrastructure in a mobile network essentially involves acquiring land
setting up towers and electrical and civil works that needs to be in place before operators
can install the active infrastructure which brings mobile services to the consumers In atypical cell site build-out almost 65 of the total cost is attributed to passive
infrastructure and 35 to active infrastructure
42 Infrastructure Sharing
Mobile operators are required to setup more and more BTS (cell) sites due to the
exponential growth of mobile subscribers in India (currently growing at almost 15 4
million subscribers a month) and limited availability of spectrum B and C Circles (wheretraffic density may not be as high as metros and Circle A) are expected to drive future
subscriber growth and requirements for cell sites will be higher to ensure greater
coverage
However creating new infrastructure by each operator separately leads to d uplicat ing
huge capital investments It also contributes to mushroom growth of telecom towers and
deteriorating skylines in urban areas which has already led to some local municipal and
state governments to regulate and restrict the erection of new mobile towers
The continued pressure on cellular tariffs higher infrastructure costs for network
deployment particularly in semi-urban and rural areas and compelling need to reduce
4 As published in ET 8 th May 09 Edition
882019 Major Project (Ramit)
httpslidepdfcomreaderfullmajor-project-ramit 2962
20
time to market for network roll outs have led operators to share and even outsource their
infrastructure requirements from third party infrastructure providers like BPTL GTL and
Indus towers It promotes capital efficiency as it allows more than one service provider to
leverage and ride o n common infrastructure In its simplest form it involves two or moreoperators jointly using the common passive infrastructure in a cell site While viewed
largely as a measure to reduce capital and operating expense such sharing also leads to
improvement of service q uality (by ensuring site space for service providers and reducing
black spots) and the environment (by reducing number of cell sites and towers)
In outsourcing operators take passive infrastructure and tower space from third party
infrastructure companies on a monthly rental basis to host their radio and transmission
equipments Outsourcing provides significant benefits to operators It enables them tosave on capital expenses (it actually converts capital expense into operating expense in
the form of lease rentals) and focus on their core activities of sales marketing and
branding while leaving the cumbersome task of managing the site development process
and site operation and maintenance to third parties who exclusively deal with such
activities
The concept of passive infrastructure sharing is increasingly gaining market acceptancein India So far it has been largely limited to bilateral sharing between operators in the
form of barter where the operators split the site related CAPEX and OPEX costs The
available information suggests that about 25 of the existing 90000 tower sites in India
are currently being shared for passive infrastructure predominantly in rural areas and
small towns
43 Introduction to the business
BPTL is an Infrastructure Provider company that builds owns operates and maintains
passive network infrastructure on a shared basis for mobile telecom operators and ITES
providers Its objective is to provide network design and planning network deployment
882019 Major Project (Ramit)
httpslidepdfcomreaderfullmajor-project-ramit 3062
21
network operations amp maintenance infrastructure management application management
and professional services to teleco m operators and enterprises
The company is planning to raise capital in the form of equity and debt to start its
operation by Aug 09 ABC rsquos vision is to provide world class managed infrastructure ampallied services to the service providers to optimize their service delivery capability In the
initial years of operation the company will focus on telecom sector with almost 100 of
its proposed capital expenditure till FY 14 earmarked for developing and owning passive
infrastructure for sharing among mobile service providers
44 Business Proposal
ABC will provide passive telecom infrastructure on build own operate (BOO) basis inboth ground based (GBS) as well as roof-top sites (RTS) It will undertake full range of
responsibilities in building owning and maintaining the sites and will serve as a single
window one-stop-shop provider of infrastructure services Typical responsibilities are
summarized below
Site planning keeping in view the network rollout plans of prospective customers
Site acquisition including entering into long-term agreements with land owners
Obtaining of necessary regulatory approvals
Erect ion and commissioning of tower and allied equipment
Provision of support services such as back-up power air-conditioning and
security
Provision of turnkey solutions to telecom companies such as sourcing of
equipment testing and maintenance
882019 Major Project (Ramit)
httpslidepdfcomreaderfullmajor-project-ramit 3162
22
Bharat Telemast Private Limited will identify the sites required for setting up the Passive
infrastructure by first of all getting a commitment from one operator who is called as
ldquoAnchor Operatorrdquo Then Bharat Telemast will go ahead to lease (or) buy out the site as
appropriate and commences construction of the cellular sites But the Cellular site will betypically designed for three to four operators While construction is in progress the
marketing team will work towards getting the second and third operator But care will be
taken in such a way that at least two operators are available at the time of completion of
construction
45 Sources of revenue
1 Infrastructure Provisioning Fees ndash fee paid by the operators on a monthly basisWith annual escalation
2 Site lease rental ndash Paid at actual on a monthly basis
3 Operations and maintenance charges Paid on a monthly basis
4 The contract also provides a fixed annual escalator
46 Attractiveness of business model
Stable and predictable cash flow business Once a tower asset is rented out it
usually generates a stable and predictable cash flow in the form of tower rentals
from occupants over the term of the MSA between the two parties
Low working capital requirement ABC rsquos business model is also characterized
by low working capital requirements as most of the operating expenses (such aselectricity and fuel and other variable operating expenses) are reimbursable by the
tenants on actual basis Moreover BPTL is may also be able to get rentals for the
towers in advance and also obtain better credit terms from their suppliers thus
further improving their working capital cycle
882019 Major Project (Ramit)
httpslidepdfcomreaderfullmajor-project-ramit 3262
23
High incremental profitability The operating costs associated with this
business are largely fixed in nature Thus each increment in tenancy is
accompanied by a minimal increase in costs This leads to a more thanproportionate increase in profits for every increase in occupancy
Reduction in capital investments due to present market conditions Due to
present market situation average capital requirement for RTT and GBT sites have
dropped from 2 million and 4 million to 15 million and 33 million ABC wishes
to grab this opportunity which will result in competitive advantage in near future
Extensive usage While on an average a GSM BTS can handle around 100-
1100 subscribers but in the case of high usage areas the figure can be as low as
600-700 subscribers which means a larger number of cell sites would be required
for the same area Moreover the country has the problem of spectrum scarcity
which increases the requirement of towers to maintain a reasonable leve l of
service quality
New entrants Many operators including Vodafone Essar Limited Idea Cellular
Limited Aircel Cellular Limited and Sistema Shyam Teleservices Limited have
received licenses as well spectrum in new circles which would enable them to
become pan-India operators in the next one-two years Also new licenses have
been issued to new players such as Unitech Swan Telecom and S Tel Limited
Given the significant expansion plans of new entrants over the medium term and
the need for them to optimize investments in order to maintain returns demand
for towers is expected to report a sharp increase
Shorter rollout time Indian telecom industry is highly competitive and doing
business for new entrant may not be easy Shorter network-rollout time would be
a critical success factor for the new entrants and a longer rollout time could meanloss of substantial market share to other operators Tower companies allow
players to start operations in a particular region just by installing their electronics
on the ready-to-use towers thereby significantly shortening the rollout time
New technologies 3G services are already launched in the country and to
augment their services various operators plan to launch Wi-Max services as soon
882019 Major Project (Ramit)
httpslidepdfcomreaderfullmajor-project-ramit 3362
24
as they receive additional spectrum from Government This would further
increase the demand for sharing of passive infrastructure
47
Expansion Schedule
BPTL would rollout both RTT and GBT sites of which the RTT sites GBT sites
normally would have a tower height of 50 meters or 60 meters depending on the need for
additional height for installation of microwave antennae based on the location of the site
and number of tenants on the cell site Details of BPTLrsquos expansion plan are summarized
below
Table 41 Expansion PlanExpansion Schedule 2009-10 2010-11 2011-12 2012-13 20013-14
GBT
Addition 210 700 1400 2450 3850
Total 210 910 2310 4760 8610
RTT
Addition 90 300 600 1050 1650
Total 90 390 990 2040 3690
48 Proposed Services
As indicated earlier ABC proposes to provide passive telecom infrastructure on a
sharing co-location basis to cellular operators The sites would either be Ground Based
Sites (GBS) or Roof Top Sites (RTS) As the sites are meant for co-location of the active
components of two to three operators they would be built to either 2-Tenant or 3-Tenant
specifications
The different components of the passive infrastructure facility and the related services
that would be offered by BPTL to the operators are as under
Infrastructure provisioning comprising
882019 Major Project (Ramit)
httpslidepdfcomreaderfullmajor-project-ramit 3462
25
Communication tower built to host multiple antennae
Weather-proof communication shelter with air-conditioning and power backup
arrangement
Diesel generating set and battery bank for power backup
A mobile standby generator to act as backup in case o f breakdown
Warehousing facility
Infrastructure operations and maintenance including
Regular operations and maintenance of the facility
Security of all the equipments at the site at all timesA dedicated team of technicians for a group of 40-50 sites to ensure effect ive and
efficient functioning of the components at all times
49 Proposed Organizational Structure
A senior management team will work under the leadership of the ldquoChief Operations
Officerrdquo who will be responsible for smooth implementation of proj ect activities He willalso assist the managing director in marketing This team will coordinate with Stallion
Telecom Pvt Ltd which will take over the role of procuring Capital Equipments
Senior management will consists of project manager infrastructure manager commercial
manager and head (legal and company affairs Apart from this there will be a requirement
Chief OperatingOfficer
Project Manager Infrastructure
Manager
Commercial
Manager (projects)
Head (Legal and
Company Affairs)
882019 Major Project (Ramit)
httpslidepdfcomreaderfullmajor-project-ramit 3562
26
of security sentries (3 per GBT site) supervisors (one for every 10 sites) and cluster
manager (one for every 50 sites)
Bharat Telemast will carry out the complete Project execution with the assistance of third party ldquoQuality control organizationrdquo and a third party ldquoProject management teamrdquo
Quality control and project management activities will be o utsourced to a third party
882019 Major Project (Ramit)
httpslidepdfcomreaderfullmajor-project-ramit 3662
27
5 METHODOLOGY
The changing face of infrastructure services creates a complex situation which demands
greater understanding of roles of competition regulatory structures and modes of
financing Knowledge of such things is a key decisive factor in building confidence
among investors promoters and government In project finance the project its assets
contract and cash flows are separated from promoter in order to permit credit appraisal
or loan to the project
As part of the financial feasibility analysis a series of related financial statements based
on projected sources and uses of funds during the development and operating phaseproject were created Financial statements consist of expenses associated with
development activities including capital costs like acquisition of land for GBT sites cost
of tower generator shelter batteries etc Most of the data regarding capital costs are
obtained from the promoter of ABC Limited All these capital costs related details are
provided in annexure 1
Assumption regarding depreciation capital structure operating expenses expansion
schedule tenancy ratios tariff or rent operatorrsquos fees and loan amortization schedule are
obtained from professional accountants Promoter and bankers of ABC Limited
Due to unknown factors that could influence the cost of towers or fees associated with
completing the project (soft costs) contingency costs were estimated at 5 of hard and
soft costs respectively If contingency is set too low developers could easily encounter
funding shortfalls upon slight changes in market forces All other costs were estimated
based on talking with industry professionals (Promoters)
A detailed financial model was prepared based on existing accounting standards and
following financial ratios were estimated
882019 Major Project (Ramit)
httpslidepdfcomreaderfullmajor-project-ramit 3762
28
EBITDA margin Profit and loss accounts for the estimated project period (15
Years) were prepared based on which estimated earnings before interests tax
depreciat ion and amortization were calculated for each year Detailed PampL
balance sheet and cash flow statements are provided in annexure 2 3 and 4
EBITDA = Total Revenue ndash (Variable expenses + Fixed Expenses)
EBITDA margin = EBITDA Total Revenue
PAT margin PAT is calculated by subtracting interests pa id on capital debt and
working capital debt depreciation and applicable corporate income tax from
EBITDA
PAT = EBITDA ndash Interest Payable ndash Depreciation ndash Income tax
PAT margin = PATTotal Revenue
Working Capital Working capital requirement is calculated by subtract ing
current liabilities from current assets Current assets are estimated based on 30
days cash requirement and current liabilities are estimated as half of salary
monthly expenses
WC = Current Assets ndash Current Liabilities
UFCF It is defined as the free cash flows available to the firm if the firm has
zero debt liability Purpose of ca lculat ing UFCF for project period is to determinethe project IRR
UFCF = PAT + Depreciation + Interest (tax adjusted) + Release of WC + Salvage
value of the assets ndash CAPEX ndash Change in WC
882019 Major Project (Ramit)
httpslidepdfcomreaderfullmajor-project-ramit 3862
29
LCFF It is defined as the cash floes available to the firm after paying interests on
long term and short term debts
LCFF = UFCF ndash Interest (tax adjusted)
FCFE It is defined as the free cash flow available to equity holders It is
determined to ca lculate equity IRR for equity investors It also includes the tax
benefits which are available as per the Income Tax Act
FCFE PAT + Depreciation + Salvage Value ndash Equity Investment ndash Long term debt
repayment
PIRR Project IRR is defined as the discount rate at which NPV (Net Present
Value) of UFCF is zero It is calculated by using following formula
UFCF 1 (1+PIRR) 0+ UFCF 2 (1+PIRR) 1+ UFCF 3 (1+PIRR) 2+ helliphelliphelliphelliphelliphellip = 0
UFCF 1 = UFCF at the end of first year of operation
UFCF 2 = UFCF at the end of second year of operation
PIRR = Project IRR
EIRR Equity IRR is defined as the discount rate at which NPV of FCFE is zero
It is calculated by using following formula
FCFE1 (1+EIRR) 0+ FCFE 2 (1+EIRR) 1+ FCFE 3 (1+EIRR) 2+ helliphelliphelliphelliphelliphellip = 0
FCFE1 = FCFE at the end of first year of operation
FCFE2 = FCFE at the end of seco nd year of operation
EIRR = Equity IRR
882019 Major Project (Ramit)
httpslidepdfcomreaderfullmajor-project-ramit 3962
30
WACC It is de fined as the percentage of return expected by the investors who
otherwise would have earned some return by investing in some other project
WACC = Cost of Debt (Debt Capital) + Cost of equity (Equity Capital)
882019 Major Project (Ramit)
httpslidepdfcomreaderfullmajor-project-ramit 4062
882019 Major Project (Ramit)
httpslidepdfcomreaderfullmajor-project-ramit 4162
32
62 Funding planAs the telecom sites are rolled out over a 5 year period till FY 2014 investment will be
required for each year ABC Limited will start generating profits from FY 10 only Such
internally generated cash accruals will be ploughed back into the business to meet part of
the project cost Investment required for each year is tabulated below
Table 61 Funding ProposalMillion INR FY 10 FY 11 FY 12 FY 13 FY 14
GBT Tower (Additional) Nos 210 700 1400 2450 3850
RTT Tower (Additional) Nos 90 300 600 1050 1650DE ratio 233 233 233 233 233
Additional CAPEX 83892 279374 558748 977809 1536557
Debt 58725 195562 391124 684466 1075590
Equity 25168 83812 167624 293343 460967
63 Results
Based on assumptions given in Annexure 1 a detailed financial model was preparedResults of the financial model such as PampL account Balance Sheet and cash flow
statements are provided in Annexure 2 3 and 4 Forecasts for the key financial figures for
first five years are provided in the Table below
Forecasts
Table 62 Income StatementMillion INR FY-10 FY11 FY12 FY-13 FY-14
Sales 7124 50511 156766 347476 667700
Cost of sales 1950 13852 39252 87612 170021
Gross 5174 36659 117514 259864 497679
7263 7258 7496 7479 7454
Admin costs 112 179 190 203 216
882019 Major Project (Ramit)
httpslidepdfcomreaderfullmajor-project-ramit 4262
33
Finance cost 0 021 7401 31330 77725
Taxation 170 4233 14536 29073 53547
PAT 2454 19458 59470 122096 223267
As shown in Table above during the expansion period revenue will grow exponentially
In the first year of operation ABC will earn a revenue of INR 7124 million from 300
(210 GBT and 90 RTT) sites with a tenancy ratio of 15 for GBS and 17 for RTS In the
first 2 years of operation the company will not pay any interest on long term debt due to
2 years moratorium period Major cost associated with the project is depreciation due to
which PAT is lower than the operating profits But cash flows to the firm are enough to
result in reasonable returns
Table 63 Balance Shee tYear ending Mar-10 Mar-11 Mar-12 Mar-13 Mar-14
AssetsGross Block 75742 328216 833164 1716823 3105430Accumulated depreciation 2439 15208 51125 128287 271212Net Block 73303 313009 782040 1588536 2834219Net Working Capital 064 241 620 1335 2515Cash Balance 12979 72089 216513 488856 947982
Total Assets 86346 385339 999172 2078727 3784715LiabilitiesEquity 25168 108980 276604 569947 1030914Reserves amp Surplus 2454 21912 81381 203477 426745Long term Debt 58725 254286 640722 1304302 2325171WC Borrowings - 161 465 1001 1886Total Liabilities 86346 385339 999172 2078727 3784715
Note All figures are in Million INR
Table 64 Key financial ratiosMar-11 Mar-12 Mar-13 Mar-14 Mar-15
Revenue Growth 60902 21036 12165 9216 3890EBITDA Growth 62061 22161 12132 9158 4020
PAT Growth 69293 20564 10531 8286 2955
As shown in table above increase in EBITDA is higher than that of revenue This is due
to better operational efficiency of ABCrsquos management and economies of scale S imilarly
882019 Major Project (Ramit)
httpslidepdfcomreaderfullmajor-project-ramit 4362
34
increase in PAT is lesser than that of EBITDA because of high depreciation and interest
expenses
Table 65 Pr ofitability r atios
Mar-11 Mar-12 Mar-13 Mar-14 Mar-15
EBITDA Margin 7222 7484 7473 7450 7520
PAT Margin 3852 3794 3514 3344 3119Return on Net Worth 622 760 769 788 1087
Key profitability ratios are shown in table above Return on net worth in the initial years
is lower because of the ambitious expansion plans of ABC Limited Thereafter return on
net worth increases with increase in PAT
Returns on Investment
Table 66 Financial returnsFinancial Indicators
Project IRR 1813Equity IRR 3609
64 Sensitivity Analysis
A sensitivity analysis has been carried out on the project financials to determine theimpact of key variables on the financial indicators namely
Project IRR
The key variables on which sensitivity analysis have been carried out areCapital expenditure for GBS and RTS1st and 2 nd tenant tariff for GBS1st and 2 nd tenant tariff for RTSTenancy Ratio
Similarly sensitivity analysis has been carried out forEquity IRR
The key variables on which sensitivity analysis have been carried out for EIRR are
Capital structure and interest rate for capital debtRepayment period and moratorium period
882019 Major Project (Ramit)
httpslidepdfcomreaderfullmajor-project-ramit 4462
35
The impact on the financial indicators is shown below
Figure 6-1 Project IRR vs GBT and RTT CAPEX
As shown in Figure 6-1 project IRR is more sensitive to change in CAPEX of RTT sitesas compared to change in CAPEX of GBT sites because tenancy ratio and tariff for RTTsites are higher than those of GBT sites
882019 Major Project (Ramit)
httpslidepdfcomreaderfullmajor-project-ramit 4562
36
Figure 6-2 Project IRR vs GBT Tariff for 1 st tenant (X-axis) and 2 nd tenant (right-hand side)
As shown in Figure 6-2 project IRR varies linearly with GBT tariff In the best casescenario when GBT tariff for 1 st tenant is INR 34000month and GBT tariff for secondtenant is INR 26000month Project IRR is 2101
Figure 6-3 Project IRR vs RTT Tariff for 1 st tenant (X-axis) and 2 nd tenant (right-hand side)
As shown in Figure 6-2 project IRR varies linearly with RTT tariff In the best casescenario when RTT tariff for 1 st tenant is INR 24000month and RTT tariff for second
882019 Major Project (Ramit)
httpslidepdfcomreaderfullmajor-project-ramit 4662
37
tenant is INR 20000month Project IRR is 1932 Project IRR is more sensitivetowards RTT tariff than GBT tariff because in practical business situation RTT siteshave a tenancy ratio of more than two due to which effect of tariff for 1 st tenant almostget nullified after few years
Figure 6-4 Project IRR vs Tenancy ratio for RTT sites (X-axis) and GBT sites
As shown in Figure 6-4 project IRR is very sensitive to tenancy ratio In the best casescenario where GBT sites have a tenancy ratio of 2 and RTT sites have a tenancy ratio of 3 project IRR can be as high as 20
Figure 6-5 Equity IRR vs long term debt interest rate for different leverage level
882019 Major Project (Ramit)
httpslidepdfcomreaderfullmajor-project-ramit 4762
38
As shown in figure 6-5 equity IRR is more sensitive to interest rate on long term debt forhigh level of leverage (lower debt equity ratio) because as the debt equity ratio increasesinterest paid on long term debt also increases significantly
Figure 6-6 Equity IRR vs long term debt repayment period at different level of moratoriumperiods
As shown in figure 6-6 Equity IRR increases with increase in moratorium period anddebt repayment period The variation is from 1654 to 60 for worst case and best casescenarios
882019 Major Project (Ramit)
httpslidepdfcomreaderfullmajor-project-ramit 4862
39
7 RISK ASSESSMENTRisk Mitigation strategyExecution Risk
(Project management landacquisition etc)
Management of ABC has proven expertise in
telecom infrastructure rollout and has executedvarious projects with large telecom operators andMNC vendorsABCrsquos top management team consists of a groupof professionals drawn from leading telecomInfrastructure Company who have immenseexpertise and experience in rolling out telecominfrastructure projects
Market Risk (No entry barriers operators may
share infrastructure betweenthemselves large players withhigh capital may increasecompetition)
India has a huge potential for telecominfrastructure market With increasing
competition falling tariffs and pressure onmargins telecom service providers are beingforced to increase their focus on marketing andreduce their expensesExperienced management healthy capital back-up effective presence in the telecominfrastructure market and value added services atrelatively lesser cost will help ABC to meet theset targets
Financing Risk
(Availability of equity capitalavailability of long term debtinterest rate and moratoriumperiod)
ABC is seeking private equity partner to secure
equity capital Company has already entered intoNDA with 2 major investorsLong term debt at an interest rate of 125 canbe easily arranged because of the credibility of the promoters in the marketMany other similar firms like Indus and GTLhave already secured long term debt for amoratorium period of 2 years Promoters of ABCLimited are confident to secure a long term debtwith a moratorium period of 2 years and apayback period of 8 years
ABC Limited would minimize the workingcapital requirements of its business by securingrentals and operating revenues in advance fromits clients and or by suitably structuring itspayment liabilities to match its cash inflows
Commercial Risk (Tenancy ratio and tariff forGBS and RTS)
ABC would aim to enter into long term contractswith the ldquoanchor tenantrdquo operator and thenrollout the infrastructure so that at least single
882019 Major Project (Ramit)
httpslidepdfcomreaderfullmajor-project-ramit 4962
40
occupancy of each site is ensured at all t imesPromoters will use its knowledge of the businessand its expertise to identify and roll out sites inlocations which have strong multi- tenancypotential to minimize occupancy risk
Revenue Risk (Operating fees may decreasecredit worthiness of the clientsdelay in payment of rentals)
As per the industry sources till now not even asingle operator have dishonored the long termlease contractThe credit risk is diversified as there will bemultiple operatorsABC would aggressively market to get 3G andWiFi broadcasters to use the sites and earnadditional revenues in addition to the assumedrevenue streams
Natural Calamities Risk The Company shall maintain insurance for thesites against these risks and the cost of insurancewill be priced in and passed on to the tenants
882019 Major Project (Ramit)
httpslidepdfcomreaderfullmajor-project-ramit 5062
41
8 CONCLUSION
India is the fastest growing wireless telecom market in the world The continuing
growth in the number of wireless subscribers and MoUs and increasing trend of
outsourcing of business processes to India has led to growing demand for large
investments in the telecom infrastructure in the country
However with increasing competition falling tariffs and pressure on margins
telecom service providers are being forced to increase their focus on marketing
customer acquisitions and branding and minimize their efforts and overheads in
project management and asset acquisition
Further with rising prices of steel cement and real estate the cost of developing
and owning passive infrastructure is increasingly becoming a costly proposition
for most operators and service providers
The compulsion on the part of service providers to reduce their operating costs
and capital expenditure requirements has led to opportunities in passiveinfrastructure outsourcing to independent third party infrastructure providers and
also sharing the infrastructure with other service providers It is expected that
cellular operators will outsource their communications site infrastructure needs as
a means of accelerating access to their markets and preserving capital rather than
constructing and operating their own communications sites and maintaining their
own communications sites service and deve lopment capabilities
Passive infrastructure is highly capital intensive and an integral part of the cellular
service providersrsquo networks Yet being a simple and low technology asset it is
amenable to outsourcing and sharing By transferring the responsibility of
ownership development and maintenance of passive infrastructure service
882019 Major Project (Ramit)
httpslidepdfcomreaderfullmajor-project-ramit 5162
42
providers have an opportunity to transfer a substantial part of their business risk to
third parties
Most telecom operators are facing capacity constraints on their networksCoverage obligations increasing pressure to improve network quality and
competition has led to aggressive roll out plans by existing cellular operators
Installation of cell sites has become a cumbersome process as there are a number
of clearances required and involves labor-intensive micro management
Availability of ready infrastructure from third party providers would enable the
operators to reduce their time to market and accelerate their access to their
customers Cellular service providers generally want to move quickly when
adding more sites and co-location on an existing site is always faster than
building
Ownership and maintenance of telecom towers and other infrastructure by third
parties is an established practice in developed nations like USA and is
increasingly gaining market acceptance in India
The Indian government is seriously considering promoting the infrastructure
sharing route between the telecom operator and private players to achieve future
national tele-density targets and improve rural telecom penetration
ABC being an independent entity with no business conflicts with other service
providers in the telecom space will be best positioned and have an early mover
advantage to capitalize on this emerging opportunity
Further the task of operating and maintaining the passive infrastructure in the cell
is increasingly becoming a cumbersome exercise for the service providers to
handle ABCrsquos composite offering to build passive infrastructure for the cellular
operators and also operate and maintain them will provide a turnkey solution to
address the infrastructure needs of the service providers
882019 Major Project (Ramit)
httpslidepdfcomreaderfullmajor-project-ramit 5262
43
The business model proposed to be followed by ABC is fairly simple with stable
and predictable cash flows as is the case with the business model of the tower
renting companies in USA Most contracts are long term for a period 10 or moreyears with annual price escalators generally ranging from 3 to 4 However
wireless carriers normally tend to renew rentals because suitable alternative sites
may not exist or be available and repositioning a site in a carrierrsquos network is
expensive and may adverse ly affect network quality
Site ownership and operations is a ldquoscalerdquo business operating administration
marketing expenses etc do not rise as quickly as revenues when portfolios are
expanded Incremental operating costs associated with adding wireless tenants to
a communications site are minimal Therefore as additional tenants are added to a
site the substantial majority of incremental revenue contributes to margin
expansion Most tower companies have high EBITDA margins as may be seen
from the financial indicators of some of the tower rental companies in USA
It is expected that site location and capacity price and quality of service and
successful execution of contracts will be the most significant competitive factors
in this business
ABCrsquos revenue and returns on investment will be primarily driven by its ability
to
o Increase the utilization of the space and infrastructure capacity owned by it by
increasing the number of tenants per site and renting out to maximum number
of users As discussed above return on capital employed (PIRR and EIRR) arevery sensitive to tenancy ratio In worst case scenario project IRR can be as
low as 8 and in the best case scenario it can be as high as 20
o Develop acquire sites of strategic importance and high growth potential that
will enable them to secure better commercial terms from users and attract
more number of tenants Infrastructure provisioning fees rentals for sites are
882019 Major Project (Ramit)
httpslidepdfcomreaderfullmajor-project-ramit 5362
44
extremely location sensitive There is a potential to acquire more land than
that of required to capitalize on the increase in real estate prices
o Develop sites in a cost effective manner ABC would consider purchasing
land only for those GBS sites which have sufficient demand and arestrategically located Else for most of its sites land will be leasehold As
shown above returns (PIRR and EIRR) are very sensitive to capital costs In
the worst case scenario project IRR can be as low as 15 whereas it can as
high as 27 in the best case scenario
o Negotiate and secure long term contracts with good credit quality users with
built in price escalation provisions to mitigate financing risk
o Leverage and secure long term financing at attractive terms and involve in
active treasury management to keep low financing cost Results of the
sensitivity analysis indicate that equity IRR can be as high as 60 foe a
moratorium period of 4 years and interest rate of 10
o Minimize working capital requirements
o Maintain low operating and administration expense
o Secure better OampM margins from operators and retain a healthy share of it in
ABC
o Maintain high service standards and build strong customer relationships
The business would have the potential to capture new revenue opportunities
around the existing assets As demand for towers is expected to grow and as
operators migrate to speedier next-generation wireless technologies they will
need the towers and associated passive infrastructure to transmit their new
services in addition to their existing offerings In addition to increasing capacity
and coverage and improving the quality of their networks cellular serviceproviders are deploying high speed data networks driving incremental demand of
sites The business therefore has potential upsides in the form of adding
customers (tenants) in wireless broadband third generation (ldquo3Grdquo) and wireless
data capabilities and also other incremental value propositions by way of hosting
882019 Major Project (Ramit)
httpslidepdfcomreaderfullmajor-project-ramit 5462
45
Billboards Hoardings etc in some of the high visible sites owned and maintained
by it
Based on the assumptions and subject to satisfactory resolution of the key risks
factors project cash flows will be able to meet debt service obligations
This business model is a lucrative investment option for a private equity player
because valuation of each site will increase in the coming years due to
improvement in market conditions increase in the value of land and increase in
the demand for passive infrastructure in rural and semi-urban areas
882019 Major Project (Ramit)
httpslidepdfcomreaderfullmajor-project-ramit 5562
46
REFERENCESAnjan G V A amp N M (2009) telecom infrastructure industry in india GurgaonICRA
Bessler W Norsworthy J amp Shusterman T (2001 12 1) Mergers in the UStelecommunications industry and market valuationeffects IEEE p 288
COAI (2009 march 14) Subscriber Figures Retrieved march 14 2009 fromCOAIcom httpwwwcoaicomstatisticsphp
IDA (2009 march 23) Highlights Retrieved march 23 2009 from idagovsghttpwwwidagovsghomeindexaspx
K R (2008) Time for new business model Delhi Cybermedia
MAXIS (2009 march 8) the malaysian telecommunications industry Retrieved march9 2009 from maxiscommyhttpwwwmaxiscommypersonalabout_usinvestorprospectusprospectus4pdf
P J amp Lisa A (2009) Stimulas spending and American Telecom Industry USACoracle group
PwC (2009 march 12) Indian Telecom Industry Gurgaon Harayana IndiaRamachanran (2009 march 1) Investment in Telecom Infrastructure sector (M RInterviewer)
Vogelsang I (2002) The German Telecommunications Reform Verein fuumlr Socialpolitik (p 26) Innsbruck Boston Press
882019 Major Project (Ramit)
httpslidepdfcomreaderfullmajor-project-ramit 5662
47
ANNEXURES
ANNEXURE 1 Key Assumptions
The occupancy of each site by single two three operators for green-field sites is assumed
to be as follows
Table 91 Expected Tenancy RatiosFY 10 FY 11 FY 12 FY 13 FY 14 FY15
GBT Tenant
Ratio 150 150 170 170 170 200
Single Operator 50 50 30 30 30 0
Two Operator 50 50 70 70 70 100
RTT Tenant
Ratio 170 170 200 200 200 250
Single Operator 30 30 0 0 0 0
Two Operator 70 70 100 100 100 50
Three Operator 0 0 0 0 0 50
From FY 15 onwards tenancy ratio of 2 and 25 for GBT and RTT sites is cons idered
882019 Major Project (Ramit)
httpslidepdfcomreaderfullmajor-project-ramit 5762
48
Capital costs related assumptions are tabulated below
Table 92 GBT and RTT Capital Cost
The lease rentals for RTT sites are reimbursed from the operators and therefore have not
been factored in the revenues as well as the expense For GBT sites land purchase cost of
035 millions assumed which has been escalated by 6 annually to determine the
salvage value of assets
GBT Capital Costs
Million
INR
Delivery cost of Ground Based
Tower (GBT)063
Delivery cost of Generator 030
Civil Work 040Shelter 012
Electrical Works 030
Other Equipments (UPS Battery
etc)045
Construction cost 045
Land 035
Contingency amp Financial Charges 035Total cost 335
RTT Capital Costs
Million
INR
Delivery cost of Roof Top
Tower (RTT) 030
Delivery cost of Generator 020
Civil Work 020Shelter 012
Electrical Works 030
Other Equipments (UPS
Battery etc) 030
Construction cost -
Land -
Contingency amp FinancialCharges 008
Total cost 150
882019 Major Project (Ramit)
httpslidepdfcomreaderfullmajor-project-ramit 5862
49
Ope rating costs related assumptions are tabulated below
Table 93 Operating CostsOperating Costs
Security Sentries (INRMonth) 4000
Supervisors (INRMonth) 6000
Cluster Manager One for Fifty Towers (INRMonth) 15000
Annual increase 500
Number of Security Sentries per tower 300
Number of supervisors per tower 010
Number of C luster manager per tower 002
Fixed Expenses
Selling amp Maintenance (INRMonth) 4000000
Annual Escalation 5
Administration overhead (INRMonth) 10000000Annual Escalation 7
AMC Cost of Generator 15 (cost of generator)
Annual Escalation (AMC) 3
For RTT sites security sentries are not required because it will be the responsibility of
the site owner A supervisor will for every 10 sites and a cluster manager for every 50
sites will be required
882019 Major Project (Ramit)
httpslidepdfcomreaderfullmajor-project-ramit 5962
50
Table 94 Long term debtInterest Rate 125 per annum
Moratorium 2 years
Repayment Period 8 years
Tariff related assumptions and date of operations are tabulated below
Table 95 GBT and RTT Tariff Table 96 Life of the projectTariff Plan
Tariff (INRMonth)
No of
operators GBT RTT
1 28000 18000
2 22000 14000
3 0 12000
Annual
increase 3 3
Commercial Operation Date 1-Aug-09
Quarter Ending 30-Sep-09
FY ending COD 31-Mar-10
Project life years 15
End of commercial
operations31-Aug-24
Quarter ending commercial
operations30-Sep-24
FY ending comme rcial
operations31-Mar-25
882019 Major Project (Ramit)
httpslidepdfcomreaderfullmajor-project-ramit 6062
51
Annexure 2 Profit amp Loss accountsTable 97 Profit amp loss account statement
Income Statement (MNINR)Year ending Mar-10 Mar-11 Mar-12 Mar-13 Mar-14 Mar-15
RevenueGBT 406350 28811 89080 197447 379409 527015Operator Fees (GBT) 1411 10004 30678 67998 130664 179664RTT 1209 8575 27269 60443 116146 164264
Operator Fees (RTT) 440 3121 9739 21587 41481 56466Net Revenue 7124 50511 156766 347476 667700 927410
Expenses
VariableSecurity Sentries 1355 9790 28339 64033 125433 158238Supervisors 097 699 2024 4574 8959 11303Cluster Manager 048 350 10 12 2287 4480 5651AMC Cost of Generator 450 3013 7877 16719 31148 54541Sub-total 1950 13852 39252 87612 170021 229734
Fixed
Selling amp Maintenance(INRMonth) 032 050 053 056 058 061
Administration overhead(INRMonth) 080 128 137 147 157 168
Sub-total 112 179 190 203 216 230
EBITDA 5062 36480 117324 259661 497464 697447
Interest on LT loan - - 7341 31200 77479 156198Interest on ST loan - 021 060 130 245 361
EBDT 5062 36459 109923 228331 419739 540888Depreciation 2439 12769 35917 77162 142925 174006
EBT 2624 23691 74006 151169 276814 366881Income Tax 170 4233 14536 29073 53547 77634
PAT 2454 19458 59470 122096 223267 289247
882019 Major Project (Ramit)
httpslidepdfcomreaderfullmajor-project-ramit 6162
52
Annexure 3 Balance sheet
Table 98 B alance sheetsYearend Balance Sheet (MNINR)Year ending Mar-10 Mar-11 Mar-12 Mar-13 Mar-14 Mar-15
AssetsGross Block 75742 328216 833164 1716823 3105430 3105430Accumulated depreciation 2439 15208 51125 128287 271212 445218Net Block 73303 313009 782040 1588536 2834219 2660212Net Working Capital 064 241 620 1335 2515 3707Cash Balance 12979 72089 216513 488856 947982 1294734Total Assets 86346 385339 999172 2078727 3784715 3958653
LiabilitiesEquity 25168 108980 276604 569947 1030914 1030914Reserves amp Surplus 2454 21912 81381 203477 426745 715992Long term Debt 58725 254286 640722 1304302 2325171 2208967WC Borrowings - 161 465 1001 1886 2780Total Liabilities 86346 385339 999172 2078727 3784715 3958653
882019 Major Project (Ramit)
httpslidepdfcomreaderfullmajor-project-ramit 6262
Annexure 4 Cash flow statement
Table 99 Cash flow statements
Year ending Mar-10 Mar-11 Mar-12 Mar-13 Mar-14 Mar-15
InflowsPAT 2454 19458 59470 122096 223267 289247Depreciation 2439 12769 35917 77162 142925 174006Tax adjusted interest - 014 4959 20991 52076 104895Release of WC - - - - - -Salvage Value - - - - - -Sub-Total 4893 32241 100345 220249 418268 568148
OutflowsCapex 75742 252474 504948 883659 1388607 -Change in WorkingCapital 064 177 379 715 1180 1192
Sub-Total 75806 252651 505327 884374 1389787 1192
UFCF (70913) (220410) (404982) (664125) (971519) 566956LFCF (70913) (220424) (409940) (685116) (1023595) 462062
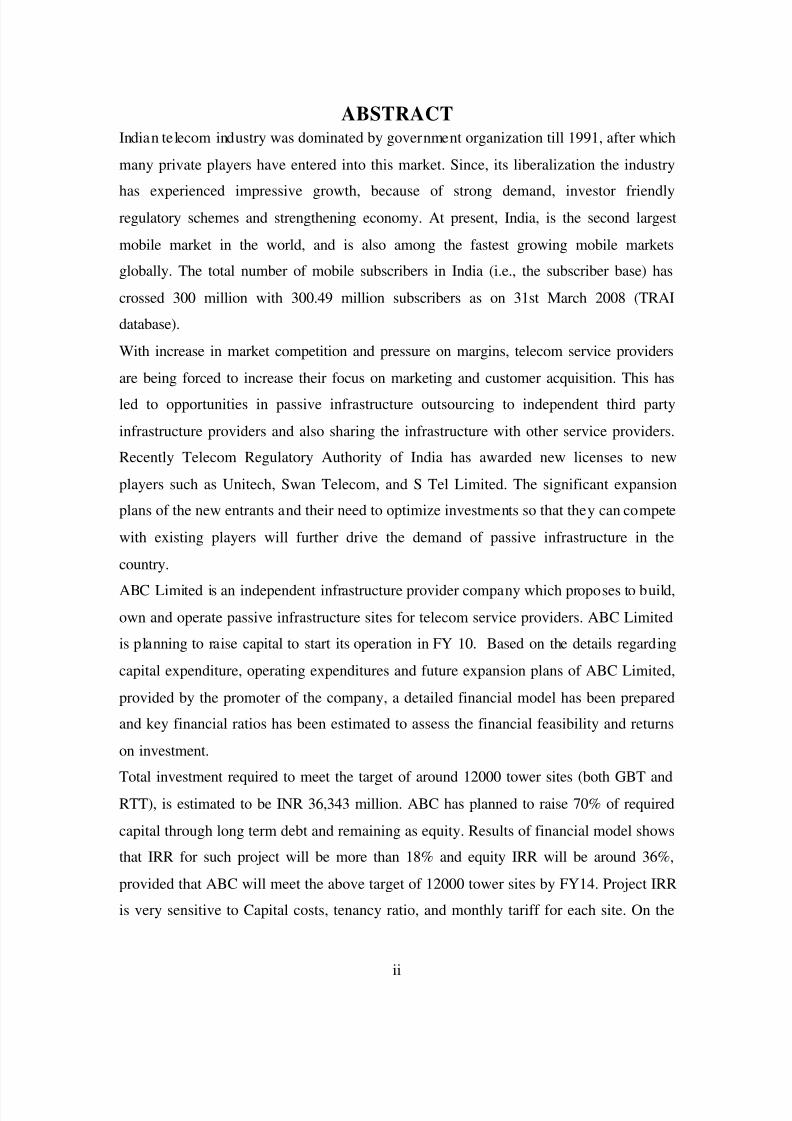
882019 Major Project (Ramit)
httpslidepdfcomreaderfullmajor-project-ramit 862
iii
other hand equity IRR is sensitive to loan moratorium period and interest rate on long
term debt The project will generate enough cash flows to cover its debt obligation and
also to generate high return on equity invested
882019 Major Project (Ramit)
httpslidepdfcomreaderfullmajor-project-ramit 962
iv
LIST OF TABLESTable 31 Telecom Circles 17 Table 41 Expansion Plan 31
Table 61 Funding Proposal 39 Table 62 Income Statement 39 Table 63 Balance Sheet 40 Table 64 Key financial ratios 40 Table 65 Profitability ratios 41 Table 66 F inancial returns 41 Table 91 Expected Tenancy Ratios 50 Table 92 GBT and RTT Capital Cost 51 Table 93 Operating Costs 52 Table 94 Long term debt 52 Table 95 GBT and RTT Tariff 53 Table 96 Life of the project 53 Table 97 Profit amp loss acco unt statement 54 Table 98 Balance sheets 55 Table 99 Cash flow statements 56
LIST OF FIGURES
Figure 3-1 Growth of Subscriber base 10 Figure 3-2 Mobile Penetration Rate 10 Figure 3-3 Market Share 11
Figure 3-4 Licensed Circles 12 Picture 3 1 Telecom Tower 14 Figure 3-5 Telecom Infrastructure Market Players 16 Figure 3-6 Telecom Tower Growth Scenario 17 Figure 6-1 Project IRR vs GBT and RTT CAPEX 35 Figure 6-2 Project IRR vs GBT Tariff 36 Figure 6-3 Project IRR vs RTT Tariff 36 Figure 6-4 Project IRR vs Tenancy ratio for RTT sites and GBT sites 37 Figure 6-5 Equity IRR vs long term debt interest rate for different leverage level 37 Figure 6-6 Equity IRR vs long term debt repayment period at different level of moratorium periods 38
882019 Major Project (Ramit)
httpslidepdfcomreaderfullmajor-project-ramit 1062
1
1 INTRODUCTION
ABC Ltd 1 is an Infrastructure Provider company that builds owns operates and
maintains passive network infrastructure on a shared basis for mobile telecom operators
and ITES providers The Company was formed in Jan 2009 Its objective is to provide
network design and planning network deployment network operations amp maintenance
infrastructure management application management and professional services to telecom
operators and enterprises
The company is planning to raise capital in the form of equity and debt to start its
operation by Aug 09 The purpose of this project is to prepare detailed financial model
for assessment of feasibility of such projects building scenarios and sensitivity charts
calculation of risk and returns associated with the project and valuation of ABC Limited
subjected to present and expected future market conditions
ABCrsquos vision is to provide world class managed infrastructure amp allied services to the
service providers to optimize their service delivery capability In the initial years of
operation the company will focus on telecom sector with almost 100 of its proposed
capital expenditure till FY 14 earmarked for developing and owning passive
infrastructure for sharing among mobile service providers
Passive Telecom Infrastructure Sharing
Mobile networks have base stations (or cell sites) which have active and passive
infrastructure components Active components include the antenna trans-receivers
switches feeder cables Node B and microwave radio equipments Passive (or non-electronic) components include the land tower shelter air-conditioning equipment
diesel electric generator battery electrical supply technical premises and easements
pylons etc Passive infrastructure in a mobile network essentially involves acquiring land
1 Actual name o f the company is no t stated as per the instructions given by external supervisor
882019 Major Project (Ramit)
httpslidepdfcomreaderfullmajor-project-ramit 1162
2
setting up towers and electrical and civil works that needs to be in place before operators
can install the active infrastructure which brings mobile services to the consumers In a
typical cell site build-out almost 65 of the total cost is attributed to passive
infrastructure and 35 to active infrastructure In this report passive cell siteinfrastructure has also been henceforth referred to as towers or sites
Mobile operators are required to setup more and more BTS (cell) sites due to the
exponential growth of mobile subscribers in India (currently growing at almost 152
million subscribers a month) and limited availability of spectrum B and C Circles (where
traffic density may not be as high as metros and Circle A) are expected to drive future
subscriber growth and requirements for cell sites will be higher to ensure greater
coverage
To cover large stretch of almost 65000 Kilometers of national highways additional
18000 towers (one tower for every 3 Kilometers of highway) will be required in near
future to ensure better connectivity Proposed build out of 3G networks are expected to
further drive substantial growth in the number of towers over the next few years
However creating new infrastructure by each operator separately leads to duplicating
huge capital investments It also contributes to mushroom growth of telecom towers and
deteriorating skylines in urban areas which has already led to some local municipal and
state governments to regulate and restrict the erection of new mobile towers
The continued pressure on cellular tariffs higher infrastructure costs for network
deployment particularly in semi-urban and rural areas and compelling need to reduce
time to market for network roll outs have led operators to share and even outsource theirinfrastructure requirements from third party infrastructure providers like ABC GTL and
Indus towers
2 As published in ET 8 th May 09 Edition
882019 Major Project (Ramit)
httpslidepdfcomreaderfullmajor-project-ramit 1262
3
Sharing promotes capital efficiency as it allows more than one service provider to
leverage and ride on common infrastructure In its simplest form it involves two or more
operators jointly using the common passive infrastructure in a cell site While viewed
largely as a measure to reduce CAPEX and operating expense such sharing also leads toimprovement of service quality (by ensuring site space for service providers and reducing
black spots) and the environment (by reducing number of cell sites and towers)
In outsourcing operators take passive infrastructure and tower space from third party
infrastructure companies on a monthly rental basis to host their radio and transmission
equipments Outsourcing provides significant benefits to operators It enables them to
save on capital expenditure (it actually converts CAPEX into OPEX in the form of lease
rentals) and focus on their core activities of sales marketing and branding while leavingthe cumbersome task of managing the site development process and site operation and
maintenance to third parties who exclusively deal with such activities
Active infrastructure sharing is not popular across the globe for several reasons the most
important being increased inter dependency among competing service providers
However tower sharing and outsourcing of tower ownership is an accepted practice in
many developed markets In countries like USA UK and Australia there are
independently owned tower companies who rent tower space to various mobile operators
The United States has arguably the most developed independent mobile tower market
with independent tower companies owning over half of all mobile towers in that country
Mobile tower owners generate revenue by owning the towers and leasing space on the
towers to mobile telecommunications operators under long-term contracts Under this
business model ownership of the base station equipments coupled to the towers is
retained by the mobile telecommunications operators In addition to rental payments
mobile tower owners generally receive a fee for installing customers base station
equipment on the tower Mobile tower owners also receive services revenue for
operations and maintenance of the passive infrastructure Regulators all over the world
favor passive sharing of infrastructure
882019 Major Project (Ramit)
httpslidepdfcomreaderfullmajor-project-ramit 1362
4
The concept of passive infrastructure sharing is increasingly gaining market acceptance
in India So far it has been largely limited to bilateral sharing between operators in the
form of barter where the operators split the site related CAPEX and OPEX costs The
available information suggests that about 25 of the existing 90000 tower sites in Indiaare currently being shared for passive infrastructure predominantly in rural areas and
small towns
ABC Limited is expecting to get shortlisted by Department of Telecom for setting up
passive cellular infrastructure in rural areas with support from the Universal Services
Obligations (USO) Fund The recent announcements by some operators like Bharti
Hutch (Vodafone) Reliance Idea for mutual sharing of infrastructure through new
companies and entry of third party infrastructure providers has further expanded the
tower market in India
Results of detailed financial model indicate that with given expansion plans and
assumptions ABC will create value for its shareholders investors clients and promoters
The project is expected to generate high cash flows which will be sufficient enough to
pay back its debt liabilities and to generate and equity IRR of 36
882019 Major Project (Ramit)
httpslidepdfcomreaderfullmajor-project-ramit 1462
5
2 OBJECTIVES
The scope of work for this Study project involves the following
Market assessment for Indian telecom Infrastructure sector
Collection of data related to capital and operating costs (from promoter)
Forecasting operating costs
Preparation of detailed financial model
Calculation of UFCF ( Unlevered Free Cash Flows) LFCF (Levered Free Cash
Flows)
Estimation of Project and Equity IRRrsquos
Preparation of balance sheet PampL and cash flow statement for expected life
cycle of project
Sensitivity analysis and Scenario analysis
882019 Major Project (Ramit)
httpslidepdfcomreaderfullmajor-project-ramit 1562
6
3 LITERATURE REVIEW
31 International Experience in Infrastructure Sharing
Different countries have adopted different approaches in order to safeguard the level of
competitive independence between co-operating operators Measures include mandating
a distinct and differentiated cost base between operators the development of different
business plans marketing and distribution strategies and the independent development or
acquisition of content and services Requiring the independent control over the respective
frequency resources of each operator is also an important competitive safeguard
In the EU for example operators are allowed to share infrastructure as long as they
maintain full operational control of their network Sharing the radio access network is
permitted but sharing frequencies and the core network is not In particular the databases
used to administer subscriber and interconnection information are required to be kept
separate Exemptions however are generally granted in special cases which advance the
objectives of government policy and the economic benefits to the consumers of the
services It is important to note that any infrastructure sharing agreement could also be
subject to review by the EC Commission under Article 81 of the EC Treaty andor the EC
Merger Regulation
USA
In USA the number of wireless service subscribers has increased from 1284 million to
2433 million between December 2001 and December 2007 representing an increase of
approximately 88 and market penetration of approximately 70 The tower business in
USA is a $5 billion industry consolidated around four large players -- American Tower
(ATC) Crown Castle International (CCI ) SBA Communications (SBAC ) and GlobalSignal (GSL ) which control 40 of the approximately 210000 (P amp Lisa 2009) towers
across the US The primary business of these companies involves leasing antenna space
on multi-tenant communications sites to a variety of wireless carriers including radio and
3 Source CTIA-The Wireless Association Website
882019 Major Project (Ramit)
httpslidepdfcomreaderfullmajor-project-ramit 1662
7
television broadcast companies under long-term lease contracts Typically these leases
are long-term (five to 10 year) contracts with renewal terms at the option of the customer
Some co mpanies offer tower related services on a limited basis including site acquisition
zoning and permitting services and structural analysis services and project managementof antenna installations that support their site leasing operations and the addition of new
tenants and equipment on their sites
Towers are a relatively scarce asset in USA as zoning laws often do not permit a new
tower to be built in the immediate vicinity of an existing tower Tenant churn tends to be
low as towers are an integral part of the networks of the wireless service providers
Tenants own their own equipment (and therefore bear the technology risk) generally
handle installation and maintenance and pay for electricity and most ongoing assets
greatly simplifying the tower business model
Germany
In Germany the main concern faced by the regulator involved a possible threat to the
competitive independence of potential 3G operators that could result from a tight
integration of the networks as a result of infrastructure sharing Infrastructure Sharing is
allowed only if the mobile systems can be independently operated for example if they
can be shut down or maintained independently by software and that no customer data is
shared (OECD report 2004) In Germany the sharing of antennae and sites is relatively
common however the sharing of transmission management equipment and core
networks is not commonly done (Vogelsang 2002)
Sweden
In Sweden the regulator has agreed to allow significant infrastructure sharing for 3G
operators Each operator only has to cover 30 of the customers while for the remaining
70 infrastructure can be shared This is the approach being taken by the Europolitan
companies Vodafone Hi3G and Orange which jointly own 3G Infrastructure Services
However with competition concerns the regulator only allows radio components such as
antennas cables and base station electronics to be shared (Khurram Mahmood 2008)
882019 Major Project (Ramit)
httpslidepdfcomreaderfullmajor-project-ramit 1762
8
Singapore
In the case of Singapore the regulatorrsquos infrastructure sharing approach is guided by the
primary policy goal of encouraging facilities-based competition Under the current
regulatory framework licensees are generally not required to share any infrastructure that
it controls with its competitors Each licensee is expected to build or lease the use of the
infrastructure it requires Notwithstanding this however infrastructure sharing is
mandated in areas where there are clear space and operating constraints For 2G and 3G
licensees such matters relate to infrastructure in the Mass Rapid Transit and underground
road tunnels The regulator has also allowed the co-location of base stations and sharing
of transmission towers and masts to reduce the impact on the environment and to
minimize the inconvenience to building owners and residents (IDA 2009)
Malaysia
Taking a different approach in Malaysia operators owning network facilities have been
encouraged by the regulator to share infrastructure as a means of lowering costs and
expanding coverage as well as to avoid a duplication of resources To this effect a
Memorandum of Understanding to share infrastructure has been executed between the
mobile operators To further catalyze infrastructure sharing the concept of a third party
provider of facilities is also being promoted in Malaysia Under this concept of a third
party will build the infrastructure and lease capacity or space to existing se rvice
providers This concept not only provides ready-made sites but will also help reduce the
numbers of telecommunication towers that have to be dealt with by local authorities
(MAXIS 2009)
882019 Major Project (Ramit)
httpslidepdfcomreaderfullmajor-project-ramit 1862
9
32 Domestic Telecom Market assessment
The Indian Telecom Industry-Historical perspective
The Indian telecommunication industry was originally a government controlled
monopoly comprising three state owned operators
MTNL (which provided wire-line services in Mumbai and Delhi metropolitan
areas)
DOT (which provided wire-line services to rest of the country)
VSNL (which provided international services)
Liberalization started in 1991 with opening up of mobile services to private sectorparticipation The country was divided into 23 circles comprising of four metropol9otan
areas (Chennai Delhi Kolkata and Mumbai) and 19 other circles broadly defined by
parameters of states (K 2008) These 19 non-metropolitan circles have been categorized
as A B and C circles in descending order of their revenue generation potential (as
shown below)
Table 31 Telecom Circles
MetropolitanAreas Circle A Circle B Circle C
Delhi ChennaiMumbai Kolkata
Gujarat KarnatakaAP Tamil NaduMaharashtra
Punjab Kera laHaryana UP (West)Rajasthan UP(East) MP WestBengal
HP JampK North-East OrissaAssam Bihar
In 1997 TRAI was formed for regulating the operations and policy making process of
Indian telecommunication sector Since its liberalization India has experienced sustained
and impressive growth in its telecommunication sector primarily because of progressive
regulatory regime strong demand for mobile telecommunication services and
strengthening economy The country has achieved distinction of having worldrsquos lowest
tariff fastest growth ion subscriber base and availability of some of the cheapest mobile
handsets
882019 Major Project (Ramit)
httpslidepdfcomreaderfullmajor-project-ramit 1962
10
Figure 3-1 Growth of Subscriber base
Growth of Subscriber base
050
100150200250300350
1998 1999 2000 2001 2002 2003 2004 2005 2006 2007 2008
Year
M i l l i o n
Source Telecom Regulatory Authority of India Database
India is the second largest mobile market in the world is also among the fastest growing
mobile markets globally The total number of mobile subscribers in India (ie the
subscriber base) has crossed 300 million with 30049 million subscribers as on 31st
March 2008 The growth of subscriber base during the past decade (1998-2008) is
indicated above in a chart
Figure 3-2 Mobile Penetration Rate
0 10 20 30 40 50 60 70 80 90 100
North-East ( C)Assam (C)
Bihar ( C)Jammu amp Kashmir (C)
Orissa (C)Him achal Pradesh (C)
Uttar Pradesh ( B)Madhya Pradesh (B)
Rajastan (B)Haryana (B)
Punjab (B)West Bengal (B)
Kerala (B)Maharashtra (A)
Gujarat (A)Tamil Nadu (A)
Andhra Pradesh (A)Karnataka (A)
Kolkata (Metro)Chennai (Metro)Mumbai (Metro)
Delhi (Metro)
Source TRAI and PwC DatabaseNote As on Dec 08
882019 Major Project (Ramit)
httpslidepdfcomreaderfullmajor-project-ramit 2062
11
Indian telecom industry has experienced a high growth rate in Metros and class A circles
with coverage reaching around 90 and 35 respectively However coverage in the
Class B and Class C cities is still low at 15-25 Growth in Class B and Class C circles
has concentrated in urban area while penetration in rural area remains lower Thus futuregrowth is likely to come largely from Class B and C circles and rural areas Keeping this
in view larger players like Bharti Airtel Limited Reliance Communications Limited and
Bharat Sanchar Nigam Limited (BSNL) are largely focusing on increasing their
geographical coverage in Class B and C c ircles
33 Telecom Market- Competitive landscape
Figure 3-3 Market Share
Bharti2668
BSNLMTNL1908
Reliance1971
Vodafone661
Tata1047
Idea1033
Aircel457
Spice181
BPL056
HFCL013
Shyam005
Market Share
Source TRAI and Pw C Database
Indian mobile sector is largely concentrated with top 4 market players (Bharti Airtel
Reliance Communication Vodafone Essar and BSNL) out of 10 capturing almost three-
fourth of the entire market This is also partly on account of the fact that these four
operators have their presence in a larger number of circles as compared with other
players
882019 Major Project (Ramit)
httpslidepdfcomreaderfullmajor-project-ramit 2162
12
Figure 3-4 Lice nsed Circles
0
5
10
15
20
25
Licensed Circles (Dec 07) New Circles (Sep 08)
Source TRAI and CRISIL Database
The competition in Indian telecom sector is expected to intensify in near future because
recently new licenses have been granted to some of the existing operators for new circles
and also to new entrants like Unitech Datacom Swan Telecom and Stel These new
players are expected to capture the rural and semi-urban cities of C ircle B and Circle C as
they are now expected to grow at a much faster rate Shorter network rollout time and
competitiveness in the industry will force these entrants to start the ir operation as early as
possible Tower companies like ABC will allow incumbents to start operations in a
particular region just by installing their electronics on the ready-to-use towers thereby
significantly shortening the ro llout time
Moreover a rapidly increasing subscriber base and spectrum crunch would force the
existing telecom operators to maintain the minimum level of QoS Thus to retain existing
subscribers by preventing subscriber churn operators will require additional
infrastructure in their existing areas of operation to be able to offer better QoS This will
also result in increase in demand for telecom infrastructure in the existing markets
(Ramachanran 2009)
882019 Major Project (Ramit)
httpslidepdfcomreaderfullmajor-project-ramit 2262
13
34 Telecom Infrastructure Overview
Passive infrastructure is one of the most important components of a mobile network It
has been a critical area of operations for telecom companies in the past However with
increasing competition posing an urgent need for telecom companies to expand their
coverage and sharpen their focus on core operations so that they can sustain and improve
their market position passive infrastructure has assumed the status of an independent
industry during the past few years The industry (COAI) estimates that there will be a
requirement of around 350000 towers for 500 million subscribers by 2010 (COAI
2009)
Each site has active and passive infrastructure components Active components includethe antenna trans-receivers switches feeder cables Node B and microwave radio
equipments Passive (or non-electronic) components include the land tower shelter air-
conditioning equipment diesel electric generator battery electrical supply technical
premises and easements pylons etc Passive infrastructure in a mobile network
essentially involves acquiring land setting up towers and electrical and civil works that
needs to be in place before operators can install the active infrastructure which brings
mobile services to the consumers In a typical cell site build-out almost 65 of the total
cost is attributed to passive infrastructure and 35 to active infrastructure
(Ramachanran 2009)In this report passive cell site infrastructure has also been
henceforth referred to as towers or sites
The components of a typical base station are shown below
882019 Major Project (Ramit)
httpslidepdfcomreaderfullmajor-project-ramit 2362
14
Picture 3 1 Telecom Tower
Telecom towers are broadly classified on the basis of their placement as Ground-basedand Roof-top
1 Ground-Based Tower Ground-based towers (GBTs) are taller (typically 200 to 400
feet) and are mostly used in rural and semi-urban areas because of the easy
availability of real-estate space there GBTs involve a capital expenditure in the range
882019 Major Project (Ramit)
httpslidepdfcomreaderfullmajor-project-ramit 2462
15
of Rs 3 to 4 million depending on the height of the tower land prices etc
(Ramachanran 2009)
2 Roof-Top Tower (RTT) Roof-top towers (RTTs) are generally placed on the roofsof high-rise buildings They are shorter (than GBTs) and more common in urban and
highly populated areas where there is paucity of real-estate space Typically these
involve a capital expenditure of Rs 15 to 2 million (Ramachanran 2009)
The height of a telecom tower determines the number of antennas that can be
accommodated which in turn determines the capacity of the towers apart from factors
such as location and geographica l conditions (wind speeds type of terrain etc)
35 Telecom Infrastructure- Domestic market
In India there are broadly two kinds of operators in the tower infrastructure industry
Tower infrastructure subsidiaries
Reliance Infratel Limited
Bharti Infratel Limited
Indus Towers Limited
Wireless TT Info Services Limited (WTTIL)
Independent tower infrastructure companies (ITICs)
GTL Infrastructure
Xcel Telecom
Essar Telecom Infrastructure
Aster Infrastructure
Bharat Telemast
882019 Major Project (Ramit)
httpslidepdfcomreaderfullmajor-project-ramit 2562
16
These companies have their business model based largely on contract or anticipatory
approaches Under the contract approach tower companies set up tower sites going by
the requirements of the telecom operators and the terms of the contract are specified
beforehand in the MSAs signed by the two parties Under the anticipatory approachhowever tower companies set up tower infrastructure at sites with reasonable demand
potential and subsequently invite telecom operators to set up their network on these
towers The latter model involves higher business risks as the tower company may not be
able to achieve reasonable tenancy for its tower infrastructure and at profitable terms
BPTL proposes to follow contract approach for its business model
36 Telecom Infrastructure market- Competitive landscape
Figure 3-5 Telecom Infrastructure Market Players
038058154
365692
10381692
26923269
0 20000 40000 60000 80000 100000
Aster InfrastructureAmerican Towers
Essar Telec om Infrastructure
GTL In frastructureWi reles s TT In fo Services Limited
Bharti Infratel Limited
Reli anc e Communications Limitedrsquos
OthersInd us To wers Limited
Number of Towers
Market Players
Source Telecom Regulatory Authority of India and ICRANote Others include tower por tfolios of BSNL MTNL Sistema Shyam Teleservices Aircel etc
In Indian Telecom Infrastructure market competition has intensified significantly with
several players spinning of their tower portfolio and independent operators expanding
their operations
882019 Major Project (Ramit)
httpslidepdfcomreaderfullmajor-project-ramit 2662
17
Bharti Airtel Limited Reliance Communications Limited and Tata Teleservices Limited
have hived off their tower assets into separate tower infrastructure subsidiaries namely
Bharti Infratel Limited Reliance Infratel Limited and Wireless TT Infoservices Limited
respectively Also Bharti Infratel Limited together with Vodafone Essar Limited and IdeaCellular Limited in a joint- venture agreement has created Indiarsquos largest tower
infrastructure company ndash Indus Towers Limited which has an estimated portfolio of
around 88000 towers (Anjan V amp N 2009) Whereas in past few years number of
independent tower infrastructure companies have ventured into the domestic telecom
tower industry These include GTL Infrastructure Limited Essar Telecom Infrastructure
Limited Xcel Telecom Private Limited (American Towers) Tower Vision India Private
Limited Aster Infrastructure Private Limited TVS Interconnect Systems Limited etc
Figure 3-6 Telecom Tower Growth Scenario
0
100
200
300
400
500
600
700
2008 2009 2010 2011 2012 T e
l e c o m
T o w e r s
( T h o u s a n
d s )
Source Telecom Regulatory Authority of IndiaAssumptions Subscriber growth rate of 28 till 2011-12
1400 subscribe per site
As shown above it is expected that in next 4-5 years there will be a requirement of
additional 85000 towers (both GBT and RTT) each year to meet the subscriber base of
800 million by 2011-12 (PwC 2009) This shows that huge investment have to be made
in Indian telecom Infrastructure sector in near future Now since both passive and active
882019 Major Project (Ramit)
httpslidepdfcomreaderfullmajor-project-ramit 2762
18
infrastructure sharing is a llowed (except spectrum) Independent service providers will be
benefited Increase in subscriber base introduction of new technologies like 3G Wi-max
etc and increase in market healthy market competition in telecom services sector will
drive the growth in telecom infrastructure sector
882019 Major Project (Ramit)
httpslidepdfcomreaderfullmajor-project-ramit 2862
19
4 BUSINESS PLAN
41 Passive Infrastructure
Mobile networks have base stations (or cell sites) which have active and passive
infrastructure components Active components include the antenna trans-receivers
switches feeder cables Node B and microwave radio equipments Passive (or non-
electronic) components include the land tower shelter air-conditioning equipment
diesel electric generator battery electrical supply technical premises and easements
pylons etc Passive infrastructure in a mobile network essentially involves acquiring land
setting up towers and electrical and civil works that needs to be in place before operators
can install the active infrastructure which brings mobile services to the consumers In atypical cell site build-out almost 65 of the total cost is attributed to passive
infrastructure and 35 to active infrastructure
42 Infrastructure Sharing
Mobile operators are required to setup more and more BTS (cell) sites due to the
exponential growth of mobile subscribers in India (currently growing at almost 15 4
million subscribers a month) and limited availability of spectrum B and C Circles (wheretraffic density may not be as high as metros and Circle A) are expected to drive future
subscriber growth and requirements for cell sites will be higher to ensure greater
coverage
However creating new infrastructure by each operator separately leads to d uplicat ing
huge capital investments It also contributes to mushroom growth of telecom towers and
deteriorating skylines in urban areas which has already led to some local municipal and
state governments to regulate and restrict the erection of new mobile towers
The continued pressure on cellular tariffs higher infrastructure costs for network
deployment particularly in semi-urban and rural areas and compelling need to reduce
4 As published in ET 8 th May 09 Edition
882019 Major Project (Ramit)
httpslidepdfcomreaderfullmajor-project-ramit 2962
20
time to market for network roll outs have led operators to share and even outsource their
infrastructure requirements from third party infrastructure providers like BPTL GTL and
Indus towers It promotes capital efficiency as it allows more than one service provider to
leverage and ride o n common infrastructure In its simplest form it involves two or moreoperators jointly using the common passive infrastructure in a cell site While viewed
largely as a measure to reduce capital and operating expense such sharing also leads to
improvement of service q uality (by ensuring site space for service providers and reducing
black spots) and the environment (by reducing number of cell sites and towers)
In outsourcing operators take passive infrastructure and tower space from third party
infrastructure companies on a monthly rental basis to host their radio and transmission
equipments Outsourcing provides significant benefits to operators It enables them tosave on capital expenses (it actually converts capital expense into operating expense in
the form of lease rentals) and focus on their core activities of sales marketing and
branding while leaving the cumbersome task of managing the site development process
and site operation and maintenance to third parties who exclusively deal with such
activities
The concept of passive infrastructure sharing is increasingly gaining market acceptancein India So far it has been largely limited to bilateral sharing between operators in the
form of barter where the operators split the site related CAPEX and OPEX costs The
available information suggests that about 25 of the existing 90000 tower sites in India
are currently being shared for passive infrastructure predominantly in rural areas and
small towns
43 Introduction to the business
BPTL is an Infrastructure Provider company that builds owns operates and maintains
passive network infrastructure on a shared basis for mobile telecom operators and ITES
providers Its objective is to provide network design and planning network deployment
882019 Major Project (Ramit)
httpslidepdfcomreaderfullmajor-project-ramit 3062
21
network operations amp maintenance infrastructure management application management
and professional services to teleco m operators and enterprises
The company is planning to raise capital in the form of equity and debt to start its
operation by Aug 09 ABC rsquos vision is to provide world class managed infrastructure ampallied services to the service providers to optimize their service delivery capability In the
initial years of operation the company will focus on telecom sector with almost 100 of
its proposed capital expenditure till FY 14 earmarked for developing and owning passive
infrastructure for sharing among mobile service providers
44 Business Proposal
ABC will provide passive telecom infrastructure on build own operate (BOO) basis inboth ground based (GBS) as well as roof-top sites (RTS) It will undertake full range of
responsibilities in building owning and maintaining the sites and will serve as a single
window one-stop-shop provider of infrastructure services Typical responsibilities are
summarized below
Site planning keeping in view the network rollout plans of prospective customers
Site acquisition including entering into long-term agreements with land owners
Obtaining of necessary regulatory approvals
Erect ion and commissioning of tower and allied equipment
Provision of support services such as back-up power air-conditioning and
security
Provision of turnkey solutions to telecom companies such as sourcing of
equipment testing and maintenance
882019 Major Project (Ramit)
httpslidepdfcomreaderfullmajor-project-ramit 3162
22
Bharat Telemast Private Limited will identify the sites required for setting up the Passive
infrastructure by first of all getting a commitment from one operator who is called as
ldquoAnchor Operatorrdquo Then Bharat Telemast will go ahead to lease (or) buy out the site as
appropriate and commences construction of the cellular sites But the Cellular site will betypically designed for three to four operators While construction is in progress the
marketing team will work towards getting the second and third operator But care will be
taken in such a way that at least two operators are available at the time of completion of
construction
45 Sources of revenue
1 Infrastructure Provisioning Fees ndash fee paid by the operators on a monthly basisWith annual escalation
2 Site lease rental ndash Paid at actual on a monthly basis
3 Operations and maintenance charges Paid on a monthly basis
4 The contract also provides a fixed annual escalator
46 Attractiveness of business model
Stable and predictable cash flow business Once a tower asset is rented out it
usually generates a stable and predictable cash flow in the form of tower rentals
from occupants over the term of the MSA between the two parties
Low working capital requirement ABC rsquos business model is also characterized
by low working capital requirements as most of the operating expenses (such aselectricity and fuel and other variable operating expenses) are reimbursable by the
tenants on actual basis Moreover BPTL is may also be able to get rentals for the
towers in advance and also obtain better credit terms from their suppliers thus
further improving their working capital cycle
882019 Major Project (Ramit)
httpslidepdfcomreaderfullmajor-project-ramit 3262
23
High incremental profitability The operating costs associated with this
business are largely fixed in nature Thus each increment in tenancy is
accompanied by a minimal increase in costs This leads to a more thanproportionate increase in profits for every increase in occupancy
Reduction in capital investments due to present market conditions Due to
present market situation average capital requirement for RTT and GBT sites have
dropped from 2 million and 4 million to 15 million and 33 million ABC wishes
to grab this opportunity which will result in competitive advantage in near future
Extensive usage While on an average a GSM BTS can handle around 100-
1100 subscribers but in the case of high usage areas the figure can be as low as
600-700 subscribers which means a larger number of cell sites would be required
for the same area Moreover the country has the problem of spectrum scarcity
which increases the requirement of towers to maintain a reasonable leve l of
service quality
New entrants Many operators including Vodafone Essar Limited Idea Cellular
Limited Aircel Cellular Limited and Sistema Shyam Teleservices Limited have
received licenses as well spectrum in new circles which would enable them to
become pan-India operators in the next one-two years Also new licenses have
been issued to new players such as Unitech Swan Telecom and S Tel Limited
Given the significant expansion plans of new entrants over the medium term and
the need for them to optimize investments in order to maintain returns demand
for towers is expected to report a sharp increase
Shorter rollout time Indian telecom industry is highly competitive and doing
business for new entrant may not be easy Shorter network-rollout time would be
a critical success factor for the new entrants and a longer rollout time could meanloss of substantial market share to other operators Tower companies allow
players to start operations in a particular region just by installing their electronics
on the ready-to-use towers thereby significantly shortening the rollout time
New technologies 3G services are already launched in the country and to
augment their services various operators plan to launch Wi-Max services as soon
882019 Major Project (Ramit)
httpslidepdfcomreaderfullmajor-project-ramit 3362
24
as they receive additional spectrum from Government This would further
increase the demand for sharing of passive infrastructure
47
Expansion Schedule
BPTL would rollout both RTT and GBT sites of which the RTT sites GBT sites
normally would have a tower height of 50 meters or 60 meters depending on the need for
additional height for installation of microwave antennae based on the location of the site
and number of tenants on the cell site Details of BPTLrsquos expansion plan are summarized
below
Table 41 Expansion PlanExpansion Schedule 2009-10 2010-11 2011-12 2012-13 20013-14
GBT
Addition 210 700 1400 2450 3850
Total 210 910 2310 4760 8610
RTT
Addition 90 300 600 1050 1650
Total 90 390 990 2040 3690
48 Proposed Services
As indicated earlier ABC proposes to provide passive telecom infrastructure on a
sharing co-location basis to cellular operators The sites would either be Ground Based
Sites (GBS) or Roof Top Sites (RTS) As the sites are meant for co-location of the active
components of two to three operators they would be built to either 2-Tenant or 3-Tenant
specifications
The different components of the passive infrastructure facility and the related services
that would be offered by BPTL to the operators are as under
Infrastructure provisioning comprising
882019 Major Project (Ramit)
httpslidepdfcomreaderfullmajor-project-ramit 3462
25
Communication tower built to host multiple antennae
Weather-proof communication shelter with air-conditioning and power backup
arrangement
Diesel generating set and battery bank for power backup
A mobile standby generator to act as backup in case o f breakdown
Warehousing facility
Infrastructure operations and maintenance including
Regular operations and maintenance of the facility
Security of all the equipments at the site at all timesA dedicated team of technicians for a group of 40-50 sites to ensure effect ive and
efficient functioning of the components at all times
49 Proposed Organizational Structure
A senior management team will work under the leadership of the ldquoChief Operations
Officerrdquo who will be responsible for smooth implementation of proj ect activities He willalso assist the managing director in marketing This team will coordinate with Stallion
Telecom Pvt Ltd which will take over the role of procuring Capital Equipments
Senior management will consists of project manager infrastructure manager commercial
manager and head (legal and company affairs Apart from this there will be a requirement
Chief OperatingOfficer
Project Manager Infrastructure
Manager
Commercial
Manager (projects)
Head (Legal and
Company Affairs)
882019 Major Project (Ramit)
httpslidepdfcomreaderfullmajor-project-ramit 3562
26
of security sentries (3 per GBT site) supervisors (one for every 10 sites) and cluster
manager (one for every 50 sites)
Bharat Telemast will carry out the complete Project execution with the assistance of third party ldquoQuality control organizationrdquo and a third party ldquoProject management teamrdquo
Quality control and project management activities will be o utsourced to a third party
882019 Major Project (Ramit)
httpslidepdfcomreaderfullmajor-project-ramit 3662
27
5 METHODOLOGY
The changing face of infrastructure services creates a complex situation which demands
greater understanding of roles of competition regulatory structures and modes of
financing Knowledge of such things is a key decisive factor in building confidence
among investors promoters and government In project finance the project its assets
contract and cash flows are separated from promoter in order to permit credit appraisal
or loan to the project
As part of the financial feasibility analysis a series of related financial statements based
on projected sources and uses of funds during the development and operating phaseproject were created Financial statements consist of expenses associated with
development activities including capital costs like acquisition of land for GBT sites cost
of tower generator shelter batteries etc Most of the data regarding capital costs are
obtained from the promoter of ABC Limited All these capital costs related details are
provided in annexure 1
Assumption regarding depreciation capital structure operating expenses expansion
schedule tenancy ratios tariff or rent operatorrsquos fees and loan amortization schedule are
obtained from professional accountants Promoter and bankers of ABC Limited
Due to unknown factors that could influence the cost of towers or fees associated with
completing the project (soft costs) contingency costs were estimated at 5 of hard and
soft costs respectively If contingency is set too low developers could easily encounter
funding shortfalls upon slight changes in market forces All other costs were estimated
based on talking with industry professionals (Promoters)
A detailed financial model was prepared based on existing accounting standards and
following financial ratios were estimated
882019 Major Project (Ramit)
httpslidepdfcomreaderfullmajor-project-ramit 3762
28
EBITDA margin Profit and loss accounts for the estimated project period (15
Years) were prepared based on which estimated earnings before interests tax
depreciat ion and amortization were calculated for each year Detailed PampL
balance sheet and cash flow statements are provided in annexure 2 3 and 4
EBITDA = Total Revenue ndash (Variable expenses + Fixed Expenses)
EBITDA margin = EBITDA Total Revenue
PAT margin PAT is calculated by subtracting interests pa id on capital debt and
working capital debt depreciation and applicable corporate income tax from
EBITDA
PAT = EBITDA ndash Interest Payable ndash Depreciation ndash Income tax
PAT margin = PATTotal Revenue
Working Capital Working capital requirement is calculated by subtract ing
current liabilities from current assets Current assets are estimated based on 30
days cash requirement and current liabilities are estimated as half of salary
monthly expenses
WC = Current Assets ndash Current Liabilities
UFCF It is defined as the free cash flows available to the firm if the firm has
zero debt liability Purpose of ca lculat ing UFCF for project period is to determinethe project IRR
UFCF = PAT + Depreciation + Interest (tax adjusted) + Release of WC + Salvage
value of the assets ndash CAPEX ndash Change in WC
882019 Major Project (Ramit)
httpslidepdfcomreaderfullmajor-project-ramit 3862
29
LCFF It is defined as the cash floes available to the firm after paying interests on
long term and short term debts
LCFF = UFCF ndash Interest (tax adjusted)
FCFE It is defined as the free cash flow available to equity holders It is
determined to ca lculate equity IRR for equity investors It also includes the tax
benefits which are available as per the Income Tax Act
FCFE PAT + Depreciation + Salvage Value ndash Equity Investment ndash Long term debt
repayment
PIRR Project IRR is defined as the discount rate at which NPV (Net Present
Value) of UFCF is zero It is calculated by using following formula
UFCF 1 (1+PIRR) 0+ UFCF 2 (1+PIRR) 1+ UFCF 3 (1+PIRR) 2+ helliphelliphelliphelliphelliphellip = 0
UFCF 1 = UFCF at the end of first year of operation
UFCF 2 = UFCF at the end of second year of operation
PIRR = Project IRR
EIRR Equity IRR is defined as the discount rate at which NPV of FCFE is zero
It is calculated by using following formula
FCFE1 (1+EIRR) 0+ FCFE 2 (1+EIRR) 1+ FCFE 3 (1+EIRR) 2+ helliphelliphelliphelliphelliphellip = 0
FCFE1 = FCFE at the end of first year of operation
FCFE2 = FCFE at the end of seco nd year of operation
EIRR = Equity IRR
882019 Major Project (Ramit)
httpslidepdfcomreaderfullmajor-project-ramit 3962
30
WACC It is de fined as the percentage of return expected by the investors who
otherwise would have earned some return by investing in some other project
WACC = Cost of Debt (Debt Capital) + Cost of equity (Equity Capital)
882019 Major Project (Ramit)
httpslidepdfcomreaderfullmajor-project-ramit 4062
882019 Major Project (Ramit)
httpslidepdfcomreaderfullmajor-project-ramit 4162
32
62 Funding planAs the telecom sites are rolled out over a 5 year period till FY 2014 investment will be
required for each year ABC Limited will start generating profits from FY 10 only Such
internally generated cash accruals will be ploughed back into the business to meet part of
the project cost Investment required for each year is tabulated below
Table 61 Funding ProposalMillion INR FY 10 FY 11 FY 12 FY 13 FY 14
GBT Tower (Additional) Nos 210 700 1400 2450 3850
RTT Tower (Additional) Nos 90 300 600 1050 1650DE ratio 233 233 233 233 233
Additional CAPEX 83892 279374 558748 977809 1536557
Debt 58725 195562 391124 684466 1075590
Equity 25168 83812 167624 293343 460967
63 Results
Based on assumptions given in Annexure 1 a detailed financial model was preparedResults of the financial model such as PampL account Balance Sheet and cash flow
statements are provided in Annexure 2 3 and 4 Forecasts for the key financial figures for
first five years are provided in the Table below
Forecasts
Table 62 Income StatementMillion INR FY-10 FY11 FY12 FY-13 FY-14
Sales 7124 50511 156766 347476 667700
Cost of sales 1950 13852 39252 87612 170021
Gross 5174 36659 117514 259864 497679
7263 7258 7496 7479 7454
Admin costs 112 179 190 203 216
882019 Major Project (Ramit)
httpslidepdfcomreaderfullmajor-project-ramit 4262
33
Finance cost 0 021 7401 31330 77725
Taxation 170 4233 14536 29073 53547
PAT 2454 19458 59470 122096 223267
As shown in Table above during the expansion period revenue will grow exponentially
In the first year of operation ABC will earn a revenue of INR 7124 million from 300
(210 GBT and 90 RTT) sites with a tenancy ratio of 15 for GBS and 17 for RTS In the
first 2 years of operation the company will not pay any interest on long term debt due to
2 years moratorium period Major cost associated with the project is depreciation due to
which PAT is lower than the operating profits But cash flows to the firm are enough to
result in reasonable returns
Table 63 Balance Shee tYear ending Mar-10 Mar-11 Mar-12 Mar-13 Mar-14
AssetsGross Block 75742 328216 833164 1716823 3105430Accumulated depreciation 2439 15208 51125 128287 271212Net Block 73303 313009 782040 1588536 2834219Net Working Capital 064 241 620 1335 2515Cash Balance 12979 72089 216513 488856 947982
Total Assets 86346 385339 999172 2078727 3784715LiabilitiesEquity 25168 108980 276604 569947 1030914Reserves amp Surplus 2454 21912 81381 203477 426745Long term Debt 58725 254286 640722 1304302 2325171WC Borrowings - 161 465 1001 1886Total Liabilities 86346 385339 999172 2078727 3784715
Note All figures are in Million INR
Table 64 Key financial ratiosMar-11 Mar-12 Mar-13 Mar-14 Mar-15
Revenue Growth 60902 21036 12165 9216 3890EBITDA Growth 62061 22161 12132 9158 4020
PAT Growth 69293 20564 10531 8286 2955
As shown in table above increase in EBITDA is higher than that of revenue This is due
to better operational efficiency of ABCrsquos management and economies of scale S imilarly
882019 Major Project (Ramit)
httpslidepdfcomreaderfullmajor-project-ramit 4362
34
increase in PAT is lesser than that of EBITDA because of high depreciation and interest
expenses
Table 65 Pr ofitability r atios
Mar-11 Mar-12 Mar-13 Mar-14 Mar-15
EBITDA Margin 7222 7484 7473 7450 7520
PAT Margin 3852 3794 3514 3344 3119Return on Net Worth 622 760 769 788 1087
Key profitability ratios are shown in table above Return on net worth in the initial years
is lower because of the ambitious expansion plans of ABC Limited Thereafter return on
net worth increases with increase in PAT
Returns on Investment
Table 66 Financial returnsFinancial Indicators
Project IRR 1813Equity IRR 3609
64 Sensitivity Analysis
A sensitivity analysis has been carried out on the project financials to determine theimpact of key variables on the financial indicators namely
Project IRR
The key variables on which sensitivity analysis have been carried out areCapital expenditure for GBS and RTS1st and 2 nd tenant tariff for GBS1st and 2 nd tenant tariff for RTSTenancy Ratio
Similarly sensitivity analysis has been carried out forEquity IRR
The key variables on which sensitivity analysis have been carried out for EIRR are
Capital structure and interest rate for capital debtRepayment period and moratorium period
882019 Major Project (Ramit)
httpslidepdfcomreaderfullmajor-project-ramit 4462
35
The impact on the financial indicators is shown below
Figure 6-1 Project IRR vs GBT and RTT CAPEX
As shown in Figure 6-1 project IRR is more sensitive to change in CAPEX of RTT sitesas compared to change in CAPEX of GBT sites because tenancy ratio and tariff for RTTsites are higher than those of GBT sites
882019 Major Project (Ramit)
httpslidepdfcomreaderfullmajor-project-ramit 4562
36
Figure 6-2 Project IRR vs GBT Tariff for 1 st tenant (X-axis) and 2 nd tenant (right-hand side)
As shown in Figure 6-2 project IRR varies linearly with GBT tariff In the best casescenario when GBT tariff for 1 st tenant is INR 34000month and GBT tariff for secondtenant is INR 26000month Project IRR is 2101
Figure 6-3 Project IRR vs RTT Tariff for 1 st tenant (X-axis) and 2 nd tenant (right-hand side)
As shown in Figure 6-2 project IRR varies linearly with RTT tariff In the best casescenario when RTT tariff for 1 st tenant is INR 24000month and RTT tariff for second
882019 Major Project (Ramit)
httpslidepdfcomreaderfullmajor-project-ramit 4662
37
tenant is INR 20000month Project IRR is 1932 Project IRR is more sensitivetowards RTT tariff than GBT tariff because in practical business situation RTT siteshave a tenancy ratio of more than two due to which effect of tariff for 1 st tenant almostget nullified after few years
Figure 6-4 Project IRR vs Tenancy ratio for RTT sites (X-axis) and GBT sites
As shown in Figure 6-4 project IRR is very sensitive to tenancy ratio In the best casescenario where GBT sites have a tenancy ratio of 2 and RTT sites have a tenancy ratio of 3 project IRR can be as high as 20
Figure 6-5 Equity IRR vs long term debt interest rate for different leverage level
882019 Major Project (Ramit)
httpslidepdfcomreaderfullmajor-project-ramit 4762
38
As shown in figure 6-5 equity IRR is more sensitive to interest rate on long term debt forhigh level of leverage (lower debt equity ratio) because as the debt equity ratio increasesinterest paid on long term debt also increases significantly
Figure 6-6 Equity IRR vs long term debt repayment period at different level of moratoriumperiods
As shown in figure 6-6 Equity IRR increases with increase in moratorium period anddebt repayment period The variation is from 1654 to 60 for worst case and best casescenarios
882019 Major Project (Ramit)
httpslidepdfcomreaderfullmajor-project-ramit 4862
39
7 RISK ASSESSMENTRisk Mitigation strategyExecution Risk
(Project management landacquisition etc)
Management of ABC has proven expertise in
telecom infrastructure rollout and has executedvarious projects with large telecom operators andMNC vendorsABCrsquos top management team consists of a groupof professionals drawn from leading telecomInfrastructure Company who have immenseexpertise and experience in rolling out telecominfrastructure projects
Market Risk (No entry barriers operators may
share infrastructure betweenthemselves large players withhigh capital may increasecompetition)
India has a huge potential for telecominfrastructure market With increasing
competition falling tariffs and pressure onmargins telecom service providers are beingforced to increase their focus on marketing andreduce their expensesExperienced management healthy capital back-up effective presence in the telecominfrastructure market and value added services atrelatively lesser cost will help ABC to meet theset targets
Financing Risk
(Availability of equity capitalavailability of long term debtinterest rate and moratoriumperiod)
ABC is seeking private equity partner to secure
equity capital Company has already entered intoNDA with 2 major investorsLong term debt at an interest rate of 125 canbe easily arranged because of the credibility of the promoters in the marketMany other similar firms like Indus and GTLhave already secured long term debt for amoratorium period of 2 years Promoters of ABCLimited are confident to secure a long term debtwith a moratorium period of 2 years and apayback period of 8 years
ABC Limited would minimize the workingcapital requirements of its business by securingrentals and operating revenues in advance fromits clients and or by suitably structuring itspayment liabilities to match its cash inflows
Commercial Risk (Tenancy ratio and tariff forGBS and RTS)
ABC would aim to enter into long term contractswith the ldquoanchor tenantrdquo operator and thenrollout the infrastructure so that at least single
882019 Major Project (Ramit)
httpslidepdfcomreaderfullmajor-project-ramit 4962
40
occupancy of each site is ensured at all t imesPromoters will use its knowledge of the businessand its expertise to identify and roll out sites inlocations which have strong multi- tenancypotential to minimize occupancy risk
Revenue Risk (Operating fees may decreasecredit worthiness of the clientsdelay in payment of rentals)
As per the industry sources till now not even asingle operator have dishonored the long termlease contractThe credit risk is diversified as there will bemultiple operatorsABC would aggressively market to get 3G andWiFi broadcasters to use the sites and earnadditional revenues in addition to the assumedrevenue streams
Natural Calamities Risk The Company shall maintain insurance for thesites against these risks and the cost of insurancewill be priced in and passed on to the tenants
882019 Major Project (Ramit)
httpslidepdfcomreaderfullmajor-project-ramit 5062
41
8 CONCLUSION
India is the fastest growing wireless telecom market in the world The continuing
growth in the number of wireless subscribers and MoUs and increasing trend of
outsourcing of business processes to India has led to growing demand for large
investments in the telecom infrastructure in the country
However with increasing competition falling tariffs and pressure on margins
telecom service providers are being forced to increase their focus on marketing
customer acquisitions and branding and minimize their efforts and overheads in
project management and asset acquisition
Further with rising prices of steel cement and real estate the cost of developing
and owning passive infrastructure is increasingly becoming a costly proposition
for most operators and service providers
The compulsion on the part of service providers to reduce their operating costs
and capital expenditure requirements has led to opportunities in passiveinfrastructure outsourcing to independent third party infrastructure providers and
also sharing the infrastructure with other service providers It is expected that
cellular operators will outsource their communications site infrastructure needs as
a means of accelerating access to their markets and preserving capital rather than
constructing and operating their own communications sites and maintaining their
own communications sites service and deve lopment capabilities
Passive infrastructure is highly capital intensive and an integral part of the cellular
service providersrsquo networks Yet being a simple and low technology asset it is
amenable to outsourcing and sharing By transferring the responsibility of
ownership development and maintenance of passive infrastructure service
882019 Major Project (Ramit)
httpslidepdfcomreaderfullmajor-project-ramit 5162
42
providers have an opportunity to transfer a substantial part of their business risk to
third parties
Most telecom operators are facing capacity constraints on their networksCoverage obligations increasing pressure to improve network quality and
competition has led to aggressive roll out plans by existing cellular operators
Installation of cell sites has become a cumbersome process as there are a number
of clearances required and involves labor-intensive micro management
Availability of ready infrastructure from third party providers would enable the
operators to reduce their time to market and accelerate their access to their
customers Cellular service providers generally want to move quickly when
adding more sites and co-location on an existing site is always faster than
building
Ownership and maintenance of telecom towers and other infrastructure by third
parties is an established practice in developed nations like USA and is
increasingly gaining market acceptance in India
The Indian government is seriously considering promoting the infrastructure
sharing route between the telecom operator and private players to achieve future
national tele-density targets and improve rural telecom penetration
ABC being an independent entity with no business conflicts with other service
providers in the telecom space will be best positioned and have an early mover
advantage to capitalize on this emerging opportunity
Further the task of operating and maintaining the passive infrastructure in the cell
is increasingly becoming a cumbersome exercise for the service providers to
handle ABCrsquos composite offering to build passive infrastructure for the cellular
operators and also operate and maintain them will provide a turnkey solution to
address the infrastructure needs of the service providers
882019 Major Project (Ramit)
httpslidepdfcomreaderfullmajor-project-ramit 5262
43
The business model proposed to be followed by ABC is fairly simple with stable
and predictable cash flows as is the case with the business model of the tower
renting companies in USA Most contracts are long term for a period 10 or moreyears with annual price escalators generally ranging from 3 to 4 However
wireless carriers normally tend to renew rentals because suitable alternative sites
may not exist or be available and repositioning a site in a carrierrsquos network is
expensive and may adverse ly affect network quality
Site ownership and operations is a ldquoscalerdquo business operating administration
marketing expenses etc do not rise as quickly as revenues when portfolios are
expanded Incremental operating costs associated with adding wireless tenants to
a communications site are minimal Therefore as additional tenants are added to a
site the substantial majority of incremental revenue contributes to margin
expansion Most tower companies have high EBITDA margins as may be seen
from the financial indicators of some of the tower rental companies in USA
It is expected that site location and capacity price and quality of service and
successful execution of contracts will be the most significant competitive factors
in this business
ABCrsquos revenue and returns on investment will be primarily driven by its ability
to
o Increase the utilization of the space and infrastructure capacity owned by it by
increasing the number of tenants per site and renting out to maximum number
of users As discussed above return on capital employed (PIRR and EIRR) arevery sensitive to tenancy ratio In worst case scenario project IRR can be as
low as 8 and in the best case scenario it can be as high as 20
o Develop acquire sites of strategic importance and high growth potential that
will enable them to secure better commercial terms from users and attract
more number of tenants Infrastructure provisioning fees rentals for sites are
882019 Major Project (Ramit)
httpslidepdfcomreaderfullmajor-project-ramit 5362
44
extremely location sensitive There is a potential to acquire more land than
that of required to capitalize on the increase in real estate prices
o Develop sites in a cost effective manner ABC would consider purchasing
land only for those GBS sites which have sufficient demand and arestrategically located Else for most of its sites land will be leasehold As
shown above returns (PIRR and EIRR) are very sensitive to capital costs In
the worst case scenario project IRR can be as low as 15 whereas it can as
high as 27 in the best case scenario
o Negotiate and secure long term contracts with good credit quality users with
built in price escalation provisions to mitigate financing risk
o Leverage and secure long term financing at attractive terms and involve in
active treasury management to keep low financing cost Results of the
sensitivity analysis indicate that equity IRR can be as high as 60 foe a
moratorium period of 4 years and interest rate of 10
o Minimize working capital requirements
o Maintain low operating and administration expense
o Secure better OampM margins from operators and retain a healthy share of it in
ABC
o Maintain high service standards and build strong customer relationships
The business would have the potential to capture new revenue opportunities
around the existing assets As demand for towers is expected to grow and as
operators migrate to speedier next-generation wireless technologies they will
need the towers and associated passive infrastructure to transmit their new
services in addition to their existing offerings In addition to increasing capacity
and coverage and improving the quality of their networks cellular serviceproviders are deploying high speed data networks driving incremental demand of
sites The business therefore has potential upsides in the form of adding
customers (tenants) in wireless broadband third generation (ldquo3Grdquo) and wireless
data capabilities and also other incremental value propositions by way of hosting
882019 Major Project (Ramit)
httpslidepdfcomreaderfullmajor-project-ramit 5462
45
Billboards Hoardings etc in some of the high visible sites owned and maintained
by it
Based on the assumptions and subject to satisfactory resolution of the key risks
factors project cash flows will be able to meet debt service obligations
This business model is a lucrative investment option for a private equity player
because valuation of each site will increase in the coming years due to
improvement in market conditions increase in the value of land and increase in
the demand for passive infrastructure in rural and semi-urban areas
882019 Major Project (Ramit)
httpslidepdfcomreaderfullmajor-project-ramit 5562
46
REFERENCESAnjan G V A amp N M (2009) telecom infrastructure industry in india GurgaonICRA
Bessler W Norsworthy J amp Shusterman T (2001 12 1) Mergers in the UStelecommunications industry and market valuationeffects IEEE p 288
COAI (2009 march 14) Subscriber Figures Retrieved march 14 2009 fromCOAIcom httpwwwcoaicomstatisticsphp
IDA (2009 march 23) Highlights Retrieved march 23 2009 from idagovsghttpwwwidagovsghomeindexaspx
K R (2008) Time for new business model Delhi Cybermedia
MAXIS (2009 march 8) the malaysian telecommunications industry Retrieved march9 2009 from maxiscommyhttpwwwmaxiscommypersonalabout_usinvestorprospectusprospectus4pdf
P J amp Lisa A (2009) Stimulas spending and American Telecom Industry USACoracle group
PwC (2009 march 12) Indian Telecom Industry Gurgaon Harayana IndiaRamachanran (2009 march 1) Investment in Telecom Infrastructure sector (M RInterviewer)
Vogelsang I (2002) The German Telecommunications Reform Verein fuumlr Socialpolitik (p 26) Innsbruck Boston Press
882019 Major Project (Ramit)
httpslidepdfcomreaderfullmajor-project-ramit 5662
47
ANNEXURES
ANNEXURE 1 Key Assumptions
The occupancy of each site by single two three operators for green-field sites is assumed
to be as follows
Table 91 Expected Tenancy RatiosFY 10 FY 11 FY 12 FY 13 FY 14 FY15
GBT Tenant
Ratio 150 150 170 170 170 200
Single Operator 50 50 30 30 30 0
Two Operator 50 50 70 70 70 100
RTT Tenant
Ratio 170 170 200 200 200 250
Single Operator 30 30 0 0 0 0
Two Operator 70 70 100 100 100 50
Three Operator 0 0 0 0 0 50
From FY 15 onwards tenancy ratio of 2 and 25 for GBT and RTT sites is cons idered
882019 Major Project (Ramit)
httpslidepdfcomreaderfullmajor-project-ramit 5762
48
Capital costs related assumptions are tabulated below
Table 92 GBT and RTT Capital Cost
The lease rentals for RTT sites are reimbursed from the operators and therefore have not
been factored in the revenues as well as the expense For GBT sites land purchase cost of
035 millions assumed which has been escalated by 6 annually to determine the
salvage value of assets
GBT Capital Costs
Million
INR
Delivery cost of Ground Based
Tower (GBT)063
Delivery cost of Generator 030
Civil Work 040Shelter 012
Electrical Works 030
Other Equipments (UPS Battery
etc)045
Construction cost 045
Land 035
Contingency amp Financial Charges 035Total cost 335
RTT Capital Costs
Million
INR
Delivery cost of Roof Top
Tower (RTT) 030
Delivery cost of Generator 020
Civil Work 020Shelter 012
Electrical Works 030
Other Equipments (UPS
Battery etc) 030
Construction cost -
Land -
Contingency amp FinancialCharges 008
Total cost 150
882019 Major Project (Ramit)
httpslidepdfcomreaderfullmajor-project-ramit 5862
49
Ope rating costs related assumptions are tabulated below
Table 93 Operating CostsOperating Costs
Security Sentries (INRMonth) 4000
Supervisors (INRMonth) 6000
Cluster Manager One for Fifty Towers (INRMonth) 15000
Annual increase 500
Number of Security Sentries per tower 300
Number of supervisors per tower 010
Number of C luster manager per tower 002
Fixed Expenses
Selling amp Maintenance (INRMonth) 4000000
Annual Escalation 5
Administration overhead (INRMonth) 10000000Annual Escalation 7
AMC Cost of Generator 15 (cost of generator)
Annual Escalation (AMC) 3
For RTT sites security sentries are not required because it will be the responsibility of
the site owner A supervisor will for every 10 sites and a cluster manager for every 50
sites will be required
882019 Major Project (Ramit)
httpslidepdfcomreaderfullmajor-project-ramit 5962
50
Table 94 Long term debtInterest Rate 125 per annum
Moratorium 2 years
Repayment Period 8 years
Tariff related assumptions and date of operations are tabulated below
Table 95 GBT and RTT Tariff Table 96 Life of the projectTariff Plan
Tariff (INRMonth)
No of
operators GBT RTT
1 28000 18000
2 22000 14000
3 0 12000
Annual
increase 3 3
Commercial Operation Date 1-Aug-09
Quarter Ending 30-Sep-09
FY ending COD 31-Mar-10
Project life years 15
End of commercial
operations31-Aug-24
Quarter ending commercial
operations30-Sep-24
FY ending comme rcial
operations31-Mar-25
882019 Major Project (Ramit)
httpslidepdfcomreaderfullmajor-project-ramit 6062
51
Annexure 2 Profit amp Loss accountsTable 97 Profit amp loss account statement
Income Statement (MNINR)Year ending Mar-10 Mar-11 Mar-12 Mar-13 Mar-14 Mar-15
RevenueGBT 406350 28811 89080 197447 379409 527015Operator Fees (GBT) 1411 10004 30678 67998 130664 179664RTT 1209 8575 27269 60443 116146 164264
Operator Fees (RTT) 440 3121 9739 21587 41481 56466Net Revenue 7124 50511 156766 347476 667700 927410
Expenses
VariableSecurity Sentries 1355 9790 28339 64033 125433 158238Supervisors 097 699 2024 4574 8959 11303Cluster Manager 048 350 10 12 2287 4480 5651AMC Cost of Generator 450 3013 7877 16719 31148 54541Sub-total 1950 13852 39252 87612 170021 229734
Fixed
Selling amp Maintenance(INRMonth) 032 050 053 056 058 061
Administration overhead(INRMonth) 080 128 137 147 157 168
Sub-total 112 179 190 203 216 230
EBITDA 5062 36480 117324 259661 497464 697447
Interest on LT loan - - 7341 31200 77479 156198Interest on ST loan - 021 060 130 245 361
EBDT 5062 36459 109923 228331 419739 540888Depreciation 2439 12769 35917 77162 142925 174006
EBT 2624 23691 74006 151169 276814 366881Income Tax 170 4233 14536 29073 53547 77634
PAT 2454 19458 59470 122096 223267 289247
882019 Major Project (Ramit)
httpslidepdfcomreaderfullmajor-project-ramit 6162
52
Annexure 3 Balance sheet
Table 98 B alance sheetsYearend Balance Sheet (MNINR)Year ending Mar-10 Mar-11 Mar-12 Mar-13 Mar-14 Mar-15
AssetsGross Block 75742 328216 833164 1716823 3105430 3105430Accumulated depreciation 2439 15208 51125 128287 271212 445218Net Block 73303 313009 782040 1588536 2834219 2660212Net Working Capital 064 241 620 1335 2515 3707Cash Balance 12979 72089 216513 488856 947982 1294734Total Assets 86346 385339 999172 2078727 3784715 3958653
LiabilitiesEquity 25168 108980 276604 569947 1030914 1030914Reserves amp Surplus 2454 21912 81381 203477 426745 715992Long term Debt 58725 254286 640722 1304302 2325171 2208967WC Borrowings - 161 465 1001 1886 2780Total Liabilities 86346 385339 999172 2078727 3784715 3958653
882019 Major Project (Ramit)
httpslidepdfcomreaderfullmajor-project-ramit 6262
Annexure 4 Cash flow statement
Table 99 Cash flow statements
Year ending Mar-10 Mar-11 Mar-12 Mar-13 Mar-14 Mar-15
InflowsPAT 2454 19458 59470 122096 223267 289247Depreciation 2439 12769 35917 77162 142925 174006Tax adjusted interest - 014 4959 20991 52076 104895Release of WC - - - - - -Salvage Value - - - - - -Sub-Total 4893 32241 100345 220249 418268 568148
OutflowsCapex 75742 252474 504948 883659 1388607 -Change in WorkingCapital 064 177 379 715 1180 1192
Sub-Total 75806 252651 505327 884374 1389787 1192
UFCF (70913) (220410) (404982) (664125) (971519) 566956LFCF (70913) (220424) (409940) (685116) (1023595) 462062
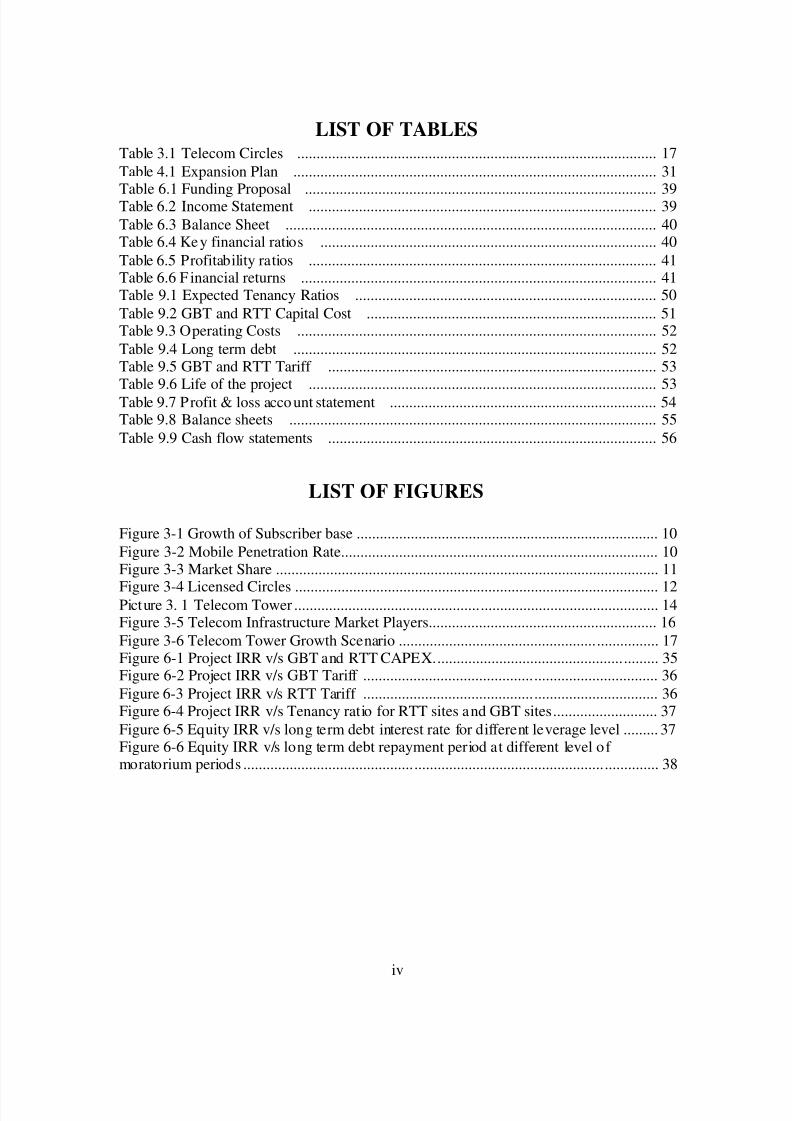
882019 Major Project (Ramit)
httpslidepdfcomreaderfullmajor-project-ramit 962
iv
LIST OF TABLESTable 31 Telecom Circles 17 Table 41 Expansion Plan 31
Table 61 Funding Proposal 39 Table 62 Income Statement 39 Table 63 Balance Sheet 40 Table 64 Key financial ratios 40 Table 65 Profitability ratios 41 Table 66 F inancial returns 41 Table 91 Expected Tenancy Ratios 50 Table 92 GBT and RTT Capital Cost 51 Table 93 Operating Costs 52 Table 94 Long term debt 52 Table 95 GBT and RTT Tariff 53 Table 96 Life of the project 53 Table 97 Profit amp loss acco unt statement 54 Table 98 Balance sheets 55 Table 99 Cash flow statements 56
LIST OF FIGURES
Figure 3-1 Growth of Subscriber base 10 Figure 3-2 Mobile Penetration Rate 10 Figure 3-3 Market Share 11
Figure 3-4 Licensed Circles 12 Picture 3 1 Telecom Tower 14 Figure 3-5 Telecom Infrastructure Market Players 16 Figure 3-6 Telecom Tower Growth Scenario 17 Figure 6-1 Project IRR vs GBT and RTT CAPEX 35 Figure 6-2 Project IRR vs GBT Tariff 36 Figure 6-3 Project IRR vs RTT Tariff 36 Figure 6-4 Project IRR vs Tenancy ratio for RTT sites and GBT sites 37 Figure 6-5 Equity IRR vs long term debt interest rate for different leverage level 37 Figure 6-6 Equity IRR vs long term debt repayment period at different level of moratorium periods 38
882019 Major Project (Ramit)
httpslidepdfcomreaderfullmajor-project-ramit 1062
1
1 INTRODUCTION
ABC Ltd 1 is an Infrastructure Provider company that builds owns operates and
maintains passive network infrastructure on a shared basis for mobile telecom operators
and ITES providers The Company was formed in Jan 2009 Its objective is to provide
network design and planning network deployment network operations amp maintenance
infrastructure management application management and professional services to telecom
operators and enterprises
The company is planning to raise capital in the form of equity and debt to start its
operation by Aug 09 The purpose of this project is to prepare detailed financial model
for assessment of feasibility of such projects building scenarios and sensitivity charts
calculation of risk and returns associated with the project and valuation of ABC Limited
subjected to present and expected future market conditions
ABCrsquos vision is to provide world class managed infrastructure amp allied services to the
service providers to optimize their service delivery capability In the initial years of
operation the company will focus on telecom sector with almost 100 of its proposed
capital expenditure till FY 14 earmarked for developing and owning passive
infrastructure for sharing among mobile service providers
Passive Telecom Infrastructure Sharing
Mobile networks have base stations (or cell sites) which have active and passive
infrastructure components Active components include the antenna trans-receivers
switches feeder cables Node B and microwave radio equipments Passive (or non-electronic) components include the land tower shelter air-conditioning equipment
diesel electric generator battery electrical supply technical premises and easements
pylons etc Passive infrastructure in a mobile network essentially involves acquiring land
1 Actual name o f the company is no t stated as per the instructions given by external supervisor
882019 Major Project (Ramit)
httpslidepdfcomreaderfullmajor-project-ramit 1162
2
setting up towers and electrical and civil works that needs to be in place before operators
can install the active infrastructure which brings mobile services to the consumers In a
typical cell site build-out almost 65 of the total cost is attributed to passive
infrastructure and 35 to active infrastructure In this report passive cell siteinfrastructure has also been henceforth referred to as towers or sites
Mobile operators are required to setup more and more BTS (cell) sites due to the
exponential growth of mobile subscribers in India (currently growing at almost 152
million subscribers a month) and limited availability of spectrum B and C Circles (where
traffic density may not be as high as metros and Circle A) are expected to drive future
subscriber growth and requirements for cell sites will be higher to ensure greater
coverage
To cover large stretch of almost 65000 Kilometers of national highways additional
18000 towers (one tower for every 3 Kilometers of highway) will be required in near
future to ensure better connectivity Proposed build out of 3G networks are expected to
further drive substantial growth in the number of towers over the next few years
However creating new infrastructure by each operator separately leads to duplicating
huge capital investments It also contributes to mushroom growth of telecom towers and
deteriorating skylines in urban areas which has already led to some local municipal and
state governments to regulate and restrict the erection of new mobile towers
The continued pressure on cellular tariffs higher infrastructure costs for network
deployment particularly in semi-urban and rural areas and compelling need to reduce
time to market for network roll outs have led operators to share and even outsource theirinfrastructure requirements from third party infrastructure providers like ABC GTL and
Indus towers
2 As published in ET 8 th May 09 Edition
882019 Major Project (Ramit)
httpslidepdfcomreaderfullmajor-project-ramit 1262
3
Sharing promotes capital efficiency as it allows more than one service provider to
leverage and ride on common infrastructure In its simplest form it involves two or more
operators jointly using the common passive infrastructure in a cell site While viewed
largely as a measure to reduce CAPEX and operating expense such sharing also leads toimprovement of service quality (by ensuring site space for service providers and reducing
black spots) and the environment (by reducing number of cell sites and towers)
In outsourcing operators take passive infrastructure and tower space from third party
infrastructure companies on a monthly rental basis to host their radio and transmission
equipments Outsourcing provides significant benefits to operators It enables them to
save on capital expenditure (it actually converts CAPEX into OPEX in the form of lease
rentals) and focus on their core activities of sales marketing and branding while leavingthe cumbersome task of managing the site development process and site operation and
maintenance to third parties who exclusively deal with such activities
Active infrastructure sharing is not popular across the globe for several reasons the most
important being increased inter dependency among competing service providers
However tower sharing and outsourcing of tower ownership is an accepted practice in
many developed markets In countries like USA UK and Australia there are
independently owned tower companies who rent tower space to various mobile operators
The United States has arguably the most developed independent mobile tower market
with independent tower companies owning over half of all mobile towers in that country
Mobile tower owners generate revenue by owning the towers and leasing space on the
towers to mobile telecommunications operators under long-term contracts Under this
business model ownership of the base station equipments coupled to the towers is
retained by the mobile telecommunications operators In addition to rental payments
mobile tower owners generally receive a fee for installing customers base station
equipment on the tower Mobile tower owners also receive services revenue for
operations and maintenance of the passive infrastructure Regulators all over the world
favor passive sharing of infrastructure
882019 Major Project (Ramit)
httpslidepdfcomreaderfullmajor-project-ramit 1362
4
The concept of passive infrastructure sharing is increasingly gaining market acceptance
in India So far it has been largely limited to bilateral sharing between operators in the
form of barter where the operators split the site related CAPEX and OPEX costs The
available information suggests that about 25 of the existing 90000 tower sites in Indiaare currently being shared for passive infrastructure predominantly in rural areas and
small towns
ABC Limited is expecting to get shortlisted by Department of Telecom for setting up
passive cellular infrastructure in rural areas with support from the Universal Services
Obligations (USO) Fund The recent announcements by some operators like Bharti
Hutch (Vodafone) Reliance Idea for mutual sharing of infrastructure through new
companies and entry of third party infrastructure providers has further expanded the
tower market in India
Results of detailed financial model indicate that with given expansion plans and
assumptions ABC will create value for its shareholders investors clients and promoters
The project is expected to generate high cash flows which will be sufficient enough to
pay back its debt liabilities and to generate and equity IRR of 36
882019 Major Project (Ramit)
httpslidepdfcomreaderfullmajor-project-ramit 1462
5
2 OBJECTIVES
The scope of work for this Study project involves the following
Market assessment for Indian telecom Infrastructure sector
Collection of data related to capital and operating costs (from promoter)
Forecasting operating costs
Preparation of detailed financial model
Calculation of UFCF ( Unlevered Free Cash Flows) LFCF (Levered Free Cash
Flows)
Estimation of Project and Equity IRRrsquos
Preparation of balance sheet PampL and cash flow statement for expected life
cycle of project
Sensitivity analysis and Scenario analysis
882019 Major Project (Ramit)
httpslidepdfcomreaderfullmajor-project-ramit 1562
6
3 LITERATURE REVIEW
31 International Experience in Infrastructure Sharing
Different countries have adopted different approaches in order to safeguard the level of
competitive independence between co-operating operators Measures include mandating
a distinct and differentiated cost base between operators the development of different
business plans marketing and distribution strategies and the independent development or
acquisition of content and services Requiring the independent control over the respective
frequency resources of each operator is also an important competitive safeguard
In the EU for example operators are allowed to share infrastructure as long as they
maintain full operational control of their network Sharing the radio access network is
permitted but sharing frequencies and the core network is not In particular the databases
used to administer subscriber and interconnection information are required to be kept
separate Exemptions however are generally granted in special cases which advance the
objectives of government policy and the economic benefits to the consumers of the
services It is important to note that any infrastructure sharing agreement could also be
subject to review by the EC Commission under Article 81 of the EC Treaty andor the EC
Merger Regulation
USA
In USA the number of wireless service subscribers has increased from 1284 million to
2433 million between December 2001 and December 2007 representing an increase of
approximately 88 and market penetration of approximately 70 The tower business in
USA is a $5 billion industry consolidated around four large players -- American Tower
(ATC) Crown Castle International (CCI ) SBA Communications (SBAC ) and GlobalSignal (GSL ) which control 40 of the approximately 210000 (P amp Lisa 2009) towers
across the US The primary business of these companies involves leasing antenna space
on multi-tenant communications sites to a variety of wireless carriers including radio and
3 Source CTIA-The Wireless Association Website
882019 Major Project (Ramit)
httpslidepdfcomreaderfullmajor-project-ramit 1662
7
television broadcast companies under long-term lease contracts Typically these leases
are long-term (five to 10 year) contracts with renewal terms at the option of the customer
Some co mpanies offer tower related services on a limited basis including site acquisition
zoning and permitting services and structural analysis services and project managementof antenna installations that support their site leasing operations and the addition of new
tenants and equipment on their sites
Towers are a relatively scarce asset in USA as zoning laws often do not permit a new
tower to be built in the immediate vicinity of an existing tower Tenant churn tends to be
low as towers are an integral part of the networks of the wireless service providers
Tenants own their own equipment (and therefore bear the technology risk) generally
handle installation and maintenance and pay for electricity and most ongoing assets
greatly simplifying the tower business model
Germany
In Germany the main concern faced by the regulator involved a possible threat to the
competitive independence of potential 3G operators that could result from a tight
integration of the networks as a result of infrastructure sharing Infrastructure Sharing is
allowed only if the mobile systems can be independently operated for example if they
can be shut down or maintained independently by software and that no customer data is
shared (OECD report 2004) In Germany the sharing of antennae and sites is relatively
common however the sharing of transmission management equipment and core
networks is not commonly done (Vogelsang 2002)
Sweden
In Sweden the regulator has agreed to allow significant infrastructure sharing for 3G
operators Each operator only has to cover 30 of the customers while for the remaining
70 infrastructure can be shared This is the approach being taken by the Europolitan
companies Vodafone Hi3G and Orange which jointly own 3G Infrastructure Services
However with competition concerns the regulator only allows radio components such as
antennas cables and base station electronics to be shared (Khurram Mahmood 2008)
882019 Major Project (Ramit)
httpslidepdfcomreaderfullmajor-project-ramit 1762
8
Singapore
In the case of Singapore the regulatorrsquos infrastructure sharing approach is guided by the
primary policy goal of encouraging facilities-based competition Under the current
regulatory framework licensees are generally not required to share any infrastructure that
it controls with its competitors Each licensee is expected to build or lease the use of the
infrastructure it requires Notwithstanding this however infrastructure sharing is
mandated in areas where there are clear space and operating constraints For 2G and 3G
licensees such matters relate to infrastructure in the Mass Rapid Transit and underground
road tunnels The regulator has also allowed the co-location of base stations and sharing
of transmission towers and masts to reduce the impact on the environment and to
minimize the inconvenience to building owners and residents (IDA 2009)
Malaysia
Taking a different approach in Malaysia operators owning network facilities have been
encouraged by the regulator to share infrastructure as a means of lowering costs and
expanding coverage as well as to avoid a duplication of resources To this effect a
Memorandum of Understanding to share infrastructure has been executed between the
mobile operators To further catalyze infrastructure sharing the concept of a third party
provider of facilities is also being promoted in Malaysia Under this concept of a third
party will build the infrastructure and lease capacity or space to existing se rvice
providers This concept not only provides ready-made sites but will also help reduce the
numbers of telecommunication towers that have to be dealt with by local authorities
(MAXIS 2009)
882019 Major Project (Ramit)
httpslidepdfcomreaderfullmajor-project-ramit 1862
9
32 Domestic Telecom Market assessment
The Indian Telecom Industry-Historical perspective
The Indian telecommunication industry was originally a government controlled
monopoly comprising three state owned operators
MTNL (which provided wire-line services in Mumbai and Delhi metropolitan
areas)
DOT (which provided wire-line services to rest of the country)
VSNL (which provided international services)
Liberalization started in 1991 with opening up of mobile services to private sectorparticipation The country was divided into 23 circles comprising of four metropol9otan
areas (Chennai Delhi Kolkata and Mumbai) and 19 other circles broadly defined by
parameters of states (K 2008) These 19 non-metropolitan circles have been categorized
as A B and C circles in descending order of their revenue generation potential (as
shown below)
Table 31 Telecom Circles
MetropolitanAreas Circle A Circle B Circle C
Delhi ChennaiMumbai Kolkata
Gujarat KarnatakaAP Tamil NaduMaharashtra
Punjab Kera laHaryana UP (West)Rajasthan UP(East) MP WestBengal
HP JampK North-East OrissaAssam Bihar
In 1997 TRAI was formed for regulating the operations and policy making process of
Indian telecommunication sector Since its liberalization India has experienced sustained
and impressive growth in its telecommunication sector primarily because of progressive
regulatory regime strong demand for mobile telecommunication services and
strengthening economy The country has achieved distinction of having worldrsquos lowest
tariff fastest growth ion subscriber base and availability of some of the cheapest mobile
handsets
882019 Major Project (Ramit)
httpslidepdfcomreaderfullmajor-project-ramit 1962
10
Figure 3-1 Growth of Subscriber base
Growth of Subscriber base
050
100150200250300350
1998 1999 2000 2001 2002 2003 2004 2005 2006 2007 2008
Year
M i l l i o n
Source Telecom Regulatory Authority of India Database
India is the second largest mobile market in the world is also among the fastest growing
mobile markets globally The total number of mobile subscribers in India (ie the
subscriber base) has crossed 300 million with 30049 million subscribers as on 31st
March 2008 The growth of subscriber base during the past decade (1998-2008) is
indicated above in a chart
Figure 3-2 Mobile Penetration Rate
0 10 20 30 40 50 60 70 80 90 100
North-East ( C)Assam (C)
Bihar ( C)Jammu amp Kashmir (C)
Orissa (C)Him achal Pradesh (C)
Uttar Pradesh ( B)Madhya Pradesh (B)
Rajastan (B)Haryana (B)
Punjab (B)West Bengal (B)
Kerala (B)Maharashtra (A)
Gujarat (A)Tamil Nadu (A)
Andhra Pradesh (A)Karnataka (A)
Kolkata (Metro)Chennai (Metro)Mumbai (Metro)
Delhi (Metro)
Source TRAI and PwC DatabaseNote As on Dec 08
882019 Major Project (Ramit)
httpslidepdfcomreaderfullmajor-project-ramit 2062
11
Indian telecom industry has experienced a high growth rate in Metros and class A circles
with coverage reaching around 90 and 35 respectively However coverage in the
Class B and Class C cities is still low at 15-25 Growth in Class B and Class C circles
has concentrated in urban area while penetration in rural area remains lower Thus futuregrowth is likely to come largely from Class B and C circles and rural areas Keeping this
in view larger players like Bharti Airtel Limited Reliance Communications Limited and
Bharat Sanchar Nigam Limited (BSNL) are largely focusing on increasing their
geographical coverage in Class B and C c ircles
33 Telecom Market- Competitive landscape
Figure 3-3 Market Share
Bharti2668
BSNLMTNL1908
Reliance1971
Vodafone661
Tata1047
Idea1033
Aircel457
Spice181
BPL056
HFCL013
Shyam005
Market Share
Source TRAI and Pw C Database
Indian mobile sector is largely concentrated with top 4 market players (Bharti Airtel
Reliance Communication Vodafone Essar and BSNL) out of 10 capturing almost three-
fourth of the entire market This is also partly on account of the fact that these four
operators have their presence in a larger number of circles as compared with other
players
882019 Major Project (Ramit)
httpslidepdfcomreaderfullmajor-project-ramit 2162
12
Figure 3-4 Lice nsed Circles
0
5
10
15
20
25
Licensed Circles (Dec 07) New Circles (Sep 08)
Source TRAI and CRISIL Database
The competition in Indian telecom sector is expected to intensify in near future because
recently new licenses have been granted to some of the existing operators for new circles
and also to new entrants like Unitech Datacom Swan Telecom and Stel These new
players are expected to capture the rural and semi-urban cities of C ircle B and Circle C as
they are now expected to grow at a much faster rate Shorter network rollout time and
competitiveness in the industry will force these entrants to start the ir operation as early as
possible Tower companies like ABC will allow incumbents to start operations in a
particular region just by installing their electronics on the ready-to-use towers thereby
significantly shortening the ro llout time
Moreover a rapidly increasing subscriber base and spectrum crunch would force the
existing telecom operators to maintain the minimum level of QoS Thus to retain existing
subscribers by preventing subscriber churn operators will require additional
infrastructure in their existing areas of operation to be able to offer better QoS This will
also result in increase in demand for telecom infrastructure in the existing markets
(Ramachanran 2009)
882019 Major Project (Ramit)
httpslidepdfcomreaderfullmajor-project-ramit 2262
13
34 Telecom Infrastructure Overview
Passive infrastructure is one of the most important components of a mobile network It
has been a critical area of operations for telecom companies in the past However with
increasing competition posing an urgent need for telecom companies to expand their
coverage and sharpen their focus on core operations so that they can sustain and improve
their market position passive infrastructure has assumed the status of an independent
industry during the past few years The industry (COAI) estimates that there will be a
requirement of around 350000 towers for 500 million subscribers by 2010 (COAI
2009)
Each site has active and passive infrastructure components Active components includethe antenna trans-receivers switches feeder cables Node B and microwave radio
equipments Passive (or non-electronic) components include the land tower shelter air-
conditioning equipment diesel electric generator battery electrical supply technical
premises and easements pylons etc Passive infrastructure in a mobile network
essentially involves acquiring land setting up towers and electrical and civil works that
needs to be in place before operators can install the active infrastructure which brings
mobile services to the consumers In a typical cell site build-out almost 65 of the total
cost is attributed to passive infrastructure and 35 to active infrastructure
(Ramachanran 2009)In this report passive cell site infrastructure has also been
henceforth referred to as towers or sites
The components of a typical base station are shown below
882019 Major Project (Ramit)
httpslidepdfcomreaderfullmajor-project-ramit 2362
14
Picture 3 1 Telecom Tower
Telecom towers are broadly classified on the basis of their placement as Ground-basedand Roof-top
1 Ground-Based Tower Ground-based towers (GBTs) are taller (typically 200 to 400
feet) and are mostly used in rural and semi-urban areas because of the easy
availability of real-estate space there GBTs involve a capital expenditure in the range
882019 Major Project (Ramit)
httpslidepdfcomreaderfullmajor-project-ramit 2462
15
of Rs 3 to 4 million depending on the height of the tower land prices etc
(Ramachanran 2009)
2 Roof-Top Tower (RTT) Roof-top towers (RTTs) are generally placed on the roofsof high-rise buildings They are shorter (than GBTs) and more common in urban and
highly populated areas where there is paucity of real-estate space Typically these
involve a capital expenditure of Rs 15 to 2 million (Ramachanran 2009)
The height of a telecom tower determines the number of antennas that can be
accommodated which in turn determines the capacity of the towers apart from factors
such as location and geographica l conditions (wind speeds type of terrain etc)
35 Telecom Infrastructure- Domestic market
In India there are broadly two kinds of operators in the tower infrastructure industry
Tower infrastructure subsidiaries
Reliance Infratel Limited
Bharti Infratel Limited
Indus Towers Limited
Wireless TT Info Services Limited (WTTIL)
Independent tower infrastructure companies (ITICs)
GTL Infrastructure
Xcel Telecom
Essar Telecom Infrastructure
Aster Infrastructure
Bharat Telemast
882019 Major Project (Ramit)
httpslidepdfcomreaderfullmajor-project-ramit 2562
16
These companies have their business model based largely on contract or anticipatory
approaches Under the contract approach tower companies set up tower sites going by
the requirements of the telecom operators and the terms of the contract are specified
beforehand in the MSAs signed by the two parties Under the anticipatory approachhowever tower companies set up tower infrastructure at sites with reasonable demand
potential and subsequently invite telecom operators to set up their network on these
towers The latter model involves higher business risks as the tower company may not be
able to achieve reasonable tenancy for its tower infrastructure and at profitable terms
BPTL proposes to follow contract approach for its business model
36 Telecom Infrastructure market- Competitive landscape
Figure 3-5 Telecom Infrastructure Market Players
038058154
365692
10381692
26923269
0 20000 40000 60000 80000 100000
Aster InfrastructureAmerican Towers
Essar Telec om Infrastructure
GTL In frastructureWi reles s TT In fo Services Limited
Bharti Infratel Limited
Reli anc e Communications Limitedrsquos
OthersInd us To wers Limited
Number of Towers
Market Players
Source Telecom Regulatory Authority of India and ICRANote Others include tower por tfolios of BSNL MTNL Sistema Shyam Teleservices Aircel etc
In Indian Telecom Infrastructure market competition has intensified significantly with
several players spinning of their tower portfolio and independent operators expanding
their operations
882019 Major Project (Ramit)
httpslidepdfcomreaderfullmajor-project-ramit 2662
17
Bharti Airtel Limited Reliance Communications Limited and Tata Teleservices Limited
have hived off their tower assets into separate tower infrastructure subsidiaries namely
Bharti Infratel Limited Reliance Infratel Limited and Wireless TT Infoservices Limited
respectively Also Bharti Infratel Limited together with Vodafone Essar Limited and IdeaCellular Limited in a joint- venture agreement has created Indiarsquos largest tower
infrastructure company ndash Indus Towers Limited which has an estimated portfolio of
around 88000 towers (Anjan V amp N 2009) Whereas in past few years number of
independent tower infrastructure companies have ventured into the domestic telecom
tower industry These include GTL Infrastructure Limited Essar Telecom Infrastructure
Limited Xcel Telecom Private Limited (American Towers) Tower Vision India Private
Limited Aster Infrastructure Private Limited TVS Interconnect Systems Limited etc
Figure 3-6 Telecom Tower Growth Scenario
0
100
200
300
400
500
600
700
2008 2009 2010 2011 2012 T e
l e c o m
T o w e r s
( T h o u s a n
d s )
Source Telecom Regulatory Authority of IndiaAssumptions Subscriber growth rate of 28 till 2011-12
1400 subscribe per site
As shown above it is expected that in next 4-5 years there will be a requirement of
additional 85000 towers (both GBT and RTT) each year to meet the subscriber base of
800 million by 2011-12 (PwC 2009) This shows that huge investment have to be made
in Indian telecom Infrastructure sector in near future Now since both passive and active
882019 Major Project (Ramit)
httpslidepdfcomreaderfullmajor-project-ramit 2762
18
infrastructure sharing is a llowed (except spectrum) Independent service providers will be
benefited Increase in subscriber base introduction of new technologies like 3G Wi-max
etc and increase in market healthy market competition in telecom services sector will
drive the growth in telecom infrastructure sector
882019 Major Project (Ramit)
httpslidepdfcomreaderfullmajor-project-ramit 2862
19
4 BUSINESS PLAN
41 Passive Infrastructure
Mobile networks have base stations (or cell sites) which have active and passive
infrastructure components Active components include the antenna trans-receivers
switches feeder cables Node B and microwave radio equipments Passive (or non-
electronic) components include the land tower shelter air-conditioning equipment
diesel electric generator battery electrical supply technical premises and easements
pylons etc Passive infrastructure in a mobile network essentially involves acquiring land
setting up towers and electrical and civil works that needs to be in place before operators
can install the active infrastructure which brings mobile services to the consumers In atypical cell site build-out almost 65 of the total cost is attributed to passive
infrastructure and 35 to active infrastructure
42 Infrastructure Sharing
Mobile operators are required to setup more and more BTS (cell) sites due to the
exponential growth of mobile subscribers in India (currently growing at almost 15 4
million subscribers a month) and limited availability of spectrum B and C Circles (wheretraffic density may not be as high as metros and Circle A) are expected to drive future
subscriber growth and requirements for cell sites will be higher to ensure greater
coverage
However creating new infrastructure by each operator separately leads to d uplicat ing
huge capital investments It also contributes to mushroom growth of telecom towers and
deteriorating skylines in urban areas which has already led to some local municipal and
state governments to regulate and restrict the erection of new mobile towers
The continued pressure on cellular tariffs higher infrastructure costs for network
deployment particularly in semi-urban and rural areas and compelling need to reduce
4 As published in ET 8 th May 09 Edition
882019 Major Project (Ramit)
httpslidepdfcomreaderfullmajor-project-ramit 2962
20
time to market for network roll outs have led operators to share and even outsource their
infrastructure requirements from third party infrastructure providers like BPTL GTL and
Indus towers It promotes capital efficiency as it allows more than one service provider to
leverage and ride o n common infrastructure In its simplest form it involves two or moreoperators jointly using the common passive infrastructure in a cell site While viewed
largely as a measure to reduce capital and operating expense such sharing also leads to
improvement of service q uality (by ensuring site space for service providers and reducing
black spots) and the environment (by reducing number of cell sites and towers)
In outsourcing operators take passive infrastructure and tower space from third party
infrastructure companies on a monthly rental basis to host their radio and transmission
equipments Outsourcing provides significant benefits to operators It enables them tosave on capital expenses (it actually converts capital expense into operating expense in
the form of lease rentals) and focus on their core activities of sales marketing and
branding while leaving the cumbersome task of managing the site development process
and site operation and maintenance to third parties who exclusively deal with such
activities
The concept of passive infrastructure sharing is increasingly gaining market acceptancein India So far it has been largely limited to bilateral sharing between operators in the
form of barter where the operators split the site related CAPEX and OPEX costs The
available information suggests that about 25 of the existing 90000 tower sites in India
are currently being shared for passive infrastructure predominantly in rural areas and
small towns
43 Introduction to the business
BPTL is an Infrastructure Provider company that builds owns operates and maintains
passive network infrastructure on a shared basis for mobile telecom operators and ITES
providers Its objective is to provide network design and planning network deployment
882019 Major Project (Ramit)
httpslidepdfcomreaderfullmajor-project-ramit 3062
21
network operations amp maintenance infrastructure management application management
and professional services to teleco m operators and enterprises
The company is planning to raise capital in the form of equity and debt to start its
operation by Aug 09 ABC rsquos vision is to provide world class managed infrastructure ampallied services to the service providers to optimize their service delivery capability In the
initial years of operation the company will focus on telecom sector with almost 100 of
its proposed capital expenditure till FY 14 earmarked for developing and owning passive
infrastructure for sharing among mobile service providers
44 Business Proposal
ABC will provide passive telecom infrastructure on build own operate (BOO) basis inboth ground based (GBS) as well as roof-top sites (RTS) It will undertake full range of
responsibilities in building owning and maintaining the sites and will serve as a single
window one-stop-shop provider of infrastructure services Typical responsibilities are
summarized below
Site planning keeping in view the network rollout plans of prospective customers
Site acquisition including entering into long-term agreements with land owners
Obtaining of necessary regulatory approvals
Erect ion and commissioning of tower and allied equipment
Provision of support services such as back-up power air-conditioning and
security
Provision of turnkey solutions to telecom companies such as sourcing of
equipment testing and maintenance
882019 Major Project (Ramit)
httpslidepdfcomreaderfullmajor-project-ramit 3162
22
Bharat Telemast Private Limited will identify the sites required for setting up the Passive
infrastructure by first of all getting a commitment from one operator who is called as
ldquoAnchor Operatorrdquo Then Bharat Telemast will go ahead to lease (or) buy out the site as
appropriate and commences construction of the cellular sites But the Cellular site will betypically designed for three to four operators While construction is in progress the
marketing team will work towards getting the second and third operator But care will be
taken in such a way that at least two operators are available at the time of completion of
construction
45 Sources of revenue
1 Infrastructure Provisioning Fees ndash fee paid by the operators on a monthly basisWith annual escalation
2 Site lease rental ndash Paid at actual on a monthly basis
3 Operations and maintenance charges Paid on a monthly basis
4 The contract also provides a fixed annual escalator
46 Attractiveness of business model
Stable and predictable cash flow business Once a tower asset is rented out it
usually generates a stable and predictable cash flow in the form of tower rentals
from occupants over the term of the MSA between the two parties
Low working capital requirement ABC rsquos business model is also characterized
by low working capital requirements as most of the operating expenses (such aselectricity and fuel and other variable operating expenses) are reimbursable by the
tenants on actual basis Moreover BPTL is may also be able to get rentals for the
towers in advance and also obtain better credit terms from their suppliers thus
further improving their working capital cycle
882019 Major Project (Ramit)
httpslidepdfcomreaderfullmajor-project-ramit 3262
23
High incremental profitability The operating costs associated with this
business are largely fixed in nature Thus each increment in tenancy is
accompanied by a minimal increase in costs This leads to a more thanproportionate increase in profits for every increase in occupancy
Reduction in capital investments due to present market conditions Due to
present market situation average capital requirement for RTT and GBT sites have
dropped from 2 million and 4 million to 15 million and 33 million ABC wishes
to grab this opportunity which will result in competitive advantage in near future
Extensive usage While on an average a GSM BTS can handle around 100-
1100 subscribers but in the case of high usage areas the figure can be as low as
600-700 subscribers which means a larger number of cell sites would be required
for the same area Moreover the country has the problem of spectrum scarcity
which increases the requirement of towers to maintain a reasonable leve l of
service quality
New entrants Many operators including Vodafone Essar Limited Idea Cellular
Limited Aircel Cellular Limited and Sistema Shyam Teleservices Limited have
received licenses as well spectrum in new circles which would enable them to
become pan-India operators in the next one-two years Also new licenses have
been issued to new players such as Unitech Swan Telecom and S Tel Limited
Given the significant expansion plans of new entrants over the medium term and
the need for them to optimize investments in order to maintain returns demand
for towers is expected to report a sharp increase
Shorter rollout time Indian telecom industry is highly competitive and doing
business for new entrant may not be easy Shorter network-rollout time would be
a critical success factor for the new entrants and a longer rollout time could meanloss of substantial market share to other operators Tower companies allow
players to start operations in a particular region just by installing their electronics
on the ready-to-use towers thereby significantly shortening the rollout time
New technologies 3G services are already launched in the country and to
augment their services various operators plan to launch Wi-Max services as soon
882019 Major Project (Ramit)
httpslidepdfcomreaderfullmajor-project-ramit 3362
24
as they receive additional spectrum from Government This would further
increase the demand for sharing of passive infrastructure
47
Expansion Schedule
BPTL would rollout both RTT and GBT sites of which the RTT sites GBT sites
normally would have a tower height of 50 meters or 60 meters depending on the need for
additional height for installation of microwave antennae based on the location of the site
and number of tenants on the cell site Details of BPTLrsquos expansion plan are summarized
below
Table 41 Expansion PlanExpansion Schedule 2009-10 2010-11 2011-12 2012-13 20013-14
GBT
Addition 210 700 1400 2450 3850
Total 210 910 2310 4760 8610
RTT
Addition 90 300 600 1050 1650
Total 90 390 990 2040 3690
48 Proposed Services
As indicated earlier ABC proposes to provide passive telecom infrastructure on a
sharing co-location basis to cellular operators The sites would either be Ground Based
Sites (GBS) or Roof Top Sites (RTS) As the sites are meant for co-location of the active
components of two to three operators they would be built to either 2-Tenant or 3-Tenant
specifications
The different components of the passive infrastructure facility and the related services
that would be offered by BPTL to the operators are as under
Infrastructure provisioning comprising
882019 Major Project (Ramit)
httpslidepdfcomreaderfullmajor-project-ramit 3462
25
Communication tower built to host multiple antennae
Weather-proof communication shelter with air-conditioning and power backup
arrangement
Diesel generating set and battery bank for power backup
A mobile standby generator to act as backup in case o f breakdown
Warehousing facility
Infrastructure operations and maintenance including
Regular operations and maintenance of the facility
Security of all the equipments at the site at all timesA dedicated team of technicians for a group of 40-50 sites to ensure effect ive and
efficient functioning of the components at all times
49 Proposed Organizational Structure
A senior management team will work under the leadership of the ldquoChief Operations
Officerrdquo who will be responsible for smooth implementation of proj ect activities He willalso assist the managing director in marketing This team will coordinate with Stallion
Telecom Pvt Ltd which will take over the role of procuring Capital Equipments
Senior management will consists of project manager infrastructure manager commercial
manager and head (legal and company affairs Apart from this there will be a requirement
Chief OperatingOfficer
Project Manager Infrastructure
Manager
Commercial
Manager (projects)
Head (Legal and
Company Affairs)
882019 Major Project (Ramit)
httpslidepdfcomreaderfullmajor-project-ramit 3562
26
of security sentries (3 per GBT site) supervisors (one for every 10 sites) and cluster
manager (one for every 50 sites)
Bharat Telemast will carry out the complete Project execution with the assistance of third party ldquoQuality control organizationrdquo and a third party ldquoProject management teamrdquo
Quality control and project management activities will be o utsourced to a third party
882019 Major Project (Ramit)
httpslidepdfcomreaderfullmajor-project-ramit 3662
27
5 METHODOLOGY
The changing face of infrastructure services creates a complex situation which demands
greater understanding of roles of competition regulatory structures and modes of
financing Knowledge of such things is a key decisive factor in building confidence
among investors promoters and government In project finance the project its assets
contract and cash flows are separated from promoter in order to permit credit appraisal
or loan to the project
As part of the financial feasibility analysis a series of related financial statements based
on projected sources and uses of funds during the development and operating phaseproject were created Financial statements consist of expenses associated with
development activities including capital costs like acquisition of land for GBT sites cost
of tower generator shelter batteries etc Most of the data regarding capital costs are
obtained from the promoter of ABC Limited All these capital costs related details are
provided in annexure 1
Assumption regarding depreciation capital structure operating expenses expansion
schedule tenancy ratios tariff or rent operatorrsquos fees and loan amortization schedule are
obtained from professional accountants Promoter and bankers of ABC Limited
Due to unknown factors that could influence the cost of towers or fees associated with
completing the project (soft costs) contingency costs were estimated at 5 of hard and
soft costs respectively If contingency is set too low developers could easily encounter
funding shortfalls upon slight changes in market forces All other costs were estimated
based on talking with industry professionals (Promoters)
A detailed financial model was prepared based on existing accounting standards and
following financial ratios were estimated
882019 Major Project (Ramit)
httpslidepdfcomreaderfullmajor-project-ramit 3762
28
EBITDA margin Profit and loss accounts for the estimated project period (15
Years) were prepared based on which estimated earnings before interests tax
depreciat ion and amortization were calculated for each year Detailed PampL
balance sheet and cash flow statements are provided in annexure 2 3 and 4
EBITDA = Total Revenue ndash (Variable expenses + Fixed Expenses)
EBITDA margin = EBITDA Total Revenue
PAT margin PAT is calculated by subtracting interests pa id on capital debt and
working capital debt depreciation and applicable corporate income tax from
EBITDA
PAT = EBITDA ndash Interest Payable ndash Depreciation ndash Income tax
PAT margin = PATTotal Revenue
Working Capital Working capital requirement is calculated by subtract ing
current liabilities from current assets Current assets are estimated based on 30
days cash requirement and current liabilities are estimated as half of salary
monthly expenses
WC = Current Assets ndash Current Liabilities
UFCF It is defined as the free cash flows available to the firm if the firm has
zero debt liability Purpose of ca lculat ing UFCF for project period is to determinethe project IRR
UFCF = PAT + Depreciation + Interest (tax adjusted) + Release of WC + Salvage
value of the assets ndash CAPEX ndash Change in WC
882019 Major Project (Ramit)
httpslidepdfcomreaderfullmajor-project-ramit 3862
29
LCFF It is defined as the cash floes available to the firm after paying interests on
long term and short term debts
LCFF = UFCF ndash Interest (tax adjusted)
FCFE It is defined as the free cash flow available to equity holders It is
determined to ca lculate equity IRR for equity investors It also includes the tax
benefits which are available as per the Income Tax Act
FCFE PAT + Depreciation + Salvage Value ndash Equity Investment ndash Long term debt
repayment
PIRR Project IRR is defined as the discount rate at which NPV (Net Present
Value) of UFCF is zero It is calculated by using following formula
UFCF 1 (1+PIRR) 0+ UFCF 2 (1+PIRR) 1+ UFCF 3 (1+PIRR) 2+ helliphelliphelliphelliphelliphellip = 0
UFCF 1 = UFCF at the end of first year of operation
UFCF 2 = UFCF at the end of second year of operation
PIRR = Project IRR
EIRR Equity IRR is defined as the discount rate at which NPV of FCFE is zero
It is calculated by using following formula
FCFE1 (1+EIRR) 0+ FCFE 2 (1+EIRR) 1+ FCFE 3 (1+EIRR) 2+ helliphelliphelliphelliphelliphellip = 0
FCFE1 = FCFE at the end of first year of operation
FCFE2 = FCFE at the end of seco nd year of operation
EIRR = Equity IRR
882019 Major Project (Ramit)
httpslidepdfcomreaderfullmajor-project-ramit 3962
30
WACC It is de fined as the percentage of return expected by the investors who
otherwise would have earned some return by investing in some other project
WACC = Cost of Debt (Debt Capital) + Cost of equity (Equity Capital)
882019 Major Project (Ramit)
httpslidepdfcomreaderfullmajor-project-ramit 4062
882019 Major Project (Ramit)
httpslidepdfcomreaderfullmajor-project-ramit 4162
32
62 Funding planAs the telecom sites are rolled out over a 5 year period till FY 2014 investment will be
required for each year ABC Limited will start generating profits from FY 10 only Such
internally generated cash accruals will be ploughed back into the business to meet part of
the project cost Investment required for each year is tabulated below
Table 61 Funding ProposalMillion INR FY 10 FY 11 FY 12 FY 13 FY 14
GBT Tower (Additional) Nos 210 700 1400 2450 3850
RTT Tower (Additional) Nos 90 300 600 1050 1650DE ratio 233 233 233 233 233
Additional CAPEX 83892 279374 558748 977809 1536557
Debt 58725 195562 391124 684466 1075590
Equity 25168 83812 167624 293343 460967
63 Results
Based on assumptions given in Annexure 1 a detailed financial model was preparedResults of the financial model such as PampL account Balance Sheet and cash flow
statements are provided in Annexure 2 3 and 4 Forecasts for the key financial figures for
first five years are provided in the Table below
Forecasts
Table 62 Income StatementMillion INR FY-10 FY11 FY12 FY-13 FY-14
Sales 7124 50511 156766 347476 667700
Cost of sales 1950 13852 39252 87612 170021
Gross 5174 36659 117514 259864 497679
7263 7258 7496 7479 7454
Admin costs 112 179 190 203 216
882019 Major Project (Ramit)
httpslidepdfcomreaderfullmajor-project-ramit 4262
33
Finance cost 0 021 7401 31330 77725
Taxation 170 4233 14536 29073 53547
PAT 2454 19458 59470 122096 223267
As shown in Table above during the expansion period revenue will grow exponentially
In the first year of operation ABC will earn a revenue of INR 7124 million from 300
(210 GBT and 90 RTT) sites with a tenancy ratio of 15 for GBS and 17 for RTS In the
first 2 years of operation the company will not pay any interest on long term debt due to
2 years moratorium period Major cost associated with the project is depreciation due to
which PAT is lower than the operating profits But cash flows to the firm are enough to
result in reasonable returns
Table 63 Balance Shee tYear ending Mar-10 Mar-11 Mar-12 Mar-13 Mar-14
AssetsGross Block 75742 328216 833164 1716823 3105430Accumulated depreciation 2439 15208 51125 128287 271212Net Block 73303 313009 782040 1588536 2834219Net Working Capital 064 241 620 1335 2515Cash Balance 12979 72089 216513 488856 947982
Total Assets 86346 385339 999172 2078727 3784715LiabilitiesEquity 25168 108980 276604 569947 1030914Reserves amp Surplus 2454 21912 81381 203477 426745Long term Debt 58725 254286 640722 1304302 2325171WC Borrowings - 161 465 1001 1886Total Liabilities 86346 385339 999172 2078727 3784715
Note All figures are in Million INR
Table 64 Key financial ratiosMar-11 Mar-12 Mar-13 Mar-14 Mar-15
Revenue Growth 60902 21036 12165 9216 3890EBITDA Growth 62061 22161 12132 9158 4020
PAT Growth 69293 20564 10531 8286 2955
As shown in table above increase in EBITDA is higher than that of revenue This is due
to better operational efficiency of ABCrsquos management and economies of scale S imilarly
882019 Major Project (Ramit)
httpslidepdfcomreaderfullmajor-project-ramit 4362
34
increase in PAT is lesser than that of EBITDA because of high depreciation and interest
expenses
Table 65 Pr ofitability r atios
Mar-11 Mar-12 Mar-13 Mar-14 Mar-15
EBITDA Margin 7222 7484 7473 7450 7520
PAT Margin 3852 3794 3514 3344 3119Return on Net Worth 622 760 769 788 1087
Key profitability ratios are shown in table above Return on net worth in the initial years
is lower because of the ambitious expansion plans of ABC Limited Thereafter return on
net worth increases with increase in PAT
Returns on Investment
Table 66 Financial returnsFinancial Indicators
Project IRR 1813Equity IRR 3609
64 Sensitivity Analysis
A sensitivity analysis has been carried out on the project financials to determine theimpact of key variables on the financial indicators namely
Project IRR
The key variables on which sensitivity analysis have been carried out areCapital expenditure for GBS and RTS1st and 2 nd tenant tariff for GBS1st and 2 nd tenant tariff for RTSTenancy Ratio
Similarly sensitivity analysis has been carried out forEquity IRR
The key variables on which sensitivity analysis have been carried out for EIRR are
Capital structure and interest rate for capital debtRepayment period and moratorium period
882019 Major Project (Ramit)
httpslidepdfcomreaderfullmajor-project-ramit 4462
35
The impact on the financial indicators is shown below
Figure 6-1 Project IRR vs GBT and RTT CAPEX
As shown in Figure 6-1 project IRR is more sensitive to change in CAPEX of RTT sitesas compared to change in CAPEX of GBT sites because tenancy ratio and tariff for RTTsites are higher than those of GBT sites
882019 Major Project (Ramit)
httpslidepdfcomreaderfullmajor-project-ramit 4562
36
Figure 6-2 Project IRR vs GBT Tariff for 1 st tenant (X-axis) and 2 nd tenant (right-hand side)
As shown in Figure 6-2 project IRR varies linearly with GBT tariff In the best casescenario when GBT tariff for 1 st tenant is INR 34000month and GBT tariff for secondtenant is INR 26000month Project IRR is 2101
Figure 6-3 Project IRR vs RTT Tariff for 1 st tenant (X-axis) and 2 nd tenant (right-hand side)
As shown in Figure 6-2 project IRR varies linearly with RTT tariff In the best casescenario when RTT tariff for 1 st tenant is INR 24000month and RTT tariff for second
882019 Major Project (Ramit)
httpslidepdfcomreaderfullmajor-project-ramit 4662
37
tenant is INR 20000month Project IRR is 1932 Project IRR is more sensitivetowards RTT tariff than GBT tariff because in practical business situation RTT siteshave a tenancy ratio of more than two due to which effect of tariff for 1 st tenant almostget nullified after few years
Figure 6-4 Project IRR vs Tenancy ratio for RTT sites (X-axis) and GBT sites
As shown in Figure 6-4 project IRR is very sensitive to tenancy ratio In the best casescenario where GBT sites have a tenancy ratio of 2 and RTT sites have a tenancy ratio of 3 project IRR can be as high as 20
Figure 6-5 Equity IRR vs long term debt interest rate for different leverage level
882019 Major Project (Ramit)
httpslidepdfcomreaderfullmajor-project-ramit 4762
38
As shown in figure 6-5 equity IRR is more sensitive to interest rate on long term debt forhigh level of leverage (lower debt equity ratio) because as the debt equity ratio increasesinterest paid on long term debt also increases significantly
Figure 6-6 Equity IRR vs long term debt repayment period at different level of moratoriumperiods
As shown in figure 6-6 Equity IRR increases with increase in moratorium period anddebt repayment period The variation is from 1654 to 60 for worst case and best casescenarios
882019 Major Project (Ramit)
httpslidepdfcomreaderfullmajor-project-ramit 4862
39
7 RISK ASSESSMENTRisk Mitigation strategyExecution Risk
(Project management landacquisition etc)
Management of ABC has proven expertise in
telecom infrastructure rollout and has executedvarious projects with large telecom operators andMNC vendorsABCrsquos top management team consists of a groupof professionals drawn from leading telecomInfrastructure Company who have immenseexpertise and experience in rolling out telecominfrastructure projects
Market Risk (No entry barriers operators may
share infrastructure betweenthemselves large players withhigh capital may increasecompetition)
India has a huge potential for telecominfrastructure market With increasing
competition falling tariffs and pressure onmargins telecom service providers are beingforced to increase their focus on marketing andreduce their expensesExperienced management healthy capital back-up effective presence in the telecominfrastructure market and value added services atrelatively lesser cost will help ABC to meet theset targets
Financing Risk
(Availability of equity capitalavailability of long term debtinterest rate and moratoriumperiod)
ABC is seeking private equity partner to secure
equity capital Company has already entered intoNDA with 2 major investorsLong term debt at an interest rate of 125 canbe easily arranged because of the credibility of the promoters in the marketMany other similar firms like Indus and GTLhave already secured long term debt for amoratorium period of 2 years Promoters of ABCLimited are confident to secure a long term debtwith a moratorium period of 2 years and apayback period of 8 years
ABC Limited would minimize the workingcapital requirements of its business by securingrentals and operating revenues in advance fromits clients and or by suitably structuring itspayment liabilities to match its cash inflows
Commercial Risk (Tenancy ratio and tariff forGBS and RTS)
ABC would aim to enter into long term contractswith the ldquoanchor tenantrdquo operator and thenrollout the infrastructure so that at least single
882019 Major Project (Ramit)
httpslidepdfcomreaderfullmajor-project-ramit 4962
40
occupancy of each site is ensured at all t imesPromoters will use its knowledge of the businessand its expertise to identify and roll out sites inlocations which have strong multi- tenancypotential to minimize occupancy risk
Revenue Risk (Operating fees may decreasecredit worthiness of the clientsdelay in payment of rentals)
As per the industry sources till now not even asingle operator have dishonored the long termlease contractThe credit risk is diversified as there will bemultiple operatorsABC would aggressively market to get 3G andWiFi broadcasters to use the sites and earnadditional revenues in addition to the assumedrevenue streams
Natural Calamities Risk The Company shall maintain insurance for thesites against these risks and the cost of insurancewill be priced in and passed on to the tenants
882019 Major Project (Ramit)
httpslidepdfcomreaderfullmajor-project-ramit 5062
41
8 CONCLUSION
India is the fastest growing wireless telecom market in the world The continuing
growth in the number of wireless subscribers and MoUs and increasing trend of
outsourcing of business processes to India has led to growing demand for large
investments in the telecom infrastructure in the country
However with increasing competition falling tariffs and pressure on margins
telecom service providers are being forced to increase their focus on marketing
customer acquisitions and branding and minimize their efforts and overheads in
project management and asset acquisition
Further with rising prices of steel cement and real estate the cost of developing
and owning passive infrastructure is increasingly becoming a costly proposition
for most operators and service providers
The compulsion on the part of service providers to reduce their operating costs
and capital expenditure requirements has led to opportunities in passiveinfrastructure outsourcing to independent third party infrastructure providers and
also sharing the infrastructure with other service providers It is expected that
cellular operators will outsource their communications site infrastructure needs as
a means of accelerating access to their markets and preserving capital rather than
constructing and operating their own communications sites and maintaining their
own communications sites service and deve lopment capabilities
Passive infrastructure is highly capital intensive and an integral part of the cellular
service providersrsquo networks Yet being a simple and low technology asset it is
amenable to outsourcing and sharing By transferring the responsibility of
ownership development and maintenance of passive infrastructure service
882019 Major Project (Ramit)
httpslidepdfcomreaderfullmajor-project-ramit 5162
42
providers have an opportunity to transfer a substantial part of their business risk to
third parties
Most telecom operators are facing capacity constraints on their networksCoverage obligations increasing pressure to improve network quality and
competition has led to aggressive roll out plans by existing cellular operators
Installation of cell sites has become a cumbersome process as there are a number
of clearances required and involves labor-intensive micro management
Availability of ready infrastructure from third party providers would enable the
operators to reduce their time to market and accelerate their access to their
customers Cellular service providers generally want to move quickly when
adding more sites and co-location on an existing site is always faster than
building
Ownership and maintenance of telecom towers and other infrastructure by third
parties is an established practice in developed nations like USA and is
increasingly gaining market acceptance in India
The Indian government is seriously considering promoting the infrastructure
sharing route between the telecom operator and private players to achieve future
national tele-density targets and improve rural telecom penetration
ABC being an independent entity with no business conflicts with other service
providers in the telecom space will be best positioned and have an early mover
advantage to capitalize on this emerging opportunity
Further the task of operating and maintaining the passive infrastructure in the cell
is increasingly becoming a cumbersome exercise for the service providers to
handle ABCrsquos composite offering to build passive infrastructure for the cellular
operators and also operate and maintain them will provide a turnkey solution to
address the infrastructure needs of the service providers
882019 Major Project (Ramit)
httpslidepdfcomreaderfullmajor-project-ramit 5262
43
The business model proposed to be followed by ABC is fairly simple with stable
and predictable cash flows as is the case with the business model of the tower
renting companies in USA Most contracts are long term for a period 10 or moreyears with annual price escalators generally ranging from 3 to 4 However
wireless carriers normally tend to renew rentals because suitable alternative sites
may not exist or be available and repositioning a site in a carrierrsquos network is
expensive and may adverse ly affect network quality
Site ownership and operations is a ldquoscalerdquo business operating administration
marketing expenses etc do not rise as quickly as revenues when portfolios are
expanded Incremental operating costs associated with adding wireless tenants to
a communications site are minimal Therefore as additional tenants are added to a
site the substantial majority of incremental revenue contributes to margin
expansion Most tower companies have high EBITDA margins as may be seen
from the financial indicators of some of the tower rental companies in USA
It is expected that site location and capacity price and quality of service and
successful execution of contracts will be the most significant competitive factors
in this business
ABCrsquos revenue and returns on investment will be primarily driven by its ability
to
o Increase the utilization of the space and infrastructure capacity owned by it by
increasing the number of tenants per site and renting out to maximum number
of users As discussed above return on capital employed (PIRR and EIRR) arevery sensitive to tenancy ratio In worst case scenario project IRR can be as
low as 8 and in the best case scenario it can be as high as 20
o Develop acquire sites of strategic importance and high growth potential that
will enable them to secure better commercial terms from users and attract
more number of tenants Infrastructure provisioning fees rentals for sites are
882019 Major Project (Ramit)
httpslidepdfcomreaderfullmajor-project-ramit 5362
44
extremely location sensitive There is a potential to acquire more land than
that of required to capitalize on the increase in real estate prices
o Develop sites in a cost effective manner ABC would consider purchasing
land only for those GBS sites which have sufficient demand and arestrategically located Else for most of its sites land will be leasehold As
shown above returns (PIRR and EIRR) are very sensitive to capital costs In
the worst case scenario project IRR can be as low as 15 whereas it can as
high as 27 in the best case scenario
o Negotiate and secure long term contracts with good credit quality users with
built in price escalation provisions to mitigate financing risk
o Leverage and secure long term financing at attractive terms and involve in
active treasury management to keep low financing cost Results of the
sensitivity analysis indicate that equity IRR can be as high as 60 foe a
moratorium period of 4 years and interest rate of 10
o Minimize working capital requirements
o Maintain low operating and administration expense
o Secure better OampM margins from operators and retain a healthy share of it in
ABC
o Maintain high service standards and build strong customer relationships
The business would have the potential to capture new revenue opportunities
around the existing assets As demand for towers is expected to grow and as
operators migrate to speedier next-generation wireless technologies they will
need the towers and associated passive infrastructure to transmit their new
services in addition to their existing offerings In addition to increasing capacity
and coverage and improving the quality of their networks cellular serviceproviders are deploying high speed data networks driving incremental demand of
sites The business therefore has potential upsides in the form of adding
customers (tenants) in wireless broadband third generation (ldquo3Grdquo) and wireless
data capabilities and also other incremental value propositions by way of hosting
882019 Major Project (Ramit)
httpslidepdfcomreaderfullmajor-project-ramit 5462
45
Billboards Hoardings etc in some of the high visible sites owned and maintained
by it
Based on the assumptions and subject to satisfactory resolution of the key risks
factors project cash flows will be able to meet debt service obligations
This business model is a lucrative investment option for a private equity player
because valuation of each site will increase in the coming years due to
improvement in market conditions increase in the value of land and increase in
the demand for passive infrastructure in rural and semi-urban areas
882019 Major Project (Ramit)
httpslidepdfcomreaderfullmajor-project-ramit 5562
46
REFERENCESAnjan G V A amp N M (2009) telecom infrastructure industry in india GurgaonICRA
Bessler W Norsworthy J amp Shusterman T (2001 12 1) Mergers in the UStelecommunications industry and market valuationeffects IEEE p 288
COAI (2009 march 14) Subscriber Figures Retrieved march 14 2009 fromCOAIcom httpwwwcoaicomstatisticsphp
IDA (2009 march 23) Highlights Retrieved march 23 2009 from idagovsghttpwwwidagovsghomeindexaspx
K R (2008) Time for new business model Delhi Cybermedia
MAXIS (2009 march 8) the malaysian telecommunications industry Retrieved march9 2009 from maxiscommyhttpwwwmaxiscommypersonalabout_usinvestorprospectusprospectus4pdf
P J amp Lisa A (2009) Stimulas spending and American Telecom Industry USACoracle group
PwC (2009 march 12) Indian Telecom Industry Gurgaon Harayana IndiaRamachanran (2009 march 1) Investment in Telecom Infrastructure sector (M RInterviewer)
Vogelsang I (2002) The German Telecommunications Reform Verein fuumlr Socialpolitik (p 26) Innsbruck Boston Press
882019 Major Project (Ramit)
httpslidepdfcomreaderfullmajor-project-ramit 5662
47
ANNEXURES
ANNEXURE 1 Key Assumptions
The occupancy of each site by single two three operators for green-field sites is assumed
to be as follows
Table 91 Expected Tenancy RatiosFY 10 FY 11 FY 12 FY 13 FY 14 FY15
GBT Tenant
Ratio 150 150 170 170 170 200
Single Operator 50 50 30 30 30 0
Two Operator 50 50 70 70 70 100
RTT Tenant
Ratio 170 170 200 200 200 250
Single Operator 30 30 0 0 0 0
Two Operator 70 70 100 100 100 50
Three Operator 0 0 0 0 0 50
From FY 15 onwards tenancy ratio of 2 and 25 for GBT and RTT sites is cons idered
882019 Major Project (Ramit)
httpslidepdfcomreaderfullmajor-project-ramit 5762
48
Capital costs related assumptions are tabulated below
Table 92 GBT and RTT Capital Cost
The lease rentals for RTT sites are reimbursed from the operators and therefore have not
been factored in the revenues as well as the expense For GBT sites land purchase cost of
035 millions assumed which has been escalated by 6 annually to determine the
salvage value of assets
GBT Capital Costs
Million
INR
Delivery cost of Ground Based
Tower (GBT)063
Delivery cost of Generator 030
Civil Work 040Shelter 012
Electrical Works 030
Other Equipments (UPS Battery
etc)045
Construction cost 045
Land 035
Contingency amp Financial Charges 035Total cost 335
RTT Capital Costs
Million
INR
Delivery cost of Roof Top
Tower (RTT) 030
Delivery cost of Generator 020
Civil Work 020Shelter 012
Electrical Works 030
Other Equipments (UPS
Battery etc) 030
Construction cost -
Land -
Contingency amp FinancialCharges 008
Total cost 150
882019 Major Project (Ramit)
httpslidepdfcomreaderfullmajor-project-ramit 5862
49
Ope rating costs related assumptions are tabulated below
Table 93 Operating CostsOperating Costs
Security Sentries (INRMonth) 4000
Supervisors (INRMonth) 6000
Cluster Manager One for Fifty Towers (INRMonth) 15000
Annual increase 500
Number of Security Sentries per tower 300
Number of supervisors per tower 010
Number of C luster manager per tower 002
Fixed Expenses
Selling amp Maintenance (INRMonth) 4000000
Annual Escalation 5
Administration overhead (INRMonth) 10000000Annual Escalation 7
AMC Cost of Generator 15 (cost of generator)
Annual Escalation (AMC) 3
For RTT sites security sentries are not required because it will be the responsibility of
the site owner A supervisor will for every 10 sites and a cluster manager for every 50
sites will be required
882019 Major Project (Ramit)
httpslidepdfcomreaderfullmajor-project-ramit 5962
50
Table 94 Long term debtInterest Rate 125 per annum
Moratorium 2 years
Repayment Period 8 years
Tariff related assumptions and date of operations are tabulated below
Table 95 GBT and RTT Tariff Table 96 Life of the projectTariff Plan
Tariff (INRMonth)
No of
operators GBT RTT
1 28000 18000
2 22000 14000
3 0 12000
Annual
increase 3 3
Commercial Operation Date 1-Aug-09
Quarter Ending 30-Sep-09
FY ending COD 31-Mar-10
Project life years 15
End of commercial
operations31-Aug-24
Quarter ending commercial
operations30-Sep-24
FY ending comme rcial
operations31-Mar-25
882019 Major Project (Ramit)
httpslidepdfcomreaderfullmajor-project-ramit 6062
51
Annexure 2 Profit amp Loss accountsTable 97 Profit amp loss account statement
Income Statement (MNINR)Year ending Mar-10 Mar-11 Mar-12 Mar-13 Mar-14 Mar-15
RevenueGBT 406350 28811 89080 197447 379409 527015Operator Fees (GBT) 1411 10004 30678 67998 130664 179664RTT 1209 8575 27269 60443 116146 164264
Operator Fees (RTT) 440 3121 9739 21587 41481 56466Net Revenue 7124 50511 156766 347476 667700 927410
Expenses
VariableSecurity Sentries 1355 9790 28339 64033 125433 158238Supervisors 097 699 2024 4574 8959 11303Cluster Manager 048 350 10 12 2287 4480 5651AMC Cost of Generator 450 3013 7877 16719 31148 54541Sub-total 1950 13852 39252 87612 170021 229734
Fixed
Selling amp Maintenance(INRMonth) 032 050 053 056 058 061
Administration overhead(INRMonth) 080 128 137 147 157 168
Sub-total 112 179 190 203 216 230
EBITDA 5062 36480 117324 259661 497464 697447
Interest on LT loan - - 7341 31200 77479 156198Interest on ST loan - 021 060 130 245 361
EBDT 5062 36459 109923 228331 419739 540888Depreciation 2439 12769 35917 77162 142925 174006
EBT 2624 23691 74006 151169 276814 366881Income Tax 170 4233 14536 29073 53547 77634
PAT 2454 19458 59470 122096 223267 289247
882019 Major Project (Ramit)
httpslidepdfcomreaderfullmajor-project-ramit 6162
52
Annexure 3 Balance sheet
Table 98 B alance sheetsYearend Balance Sheet (MNINR)Year ending Mar-10 Mar-11 Mar-12 Mar-13 Mar-14 Mar-15
AssetsGross Block 75742 328216 833164 1716823 3105430 3105430Accumulated depreciation 2439 15208 51125 128287 271212 445218Net Block 73303 313009 782040 1588536 2834219 2660212Net Working Capital 064 241 620 1335 2515 3707Cash Balance 12979 72089 216513 488856 947982 1294734Total Assets 86346 385339 999172 2078727 3784715 3958653
LiabilitiesEquity 25168 108980 276604 569947 1030914 1030914Reserves amp Surplus 2454 21912 81381 203477 426745 715992Long term Debt 58725 254286 640722 1304302 2325171 2208967WC Borrowings - 161 465 1001 1886 2780Total Liabilities 86346 385339 999172 2078727 3784715 3958653
882019 Major Project (Ramit)
httpslidepdfcomreaderfullmajor-project-ramit 6262
Annexure 4 Cash flow statement
Table 99 Cash flow statements
Year ending Mar-10 Mar-11 Mar-12 Mar-13 Mar-14 Mar-15
InflowsPAT 2454 19458 59470 122096 223267 289247Depreciation 2439 12769 35917 77162 142925 174006Tax adjusted interest - 014 4959 20991 52076 104895Release of WC - - - - - -Salvage Value - - - - - -Sub-Total 4893 32241 100345 220249 418268 568148
OutflowsCapex 75742 252474 504948 883659 1388607 -Change in WorkingCapital 064 177 379 715 1180 1192
Sub-Total 75806 252651 505327 884374 1389787 1192
UFCF (70913) (220410) (404982) (664125) (971519) 566956LFCF (70913) (220424) (409940) (685116) (1023595) 462062
882019 Major Project (Ramit)
httpslidepdfcomreaderfullmajor-project-ramit 1562
6
3 LITERATURE REVIEW
31 International Experience in Infrastructure Sharing
Different countries have adopted different approaches in order to safeguard the level of
competitive independence between co-operating operators Measures include mandating
a distinct and differentiated cost base between operators the development of different
business plans marketing and distribution strategies and the independent development or
acquisition of content and services Requiring the independent control over the respective
frequency resources of each operator is also an important competitive safeguard
In the EU for example operators are allowed to share infrastructure as long as they
maintain full operational control of their network Sharing the radio access network is
permitted but sharing frequencies and the core network is not In particular the databases
used to administer subscriber and interconnection information are required to be kept
separate Exemptions however are generally granted in special cases which advance the
objectives of government policy and the economic benefits to the consumers of the
services It is important to note that any infrastructure sharing agreement could also be
subject to review by the EC Commission under Article 81 of the EC Treaty andor the EC
Merger Regulation
USA
In USA the number of wireless service subscribers has increased from 1284 million to
2433 million between December 2001 and December 2007 representing an increase of
approximately 88 and market penetration of approximately 70 The tower business in
USA is a $5 billion industry consolidated around four large players -- American Tower
(ATC) Crown Castle International (CCI ) SBA Communications (SBAC ) and GlobalSignal (GSL ) which control 40 of the approximately 210000 (P amp Lisa 2009) towers
across the US The primary business of these companies involves leasing antenna space
on multi-tenant communications sites to a variety of wireless carriers including radio and
3 Source CTIA-The Wireless Association Website
882019 Major Project (Ramit)
httpslidepdfcomreaderfullmajor-project-ramit 1662
7
television broadcast companies under long-term lease contracts Typically these leases
are long-term (five to 10 year) contracts with renewal terms at the option of the customer
Some co mpanies offer tower related services on a limited basis including site acquisition
zoning and permitting services and structural analysis services and project managementof antenna installations that support their site leasing operations and the addition of new
tenants and equipment on their sites
Towers are a relatively scarce asset in USA as zoning laws often do not permit a new
tower to be built in the immediate vicinity of an existing tower Tenant churn tends to be
low as towers are an integral part of the networks of the wireless service providers
Tenants own their own equipment (and therefore bear the technology risk) generally
handle installation and maintenance and pay for electricity and most ongoing assets
greatly simplifying the tower business model
Germany
In Germany the main concern faced by the regulator involved a possible threat to the
competitive independence of potential 3G operators that could result from a tight
integration of the networks as a result of infrastructure sharing Infrastructure Sharing is
allowed only if the mobile systems can be independently operated for example if they
can be shut down or maintained independently by software and that no customer data is
shared (OECD report 2004) In Germany the sharing of antennae and sites is relatively
common however the sharing of transmission management equipment and core
networks is not commonly done (Vogelsang 2002)
Sweden
In Sweden the regulator has agreed to allow significant infrastructure sharing for 3G
operators Each operator only has to cover 30 of the customers while for the remaining
70 infrastructure can be shared This is the approach being taken by the Europolitan
companies Vodafone Hi3G and Orange which jointly own 3G Infrastructure Services
However with competition concerns the regulator only allows radio components such as
antennas cables and base station electronics to be shared (Khurram Mahmood 2008)
882019 Major Project (Ramit)
httpslidepdfcomreaderfullmajor-project-ramit 1762
8
Singapore
In the case of Singapore the regulatorrsquos infrastructure sharing approach is guided by the
primary policy goal of encouraging facilities-based competition Under the current
regulatory framework licensees are generally not required to share any infrastructure that
it controls with its competitors Each licensee is expected to build or lease the use of the
infrastructure it requires Notwithstanding this however infrastructure sharing is
mandated in areas where there are clear space and operating constraints For 2G and 3G
licensees such matters relate to infrastructure in the Mass Rapid Transit and underground
road tunnels The regulator has also allowed the co-location of base stations and sharing
of transmission towers and masts to reduce the impact on the environment and to
minimize the inconvenience to building owners and residents (IDA 2009)
Malaysia
Taking a different approach in Malaysia operators owning network facilities have been
encouraged by the regulator to share infrastructure as a means of lowering costs and
expanding coverage as well as to avoid a duplication of resources To this effect a
Memorandum of Understanding to share infrastructure has been executed between the
mobile operators To further catalyze infrastructure sharing the concept of a third party
provider of facilities is also being promoted in Malaysia Under this concept of a third
party will build the infrastructure and lease capacity or space to existing se rvice
providers This concept not only provides ready-made sites but will also help reduce the
numbers of telecommunication towers that have to be dealt with by local authorities
(MAXIS 2009)
882019 Major Project (Ramit)
httpslidepdfcomreaderfullmajor-project-ramit 1862
9
32 Domestic Telecom Market assessment
The Indian Telecom Industry-Historical perspective
The Indian telecommunication industry was originally a government controlled
monopoly comprising three state owned operators
MTNL (which provided wire-line services in Mumbai and Delhi metropolitan
areas)
DOT (which provided wire-line services to rest of the country)
VSNL (which provided international services)
Liberalization started in 1991 with opening up of mobile services to private sectorparticipation The country was divided into 23 circles comprising of four metropol9otan
areas (Chennai Delhi Kolkata and Mumbai) and 19 other circles broadly defined by
parameters of states (K 2008) These 19 non-metropolitan circles have been categorized
as A B and C circles in descending order of their revenue generation potential (as
shown below)
Table 31 Telecom Circles
MetropolitanAreas Circle A Circle B Circle C
Delhi ChennaiMumbai Kolkata
Gujarat KarnatakaAP Tamil NaduMaharashtra
Punjab Kera laHaryana UP (West)Rajasthan UP(East) MP WestBengal
HP JampK North-East OrissaAssam Bihar
In 1997 TRAI was formed for regulating the operations and policy making process of
Indian telecommunication sector Since its liberalization India has experienced sustained
and impressive growth in its telecommunication sector primarily because of progressive
regulatory regime strong demand for mobile telecommunication services and
strengthening economy The country has achieved distinction of having worldrsquos lowest
tariff fastest growth ion subscriber base and availability of some of the cheapest mobile
handsets
882019 Major Project (Ramit)
httpslidepdfcomreaderfullmajor-project-ramit 1962
10
Figure 3-1 Growth of Subscriber base
Growth of Subscriber base
050
100150200250300350
1998 1999 2000 2001 2002 2003 2004 2005 2006 2007 2008
Year
M i l l i o n
Source Telecom Regulatory Authority of India Database
India is the second largest mobile market in the world is also among the fastest growing
mobile markets globally The total number of mobile subscribers in India (ie the
subscriber base) has crossed 300 million with 30049 million subscribers as on 31st
March 2008 The growth of subscriber base during the past decade (1998-2008) is
indicated above in a chart
Figure 3-2 Mobile Penetration Rate
0 10 20 30 40 50 60 70 80 90 100
North-East ( C)Assam (C)
Bihar ( C)Jammu amp Kashmir (C)
Orissa (C)Him achal Pradesh (C)
Uttar Pradesh ( B)Madhya Pradesh (B)
Rajastan (B)Haryana (B)
Punjab (B)West Bengal (B)
Kerala (B)Maharashtra (A)
Gujarat (A)Tamil Nadu (A)
Andhra Pradesh (A)Karnataka (A)
Kolkata (Metro)Chennai (Metro)Mumbai (Metro)
Delhi (Metro)
Source TRAI and PwC DatabaseNote As on Dec 08
882019 Major Project (Ramit)
httpslidepdfcomreaderfullmajor-project-ramit 2062
11
Indian telecom industry has experienced a high growth rate in Metros and class A circles
with coverage reaching around 90 and 35 respectively However coverage in the
Class B and Class C cities is still low at 15-25 Growth in Class B and Class C circles
has concentrated in urban area while penetration in rural area remains lower Thus futuregrowth is likely to come largely from Class B and C circles and rural areas Keeping this
in view larger players like Bharti Airtel Limited Reliance Communications Limited and
Bharat Sanchar Nigam Limited (BSNL) are largely focusing on increasing their
geographical coverage in Class B and C c ircles
33 Telecom Market- Competitive landscape
Figure 3-3 Market Share
Bharti2668
BSNLMTNL1908
Reliance1971
Vodafone661
Tata1047
Idea1033
Aircel457
Spice181
BPL056
HFCL013
Shyam005
Market Share
Source TRAI and Pw C Database
Indian mobile sector is largely concentrated with top 4 market players (Bharti Airtel
Reliance Communication Vodafone Essar and BSNL) out of 10 capturing almost three-
fourth of the entire market This is also partly on account of the fact that these four
operators have their presence in a larger number of circles as compared with other
players
882019 Major Project (Ramit)
httpslidepdfcomreaderfullmajor-project-ramit 2162
12
Figure 3-4 Lice nsed Circles
0
5
10
15
20
25
Licensed Circles (Dec 07) New Circles (Sep 08)
Source TRAI and CRISIL Database
The competition in Indian telecom sector is expected to intensify in near future because
recently new licenses have been granted to some of the existing operators for new circles
and also to new entrants like Unitech Datacom Swan Telecom and Stel These new
players are expected to capture the rural and semi-urban cities of C ircle B and Circle C as
they are now expected to grow at a much faster rate Shorter network rollout time and
competitiveness in the industry will force these entrants to start the ir operation as early as
possible Tower companies like ABC will allow incumbents to start operations in a
particular region just by installing their electronics on the ready-to-use towers thereby
significantly shortening the ro llout time
Moreover a rapidly increasing subscriber base and spectrum crunch would force the
existing telecom operators to maintain the minimum level of QoS Thus to retain existing
subscribers by preventing subscriber churn operators will require additional
infrastructure in their existing areas of operation to be able to offer better QoS This will
also result in increase in demand for telecom infrastructure in the existing markets
(Ramachanran 2009)
882019 Major Project (Ramit)
httpslidepdfcomreaderfullmajor-project-ramit 2262
13
34 Telecom Infrastructure Overview
Passive infrastructure is one of the most important components of a mobile network It
has been a critical area of operations for telecom companies in the past However with
increasing competition posing an urgent need for telecom companies to expand their
coverage and sharpen their focus on core operations so that they can sustain and improve
their market position passive infrastructure has assumed the status of an independent
industry during the past few years The industry (COAI) estimates that there will be a
requirement of around 350000 towers for 500 million subscribers by 2010 (COAI
2009)
Each site has active and passive infrastructure components Active components includethe antenna trans-receivers switches feeder cables Node B and microwave radio
equipments Passive (or non-electronic) components include the land tower shelter air-
conditioning equipment diesel electric generator battery electrical supply technical
premises and easements pylons etc Passive infrastructure in a mobile network
essentially involves acquiring land setting up towers and electrical and civil works that
needs to be in place before operators can install the active infrastructure which brings
mobile services to the consumers In a typical cell site build-out almost 65 of the total
cost is attributed to passive infrastructure and 35 to active infrastructure
(Ramachanran 2009)In this report passive cell site infrastructure has also been
henceforth referred to as towers or sites
The components of a typical base station are shown below
882019 Major Project (Ramit)
httpslidepdfcomreaderfullmajor-project-ramit 2362
14
Picture 3 1 Telecom Tower
Telecom towers are broadly classified on the basis of their placement as Ground-basedand Roof-top
1 Ground-Based Tower Ground-based towers (GBTs) are taller (typically 200 to 400
feet) and are mostly used in rural and semi-urban areas because of the easy
availability of real-estate space there GBTs involve a capital expenditure in the range
882019 Major Project (Ramit)
httpslidepdfcomreaderfullmajor-project-ramit 2462
15
of Rs 3 to 4 million depending on the height of the tower land prices etc
(Ramachanran 2009)
2 Roof-Top Tower (RTT) Roof-top towers (RTTs) are generally placed on the roofsof high-rise buildings They are shorter (than GBTs) and more common in urban and
highly populated areas where there is paucity of real-estate space Typically these
involve a capital expenditure of Rs 15 to 2 million (Ramachanran 2009)
The height of a telecom tower determines the number of antennas that can be
accommodated which in turn determines the capacity of the towers apart from factors
such as location and geographica l conditions (wind speeds type of terrain etc)
35 Telecom Infrastructure- Domestic market
In India there are broadly two kinds of operators in the tower infrastructure industry
Tower infrastructure subsidiaries
Reliance Infratel Limited
Bharti Infratel Limited
Indus Towers Limited
Wireless TT Info Services Limited (WTTIL)
Independent tower infrastructure companies (ITICs)
GTL Infrastructure
Xcel Telecom
Essar Telecom Infrastructure
Aster Infrastructure
Bharat Telemast
882019 Major Project (Ramit)
httpslidepdfcomreaderfullmajor-project-ramit 2562
16
These companies have their business model based largely on contract or anticipatory
approaches Under the contract approach tower companies set up tower sites going by
the requirements of the telecom operators and the terms of the contract are specified
beforehand in the MSAs signed by the two parties Under the anticipatory approachhowever tower companies set up tower infrastructure at sites with reasonable demand
potential and subsequently invite telecom operators to set up their network on these
towers The latter model involves higher business risks as the tower company may not be
able to achieve reasonable tenancy for its tower infrastructure and at profitable terms
BPTL proposes to follow contract approach for its business model
36 Telecom Infrastructure market- Competitive landscape
Figure 3-5 Telecom Infrastructure Market Players
038058154
365692
10381692
26923269
0 20000 40000 60000 80000 100000
Aster InfrastructureAmerican Towers
Essar Telec om Infrastructure
GTL In frastructureWi reles s TT In fo Services Limited
Bharti Infratel Limited
Reli anc e Communications Limitedrsquos
OthersInd us To wers Limited
Number of Towers
Market Players
Source Telecom Regulatory Authority of India and ICRANote Others include tower por tfolios of BSNL MTNL Sistema Shyam Teleservices Aircel etc
In Indian Telecom Infrastructure market competition has intensified significantly with
several players spinning of their tower portfolio and independent operators expanding
their operations
882019 Major Project (Ramit)
httpslidepdfcomreaderfullmajor-project-ramit 2662
17
Bharti Airtel Limited Reliance Communications Limited and Tata Teleservices Limited
have hived off their tower assets into separate tower infrastructure subsidiaries namely
Bharti Infratel Limited Reliance Infratel Limited and Wireless TT Infoservices Limited
respectively Also Bharti Infratel Limited together with Vodafone Essar Limited and IdeaCellular Limited in a joint- venture agreement has created Indiarsquos largest tower
infrastructure company ndash Indus Towers Limited which has an estimated portfolio of
around 88000 towers (Anjan V amp N 2009) Whereas in past few years number of
independent tower infrastructure companies have ventured into the domestic telecom
tower industry These include GTL Infrastructure Limited Essar Telecom Infrastructure
Limited Xcel Telecom Private Limited (American Towers) Tower Vision India Private
Limited Aster Infrastructure Private Limited TVS Interconnect Systems Limited etc
Figure 3-6 Telecom Tower Growth Scenario
0
100
200
300
400
500
600
700
2008 2009 2010 2011 2012 T e
l e c o m
T o w e r s
( T h o u s a n
d s )
Source Telecom Regulatory Authority of IndiaAssumptions Subscriber growth rate of 28 till 2011-12
1400 subscribe per site
As shown above it is expected that in next 4-5 years there will be a requirement of
additional 85000 towers (both GBT and RTT) each year to meet the subscriber base of
800 million by 2011-12 (PwC 2009) This shows that huge investment have to be made
in Indian telecom Infrastructure sector in near future Now since both passive and active
882019 Major Project (Ramit)
httpslidepdfcomreaderfullmajor-project-ramit 2762
18
infrastructure sharing is a llowed (except spectrum) Independent service providers will be
benefited Increase in subscriber base introduction of new technologies like 3G Wi-max
etc and increase in market healthy market competition in telecom services sector will
drive the growth in telecom infrastructure sector
882019 Major Project (Ramit)
httpslidepdfcomreaderfullmajor-project-ramit 2862
19
4 BUSINESS PLAN
41 Passive Infrastructure
Mobile networks have base stations (or cell sites) which have active and passive
infrastructure components Active components include the antenna trans-receivers
switches feeder cables Node B and microwave radio equipments Passive (or non-
electronic) components include the land tower shelter air-conditioning equipment
diesel electric generator battery electrical supply technical premises and easements
pylons etc Passive infrastructure in a mobile network essentially involves acquiring land
setting up towers and electrical and civil works that needs to be in place before operators
can install the active infrastructure which brings mobile services to the consumers In atypical cell site build-out almost 65 of the total cost is attributed to passive
infrastructure and 35 to active infrastructure
42 Infrastructure Sharing
Mobile operators are required to setup more and more BTS (cell) sites due to the
exponential growth of mobile subscribers in India (currently growing at almost 15 4
million subscribers a month) and limited availability of spectrum B and C Circles (wheretraffic density may not be as high as metros and Circle A) are expected to drive future
subscriber growth and requirements for cell sites will be higher to ensure greater
coverage
However creating new infrastructure by each operator separately leads to d uplicat ing
huge capital investments It also contributes to mushroom growth of telecom towers and
deteriorating skylines in urban areas which has already led to some local municipal and
state governments to regulate and restrict the erection of new mobile towers
The continued pressure on cellular tariffs higher infrastructure costs for network
deployment particularly in semi-urban and rural areas and compelling need to reduce
4 As published in ET 8 th May 09 Edition
882019 Major Project (Ramit)
httpslidepdfcomreaderfullmajor-project-ramit 2962
20
time to market for network roll outs have led operators to share and even outsource their
infrastructure requirements from third party infrastructure providers like BPTL GTL and
Indus towers It promotes capital efficiency as it allows more than one service provider to
leverage and ride o n common infrastructure In its simplest form it involves two or moreoperators jointly using the common passive infrastructure in a cell site While viewed
largely as a measure to reduce capital and operating expense such sharing also leads to
improvement of service q uality (by ensuring site space for service providers and reducing
black spots) and the environment (by reducing number of cell sites and towers)
In outsourcing operators take passive infrastructure and tower space from third party
infrastructure companies on a monthly rental basis to host their radio and transmission
equipments Outsourcing provides significant benefits to operators It enables them tosave on capital expenses (it actually converts capital expense into operating expense in
the form of lease rentals) and focus on their core activities of sales marketing and
branding while leaving the cumbersome task of managing the site development process
and site operation and maintenance to third parties who exclusively deal with such
activities
The concept of passive infrastructure sharing is increasingly gaining market acceptancein India So far it has been largely limited to bilateral sharing between operators in the
form of barter where the operators split the site related CAPEX and OPEX costs The
available information suggests that about 25 of the existing 90000 tower sites in India
are currently being shared for passive infrastructure predominantly in rural areas and
small towns
43 Introduction to the business
BPTL is an Infrastructure Provider company that builds owns operates and maintains
passive network infrastructure on a shared basis for mobile telecom operators and ITES
providers Its objective is to provide network design and planning network deployment
882019 Major Project (Ramit)
httpslidepdfcomreaderfullmajor-project-ramit 3062
21
network operations amp maintenance infrastructure management application management
and professional services to teleco m operators and enterprises
The company is planning to raise capital in the form of equity and debt to start its
operation by Aug 09 ABC rsquos vision is to provide world class managed infrastructure ampallied services to the service providers to optimize their service delivery capability In the
initial years of operation the company will focus on telecom sector with almost 100 of
its proposed capital expenditure till FY 14 earmarked for developing and owning passive
infrastructure for sharing among mobile service providers
44 Business Proposal
ABC will provide passive telecom infrastructure on build own operate (BOO) basis inboth ground based (GBS) as well as roof-top sites (RTS) It will undertake full range of
responsibilities in building owning and maintaining the sites and will serve as a single
window one-stop-shop provider of infrastructure services Typical responsibilities are
summarized below
Site planning keeping in view the network rollout plans of prospective customers
Site acquisition including entering into long-term agreements with land owners
Obtaining of necessary regulatory approvals
Erect ion and commissioning of tower and allied equipment
Provision of support services such as back-up power air-conditioning and
security
Provision of turnkey solutions to telecom companies such as sourcing of
equipment testing and maintenance
882019 Major Project (Ramit)
httpslidepdfcomreaderfullmajor-project-ramit 3162
22
Bharat Telemast Private Limited will identify the sites required for setting up the Passive
infrastructure by first of all getting a commitment from one operator who is called as
ldquoAnchor Operatorrdquo Then Bharat Telemast will go ahead to lease (or) buy out the site as
appropriate and commences construction of the cellular sites But the Cellular site will betypically designed for three to four operators While construction is in progress the
marketing team will work towards getting the second and third operator But care will be
taken in such a way that at least two operators are available at the time of completion of
construction
45 Sources of revenue
1 Infrastructure Provisioning Fees ndash fee paid by the operators on a monthly basisWith annual escalation
2 Site lease rental ndash Paid at actual on a monthly basis
3 Operations and maintenance charges Paid on a monthly basis
4 The contract also provides a fixed annual escalator
46 Attractiveness of business model
Stable and predictable cash flow business Once a tower asset is rented out it
usually generates a stable and predictable cash flow in the form of tower rentals
from occupants over the term of the MSA between the two parties
Low working capital requirement ABC rsquos business model is also characterized
by low working capital requirements as most of the operating expenses (such aselectricity and fuel and other variable operating expenses) are reimbursable by the
tenants on actual basis Moreover BPTL is may also be able to get rentals for the
towers in advance and also obtain better credit terms from their suppliers thus
further improving their working capital cycle
882019 Major Project (Ramit)
httpslidepdfcomreaderfullmajor-project-ramit 3262
23
High incremental profitability The operating costs associated with this
business are largely fixed in nature Thus each increment in tenancy is
accompanied by a minimal increase in costs This leads to a more thanproportionate increase in profits for every increase in occupancy
Reduction in capital investments due to present market conditions Due to
present market situation average capital requirement for RTT and GBT sites have
dropped from 2 million and 4 million to 15 million and 33 million ABC wishes
to grab this opportunity which will result in competitive advantage in near future
Extensive usage While on an average a GSM BTS can handle around 100-
1100 subscribers but in the case of high usage areas the figure can be as low as
600-700 subscribers which means a larger number of cell sites would be required
for the same area Moreover the country has the problem of spectrum scarcity
which increases the requirement of towers to maintain a reasonable leve l of
service quality
New entrants Many operators including Vodafone Essar Limited Idea Cellular
Limited Aircel Cellular Limited and Sistema Shyam Teleservices Limited have
received licenses as well spectrum in new circles which would enable them to
become pan-India operators in the next one-two years Also new licenses have
been issued to new players such as Unitech Swan Telecom and S Tel Limited
Given the significant expansion plans of new entrants over the medium term and
the need for them to optimize investments in order to maintain returns demand
for towers is expected to report a sharp increase
Shorter rollout time Indian telecom industry is highly competitive and doing
business for new entrant may not be easy Shorter network-rollout time would be
a critical success factor for the new entrants and a longer rollout time could meanloss of substantial market share to other operators Tower companies allow
players to start operations in a particular region just by installing their electronics
on the ready-to-use towers thereby significantly shortening the rollout time
New technologies 3G services are already launched in the country and to
augment their services various operators plan to launch Wi-Max services as soon
882019 Major Project (Ramit)
httpslidepdfcomreaderfullmajor-project-ramit 3362
24
as they receive additional spectrum from Government This would further
increase the demand for sharing of passive infrastructure
47
Expansion Schedule
BPTL would rollout both RTT and GBT sites of which the RTT sites GBT sites
normally would have a tower height of 50 meters or 60 meters depending on the need for
additional height for installation of microwave antennae based on the location of the site
and number of tenants on the cell site Details of BPTLrsquos expansion plan are summarized
below
Table 41 Expansion PlanExpansion Schedule 2009-10 2010-11 2011-12 2012-13 20013-14
GBT
Addition 210 700 1400 2450 3850
Total 210 910 2310 4760 8610
RTT
Addition 90 300 600 1050 1650
Total 90 390 990 2040 3690
48 Proposed Services
As indicated earlier ABC proposes to provide passive telecom infrastructure on a
sharing co-location basis to cellular operators The sites would either be Ground Based
Sites (GBS) or Roof Top Sites (RTS) As the sites are meant for co-location of the active
components of two to three operators they would be built to either 2-Tenant or 3-Tenant
specifications
The different components of the passive infrastructure facility and the related services
that would be offered by BPTL to the operators are as under
Infrastructure provisioning comprising
882019 Major Project (Ramit)
httpslidepdfcomreaderfullmajor-project-ramit 3462
25
Communication tower built to host multiple antennae
Weather-proof communication shelter with air-conditioning and power backup
arrangement
Diesel generating set and battery bank for power backup
A mobile standby generator to act as backup in case o f breakdown
Warehousing facility
Infrastructure operations and maintenance including
Regular operations and maintenance of the facility
Security of all the equipments at the site at all timesA dedicated team of technicians for a group of 40-50 sites to ensure effect ive and
efficient functioning of the components at all times
49 Proposed Organizational Structure
A senior management team will work under the leadership of the ldquoChief Operations
Officerrdquo who will be responsible for smooth implementation of proj ect activities He willalso assist the managing director in marketing This team will coordinate with Stallion
Telecom Pvt Ltd which will take over the role of procuring Capital Equipments
Senior management will consists of project manager infrastructure manager commercial
manager and head (legal and company affairs Apart from this there will be a requirement
Chief OperatingOfficer
Project Manager Infrastructure
Manager
Commercial
Manager (projects)
Head (Legal and
Company Affairs)
882019 Major Project (Ramit)
httpslidepdfcomreaderfullmajor-project-ramit 3562
26
of security sentries (3 per GBT site) supervisors (one for every 10 sites) and cluster
manager (one for every 50 sites)
Bharat Telemast will carry out the complete Project execution with the assistance of third party ldquoQuality control organizationrdquo and a third party ldquoProject management teamrdquo
Quality control and project management activities will be o utsourced to a third party
882019 Major Project (Ramit)
httpslidepdfcomreaderfullmajor-project-ramit 3662
27
5 METHODOLOGY
The changing face of infrastructure services creates a complex situation which demands
greater understanding of roles of competition regulatory structures and modes of
financing Knowledge of such things is a key decisive factor in building confidence
among investors promoters and government In project finance the project its assets
contract and cash flows are separated from promoter in order to permit credit appraisal
or loan to the project
As part of the financial feasibility analysis a series of related financial statements based
on projected sources and uses of funds during the development and operating phaseproject were created Financial statements consist of expenses associated with
development activities including capital costs like acquisition of land for GBT sites cost
of tower generator shelter batteries etc Most of the data regarding capital costs are
obtained from the promoter of ABC Limited All these capital costs related details are
provided in annexure 1
Assumption regarding depreciation capital structure operating expenses expansion
schedule tenancy ratios tariff or rent operatorrsquos fees and loan amortization schedule are
obtained from professional accountants Promoter and bankers of ABC Limited
Due to unknown factors that could influence the cost of towers or fees associated with
completing the project (soft costs) contingency costs were estimated at 5 of hard and
soft costs respectively If contingency is set too low developers could easily encounter
funding shortfalls upon slight changes in market forces All other costs were estimated
based on talking with industry professionals (Promoters)
A detailed financial model was prepared based on existing accounting standards and
following financial ratios were estimated
882019 Major Project (Ramit)
httpslidepdfcomreaderfullmajor-project-ramit 3762
28
EBITDA margin Profit and loss accounts for the estimated project period (15
Years) were prepared based on which estimated earnings before interests tax
depreciat ion and amortization were calculated for each year Detailed PampL
balance sheet and cash flow statements are provided in annexure 2 3 and 4
EBITDA = Total Revenue ndash (Variable expenses + Fixed Expenses)
EBITDA margin = EBITDA Total Revenue
PAT margin PAT is calculated by subtracting interests pa id on capital debt and
working capital debt depreciation and applicable corporate income tax from
EBITDA
PAT = EBITDA ndash Interest Payable ndash Depreciation ndash Income tax
PAT margin = PATTotal Revenue
Working Capital Working capital requirement is calculated by subtract ing
current liabilities from current assets Current assets are estimated based on 30
days cash requirement and current liabilities are estimated as half of salary
monthly expenses
WC = Current Assets ndash Current Liabilities
UFCF It is defined as the free cash flows available to the firm if the firm has
zero debt liability Purpose of ca lculat ing UFCF for project period is to determinethe project IRR
UFCF = PAT + Depreciation + Interest (tax adjusted) + Release of WC + Salvage
value of the assets ndash CAPEX ndash Change in WC
882019 Major Project (Ramit)
httpslidepdfcomreaderfullmajor-project-ramit 3862
29
LCFF It is defined as the cash floes available to the firm after paying interests on
long term and short term debts
LCFF = UFCF ndash Interest (tax adjusted)
FCFE It is defined as the free cash flow available to equity holders It is
determined to ca lculate equity IRR for equity investors It also includes the tax
benefits which are available as per the Income Tax Act
FCFE PAT + Depreciation + Salvage Value ndash Equity Investment ndash Long term debt
repayment
PIRR Project IRR is defined as the discount rate at which NPV (Net Present
Value) of UFCF is zero It is calculated by using following formula
UFCF 1 (1+PIRR) 0+ UFCF 2 (1+PIRR) 1+ UFCF 3 (1+PIRR) 2+ helliphelliphelliphelliphelliphellip = 0
UFCF 1 = UFCF at the end of first year of operation
UFCF 2 = UFCF at the end of second year of operation
PIRR = Project IRR
EIRR Equity IRR is defined as the discount rate at which NPV of FCFE is zero
It is calculated by using following formula
FCFE1 (1+EIRR) 0+ FCFE 2 (1+EIRR) 1+ FCFE 3 (1+EIRR) 2+ helliphelliphelliphelliphelliphellip = 0
FCFE1 = FCFE at the end of first year of operation
FCFE2 = FCFE at the end of seco nd year of operation
EIRR = Equity IRR
882019 Major Project (Ramit)
httpslidepdfcomreaderfullmajor-project-ramit 3962
30
WACC It is de fined as the percentage of return expected by the investors who
otherwise would have earned some return by investing in some other project
WACC = Cost of Debt (Debt Capital) + Cost of equity (Equity Capital)
882019 Major Project (Ramit)
httpslidepdfcomreaderfullmajor-project-ramit 4062
882019 Major Project (Ramit)
httpslidepdfcomreaderfullmajor-project-ramit 4162
32
62 Funding planAs the telecom sites are rolled out over a 5 year period till FY 2014 investment will be
required for each year ABC Limited will start generating profits from FY 10 only Such
internally generated cash accruals will be ploughed back into the business to meet part of
the project cost Investment required for each year is tabulated below
Table 61 Funding ProposalMillion INR FY 10 FY 11 FY 12 FY 13 FY 14
GBT Tower (Additional) Nos 210 700 1400 2450 3850
RTT Tower (Additional) Nos 90 300 600 1050 1650DE ratio 233 233 233 233 233
Additional CAPEX 83892 279374 558748 977809 1536557
Debt 58725 195562 391124 684466 1075590
Equity 25168 83812 167624 293343 460967
63 Results
Based on assumptions given in Annexure 1 a detailed financial model was preparedResults of the financial model such as PampL account Balance Sheet and cash flow
statements are provided in Annexure 2 3 and 4 Forecasts for the key financial figures for
first five years are provided in the Table below
Forecasts
Table 62 Income StatementMillion INR FY-10 FY11 FY12 FY-13 FY-14
Sales 7124 50511 156766 347476 667700
Cost of sales 1950 13852 39252 87612 170021
Gross 5174 36659 117514 259864 497679
7263 7258 7496 7479 7454
Admin costs 112 179 190 203 216
882019 Major Project (Ramit)
httpslidepdfcomreaderfullmajor-project-ramit 4262
33
Finance cost 0 021 7401 31330 77725
Taxation 170 4233 14536 29073 53547
PAT 2454 19458 59470 122096 223267
As shown in Table above during the expansion period revenue will grow exponentially
In the first year of operation ABC will earn a revenue of INR 7124 million from 300
(210 GBT and 90 RTT) sites with a tenancy ratio of 15 for GBS and 17 for RTS In the
first 2 years of operation the company will not pay any interest on long term debt due to
2 years moratorium period Major cost associated with the project is depreciation due to
which PAT is lower than the operating profits But cash flows to the firm are enough to
result in reasonable returns
Table 63 Balance Shee tYear ending Mar-10 Mar-11 Mar-12 Mar-13 Mar-14
AssetsGross Block 75742 328216 833164 1716823 3105430Accumulated depreciation 2439 15208 51125 128287 271212Net Block 73303 313009 782040 1588536 2834219Net Working Capital 064 241 620 1335 2515Cash Balance 12979 72089 216513 488856 947982
Total Assets 86346 385339 999172 2078727 3784715LiabilitiesEquity 25168 108980 276604 569947 1030914Reserves amp Surplus 2454 21912 81381 203477 426745Long term Debt 58725 254286 640722 1304302 2325171WC Borrowings - 161 465 1001 1886Total Liabilities 86346 385339 999172 2078727 3784715
Note All figures are in Million INR
Table 64 Key financial ratiosMar-11 Mar-12 Mar-13 Mar-14 Mar-15
Revenue Growth 60902 21036 12165 9216 3890EBITDA Growth 62061 22161 12132 9158 4020
PAT Growth 69293 20564 10531 8286 2955
As shown in table above increase in EBITDA is higher than that of revenue This is due
to better operational efficiency of ABCrsquos management and economies of scale S imilarly
882019 Major Project (Ramit)
httpslidepdfcomreaderfullmajor-project-ramit 4362
34
increase in PAT is lesser than that of EBITDA because of high depreciation and interest
expenses
Table 65 Pr ofitability r atios
Mar-11 Mar-12 Mar-13 Mar-14 Mar-15
EBITDA Margin 7222 7484 7473 7450 7520
PAT Margin 3852 3794 3514 3344 3119Return on Net Worth 622 760 769 788 1087
Key profitability ratios are shown in table above Return on net worth in the initial years
is lower because of the ambitious expansion plans of ABC Limited Thereafter return on
net worth increases with increase in PAT
Returns on Investment
Table 66 Financial returnsFinancial Indicators
Project IRR 1813Equity IRR 3609
64 Sensitivity Analysis
A sensitivity analysis has been carried out on the project financials to determine theimpact of key variables on the financial indicators namely
Project IRR
The key variables on which sensitivity analysis have been carried out areCapital expenditure for GBS and RTS1st and 2 nd tenant tariff for GBS1st and 2 nd tenant tariff for RTSTenancy Ratio
Similarly sensitivity analysis has been carried out forEquity IRR
The key variables on which sensitivity analysis have been carried out for EIRR are
Capital structure and interest rate for capital debtRepayment period and moratorium period
882019 Major Project (Ramit)
httpslidepdfcomreaderfullmajor-project-ramit 4462
35
The impact on the financial indicators is shown below
Figure 6-1 Project IRR vs GBT and RTT CAPEX
As shown in Figure 6-1 project IRR is more sensitive to change in CAPEX of RTT sitesas compared to change in CAPEX of GBT sites because tenancy ratio and tariff for RTTsites are higher than those of GBT sites
882019 Major Project (Ramit)
httpslidepdfcomreaderfullmajor-project-ramit 4562
36
Figure 6-2 Project IRR vs GBT Tariff for 1 st tenant (X-axis) and 2 nd tenant (right-hand side)
As shown in Figure 6-2 project IRR varies linearly with GBT tariff In the best casescenario when GBT tariff for 1 st tenant is INR 34000month and GBT tariff for secondtenant is INR 26000month Project IRR is 2101
Figure 6-3 Project IRR vs RTT Tariff for 1 st tenant (X-axis) and 2 nd tenant (right-hand side)
As shown in Figure 6-2 project IRR varies linearly with RTT tariff In the best casescenario when RTT tariff for 1 st tenant is INR 24000month and RTT tariff for second
882019 Major Project (Ramit)
httpslidepdfcomreaderfullmajor-project-ramit 4662
37
tenant is INR 20000month Project IRR is 1932 Project IRR is more sensitivetowards RTT tariff than GBT tariff because in practical business situation RTT siteshave a tenancy ratio of more than two due to which effect of tariff for 1 st tenant almostget nullified after few years
Figure 6-4 Project IRR vs Tenancy ratio for RTT sites (X-axis) and GBT sites
As shown in Figure 6-4 project IRR is very sensitive to tenancy ratio In the best casescenario where GBT sites have a tenancy ratio of 2 and RTT sites have a tenancy ratio of 3 project IRR can be as high as 20
Figure 6-5 Equity IRR vs long term debt interest rate for different leverage level
882019 Major Project (Ramit)
httpslidepdfcomreaderfullmajor-project-ramit 4762
38
As shown in figure 6-5 equity IRR is more sensitive to interest rate on long term debt forhigh level of leverage (lower debt equity ratio) because as the debt equity ratio increasesinterest paid on long term debt also increases significantly
Figure 6-6 Equity IRR vs long term debt repayment period at different level of moratoriumperiods
As shown in figure 6-6 Equity IRR increases with increase in moratorium period anddebt repayment period The variation is from 1654 to 60 for worst case and best casescenarios
882019 Major Project (Ramit)
httpslidepdfcomreaderfullmajor-project-ramit 4862
39
7 RISK ASSESSMENTRisk Mitigation strategyExecution Risk
(Project management landacquisition etc)
Management of ABC has proven expertise in
telecom infrastructure rollout and has executedvarious projects with large telecom operators andMNC vendorsABCrsquos top management team consists of a groupof professionals drawn from leading telecomInfrastructure Company who have immenseexpertise and experience in rolling out telecominfrastructure projects
Market Risk (No entry barriers operators may
share infrastructure betweenthemselves large players withhigh capital may increasecompetition)
India has a huge potential for telecominfrastructure market With increasing
competition falling tariffs and pressure onmargins telecom service providers are beingforced to increase their focus on marketing andreduce their expensesExperienced management healthy capital back-up effective presence in the telecominfrastructure market and value added services atrelatively lesser cost will help ABC to meet theset targets
Financing Risk
(Availability of equity capitalavailability of long term debtinterest rate and moratoriumperiod)
ABC is seeking private equity partner to secure
equity capital Company has already entered intoNDA with 2 major investorsLong term debt at an interest rate of 125 canbe easily arranged because of the credibility of the promoters in the marketMany other similar firms like Indus and GTLhave already secured long term debt for amoratorium period of 2 years Promoters of ABCLimited are confident to secure a long term debtwith a moratorium period of 2 years and apayback period of 8 years
ABC Limited would minimize the workingcapital requirements of its business by securingrentals and operating revenues in advance fromits clients and or by suitably structuring itspayment liabilities to match its cash inflows
Commercial Risk (Tenancy ratio and tariff forGBS and RTS)
ABC would aim to enter into long term contractswith the ldquoanchor tenantrdquo operator and thenrollout the infrastructure so that at least single
882019 Major Project (Ramit)
httpslidepdfcomreaderfullmajor-project-ramit 4962
40
occupancy of each site is ensured at all t imesPromoters will use its knowledge of the businessand its expertise to identify and roll out sites inlocations which have strong multi- tenancypotential to minimize occupancy risk
Revenue Risk (Operating fees may decreasecredit worthiness of the clientsdelay in payment of rentals)
As per the industry sources till now not even asingle operator have dishonored the long termlease contractThe credit risk is diversified as there will bemultiple operatorsABC would aggressively market to get 3G andWiFi broadcasters to use the sites and earnadditional revenues in addition to the assumedrevenue streams
Natural Calamities Risk The Company shall maintain insurance for thesites against these risks and the cost of insurancewill be priced in and passed on to the tenants
882019 Major Project (Ramit)
httpslidepdfcomreaderfullmajor-project-ramit 5062
41
8 CONCLUSION
India is the fastest growing wireless telecom market in the world The continuing
growth in the number of wireless subscribers and MoUs and increasing trend of
outsourcing of business processes to India has led to growing demand for large
investments in the telecom infrastructure in the country
However with increasing competition falling tariffs and pressure on margins
telecom service providers are being forced to increase their focus on marketing
customer acquisitions and branding and minimize their efforts and overheads in
project management and asset acquisition
Further with rising prices of steel cement and real estate the cost of developing
and owning passive infrastructure is increasingly becoming a costly proposition
for most operators and service providers
The compulsion on the part of service providers to reduce their operating costs
and capital expenditure requirements has led to opportunities in passiveinfrastructure outsourcing to independent third party infrastructure providers and
also sharing the infrastructure with other service providers It is expected that
cellular operators will outsource their communications site infrastructure needs as
a means of accelerating access to their markets and preserving capital rather than
constructing and operating their own communications sites and maintaining their
own communications sites service and deve lopment capabilities
Passive infrastructure is highly capital intensive and an integral part of the cellular
service providersrsquo networks Yet being a simple and low technology asset it is
amenable to outsourcing and sharing By transferring the responsibility of
ownership development and maintenance of passive infrastructure service
882019 Major Project (Ramit)
httpslidepdfcomreaderfullmajor-project-ramit 5162
42
providers have an opportunity to transfer a substantial part of their business risk to
third parties
Most telecom operators are facing capacity constraints on their networksCoverage obligations increasing pressure to improve network quality and
competition has led to aggressive roll out plans by existing cellular operators
Installation of cell sites has become a cumbersome process as there are a number
of clearances required and involves labor-intensive micro management
Availability of ready infrastructure from third party providers would enable the
operators to reduce their time to market and accelerate their access to their
customers Cellular service providers generally want to move quickly when
adding more sites and co-location on an existing site is always faster than
building
Ownership and maintenance of telecom towers and other infrastructure by third
parties is an established practice in developed nations like USA and is
increasingly gaining market acceptance in India
The Indian government is seriously considering promoting the infrastructure
sharing route between the telecom operator and private players to achieve future
national tele-density targets and improve rural telecom penetration
ABC being an independent entity with no business conflicts with other service
providers in the telecom space will be best positioned and have an early mover
advantage to capitalize on this emerging opportunity
Further the task of operating and maintaining the passive infrastructure in the cell
is increasingly becoming a cumbersome exercise for the service providers to
handle ABCrsquos composite offering to build passive infrastructure for the cellular
operators and also operate and maintain them will provide a turnkey solution to
address the infrastructure needs of the service providers
882019 Major Project (Ramit)
httpslidepdfcomreaderfullmajor-project-ramit 5262
43
The business model proposed to be followed by ABC is fairly simple with stable
and predictable cash flows as is the case with the business model of the tower
renting companies in USA Most contracts are long term for a period 10 or moreyears with annual price escalators generally ranging from 3 to 4 However
wireless carriers normally tend to renew rentals because suitable alternative sites
may not exist or be available and repositioning a site in a carrierrsquos network is
expensive and may adverse ly affect network quality
Site ownership and operations is a ldquoscalerdquo business operating administration
marketing expenses etc do not rise as quickly as revenues when portfolios are
expanded Incremental operating costs associated with adding wireless tenants to
a communications site are minimal Therefore as additional tenants are added to a
site the substantial majority of incremental revenue contributes to margin
expansion Most tower companies have high EBITDA margins as may be seen
from the financial indicators of some of the tower rental companies in USA
It is expected that site location and capacity price and quality of service and
successful execution of contracts will be the most significant competitive factors
in this business
ABCrsquos revenue and returns on investment will be primarily driven by its ability
to
o Increase the utilization of the space and infrastructure capacity owned by it by
increasing the number of tenants per site and renting out to maximum number
of users As discussed above return on capital employed (PIRR and EIRR) arevery sensitive to tenancy ratio In worst case scenario project IRR can be as
low as 8 and in the best case scenario it can be as high as 20
o Develop acquire sites of strategic importance and high growth potential that
will enable them to secure better commercial terms from users and attract
more number of tenants Infrastructure provisioning fees rentals for sites are
882019 Major Project (Ramit)
httpslidepdfcomreaderfullmajor-project-ramit 5362
44
extremely location sensitive There is a potential to acquire more land than
that of required to capitalize on the increase in real estate prices
o Develop sites in a cost effective manner ABC would consider purchasing
land only for those GBS sites which have sufficient demand and arestrategically located Else for most of its sites land will be leasehold As
shown above returns (PIRR and EIRR) are very sensitive to capital costs In
the worst case scenario project IRR can be as low as 15 whereas it can as
high as 27 in the best case scenario
o Negotiate and secure long term contracts with good credit quality users with
built in price escalation provisions to mitigate financing risk
o Leverage and secure long term financing at attractive terms and involve in
active treasury management to keep low financing cost Results of the
sensitivity analysis indicate that equity IRR can be as high as 60 foe a
moratorium period of 4 years and interest rate of 10
o Minimize working capital requirements
o Maintain low operating and administration expense
o Secure better OampM margins from operators and retain a healthy share of it in
ABC
o Maintain high service standards and build strong customer relationships
The business would have the potential to capture new revenue opportunities
around the existing assets As demand for towers is expected to grow and as
operators migrate to speedier next-generation wireless technologies they will
need the towers and associated passive infrastructure to transmit their new
services in addition to their existing offerings In addition to increasing capacity
and coverage and improving the quality of their networks cellular serviceproviders are deploying high speed data networks driving incremental demand of
sites The business therefore has potential upsides in the form of adding
customers (tenants) in wireless broadband third generation (ldquo3Grdquo) and wireless
data capabilities and also other incremental value propositions by way of hosting
882019 Major Project (Ramit)
httpslidepdfcomreaderfullmajor-project-ramit 5462
45
Billboards Hoardings etc in some of the high visible sites owned and maintained
by it
Based on the assumptions and subject to satisfactory resolution of the key risks
factors project cash flows will be able to meet debt service obligations
This business model is a lucrative investment option for a private equity player
because valuation of each site will increase in the coming years due to
improvement in market conditions increase in the value of land and increase in
the demand for passive infrastructure in rural and semi-urban areas
882019 Major Project (Ramit)
httpslidepdfcomreaderfullmajor-project-ramit 5562
46
REFERENCESAnjan G V A amp N M (2009) telecom infrastructure industry in india GurgaonICRA
Bessler W Norsworthy J amp Shusterman T (2001 12 1) Mergers in the UStelecommunications industry and market valuationeffects IEEE p 288
COAI (2009 march 14) Subscriber Figures Retrieved march 14 2009 fromCOAIcom httpwwwcoaicomstatisticsphp
IDA (2009 march 23) Highlights Retrieved march 23 2009 from idagovsghttpwwwidagovsghomeindexaspx
K R (2008) Time for new business model Delhi Cybermedia
MAXIS (2009 march 8) the malaysian telecommunications industry Retrieved march9 2009 from maxiscommyhttpwwwmaxiscommypersonalabout_usinvestorprospectusprospectus4pdf
P J amp Lisa A (2009) Stimulas spending and American Telecom Industry USACoracle group
PwC (2009 march 12) Indian Telecom Industry Gurgaon Harayana IndiaRamachanran (2009 march 1) Investment in Telecom Infrastructure sector (M RInterviewer)
Vogelsang I (2002) The German Telecommunications Reform Verein fuumlr Socialpolitik (p 26) Innsbruck Boston Press
882019 Major Project (Ramit)
httpslidepdfcomreaderfullmajor-project-ramit 5662
47
ANNEXURES
ANNEXURE 1 Key Assumptions
The occupancy of each site by single two three operators for green-field sites is assumed
to be as follows
Table 91 Expected Tenancy RatiosFY 10 FY 11 FY 12 FY 13 FY 14 FY15
GBT Tenant
Ratio 150 150 170 170 170 200
Single Operator 50 50 30 30 30 0
Two Operator 50 50 70 70 70 100
RTT Tenant
Ratio 170 170 200 200 200 250
Single Operator 30 30 0 0 0 0
Two Operator 70 70 100 100 100 50
Three Operator 0 0 0 0 0 50
From FY 15 onwards tenancy ratio of 2 and 25 for GBT and RTT sites is cons idered
882019 Major Project (Ramit)
httpslidepdfcomreaderfullmajor-project-ramit 5762
48
Capital costs related assumptions are tabulated below
Table 92 GBT and RTT Capital Cost
The lease rentals for RTT sites are reimbursed from the operators and therefore have not
been factored in the revenues as well as the expense For GBT sites land purchase cost of
035 millions assumed which has been escalated by 6 annually to determine the
salvage value of assets
GBT Capital Costs
Million
INR
Delivery cost of Ground Based
Tower (GBT)063
Delivery cost of Generator 030
Civil Work 040Shelter 012
Electrical Works 030
Other Equipments (UPS Battery
etc)045
Construction cost 045
Land 035
Contingency amp Financial Charges 035Total cost 335
RTT Capital Costs
Million
INR
Delivery cost of Roof Top
Tower (RTT) 030
Delivery cost of Generator 020
Civil Work 020Shelter 012
Electrical Works 030
Other Equipments (UPS
Battery etc) 030
Construction cost -
Land -
Contingency amp FinancialCharges 008
Total cost 150
882019 Major Project (Ramit)
httpslidepdfcomreaderfullmajor-project-ramit 5862
49
Ope rating costs related assumptions are tabulated below
Table 93 Operating CostsOperating Costs
Security Sentries (INRMonth) 4000
Supervisors (INRMonth) 6000
Cluster Manager One for Fifty Towers (INRMonth) 15000
Annual increase 500
Number of Security Sentries per tower 300
Number of supervisors per tower 010
Number of C luster manager per tower 002
Fixed Expenses
Selling amp Maintenance (INRMonth) 4000000
Annual Escalation 5
Administration overhead (INRMonth) 10000000Annual Escalation 7
AMC Cost of Generator 15 (cost of generator)
Annual Escalation (AMC) 3
For RTT sites security sentries are not required because it will be the responsibility of
the site owner A supervisor will for every 10 sites and a cluster manager for every 50
sites will be required
882019 Major Project (Ramit)
httpslidepdfcomreaderfullmajor-project-ramit 5962
50
Table 94 Long term debtInterest Rate 125 per annum
Moratorium 2 years
Repayment Period 8 years
Tariff related assumptions and date of operations are tabulated below
Table 95 GBT and RTT Tariff Table 96 Life of the projectTariff Plan
Tariff (INRMonth)
No of
operators GBT RTT
1 28000 18000
2 22000 14000
3 0 12000
Annual
increase 3 3
Commercial Operation Date 1-Aug-09
Quarter Ending 30-Sep-09
FY ending COD 31-Mar-10
Project life years 15
End of commercial
operations31-Aug-24
Quarter ending commercial
operations30-Sep-24
FY ending comme rcial
operations31-Mar-25
882019 Major Project (Ramit)
httpslidepdfcomreaderfullmajor-project-ramit 6062
51
Annexure 2 Profit amp Loss accountsTable 97 Profit amp loss account statement
Income Statement (MNINR)Year ending Mar-10 Mar-11 Mar-12 Mar-13 Mar-14 Mar-15
RevenueGBT 406350 28811 89080 197447 379409 527015Operator Fees (GBT) 1411 10004 30678 67998 130664 179664RTT 1209 8575 27269 60443 116146 164264
Operator Fees (RTT) 440 3121 9739 21587 41481 56466Net Revenue 7124 50511 156766 347476 667700 927410
Expenses
VariableSecurity Sentries 1355 9790 28339 64033 125433 158238Supervisors 097 699 2024 4574 8959 11303Cluster Manager 048 350 10 12 2287 4480 5651AMC Cost of Generator 450 3013 7877 16719 31148 54541Sub-total 1950 13852 39252 87612 170021 229734
Fixed
Selling amp Maintenance(INRMonth) 032 050 053 056 058 061
Administration overhead(INRMonth) 080 128 137 147 157 168
Sub-total 112 179 190 203 216 230
EBITDA 5062 36480 117324 259661 497464 697447
Interest on LT loan - - 7341 31200 77479 156198Interest on ST loan - 021 060 130 245 361
EBDT 5062 36459 109923 228331 419739 540888Depreciation 2439 12769 35917 77162 142925 174006
EBT 2624 23691 74006 151169 276814 366881Income Tax 170 4233 14536 29073 53547 77634
PAT 2454 19458 59470 122096 223267 289247
882019 Major Project (Ramit)
httpslidepdfcomreaderfullmajor-project-ramit 6162
52
Annexure 3 Balance sheet
Table 98 B alance sheetsYearend Balance Sheet (MNINR)Year ending Mar-10 Mar-11 Mar-12 Mar-13 Mar-14 Mar-15
AssetsGross Block 75742 328216 833164 1716823 3105430 3105430Accumulated depreciation 2439 15208 51125 128287 271212 445218Net Block 73303 313009 782040 1588536 2834219 2660212Net Working Capital 064 241 620 1335 2515 3707Cash Balance 12979 72089 216513 488856 947982 1294734Total Assets 86346 385339 999172 2078727 3784715 3958653
LiabilitiesEquity 25168 108980 276604 569947 1030914 1030914Reserves amp Surplus 2454 21912 81381 203477 426745 715992Long term Debt 58725 254286 640722 1304302 2325171 2208967WC Borrowings - 161 465 1001 1886 2780Total Liabilities 86346 385339 999172 2078727 3784715 3958653
882019 Major Project (Ramit)
httpslidepdfcomreaderfullmajor-project-ramit 6262
Annexure 4 Cash flow statement
Table 99 Cash flow statements
Year ending Mar-10 Mar-11 Mar-12 Mar-13 Mar-14 Mar-15
InflowsPAT 2454 19458 59470 122096 223267 289247Depreciation 2439 12769 35917 77162 142925 174006Tax adjusted interest - 014 4959 20991 52076 104895Release of WC - - - - - -Salvage Value - - - - - -Sub-Total 4893 32241 100345 220249 418268 568148
OutflowsCapex 75742 252474 504948 883659 1388607 -Change in WorkingCapital 064 177 379 715 1180 1192
Sub-Total 75806 252651 505327 884374 1389787 1192
UFCF (70913) (220410) (404982) (664125) (971519) 566956LFCF (70913) (220424) (409940) (685116) (1023595) 462062
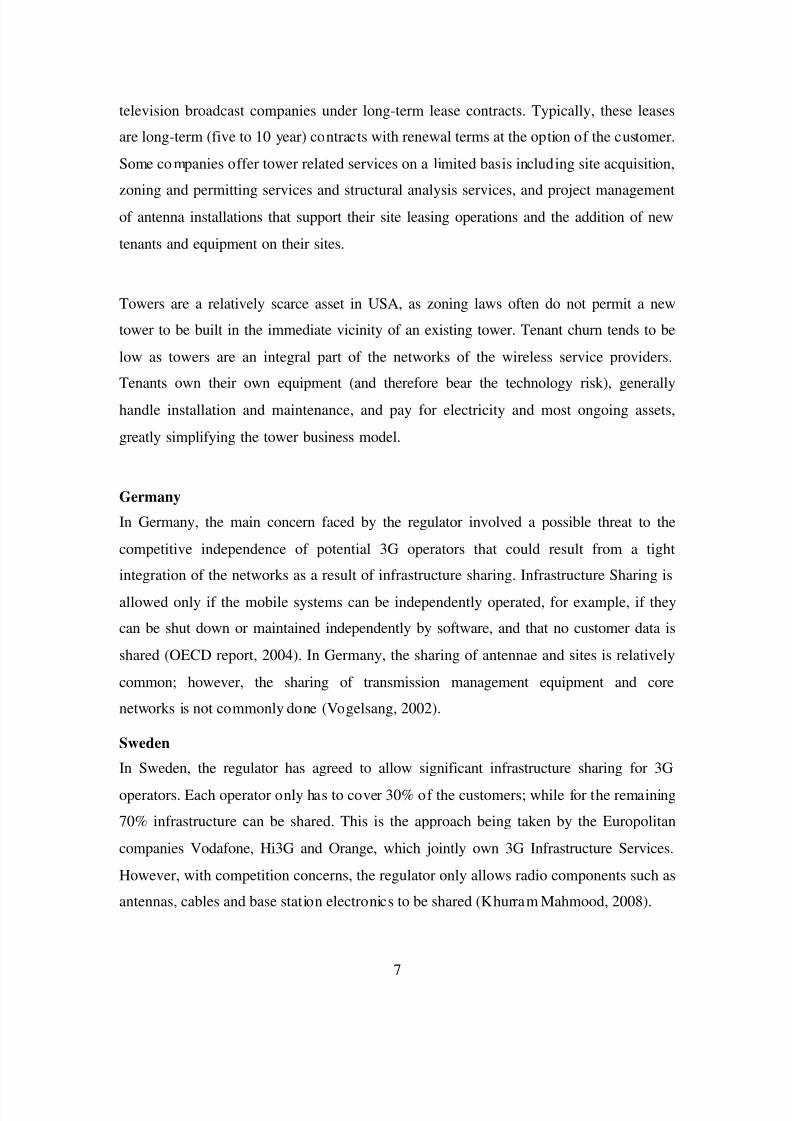
882019 Major Project (Ramit)
httpslidepdfcomreaderfullmajor-project-ramit 1762
8
Singapore
In the case of Singapore the regulatorrsquos infrastructure sharing approach is guided by the
primary policy goal of encouraging facilities-based competition Under the current
regulatory framework licensees are generally not required to share any infrastructure that
it controls with its competitors Each licensee is expected to build or lease the use of the
infrastructure it requires Notwithstanding this however infrastructure sharing is
mandated in areas where there are clear space and operating constraints For 2G and 3G
licensees such matters relate to infrastructure in the Mass Rapid Transit and underground
road tunnels The regulator has also allowed the co-location of base stations and sharing
of transmission towers and masts to reduce the impact on the environment and to
minimize the inconvenience to building owners and residents (IDA 2009)
Malaysia
Taking a different approach in Malaysia operators owning network facilities have been
encouraged by the regulator to share infrastructure as a means of lowering costs and
expanding coverage as well as to avoid a duplication of resources To this effect a
Memorandum of Understanding to share infrastructure has been executed between the
mobile operators To further catalyze infrastructure sharing the concept of a third party
provider of facilities is also being promoted in Malaysia Under this concept of a third
party will build the infrastructure and lease capacity or space to existing se rvice
providers This concept not only provides ready-made sites but will also help reduce the
numbers of telecommunication towers that have to be dealt with by local authorities
(MAXIS 2009)
882019 Major Project (Ramit)
httpslidepdfcomreaderfullmajor-project-ramit 1862
9
32 Domestic Telecom Market assessment
The Indian Telecom Industry-Historical perspective
The Indian telecommunication industry was originally a government controlled
monopoly comprising three state owned operators
MTNL (which provided wire-line services in Mumbai and Delhi metropolitan
areas)
DOT (which provided wire-line services to rest of the country)
VSNL (which provided international services)
Liberalization started in 1991 with opening up of mobile services to private sectorparticipation The country was divided into 23 circles comprising of four metropol9otan
areas (Chennai Delhi Kolkata and Mumbai) and 19 other circles broadly defined by
parameters of states (K 2008) These 19 non-metropolitan circles have been categorized
as A B and C circles in descending order of their revenue generation potential (as
shown below)
Table 31 Telecom Circles
MetropolitanAreas Circle A Circle B Circle C
Delhi ChennaiMumbai Kolkata
Gujarat KarnatakaAP Tamil NaduMaharashtra
Punjab Kera laHaryana UP (West)Rajasthan UP(East) MP WestBengal
HP JampK North-East OrissaAssam Bihar
In 1997 TRAI was formed for regulating the operations and policy making process of
Indian telecommunication sector Since its liberalization India has experienced sustained
and impressive growth in its telecommunication sector primarily because of progressive
regulatory regime strong demand for mobile telecommunication services and
strengthening economy The country has achieved distinction of having worldrsquos lowest
tariff fastest growth ion subscriber base and availability of some of the cheapest mobile
handsets
882019 Major Project (Ramit)
httpslidepdfcomreaderfullmajor-project-ramit 1962
10
Figure 3-1 Growth of Subscriber base
Growth of Subscriber base
050
100150200250300350
1998 1999 2000 2001 2002 2003 2004 2005 2006 2007 2008
Year
M i l l i o n
Source Telecom Regulatory Authority of India Database
India is the second largest mobile market in the world is also among the fastest growing
mobile markets globally The total number of mobile subscribers in India (ie the
subscriber base) has crossed 300 million with 30049 million subscribers as on 31st
March 2008 The growth of subscriber base during the past decade (1998-2008) is
indicated above in a chart
Figure 3-2 Mobile Penetration Rate
0 10 20 30 40 50 60 70 80 90 100
North-East ( C)Assam (C)
Bihar ( C)Jammu amp Kashmir (C)
Orissa (C)Him achal Pradesh (C)
Uttar Pradesh ( B)Madhya Pradesh (B)
Rajastan (B)Haryana (B)
Punjab (B)West Bengal (B)
Kerala (B)Maharashtra (A)
Gujarat (A)Tamil Nadu (A)
Andhra Pradesh (A)Karnataka (A)
Kolkata (Metro)Chennai (Metro)Mumbai (Metro)
Delhi (Metro)
Source TRAI and PwC DatabaseNote As on Dec 08
882019 Major Project (Ramit)
httpslidepdfcomreaderfullmajor-project-ramit 2062
11
Indian telecom industry has experienced a high growth rate in Metros and class A circles
with coverage reaching around 90 and 35 respectively However coverage in the
Class B and Class C cities is still low at 15-25 Growth in Class B and Class C circles
has concentrated in urban area while penetration in rural area remains lower Thus futuregrowth is likely to come largely from Class B and C circles and rural areas Keeping this
in view larger players like Bharti Airtel Limited Reliance Communications Limited and
Bharat Sanchar Nigam Limited (BSNL) are largely focusing on increasing their
geographical coverage in Class B and C c ircles
33 Telecom Market- Competitive landscape
Figure 3-3 Market Share
Bharti2668
BSNLMTNL1908
Reliance1971
Vodafone661
Tata1047
Idea1033
Aircel457
Spice181
BPL056
HFCL013
Shyam005
Market Share
Source TRAI and Pw C Database
Indian mobile sector is largely concentrated with top 4 market players (Bharti Airtel
Reliance Communication Vodafone Essar and BSNL) out of 10 capturing almost three-
fourth of the entire market This is also partly on account of the fact that these four
operators have their presence in a larger number of circles as compared with other
players
882019 Major Project (Ramit)
httpslidepdfcomreaderfullmajor-project-ramit 2162
12
Figure 3-4 Lice nsed Circles
0
5
10
15
20
25
Licensed Circles (Dec 07) New Circles (Sep 08)
Source TRAI and CRISIL Database
The competition in Indian telecom sector is expected to intensify in near future because
recently new licenses have been granted to some of the existing operators for new circles
and also to new entrants like Unitech Datacom Swan Telecom and Stel These new
players are expected to capture the rural and semi-urban cities of C ircle B and Circle C as
they are now expected to grow at a much faster rate Shorter network rollout time and
competitiveness in the industry will force these entrants to start the ir operation as early as
possible Tower companies like ABC will allow incumbents to start operations in a
particular region just by installing their electronics on the ready-to-use towers thereby
significantly shortening the ro llout time
Moreover a rapidly increasing subscriber base and spectrum crunch would force the
existing telecom operators to maintain the minimum level of QoS Thus to retain existing
subscribers by preventing subscriber churn operators will require additional
infrastructure in their existing areas of operation to be able to offer better QoS This will
also result in increase in demand for telecom infrastructure in the existing markets
(Ramachanran 2009)
882019 Major Project (Ramit)
httpslidepdfcomreaderfullmajor-project-ramit 2262
13
34 Telecom Infrastructure Overview
Passive infrastructure is one of the most important components of a mobile network It
has been a critical area of operations for telecom companies in the past However with
increasing competition posing an urgent need for telecom companies to expand their
coverage and sharpen their focus on core operations so that they can sustain and improve
their market position passive infrastructure has assumed the status of an independent
industry during the past few years The industry (COAI) estimates that there will be a
requirement of around 350000 towers for 500 million subscribers by 2010 (COAI
2009)
Each site has active and passive infrastructure components Active components includethe antenna trans-receivers switches feeder cables Node B and microwave radio
equipments Passive (or non-electronic) components include the land tower shelter air-
conditioning equipment diesel electric generator battery electrical supply technical
premises and easements pylons etc Passive infrastructure in a mobile network
essentially involves acquiring land setting up towers and electrical and civil works that
needs to be in place before operators can install the active infrastructure which brings
mobile services to the consumers In a typical cell site build-out almost 65 of the total
cost is attributed to passive infrastructure and 35 to active infrastructure
(Ramachanran 2009)In this report passive cell site infrastructure has also been
henceforth referred to as towers or sites
The components of a typical base station are shown below
882019 Major Project (Ramit)
httpslidepdfcomreaderfullmajor-project-ramit 2362
14
Picture 3 1 Telecom Tower
Telecom towers are broadly classified on the basis of their placement as Ground-basedand Roof-top
1 Ground-Based Tower Ground-based towers (GBTs) are taller (typically 200 to 400
feet) and are mostly used in rural and semi-urban areas because of the easy
availability of real-estate space there GBTs involve a capital expenditure in the range
882019 Major Project (Ramit)
httpslidepdfcomreaderfullmajor-project-ramit 2462
15
of Rs 3 to 4 million depending on the height of the tower land prices etc
(Ramachanran 2009)
2 Roof-Top Tower (RTT) Roof-top towers (RTTs) are generally placed on the roofsof high-rise buildings They are shorter (than GBTs) and more common in urban and
highly populated areas where there is paucity of real-estate space Typically these
involve a capital expenditure of Rs 15 to 2 million (Ramachanran 2009)
The height of a telecom tower determines the number of antennas that can be
accommodated which in turn determines the capacity of the towers apart from factors
such as location and geographica l conditions (wind speeds type of terrain etc)
35 Telecom Infrastructure- Domestic market
In India there are broadly two kinds of operators in the tower infrastructure industry
Tower infrastructure subsidiaries
Reliance Infratel Limited
Bharti Infratel Limited
Indus Towers Limited
Wireless TT Info Services Limited (WTTIL)
Independent tower infrastructure companies (ITICs)
GTL Infrastructure
Xcel Telecom
Essar Telecom Infrastructure
Aster Infrastructure
Bharat Telemast
882019 Major Project (Ramit)
httpslidepdfcomreaderfullmajor-project-ramit 2562
16
These companies have their business model based largely on contract or anticipatory
approaches Under the contract approach tower companies set up tower sites going by
the requirements of the telecom operators and the terms of the contract are specified
beforehand in the MSAs signed by the two parties Under the anticipatory approachhowever tower companies set up tower infrastructure at sites with reasonable demand
potential and subsequently invite telecom operators to set up their network on these
towers The latter model involves higher business risks as the tower company may not be
able to achieve reasonable tenancy for its tower infrastructure and at profitable terms
BPTL proposes to follow contract approach for its business model
36 Telecom Infrastructure market- Competitive landscape
Figure 3-5 Telecom Infrastructure Market Players
038058154
365692
10381692
26923269
0 20000 40000 60000 80000 100000
Aster InfrastructureAmerican Towers
Essar Telec om Infrastructure
GTL In frastructureWi reles s TT In fo Services Limited
Bharti Infratel Limited
Reli anc e Communications Limitedrsquos
OthersInd us To wers Limited
Number of Towers
Market Players
Source Telecom Regulatory Authority of India and ICRANote Others include tower por tfolios of BSNL MTNL Sistema Shyam Teleservices Aircel etc
In Indian Telecom Infrastructure market competition has intensified significantly with
several players spinning of their tower portfolio and independent operators expanding
their operations
882019 Major Project (Ramit)
httpslidepdfcomreaderfullmajor-project-ramit 2662
17
Bharti Airtel Limited Reliance Communications Limited and Tata Teleservices Limited
have hived off their tower assets into separate tower infrastructure subsidiaries namely
Bharti Infratel Limited Reliance Infratel Limited and Wireless TT Infoservices Limited
respectively Also Bharti Infratel Limited together with Vodafone Essar Limited and IdeaCellular Limited in a joint- venture agreement has created Indiarsquos largest tower
infrastructure company ndash Indus Towers Limited which has an estimated portfolio of
around 88000 towers (Anjan V amp N 2009) Whereas in past few years number of
independent tower infrastructure companies have ventured into the domestic telecom
tower industry These include GTL Infrastructure Limited Essar Telecom Infrastructure
Limited Xcel Telecom Private Limited (American Towers) Tower Vision India Private
Limited Aster Infrastructure Private Limited TVS Interconnect Systems Limited etc
Figure 3-6 Telecom Tower Growth Scenario
0
100
200
300
400
500
600
700
2008 2009 2010 2011 2012 T e
l e c o m
T o w e r s
( T h o u s a n
d s )
Source Telecom Regulatory Authority of IndiaAssumptions Subscriber growth rate of 28 till 2011-12
1400 subscribe per site
As shown above it is expected that in next 4-5 years there will be a requirement of
additional 85000 towers (both GBT and RTT) each year to meet the subscriber base of
800 million by 2011-12 (PwC 2009) This shows that huge investment have to be made
in Indian telecom Infrastructure sector in near future Now since both passive and active
882019 Major Project (Ramit)
httpslidepdfcomreaderfullmajor-project-ramit 2762
18
infrastructure sharing is a llowed (except spectrum) Independent service providers will be
benefited Increase in subscriber base introduction of new technologies like 3G Wi-max
etc and increase in market healthy market competition in telecom services sector will
drive the growth in telecom infrastructure sector
882019 Major Project (Ramit)
httpslidepdfcomreaderfullmajor-project-ramit 2862
19
4 BUSINESS PLAN
41 Passive Infrastructure
Mobile networks have base stations (or cell sites) which have active and passive
infrastructure components Active components include the antenna trans-receivers
switches feeder cables Node B and microwave radio equipments Passive (or non-
electronic) components include the land tower shelter air-conditioning equipment
diesel electric generator battery electrical supply technical premises and easements
pylons etc Passive infrastructure in a mobile network essentially involves acquiring land
setting up towers and electrical and civil works that needs to be in place before operators
can install the active infrastructure which brings mobile services to the consumers In atypical cell site build-out almost 65 of the total cost is attributed to passive
infrastructure and 35 to active infrastructure
42 Infrastructure Sharing
Mobile operators are required to setup more and more BTS (cell) sites due to the
exponential growth of mobile subscribers in India (currently growing at almost 15 4
million subscribers a month) and limited availability of spectrum B and C Circles (wheretraffic density may not be as high as metros and Circle A) are expected to drive future
subscriber growth and requirements for cell sites will be higher to ensure greater
coverage
However creating new infrastructure by each operator separately leads to d uplicat ing
huge capital investments It also contributes to mushroom growth of telecom towers and
deteriorating skylines in urban areas which has already led to some local municipal and
state governments to regulate and restrict the erection of new mobile towers
The continued pressure on cellular tariffs higher infrastructure costs for network
deployment particularly in semi-urban and rural areas and compelling need to reduce
4 As published in ET 8 th May 09 Edition
882019 Major Project (Ramit)
httpslidepdfcomreaderfullmajor-project-ramit 2962
20
time to market for network roll outs have led operators to share and even outsource their
infrastructure requirements from third party infrastructure providers like BPTL GTL and
Indus towers It promotes capital efficiency as it allows more than one service provider to
leverage and ride o n common infrastructure In its simplest form it involves two or moreoperators jointly using the common passive infrastructure in a cell site While viewed
largely as a measure to reduce capital and operating expense such sharing also leads to
improvement of service q uality (by ensuring site space for service providers and reducing
black spots) and the environment (by reducing number of cell sites and towers)
In outsourcing operators take passive infrastructure and tower space from third party
infrastructure companies on a monthly rental basis to host their radio and transmission
equipments Outsourcing provides significant benefits to operators It enables them tosave on capital expenses (it actually converts capital expense into operating expense in
the form of lease rentals) and focus on their core activities of sales marketing and
branding while leaving the cumbersome task of managing the site development process
and site operation and maintenance to third parties who exclusively deal with such
activities
The concept of passive infrastructure sharing is increasingly gaining market acceptancein India So far it has been largely limited to bilateral sharing between operators in the
form of barter where the operators split the site related CAPEX and OPEX costs The
available information suggests that about 25 of the existing 90000 tower sites in India
are currently being shared for passive infrastructure predominantly in rural areas and
small towns
43 Introduction to the business
BPTL is an Infrastructure Provider company that builds owns operates and maintains
passive network infrastructure on a shared basis for mobile telecom operators and ITES
providers Its objective is to provide network design and planning network deployment
882019 Major Project (Ramit)
httpslidepdfcomreaderfullmajor-project-ramit 3062
21
network operations amp maintenance infrastructure management application management
and professional services to teleco m operators and enterprises
The company is planning to raise capital in the form of equity and debt to start its
operation by Aug 09 ABC rsquos vision is to provide world class managed infrastructure ampallied services to the service providers to optimize their service delivery capability In the
initial years of operation the company will focus on telecom sector with almost 100 of
its proposed capital expenditure till FY 14 earmarked for developing and owning passive
infrastructure for sharing among mobile service providers
44 Business Proposal
ABC will provide passive telecom infrastructure on build own operate (BOO) basis inboth ground based (GBS) as well as roof-top sites (RTS) It will undertake full range of
responsibilities in building owning and maintaining the sites and will serve as a single
window one-stop-shop provider of infrastructure services Typical responsibilities are
summarized below
Site planning keeping in view the network rollout plans of prospective customers
Site acquisition including entering into long-term agreements with land owners
Obtaining of necessary regulatory approvals
Erect ion and commissioning of tower and allied equipment
Provision of support services such as back-up power air-conditioning and
security
Provision of turnkey solutions to telecom companies such as sourcing of
equipment testing and maintenance
882019 Major Project (Ramit)
httpslidepdfcomreaderfullmajor-project-ramit 3162
22
Bharat Telemast Private Limited will identify the sites required for setting up the Passive
infrastructure by first of all getting a commitment from one operator who is called as
ldquoAnchor Operatorrdquo Then Bharat Telemast will go ahead to lease (or) buy out the site as
appropriate and commences construction of the cellular sites But the Cellular site will betypically designed for three to four operators While construction is in progress the
marketing team will work towards getting the second and third operator But care will be
taken in such a way that at least two operators are available at the time of completion of
construction
45 Sources of revenue
1 Infrastructure Provisioning Fees ndash fee paid by the operators on a monthly basisWith annual escalation
2 Site lease rental ndash Paid at actual on a monthly basis
3 Operations and maintenance charges Paid on a monthly basis
4 The contract also provides a fixed annual escalator
46 Attractiveness of business model
Stable and predictable cash flow business Once a tower asset is rented out it
usually generates a stable and predictable cash flow in the form of tower rentals
from occupants over the term of the MSA between the two parties
Low working capital requirement ABC rsquos business model is also characterized
by low working capital requirements as most of the operating expenses (such aselectricity and fuel and other variable operating expenses) are reimbursable by the
tenants on actual basis Moreover BPTL is may also be able to get rentals for the
towers in advance and also obtain better credit terms from their suppliers thus
further improving their working capital cycle
882019 Major Project (Ramit)
httpslidepdfcomreaderfullmajor-project-ramit 3262
23
High incremental profitability The operating costs associated with this
business are largely fixed in nature Thus each increment in tenancy is
accompanied by a minimal increase in costs This leads to a more thanproportionate increase in profits for every increase in occupancy
Reduction in capital investments due to present market conditions Due to
present market situation average capital requirement for RTT and GBT sites have
dropped from 2 million and 4 million to 15 million and 33 million ABC wishes
to grab this opportunity which will result in competitive advantage in near future
Extensive usage While on an average a GSM BTS can handle around 100-
1100 subscribers but in the case of high usage areas the figure can be as low as
600-700 subscribers which means a larger number of cell sites would be required
for the same area Moreover the country has the problem of spectrum scarcity
which increases the requirement of towers to maintain a reasonable leve l of
service quality
New entrants Many operators including Vodafone Essar Limited Idea Cellular
Limited Aircel Cellular Limited and Sistema Shyam Teleservices Limited have
received licenses as well spectrum in new circles which would enable them to
become pan-India operators in the next one-two years Also new licenses have
been issued to new players such as Unitech Swan Telecom and S Tel Limited
Given the significant expansion plans of new entrants over the medium term and
the need for them to optimize investments in order to maintain returns demand
for towers is expected to report a sharp increase
Shorter rollout time Indian telecom industry is highly competitive and doing
business for new entrant may not be easy Shorter network-rollout time would be
a critical success factor for the new entrants and a longer rollout time could meanloss of substantial market share to other operators Tower companies allow
players to start operations in a particular region just by installing their electronics
on the ready-to-use towers thereby significantly shortening the rollout time
New technologies 3G services are already launched in the country and to
augment their services various operators plan to launch Wi-Max services as soon
882019 Major Project (Ramit)
httpslidepdfcomreaderfullmajor-project-ramit 3362
24
as they receive additional spectrum from Government This would further
increase the demand for sharing of passive infrastructure
47
Expansion Schedule
BPTL would rollout both RTT and GBT sites of which the RTT sites GBT sites
normally would have a tower height of 50 meters or 60 meters depending on the need for
additional height for installation of microwave antennae based on the location of the site
and number of tenants on the cell site Details of BPTLrsquos expansion plan are summarized
below
Table 41 Expansion PlanExpansion Schedule 2009-10 2010-11 2011-12 2012-13 20013-14
GBT
Addition 210 700 1400 2450 3850
Total 210 910 2310 4760 8610
RTT
Addition 90 300 600 1050 1650
Total 90 390 990 2040 3690
48 Proposed Services
As indicated earlier ABC proposes to provide passive telecom infrastructure on a
sharing co-location basis to cellular operators The sites would either be Ground Based
Sites (GBS) or Roof Top Sites (RTS) As the sites are meant for co-location of the active
components of two to three operators they would be built to either 2-Tenant or 3-Tenant
specifications
The different components of the passive infrastructure facility and the related services
that would be offered by BPTL to the operators are as under
Infrastructure provisioning comprising
882019 Major Project (Ramit)
httpslidepdfcomreaderfullmajor-project-ramit 3462
25
Communication tower built to host multiple antennae
Weather-proof communication shelter with air-conditioning and power backup
arrangement
Diesel generating set and battery bank for power backup
A mobile standby generator to act as backup in case o f breakdown
Warehousing facility
Infrastructure operations and maintenance including
Regular operations and maintenance of the facility
Security of all the equipments at the site at all timesA dedicated team of technicians for a group of 40-50 sites to ensure effect ive and
efficient functioning of the components at all times
49 Proposed Organizational Structure
A senior management team will work under the leadership of the ldquoChief Operations
Officerrdquo who will be responsible for smooth implementation of proj ect activities He willalso assist the managing director in marketing This team will coordinate with Stallion
Telecom Pvt Ltd which will take over the role of procuring Capital Equipments
Senior management will consists of project manager infrastructure manager commercial
manager and head (legal and company affairs Apart from this there will be a requirement
Chief OperatingOfficer
Project Manager Infrastructure
Manager
Commercial
Manager (projects)
Head (Legal and
Company Affairs)
882019 Major Project (Ramit)
httpslidepdfcomreaderfullmajor-project-ramit 3562
26
of security sentries (3 per GBT site) supervisors (one for every 10 sites) and cluster
manager (one for every 50 sites)
Bharat Telemast will carry out the complete Project execution with the assistance of third party ldquoQuality control organizationrdquo and a third party ldquoProject management teamrdquo
Quality control and project management activities will be o utsourced to a third party
882019 Major Project (Ramit)
httpslidepdfcomreaderfullmajor-project-ramit 3662
27
5 METHODOLOGY
The changing face of infrastructure services creates a complex situation which demands
greater understanding of roles of competition regulatory structures and modes of
financing Knowledge of such things is a key decisive factor in building confidence
among investors promoters and government In project finance the project its assets
contract and cash flows are separated from promoter in order to permit credit appraisal
or loan to the project
As part of the financial feasibility analysis a series of related financial statements based
on projected sources and uses of funds during the development and operating phaseproject were created Financial statements consist of expenses associated with
development activities including capital costs like acquisition of land for GBT sites cost
of tower generator shelter batteries etc Most of the data regarding capital costs are
obtained from the promoter of ABC Limited All these capital costs related details are
provided in annexure 1
Assumption regarding depreciation capital structure operating expenses expansion
schedule tenancy ratios tariff or rent operatorrsquos fees and loan amortization schedule are
obtained from professional accountants Promoter and bankers of ABC Limited
Due to unknown factors that could influence the cost of towers or fees associated with
completing the project (soft costs) contingency costs were estimated at 5 of hard and
soft costs respectively If contingency is set too low developers could easily encounter
funding shortfalls upon slight changes in market forces All other costs were estimated
based on talking with industry professionals (Promoters)
A detailed financial model was prepared based on existing accounting standards and
following financial ratios were estimated
882019 Major Project (Ramit)
httpslidepdfcomreaderfullmajor-project-ramit 3762
28
EBITDA margin Profit and loss accounts for the estimated project period (15
Years) were prepared based on which estimated earnings before interests tax
depreciat ion and amortization were calculated for each year Detailed PampL
balance sheet and cash flow statements are provided in annexure 2 3 and 4
EBITDA = Total Revenue ndash (Variable expenses + Fixed Expenses)
EBITDA margin = EBITDA Total Revenue
PAT margin PAT is calculated by subtracting interests pa id on capital debt and
working capital debt depreciation and applicable corporate income tax from
EBITDA
PAT = EBITDA ndash Interest Payable ndash Depreciation ndash Income tax
PAT margin = PATTotal Revenue
Working Capital Working capital requirement is calculated by subtract ing
current liabilities from current assets Current assets are estimated based on 30
days cash requirement and current liabilities are estimated as half of salary
monthly expenses
WC = Current Assets ndash Current Liabilities
UFCF It is defined as the free cash flows available to the firm if the firm has
zero debt liability Purpose of ca lculat ing UFCF for project period is to determinethe project IRR
UFCF = PAT + Depreciation + Interest (tax adjusted) + Release of WC + Salvage
value of the assets ndash CAPEX ndash Change in WC
882019 Major Project (Ramit)
httpslidepdfcomreaderfullmajor-project-ramit 3862
29
LCFF It is defined as the cash floes available to the firm after paying interests on
long term and short term debts
LCFF = UFCF ndash Interest (tax adjusted)
FCFE It is defined as the free cash flow available to equity holders It is
determined to ca lculate equity IRR for equity investors It also includes the tax
benefits which are available as per the Income Tax Act
FCFE PAT + Depreciation + Salvage Value ndash Equity Investment ndash Long term debt
repayment
PIRR Project IRR is defined as the discount rate at which NPV (Net Present
Value) of UFCF is zero It is calculated by using following formula
UFCF 1 (1+PIRR) 0+ UFCF 2 (1+PIRR) 1+ UFCF 3 (1+PIRR) 2+ helliphelliphelliphelliphelliphellip = 0
UFCF 1 = UFCF at the end of first year of operation
UFCF 2 = UFCF at the end of second year of operation
PIRR = Project IRR
EIRR Equity IRR is defined as the discount rate at which NPV of FCFE is zero
It is calculated by using following formula
FCFE1 (1+EIRR) 0+ FCFE 2 (1+EIRR) 1+ FCFE 3 (1+EIRR) 2+ helliphelliphelliphelliphelliphellip = 0
FCFE1 = FCFE at the end of first year of operation
FCFE2 = FCFE at the end of seco nd year of operation
EIRR = Equity IRR
882019 Major Project (Ramit)
httpslidepdfcomreaderfullmajor-project-ramit 3962
30
WACC It is de fined as the percentage of return expected by the investors who
otherwise would have earned some return by investing in some other project
WACC = Cost of Debt (Debt Capital) + Cost of equity (Equity Capital)
882019 Major Project (Ramit)
httpslidepdfcomreaderfullmajor-project-ramit 4062
882019 Major Project (Ramit)
httpslidepdfcomreaderfullmajor-project-ramit 4162
32
62 Funding planAs the telecom sites are rolled out over a 5 year period till FY 2014 investment will be
required for each year ABC Limited will start generating profits from FY 10 only Such
internally generated cash accruals will be ploughed back into the business to meet part of
the project cost Investment required for each year is tabulated below
Table 61 Funding ProposalMillion INR FY 10 FY 11 FY 12 FY 13 FY 14
GBT Tower (Additional) Nos 210 700 1400 2450 3850
RTT Tower (Additional) Nos 90 300 600 1050 1650DE ratio 233 233 233 233 233
Additional CAPEX 83892 279374 558748 977809 1536557
Debt 58725 195562 391124 684466 1075590
Equity 25168 83812 167624 293343 460967
63 Results
Based on assumptions given in Annexure 1 a detailed financial model was preparedResults of the financial model such as PampL account Balance Sheet and cash flow
statements are provided in Annexure 2 3 and 4 Forecasts for the key financial figures for
first five years are provided in the Table below
Forecasts
Table 62 Income StatementMillion INR FY-10 FY11 FY12 FY-13 FY-14
Sales 7124 50511 156766 347476 667700
Cost of sales 1950 13852 39252 87612 170021
Gross 5174 36659 117514 259864 497679
7263 7258 7496 7479 7454
Admin costs 112 179 190 203 216
882019 Major Project (Ramit)
httpslidepdfcomreaderfullmajor-project-ramit 4262
33
Finance cost 0 021 7401 31330 77725
Taxation 170 4233 14536 29073 53547
PAT 2454 19458 59470 122096 223267
As shown in Table above during the expansion period revenue will grow exponentially
In the first year of operation ABC will earn a revenue of INR 7124 million from 300
(210 GBT and 90 RTT) sites with a tenancy ratio of 15 for GBS and 17 for RTS In the
first 2 years of operation the company will not pay any interest on long term debt due to
2 years moratorium period Major cost associated with the project is depreciation due to
which PAT is lower than the operating profits But cash flows to the firm are enough to
result in reasonable returns
Table 63 Balance Shee tYear ending Mar-10 Mar-11 Mar-12 Mar-13 Mar-14
AssetsGross Block 75742 328216 833164 1716823 3105430Accumulated depreciation 2439 15208 51125 128287 271212Net Block 73303 313009 782040 1588536 2834219Net Working Capital 064 241 620 1335 2515Cash Balance 12979 72089 216513 488856 947982
Total Assets 86346 385339 999172 2078727 3784715LiabilitiesEquity 25168 108980 276604 569947 1030914Reserves amp Surplus 2454 21912 81381 203477 426745Long term Debt 58725 254286 640722 1304302 2325171WC Borrowings - 161 465 1001 1886Total Liabilities 86346 385339 999172 2078727 3784715
Note All figures are in Million INR
Table 64 Key financial ratiosMar-11 Mar-12 Mar-13 Mar-14 Mar-15
Revenue Growth 60902 21036 12165 9216 3890EBITDA Growth 62061 22161 12132 9158 4020
PAT Growth 69293 20564 10531 8286 2955
As shown in table above increase in EBITDA is higher than that of revenue This is due
to better operational efficiency of ABCrsquos management and economies of scale S imilarly
882019 Major Project (Ramit)
httpslidepdfcomreaderfullmajor-project-ramit 4362
34
increase in PAT is lesser than that of EBITDA because of high depreciation and interest
expenses
Table 65 Pr ofitability r atios
Mar-11 Mar-12 Mar-13 Mar-14 Mar-15
EBITDA Margin 7222 7484 7473 7450 7520
PAT Margin 3852 3794 3514 3344 3119Return on Net Worth 622 760 769 788 1087
Key profitability ratios are shown in table above Return on net worth in the initial years
is lower because of the ambitious expansion plans of ABC Limited Thereafter return on
net worth increases with increase in PAT
Returns on Investment
Table 66 Financial returnsFinancial Indicators
Project IRR 1813Equity IRR 3609
64 Sensitivity Analysis
A sensitivity analysis has been carried out on the project financials to determine theimpact of key variables on the financial indicators namely
Project IRR
The key variables on which sensitivity analysis have been carried out areCapital expenditure for GBS and RTS1st and 2 nd tenant tariff for GBS1st and 2 nd tenant tariff for RTSTenancy Ratio
Similarly sensitivity analysis has been carried out forEquity IRR
The key variables on which sensitivity analysis have been carried out for EIRR are
Capital structure and interest rate for capital debtRepayment period and moratorium period
882019 Major Project (Ramit)
httpslidepdfcomreaderfullmajor-project-ramit 4462
35
The impact on the financial indicators is shown below
Figure 6-1 Project IRR vs GBT and RTT CAPEX
As shown in Figure 6-1 project IRR is more sensitive to change in CAPEX of RTT sitesas compared to change in CAPEX of GBT sites because tenancy ratio and tariff for RTTsites are higher than those of GBT sites
882019 Major Project (Ramit)
httpslidepdfcomreaderfullmajor-project-ramit 4562
36
Figure 6-2 Project IRR vs GBT Tariff for 1 st tenant (X-axis) and 2 nd tenant (right-hand side)
As shown in Figure 6-2 project IRR varies linearly with GBT tariff In the best casescenario when GBT tariff for 1 st tenant is INR 34000month and GBT tariff for secondtenant is INR 26000month Project IRR is 2101
Figure 6-3 Project IRR vs RTT Tariff for 1 st tenant (X-axis) and 2 nd tenant (right-hand side)
As shown in Figure 6-2 project IRR varies linearly with RTT tariff In the best casescenario when RTT tariff for 1 st tenant is INR 24000month and RTT tariff for second
882019 Major Project (Ramit)
httpslidepdfcomreaderfullmajor-project-ramit 4662
37
tenant is INR 20000month Project IRR is 1932 Project IRR is more sensitivetowards RTT tariff than GBT tariff because in practical business situation RTT siteshave a tenancy ratio of more than two due to which effect of tariff for 1 st tenant almostget nullified after few years
Figure 6-4 Project IRR vs Tenancy ratio for RTT sites (X-axis) and GBT sites
As shown in Figure 6-4 project IRR is very sensitive to tenancy ratio In the best casescenario where GBT sites have a tenancy ratio of 2 and RTT sites have a tenancy ratio of 3 project IRR can be as high as 20
Figure 6-5 Equity IRR vs long term debt interest rate for different leverage level
882019 Major Project (Ramit)
httpslidepdfcomreaderfullmajor-project-ramit 4762
38
As shown in figure 6-5 equity IRR is more sensitive to interest rate on long term debt forhigh level of leverage (lower debt equity ratio) because as the debt equity ratio increasesinterest paid on long term debt also increases significantly
Figure 6-6 Equity IRR vs long term debt repayment period at different level of moratoriumperiods
As shown in figure 6-6 Equity IRR increases with increase in moratorium period anddebt repayment period The variation is from 1654 to 60 for worst case and best casescenarios
882019 Major Project (Ramit)
httpslidepdfcomreaderfullmajor-project-ramit 4862
39
7 RISK ASSESSMENTRisk Mitigation strategyExecution Risk
(Project management landacquisition etc)
Management of ABC has proven expertise in
telecom infrastructure rollout and has executedvarious projects with large telecom operators andMNC vendorsABCrsquos top management team consists of a groupof professionals drawn from leading telecomInfrastructure Company who have immenseexpertise and experience in rolling out telecominfrastructure projects
Market Risk (No entry barriers operators may
share infrastructure betweenthemselves large players withhigh capital may increasecompetition)
India has a huge potential for telecominfrastructure market With increasing
competition falling tariffs and pressure onmargins telecom service providers are beingforced to increase their focus on marketing andreduce their expensesExperienced management healthy capital back-up effective presence in the telecominfrastructure market and value added services atrelatively lesser cost will help ABC to meet theset targets
Financing Risk
(Availability of equity capitalavailability of long term debtinterest rate and moratoriumperiod)
ABC is seeking private equity partner to secure
equity capital Company has already entered intoNDA with 2 major investorsLong term debt at an interest rate of 125 canbe easily arranged because of the credibility of the promoters in the marketMany other similar firms like Indus and GTLhave already secured long term debt for amoratorium period of 2 years Promoters of ABCLimited are confident to secure a long term debtwith a moratorium period of 2 years and apayback period of 8 years
ABC Limited would minimize the workingcapital requirements of its business by securingrentals and operating revenues in advance fromits clients and or by suitably structuring itspayment liabilities to match its cash inflows
Commercial Risk (Tenancy ratio and tariff forGBS and RTS)
ABC would aim to enter into long term contractswith the ldquoanchor tenantrdquo operator and thenrollout the infrastructure so that at least single
882019 Major Project (Ramit)
httpslidepdfcomreaderfullmajor-project-ramit 4962
40
occupancy of each site is ensured at all t imesPromoters will use its knowledge of the businessand its expertise to identify and roll out sites inlocations which have strong multi- tenancypotential to minimize occupancy risk
Revenue Risk (Operating fees may decreasecredit worthiness of the clientsdelay in payment of rentals)
As per the industry sources till now not even asingle operator have dishonored the long termlease contractThe credit risk is diversified as there will bemultiple operatorsABC would aggressively market to get 3G andWiFi broadcasters to use the sites and earnadditional revenues in addition to the assumedrevenue streams
Natural Calamities Risk The Company shall maintain insurance for thesites against these risks and the cost of insurancewill be priced in and passed on to the tenants
882019 Major Project (Ramit)
httpslidepdfcomreaderfullmajor-project-ramit 5062
41
8 CONCLUSION
India is the fastest growing wireless telecom market in the world The continuing
growth in the number of wireless subscribers and MoUs and increasing trend of
outsourcing of business processes to India has led to growing demand for large
investments in the telecom infrastructure in the country
However with increasing competition falling tariffs and pressure on margins
telecom service providers are being forced to increase their focus on marketing
customer acquisitions and branding and minimize their efforts and overheads in
project management and asset acquisition
Further with rising prices of steel cement and real estate the cost of developing
and owning passive infrastructure is increasingly becoming a costly proposition
for most operators and service providers
The compulsion on the part of service providers to reduce their operating costs
and capital expenditure requirements has led to opportunities in passiveinfrastructure outsourcing to independent third party infrastructure providers and
also sharing the infrastructure with other service providers It is expected that
cellular operators will outsource their communications site infrastructure needs as
a means of accelerating access to their markets and preserving capital rather than
constructing and operating their own communications sites and maintaining their
own communications sites service and deve lopment capabilities
Passive infrastructure is highly capital intensive and an integral part of the cellular
service providersrsquo networks Yet being a simple and low technology asset it is
amenable to outsourcing and sharing By transferring the responsibility of
ownership development and maintenance of passive infrastructure service
882019 Major Project (Ramit)
httpslidepdfcomreaderfullmajor-project-ramit 5162
42
providers have an opportunity to transfer a substantial part of their business risk to
third parties
Most telecom operators are facing capacity constraints on their networksCoverage obligations increasing pressure to improve network quality and
competition has led to aggressive roll out plans by existing cellular operators
Installation of cell sites has become a cumbersome process as there are a number
of clearances required and involves labor-intensive micro management
Availability of ready infrastructure from third party providers would enable the
operators to reduce their time to market and accelerate their access to their
customers Cellular service providers generally want to move quickly when
adding more sites and co-location on an existing site is always faster than
building
Ownership and maintenance of telecom towers and other infrastructure by third
parties is an established practice in developed nations like USA and is
increasingly gaining market acceptance in India
The Indian government is seriously considering promoting the infrastructure
sharing route between the telecom operator and private players to achieve future
national tele-density targets and improve rural telecom penetration
ABC being an independent entity with no business conflicts with other service
providers in the telecom space will be best positioned and have an early mover
advantage to capitalize on this emerging opportunity
Further the task of operating and maintaining the passive infrastructure in the cell
is increasingly becoming a cumbersome exercise for the service providers to
handle ABCrsquos composite offering to build passive infrastructure for the cellular
operators and also operate and maintain them will provide a turnkey solution to
address the infrastructure needs of the service providers
882019 Major Project (Ramit)
httpslidepdfcomreaderfullmajor-project-ramit 5262
43
The business model proposed to be followed by ABC is fairly simple with stable
and predictable cash flows as is the case with the business model of the tower
renting companies in USA Most contracts are long term for a period 10 or moreyears with annual price escalators generally ranging from 3 to 4 However
wireless carriers normally tend to renew rentals because suitable alternative sites
may not exist or be available and repositioning a site in a carrierrsquos network is
expensive and may adverse ly affect network quality
Site ownership and operations is a ldquoscalerdquo business operating administration
marketing expenses etc do not rise as quickly as revenues when portfolios are
expanded Incremental operating costs associated with adding wireless tenants to
a communications site are minimal Therefore as additional tenants are added to a
site the substantial majority of incremental revenue contributes to margin
expansion Most tower companies have high EBITDA margins as may be seen
from the financial indicators of some of the tower rental companies in USA
It is expected that site location and capacity price and quality of service and
successful execution of contracts will be the most significant competitive factors
in this business
ABCrsquos revenue and returns on investment will be primarily driven by its ability
to
o Increase the utilization of the space and infrastructure capacity owned by it by
increasing the number of tenants per site and renting out to maximum number
of users As discussed above return on capital employed (PIRR and EIRR) arevery sensitive to tenancy ratio In worst case scenario project IRR can be as
low as 8 and in the best case scenario it can be as high as 20
o Develop acquire sites of strategic importance and high growth potential that
will enable them to secure better commercial terms from users and attract
more number of tenants Infrastructure provisioning fees rentals for sites are
882019 Major Project (Ramit)
httpslidepdfcomreaderfullmajor-project-ramit 5362
44
extremely location sensitive There is a potential to acquire more land than
that of required to capitalize on the increase in real estate prices
o Develop sites in a cost effective manner ABC would consider purchasing
land only for those GBS sites which have sufficient demand and arestrategically located Else for most of its sites land will be leasehold As
shown above returns (PIRR and EIRR) are very sensitive to capital costs In
the worst case scenario project IRR can be as low as 15 whereas it can as
high as 27 in the best case scenario
o Negotiate and secure long term contracts with good credit quality users with
built in price escalation provisions to mitigate financing risk
o Leverage and secure long term financing at attractive terms and involve in
active treasury management to keep low financing cost Results of the
sensitivity analysis indicate that equity IRR can be as high as 60 foe a
moratorium period of 4 years and interest rate of 10
o Minimize working capital requirements
o Maintain low operating and administration expense
o Secure better OampM margins from operators and retain a healthy share of it in
ABC
o Maintain high service standards and build strong customer relationships
The business would have the potential to capture new revenue opportunities
around the existing assets As demand for towers is expected to grow and as
operators migrate to speedier next-generation wireless technologies they will
need the towers and associated passive infrastructure to transmit their new
services in addition to their existing offerings In addition to increasing capacity
and coverage and improving the quality of their networks cellular serviceproviders are deploying high speed data networks driving incremental demand of
sites The business therefore has potential upsides in the form of adding
customers (tenants) in wireless broadband third generation (ldquo3Grdquo) and wireless
data capabilities and also other incremental value propositions by way of hosting
882019 Major Project (Ramit)
httpslidepdfcomreaderfullmajor-project-ramit 5462
45
Billboards Hoardings etc in some of the high visible sites owned and maintained
by it
Based on the assumptions and subject to satisfactory resolution of the key risks
factors project cash flows will be able to meet debt service obligations
This business model is a lucrative investment option for a private equity player
because valuation of each site will increase in the coming years due to
improvement in market conditions increase in the value of land and increase in
the demand for passive infrastructure in rural and semi-urban areas
882019 Major Project (Ramit)
httpslidepdfcomreaderfullmajor-project-ramit 5562
46
REFERENCESAnjan G V A amp N M (2009) telecom infrastructure industry in india GurgaonICRA
Bessler W Norsworthy J amp Shusterman T (2001 12 1) Mergers in the UStelecommunications industry and market valuationeffects IEEE p 288
COAI (2009 march 14) Subscriber Figures Retrieved march 14 2009 fromCOAIcom httpwwwcoaicomstatisticsphp
IDA (2009 march 23) Highlights Retrieved march 23 2009 from idagovsghttpwwwidagovsghomeindexaspx
K R (2008) Time for new business model Delhi Cybermedia
MAXIS (2009 march 8) the malaysian telecommunications industry Retrieved march9 2009 from maxiscommyhttpwwwmaxiscommypersonalabout_usinvestorprospectusprospectus4pdf
P J amp Lisa A (2009) Stimulas spending and American Telecom Industry USACoracle group
PwC (2009 march 12) Indian Telecom Industry Gurgaon Harayana IndiaRamachanran (2009 march 1) Investment in Telecom Infrastructure sector (M RInterviewer)
Vogelsang I (2002) The German Telecommunications Reform Verein fuumlr Socialpolitik (p 26) Innsbruck Boston Press
882019 Major Project (Ramit)
httpslidepdfcomreaderfullmajor-project-ramit 5662
47
ANNEXURES
ANNEXURE 1 Key Assumptions
The occupancy of each site by single two three operators for green-field sites is assumed
to be as follows
Table 91 Expected Tenancy RatiosFY 10 FY 11 FY 12 FY 13 FY 14 FY15
GBT Tenant
Ratio 150 150 170 170 170 200
Single Operator 50 50 30 30 30 0
Two Operator 50 50 70 70 70 100
RTT Tenant
Ratio 170 170 200 200 200 250
Single Operator 30 30 0 0 0 0
Two Operator 70 70 100 100 100 50
Three Operator 0 0 0 0 0 50
From FY 15 onwards tenancy ratio of 2 and 25 for GBT and RTT sites is cons idered
882019 Major Project (Ramit)
httpslidepdfcomreaderfullmajor-project-ramit 5762
48
Capital costs related assumptions are tabulated below
Table 92 GBT and RTT Capital Cost
The lease rentals for RTT sites are reimbursed from the operators and therefore have not
been factored in the revenues as well as the expense For GBT sites land purchase cost of
035 millions assumed which has been escalated by 6 annually to determine the
salvage value of assets
GBT Capital Costs
Million
INR
Delivery cost of Ground Based
Tower (GBT)063
Delivery cost of Generator 030
Civil Work 040Shelter 012
Electrical Works 030
Other Equipments (UPS Battery
etc)045
Construction cost 045
Land 035
Contingency amp Financial Charges 035Total cost 335
RTT Capital Costs
Million
INR
Delivery cost of Roof Top
Tower (RTT) 030
Delivery cost of Generator 020
Civil Work 020Shelter 012
Electrical Works 030
Other Equipments (UPS
Battery etc) 030
Construction cost -
Land -
Contingency amp FinancialCharges 008
Total cost 150
882019 Major Project (Ramit)
httpslidepdfcomreaderfullmajor-project-ramit 5862
49
Ope rating costs related assumptions are tabulated below
Table 93 Operating CostsOperating Costs
Security Sentries (INRMonth) 4000
Supervisors (INRMonth) 6000
Cluster Manager One for Fifty Towers (INRMonth) 15000
Annual increase 500
Number of Security Sentries per tower 300
Number of supervisors per tower 010
Number of C luster manager per tower 002
Fixed Expenses
Selling amp Maintenance (INRMonth) 4000000
Annual Escalation 5
Administration overhead (INRMonth) 10000000Annual Escalation 7
AMC Cost of Generator 15 (cost of generator)
Annual Escalation (AMC) 3
For RTT sites security sentries are not required because it will be the responsibility of
the site owner A supervisor will for every 10 sites and a cluster manager for every 50
sites will be required
882019 Major Project (Ramit)
httpslidepdfcomreaderfullmajor-project-ramit 5962
50
Table 94 Long term debtInterest Rate 125 per annum
Moratorium 2 years
Repayment Period 8 years
Tariff related assumptions and date of operations are tabulated below
Table 95 GBT and RTT Tariff Table 96 Life of the projectTariff Plan
Tariff (INRMonth)
No of
operators GBT RTT
1 28000 18000
2 22000 14000
3 0 12000
Annual
increase 3 3
Commercial Operation Date 1-Aug-09
Quarter Ending 30-Sep-09
FY ending COD 31-Mar-10
Project life years 15
End of commercial
operations31-Aug-24
Quarter ending commercial
operations30-Sep-24
FY ending comme rcial
operations31-Mar-25
882019 Major Project (Ramit)
httpslidepdfcomreaderfullmajor-project-ramit 6062
51
Annexure 2 Profit amp Loss accountsTable 97 Profit amp loss account statement
Income Statement (MNINR)Year ending Mar-10 Mar-11 Mar-12 Mar-13 Mar-14 Mar-15
RevenueGBT 406350 28811 89080 197447 379409 527015Operator Fees (GBT) 1411 10004 30678 67998 130664 179664RTT 1209 8575 27269 60443 116146 164264
Operator Fees (RTT) 440 3121 9739 21587 41481 56466Net Revenue 7124 50511 156766 347476 667700 927410
Expenses
VariableSecurity Sentries 1355 9790 28339 64033 125433 158238Supervisors 097 699 2024 4574 8959 11303Cluster Manager 048 350 10 12 2287 4480 5651AMC Cost of Generator 450 3013 7877 16719 31148 54541Sub-total 1950 13852 39252 87612 170021 229734
Fixed
Selling amp Maintenance(INRMonth) 032 050 053 056 058 061
Administration overhead(INRMonth) 080 128 137 147 157 168
Sub-total 112 179 190 203 216 230
EBITDA 5062 36480 117324 259661 497464 697447
Interest on LT loan - - 7341 31200 77479 156198Interest on ST loan - 021 060 130 245 361
EBDT 5062 36459 109923 228331 419739 540888Depreciation 2439 12769 35917 77162 142925 174006
EBT 2624 23691 74006 151169 276814 366881Income Tax 170 4233 14536 29073 53547 77634
PAT 2454 19458 59470 122096 223267 289247
882019 Major Project (Ramit)
httpslidepdfcomreaderfullmajor-project-ramit 6162
52
Annexure 3 Balance sheet
Table 98 B alance sheetsYearend Balance Sheet (MNINR)Year ending Mar-10 Mar-11 Mar-12 Mar-13 Mar-14 Mar-15
AssetsGross Block 75742 328216 833164 1716823 3105430 3105430Accumulated depreciation 2439 15208 51125 128287 271212 445218Net Block 73303 313009 782040 1588536 2834219 2660212Net Working Capital 064 241 620 1335 2515 3707Cash Balance 12979 72089 216513 488856 947982 1294734Total Assets 86346 385339 999172 2078727 3784715 3958653
LiabilitiesEquity 25168 108980 276604 569947 1030914 1030914Reserves amp Surplus 2454 21912 81381 203477 426745 715992Long term Debt 58725 254286 640722 1304302 2325171 2208967WC Borrowings - 161 465 1001 1886 2780Total Liabilities 86346 385339 999172 2078727 3784715 3958653
882019 Major Project (Ramit)
httpslidepdfcomreaderfullmajor-project-ramit 6262
Annexure 4 Cash flow statement
Table 99 Cash flow statements
Year ending Mar-10 Mar-11 Mar-12 Mar-13 Mar-14 Mar-15
InflowsPAT 2454 19458 59470 122096 223267 289247Depreciation 2439 12769 35917 77162 142925 174006Tax adjusted interest - 014 4959 20991 52076 104895Release of WC - - - - - -Salvage Value - - - - - -Sub-Total 4893 32241 100345 220249 418268 568148
OutflowsCapex 75742 252474 504948 883659 1388607 -Change in WorkingCapital 064 177 379 715 1180 1192
Sub-Total 75806 252651 505327 884374 1389787 1192
UFCF (70913) (220410) (404982) (664125) (971519) 566956LFCF (70913) (220424) (409940) (685116) (1023595) 462062
882019 Major Project (Ramit)
httpslidepdfcomreaderfullmajor-project-ramit 1862
9
32 Domestic Telecom Market assessment
The Indian Telecom Industry-Historical perspective
The Indian telecommunication industry was originally a government controlled
monopoly comprising three state owned operators
MTNL (which provided wire-line services in Mumbai and Delhi metropolitan
areas)
DOT (which provided wire-line services to rest of the country)
VSNL (which provided international services)
Liberalization started in 1991 with opening up of mobile services to private sectorparticipation The country was divided into 23 circles comprising of four metropol9otan
areas (Chennai Delhi Kolkata and Mumbai) and 19 other circles broadly defined by
parameters of states (K 2008) These 19 non-metropolitan circles have been categorized
as A B and C circles in descending order of their revenue generation potential (as
shown below)
Table 31 Telecom Circles
MetropolitanAreas Circle A Circle B Circle C
Delhi ChennaiMumbai Kolkata
Gujarat KarnatakaAP Tamil NaduMaharashtra
Punjab Kera laHaryana UP (West)Rajasthan UP(East) MP WestBengal
HP JampK North-East OrissaAssam Bihar
In 1997 TRAI was formed for regulating the operations and policy making process of
Indian telecommunication sector Since its liberalization India has experienced sustained
and impressive growth in its telecommunication sector primarily because of progressive
regulatory regime strong demand for mobile telecommunication services and
strengthening economy The country has achieved distinction of having worldrsquos lowest
tariff fastest growth ion subscriber base and availability of some of the cheapest mobile
handsets
882019 Major Project (Ramit)
httpslidepdfcomreaderfullmajor-project-ramit 1962
10
Figure 3-1 Growth of Subscriber base
Growth of Subscriber base
050
100150200250300350
1998 1999 2000 2001 2002 2003 2004 2005 2006 2007 2008
Year
M i l l i o n
Source Telecom Regulatory Authority of India Database
India is the second largest mobile market in the world is also among the fastest growing
mobile markets globally The total number of mobile subscribers in India (ie the
subscriber base) has crossed 300 million with 30049 million subscribers as on 31st
March 2008 The growth of subscriber base during the past decade (1998-2008) is
indicated above in a chart
Figure 3-2 Mobile Penetration Rate
0 10 20 30 40 50 60 70 80 90 100
North-East ( C)Assam (C)
Bihar ( C)Jammu amp Kashmir (C)
Orissa (C)Him achal Pradesh (C)
Uttar Pradesh ( B)Madhya Pradesh (B)
Rajastan (B)Haryana (B)
Punjab (B)West Bengal (B)
Kerala (B)Maharashtra (A)
Gujarat (A)Tamil Nadu (A)
Andhra Pradesh (A)Karnataka (A)
Kolkata (Metro)Chennai (Metro)Mumbai (Metro)
Delhi (Metro)
Source TRAI and PwC DatabaseNote As on Dec 08
882019 Major Project (Ramit)
httpslidepdfcomreaderfullmajor-project-ramit 2062
11
Indian telecom industry has experienced a high growth rate in Metros and class A circles
with coverage reaching around 90 and 35 respectively However coverage in the
Class B and Class C cities is still low at 15-25 Growth in Class B and Class C circles
has concentrated in urban area while penetration in rural area remains lower Thus futuregrowth is likely to come largely from Class B and C circles and rural areas Keeping this
in view larger players like Bharti Airtel Limited Reliance Communications Limited and
Bharat Sanchar Nigam Limited (BSNL) are largely focusing on increasing their
geographical coverage in Class B and C c ircles
33 Telecom Market- Competitive landscape
Figure 3-3 Market Share
Bharti2668
BSNLMTNL1908
Reliance1971
Vodafone661
Tata1047
Idea1033
Aircel457
Spice181
BPL056
HFCL013
Shyam005
Market Share
Source TRAI and Pw C Database
Indian mobile sector is largely concentrated with top 4 market players (Bharti Airtel
Reliance Communication Vodafone Essar and BSNL) out of 10 capturing almost three-
fourth of the entire market This is also partly on account of the fact that these four
operators have their presence in a larger number of circles as compared with other
players
882019 Major Project (Ramit)
httpslidepdfcomreaderfullmajor-project-ramit 2162
12
Figure 3-4 Lice nsed Circles
0
5
10
15
20
25
Licensed Circles (Dec 07) New Circles (Sep 08)
Source TRAI and CRISIL Database
The competition in Indian telecom sector is expected to intensify in near future because
recently new licenses have been granted to some of the existing operators for new circles
and also to new entrants like Unitech Datacom Swan Telecom and Stel These new
players are expected to capture the rural and semi-urban cities of C ircle B and Circle C as
they are now expected to grow at a much faster rate Shorter network rollout time and
competitiveness in the industry will force these entrants to start the ir operation as early as
possible Tower companies like ABC will allow incumbents to start operations in a
particular region just by installing their electronics on the ready-to-use towers thereby
significantly shortening the ro llout time
Moreover a rapidly increasing subscriber base and spectrum crunch would force the
existing telecom operators to maintain the minimum level of QoS Thus to retain existing
subscribers by preventing subscriber churn operators will require additional
infrastructure in their existing areas of operation to be able to offer better QoS This will
also result in increase in demand for telecom infrastructure in the existing markets
(Ramachanran 2009)
882019 Major Project (Ramit)
httpslidepdfcomreaderfullmajor-project-ramit 2262
13
34 Telecom Infrastructure Overview
Passive infrastructure is one of the most important components of a mobile network It
has been a critical area of operations for telecom companies in the past However with
increasing competition posing an urgent need for telecom companies to expand their
coverage and sharpen their focus on core operations so that they can sustain and improve
their market position passive infrastructure has assumed the status of an independent
industry during the past few years The industry (COAI) estimates that there will be a
requirement of around 350000 towers for 500 million subscribers by 2010 (COAI
2009)
Each site has active and passive infrastructure components Active components includethe antenna trans-receivers switches feeder cables Node B and microwave radio
equipments Passive (or non-electronic) components include the land tower shelter air-
conditioning equipment diesel electric generator battery electrical supply technical
premises and easements pylons etc Passive infrastructure in a mobile network
essentially involves acquiring land setting up towers and electrical and civil works that
needs to be in place before operators can install the active infrastructure which brings
mobile services to the consumers In a typical cell site build-out almost 65 of the total
cost is attributed to passive infrastructure and 35 to active infrastructure
(Ramachanran 2009)In this report passive cell site infrastructure has also been
henceforth referred to as towers or sites
The components of a typical base station are shown below
882019 Major Project (Ramit)
httpslidepdfcomreaderfullmajor-project-ramit 2362
14
Picture 3 1 Telecom Tower
Telecom towers are broadly classified on the basis of their placement as Ground-basedand Roof-top
1 Ground-Based Tower Ground-based towers (GBTs) are taller (typically 200 to 400
feet) and are mostly used in rural and semi-urban areas because of the easy
availability of real-estate space there GBTs involve a capital expenditure in the range
882019 Major Project (Ramit)
httpslidepdfcomreaderfullmajor-project-ramit 2462
15
of Rs 3 to 4 million depending on the height of the tower land prices etc
(Ramachanran 2009)
2 Roof-Top Tower (RTT) Roof-top towers (RTTs) are generally placed on the roofsof high-rise buildings They are shorter (than GBTs) and more common in urban and
highly populated areas where there is paucity of real-estate space Typically these
involve a capital expenditure of Rs 15 to 2 million (Ramachanran 2009)
The height of a telecom tower determines the number of antennas that can be
accommodated which in turn determines the capacity of the towers apart from factors
such as location and geographica l conditions (wind speeds type of terrain etc)
35 Telecom Infrastructure- Domestic market
In India there are broadly two kinds of operators in the tower infrastructure industry
Tower infrastructure subsidiaries
Reliance Infratel Limited
Bharti Infratel Limited
Indus Towers Limited
Wireless TT Info Services Limited (WTTIL)
Independent tower infrastructure companies (ITICs)
GTL Infrastructure
Xcel Telecom
Essar Telecom Infrastructure
Aster Infrastructure
Bharat Telemast
882019 Major Project (Ramit)
httpslidepdfcomreaderfullmajor-project-ramit 2562
16
These companies have their business model based largely on contract or anticipatory
approaches Under the contract approach tower companies set up tower sites going by
the requirements of the telecom operators and the terms of the contract are specified
beforehand in the MSAs signed by the two parties Under the anticipatory approachhowever tower companies set up tower infrastructure at sites with reasonable demand
potential and subsequently invite telecom operators to set up their network on these
towers The latter model involves higher business risks as the tower company may not be
able to achieve reasonable tenancy for its tower infrastructure and at profitable terms
BPTL proposes to follow contract approach for its business model
36 Telecom Infrastructure market- Competitive landscape
Figure 3-5 Telecom Infrastructure Market Players
038058154
365692
10381692
26923269
0 20000 40000 60000 80000 100000
Aster InfrastructureAmerican Towers
Essar Telec om Infrastructure
GTL In frastructureWi reles s TT In fo Services Limited
Bharti Infratel Limited
Reli anc e Communications Limitedrsquos
OthersInd us To wers Limited
Number of Towers
Market Players
Source Telecom Regulatory Authority of India and ICRANote Others include tower por tfolios of BSNL MTNL Sistema Shyam Teleservices Aircel etc
In Indian Telecom Infrastructure market competition has intensified significantly with
several players spinning of their tower portfolio and independent operators expanding
their operations
882019 Major Project (Ramit)
httpslidepdfcomreaderfullmajor-project-ramit 2662
17
Bharti Airtel Limited Reliance Communications Limited and Tata Teleservices Limited
have hived off their tower assets into separate tower infrastructure subsidiaries namely
Bharti Infratel Limited Reliance Infratel Limited and Wireless TT Infoservices Limited
respectively Also Bharti Infratel Limited together with Vodafone Essar Limited and IdeaCellular Limited in a joint- venture agreement has created Indiarsquos largest tower
infrastructure company ndash Indus Towers Limited which has an estimated portfolio of
around 88000 towers (Anjan V amp N 2009) Whereas in past few years number of
independent tower infrastructure companies have ventured into the domestic telecom
tower industry These include GTL Infrastructure Limited Essar Telecom Infrastructure
Limited Xcel Telecom Private Limited (American Towers) Tower Vision India Private
Limited Aster Infrastructure Private Limited TVS Interconnect Systems Limited etc
Figure 3-6 Telecom Tower Growth Scenario
0
100
200
300
400
500
600
700
2008 2009 2010 2011 2012 T e
l e c o m
T o w e r s
( T h o u s a n
d s )
Source Telecom Regulatory Authority of IndiaAssumptions Subscriber growth rate of 28 till 2011-12
1400 subscribe per site
As shown above it is expected that in next 4-5 years there will be a requirement of
additional 85000 towers (both GBT and RTT) each year to meet the subscriber base of
800 million by 2011-12 (PwC 2009) This shows that huge investment have to be made
in Indian telecom Infrastructure sector in near future Now since both passive and active
882019 Major Project (Ramit)
httpslidepdfcomreaderfullmajor-project-ramit 2762
18
infrastructure sharing is a llowed (except spectrum) Independent service providers will be
benefited Increase in subscriber base introduction of new technologies like 3G Wi-max
etc and increase in market healthy market competition in telecom services sector will
drive the growth in telecom infrastructure sector
882019 Major Project (Ramit)
httpslidepdfcomreaderfullmajor-project-ramit 2862
19
4 BUSINESS PLAN
41 Passive Infrastructure
Mobile networks have base stations (or cell sites) which have active and passive
infrastructure components Active components include the antenna trans-receivers
switches feeder cables Node B and microwave radio equipments Passive (or non-
electronic) components include the land tower shelter air-conditioning equipment
diesel electric generator battery electrical supply technical premises and easements
pylons etc Passive infrastructure in a mobile network essentially involves acquiring land
setting up towers and electrical and civil works that needs to be in place before operators
can install the active infrastructure which brings mobile services to the consumers In atypical cell site build-out almost 65 of the total cost is attributed to passive
infrastructure and 35 to active infrastructure
42 Infrastructure Sharing
Mobile operators are required to setup more and more BTS (cell) sites due to the
exponential growth of mobile subscribers in India (currently growing at almost 15 4
million subscribers a month) and limited availability of spectrum B and C Circles (wheretraffic density may not be as high as metros and Circle A) are expected to drive future
subscriber growth and requirements for cell sites will be higher to ensure greater
coverage
However creating new infrastructure by each operator separately leads to d uplicat ing
huge capital investments It also contributes to mushroom growth of telecom towers and
deteriorating skylines in urban areas which has already led to some local municipal and
state governments to regulate and restrict the erection of new mobile towers
The continued pressure on cellular tariffs higher infrastructure costs for network
deployment particularly in semi-urban and rural areas and compelling need to reduce
4 As published in ET 8 th May 09 Edition
882019 Major Project (Ramit)
httpslidepdfcomreaderfullmajor-project-ramit 2962
20
time to market for network roll outs have led operators to share and even outsource their
infrastructure requirements from third party infrastructure providers like BPTL GTL and
Indus towers It promotes capital efficiency as it allows more than one service provider to
leverage and ride o n common infrastructure In its simplest form it involves two or moreoperators jointly using the common passive infrastructure in a cell site While viewed
largely as a measure to reduce capital and operating expense such sharing also leads to
improvement of service q uality (by ensuring site space for service providers and reducing
black spots) and the environment (by reducing number of cell sites and towers)
In outsourcing operators take passive infrastructure and tower space from third party
infrastructure companies on a monthly rental basis to host their radio and transmission
equipments Outsourcing provides significant benefits to operators It enables them tosave on capital expenses (it actually converts capital expense into operating expense in
the form of lease rentals) and focus on their core activities of sales marketing and
branding while leaving the cumbersome task of managing the site development process
and site operation and maintenance to third parties who exclusively deal with such
activities
The concept of passive infrastructure sharing is increasingly gaining market acceptancein India So far it has been largely limited to bilateral sharing between operators in the
form of barter where the operators split the site related CAPEX and OPEX costs The
available information suggests that about 25 of the existing 90000 tower sites in India
are currently being shared for passive infrastructure predominantly in rural areas and
small towns
43 Introduction to the business
BPTL is an Infrastructure Provider company that builds owns operates and maintains
passive network infrastructure on a shared basis for mobile telecom operators and ITES
providers Its objective is to provide network design and planning network deployment
882019 Major Project (Ramit)
httpslidepdfcomreaderfullmajor-project-ramit 3062
21
network operations amp maintenance infrastructure management application management
and professional services to teleco m operators and enterprises
The company is planning to raise capital in the form of equity and debt to start its
operation by Aug 09 ABC rsquos vision is to provide world class managed infrastructure ampallied services to the service providers to optimize their service delivery capability In the
initial years of operation the company will focus on telecom sector with almost 100 of
its proposed capital expenditure till FY 14 earmarked for developing and owning passive
infrastructure for sharing among mobile service providers
44 Business Proposal
ABC will provide passive telecom infrastructure on build own operate (BOO) basis inboth ground based (GBS) as well as roof-top sites (RTS) It will undertake full range of
responsibilities in building owning and maintaining the sites and will serve as a single
window one-stop-shop provider of infrastructure services Typical responsibilities are
summarized below
Site planning keeping in view the network rollout plans of prospective customers
Site acquisition including entering into long-term agreements with land owners
Obtaining of necessary regulatory approvals
Erect ion and commissioning of tower and allied equipment
Provision of support services such as back-up power air-conditioning and
security
Provision of turnkey solutions to telecom companies such as sourcing of
equipment testing and maintenance
882019 Major Project (Ramit)
httpslidepdfcomreaderfullmajor-project-ramit 3162
22
Bharat Telemast Private Limited will identify the sites required for setting up the Passive
infrastructure by first of all getting a commitment from one operator who is called as
ldquoAnchor Operatorrdquo Then Bharat Telemast will go ahead to lease (or) buy out the site as
appropriate and commences construction of the cellular sites But the Cellular site will betypically designed for three to four operators While construction is in progress the
marketing team will work towards getting the second and third operator But care will be
taken in such a way that at least two operators are available at the time of completion of
construction
45 Sources of revenue
1 Infrastructure Provisioning Fees ndash fee paid by the operators on a monthly basisWith annual escalation
2 Site lease rental ndash Paid at actual on a monthly basis
3 Operations and maintenance charges Paid on a monthly basis
4 The contract also provides a fixed annual escalator
46 Attractiveness of business model
Stable and predictable cash flow business Once a tower asset is rented out it
usually generates a stable and predictable cash flow in the form of tower rentals
from occupants over the term of the MSA between the two parties
Low working capital requirement ABC rsquos business model is also characterized
by low working capital requirements as most of the operating expenses (such aselectricity and fuel and other variable operating expenses) are reimbursable by the
tenants on actual basis Moreover BPTL is may also be able to get rentals for the
towers in advance and also obtain better credit terms from their suppliers thus
further improving their working capital cycle
882019 Major Project (Ramit)
httpslidepdfcomreaderfullmajor-project-ramit 3262
23
High incremental profitability The operating costs associated with this
business are largely fixed in nature Thus each increment in tenancy is
accompanied by a minimal increase in costs This leads to a more thanproportionate increase in profits for every increase in occupancy
Reduction in capital investments due to present market conditions Due to
present market situation average capital requirement for RTT and GBT sites have
dropped from 2 million and 4 million to 15 million and 33 million ABC wishes
to grab this opportunity which will result in competitive advantage in near future
Extensive usage While on an average a GSM BTS can handle around 100-
1100 subscribers but in the case of high usage areas the figure can be as low as
600-700 subscribers which means a larger number of cell sites would be required
for the same area Moreover the country has the problem of spectrum scarcity
which increases the requirement of towers to maintain a reasonable leve l of
service quality
New entrants Many operators including Vodafone Essar Limited Idea Cellular
Limited Aircel Cellular Limited and Sistema Shyam Teleservices Limited have
received licenses as well spectrum in new circles which would enable them to
become pan-India operators in the next one-two years Also new licenses have
been issued to new players such as Unitech Swan Telecom and S Tel Limited
Given the significant expansion plans of new entrants over the medium term and
the need for them to optimize investments in order to maintain returns demand
for towers is expected to report a sharp increase
Shorter rollout time Indian telecom industry is highly competitive and doing
business for new entrant may not be easy Shorter network-rollout time would be
a critical success factor for the new entrants and a longer rollout time could meanloss of substantial market share to other operators Tower companies allow
players to start operations in a particular region just by installing their electronics
on the ready-to-use towers thereby significantly shortening the rollout time
New technologies 3G services are already launched in the country and to
augment their services various operators plan to launch Wi-Max services as soon
882019 Major Project (Ramit)
httpslidepdfcomreaderfullmajor-project-ramit 3362
24
as they receive additional spectrum from Government This would further
increase the demand for sharing of passive infrastructure
47
Expansion Schedule
BPTL would rollout both RTT and GBT sites of which the RTT sites GBT sites
normally would have a tower height of 50 meters or 60 meters depending on the need for
additional height for installation of microwave antennae based on the location of the site
and number of tenants on the cell site Details of BPTLrsquos expansion plan are summarized
below
Table 41 Expansion PlanExpansion Schedule 2009-10 2010-11 2011-12 2012-13 20013-14
GBT
Addition 210 700 1400 2450 3850
Total 210 910 2310 4760 8610
RTT
Addition 90 300 600 1050 1650
Total 90 390 990 2040 3690
48 Proposed Services
As indicated earlier ABC proposes to provide passive telecom infrastructure on a
sharing co-location basis to cellular operators The sites would either be Ground Based
Sites (GBS) or Roof Top Sites (RTS) As the sites are meant for co-location of the active
components of two to three operators they would be built to either 2-Tenant or 3-Tenant
specifications
The different components of the passive infrastructure facility and the related services
that would be offered by BPTL to the operators are as under
Infrastructure provisioning comprising
882019 Major Project (Ramit)
httpslidepdfcomreaderfullmajor-project-ramit 3462
25
Communication tower built to host multiple antennae
Weather-proof communication shelter with air-conditioning and power backup
arrangement
Diesel generating set and battery bank for power backup
A mobile standby generator to act as backup in case o f breakdown
Warehousing facility
Infrastructure operations and maintenance including
Regular operations and maintenance of the facility
Security of all the equipments at the site at all timesA dedicated team of technicians for a group of 40-50 sites to ensure effect ive and
efficient functioning of the components at all times
49 Proposed Organizational Structure
A senior management team will work under the leadership of the ldquoChief Operations
Officerrdquo who will be responsible for smooth implementation of proj ect activities He willalso assist the managing director in marketing This team will coordinate with Stallion
Telecom Pvt Ltd which will take over the role of procuring Capital Equipments
Senior management will consists of project manager infrastructure manager commercial
manager and head (legal and company affairs Apart from this there will be a requirement
Chief OperatingOfficer
Project Manager Infrastructure
Manager
Commercial
Manager (projects)
Head (Legal and
Company Affairs)
882019 Major Project (Ramit)
httpslidepdfcomreaderfullmajor-project-ramit 3562
26
of security sentries (3 per GBT site) supervisors (one for every 10 sites) and cluster
manager (one for every 50 sites)
Bharat Telemast will carry out the complete Project execution with the assistance of third party ldquoQuality control organizationrdquo and a third party ldquoProject management teamrdquo
Quality control and project management activities will be o utsourced to a third party
882019 Major Project (Ramit)
httpslidepdfcomreaderfullmajor-project-ramit 3662
27
5 METHODOLOGY
The changing face of infrastructure services creates a complex situation which demands
greater understanding of roles of competition regulatory structures and modes of
financing Knowledge of such things is a key decisive factor in building confidence
among investors promoters and government In project finance the project its assets
contract and cash flows are separated from promoter in order to permit credit appraisal
or loan to the project
As part of the financial feasibility analysis a series of related financial statements based
on projected sources and uses of funds during the development and operating phaseproject were created Financial statements consist of expenses associated with
development activities including capital costs like acquisition of land for GBT sites cost
of tower generator shelter batteries etc Most of the data regarding capital costs are
obtained from the promoter of ABC Limited All these capital costs related details are
provided in annexure 1
Assumption regarding depreciation capital structure operating expenses expansion
schedule tenancy ratios tariff or rent operatorrsquos fees and loan amortization schedule are
obtained from professional accountants Promoter and bankers of ABC Limited
Due to unknown factors that could influence the cost of towers or fees associated with
completing the project (soft costs) contingency costs were estimated at 5 of hard and
soft costs respectively If contingency is set too low developers could easily encounter
funding shortfalls upon slight changes in market forces All other costs were estimated
based on talking with industry professionals (Promoters)
A detailed financial model was prepared based on existing accounting standards and
following financial ratios were estimated
882019 Major Project (Ramit)
httpslidepdfcomreaderfullmajor-project-ramit 3762
28
EBITDA margin Profit and loss accounts for the estimated project period (15
Years) were prepared based on which estimated earnings before interests tax
depreciat ion and amortization were calculated for each year Detailed PampL
balance sheet and cash flow statements are provided in annexure 2 3 and 4
EBITDA = Total Revenue ndash (Variable expenses + Fixed Expenses)
EBITDA margin = EBITDA Total Revenue
PAT margin PAT is calculated by subtracting interests pa id on capital debt and
working capital debt depreciation and applicable corporate income tax from
EBITDA
PAT = EBITDA ndash Interest Payable ndash Depreciation ndash Income tax
PAT margin = PATTotal Revenue
Working Capital Working capital requirement is calculated by subtract ing
current liabilities from current assets Current assets are estimated based on 30
days cash requirement and current liabilities are estimated as half of salary
monthly expenses
WC = Current Assets ndash Current Liabilities
UFCF It is defined as the free cash flows available to the firm if the firm has
zero debt liability Purpose of ca lculat ing UFCF for project period is to determinethe project IRR
UFCF = PAT + Depreciation + Interest (tax adjusted) + Release of WC + Salvage
value of the assets ndash CAPEX ndash Change in WC
882019 Major Project (Ramit)
httpslidepdfcomreaderfullmajor-project-ramit 3862
29
LCFF It is defined as the cash floes available to the firm after paying interests on
long term and short term debts
LCFF = UFCF ndash Interest (tax adjusted)
FCFE It is defined as the free cash flow available to equity holders It is
determined to ca lculate equity IRR for equity investors It also includes the tax
benefits which are available as per the Income Tax Act
FCFE PAT + Depreciation + Salvage Value ndash Equity Investment ndash Long term debt
repayment
PIRR Project IRR is defined as the discount rate at which NPV (Net Present
Value) of UFCF is zero It is calculated by using following formula
UFCF 1 (1+PIRR) 0+ UFCF 2 (1+PIRR) 1+ UFCF 3 (1+PIRR) 2+ helliphelliphelliphelliphelliphellip = 0
UFCF 1 = UFCF at the end of first year of operation
UFCF 2 = UFCF at the end of second year of operation
PIRR = Project IRR
EIRR Equity IRR is defined as the discount rate at which NPV of FCFE is zero
It is calculated by using following formula
FCFE1 (1+EIRR) 0+ FCFE 2 (1+EIRR) 1+ FCFE 3 (1+EIRR) 2+ helliphelliphelliphelliphelliphellip = 0
FCFE1 = FCFE at the end of first year of operation
FCFE2 = FCFE at the end of seco nd year of operation
EIRR = Equity IRR
882019 Major Project (Ramit)
httpslidepdfcomreaderfullmajor-project-ramit 3962
30
WACC It is de fined as the percentage of return expected by the investors who
otherwise would have earned some return by investing in some other project
WACC = Cost of Debt (Debt Capital) + Cost of equity (Equity Capital)
882019 Major Project (Ramit)
httpslidepdfcomreaderfullmajor-project-ramit 4062
882019 Major Project (Ramit)
httpslidepdfcomreaderfullmajor-project-ramit 4162
32
62 Funding planAs the telecom sites are rolled out over a 5 year period till FY 2014 investment will be
required for each year ABC Limited will start generating profits from FY 10 only Such
internally generated cash accruals will be ploughed back into the business to meet part of
the project cost Investment required for each year is tabulated below
Table 61 Funding ProposalMillion INR FY 10 FY 11 FY 12 FY 13 FY 14
GBT Tower (Additional) Nos 210 700 1400 2450 3850
RTT Tower (Additional) Nos 90 300 600 1050 1650DE ratio 233 233 233 233 233
Additional CAPEX 83892 279374 558748 977809 1536557
Debt 58725 195562 391124 684466 1075590
Equity 25168 83812 167624 293343 460967
63 Results
Based on assumptions given in Annexure 1 a detailed financial model was preparedResults of the financial model such as PampL account Balance Sheet and cash flow
statements are provided in Annexure 2 3 and 4 Forecasts for the key financial figures for
first five years are provided in the Table below
Forecasts
Table 62 Income StatementMillion INR FY-10 FY11 FY12 FY-13 FY-14
Sales 7124 50511 156766 347476 667700
Cost of sales 1950 13852 39252 87612 170021
Gross 5174 36659 117514 259864 497679
7263 7258 7496 7479 7454
Admin costs 112 179 190 203 216
882019 Major Project (Ramit)
httpslidepdfcomreaderfullmajor-project-ramit 4262
33
Finance cost 0 021 7401 31330 77725
Taxation 170 4233 14536 29073 53547
PAT 2454 19458 59470 122096 223267
As shown in Table above during the expansion period revenue will grow exponentially
In the first year of operation ABC will earn a revenue of INR 7124 million from 300
(210 GBT and 90 RTT) sites with a tenancy ratio of 15 for GBS and 17 for RTS In the
first 2 years of operation the company will not pay any interest on long term debt due to
2 years moratorium period Major cost associated with the project is depreciation due to
which PAT is lower than the operating profits But cash flows to the firm are enough to
result in reasonable returns
Table 63 Balance Shee tYear ending Mar-10 Mar-11 Mar-12 Mar-13 Mar-14
AssetsGross Block 75742 328216 833164 1716823 3105430Accumulated depreciation 2439 15208 51125 128287 271212Net Block 73303 313009 782040 1588536 2834219Net Working Capital 064 241 620 1335 2515Cash Balance 12979 72089 216513 488856 947982
Total Assets 86346 385339 999172 2078727 3784715LiabilitiesEquity 25168 108980 276604 569947 1030914Reserves amp Surplus 2454 21912 81381 203477 426745Long term Debt 58725 254286 640722 1304302 2325171WC Borrowings - 161 465 1001 1886Total Liabilities 86346 385339 999172 2078727 3784715
Note All figures are in Million INR
Table 64 Key financial ratiosMar-11 Mar-12 Mar-13 Mar-14 Mar-15
Revenue Growth 60902 21036 12165 9216 3890EBITDA Growth 62061 22161 12132 9158 4020
PAT Growth 69293 20564 10531 8286 2955
As shown in table above increase in EBITDA is higher than that of revenue This is due
to better operational efficiency of ABCrsquos management and economies of scale S imilarly
882019 Major Project (Ramit)
httpslidepdfcomreaderfullmajor-project-ramit 4362
34
increase in PAT is lesser than that of EBITDA because of high depreciation and interest
expenses
Table 65 Pr ofitability r atios
Mar-11 Mar-12 Mar-13 Mar-14 Mar-15
EBITDA Margin 7222 7484 7473 7450 7520
PAT Margin 3852 3794 3514 3344 3119Return on Net Worth 622 760 769 788 1087
Key profitability ratios are shown in table above Return on net worth in the initial years
is lower because of the ambitious expansion plans of ABC Limited Thereafter return on
net worth increases with increase in PAT
Returns on Investment
Table 66 Financial returnsFinancial Indicators
Project IRR 1813Equity IRR 3609
64 Sensitivity Analysis
A sensitivity analysis has been carried out on the project financials to determine theimpact of key variables on the financial indicators namely
Project IRR
The key variables on which sensitivity analysis have been carried out areCapital expenditure for GBS and RTS1st and 2 nd tenant tariff for GBS1st and 2 nd tenant tariff for RTSTenancy Ratio
Similarly sensitivity analysis has been carried out forEquity IRR
The key variables on which sensitivity analysis have been carried out for EIRR are
Capital structure and interest rate for capital debtRepayment period and moratorium period
882019 Major Project (Ramit)
httpslidepdfcomreaderfullmajor-project-ramit 4462
35
The impact on the financial indicators is shown below
Figure 6-1 Project IRR vs GBT and RTT CAPEX
As shown in Figure 6-1 project IRR is more sensitive to change in CAPEX of RTT sitesas compared to change in CAPEX of GBT sites because tenancy ratio and tariff for RTTsites are higher than those of GBT sites
882019 Major Project (Ramit)
httpslidepdfcomreaderfullmajor-project-ramit 4562
36
Figure 6-2 Project IRR vs GBT Tariff for 1 st tenant (X-axis) and 2 nd tenant (right-hand side)
As shown in Figure 6-2 project IRR varies linearly with GBT tariff In the best casescenario when GBT tariff for 1 st tenant is INR 34000month and GBT tariff for secondtenant is INR 26000month Project IRR is 2101
Figure 6-3 Project IRR vs RTT Tariff for 1 st tenant (X-axis) and 2 nd tenant (right-hand side)
As shown in Figure 6-2 project IRR varies linearly with RTT tariff In the best casescenario when RTT tariff for 1 st tenant is INR 24000month and RTT tariff for second
882019 Major Project (Ramit)
httpslidepdfcomreaderfullmajor-project-ramit 4662
37
tenant is INR 20000month Project IRR is 1932 Project IRR is more sensitivetowards RTT tariff than GBT tariff because in practical business situation RTT siteshave a tenancy ratio of more than two due to which effect of tariff for 1 st tenant almostget nullified after few years
Figure 6-4 Project IRR vs Tenancy ratio for RTT sites (X-axis) and GBT sites
As shown in Figure 6-4 project IRR is very sensitive to tenancy ratio In the best casescenario where GBT sites have a tenancy ratio of 2 and RTT sites have a tenancy ratio of 3 project IRR can be as high as 20
Figure 6-5 Equity IRR vs long term debt interest rate for different leverage level
882019 Major Project (Ramit)
httpslidepdfcomreaderfullmajor-project-ramit 4762
38
As shown in figure 6-5 equity IRR is more sensitive to interest rate on long term debt forhigh level of leverage (lower debt equity ratio) because as the debt equity ratio increasesinterest paid on long term debt also increases significantly
Figure 6-6 Equity IRR vs long term debt repayment period at different level of moratoriumperiods
As shown in figure 6-6 Equity IRR increases with increase in moratorium period anddebt repayment period The variation is from 1654 to 60 for worst case and best casescenarios
882019 Major Project (Ramit)
httpslidepdfcomreaderfullmajor-project-ramit 4862
39
7 RISK ASSESSMENTRisk Mitigation strategyExecution Risk
(Project management landacquisition etc)
Management of ABC has proven expertise in
telecom infrastructure rollout and has executedvarious projects with large telecom operators andMNC vendorsABCrsquos top management team consists of a groupof professionals drawn from leading telecomInfrastructure Company who have immenseexpertise and experience in rolling out telecominfrastructure projects
Market Risk (No entry barriers operators may
share infrastructure betweenthemselves large players withhigh capital may increasecompetition)
India has a huge potential for telecominfrastructure market With increasing
competition falling tariffs and pressure onmargins telecom service providers are beingforced to increase their focus on marketing andreduce their expensesExperienced management healthy capital back-up effective presence in the telecominfrastructure market and value added services atrelatively lesser cost will help ABC to meet theset targets
Financing Risk
(Availability of equity capitalavailability of long term debtinterest rate and moratoriumperiod)
ABC is seeking private equity partner to secure
equity capital Company has already entered intoNDA with 2 major investorsLong term debt at an interest rate of 125 canbe easily arranged because of the credibility of the promoters in the marketMany other similar firms like Indus and GTLhave already secured long term debt for amoratorium period of 2 years Promoters of ABCLimited are confident to secure a long term debtwith a moratorium period of 2 years and apayback period of 8 years
ABC Limited would minimize the workingcapital requirements of its business by securingrentals and operating revenues in advance fromits clients and or by suitably structuring itspayment liabilities to match its cash inflows
Commercial Risk (Tenancy ratio and tariff forGBS and RTS)
ABC would aim to enter into long term contractswith the ldquoanchor tenantrdquo operator and thenrollout the infrastructure so that at least single
882019 Major Project (Ramit)
httpslidepdfcomreaderfullmajor-project-ramit 4962
40
occupancy of each site is ensured at all t imesPromoters will use its knowledge of the businessand its expertise to identify and roll out sites inlocations which have strong multi- tenancypotential to minimize occupancy risk
Revenue Risk (Operating fees may decreasecredit worthiness of the clientsdelay in payment of rentals)
As per the industry sources till now not even asingle operator have dishonored the long termlease contractThe credit risk is diversified as there will bemultiple operatorsABC would aggressively market to get 3G andWiFi broadcasters to use the sites and earnadditional revenues in addition to the assumedrevenue streams
Natural Calamities Risk The Company shall maintain insurance for thesites against these risks and the cost of insurancewill be priced in and passed on to the tenants
882019 Major Project (Ramit)
httpslidepdfcomreaderfullmajor-project-ramit 5062
41
8 CONCLUSION
India is the fastest growing wireless telecom market in the world The continuing
growth in the number of wireless subscribers and MoUs and increasing trend of
outsourcing of business processes to India has led to growing demand for large
investments in the telecom infrastructure in the country
However with increasing competition falling tariffs and pressure on margins
telecom service providers are being forced to increase their focus on marketing
customer acquisitions and branding and minimize their efforts and overheads in
project management and asset acquisition
Further with rising prices of steel cement and real estate the cost of developing
and owning passive infrastructure is increasingly becoming a costly proposition
for most operators and service providers
The compulsion on the part of service providers to reduce their operating costs
and capital expenditure requirements has led to opportunities in passiveinfrastructure outsourcing to independent third party infrastructure providers and
also sharing the infrastructure with other service providers It is expected that
cellular operators will outsource their communications site infrastructure needs as
a means of accelerating access to their markets and preserving capital rather than
constructing and operating their own communications sites and maintaining their
own communications sites service and deve lopment capabilities
Passive infrastructure is highly capital intensive and an integral part of the cellular
service providersrsquo networks Yet being a simple and low technology asset it is
amenable to outsourcing and sharing By transferring the responsibility of
ownership development and maintenance of passive infrastructure service
882019 Major Project (Ramit)
httpslidepdfcomreaderfullmajor-project-ramit 5162
42
providers have an opportunity to transfer a substantial part of their business risk to
third parties
Most telecom operators are facing capacity constraints on their networksCoverage obligations increasing pressure to improve network quality and
competition has led to aggressive roll out plans by existing cellular operators
Installation of cell sites has become a cumbersome process as there are a number
of clearances required and involves labor-intensive micro management
Availability of ready infrastructure from third party providers would enable the
operators to reduce their time to market and accelerate their access to their
customers Cellular service providers generally want to move quickly when
adding more sites and co-location on an existing site is always faster than
building
Ownership and maintenance of telecom towers and other infrastructure by third
parties is an established practice in developed nations like USA and is
increasingly gaining market acceptance in India
The Indian government is seriously considering promoting the infrastructure
sharing route between the telecom operator and private players to achieve future
national tele-density targets and improve rural telecom penetration
ABC being an independent entity with no business conflicts with other service
providers in the telecom space will be best positioned and have an early mover
advantage to capitalize on this emerging opportunity
Further the task of operating and maintaining the passive infrastructure in the cell
is increasingly becoming a cumbersome exercise for the service providers to
handle ABCrsquos composite offering to build passive infrastructure for the cellular
operators and also operate and maintain them will provide a turnkey solution to
address the infrastructure needs of the service providers
882019 Major Project (Ramit)
httpslidepdfcomreaderfullmajor-project-ramit 5262
43
The business model proposed to be followed by ABC is fairly simple with stable
and predictable cash flows as is the case with the business model of the tower
renting companies in USA Most contracts are long term for a period 10 or moreyears with annual price escalators generally ranging from 3 to 4 However
wireless carriers normally tend to renew rentals because suitable alternative sites
may not exist or be available and repositioning a site in a carrierrsquos network is
expensive and may adverse ly affect network quality
Site ownership and operations is a ldquoscalerdquo business operating administration
marketing expenses etc do not rise as quickly as revenues when portfolios are
expanded Incremental operating costs associated with adding wireless tenants to
a communications site are minimal Therefore as additional tenants are added to a
site the substantial majority of incremental revenue contributes to margin
expansion Most tower companies have high EBITDA margins as may be seen
from the financial indicators of some of the tower rental companies in USA
It is expected that site location and capacity price and quality of service and
successful execution of contracts will be the most significant competitive factors
in this business
ABCrsquos revenue and returns on investment will be primarily driven by its ability
to
o Increase the utilization of the space and infrastructure capacity owned by it by
increasing the number of tenants per site and renting out to maximum number
of users As discussed above return on capital employed (PIRR and EIRR) arevery sensitive to tenancy ratio In worst case scenario project IRR can be as
low as 8 and in the best case scenario it can be as high as 20
o Develop acquire sites of strategic importance and high growth potential that
will enable them to secure better commercial terms from users and attract
more number of tenants Infrastructure provisioning fees rentals for sites are
882019 Major Project (Ramit)
httpslidepdfcomreaderfullmajor-project-ramit 5362
44
extremely location sensitive There is a potential to acquire more land than
that of required to capitalize on the increase in real estate prices
o Develop sites in a cost effective manner ABC would consider purchasing
land only for those GBS sites which have sufficient demand and arestrategically located Else for most of its sites land will be leasehold As
shown above returns (PIRR and EIRR) are very sensitive to capital costs In
the worst case scenario project IRR can be as low as 15 whereas it can as
high as 27 in the best case scenario
o Negotiate and secure long term contracts with good credit quality users with
built in price escalation provisions to mitigate financing risk
o Leverage and secure long term financing at attractive terms and involve in
active treasury management to keep low financing cost Results of the
sensitivity analysis indicate that equity IRR can be as high as 60 foe a
moratorium period of 4 years and interest rate of 10
o Minimize working capital requirements
o Maintain low operating and administration expense
o Secure better OampM margins from operators and retain a healthy share of it in
ABC
o Maintain high service standards and build strong customer relationships
The business would have the potential to capture new revenue opportunities
around the existing assets As demand for towers is expected to grow and as
operators migrate to speedier next-generation wireless technologies they will
need the towers and associated passive infrastructure to transmit their new
services in addition to their existing offerings In addition to increasing capacity
and coverage and improving the quality of their networks cellular serviceproviders are deploying high speed data networks driving incremental demand of
sites The business therefore has potential upsides in the form of adding
customers (tenants) in wireless broadband third generation (ldquo3Grdquo) and wireless
data capabilities and also other incremental value propositions by way of hosting
882019 Major Project (Ramit)
httpslidepdfcomreaderfullmajor-project-ramit 5462
45
Billboards Hoardings etc in some of the high visible sites owned and maintained
by it
Based on the assumptions and subject to satisfactory resolution of the key risks
factors project cash flows will be able to meet debt service obligations
This business model is a lucrative investment option for a private equity player
because valuation of each site will increase in the coming years due to
improvement in market conditions increase in the value of land and increase in
the demand for passive infrastructure in rural and semi-urban areas
882019 Major Project (Ramit)
httpslidepdfcomreaderfullmajor-project-ramit 5562
46
REFERENCESAnjan G V A amp N M (2009) telecom infrastructure industry in india GurgaonICRA
Bessler W Norsworthy J amp Shusterman T (2001 12 1) Mergers in the UStelecommunications industry and market valuationeffects IEEE p 288
COAI (2009 march 14) Subscriber Figures Retrieved march 14 2009 fromCOAIcom httpwwwcoaicomstatisticsphp
IDA (2009 march 23) Highlights Retrieved march 23 2009 from idagovsghttpwwwidagovsghomeindexaspx
K R (2008) Time for new business model Delhi Cybermedia
MAXIS (2009 march 8) the malaysian telecommunications industry Retrieved march9 2009 from maxiscommyhttpwwwmaxiscommypersonalabout_usinvestorprospectusprospectus4pdf
P J amp Lisa A (2009) Stimulas spending and American Telecom Industry USACoracle group
PwC (2009 march 12) Indian Telecom Industry Gurgaon Harayana IndiaRamachanran (2009 march 1) Investment in Telecom Infrastructure sector (M RInterviewer)
Vogelsang I (2002) The German Telecommunications Reform Verein fuumlr Socialpolitik (p 26) Innsbruck Boston Press
882019 Major Project (Ramit)
httpslidepdfcomreaderfullmajor-project-ramit 5662
47
ANNEXURES
ANNEXURE 1 Key Assumptions
The occupancy of each site by single two three operators for green-field sites is assumed
to be as follows
Table 91 Expected Tenancy RatiosFY 10 FY 11 FY 12 FY 13 FY 14 FY15
GBT Tenant
Ratio 150 150 170 170 170 200
Single Operator 50 50 30 30 30 0
Two Operator 50 50 70 70 70 100
RTT Tenant
Ratio 170 170 200 200 200 250
Single Operator 30 30 0 0 0 0
Two Operator 70 70 100 100 100 50
Three Operator 0 0 0 0 0 50
From FY 15 onwards tenancy ratio of 2 and 25 for GBT and RTT sites is cons idered
882019 Major Project (Ramit)
httpslidepdfcomreaderfullmajor-project-ramit 5762
48
Capital costs related assumptions are tabulated below
Table 92 GBT and RTT Capital Cost
The lease rentals for RTT sites are reimbursed from the operators and therefore have not
been factored in the revenues as well as the expense For GBT sites land purchase cost of
035 millions assumed which has been escalated by 6 annually to determine the
salvage value of assets
GBT Capital Costs
Million
INR
Delivery cost of Ground Based
Tower (GBT)063
Delivery cost of Generator 030
Civil Work 040Shelter 012
Electrical Works 030
Other Equipments (UPS Battery
etc)045
Construction cost 045
Land 035
Contingency amp Financial Charges 035Total cost 335
RTT Capital Costs
Million
INR
Delivery cost of Roof Top
Tower (RTT) 030
Delivery cost of Generator 020
Civil Work 020Shelter 012
Electrical Works 030
Other Equipments (UPS
Battery etc) 030
Construction cost -
Land -
Contingency amp FinancialCharges 008
Total cost 150
882019 Major Project (Ramit)
httpslidepdfcomreaderfullmajor-project-ramit 5862
49
Ope rating costs related assumptions are tabulated below
Table 93 Operating CostsOperating Costs
Security Sentries (INRMonth) 4000
Supervisors (INRMonth) 6000
Cluster Manager One for Fifty Towers (INRMonth) 15000
Annual increase 500
Number of Security Sentries per tower 300
Number of supervisors per tower 010
Number of C luster manager per tower 002
Fixed Expenses
Selling amp Maintenance (INRMonth) 4000000
Annual Escalation 5
Administration overhead (INRMonth) 10000000Annual Escalation 7
AMC Cost of Generator 15 (cost of generator)
Annual Escalation (AMC) 3
For RTT sites security sentries are not required because it will be the responsibility of
the site owner A supervisor will for every 10 sites and a cluster manager for every 50
sites will be required
882019 Major Project (Ramit)
httpslidepdfcomreaderfullmajor-project-ramit 5962
50
Table 94 Long term debtInterest Rate 125 per annum
Moratorium 2 years
Repayment Period 8 years
Tariff related assumptions and date of operations are tabulated below
Table 95 GBT and RTT Tariff Table 96 Life of the projectTariff Plan
Tariff (INRMonth)
No of
operators GBT RTT
1 28000 18000
2 22000 14000
3 0 12000
Annual
increase 3 3
Commercial Operation Date 1-Aug-09
Quarter Ending 30-Sep-09
FY ending COD 31-Mar-10
Project life years 15
End of commercial
operations31-Aug-24
Quarter ending commercial
operations30-Sep-24
FY ending comme rcial
operations31-Mar-25
882019 Major Project (Ramit)
httpslidepdfcomreaderfullmajor-project-ramit 6062
51
Annexure 2 Profit amp Loss accountsTable 97 Profit amp loss account statement
Income Statement (MNINR)Year ending Mar-10 Mar-11 Mar-12 Mar-13 Mar-14 Mar-15
RevenueGBT 406350 28811 89080 197447 379409 527015Operator Fees (GBT) 1411 10004 30678 67998 130664 179664RTT 1209 8575 27269 60443 116146 164264
Operator Fees (RTT) 440 3121 9739 21587 41481 56466Net Revenue 7124 50511 156766 347476 667700 927410
Expenses
VariableSecurity Sentries 1355 9790 28339 64033 125433 158238Supervisors 097 699 2024 4574 8959 11303Cluster Manager 048 350 10 12 2287 4480 5651AMC Cost of Generator 450 3013 7877 16719 31148 54541Sub-total 1950 13852 39252 87612 170021 229734
Fixed
Selling amp Maintenance(INRMonth) 032 050 053 056 058 061
Administration overhead(INRMonth) 080 128 137 147 157 168
Sub-total 112 179 190 203 216 230
EBITDA 5062 36480 117324 259661 497464 697447
Interest on LT loan - - 7341 31200 77479 156198Interest on ST loan - 021 060 130 245 361
EBDT 5062 36459 109923 228331 419739 540888Depreciation 2439 12769 35917 77162 142925 174006
EBT 2624 23691 74006 151169 276814 366881Income Tax 170 4233 14536 29073 53547 77634
PAT 2454 19458 59470 122096 223267 289247
882019 Major Project (Ramit)
httpslidepdfcomreaderfullmajor-project-ramit 6162
52
Annexure 3 Balance sheet
Table 98 B alance sheetsYearend Balance Sheet (MNINR)Year ending Mar-10 Mar-11 Mar-12 Mar-13 Mar-14 Mar-15
AssetsGross Block 75742 328216 833164 1716823 3105430 3105430Accumulated depreciation 2439 15208 51125 128287 271212 445218Net Block 73303 313009 782040 1588536 2834219 2660212Net Working Capital 064 241 620 1335 2515 3707Cash Balance 12979 72089 216513 488856 947982 1294734Total Assets 86346 385339 999172 2078727 3784715 3958653
LiabilitiesEquity 25168 108980 276604 569947 1030914 1030914Reserves amp Surplus 2454 21912 81381 203477 426745 715992Long term Debt 58725 254286 640722 1304302 2325171 2208967WC Borrowings - 161 465 1001 1886 2780Total Liabilities 86346 385339 999172 2078727 3784715 3958653
882019 Major Project (Ramit)
httpslidepdfcomreaderfullmajor-project-ramit 6262
Annexure 4 Cash flow statement
Table 99 Cash flow statements
Year ending Mar-10 Mar-11 Mar-12 Mar-13 Mar-14 Mar-15
InflowsPAT 2454 19458 59470 122096 223267 289247Depreciation 2439 12769 35917 77162 142925 174006Tax adjusted interest - 014 4959 20991 52076 104895Release of WC - - - - - -Salvage Value - - - - - -Sub-Total 4893 32241 100345 220249 418268 568148
OutflowsCapex 75742 252474 504948 883659 1388607 -Change in WorkingCapital 064 177 379 715 1180 1192
Sub-Total 75806 252651 505327 884374 1389787 1192
UFCF (70913) (220410) (404982) (664125) (971519) 566956LFCF (70913) (220424) (409940) (685116) (1023595) 462062
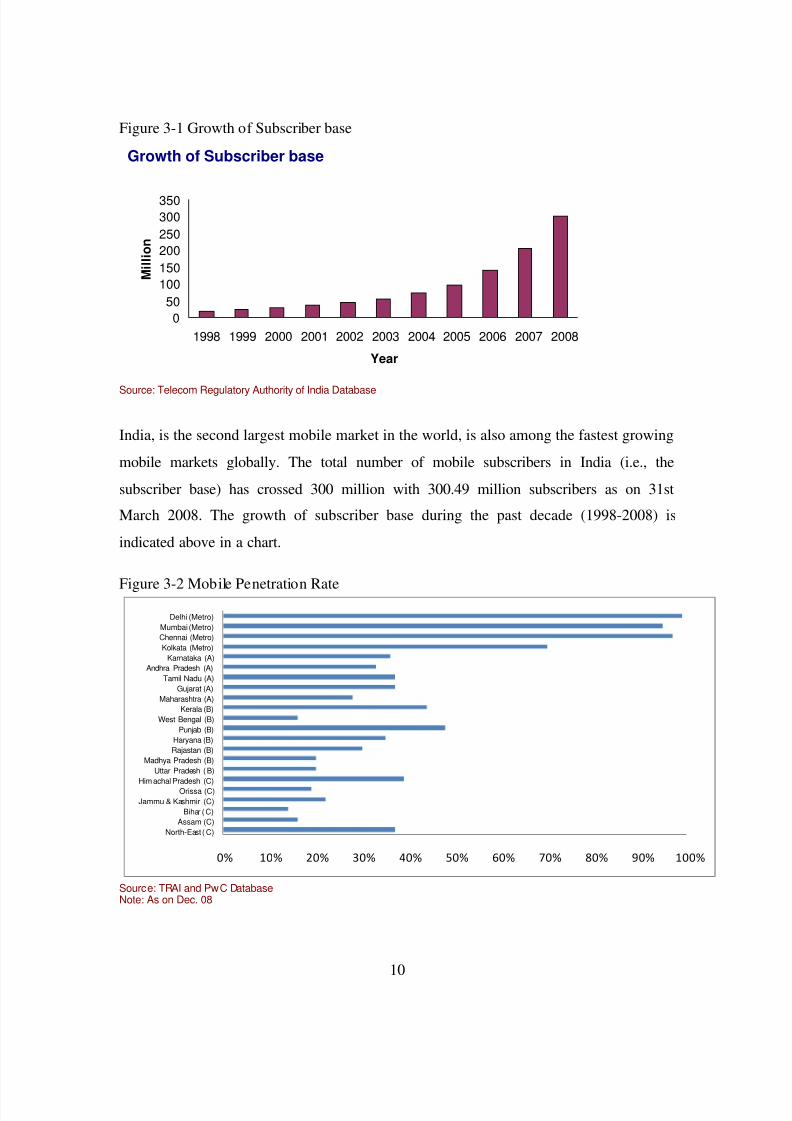
882019 Major Project (Ramit)
httpslidepdfcomreaderfullmajor-project-ramit 1962
10
Figure 3-1 Growth of Subscriber base
Growth of Subscriber base
050
100150200250300350
1998 1999 2000 2001 2002 2003 2004 2005 2006 2007 2008
Year
M i l l i o n
Source Telecom Regulatory Authority of India Database
India is the second largest mobile market in the world is also among the fastest growing
mobile markets globally The total number of mobile subscribers in India (ie the
subscriber base) has crossed 300 million with 30049 million subscribers as on 31st
March 2008 The growth of subscriber base during the past decade (1998-2008) is
indicated above in a chart
Figure 3-2 Mobile Penetration Rate
0 10 20 30 40 50 60 70 80 90 100
North-East ( C)Assam (C)
Bihar ( C)Jammu amp Kashmir (C)
Orissa (C)Him achal Pradesh (C)
Uttar Pradesh ( B)Madhya Pradesh (B)
Rajastan (B)Haryana (B)
Punjab (B)West Bengal (B)
Kerala (B)Maharashtra (A)
Gujarat (A)Tamil Nadu (A)
Andhra Pradesh (A)Karnataka (A)
Kolkata (Metro)Chennai (Metro)Mumbai (Metro)
Delhi (Metro)
Source TRAI and PwC DatabaseNote As on Dec 08
882019 Major Project (Ramit)
httpslidepdfcomreaderfullmajor-project-ramit 2062
11
Indian telecom industry has experienced a high growth rate in Metros and class A circles
with coverage reaching around 90 and 35 respectively However coverage in the
Class B and Class C cities is still low at 15-25 Growth in Class B and Class C circles
has concentrated in urban area while penetration in rural area remains lower Thus futuregrowth is likely to come largely from Class B and C circles and rural areas Keeping this
in view larger players like Bharti Airtel Limited Reliance Communications Limited and
Bharat Sanchar Nigam Limited (BSNL) are largely focusing on increasing their
geographical coverage in Class B and C c ircles
33 Telecom Market- Competitive landscape
Figure 3-3 Market Share
Bharti2668
BSNLMTNL1908
Reliance1971
Vodafone661
Tata1047
Idea1033
Aircel457
Spice181
BPL056
HFCL013
Shyam005
Market Share
Source TRAI and Pw C Database
Indian mobile sector is largely concentrated with top 4 market players (Bharti Airtel
Reliance Communication Vodafone Essar and BSNL) out of 10 capturing almost three-
fourth of the entire market This is also partly on account of the fact that these four
operators have their presence in a larger number of circles as compared with other
players
882019 Major Project (Ramit)
httpslidepdfcomreaderfullmajor-project-ramit 2162
12
Figure 3-4 Lice nsed Circles
0
5
10
15
20
25
Licensed Circles (Dec 07) New Circles (Sep 08)
Source TRAI and CRISIL Database
The competition in Indian telecom sector is expected to intensify in near future because
recently new licenses have been granted to some of the existing operators for new circles
and also to new entrants like Unitech Datacom Swan Telecom and Stel These new
players are expected to capture the rural and semi-urban cities of C ircle B and Circle C as
they are now expected to grow at a much faster rate Shorter network rollout time and
competitiveness in the industry will force these entrants to start the ir operation as early as
possible Tower companies like ABC will allow incumbents to start operations in a
particular region just by installing their electronics on the ready-to-use towers thereby
significantly shortening the ro llout time
Moreover a rapidly increasing subscriber base and spectrum crunch would force the
existing telecom operators to maintain the minimum level of QoS Thus to retain existing
subscribers by preventing subscriber churn operators will require additional
infrastructure in their existing areas of operation to be able to offer better QoS This will
also result in increase in demand for telecom infrastructure in the existing markets
(Ramachanran 2009)
882019 Major Project (Ramit)
httpslidepdfcomreaderfullmajor-project-ramit 2262
13
34 Telecom Infrastructure Overview
Passive infrastructure is one of the most important components of a mobile network It
has been a critical area of operations for telecom companies in the past However with
increasing competition posing an urgent need for telecom companies to expand their
coverage and sharpen their focus on core operations so that they can sustain and improve
their market position passive infrastructure has assumed the status of an independent
industry during the past few years The industry (COAI) estimates that there will be a
requirement of around 350000 towers for 500 million subscribers by 2010 (COAI
2009)
Each site has active and passive infrastructure components Active components includethe antenna trans-receivers switches feeder cables Node B and microwave radio
equipments Passive (or non-electronic) components include the land tower shelter air-
conditioning equipment diesel electric generator battery electrical supply technical
premises and easements pylons etc Passive infrastructure in a mobile network
essentially involves acquiring land setting up towers and electrical and civil works that
needs to be in place before operators can install the active infrastructure which brings
mobile services to the consumers In a typical cell site build-out almost 65 of the total
cost is attributed to passive infrastructure and 35 to active infrastructure
(Ramachanran 2009)In this report passive cell site infrastructure has also been
henceforth referred to as towers or sites
The components of a typical base station are shown below
882019 Major Project (Ramit)
httpslidepdfcomreaderfullmajor-project-ramit 2362
14
Picture 3 1 Telecom Tower
Telecom towers are broadly classified on the basis of their placement as Ground-basedand Roof-top
1 Ground-Based Tower Ground-based towers (GBTs) are taller (typically 200 to 400
feet) and are mostly used in rural and semi-urban areas because of the easy
availability of real-estate space there GBTs involve a capital expenditure in the range
882019 Major Project (Ramit)
httpslidepdfcomreaderfullmajor-project-ramit 2462
15
of Rs 3 to 4 million depending on the height of the tower land prices etc
(Ramachanran 2009)
2 Roof-Top Tower (RTT) Roof-top towers (RTTs) are generally placed on the roofsof high-rise buildings They are shorter (than GBTs) and more common in urban and
highly populated areas where there is paucity of real-estate space Typically these
involve a capital expenditure of Rs 15 to 2 million (Ramachanran 2009)
The height of a telecom tower determines the number of antennas that can be
accommodated which in turn determines the capacity of the towers apart from factors
such as location and geographica l conditions (wind speeds type of terrain etc)
35 Telecom Infrastructure- Domestic market
In India there are broadly two kinds of operators in the tower infrastructure industry
Tower infrastructure subsidiaries
Reliance Infratel Limited
Bharti Infratel Limited
Indus Towers Limited
Wireless TT Info Services Limited (WTTIL)
Independent tower infrastructure companies (ITICs)
GTL Infrastructure
Xcel Telecom
Essar Telecom Infrastructure
Aster Infrastructure
Bharat Telemast
882019 Major Project (Ramit)
httpslidepdfcomreaderfullmajor-project-ramit 2562
16
These companies have their business model based largely on contract or anticipatory
approaches Under the contract approach tower companies set up tower sites going by
the requirements of the telecom operators and the terms of the contract are specified
beforehand in the MSAs signed by the two parties Under the anticipatory approachhowever tower companies set up tower infrastructure at sites with reasonable demand
potential and subsequently invite telecom operators to set up their network on these
towers The latter model involves higher business risks as the tower company may not be
able to achieve reasonable tenancy for its tower infrastructure and at profitable terms
BPTL proposes to follow contract approach for its business model
36 Telecom Infrastructure market- Competitive landscape
Figure 3-5 Telecom Infrastructure Market Players
038058154
365692
10381692
26923269
0 20000 40000 60000 80000 100000
Aster InfrastructureAmerican Towers
Essar Telec om Infrastructure
GTL In frastructureWi reles s TT In fo Services Limited
Bharti Infratel Limited
Reli anc e Communications Limitedrsquos
OthersInd us To wers Limited
Number of Towers
Market Players
Source Telecom Regulatory Authority of India and ICRANote Others include tower por tfolios of BSNL MTNL Sistema Shyam Teleservices Aircel etc
In Indian Telecom Infrastructure market competition has intensified significantly with
several players spinning of their tower portfolio and independent operators expanding
their operations
882019 Major Project (Ramit)
httpslidepdfcomreaderfullmajor-project-ramit 2662
17
Bharti Airtel Limited Reliance Communications Limited and Tata Teleservices Limited
have hived off their tower assets into separate tower infrastructure subsidiaries namely
Bharti Infratel Limited Reliance Infratel Limited and Wireless TT Infoservices Limited
respectively Also Bharti Infratel Limited together with Vodafone Essar Limited and IdeaCellular Limited in a joint- venture agreement has created Indiarsquos largest tower
infrastructure company ndash Indus Towers Limited which has an estimated portfolio of
around 88000 towers (Anjan V amp N 2009) Whereas in past few years number of
independent tower infrastructure companies have ventured into the domestic telecom
tower industry These include GTL Infrastructure Limited Essar Telecom Infrastructure
Limited Xcel Telecom Private Limited (American Towers) Tower Vision India Private
Limited Aster Infrastructure Private Limited TVS Interconnect Systems Limited etc
Figure 3-6 Telecom Tower Growth Scenario
0
100
200
300
400
500
600
700
2008 2009 2010 2011 2012 T e
l e c o m
T o w e r s
( T h o u s a n
d s )
Source Telecom Regulatory Authority of IndiaAssumptions Subscriber growth rate of 28 till 2011-12
1400 subscribe per site
As shown above it is expected that in next 4-5 years there will be a requirement of
additional 85000 towers (both GBT and RTT) each year to meet the subscriber base of
800 million by 2011-12 (PwC 2009) This shows that huge investment have to be made
in Indian telecom Infrastructure sector in near future Now since both passive and active
882019 Major Project (Ramit)
httpslidepdfcomreaderfullmajor-project-ramit 2762
18
infrastructure sharing is a llowed (except spectrum) Independent service providers will be
benefited Increase in subscriber base introduction of new technologies like 3G Wi-max
etc and increase in market healthy market competition in telecom services sector will
drive the growth in telecom infrastructure sector
882019 Major Project (Ramit)
httpslidepdfcomreaderfullmajor-project-ramit 2862
19
4 BUSINESS PLAN
41 Passive Infrastructure
Mobile networks have base stations (or cell sites) which have active and passive
infrastructure components Active components include the antenna trans-receivers
switches feeder cables Node B and microwave radio equipments Passive (or non-
electronic) components include the land tower shelter air-conditioning equipment
diesel electric generator battery electrical supply technical premises and easements
pylons etc Passive infrastructure in a mobile network essentially involves acquiring land
setting up towers and electrical and civil works that needs to be in place before operators
can install the active infrastructure which brings mobile services to the consumers In atypical cell site build-out almost 65 of the total cost is attributed to passive
infrastructure and 35 to active infrastructure
42 Infrastructure Sharing
Mobile operators are required to setup more and more BTS (cell) sites due to the
exponential growth of mobile subscribers in India (currently growing at almost 15 4
million subscribers a month) and limited availability of spectrum B and C Circles (wheretraffic density may not be as high as metros and Circle A) are expected to drive future
subscriber growth and requirements for cell sites will be higher to ensure greater
coverage
However creating new infrastructure by each operator separately leads to d uplicat ing
huge capital investments It also contributes to mushroom growth of telecom towers and
deteriorating skylines in urban areas which has already led to some local municipal and
state governments to regulate and restrict the erection of new mobile towers
The continued pressure on cellular tariffs higher infrastructure costs for network
deployment particularly in semi-urban and rural areas and compelling need to reduce
4 As published in ET 8 th May 09 Edition
882019 Major Project (Ramit)
httpslidepdfcomreaderfullmajor-project-ramit 2962
20
time to market for network roll outs have led operators to share and even outsource their
infrastructure requirements from third party infrastructure providers like BPTL GTL and
Indus towers It promotes capital efficiency as it allows more than one service provider to
leverage and ride o n common infrastructure In its simplest form it involves two or moreoperators jointly using the common passive infrastructure in a cell site While viewed
largely as a measure to reduce capital and operating expense such sharing also leads to
improvement of service q uality (by ensuring site space for service providers and reducing
black spots) and the environment (by reducing number of cell sites and towers)
In outsourcing operators take passive infrastructure and tower space from third party
infrastructure companies on a monthly rental basis to host their radio and transmission
equipments Outsourcing provides significant benefits to operators It enables them tosave on capital expenses (it actually converts capital expense into operating expense in
the form of lease rentals) and focus on their core activities of sales marketing and
branding while leaving the cumbersome task of managing the site development process
and site operation and maintenance to third parties who exclusively deal with such
activities
The concept of passive infrastructure sharing is increasingly gaining market acceptancein India So far it has been largely limited to bilateral sharing between operators in the
form of barter where the operators split the site related CAPEX and OPEX costs The
available information suggests that about 25 of the existing 90000 tower sites in India
are currently being shared for passive infrastructure predominantly in rural areas and
small towns
43 Introduction to the business
BPTL is an Infrastructure Provider company that builds owns operates and maintains
passive network infrastructure on a shared basis for mobile telecom operators and ITES
providers Its objective is to provide network design and planning network deployment
882019 Major Project (Ramit)
httpslidepdfcomreaderfullmajor-project-ramit 3062
21
network operations amp maintenance infrastructure management application management
and professional services to teleco m operators and enterprises
The company is planning to raise capital in the form of equity and debt to start its
operation by Aug 09 ABC rsquos vision is to provide world class managed infrastructure ampallied services to the service providers to optimize their service delivery capability In the
initial years of operation the company will focus on telecom sector with almost 100 of
its proposed capital expenditure till FY 14 earmarked for developing and owning passive
infrastructure for sharing among mobile service providers
44 Business Proposal
ABC will provide passive telecom infrastructure on build own operate (BOO) basis inboth ground based (GBS) as well as roof-top sites (RTS) It will undertake full range of
responsibilities in building owning and maintaining the sites and will serve as a single
window one-stop-shop provider of infrastructure services Typical responsibilities are
summarized below
Site planning keeping in view the network rollout plans of prospective customers
Site acquisition including entering into long-term agreements with land owners
Obtaining of necessary regulatory approvals
Erect ion and commissioning of tower and allied equipment
Provision of support services such as back-up power air-conditioning and
security
Provision of turnkey solutions to telecom companies such as sourcing of
equipment testing and maintenance
882019 Major Project (Ramit)
httpslidepdfcomreaderfullmajor-project-ramit 3162
22
Bharat Telemast Private Limited will identify the sites required for setting up the Passive
infrastructure by first of all getting a commitment from one operator who is called as
ldquoAnchor Operatorrdquo Then Bharat Telemast will go ahead to lease (or) buy out the site as
appropriate and commences construction of the cellular sites But the Cellular site will betypically designed for three to four operators While construction is in progress the
marketing team will work towards getting the second and third operator But care will be
taken in such a way that at least two operators are available at the time of completion of
construction
45 Sources of revenue
1 Infrastructure Provisioning Fees ndash fee paid by the operators on a monthly basisWith annual escalation
2 Site lease rental ndash Paid at actual on a monthly basis
3 Operations and maintenance charges Paid on a monthly basis
4 The contract also provides a fixed annual escalator
46 Attractiveness of business model
Stable and predictable cash flow business Once a tower asset is rented out it
usually generates a stable and predictable cash flow in the form of tower rentals
from occupants over the term of the MSA between the two parties
Low working capital requirement ABC rsquos business model is also characterized
by low working capital requirements as most of the operating expenses (such aselectricity and fuel and other variable operating expenses) are reimbursable by the
tenants on actual basis Moreover BPTL is may also be able to get rentals for the
towers in advance and also obtain better credit terms from their suppliers thus
further improving their working capital cycle
882019 Major Project (Ramit)
httpslidepdfcomreaderfullmajor-project-ramit 3262
23
High incremental profitability The operating costs associated with this
business are largely fixed in nature Thus each increment in tenancy is
accompanied by a minimal increase in costs This leads to a more thanproportionate increase in profits for every increase in occupancy
Reduction in capital investments due to present market conditions Due to
present market situation average capital requirement for RTT and GBT sites have
dropped from 2 million and 4 million to 15 million and 33 million ABC wishes
to grab this opportunity which will result in competitive advantage in near future
Extensive usage While on an average a GSM BTS can handle around 100-
1100 subscribers but in the case of high usage areas the figure can be as low as
600-700 subscribers which means a larger number of cell sites would be required
for the same area Moreover the country has the problem of spectrum scarcity
which increases the requirement of towers to maintain a reasonable leve l of
service quality
New entrants Many operators including Vodafone Essar Limited Idea Cellular
Limited Aircel Cellular Limited and Sistema Shyam Teleservices Limited have
received licenses as well spectrum in new circles which would enable them to
become pan-India operators in the next one-two years Also new licenses have
been issued to new players such as Unitech Swan Telecom and S Tel Limited
Given the significant expansion plans of new entrants over the medium term and
the need for them to optimize investments in order to maintain returns demand
for towers is expected to report a sharp increase
Shorter rollout time Indian telecom industry is highly competitive and doing
business for new entrant may not be easy Shorter network-rollout time would be
a critical success factor for the new entrants and a longer rollout time could meanloss of substantial market share to other operators Tower companies allow
players to start operations in a particular region just by installing their electronics
on the ready-to-use towers thereby significantly shortening the rollout time
New technologies 3G services are already launched in the country and to
augment their services various operators plan to launch Wi-Max services as soon
882019 Major Project (Ramit)
httpslidepdfcomreaderfullmajor-project-ramit 3362
24
as they receive additional spectrum from Government This would further
increase the demand for sharing of passive infrastructure
47
Expansion Schedule
BPTL would rollout both RTT and GBT sites of which the RTT sites GBT sites
normally would have a tower height of 50 meters or 60 meters depending on the need for
additional height for installation of microwave antennae based on the location of the site
and number of tenants on the cell site Details of BPTLrsquos expansion plan are summarized
below
Table 41 Expansion PlanExpansion Schedule 2009-10 2010-11 2011-12 2012-13 20013-14
GBT
Addition 210 700 1400 2450 3850
Total 210 910 2310 4760 8610
RTT
Addition 90 300 600 1050 1650
Total 90 390 990 2040 3690
48 Proposed Services
As indicated earlier ABC proposes to provide passive telecom infrastructure on a
sharing co-location basis to cellular operators The sites would either be Ground Based
Sites (GBS) or Roof Top Sites (RTS) As the sites are meant for co-location of the active
components of two to three operators they would be built to either 2-Tenant or 3-Tenant
specifications
The different components of the passive infrastructure facility and the related services
that would be offered by BPTL to the operators are as under
Infrastructure provisioning comprising
882019 Major Project (Ramit)
httpslidepdfcomreaderfullmajor-project-ramit 3462
25
Communication tower built to host multiple antennae
Weather-proof communication shelter with air-conditioning and power backup
arrangement
Diesel generating set and battery bank for power backup
A mobile standby generator to act as backup in case o f breakdown
Warehousing facility
Infrastructure operations and maintenance including
Regular operations and maintenance of the facility
Security of all the equipments at the site at all timesA dedicated team of technicians for a group of 40-50 sites to ensure effect ive and
efficient functioning of the components at all times
49 Proposed Organizational Structure
A senior management team will work under the leadership of the ldquoChief Operations
Officerrdquo who will be responsible for smooth implementation of proj ect activities He willalso assist the managing director in marketing This team will coordinate with Stallion
Telecom Pvt Ltd which will take over the role of procuring Capital Equipments
Senior management will consists of project manager infrastructure manager commercial
manager and head (legal and company affairs Apart from this there will be a requirement
Chief OperatingOfficer
Project Manager Infrastructure
Manager
Commercial
Manager (projects)
Head (Legal and
Company Affairs)
882019 Major Project (Ramit)
httpslidepdfcomreaderfullmajor-project-ramit 3562
26
of security sentries (3 per GBT site) supervisors (one for every 10 sites) and cluster
manager (one for every 50 sites)
Bharat Telemast will carry out the complete Project execution with the assistance of third party ldquoQuality control organizationrdquo and a third party ldquoProject management teamrdquo
Quality control and project management activities will be o utsourced to a third party
882019 Major Project (Ramit)
httpslidepdfcomreaderfullmajor-project-ramit 3662
27
5 METHODOLOGY
The changing face of infrastructure services creates a complex situation which demands
greater understanding of roles of competition regulatory structures and modes of
financing Knowledge of such things is a key decisive factor in building confidence
among investors promoters and government In project finance the project its assets
contract and cash flows are separated from promoter in order to permit credit appraisal
or loan to the project
As part of the financial feasibility analysis a series of related financial statements based
on projected sources and uses of funds during the development and operating phaseproject were created Financial statements consist of expenses associated with
development activities including capital costs like acquisition of land for GBT sites cost
of tower generator shelter batteries etc Most of the data regarding capital costs are
obtained from the promoter of ABC Limited All these capital costs related details are
provided in annexure 1
Assumption regarding depreciation capital structure operating expenses expansion
schedule tenancy ratios tariff or rent operatorrsquos fees and loan amortization schedule are
obtained from professional accountants Promoter and bankers of ABC Limited
Due to unknown factors that could influence the cost of towers or fees associated with
completing the project (soft costs) contingency costs were estimated at 5 of hard and
soft costs respectively If contingency is set too low developers could easily encounter
funding shortfalls upon slight changes in market forces All other costs were estimated
based on talking with industry professionals (Promoters)
A detailed financial model was prepared based on existing accounting standards and
following financial ratios were estimated
882019 Major Project (Ramit)
httpslidepdfcomreaderfullmajor-project-ramit 3762
28
EBITDA margin Profit and loss accounts for the estimated project period (15
Years) were prepared based on which estimated earnings before interests tax
depreciat ion and amortization were calculated for each year Detailed PampL
balance sheet and cash flow statements are provided in annexure 2 3 and 4
EBITDA = Total Revenue ndash (Variable expenses + Fixed Expenses)
EBITDA margin = EBITDA Total Revenue
PAT margin PAT is calculated by subtracting interests pa id on capital debt and
working capital debt depreciation and applicable corporate income tax from
EBITDA
PAT = EBITDA ndash Interest Payable ndash Depreciation ndash Income tax
PAT margin = PATTotal Revenue
Working Capital Working capital requirement is calculated by subtract ing
current liabilities from current assets Current assets are estimated based on 30
days cash requirement and current liabilities are estimated as half of salary
monthly expenses
WC = Current Assets ndash Current Liabilities
UFCF It is defined as the free cash flows available to the firm if the firm has
zero debt liability Purpose of ca lculat ing UFCF for project period is to determinethe project IRR
UFCF = PAT + Depreciation + Interest (tax adjusted) + Release of WC + Salvage
value of the assets ndash CAPEX ndash Change in WC
882019 Major Project (Ramit)
httpslidepdfcomreaderfullmajor-project-ramit 3862
29
LCFF It is defined as the cash floes available to the firm after paying interests on
long term and short term debts
LCFF = UFCF ndash Interest (tax adjusted)
FCFE It is defined as the free cash flow available to equity holders It is
determined to ca lculate equity IRR for equity investors It also includes the tax
benefits which are available as per the Income Tax Act
FCFE PAT + Depreciation + Salvage Value ndash Equity Investment ndash Long term debt
repayment
PIRR Project IRR is defined as the discount rate at which NPV (Net Present
Value) of UFCF is zero It is calculated by using following formula
UFCF 1 (1+PIRR) 0+ UFCF 2 (1+PIRR) 1+ UFCF 3 (1+PIRR) 2+ helliphelliphelliphelliphelliphellip = 0
UFCF 1 = UFCF at the end of first year of operation
UFCF 2 = UFCF at the end of second year of operation
PIRR = Project IRR
EIRR Equity IRR is defined as the discount rate at which NPV of FCFE is zero
It is calculated by using following formula
FCFE1 (1+EIRR) 0+ FCFE 2 (1+EIRR) 1+ FCFE 3 (1+EIRR) 2+ helliphelliphelliphelliphelliphellip = 0
FCFE1 = FCFE at the end of first year of operation
FCFE2 = FCFE at the end of seco nd year of operation
EIRR = Equity IRR
882019 Major Project (Ramit)
httpslidepdfcomreaderfullmajor-project-ramit 3962
30
WACC It is de fined as the percentage of return expected by the investors who
otherwise would have earned some return by investing in some other project
WACC = Cost of Debt (Debt Capital) + Cost of equity (Equity Capital)
882019 Major Project (Ramit)
httpslidepdfcomreaderfullmajor-project-ramit 4062
882019 Major Project (Ramit)
httpslidepdfcomreaderfullmajor-project-ramit 4162
32
62 Funding planAs the telecom sites are rolled out over a 5 year period till FY 2014 investment will be
required for each year ABC Limited will start generating profits from FY 10 only Such
internally generated cash accruals will be ploughed back into the business to meet part of
the project cost Investment required for each year is tabulated below
Table 61 Funding ProposalMillion INR FY 10 FY 11 FY 12 FY 13 FY 14
GBT Tower (Additional) Nos 210 700 1400 2450 3850
RTT Tower (Additional) Nos 90 300 600 1050 1650DE ratio 233 233 233 233 233
Additional CAPEX 83892 279374 558748 977809 1536557
Debt 58725 195562 391124 684466 1075590
Equity 25168 83812 167624 293343 460967
63 Results
Based on assumptions given in Annexure 1 a detailed financial model was preparedResults of the financial model such as PampL account Balance Sheet and cash flow
statements are provided in Annexure 2 3 and 4 Forecasts for the key financial figures for
first five years are provided in the Table below
Forecasts
Table 62 Income StatementMillion INR FY-10 FY11 FY12 FY-13 FY-14
Sales 7124 50511 156766 347476 667700
Cost of sales 1950 13852 39252 87612 170021
Gross 5174 36659 117514 259864 497679
7263 7258 7496 7479 7454
Admin costs 112 179 190 203 216
882019 Major Project (Ramit)
httpslidepdfcomreaderfullmajor-project-ramit 4262
33
Finance cost 0 021 7401 31330 77725
Taxation 170 4233 14536 29073 53547
PAT 2454 19458 59470 122096 223267
As shown in Table above during the expansion period revenue will grow exponentially
In the first year of operation ABC will earn a revenue of INR 7124 million from 300
(210 GBT and 90 RTT) sites with a tenancy ratio of 15 for GBS and 17 for RTS In the
first 2 years of operation the company will not pay any interest on long term debt due to
2 years moratorium period Major cost associated with the project is depreciation due to
which PAT is lower than the operating profits But cash flows to the firm are enough to
result in reasonable returns
Table 63 Balance Shee tYear ending Mar-10 Mar-11 Mar-12 Mar-13 Mar-14
AssetsGross Block 75742 328216 833164 1716823 3105430Accumulated depreciation 2439 15208 51125 128287 271212Net Block 73303 313009 782040 1588536 2834219Net Working Capital 064 241 620 1335 2515Cash Balance 12979 72089 216513 488856 947982
Total Assets 86346 385339 999172 2078727 3784715LiabilitiesEquity 25168 108980 276604 569947 1030914Reserves amp Surplus 2454 21912 81381 203477 426745Long term Debt 58725 254286 640722 1304302 2325171WC Borrowings - 161 465 1001 1886Total Liabilities 86346 385339 999172 2078727 3784715
Note All figures are in Million INR
Table 64 Key financial ratiosMar-11 Mar-12 Mar-13 Mar-14 Mar-15
Revenue Growth 60902 21036 12165 9216 3890EBITDA Growth 62061 22161 12132 9158 4020
PAT Growth 69293 20564 10531 8286 2955
As shown in table above increase in EBITDA is higher than that of revenue This is due
to better operational efficiency of ABCrsquos management and economies of scale S imilarly
882019 Major Project (Ramit)
httpslidepdfcomreaderfullmajor-project-ramit 4362
34
increase in PAT is lesser than that of EBITDA because of high depreciation and interest
expenses
Table 65 Pr ofitability r atios
Mar-11 Mar-12 Mar-13 Mar-14 Mar-15
EBITDA Margin 7222 7484 7473 7450 7520
PAT Margin 3852 3794 3514 3344 3119Return on Net Worth 622 760 769 788 1087
Key profitability ratios are shown in table above Return on net worth in the initial years
is lower because of the ambitious expansion plans of ABC Limited Thereafter return on
net worth increases with increase in PAT
Returns on Investment
Table 66 Financial returnsFinancial Indicators
Project IRR 1813Equity IRR 3609
64 Sensitivity Analysis
A sensitivity analysis has been carried out on the project financials to determine theimpact of key variables on the financial indicators namely
Project IRR
The key variables on which sensitivity analysis have been carried out areCapital expenditure for GBS and RTS1st and 2 nd tenant tariff for GBS1st and 2 nd tenant tariff for RTSTenancy Ratio
Similarly sensitivity analysis has been carried out forEquity IRR
The key variables on which sensitivity analysis have been carried out for EIRR are
Capital structure and interest rate for capital debtRepayment period and moratorium period
882019 Major Project (Ramit)
httpslidepdfcomreaderfullmajor-project-ramit 4462
35
The impact on the financial indicators is shown below
Figure 6-1 Project IRR vs GBT and RTT CAPEX
As shown in Figure 6-1 project IRR is more sensitive to change in CAPEX of RTT sitesas compared to change in CAPEX of GBT sites because tenancy ratio and tariff for RTTsites are higher than those of GBT sites
882019 Major Project (Ramit)
httpslidepdfcomreaderfullmajor-project-ramit 4562
36
Figure 6-2 Project IRR vs GBT Tariff for 1 st tenant (X-axis) and 2 nd tenant (right-hand side)
As shown in Figure 6-2 project IRR varies linearly with GBT tariff In the best casescenario when GBT tariff for 1 st tenant is INR 34000month and GBT tariff for secondtenant is INR 26000month Project IRR is 2101
Figure 6-3 Project IRR vs RTT Tariff for 1 st tenant (X-axis) and 2 nd tenant (right-hand side)
As shown in Figure 6-2 project IRR varies linearly with RTT tariff In the best casescenario when RTT tariff for 1 st tenant is INR 24000month and RTT tariff for second
882019 Major Project (Ramit)
httpslidepdfcomreaderfullmajor-project-ramit 4662
37
tenant is INR 20000month Project IRR is 1932 Project IRR is more sensitivetowards RTT tariff than GBT tariff because in practical business situation RTT siteshave a tenancy ratio of more than two due to which effect of tariff for 1 st tenant almostget nullified after few years
Figure 6-4 Project IRR vs Tenancy ratio for RTT sites (X-axis) and GBT sites
As shown in Figure 6-4 project IRR is very sensitive to tenancy ratio In the best casescenario where GBT sites have a tenancy ratio of 2 and RTT sites have a tenancy ratio of 3 project IRR can be as high as 20
Figure 6-5 Equity IRR vs long term debt interest rate for different leverage level
882019 Major Project (Ramit)
httpslidepdfcomreaderfullmajor-project-ramit 4762
38
As shown in figure 6-5 equity IRR is more sensitive to interest rate on long term debt forhigh level of leverage (lower debt equity ratio) because as the debt equity ratio increasesinterest paid on long term debt also increases significantly
Figure 6-6 Equity IRR vs long term debt repayment period at different level of moratoriumperiods
As shown in figure 6-6 Equity IRR increases with increase in moratorium period anddebt repayment period The variation is from 1654 to 60 for worst case and best casescenarios
882019 Major Project (Ramit)
httpslidepdfcomreaderfullmajor-project-ramit 4862
39
7 RISK ASSESSMENTRisk Mitigation strategyExecution Risk
(Project management landacquisition etc)
Management of ABC has proven expertise in
telecom infrastructure rollout and has executedvarious projects with large telecom operators andMNC vendorsABCrsquos top management team consists of a groupof professionals drawn from leading telecomInfrastructure Company who have immenseexpertise and experience in rolling out telecominfrastructure projects
Market Risk (No entry barriers operators may
share infrastructure betweenthemselves large players withhigh capital may increasecompetition)
India has a huge potential for telecominfrastructure market With increasing
competition falling tariffs and pressure onmargins telecom service providers are beingforced to increase their focus on marketing andreduce their expensesExperienced management healthy capital back-up effective presence in the telecominfrastructure market and value added services atrelatively lesser cost will help ABC to meet theset targets
Financing Risk
(Availability of equity capitalavailability of long term debtinterest rate and moratoriumperiod)
ABC is seeking private equity partner to secure
equity capital Company has already entered intoNDA with 2 major investorsLong term debt at an interest rate of 125 canbe easily arranged because of the credibility of the promoters in the marketMany other similar firms like Indus and GTLhave already secured long term debt for amoratorium period of 2 years Promoters of ABCLimited are confident to secure a long term debtwith a moratorium period of 2 years and apayback period of 8 years
ABC Limited would minimize the workingcapital requirements of its business by securingrentals and operating revenues in advance fromits clients and or by suitably structuring itspayment liabilities to match its cash inflows
Commercial Risk (Tenancy ratio and tariff forGBS and RTS)
ABC would aim to enter into long term contractswith the ldquoanchor tenantrdquo operator and thenrollout the infrastructure so that at least single
882019 Major Project (Ramit)
httpslidepdfcomreaderfullmajor-project-ramit 4962
40
occupancy of each site is ensured at all t imesPromoters will use its knowledge of the businessand its expertise to identify and roll out sites inlocations which have strong multi- tenancypotential to minimize occupancy risk
Revenue Risk (Operating fees may decreasecredit worthiness of the clientsdelay in payment of rentals)
As per the industry sources till now not even asingle operator have dishonored the long termlease contractThe credit risk is diversified as there will bemultiple operatorsABC would aggressively market to get 3G andWiFi broadcasters to use the sites and earnadditional revenues in addition to the assumedrevenue streams
Natural Calamities Risk The Company shall maintain insurance for thesites against these risks and the cost of insurancewill be priced in and passed on to the tenants
882019 Major Project (Ramit)
httpslidepdfcomreaderfullmajor-project-ramit 5062
41
8 CONCLUSION
India is the fastest growing wireless telecom market in the world The continuing
growth in the number of wireless subscribers and MoUs and increasing trend of
outsourcing of business processes to India has led to growing demand for large
investments in the telecom infrastructure in the country
However with increasing competition falling tariffs and pressure on margins
telecom service providers are being forced to increase their focus on marketing
customer acquisitions and branding and minimize their efforts and overheads in
project management and asset acquisition
Further with rising prices of steel cement and real estate the cost of developing
and owning passive infrastructure is increasingly becoming a costly proposition
for most operators and service providers
The compulsion on the part of service providers to reduce their operating costs
and capital expenditure requirements has led to opportunities in passiveinfrastructure outsourcing to independent third party infrastructure providers and
also sharing the infrastructure with other service providers It is expected that
cellular operators will outsource their communications site infrastructure needs as
a means of accelerating access to their markets and preserving capital rather than
constructing and operating their own communications sites and maintaining their
own communications sites service and deve lopment capabilities
Passive infrastructure is highly capital intensive and an integral part of the cellular
service providersrsquo networks Yet being a simple and low technology asset it is
amenable to outsourcing and sharing By transferring the responsibility of
ownership development and maintenance of passive infrastructure service
882019 Major Project (Ramit)
httpslidepdfcomreaderfullmajor-project-ramit 5162
42
providers have an opportunity to transfer a substantial part of their business risk to
third parties
Most telecom operators are facing capacity constraints on their networksCoverage obligations increasing pressure to improve network quality and
competition has led to aggressive roll out plans by existing cellular operators
Installation of cell sites has become a cumbersome process as there are a number
of clearances required and involves labor-intensive micro management
Availability of ready infrastructure from third party providers would enable the
operators to reduce their time to market and accelerate their access to their
customers Cellular service providers generally want to move quickly when
adding more sites and co-location on an existing site is always faster than
building
Ownership and maintenance of telecom towers and other infrastructure by third
parties is an established practice in developed nations like USA and is
increasingly gaining market acceptance in India
The Indian government is seriously considering promoting the infrastructure
sharing route between the telecom operator and private players to achieve future
national tele-density targets and improve rural telecom penetration
ABC being an independent entity with no business conflicts with other service
providers in the telecom space will be best positioned and have an early mover
advantage to capitalize on this emerging opportunity
Further the task of operating and maintaining the passive infrastructure in the cell
is increasingly becoming a cumbersome exercise for the service providers to
handle ABCrsquos composite offering to build passive infrastructure for the cellular
operators and also operate and maintain them will provide a turnkey solution to
address the infrastructure needs of the service providers
882019 Major Project (Ramit)
httpslidepdfcomreaderfullmajor-project-ramit 5262
43
The business model proposed to be followed by ABC is fairly simple with stable
and predictable cash flows as is the case with the business model of the tower
renting companies in USA Most contracts are long term for a period 10 or moreyears with annual price escalators generally ranging from 3 to 4 However
wireless carriers normally tend to renew rentals because suitable alternative sites
may not exist or be available and repositioning a site in a carrierrsquos network is
expensive and may adverse ly affect network quality
Site ownership and operations is a ldquoscalerdquo business operating administration
marketing expenses etc do not rise as quickly as revenues when portfolios are
expanded Incremental operating costs associated with adding wireless tenants to
a communications site are minimal Therefore as additional tenants are added to a
site the substantial majority of incremental revenue contributes to margin
expansion Most tower companies have high EBITDA margins as may be seen
from the financial indicators of some of the tower rental companies in USA
It is expected that site location and capacity price and quality of service and
successful execution of contracts will be the most significant competitive factors
in this business
ABCrsquos revenue and returns on investment will be primarily driven by its ability
to
o Increase the utilization of the space and infrastructure capacity owned by it by
increasing the number of tenants per site and renting out to maximum number
of users As discussed above return on capital employed (PIRR and EIRR) arevery sensitive to tenancy ratio In worst case scenario project IRR can be as
low as 8 and in the best case scenario it can be as high as 20
o Develop acquire sites of strategic importance and high growth potential that
will enable them to secure better commercial terms from users and attract
more number of tenants Infrastructure provisioning fees rentals for sites are
882019 Major Project (Ramit)
httpslidepdfcomreaderfullmajor-project-ramit 5362
44
extremely location sensitive There is a potential to acquire more land than
that of required to capitalize on the increase in real estate prices
o Develop sites in a cost effective manner ABC would consider purchasing
land only for those GBS sites which have sufficient demand and arestrategically located Else for most of its sites land will be leasehold As
shown above returns (PIRR and EIRR) are very sensitive to capital costs In
the worst case scenario project IRR can be as low as 15 whereas it can as
high as 27 in the best case scenario
o Negotiate and secure long term contracts with good credit quality users with
built in price escalation provisions to mitigate financing risk
o Leverage and secure long term financing at attractive terms and involve in
active treasury management to keep low financing cost Results of the
sensitivity analysis indicate that equity IRR can be as high as 60 foe a
moratorium period of 4 years and interest rate of 10
o Minimize working capital requirements
o Maintain low operating and administration expense
o Secure better OampM margins from operators and retain a healthy share of it in
ABC
o Maintain high service standards and build strong customer relationships
The business would have the potential to capture new revenue opportunities
around the existing assets As demand for towers is expected to grow and as
operators migrate to speedier next-generation wireless technologies they will
need the towers and associated passive infrastructure to transmit their new
services in addition to their existing offerings In addition to increasing capacity
and coverage and improving the quality of their networks cellular serviceproviders are deploying high speed data networks driving incremental demand of
sites The business therefore has potential upsides in the form of adding
customers (tenants) in wireless broadband third generation (ldquo3Grdquo) and wireless
data capabilities and also other incremental value propositions by way of hosting
882019 Major Project (Ramit)
httpslidepdfcomreaderfullmajor-project-ramit 5462
45
Billboards Hoardings etc in some of the high visible sites owned and maintained
by it
Based on the assumptions and subject to satisfactory resolution of the key risks
factors project cash flows will be able to meet debt service obligations
This business model is a lucrative investment option for a private equity player
because valuation of each site will increase in the coming years due to
improvement in market conditions increase in the value of land and increase in
the demand for passive infrastructure in rural and semi-urban areas
882019 Major Project (Ramit)
httpslidepdfcomreaderfullmajor-project-ramit 5562
46
REFERENCESAnjan G V A amp N M (2009) telecom infrastructure industry in india GurgaonICRA
Bessler W Norsworthy J amp Shusterman T (2001 12 1) Mergers in the UStelecommunications industry and market valuationeffects IEEE p 288
COAI (2009 march 14) Subscriber Figures Retrieved march 14 2009 fromCOAIcom httpwwwcoaicomstatisticsphp
IDA (2009 march 23) Highlights Retrieved march 23 2009 from idagovsghttpwwwidagovsghomeindexaspx
K R (2008) Time for new business model Delhi Cybermedia
MAXIS (2009 march 8) the malaysian telecommunications industry Retrieved march9 2009 from maxiscommyhttpwwwmaxiscommypersonalabout_usinvestorprospectusprospectus4pdf
P J amp Lisa A (2009) Stimulas spending and American Telecom Industry USACoracle group
PwC (2009 march 12) Indian Telecom Industry Gurgaon Harayana IndiaRamachanran (2009 march 1) Investment in Telecom Infrastructure sector (M RInterviewer)
Vogelsang I (2002) The German Telecommunications Reform Verein fuumlr Socialpolitik (p 26) Innsbruck Boston Press
882019 Major Project (Ramit)
httpslidepdfcomreaderfullmajor-project-ramit 5662
47
ANNEXURES
ANNEXURE 1 Key Assumptions
The occupancy of each site by single two three operators for green-field sites is assumed
to be as follows
Table 91 Expected Tenancy RatiosFY 10 FY 11 FY 12 FY 13 FY 14 FY15
GBT Tenant
Ratio 150 150 170 170 170 200
Single Operator 50 50 30 30 30 0
Two Operator 50 50 70 70 70 100
RTT Tenant
Ratio 170 170 200 200 200 250
Single Operator 30 30 0 0 0 0
Two Operator 70 70 100 100 100 50
Three Operator 0 0 0 0 0 50
From FY 15 onwards tenancy ratio of 2 and 25 for GBT and RTT sites is cons idered
882019 Major Project (Ramit)
httpslidepdfcomreaderfullmajor-project-ramit 5762
48
Capital costs related assumptions are tabulated below
Table 92 GBT and RTT Capital Cost
The lease rentals for RTT sites are reimbursed from the operators and therefore have not
been factored in the revenues as well as the expense For GBT sites land purchase cost of
035 millions assumed which has been escalated by 6 annually to determine the
salvage value of assets
GBT Capital Costs
Million
INR
Delivery cost of Ground Based
Tower (GBT)063
Delivery cost of Generator 030
Civil Work 040Shelter 012
Electrical Works 030
Other Equipments (UPS Battery
etc)045
Construction cost 045
Land 035
Contingency amp Financial Charges 035Total cost 335
RTT Capital Costs
Million
INR
Delivery cost of Roof Top
Tower (RTT) 030
Delivery cost of Generator 020
Civil Work 020Shelter 012
Electrical Works 030
Other Equipments (UPS
Battery etc) 030
Construction cost -
Land -
Contingency amp FinancialCharges 008
Total cost 150
882019 Major Project (Ramit)
httpslidepdfcomreaderfullmajor-project-ramit 5862
49
Ope rating costs related assumptions are tabulated below
Table 93 Operating CostsOperating Costs
Security Sentries (INRMonth) 4000
Supervisors (INRMonth) 6000
Cluster Manager One for Fifty Towers (INRMonth) 15000
Annual increase 500
Number of Security Sentries per tower 300
Number of supervisors per tower 010
Number of C luster manager per tower 002
Fixed Expenses
Selling amp Maintenance (INRMonth) 4000000
Annual Escalation 5
Administration overhead (INRMonth) 10000000Annual Escalation 7
AMC Cost of Generator 15 (cost of generator)
Annual Escalation (AMC) 3
For RTT sites security sentries are not required because it will be the responsibility of
the site owner A supervisor will for every 10 sites and a cluster manager for every 50
sites will be required
882019 Major Project (Ramit)
httpslidepdfcomreaderfullmajor-project-ramit 5962
50
Table 94 Long term debtInterest Rate 125 per annum
Moratorium 2 years
Repayment Period 8 years
Tariff related assumptions and date of operations are tabulated below
Table 95 GBT and RTT Tariff Table 96 Life of the projectTariff Plan
Tariff (INRMonth)
No of
operators GBT RTT
1 28000 18000
2 22000 14000
3 0 12000
Annual
increase 3 3
Commercial Operation Date 1-Aug-09
Quarter Ending 30-Sep-09
FY ending COD 31-Mar-10
Project life years 15
End of commercial
operations31-Aug-24
Quarter ending commercial
operations30-Sep-24
FY ending comme rcial
operations31-Mar-25
882019 Major Project (Ramit)
httpslidepdfcomreaderfullmajor-project-ramit 6062
51
Annexure 2 Profit amp Loss accountsTable 97 Profit amp loss account statement
Income Statement (MNINR)Year ending Mar-10 Mar-11 Mar-12 Mar-13 Mar-14 Mar-15
RevenueGBT 406350 28811 89080 197447 379409 527015Operator Fees (GBT) 1411 10004 30678 67998 130664 179664RTT 1209 8575 27269 60443 116146 164264
Operator Fees (RTT) 440 3121 9739 21587 41481 56466Net Revenue 7124 50511 156766 347476 667700 927410
Expenses
VariableSecurity Sentries 1355 9790 28339 64033 125433 158238Supervisors 097 699 2024 4574 8959 11303Cluster Manager 048 350 10 12 2287 4480 5651AMC Cost of Generator 450 3013 7877 16719 31148 54541Sub-total 1950 13852 39252 87612 170021 229734
Fixed
Selling amp Maintenance(INRMonth) 032 050 053 056 058 061
Administration overhead(INRMonth) 080 128 137 147 157 168
Sub-total 112 179 190 203 216 230
EBITDA 5062 36480 117324 259661 497464 697447
Interest on LT loan - - 7341 31200 77479 156198Interest on ST loan - 021 060 130 245 361
EBDT 5062 36459 109923 228331 419739 540888Depreciation 2439 12769 35917 77162 142925 174006
EBT 2624 23691 74006 151169 276814 366881Income Tax 170 4233 14536 29073 53547 77634
PAT 2454 19458 59470 122096 223267 289247
882019 Major Project (Ramit)
httpslidepdfcomreaderfullmajor-project-ramit 6162
52
Annexure 3 Balance sheet
Table 98 B alance sheetsYearend Balance Sheet (MNINR)Year ending Mar-10 Mar-11 Mar-12 Mar-13 Mar-14 Mar-15
AssetsGross Block 75742 328216 833164 1716823 3105430 3105430Accumulated depreciation 2439 15208 51125 128287 271212 445218Net Block 73303 313009 782040 1588536 2834219 2660212Net Working Capital 064 241 620 1335 2515 3707Cash Balance 12979 72089 216513 488856 947982 1294734Total Assets 86346 385339 999172 2078727 3784715 3958653
LiabilitiesEquity 25168 108980 276604 569947 1030914 1030914Reserves amp Surplus 2454 21912 81381 203477 426745 715992Long term Debt 58725 254286 640722 1304302 2325171 2208967WC Borrowings - 161 465 1001 1886 2780Total Liabilities 86346 385339 999172 2078727 3784715 3958653
882019 Major Project (Ramit)
httpslidepdfcomreaderfullmajor-project-ramit 6262
Annexure 4 Cash flow statement
Table 99 Cash flow statements
Year ending Mar-10 Mar-11 Mar-12 Mar-13 Mar-14 Mar-15
InflowsPAT 2454 19458 59470 122096 223267 289247Depreciation 2439 12769 35917 77162 142925 174006Tax adjusted interest - 014 4959 20991 52076 104895Release of WC - - - - - -Salvage Value - - - - - -Sub-Total 4893 32241 100345 220249 418268 568148
OutflowsCapex 75742 252474 504948 883659 1388607 -Change in WorkingCapital 064 177 379 715 1180 1192
Sub-Total 75806 252651 505327 884374 1389787 1192
UFCF (70913) (220410) (404982) (664125) (971519) 566956LFCF (70913) (220424) (409940) (685116) (1023595) 462062
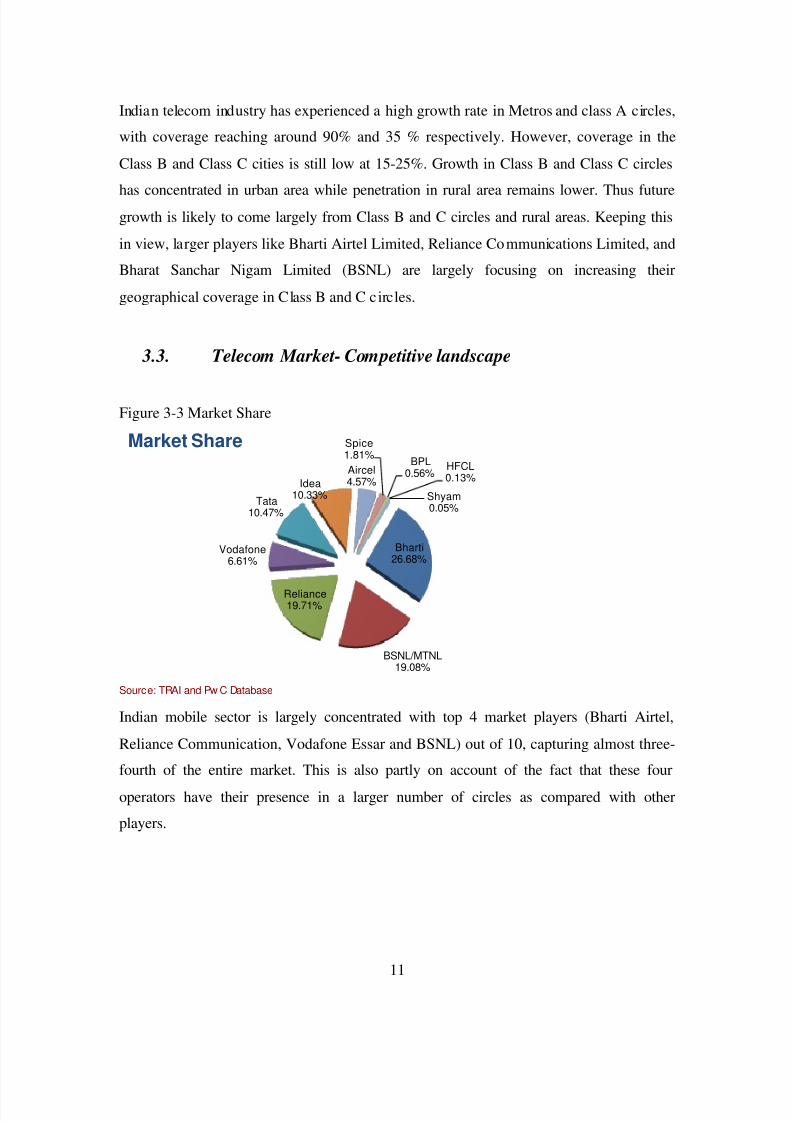
882019 Major Project (Ramit)
httpslidepdfcomreaderfullmajor-project-ramit 2062
11
Indian telecom industry has experienced a high growth rate in Metros and class A circles
with coverage reaching around 90 and 35 respectively However coverage in the
Class B and Class C cities is still low at 15-25 Growth in Class B and Class C circles
has concentrated in urban area while penetration in rural area remains lower Thus futuregrowth is likely to come largely from Class B and C circles and rural areas Keeping this
in view larger players like Bharti Airtel Limited Reliance Communications Limited and
Bharat Sanchar Nigam Limited (BSNL) are largely focusing on increasing their
geographical coverage in Class B and C c ircles
33 Telecom Market- Competitive landscape
Figure 3-3 Market Share
Bharti2668
BSNLMTNL1908
Reliance1971
Vodafone661
Tata1047
Idea1033
Aircel457
Spice181
BPL056
HFCL013
Shyam005
Market Share
Source TRAI and Pw C Database
Indian mobile sector is largely concentrated with top 4 market players (Bharti Airtel
Reliance Communication Vodafone Essar and BSNL) out of 10 capturing almost three-
fourth of the entire market This is also partly on account of the fact that these four
operators have their presence in a larger number of circles as compared with other
players
882019 Major Project (Ramit)
httpslidepdfcomreaderfullmajor-project-ramit 2162
12
Figure 3-4 Lice nsed Circles
0
5
10
15
20
25
Licensed Circles (Dec 07) New Circles (Sep 08)
Source TRAI and CRISIL Database
The competition in Indian telecom sector is expected to intensify in near future because
recently new licenses have been granted to some of the existing operators for new circles
and also to new entrants like Unitech Datacom Swan Telecom and Stel These new
players are expected to capture the rural and semi-urban cities of C ircle B and Circle C as
they are now expected to grow at a much faster rate Shorter network rollout time and
competitiveness in the industry will force these entrants to start the ir operation as early as
possible Tower companies like ABC will allow incumbents to start operations in a
particular region just by installing their electronics on the ready-to-use towers thereby
significantly shortening the ro llout time
Moreover a rapidly increasing subscriber base and spectrum crunch would force the
existing telecom operators to maintain the minimum level of QoS Thus to retain existing
subscribers by preventing subscriber churn operators will require additional
infrastructure in their existing areas of operation to be able to offer better QoS This will
also result in increase in demand for telecom infrastructure in the existing markets
(Ramachanran 2009)
882019 Major Project (Ramit)
httpslidepdfcomreaderfullmajor-project-ramit 2262
13
34 Telecom Infrastructure Overview
Passive infrastructure is one of the most important components of a mobile network It
has been a critical area of operations for telecom companies in the past However with
increasing competition posing an urgent need for telecom companies to expand their
coverage and sharpen their focus on core operations so that they can sustain and improve
their market position passive infrastructure has assumed the status of an independent
industry during the past few years The industry (COAI) estimates that there will be a
requirement of around 350000 towers for 500 million subscribers by 2010 (COAI
2009)
Each site has active and passive infrastructure components Active components includethe antenna trans-receivers switches feeder cables Node B and microwave radio
equipments Passive (or non-electronic) components include the land tower shelter air-
conditioning equipment diesel electric generator battery electrical supply technical
premises and easements pylons etc Passive infrastructure in a mobile network
essentially involves acquiring land setting up towers and electrical and civil works that
needs to be in place before operators can install the active infrastructure which brings
mobile services to the consumers In a typical cell site build-out almost 65 of the total
cost is attributed to passive infrastructure and 35 to active infrastructure
(Ramachanran 2009)In this report passive cell site infrastructure has also been
henceforth referred to as towers or sites
The components of a typical base station are shown below
882019 Major Project (Ramit)
httpslidepdfcomreaderfullmajor-project-ramit 2362
14
Picture 3 1 Telecom Tower
Telecom towers are broadly classified on the basis of their placement as Ground-basedand Roof-top
1 Ground-Based Tower Ground-based towers (GBTs) are taller (typically 200 to 400
feet) and are mostly used in rural and semi-urban areas because of the easy
availability of real-estate space there GBTs involve a capital expenditure in the range
882019 Major Project (Ramit)
httpslidepdfcomreaderfullmajor-project-ramit 2462
15
of Rs 3 to 4 million depending on the height of the tower land prices etc
(Ramachanran 2009)
2 Roof-Top Tower (RTT) Roof-top towers (RTTs) are generally placed on the roofsof high-rise buildings They are shorter (than GBTs) and more common in urban and
highly populated areas where there is paucity of real-estate space Typically these
involve a capital expenditure of Rs 15 to 2 million (Ramachanran 2009)
The height of a telecom tower determines the number of antennas that can be
accommodated which in turn determines the capacity of the towers apart from factors
such as location and geographica l conditions (wind speeds type of terrain etc)
35 Telecom Infrastructure- Domestic market
In India there are broadly two kinds of operators in the tower infrastructure industry
Tower infrastructure subsidiaries
Reliance Infratel Limited
Bharti Infratel Limited
Indus Towers Limited
Wireless TT Info Services Limited (WTTIL)
Independent tower infrastructure companies (ITICs)
GTL Infrastructure
Xcel Telecom
Essar Telecom Infrastructure
Aster Infrastructure
Bharat Telemast
882019 Major Project (Ramit)
httpslidepdfcomreaderfullmajor-project-ramit 2562
16
These companies have their business model based largely on contract or anticipatory
approaches Under the contract approach tower companies set up tower sites going by
the requirements of the telecom operators and the terms of the contract are specified
beforehand in the MSAs signed by the two parties Under the anticipatory approachhowever tower companies set up tower infrastructure at sites with reasonable demand
potential and subsequently invite telecom operators to set up their network on these
towers The latter model involves higher business risks as the tower company may not be
able to achieve reasonable tenancy for its tower infrastructure and at profitable terms
BPTL proposes to follow contract approach for its business model
36 Telecom Infrastructure market- Competitive landscape
Figure 3-5 Telecom Infrastructure Market Players
038058154
365692
10381692
26923269
0 20000 40000 60000 80000 100000
Aster InfrastructureAmerican Towers
Essar Telec om Infrastructure
GTL In frastructureWi reles s TT In fo Services Limited
Bharti Infratel Limited
Reli anc e Communications Limitedrsquos
OthersInd us To wers Limited
Number of Towers
Market Players
Source Telecom Regulatory Authority of India and ICRANote Others include tower por tfolios of BSNL MTNL Sistema Shyam Teleservices Aircel etc
In Indian Telecom Infrastructure market competition has intensified significantly with
several players spinning of their tower portfolio and independent operators expanding
their operations
882019 Major Project (Ramit)
httpslidepdfcomreaderfullmajor-project-ramit 2662
17
Bharti Airtel Limited Reliance Communications Limited and Tata Teleservices Limited
have hived off their tower assets into separate tower infrastructure subsidiaries namely
Bharti Infratel Limited Reliance Infratel Limited and Wireless TT Infoservices Limited
respectively Also Bharti Infratel Limited together with Vodafone Essar Limited and IdeaCellular Limited in a joint- venture agreement has created Indiarsquos largest tower
infrastructure company ndash Indus Towers Limited which has an estimated portfolio of
around 88000 towers (Anjan V amp N 2009) Whereas in past few years number of
independent tower infrastructure companies have ventured into the domestic telecom
tower industry These include GTL Infrastructure Limited Essar Telecom Infrastructure
Limited Xcel Telecom Private Limited (American Towers) Tower Vision India Private
Limited Aster Infrastructure Private Limited TVS Interconnect Systems Limited etc
Figure 3-6 Telecom Tower Growth Scenario
0
100
200
300
400
500
600
700
2008 2009 2010 2011 2012 T e
l e c o m
T o w e r s
( T h o u s a n
d s )
Source Telecom Regulatory Authority of IndiaAssumptions Subscriber growth rate of 28 till 2011-12
1400 subscribe per site
As shown above it is expected that in next 4-5 years there will be a requirement of
additional 85000 towers (both GBT and RTT) each year to meet the subscriber base of
800 million by 2011-12 (PwC 2009) This shows that huge investment have to be made
in Indian telecom Infrastructure sector in near future Now since both passive and active
882019 Major Project (Ramit)
httpslidepdfcomreaderfullmajor-project-ramit 2762
18
infrastructure sharing is a llowed (except spectrum) Independent service providers will be
benefited Increase in subscriber base introduction of new technologies like 3G Wi-max
etc and increase in market healthy market competition in telecom services sector will
drive the growth in telecom infrastructure sector
882019 Major Project (Ramit)
httpslidepdfcomreaderfullmajor-project-ramit 2862
19
4 BUSINESS PLAN
41 Passive Infrastructure
Mobile networks have base stations (or cell sites) which have active and passive
infrastructure components Active components include the antenna trans-receivers
switches feeder cables Node B and microwave radio equipments Passive (or non-
electronic) components include the land tower shelter air-conditioning equipment
diesel electric generator battery electrical supply technical premises and easements
pylons etc Passive infrastructure in a mobile network essentially involves acquiring land
setting up towers and electrical and civil works that needs to be in place before operators
can install the active infrastructure which brings mobile services to the consumers In atypical cell site build-out almost 65 of the total cost is attributed to passive
infrastructure and 35 to active infrastructure
42 Infrastructure Sharing
Mobile operators are required to setup more and more BTS (cell) sites due to the
exponential growth of mobile subscribers in India (currently growing at almost 15 4
million subscribers a month) and limited availability of spectrum B and C Circles (wheretraffic density may not be as high as metros and Circle A) are expected to drive future
subscriber growth and requirements for cell sites will be higher to ensure greater
coverage
However creating new infrastructure by each operator separately leads to d uplicat ing
huge capital investments It also contributes to mushroom growth of telecom towers and
deteriorating skylines in urban areas which has already led to some local municipal and
state governments to regulate and restrict the erection of new mobile towers
The continued pressure on cellular tariffs higher infrastructure costs for network
deployment particularly in semi-urban and rural areas and compelling need to reduce
4 As published in ET 8 th May 09 Edition
882019 Major Project (Ramit)
httpslidepdfcomreaderfullmajor-project-ramit 2962
20
time to market for network roll outs have led operators to share and even outsource their
infrastructure requirements from third party infrastructure providers like BPTL GTL and
Indus towers It promotes capital efficiency as it allows more than one service provider to
leverage and ride o n common infrastructure In its simplest form it involves two or moreoperators jointly using the common passive infrastructure in a cell site While viewed
largely as a measure to reduce capital and operating expense such sharing also leads to
improvement of service q uality (by ensuring site space for service providers and reducing
black spots) and the environment (by reducing number of cell sites and towers)
In outsourcing operators take passive infrastructure and tower space from third party
infrastructure companies on a monthly rental basis to host their radio and transmission
equipments Outsourcing provides significant benefits to operators It enables them tosave on capital expenses (it actually converts capital expense into operating expense in
the form of lease rentals) and focus on their core activities of sales marketing and
branding while leaving the cumbersome task of managing the site development process
and site operation and maintenance to third parties who exclusively deal with such
activities
The concept of passive infrastructure sharing is increasingly gaining market acceptancein India So far it has been largely limited to bilateral sharing between operators in the
form of barter where the operators split the site related CAPEX and OPEX costs The
available information suggests that about 25 of the existing 90000 tower sites in India
are currently being shared for passive infrastructure predominantly in rural areas and
small towns
43 Introduction to the business
BPTL is an Infrastructure Provider company that builds owns operates and maintains
passive network infrastructure on a shared basis for mobile telecom operators and ITES
providers Its objective is to provide network design and planning network deployment
882019 Major Project (Ramit)
httpslidepdfcomreaderfullmajor-project-ramit 3062
21
network operations amp maintenance infrastructure management application management
and professional services to teleco m operators and enterprises
The company is planning to raise capital in the form of equity and debt to start its
operation by Aug 09 ABC rsquos vision is to provide world class managed infrastructure ampallied services to the service providers to optimize their service delivery capability In the
initial years of operation the company will focus on telecom sector with almost 100 of
its proposed capital expenditure till FY 14 earmarked for developing and owning passive
infrastructure for sharing among mobile service providers
44 Business Proposal
ABC will provide passive telecom infrastructure on build own operate (BOO) basis inboth ground based (GBS) as well as roof-top sites (RTS) It will undertake full range of
responsibilities in building owning and maintaining the sites and will serve as a single
window one-stop-shop provider of infrastructure services Typical responsibilities are
summarized below
Site planning keeping in view the network rollout plans of prospective customers
Site acquisition including entering into long-term agreements with land owners
Obtaining of necessary regulatory approvals
Erect ion and commissioning of tower and allied equipment
Provision of support services such as back-up power air-conditioning and
security
Provision of turnkey solutions to telecom companies such as sourcing of
equipment testing and maintenance
882019 Major Project (Ramit)
httpslidepdfcomreaderfullmajor-project-ramit 3162
22
Bharat Telemast Private Limited will identify the sites required for setting up the Passive
infrastructure by first of all getting a commitment from one operator who is called as
ldquoAnchor Operatorrdquo Then Bharat Telemast will go ahead to lease (or) buy out the site as
appropriate and commences construction of the cellular sites But the Cellular site will betypically designed for three to four operators While construction is in progress the
marketing team will work towards getting the second and third operator But care will be
taken in such a way that at least two operators are available at the time of completion of
construction
45 Sources of revenue
1 Infrastructure Provisioning Fees ndash fee paid by the operators on a monthly basisWith annual escalation
2 Site lease rental ndash Paid at actual on a monthly basis
3 Operations and maintenance charges Paid on a monthly basis
4 The contract also provides a fixed annual escalator
46 Attractiveness of business model
Stable and predictable cash flow business Once a tower asset is rented out it
usually generates a stable and predictable cash flow in the form of tower rentals
from occupants over the term of the MSA between the two parties
Low working capital requirement ABC rsquos business model is also characterized
by low working capital requirements as most of the operating expenses (such aselectricity and fuel and other variable operating expenses) are reimbursable by the
tenants on actual basis Moreover BPTL is may also be able to get rentals for the
towers in advance and also obtain better credit terms from their suppliers thus
further improving their working capital cycle
882019 Major Project (Ramit)
httpslidepdfcomreaderfullmajor-project-ramit 3262
23
High incremental profitability The operating costs associated with this
business are largely fixed in nature Thus each increment in tenancy is
accompanied by a minimal increase in costs This leads to a more thanproportionate increase in profits for every increase in occupancy
Reduction in capital investments due to present market conditions Due to
present market situation average capital requirement for RTT and GBT sites have
dropped from 2 million and 4 million to 15 million and 33 million ABC wishes
to grab this opportunity which will result in competitive advantage in near future
Extensive usage While on an average a GSM BTS can handle around 100-
1100 subscribers but in the case of high usage areas the figure can be as low as
600-700 subscribers which means a larger number of cell sites would be required
for the same area Moreover the country has the problem of spectrum scarcity
which increases the requirement of towers to maintain a reasonable leve l of
service quality
New entrants Many operators including Vodafone Essar Limited Idea Cellular
Limited Aircel Cellular Limited and Sistema Shyam Teleservices Limited have
received licenses as well spectrum in new circles which would enable them to
become pan-India operators in the next one-two years Also new licenses have
been issued to new players such as Unitech Swan Telecom and S Tel Limited
Given the significant expansion plans of new entrants over the medium term and
the need for them to optimize investments in order to maintain returns demand
for towers is expected to report a sharp increase
Shorter rollout time Indian telecom industry is highly competitive and doing
business for new entrant may not be easy Shorter network-rollout time would be
a critical success factor for the new entrants and a longer rollout time could meanloss of substantial market share to other operators Tower companies allow
players to start operations in a particular region just by installing their electronics
on the ready-to-use towers thereby significantly shortening the rollout time
New technologies 3G services are already launched in the country and to
augment their services various operators plan to launch Wi-Max services as soon
882019 Major Project (Ramit)
httpslidepdfcomreaderfullmajor-project-ramit 3362
24
as they receive additional spectrum from Government This would further
increase the demand for sharing of passive infrastructure
47
Expansion Schedule
BPTL would rollout both RTT and GBT sites of which the RTT sites GBT sites
normally would have a tower height of 50 meters or 60 meters depending on the need for
additional height for installation of microwave antennae based on the location of the site
and number of tenants on the cell site Details of BPTLrsquos expansion plan are summarized
below
Table 41 Expansion PlanExpansion Schedule 2009-10 2010-11 2011-12 2012-13 20013-14
GBT
Addition 210 700 1400 2450 3850
Total 210 910 2310 4760 8610
RTT
Addition 90 300 600 1050 1650
Total 90 390 990 2040 3690
48 Proposed Services
As indicated earlier ABC proposes to provide passive telecom infrastructure on a
sharing co-location basis to cellular operators The sites would either be Ground Based
Sites (GBS) or Roof Top Sites (RTS) As the sites are meant for co-location of the active
components of two to three operators they would be built to either 2-Tenant or 3-Tenant
specifications
The different components of the passive infrastructure facility and the related services
that would be offered by BPTL to the operators are as under
Infrastructure provisioning comprising
882019 Major Project (Ramit)
httpslidepdfcomreaderfullmajor-project-ramit 3462
25
Communication tower built to host multiple antennae
Weather-proof communication shelter with air-conditioning and power backup
arrangement
Diesel generating set and battery bank for power backup
A mobile standby generator to act as backup in case o f breakdown
Warehousing facility
Infrastructure operations and maintenance including
Regular operations and maintenance of the facility
Security of all the equipments at the site at all timesA dedicated team of technicians for a group of 40-50 sites to ensure effect ive and
efficient functioning of the components at all times
49 Proposed Organizational Structure
A senior management team will work under the leadership of the ldquoChief Operations
Officerrdquo who will be responsible for smooth implementation of proj ect activities He willalso assist the managing director in marketing This team will coordinate with Stallion
Telecom Pvt Ltd which will take over the role of procuring Capital Equipments
Senior management will consists of project manager infrastructure manager commercial
manager and head (legal and company affairs Apart from this there will be a requirement
Chief OperatingOfficer
Project Manager Infrastructure
Manager
Commercial
Manager (projects)
Head (Legal and
Company Affairs)
882019 Major Project (Ramit)
httpslidepdfcomreaderfullmajor-project-ramit 3562
26
of security sentries (3 per GBT site) supervisors (one for every 10 sites) and cluster
manager (one for every 50 sites)
Bharat Telemast will carry out the complete Project execution with the assistance of third party ldquoQuality control organizationrdquo and a third party ldquoProject management teamrdquo
Quality control and project management activities will be o utsourced to a third party
882019 Major Project (Ramit)
httpslidepdfcomreaderfullmajor-project-ramit 3662
27
5 METHODOLOGY
The changing face of infrastructure services creates a complex situation which demands
greater understanding of roles of competition regulatory structures and modes of
financing Knowledge of such things is a key decisive factor in building confidence
among investors promoters and government In project finance the project its assets
contract and cash flows are separated from promoter in order to permit credit appraisal
or loan to the project
As part of the financial feasibility analysis a series of related financial statements based
on projected sources and uses of funds during the development and operating phaseproject were created Financial statements consist of expenses associated with
development activities including capital costs like acquisition of land for GBT sites cost
of tower generator shelter batteries etc Most of the data regarding capital costs are
obtained from the promoter of ABC Limited All these capital costs related details are
provided in annexure 1
Assumption regarding depreciation capital structure operating expenses expansion
schedule tenancy ratios tariff or rent operatorrsquos fees and loan amortization schedule are
obtained from professional accountants Promoter and bankers of ABC Limited
Due to unknown factors that could influence the cost of towers or fees associated with
completing the project (soft costs) contingency costs were estimated at 5 of hard and
soft costs respectively If contingency is set too low developers could easily encounter
funding shortfalls upon slight changes in market forces All other costs were estimated
based on talking with industry professionals (Promoters)
A detailed financial model was prepared based on existing accounting standards and
following financial ratios were estimated
882019 Major Project (Ramit)
httpslidepdfcomreaderfullmajor-project-ramit 3762
28
EBITDA margin Profit and loss accounts for the estimated project period (15
Years) were prepared based on which estimated earnings before interests tax
depreciat ion and amortization were calculated for each year Detailed PampL
balance sheet and cash flow statements are provided in annexure 2 3 and 4
EBITDA = Total Revenue ndash (Variable expenses + Fixed Expenses)
EBITDA margin = EBITDA Total Revenue
PAT margin PAT is calculated by subtracting interests pa id on capital debt and
working capital debt depreciation and applicable corporate income tax from
EBITDA
PAT = EBITDA ndash Interest Payable ndash Depreciation ndash Income tax
PAT margin = PATTotal Revenue
Working Capital Working capital requirement is calculated by subtract ing
current liabilities from current assets Current assets are estimated based on 30
days cash requirement and current liabilities are estimated as half of salary
monthly expenses
WC = Current Assets ndash Current Liabilities
UFCF It is defined as the free cash flows available to the firm if the firm has
zero debt liability Purpose of ca lculat ing UFCF for project period is to determinethe project IRR
UFCF = PAT + Depreciation + Interest (tax adjusted) + Release of WC + Salvage
value of the assets ndash CAPEX ndash Change in WC
882019 Major Project (Ramit)
httpslidepdfcomreaderfullmajor-project-ramit 3862
29
LCFF It is defined as the cash floes available to the firm after paying interests on
long term and short term debts
LCFF = UFCF ndash Interest (tax adjusted)
FCFE It is defined as the free cash flow available to equity holders It is
determined to ca lculate equity IRR for equity investors It also includes the tax
benefits which are available as per the Income Tax Act
FCFE PAT + Depreciation + Salvage Value ndash Equity Investment ndash Long term debt
repayment
PIRR Project IRR is defined as the discount rate at which NPV (Net Present
Value) of UFCF is zero It is calculated by using following formula
UFCF 1 (1+PIRR) 0+ UFCF 2 (1+PIRR) 1+ UFCF 3 (1+PIRR) 2+ helliphelliphelliphelliphelliphellip = 0
UFCF 1 = UFCF at the end of first year of operation
UFCF 2 = UFCF at the end of second year of operation
PIRR = Project IRR
EIRR Equity IRR is defined as the discount rate at which NPV of FCFE is zero
It is calculated by using following formula
FCFE1 (1+EIRR) 0+ FCFE 2 (1+EIRR) 1+ FCFE 3 (1+EIRR) 2+ helliphelliphelliphelliphelliphellip = 0
FCFE1 = FCFE at the end of first year of operation
FCFE2 = FCFE at the end of seco nd year of operation
EIRR = Equity IRR
882019 Major Project (Ramit)
httpslidepdfcomreaderfullmajor-project-ramit 3962
30
WACC It is de fined as the percentage of return expected by the investors who
otherwise would have earned some return by investing in some other project
WACC = Cost of Debt (Debt Capital) + Cost of equity (Equity Capital)
882019 Major Project (Ramit)
httpslidepdfcomreaderfullmajor-project-ramit 4062
882019 Major Project (Ramit)
httpslidepdfcomreaderfullmajor-project-ramit 4162
32
62 Funding planAs the telecom sites are rolled out over a 5 year period till FY 2014 investment will be
required for each year ABC Limited will start generating profits from FY 10 only Such
internally generated cash accruals will be ploughed back into the business to meet part of
the project cost Investment required for each year is tabulated below
Table 61 Funding ProposalMillion INR FY 10 FY 11 FY 12 FY 13 FY 14
GBT Tower (Additional) Nos 210 700 1400 2450 3850
RTT Tower (Additional) Nos 90 300 600 1050 1650DE ratio 233 233 233 233 233
Additional CAPEX 83892 279374 558748 977809 1536557
Debt 58725 195562 391124 684466 1075590
Equity 25168 83812 167624 293343 460967
63 Results
Based on assumptions given in Annexure 1 a detailed financial model was preparedResults of the financial model such as PampL account Balance Sheet and cash flow
statements are provided in Annexure 2 3 and 4 Forecasts for the key financial figures for
first five years are provided in the Table below
Forecasts
Table 62 Income StatementMillion INR FY-10 FY11 FY12 FY-13 FY-14
Sales 7124 50511 156766 347476 667700
Cost of sales 1950 13852 39252 87612 170021
Gross 5174 36659 117514 259864 497679
7263 7258 7496 7479 7454
Admin costs 112 179 190 203 216
882019 Major Project (Ramit)
httpslidepdfcomreaderfullmajor-project-ramit 4262
33
Finance cost 0 021 7401 31330 77725
Taxation 170 4233 14536 29073 53547
PAT 2454 19458 59470 122096 223267
As shown in Table above during the expansion period revenue will grow exponentially
In the first year of operation ABC will earn a revenue of INR 7124 million from 300
(210 GBT and 90 RTT) sites with a tenancy ratio of 15 for GBS and 17 for RTS In the
first 2 years of operation the company will not pay any interest on long term debt due to
2 years moratorium period Major cost associated with the project is depreciation due to
which PAT is lower than the operating profits But cash flows to the firm are enough to
result in reasonable returns
Table 63 Balance Shee tYear ending Mar-10 Mar-11 Mar-12 Mar-13 Mar-14
AssetsGross Block 75742 328216 833164 1716823 3105430Accumulated depreciation 2439 15208 51125 128287 271212Net Block 73303 313009 782040 1588536 2834219Net Working Capital 064 241 620 1335 2515Cash Balance 12979 72089 216513 488856 947982
Total Assets 86346 385339 999172 2078727 3784715LiabilitiesEquity 25168 108980 276604 569947 1030914Reserves amp Surplus 2454 21912 81381 203477 426745Long term Debt 58725 254286 640722 1304302 2325171WC Borrowings - 161 465 1001 1886Total Liabilities 86346 385339 999172 2078727 3784715
Note All figures are in Million INR
Table 64 Key financial ratiosMar-11 Mar-12 Mar-13 Mar-14 Mar-15
Revenue Growth 60902 21036 12165 9216 3890EBITDA Growth 62061 22161 12132 9158 4020
PAT Growth 69293 20564 10531 8286 2955
As shown in table above increase in EBITDA is higher than that of revenue This is due
to better operational efficiency of ABCrsquos management and economies of scale S imilarly
882019 Major Project (Ramit)
httpslidepdfcomreaderfullmajor-project-ramit 4362
34
increase in PAT is lesser than that of EBITDA because of high depreciation and interest
expenses
Table 65 Pr ofitability r atios
Mar-11 Mar-12 Mar-13 Mar-14 Mar-15
EBITDA Margin 7222 7484 7473 7450 7520
PAT Margin 3852 3794 3514 3344 3119Return on Net Worth 622 760 769 788 1087
Key profitability ratios are shown in table above Return on net worth in the initial years
is lower because of the ambitious expansion plans of ABC Limited Thereafter return on
net worth increases with increase in PAT
Returns on Investment
Table 66 Financial returnsFinancial Indicators
Project IRR 1813Equity IRR 3609
64 Sensitivity Analysis
A sensitivity analysis has been carried out on the project financials to determine theimpact of key variables on the financial indicators namely
Project IRR
The key variables on which sensitivity analysis have been carried out areCapital expenditure for GBS and RTS1st and 2 nd tenant tariff for GBS1st and 2 nd tenant tariff for RTSTenancy Ratio
Similarly sensitivity analysis has been carried out forEquity IRR
The key variables on which sensitivity analysis have been carried out for EIRR are
Capital structure and interest rate for capital debtRepayment period and moratorium period
882019 Major Project (Ramit)
httpslidepdfcomreaderfullmajor-project-ramit 4462
35
The impact on the financial indicators is shown below
Figure 6-1 Project IRR vs GBT and RTT CAPEX
As shown in Figure 6-1 project IRR is more sensitive to change in CAPEX of RTT sitesas compared to change in CAPEX of GBT sites because tenancy ratio and tariff for RTTsites are higher than those of GBT sites
882019 Major Project (Ramit)
httpslidepdfcomreaderfullmajor-project-ramit 4562
36
Figure 6-2 Project IRR vs GBT Tariff for 1 st tenant (X-axis) and 2 nd tenant (right-hand side)
As shown in Figure 6-2 project IRR varies linearly with GBT tariff In the best casescenario when GBT tariff for 1 st tenant is INR 34000month and GBT tariff for secondtenant is INR 26000month Project IRR is 2101
Figure 6-3 Project IRR vs RTT Tariff for 1 st tenant (X-axis) and 2 nd tenant (right-hand side)
As shown in Figure 6-2 project IRR varies linearly with RTT tariff In the best casescenario when RTT tariff for 1 st tenant is INR 24000month and RTT tariff for second
882019 Major Project (Ramit)
httpslidepdfcomreaderfullmajor-project-ramit 4662
37
tenant is INR 20000month Project IRR is 1932 Project IRR is more sensitivetowards RTT tariff than GBT tariff because in practical business situation RTT siteshave a tenancy ratio of more than two due to which effect of tariff for 1 st tenant almostget nullified after few years
Figure 6-4 Project IRR vs Tenancy ratio for RTT sites (X-axis) and GBT sites
As shown in Figure 6-4 project IRR is very sensitive to tenancy ratio In the best casescenario where GBT sites have a tenancy ratio of 2 and RTT sites have a tenancy ratio of 3 project IRR can be as high as 20
Figure 6-5 Equity IRR vs long term debt interest rate for different leverage level
882019 Major Project (Ramit)
httpslidepdfcomreaderfullmajor-project-ramit 4762
38
As shown in figure 6-5 equity IRR is more sensitive to interest rate on long term debt forhigh level of leverage (lower debt equity ratio) because as the debt equity ratio increasesinterest paid on long term debt also increases significantly
Figure 6-6 Equity IRR vs long term debt repayment period at different level of moratoriumperiods
As shown in figure 6-6 Equity IRR increases with increase in moratorium period anddebt repayment period The variation is from 1654 to 60 for worst case and best casescenarios
882019 Major Project (Ramit)
httpslidepdfcomreaderfullmajor-project-ramit 4862
39
7 RISK ASSESSMENTRisk Mitigation strategyExecution Risk
(Project management landacquisition etc)
Management of ABC has proven expertise in
telecom infrastructure rollout and has executedvarious projects with large telecom operators andMNC vendorsABCrsquos top management team consists of a groupof professionals drawn from leading telecomInfrastructure Company who have immenseexpertise and experience in rolling out telecominfrastructure projects
Market Risk (No entry barriers operators may
share infrastructure betweenthemselves large players withhigh capital may increasecompetition)
India has a huge potential for telecominfrastructure market With increasing
competition falling tariffs and pressure onmargins telecom service providers are beingforced to increase their focus on marketing andreduce their expensesExperienced management healthy capital back-up effective presence in the telecominfrastructure market and value added services atrelatively lesser cost will help ABC to meet theset targets
Financing Risk
(Availability of equity capitalavailability of long term debtinterest rate and moratoriumperiod)
ABC is seeking private equity partner to secure
equity capital Company has already entered intoNDA with 2 major investorsLong term debt at an interest rate of 125 canbe easily arranged because of the credibility of the promoters in the marketMany other similar firms like Indus and GTLhave already secured long term debt for amoratorium period of 2 years Promoters of ABCLimited are confident to secure a long term debtwith a moratorium period of 2 years and apayback period of 8 years
ABC Limited would minimize the workingcapital requirements of its business by securingrentals and operating revenues in advance fromits clients and or by suitably structuring itspayment liabilities to match its cash inflows
Commercial Risk (Tenancy ratio and tariff forGBS and RTS)
ABC would aim to enter into long term contractswith the ldquoanchor tenantrdquo operator and thenrollout the infrastructure so that at least single
882019 Major Project (Ramit)
httpslidepdfcomreaderfullmajor-project-ramit 4962
40
occupancy of each site is ensured at all t imesPromoters will use its knowledge of the businessand its expertise to identify and roll out sites inlocations which have strong multi- tenancypotential to minimize occupancy risk
Revenue Risk (Operating fees may decreasecredit worthiness of the clientsdelay in payment of rentals)
As per the industry sources till now not even asingle operator have dishonored the long termlease contractThe credit risk is diversified as there will bemultiple operatorsABC would aggressively market to get 3G andWiFi broadcasters to use the sites and earnadditional revenues in addition to the assumedrevenue streams
Natural Calamities Risk The Company shall maintain insurance for thesites against these risks and the cost of insurancewill be priced in and passed on to the tenants
882019 Major Project (Ramit)
httpslidepdfcomreaderfullmajor-project-ramit 5062
41
8 CONCLUSION
India is the fastest growing wireless telecom market in the world The continuing
growth in the number of wireless subscribers and MoUs and increasing trend of
outsourcing of business processes to India has led to growing demand for large
investments in the telecom infrastructure in the country
However with increasing competition falling tariffs and pressure on margins
telecom service providers are being forced to increase their focus on marketing
customer acquisitions and branding and minimize their efforts and overheads in
project management and asset acquisition
Further with rising prices of steel cement and real estate the cost of developing
and owning passive infrastructure is increasingly becoming a costly proposition
for most operators and service providers
The compulsion on the part of service providers to reduce their operating costs
and capital expenditure requirements has led to opportunities in passiveinfrastructure outsourcing to independent third party infrastructure providers and
also sharing the infrastructure with other service providers It is expected that
cellular operators will outsource their communications site infrastructure needs as
a means of accelerating access to their markets and preserving capital rather than
constructing and operating their own communications sites and maintaining their
own communications sites service and deve lopment capabilities
Passive infrastructure is highly capital intensive and an integral part of the cellular
service providersrsquo networks Yet being a simple and low technology asset it is
amenable to outsourcing and sharing By transferring the responsibility of
ownership development and maintenance of passive infrastructure service
882019 Major Project (Ramit)
httpslidepdfcomreaderfullmajor-project-ramit 5162
42
providers have an opportunity to transfer a substantial part of their business risk to
third parties
Most telecom operators are facing capacity constraints on their networksCoverage obligations increasing pressure to improve network quality and
competition has led to aggressive roll out plans by existing cellular operators
Installation of cell sites has become a cumbersome process as there are a number
of clearances required and involves labor-intensive micro management
Availability of ready infrastructure from third party providers would enable the
operators to reduce their time to market and accelerate their access to their
customers Cellular service providers generally want to move quickly when
adding more sites and co-location on an existing site is always faster than
building
Ownership and maintenance of telecom towers and other infrastructure by third
parties is an established practice in developed nations like USA and is
increasingly gaining market acceptance in India
The Indian government is seriously considering promoting the infrastructure
sharing route between the telecom operator and private players to achieve future
national tele-density targets and improve rural telecom penetration
ABC being an independent entity with no business conflicts with other service
providers in the telecom space will be best positioned and have an early mover
advantage to capitalize on this emerging opportunity
Further the task of operating and maintaining the passive infrastructure in the cell
is increasingly becoming a cumbersome exercise for the service providers to
handle ABCrsquos composite offering to build passive infrastructure for the cellular
operators and also operate and maintain them will provide a turnkey solution to
address the infrastructure needs of the service providers
882019 Major Project (Ramit)
httpslidepdfcomreaderfullmajor-project-ramit 5262
43
The business model proposed to be followed by ABC is fairly simple with stable
and predictable cash flows as is the case with the business model of the tower
renting companies in USA Most contracts are long term for a period 10 or moreyears with annual price escalators generally ranging from 3 to 4 However
wireless carriers normally tend to renew rentals because suitable alternative sites
may not exist or be available and repositioning a site in a carrierrsquos network is
expensive and may adverse ly affect network quality
Site ownership and operations is a ldquoscalerdquo business operating administration
marketing expenses etc do not rise as quickly as revenues when portfolios are
expanded Incremental operating costs associated with adding wireless tenants to
a communications site are minimal Therefore as additional tenants are added to a
site the substantial majority of incremental revenue contributes to margin
expansion Most tower companies have high EBITDA margins as may be seen
from the financial indicators of some of the tower rental companies in USA
It is expected that site location and capacity price and quality of service and
successful execution of contracts will be the most significant competitive factors
in this business
ABCrsquos revenue and returns on investment will be primarily driven by its ability
to
o Increase the utilization of the space and infrastructure capacity owned by it by
increasing the number of tenants per site and renting out to maximum number
of users As discussed above return on capital employed (PIRR and EIRR) arevery sensitive to tenancy ratio In worst case scenario project IRR can be as
low as 8 and in the best case scenario it can be as high as 20
o Develop acquire sites of strategic importance and high growth potential that
will enable them to secure better commercial terms from users and attract
more number of tenants Infrastructure provisioning fees rentals for sites are
882019 Major Project (Ramit)
httpslidepdfcomreaderfullmajor-project-ramit 5362
44
extremely location sensitive There is a potential to acquire more land than
that of required to capitalize on the increase in real estate prices
o Develop sites in a cost effective manner ABC would consider purchasing
land only for those GBS sites which have sufficient demand and arestrategically located Else for most of its sites land will be leasehold As
shown above returns (PIRR and EIRR) are very sensitive to capital costs In
the worst case scenario project IRR can be as low as 15 whereas it can as
high as 27 in the best case scenario
o Negotiate and secure long term contracts with good credit quality users with
built in price escalation provisions to mitigate financing risk
o Leverage and secure long term financing at attractive terms and involve in
active treasury management to keep low financing cost Results of the
sensitivity analysis indicate that equity IRR can be as high as 60 foe a
moratorium period of 4 years and interest rate of 10
o Minimize working capital requirements
o Maintain low operating and administration expense
o Secure better OampM margins from operators and retain a healthy share of it in
ABC
o Maintain high service standards and build strong customer relationships
The business would have the potential to capture new revenue opportunities
around the existing assets As demand for towers is expected to grow and as
operators migrate to speedier next-generation wireless technologies they will
need the towers and associated passive infrastructure to transmit their new
services in addition to their existing offerings In addition to increasing capacity
and coverage and improving the quality of their networks cellular serviceproviders are deploying high speed data networks driving incremental demand of
sites The business therefore has potential upsides in the form of adding
customers (tenants) in wireless broadband third generation (ldquo3Grdquo) and wireless
data capabilities and also other incremental value propositions by way of hosting
882019 Major Project (Ramit)
httpslidepdfcomreaderfullmajor-project-ramit 5462
45
Billboards Hoardings etc in some of the high visible sites owned and maintained
by it
Based on the assumptions and subject to satisfactory resolution of the key risks
factors project cash flows will be able to meet debt service obligations
This business model is a lucrative investment option for a private equity player
because valuation of each site will increase in the coming years due to
improvement in market conditions increase in the value of land and increase in
the demand for passive infrastructure in rural and semi-urban areas
882019 Major Project (Ramit)
httpslidepdfcomreaderfullmajor-project-ramit 5562
46
REFERENCESAnjan G V A amp N M (2009) telecom infrastructure industry in india GurgaonICRA
Bessler W Norsworthy J amp Shusterman T (2001 12 1) Mergers in the UStelecommunications industry and market valuationeffects IEEE p 288
COAI (2009 march 14) Subscriber Figures Retrieved march 14 2009 fromCOAIcom httpwwwcoaicomstatisticsphp
IDA (2009 march 23) Highlights Retrieved march 23 2009 from idagovsghttpwwwidagovsghomeindexaspx
K R (2008) Time for new business model Delhi Cybermedia
MAXIS (2009 march 8) the malaysian telecommunications industry Retrieved march9 2009 from maxiscommyhttpwwwmaxiscommypersonalabout_usinvestorprospectusprospectus4pdf
P J amp Lisa A (2009) Stimulas spending and American Telecom Industry USACoracle group
PwC (2009 march 12) Indian Telecom Industry Gurgaon Harayana IndiaRamachanran (2009 march 1) Investment in Telecom Infrastructure sector (M RInterviewer)
Vogelsang I (2002) The German Telecommunications Reform Verein fuumlr Socialpolitik (p 26) Innsbruck Boston Press
882019 Major Project (Ramit)
httpslidepdfcomreaderfullmajor-project-ramit 5662
47
ANNEXURES
ANNEXURE 1 Key Assumptions
The occupancy of each site by single two three operators for green-field sites is assumed
to be as follows
Table 91 Expected Tenancy RatiosFY 10 FY 11 FY 12 FY 13 FY 14 FY15
GBT Tenant
Ratio 150 150 170 170 170 200
Single Operator 50 50 30 30 30 0
Two Operator 50 50 70 70 70 100
RTT Tenant
Ratio 170 170 200 200 200 250
Single Operator 30 30 0 0 0 0
Two Operator 70 70 100 100 100 50
Three Operator 0 0 0 0 0 50
From FY 15 onwards tenancy ratio of 2 and 25 for GBT and RTT sites is cons idered
882019 Major Project (Ramit)
httpslidepdfcomreaderfullmajor-project-ramit 5762
48
Capital costs related assumptions are tabulated below
Table 92 GBT and RTT Capital Cost
The lease rentals for RTT sites are reimbursed from the operators and therefore have not
been factored in the revenues as well as the expense For GBT sites land purchase cost of
035 millions assumed which has been escalated by 6 annually to determine the
salvage value of assets
GBT Capital Costs
Million
INR
Delivery cost of Ground Based
Tower (GBT)063
Delivery cost of Generator 030
Civil Work 040Shelter 012
Electrical Works 030
Other Equipments (UPS Battery
etc)045
Construction cost 045
Land 035
Contingency amp Financial Charges 035Total cost 335
RTT Capital Costs
Million
INR
Delivery cost of Roof Top
Tower (RTT) 030
Delivery cost of Generator 020
Civil Work 020Shelter 012
Electrical Works 030
Other Equipments (UPS
Battery etc) 030
Construction cost -
Land -
Contingency amp FinancialCharges 008
Total cost 150
882019 Major Project (Ramit)
httpslidepdfcomreaderfullmajor-project-ramit 5862
49
Ope rating costs related assumptions are tabulated below
Table 93 Operating CostsOperating Costs
Security Sentries (INRMonth) 4000
Supervisors (INRMonth) 6000
Cluster Manager One for Fifty Towers (INRMonth) 15000
Annual increase 500
Number of Security Sentries per tower 300
Number of supervisors per tower 010
Number of C luster manager per tower 002
Fixed Expenses
Selling amp Maintenance (INRMonth) 4000000
Annual Escalation 5
Administration overhead (INRMonth) 10000000Annual Escalation 7
AMC Cost of Generator 15 (cost of generator)
Annual Escalation (AMC) 3
For RTT sites security sentries are not required because it will be the responsibility of
the site owner A supervisor will for every 10 sites and a cluster manager for every 50
sites will be required
882019 Major Project (Ramit)
httpslidepdfcomreaderfullmajor-project-ramit 5962
50
Table 94 Long term debtInterest Rate 125 per annum
Moratorium 2 years
Repayment Period 8 years
Tariff related assumptions and date of operations are tabulated below
Table 95 GBT and RTT Tariff Table 96 Life of the projectTariff Plan
Tariff (INRMonth)
No of
operators GBT RTT
1 28000 18000
2 22000 14000
3 0 12000
Annual
increase 3 3
Commercial Operation Date 1-Aug-09
Quarter Ending 30-Sep-09
FY ending COD 31-Mar-10
Project life years 15
End of commercial
operations31-Aug-24
Quarter ending commercial
operations30-Sep-24
FY ending comme rcial
operations31-Mar-25
882019 Major Project (Ramit)
httpslidepdfcomreaderfullmajor-project-ramit 6062
51
Annexure 2 Profit amp Loss accountsTable 97 Profit amp loss account statement
Income Statement (MNINR)Year ending Mar-10 Mar-11 Mar-12 Mar-13 Mar-14 Mar-15
RevenueGBT 406350 28811 89080 197447 379409 527015Operator Fees (GBT) 1411 10004 30678 67998 130664 179664RTT 1209 8575 27269 60443 116146 164264
Operator Fees (RTT) 440 3121 9739 21587 41481 56466Net Revenue 7124 50511 156766 347476 667700 927410
Expenses
VariableSecurity Sentries 1355 9790 28339 64033 125433 158238Supervisors 097 699 2024 4574 8959 11303Cluster Manager 048 350 10 12 2287 4480 5651AMC Cost of Generator 450 3013 7877 16719 31148 54541Sub-total 1950 13852 39252 87612 170021 229734
Fixed
Selling amp Maintenance(INRMonth) 032 050 053 056 058 061
Administration overhead(INRMonth) 080 128 137 147 157 168
Sub-total 112 179 190 203 216 230
EBITDA 5062 36480 117324 259661 497464 697447
Interest on LT loan - - 7341 31200 77479 156198Interest on ST loan - 021 060 130 245 361
EBDT 5062 36459 109923 228331 419739 540888Depreciation 2439 12769 35917 77162 142925 174006
EBT 2624 23691 74006 151169 276814 366881Income Tax 170 4233 14536 29073 53547 77634
PAT 2454 19458 59470 122096 223267 289247
882019 Major Project (Ramit)
httpslidepdfcomreaderfullmajor-project-ramit 6162
52
Annexure 3 Balance sheet
Table 98 B alance sheetsYearend Balance Sheet (MNINR)Year ending Mar-10 Mar-11 Mar-12 Mar-13 Mar-14 Mar-15
AssetsGross Block 75742 328216 833164 1716823 3105430 3105430Accumulated depreciation 2439 15208 51125 128287 271212 445218Net Block 73303 313009 782040 1588536 2834219 2660212Net Working Capital 064 241 620 1335 2515 3707Cash Balance 12979 72089 216513 488856 947982 1294734Total Assets 86346 385339 999172 2078727 3784715 3958653
LiabilitiesEquity 25168 108980 276604 569947 1030914 1030914Reserves amp Surplus 2454 21912 81381 203477 426745 715992Long term Debt 58725 254286 640722 1304302 2325171 2208967WC Borrowings - 161 465 1001 1886 2780Total Liabilities 86346 385339 999172 2078727 3784715 3958653
882019 Major Project (Ramit)
httpslidepdfcomreaderfullmajor-project-ramit 6262
Annexure 4 Cash flow statement
Table 99 Cash flow statements
Year ending Mar-10 Mar-11 Mar-12 Mar-13 Mar-14 Mar-15
InflowsPAT 2454 19458 59470 122096 223267 289247Depreciation 2439 12769 35917 77162 142925 174006Tax adjusted interest - 014 4959 20991 52076 104895Release of WC - - - - - -Salvage Value - - - - - -Sub-Total 4893 32241 100345 220249 418268 568148
OutflowsCapex 75742 252474 504948 883659 1388607 -Change in WorkingCapital 064 177 379 715 1180 1192
Sub-Total 75806 252651 505327 884374 1389787 1192
UFCF (70913) (220410) (404982) (664125) (971519) 566956LFCF (70913) (220424) (409940) (685116) (1023595) 462062
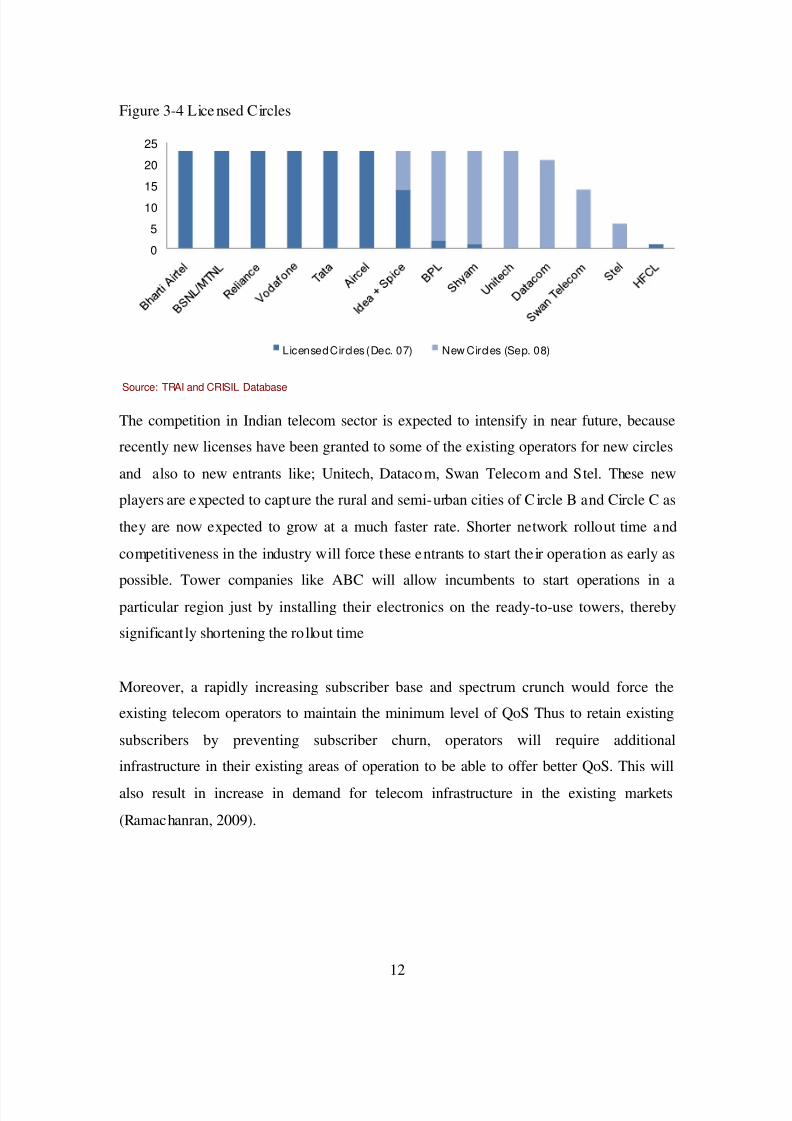
882019 Major Project (Ramit)
httpslidepdfcomreaderfullmajor-project-ramit 2162
12
Figure 3-4 Lice nsed Circles
0
5
10
15
20
25
Licensed Circles (Dec 07) New Circles (Sep 08)
Source TRAI and CRISIL Database
The competition in Indian telecom sector is expected to intensify in near future because
recently new licenses have been granted to some of the existing operators for new circles
and also to new entrants like Unitech Datacom Swan Telecom and Stel These new
players are expected to capture the rural and semi-urban cities of C ircle B and Circle C as
they are now expected to grow at a much faster rate Shorter network rollout time and
competitiveness in the industry will force these entrants to start the ir operation as early as
possible Tower companies like ABC will allow incumbents to start operations in a
particular region just by installing their electronics on the ready-to-use towers thereby
significantly shortening the ro llout time
Moreover a rapidly increasing subscriber base and spectrum crunch would force the
existing telecom operators to maintain the minimum level of QoS Thus to retain existing
subscribers by preventing subscriber churn operators will require additional
infrastructure in their existing areas of operation to be able to offer better QoS This will
also result in increase in demand for telecom infrastructure in the existing markets
(Ramachanran 2009)
882019 Major Project (Ramit)
httpslidepdfcomreaderfullmajor-project-ramit 2262
13
34 Telecom Infrastructure Overview
Passive infrastructure is one of the most important components of a mobile network It
has been a critical area of operations for telecom companies in the past However with
increasing competition posing an urgent need for telecom companies to expand their
coverage and sharpen their focus on core operations so that they can sustain and improve
their market position passive infrastructure has assumed the status of an independent
industry during the past few years The industry (COAI) estimates that there will be a
requirement of around 350000 towers for 500 million subscribers by 2010 (COAI
2009)
Each site has active and passive infrastructure components Active components includethe antenna trans-receivers switches feeder cables Node B and microwave radio
equipments Passive (or non-electronic) components include the land tower shelter air-
conditioning equipment diesel electric generator battery electrical supply technical
premises and easements pylons etc Passive infrastructure in a mobile network
essentially involves acquiring land setting up towers and electrical and civil works that
needs to be in place before operators can install the active infrastructure which brings
mobile services to the consumers In a typical cell site build-out almost 65 of the total
cost is attributed to passive infrastructure and 35 to active infrastructure
(Ramachanran 2009)In this report passive cell site infrastructure has also been
henceforth referred to as towers or sites
The components of a typical base station are shown below
882019 Major Project (Ramit)
httpslidepdfcomreaderfullmajor-project-ramit 2362
14
Picture 3 1 Telecom Tower
Telecom towers are broadly classified on the basis of their placement as Ground-basedand Roof-top
1 Ground-Based Tower Ground-based towers (GBTs) are taller (typically 200 to 400
feet) and are mostly used in rural and semi-urban areas because of the easy
availability of real-estate space there GBTs involve a capital expenditure in the range
882019 Major Project (Ramit)
httpslidepdfcomreaderfullmajor-project-ramit 2462
15
of Rs 3 to 4 million depending on the height of the tower land prices etc
(Ramachanran 2009)
2 Roof-Top Tower (RTT) Roof-top towers (RTTs) are generally placed on the roofsof high-rise buildings They are shorter (than GBTs) and more common in urban and
highly populated areas where there is paucity of real-estate space Typically these
involve a capital expenditure of Rs 15 to 2 million (Ramachanran 2009)
The height of a telecom tower determines the number of antennas that can be
accommodated which in turn determines the capacity of the towers apart from factors
such as location and geographica l conditions (wind speeds type of terrain etc)
35 Telecom Infrastructure- Domestic market
In India there are broadly two kinds of operators in the tower infrastructure industry
Tower infrastructure subsidiaries
Reliance Infratel Limited
Bharti Infratel Limited
Indus Towers Limited
Wireless TT Info Services Limited (WTTIL)
Independent tower infrastructure companies (ITICs)
GTL Infrastructure
Xcel Telecom
Essar Telecom Infrastructure
Aster Infrastructure
Bharat Telemast
882019 Major Project (Ramit)
httpslidepdfcomreaderfullmajor-project-ramit 2562
16
These companies have their business model based largely on contract or anticipatory
approaches Under the contract approach tower companies set up tower sites going by
the requirements of the telecom operators and the terms of the contract are specified
beforehand in the MSAs signed by the two parties Under the anticipatory approachhowever tower companies set up tower infrastructure at sites with reasonable demand
potential and subsequently invite telecom operators to set up their network on these
towers The latter model involves higher business risks as the tower company may not be
able to achieve reasonable tenancy for its tower infrastructure and at profitable terms
BPTL proposes to follow contract approach for its business model
36 Telecom Infrastructure market- Competitive landscape
Figure 3-5 Telecom Infrastructure Market Players
038058154
365692
10381692
26923269
0 20000 40000 60000 80000 100000
Aster InfrastructureAmerican Towers
Essar Telec om Infrastructure
GTL In frastructureWi reles s TT In fo Services Limited
Bharti Infratel Limited
Reli anc e Communications Limitedrsquos
OthersInd us To wers Limited
Number of Towers
Market Players
Source Telecom Regulatory Authority of India and ICRANote Others include tower por tfolios of BSNL MTNL Sistema Shyam Teleservices Aircel etc
In Indian Telecom Infrastructure market competition has intensified significantly with
several players spinning of their tower portfolio and independent operators expanding
their operations
882019 Major Project (Ramit)
httpslidepdfcomreaderfullmajor-project-ramit 2662
17
Bharti Airtel Limited Reliance Communications Limited and Tata Teleservices Limited
have hived off their tower assets into separate tower infrastructure subsidiaries namely
Bharti Infratel Limited Reliance Infratel Limited and Wireless TT Infoservices Limited
respectively Also Bharti Infratel Limited together with Vodafone Essar Limited and IdeaCellular Limited in a joint- venture agreement has created Indiarsquos largest tower
infrastructure company ndash Indus Towers Limited which has an estimated portfolio of
around 88000 towers (Anjan V amp N 2009) Whereas in past few years number of
independent tower infrastructure companies have ventured into the domestic telecom
tower industry These include GTL Infrastructure Limited Essar Telecom Infrastructure
Limited Xcel Telecom Private Limited (American Towers) Tower Vision India Private
Limited Aster Infrastructure Private Limited TVS Interconnect Systems Limited etc
Figure 3-6 Telecom Tower Growth Scenario
0
100
200
300
400
500
600
700
2008 2009 2010 2011 2012 T e
l e c o m
T o w e r s
( T h o u s a n
d s )
Source Telecom Regulatory Authority of IndiaAssumptions Subscriber growth rate of 28 till 2011-12
1400 subscribe per site
As shown above it is expected that in next 4-5 years there will be a requirement of
additional 85000 towers (both GBT and RTT) each year to meet the subscriber base of
800 million by 2011-12 (PwC 2009) This shows that huge investment have to be made
in Indian telecom Infrastructure sector in near future Now since both passive and active
882019 Major Project (Ramit)
httpslidepdfcomreaderfullmajor-project-ramit 2762
18
infrastructure sharing is a llowed (except spectrum) Independent service providers will be
benefited Increase in subscriber base introduction of new technologies like 3G Wi-max
etc and increase in market healthy market competition in telecom services sector will
drive the growth in telecom infrastructure sector
882019 Major Project (Ramit)
httpslidepdfcomreaderfullmajor-project-ramit 2862
19
4 BUSINESS PLAN
41 Passive Infrastructure
Mobile networks have base stations (or cell sites) which have active and passive
infrastructure components Active components include the antenna trans-receivers
switches feeder cables Node B and microwave radio equipments Passive (or non-
electronic) components include the land tower shelter air-conditioning equipment
diesel electric generator battery electrical supply technical premises and easements
pylons etc Passive infrastructure in a mobile network essentially involves acquiring land
setting up towers and electrical and civil works that needs to be in place before operators
can install the active infrastructure which brings mobile services to the consumers In atypical cell site build-out almost 65 of the total cost is attributed to passive
infrastructure and 35 to active infrastructure
42 Infrastructure Sharing
Mobile operators are required to setup more and more BTS (cell) sites due to the
exponential growth of mobile subscribers in India (currently growing at almost 15 4
million subscribers a month) and limited availability of spectrum B and C Circles (wheretraffic density may not be as high as metros and Circle A) are expected to drive future
subscriber growth and requirements for cell sites will be higher to ensure greater
coverage
However creating new infrastructure by each operator separately leads to d uplicat ing
huge capital investments It also contributes to mushroom growth of telecom towers and
deteriorating skylines in urban areas which has already led to some local municipal and
state governments to regulate and restrict the erection of new mobile towers
The continued pressure on cellular tariffs higher infrastructure costs for network
deployment particularly in semi-urban and rural areas and compelling need to reduce
4 As published in ET 8 th May 09 Edition
882019 Major Project (Ramit)
httpslidepdfcomreaderfullmajor-project-ramit 2962
20
time to market for network roll outs have led operators to share and even outsource their
infrastructure requirements from third party infrastructure providers like BPTL GTL and
Indus towers It promotes capital efficiency as it allows more than one service provider to
leverage and ride o n common infrastructure In its simplest form it involves two or moreoperators jointly using the common passive infrastructure in a cell site While viewed
largely as a measure to reduce capital and operating expense such sharing also leads to
improvement of service q uality (by ensuring site space for service providers and reducing
black spots) and the environment (by reducing number of cell sites and towers)
In outsourcing operators take passive infrastructure and tower space from third party
infrastructure companies on a monthly rental basis to host their radio and transmission
equipments Outsourcing provides significant benefits to operators It enables them tosave on capital expenses (it actually converts capital expense into operating expense in
the form of lease rentals) and focus on their core activities of sales marketing and
branding while leaving the cumbersome task of managing the site development process
and site operation and maintenance to third parties who exclusively deal with such
activities
The concept of passive infrastructure sharing is increasingly gaining market acceptancein India So far it has been largely limited to bilateral sharing between operators in the
form of barter where the operators split the site related CAPEX and OPEX costs The
available information suggests that about 25 of the existing 90000 tower sites in India
are currently being shared for passive infrastructure predominantly in rural areas and
small towns
43 Introduction to the business
BPTL is an Infrastructure Provider company that builds owns operates and maintains
passive network infrastructure on a shared basis for mobile telecom operators and ITES
providers Its objective is to provide network design and planning network deployment
882019 Major Project (Ramit)
httpslidepdfcomreaderfullmajor-project-ramit 3062
21
network operations amp maintenance infrastructure management application management
and professional services to teleco m operators and enterprises
The company is planning to raise capital in the form of equity and debt to start its
operation by Aug 09 ABC rsquos vision is to provide world class managed infrastructure ampallied services to the service providers to optimize their service delivery capability In the
initial years of operation the company will focus on telecom sector with almost 100 of
its proposed capital expenditure till FY 14 earmarked for developing and owning passive
infrastructure for sharing among mobile service providers
44 Business Proposal
ABC will provide passive telecom infrastructure on build own operate (BOO) basis inboth ground based (GBS) as well as roof-top sites (RTS) It will undertake full range of
responsibilities in building owning and maintaining the sites and will serve as a single
window one-stop-shop provider of infrastructure services Typical responsibilities are
summarized below
Site planning keeping in view the network rollout plans of prospective customers
Site acquisition including entering into long-term agreements with land owners
Obtaining of necessary regulatory approvals
Erect ion and commissioning of tower and allied equipment
Provision of support services such as back-up power air-conditioning and
security
Provision of turnkey solutions to telecom companies such as sourcing of
equipment testing and maintenance
882019 Major Project (Ramit)
httpslidepdfcomreaderfullmajor-project-ramit 3162
22
Bharat Telemast Private Limited will identify the sites required for setting up the Passive
infrastructure by first of all getting a commitment from one operator who is called as
ldquoAnchor Operatorrdquo Then Bharat Telemast will go ahead to lease (or) buy out the site as
appropriate and commences construction of the cellular sites But the Cellular site will betypically designed for three to four operators While construction is in progress the
marketing team will work towards getting the second and third operator But care will be
taken in such a way that at least two operators are available at the time of completion of
construction
45 Sources of revenue
1 Infrastructure Provisioning Fees ndash fee paid by the operators on a monthly basisWith annual escalation
2 Site lease rental ndash Paid at actual on a monthly basis
3 Operations and maintenance charges Paid on a monthly basis
4 The contract also provides a fixed annual escalator
46 Attractiveness of business model
Stable and predictable cash flow business Once a tower asset is rented out it
usually generates a stable and predictable cash flow in the form of tower rentals
from occupants over the term of the MSA between the two parties
Low working capital requirement ABC rsquos business model is also characterized
by low working capital requirements as most of the operating expenses (such aselectricity and fuel and other variable operating expenses) are reimbursable by the
tenants on actual basis Moreover BPTL is may also be able to get rentals for the
towers in advance and also obtain better credit terms from their suppliers thus
further improving their working capital cycle
882019 Major Project (Ramit)
httpslidepdfcomreaderfullmajor-project-ramit 3262
23
High incremental profitability The operating costs associated with this
business are largely fixed in nature Thus each increment in tenancy is
accompanied by a minimal increase in costs This leads to a more thanproportionate increase in profits for every increase in occupancy
Reduction in capital investments due to present market conditions Due to
present market situation average capital requirement for RTT and GBT sites have
dropped from 2 million and 4 million to 15 million and 33 million ABC wishes
to grab this opportunity which will result in competitive advantage in near future
Extensive usage While on an average a GSM BTS can handle around 100-
1100 subscribers but in the case of high usage areas the figure can be as low as
600-700 subscribers which means a larger number of cell sites would be required
for the same area Moreover the country has the problem of spectrum scarcity
which increases the requirement of towers to maintain a reasonable leve l of
service quality
New entrants Many operators including Vodafone Essar Limited Idea Cellular
Limited Aircel Cellular Limited and Sistema Shyam Teleservices Limited have
received licenses as well spectrum in new circles which would enable them to
become pan-India operators in the next one-two years Also new licenses have
been issued to new players such as Unitech Swan Telecom and S Tel Limited
Given the significant expansion plans of new entrants over the medium term and
the need for them to optimize investments in order to maintain returns demand
for towers is expected to report a sharp increase
Shorter rollout time Indian telecom industry is highly competitive and doing
business for new entrant may not be easy Shorter network-rollout time would be
a critical success factor for the new entrants and a longer rollout time could meanloss of substantial market share to other operators Tower companies allow
players to start operations in a particular region just by installing their electronics
on the ready-to-use towers thereby significantly shortening the rollout time
New technologies 3G services are already launched in the country and to
augment their services various operators plan to launch Wi-Max services as soon
882019 Major Project (Ramit)
httpslidepdfcomreaderfullmajor-project-ramit 3362
24
as they receive additional spectrum from Government This would further
increase the demand for sharing of passive infrastructure
47
Expansion Schedule
BPTL would rollout both RTT and GBT sites of which the RTT sites GBT sites
normally would have a tower height of 50 meters or 60 meters depending on the need for
additional height for installation of microwave antennae based on the location of the site
and number of tenants on the cell site Details of BPTLrsquos expansion plan are summarized
below
Table 41 Expansion PlanExpansion Schedule 2009-10 2010-11 2011-12 2012-13 20013-14
GBT
Addition 210 700 1400 2450 3850
Total 210 910 2310 4760 8610
RTT
Addition 90 300 600 1050 1650
Total 90 390 990 2040 3690
48 Proposed Services
As indicated earlier ABC proposes to provide passive telecom infrastructure on a
sharing co-location basis to cellular operators The sites would either be Ground Based
Sites (GBS) or Roof Top Sites (RTS) As the sites are meant for co-location of the active
components of two to three operators they would be built to either 2-Tenant or 3-Tenant
specifications
The different components of the passive infrastructure facility and the related services
that would be offered by BPTL to the operators are as under
Infrastructure provisioning comprising
882019 Major Project (Ramit)
httpslidepdfcomreaderfullmajor-project-ramit 3462
25
Communication tower built to host multiple antennae
Weather-proof communication shelter with air-conditioning and power backup
arrangement
Diesel generating set and battery bank for power backup
A mobile standby generator to act as backup in case o f breakdown
Warehousing facility
Infrastructure operations and maintenance including
Regular operations and maintenance of the facility
Security of all the equipments at the site at all timesA dedicated team of technicians for a group of 40-50 sites to ensure effect ive and
efficient functioning of the components at all times
49 Proposed Organizational Structure
A senior management team will work under the leadership of the ldquoChief Operations
Officerrdquo who will be responsible for smooth implementation of proj ect activities He willalso assist the managing director in marketing This team will coordinate with Stallion
Telecom Pvt Ltd which will take over the role of procuring Capital Equipments
Senior management will consists of project manager infrastructure manager commercial
manager and head (legal and company affairs Apart from this there will be a requirement
Chief OperatingOfficer
Project Manager Infrastructure
Manager
Commercial
Manager (projects)
Head (Legal and
Company Affairs)
882019 Major Project (Ramit)
httpslidepdfcomreaderfullmajor-project-ramit 3562
26
of security sentries (3 per GBT site) supervisors (one for every 10 sites) and cluster
manager (one for every 50 sites)
Bharat Telemast will carry out the complete Project execution with the assistance of third party ldquoQuality control organizationrdquo and a third party ldquoProject management teamrdquo
Quality control and project management activities will be o utsourced to a third party
882019 Major Project (Ramit)
httpslidepdfcomreaderfullmajor-project-ramit 3662
27
5 METHODOLOGY
The changing face of infrastructure services creates a complex situation which demands
greater understanding of roles of competition regulatory structures and modes of
financing Knowledge of such things is a key decisive factor in building confidence
among investors promoters and government In project finance the project its assets
contract and cash flows are separated from promoter in order to permit credit appraisal
or loan to the project
As part of the financial feasibility analysis a series of related financial statements based
on projected sources and uses of funds during the development and operating phaseproject were created Financial statements consist of expenses associated with
development activities including capital costs like acquisition of land for GBT sites cost
of tower generator shelter batteries etc Most of the data regarding capital costs are
obtained from the promoter of ABC Limited All these capital costs related details are
provided in annexure 1
Assumption regarding depreciation capital structure operating expenses expansion
schedule tenancy ratios tariff or rent operatorrsquos fees and loan amortization schedule are
obtained from professional accountants Promoter and bankers of ABC Limited
Due to unknown factors that could influence the cost of towers or fees associated with
completing the project (soft costs) contingency costs were estimated at 5 of hard and
soft costs respectively If contingency is set too low developers could easily encounter
funding shortfalls upon slight changes in market forces All other costs were estimated
based on talking with industry professionals (Promoters)
A detailed financial model was prepared based on existing accounting standards and
following financial ratios were estimated
882019 Major Project (Ramit)
httpslidepdfcomreaderfullmajor-project-ramit 3762
28
EBITDA margin Profit and loss accounts for the estimated project period (15
Years) were prepared based on which estimated earnings before interests tax
depreciat ion and amortization were calculated for each year Detailed PampL
balance sheet and cash flow statements are provided in annexure 2 3 and 4
EBITDA = Total Revenue ndash (Variable expenses + Fixed Expenses)
EBITDA margin = EBITDA Total Revenue
PAT margin PAT is calculated by subtracting interests pa id on capital debt and
working capital debt depreciation and applicable corporate income tax from
EBITDA
PAT = EBITDA ndash Interest Payable ndash Depreciation ndash Income tax
PAT margin = PATTotal Revenue
Working Capital Working capital requirement is calculated by subtract ing
current liabilities from current assets Current assets are estimated based on 30
days cash requirement and current liabilities are estimated as half of salary
monthly expenses
WC = Current Assets ndash Current Liabilities
UFCF It is defined as the free cash flows available to the firm if the firm has
zero debt liability Purpose of ca lculat ing UFCF for project period is to determinethe project IRR
UFCF = PAT + Depreciation + Interest (tax adjusted) + Release of WC + Salvage
value of the assets ndash CAPEX ndash Change in WC
882019 Major Project (Ramit)
httpslidepdfcomreaderfullmajor-project-ramit 3862
29
LCFF It is defined as the cash floes available to the firm after paying interests on
long term and short term debts
LCFF = UFCF ndash Interest (tax adjusted)
FCFE It is defined as the free cash flow available to equity holders It is
determined to ca lculate equity IRR for equity investors It also includes the tax
benefits which are available as per the Income Tax Act
FCFE PAT + Depreciation + Salvage Value ndash Equity Investment ndash Long term debt
repayment
PIRR Project IRR is defined as the discount rate at which NPV (Net Present
Value) of UFCF is zero It is calculated by using following formula
UFCF 1 (1+PIRR) 0+ UFCF 2 (1+PIRR) 1+ UFCF 3 (1+PIRR) 2+ helliphelliphelliphelliphelliphellip = 0
UFCF 1 = UFCF at the end of first year of operation
UFCF 2 = UFCF at the end of second year of operation
PIRR = Project IRR
EIRR Equity IRR is defined as the discount rate at which NPV of FCFE is zero
It is calculated by using following formula
FCFE1 (1+EIRR) 0+ FCFE 2 (1+EIRR) 1+ FCFE 3 (1+EIRR) 2+ helliphelliphelliphelliphelliphellip = 0
FCFE1 = FCFE at the end of first year of operation
FCFE2 = FCFE at the end of seco nd year of operation
EIRR = Equity IRR
882019 Major Project (Ramit)
httpslidepdfcomreaderfullmajor-project-ramit 3962
30
WACC It is de fined as the percentage of return expected by the investors who
otherwise would have earned some return by investing in some other project
WACC = Cost of Debt (Debt Capital) + Cost of equity (Equity Capital)
882019 Major Project (Ramit)
httpslidepdfcomreaderfullmajor-project-ramit 4062
882019 Major Project (Ramit)
httpslidepdfcomreaderfullmajor-project-ramit 4162
32
62 Funding planAs the telecom sites are rolled out over a 5 year period till FY 2014 investment will be
required for each year ABC Limited will start generating profits from FY 10 only Such
internally generated cash accruals will be ploughed back into the business to meet part of
the project cost Investment required for each year is tabulated below
Table 61 Funding ProposalMillion INR FY 10 FY 11 FY 12 FY 13 FY 14
GBT Tower (Additional) Nos 210 700 1400 2450 3850
RTT Tower (Additional) Nos 90 300 600 1050 1650DE ratio 233 233 233 233 233
Additional CAPEX 83892 279374 558748 977809 1536557
Debt 58725 195562 391124 684466 1075590
Equity 25168 83812 167624 293343 460967
63 Results
Based on assumptions given in Annexure 1 a detailed financial model was preparedResults of the financial model such as PampL account Balance Sheet and cash flow
statements are provided in Annexure 2 3 and 4 Forecasts for the key financial figures for
first five years are provided in the Table below
Forecasts
Table 62 Income StatementMillion INR FY-10 FY11 FY12 FY-13 FY-14
Sales 7124 50511 156766 347476 667700
Cost of sales 1950 13852 39252 87612 170021
Gross 5174 36659 117514 259864 497679
7263 7258 7496 7479 7454
Admin costs 112 179 190 203 216
882019 Major Project (Ramit)
httpslidepdfcomreaderfullmajor-project-ramit 4262
33
Finance cost 0 021 7401 31330 77725
Taxation 170 4233 14536 29073 53547
PAT 2454 19458 59470 122096 223267
As shown in Table above during the expansion period revenue will grow exponentially
In the first year of operation ABC will earn a revenue of INR 7124 million from 300
(210 GBT and 90 RTT) sites with a tenancy ratio of 15 for GBS and 17 for RTS In the
first 2 years of operation the company will not pay any interest on long term debt due to
2 years moratorium period Major cost associated with the project is depreciation due to
which PAT is lower than the operating profits But cash flows to the firm are enough to
result in reasonable returns
Table 63 Balance Shee tYear ending Mar-10 Mar-11 Mar-12 Mar-13 Mar-14
AssetsGross Block 75742 328216 833164 1716823 3105430Accumulated depreciation 2439 15208 51125 128287 271212Net Block 73303 313009 782040 1588536 2834219Net Working Capital 064 241 620 1335 2515Cash Balance 12979 72089 216513 488856 947982
Total Assets 86346 385339 999172 2078727 3784715LiabilitiesEquity 25168 108980 276604 569947 1030914Reserves amp Surplus 2454 21912 81381 203477 426745Long term Debt 58725 254286 640722 1304302 2325171WC Borrowings - 161 465 1001 1886Total Liabilities 86346 385339 999172 2078727 3784715
Note All figures are in Million INR
Table 64 Key financial ratiosMar-11 Mar-12 Mar-13 Mar-14 Mar-15
Revenue Growth 60902 21036 12165 9216 3890EBITDA Growth 62061 22161 12132 9158 4020
PAT Growth 69293 20564 10531 8286 2955
As shown in table above increase in EBITDA is higher than that of revenue This is due
to better operational efficiency of ABCrsquos management and economies of scale S imilarly
882019 Major Project (Ramit)
httpslidepdfcomreaderfullmajor-project-ramit 4362
34
increase in PAT is lesser than that of EBITDA because of high depreciation and interest
expenses
Table 65 Pr ofitability r atios
Mar-11 Mar-12 Mar-13 Mar-14 Mar-15
EBITDA Margin 7222 7484 7473 7450 7520
PAT Margin 3852 3794 3514 3344 3119Return on Net Worth 622 760 769 788 1087
Key profitability ratios are shown in table above Return on net worth in the initial years
is lower because of the ambitious expansion plans of ABC Limited Thereafter return on
net worth increases with increase in PAT
Returns on Investment
Table 66 Financial returnsFinancial Indicators
Project IRR 1813Equity IRR 3609
64 Sensitivity Analysis
A sensitivity analysis has been carried out on the project financials to determine theimpact of key variables on the financial indicators namely
Project IRR
The key variables on which sensitivity analysis have been carried out areCapital expenditure for GBS and RTS1st and 2 nd tenant tariff for GBS1st and 2 nd tenant tariff for RTSTenancy Ratio
Similarly sensitivity analysis has been carried out forEquity IRR
The key variables on which sensitivity analysis have been carried out for EIRR are
Capital structure and interest rate for capital debtRepayment period and moratorium period
882019 Major Project (Ramit)
httpslidepdfcomreaderfullmajor-project-ramit 4462
35
The impact on the financial indicators is shown below
Figure 6-1 Project IRR vs GBT and RTT CAPEX
As shown in Figure 6-1 project IRR is more sensitive to change in CAPEX of RTT sitesas compared to change in CAPEX of GBT sites because tenancy ratio and tariff for RTTsites are higher than those of GBT sites
882019 Major Project (Ramit)
httpslidepdfcomreaderfullmajor-project-ramit 4562
36
Figure 6-2 Project IRR vs GBT Tariff for 1 st tenant (X-axis) and 2 nd tenant (right-hand side)
As shown in Figure 6-2 project IRR varies linearly with GBT tariff In the best casescenario when GBT tariff for 1 st tenant is INR 34000month and GBT tariff for secondtenant is INR 26000month Project IRR is 2101
Figure 6-3 Project IRR vs RTT Tariff for 1 st tenant (X-axis) and 2 nd tenant (right-hand side)
As shown in Figure 6-2 project IRR varies linearly with RTT tariff In the best casescenario when RTT tariff for 1 st tenant is INR 24000month and RTT tariff for second
882019 Major Project (Ramit)
httpslidepdfcomreaderfullmajor-project-ramit 4662
37
tenant is INR 20000month Project IRR is 1932 Project IRR is more sensitivetowards RTT tariff than GBT tariff because in practical business situation RTT siteshave a tenancy ratio of more than two due to which effect of tariff for 1 st tenant almostget nullified after few years
Figure 6-4 Project IRR vs Tenancy ratio for RTT sites (X-axis) and GBT sites
As shown in Figure 6-4 project IRR is very sensitive to tenancy ratio In the best casescenario where GBT sites have a tenancy ratio of 2 and RTT sites have a tenancy ratio of 3 project IRR can be as high as 20
Figure 6-5 Equity IRR vs long term debt interest rate for different leverage level
882019 Major Project (Ramit)
httpslidepdfcomreaderfullmajor-project-ramit 4762
38
As shown in figure 6-5 equity IRR is more sensitive to interest rate on long term debt forhigh level of leverage (lower debt equity ratio) because as the debt equity ratio increasesinterest paid on long term debt also increases significantly
Figure 6-6 Equity IRR vs long term debt repayment period at different level of moratoriumperiods
As shown in figure 6-6 Equity IRR increases with increase in moratorium period anddebt repayment period The variation is from 1654 to 60 for worst case and best casescenarios
882019 Major Project (Ramit)
httpslidepdfcomreaderfullmajor-project-ramit 4862
39
7 RISK ASSESSMENTRisk Mitigation strategyExecution Risk
(Project management landacquisition etc)
Management of ABC has proven expertise in
telecom infrastructure rollout and has executedvarious projects with large telecom operators andMNC vendorsABCrsquos top management team consists of a groupof professionals drawn from leading telecomInfrastructure Company who have immenseexpertise and experience in rolling out telecominfrastructure projects
Market Risk (No entry barriers operators may
share infrastructure betweenthemselves large players withhigh capital may increasecompetition)
India has a huge potential for telecominfrastructure market With increasing
competition falling tariffs and pressure onmargins telecom service providers are beingforced to increase their focus on marketing andreduce their expensesExperienced management healthy capital back-up effective presence in the telecominfrastructure market and value added services atrelatively lesser cost will help ABC to meet theset targets
Financing Risk
(Availability of equity capitalavailability of long term debtinterest rate and moratoriumperiod)
ABC is seeking private equity partner to secure
equity capital Company has already entered intoNDA with 2 major investorsLong term debt at an interest rate of 125 canbe easily arranged because of the credibility of the promoters in the marketMany other similar firms like Indus and GTLhave already secured long term debt for amoratorium period of 2 years Promoters of ABCLimited are confident to secure a long term debtwith a moratorium period of 2 years and apayback period of 8 years
ABC Limited would minimize the workingcapital requirements of its business by securingrentals and operating revenues in advance fromits clients and or by suitably structuring itspayment liabilities to match its cash inflows
Commercial Risk (Tenancy ratio and tariff forGBS and RTS)
ABC would aim to enter into long term contractswith the ldquoanchor tenantrdquo operator and thenrollout the infrastructure so that at least single
882019 Major Project (Ramit)
httpslidepdfcomreaderfullmajor-project-ramit 4962
40
occupancy of each site is ensured at all t imesPromoters will use its knowledge of the businessand its expertise to identify and roll out sites inlocations which have strong multi- tenancypotential to minimize occupancy risk
Revenue Risk (Operating fees may decreasecredit worthiness of the clientsdelay in payment of rentals)
As per the industry sources till now not even asingle operator have dishonored the long termlease contractThe credit risk is diversified as there will bemultiple operatorsABC would aggressively market to get 3G andWiFi broadcasters to use the sites and earnadditional revenues in addition to the assumedrevenue streams
Natural Calamities Risk The Company shall maintain insurance for thesites against these risks and the cost of insurancewill be priced in and passed on to the tenants
882019 Major Project (Ramit)
httpslidepdfcomreaderfullmajor-project-ramit 5062
41
8 CONCLUSION
India is the fastest growing wireless telecom market in the world The continuing
growth in the number of wireless subscribers and MoUs and increasing trend of
outsourcing of business processes to India has led to growing demand for large
investments in the telecom infrastructure in the country
However with increasing competition falling tariffs and pressure on margins
telecom service providers are being forced to increase their focus on marketing
customer acquisitions and branding and minimize their efforts and overheads in
project management and asset acquisition
Further with rising prices of steel cement and real estate the cost of developing
and owning passive infrastructure is increasingly becoming a costly proposition
for most operators and service providers
The compulsion on the part of service providers to reduce their operating costs
and capital expenditure requirements has led to opportunities in passiveinfrastructure outsourcing to independent third party infrastructure providers and
also sharing the infrastructure with other service providers It is expected that
cellular operators will outsource their communications site infrastructure needs as
a means of accelerating access to their markets and preserving capital rather than
constructing and operating their own communications sites and maintaining their
own communications sites service and deve lopment capabilities
Passive infrastructure is highly capital intensive and an integral part of the cellular
service providersrsquo networks Yet being a simple and low technology asset it is
amenable to outsourcing and sharing By transferring the responsibility of
ownership development and maintenance of passive infrastructure service
882019 Major Project (Ramit)
httpslidepdfcomreaderfullmajor-project-ramit 5162
42
providers have an opportunity to transfer a substantial part of their business risk to
third parties
Most telecom operators are facing capacity constraints on their networksCoverage obligations increasing pressure to improve network quality and
competition has led to aggressive roll out plans by existing cellular operators
Installation of cell sites has become a cumbersome process as there are a number
of clearances required and involves labor-intensive micro management
Availability of ready infrastructure from third party providers would enable the
operators to reduce their time to market and accelerate their access to their
customers Cellular service providers generally want to move quickly when
adding more sites and co-location on an existing site is always faster than
building
Ownership and maintenance of telecom towers and other infrastructure by third
parties is an established practice in developed nations like USA and is
increasingly gaining market acceptance in India
The Indian government is seriously considering promoting the infrastructure
sharing route between the telecom operator and private players to achieve future
national tele-density targets and improve rural telecom penetration
ABC being an independent entity with no business conflicts with other service
providers in the telecom space will be best positioned and have an early mover
advantage to capitalize on this emerging opportunity
Further the task of operating and maintaining the passive infrastructure in the cell
is increasingly becoming a cumbersome exercise for the service providers to
handle ABCrsquos composite offering to build passive infrastructure for the cellular
operators and also operate and maintain them will provide a turnkey solution to
address the infrastructure needs of the service providers
882019 Major Project (Ramit)
httpslidepdfcomreaderfullmajor-project-ramit 5262
43
The business model proposed to be followed by ABC is fairly simple with stable
and predictable cash flows as is the case with the business model of the tower
renting companies in USA Most contracts are long term for a period 10 or moreyears with annual price escalators generally ranging from 3 to 4 However
wireless carriers normally tend to renew rentals because suitable alternative sites
may not exist or be available and repositioning a site in a carrierrsquos network is
expensive and may adverse ly affect network quality
Site ownership and operations is a ldquoscalerdquo business operating administration
marketing expenses etc do not rise as quickly as revenues when portfolios are
expanded Incremental operating costs associated with adding wireless tenants to
a communications site are minimal Therefore as additional tenants are added to a
site the substantial majority of incremental revenue contributes to margin
expansion Most tower companies have high EBITDA margins as may be seen
from the financial indicators of some of the tower rental companies in USA
It is expected that site location and capacity price and quality of service and
successful execution of contracts will be the most significant competitive factors
in this business
ABCrsquos revenue and returns on investment will be primarily driven by its ability
to
o Increase the utilization of the space and infrastructure capacity owned by it by
increasing the number of tenants per site and renting out to maximum number
of users As discussed above return on capital employed (PIRR and EIRR) arevery sensitive to tenancy ratio In worst case scenario project IRR can be as
low as 8 and in the best case scenario it can be as high as 20
o Develop acquire sites of strategic importance and high growth potential that
will enable them to secure better commercial terms from users and attract
more number of tenants Infrastructure provisioning fees rentals for sites are
882019 Major Project (Ramit)
httpslidepdfcomreaderfullmajor-project-ramit 5362
44
extremely location sensitive There is a potential to acquire more land than
that of required to capitalize on the increase in real estate prices
o Develop sites in a cost effective manner ABC would consider purchasing
land only for those GBS sites which have sufficient demand and arestrategically located Else for most of its sites land will be leasehold As
shown above returns (PIRR and EIRR) are very sensitive to capital costs In
the worst case scenario project IRR can be as low as 15 whereas it can as
high as 27 in the best case scenario
o Negotiate and secure long term contracts with good credit quality users with
built in price escalation provisions to mitigate financing risk
o Leverage and secure long term financing at attractive terms and involve in
active treasury management to keep low financing cost Results of the
sensitivity analysis indicate that equity IRR can be as high as 60 foe a
moratorium period of 4 years and interest rate of 10
o Minimize working capital requirements
o Maintain low operating and administration expense
o Secure better OampM margins from operators and retain a healthy share of it in
ABC
o Maintain high service standards and build strong customer relationships
The business would have the potential to capture new revenue opportunities
around the existing assets As demand for towers is expected to grow and as
operators migrate to speedier next-generation wireless technologies they will
need the towers and associated passive infrastructure to transmit their new
services in addition to their existing offerings In addition to increasing capacity
and coverage and improving the quality of their networks cellular serviceproviders are deploying high speed data networks driving incremental demand of
sites The business therefore has potential upsides in the form of adding
customers (tenants) in wireless broadband third generation (ldquo3Grdquo) and wireless
data capabilities and also other incremental value propositions by way of hosting
882019 Major Project (Ramit)
httpslidepdfcomreaderfullmajor-project-ramit 5462
45
Billboards Hoardings etc in some of the high visible sites owned and maintained
by it
Based on the assumptions and subject to satisfactory resolution of the key risks
factors project cash flows will be able to meet debt service obligations
This business model is a lucrative investment option for a private equity player
because valuation of each site will increase in the coming years due to
improvement in market conditions increase in the value of land and increase in
the demand for passive infrastructure in rural and semi-urban areas
882019 Major Project (Ramit)
httpslidepdfcomreaderfullmajor-project-ramit 5562
46
REFERENCESAnjan G V A amp N M (2009) telecom infrastructure industry in india GurgaonICRA
Bessler W Norsworthy J amp Shusterman T (2001 12 1) Mergers in the UStelecommunications industry and market valuationeffects IEEE p 288
COAI (2009 march 14) Subscriber Figures Retrieved march 14 2009 fromCOAIcom httpwwwcoaicomstatisticsphp
IDA (2009 march 23) Highlights Retrieved march 23 2009 from idagovsghttpwwwidagovsghomeindexaspx
K R (2008) Time for new business model Delhi Cybermedia
MAXIS (2009 march 8) the malaysian telecommunications industry Retrieved march9 2009 from maxiscommyhttpwwwmaxiscommypersonalabout_usinvestorprospectusprospectus4pdf
P J amp Lisa A (2009) Stimulas spending and American Telecom Industry USACoracle group
PwC (2009 march 12) Indian Telecom Industry Gurgaon Harayana IndiaRamachanran (2009 march 1) Investment in Telecom Infrastructure sector (M RInterviewer)
Vogelsang I (2002) The German Telecommunications Reform Verein fuumlr Socialpolitik (p 26) Innsbruck Boston Press
882019 Major Project (Ramit)
httpslidepdfcomreaderfullmajor-project-ramit 5662
47
ANNEXURES
ANNEXURE 1 Key Assumptions
The occupancy of each site by single two three operators for green-field sites is assumed
to be as follows
Table 91 Expected Tenancy RatiosFY 10 FY 11 FY 12 FY 13 FY 14 FY15
GBT Tenant
Ratio 150 150 170 170 170 200
Single Operator 50 50 30 30 30 0
Two Operator 50 50 70 70 70 100
RTT Tenant
Ratio 170 170 200 200 200 250
Single Operator 30 30 0 0 0 0
Two Operator 70 70 100 100 100 50
Three Operator 0 0 0 0 0 50
From FY 15 onwards tenancy ratio of 2 and 25 for GBT and RTT sites is cons idered
882019 Major Project (Ramit)
httpslidepdfcomreaderfullmajor-project-ramit 5762
48
Capital costs related assumptions are tabulated below
Table 92 GBT and RTT Capital Cost
The lease rentals for RTT sites are reimbursed from the operators and therefore have not
been factored in the revenues as well as the expense For GBT sites land purchase cost of
035 millions assumed which has been escalated by 6 annually to determine the
salvage value of assets
GBT Capital Costs
Million
INR
Delivery cost of Ground Based
Tower (GBT)063
Delivery cost of Generator 030
Civil Work 040Shelter 012
Electrical Works 030
Other Equipments (UPS Battery
etc)045
Construction cost 045
Land 035
Contingency amp Financial Charges 035Total cost 335
RTT Capital Costs
Million
INR
Delivery cost of Roof Top
Tower (RTT) 030
Delivery cost of Generator 020
Civil Work 020Shelter 012
Electrical Works 030
Other Equipments (UPS
Battery etc) 030
Construction cost -
Land -
Contingency amp FinancialCharges 008
Total cost 150
882019 Major Project (Ramit)
httpslidepdfcomreaderfullmajor-project-ramit 5862
49
Ope rating costs related assumptions are tabulated below
Table 93 Operating CostsOperating Costs
Security Sentries (INRMonth) 4000
Supervisors (INRMonth) 6000
Cluster Manager One for Fifty Towers (INRMonth) 15000
Annual increase 500
Number of Security Sentries per tower 300
Number of supervisors per tower 010
Number of C luster manager per tower 002
Fixed Expenses
Selling amp Maintenance (INRMonth) 4000000
Annual Escalation 5
Administration overhead (INRMonth) 10000000Annual Escalation 7
AMC Cost of Generator 15 (cost of generator)
Annual Escalation (AMC) 3
For RTT sites security sentries are not required because it will be the responsibility of
the site owner A supervisor will for every 10 sites and a cluster manager for every 50
sites will be required
882019 Major Project (Ramit)
httpslidepdfcomreaderfullmajor-project-ramit 5962
50
Table 94 Long term debtInterest Rate 125 per annum
Moratorium 2 years
Repayment Period 8 years
Tariff related assumptions and date of operations are tabulated below
Table 95 GBT and RTT Tariff Table 96 Life of the projectTariff Plan
Tariff (INRMonth)
No of
operators GBT RTT
1 28000 18000
2 22000 14000
3 0 12000
Annual
increase 3 3
Commercial Operation Date 1-Aug-09
Quarter Ending 30-Sep-09
FY ending COD 31-Mar-10
Project life years 15
End of commercial
operations31-Aug-24
Quarter ending commercial
operations30-Sep-24
FY ending comme rcial
operations31-Mar-25
882019 Major Project (Ramit)
httpslidepdfcomreaderfullmajor-project-ramit 6062
51
Annexure 2 Profit amp Loss accountsTable 97 Profit amp loss account statement
Income Statement (MNINR)Year ending Mar-10 Mar-11 Mar-12 Mar-13 Mar-14 Mar-15
RevenueGBT 406350 28811 89080 197447 379409 527015Operator Fees (GBT) 1411 10004 30678 67998 130664 179664RTT 1209 8575 27269 60443 116146 164264
Operator Fees (RTT) 440 3121 9739 21587 41481 56466Net Revenue 7124 50511 156766 347476 667700 927410
Expenses
VariableSecurity Sentries 1355 9790 28339 64033 125433 158238Supervisors 097 699 2024 4574 8959 11303Cluster Manager 048 350 10 12 2287 4480 5651AMC Cost of Generator 450 3013 7877 16719 31148 54541Sub-total 1950 13852 39252 87612 170021 229734
Fixed
Selling amp Maintenance(INRMonth) 032 050 053 056 058 061
Administration overhead(INRMonth) 080 128 137 147 157 168
Sub-total 112 179 190 203 216 230
EBITDA 5062 36480 117324 259661 497464 697447
Interest on LT loan - - 7341 31200 77479 156198Interest on ST loan - 021 060 130 245 361
EBDT 5062 36459 109923 228331 419739 540888Depreciation 2439 12769 35917 77162 142925 174006
EBT 2624 23691 74006 151169 276814 366881Income Tax 170 4233 14536 29073 53547 77634
PAT 2454 19458 59470 122096 223267 289247
882019 Major Project (Ramit)
httpslidepdfcomreaderfullmajor-project-ramit 6162
52
Annexure 3 Balance sheet
Table 98 B alance sheetsYearend Balance Sheet (MNINR)Year ending Mar-10 Mar-11 Mar-12 Mar-13 Mar-14 Mar-15
AssetsGross Block 75742 328216 833164 1716823 3105430 3105430Accumulated depreciation 2439 15208 51125 128287 271212 445218Net Block 73303 313009 782040 1588536 2834219 2660212Net Working Capital 064 241 620 1335 2515 3707Cash Balance 12979 72089 216513 488856 947982 1294734Total Assets 86346 385339 999172 2078727 3784715 3958653
LiabilitiesEquity 25168 108980 276604 569947 1030914 1030914Reserves amp Surplus 2454 21912 81381 203477 426745 715992Long term Debt 58725 254286 640722 1304302 2325171 2208967WC Borrowings - 161 465 1001 1886 2780Total Liabilities 86346 385339 999172 2078727 3784715 3958653
882019 Major Project (Ramit)
httpslidepdfcomreaderfullmajor-project-ramit 6262
Annexure 4 Cash flow statement
Table 99 Cash flow statements
Year ending Mar-10 Mar-11 Mar-12 Mar-13 Mar-14 Mar-15
InflowsPAT 2454 19458 59470 122096 223267 289247Depreciation 2439 12769 35917 77162 142925 174006Tax adjusted interest - 014 4959 20991 52076 104895Release of WC - - - - - -Salvage Value - - - - - -Sub-Total 4893 32241 100345 220249 418268 568148
OutflowsCapex 75742 252474 504948 883659 1388607 -Change in WorkingCapital 064 177 379 715 1180 1192
Sub-Total 75806 252651 505327 884374 1389787 1192
UFCF (70913) (220410) (404982) (664125) (971519) 566956LFCF (70913) (220424) (409940) (685116) (1023595) 462062
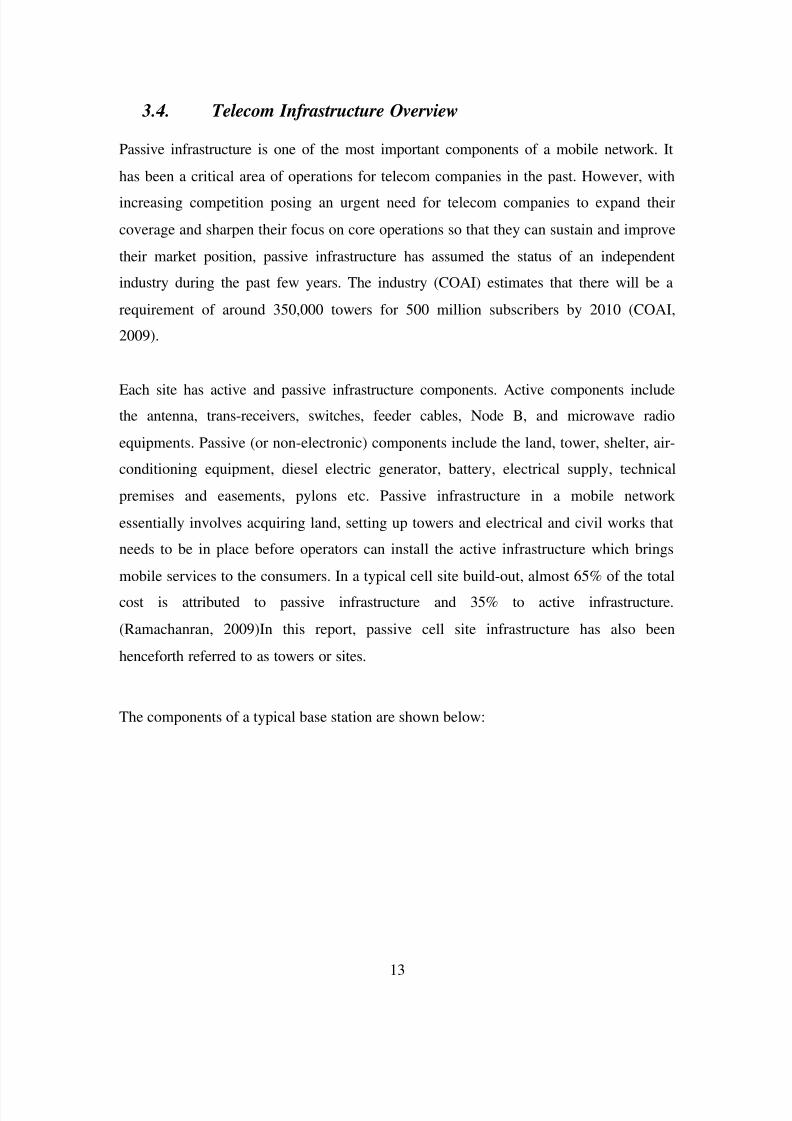
882019 Major Project (Ramit)
httpslidepdfcomreaderfullmajor-project-ramit 2262
13
34 Telecom Infrastructure Overview
Passive infrastructure is one of the most important components of a mobile network It
has been a critical area of operations for telecom companies in the past However with
increasing competition posing an urgent need for telecom companies to expand their
coverage and sharpen their focus on core operations so that they can sustain and improve
their market position passive infrastructure has assumed the status of an independent
industry during the past few years The industry (COAI) estimates that there will be a
requirement of around 350000 towers for 500 million subscribers by 2010 (COAI
2009)
Each site has active and passive infrastructure components Active components includethe antenna trans-receivers switches feeder cables Node B and microwave radio
equipments Passive (or non-electronic) components include the land tower shelter air-
conditioning equipment diesel electric generator battery electrical supply technical
premises and easements pylons etc Passive infrastructure in a mobile network
essentially involves acquiring land setting up towers and electrical and civil works that
needs to be in place before operators can install the active infrastructure which brings
mobile services to the consumers In a typical cell site build-out almost 65 of the total
cost is attributed to passive infrastructure and 35 to active infrastructure
(Ramachanran 2009)In this report passive cell site infrastructure has also been
henceforth referred to as towers or sites
The components of a typical base station are shown below
882019 Major Project (Ramit)
httpslidepdfcomreaderfullmajor-project-ramit 2362
14
Picture 3 1 Telecom Tower
Telecom towers are broadly classified on the basis of their placement as Ground-basedand Roof-top
1 Ground-Based Tower Ground-based towers (GBTs) are taller (typically 200 to 400
feet) and are mostly used in rural and semi-urban areas because of the easy
availability of real-estate space there GBTs involve a capital expenditure in the range
882019 Major Project (Ramit)
httpslidepdfcomreaderfullmajor-project-ramit 2462
15
of Rs 3 to 4 million depending on the height of the tower land prices etc
(Ramachanran 2009)
2 Roof-Top Tower (RTT) Roof-top towers (RTTs) are generally placed on the roofsof high-rise buildings They are shorter (than GBTs) and more common in urban and
highly populated areas where there is paucity of real-estate space Typically these
involve a capital expenditure of Rs 15 to 2 million (Ramachanran 2009)
The height of a telecom tower determines the number of antennas that can be
accommodated which in turn determines the capacity of the towers apart from factors
such as location and geographica l conditions (wind speeds type of terrain etc)
35 Telecom Infrastructure- Domestic market
In India there are broadly two kinds of operators in the tower infrastructure industry
Tower infrastructure subsidiaries
Reliance Infratel Limited
Bharti Infratel Limited
Indus Towers Limited
Wireless TT Info Services Limited (WTTIL)
Independent tower infrastructure companies (ITICs)
GTL Infrastructure
Xcel Telecom
Essar Telecom Infrastructure
Aster Infrastructure
Bharat Telemast
882019 Major Project (Ramit)
httpslidepdfcomreaderfullmajor-project-ramit 2562
16
These companies have their business model based largely on contract or anticipatory
approaches Under the contract approach tower companies set up tower sites going by
the requirements of the telecom operators and the terms of the contract are specified
beforehand in the MSAs signed by the two parties Under the anticipatory approachhowever tower companies set up tower infrastructure at sites with reasonable demand
potential and subsequently invite telecom operators to set up their network on these
towers The latter model involves higher business risks as the tower company may not be
able to achieve reasonable tenancy for its tower infrastructure and at profitable terms
BPTL proposes to follow contract approach for its business model
36 Telecom Infrastructure market- Competitive landscape
Figure 3-5 Telecom Infrastructure Market Players
038058154
365692
10381692
26923269
0 20000 40000 60000 80000 100000
Aster InfrastructureAmerican Towers
Essar Telec om Infrastructure
GTL In frastructureWi reles s TT In fo Services Limited
Bharti Infratel Limited
Reli anc e Communications Limitedrsquos
OthersInd us To wers Limited
Number of Towers
Market Players
Source Telecom Regulatory Authority of India and ICRANote Others include tower por tfolios of BSNL MTNL Sistema Shyam Teleservices Aircel etc
In Indian Telecom Infrastructure market competition has intensified significantly with
several players spinning of their tower portfolio and independent operators expanding
their operations
882019 Major Project (Ramit)
httpslidepdfcomreaderfullmajor-project-ramit 2662
17
Bharti Airtel Limited Reliance Communications Limited and Tata Teleservices Limited
have hived off their tower assets into separate tower infrastructure subsidiaries namely
Bharti Infratel Limited Reliance Infratel Limited and Wireless TT Infoservices Limited
respectively Also Bharti Infratel Limited together with Vodafone Essar Limited and IdeaCellular Limited in a joint- venture agreement has created Indiarsquos largest tower
infrastructure company ndash Indus Towers Limited which has an estimated portfolio of
around 88000 towers (Anjan V amp N 2009) Whereas in past few years number of
independent tower infrastructure companies have ventured into the domestic telecom
tower industry These include GTL Infrastructure Limited Essar Telecom Infrastructure
Limited Xcel Telecom Private Limited (American Towers) Tower Vision India Private
Limited Aster Infrastructure Private Limited TVS Interconnect Systems Limited etc
Figure 3-6 Telecom Tower Growth Scenario
0
100
200
300
400
500
600
700
2008 2009 2010 2011 2012 T e
l e c o m
T o w e r s
( T h o u s a n
d s )
Source Telecom Regulatory Authority of IndiaAssumptions Subscriber growth rate of 28 till 2011-12
1400 subscribe per site
As shown above it is expected that in next 4-5 years there will be a requirement of
additional 85000 towers (both GBT and RTT) each year to meet the subscriber base of
800 million by 2011-12 (PwC 2009) This shows that huge investment have to be made
in Indian telecom Infrastructure sector in near future Now since both passive and active
882019 Major Project (Ramit)
httpslidepdfcomreaderfullmajor-project-ramit 2762
18
infrastructure sharing is a llowed (except spectrum) Independent service providers will be
benefited Increase in subscriber base introduction of new technologies like 3G Wi-max
etc and increase in market healthy market competition in telecom services sector will
drive the growth in telecom infrastructure sector
882019 Major Project (Ramit)
httpslidepdfcomreaderfullmajor-project-ramit 2862
19
4 BUSINESS PLAN
41 Passive Infrastructure
Mobile networks have base stations (or cell sites) which have active and passive
infrastructure components Active components include the antenna trans-receivers
switches feeder cables Node B and microwave radio equipments Passive (or non-
electronic) components include the land tower shelter air-conditioning equipment
diesel electric generator battery electrical supply technical premises and easements
pylons etc Passive infrastructure in a mobile network essentially involves acquiring land
setting up towers and electrical and civil works that needs to be in place before operators
can install the active infrastructure which brings mobile services to the consumers In atypical cell site build-out almost 65 of the total cost is attributed to passive
infrastructure and 35 to active infrastructure
42 Infrastructure Sharing
Mobile operators are required to setup more and more BTS (cell) sites due to the
exponential growth of mobile subscribers in India (currently growing at almost 15 4
million subscribers a month) and limited availability of spectrum B and C Circles (wheretraffic density may not be as high as metros and Circle A) are expected to drive future
subscriber growth and requirements for cell sites will be higher to ensure greater
coverage
However creating new infrastructure by each operator separately leads to d uplicat ing
huge capital investments It also contributes to mushroom growth of telecom towers and
deteriorating skylines in urban areas which has already led to some local municipal and
state governments to regulate and restrict the erection of new mobile towers
The continued pressure on cellular tariffs higher infrastructure costs for network
deployment particularly in semi-urban and rural areas and compelling need to reduce
4 As published in ET 8 th May 09 Edition
882019 Major Project (Ramit)
httpslidepdfcomreaderfullmajor-project-ramit 2962
20
time to market for network roll outs have led operators to share and even outsource their
infrastructure requirements from third party infrastructure providers like BPTL GTL and
Indus towers It promotes capital efficiency as it allows more than one service provider to
leverage and ride o n common infrastructure In its simplest form it involves two or moreoperators jointly using the common passive infrastructure in a cell site While viewed
largely as a measure to reduce capital and operating expense such sharing also leads to
improvement of service q uality (by ensuring site space for service providers and reducing
black spots) and the environment (by reducing number of cell sites and towers)
In outsourcing operators take passive infrastructure and tower space from third party
infrastructure companies on a monthly rental basis to host their radio and transmission
equipments Outsourcing provides significant benefits to operators It enables them tosave on capital expenses (it actually converts capital expense into operating expense in
the form of lease rentals) and focus on their core activities of sales marketing and
branding while leaving the cumbersome task of managing the site development process
and site operation and maintenance to third parties who exclusively deal with such
activities
The concept of passive infrastructure sharing is increasingly gaining market acceptancein India So far it has been largely limited to bilateral sharing between operators in the
form of barter where the operators split the site related CAPEX and OPEX costs The
available information suggests that about 25 of the existing 90000 tower sites in India
are currently being shared for passive infrastructure predominantly in rural areas and
small towns
43 Introduction to the business
BPTL is an Infrastructure Provider company that builds owns operates and maintains
passive network infrastructure on a shared basis for mobile telecom operators and ITES
providers Its objective is to provide network design and planning network deployment
882019 Major Project (Ramit)
httpslidepdfcomreaderfullmajor-project-ramit 3062
21
network operations amp maintenance infrastructure management application management
and professional services to teleco m operators and enterprises
The company is planning to raise capital in the form of equity and debt to start its
operation by Aug 09 ABC rsquos vision is to provide world class managed infrastructure ampallied services to the service providers to optimize their service delivery capability In the
initial years of operation the company will focus on telecom sector with almost 100 of
its proposed capital expenditure till FY 14 earmarked for developing and owning passive
infrastructure for sharing among mobile service providers
44 Business Proposal
ABC will provide passive telecom infrastructure on build own operate (BOO) basis inboth ground based (GBS) as well as roof-top sites (RTS) It will undertake full range of
responsibilities in building owning and maintaining the sites and will serve as a single
window one-stop-shop provider of infrastructure services Typical responsibilities are
summarized below
Site planning keeping in view the network rollout plans of prospective customers
Site acquisition including entering into long-term agreements with land owners
Obtaining of necessary regulatory approvals
Erect ion and commissioning of tower and allied equipment
Provision of support services such as back-up power air-conditioning and
security
Provision of turnkey solutions to telecom companies such as sourcing of
equipment testing and maintenance
882019 Major Project (Ramit)
httpslidepdfcomreaderfullmajor-project-ramit 3162
22
Bharat Telemast Private Limited will identify the sites required for setting up the Passive
infrastructure by first of all getting a commitment from one operator who is called as
ldquoAnchor Operatorrdquo Then Bharat Telemast will go ahead to lease (or) buy out the site as
appropriate and commences construction of the cellular sites But the Cellular site will betypically designed for three to four operators While construction is in progress the
marketing team will work towards getting the second and third operator But care will be
taken in such a way that at least two operators are available at the time of completion of
construction
45 Sources of revenue
1 Infrastructure Provisioning Fees ndash fee paid by the operators on a monthly basisWith annual escalation
2 Site lease rental ndash Paid at actual on a monthly basis
3 Operations and maintenance charges Paid on a monthly basis
4 The contract also provides a fixed annual escalator
46 Attractiveness of business model
Stable and predictable cash flow business Once a tower asset is rented out it
usually generates a stable and predictable cash flow in the form of tower rentals
from occupants over the term of the MSA between the two parties
Low working capital requirement ABC rsquos business model is also characterized
by low working capital requirements as most of the operating expenses (such aselectricity and fuel and other variable operating expenses) are reimbursable by the
tenants on actual basis Moreover BPTL is may also be able to get rentals for the
towers in advance and also obtain better credit terms from their suppliers thus
further improving their working capital cycle
882019 Major Project (Ramit)
httpslidepdfcomreaderfullmajor-project-ramit 3262
23
High incremental profitability The operating costs associated with this
business are largely fixed in nature Thus each increment in tenancy is
accompanied by a minimal increase in costs This leads to a more thanproportionate increase in profits for every increase in occupancy
Reduction in capital investments due to present market conditions Due to
present market situation average capital requirement for RTT and GBT sites have
dropped from 2 million and 4 million to 15 million and 33 million ABC wishes
to grab this opportunity which will result in competitive advantage in near future
Extensive usage While on an average a GSM BTS can handle around 100-
1100 subscribers but in the case of high usage areas the figure can be as low as
600-700 subscribers which means a larger number of cell sites would be required
for the same area Moreover the country has the problem of spectrum scarcity
which increases the requirement of towers to maintain a reasonable leve l of
service quality
New entrants Many operators including Vodafone Essar Limited Idea Cellular
Limited Aircel Cellular Limited and Sistema Shyam Teleservices Limited have
received licenses as well spectrum in new circles which would enable them to
become pan-India operators in the next one-two years Also new licenses have
been issued to new players such as Unitech Swan Telecom and S Tel Limited
Given the significant expansion plans of new entrants over the medium term and
the need for them to optimize investments in order to maintain returns demand
for towers is expected to report a sharp increase
Shorter rollout time Indian telecom industry is highly competitive and doing
business for new entrant may not be easy Shorter network-rollout time would be
a critical success factor for the new entrants and a longer rollout time could meanloss of substantial market share to other operators Tower companies allow
players to start operations in a particular region just by installing their electronics
on the ready-to-use towers thereby significantly shortening the rollout time
New technologies 3G services are already launched in the country and to
augment their services various operators plan to launch Wi-Max services as soon
882019 Major Project (Ramit)
httpslidepdfcomreaderfullmajor-project-ramit 3362
24
as they receive additional spectrum from Government This would further
increase the demand for sharing of passive infrastructure
47
Expansion Schedule
BPTL would rollout both RTT and GBT sites of which the RTT sites GBT sites
normally would have a tower height of 50 meters or 60 meters depending on the need for
additional height for installation of microwave antennae based on the location of the site
and number of tenants on the cell site Details of BPTLrsquos expansion plan are summarized
below
Table 41 Expansion PlanExpansion Schedule 2009-10 2010-11 2011-12 2012-13 20013-14
GBT
Addition 210 700 1400 2450 3850
Total 210 910 2310 4760 8610
RTT
Addition 90 300 600 1050 1650
Total 90 390 990 2040 3690
48 Proposed Services
As indicated earlier ABC proposes to provide passive telecom infrastructure on a
sharing co-location basis to cellular operators The sites would either be Ground Based
Sites (GBS) or Roof Top Sites (RTS) As the sites are meant for co-location of the active
components of two to three operators they would be built to either 2-Tenant or 3-Tenant
specifications
The different components of the passive infrastructure facility and the related services
that would be offered by BPTL to the operators are as under
Infrastructure provisioning comprising
882019 Major Project (Ramit)
httpslidepdfcomreaderfullmajor-project-ramit 3462
25
Communication tower built to host multiple antennae
Weather-proof communication shelter with air-conditioning and power backup
arrangement
Diesel generating set and battery bank for power backup
A mobile standby generator to act as backup in case o f breakdown
Warehousing facility
Infrastructure operations and maintenance including
Regular operations and maintenance of the facility
Security of all the equipments at the site at all timesA dedicated team of technicians for a group of 40-50 sites to ensure effect ive and
efficient functioning of the components at all times
49 Proposed Organizational Structure
A senior management team will work under the leadership of the ldquoChief Operations
Officerrdquo who will be responsible for smooth implementation of proj ect activities He willalso assist the managing director in marketing This team will coordinate with Stallion
Telecom Pvt Ltd which will take over the role of procuring Capital Equipments
Senior management will consists of project manager infrastructure manager commercial
manager and head (legal and company affairs Apart from this there will be a requirement
Chief OperatingOfficer
Project Manager Infrastructure
Manager
Commercial
Manager (projects)
Head (Legal and
Company Affairs)
882019 Major Project (Ramit)
httpslidepdfcomreaderfullmajor-project-ramit 3562
26
of security sentries (3 per GBT site) supervisors (one for every 10 sites) and cluster
manager (one for every 50 sites)
Bharat Telemast will carry out the complete Project execution with the assistance of third party ldquoQuality control organizationrdquo and a third party ldquoProject management teamrdquo
Quality control and project management activities will be o utsourced to a third party
882019 Major Project (Ramit)
httpslidepdfcomreaderfullmajor-project-ramit 3662
27
5 METHODOLOGY
The changing face of infrastructure services creates a complex situation which demands
greater understanding of roles of competition regulatory structures and modes of
financing Knowledge of such things is a key decisive factor in building confidence
among investors promoters and government In project finance the project its assets
contract and cash flows are separated from promoter in order to permit credit appraisal
or loan to the project
As part of the financial feasibility analysis a series of related financial statements based
on projected sources and uses of funds during the development and operating phaseproject were created Financial statements consist of expenses associated with
development activities including capital costs like acquisition of land for GBT sites cost
of tower generator shelter batteries etc Most of the data regarding capital costs are
obtained from the promoter of ABC Limited All these capital costs related details are
provided in annexure 1
Assumption regarding depreciation capital structure operating expenses expansion
schedule tenancy ratios tariff or rent operatorrsquos fees and loan amortization schedule are
obtained from professional accountants Promoter and bankers of ABC Limited
Due to unknown factors that could influence the cost of towers or fees associated with
completing the project (soft costs) contingency costs were estimated at 5 of hard and
soft costs respectively If contingency is set too low developers could easily encounter
funding shortfalls upon slight changes in market forces All other costs were estimated
based on talking with industry professionals (Promoters)
A detailed financial model was prepared based on existing accounting standards and
following financial ratios were estimated
882019 Major Project (Ramit)
httpslidepdfcomreaderfullmajor-project-ramit 3762
28
EBITDA margin Profit and loss accounts for the estimated project period (15
Years) were prepared based on which estimated earnings before interests tax
depreciat ion and amortization were calculated for each year Detailed PampL
balance sheet and cash flow statements are provided in annexure 2 3 and 4
EBITDA = Total Revenue ndash (Variable expenses + Fixed Expenses)
EBITDA margin = EBITDA Total Revenue
PAT margin PAT is calculated by subtracting interests pa id on capital debt and
working capital debt depreciation and applicable corporate income tax from
EBITDA
PAT = EBITDA ndash Interest Payable ndash Depreciation ndash Income tax
PAT margin = PATTotal Revenue
Working Capital Working capital requirement is calculated by subtract ing
current liabilities from current assets Current assets are estimated based on 30
days cash requirement and current liabilities are estimated as half of salary
monthly expenses
WC = Current Assets ndash Current Liabilities
UFCF It is defined as the free cash flows available to the firm if the firm has
zero debt liability Purpose of ca lculat ing UFCF for project period is to determinethe project IRR
UFCF = PAT + Depreciation + Interest (tax adjusted) + Release of WC + Salvage
value of the assets ndash CAPEX ndash Change in WC
882019 Major Project (Ramit)
httpslidepdfcomreaderfullmajor-project-ramit 3862
29
LCFF It is defined as the cash floes available to the firm after paying interests on
long term and short term debts
LCFF = UFCF ndash Interest (tax adjusted)
FCFE It is defined as the free cash flow available to equity holders It is
determined to ca lculate equity IRR for equity investors It also includes the tax
benefits which are available as per the Income Tax Act
FCFE PAT + Depreciation + Salvage Value ndash Equity Investment ndash Long term debt
repayment
PIRR Project IRR is defined as the discount rate at which NPV (Net Present
Value) of UFCF is zero It is calculated by using following formula
UFCF 1 (1+PIRR) 0+ UFCF 2 (1+PIRR) 1+ UFCF 3 (1+PIRR) 2+ helliphelliphelliphelliphelliphellip = 0
UFCF 1 = UFCF at the end of first year of operation
UFCF 2 = UFCF at the end of second year of operation
PIRR = Project IRR
EIRR Equity IRR is defined as the discount rate at which NPV of FCFE is zero
It is calculated by using following formula
FCFE1 (1+EIRR) 0+ FCFE 2 (1+EIRR) 1+ FCFE 3 (1+EIRR) 2+ helliphelliphelliphelliphelliphellip = 0
FCFE1 = FCFE at the end of first year of operation
FCFE2 = FCFE at the end of seco nd year of operation
EIRR = Equity IRR
882019 Major Project (Ramit)
httpslidepdfcomreaderfullmajor-project-ramit 3962
30
WACC It is de fined as the percentage of return expected by the investors who
otherwise would have earned some return by investing in some other project
WACC = Cost of Debt (Debt Capital) + Cost of equity (Equity Capital)
882019 Major Project (Ramit)
httpslidepdfcomreaderfullmajor-project-ramit 4062
882019 Major Project (Ramit)
httpslidepdfcomreaderfullmajor-project-ramit 4162
32
62 Funding planAs the telecom sites are rolled out over a 5 year period till FY 2014 investment will be
required for each year ABC Limited will start generating profits from FY 10 only Such
internally generated cash accruals will be ploughed back into the business to meet part of
the project cost Investment required for each year is tabulated below
Table 61 Funding ProposalMillion INR FY 10 FY 11 FY 12 FY 13 FY 14
GBT Tower (Additional) Nos 210 700 1400 2450 3850
RTT Tower (Additional) Nos 90 300 600 1050 1650DE ratio 233 233 233 233 233
Additional CAPEX 83892 279374 558748 977809 1536557
Debt 58725 195562 391124 684466 1075590
Equity 25168 83812 167624 293343 460967
63 Results
Based on assumptions given in Annexure 1 a detailed financial model was preparedResults of the financial model such as PampL account Balance Sheet and cash flow
statements are provided in Annexure 2 3 and 4 Forecasts for the key financial figures for
first five years are provided in the Table below
Forecasts
Table 62 Income StatementMillion INR FY-10 FY11 FY12 FY-13 FY-14
Sales 7124 50511 156766 347476 667700
Cost of sales 1950 13852 39252 87612 170021
Gross 5174 36659 117514 259864 497679
7263 7258 7496 7479 7454
Admin costs 112 179 190 203 216
882019 Major Project (Ramit)
httpslidepdfcomreaderfullmajor-project-ramit 4262
33
Finance cost 0 021 7401 31330 77725
Taxation 170 4233 14536 29073 53547
PAT 2454 19458 59470 122096 223267
As shown in Table above during the expansion period revenue will grow exponentially
In the first year of operation ABC will earn a revenue of INR 7124 million from 300
(210 GBT and 90 RTT) sites with a tenancy ratio of 15 for GBS and 17 for RTS In the
first 2 years of operation the company will not pay any interest on long term debt due to
2 years moratorium period Major cost associated with the project is depreciation due to
which PAT is lower than the operating profits But cash flows to the firm are enough to
result in reasonable returns
Table 63 Balance Shee tYear ending Mar-10 Mar-11 Mar-12 Mar-13 Mar-14
AssetsGross Block 75742 328216 833164 1716823 3105430Accumulated depreciation 2439 15208 51125 128287 271212Net Block 73303 313009 782040 1588536 2834219Net Working Capital 064 241 620 1335 2515Cash Balance 12979 72089 216513 488856 947982
Total Assets 86346 385339 999172 2078727 3784715LiabilitiesEquity 25168 108980 276604 569947 1030914Reserves amp Surplus 2454 21912 81381 203477 426745Long term Debt 58725 254286 640722 1304302 2325171WC Borrowings - 161 465 1001 1886Total Liabilities 86346 385339 999172 2078727 3784715
Note All figures are in Million INR
Table 64 Key financial ratiosMar-11 Mar-12 Mar-13 Mar-14 Mar-15
Revenue Growth 60902 21036 12165 9216 3890EBITDA Growth 62061 22161 12132 9158 4020
PAT Growth 69293 20564 10531 8286 2955
As shown in table above increase in EBITDA is higher than that of revenue This is due
to better operational efficiency of ABCrsquos management and economies of scale S imilarly
882019 Major Project (Ramit)
httpslidepdfcomreaderfullmajor-project-ramit 4362
34
increase in PAT is lesser than that of EBITDA because of high depreciation and interest
expenses
Table 65 Pr ofitability r atios
Mar-11 Mar-12 Mar-13 Mar-14 Mar-15
EBITDA Margin 7222 7484 7473 7450 7520
PAT Margin 3852 3794 3514 3344 3119Return on Net Worth 622 760 769 788 1087
Key profitability ratios are shown in table above Return on net worth in the initial years
is lower because of the ambitious expansion plans of ABC Limited Thereafter return on
net worth increases with increase in PAT
Returns on Investment
Table 66 Financial returnsFinancial Indicators
Project IRR 1813Equity IRR 3609
64 Sensitivity Analysis
A sensitivity analysis has been carried out on the project financials to determine theimpact of key variables on the financial indicators namely
Project IRR
The key variables on which sensitivity analysis have been carried out areCapital expenditure for GBS and RTS1st and 2 nd tenant tariff for GBS1st and 2 nd tenant tariff for RTSTenancy Ratio
Similarly sensitivity analysis has been carried out forEquity IRR
The key variables on which sensitivity analysis have been carried out for EIRR are
Capital structure and interest rate for capital debtRepayment period and moratorium period
882019 Major Project (Ramit)
httpslidepdfcomreaderfullmajor-project-ramit 4462
35
The impact on the financial indicators is shown below
Figure 6-1 Project IRR vs GBT and RTT CAPEX
As shown in Figure 6-1 project IRR is more sensitive to change in CAPEX of RTT sitesas compared to change in CAPEX of GBT sites because tenancy ratio and tariff for RTTsites are higher than those of GBT sites
882019 Major Project (Ramit)
httpslidepdfcomreaderfullmajor-project-ramit 4562
36
Figure 6-2 Project IRR vs GBT Tariff for 1 st tenant (X-axis) and 2 nd tenant (right-hand side)
As shown in Figure 6-2 project IRR varies linearly with GBT tariff In the best casescenario when GBT tariff for 1 st tenant is INR 34000month and GBT tariff for secondtenant is INR 26000month Project IRR is 2101
Figure 6-3 Project IRR vs RTT Tariff for 1 st tenant (X-axis) and 2 nd tenant (right-hand side)
As shown in Figure 6-2 project IRR varies linearly with RTT tariff In the best casescenario when RTT tariff for 1 st tenant is INR 24000month and RTT tariff for second
882019 Major Project (Ramit)
httpslidepdfcomreaderfullmajor-project-ramit 4662
37
tenant is INR 20000month Project IRR is 1932 Project IRR is more sensitivetowards RTT tariff than GBT tariff because in practical business situation RTT siteshave a tenancy ratio of more than two due to which effect of tariff for 1 st tenant almostget nullified after few years
Figure 6-4 Project IRR vs Tenancy ratio for RTT sites (X-axis) and GBT sites
As shown in Figure 6-4 project IRR is very sensitive to tenancy ratio In the best casescenario where GBT sites have a tenancy ratio of 2 and RTT sites have a tenancy ratio of 3 project IRR can be as high as 20
Figure 6-5 Equity IRR vs long term debt interest rate for different leverage level
882019 Major Project (Ramit)
httpslidepdfcomreaderfullmajor-project-ramit 4762
38
As shown in figure 6-5 equity IRR is more sensitive to interest rate on long term debt forhigh level of leverage (lower debt equity ratio) because as the debt equity ratio increasesinterest paid on long term debt also increases significantly
Figure 6-6 Equity IRR vs long term debt repayment period at different level of moratoriumperiods
As shown in figure 6-6 Equity IRR increases with increase in moratorium period anddebt repayment period The variation is from 1654 to 60 for worst case and best casescenarios
882019 Major Project (Ramit)
httpslidepdfcomreaderfullmajor-project-ramit 4862
39
7 RISK ASSESSMENTRisk Mitigation strategyExecution Risk
(Project management landacquisition etc)
Management of ABC has proven expertise in
telecom infrastructure rollout and has executedvarious projects with large telecom operators andMNC vendorsABCrsquos top management team consists of a groupof professionals drawn from leading telecomInfrastructure Company who have immenseexpertise and experience in rolling out telecominfrastructure projects
Market Risk (No entry barriers operators may
share infrastructure betweenthemselves large players withhigh capital may increasecompetition)
India has a huge potential for telecominfrastructure market With increasing
competition falling tariffs and pressure onmargins telecom service providers are beingforced to increase their focus on marketing andreduce their expensesExperienced management healthy capital back-up effective presence in the telecominfrastructure market and value added services atrelatively lesser cost will help ABC to meet theset targets
Financing Risk
(Availability of equity capitalavailability of long term debtinterest rate and moratoriumperiod)
ABC is seeking private equity partner to secure
equity capital Company has already entered intoNDA with 2 major investorsLong term debt at an interest rate of 125 canbe easily arranged because of the credibility of the promoters in the marketMany other similar firms like Indus and GTLhave already secured long term debt for amoratorium period of 2 years Promoters of ABCLimited are confident to secure a long term debtwith a moratorium period of 2 years and apayback period of 8 years
ABC Limited would minimize the workingcapital requirements of its business by securingrentals and operating revenues in advance fromits clients and or by suitably structuring itspayment liabilities to match its cash inflows
Commercial Risk (Tenancy ratio and tariff forGBS and RTS)
ABC would aim to enter into long term contractswith the ldquoanchor tenantrdquo operator and thenrollout the infrastructure so that at least single
882019 Major Project (Ramit)
httpslidepdfcomreaderfullmajor-project-ramit 4962
40
occupancy of each site is ensured at all t imesPromoters will use its knowledge of the businessand its expertise to identify and roll out sites inlocations which have strong multi- tenancypotential to minimize occupancy risk
Revenue Risk (Operating fees may decreasecredit worthiness of the clientsdelay in payment of rentals)
As per the industry sources till now not even asingle operator have dishonored the long termlease contractThe credit risk is diversified as there will bemultiple operatorsABC would aggressively market to get 3G andWiFi broadcasters to use the sites and earnadditional revenues in addition to the assumedrevenue streams
Natural Calamities Risk The Company shall maintain insurance for thesites against these risks and the cost of insurancewill be priced in and passed on to the tenants
882019 Major Project (Ramit)
httpslidepdfcomreaderfullmajor-project-ramit 5062
41
8 CONCLUSION
India is the fastest growing wireless telecom market in the world The continuing
growth in the number of wireless subscribers and MoUs and increasing trend of
outsourcing of business processes to India has led to growing demand for large
investments in the telecom infrastructure in the country
However with increasing competition falling tariffs and pressure on margins
telecom service providers are being forced to increase their focus on marketing
customer acquisitions and branding and minimize their efforts and overheads in
project management and asset acquisition
Further with rising prices of steel cement and real estate the cost of developing
and owning passive infrastructure is increasingly becoming a costly proposition
for most operators and service providers
The compulsion on the part of service providers to reduce their operating costs
and capital expenditure requirements has led to opportunities in passiveinfrastructure outsourcing to independent third party infrastructure providers and
also sharing the infrastructure with other service providers It is expected that
cellular operators will outsource their communications site infrastructure needs as
a means of accelerating access to their markets and preserving capital rather than
constructing and operating their own communications sites and maintaining their
own communications sites service and deve lopment capabilities
Passive infrastructure is highly capital intensive and an integral part of the cellular
service providersrsquo networks Yet being a simple and low technology asset it is
amenable to outsourcing and sharing By transferring the responsibility of
ownership development and maintenance of passive infrastructure service
882019 Major Project (Ramit)
httpslidepdfcomreaderfullmajor-project-ramit 5162
42
providers have an opportunity to transfer a substantial part of their business risk to
third parties
Most telecom operators are facing capacity constraints on their networksCoverage obligations increasing pressure to improve network quality and
competition has led to aggressive roll out plans by existing cellular operators
Installation of cell sites has become a cumbersome process as there are a number
of clearances required and involves labor-intensive micro management
Availability of ready infrastructure from third party providers would enable the
operators to reduce their time to market and accelerate their access to their
customers Cellular service providers generally want to move quickly when
adding more sites and co-location on an existing site is always faster than
building
Ownership and maintenance of telecom towers and other infrastructure by third
parties is an established practice in developed nations like USA and is
increasingly gaining market acceptance in India
The Indian government is seriously considering promoting the infrastructure
sharing route between the telecom operator and private players to achieve future
national tele-density targets and improve rural telecom penetration
ABC being an independent entity with no business conflicts with other service
providers in the telecom space will be best positioned and have an early mover
advantage to capitalize on this emerging opportunity
Further the task of operating and maintaining the passive infrastructure in the cell
is increasingly becoming a cumbersome exercise for the service providers to
handle ABCrsquos composite offering to build passive infrastructure for the cellular
operators and also operate and maintain them will provide a turnkey solution to
address the infrastructure needs of the service providers
882019 Major Project (Ramit)
httpslidepdfcomreaderfullmajor-project-ramit 5262
43
The business model proposed to be followed by ABC is fairly simple with stable
and predictable cash flows as is the case with the business model of the tower
renting companies in USA Most contracts are long term for a period 10 or moreyears with annual price escalators generally ranging from 3 to 4 However
wireless carriers normally tend to renew rentals because suitable alternative sites
may not exist or be available and repositioning a site in a carrierrsquos network is
expensive and may adverse ly affect network quality
Site ownership and operations is a ldquoscalerdquo business operating administration
marketing expenses etc do not rise as quickly as revenues when portfolios are
expanded Incremental operating costs associated with adding wireless tenants to
a communications site are minimal Therefore as additional tenants are added to a
site the substantial majority of incremental revenue contributes to margin
expansion Most tower companies have high EBITDA margins as may be seen
from the financial indicators of some of the tower rental companies in USA
It is expected that site location and capacity price and quality of service and
successful execution of contracts will be the most significant competitive factors
in this business
ABCrsquos revenue and returns on investment will be primarily driven by its ability
to
o Increase the utilization of the space and infrastructure capacity owned by it by
increasing the number of tenants per site and renting out to maximum number
of users As discussed above return on capital employed (PIRR and EIRR) arevery sensitive to tenancy ratio In worst case scenario project IRR can be as
low as 8 and in the best case scenario it can be as high as 20
o Develop acquire sites of strategic importance and high growth potential that
will enable them to secure better commercial terms from users and attract
more number of tenants Infrastructure provisioning fees rentals for sites are
882019 Major Project (Ramit)
httpslidepdfcomreaderfullmajor-project-ramit 5362
44
extremely location sensitive There is a potential to acquire more land than
that of required to capitalize on the increase in real estate prices
o Develop sites in a cost effective manner ABC would consider purchasing
land only for those GBS sites which have sufficient demand and arestrategically located Else for most of its sites land will be leasehold As
shown above returns (PIRR and EIRR) are very sensitive to capital costs In
the worst case scenario project IRR can be as low as 15 whereas it can as
high as 27 in the best case scenario
o Negotiate and secure long term contracts with good credit quality users with
built in price escalation provisions to mitigate financing risk
o Leverage and secure long term financing at attractive terms and involve in
active treasury management to keep low financing cost Results of the
sensitivity analysis indicate that equity IRR can be as high as 60 foe a
moratorium period of 4 years and interest rate of 10
o Minimize working capital requirements
o Maintain low operating and administration expense
o Secure better OampM margins from operators and retain a healthy share of it in
ABC
o Maintain high service standards and build strong customer relationships
The business would have the potential to capture new revenue opportunities
around the existing assets As demand for towers is expected to grow and as
operators migrate to speedier next-generation wireless technologies they will
need the towers and associated passive infrastructure to transmit their new
services in addition to their existing offerings In addition to increasing capacity
and coverage and improving the quality of their networks cellular serviceproviders are deploying high speed data networks driving incremental demand of
sites The business therefore has potential upsides in the form of adding
customers (tenants) in wireless broadband third generation (ldquo3Grdquo) and wireless
data capabilities and also other incremental value propositions by way of hosting
882019 Major Project (Ramit)
httpslidepdfcomreaderfullmajor-project-ramit 5462
45
Billboards Hoardings etc in some of the high visible sites owned and maintained
by it
Based on the assumptions and subject to satisfactory resolution of the key risks
factors project cash flows will be able to meet debt service obligations
This business model is a lucrative investment option for a private equity player
because valuation of each site will increase in the coming years due to
improvement in market conditions increase in the value of land and increase in
the demand for passive infrastructure in rural and semi-urban areas
882019 Major Project (Ramit)
httpslidepdfcomreaderfullmajor-project-ramit 5562
46
REFERENCESAnjan G V A amp N M (2009) telecom infrastructure industry in india GurgaonICRA
Bessler W Norsworthy J amp Shusterman T (2001 12 1) Mergers in the UStelecommunications industry and market valuationeffects IEEE p 288
COAI (2009 march 14) Subscriber Figures Retrieved march 14 2009 fromCOAIcom httpwwwcoaicomstatisticsphp
IDA (2009 march 23) Highlights Retrieved march 23 2009 from idagovsghttpwwwidagovsghomeindexaspx
K R (2008) Time for new business model Delhi Cybermedia
MAXIS (2009 march 8) the malaysian telecommunications industry Retrieved march9 2009 from maxiscommyhttpwwwmaxiscommypersonalabout_usinvestorprospectusprospectus4pdf
P J amp Lisa A (2009) Stimulas spending and American Telecom Industry USACoracle group
PwC (2009 march 12) Indian Telecom Industry Gurgaon Harayana IndiaRamachanran (2009 march 1) Investment in Telecom Infrastructure sector (M RInterviewer)
Vogelsang I (2002) The German Telecommunications Reform Verein fuumlr Socialpolitik (p 26) Innsbruck Boston Press
882019 Major Project (Ramit)
httpslidepdfcomreaderfullmajor-project-ramit 5662
47
ANNEXURES
ANNEXURE 1 Key Assumptions
The occupancy of each site by single two three operators for green-field sites is assumed
to be as follows
Table 91 Expected Tenancy RatiosFY 10 FY 11 FY 12 FY 13 FY 14 FY15
GBT Tenant
Ratio 150 150 170 170 170 200
Single Operator 50 50 30 30 30 0
Two Operator 50 50 70 70 70 100
RTT Tenant
Ratio 170 170 200 200 200 250
Single Operator 30 30 0 0 0 0
Two Operator 70 70 100 100 100 50
Three Operator 0 0 0 0 0 50
From FY 15 onwards tenancy ratio of 2 and 25 for GBT and RTT sites is cons idered
882019 Major Project (Ramit)
httpslidepdfcomreaderfullmajor-project-ramit 5762
48
Capital costs related assumptions are tabulated below
Table 92 GBT and RTT Capital Cost
The lease rentals for RTT sites are reimbursed from the operators and therefore have not
been factored in the revenues as well as the expense For GBT sites land purchase cost of
035 millions assumed which has been escalated by 6 annually to determine the
salvage value of assets
GBT Capital Costs
Million
INR
Delivery cost of Ground Based
Tower (GBT)063
Delivery cost of Generator 030
Civil Work 040Shelter 012
Electrical Works 030
Other Equipments (UPS Battery
etc)045
Construction cost 045
Land 035
Contingency amp Financial Charges 035Total cost 335
RTT Capital Costs
Million
INR
Delivery cost of Roof Top
Tower (RTT) 030
Delivery cost of Generator 020
Civil Work 020Shelter 012
Electrical Works 030
Other Equipments (UPS
Battery etc) 030
Construction cost -
Land -
Contingency amp FinancialCharges 008
Total cost 150
882019 Major Project (Ramit)
httpslidepdfcomreaderfullmajor-project-ramit 5862
49
Ope rating costs related assumptions are tabulated below
Table 93 Operating CostsOperating Costs
Security Sentries (INRMonth) 4000
Supervisors (INRMonth) 6000
Cluster Manager One for Fifty Towers (INRMonth) 15000
Annual increase 500
Number of Security Sentries per tower 300
Number of supervisors per tower 010
Number of C luster manager per tower 002
Fixed Expenses
Selling amp Maintenance (INRMonth) 4000000
Annual Escalation 5
Administration overhead (INRMonth) 10000000Annual Escalation 7
AMC Cost of Generator 15 (cost of generator)
Annual Escalation (AMC) 3
For RTT sites security sentries are not required because it will be the responsibility of
the site owner A supervisor will for every 10 sites and a cluster manager for every 50
sites will be required
882019 Major Project (Ramit)
httpslidepdfcomreaderfullmajor-project-ramit 5962
50
Table 94 Long term debtInterest Rate 125 per annum
Moratorium 2 years
Repayment Period 8 years
Tariff related assumptions and date of operations are tabulated below
Table 95 GBT and RTT Tariff Table 96 Life of the projectTariff Plan
Tariff (INRMonth)
No of
operators GBT RTT
1 28000 18000
2 22000 14000
3 0 12000
Annual
increase 3 3
Commercial Operation Date 1-Aug-09
Quarter Ending 30-Sep-09
FY ending COD 31-Mar-10
Project life years 15
End of commercial
operations31-Aug-24
Quarter ending commercial
operations30-Sep-24
FY ending comme rcial
operations31-Mar-25
882019 Major Project (Ramit)
httpslidepdfcomreaderfullmajor-project-ramit 6062
51
Annexure 2 Profit amp Loss accountsTable 97 Profit amp loss account statement
Income Statement (MNINR)Year ending Mar-10 Mar-11 Mar-12 Mar-13 Mar-14 Mar-15
RevenueGBT 406350 28811 89080 197447 379409 527015Operator Fees (GBT) 1411 10004 30678 67998 130664 179664RTT 1209 8575 27269 60443 116146 164264
Operator Fees (RTT) 440 3121 9739 21587 41481 56466Net Revenue 7124 50511 156766 347476 667700 927410
Expenses
VariableSecurity Sentries 1355 9790 28339 64033 125433 158238Supervisors 097 699 2024 4574 8959 11303Cluster Manager 048 350 10 12 2287 4480 5651AMC Cost of Generator 450 3013 7877 16719 31148 54541Sub-total 1950 13852 39252 87612 170021 229734
Fixed
Selling amp Maintenance(INRMonth) 032 050 053 056 058 061
Administration overhead(INRMonth) 080 128 137 147 157 168
Sub-total 112 179 190 203 216 230
EBITDA 5062 36480 117324 259661 497464 697447
Interest on LT loan - - 7341 31200 77479 156198Interest on ST loan - 021 060 130 245 361
EBDT 5062 36459 109923 228331 419739 540888Depreciation 2439 12769 35917 77162 142925 174006
EBT 2624 23691 74006 151169 276814 366881Income Tax 170 4233 14536 29073 53547 77634
PAT 2454 19458 59470 122096 223267 289247
882019 Major Project (Ramit)
httpslidepdfcomreaderfullmajor-project-ramit 6162
52
Annexure 3 Balance sheet
Table 98 B alance sheetsYearend Balance Sheet (MNINR)Year ending Mar-10 Mar-11 Mar-12 Mar-13 Mar-14 Mar-15
AssetsGross Block 75742 328216 833164 1716823 3105430 3105430Accumulated depreciation 2439 15208 51125 128287 271212 445218Net Block 73303 313009 782040 1588536 2834219 2660212Net Working Capital 064 241 620 1335 2515 3707Cash Balance 12979 72089 216513 488856 947982 1294734Total Assets 86346 385339 999172 2078727 3784715 3958653
LiabilitiesEquity 25168 108980 276604 569947 1030914 1030914Reserves amp Surplus 2454 21912 81381 203477 426745 715992Long term Debt 58725 254286 640722 1304302 2325171 2208967WC Borrowings - 161 465 1001 1886 2780Total Liabilities 86346 385339 999172 2078727 3784715 3958653
882019 Major Project (Ramit)
httpslidepdfcomreaderfullmajor-project-ramit 6262
Annexure 4 Cash flow statement
Table 99 Cash flow statements
Year ending Mar-10 Mar-11 Mar-12 Mar-13 Mar-14 Mar-15
InflowsPAT 2454 19458 59470 122096 223267 289247Depreciation 2439 12769 35917 77162 142925 174006Tax adjusted interest - 014 4959 20991 52076 104895Release of WC - - - - - -Salvage Value - - - - - -Sub-Total 4893 32241 100345 220249 418268 568148
OutflowsCapex 75742 252474 504948 883659 1388607 -Change in WorkingCapital 064 177 379 715 1180 1192
Sub-Total 75806 252651 505327 884374 1389787 1192
UFCF (70913) (220410) (404982) (664125) (971519) 566956LFCF (70913) (220424) (409940) (685116) (1023595) 462062
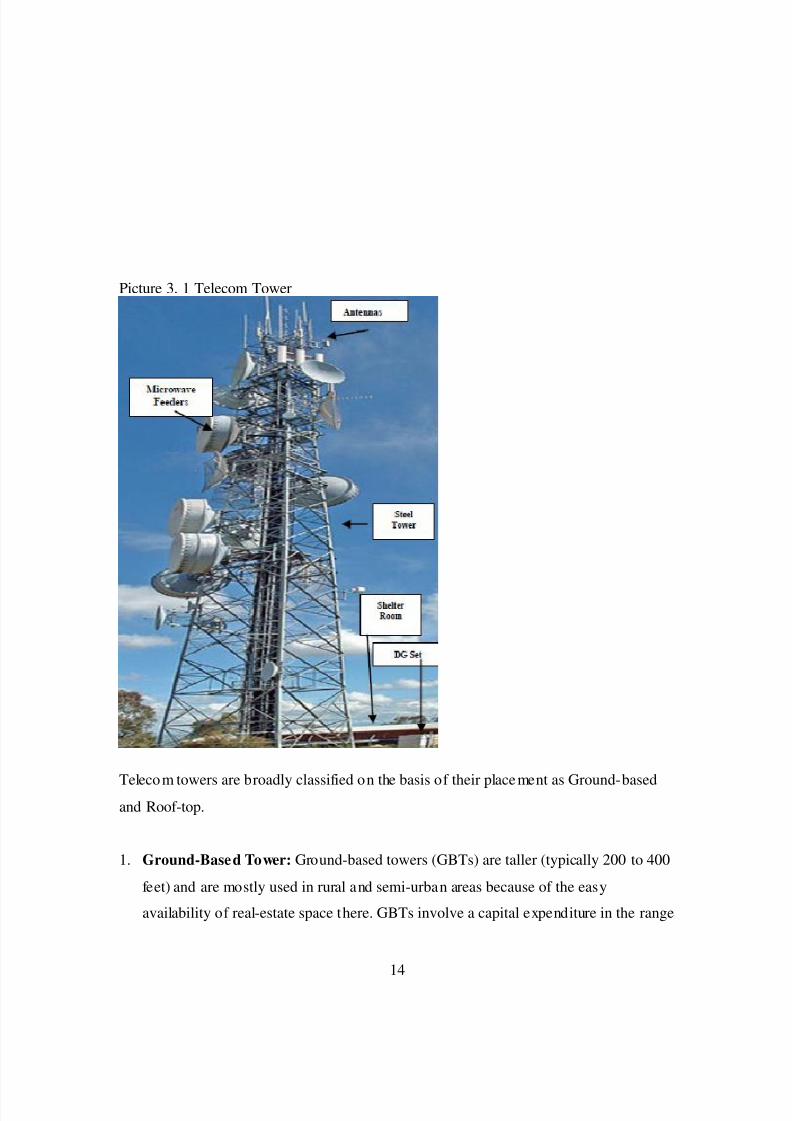
882019 Major Project (Ramit)
httpslidepdfcomreaderfullmajor-project-ramit 2362
14
Picture 3 1 Telecom Tower
Telecom towers are broadly classified on the basis of their placement as Ground-basedand Roof-top
1 Ground-Based Tower Ground-based towers (GBTs) are taller (typically 200 to 400
feet) and are mostly used in rural and semi-urban areas because of the easy
availability of real-estate space there GBTs involve a capital expenditure in the range
882019 Major Project (Ramit)
httpslidepdfcomreaderfullmajor-project-ramit 2462
15
of Rs 3 to 4 million depending on the height of the tower land prices etc
(Ramachanran 2009)
2 Roof-Top Tower (RTT) Roof-top towers (RTTs) are generally placed on the roofsof high-rise buildings They are shorter (than GBTs) and more common in urban and
highly populated areas where there is paucity of real-estate space Typically these
involve a capital expenditure of Rs 15 to 2 million (Ramachanran 2009)
The height of a telecom tower determines the number of antennas that can be
accommodated which in turn determines the capacity of the towers apart from factors
such as location and geographica l conditions (wind speeds type of terrain etc)
35 Telecom Infrastructure- Domestic market
In India there are broadly two kinds of operators in the tower infrastructure industry
Tower infrastructure subsidiaries
Reliance Infratel Limited
Bharti Infratel Limited
Indus Towers Limited
Wireless TT Info Services Limited (WTTIL)
Independent tower infrastructure companies (ITICs)
GTL Infrastructure
Xcel Telecom
Essar Telecom Infrastructure
Aster Infrastructure
Bharat Telemast
882019 Major Project (Ramit)
httpslidepdfcomreaderfullmajor-project-ramit 2562
16
These companies have their business model based largely on contract or anticipatory
approaches Under the contract approach tower companies set up tower sites going by
the requirements of the telecom operators and the terms of the contract are specified
beforehand in the MSAs signed by the two parties Under the anticipatory approachhowever tower companies set up tower infrastructure at sites with reasonable demand
potential and subsequently invite telecom operators to set up their network on these
towers The latter model involves higher business risks as the tower company may not be
able to achieve reasonable tenancy for its tower infrastructure and at profitable terms
BPTL proposes to follow contract approach for its business model
36 Telecom Infrastructure market- Competitive landscape
Figure 3-5 Telecom Infrastructure Market Players
038058154
365692
10381692
26923269
0 20000 40000 60000 80000 100000
Aster InfrastructureAmerican Towers
Essar Telec om Infrastructure
GTL In frastructureWi reles s TT In fo Services Limited
Bharti Infratel Limited
Reli anc e Communications Limitedrsquos
OthersInd us To wers Limited
Number of Towers
Market Players
Source Telecom Regulatory Authority of India and ICRANote Others include tower por tfolios of BSNL MTNL Sistema Shyam Teleservices Aircel etc
In Indian Telecom Infrastructure market competition has intensified significantly with
several players spinning of their tower portfolio and independent operators expanding
their operations
882019 Major Project (Ramit)
httpslidepdfcomreaderfullmajor-project-ramit 2662
17
Bharti Airtel Limited Reliance Communications Limited and Tata Teleservices Limited
have hived off their tower assets into separate tower infrastructure subsidiaries namely
Bharti Infratel Limited Reliance Infratel Limited and Wireless TT Infoservices Limited
respectively Also Bharti Infratel Limited together with Vodafone Essar Limited and IdeaCellular Limited in a joint- venture agreement has created Indiarsquos largest tower
infrastructure company ndash Indus Towers Limited which has an estimated portfolio of
around 88000 towers (Anjan V amp N 2009) Whereas in past few years number of
independent tower infrastructure companies have ventured into the domestic telecom
tower industry These include GTL Infrastructure Limited Essar Telecom Infrastructure
Limited Xcel Telecom Private Limited (American Towers) Tower Vision India Private
Limited Aster Infrastructure Private Limited TVS Interconnect Systems Limited etc
Figure 3-6 Telecom Tower Growth Scenario
0
100
200
300
400
500
600
700
2008 2009 2010 2011 2012 T e
l e c o m
T o w e r s
( T h o u s a n
d s )
Source Telecom Regulatory Authority of IndiaAssumptions Subscriber growth rate of 28 till 2011-12
1400 subscribe per site
As shown above it is expected that in next 4-5 years there will be a requirement of
additional 85000 towers (both GBT and RTT) each year to meet the subscriber base of
800 million by 2011-12 (PwC 2009) This shows that huge investment have to be made
in Indian telecom Infrastructure sector in near future Now since both passive and active
882019 Major Project (Ramit)
httpslidepdfcomreaderfullmajor-project-ramit 2762
18
infrastructure sharing is a llowed (except spectrum) Independent service providers will be
benefited Increase in subscriber base introduction of new technologies like 3G Wi-max
etc and increase in market healthy market competition in telecom services sector will
drive the growth in telecom infrastructure sector
882019 Major Project (Ramit)
httpslidepdfcomreaderfullmajor-project-ramit 2862
19
4 BUSINESS PLAN
41 Passive Infrastructure
Mobile networks have base stations (or cell sites) which have active and passive
infrastructure components Active components include the antenna trans-receivers
switches feeder cables Node B and microwave radio equipments Passive (or non-
electronic) components include the land tower shelter air-conditioning equipment
diesel electric generator battery electrical supply technical premises and easements
pylons etc Passive infrastructure in a mobile network essentially involves acquiring land
setting up towers and electrical and civil works that needs to be in place before operators
can install the active infrastructure which brings mobile services to the consumers In atypical cell site build-out almost 65 of the total cost is attributed to passive
infrastructure and 35 to active infrastructure
42 Infrastructure Sharing
Mobile operators are required to setup more and more BTS (cell) sites due to the
exponential growth of mobile subscribers in India (currently growing at almost 15 4
million subscribers a month) and limited availability of spectrum B and C Circles (wheretraffic density may not be as high as metros and Circle A) are expected to drive future
subscriber growth and requirements for cell sites will be higher to ensure greater
coverage
However creating new infrastructure by each operator separately leads to d uplicat ing
huge capital investments It also contributes to mushroom growth of telecom towers and
deteriorating skylines in urban areas which has already led to some local municipal and
state governments to regulate and restrict the erection of new mobile towers
The continued pressure on cellular tariffs higher infrastructure costs for network
deployment particularly in semi-urban and rural areas and compelling need to reduce
4 As published in ET 8 th May 09 Edition
882019 Major Project (Ramit)
httpslidepdfcomreaderfullmajor-project-ramit 2962
20
time to market for network roll outs have led operators to share and even outsource their
infrastructure requirements from third party infrastructure providers like BPTL GTL and
Indus towers It promotes capital efficiency as it allows more than one service provider to
leverage and ride o n common infrastructure In its simplest form it involves two or moreoperators jointly using the common passive infrastructure in a cell site While viewed
largely as a measure to reduce capital and operating expense such sharing also leads to
improvement of service q uality (by ensuring site space for service providers and reducing
black spots) and the environment (by reducing number of cell sites and towers)
In outsourcing operators take passive infrastructure and tower space from third party
infrastructure companies on a monthly rental basis to host their radio and transmission
equipments Outsourcing provides significant benefits to operators It enables them tosave on capital expenses (it actually converts capital expense into operating expense in
the form of lease rentals) and focus on their core activities of sales marketing and
branding while leaving the cumbersome task of managing the site development process
and site operation and maintenance to third parties who exclusively deal with such
activities
The concept of passive infrastructure sharing is increasingly gaining market acceptancein India So far it has been largely limited to bilateral sharing between operators in the
form of barter where the operators split the site related CAPEX and OPEX costs The
available information suggests that about 25 of the existing 90000 tower sites in India
are currently being shared for passive infrastructure predominantly in rural areas and
small towns
43 Introduction to the business
BPTL is an Infrastructure Provider company that builds owns operates and maintains
passive network infrastructure on a shared basis for mobile telecom operators and ITES
providers Its objective is to provide network design and planning network deployment
882019 Major Project (Ramit)
httpslidepdfcomreaderfullmajor-project-ramit 3062
21
network operations amp maintenance infrastructure management application management
and professional services to teleco m operators and enterprises
The company is planning to raise capital in the form of equity and debt to start its
operation by Aug 09 ABC rsquos vision is to provide world class managed infrastructure ampallied services to the service providers to optimize their service delivery capability In the
initial years of operation the company will focus on telecom sector with almost 100 of
its proposed capital expenditure till FY 14 earmarked for developing and owning passive
infrastructure for sharing among mobile service providers
44 Business Proposal
ABC will provide passive telecom infrastructure on build own operate (BOO) basis inboth ground based (GBS) as well as roof-top sites (RTS) It will undertake full range of
responsibilities in building owning and maintaining the sites and will serve as a single
window one-stop-shop provider of infrastructure services Typical responsibilities are
summarized below
Site planning keeping in view the network rollout plans of prospective customers
Site acquisition including entering into long-term agreements with land owners
Obtaining of necessary regulatory approvals
Erect ion and commissioning of tower and allied equipment
Provision of support services such as back-up power air-conditioning and
security
Provision of turnkey solutions to telecom companies such as sourcing of
equipment testing and maintenance
882019 Major Project (Ramit)
httpslidepdfcomreaderfullmajor-project-ramit 3162
22
Bharat Telemast Private Limited will identify the sites required for setting up the Passive
infrastructure by first of all getting a commitment from one operator who is called as
ldquoAnchor Operatorrdquo Then Bharat Telemast will go ahead to lease (or) buy out the site as
appropriate and commences construction of the cellular sites But the Cellular site will betypically designed for three to four operators While construction is in progress the
marketing team will work towards getting the second and third operator But care will be
taken in such a way that at least two operators are available at the time of completion of
construction
45 Sources of revenue
1 Infrastructure Provisioning Fees ndash fee paid by the operators on a monthly basisWith annual escalation
2 Site lease rental ndash Paid at actual on a monthly basis
3 Operations and maintenance charges Paid on a monthly basis
4 The contract also provides a fixed annual escalator
46 Attractiveness of business model
Stable and predictable cash flow business Once a tower asset is rented out it
usually generates a stable and predictable cash flow in the form of tower rentals
from occupants over the term of the MSA between the two parties
Low working capital requirement ABC rsquos business model is also characterized
by low working capital requirements as most of the operating expenses (such aselectricity and fuel and other variable operating expenses) are reimbursable by the
tenants on actual basis Moreover BPTL is may also be able to get rentals for the
towers in advance and also obtain better credit terms from their suppliers thus
further improving their working capital cycle
882019 Major Project (Ramit)
httpslidepdfcomreaderfullmajor-project-ramit 3262
23
High incremental profitability The operating costs associated with this
business are largely fixed in nature Thus each increment in tenancy is
accompanied by a minimal increase in costs This leads to a more thanproportionate increase in profits for every increase in occupancy
Reduction in capital investments due to present market conditions Due to
present market situation average capital requirement for RTT and GBT sites have
dropped from 2 million and 4 million to 15 million and 33 million ABC wishes
to grab this opportunity which will result in competitive advantage in near future
Extensive usage While on an average a GSM BTS can handle around 100-
1100 subscribers but in the case of high usage areas the figure can be as low as
600-700 subscribers which means a larger number of cell sites would be required
for the same area Moreover the country has the problem of spectrum scarcity
which increases the requirement of towers to maintain a reasonable leve l of
service quality
New entrants Many operators including Vodafone Essar Limited Idea Cellular
Limited Aircel Cellular Limited and Sistema Shyam Teleservices Limited have
received licenses as well spectrum in new circles which would enable them to
become pan-India operators in the next one-two years Also new licenses have
been issued to new players such as Unitech Swan Telecom and S Tel Limited
Given the significant expansion plans of new entrants over the medium term and
the need for them to optimize investments in order to maintain returns demand
for towers is expected to report a sharp increase
Shorter rollout time Indian telecom industry is highly competitive and doing
business for new entrant may not be easy Shorter network-rollout time would be
a critical success factor for the new entrants and a longer rollout time could meanloss of substantial market share to other operators Tower companies allow
players to start operations in a particular region just by installing their electronics
on the ready-to-use towers thereby significantly shortening the rollout time
New technologies 3G services are already launched in the country and to
augment their services various operators plan to launch Wi-Max services as soon
882019 Major Project (Ramit)
httpslidepdfcomreaderfullmajor-project-ramit 3362
24
as they receive additional spectrum from Government This would further
increase the demand for sharing of passive infrastructure
47
Expansion Schedule
BPTL would rollout both RTT and GBT sites of which the RTT sites GBT sites
normally would have a tower height of 50 meters or 60 meters depending on the need for
additional height for installation of microwave antennae based on the location of the site
and number of tenants on the cell site Details of BPTLrsquos expansion plan are summarized
below
Table 41 Expansion PlanExpansion Schedule 2009-10 2010-11 2011-12 2012-13 20013-14
GBT
Addition 210 700 1400 2450 3850
Total 210 910 2310 4760 8610
RTT
Addition 90 300 600 1050 1650
Total 90 390 990 2040 3690
48 Proposed Services
As indicated earlier ABC proposes to provide passive telecom infrastructure on a
sharing co-location basis to cellular operators The sites would either be Ground Based
Sites (GBS) or Roof Top Sites (RTS) As the sites are meant for co-location of the active
components of two to three operators they would be built to either 2-Tenant or 3-Tenant
specifications
The different components of the passive infrastructure facility and the related services
that would be offered by BPTL to the operators are as under
Infrastructure provisioning comprising
882019 Major Project (Ramit)
httpslidepdfcomreaderfullmajor-project-ramit 3462
25
Communication tower built to host multiple antennae
Weather-proof communication shelter with air-conditioning and power backup
arrangement
Diesel generating set and battery bank for power backup
A mobile standby generator to act as backup in case o f breakdown
Warehousing facility
Infrastructure operations and maintenance including
Regular operations and maintenance of the facility
Security of all the equipments at the site at all timesA dedicated team of technicians for a group of 40-50 sites to ensure effect ive and
efficient functioning of the components at all times
49 Proposed Organizational Structure
A senior management team will work under the leadership of the ldquoChief Operations
Officerrdquo who will be responsible for smooth implementation of proj ect activities He willalso assist the managing director in marketing This team will coordinate with Stallion
Telecom Pvt Ltd which will take over the role of procuring Capital Equipments
Senior management will consists of project manager infrastructure manager commercial
manager and head (legal and company affairs Apart from this there will be a requirement
Chief OperatingOfficer
Project Manager Infrastructure
Manager
Commercial
Manager (projects)
Head (Legal and
Company Affairs)
882019 Major Project (Ramit)
httpslidepdfcomreaderfullmajor-project-ramit 3562
26
of security sentries (3 per GBT site) supervisors (one for every 10 sites) and cluster
manager (one for every 50 sites)
Bharat Telemast will carry out the complete Project execution with the assistance of third party ldquoQuality control organizationrdquo and a third party ldquoProject management teamrdquo
Quality control and project management activities will be o utsourced to a third party
882019 Major Project (Ramit)
httpslidepdfcomreaderfullmajor-project-ramit 3662
27
5 METHODOLOGY
The changing face of infrastructure services creates a complex situation which demands
greater understanding of roles of competition regulatory structures and modes of
financing Knowledge of such things is a key decisive factor in building confidence
among investors promoters and government In project finance the project its assets
contract and cash flows are separated from promoter in order to permit credit appraisal
or loan to the project
As part of the financial feasibility analysis a series of related financial statements based
on projected sources and uses of funds during the development and operating phaseproject were created Financial statements consist of expenses associated with
development activities including capital costs like acquisition of land for GBT sites cost
of tower generator shelter batteries etc Most of the data regarding capital costs are
obtained from the promoter of ABC Limited All these capital costs related details are
provided in annexure 1
Assumption regarding depreciation capital structure operating expenses expansion
schedule tenancy ratios tariff or rent operatorrsquos fees and loan amortization schedule are
obtained from professional accountants Promoter and bankers of ABC Limited
Due to unknown factors that could influence the cost of towers or fees associated with
completing the project (soft costs) contingency costs were estimated at 5 of hard and
soft costs respectively If contingency is set too low developers could easily encounter
funding shortfalls upon slight changes in market forces All other costs were estimated
based on talking with industry professionals (Promoters)
A detailed financial model was prepared based on existing accounting standards and
following financial ratios were estimated
882019 Major Project (Ramit)
httpslidepdfcomreaderfullmajor-project-ramit 3762
28
EBITDA margin Profit and loss accounts for the estimated project period (15
Years) were prepared based on which estimated earnings before interests tax
depreciat ion and amortization were calculated for each year Detailed PampL
balance sheet and cash flow statements are provided in annexure 2 3 and 4
EBITDA = Total Revenue ndash (Variable expenses + Fixed Expenses)
EBITDA margin = EBITDA Total Revenue
PAT margin PAT is calculated by subtracting interests pa id on capital debt and
working capital debt depreciation and applicable corporate income tax from
EBITDA
PAT = EBITDA ndash Interest Payable ndash Depreciation ndash Income tax
PAT margin = PATTotal Revenue
Working Capital Working capital requirement is calculated by subtract ing
current liabilities from current assets Current assets are estimated based on 30
days cash requirement and current liabilities are estimated as half of salary
monthly expenses
WC = Current Assets ndash Current Liabilities
UFCF It is defined as the free cash flows available to the firm if the firm has
zero debt liability Purpose of ca lculat ing UFCF for project period is to determinethe project IRR
UFCF = PAT + Depreciation + Interest (tax adjusted) + Release of WC + Salvage
value of the assets ndash CAPEX ndash Change in WC
882019 Major Project (Ramit)
httpslidepdfcomreaderfullmajor-project-ramit 3862
29
LCFF It is defined as the cash floes available to the firm after paying interests on
long term and short term debts
LCFF = UFCF ndash Interest (tax adjusted)
FCFE It is defined as the free cash flow available to equity holders It is
determined to ca lculate equity IRR for equity investors It also includes the tax
benefits which are available as per the Income Tax Act
FCFE PAT + Depreciation + Salvage Value ndash Equity Investment ndash Long term debt
repayment
PIRR Project IRR is defined as the discount rate at which NPV (Net Present
Value) of UFCF is zero It is calculated by using following formula
UFCF 1 (1+PIRR) 0+ UFCF 2 (1+PIRR) 1+ UFCF 3 (1+PIRR) 2+ helliphelliphelliphelliphelliphellip = 0
UFCF 1 = UFCF at the end of first year of operation
UFCF 2 = UFCF at the end of second year of operation
PIRR = Project IRR
EIRR Equity IRR is defined as the discount rate at which NPV of FCFE is zero
It is calculated by using following formula
FCFE1 (1+EIRR) 0+ FCFE 2 (1+EIRR) 1+ FCFE 3 (1+EIRR) 2+ helliphelliphelliphelliphelliphellip = 0
FCFE1 = FCFE at the end of first year of operation
FCFE2 = FCFE at the end of seco nd year of operation
EIRR = Equity IRR
882019 Major Project (Ramit)
httpslidepdfcomreaderfullmajor-project-ramit 3962
30
WACC It is de fined as the percentage of return expected by the investors who
otherwise would have earned some return by investing in some other project
WACC = Cost of Debt (Debt Capital) + Cost of equity (Equity Capital)
882019 Major Project (Ramit)
httpslidepdfcomreaderfullmajor-project-ramit 4062
882019 Major Project (Ramit)
httpslidepdfcomreaderfullmajor-project-ramit 4162
32
62 Funding planAs the telecom sites are rolled out over a 5 year period till FY 2014 investment will be
required for each year ABC Limited will start generating profits from FY 10 only Such
internally generated cash accruals will be ploughed back into the business to meet part of
the project cost Investment required for each year is tabulated below
Table 61 Funding ProposalMillion INR FY 10 FY 11 FY 12 FY 13 FY 14
GBT Tower (Additional) Nos 210 700 1400 2450 3850
RTT Tower (Additional) Nos 90 300 600 1050 1650DE ratio 233 233 233 233 233
Additional CAPEX 83892 279374 558748 977809 1536557
Debt 58725 195562 391124 684466 1075590
Equity 25168 83812 167624 293343 460967
63 Results
Based on assumptions given in Annexure 1 a detailed financial model was preparedResults of the financial model such as PampL account Balance Sheet and cash flow
statements are provided in Annexure 2 3 and 4 Forecasts for the key financial figures for
first five years are provided in the Table below
Forecasts
Table 62 Income StatementMillion INR FY-10 FY11 FY12 FY-13 FY-14
Sales 7124 50511 156766 347476 667700
Cost of sales 1950 13852 39252 87612 170021
Gross 5174 36659 117514 259864 497679
7263 7258 7496 7479 7454
Admin costs 112 179 190 203 216
882019 Major Project (Ramit)
httpslidepdfcomreaderfullmajor-project-ramit 4262
33
Finance cost 0 021 7401 31330 77725
Taxation 170 4233 14536 29073 53547
PAT 2454 19458 59470 122096 223267
As shown in Table above during the expansion period revenue will grow exponentially
In the first year of operation ABC will earn a revenue of INR 7124 million from 300
(210 GBT and 90 RTT) sites with a tenancy ratio of 15 for GBS and 17 for RTS In the
first 2 years of operation the company will not pay any interest on long term debt due to
2 years moratorium period Major cost associated with the project is depreciation due to
which PAT is lower than the operating profits But cash flows to the firm are enough to
result in reasonable returns
Table 63 Balance Shee tYear ending Mar-10 Mar-11 Mar-12 Mar-13 Mar-14
AssetsGross Block 75742 328216 833164 1716823 3105430Accumulated depreciation 2439 15208 51125 128287 271212Net Block 73303 313009 782040 1588536 2834219Net Working Capital 064 241 620 1335 2515Cash Balance 12979 72089 216513 488856 947982
Total Assets 86346 385339 999172 2078727 3784715LiabilitiesEquity 25168 108980 276604 569947 1030914Reserves amp Surplus 2454 21912 81381 203477 426745Long term Debt 58725 254286 640722 1304302 2325171WC Borrowings - 161 465 1001 1886Total Liabilities 86346 385339 999172 2078727 3784715
Note All figures are in Million INR
Table 64 Key financial ratiosMar-11 Mar-12 Mar-13 Mar-14 Mar-15
Revenue Growth 60902 21036 12165 9216 3890EBITDA Growth 62061 22161 12132 9158 4020
PAT Growth 69293 20564 10531 8286 2955
As shown in table above increase in EBITDA is higher than that of revenue This is due
to better operational efficiency of ABCrsquos management and economies of scale S imilarly
882019 Major Project (Ramit)
httpslidepdfcomreaderfullmajor-project-ramit 4362
34
increase in PAT is lesser than that of EBITDA because of high depreciation and interest
expenses
Table 65 Pr ofitability r atios
Mar-11 Mar-12 Mar-13 Mar-14 Mar-15
EBITDA Margin 7222 7484 7473 7450 7520
PAT Margin 3852 3794 3514 3344 3119Return on Net Worth 622 760 769 788 1087
Key profitability ratios are shown in table above Return on net worth in the initial years
is lower because of the ambitious expansion plans of ABC Limited Thereafter return on
net worth increases with increase in PAT
Returns on Investment
Table 66 Financial returnsFinancial Indicators
Project IRR 1813Equity IRR 3609
64 Sensitivity Analysis
A sensitivity analysis has been carried out on the project financials to determine theimpact of key variables on the financial indicators namely
Project IRR
The key variables on which sensitivity analysis have been carried out areCapital expenditure for GBS and RTS1st and 2 nd tenant tariff for GBS1st and 2 nd tenant tariff for RTSTenancy Ratio
Similarly sensitivity analysis has been carried out forEquity IRR
The key variables on which sensitivity analysis have been carried out for EIRR are
Capital structure and interest rate for capital debtRepayment period and moratorium period
882019 Major Project (Ramit)
httpslidepdfcomreaderfullmajor-project-ramit 4462
35
The impact on the financial indicators is shown below
Figure 6-1 Project IRR vs GBT and RTT CAPEX
As shown in Figure 6-1 project IRR is more sensitive to change in CAPEX of RTT sitesas compared to change in CAPEX of GBT sites because tenancy ratio and tariff for RTTsites are higher than those of GBT sites
882019 Major Project (Ramit)
httpslidepdfcomreaderfullmajor-project-ramit 4562
36
Figure 6-2 Project IRR vs GBT Tariff for 1 st tenant (X-axis) and 2 nd tenant (right-hand side)
As shown in Figure 6-2 project IRR varies linearly with GBT tariff In the best casescenario when GBT tariff for 1 st tenant is INR 34000month and GBT tariff for secondtenant is INR 26000month Project IRR is 2101
Figure 6-3 Project IRR vs RTT Tariff for 1 st tenant (X-axis) and 2 nd tenant (right-hand side)
As shown in Figure 6-2 project IRR varies linearly with RTT tariff In the best casescenario when RTT tariff for 1 st tenant is INR 24000month and RTT tariff for second
882019 Major Project (Ramit)
httpslidepdfcomreaderfullmajor-project-ramit 4662
37
tenant is INR 20000month Project IRR is 1932 Project IRR is more sensitivetowards RTT tariff than GBT tariff because in practical business situation RTT siteshave a tenancy ratio of more than two due to which effect of tariff for 1 st tenant almostget nullified after few years
Figure 6-4 Project IRR vs Tenancy ratio for RTT sites (X-axis) and GBT sites
As shown in Figure 6-4 project IRR is very sensitive to tenancy ratio In the best casescenario where GBT sites have a tenancy ratio of 2 and RTT sites have a tenancy ratio of 3 project IRR can be as high as 20
Figure 6-5 Equity IRR vs long term debt interest rate for different leverage level
882019 Major Project (Ramit)
httpslidepdfcomreaderfullmajor-project-ramit 4762
38
As shown in figure 6-5 equity IRR is more sensitive to interest rate on long term debt forhigh level of leverage (lower debt equity ratio) because as the debt equity ratio increasesinterest paid on long term debt also increases significantly
Figure 6-6 Equity IRR vs long term debt repayment period at different level of moratoriumperiods
As shown in figure 6-6 Equity IRR increases with increase in moratorium period anddebt repayment period The variation is from 1654 to 60 for worst case and best casescenarios
882019 Major Project (Ramit)
httpslidepdfcomreaderfullmajor-project-ramit 4862
39
7 RISK ASSESSMENTRisk Mitigation strategyExecution Risk
(Project management landacquisition etc)
Management of ABC has proven expertise in
telecom infrastructure rollout and has executedvarious projects with large telecom operators andMNC vendorsABCrsquos top management team consists of a groupof professionals drawn from leading telecomInfrastructure Company who have immenseexpertise and experience in rolling out telecominfrastructure projects
Market Risk (No entry barriers operators may
share infrastructure betweenthemselves large players withhigh capital may increasecompetition)
India has a huge potential for telecominfrastructure market With increasing
competition falling tariffs and pressure onmargins telecom service providers are beingforced to increase their focus on marketing andreduce their expensesExperienced management healthy capital back-up effective presence in the telecominfrastructure market and value added services atrelatively lesser cost will help ABC to meet theset targets
Financing Risk
(Availability of equity capitalavailability of long term debtinterest rate and moratoriumperiod)
ABC is seeking private equity partner to secure
equity capital Company has already entered intoNDA with 2 major investorsLong term debt at an interest rate of 125 canbe easily arranged because of the credibility of the promoters in the marketMany other similar firms like Indus and GTLhave already secured long term debt for amoratorium period of 2 years Promoters of ABCLimited are confident to secure a long term debtwith a moratorium period of 2 years and apayback period of 8 years
ABC Limited would minimize the workingcapital requirements of its business by securingrentals and operating revenues in advance fromits clients and or by suitably structuring itspayment liabilities to match its cash inflows
Commercial Risk (Tenancy ratio and tariff forGBS and RTS)
ABC would aim to enter into long term contractswith the ldquoanchor tenantrdquo operator and thenrollout the infrastructure so that at least single
882019 Major Project (Ramit)
httpslidepdfcomreaderfullmajor-project-ramit 4962
40
occupancy of each site is ensured at all t imesPromoters will use its knowledge of the businessand its expertise to identify and roll out sites inlocations which have strong multi- tenancypotential to minimize occupancy risk
Revenue Risk (Operating fees may decreasecredit worthiness of the clientsdelay in payment of rentals)
As per the industry sources till now not even asingle operator have dishonored the long termlease contractThe credit risk is diversified as there will bemultiple operatorsABC would aggressively market to get 3G andWiFi broadcasters to use the sites and earnadditional revenues in addition to the assumedrevenue streams
Natural Calamities Risk The Company shall maintain insurance for thesites against these risks and the cost of insurancewill be priced in and passed on to the tenants
882019 Major Project (Ramit)
httpslidepdfcomreaderfullmajor-project-ramit 5062
41
8 CONCLUSION
India is the fastest growing wireless telecom market in the world The continuing
growth in the number of wireless subscribers and MoUs and increasing trend of
outsourcing of business processes to India has led to growing demand for large
investments in the telecom infrastructure in the country
However with increasing competition falling tariffs and pressure on margins
telecom service providers are being forced to increase their focus on marketing
customer acquisitions and branding and minimize their efforts and overheads in
project management and asset acquisition
Further with rising prices of steel cement and real estate the cost of developing
and owning passive infrastructure is increasingly becoming a costly proposition
for most operators and service providers
The compulsion on the part of service providers to reduce their operating costs
and capital expenditure requirements has led to opportunities in passiveinfrastructure outsourcing to independent third party infrastructure providers and
also sharing the infrastructure with other service providers It is expected that
cellular operators will outsource their communications site infrastructure needs as
a means of accelerating access to their markets and preserving capital rather than
constructing and operating their own communications sites and maintaining their
own communications sites service and deve lopment capabilities
Passive infrastructure is highly capital intensive and an integral part of the cellular
service providersrsquo networks Yet being a simple and low technology asset it is
amenable to outsourcing and sharing By transferring the responsibility of
ownership development and maintenance of passive infrastructure service
882019 Major Project (Ramit)
httpslidepdfcomreaderfullmajor-project-ramit 5162
42
providers have an opportunity to transfer a substantial part of their business risk to
third parties
Most telecom operators are facing capacity constraints on their networksCoverage obligations increasing pressure to improve network quality and
competition has led to aggressive roll out plans by existing cellular operators
Installation of cell sites has become a cumbersome process as there are a number
of clearances required and involves labor-intensive micro management
Availability of ready infrastructure from third party providers would enable the
operators to reduce their time to market and accelerate their access to their
customers Cellular service providers generally want to move quickly when
adding more sites and co-location on an existing site is always faster than
building
Ownership and maintenance of telecom towers and other infrastructure by third
parties is an established practice in developed nations like USA and is
increasingly gaining market acceptance in India
The Indian government is seriously considering promoting the infrastructure
sharing route between the telecom operator and private players to achieve future
national tele-density targets and improve rural telecom penetration
ABC being an independent entity with no business conflicts with other service
providers in the telecom space will be best positioned and have an early mover
advantage to capitalize on this emerging opportunity
Further the task of operating and maintaining the passive infrastructure in the cell
is increasingly becoming a cumbersome exercise for the service providers to
handle ABCrsquos composite offering to build passive infrastructure for the cellular
operators and also operate and maintain them will provide a turnkey solution to
address the infrastructure needs of the service providers
882019 Major Project (Ramit)
httpslidepdfcomreaderfullmajor-project-ramit 5262
43
The business model proposed to be followed by ABC is fairly simple with stable
and predictable cash flows as is the case with the business model of the tower
renting companies in USA Most contracts are long term for a period 10 or moreyears with annual price escalators generally ranging from 3 to 4 However
wireless carriers normally tend to renew rentals because suitable alternative sites
may not exist or be available and repositioning a site in a carrierrsquos network is
expensive and may adverse ly affect network quality
Site ownership and operations is a ldquoscalerdquo business operating administration
marketing expenses etc do not rise as quickly as revenues when portfolios are
expanded Incremental operating costs associated with adding wireless tenants to
a communications site are minimal Therefore as additional tenants are added to a
site the substantial majority of incremental revenue contributes to margin
expansion Most tower companies have high EBITDA margins as may be seen
from the financial indicators of some of the tower rental companies in USA
It is expected that site location and capacity price and quality of service and
successful execution of contracts will be the most significant competitive factors
in this business
ABCrsquos revenue and returns on investment will be primarily driven by its ability
to
o Increase the utilization of the space and infrastructure capacity owned by it by
increasing the number of tenants per site and renting out to maximum number
of users As discussed above return on capital employed (PIRR and EIRR) arevery sensitive to tenancy ratio In worst case scenario project IRR can be as
low as 8 and in the best case scenario it can be as high as 20
o Develop acquire sites of strategic importance and high growth potential that
will enable them to secure better commercial terms from users and attract
more number of tenants Infrastructure provisioning fees rentals for sites are
882019 Major Project (Ramit)
httpslidepdfcomreaderfullmajor-project-ramit 5362
44
extremely location sensitive There is a potential to acquire more land than
that of required to capitalize on the increase in real estate prices
o Develop sites in a cost effective manner ABC would consider purchasing
land only for those GBS sites which have sufficient demand and arestrategically located Else for most of its sites land will be leasehold As
shown above returns (PIRR and EIRR) are very sensitive to capital costs In
the worst case scenario project IRR can be as low as 15 whereas it can as
high as 27 in the best case scenario
o Negotiate and secure long term contracts with good credit quality users with
built in price escalation provisions to mitigate financing risk
o Leverage and secure long term financing at attractive terms and involve in
active treasury management to keep low financing cost Results of the
sensitivity analysis indicate that equity IRR can be as high as 60 foe a
moratorium period of 4 years and interest rate of 10
o Minimize working capital requirements
o Maintain low operating and administration expense
o Secure better OampM margins from operators and retain a healthy share of it in
ABC
o Maintain high service standards and build strong customer relationships
The business would have the potential to capture new revenue opportunities
around the existing assets As demand for towers is expected to grow and as
operators migrate to speedier next-generation wireless technologies they will
need the towers and associated passive infrastructure to transmit their new
services in addition to their existing offerings In addition to increasing capacity
and coverage and improving the quality of their networks cellular serviceproviders are deploying high speed data networks driving incremental demand of
sites The business therefore has potential upsides in the form of adding
customers (tenants) in wireless broadband third generation (ldquo3Grdquo) and wireless
data capabilities and also other incremental value propositions by way of hosting
882019 Major Project (Ramit)
httpslidepdfcomreaderfullmajor-project-ramit 5462
45
Billboards Hoardings etc in some of the high visible sites owned and maintained
by it
Based on the assumptions and subject to satisfactory resolution of the key risks
factors project cash flows will be able to meet debt service obligations
This business model is a lucrative investment option for a private equity player
because valuation of each site will increase in the coming years due to
improvement in market conditions increase in the value of land and increase in
the demand for passive infrastructure in rural and semi-urban areas
882019 Major Project (Ramit)
httpslidepdfcomreaderfullmajor-project-ramit 5562
46
REFERENCESAnjan G V A amp N M (2009) telecom infrastructure industry in india GurgaonICRA
Bessler W Norsworthy J amp Shusterman T (2001 12 1) Mergers in the UStelecommunications industry and market valuationeffects IEEE p 288
COAI (2009 march 14) Subscriber Figures Retrieved march 14 2009 fromCOAIcom httpwwwcoaicomstatisticsphp
IDA (2009 march 23) Highlights Retrieved march 23 2009 from idagovsghttpwwwidagovsghomeindexaspx
K R (2008) Time for new business model Delhi Cybermedia
MAXIS (2009 march 8) the malaysian telecommunications industry Retrieved march9 2009 from maxiscommyhttpwwwmaxiscommypersonalabout_usinvestorprospectusprospectus4pdf
P J amp Lisa A (2009) Stimulas spending and American Telecom Industry USACoracle group
PwC (2009 march 12) Indian Telecom Industry Gurgaon Harayana IndiaRamachanran (2009 march 1) Investment in Telecom Infrastructure sector (M RInterviewer)
Vogelsang I (2002) The German Telecommunications Reform Verein fuumlr Socialpolitik (p 26) Innsbruck Boston Press
882019 Major Project (Ramit)
httpslidepdfcomreaderfullmajor-project-ramit 5662
47
ANNEXURES
ANNEXURE 1 Key Assumptions
The occupancy of each site by single two three operators for green-field sites is assumed
to be as follows
Table 91 Expected Tenancy RatiosFY 10 FY 11 FY 12 FY 13 FY 14 FY15
GBT Tenant
Ratio 150 150 170 170 170 200
Single Operator 50 50 30 30 30 0
Two Operator 50 50 70 70 70 100
RTT Tenant
Ratio 170 170 200 200 200 250
Single Operator 30 30 0 0 0 0
Two Operator 70 70 100 100 100 50
Three Operator 0 0 0 0 0 50
From FY 15 onwards tenancy ratio of 2 and 25 for GBT and RTT sites is cons idered
882019 Major Project (Ramit)
httpslidepdfcomreaderfullmajor-project-ramit 5762
48
Capital costs related assumptions are tabulated below
Table 92 GBT and RTT Capital Cost
The lease rentals for RTT sites are reimbursed from the operators and therefore have not
been factored in the revenues as well as the expense For GBT sites land purchase cost of
035 millions assumed which has been escalated by 6 annually to determine the
salvage value of assets
GBT Capital Costs
Million
INR
Delivery cost of Ground Based
Tower (GBT)063
Delivery cost of Generator 030
Civil Work 040Shelter 012
Electrical Works 030
Other Equipments (UPS Battery
etc)045
Construction cost 045
Land 035
Contingency amp Financial Charges 035Total cost 335
RTT Capital Costs
Million
INR
Delivery cost of Roof Top
Tower (RTT) 030
Delivery cost of Generator 020
Civil Work 020Shelter 012
Electrical Works 030
Other Equipments (UPS
Battery etc) 030
Construction cost -
Land -
Contingency amp FinancialCharges 008
Total cost 150
882019 Major Project (Ramit)
httpslidepdfcomreaderfullmajor-project-ramit 5862
49
Ope rating costs related assumptions are tabulated below
Table 93 Operating CostsOperating Costs
Security Sentries (INRMonth) 4000
Supervisors (INRMonth) 6000
Cluster Manager One for Fifty Towers (INRMonth) 15000
Annual increase 500
Number of Security Sentries per tower 300
Number of supervisors per tower 010
Number of C luster manager per tower 002
Fixed Expenses
Selling amp Maintenance (INRMonth) 4000000
Annual Escalation 5
Administration overhead (INRMonth) 10000000Annual Escalation 7
AMC Cost of Generator 15 (cost of generator)
Annual Escalation (AMC) 3
For RTT sites security sentries are not required because it will be the responsibility of
the site owner A supervisor will for every 10 sites and a cluster manager for every 50
sites will be required
882019 Major Project (Ramit)
httpslidepdfcomreaderfullmajor-project-ramit 5962
50
Table 94 Long term debtInterest Rate 125 per annum
Moratorium 2 years
Repayment Period 8 years
Tariff related assumptions and date of operations are tabulated below
Table 95 GBT and RTT Tariff Table 96 Life of the projectTariff Plan
Tariff (INRMonth)
No of
operators GBT RTT
1 28000 18000
2 22000 14000
3 0 12000
Annual
increase 3 3
Commercial Operation Date 1-Aug-09
Quarter Ending 30-Sep-09
FY ending COD 31-Mar-10
Project life years 15
End of commercial
operations31-Aug-24
Quarter ending commercial
operations30-Sep-24
FY ending comme rcial
operations31-Mar-25
882019 Major Project (Ramit)
httpslidepdfcomreaderfullmajor-project-ramit 6062
51
Annexure 2 Profit amp Loss accountsTable 97 Profit amp loss account statement
Income Statement (MNINR)Year ending Mar-10 Mar-11 Mar-12 Mar-13 Mar-14 Mar-15
RevenueGBT 406350 28811 89080 197447 379409 527015Operator Fees (GBT) 1411 10004 30678 67998 130664 179664RTT 1209 8575 27269 60443 116146 164264
Operator Fees (RTT) 440 3121 9739 21587 41481 56466Net Revenue 7124 50511 156766 347476 667700 927410
Expenses
VariableSecurity Sentries 1355 9790 28339 64033 125433 158238Supervisors 097 699 2024 4574 8959 11303Cluster Manager 048 350 10 12 2287 4480 5651AMC Cost of Generator 450 3013 7877 16719 31148 54541Sub-total 1950 13852 39252 87612 170021 229734
Fixed
Selling amp Maintenance(INRMonth) 032 050 053 056 058 061
Administration overhead(INRMonth) 080 128 137 147 157 168
Sub-total 112 179 190 203 216 230
EBITDA 5062 36480 117324 259661 497464 697447
Interest on LT loan - - 7341 31200 77479 156198Interest on ST loan - 021 060 130 245 361
EBDT 5062 36459 109923 228331 419739 540888Depreciation 2439 12769 35917 77162 142925 174006
EBT 2624 23691 74006 151169 276814 366881Income Tax 170 4233 14536 29073 53547 77634
PAT 2454 19458 59470 122096 223267 289247
882019 Major Project (Ramit)
httpslidepdfcomreaderfullmajor-project-ramit 6162
52
Annexure 3 Balance sheet
Table 98 B alance sheetsYearend Balance Sheet (MNINR)Year ending Mar-10 Mar-11 Mar-12 Mar-13 Mar-14 Mar-15
AssetsGross Block 75742 328216 833164 1716823 3105430 3105430Accumulated depreciation 2439 15208 51125 128287 271212 445218Net Block 73303 313009 782040 1588536 2834219 2660212Net Working Capital 064 241 620 1335 2515 3707Cash Balance 12979 72089 216513 488856 947982 1294734Total Assets 86346 385339 999172 2078727 3784715 3958653
LiabilitiesEquity 25168 108980 276604 569947 1030914 1030914Reserves amp Surplus 2454 21912 81381 203477 426745 715992Long term Debt 58725 254286 640722 1304302 2325171 2208967WC Borrowings - 161 465 1001 1886 2780Total Liabilities 86346 385339 999172 2078727 3784715 3958653
882019 Major Project (Ramit)
httpslidepdfcomreaderfullmajor-project-ramit 6262
Annexure 4 Cash flow statement
Table 99 Cash flow statements
Year ending Mar-10 Mar-11 Mar-12 Mar-13 Mar-14 Mar-15
InflowsPAT 2454 19458 59470 122096 223267 289247Depreciation 2439 12769 35917 77162 142925 174006Tax adjusted interest - 014 4959 20991 52076 104895Release of WC - - - - - -Salvage Value - - - - - -Sub-Total 4893 32241 100345 220249 418268 568148
OutflowsCapex 75742 252474 504948 883659 1388607 -Change in WorkingCapital 064 177 379 715 1180 1192
Sub-Total 75806 252651 505327 884374 1389787 1192
UFCF (70913) (220410) (404982) (664125) (971519) 566956LFCF (70913) (220424) (409940) (685116) (1023595) 462062
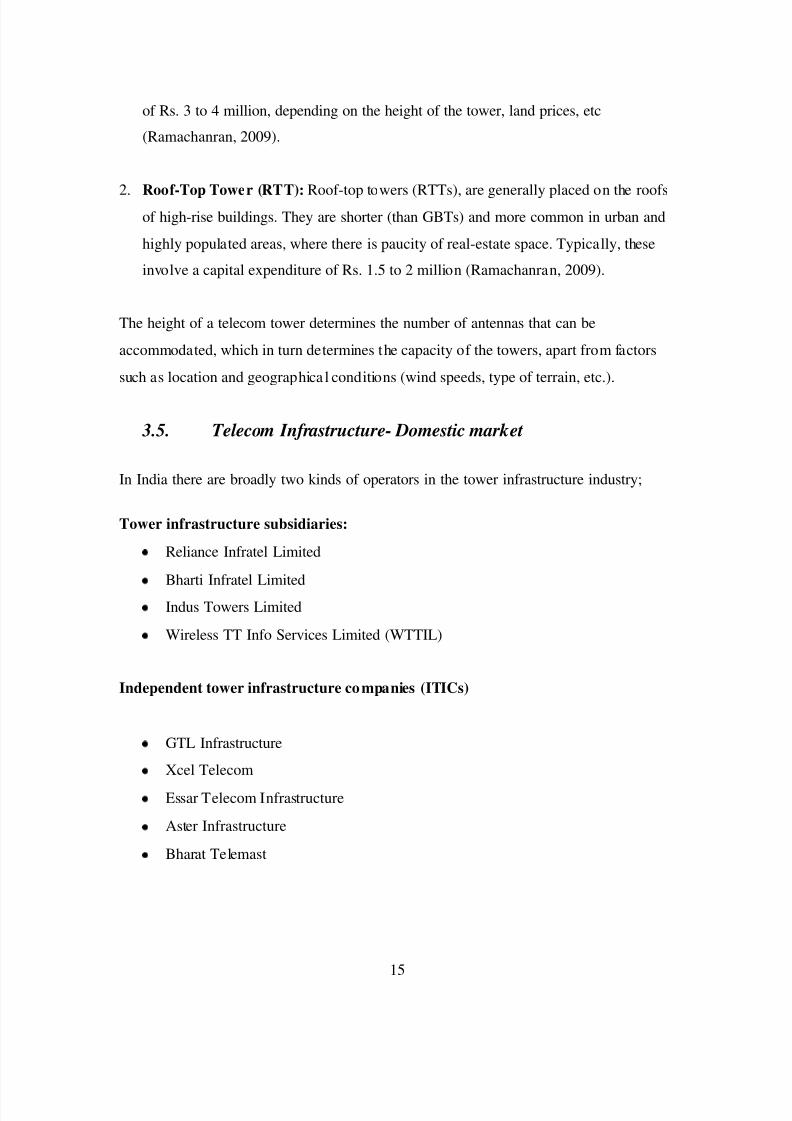
882019 Major Project (Ramit)
httpslidepdfcomreaderfullmajor-project-ramit 2462
15
of Rs 3 to 4 million depending on the height of the tower land prices etc
(Ramachanran 2009)
2 Roof-Top Tower (RTT) Roof-top towers (RTTs) are generally placed on the roofsof high-rise buildings They are shorter (than GBTs) and more common in urban and
highly populated areas where there is paucity of real-estate space Typically these
involve a capital expenditure of Rs 15 to 2 million (Ramachanran 2009)
The height of a telecom tower determines the number of antennas that can be
accommodated which in turn determines the capacity of the towers apart from factors
such as location and geographica l conditions (wind speeds type of terrain etc)
35 Telecom Infrastructure- Domestic market
In India there are broadly two kinds of operators in the tower infrastructure industry
Tower infrastructure subsidiaries
Reliance Infratel Limited
Bharti Infratel Limited
Indus Towers Limited
Wireless TT Info Services Limited (WTTIL)
Independent tower infrastructure companies (ITICs)
GTL Infrastructure
Xcel Telecom
Essar Telecom Infrastructure
Aster Infrastructure
Bharat Telemast
882019 Major Project (Ramit)
httpslidepdfcomreaderfullmajor-project-ramit 2562
16
These companies have their business model based largely on contract or anticipatory
approaches Under the contract approach tower companies set up tower sites going by
the requirements of the telecom operators and the terms of the contract are specified
beforehand in the MSAs signed by the two parties Under the anticipatory approachhowever tower companies set up tower infrastructure at sites with reasonable demand
potential and subsequently invite telecom operators to set up their network on these
towers The latter model involves higher business risks as the tower company may not be
able to achieve reasonable tenancy for its tower infrastructure and at profitable terms
BPTL proposes to follow contract approach for its business model
36 Telecom Infrastructure market- Competitive landscape
Figure 3-5 Telecom Infrastructure Market Players
038058154
365692
10381692
26923269
0 20000 40000 60000 80000 100000
Aster InfrastructureAmerican Towers
Essar Telec om Infrastructure
GTL In frastructureWi reles s TT In fo Services Limited
Bharti Infratel Limited
Reli anc e Communications Limitedrsquos
OthersInd us To wers Limited
Number of Towers
Market Players
Source Telecom Regulatory Authority of India and ICRANote Others include tower por tfolios of BSNL MTNL Sistema Shyam Teleservices Aircel etc
In Indian Telecom Infrastructure market competition has intensified significantly with
several players spinning of their tower portfolio and independent operators expanding
their operations
882019 Major Project (Ramit)
httpslidepdfcomreaderfullmajor-project-ramit 2662
17
Bharti Airtel Limited Reliance Communications Limited and Tata Teleservices Limited
have hived off their tower assets into separate tower infrastructure subsidiaries namely
Bharti Infratel Limited Reliance Infratel Limited and Wireless TT Infoservices Limited
respectively Also Bharti Infratel Limited together with Vodafone Essar Limited and IdeaCellular Limited in a joint- venture agreement has created Indiarsquos largest tower
infrastructure company ndash Indus Towers Limited which has an estimated portfolio of
around 88000 towers (Anjan V amp N 2009) Whereas in past few years number of
independent tower infrastructure companies have ventured into the domestic telecom
tower industry These include GTL Infrastructure Limited Essar Telecom Infrastructure
Limited Xcel Telecom Private Limited (American Towers) Tower Vision India Private
Limited Aster Infrastructure Private Limited TVS Interconnect Systems Limited etc
Figure 3-6 Telecom Tower Growth Scenario
0
100
200
300
400
500
600
700
2008 2009 2010 2011 2012 T e
l e c o m
T o w e r s
( T h o u s a n
d s )
Source Telecom Regulatory Authority of IndiaAssumptions Subscriber growth rate of 28 till 2011-12
1400 subscribe per site
As shown above it is expected that in next 4-5 years there will be a requirement of
additional 85000 towers (both GBT and RTT) each year to meet the subscriber base of
800 million by 2011-12 (PwC 2009) This shows that huge investment have to be made
in Indian telecom Infrastructure sector in near future Now since both passive and active
882019 Major Project (Ramit)
httpslidepdfcomreaderfullmajor-project-ramit 2762
18
infrastructure sharing is a llowed (except spectrum) Independent service providers will be
benefited Increase in subscriber base introduction of new technologies like 3G Wi-max
etc and increase in market healthy market competition in telecom services sector will
drive the growth in telecom infrastructure sector
882019 Major Project (Ramit)
httpslidepdfcomreaderfullmajor-project-ramit 2862
19
4 BUSINESS PLAN
41 Passive Infrastructure
Mobile networks have base stations (or cell sites) which have active and passive
infrastructure components Active components include the antenna trans-receivers
switches feeder cables Node B and microwave radio equipments Passive (or non-
electronic) components include the land tower shelter air-conditioning equipment
diesel electric generator battery electrical supply technical premises and easements
pylons etc Passive infrastructure in a mobile network essentially involves acquiring land
setting up towers and electrical and civil works that needs to be in place before operators
can install the active infrastructure which brings mobile services to the consumers In atypical cell site build-out almost 65 of the total cost is attributed to passive
infrastructure and 35 to active infrastructure
42 Infrastructure Sharing
Mobile operators are required to setup more and more BTS (cell) sites due to the
exponential growth of mobile subscribers in India (currently growing at almost 15 4
million subscribers a month) and limited availability of spectrum B and C Circles (wheretraffic density may not be as high as metros and Circle A) are expected to drive future
subscriber growth and requirements for cell sites will be higher to ensure greater
coverage
However creating new infrastructure by each operator separately leads to d uplicat ing
huge capital investments It also contributes to mushroom growth of telecom towers and
deteriorating skylines in urban areas which has already led to some local municipal and
state governments to regulate and restrict the erection of new mobile towers
The continued pressure on cellular tariffs higher infrastructure costs for network
deployment particularly in semi-urban and rural areas and compelling need to reduce
4 As published in ET 8 th May 09 Edition
882019 Major Project (Ramit)
httpslidepdfcomreaderfullmajor-project-ramit 2962
20
time to market for network roll outs have led operators to share and even outsource their
infrastructure requirements from third party infrastructure providers like BPTL GTL and
Indus towers It promotes capital efficiency as it allows more than one service provider to
leverage and ride o n common infrastructure In its simplest form it involves two or moreoperators jointly using the common passive infrastructure in a cell site While viewed
largely as a measure to reduce capital and operating expense such sharing also leads to
improvement of service q uality (by ensuring site space for service providers and reducing
black spots) and the environment (by reducing number of cell sites and towers)
In outsourcing operators take passive infrastructure and tower space from third party
infrastructure companies on a monthly rental basis to host their radio and transmission
equipments Outsourcing provides significant benefits to operators It enables them tosave on capital expenses (it actually converts capital expense into operating expense in
the form of lease rentals) and focus on their core activities of sales marketing and
branding while leaving the cumbersome task of managing the site development process
and site operation and maintenance to third parties who exclusively deal with such
activities
The concept of passive infrastructure sharing is increasingly gaining market acceptancein India So far it has been largely limited to bilateral sharing between operators in the
form of barter where the operators split the site related CAPEX and OPEX costs The
available information suggests that about 25 of the existing 90000 tower sites in India
are currently being shared for passive infrastructure predominantly in rural areas and
small towns
43 Introduction to the business
BPTL is an Infrastructure Provider company that builds owns operates and maintains
passive network infrastructure on a shared basis for mobile telecom operators and ITES
providers Its objective is to provide network design and planning network deployment
882019 Major Project (Ramit)
httpslidepdfcomreaderfullmajor-project-ramit 3062
21
network operations amp maintenance infrastructure management application management
and professional services to teleco m operators and enterprises
The company is planning to raise capital in the form of equity and debt to start its
operation by Aug 09 ABC rsquos vision is to provide world class managed infrastructure ampallied services to the service providers to optimize their service delivery capability In the
initial years of operation the company will focus on telecom sector with almost 100 of
its proposed capital expenditure till FY 14 earmarked for developing and owning passive
infrastructure for sharing among mobile service providers
44 Business Proposal
ABC will provide passive telecom infrastructure on build own operate (BOO) basis inboth ground based (GBS) as well as roof-top sites (RTS) It will undertake full range of
responsibilities in building owning and maintaining the sites and will serve as a single
window one-stop-shop provider of infrastructure services Typical responsibilities are
summarized below
Site planning keeping in view the network rollout plans of prospective customers
Site acquisition including entering into long-term agreements with land owners
Obtaining of necessary regulatory approvals
Erect ion and commissioning of tower and allied equipment
Provision of support services such as back-up power air-conditioning and
security
Provision of turnkey solutions to telecom companies such as sourcing of
equipment testing and maintenance
882019 Major Project (Ramit)
httpslidepdfcomreaderfullmajor-project-ramit 3162
22
Bharat Telemast Private Limited will identify the sites required for setting up the Passive
infrastructure by first of all getting a commitment from one operator who is called as
ldquoAnchor Operatorrdquo Then Bharat Telemast will go ahead to lease (or) buy out the site as
appropriate and commences construction of the cellular sites But the Cellular site will betypically designed for three to four operators While construction is in progress the
marketing team will work towards getting the second and third operator But care will be
taken in such a way that at least two operators are available at the time of completion of
construction
45 Sources of revenue
1 Infrastructure Provisioning Fees ndash fee paid by the operators on a monthly basisWith annual escalation
2 Site lease rental ndash Paid at actual on a monthly basis
3 Operations and maintenance charges Paid on a monthly basis
4 The contract also provides a fixed annual escalator
46 Attractiveness of business model
Stable and predictable cash flow business Once a tower asset is rented out it
usually generates a stable and predictable cash flow in the form of tower rentals
from occupants over the term of the MSA between the two parties
Low working capital requirement ABC rsquos business model is also characterized
by low working capital requirements as most of the operating expenses (such aselectricity and fuel and other variable operating expenses) are reimbursable by the
tenants on actual basis Moreover BPTL is may also be able to get rentals for the
towers in advance and also obtain better credit terms from their suppliers thus
further improving their working capital cycle
882019 Major Project (Ramit)
httpslidepdfcomreaderfullmajor-project-ramit 3262
23
High incremental profitability The operating costs associated with this
business are largely fixed in nature Thus each increment in tenancy is
accompanied by a minimal increase in costs This leads to a more thanproportionate increase in profits for every increase in occupancy
Reduction in capital investments due to present market conditions Due to
present market situation average capital requirement for RTT and GBT sites have
dropped from 2 million and 4 million to 15 million and 33 million ABC wishes
to grab this opportunity which will result in competitive advantage in near future
Extensive usage While on an average a GSM BTS can handle around 100-
1100 subscribers but in the case of high usage areas the figure can be as low as
600-700 subscribers which means a larger number of cell sites would be required
for the same area Moreover the country has the problem of spectrum scarcity
which increases the requirement of towers to maintain a reasonable leve l of
service quality
New entrants Many operators including Vodafone Essar Limited Idea Cellular
Limited Aircel Cellular Limited and Sistema Shyam Teleservices Limited have
received licenses as well spectrum in new circles which would enable them to
become pan-India operators in the next one-two years Also new licenses have
been issued to new players such as Unitech Swan Telecom and S Tel Limited
Given the significant expansion plans of new entrants over the medium term and
the need for them to optimize investments in order to maintain returns demand
for towers is expected to report a sharp increase
Shorter rollout time Indian telecom industry is highly competitive and doing
business for new entrant may not be easy Shorter network-rollout time would be
a critical success factor for the new entrants and a longer rollout time could meanloss of substantial market share to other operators Tower companies allow
players to start operations in a particular region just by installing their electronics
on the ready-to-use towers thereby significantly shortening the rollout time
New technologies 3G services are already launched in the country and to
augment their services various operators plan to launch Wi-Max services as soon
882019 Major Project (Ramit)
httpslidepdfcomreaderfullmajor-project-ramit 3362
24
as they receive additional spectrum from Government This would further
increase the demand for sharing of passive infrastructure
47
Expansion Schedule
BPTL would rollout both RTT and GBT sites of which the RTT sites GBT sites
normally would have a tower height of 50 meters or 60 meters depending on the need for
additional height for installation of microwave antennae based on the location of the site
and number of tenants on the cell site Details of BPTLrsquos expansion plan are summarized
below
Table 41 Expansion PlanExpansion Schedule 2009-10 2010-11 2011-12 2012-13 20013-14
GBT
Addition 210 700 1400 2450 3850
Total 210 910 2310 4760 8610
RTT
Addition 90 300 600 1050 1650
Total 90 390 990 2040 3690
48 Proposed Services
As indicated earlier ABC proposes to provide passive telecom infrastructure on a
sharing co-location basis to cellular operators The sites would either be Ground Based
Sites (GBS) or Roof Top Sites (RTS) As the sites are meant for co-location of the active
components of two to three operators they would be built to either 2-Tenant or 3-Tenant
specifications
The different components of the passive infrastructure facility and the related services
that would be offered by BPTL to the operators are as under
Infrastructure provisioning comprising
882019 Major Project (Ramit)
httpslidepdfcomreaderfullmajor-project-ramit 3462
25
Communication tower built to host multiple antennae
Weather-proof communication shelter with air-conditioning and power backup
arrangement
Diesel generating set and battery bank for power backup
A mobile standby generator to act as backup in case o f breakdown
Warehousing facility
Infrastructure operations and maintenance including
Regular operations and maintenance of the facility
Security of all the equipments at the site at all timesA dedicated team of technicians for a group of 40-50 sites to ensure effect ive and
efficient functioning of the components at all times
49 Proposed Organizational Structure
A senior management team will work under the leadership of the ldquoChief Operations
Officerrdquo who will be responsible for smooth implementation of proj ect activities He willalso assist the managing director in marketing This team will coordinate with Stallion
Telecom Pvt Ltd which will take over the role of procuring Capital Equipments
Senior management will consists of project manager infrastructure manager commercial
manager and head (legal and company affairs Apart from this there will be a requirement
Chief OperatingOfficer
Project Manager Infrastructure
Manager
Commercial
Manager (projects)
Head (Legal and
Company Affairs)
882019 Major Project (Ramit)
httpslidepdfcomreaderfullmajor-project-ramit 3562
26
of security sentries (3 per GBT site) supervisors (one for every 10 sites) and cluster
manager (one for every 50 sites)
Bharat Telemast will carry out the complete Project execution with the assistance of third party ldquoQuality control organizationrdquo and a third party ldquoProject management teamrdquo
Quality control and project management activities will be o utsourced to a third party
882019 Major Project (Ramit)
httpslidepdfcomreaderfullmajor-project-ramit 3662
27
5 METHODOLOGY
The changing face of infrastructure services creates a complex situation which demands
greater understanding of roles of competition regulatory structures and modes of
financing Knowledge of such things is a key decisive factor in building confidence
among investors promoters and government In project finance the project its assets
contract and cash flows are separated from promoter in order to permit credit appraisal
or loan to the project
As part of the financial feasibility analysis a series of related financial statements based
on projected sources and uses of funds during the development and operating phaseproject were created Financial statements consist of expenses associated with
development activities including capital costs like acquisition of land for GBT sites cost
of tower generator shelter batteries etc Most of the data regarding capital costs are
obtained from the promoter of ABC Limited All these capital costs related details are
provided in annexure 1
Assumption regarding depreciation capital structure operating expenses expansion
schedule tenancy ratios tariff or rent operatorrsquos fees and loan amortization schedule are
obtained from professional accountants Promoter and bankers of ABC Limited
Due to unknown factors that could influence the cost of towers or fees associated with
completing the project (soft costs) contingency costs were estimated at 5 of hard and
soft costs respectively If contingency is set too low developers could easily encounter
funding shortfalls upon slight changes in market forces All other costs were estimated
based on talking with industry professionals (Promoters)
A detailed financial model was prepared based on existing accounting standards and
following financial ratios were estimated
882019 Major Project (Ramit)
httpslidepdfcomreaderfullmajor-project-ramit 3762
28
EBITDA margin Profit and loss accounts for the estimated project period (15
Years) were prepared based on which estimated earnings before interests tax
depreciat ion and amortization were calculated for each year Detailed PampL
balance sheet and cash flow statements are provided in annexure 2 3 and 4
EBITDA = Total Revenue ndash (Variable expenses + Fixed Expenses)
EBITDA margin = EBITDA Total Revenue
PAT margin PAT is calculated by subtracting interests pa id on capital debt and
working capital debt depreciation and applicable corporate income tax from
EBITDA
PAT = EBITDA ndash Interest Payable ndash Depreciation ndash Income tax
PAT margin = PATTotal Revenue
Working Capital Working capital requirement is calculated by subtract ing
current liabilities from current assets Current assets are estimated based on 30
days cash requirement and current liabilities are estimated as half of salary
monthly expenses
WC = Current Assets ndash Current Liabilities
UFCF It is defined as the free cash flows available to the firm if the firm has
zero debt liability Purpose of ca lculat ing UFCF for project period is to determinethe project IRR
UFCF = PAT + Depreciation + Interest (tax adjusted) + Release of WC + Salvage
value of the assets ndash CAPEX ndash Change in WC
882019 Major Project (Ramit)
httpslidepdfcomreaderfullmajor-project-ramit 3862
29
LCFF It is defined as the cash floes available to the firm after paying interests on
long term and short term debts
LCFF = UFCF ndash Interest (tax adjusted)
FCFE It is defined as the free cash flow available to equity holders It is
determined to ca lculate equity IRR for equity investors It also includes the tax
benefits which are available as per the Income Tax Act
FCFE PAT + Depreciation + Salvage Value ndash Equity Investment ndash Long term debt
repayment
PIRR Project IRR is defined as the discount rate at which NPV (Net Present
Value) of UFCF is zero It is calculated by using following formula
UFCF 1 (1+PIRR) 0+ UFCF 2 (1+PIRR) 1+ UFCF 3 (1+PIRR) 2+ helliphelliphelliphelliphelliphellip = 0
UFCF 1 = UFCF at the end of first year of operation
UFCF 2 = UFCF at the end of second year of operation
PIRR = Project IRR
EIRR Equity IRR is defined as the discount rate at which NPV of FCFE is zero
It is calculated by using following formula
FCFE1 (1+EIRR) 0+ FCFE 2 (1+EIRR) 1+ FCFE 3 (1+EIRR) 2+ helliphelliphelliphelliphelliphellip = 0
FCFE1 = FCFE at the end of first year of operation
FCFE2 = FCFE at the end of seco nd year of operation
EIRR = Equity IRR
882019 Major Project (Ramit)
httpslidepdfcomreaderfullmajor-project-ramit 3962
30
WACC It is de fined as the percentage of return expected by the investors who
otherwise would have earned some return by investing in some other project
WACC = Cost of Debt (Debt Capital) + Cost of equity (Equity Capital)
882019 Major Project (Ramit)
httpslidepdfcomreaderfullmajor-project-ramit 4062
882019 Major Project (Ramit)
httpslidepdfcomreaderfullmajor-project-ramit 4162
32
62 Funding planAs the telecom sites are rolled out over a 5 year period till FY 2014 investment will be
required for each year ABC Limited will start generating profits from FY 10 only Such
internally generated cash accruals will be ploughed back into the business to meet part of
the project cost Investment required for each year is tabulated below
Table 61 Funding ProposalMillion INR FY 10 FY 11 FY 12 FY 13 FY 14
GBT Tower (Additional) Nos 210 700 1400 2450 3850
RTT Tower (Additional) Nos 90 300 600 1050 1650DE ratio 233 233 233 233 233
Additional CAPEX 83892 279374 558748 977809 1536557
Debt 58725 195562 391124 684466 1075590
Equity 25168 83812 167624 293343 460967
63 Results
Based on assumptions given in Annexure 1 a detailed financial model was preparedResults of the financial model such as PampL account Balance Sheet and cash flow
statements are provided in Annexure 2 3 and 4 Forecasts for the key financial figures for
first five years are provided in the Table below
Forecasts
Table 62 Income StatementMillion INR FY-10 FY11 FY12 FY-13 FY-14
Sales 7124 50511 156766 347476 667700
Cost of sales 1950 13852 39252 87612 170021
Gross 5174 36659 117514 259864 497679
7263 7258 7496 7479 7454
Admin costs 112 179 190 203 216
882019 Major Project (Ramit)
httpslidepdfcomreaderfullmajor-project-ramit 4262
33
Finance cost 0 021 7401 31330 77725
Taxation 170 4233 14536 29073 53547
PAT 2454 19458 59470 122096 223267
As shown in Table above during the expansion period revenue will grow exponentially
In the first year of operation ABC will earn a revenue of INR 7124 million from 300
(210 GBT and 90 RTT) sites with a tenancy ratio of 15 for GBS and 17 for RTS In the
first 2 years of operation the company will not pay any interest on long term debt due to
2 years moratorium period Major cost associated with the project is depreciation due to
which PAT is lower than the operating profits But cash flows to the firm are enough to
result in reasonable returns
Table 63 Balance Shee tYear ending Mar-10 Mar-11 Mar-12 Mar-13 Mar-14
AssetsGross Block 75742 328216 833164 1716823 3105430Accumulated depreciation 2439 15208 51125 128287 271212Net Block 73303 313009 782040 1588536 2834219Net Working Capital 064 241 620 1335 2515Cash Balance 12979 72089 216513 488856 947982
Total Assets 86346 385339 999172 2078727 3784715LiabilitiesEquity 25168 108980 276604 569947 1030914Reserves amp Surplus 2454 21912 81381 203477 426745Long term Debt 58725 254286 640722 1304302 2325171WC Borrowings - 161 465 1001 1886Total Liabilities 86346 385339 999172 2078727 3784715
Note All figures are in Million INR
Table 64 Key financial ratiosMar-11 Mar-12 Mar-13 Mar-14 Mar-15
Revenue Growth 60902 21036 12165 9216 3890EBITDA Growth 62061 22161 12132 9158 4020
PAT Growth 69293 20564 10531 8286 2955
As shown in table above increase in EBITDA is higher than that of revenue This is due
to better operational efficiency of ABCrsquos management and economies of scale S imilarly
882019 Major Project (Ramit)
httpslidepdfcomreaderfullmajor-project-ramit 4362
34
increase in PAT is lesser than that of EBITDA because of high depreciation and interest
expenses
Table 65 Pr ofitability r atios
Mar-11 Mar-12 Mar-13 Mar-14 Mar-15
EBITDA Margin 7222 7484 7473 7450 7520
PAT Margin 3852 3794 3514 3344 3119Return on Net Worth 622 760 769 788 1087
Key profitability ratios are shown in table above Return on net worth in the initial years
is lower because of the ambitious expansion plans of ABC Limited Thereafter return on
net worth increases with increase in PAT
Returns on Investment
Table 66 Financial returnsFinancial Indicators
Project IRR 1813Equity IRR 3609
64 Sensitivity Analysis
A sensitivity analysis has been carried out on the project financials to determine theimpact of key variables on the financial indicators namely
Project IRR
The key variables on which sensitivity analysis have been carried out areCapital expenditure for GBS and RTS1st and 2 nd tenant tariff for GBS1st and 2 nd tenant tariff for RTSTenancy Ratio
Similarly sensitivity analysis has been carried out forEquity IRR
The key variables on which sensitivity analysis have been carried out for EIRR are
Capital structure and interest rate for capital debtRepayment period and moratorium period
882019 Major Project (Ramit)
httpslidepdfcomreaderfullmajor-project-ramit 4462
35
The impact on the financial indicators is shown below
Figure 6-1 Project IRR vs GBT and RTT CAPEX
As shown in Figure 6-1 project IRR is more sensitive to change in CAPEX of RTT sitesas compared to change in CAPEX of GBT sites because tenancy ratio and tariff for RTTsites are higher than those of GBT sites
882019 Major Project (Ramit)
httpslidepdfcomreaderfullmajor-project-ramit 4562
36
Figure 6-2 Project IRR vs GBT Tariff for 1 st tenant (X-axis) and 2 nd tenant (right-hand side)
As shown in Figure 6-2 project IRR varies linearly with GBT tariff In the best casescenario when GBT tariff for 1 st tenant is INR 34000month and GBT tariff for secondtenant is INR 26000month Project IRR is 2101
Figure 6-3 Project IRR vs RTT Tariff for 1 st tenant (X-axis) and 2 nd tenant (right-hand side)
As shown in Figure 6-2 project IRR varies linearly with RTT tariff In the best casescenario when RTT tariff for 1 st tenant is INR 24000month and RTT tariff for second
882019 Major Project (Ramit)
httpslidepdfcomreaderfullmajor-project-ramit 4662
37
tenant is INR 20000month Project IRR is 1932 Project IRR is more sensitivetowards RTT tariff than GBT tariff because in practical business situation RTT siteshave a tenancy ratio of more than two due to which effect of tariff for 1 st tenant almostget nullified after few years
Figure 6-4 Project IRR vs Tenancy ratio for RTT sites (X-axis) and GBT sites
As shown in Figure 6-4 project IRR is very sensitive to tenancy ratio In the best casescenario where GBT sites have a tenancy ratio of 2 and RTT sites have a tenancy ratio of 3 project IRR can be as high as 20
Figure 6-5 Equity IRR vs long term debt interest rate for different leverage level
882019 Major Project (Ramit)
httpslidepdfcomreaderfullmajor-project-ramit 4762
38
As shown in figure 6-5 equity IRR is more sensitive to interest rate on long term debt forhigh level of leverage (lower debt equity ratio) because as the debt equity ratio increasesinterest paid on long term debt also increases significantly
Figure 6-6 Equity IRR vs long term debt repayment period at different level of moratoriumperiods
As shown in figure 6-6 Equity IRR increases with increase in moratorium period anddebt repayment period The variation is from 1654 to 60 for worst case and best casescenarios
882019 Major Project (Ramit)
httpslidepdfcomreaderfullmajor-project-ramit 4862
39
7 RISK ASSESSMENTRisk Mitigation strategyExecution Risk
(Project management landacquisition etc)
Management of ABC has proven expertise in
telecom infrastructure rollout and has executedvarious projects with large telecom operators andMNC vendorsABCrsquos top management team consists of a groupof professionals drawn from leading telecomInfrastructure Company who have immenseexpertise and experience in rolling out telecominfrastructure projects
Market Risk (No entry barriers operators may
share infrastructure betweenthemselves large players withhigh capital may increasecompetition)
India has a huge potential for telecominfrastructure market With increasing
competition falling tariffs and pressure onmargins telecom service providers are beingforced to increase their focus on marketing andreduce their expensesExperienced management healthy capital back-up effective presence in the telecominfrastructure market and value added services atrelatively lesser cost will help ABC to meet theset targets
Financing Risk
(Availability of equity capitalavailability of long term debtinterest rate and moratoriumperiod)
ABC is seeking private equity partner to secure
equity capital Company has already entered intoNDA with 2 major investorsLong term debt at an interest rate of 125 canbe easily arranged because of the credibility of the promoters in the marketMany other similar firms like Indus and GTLhave already secured long term debt for amoratorium period of 2 years Promoters of ABCLimited are confident to secure a long term debtwith a moratorium period of 2 years and apayback period of 8 years
ABC Limited would minimize the workingcapital requirements of its business by securingrentals and operating revenues in advance fromits clients and or by suitably structuring itspayment liabilities to match its cash inflows
Commercial Risk (Tenancy ratio and tariff forGBS and RTS)
ABC would aim to enter into long term contractswith the ldquoanchor tenantrdquo operator and thenrollout the infrastructure so that at least single
882019 Major Project (Ramit)
httpslidepdfcomreaderfullmajor-project-ramit 4962
40
occupancy of each site is ensured at all t imesPromoters will use its knowledge of the businessand its expertise to identify and roll out sites inlocations which have strong multi- tenancypotential to minimize occupancy risk
Revenue Risk (Operating fees may decreasecredit worthiness of the clientsdelay in payment of rentals)
As per the industry sources till now not even asingle operator have dishonored the long termlease contractThe credit risk is diversified as there will bemultiple operatorsABC would aggressively market to get 3G andWiFi broadcasters to use the sites and earnadditional revenues in addition to the assumedrevenue streams
Natural Calamities Risk The Company shall maintain insurance for thesites against these risks and the cost of insurancewill be priced in and passed on to the tenants
882019 Major Project (Ramit)
httpslidepdfcomreaderfullmajor-project-ramit 5062
41
8 CONCLUSION
India is the fastest growing wireless telecom market in the world The continuing
growth in the number of wireless subscribers and MoUs and increasing trend of
outsourcing of business processes to India has led to growing demand for large
investments in the telecom infrastructure in the country
However with increasing competition falling tariffs and pressure on margins
telecom service providers are being forced to increase their focus on marketing
customer acquisitions and branding and minimize their efforts and overheads in
project management and asset acquisition
Further with rising prices of steel cement and real estate the cost of developing
and owning passive infrastructure is increasingly becoming a costly proposition
for most operators and service providers
The compulsion on the part of service providers to reduce their operating costs
and capital expenditure requirements has led to opportunities in passiveinfrastructure outsourcing to independent third party infrastructure providers and
also sharing the infrastructure with other service providers It is expected that
cellular operators will outsource their communications site infrastructure needs as
a means of accelerating access to their markets and preserving capital rather than
constructing and operating their own communications sites and maintaining their
own communications sites service and deve lopment capabilities
Passive infrastructure is highly capital intensive and an integral part of the cellular
service providersrsquo networks Yet being a simple and low technology asset it is
amenable to outsourcing and sharing By transferring the responsibility of
ownership development and maintenance of passive infrastructure service
882019 Major Project (Ramit)
httpslidepdfcomreaderfullmajor-project-ramit 5162
42
providers have an opportunity to transfer a substantial part of their business risk to
third parties
Most telecom operators are facing capacity constraints on their networksCoverage obligations increasing pressure to improve network quality and
competition has led to aggressive roll out plans by existing cellular operators
Installation of cell sites has become a cumbersome process as there are a number
of clearances required and involves labor-intensive micro management
Availability of ready infrastructure from third party providers would enable the
operators to reduce their time to market and accelerate their access to their
customers Cellular service providers generally want to move quickly when
adding more sites and co-location on an existing site is always faster than
building
Ownership and maintenance of telecom towers and other infrastructure by third
parties is an established practice in developed nations like USA and is
increasingly gaining market acceptance in India
The Indian government is seriously considering promoting the infrastructure
sharing route between the telecom operator and private players to achieve future
national tele-density targets and improve rural telecom penetration
ABC being an independent entity with no business conflicts with other service
providers in the telecom space will be best positioned and have an early mover
advantage to capitalize on this emerging opportunity
Further the task of operating and maintaining the passive infrastructure in the cell
is increasingly becoming a cumbersome exercise for the service providers to
handle ABCrsquos composite offering to build passive infrastructure for the cellular
operators and also operate and maintain them will provide a turnkey solution to
address the infrastructure needs of the service providers
882019 Major Project (Ramit)
httpslidepdfcomreaderfullmajor-project-ramit 5262
43
The business model proposed to be followed by ABC is fairly simple with stable
and predictable cash flows as is the case with the business model of the tower
renting companies in USA Most contracts are long term for a period 10 or moreyears with annual price escalators generally ranging from 3 to 4 However
wireless carriers normally tend to renew rentals because suitable alternative sites
may not exist or be available and repositioning a site in a carrierrsquos network is
expensive and may adverse ly affect network quality
Site ownership and operations is a ldquoscalerdquo business operating administration
marketing expenses etc do not rise as quickly as revenues when portfolios are
expanded Incremental operating costs associated with adding wireless tenants to
a communications site are minimal Therefore as additional tenants are added to a
site the substantial majority of incremental revenue contributes to margin
expansion Most tower companies have high EBITDA margins as may be seen
from the financial indicators of some of the tower rental companies in USA
It is expected that site location and capacity price and quality of service and
successful execution of contracts will be the most significant competitive factors
in this business
ABCrsquos revenue and returns on investment will be primarily driven by its ability
to
o Increase the utilization of the space and infrastructure capacity owned by it by
increasing the number of tenants per site and renting out to maximum number
of users As discussed above return on capital employed (PIRR and EIRR) arevery sensitive to tenancy ratio In worst case scenario project IRR can be as
low as 8 and in the best case scenario it can be as high as 20
o Develop acquire sites of strategic importance and high growth potential that
will enable them to secure better commercial terms from users and attract
more number of tenants Infrastructure provisioning fees rentals for sites are
882019 Major Project (Ramit)
httpslidepdfcomreaderfullmajor-project-ramit 5362
44
extremely location sensitive There is a potential to acquire more land than
that of required to capitalize on the increase in real estate prices
o Develop sites in a cost effective manner ABC would consider purchasing
land only for those GBS sites which have sufficient demand and arestrategically located Else for most of its sites land will be leasehold As
shown above returns (PIRR and EIRR) are very sensitive to capital costs In
the worst case scenario project IRR can be as low as 15 whereas it can as
high as 27 in the best case scenario
o Negotiate and secure long term contracts with good credit quality users with
built in price escalation provisions to mitigate financing risk
o Leverage and secure long term financing at attractive terms and involve in
active treasury management to keep low financing cost Results of the
sensitivity analysis indicate that equity IRR can be as high as 60 foe a
moratorium period of 4 years and interest rate of 10
o Minimize working capital requirements
o Maintain low operating and administration expense
o Secure better OampM margins from operators and retain a healthy share of it in
ABC
o Maintain high service standards and build strong customer relationships
The business would have the potential to capture new revenue opportunities
around the existing assets As demand for towers is expected to grow and as
operators migrate to speedier next-generation wireless technologies they will
need the towers and associated passive infrastructure to transmit their new
services in addition to their existing offerings In addition to increasing capacity
and coverage and improving the quality of their networks cellular serviceproviders are deploying high speed data networks driving incremental demand of
sites The business therefore has potential upsides in the form of adding
customers (tenants) in wireless broadband third generation (ldquo3Grdquo) and wireless
data capabilities and also other incremental value propositions by way of hosting
882019 Major Project (Ramit)
httpslidepdfcomreaderfullmajor-project-ramit 5462
45
Billboards Hoardings etc in some of the high visible sites owned and maintained
by it
Based on the assumptions and subject to satisfactory resolution of the key risks
factors project cash flows will be able to meet debt service obligations
This business model is a lucrative investment option for a private equity player
because valuation of each site will increase in the coming years due to
improvement in market conditions increase in the value of land and increase in
the demand for passive infrastructure in rural and semi-urban areas
882019 Major Project (Ramit)
httpslidepdfcomreaderfullmajor-project-ramit 5562
46
REFERENCESAnjan G V A amp N M (2009) telecom infrastructure industry in india GurgaonICRA
Bessler W Norsworthy J amp Shusterman T (2001 12 1) Mergers in the UStelecommunications industry and market valuationeffects IEEE p 288
COAI (2009 march 14) Subscriber Figures Retrieved march 14 2009 fromCOAIcom httpwwwcoaicomstatisticsphp
IDA (2009 march 23) Highlights Retrieved march 23 2009 from idagovsghttpwwwidagovsghomeindexaspx
K R (2008) Time for new business model Delhi Cybermedia
MAXIS (2009 march 8) the malaysian telecommunications industry Retrieved march9 2009 from maxiscommyhttpwwwmaxiscommypersonalabout_usinvestorprospectusprospectus4pdf
P J amp Lisa A (2009) Stimulas spending and American Telecom Industry USACoracle group
PwC (2009 march 12) Indian Telecom Industry Gurgaon Harayana IndiaRamachanran (2009 march 1) Investment in Telecom Infrastructure sector (M RInterviewer)
Vogelsang I (2002) The German Telecommunications Reform Verein fuumlr Socialpolitik (p 26) Innsbruck Boston Press
882019 Major Project (Ramit)
httpslidepdfcomreaderfullmajor-project-ramit 5662
47
ANNEXURES
ANNEXURE 1 Key Assumptions
The occupancy of each site by single two three operators for green-field sites is assumed
to be as follows
Table 91 Expected Tenancy RatiosFY 10 FY 11 FY 12 FY 13 FY 14 FY15
GBT Tenant
Ratio 150 150 170 170 170 200
Single Operator 50 50 30 30 30 0
Two Operator 50 50 70 70 70 100
RTT Tenant
Ratio 170 170 200 200 200 250
Single Operator 30 30 0 0 0 0
Two Operator 70 70 100 100 100 50
Three Operator 0 0 0 0 0 50
From FY 15 onwards tenancy ratio of 2 and 25 for GBT and RTT sites is cons idered
882019 Major Project (Ramit)
httpslidepdfcomreaderfullmajor-project-ramit 5762
48
Capital costs related assumptions are tabulated below
Table 92 GBT and RTT Capital Cost
The lease rentals for RTT sites are reimbursed from the operators and therefore have not
been factored in the revenues as well as the expense For GBT sites land purchase cost of
035 millions assumed which has been escalated by 6 annually to determine the
salvage value of assets
GBT Capital Costs
Million
INR
Delivery cost of Ground Based
Tower (GBT)063
Delivery cost of Generator 030
Civil Work 040Shelter 012
Electrical Works 030
Other Equipments (UPS Battery
etc)045
Construction cost 045
Land 035
Contingency amp Financial Charges 035Total cost 335
RTT Capital Costs
Million
INR
Delivery cost of Roof Top
Tower (RTT) 030
Delivery cost of Generator 020
Civil Work 020Shelter 012
Electrical Works 030
Other Equipments (UPS
Battery etc) 030
Construction cost -
Land -
Contingency amp FinancialCharges 008
Total cost 150
882019 Major Project (Ramit)
httpslidepdfcomreaderfullmajor-project-ramit 5862
49
Ope rating costs related assumptions are tabulated below
Table 93 Operating CostsOperating Costs
Security Sentries (INRMonth) 4000
Supervisors (INRMonth) 6000
Cluster Manager One for Fifty Towers (INRMonth) 15000
Annual increase 500
Number of Security Sentries per tower 300
Number of supervisors per tower 010
Number of C luster manager per tower 002
Fixed Expenses
Selling amp Maintenance (INRMonth) 4000000
Annual Escalation 5
Administration overhead (INRMonth) 10000000Annual Escalation 7
AMC Cost of Generator 15 (cost of generator)
Annual Escalation (AMC) 3
For RTT sites security sentries are not required because it will be the responsibility of
the site owner A supervisor will for every 10 sites and a cluster manager for every 50
sites will be required
882019 Major Project (Ramit)
httpslidepdfcomreaderfullmajor-project-ramit 5962
50
Table 94 Long term debtInterest Rate 125 per annum
Moratorium 2 years
Repayment Period 8 years
Tariff related assumptions and date of operations are tabulated below
Table 95 GBT and RTT Tariff Table 96 Life of the projectTariff Plan
Tariff (INRMonth)
No of
operators GBT RTT
1 28000 18000
2 22000 14000
3 0 12000
Annual
increase 3 3
Commercial Operation Date 1-Aug-09
Quarter Ending 30-Sep-09
FY ending COD 31-Mar-10
Project life years 15
End of commercial
operations31-Aug-24
Quarter ending commercial
operations30-Sep-24
FY ending comme rcial
operations31-Mar-25
882019 Major Project (Ramit)
httpslidepdfcomreaderfullmajor-project-ramit 6062
51
Annexure 2 Profit amp Loss accountsTable 97 Profit amp loss account statement
Income Statement (MNINR)Year ending Mar-10 Mar-11 Mar-12 Mar-13 Mar-14 Mar-15
RevenueGBT 406350 28811 89080 197447 379409 527015Operator Fees (GBT) 1411 10004 30678 67998 130664 179664RTT 1209 8575 27269 60443 116146 164264
Operator Fees (RTT) 440 3121 9739 21587 41481 56466Net Revenue 7124 50511 156766 347476 667700 927410
Expenses
VariableSecurity Sentries 1355 9790 28339 64033 125433 158238Supervisors 097 699 2024 4574 8959 11303Cluster Manager 048 350 10 12 2287 4480 5651AMC Cost of Generator 450 3013 7877 16719 31148 54541Sub-total 1950 13852 39252 87612 170021 229734
Fixed
Selling amp Maintenance(INRMonth) 032 050 053 056 058 061
Administration overhead(INRMonth) 080 128 137 147 157 168
Sub-total 112 179 190 203 216 230
EBITDA 5062 36480 117324 259661 497464 697447
Interest on LT loan - - 7341 31200 77479 156198Interest on ST loan - 021 060 130 245 361
EBDT 5062 36459 109923 228331 419739 540888Depreciation 2439 12769 35917 77162 142925 174006
EBT 2624 23691 74006 151169 276814 366881Income Tax 170 4233 14536 29073 53547 77634
PAT 2454 19458 59470 122096 223267 289247
882019 Major Project (Ramit)
httpslidepdfcomreaderfullmajor-project-ramit 6162
52
Annexure 3 Balance sheet
Table 98 B alance sheetsYearend Balance Sheet (MNINR)Year ending Mar-10 Mar-11 Mar-12 Mar-13 Mar-14 Mar-15
AssetsGross Block 75742 328216 833164 1716823 3105430 3105430Accumulated depreciation 2439 15208 51125 128287 271212 445218Net Block 73303 313009 782040 1588536 2834219 2660212Net Working Capital 064 241 620 1335 2515 3707Cash Balance 12979 72089 216513 488856 947982 1294734Total Assets 86346 385339 999172 2078727 3784715 3958653
LiabilitiesEquity 25168 108980 276604 569947 1030914 1030914Reserves amp Surplus 2454 21912 81381 203477 426745 715992Long term Debt 58725 254286 640722 1304302 2325171 2208967WC Borrowings - 161 465 1001 1886 2780Total Liabilities 86346 385339 999172 2078727 3784715 3958653
882019 Major Project (Ramit)
httpslidepdfcomreaderfullmajor-project-ramit 6262
Annexure 4 Cash flow statement
Table 99 Cash flow statements
Year ending Mar-10 Mar-11 Mar-12 Mar-13 Mar-14 Mar-15
InflowsPAT 2454 19458 59470 122096 223267 289247Depreciation 2439 12769 35917 77162 142925 174006Tax adjusted interest - 014 4959 20991 52076 104895Release of WC - - - - - -Salvage Value - - - - - -Sub-Total 4893 32241 100345 220249 418268 568148
OutflowsCapex 75742 252474 504948 883659 1388607 -Change in WorkingCapital 064 177 379 715 1180 1192
Sub-Total 75806 252651 505327 884374 1389787 1192
UFCF (70913) (220410) (404982) (664125) (971519) 566956LFCF (70913) (220424) (409940) (685116) (1023595) 462062
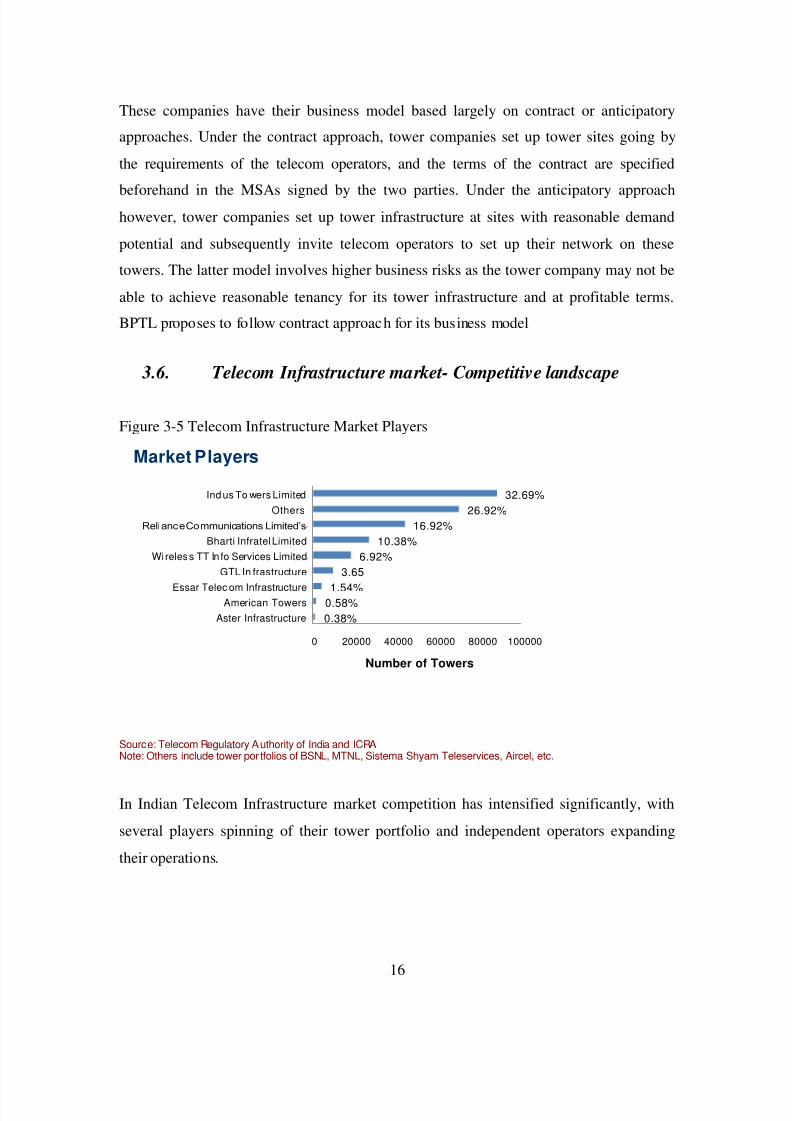
882019 Major Project (Ramit)
httpslidepdfcomreaderfullmajor-project-ramit 2562
16
These companies have their business model based largely on contract or anticipatory
approaches Under the contract approach tower companies set up tower sites going by
the requirements of the telecom operators and the terms of the contract are specified
beforehand in the MSAs signed by the two parties Under the anticipatory approachhowever tower companies set up tower infrastructure at sites with reasonable demand
potential and subsequently invite telecom operators to set up their network on these
towers The latter model involves higher business risks as the tower company may not be
able to achieve reasonable tenancy for its tower infrastructure and at profitable terms
BPTL proposes to follow contract approach for its business model
36 Telecom Infrastructure market- Competitive landscape
Figure 3-5 Telecom Infrastructure Market Players
038058154
365692
10381692
26923269
0 20000 40000 60000 80000 100000
Aster InfrastructureAmerican Towers
Essar Telec om Infrastructure
GTL In frastructureWi reles s TT In fo Services Limited
Bharti Infratel Limited
Reli anc e Communications Limitedrsquos
OthersInd us To wers Limited
Number of Towers
Market Players
Source Telecom Regulatory Authority of India and ICRANote Others include tower por tfolios of BSNL MTNL Sistema Shyam Teleservices Aircel etc
In Indian Telecom Infrastructure market competition has intensified significantly with
several players spinning of their tower portfolio and independent operators expanding
their operations
882019 Major Project (Ramit)
httpslidepdfcomreaderfullmajor-project-ramit 2662
17
Bharti Airtel Limited Reliance Communications Limited and Tata Teleservices Limited
have hived off their tower assets into separate tower infrastructure subsidiaries namely
Bharti Infratel Limited Reliance Infratel Limited and Wireless TT Infoservices Limited
respectively Also Bharti Infratel Limited together with Vodafone Essar Limited and IdeaCellular Limited in a joint- venture agreement has created Indiarsquos largest tower
infrastructure company ndash Indus Towers Limited which has an estimated portfolio of
around 88000 towers (Anjan V amp N 2009) Whereas in past few years number of
independent tower infrastructure companies have ventured into the domestic telecom
tower industry These include GTL Infrastructure Limited Essar Telecom Infrastructure
Limited Xcel Telecom Private Limited (American Towers) Tower Vision India Private
Limited Aster Infrastructure Private Limited TVS Interconnect Systems Limited etc
Figure 3-6 Telecom Tower Growth Scenario
0
100
200
300
400
500
600
700
2008 2009 2010 2011 2012 T e
l e c o m
T o w e r s
( T h o u s a n
d s )
Source Telecom Regulatory Authority of IndiaAssumptions Subscriber growth rate of 28 till 2011-12
1400 subscribe per site
As shown above it is expected that in next 4-5 years there will be a requirement of
additional 85000 towers (both GBT and RTT) each year to meet the subscriber base of
800 million by 2011-12 (PwC 2009) This shows that huge investment have to be made
in Indian telecom Infrastructure sector in near future Now since both passive and active
882019 Major Project (Ramit)
httpslidepdfcomreaderfullmajor-project-ramit 2762
18
infrastructure sharing is a llowed (except spectrum) Independent service providers will be
benefited Increase in subscriber base introduction of new technologies like 3G Wi-max
etc and increase in market healthy market competition in telecom services sector will
drive the growth in telecom infrastructure sector
882019 Major Project (Ramit)
httpslidepdfcomreaderfullmajor-project-ramit 2862
19
4 BUSINESS PLAN
41 Passive Infrastructure
Mobile networks have base stations (or cell sites) which have active and passive
infrastructure components Active components include the antenna trans-receivers
switches feeder cables Node B and microwave radio equipments Passive (or non-
electronic) components include the land tower shelter air-conditioning equipment
diesel electric generator battery electrical supply technical premises and easements
pylons etc Passive infrastructure in a mobile network essentially involves acquiring land
setting up towers and electrical and civil works that needs to be in place before operators
can install the active infrastructure which brings mobile services to the consumers In atypical cell site build-out almost 65 of the total cost is attributed to passive
infrastructure and 35 to active infrastructure
42 Infrastructure Sharing
Mobile operators are required to setup more and more BTS (cell) sites due to the
exponential growth of mobile subscribers in India (currently growing at almost 15 4
million subscribers a month) and limited availability of spectrum B and C Circles (wheretraffic density may not be as high as metros and Circle A) are expected to drive future
subscriber growth and requirements for cell sites will be higher to ensure greater
coverage
However creating new infrastructure by each operator separately leads to d uplicat ing
huge capital investments It also contributes to mushroom growth of telecom towers and
deteriorating skylines in urban areas which has already led to some local municipal and
state governments to regulate and restrict the erection of new mobile towers
The continued pressure on cellular tariffs higher infrastructure costs for network
deployment particularly in semi-urban and rural areas and compelling need to reduce
4 As published in ET 8 th May 09 Edition
882019 Major Project (Ramit)
httpslidepdfcomreaderfullmajor-project-ramit 2962
20
time to market for network roll outs have led operators to share and even outsource their
infrastructure requirements from third party infrastructure providers like BPTL GTL and
Indus towers It promotes capital efficiency as it allows more than one service provider to
leverage and ride o n common infrastructure In its simplest form it involves two or moreoperators jointly using the common passive infrastructure in a cell site While viewed
largely as a measure to reduce capital and operating expense such sharing also leads to
improvement of service q uality (by ensuring site space for service providers and reducing
black spots) and the environment (by reducing number of cell sites and towers)
In outsourcing operators take passive infrastructure and tower space from third party
infrastructure companies on a monthly rental basis to host their radio and transmission
equipments Outsourcing provides significant benefits to operators It enables them tosave on capital expenses (it actually converts capital expense into operating expense in
the form of lease rentals) and focus on their core activities of sales marketing and
branding while leaving the cumbersome task of managing the site development process
and site operation and maintenance to third parties who exclusively deal with such
activities
The concept of passive infrastructure sharing is increasingly gaining market acceptancein India So far it has been largely limited to bilateral sharing between operators in the
form of barter where the operators split the site related CAPEX and OPEX costs The
available information suggests that about 25 of the existing 90000 tower sites in India
are currently being shared for passive infrastructure predominantly in rural areas and
small towns
43 Introduction to the business
BPTL is an Infrastructure Provider company that builds owns operates and maintains
passive network infrastructure on a shared basis for mobile telecom operators and ITES
providers Its objective is to provide network design and planning network deployment
882019 Major Project (Ramit)
httpslidepdfcomreaderfullmajor-project-ramit 3062
21
network operations amp maintenance infrastructure management application management
and professional services to teleco m operators and enterprises
The company is planning to raise capital in the form of equity and debt to start its
operation by Aug 09 ABC rsquos vision is to provide world class managed infrastructure ampallied services to the service providers to optimize their service delivery capability In the
initial years of operation the company will focus on telecom sector with almost 100 of
its proposed capital expenditure till FY 14 earmarked for developing and owning passive
infrastructure for sharing among mobile service providers
44 Business Proposal
ABC will provide passive telecom infrastructure on build own operate (BOO) basis inboth ground based (GBS) as well as roof-top sites (RTS) It will undertake full range of
responsibilities in building owning and maintaining the sites and will serve as a single
window one-stop-shop provider of infrastructure services Typical responsibilities are
summarized below
Site planning keeping in view the network rollout plans of prospective customers
Site acquisition including entering into long-term agreements with land owners
Obtaining of necessary regulatory approvals
Erect ion and commissioning of tower and allied equipment
Provision of support services such as back-up power air-conditioning and
security
Provision of turnkey solutions to telecom companies such as sourcing of
equipment testing and maintenance
882019 Major Project (Ramit)
httpslidepdfcomreaderfullmajor-project-ramit 3162
22
Bharat Telemast Private Limited will identify the sites required for setting up the Passive
infrastructure by first of all getting a commitment from one operator who is called as
ldquoAnchor Operatorrdquo Then Bharat Telemast will go ahead to lease (or) buy out the site as
appropriate and commences construction of the cellular sites But the Cellular site will betypically designed for three to four operators While construction is in progress the
marketing team will work towards getting the second and third operator But care will be
taken in such a way that at least two operators are available at the time of completion of
construction
45 Sources of revenue
1 Infrastructure Provisioning Fees ndash fee paid by the operators on a monthly basisWith annual escalation
2 Site lease rental ndash Paid at actual on a monthly basis
3 Operations and maintenance charges Paid on a monthly basis
4 The contract also provides a fixed annual escalator
46 Attractiveness of business model
Stable and predictable cash flow business Once a tower asset is rented out it
usually generates a stable and predictable cash flow in the form of tower rentals
from occupants over the term of the MSA between the two parties
Low working capital requirement ABC rsquos business model is also characterized
by low working capital requirements as most of the operating expenses (such aselectricity and fuel and other variable operating expenses) are reimbursable by the
tenants on actual basis Moreover BPTL is may also be able to get rentals for the
towers in advance and also obtain better credit terms from their suppliers thus
further improving their working capital cycle
882019 Major Project (Ramit)
httpslidepdfcomreaderfullmajor-project-ramit 3262
23
High incremental profitability The operating costs associated with this
business are largely fixed in nature Thus each increment in tenancy is
accompanied by a minimal increase in costs This leads to a more thanproportionate increase in profits for every increase in occupancy
Reduction in capital investments due to present market conditions Due to
present market situation average capital requirement for RTT and GBT sites have
dropped from 2 million and 4 million to 15 million and 33 million ABC wishes
to grab this opportunity which will result in competitive advantage in near future
Extensive usage While on an average a GSM BTS can handle around 100-
1100 subscribers but in the case of high usage areas the figure can be as low as
600-700 subscribers which means a larger number of cell sites would be required
for the same area Moreover the country has the problem of spectrum scarcity
which increases the requirement of towers to maintain a reasonable leve l of
service quality
New entrants Many operators including Vodafone Essar Limited Idea Cellular
Limited Aircel Cellular Limited and Sistema Shyam Teleservices Limited have
received licenses as well spectrum in new circles which would enable them to
become pan-India operators in the next one-two years Also new licenses have
been issued to new players such as Unitech Swan Telecom and S Tel Limited
Given the significant expansion plans of new entrants over the medium term and
the need for them to optimize investments in order to maintain returns demand
for towers is expected to report a sharp increase
Shorter rollout time Indian telecom industry is highly competitive and doing
business for new entrant may not be easy Shorter network-rollout time would be
a critical success factor for the new entrants and a longer rollout time could meanloss of substantial market share to other operators Tower companies allow
players to start operations in a particular region just by installing their electronics
on the ready-to-use towers thereby significantly shortening the rollout time
New technologies 3G services are already launched in the country and to
augment their services various operators plan to launch Wi-Max services as soon
882019 Major Project (Ramit)
httpslidepdfcomreaderfullmajor-project-ramit 3362
24
as they receive additional spectrum from Government This would further
increase the demand for sharing of passive infrastructure
47
Expansion Schedule
BPTL would rollout both RTT and GBT sites of which the RTT sites GBT sites
normally would have a tower height of 50 meters or 60 meters depending on the need for
additional height for installation of microwave antennae based on the location of the site
and number of tenants on the cell site Details of BPTLrsquos expansion plan are summarized
below
Table 41 Expansion PlanExpansion Schedule 2009-10 2010-11 2011-12 2012-13 20013-14
GBT
Addition 210 700 1400 2450 3850
Total 210 910 2310 4760 8610
RTT
Addition 90 300 600 1050 1650
Total 90 390 990 2040 3690
48 Proposed Services
As indicated earlier ABC proposes to provide passive telecom infrastructure on a
sharing co-location basis to cellular operators The sites would either be Ground Based
Sites (GBS) or Roof Top Sites (RTS) As the sites are meant for co-location of the active
components of two to three operators they would be built to either 2-Tenant or 3-Tenant
specifications
The different components of the passive infrastructure facility and the related services
that would be offered by BPTL to the operators are as under
Infrastructure provisioning comprising
882019 Major Project (Ramit)
httpslidepdfcomreaderfullmajor-project-ramit 3462
25
Communication tower built to host multiple antennae
Weather-proof communication shelter with air-conditioning and power backup
arrangement
Diesel generating set and battery bank for power backup
A mobile standby generator to act as backup in case o f breakdown
Warehousing facility
Infrastructure operations and maintenance including
Regular operations and maintenance of the facility
Security of all the equipments at the site at all timesA dedicated team of technicians for a group of 40-50 sites to ensure effect ive and
efficient functioning of the components at all times
49 Proposed Organizational Structure
A senior management team will work under the leadership of the ldquoChief Operations
Officerrdquo who will be responsible for smooth implementation of proj ect activities He willalso assist the managing director in marketing This team will coordinate with Stallion
Telecom Pvt Ltd which will take over the role of procuring Capital Equipments
Senior management will consists of project manager infrastructure manager commercial
manager and head (legal and company affairs Apart from this there will be a requirement
Chief OperatingOfficer
Project Manager Infrastructure
Manager
Commercial
Manager (projects)
Head (Legal and
Company Affairs)
882019 Major Project (Ramit)
httpslidepdfcomreaderfullmajor-project-ramit 3562
26
of security sentries (3 per GBT site) supervisors (one for every 10 sites) and cluster
manager (one for every 50 sites)
Bharat Telemast will carry out the complete Project execution with the assistance of third party ldquoQuality control organizationrdquo and a third party ldquoProject management teamrdquo
Quality control and project management activities will be o utsourced to a third party
882019 Major Project (Ramit)
httpslidepdfcomreaderfullmajor-project-ramit 3662
27
5 METHODOLOGY
The changing face of infrastructure services creates a complex situation which demands
greater understanding of roles of competition regulatory structures and modes of
financing Knowledge of such things is a key decisive factor in building confidence
among investors promoters and government In project finance the project its assets
contract and cash flows are separated from promoter in order to permit credit appraisal
or loan to the project
As part of the financial feasibility analysis a series of related financial statements based
on projected sources and uses of funds during the development and operating phaseproject were created Financial statements consist of expenses associated with
development activities including capital costs like acquisition of land for GBT sites cost
of tower generator shelter batteries etc Most of the data regarding capital costs are
obtained from the promoter of ABC Limited All these capital costs related details are
provided in annexure 1
Assumption regarding depreciation capital structure operating expenses expansion
schedule tenancy ratios tariff or rent operatorrsquos fees and loan amortization schedule are
obtained from professional accountants Promoter and bankers of ABC Limited
Due to unknown factors that could influence the cost of towers or fees associated with
completing the project (soft costs) contingency costs were estimated at 5 of hard and
soft costs respectively If contingency is set too low developers could easily encounter
funding shortfalls upon slight changes in market forces All other costs were estimated
based on talking with industry professionals (Promoters)
A detailed financial model was prepared based on existing accounting standards and
following financial ratios were estimated
882019 Major Project (Ramit)
httpslidepdfcomreaderfullmajor-project-ramit 3762
28
EBITDA margin Profit and loss accounts for the estimated project period (15
Years) were prepared based on which estimated earnings before interests tax
depreciat ion and amortization were calculated for each year Detailed PampL
balance sheet and cash flow statements are provided in annexure 2 3 and 4
EBITDA = Total Revenue ndash (Variable expenses + Fixed Expenses)
EBITDA margin = EBITDA Total Revenue
PAT margin PAT is calculated by subtracting interests pa id on capital debt and
working capital debt depreciation and applicable corporate income tax from
EBITDA
PAT = EBITDA ndash Interest Payable ndash Depreciation ndash Income tax
PAT margin = PATTotal Revenue
Working Capital Working capital requirement is calculated by subtract ing
current liabilities from current assets Current assets are estimated based on 30
days cash requirement and current liabilities are estimated as half of salary
monthly expenses
WC = Current Assets ndash Current Liabilities
UFCF It is defined as the free cash flows available to the firm if the firm has
zero debt liability Purpose of ca lculat ing UFCF for project period is to determinethe project IRR
UFCF = PAT + Depreciation + Interest (tax adjusted) + Release of WC + Salvage
value of the assets ndash CAPEX ndash Change in WC
882019 Major Project (Ramit)
httpslidepdfcomreaderfullmajor-project-ramit 3862
29
LCFF It is defined as the cash floes available to the firm after paying interests on
long term and short term debts
LCFF = UFCF ndash Interest (tax adjusted)
FCFE It is defined as the free cash flow available to equity holders It is
determined to ca lculate equity IRR for equity investors It also includes the tax
benefits which are available as per the Income Tax Act
FCFE PAT + Depreciation + Salvage Value ndash Equity Investment ndash Long term debt
repayment
PIRR Project IRR is defined as the discount rate at which NPV (Net Present
Value) of UFCF is zero It is calculated by using following formula
UFCF 1 (1+PIRR) 0+ UFCF 2 (1+PIRR) 1+ UFCF 3 (1+PIRR) 2+ helliphelliphelliphelliphelliphellip = 0
UFCF 1 = UFCF at the end of first year of operation
UFCF 2 = UFCF at the end of second year of operation
PIRR = Project IRR
EIRR Equity IRR is defined as the discount rate at which NPV of FCFE is zero
It is calculated by using following formula
FCFE1 (1+EIRR) 0+ FCFE 2 (1+EIRR) 1+ FCFE 3 (1+EIRR) 2+ helliphelliphelliphelliphelliphellip = 0
FCFE1 = FCFE at the end of first year of operation
FCFE2 = FCFE at the end of seco nd year of operation
EIRR = Equity IRR
882019 Major Project (Ramit)
httpslidepdfcomreaderfullmajor-project-ramit 3962
30
WACC It is de fined as the percentage of return expected by the investors who
otherwise would have earned some return by investing in some other project
WACC = Cost of Debt (Debt Capital) + Cost of equity (Equity Capital)
882019 Major Project (Ramit)
httpslidepdfcomreaderfullmajor-project-ramit 4062
882019 Major Project (Ramit)
httpslidepdfcomreaderfullmajor-project-ramit 4162
32
62 Funding planAs the telecom sites are rolled out over a 5 year period till FY 2014 investment will be
required for each year ABC Limited will start generating profits from FY 10 only Such
internally generated cash accruals will be ploughed back into the business to meet part of
the project cost Investment required for each year is tabulated below
Table 61 Funding ProposalMillion INR FY 10 FY 11 FY 12 FY 13 FY 14
GBT Tower (Additional) Nos 210 700 1400 2450 3850
RTT Tower (Additional) Nos 90 300 600 1050 1650DE ratio 233 233 233 233 233
Additional CAPEX 83892 279374 558748 977809 1536557
Debt 58725 195562 391124 684466 1075590
Equity 25168 83812 167624 293343 460967
63 Results
Based on assumptions given in Annexure 1 a detailed financial model was preparedResults of the financial model such as PampL account Balance Sheet and cash flow
statements are provided in Annexure 2 3 and 4 Forecasts for the key financial figures for
first five years are provided in the Table below
Forecasts
Table 62 Income StatementMillion INR FY-10 FY11 FY12 FY-13 FY-14
Sales 7124 50511 156766 347476 667700
Cost of sales 1950 13852 39252 87612 170021
Gross 5174 36659 117514 259864 497679
7263 7258 7496 7479 7454
Admin costs 112 179 190 203 216
882019 Major Project (Ramit)
httpslidepdfcomreaderfullmajor-project-ramit 4262
33
Finance cost 0 021 7401 31330 77725
Taxation 170 4233 14536 29073 53547
PAT 2454 19458 59470 122096 223267
As shown in Table above during the expansion period revenue will grow exponentially
In the first year of operation ABC will earn a revenue of INR 7124 million from 300
(210 GBT and 90 RTT) sites with a tenancy ratio of 15 for GBS and 17 for RTS In the
first 2 years of operation the company will not pay any interest on long term debt due to
2 years moratorium period Major cost associated with the project is depreciation due to
which PAT is lower than the operating profits But cash flows to the firm are enough to
result in reasonable returns
Table 63 Balance Shee tYear ending Mar-10 Mar-11 Mar-12 Mar-13 Mar-14
AssetsGross Block 75742 328216 833164 1716823 3105430Accumulated depreciation 2439 15208 51125 128287 271212Net Block 73303 313009 782040 1588536 2834219Net Working Capital 064 241 620 1335 2515Cash Balance 12979 72089 216513 488856 947982
Total Assets 86346 385339 999172 2078727 3784715LiabilitiesEquity 25168 108980 276604 569947 1030914Reserves amp Surplus 2454 21912 81381 203477 426745Long term Debt 58725 254286 640722 1304302 2325171WC Borrowings - 161 465 1001 1886Total Liabilities 86346 385339 999172 2078727 3784715
Note All figures are in Million INR
Table 64 Key financial ratiosMar-11 Mar-12 Mar-13 Mar-14 Mar-15
Revenue Growth 60902 21036 12165 9216 3890EBITDA Growth 62061 22161 12132 9158 4020
PAT Growth 69293 20564 10531 8286 2955
As shown in table above increase in EBITDA is higher than that of revenue This is due
to better operational efficiency of ABCrsquos management and economies of scale S imilarly
882019 Major Project (Ramit)
httpslidepdfcomreaderfullmajor-project-ramit 4362
34
increase in PAT is lesser than that of EBITDA because of high depreciation and interest
expenses
Table 65 Pr ofitability r atios
Mar-11 Mar-12 Mar-13 Mar-14 Mar-15
EBITDA Margin 7222 7484 7473 7450 7520
PAT Margin 3852 3794 3514 3344 3119Return on Net Worth 622 760 769 788 1087
Key profitability ratios are shown in table above Return on net worth in the initial years
is lower because of the ambitious expansion plans of ABC Limited Thereafter return on
net worth increases with increase in PAT
Returns on Investment
Table 66 Financial returnsFinancial Indicators
Project IRR 1813Equity IRR 3609
64 Sensitivity Analysis
A sensitivity analysis has been carried out on the project financials to determine theimpact of key variables on the financial indicators namely
Project IRR
The key variables on which sensitivity analysis have been carried out areCapital expenditure for GBS and RTS1st and 2 nd tenant tariff for GBS1st and 2 nd tenant tariff for RTSTenancy Ratio
Similarly sensitivity analysis has been carried out forEquity IRR
The key variables on which sensitivity analysis have been carried out for EIRR are
Capital structure and interest rate for capital debtRepayment period and moratorium period
882019 Major Project (Ramit)
httpslidepdfcomreaderfullmajor-project-ramit 4462
35
The impact on the financial indicators is shown below
Figure 6-1 Project IRR vs GBT and RTT CAPEX
As shown in Figure 6-1 project IRR is more sensitive to change in CAPEX of RTT sitesas compared to change in CAPEX of GBT sites because tenancy ratio and tariff for RTTsites are higher than those of GBT sites
882019 Major Project (Ramit)
httpslidepdfcomreaderfullmajor-project-ramit 4562
36
Figure 6-2 Project IRR vs GBT Tariff for 1 st tenant (X-axis) and 2 nd tenant (right-hand side)
As shown in Figure 6-2 project IRR varies linearly with GBT tariff In the best casescenario when GBT tariff for 1 st tenant is INR 34000month and GBT tariff for secondtenant is INR 26000month Project IRR is 2101
Figure 6-3 Project IRR vs RTT Tariff for 1 st tenant (X-axis) and 2 nd tenant (right-hand side)
As shown in Figure 6-2 project IRR varies linearly with RTT tariff In the best casescenario when RTT tariff for 1 st tenant is INR 24000month and RTT tariff for second
882019 Major Project (Ramit)
httpslidepdfcomreaderfullmajor-project-ramit 4662
37
tenant is INR 20000month Project IRR is 1932 Project IRR is more sensitivetowards RTT tariff than GBT tariff because in practical business situation RTT siteshave a tenancy ratio of more than two due to which effect of tariff for 1 st tenant almostget nullified after few years
Figure 6-4 Project IRR vs Tenancy ratio for RTT sites (X-axis) and GBT sites
As shown in Figure 6-4 project IRR is very sensitive to tenancy ratio In the best casescenario where GBT sites have a tenancy ratio of 2 and RTT sites have a tenancy ratio of 3 project IRR can be as high as 20
Figure 6-5 Equity IRR vs long term debt interest rate for different leverage level
882019 Major Project (Ramit)
httpslidepdfcomreaderfullmajor-project-ramit 4762
38
As shown in figure 6-5 equity IRR is more sensitive to interest rate on long term debt forhigh level of leverage (lower debt equity ratio) because as the debt equity ratio increasesinterest paid on long term debt also increases significantly
Figure 6-6 Equity IRR vs long term debt repayment period at different level of moratoriumperiods
As shown in figure 6-6 Equity IRR increases with increase in moratorium period anddebt repayment period The variation is from 1654 to 60 for worst case and best casescenarios
882019 Major Project (Ramit)
httpslidepdfcomreaderfullmajor-project-ramit 4862
39
7 RISK ASSESSMENTRisk Mitigation strategyExecution Risk
(Project management landacquisition etc)
Management of ABC has proven expertise in
telecom infrastructure rollout and has executedvarious projects with large telecom operators andMNC vendorsABCrsquos top management team consists of a groupof professionals drawn from leading telecomInfrastructure Company who have immenseexpertise and experience in rolling out telecominfrastructure projects
Market Risk (No entry barriers operators may
share infrastructure betweenthemselves large players withhigh capital may increasecompetition)
India has a huge potential for telecominfrastructure market With increasing
competition falling tariffs and pressure onmargins telecom service providers are beingforced to increase their focus on marketing andreduce their expensesExperienced management healthy capital back-up effective presence in the telecominfrastructure market and value added services atrelatively lesser cost will help ABC to meet theset targets
Financing Risk
(Availability of equity capitalavailability of long term debtinterest rate and moratoriumperiod)
ABC is seeking private equity partner to secure
equity capital Company has already entered intoNDA with 2 major investorsLong term debt at an interest rate of 125 canbe easily arranged because of the credibility of the promoters in the marketMany other similar firms like Indus and GTLhave already secured long term debt for amoratorium period of 2 years Promoters of ABCLimited are confident to secure a long term debtwith a moratorium period of 2 years and apayback period of 8 years
ABC Limited would minimize the workingcapital requirements of its business by securingrentals and operating revenues in advance fromits clients and or by suitably structuring itspayment liabilities to match its cash inflows
Commercial Risk (Tenancy ratio and tariff forGBS and RTS)
ABC would aim to enter into long term contractswith the ldquoanchor tenantrdquo operator and thenrollout the infrastructure so that at least single
882019 Major Project (Ramit)
httpslidepdfcomreaderfullmajor-project-ramit 4962
40
occupancy of each site is ensured at all t imesPromoters will use its knowledge of the businessand its expertise to identify and roll out sites inlocations which have strong multi- tenancypotential to minimize occupancy risk
Revenue Risk (Operating fees may decreasecredit worthiness of the clientsdelay in payment of rentals)
As per the industry sources till now not even asingle operator have dishonored the long termlease contractThe credit risk is diversified as there will bemultiple operatorsABC would aggressively market to get 3G andWiFi broadcasters to use the sites and earnadditional revenues in addition to the assumedrevenue streams
Natural Calamities Risk The Company shall maintain insurance for thesites against these risks and the cost of insurancewill be priced in and passed on to the tenants
882019 Major Project (Ramit)
httpslidepdfcomreaderfullmajor-project-ramit 5062
41
8 CONCLUSION
India is the fastest growing wireless telecom market in the world The continuing
growth in the number of wireless subscribers and MoUs and increasing trend of
outsourcing of business processes to India has led to growing demand for large
investments in the telecom infrastructure in the country
However with increasing competition falling tariffs and pressure on margins
telecom service providers are being forced to increase their focus on marketing
customer acquisitions and branding and minimize their efforts and overheads in
project management and asset acquisition
Further with rising prices of steel cement and real estate the cost of developing
and owning passive infrastructure is increasingly becoming a costly proposition
for most operators and service providers
The compulsion on the part of service providers to reduce their operating costs
and capital expenditure requirements has led to opportunities in passiveinfrastructure outsourcing to independent third party infrastructure providers and
also sharing the infrastructure with other service providers It is expected that
cellular operators will outsource their communications site infrastructure needs as
a means of accelerating access to their markets and preserving capital rather than
constructing and operating their own communications sites and maintaining their
own communications sites service and deve lopment capabilities
Passive infrastructure is highly capital intensive and an integral part of the cellular
service providersrsquo networks Yet being a simple and low technology asset it is
amenable to outsourcing and sharing By transferring the responsibility of
ownership development and maintenance of passive infrastructure service
882019 Major Project (Ramit)
httpslidepdfcomreaderfullmajor-project-ramit 5162
42
providers have an opportunity to transfer a substantial part of their business risk to
third parties
Most telecom operators are facing capacity constraints on their networksCoverage obligations increasing pressure to improve network quality and
competition has led to aggressive roll out plans by existing cellular operators
Installation of cell sites has become a cumbersome process as there are a number
of clearances required and involves labor-intensive micro management
Availability of ready infrastructure from third party providers would enable the
operators to reduce their time to market and accelerate their access to their
customers Cellular service providers generally want to move quickly when
adding more sites and co-location on an existing site is always faster than
building
Ownership and maintenance of telecom towers and other infrastructure by third
parties is an established practice in developed nations like USA and is
increasingly gaining market acceptance in India
The Indian government is seriously considering promoting the infrastructure
sharing route between the telecom operator and private players to achieve future
national tele-density targets and improve rural telecom penetration
ABC being an independent entity with no business conflicts with other service
providers in the telecom space will be best positioned and have an early mover
advantage to capitalize on this emerging opportunity
Further the task of operating and maintaining the passive infrastructure in the cell
is increasingly becoming a cumbersome exercise for the service providers to
handle ABCrsquos composite offering to build passive infrastructure for the cellular
operators and also operate and maintain them will provide a turnkey solution to
address the infrastructure needs of the service providers
882019 Major Project (Ramit)
httpslidepdfcomreaderfullmajor-project-ramit 5262
43
The business model proposed to be followed by ABC is fairly simple with stable
and predictable cash flows as is the case with the business model of the tower
renting companies in USA Most contracts are long term for a period 10 or moreyears with annual price escalators generally ranging from 3 to 4 However
wireless carriers normally tend to renew rentals because suitable alternative sites
may not exist or be available and repositioning a site in a carrierrsquos network is
expensive and may adverse ly affect network quality
Site ownership and operations is a ldquoscalerdquo business operating administration
marketing expenses etc do not rise as quickly as revenues when portfolios are
expanded Incremental operating costs associated with adding wireless tenants to
a communications site are minimal Therefore as additional tenants are added to a
site the substantial majority of incremental revenue contributes to margin
expansion Most tower companies have high EBITDA margins as may be seen
from the financial indicators of some of the tower rental companies in USA
It is expected that site location and capacity price and quality of service and
successful execution of contracts will be the most significant competitive factors
in this business
ABCrsquos revenue and returns on investment will be primarily driven by its ability
to
o Increase the utilization of the space and infrastructure capacity owned by it by
increasing the number of tenants per site and renting out to maximum number
of users As discussed above return on capital employed (PIRR and EIRR) arevery sensitive to tenancy ratio In worst case scenario project IRR can be as
low as 8 and in the best case scenario it can be as high as 20
o Develop acquire sites of strategic importance and high growth potential that
will enable them to secure better commercial terms from users and attract
more number of tenants Infrastructure provisioning fees rentals for sites are
882019 Major Project (Ramit)
httpslidepdfcomreaderfullmajor-project-ramit 5362
44
extremely location sensitive There is a potential to acquire more land than
that of required to capitalize on the increase in real estate prices
o Develop sites in a cost effective manner ABC would consider purchasing
land only for those GBS sites which have sufficient demand and arestrategically located Else for most of its sites land will be leasehold As
shown above returns (PIRR and EIRR) are very sensitive to capital costs In
the worst case scenario project IRR can be as low as 15 whereas it can as
high as 27 in the best case scenario
o Negotiate and secure long term contracts with good credit quality users with
built in price escalation provisions to mitigate financing risk
o Leverage and secure long term financing at attractive terms and involve in
active treasury management to keep low financing cost Results of the
sensitivity analysis indicate that equity IRR can be as high as 60 foe a
moratorium period of 4 years and interest rate of 10
o Minimize working capital requirements
o Maintain low operating and administration expense
o Secure better OampM margins from operators and retain a healthy share of it in
ABC
o Maintain high service standards and build strong customer relationships
The business would have the potential to capture new revenue opportunities
around the existing assets As demand for towers is expected to grow and as
operators migrate to speedier next-generation wireless technologies they will
need the towers and associated passive infrastructure to transmit their new
services in addition to their existing offerings In addition to increasing capacity
and coverage and improving the quality of their networks cellular serviceproviders are deploying high speed data networks driving incremental demand of
sites The business therefore has potential upsides in the form of adding
customers (tenants) in wireless broadband third generation (ldquo3Grdquo) and wireless
data capabilities and also other incremental value propositions by way of hosting
882019 Major Project (Ramit)
httpslidepdfcomreaderfullmajor-project-ramit 5462
45
Billboards Hoardings etc in some of the high visible sites owned and maintained
by it
Based on the assumptions and subject to satisfactory resolution of the key risks
factors project cash flows will be able to meet debt service obligations
This business model is a lucrative investment option for a private equity player
because valuation of each site will increase in the coming years due to
improvement in market conditions increase in the value of land and increase in
the demand for passive infrastructure in rural and semi-urban areas
882019 Major Project (Ramit)
httpslidepdfcomreaderfullmajor-project-ramit 5562
46
REFERENCESAnjan G V A amp N M (2009) telecom infrastructure industry in india GurgaonICRA
Bessler W Norsworthy J amp Shusterman T (2001 12 1) Mergers in the UStelecommunications industry and market valuationeffects IEEE p 288
COAI (2009 march 14) Subscriber Figures Retrieved march 14 2009 fromCOAIcom httpwwwcoaicomstatisticsphp
IDA (2009 march 23) Highlights Retrieved march 23 2009 from idagovsghttpwwwidagovsghomeindexaspx
K R (2008) Time for new business model Delhi Cybermedia
MAXIS (2009 march 8) the malaysian telecommunications industry Retrieved march9 2009 from maxiscommyhttpwwwmaxiscommypersonalabout_usinvestorprospectusprospectus4pdf
P J amp Lisa A (2009) Stimulas spending and American Telecom Industry USACoracle group
PwC (2009 march 12) Indian Telecom Industry Gurgaon Harayana IndiaRamachanran (2009 march 1) Investment in Telecom Infrastructure sector (M RInterviewer)
Vogelsang I (2002) The German Telecommunications Reform Verein fuumlr Socialpolitik (p 26) Innsbruck Boston Press
882019 Major Project (Ramit)
httpslidepdfcomreaderfullmajor-project-ramit 5662
47
ANNEXURES
ANNEXURE 1 Key Assumptions
The occupancy of each site by single two three operators for green-field sites is assumed
to be as follows
Table 91 Expected Tenancy RatiosFY 10 FY 11 FY 12 FY 13 FY 14 FY15
GBT Tenant
Ratio 150 150 170 170 170 200
Single Operator 50 50 30 30 30 0
Two Operator 50 50 70 70 70 100
RTT Tenant
Ratio 170 170 200 200 200 250
Single Operator 30 30 0 0 0 0
Two Operator 70 70 100 100 100 50
Three Operator 0 0 0 0 0 50
From FY 15 onwards tenancy ratio of 2 and 25 for GBT and RTT sites is cons idered
882019 Major Project (Ramit)
httpslidepdfcomreaderfullmajor-project-ramit 5762
48
Capital costs related assumptions are tabulated below
Table 92 GBT and RTT Capital Cost
The lease rentals for RTT sites are reimbursed from the operators and therefore have not
been factored in the revenues as well as the expense For GBT sites land purchase cost of
035 millions assumed which has been escalated by 6 annually to determine the
salvage value of assets
GBT Capital Costs
Million
INR
Delivery cost of Ground Based
Tower (GBT)063
Delivery cost of Generator 030
Civil Work 040Shelter 012
Electrical Works 030
Other Equipments (UPS Battery
etc)045
Construction cost 045
Land 035
Contingency amp Financial Charges 035Total cost 335
RTT Capital Costs
Million
INR
Delivery cost of Roof Top
Tower (RTT) 030
Delivery cost of Generator 020
Civil Work 020Shelter 012
Electrical Works 030
Other Equipments (UPS
Battery etc) 030
Construction cost -
Land -
Contingency amp FinancialCharges 008
Total cost 150
882019 Major Project (Ramit)
httpslidepdfcomreaderfullmajor-project-ramit 5862
49
Ope rating costs related assumptions are tabulated below
Table 93 Operating CostsOperating Costs
Security Sentries (INRMonth) 4000
Supervisors (INRMonth) 6000
Cluster Manager One for Fifty Towers (INRMonth) 15000
Annual increase 500
Number of Security Sentries per tower 300
Number of supervisors per tower 010
Number of C luster manager per tower 002
Fixed Expenses
Selling amp Maintenance (INRMonth) 4000000
Annual Escalation 5
Administration overhead (INRMonth) 10000000Annual Escalation 7
AMC Cost of Generator 15 (cost of generator)
Annual Escalation (AMC) 3
For RTT sites security sentries are not required because it will be the responsibility of
the site owner A supervisor will for every 10 sites and a cluster manager for every 50
sites will be required
882019 Major Project (Ramit)
httpslidepdfcomreaderfullmajor-project-ramit 5962
50
Table 94 Long term debtInterest Rate 125 per annum
Moratorium 2 years
Repayment Period 8 years
Tariff related assumptions and date of operations are tabulated below
Table 95 GBT and RTT Tariff Table 96 Life of the projectTariff Plan
Tariff (INRMonth)
No of
operators GBT RTT
1 28000 18000
2 22000 14000
3 0 12000
Annual
increase 3 3
Commercial Operation Date 1-Aug-09
Quarter Ending 30-Sep-09
FY ending COD 31-Mar-10
Project life years 15
End of commercial
operations31-Aug-24
Quarter ending commercial
operations30-Sep-24
FY ending comme rcial
operations31-Mar-25
882019 Major Project (Ramit)
httpslidepdfcomreaderfullmajor-project-ramit 6062
51
Annexure 2 Profit amp Loss accountsTable 97 Profit amp loss account statement
Income Statement (MNINR)Year ending Mar-10 Mar-11 Mar-12 Mar-13 Mar-14 Mar-15
RevenueGBT 406350 28811 89080 197447 379409 527015Operator Fees (GBT) 1411 10004 30678 67998 130664 179664RTT 1209 8575 27269 60443 116146 164264
Operator Fees (RTT) 440 3121 9739 21587 41481 56466Net Revenue 7124 50511 156766 347476 667700 927410
Expenses
VariableSecurity Sentries 1355 9790 28339 64033 125433 158238Supervisors 097 699 2024 4574 8959 11303Cluster Manager 048 350 10 12 2287 4480 5651AMC Cost of Generator 450 3013 7877 16719 31148 54541Sub-total 1950 13852 39252 87612 170021 229734
Fixed
Selling amp Maintenance(INRMonth) 032 050 053 056 058 061
Administration overhead(INRMonth) 080 128 137 147 157 168
Sub-total 112 179 190 203 216 230
EBITDA 5062 36480 117324 259661 497464 697447
Interest on LT loan - - 7341 31200 77479 156198Interest on ST loan - 021 060 130 245 361
EBDT 5062 36459 109923 228331 419739 540888Depreciation 2439 12769 35917 77162 142925 174006
EBT 2624 23691 74006 151169 276814 366881Income Tax 170 4233 14536 29073 53547 77634
PAT 2454 19458 59470 122096 223267 289247
882019 Major Project (Ramit)
httpslidepdfcomreaderfullmajor-project-ramit 6162
52
Annexure 3 Balance sheet
Table 98 B alance sheetsYearend Balance Sheet (MNINR)Year ending Mar-10 Mar-11 Mar-12 Mar-13 Mar-14 Mar-15
AssetsGross Block 75742 328216 833164 1716823 3105430 3105430Accumulated depreciation 2439 15208 51125 128287 271212 445218Net Block 73303 313009 782040 1588536 2834219 2660212Net Working Capital 064 241 620 1335 2515 3707Cash Balance 12979 72089 216513 488856 947982 1294734Total Assets 86346 385339 999172 2078727 3784715 3958653
LiabilitiesEquity 25168 108980 276604 569947 1030914 1030914Reserves amp Surplus 2454 21912 81381 203477 426745 715992Long term Debt 58725 254286 640722 1304302 2325171 2208967WC Borrowings - 161 465 1001 1886 2780Total Liabilities 86346 385339 999172 2078727 3784715 3958653
882019 Major Project (Ramit)
httpslidepdfcomreaderfullmajor-project-ramit 6262
Annexure 4 Cash flow statement
Table 99 Cash flow statements
Year ending Mar-10 Mar-11 Mar-12 Mar-13 Mar-14 Mar-15
InflowsPAT 2454 19458 59470 122096 223267 289247Depreciation 2439 12769 35917 77162 142925 174006Tax adjusted interest - 014 4959 20991 52076 104895Release of WC - - - - - -Salvage Value - - - - - -Sub-Total 4893 32241 100345 220249 418268 568148
OutflowsCapex 75742 252474 504948 883659 1388607 -Change in WorkingCapital 064 177 379 715 1180 1192
Sub-Total 75806 252651 505327 884374 1389787 1192
UFCF (70913) (220410) (404982) (664125) (971519) 566956LFCF (70913) (220424) (409940) (685116) (1023595) 462062
882019 Major Project (Ramit)
httpslidepdfcomreaderfullmajor-project-ramit 2662
17
Bharti Airtel Limited Reliance Communications Limited and Tata Teleservices Limited
have hived off their tower assets into separate tower infrastructure subsidiaries namely
Bharti Infratel Limited Reliance Infratel Limited and Wireless TT Infoservices Limited
respectively Also Bharti Infratel Limited together with Vodafone Essar Limited and IdeaCellular Limited in a joint- venture agreement has created Indiarsquos largest tower
infrastructure company ndash Indus Towers Limited which has an estimated portfolio of
around 88000 towers (Anjan V amp N 2009) Whereas in past few years number of
independent tower infrastructure companies have ventured into the domestic telecom
tower industry These include GTL Infrastructure Limited Essar Telecom Infrastructure
Limited Xcel Telecom Private Limited (American Towers) Tower Vision India Private
Limited Aster Infrastructure Private Limited TVS Interconnect Systems Limited etc
Figure 3-6 Telecom Tower Growth Scenario
0
100
200
300
400
500
600
700
2008 2009 2010 2011 2012 T e
l e c o m
T o w e r s
( T h o u s a n
d s )
Source Telecom Regulatory Authority of IndiaAssumptions Subscriber growth rate of 28 till 2011-12
1400 subscribe per site
As shown above it is expected that in next 4-5 years there will be a requirement of
additional 85000 towers (both GBT and RTT) each year to meet the subscriber base of
800 million by 2011-12 (PwC 2009) This shows that huge investment have to be made
in Indian telecom Infrastructure sector in near future Now since both passive and active
882019 Major Project (Ramit)
httpslidepdfcomreaderfullmajor-project-ramit 2762
18
infrastructure sharing is a llowed (except spectrum) Independent service providers will be
benefited Increase in subscriber base introduction of new technologies like 3G Wi-max
etc and increase in market healthy market competition in telecom services sector will
drive the growth in telecom infrastructure sector
882019 Major Project (Ramit)
httpslidepdfcomreaderfullmajor-project-ramit 2862
19
4 BUSINESS PLAN
41 Passive Infrastructure
Mobile networks have base stations (or cell sites) which have active and passive
infrastructure components Active components include the antenna trans-receivers
switches feeder cables Node B and microwave radio equipments Passive (or non-
electronic) components include the land tower shelter air-conditioning equipment
diesel electric generator battery electrical supply technical premises and easements
pylons etc Passive infrastructure in a mobile network essentially involves acquiring land
setting up towers and electrical and civil works that needs to be in place before operators
can install the active infrastructure which brings mobile services to the consumers In atypical cell site build-out almost 65 of the total cost is attributed to passive
infrastructure and 35 to active infrastructure
42 Infrastructure Sharing
Mobile operators are required to setup more and more BTS (cell) sites due to the
exponential growth of mobile subscribers in India (currently growing at almost 15 4
million subscribers a month) and limited availability of spectrum B and C Circles (wheretraffic density may not be as high as metros and Circle A) are expected to drive future
subscriber growth and requirements for cell sites will be higher to ensure greater
coverage
However creating new infrastructure by each operator separately leads to d uplicat ing
huge capital investments It also contributes to mushroom growth of telecom towers and
deteriorating skylines in urban areas which has already led to some local municipal and
state governments to regulate and restrict the erection of new mobile towers
The continued pressure on cellular tariffs higher infrastructure costs for network
deployment particularly in semi-urban and rural areas and compelling need to reduce
4 As published in ET 8 th May 09 Edition
882019 Major Project (Ramit)
httpslidepdfcomreaderfullmajor-project-ramit 2962
20
time to market for network roll outs have led operators to share and even outsource their
infrastructure requirements from third party infrastructure providers like BPTL GTL and
Indus towers It promotes capital efficiency as it allows more than one service provider to
leverage and ride o n common infrastructure In its simplest form it involves two or moreoperators jointly using the common passive infrastructure in a cell site While viewed
largely as a measure to reduce capital and operating expense such sharing also leads to
improvement of service q uality (by ensuring site space for service providers and reducing
black spots) and the environment (by reducing number of cell sites and towers)
In outsourcing operators take passive infrastructure and tower space from third party
infrastructure companies on a monthly rental basis to host their radio and transmission
equipments Outsourcing provides significant benefits to operators It enables them tosave on capital expenses (it actually converts capital expense into operating expense in
the form of lease rentals) and focus on their core activities of sales marketing and
branding while leaving the cumbersome task of managing the site development process
and site operation and maintenance to third parties who exclusively deal with such
activities
The concept of passive infrastructure sharing is increasingly gaining market acceptancein India So far it has been largely limited to bilateral sharing between operators in the
form of barter where the operators split the site related CAPEX and OPEX costs The
available information suggests that about 25 of the existing 90000 tower sites in India
are currently being shared for passive infrastructure predominantly in rural areas and
small towns
43 Introduction to the business
BPTL is an Infrastructure Provider company that builds owns operates and maintains
passive network infrastructure on a shared basis for mobile telecom operators and ITES
providers Its objective is to provide network design and planning network deployment
882019 Major Project (Ramit)
httpslidepdfcomreaderfullmajor-project-ramit 3062
21
network operations amp maintenance infrastructure management application management
and professional services to teleco m operators and enterprises
The company is planning to raise capital in the form of equity and debt to start its
operation by Aug 09 ABC rsquos vision is to provide world class managed infrastructure ampallied services to the service providers to optimize their service delivery capability In the
initial years of operation the company will focus on telecom sector with almost 100 of
its proposed capital expenditure till FY 14 earmarked for developing and owning passive
infrastructure for sharing among mobile service providers
44 Business Proposal
ABC will provide passive telecom infrastructure on build own operate (BOO) basis inboth ground based (GBS) as well as roof-top sites (RTS) It will undertake full range of
responsibilities in building owning and maintaining the sites and will serve as a single
window one-stop-shop provider of infrastructure services Typical responsibilities are
summarized below
Site planning keeping in view the network rollout plans of prospective customers
Site acquisition including entering into long-term agreements with land owners
Obtaining of necessary regulatory approvals
Erect ion and commissioning of tower and allied equipment
Provision of support services such as back-up power air-conditioning and
security
Provision of turnkey solutions to telecom companies such as sourcing of
equipment testing and maintenance
882019 Major Project (Ramit)
httpslidepdfcomreaderfullmajor-project-ramit 3162
22
Bharat Telemast Private Limited will identify the sites required for setting up the Passive
infrastructure by first of all getting a commitment from one operator who is called as
ldquoAnchor Operatorrdquo Then Bharat Telemast will go ahead to lease (or) buy out the site as
appropriate and commences construction of the cellular sites But the Cellular site will betypically designed for three to four operators While construction is in progress the
marketing team will work towards getting the second and third operator But care will be
taken in such a way that at least two operators are available at the time of completion of
construction
45 Sources of revenue
1 Infrastructure Provisioning Fees ndash fee paid by the operators on a monthly basisWith annual escalation
2 Site lease rental ndash Paid at actual on a monthly basis
3 Operations and maintenance charges Paid on a monthly basis
4 The contract also provides a fixed annual escalator
46 Attractiveness of business model
Stable and predictable cash flow business Once a tower asset is rented out it
usually generates a stable and predictable cash flow in the form of tower rentals
from occupants over the term of the MSA between the two parties
Low working capital requirement ABC rsquos business model is also characterized
by low working capital requirements as most of the operating expenses (such aselectricity and fuel and other variable operating expenses) are reimbursable by the
tenants on actual basis Moreover BPTL is may also be able to get rentals for the
towers in advance and also obtain better credit terms from their suppliers thus
further improving their working capital cycle
882019 Major Project (Ramit)
httpslidepdfcomreaderfullmajor-project-ramit 3262
23
High incremental profitability The operating costs associated with this
business are largely fixed in nature Thus each increment in tenancy is
accompanied by a minimal increase in costs This leads to a more thanproportionate increase in profits for every increase in occupancy
Reduction in capital investments due to present market conditions Due to
present market situation average capital requirement for RTT and GBT sites have
dropped from 2 million and 4 million to 15 million and 33 million ABC wishes
to grab this opportunity which will result in competitive advantage in near future
Extensive usage While on an average a GSM BTS can handle around 100-
1100 subscribers but in the case of high usage areas the figure can be as low as
600-700 subscribers which means a larger number of cell sites would be required
for the same area Moreover the country has the problem of spectrum scarcity
which increases the requirement of towers to maintain a reasonable leve l of
service quality
New entrants Many operators including Vodafone Essar Limited Idea Cellular
Limited Aircel Cellular Limited and Sistema Shyam Teleservices Limited have
received licenses as well spectrum in new circles which would enable them to
become pan-India operators in the next one-two years Also new licenses have
been issued to new players such as Unitech Swan Telecom and S Tel Limited
Given the significant expansion plans of new entrants over the medium term and
the need for them to optimize investments in order to maintain returns demand
for towers is expected to report a sharp increase
Shorter rollout time Indian telecom industry is highly competitive and doing
business for new entrant may not be easy Shorter network-rollout time would be
a critical success factor for the new entrants and a longer rollout time could meanloss of substantial market share to other operators Tower companies allow
players to start operations in a particular region just by installing their electronics
on the ready-to-use towers thereby significantly shortening the rollout time
New technologies 3G services are already launched in the country and to
augment their services various operators plan to launch Wi-Max services as soon
882019 Major Project (Ramit)
httpslidepdfcomreaderfullmajor-project-ramit 3362
24
as they receive additional spectrum from Government This would further
increase the demand for sharing of passive infrastructure
47
Expansion Schedule
BPTL would rollout both RTT and GBT sites of which the RTT sites GBT sites
normally would have a tower height of 50 meters or 60 meters depending on the need for
additional height for installation of microwave antennae based on the location of the site
and number of tenants on the cell site Details of BPTLrsquos expansion plan are summarized
below
Table 41 Expansion PlanExpansion Schedule 2009-10 2010-11 2011-12 2012-13 20013-14
GBT
Addition 210 700 1400 2450 3850
Total 210 910 2310 4760 8610
RTT
Addition 90 300 600 1050 1650
Total 90 390 990 2040 3690
48 Proposed Services
As indicated earlier ABC proposes to provide passive telecom infrastructure on a
sharing co-location basis to cellular operators The sites would either be Ground Based
Sites (GBS) or Roof Top Sites (RTS) As the sites are meant for co-location of the active
components of two to three operators they would be built to either 2-Tenant or 3-Tenant
specifications
The different components of the passive infrastructure facility and the related services
that would be offered by BPTL to the operators are as under
Infrastructure provisioning comprising
882019 Major Project (Ramit)
httpslidepdfcomreaderfullmajor-project-ramit 3462
25
Communication tower built to host multiple antennae
Weather-proof communication shelter with air-conditioning and power backup
arrangement
Diesel generating set and battery bank for power backup
A mobile standby generator to act as backup in case o f breakdown
Warehousing facility
Infrastructure operations and maintenance including
Regular operations and maintenance of the facility
Security of all the equipments at the site at all timesA dedicated team of technicians for a group of 40-50 sites to ensure effect ive and
efficient functioning of the components at all times
49 Proposed Organizational Structure
A senior management team will work under the leadership of the ldquoChief Operations
Officerrdquo who will be responsible for smooth implementation of proj ect activities He willalso assist the managing director in marketing This team will coordinate with Stallion
Telecom Pvt Ltd which will take over the role of procuring Capital Equipments
Senior management will consists of project manager infrastructure manager commercial
manager and head (legal and company affairs Apart from this there will be a requirement
Chief OperatingOfficer
Project Manager Infrastructure
Manager
Commercial
Manager (projects)
Head (Legal and
Company Affairs)
882019 Major Project (Ramit)
httpslidepdfcomreaderfullmajor-project-ramit 3562
26
of security sentries (3 per GBT site) supervisors (one for every 10 sites) and cluster
manager (one for every 50 sites)
Bharat Telemast will carry out the complete Project execution with the assistance of third party ldquoQuality control organizationrdquo and a third party ldquoProject management teamrdquo
Quality control and project management activities will be o utsourced to a third party
882019 Major Project (Ramit)
httpslidepdfcomreaderfullmajor-project-ramit 3662
27
5 METHODOLOGY
The changing face of infrastructure services creates a complex situation which demands
greater understanding of roles of competition regulatory structures and modes of
financing Knowledge of such things is a key decisive factor in building confidence
among investors promoters and government In project finance the project its assets
contract and cash flows are separated from promoter in order to permit credit appraisal
or loan to the project
As part of the financial feasibility analysis a series of related financial statements based
on projected sources and uses of funds during the development and operating phaseproject were created Financial statements consist of expenses associated with
development activities including capital costs like acquisition of land for GBT sites cost
of tower generator shelter batteries etc Most of the data regarding capital costs are
obtained from the promoter of ABC Limited All these capital costs related details are
provided in annexure 1
Assumption regarding depreciation capital structure operating expenses expansion
schedule tenancy ratios tariff or rent operatorrsquos fees and loan amortization schedule are
obtained from professional accountants Promoter and bankers of ABC Limited
Due to unknown factors that could influence the cost of towers or fees associated with
completing the project (soft costs) contingency costs were estimated at 5 of hard and
soft costs respectively If contingency is set too low developers could easily encounter
funding shortfalls upon slight changes in market forces All other costs were estimated
based on talking with industry professionals (Promoters)
A detailed financial model was prepared based on existing accounting standards and
following financial ratios were estimated
882019 Major Project (Ramit)
httpslidepdfcomreaderfullmajor-project-ramit 3762
28
EBITDA margin Profit and loss accounts for the estimated project period (15
Years) were prepared based on which estimated earnings before interests tax
depreciat ion and amortization were calculated for each year Detailed PampL
balance sheet and cash flow statements are provided in annexure 2 3 and 4
EBITDA = Total Revenue ndash (Variable expenses + Fixed Expenses)
EBITDA margin = EBITDA Total Revenue
PAT margin PAT is calculated by subtracting interests pa id on capital debt and
working capital debt depreciation and applicable corporate income tax from
EBITDA
PAT = EBITDA ndash Interest Payable ndash Depreciation ndash Income tax
PAT margin = PATTotal Revenue
Working Capital Working capital requirement is calculated by subtract ing
current liabilities from current assets Current assets are estimated based on 30
days cash requirement and current liabilities are estimated as half of salary
monthly expenses
WC = Current Assets ndash Current Liabilities
UFCF It is defined as the free cash flows available to the firm if the firm has
zero debt liability Purpose of ca lculat ing UFCF for project period is to determinethe project IRR
UFCF = PAT + Depreciation + Interest (tax adjusted) + Release of WC + Salvage
value of the assets ndash CAPEX ndash Change in WC
882019 Major Project (Ramit)
httpslidepdfcomreaderfullmajor-project-ramit 3862
29
LCFF It is defined as the cash floes available to the firm after paying interests on
long term and short term debts
LCFF = UFCF ndash Interest (tax adjusted)
FCFE It is defined as the free cash flow available to equity holders It is
determined to ca lculate equity IRR for equity investors It also includes the tax
benefits which are available as per the Income Tax Act
FCFE PAT + Depreciation + Salvage Value ndash Equity Investment ndash Long term debt
repayment
PIRR Project IRR is defined as the discount rate at which NPV (Net Present
Value) of UFCF is zero It is calculated by using following formula
UFCF 1 (1+PIRR) 0+ UFCF 2 (1+PIRR) 1+ UFCF 3 (1+PIRR) 2+ helliphelliphelliphelliphelliphellip = 0
UFCF 1 = UFCF at the end of first year of operation
UFCF 2 = UFCF at the end of second year of operation
PIRR = Project IRR
EIRR Equity IRR is defined as the discount rate at which NPV of FCFE is zero
It is calculated by using following formula
FCFE1 (1+EIRR) 0+ FCFE 2 (1+EIRR) 1+ FCFE 3 (1+EIRR) 2+ helliphelliphelliphelliphelliphellip = 0
FCFE1 = FCFE at the end of first year of operation
FCFE2 = FCFE at the end of seco nd year of operation
EIRR = Equity IRR
882019 Major Project (Ramit)
httpslidepdfcomreaderfullmajor-project-ramit 3962
30
WACC It is de fined as the percentage of return expected by the investors who
otherwise would have earned some return by investing in some other project
WACC = Cost of Debt (Debt Capital) + Cost of equity (Equity Capital)
882019 Major Project (Ramit)
httpslidepdfcomreaderfullmajor-project-ramit 4062
882019 Major Project (Ramit)
httpslidepdfcomreaderfullmajor-project-ramit 4162
32
62 Funding planAs the telecom sites are rolled out over a 5 year period till FY 2014 investment will be
required for each year ABC Limited will start generating profits from FY 10 only Such
internally generated cash accruals will be ploughed back into the business to meet part of
the project cost Investment required for each year is tabulated below
Table 61 Funding ProposalMillion INR FY 10 FY 11 FY 12 FY 13 FY 14
GBT Tower (Additional) Nos 210 700 1400 2450 3850
RTT Tower (Additional) Nos 90 300 600 1050 1650DE ratio 233 233 233 233 233
Additional CAPEX 83892 279374 558748 977809 1536557
Debt 58725 195562 391124 684466 1075590
Equity 25168 83812 167624 293343 460967
63 Results
Based on assumptions given in Annexure 1 a detailed financial model was preparedResults of the financial model such as PampL account Balance Sheet and cash flow
statements are provided in Annexure 2 3 and 4 Forecasts for the key financial figures for
first five years are provided in the Table below
Forecasts
Table 62 Income StatementMillion INR FY-10 FY11 FY12 FY-13 FY-14
Sales 7124 50511 156766 347476 667700
Cost of sales 1950 13852 39252 87612 170021
Gross 5174 36659 117514 259864 497679
7263 7258 7496 7479 7454
Admin costs 112 179 190 203 216
882019 Major Project (Ramit)
httpslidepdfcomreaderfullmajor-project-ramit 4262
33
Finance cost 0 021 7401 31330 77725
Taxation 170 4233 14536 29073 53547
PAT 2454 19458 59470 122096 223267
As shown in Table above during the expansion period revenue will grow exponentially
In the first year of operation ABC will earn a revenue of INR 7124 million from 300
(210 GBT and 90 RTT) sites with a tenancy ratio of 15 for GBS and 17 for RTS In the
first 2 years of operation the company will not pay any interest on long term debt due to
2 years moratorium period Major cost associated with the project is depreciation due to
which PAT is lower than the operating profits But cash flows to the firm are enough to
result in reasonable returns
Table 63 Balance Shee tYear ending Mar-10 Mar-11 Mar-12 Mar-13 Mar-14
AssetsGross Block 75742 328216 833164 1716823 3105430Accumulated depreciation 2439 15208 51125 128287 271212Net Block 73303 313009 782040 1588536 2834219Net Working Capital 064 241 620 1335 2515Cash Balance 12979 72089 216513 488856 947982
Total Assets 86346 385339 999172 2078727 3784715LiabilitiesEquity 25168 108980 276604 569947 1030914Reserves amp Surplus 2454 21912 81381 203477 426745Long term Debt 58725 254286 640722 1304302 2325171WC Borrowings - 161 465 1001 1886Total Liabilities 86346 385339 999172 2078727 3784715
Note All figures are in Million INR
Table 64 Key financial ratiosMar-11 Mar-12 Mar-13 Mar-14 Mar-15
Revenue Growth 60902 21036 12165 9216 3890EBITDA Growth 62061 22161 12132 9158 4020
PAT Growth 69293 20564 10531 8286 2955
As shown in table above increase in EBITDA is higher than that of revenue This is due
to better operational efficiency of ABCrsquos management and economies of scale S imilarly
882019 Major Project (Ramit)
httpslidepdfcomreaderfullmajor-project-ramit 4362
34
increase in PAT is lesser than that of EBITDA because of high depreciation and interest
expenses
Table 65 Pr ofitability r atios
Mar-11 Mar-12 Mar-13 Mar-14 Mar-15
EBITDA Margin 7222 7484 7473 7450 7520
PAT Margin 3852 3794 3514 3344 3119Return on Net Worth 622 760 769 788 1087
Key profitability ratios are shown in table above Return on net worth in the initial years
is lower because of the ambitious expansion plans of ABC Limited Thereafter return on
net worth increases with increase in PAT
Returns on Investment
Table 66 Financial returnsFinancial Indicators
Project IRR 1813Equity IRR 3609
64 Sensitivity Analysis
A sensitivity analysis has been carried out on the project financials to determine theimpact of key variables on the financial indicators namely
Project IRR
The key variables on which sensitivity analysis have been carried out areCapital expenditure for GBS and RTS1st and 2 nd tenant tariff for GBS1st and 2 nd tenant tariff for RTSTenancy Ratio
Similarly sensitivity analysis has been carried out forEquity IRR
The key variables on which sensitivity analysis have been carried out for EIRR are
Capital structure and interest rate for capital debtRepayment period and moratorium period
882019 Major Project (Ramit)
httpslidepdfcomreaderfullmajor-project-ramit 4462
35
The impact on the financial indicators is shown below
Figure 6-1 Project IRR vs GBT and RTT CAPEX
As shown in Figure 6-1 project IRR is more sensitive to change in CAPEX of RTT sitesas compared to change in CAPEX of GBT sites because tenancy ratio and tariff for RTTsites are higher than those of GBT sites
882019 Major Project (Ramit)
httpslidepdfcomreaderfullmajor-project-ramit 4562
36
Figure 6-2 Project IRR vs GBT Tariff for 1 st tenant (X-axis) and 2 nd tenant (right-hand side)
As shown in Figure 6-2 project IRR varies linearly with GBT tariff In the best casescenario when GBT tariff for 1 st tenant is INR 34000month and GBT tariff for secondtenant is INR 26000month Project IRR is 2101
Figure 6-3 Project IRR vs RTT Tariff for 1 st tenant (X-axis) and 2 nd tenant (right-hand side)
As shown in Figure 6-2 project IRR varies linearly with RTT tariff In the best casescenario when RTT tariff for 1 st tenant is INR 24000month and RTT tariff for second
882019 Major Project (Ramit)
httpslidepdfcomreaderfullmajor-project-ramit 4662
37
tenant is INR 20000month Project IRR is 1932 Project IRR is more sensitivetowards RTT tariff than GBT tariff because in practical business situation RTT siteshave a tenancy ratio of more than two due to which effect of tariff for 1 st tenant almostget nullified after few years
Figure 6-4 Project IRR vs Tenancy ratio for RTT sites (X-axis) and GBT sites
As shown in Figure 6-4 project IRR is very sensitive to tenancy ratio In the best casescenario where GBT sites have a tenancy ratio of 2 and RTT sites have a tenancy ratio of 3 project IRR can be as high as 20
Figure 6-5 Equity IRR vs long term debt interest rate for different leverage level
882019 Major Project (Ramit)
httpslidepdfcomreaderfullmajor-project-ramit 4762
38
As shown in figure 6-5 equity IRR is more sensitive to interest rate on long term debt forhigh level of leverage (lower debt equity ratio) because as the debt equity ratio increasesinterest paid on long term debt also increases significantly
Figure 6-6 Equity IRR vs long term debt repayment period at different level of moratoriumperiods
As shown in figure 6-6 Equity IRR increases with increase in moratorium period anddebt repayment period The variation is from 1654 to 60 for worst case and best casescenarios
882019 Major Project (Ramit)
httpslidepdfcomreaderfullmajor-project-ramit 4862
39
7 RISK ASSESSMENTRisk Mitigation strategyExecution Risk
(Project management landacquisition etc)
Management of ABC has proven expertise in
telecom infrastructure rollout and has executedvarious projects with large telecom operators andMNC vendorsABCrsquos top management team consists of a groupof professionals drawn from leading telecomInfrastructure Company who have immenseexpertise and experience in rolling out telecominfrastructure projects
Market Risk (No entry barriers operators may
share infrastructure betweenthemselves large players withhigh capital may increasecompetition)
India has a huge potential for telecominfrastructure market With increasing
competition falling tariffs and pressure onmargins telecom service providers are beingforced to increase their focus on marketing andreduce their expensesExperienced management healthy capital back-up effective presence in the telecominfrastructure market and value added services atrelatively lesser cost will help ABC to meet theset targets
Financing Risk
(Availability of equity capitalavailability of long term debtinterest rate and moratoriumperiod)
ABC is seeking private equity partner to secure
equity capital Company has already entered intoNDA with 2 major investorsLong term debt at an interest rate of 125 canbe easily arranged because of the credibility of the promoters in the marketMany other similar firms like Indus and GTLhave already secured long term debt for amoratorium period of 2 years Promoters of ABCLimited are confident to secure a long term debtwith a moratorium period of 2 years and apayback period of 8 years
ABC Limited would minimize the workingcapital requirements of its business by securingrentals and operating revenues in advance fromits clients and or by suitably structuring itspayment liabilities to match its cash inflows
Commercial Risk (Tenancy ratio and tariff forGBS and RTS)
ABC would aim to enter into long term contractswith the ldquoanchor tenantrdquo operator and thenrollout the infrastructure so that at least single
882019 Major Project (Ramit)
httpslidepdfcomreaderfullmajor-project-ramit 4962
40
occupancy of each site is ensured at all t imesPromoters will use its knowledge of the businessand its expertise to identify and roll out sites inlocations which have strong multi- tenancypotential to minimize occupancy risk
Revenue Risk (Operating fees may decreasecredit worthiness of the clientsdelay in payment of rentals)
As per the industry sources till now not even asingle operator have dishonored the long termlease contractThe credit risk is diversified as there will bemultiple operatorsABC would aggressively market to get 3G andWiFi broadcasters to use the sites and earnadditional revenues in addition to the assumedrevenue streams
Natural Calamities Risk The Company shall maintain insurance for thesites against these risks and the cost of insurancewill be priced in and passed on to the tenants
882019 Major Project (Ramit)
httpslidepdfcomreaderfullmajor-project-ramit 5062
41
8 CONCLUSION
India is the fastest growing wireless telecom market in the world The continuing
growth in the number of wireless subscribers and MoUs and increasing trend of
outsourcing of business processes to India has led to growing demand for large
investments in the telecom infrastructure in the country
However with increasing competition falling tariffs and pressure on margins
telecom service providers are being forced to increase their focus on marketing
customer acquisitions and branding and minimize their efforts and overheads in
project management and asset acquisition
Further with rising prices of steel cement and real estate the cost of developing
and owning passive infrastructure is increasingly becoming a costly proposition
for most operators and service providers
The compulsion on the part of service providers to reduce their operating costs
and capital expenditure requirements has led to opportunities in passiveinfrastructure outsourcing to independent third party infrastructure providers and
also sharing the infrastructure with other service providers It is expected that
cellular operators will outsource their communications site infrastructure needs as
a means of accelerating access to their markets and preserving capital rather than
constructing and operating their own communications sites and maintaining their
own communications sites service and deve lopment capabilities
Passive infrastructure is highly capital intensive and an integral part of the cellular
service providersrsquo networks Yet being a simple and low technology asset it is
amenable to outsourcing and sharing By transferring the responsibility of
ownership development and maintenance of passive infrastructure service
882019 Major Project (Ramit)
httpslidepdfcomreaderfullmajor-project-ramit 5162
42
providers have an opportunity to transfer a substantial part of their business risk to
third parties
Most telecom operators are facing capacity constraints on their networksCoverage obligations increasing pressure to improve network quality and
competition has led to aggressive roll out plans by existing cellular operators
Installation of cell sites has become a cumbersome process as there are a number
of clearances required and involves labor-intensive micro management
Availability of ready infrastructure from third party providers would enable the
operators to reduce their time to market and accelerate their access to their
customers Cellular service providers generally want to move quickly when
adding more sites and co-location on an existing site is always faster than
building
Ownership and maintenance of telecom towers and other infrastructure by third
parties is an established practice in developed nations like USA and is
increasingly gaining market acceptance in India
The Indian government is seriously considering promoting the infrastructure
sharing route between the telecom operator and private players to achieve future
national tele-density targets and improve rural telecom penetration
ABC being an independent entity with no business conflicts with other service
providers in the telecom space will be best positioned and have an early mover
advantage to capitalize on this emerging opportunity
Further the task of operating and maintaining the passive infrastructure in the cell
is increasingly becoming a cumbersome exercise for the service providers to
handle ABCrsquos composite offering to build passive infrastructure for the cellular
operators and also operate and maintain them will provide a turnkey solution to
address the infrastructure needs of the service providers
882019 Major Project (Ramit)
httpslidepdfcomreaderfullmajor-project-ramit 5262
43
The business model proposed to be followed by ABC is fairly simple with stable
and predictable cash flows as is the case with the business model of the tower
renting companies in USA Most contracts are long term for a period 10 or moreyears with annual price escalators generally ranging from 3 to 4 However
wireless carriers normally tend to renew rentals because suitable alternative sites
may not exist or be available and repositioning a site in a carrierrsquos network is
expensive and may adverse ly affect network quality
Site ownership and operations is a ldquoscalerdquo business operating administration
marketing expenses etc do not rise as quickly as revenues when portfolios are
expanded Incremental operating costs associated with adding wireless tenants to
a communications site are minimal Therefore as additional tenants are added to a
site the substantial majority of incremental revenue contributes to margin
expansion Most tower companies have high EBITDA margins as may be seen
from the financial indicators of some of the tower rental companies in USA
It is expected that site location and capacity price and quality of service and
successful execution of contracts will be the most significant competitive factors
in this business
ABCrsquos revenue and returns on investment will be primarily driven by its ability
to
o Increase the utilization of the space and infrastructure capacity owned by it by
increasing the number of tenants per site and renting out to maximum number
of users As discussed above return on capital employed (PIRR and EIRR) arevery sensitive to tenancy ratio In worst case scenario project IRR can be as
low as 8 and in the best case scenario it can be as high as 20
o Develop acquire sites of strategic importance and high growth potential that
will enable them to secure better commercial terms from users and attract
more number of tenants Infrastructure provisioning fees rentals for sites are
882019 Major Project (Ramit)
httpslidepdfcomreaderfullmajor-project-ramit 5362
44
extremely location sensitive There is a potential to acquire more land than
that of required to capitalize on the increase in real estate prices
o Develop sites in a cost effective manner ABC would consider purchasing
land only for those GBS sites which have sufficient demand and arestrategically located Else for most of its sites land will be leasehold As
shown above returns (PIRR and EIRR) are very sensitive to capital costs In
the worst case scenario project IRR can be as low as 15 whereas it can as
high as 27 in the best case scenario
o Negotiate and secure long term contracts with good credit quality users with
built in price escalation provisions to mitigate financing risk
o Leverage and secure long term financing at attractive terms and involve in
active treasury management to keep low financing cost Results of the
sensitivity analysis indicate that equity IRR can be as high as 60 foe a
moratorium period of 4 years and interest rate of 10
o Minimize working capital requirements
o Maintain low operating and administration expense
o Secure better OampM margins from operators and retain a healthy share of it in
ABC
o Maintain high service standards and build strong customer relationships
The business would have the potential to capture new revenue opportunities
around the existing assets As demand for towers is expected to grow and as
operators migrate to speedier next-generation wireless technologies they will
need the towers and associated passive infrastructure to transmit their new
services in addition to their existing offerings In addition to increasing capacity
and coverage and improving the quality of their networks cellular serviceproviders are deploying high speed data networks driving incremental demand of
sites The business therefore has potential upsides in the form of adding
customers (tenants) in wireless broadband third generation (ldquo3Grdquo) and wireless
data capabilities and also other incremental value propositions by way of hosting
882019 Major Project (Ramit)
httpslidepdfcomreaderfullmajor-project-ramit 5462
45
Billboards Hoardings etc in some of the high visible sites owned and maintained
by it
Based on the assumptions and subject to satisfactory resolution of the key risks
factors project cash flows will be able to meet debt service obligations
This business model is a lucrative investment option for a private equity player
because valuation of each site will increase in the coming years due to
improvement in market conditions increase in the value of land and increase in
the demand for passive infrastructure in rural and semi-urban areas
882019 Major Project (Ramit)
httpslidepdfcomreaderfullmajor-project-ramit 5562
46
REFERENCESAnjan G V A amp N M (2009) telecom infrastructure industry in india GurgaonICRA
Bessler W Norsworthy J amp Shusterman T (2001 12 1) Mergers in the UStelecommunications industry and market valuationeffects IEEE p 288
COAI (2009 march 14) Subscriber Figures Retrieved march 14 2009 fromCOAIcom httpwwwcoaicomstatisticsphp
IDA (2009 march 23) Highlights Retrieved march 23 2009 from idagovsghttpwwwidagovsghomeindexaspx
K R (2008) Time for new business model Delhi Cybermedia
MAXIS (2009 march 8) the malaysian telecommunications industry Retrieved march9 2009 from maxiscommyhttpwwwmaxiscommypersonalabout_usinvestorprospectusprospectus4pdf
P J amp Lisa A (2009) Stimulas spending and American Telecom Industry USACoracle group
PwC (2009 march 12) Indian Telecom Industry Gurgaon Harayana IndiaRamachanran (2009 march 1) Investment in Telecom Infrastructure sector (M RInterviewer)
Vogelsang I (2002) The German Telecommunications Reform Verein fuumlr Socialpolitik (p 26) Innsbruck Boston Press
882019 Major Project (Ramit)
httpslidepdfcomreaderfullmajor-project-ramit 5662
47
ANNEXURES
ANNEXURE 1 Key Assumptions
The occupancy of each site by single two three operators for green-field sites is assumed
to be as follows
Table 91 Expected Tenancy RatiosFY 10 FY 11 FY 12 FY 13 FY 14 FY15
GBT Tenant
Ratio 150 150 170 170 170 200
Single Operator 50 50 30 30 30 0
Two Operator 50 50 70 70 70 100
RTT Tenant
Ratio 170 170 200 200 200 250
Single Operator 30 30 0 0 0 0
Two Operator 70 70 100 100 100 50
Three Operator 0 0 0 0 0 50
From FY 15 onwards tenancy ratio of 2 and 25 for GBT and RTT sites is cons idered
882019 Major Project (Ramit)
httpslidepdfcomreaderfullmajor-project-ramit 5762
48
Capital costs related assumptions are tabulated below
Table 92 GBT and RTT Capital Cost
The lease rentals for RTT sites are reimbursed from the operators and therefore have not
been factored in the revenues as well as the expense For GBT sites land purchase cost of
035 millions assumed which has been escalated by 6 annually to determine the
salvage value of assets
GBT Capital Costs
Million
INR
Delivery cost of Ground Based
Tower (GBT)063
Delivery cost of Generator 030
Civil Work 040Shelter 012
Electrical Works 030
Other Equipments (UPS Battery
etc)045
Construction cost 045
Land 035
Contingency amp Financial Charges 035Total cost 335
RTT Capital Costs
Million
INR
Delivery cost of Roof Top
Tower (RTT) 030
Delivery cost of Generator 020
Civil Work 020Shelter 012
Electrical Works 030
Other Equipments (UPS
Battery etc) 030
Construction cost -
Land -
Contingency amp FinancialCharges 008
Total cost 150
882019 Major Project (Ramit)
httpslidepdfcomreaderfullmajor-project-ramit 5862
49
Ope rating costs related assumptions are tabulated below
Table 93 Operating CostsOperating Costs
Security Sentries (INRMonth) 4000
Supervisors (INRMonth) 6000
Cluster Manager One for Fifty Towers (INRMonth) 15000
Annual increase 500
Number of Security Sentries per tower 300
Number of supervisors per tower 010
Number of C luster manager per tower 002
Fixed Expenses
Selling amp Maintenance (INRMonth) 4000000
Annual Escalation 5
Administration overhead (INRMonth) 10000000Annual Escalation 7
AMC Cost of Generator 15 (cost of generator)
Annual Escalation (AMC) 3
For RTT sites security sentries are not required because it will be the responsibility of
the site owner A supervisor will for every 10 sites and a cluster manager for every 50
sites will be required
882019 Major Project (Ramit)
httpslidepdfcomreaderfullmajor-project-ramit 5962
50
Table 94 Long term debtInterest Rate 125 per annum
Moratorium 2 years
Repayment Period 8 years
Tariff related assumptions and date of operations are tabulated below
Table 95 GBT and RTT Tariff Table 96 Life of the projectTariff Plan
Tariff (INRMonth)
No of
operators GBT RTT
1 28000 18000
2 22000 14000
3 0 12000
Annual
increase 3 3
Commercial Operation Date 1-Aug-09
Quarter Ending 30-Sep-09
FY ending COD 31-Mar-10
Project life years 15
End of commercial
operations31-Aug-24
Quarter ending commercial
operations30-Sep-24
FY ending comme rcial
operations31-Mar-25
882019 Major Project (Ramit)
httpslidepdfcomreaderfullmajor-project-ramit 6062
51
Annexure 2 Profit amp Loss accountsTable 97 Profit amp loss account statement
Income Statement (MNINR)Year ending Mar-10 Mar-11 Mar-12 Mar-13 Mar-14 Mar-15
RevenueGBT 406350 28811 89080 197447 379409 527015Operator Fees (GBT) 1411 10004 30678 67998 130664 179664RTT 1209 8575 27269 60443 116146 164264
Operator Fees (RTT) 440 3121 9739 21587 41481 56466Net Revenue 7124 50511 156766 347476 667700 927410
Expenses
VariableSecurity Sentries 1355 9790 28339 64033 125433 158238Supervisors 097 699 2024 4574 8959 11303Cluster Manager 048 350 10 12 2287 4480 5651AMC Cost of Generator 450 3013 7877 16719 31148 54541Sub-total 1950 13852 39252 87612 170021 229734
Fixed
Selling amp Maintenance(INRMonth) 032 050 053 056 058 061
Administration overhead(INRMonth) 080 128 137 147 157 168
Sub-total 112 179 190 203 216 230
EBITDA 5062 36480 117324 259661 497464 697447
Interest on LT loan - - 7341 31200 77479 156198Interest on ST loan - 021 060 130 245 361
EBDT 5062 36459 109923 228331 419739 540888Depreciation 2439 12769 35917 77162 142925 174006
EBT 2624 23691 74006 151169 276814 366881Income Tax 170 4233 14536 29073 53547 77634
PAT 2454 19458 59470 122096 223267 289247
882019 Major Project (Ramit)
httpslidepdfcomreaderfullmajor-project-ramit 6162
52
Annexure 3 Balance sheet
Table 98 B alance sheetsYearend Balance Sheet (MNINR)Year ending Mar-10 Mar-11 Mar-12 Mar-13 Mar-14 Mar-15
AssetsGross Block 75742 328216 833164 1716823 3105430 3105430Accumulated depreciation 2439 15208 51125 128287 271212 445218Net Block 73303 313009 782040 1588536 2834219 2660212Net Working Capital 064 241 620 1335 2515 3707Cash Balance 12979 72089 216513 488856 947982 1294734Total Assets 86346 385339 999172 2078727 3784715 3958653
LiabilitiesEquity 25168 108980 276604 569947 1030914 1030914Reserves amp Surplus 2454 21912 81381 203477 426745 715992Long term Debt 58725 254286 640722 1304302 2325171 2208967WC Borrowings - 161 465 1001 1886 2780Total Liabilities 86346 385339 999172 2078727 3784715 3958653
882019 Major Project (Ramit)
httpslidepdfcomreaderfullmajor-project-ramit 6262
Annexure 4 Cash flow statement
Table 99 Cash flow statements
Year ending Mar-10 Mar-11 Mar-12 Mar-13 Mar-14 Mar-15
InflowsPAT 2454 19458 59470 122096 223267 289247Depreciation 2439 12769 35917 77162 142925 174006Tax adjusted interest - 014 4959 20991 52076 104895Release of WC - - - - - -Salvage Value - - - - - -Sub-Total 4893 32241 100345 220249 418268 568148
OutflowsCapex 75742 252474 504948 883659 1388607 -Change in WorkingCapital 064 177 379 715 1180 1192
Sub-Total 75806 252651 505327 884374 1389787 1192
UFCF (70913) (220410) (404982) (664125) (971519) 566956LFCF (70913) (220424) (409940) (685116) (1023595) 462062

882019 Major Project (Ramit)
httpslidepdfcomreaderfullmajor-project-ramit 2762
18
infrastructure sharing is a llowed (except spectrum) Independent service providers will be
benefited Increase in subscriber base introduction of new technologies like 3G Wi-max
etc and increase in market healthy market competition in telecom services sector will
drive the growth in telecom infrastructure sector
882019 Major Project (Ramit)
httpslidepdfcomreaderfullmajor-project-ramit 2862
19
4 BUSINESS PLAN
41 Passive Infrastructure
Mobile networks have base stations (or cell sites) which have active and passive
infrastructure components Active components include the antenna trans-receivers
switches feeder cables Node B and microwave radio equipments Passive (or non-
electronic) components include the land tower shelter air-conditioning equipment
diesel electric generator battery electrical supply technical premises and easements
pylons etc Passive infrastructure in a mobile network essentially involves acquiring land
setting up towers and electrical and civil works that needs to be in place before operators
can install the active infrastructure which brings mobile services to the consumers In atypical cell site build-out almost 65 of the total cost is attributed to passive
infrastructure and 35 to active infrastructure
42 Infrastructure Sharing
Mobile operators are required to setup more and more BTS (cell) sites due to the
exponential growth of mobile subscribers in India (currently growing at almost 15 4
million subscribers a month) and limited availability of spectrum B and C Circles (wheretraffic density may not be as high as metros and Circle A) are expected to drive future
subscriber growth and requirements for cell sites will be higher to ensure greater
coverage
However creating new infrastructure by each operator separately leads to d uplicat ing
huge capital investments It also contributes to mushroom growth of telecom towers and
deteriorating skylines in urban areas which has already led to some local municipal and
state governments to regulate and restrict the erection of new mobile towers
The continued pressure on cellular tariffs higher infrastructure costs for network
deployment particularly in semi-urban and rural areas and compelling need to reduce
4 As published in ET 8 th May 09 Edition
882019 Major Project (Ramit)
httpslidepdfcomreaderfullmajor-project-ramit 2962
20
time to market for network roll outs have led operators to share and even outsource their
infrastructure requirements from third party infrastructure providers like BPTL GTL and
Indus towers It promotes capital efficiency as it allows more than one service provider to
leverage and ride o n common infrastructure In its simplest form it involves two or moreoperators jointly using the common passive infrastructure in a cell site While viewed
largely as a measure to reduce capital and operating expense such sharing also leads to
improvement of service q uality (by ensuring site space for service providers and reducing
black spots) and the environment (by reducing number of cell sites and towers)
In outsourcing operators take passive infrastructure and tower space from third party
infrastructure companies on a monthly rental basis to host their radio and transmission
equipments Outsourcing provides significant benefits to operators It enables them tosave on capital expenses (it actually converts capital expense into operating expense in
the form of lease rentals) and focus on their core activities of sales marketing and
branding while leaving the cumbersome task of managing the site development process
and site operation and maintenance to third parties who exclusively deal with such
activities
The concept of passive infrastructure sharing is increasingly gaining market acceptancein India So far it has been largely limited to bilateral sharing between operators in the
form of barter where the operators split the site related CAPEX and OPEX costs The
available information suggests that about 25 of the existing 90000 tower sites in India
are currently being shared for passive infrastructure predominantly in rural areas and
small towns
43 Introduction to the business
BPTL is an Infrastructure Provider company that builds owns operates and maintains
passive network infrastructure on a shared basis for mobile telecom operators and ITES
providers Its objective is to provide network design and planning network deployment
882019 Major Project (Ramit)
httpslidepdfcomreaderfullmajor-project-ramit 3062
21
network operations amp maintenance infrastructure management application management
and professional services to teleco m operators and enterprises
The company is planning to raise capital in the form of equity and debt to start its
operation by Aug 09 ABC rsquos vision is to provide world class managed infrastructure ampallied services to the service providers to optimize their service delivery capability In the
initial years of operation the company will focus on telecom sector with almost 100 of
its proposed capital expenditure till FY 14 earmarked for developing and owning passive
infrastructure for sharing among mobile service providers
44 Business Proposal
ABC will provide passive telecom infrastructure on build own operate (BOO) basis inboth ground based (GBS) as well as roof-top sites (RTS) It will undertake full range of
responsibilities in building owning and maintaining the sites and will serve as a single
window one-stop-shop provider of infrastructure services Typical responsibilities are
summarized below
Site planning keeping in view the network rollout plans of prospective customers
Site acquisition including entering into long-term agreements with land owners
Obtaining of necessary regulatory approvals
Erect ion and commissioning of tower and allied equipment
Provision of support services such as back-up power air-conditioning and
security
Provision of turnkey solutions to telecom companies such as sourcing of
equipment testing and maintenance
882019 Major Project (Ramit)
httpslidepdfcomreaderfullmajor-project-ramit 3162
22
Bharat Telemast Private Limited will identify the sites required for setting up the Passive
infrastructure by first of all getting a commitment from one operator who is called as
ldquoAnchor Operatorrdquo Then Bharat Telemast will go ahead to lease (or) buy out the site as
appropriate and commences construction of the cellular sites But the Cellular site will betypically designed for three to four operators While construction is in progress the
marketing team will work towards getting the second and third operator But care will be
taken in such a way that at least two operators are available at the time of completion of
construction
45 Sources of revenue
1 Infrastructure Provisioning Fees ndash fee paid by the operators on a monthly basisWith annual escalation
2 Site lease rental ndash Paid at actual on a monthly basis
3 Operations and maintenance charges Paid on a monthly basis
4 The contract also provides a fixed annual escalator
46 Attractiveness of business model
Stable and predictable cash flow business Once a tower asset is rented out it
usually generates a stable and predictable cash flow in the form of tower rentals
from occupants over the term of the MSA between the two parties
Low working capital requirement ABC rsquos business model is also characterized
by low working capital requirements as most of the operating expenses (such aselectricity and fuel and other variable operating expenses) are reimbursable by the
tenants on actual basis Moreover BPTL is may also be able to get rentals for the
towers in advance and also obtain better credit terms from their suppliers thus
further improving their working capital cycle
882019 Major Project (Ramit)
httpslidepdfcomreaderfullmajor-project-ramit 3262
23
High incremental profitability The operating costs associated with this
business are largely fixed in nature Thus each increment in tenancy is
accompanied by a minimal increase in costs This leads to a more thanproportionate increase in profits for every increase in occupancy
Reduction in capital investments due to present market conditions Due to
present market situation average capital requirement for RTT and GBT sites have
dropped from 2 million and 4 million to 15 million and 33 million ABC wishes
to grab this opportunity which will result in competitive advantage in near future
Extensive usage While on an average a GSM BTS can handle around 100-
1100 subscribers but in the case of high usage areas the figure can be as low as
600-700 subscribers which means a larger number of cell sites would be required
for the same area Moreover the country has the problem of spectrum scarcity
which increases the requirement of towers to maintain a reasonable leve l of
service quality
New entrants Many operators including Vodafone Essar Limited Idea Cellular
Limited Aircel Cellular Limited and Sistema Shyam Teleservices Limited have
received licenses as well spectrum in new circles which would enable them to
become pan-India operators in the next one-two years Also new licenses have
been issued to new players such as Unitech Swan Telecom and S Tel Limited
Given the significant expansion plans of new entrants over the medium term and
the need for them to optimize investments in order to maintain returns demand
for towers is expected to report a sharp increase
Shorter rollout time Indian telecom industry is highly competitive and doing
business for new entrant may not be easy Shorter network-rollout time would be
a critical success factor for the new entrants and a longer rollout time could meanloss of substantial market share to other operators Tower companies allow
players to start operations in a particular region just by installing their electronics
on the ready-to-use towers thereby significantly shortening the rollout time
New technologies 3G services are already launched in the country and to
augment their services various operators plan to launch Wi-Max services as soon
882019 Major Project (Ramit)
httpslidepdfcomreaderfullmajor-project-ramit 3362
24
as they receive additional spectrum from Government This would further
increase the demand for sharing of passive infrastructure
47
Expansion Schedule
BPTL would rollout both RTT and GBT sites of which the RTT sites GBT sites
normally would have a tower height of 50 meters or 60 meters depending on the need for
additional height for installation of microwave antennae based on the location of the site
and number of tenants on the cell site Details of BPTLrsquos expansion plan are summarized
below
Table 41 Expansion PlanExpansion Schedule 2009-10 2010-11 2011-12 2012-13 20013-14
GBT
Addition 210 700 1400 2450 3850
Total 210 910 2310 4760 8610
RTT
Addition 90 300 600 1050 1650
Total 90 390 990 2040 3690
48 Proposed Services
As indicated earlier ABC proposes to provide passive telecom infrastructure on a
sharing co-location basis to cellular operators The sites would either be Ground Based
Sites (GBS) or Roof Top Sites (RTS) As the sites are meant for co-location of the active
components of two to three operators they would be built to either 2-Tenant or 3-Tenant
specifications
The different components of the passive infrastructure facility and the related services
that would be offered by BPTL to the operators are as under
Infrastructure provisioning comprising
882019 Major Project (Ramit)
httpslidepdfcomreaderfullmajor-project-ramit 3462
25
Communication tower built to host multiple antennae
Weather-proof communication shelter with air-conditioning and power backup
arrangement
Diesel generating set and battery bank for power backup
A mobile standby generator to act as backup in case o f breakdown
Warehousing facility
Infrastructure operations and maintenance including
Regular operations and maintenance of the facility
Security of all the equipments at the site at all timesA dedicated team of technicians for a group of 40-50 sites to ensure effect ive and
efficient functioning of the components at all times
49 Proposed Organizational Structure
A senior management team will work under the leadership of the ldquoChief Operations
Officerrdquo who will be responsible for smooth implementation of proj ect activities He willalso assist the managing director in marketing This team will coordinate with Stallion
Telecom Pvt Ltd which will take over the role of procuring Capital Equipments
Senior management will consists of project manager infrastructure manager commercial
manager and head (legal and company affairs Apart from this there will be a requirement
Chief OperatingOfficer
Project Manager Infrastructure
Manager
Commercial
Manager (projects)
Head (Legal and
Company Affairs)
882019 Major Project (Ramit)
httpslidepdfcomreaderfullmajor-project-ramit 3562
26
of security sentries (3 per GBT site) supervisors (one for every 10 sites) and cluster
manager (one for every 50 sites)
Bharat Telemast will carry out the complete Project execution with the assistance of third party ldquoQuality control organizationrdquo and a third party ldquoProject management teamrdquo
Quality control and project management activities will be o utsourced to a third party
882019 Major Project (Ramit)
httpslidepdfcomreaderfullmajor-project-ramit 3662
27
5 METHODOLOGY
The changing face of infrastructure services creates a complex situation which demands
greater understanding of roles of competition regulatory structures and modes of
financing Knowledge of such things is a key decisive factor in building confidence
among investors promoters and government In project finance the project its assets
contract and cash flows are separated from promoter in order to permit credit appraisal
or loan to the project
As part of the financial feasibility analysis a series of related financial statements based
on projected sources and uses of funds during the development and operating phaseproject were created Financial statements consist of expenses associated with
development activities including capital costs like acquisition of land for GBT sites cost
of tower generator shelter batteries etc Most of the data regarding capital costs are
obtained from the promoter of ABC Limited All these capital costs related details are
provided in annexure 1
Assumption regarding depreciation capital structure operating expenses expansion
schedule tenancy ratios tariff or rent operatorrsquos fees and loan amortization schedule are
obtained from professional accountants Promoter and bankers of ABC Limited
Due to unknown factors that could influence the cost of towers or fees associated with
completing the project (soft costs) contingency costs were estimated at 5 of hard and
soft costs respectively If contingency is set too low developers could easily encounter
funding shortfalls upon slight changes in market forces All other costs were estimated
based on talking with industry professionals (Promoters)
A detailed financial model was prepared based on existing accounting standards and
following financial ratios were estimated
882019 Major Project (Ramit)
httpslidepdfcomreaderfullmajor-project-ramit 3762
28
EBITDA margin Profit and loss accounts for the estimated project period (15
Years) were prepared based on which estimated earnings before interests tax
depreciat ion and amortization were calculated for each year Detailed PampL
balance sheet and cash flow statements are provided in annexure 2 3 and 4
EBITDA = Total Revenue ndash (Variable expenses + Fixed Expenses)
EBITDA margin = EBITDA Total Revenue
PAT margin PAT is calculated by subtracting interests pa id on capital debt and
working capital debt depreciation and applicable corporate income tax from
EBITDA
PAT = EBITDA ndash Interest Payable ndash Depreciation ndash Income tax
PAT margin = PATTotal Revenue
Working Capital Working capital requirement is calculated by subtract ing
current liabilities from current assets Current assets are estimated based on 30
days cash requirement and current liabilities are estimated as half of salary
monthly expenses
WC = Current Assets ndash Current Liabilities
UFCF It is defined as the free cash flows available to the firm if the firm has
zero debt liability Purpose of ca lculat ing UFCF for project period is to determinethe project IRR
UFCF = PAT + Depreciation + Interest (tax adjusted) + Release of WC + Salvage
value of the assets ndash CAPEX ndash Change in WC
882019 Major Project (Ramit)
httpslidepdfcomreaderfullmajor-project-ramit 3862
29
LCFF It is defined as the cash floes available to the firm after paying interests on
long term and short term debts
LCFF = UFCF ndash Interest (tax adjusted)
FCFE It is defined as the free cash flow available to equity holders It is
determined to ca lculate equity IRR for equity investors It also includes the tax
benefits which are available as per the Income Tax Act
FCFE PAT + Depreciation + Salvage Value ndash Equity Investment ndash Long term debt
repayment
PIRR Project IRR is defined as the discount rate at which NPV (Net Present
Value) of UFCF is zero It is calculated by using following formula
UFCF 1 (1+PIRR) 0+ UFCF 2 (1+PIRR) 1+ UFCF 3 (1+PIRR) 2+ helliphelliphelliphelliphelliphellip = 0
UFCF 1 = UFCF at the end of first year of operation
UFCF 2 = UFCF at the end of second year of operation
PIRR = Project IRR
EIRR Equity IRR is defined as the discount rate at which NPV of FCFE is zero
It is calculated by using following formula
FCFE1 (1+EIRR) 0+ FCFE 2 (1+EIRR) 1+ FCFE 3 (1+EIRR) 2+ helliphelliphelliphelliphelliphellip = 0
FCFE1 = FCFE at the end of first year of operation
FCFE2 = FCFE at the end of seco nd year of operation
EIRR = Equity IRR
882019 Major Project (Ramit)
httpslidepdfcomreaderfullmajor-project-ramit 3962
30
WACC It is de fined as the percentage of return expected by the investors who
otherwise would have earned some return by investing in some other project
WACC = Cost of Debt (Debt Capital) + Cost of equity (Equity Capital)
882019 Major Project (Ramit)
httpslidepdfcomreaderfullmajor-project-ramit 4062
882019 Major Project (Ramit)
httpslidepdfcomreaderfullmajor-project-ramit 4162
32
62 Funding planAs the telecom sites are rolled out over a 5 year period till FY 2014 investment will be
required for each year ABC Limited will start generating profits from FY 10 only Such
internally generated cash accruals will be ploughed back into the business to meet part of
the project cost Investment required for each year is tabulated below
Table 61 Funding ProposalMillion INR FY 10 FY 11 FY 12 FY 13 FY 14
GBT Tower (Additional) Nos 210 700 1400 2450 3850
RTT Tower (Additional) Nos 90 300 600 1050 1650DE ratio 233 233 233 233 233
Additional CAPEX 83892 279374 558748 977809 1536557
Debt 58725 195562 391124 684466 1075590
Equity 25168 83812 167624 293343 460967
63 Results
Based on assumptions given in Annexure 1 a detailed financial model was preparedResults of the financial model such as PampL account Balance Sheet and cash flow
statements are provided in Annexure 2 3 and 4 Forecasts for the key financial figures for
first five years are provided in the Table below
Forecasts
Table 62 Income StatementMillion INR FY-10 FY11 FY12 FY-13 FY-14
Sales 7124 50511 156766 347476 667700
Cost of sales 1950 13852 39252 87612 170021
Gross 5174 36659 117514 259864 497679
7263 7258 7496 7479 7454
Admin costs 112 179 190 203 216
882019 Major Project (Ramit)
httpslidepdfcomreaderfullmajor-project-ramit 4262
33
Finance cost 0 021 7401 31330 77725
Taxation 170 4233 14536 29073 53547
PAT 2454 19458 59470 122096 223267
As shown in Table above during the expansion period revenue will grow exponentially
In the first year of operation ABC will earn a revenue of INR 7124 million from 300
(210 GBT and 90 RTT) sites with a tenancy ratio of 15 for GBS and 17 for RTS In the
first 2 years of operation the company will not pay any interest on long term debt due to
2 years moratorium period Major cost associated with the project is depreciation due to
which PAT is lower than the operating profits But cash flows to the firm are enough to
result in reasonable returns
Table 63 Balance Shee tYear ending Mar-10 Mar-11 Mar-12 Mar-13 Mar-14
AssetsGross Block 75742 328216 833164 1716823 3105430Accumulated depreciation 2439 15208 51125 128287 271212Net Block 73303 313009 782040 1588536 2834219Net Working Capital 064 241 620 1335 2515Cash Balance 12979 72089 216513 488856 947982
Total Assets 86346 385339 999172 2078727 3784715LiabilitiesEquity 25168 108980 276604 569947 1030914Reserves amp Surplus 2454 21912 81381 203477 426745Long term Debt 58725 254286 640722 1304302 2325171WC Borrowings - 161 465 1001 1886Total Liabilities 86346 385339 999172 2078727 3784715
Note All figures are in Million INR
Table 64 Key financial ratiosMar-11 Mar-12 Mar-13 Mar-14 Mar-15
Revenue Growth 60902 21036 12165 9216 3890EBITDA Growth 62061 22161 12132 9158 4020
PAT Growth 69293 20564 10531 8286 2955
As shown in table above increase in EBITDA is higher than that of revenue This is due
to better operational efficiency of ABCrsquos management and economies of scale S imilarly
882019 Major Project (Ramit)
httpslidepdfcomreaderfullmajor-project-ramit 4362
34
increase in PAT is lesser than that of EBITDA because of high depreciation and interest
expenses
Table 65 Pr ofitability r atios
Mar-11 Mar-12 Mar-13 Mar-14 Mar-15
EBITDA Margin 7222 7484 7473 7450 7520
PAT Margin 3852 3794 3514 3344 3119Return on Net Worth 622 760 769 788 1087
Key profitability ratios are shown in table above Return on net worth in the initial years
is lower because of the ambitious expansion plans of ABC Limited Thereafter return on
net worth increases with increase in PAT
Returns on Investment
Table 66 Financial returnsFinancial Indicators
Project IRR 1813Equity IRR 3609
64 Sensitivity Analysis
A sensitivity analysis has been carried out on the project financials to determine theimpact of key variables on the financial indicators namely
Project IRR
The key variables on which sensitivity analysis have been carried out areCapital expenditure for GBS and RTS1st and 2 nd tenant tariff for GBS1st and 2 nd tenant tariff for RTSTenancy Ratio
Similarly sensitivity analysis has been carried out forEquity IRR
The key variables on which sensitivity analysis have been carried out for EIRR are
Capital structure and interest rate for capital debtRepayment period and moratorium period
882019 Major Project (Ramit)
httpslidepdfcomreaderfullmajor-project-ramit 4462
35
The impact on the financial indicators is shown below
Figure 6-1 Project IRR vs GBT and RTT CAPEX
As shown in Figure 6-1 project IRR is more sensitive to change in CAPEX of RTT sitesas compared to change in CAPEX of GBT sites because tenancy ratio and tariff for RTTsites are higher than those of GBT sites
882019 Major Project (Ramit)
httpslidepdfcomreaderfullmajor-project-ramit 4562
36
Figure 6-2 Project IRR vs GBT Tariff for 1 st tenant (X-axis) and 2 nd tenant (right-hand side)
As shown in Figure 6-2 project IRR varies linearly with GBT tariff In the best casescenario when GBT tariff for 1 st tenant is INR 34000month and GBT tariff for secondtenant is INR 26000month Project IRR is 2101
Figure 6-3 Project IRR vs RTT Tariff for 1 st tenant (X-axis) and 2 nd tenant (right-hand side)
As shown in Figure 6-2 project IRR varies linearly with RTT tariff In the best casescenario when RTT tariff for 1 st tenant is INR 24000month and RTT tariff for second
882019 Major Project (Ramit)
httpslidepdfcomreaderfullmajor-project-ramit 4662
37
tenant is INR 20000month Project IRR is 1932 Project IRR is more sensitivetowards RTT tariff than GBT tariff because in practical business situation RTT siteshave a tenancy ratio of more than two due to which effect of tariff for 1 st tenant almostget nullified after few years
Figure 6-4 Project IRR vs Tenancy ratio for RTT sites (X-axis) and GBT sites
As shown in Figure 6-4 project IRR is very sensitive to tenancy ratio In the best casescenario where GBT sites have a tenancy ratio of 2 and RTT sites have a tenancy ratio of 3 project IRR can be as high as 20
Figure 6-5 Equity IRR vs long term debt interest rate for different leverage level
882019 Major Project (Ramit)
httpslidepdfcomreaderfullmajor-project-ramit 4762
38
As shown in figure 6-5 equity IRR is more sensitive to interest rate on long term debt forhigh level of leverage (lower debt equity ratio) because as the debt equity ratio increasesinterest paid on long term debt also increases significantly
Figure 6-6 Equity IRR vs long term debt repayment period at different level of moratoriumperiods
As shown in figure 6-6 Equity IRR increases with increase in moratorium period anddebt repayment period The variation is from 1654 to 60 for worst case and best casescenarios
882019 Major Project (Ramit)
httpslidepdfcomreaderfullmajor-project-ramit 4862
39
7 RISK ASSESSMENTRisk Mitigation strategyExecution Risk
(Project management landacquisition etc)
Management of ABC has proven expertise in
telecom infrastructure rollout and has executedvarious projects with large telecom operators andMNC vendorsABCrsquos top management team consists of a groupof professionals drawn from leading telecomInfrastructure Company who have immenseexpertise and experience in rolling out telecominfrastructure projects
Market Risk (No entry barriers operators may
share infrastructure betweenthemselves large players withhigh capital may increasecompetition)
India has a huge potential for telecominfrastructure market With increasing
competition falling tariffs and pressure onmargins telecom service providers are beingforced to increase their focus on marketing andreduce their expensesExperienced management healthy capital back-up effective presence in the telecominfrastructure market and value added services atrelatively lesser cost will help ABC to meet theset targets
Financing Risk
(Availability of equity capitalavailability of long term debtinterest rate and moratoriumperiod)
ABC is seeking private equity partner to secure
equity capital Company has already entered intoNDA with 2 major investorsLong term debt at an interest rate of 125 canbe easily arranged because of the credibility of the promoters in the marketMany other similar firms like Indus and GTLhave already secured long term debt for amoratorium period of 2 years Promoters of ABCLimited are confident to secure a long term debtwith a moratorium period of 2 years and apayback period of 8 years
ABC Limited would minimize the workingcapital requirements of its business by securingrentals and operating revenues in advance fromits clients and or by suitably structuring itspayment liabilities to match its cash inflows
Commercial Risk (Tenancy ratio and tariff forGBS and RTS)
ABC would aim to enter into long term contractswith the ldquoanchor tenantrdquo operator and thenrollout the infrastructure so that at least single
882019 Major Project (Ramit)
httpslidepdfcomreaderfullmajor-project-ramit 4962
40
occupancy of each site is ensured at all t imesPromoters will use its knowledge of the businessand its expertise to identify and roll out sites inlocations which have strong multi- tenancypotential to minimize occupancy risk
Revenue Risk (Operating fees may decreasecredit worthiness of the clientsdelay in payment of rentals)
As per the industry sources till now not even asingle operator have dishonored the long termlease contractThe credit risk is diversified as there will bemultiple operatorsABC would aggressively market to get 3G andWiFi broadcasters to use the sites and earnadditional revenues in addition to the assumedrevenue streams
Natural Calamities Risk The Company shall maintain insurance for thesites against these risks and the cost of insurancewill be priced in and passed on to the tenants
882019 Major Project (Ramit)
httpslidepdfcomreaderfullmajor-project-ramit 5062
41
8 CONCLUSION
India is the fastest growing wireless telecom market in the world The continuing
growth in the number of wireless subscribers and MoUs and increasing trend of
outsourcing of business processes to India has led to growing demand for large
investments in the telecom infrastructure in the country
However with increasing competition falling tariffs and pressure on margins
telecom service providers are being forced to increase their focus on marketing
customer acquisitions and branding and minimize their efforts and overheads in
project management and asset acquisition
Further with rising prices of steel cement and real estate the cost of developing
and owning passive infrastructure is increasingly becoming a costly proposition
for most operators and service providers
The compulsion on the part of service providers to reduce their operating costs
and capital expenditure requirements has led to opportunities in passiveinfrastructure outsourcing to independent third party infrastructure providers and
also sharing the infrastructure with other service providers It is expected that
cellular operators will outsource their communications site infrastructure needs as
a means of accelerating access to their markets and preserving capital rather than
constructing and operating their own communications sites and maintaining their
own communications sites service and deve lopment capabilities
Passive infrastructure is highly capital intensive and an integral part of the cellular
service providersrsquo networks Yet being a simple and low technology asset it is
amenable to outsourcing and sharing By transferring the responsibility of
ownership development and maintenance of passive infrastructure service
882019 Major Project (Ramit)
httpslidepdfcomreaderfullmajor-project-ramit 5162
42
providers have an opportunity to transfer a substantial part of their business risk to
third parties
Most telecom operators are facing capacity constraints on their networksCoverage obligations increasing pressure to improve network quality and
competition has led to aggressive roll out plans by existing cellular operators
Installation of cell sites has become a cumbersome process as there are a number
of clearances required and involves labor-intensive micro management
Availability of ready infrastructure from third party providers would enable the
operators to reduce their time to market and accelerate their access to their
customers Cellular service providers generally want to move quickly when
adding more sites and co-location on an existing site is always faster than
building
Ownership and maintenance of telecom towers and other infrastructure by third
parties is an established practice in developed nations like USA and is
increasingly gaining market acceptance in India
The Indian government is seriously considering promoting the infrastructure
sharing route between the telecom operator and private players to achieve future
national tele-density targets and improve rural telecom penetration
ABC being an independent entity with no business conflicts with other service
providers in the telecom space will be best positioned and have an early mover
advantage to capitalize on this emerging opportunity
Further the task of operating and maintaining the passive infrastructure in the cell
is increasingly becoming a cumbersome exercise for the service providers to
handle ABCrsquos composite offering to build passive infrastructure for the cellular
operators and also operate and maintain them will provide a turnkey solution to
address the infrastructure needs of the service providers
882019 Major Project (Ramit)
httpslidepdfcomreaderfullmajor-project-ramit 5262
43
The business model proposed to be followed by ABC is fairly simple with stable
and predictable cash flows as is the case with the business model of the tower
renting companies in USA Most contracts are long term for a period 10 or moreyears with annual price escalators generally ranging from 3 to 4 However
wireless carriers normally tend to renew rentals because suitable alternative sites
may not exist or be available and repositioning a site in a carrierrsquos network is
expensive and may adverse ly affect network quality
Site ownership and operations is a ldquoscalerdquo business operating administration
marketing expenses etc do not rise as quickly as revenues when portfolios are
expanded Incremental operating costs associated with adding wireless tenants to
a communications site are minimal Therefore as additional tenants are added to a
site the substantial majority of incremental revenue contributes to margin
expansion Most tower companies have high EBITDA margins as may be seen
from the financial indicators of some of the tower rental companies in USA
It is expected that site location and capacity price and quality of service and
successful execution of contracts will be the most significant competitive factors
in this business
ABCrsquos revenue and returns on investment will be primarily driven by its ability
to
o Increase the utilization of the space and infrastructure capacity owned by it by
increasing the number of tenants per site and renting out to maximum number
of users As discussed above return on capital employed (PIRR and EIRR) arevery sensitive to tenancy ratio In worst case scenario project IRR can be as
low as 8 and in the best case scenario it can be as high as 20
o Develop acquire sites of strategic importance and high growth potential that
will enable them to secure better commercial terms from users and attract
more number of tenants Infrastructure provisioning fees rentals for sites are
882019 Major Project (Ramit)
httpslidepdfcomreaderfullmajor-project-ramit 5362
44
extremely location sensitive There is a potential to acquire more land than
that of required to capitalize on the increase in real estate prices
o Develop sites in a cost effective manner ABC would consider purchasing
land only for those GBS sites which have sufficient demand and arestrategically located Else for most of its sites land will be leasehold As
shown above returns (PIRR and EIRR) are very sensitive to capital costs In
the worst case scenario project IRR can be as low as 15 whereas it can as
high as 27 in the best case scenario
o Negotiate and secure long term contracts with good credit quality users with
built in price escalation provisions to mitigate financing risk
o Leverage and secure long term financing at attractive terms and involve in
active treasury management to keep low financing cost Results of the
sensitivity analysis indicate that equity IRR can be as high as 60 foe a
moratorium period of 4 years and interest rate of 10
o Minimize working capital requirements
o Maintain low operating and administration expense
o Secure better OampM margins from operators and retain a healthy share of it in
ABC
o Maintain high service standards and build strong customer relationships
The business would have the potential to capture new revenue opportunities
around the existing assets As demand for towers is expected to grow and as
operators migrate to speedier next-generation wireless technologies they will
need the towers and associated passive infrastructure to transmit their new
services in addition to their existing offerings In addition to increasing capacity
and coverage and improving the quality of their networks cellular serviceproviders are deploying high speed data networks driving incremental demand of
sites The business therefore has potential upsides in the form of adding
customers (tenants) in wireless broadband third generation (ldquo3Grdquo) and wireless
data capabilities and also other incremental value propositions by way of hosting
882019 Major Project (Ramit)
httpslidepdfcomreaderfullmajor-project-ramit 5462
45
Billboards Hoardings etc in some of the high visible sites owned and maintained
by it
Based on the assumptions and subject to satisfactory resolution of the key risks
factors project cash flows will be able to meet debt service obligations
This business model is a lucrative investment option for a private equity player
because valuation of each site will increase in the coming years due to
improvement in market conditions increase in the value of land and increase in
the demand for passive infrastructure in rural and semi-urban areas
882019 Major Project (Ramit)
httpslidepdfcomreaderfullmajor-project-ramit 5562
46
REFERENCESAnjan G V A amp N M (2009) telecom infrastructure industry in india GurgaonICRA
Bessler W Norsworthy J amp Shusterman T (2001 12 1) Mergers in the UStelecommunications industry and market valuationeffects IEEE p 288
COAI (2009 march 14) Subscriber Figures Retrieved march 14 2009 fromCOAIcom httpwwwcoaicomstatisticsphp
IDA (2009 march 23) Highlights Retrieved march 23 2009 from idagovsghttpwwwidagovsghomeindexaspx
K R (2008) Time for new business model Delhi Cybermedia
MAXIS (2009 march 8) the malaysian telecommunications industry Retrieved march9 2009 from maxiscommyhttpwwwmaxiscommypersonalabout_usinvestorprospectusprospectus4pdf
P J amp Lisa A (2009) Stimulas spending and American Telecom Industry USACoracle group
PwC (2009 march 12) Indian Telecom Industry Gurgaon Harayana IndiaRamachanran (2009 march 1) Investment in Telecom Infrastructure sector (M RInterviewer)
Vogelsang I (2002) The German Telecommunications Reform Verein fuumlr Socialpolitik (p 26) Innsbruck Boston Press
882019 Major Project (Ramit)
httpslidepdfcomreaderfullmajor-project-ramit 5662
47
ANNEXURES
ANNEXURE 1 Key Assumptions
The occupancy of each site by single two three operators for green-field sites is assumed
to be as follows
Table 91 Expected Tenancy RatiosFY 10 FY 11 FY 12 FY 13 FY 14 FY15
GBT Tenant
Ratio 150 150 170 170 170 200
Single Operator 50 50 30 30 30 0
Two Operator 50 50 70 70 70 100
RTT Tenant
Ratio 170 170 200 200 200 250
Single Operator 30 30 0 0 0 0
Two Operator 70 70 100 100 100 50
Three Operator 0 0 0 0 0 50
From FY 15 onwards tenancy ratio of 2 and 25 for GBT and RTT sites is cons idered
882019 Major Project (Ramit)
httpslidepdfcomreaderfullmajor-project-ramit 5762
48
Capital costs related assumptions are tabulated below
Table 92 GBT and RTT Capital Cost
The lease rentals for RTT sites are reimbursed from the operators and therefore have not
been factored in the revenues as well as the expense For GBT sites land purchase cost of
035 millions assumed which has been escalated by 6 annually to determine the
salvage value of assets
GBT Capital Costs
Million
INR
Delivery cost of Ground Based
Tower (GBT)063
Delivery cost of Generator 030
Civil Work 040Shelter 012
Electrical Works 030
Other Equipments (UPS Battery
etc)045
Construction cost 045
Land 035
Contingency amp Financial Charges 035Total cost 335
RTT Capital Costs
Million
INR
Delivery cost of Roof Top
Tower (RTT) 030
Delivery cost of Generator 020
Civil Work 020Shelter 012
Electrical Works 030
Other Equipments (UPS
Battery etc) 030
Construction cost -
Land -
Contingency amp FinancialCharges 008
Total cost 150
882019 Major Project (Ramit)
httpslidepdfcomreaderfullmajor-project-ramit 5862
49
Ope rating costs related assumptions are tabulated below
Table 93 Operating CostsOperating Costs
Security Sentries (INRMonth) 4000
Supervisors (INRMonth) 6000
Cluster Manager One for Fifty Towers (INRMonth) 15000
Annual increase 500
Number of Security Sentries per tower 300
Number of supervisors per tower 010
Number of C luster manager per tower 002
Fixed Expenses
Selling amp Maintenance (INRMonth) 4000000
Annual Escalation 5
Administration overhead (INRMonth) 10000000Annual Escalation 7
AMC Cost of Generator 15 (cost of generator)
Annual Escalation (AMC) 3
For RTT sites security sentries are not required because it will be the responsibility of
the site owner A supervisor will for every 10 sites and a cluster manager for every 50
sites will be required
882019 Major Project (Ramit)
httpslidepdfcomreaderfullmajor-project-ramit 5962
50
Table 94 Long term debtInterest Rate 125 per annum
Moratorium 2 years
Repayment Period 8 years
Tariff related assumptions and date of operations are tabulated below
Table 95 GBT and RTT Tariff Table 96 Life of the projectTariff Plan
Tariff (INRMonth)
No of
operators GBT RTT
1 28000 18000
2 22000 14000
3 0 12000
Annual
increase 3 3
Commercial Operation Date 1-Aug-09
Quarter Ending 30-Sep-09
FY ending COD 31-Mar-10
Project life years 15
End of commercial
operations31-Aug-24
Quarter ending commercial
operations30-Sep-24
FY ending comme rcial
operations31-Mar-25
882019 Major Project (Ramit)
httpslidepdfcomreaderfullmajor-project-ramit 6062
51
Annexure 2 Profit amp Loss accountsTable 97 Profit amp loss account statement
Income Statement (MNINR)Year ending Mar-10 Mar-11 Mar-12 Mar-13 Mar-14 Mar-15
RevenueGBT 406350 28811 89080 197447 379409 527015Operator Fees (GBT) 1411 10004 30678 67998 130664 179664RTT 1209 8575 27269 60443 116146 164264
Operator Fees (RTT) 440 3121 9739 21587 41481 56466Net Revenue 7124 50511 156766 347476 667700 927410
Expenses
VariableSecurity Sentries 1355 9790 28339 64033 125433 158238Supervisors 097 699 2024 4574 8959 11303Cluster Manager 048 350 10 12 2287 4480 5651AMC Cost of Generator 450 3013 7877 16719 31148 54541Sub-total 1950 13852 39252 87612 170021 229734
Fixed
Selling amp Maintenance(INRMonth) 032 050 053 056 058 061
Administration overhead(INRMonth) 080 128 137 147 157 168
Sub-total 112 179 190 203 216 230
EBITDA 5062 36480 117324 259661 497464 697447
Interest on LT loan - - 7341 31200 77479 156198Interest on ST loan - 021 060 130 245 361
EBDT 5062 36459 109923 228331 419739 540888Depreciation 2439 12769 35917 77162 142925 174006
EBT 2624 23691 74006 151169 276814 366881Income Tax 170 4233 14536 29073 53547 77634
PAT 2454 19458 59470 122096 223267 289247
882019 Major Project (Ramit)
httpslidepdfcomreaderfullmajor-project-ramit 6162
52
Annexure 3 Balance sheet
Table 98 B alance sheetsYearend Balance Sheet (MNINR)Year ending Mar-10 Mar-11 Mar-12 Mar-13 Mar-14 Mar-15
AssetsGross Block 75742 328216 833164 1716823 3105430 3105430Accumulated depreciation 2439 15208 51125 128287 271212 445218Net Block 73303 313009 782040 1588536 2834219 2660212Net Working Capital 064 241 620 1335 2515 3707Cash Balance 12979 72089 216513 488856 947982 1294734Total Assets 86346 385339 999172 2078727 3784715 3958653
LiabilitiesEquity 25168 108980 276604 569947 1030914 1030914Reserves amp Surplus 2454 21912 81381 203477 426745 715992Long term Debt 58725 254286 640722 1304302 2325171 2208967WC Borrowings - 161 465 1001 1886 2780Total Liabilities 86346 385339 999172 2078727 3784715 3958653
882019 Major Project (Ramit)
httpslidepdfcomreaderfullmajor-project-ramit 6262
Annexure 4 Cash flow statement
Table 99 Cash flow statements
Year ending Mar-10 Mar-11 Mar-12 Mar-13 Mar-14 Mar-15
InflowsPAT 2454 19458 59470 122096 223267 289247Depreciation 2439 12769 35917 77162 142925 174006Tax adjusted interest - 014 4959 20991 52076 104895Release of WC - - - - - -Salvage Value - - - - - -Sub-Total 4893 32241 100345 220249 418268 568148
OutflowsCapex 75742 252474 504948 883659 1388607 -Change in WorkingCapital 064 177 379 715 1180 1192
Sub-Total 75806 252651 505327 884374 1389787 1192
UFCF (70913) (220410) (404982) (664125) (971519) 566956LFCF (70913) (220424) (409940) (685116) (1023595) 462062
882019 Major Project (Ramit)
httpslidepdfcomreaderfullmajor-project-ramit 3262
23
High incremental profitability The operating costs associated with this
business are largely fixed in nature Thus each increment in tenancy is
accompanied by a minimal increase in costs This leads to a more thanproportionate increase in profits for every increase in occupancy
Reduction in capital investments due to present market conditions Due to
present market situation average capital requirement for RTT and GBT sites have
dropped from 2 million and 4 million to 15 million and 33 million ABC wishes
to grab this opportunity which will result in competitive advantage in near future
Extensive usage While on an average a GSM BTS can handle around 100-
1100 subscribers but in the case of high usage areas the figure can be as low as
600-700 subscribers which means a larger number of cell sites would be required
for the same area Moreover the country has the problem of spectrum scarcity
which increases the requirement of towers to maintain a reasonable leve l of
service quality
New entrants Many operators including Vodafone Essar Limited Idea Cellular
Limited Aircel Cellular Limited and Sistema Shyam Teleservices Limited have
received licenses as well spectrum in new circles which would enable them to
become pan-India operators in the next one-two years Also new licenses have
been issued to new players such as Unitech Swan Telecom and S Tel Limited
Given the significant expansion plans of new entrants over the medium term and
the need for them to optimize investments in order to maintain returns demand
for towers is expected to report a sharp increase
Shorter rollout time Indian telecom industry is highly competitive and doing
business for new entrant may not be easy Shorter network-rollout time would be
a critical success factor for the new entrants and a longer rollout time could meanloss of substantial market share to other operators Tower companies allow
players to start operations in a particular region just by installing their electronics
on the ready-to-use towers thereby significantly shortening the rollout time
New technologies 3G services are already launched in the country and to
augment their services various operators plan to launch Wi-Max services as soon
882019 Major Project (Ramit)
httpslidepdfcomreaderfullmajor-project-ramit 3362
24
as they receive additional spectrum from Government This would further
increase the demand for sharing of passive infrastructure
47
Expansion Schedule
BPTL would rollout both RTT and GBT sites of which the RTT sites GBT sites
normally would have a tower height of 50 meters or 60 meters depending on the need for
additional height for installation of microwave antennae based on the location of the site
and number of tenants on the cell site Details of BPTLrsquos expansion plan are summarized
below
Table 41 Expansion PlanExpansion Schedule 2009-10 2010-11 2011-12 2012-13 20013-14
GBT
Addition 210 700 1400 2450 3850
Total 210 910 2310 4760 8610
RTT
Addition 90 300 600 1050 1650
Total 90 390 990 2040 3690
48 Proposed Services
As indicated earlier ABC proposes to provide passive telecom infrastructure on a
sharing co-location basis to cellular operators The sites would either be Ground Based
Sites (GBS) or Roof Top Sites (RTS) As the sites are meant for co-location of the active
components of two to three operators they would be built to either 2-Tenant or 3-Tenant
specifications
The different components of the passive infrastructure facility and the related services
that would be offered by BPTL to the operators are as under
Infrastructure provisioning comprising
882019 Major Project (Ramit)
httpslidepdfcomreaderfullmajor-project-ramit 3462
25
Communication tower built to host multiple antennae
Weather-proof communication shelter with air-conditioning and power backup
arrangement
Diesel generating set and battery bank for power backup
A mobile standby generator to act as backup in case o f breakdown
Warehousing facility
Infrastructure operations and maintenance including
Regular operations and maintenance of the facility
Security of all the equipments at the site at all timesA dedicated team of technicians for a group of 40-50 sites to ensure effect ive and
efficient functioning of the components at all times
49 Proposed Organizational Structure
A senior management team will work under the leadership of the ldquoChief Operations
Officerrdquo who will be responsible for smooth implementation of proj ect activities He willalso assist the managing director in marketing This team will coordinate with Stallion
Telecom Pvt Ltd which will take over the role of procuring Capital Equipments
Senior management will consists of project manager infrastructure manager commercial
manager and head (legal and company affairs Apart from this there will be a requirement
Chief OperatingOfficer
Project Manager Infrastructure
Manager
Commercial
Manager (projects)
Head (Legal and
Company Affairs)
882019 Major Project (Ramit)
httpslidepdfcomreaderfullmajor-project-ramit 3562
26
of security sentries (3 per GBT site) supervisors (one for every 10 sites) and cluster
manager (one for every 50 sites)
Bharat Telemast will carry out the complete Project execution with the assistance of third party ldquoQuality control organizationrdquo and a third party ldquoProject management teamrdquo
Quality control and project management activities will be o utsourced to a third party
882019 Major Project (Ramit)
httpslidepdfcomreaderfullmajor-project-ramit 3662
27
5 METHODOLOGY
The changing face of infrastructure services creates a complex situation which demands
greater understanding of roles of competition regulatory structures and modes of
financing Knowledge of such things is a key decisive factor in building confidence
among investors promoters and government In project finance the project its assets
contract and cash flows are separated from promoter in order to permit credit appraisal
or loan to the project
As part of the financial feasibility analysis a series of related financial statements based
on projected sources and uses of funds during the development and operating phaseproject were created Financial statements consist of expenses associated with
development activities including capital costs like acquisition of land for GBT sites cost
of tower generator shelter batteries etc Most of the data regarding capital costs are
obtained from the promoter of ABC Limited All these capital costs related details are
provided in annexure 1
Assumption regarding depreciation capital structure operating expenses expansion
schedule tenancy ratios tariff or rent operatorrsquos fees and loan amortization schedule are
obtained from professional accountants Promoter and bankers of ABC Limited
Due to unknown factors that could influence the cost of towers or fees associated with
completing the project (soft costs) contingency costs were estimated at 5 of hard and
soft costs respectively If contingency is set too low developers could easily encounter
funding shortfalls upon slight changes in market forces All other costs were estimated
based on talking with industry professionals (Promoters)
A detailed financial model was prepared based on existing accounting standards and
following financial ratios were estimated
882019 Major Project (Ramit)
httpslidepdfcomreaderfullmajor-project-ramit 3762
28
EBITDA margin Profit and loss accounts for the estimated project period (15
Years) were prepared based on which estimated earnings before interests tax
depreciat ion and amortization were calculated for each year Detailed PampL
balance sheet and cash flow statements are provided in annexure 2 3 and 4
EBITDA = Total Revenue ndash (Variable expenses + Fixed Expenses)
EBITDA margin = EBITDA Total Revenue
PAT margin PAT is calculated by subtracting interests pa id on capital debt and
working capital debt depreciation and applicable corporate income tax from
EBITDA
PAT = EBITDA ndash Interest Payable ndash Depreciation ndash Income tax
PAT margin = PATTotal Revenue
Working Capital Working capital requirement is calculated by subtract ing
current liabilities from current assets Current assets are estimated based on 30
days cash requirement and current liabilities are estimated as half of salary
monthly expenses
WC = Current Assets ndash Current Liabilities
UFCF It is defined as the free cash flows available to the firm if the firm has
zero debt liability Purpose of ca lculat ing UFCF for project period is to determinethe project IRR
UFCF = PAT + Depreciation + Interest (tax adjusted) + Release of WC + Salvage
value of the assets ndash CAPEX ndash Change in WC
882019 Major Project (Ramit)
httpslidepdfcomreaderfullmajor-project-ramit 3862
29
LCFF It is defined as the cash floes available to the firm after paying interests on
long term and short term debts
LCFF = UFCF ndash Interest (tax adjusted)
FCFE It is defined as the free cash flow available to equity holders It is
determined to ca lculate equity IRR for equity investors It also includes the tax
benefits which are available as per the Income Tax Act
FCFE PAT + Depreciation + Salvage Value ndash Equity Investment ndash Long term debt
repayment
PIRR Project IRR is defined as the discount rate at which NPV (Net Present
Value) of UFCF is zero It is calculated by using following formula
UFCF 1 (1+PIRR) 0+ UFCF 2 (1+PIRR) 1+ UFCF 3 (1+PIRR) 2+ helliphelliphelliphelliphelliphellip = 0
UFCF 1 = UFCF at the end of first year of operation
UFCF 2 = UFCF at the end of second year of operation
PIRR = Project IRR
EIRR Equity IRR is defined as the discount rate at which NPV of FCFE is zero
It is calculated by using following formula
FCFE1 (1+EIRR) 0+ FCFE 2 (1+EIRR) 1+ FCFE 3 (1+EIRR) 2+ helliphelliphelliphelliphelliphellip = 0
FCFE1 = FCFE at the end of first year of operation
FCFE2 = FCFE at the end of seco nd year of operation
EIRR = Equity IRR
882019 Major Project (Ramit)
httpslidepdfcomreaderfullmajor-project-ramit 3962
30
WACC It is de fined as the percentage of return expected by the investors who
otherwise would have earned some return by investing in some other project
WACC = Cost of Debt (Debt Capital) + Cost of equity (Equity Capital)
882019 Major Project (Ramit)
httpslidepdfcomreaderfullmajor-project-ramit 4062
882019 Major Project (Ramit)
httpslidepdfcomreaderfullmajor-project-ramit 4162
32
62 Funding planAs the telecom sites are rolled out over a 5 year period till FY 2014 investment will be
required for each year ABC Limited will start generating profits from FY 10 only Such
internally generated cash accruals will be ploughed back into the business to meet part of
the project cost Investment required for each year is tabulated below
Table 61 Funding ProposalMillion INR FY 10 FY 11 FY 12 FY 13 FY 14
GBT Tower (Additional) Nos 210 700 1400 2450 3850
RTT Tower (Additional) Nos 90 300 600 1050 1650DE ratio 233 233 233 233 233
Additional CAPEX 83892 279374 558748 977809 1536557
Debt 58725 195562 391124 684466 1075590
Equity 25168 83812 167624 293343 460967
63 Results
Based on assumptions given in Annexure 1 a detailed financial model was preparedResults of the financial model such as PampL account Balance Sheet and cash flow
statements are provided in Annexure 2 3 and 4 Forecasts for the key financial figures for
first five years are provided in the Table below
Forecasts
Table 62 Income StatementMillion INR FY-10 FY11 FY12 FY-13 FY-14
Sales 7124 50511 156766 347476 667700
Cost of sales 1950 13852 39252 87612 170021
Gross 5174 36659 117514 259864 497679
7263 7258 7496 7479 7454
Admin costs 112 179 190 203 216
882019 Major Project (Ramit)
httpslidepdfcomreaderfullmajor-project-ramit 4262
33
Finance cost 0 021 7401 31330 77725
Taxation 170 4233 14536 29073 53547
PAT 2454 19458 59470 122096 223267
As shown in Table above during the expansion period revenue will grow exponentially
In the first year of operation ABC will earn a revenue of INR 7124 million from 300
(210 GBT and 90 RTT) sites with a tenancy ratio of 15 for GBS and 17 for RTS In the
first 2 years of operation the company will not pay any interest on long term debt due to
2 years moratorium period Major cost associated with the project is depreciation due to
which PAT is lower than the operating profits But cash flows to the firm are enough to
result in reasonable returns
Table 63 Balance Shee tYear ending Mar-10 Mar-11 Mar-12 Mar-13 Mar-14
AssetsGross Block 75742 328216 833164 1716823 3105430Accumulated depreciation 2439 15208 51125 128287 271212Net Block 73303 313009 782040 1588536 2834219Net Working Capital 064 241 620 1335 2515Cash Balance 12979 72089 216513 488856 947982
Total Assets 86346 385339 999172 2078727 3784715LiabilitiesEquity 25168 108980 276604 569947 1030914Reserves amp Surplus 2454 21912 81381 203477 426745Long term Debt 58725 254286 640722 1304302 2325171WC Borrowings - 161 465 1001 1886Total Liabilities 86346 385339 999172 2078727 3784715
Note All figures are in Million INR
Table 64 Key financial ratiosMar-11 Mar-12 Mar-13 Mar-14 Mar-15
Revenue Growth 60902 21036 12165 9216 3890EBITDA Growth 62061 22161 12132 9158 4020
PAT Growth 69293 20564 10531 8286 2955
As shown in table above increase in EBITDA is higher than that of revenue This is due
to better operational efficiency of ABCrsquos management and economies of scale S imilarly
882019 Major Project (Ramit)
httpslidepdfcomreaderfullmajor-project-ramit 4362
34
increase in PAT is lesser than that of EBITDA because of high depreciation and interest
expenses
Table 65 Pr ofitability r atios
Mar-11 Mar-12 Mar-13 Mar-14 Mar-15
EBITDA Margin 7222 7484 7473 7450 7520
PAT Margin 3852 3794 3514 3344 3119Return on Net Worth 622 760 769 788 1087
Key profitability ratios are shown in table above Return on net worth in the initial years
is lower because of the ambitious expansion plans of ABC Limited Thereafter return on
net worth increases with increase in PAT
Returns on Investment
Table 66 Financial returnsFinancial Indicators
Project IRR 1813Equity IRR 3609
64 Sensitivity Analysis
A sensitivity analysis has been carried out on the project financials to determine theimpact of key variables on the financial indicators namely
Project IRR
The key variables on which sensitivity analysis have been carried out areCapital expenditure for GBS and RTS1st and 2 nd tenant tariff for GBS1st and 2 nd tenant tariff for RTSTenancy Ratio
Similarly sensitivity analysis has been carried out forEquity IRR
The key variables on which sensitivity analysis have been carried out for EIRR are
Capital structure and interest rate for capital debtRepayment period and moratorium period
882019 Major Project (Ramit)
httpslidepdfcomreaderfullmajor-project-ramit 4462
35
The impact on the financial indicators is shown below
Figure 6-1 Project IRR vs GBT and RTT CAPEX
As shown in Figure 6-1 project IRR is more sensitive to change in CAPEX of RTT sitesas compared to change in CAPEX of GBT sites because tenancy ratio and tariff for RTTsites are higher than those of GBT sites
882019 Major Project (Ramit)
httpslidepdfcomreaderfullmajor-project-ramit 4562
36
Figure 6-2 Project IRR vs GBT Tariff for 1 st tenant (X-axis) and 2 nd tenant (right-hand side)
As shown in Figure 6-2 project IRR varies linearly with GBT tariff In the best casescenario when GBT tariff for 1 st tenant is INR 34000month and GBT tariff for secondtenant is INR 26000month Project IRR is 2101
Figure 6-3 Project IRR vs RTT Tariff for 1 st tenant (X-axis) and 2 nd tenant (right-hand side)
As shown in Figure 6-2 project IRR varies linearly with RTT tariff In the best casescenario when RTT tariff for 1 st tenant is INR 24000month and RTT tariff for second
882019 Major Project (Ramit)
httpslidepdfcomreaderfullmajor-project-ramit 4662
37
tenant is INR 20000month Project IRR is 1932 Project IRR is more sensitivetowards RTT tariff than GBT tariff because in practical business situation RTT siteshave a tenancy ratio of more than two due to which effect of tariff for 1 st tenant almostget nullified after few years
Figure 6-4 Project IRR vs Tenancy ratio for RTT sites (X-axis) and GBT sites
As shown in Figure 6-4 project IRR is very sensitive to tenancy ratio In the best casescenario where GBT sites have a tenancy ratio of 2 and RTT sites have a tenancy ratio of 3 project IRR can be as high as 20
Figure 6-5 Equity IRR vs long term debt interest rate for different leverage level
882019 Major Project (Ramit)
httpslidepdfcomreaderfullmajor-project-ramit 4762
38
As shown in figure 6-5 equity IRR is more sensitive to interest rate on long term debt forhigh level of leverage (lower debt equity ratio) because as the debt equity ratio increasesinterest paid on long term debt also increases significantly
Figure 6-6 Equity IRR vs long term debt repayment period at different level of moratoriumperiods
As shown in figure 6-6 Equity IRR increases with increase in moratorium period anddebt repayment period The variation is from 1654 to 60 for worst case and best casescenarios
882019 Major Project (Ramit)
httpslidepdfcomreaderfullmajor-project-ramit 4862
39
7 RISK ASSESSMENTRisk Mitigation strategyExecution Risk
(Project management landacquisition etc)
Management of ABC has proven expertise in
telecom infrastructure rollout and has executedvarious projects with large telecom operators andMNC vendorsABCrsquos top management team consists of a groupof professionals drawn from leading telecomInfrastructure Company who have immenseexpertise and experience in rolling out telecominfrastructure projects
Market Risk (No entry barriers operators may
share infrastructure betweenthemselves large players withhigh capital may increasecompetition)
India has a huge potential for telecominfrastructure market With increasing
competition falling tariffs and pressure onmargins telecom service providers are beingforced to increase their focus on marketing andreduce their expensesExperienced management healthy capital back-up effective presence in the telecominfrastructure market and value added services atrelatively lesser cost will help ABC to meet theset targets
Financing Risk
(Availability of equity capitalavailability of long term debtinterest rate and moratoriumperiod)
ABC is seeking private equity partner to secure
equity capital Company has already entered intoNDA with 2 major investorsLong term debt at an interest rate of 125 canbe easily arranged because of the credibility of the promoters in the marketMany other similar firms like Indus and GTLhave already secured long term debt for amoratorium period of 2 years Promoters of ABCLimited are confident to secure a long term debtwith a moratorium period of 2 years and apayback period of 8 years
ABC Limited would minimize the workingcapital requirements of its business by securingrentals and operating revenues in advance fromits clients and or by suitably structuring itspayment liabilities to match its cash inflows
Commercial Risk (Tenancy ratio and tariff forGBS and RTS)
ABC would aim to enter into long term contractswith the ldquoanchor tenantrdquo operator and thenrollout the infrastructure so that at least single
882019 Major Project (Ramit)
httpslidepdfcomreaderfullmajor-project-ramit 4962
40
occupancy of each site is ensured at all t imesPromoters will use its knowledge of the businessand its expertise to identify and roll out sites inlocations which have strong multi- tenancypotential to minimize occupancy risk
Revenue Risk (Operating fees may decreasecredit worthiness of the clientsdelay in payment of rentals)
As per the industry sources till now not even asingle operator have dishonored the long termlease contractThe credit risk is diversified as there will bemultiple operatorsABC would aggressively market to get 3G andWiFi broadcasters to use the sites and earnadditional revenues in addition to the assumedrevenue streams
Natural Calamities Risk The Company shall maintain insurance for thesites against these risks and the cost of insurancewill be priced in and passed on to the tenants
882019 Major Project (Ramit)
httpslidepdfcomreaderfullmajor-project-ramit 5062
41
8 CONCLUSION
India is the fastest growing wireless telecom market in the world The continuing
growth in the number of wireless subscribers and MoUs and increasing trend of
outsourcing of business processes to India has led to growing demand for large
investments in the telecom infrastructure in the country
However with increasing competition falling tariffs and pressure on margins
telecom service providers are being forced to increase their focus on marketing
customer acquisitions and branding and minimize their efforts and overheads in
project management and asset acquisition
Further with rising prices of steel cement and real estate the cost of developing
and owning passive infrastructure is increasingly becoming a costly proposition
for most operators and service providers
The compulsion on the part of service providers to reduce their operating costs
and capital expenditure requirements has led to opportunities in passiveinfrastructure outsourcing to independent third party infrastructure providers and
also sharing the infrastructure with other service providers It is expected that
cellular operators will outsource their communications site infrastructure needs as
a means of accelerating access to their markets and preserving capital rather than
constructing and operating their own communications sites and maintaining their
own communications sites service and deve lopment capabilities
Passive infrastructure is highly capital intensive and an integral part of the cellular
service providersrsquo networks Yet being a simple and low technology asset it is
amenable to outsourcing and sharing By transferring the responsibility of
ownership development and maintenance of passive infrastructure service
882019 Major Project (Ramit)
httpslidepdfcomreaderfullmajor-project-ramit 5162
42
providers have an opportunity to transfer a substantial part of their business risk to
third parties
Most telecom operators are facing capacity constraints on their networksCoverage obligations increasing pressure to improve network quality and
competition has led to aggressive roll out plans by existing cellular operators
Installation of cell sites has become a cumbersome process as there are a number
of clearances required and involves labor-intensive micro management
Availability of ready infrastructure from third party providers would enable the
operators to reduce their time to market and accelerate their access to their
customers Cellular service providers generally want to move quickly when
adding more sites and co-location on an existing site is always faster than
building
Ownership and maintenance of telecom towers and other infrastructure by third
parties is an established practice in developed nations like USA and is
increasingly gaining market acceptance in India
The Indian government is seriously considering promoting the infrastructure
sharing route between the telecom operator and private players to achieve future
national tele-density targets and improve rural telecom penetration
ABC being an independent entity with no business conflicts with other service
providers in the telecom space will be best positioned and have an early mover
advantage to capitalize on this emerging opportunity
Further the task of operating and maintaining the passive infrastructure in the cell
is increasingly becoming a cumbersome exercise for the service providers to
handle ABCrsquos composite offering to build passive infrastructure for the cellular
operators and also operate and maintain them will provide a turnkey solution to
address the infrastructure needs of the service providers
882019 Major Project (Ramit)
httpslidepdfcomreaderfullmajor-project-ramit 5262
43
The business model proposed to be followed by ABC is fairly simple with stable
and predictable cash flows as is the case with the business model of the tower
renting companies in USA Most contracts are long term for a period 10 or moreyears with annual price escalators generally ranging from 3 to 4 However
wireless carriers normally tend to renew rentals because suitable alternative sites
may not exist or be available and repositioning a site in a carrierrsquos network is
expensive and may adverse ly affect network quality
Site ownership and operations is a ldquoscalerdquo business operating administration
marketing expenses etc do not rise as quickly as revenues when portfolios are
expanded Incremental operating costs associated with adding wireless tenants to
a communications site are minimal Therefore as additional tenants are added to a
site the substantial majority of incremental revenue contributes to margin
expansion Most tower companies have high EBITDA margins as may be seen
from the financial indicators of some of the tower rental companies in USA
It is expected that site location and capacity price and quality of service and
successful execution of contracts will be the most significant competitive factors
in this business
ABCrsquos revenue and returns on investment will be primarily driven by its ability
to
o Increase the utilization of the space and infrastructure capacity owned by it by
increasing the number of tenants per site and renting out to maximum number
of users As discussed above return on capital employed (PIRR and EIRR) arevery sensitive to tenancy ratio In worst case scenario project IRR can be as
low as 8 and in the best case scenario it can be as high as 20
o Develop acquire sites of strategic importance and high growth potential that
will enable them to secure better commercial terms from users and attract
more number of tenants Infrastructure provisioning fees rentals for sites are
882019 Major Project (Ramit)
httpslidepdfcomreaderfullmajor-project-ramit 5362
44
extremely location sensitive There is a potential to acquire more land than
that of required to capitalize on the increase in real estate prices
o Develop sites in a cost effective manner ABC would consider purchasing
land only for those GBS sites which have sufficient demand and arestrategically located Else for most of its sites land will be leasehold As
shown above returns (PIRR and EIRR) are very sensitive to capital costs In
the worst case scenario project IRR can be as low as 15 whereas it can as
high as 27 in the best case scenario
o Negotiate and secure long term contracts with good credit quality users with
built in price escalation provisions to mitigate financing risk
o Leverage and secure long term financing at attractive terms and involve in
active treasury management to keep low financing cost Results of the
sensitivity analysis indicate that equity IRR can be as high as 60 foe a
moratorium period of 4 years and interest rate of 10
o Minimize working capital requirements
o Maintain low operating and administration expense
o Secure better OampM margins from operators and retain a healthy share of it in
ABC
o Maintain high service standards and build strong customer relationships
The business would have the potential to capture new revenue opportunities
around the existing assets As demand for towers is expected to grow and as
operators migrate to speedier next-generation wireless technologies they will
need the towers and associated passive infrastructure to transmit their new
services in addition to their existing offerings In addition to increasing capacity
and coverage and improving the quality of their networks cellular serviceproviders are deploying high speed data networks driving incremental demand of
sites The business therefore has potential upsides in the form of adding
customers (tenants) in wireless broadband third generation (ldquo3Grdquo) and wireless
data capabilities and also other incremental value propositions by way of hosting
882019 Major Project (Ramit)
httpslidepdfcomreaderfullmajor-project-ramit 5462
45
Billboards Hoardings etc in some of the high visible sites owned and maintained
by it
Based on the assumptions and subject to satisfactory resolution of the key risks
factors project cash flows will be able to meet debt service obligations
This business model is a lucrative investment option for a private equity player
because valuation of each site will increase in the coming years due to
improvement in market conditions increase in the value of land and increase in
the demand for passive infrastructure in rural and semi-urban areas
882019 Major Project (Ramit)
httpslidepdfcomreaderfullmajor-project-ramit 5562
46
REFERENCESAnjan G V A amp N M (2009) telecom infrastructure industry in india GurgaonICRA
Bessler W Norsworthy J amp Shusterman T (2001 12 1) Mergers in the UStelecommunications industry and market valuationeffects IEEE p 288
COAI (2009 march 14) Subscriber Figures Retrieved march 14 2009 fromCOAIcom httpwwwcoaicomstatisticsphp
IDA (2009 march 23) Highlights Retrieved march 23 2009 from idagovsghttpwwwidagovsghomeindexaspx
K R (2008) Time for new business model Delhi Cybermedia
MAXIS (2009 march 8) the malaysian telecommunications industry Retrieved march9 2009 from maxiscommyhttpwwwmaxiscommypersonalabout_usinvestorprospectusprospectus4pdf
P J amp Lisa A (2009) Stimulas spending and American Telecom Industry USACoracle group
PwC (2009 march 12) Indian Telecom Industry Gurgaon Harayana IndiaRamachanran (2009 march 1) Investment in Telecom Infrastructure sector (M RInterviewer)
Vogelsang I (2002) The German Telecommunications Reform Verein fuumlr Socialpolitik (p 26) Innsbruck Boston Press
882019 Major Project (Ramit)
httpslidepdfcomreaderfullmajor-project-ramit 5662
47
ANNEXURES
ANNEXURE 1 Key Assumptions
The occupancy of each site by single two three operators for green-field sites is assumed
to be as follows
Table 91 Expected Tenancy RatiosFY 10 FY 11 FY 12 FY 13 FY 14 FY15
GBT Tenant
Ratio 150 150 170 170 170 200
Single Operator 50 50 30 30 30 0
Two Operator 50 50 70 70 70 100
RTT Tenant
Ratio 170 170 200 200 200 250
Single Operator 30 30 0 0 0 0
Two Operator 70 70 100 100 100 50
Three Operator 0 0 0 0 0 50
From FY 15 onwards tenancy ratio of 2 and 25 for GBT and RTT sites is cons idered
882019 Major Project (Ramit)
httpslidepdfcomreaderfullmajor-project-ramit 5762
48
Capital costs related assumptions are tabulated below
Table 92 GBT and RTT Capital Cost
The lease rentals for RTT sites are reimbursed from the operators and therefore have not
been factored in the revenues as well as the expense For GBT sites land purchase cost of
035 millions assumed which has been escalated by 6 annually to determine the
salvage value of assets
GBT Capital Costs
Million
INR
Delivery cost of Ground Based
Tower (GBT)063
Delivery cost of Generator 030
Civil Work 040Shelter 012
Electrical Works 030
Other Equipments (UPS Battery
etc)045
Construction cost 045
Land 035
Contingency amp Financial Charges 035Total cost 335
RTT Capital Costs
Million
INR
Delivery cost of Roof Top
Tower (RTT) 030
Delivery cost of Generator 020
Civil Work 020Shelter 012
Electrical Works 030
Other Equipments (UPS
Battery etc) 030
Construction cost -
Land -
Contingency amp FinancialCharges 008
Total cost 150
882019 Major Project (Ramit)
httpslidepdfcomreaderfullmajor-project-ramit 5862
49
Ope rating costs related assumptions are tabulated below
Table 93 Operating CostsOperating Costs
Security Sentries (INRMonth) 4000
Supervisors (INRMonth) 6000
Cluster Manager One for Fifty Towers (INRMonth) 15000
Annual increase 500
Number of Security Sentries per tower 300
Number of supervisors per tower 010
Number of C luster manager per tower 002
Fixed Expenses
Selling amp Maintenance (INRMonth) 4000000
Annual Escalation 5
Administration overhead (INRMonth) 10000000Annual Escalation 7
AMC Cost of Generator 15 (cost of generator)
Annual Escalation (AMC) 3
For RTT sites security sentries are not required because it will be the responsibility of
the site owner A supervisor will for every 10 sites and a cluster manager for every 50
sites will be required
882019 Major Project (Ramit)
httpslidepdfcomreaderfullmajor-project-ramit 5962
50
Table 94 Long term debtInterest Rate 125 per annum
Moratorium 2 years
Repayment Period 8 years
Tariff related assumptions and date of operations are tabulated below
Table 95 GBT and RTT Tariff Table 96 Life of the projectTariff Plan
Tariff (INRMonth)
No of
operators GBT RTT
1 28000 18000
2 22000 14000
3 0 12000
Annual
increase 3 3
Commercial Operation Date 1-Aug-09
Quarter Ending 30-Sep-09
FY ending COD 31-Mar-10
Project life years 15
End of commercial
operations31-Aug-24
Quarter ending commercial
operations30-Sep-24
FY ending comme rcial
operations31-Mar-25
882019 Major Project (Ramit)
httpslidepdfcomreaderfullmajor-project-ramit 6062
51
Annexure 2 Profit amp Loss accountsTable 97 Profit amp loss account statement
Income Statement (MNINR)Year ending Mar-10 Mar-11 Mar-12 Mar-13 Mar-14 Mar-15
RevenueGBT 406350 28811 89080 197447 379409 527015Operator Fees (GBT) 1411 10004 30678 67998 130664 179664RTT 1209 8575 27269 60443 116146 164264
Operator Fees (RTT) 440 3121 9739 21587 41481 56466Net Revenue 7124 50511 156766 347476 667700 927410
Expenses
VariableSecurity Sentries 1355 9790 28339 64033 125433 158238Supervisors 097 699 2024 4574 8959 11303Cluster Manager 048 350 10 12 2287 4480 5651AMC Cost of Generator 450 3013 7877 16719 31148 54541Sub-total 1950 13852 39252 87612 170021 229734
Fixed
Selling amp Maintenance(INRMonth) 032 050 053 056 058 061
Administration overhead(INRMonth) 080 128 137 147 157 168
Sub-total 112 179 190 203 216 230
EBITDA 5062 36480 117324 259661 497464 697447
Interest on LT loan - - 7341 31200 77479 156198Interest on ST loan - 021 060 130 245 361
EBDT 5062 36459 109923 228331 419739 540888Depreciation 2439 12769 35917 77162 142925 174006
EBT 2624 23691 74006 151169 276814 366881Income Tax 170 4233 14536 29073 53547 77634
PAT 2454 19458 59470 122096 223267 289247
882019 Major Project (Ramit)
httpslidepdfcomreaderfullmajor-project-ramit 6162
52
Annexure 3 Balance sheet
Table 98 B alance sheetsYearend Balance Sheet (MNINR)Year ending Mar-10 Mar-11 Mar-12 Mar-13 Mar-14 Mar-15
AssetsGross Block 75742 328216 833164 1716823 3105430 3105430Accumulated depreciation 2439 15208 51125 128287 271212 445218Net Block 73303 313009 782040 1588536 2834219 2660212Net Working Capital 064 241 620 1335 2515 3707Cash Balance 12979 72089 216513 488856 947982 1294734Total Assets 86346 385339 999172 2078727 3784715 3958653
LiabilitiesEquity 25168 108980 276604 569947 1030914 1030914Reserves amp Surplus 2454 21912 81381 203477 426745 715992Long term Debt 58725 254286 640722 1304302 2325171 2208967WC Borrowings - 161 465 1001 1886 2780Total Liabilities 86346 385339 999172 2078727 3784715 3958653
882019 Major Project (Ramit)
httpslidepdfcomreaderfullmajor-project-ramit 6262
Annexure 4 Cash flow statement
Table 99 Cash flow statements
Year ending Mar-10 Mar-11 Mar-12 Mar-13 Mar-14 Mar-15
InflowsPAT 2454 19458 59470 122096 223267 289247Depreciation 2439 12769 35917 77162 142925 174006Tax adjusted interest - 014 4959 20991 52076 104895Release of WC - - - - - -Salvage Value - - - - - -Sub-Total 4893 32241 100345 220249 418268 568148
OutflowsCapex 75742 252474 504948 883659 1388607 -Change in WorkingCapital 064 177 379 715 1180 1192
Sub-Total 75806 252651 505327 884374 1389787 1192
UFCF (70913) (220410) (404982) (664125) (971519) 566956LFCF (70913) (220424) (409940) (685116) (1023595) 462062
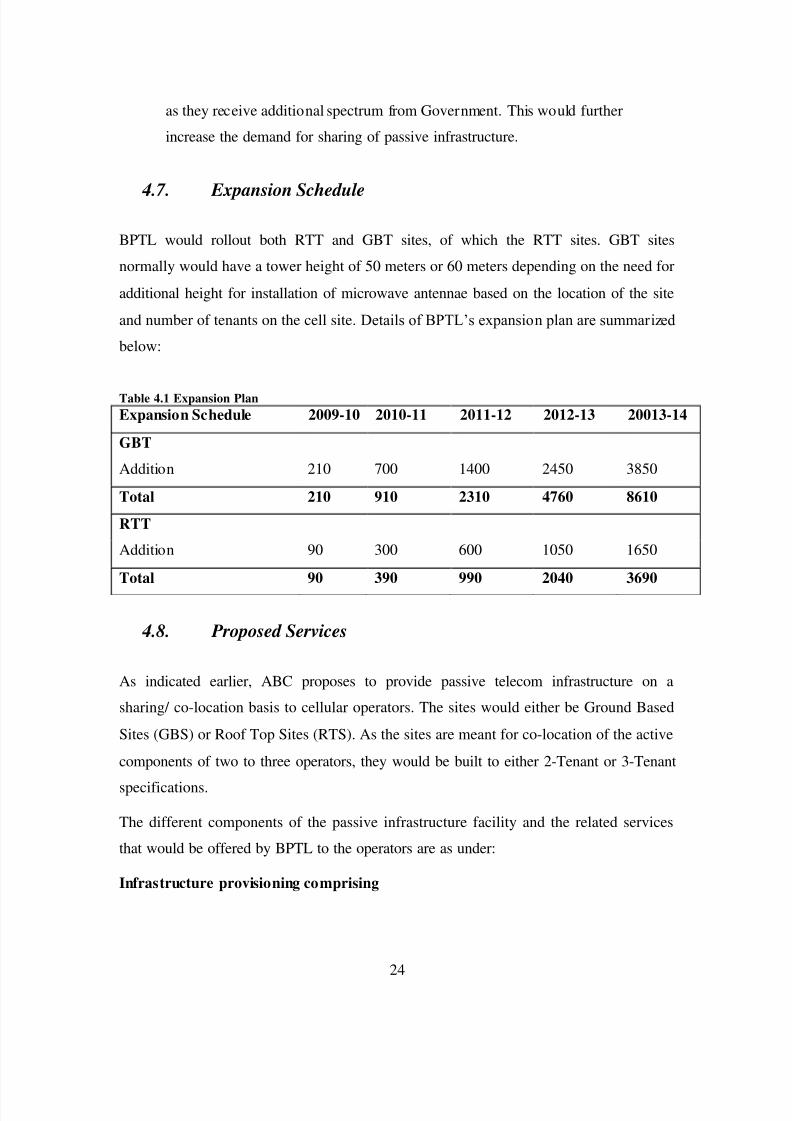
882019 Major Project (Ramit)
httpslidepdfcomreaderfullmajor-project-ramit 3362
24
as they receive additional spectrum from Government This would further
increase the demand for sharing of passive infrastructure
47
Expansion Schedule
BPTL would rollout both RTT and GBT sites of which the RTT sites GBT sites
normally would have a tower height of 50 meters or 60 meters depending on the need for
additional height for installation of microwave antennae based on the location of the site
and number of tenants on the cell site Details of BPTLrsquos expansion plan are summarized
below
Table 41 Expansion PlanExpansion Schedule 2009-10 2010-11 2011-12 2012-13 20013-14
GBT
Addition 210 700 1400 2450 3850
Total 210 910 2310 4760 8610
RTT
Addition 90 300 600 1050 1650
Total 90 390 990 2040 3690
48 Proposed Services
As indicated earlier ABC proposes to provide passive telecom infrastructure on a
sharing co-location basis to cellular operators The sites would either be Ground Based
Sites (GBS) or Roof Top Sites (RTS) As the sites are meant for co-location of the active
components of two to three operators they would be built to either 2-Tenant or 3-Tenant
specifications
The different components of the passive infrastructure facility and the related services
that would be offered by BPTL to the operators are as under
Infrastructure provisioning comprising
882019 Major Project (Ramit)
httpslidepdfcomreaderfullmajor-project-ramit 3462
25
Communication tower built to host multiple antennae
Weather-proof communication shelter with air-conditioning and power backup
arrangement
Diesel generating set and battery bank for power backup
A mobile standby generator to act as backup in case o f breakdown
Warehousing facility
Infrastructure operations and maintenance including
Regular operations and maintenance of the facility
Security of all the equipments at the site at all timesA dedicated team of technicians for a group of 40-50 sites to ensure effect ive and
efficient functioning of the components at all times
49 Proposed Organizational Structure
A senior management team will work under the leadership of the ldquoChief Operations
Officerrdquo who will be responsible for smooth implementation of proj ect activities He willalso assist the managing director in marketing This team will coordinate with Stallion
Telecom Pvt Ltd which will take over the role of procuring Capital Equipments
Senior management will consists of project manager infrastructure manager commercial
manager and head (legal and company affairs Apart from this there will be a requirement
Chief OperatingOfficer
Project Manager Infrastructure
Manager
Commercial
Manager (projects)
Head (Legal and
Company Affairs)
882019 Major Project (Ramit)
httpslidepdfcomreaderfullmajor-project-ramit 3562
26
of security sentries (3 per GBT site) supervisors (one for every 10 sites) and cluster
manager (one for every 50 sites)
Bharat Telemast will carry out the complete Project execution with the assistance of third party ldquoQuality control organizationrdquo and a third party ldquoProject management teamrdquo
Quality control and project management activities will be o utsourced to a third party
882019 Major Project (Ramit)
httpslidepdfcomreaderfullmajor-project-ramit 3662
27
5 METHODOLOGY
The changing face of infrastructure services creates a complex situation which demands
greater understanding of roles of competition regulatory structures and modes of
financing Knowledge of such things is a key decisive factor in building confidence
among investors promoters and government In project finance the project its assets
contract and cash flows are separated from promoter in order to permit credit appraisal
or loan to the project
As part of the financial feasibility analysis a series of related financial statements based
on projected sources and uses of funds during the development and operating phaseproject were created Financial statements consist of expenses associated with
development activities including capital costs like acquisition of land for GBT sites cost
of tower generator shelter batteries etc Most of the data regarding capital costs are
obtained from the promoter of ABC Limited All these capital costs related details are
provided in annexure 1
Assumption regarding depreciation capital structure operating expenses expansion
schedule tenancy ratios tariff or rent operatorrsquos fees and loan amortization schedule are
obtained from professional accountants Promoter and bankers of ABC Limited
Due to unknown factors that could influence the cost of towers or fees associated with
completing the project (soft costs) contingency costs were estimated at 5 of hard and
soft costs respectively If contingency is set too low developers could easily encounter
funding shortfalls upon slight changes in market forces All other costs were estimated
based on talking with industry professionals (Promoters)
A detailed financial model was prepared based on existing accounting standards and
following financial ratios were estimated
882019 Major Project (Ramit)
httpslidepdfcomreaderfullmajor-project-ramit 3762
28
EBITDA margin Profit and loss accounts for the estimated project period (15
Years) were prepared based on which estimated earnings before interests tax
depreciat ion and amortization were calculated for each year Detailed PampL
balance sheet and cash flow statements are provided in annexure 2 3 and 4
EBITDA = Total Revenue ndash (Variable expenses + Fixed Expenses)
EBITDA margin = EBITDA Total Revenue
PAT margin PAT is calculated by subtracting interests pa id on capital debt and
working capital debt depreciation and applicable corporate income tax from
EBITDA
PAT = EBITDA ndash Interest Payable ndash Depreciation ndash Income tax
PAT margin = PATTotal Revenue
Working Capital Working capital requirement is calculated by subtract ing
current liabilities from current assets Current assets are estimated based on 30
days cash requirement and current liabilities are estimated as half of salary
monthly expenses
WC = Current Assets ndash Current Liabilities
UFCF It is defined as the free cash flows available to the firm if the firm has
zero debt liability Purpose of ca lculat ing UFCF for project period is to determinethe project IRR
UFCF = PAT + Depreciation + Interest (tax adjusted) + Release of WC + Salvage
value of the assets ndash CAPEX ndash Change in WC
882019 Major Project (Ramit)
httpslidepdfcomreaderfullmajor-project-ramit 3862
29
LCFF It is defined as the cash floes available to the firm after paying interests on
long term and short term debts
LCFF = UFCF ndash Interest (tax adjusted)
FCFE It is defined as the free cash flow available to equity holders It is
determined to ca lculate equity IRR for equity investors It also includes the tax
benefits which are available as per the Income Tax Act
FCFE PAT + Depreciation + Salvage Value ndash Equity Investment ndash Long term debt
repayment
PIRR Project IRR is defined as the discount rate at which NPV (Net Present
Value) of UFCF is zero It is calculated by using following formula
UFCF 1 (1+PIRR) 0+ UFCF 2 (1+PIRR) 1+ UFCF 3 (1+PIRR) 2+ helliphelliphelliphelliphelliphellip = 0
UFCF 1 = UFCF at the end of first year of operation
UFCF 2 = UFCF at the end of second year of operation
PIRR = Project IRR
EIRR Equity IRR is defined as the discount rate at which NPV of FCFE is zero
It is calculated by using following formula
FCFE1 (1+EIRR) 0+ FCFE 2 (1+EIRR) 1+ FCFE 3 (1+EIRR) 2+ helliphelliphelliphelliphelliphellip = 0
FCFE1 = FCFE at the end of first year of operation
FCFE2 = FCFE at the end of seco nd year of operation
EIRR = Equity IRR
882019 Major Project (Ramit)
httpslidepdfcomreaderfullmajor-project-ramit 3962
30
WACC It is de fined as the percentage of return expected by the investors who
otherwise would have earned some return by investing in some other project
WACC = Cost of Debt (Debt Capital) + Cost of equity (Equity Capital)
882019 Major Project (Ramit)
httpslidepdfcomreaderfullmajor-project-ramit 4062
882019 Major Project (Ramit)
httpslidepdfcomreaderfullmajor-project-ramit 4162
32
62 Funding planAs the telecom sites are rolled out over a 5 year period till FY 2014 investment will be
required for each year ABC Limited will start generating profits from FY 10 only Such
internally generated cash accruals will be ploughed back into the business to meet part of
the project cost Investment required for each year is tabulated below
Table 61 Funding ProposalMillion INR FY 10 FY 11 FY 12 FY 13 FY 14
GBT Tower (Additional) Nos 210 700 1400 2450 3850
RTT Tower (Additional) Nos 90 300 600 1050 1650DE ratio 233 233 233 233 233
Additional CAPEX 83892 279374 558748 977809 1536557
Debt 58725 195562 391124 684466 1075590
Equity 25168 83812 167624 293343 460967
63 Results
Based on assumptions given in Annexure 1 a detailed financial model was preparedResults of the financial model such as PampL account Balance Sheet and cash flow
statements are provided in Annexure 2 3 and 4 Forecasts for the key financial figures for
first five years are provided in the Table below
Forecasts
Table 62 Income StatementMillion INR FY-10 FY11 FY12 FY-13 FY-14
Sales 7124 50511 156766 347476 667700
Cost of sales 1950 13852 39252 87612 170021
Gross 5174 36659 117514 259864 497679
7263 7258 7496 7479 7454
Admin costs 112 179 190 203 216
882019 Major Project (Ramit)
httpslidepdfcomreaderfullmajor-project-ramit 4262
33
Finance cost 0 021 7401 31330 77725
Taxation 170 4233 14536 29073 53547
PAT 2454 19458 59470 122096 223267
As shown in Table above during the expansion period revenue will grow exponentially
In the first year of operation ABC will earn a revenue of INR 7124 million from 300
(210 GBT and 90 RTT) sites with a tenancy ratio of 15 for GBS and 17 for RTS In the
first 2 years of operation the company will not pay any interest on long term debt due to
2 years moratorium period Major cost associated with the project is depreciation due to
which PAT is lower than the operating profits But cash flows to the firm are enough to
result in reasonable returns
Table 63 Balance Shee tYear ending Mar-10 Mar-11 Mar-12 Mar-13 Mar-14
AssetsGross Block 75742 328216 833164 1716823 3105430Accumulated depreciation 2439 15208 51125 128287 271212Net Block 73303 313009 782040 1588536 2834219Net Working Capital 064 241 620 1335 2515Cash Balance 12979 72089 216513 488856 947982
Total Assets 86346 385339 999172 2078727 3784715LiabilitiesEquity 25168 108980 276604 569947 1030914Reserves amp Surplus 2454 21912 81381 203477 426745Long term Debt 58725 254286 640722 1304302 2325171WC Borrowings - 161 465 1001 1886Total Liabilities 86346 385339 999172 2078727 3784715
Note All figures are in Million INR
Table 64 Key financial ratiosMar-11 Mar-12 Mar-13 Mar-14 Mar-15
Revenue Growth 60902 21036 12165 9216 3890EBITDA Growth 62061 22161 12132 9158 4020
PAT Growth 69293 20564 10531 8286 2955
As shown in table above increase in EBITDA is higher than that of revenue This is due
to better operational efficiency of ABCrsquos management and economies of scale S imilarly
882019 Major Project (Ramit)
httpslidepdfcomreaderfullmajor-project-ramit 4362
34
increase in PAT is lesser than that of EBITDA because of high depreciation and interest
expenses
Table 65 Pr ofitability r atios
Mar-11 Mar-12 Mar-13 Mar-14 Mar-15
EBITDA Margin 7222 7484 7473 7450 7520
PAT Margin 3852 3794 3514 3344 3119Return on Net Worth 622 760 769 788 1087
Key profitability ratios are shown in table above Return on net worth in the initial years
is lower because of the ambitious expansion plans of ABC Limited Thereafter return on
net worth increases with increase in PAT
Returns on Investment
Table 66 Financial returnsFinancial Indicators
Project IRR 1813Equity IRR 3609
64 Sensitivity Analysis
A sensitivity analysis has been carried out on the project financials to determine theimpact of key variables on the financial indicators namely
Project IRR
The key variables on which sensitivity analysis have been carried out areCapital expenditure for GBS and RTS1st and 2 nd tenant tariff for GBS1st and 2 nd tenant tariff for RTSTenancy Ratio
Similarly sensitivity analysis has been carried out forEquity IRR
The key variables on which sensitivity analysis have been carried out for EIRR are
Capital structure and interest rate for capital debtRepayment period and moratorium period
882019 Major Project (Ramit)
httpslidepdfcomreaderfullmajor-project-ramit 4462
35
The impact on the financial indicators is shown below
Figure 6-1 Project IRR vs GBT and RTT CAPEX
As shown in Figure 6-1 project IRR is more sensitive to change in CAPEX of RTT sitesas compared to change in CAPEX of GBT sites because tenancy ratio and tariff for RTTsites are higher than those of GBT sites
882019 Major Project (Ramit)
httpslidepdfcomreaderfullmajor-project-ramit 4562
36
Figure 6-2 Project IRR vs GBT Tariff for 1 st tenant (X-axis) and 2 nd tenant (right-hand side)
As shown in Figure 6-2 project IRR varies linearly with GBT tariff In the best casescenario when GBT tariff for 1 st tenant is INR 34000month and GBT tariff for secondtenant is INR 26000month Project IRR is 2101
Figure 6-3 Project IRR vs RTT Tariff for 1 st tenant (X-axis) and 2 nd tenant (right-hand side)
As shown in Figure 6-2 project IRR varies linearly with RTT tariff In the best casescenario when RTT tariff for 1 st tenant is INR 24000month and RTT tariff for second
882019 Major Project (Ramit)
httpslidepdfcomreaderfullmajor-project-ramit 4662
37
tenant is INR 20000month Project IRR is 1932 Project IRR is more sensitivetowards RTT tariff than GBT tariff because in practical business situation RTT siteshave a tenancy ratio of more than two due to which effect of tariff for 1 st tenant almostget nullified after few years
Figure 6-4 Project IRR vs Tenancy ratio for RTT sites (X-axis) and GBT sites
As shown in Figure 6-4 project IRR is very sensitive to tenancy ratio In the best casescenario where GBT sites have a tenancy ratio of 2 and RTT sites have a tenancy ratio of 3 project IRR can be as high as 20
Figure 6-5 Equity IRR vs long term debt interest rate for different leverage level
882019 Major Project (Ramit)
httpslidepdfcomreaderfullmajor-project-ramit 4762
38
As shown in figure 6-5 equity IRR is more sensitive to interest rate on long term debt forhigh level of leverage (lower debt equity ratio) because as the debt equity ratio increasesinterest paid on long term debt also increases significantly
Figure 6-6 Equity IRR vs long term debt repayment period at different level of moratoriumperiods
As shown in figure 6-6 Equity IRR increases with increase in moratorium period anddebt repayment period The variation is from 1654 to 60 for worst case and best casescenarios
882019 Major Project (Ramit)
httpslidepdfcomreaderfullmajor-project-ramit 4862
39
7 RISK ASSESSMENTRisk Mitigation strategyExecution Risk
(Project management landacquisition etc)
Management of ABC has proven expertise in
telecom infrastructure rollout and has executedvarious projects with large telecom operators andMNC vendorsABCrsquos top management team consists of a groupof professionals drawn from leading telecomInfrastructure Company who have immenseexpertise and experience in rolling out telecominfrastructure projects
Market Risk (No entry barriers operators may
share infrastructure betweenthemselves large players withhigh capital may increasecompetition)
India has a huge potential for telecominfrastructure market With increasing
competition falling tariffs and pressure onmargins telecom service providers are beingforced to increase their focus on marketing andreduce their expensesExperienced management healthy capital back-up effective presence in the telecominfrastructure market and value added services atrelatively lesser cost will help ABC to meet theset targets
Financing Risk
(Availability of equity capitalavailability of long term debtinterest rate and moratoriumperiod)
ABC is seeking private equity partner to secure
equity capital Company has already entered intoNDA with 2 major investorsLong term debt at an interest rate of 125 canbe easily arranged because of the credibility of the promoters in the marketMany other similar firms like Indus and GTLhave already secured long term debt for amoratorium period of 2 years Promoters of ABCLimited are confident to secure a long term debtwith a moratorium period of 2 years and apayback period of 8 years
ABC Limited would minimize the workingcapital requirements of its business by securingrentals and operating revenues in advance fromits clients and or by suitably structuring itspayment liabilities to match its cash inflows
Commercial Risk (Tenancy ratio and tariff forGBS and RTS)
ABC would aim to enter into long term contractswith the ldquoanchor tenantrdquo operator and thenrollout the infrastructure so that at least single
882019 Major Project (Ramit)
httpslidepdfcomreaderfullmajor-project-ramit 4962
40
occupancy of each site is ensured at all t imesPromoters will use its knowledge of the businessand its expertise to identify and roll out sites inlocations which have strong multi- tenancypotential to minimize occupancy risk
Revenue Risk (Operating fees may decreasecredit worthiness of the clientsdelay in payment of rentals)
As per the industry sources till now not even asingle operator have dishonored the long termlease contractThe credit risk is diversified as there will bemultiple operatorsABC would aggressively market to get 3G andWiFi broadcasters to use the sites and earnadditional revenues in addition to the assumedrevenue streams
Natural Calamities Risk The Company shall maintain insurance for thesites against these risks and the cost of insurancewill be priced in and passed on to the tenants
882019 Major Project (Ramit)
httpslidepdfcomreaderfullmajor-project-ramit 5062
41
8 CONCLUSION
India is the fastest growing wireless telecom market in the world The continuing
growth in the number of wireless subscribers and MoUs and increasing trend of
outsourcing of business processes to India has led to growing demand for large
investments in the telecom infrastructure in the country
However with increasing competition falling tariffs and pressure on margins
telecom service providers are being forced to increase their focus on marketing
customer acquisitions and branding and minimize their efforts and overheads in
project management and asset acquisition
Further with rising prices of steel cement and real estate the cost of developing
and owning passive infrastructure is increasingly becoming a costly proposition
for most operators and service providers
The compulsion on the part of service providers to reduce their operating costs
and capital expenditure requirements has led to opportunities in passiveinfrastructure outsourcing to independent third party infrastructure providers and
also sharing the infrastructure with other service providers It is expected that
cellular operators will outsource their communications site infrastructure needs as
a means of accelerating access to their markets and preserving capital rather than
constructing and operating their own communications sites and maintaining their
own communications sites service and deve lopment capabilities
Passive infrastructure is highly capital intensive and an integral part of the cellular
service providersrsquo networks Yet being a simple and low technology asset it is
amenable to outsourcing and sharing By transferring the responsibility of
ownership development and maintenance of passive infrastructure service
882019 Major Project (Ramit)
httpslidepdfcomreaderfullmajor-project-ramit 5162
42
providers have an opportunity to transfer a substantial part of their business risk to
third parties
Most telecom operators are facing capacity constraints on their networksCoverage obligations increasing pressure to improve network quality and
competition has led to aggressive roll out plans by existing cellular operators
Installation of cell sites has become a cumbersome process as there are a number
of clearances required and involves labor-intensive micro management
Availability of ready infrastructure from third party providers would enable the
operators to reduce their time to market and accelerate their access to their
customers Cellular service providers generally want to move quickly when
adding more sites and co-location on an existing site is always faster than
building
Ownership and maintenance of telecom towers and other infrastructure by third
parties is an established practice in developed nations like USA and is
increasingly gaining market acceptance in India
The Indian government is seriously considering promoting the infrastructure
sharing route between the telecom operator and private players to achieve future
national tele-density targets and improve rural telecom penetration
ABC being an independent entity with no business conflicts with other service
providers in the telecom space will be best positioned and have an early mover
advantage to capitalize on this emerging opportunity
Further the task of operating and maintaining the passive infrastructure in the cell
is increasingly becoming a cumbersome exercise for the service providers to
handle ABCrsquos composite offering to build passive infrastructure for the cellular
operators and also operate and maintain them will provide a turnkey solution to
address the infrastructure needs of the service providers
882019 Major Project (Ramit)
httpslidepdfcomreaderfullmajor-project-ramit 5262
43
The business model proposed to be followed by ABC is fairly simple with stable
and predictable cash flows as is the case with the business model of the tower
renting companies in USA Most contracts are long term for a period 10 or moreyears with annual price escalators generally ranging from 3 to 4 However
wireless carriers normally tend to renew rentals because suitable alternative sites
may not exist or be available and repositioning a site in a carrierrsquos network is
expensive and may adverse ly affect network quality
Site ownership and operations is a ldquoscalerdquo business operating administration
marketing expenses etc do not rise as quickly as revenues when portfolios are
expanded Incremental operating costs associated with adding wireless tenants to
a communications site are minimal Therefore as additional tenants are added to a
site the substantial majority of incremental revenue contributes to margin
expansion Most tower companies have high EBITDA margins as may be seen
from the financial indicators of some of the tower rental companies in USA
It is expected that site location and capacity price and quality of service and
successful execution of contracts will be the most significant competitive factors
in this business
ABCrsquos revenue and returns on investment will be primarily driven by its ability
to
o Increase the utilization of the space and infrastructure capacity owned by it by
increasing the number of tenants per site and renting out to maximum number
of users As discussed above return on capital employed (PIRR and EIRR) arevery sensitive to tenancy ratio In worst case scenario project IRR can be as
low as 8 and in the best case scenario it can be as high as 20
o Develop acquire sites of strategic importance and high growth potential that
will enable them to secure better commercial terms from users and attract
more number of tenants Infrastructure provisioning fees rentals for sites are
882019 Major Project (Ramit)
httpslidepdfcomreaderfullmajor-project-ramit 5362
44
extremely location sensitive There is a potential to acquire more land than
that of required to capitalize on the increase in real estate prices
o Develop sites in a cost effective manner ABC would consider purchasing
land only for those GBS sites which have sufficient demand and arestrategically located Else for most of its sites land will be leasehold As
shown above returns (PIRR and EIRR) are very sensitive to capital costs In
the worst case scenario project IRR can be as low as 15 whereas it can as
high as 27 in the best case scenario
o Negotiate and secure long term contracts with good credit quality users with
built in price escalation provisions to mitigate financing risk
o Leverage and secure long term financing at attractive terms and involve in
active treasury management to keep low financing cost Results of the
sensitivity analysis indicate that equity IRR can be as high as 60 foe a
moratorium period of 4 years and interest rate of 10
o Minimize working capital requirements
o Maintain low operating and administration expense
o Secure better OampM margins from operators and retain a healthy share of it in
ABC
o Maintain high service standards and build strong customer relationships
The business would have the potential to capture new revenue opportunities
around the existing assets As demand for towers is expected to grow and as
operators migrate to speedier next-generation wireless technologies they will
need the towers and associated passive infrastructure to transmit their new
services in addition to their existing offerings In addition to increasing capacity
and coverage and improving the quality of their networks cellular serviceproviders are deploying high speed data networks driving incremental demand of
sites The business therefore has potential upsides in the form of adding
customers (tenants) in wireless broadband third generation (ldquo3Grdquo) and wireless
data capabilities and also other incremental value propositions by way of hosting
882019 Major Project (Ramit)
httpslidepdfcomreaderfullmajor-project-ramit 5462
45
Billboards Hoardings etc in some of the high visible sites owned and maintained
by it
Based on the assumptions and subject to satisfactory resolution of the key risks
factors project cash flows will be able to meet debt service obligations
This business model is a lucrative investment option for a private equity player
because valuation of each site will increase in the coming years due to
improvement in market conditions increase in the value of land and increase in
the demand for passive infrastructure in rural and semi-urban areas
882019 Major Project (Ramit)
httpslidepdfcomreaderfullmajor-project-ramit 5562
46
REFERENCESAnjan G V A amp N M (2009) telecom infrastructure industry in india GurgaonICRA
Bessler W Norsworthy J amp Shusterman T (2001 12 1) Mergers in the UStelecommunications industry and market valuationeffects IEEE p 288
COAI (2009 march 14) Subscriber Figures Retrieved march 14 2009 fromCOAIcom httpwwwcoaicomstatisticsphp
IDA (2009 march 23) Highlights Retrieved march 23 2009 from idagovsghttpwwwidagovsghomeindexaspx
K R (2008) Time for new business model Delhi Cybermedia
MAXIS (2009 march 8) the malaysian telecommunications industry Retrieved march9 2009 from maxiscommyhttpwwwmaxiscommypersonalabout_usinvestorprospectusprospectus4pdf
P J amp Lisa A (2009) Stimulas spending and American Telecom Industry USACoracle group
PwC (2009 march 12) Indian Telecom Industry Gurgaon Harayana IndiaRamachanran (2009 march 1) Investment in Telecom Infrastructure sector (M RInterviewer)
Vogelsang I (2002) The German Telecommunications Reform Verein fuumlr Socialpolitik (p 26) Innsbruck Boston Press
882019 Major Project (Ramit)
httpslidepdfcomreaderfullmajor-project-ramit 5662
47
ANNEXURES
ANNEXURE 1 Key Assumptions
The occupancy of each site by single two three operators for green-field sites is assumed
to be as follows
Table 91 Expected Tenancy RatiosFY 10 FY 11 FY 12 FY 13 FY 14 FY15
GBT Tenant
Ratio 150 150 170 170 170 200
Single Operator 50 50 30 30 30 0
Two Operator 50 50 70 70 70 100
RTT Tenant
Ratio 170 170 200 200 200 250
Single Operator 30 30 0 0 0 0
Two Operator 70 70 100 100 100 50
Three Operator 0 0 0 0 0 50
From FY 15 onwards tenancy ratio of 2 and 25 for GBT and RTT sites is cons idered
882019 Major Project (Ramit)
httpslidepdfcomreaderfullmajor-project-ramit 5762
48
Capital costs related assumptions are tabulated below
Table 92 GBT and RTT Capital Cost
The lease rentals for RTT sites are reimbursed from the operators and therefore have not
been factored in the revenues as well as the expense For GBT sites land purchase cost of
035 millions assumed which has been escalated by 6 annually to determine the
salvage value of assets
GBT Capital Costs
Million
INR
Delivery cost of Ground Based
Tower (GBT)063
Delivery cost of Generator 030
Civil Work 040Shelter 012
Electrical Works 030
Other Equipments (UPS Battery
etc)045
Construction cost 045
Land 035
Contingency amp Financial Charges 035Total cost 335
RTT Capital Costs
Million
INR
Delivery cost of Roof Top
Tower (RTT) 030
Delivery cost of Generator 020
Civil Work 020Shelter 012
Electrical Works 030
Other Equipments (UPS
Battery etc) 030
Construction cost -
Land -
Contingency amp FinancialCharges 008
Total cost 150
882019 Major Project (Ramit)
httpslidepdfcomreaderfullmajor-project-ramit 5862
49
Ope rating costs related assumptions are tabulated below
Table 93 Operating CostsOperating Costs
Security Sentries (INRMonth) 4000
Supervisors (INRMonth) 6000
Cluster Manager One for Fifty Towers (INRMonth) 15000
Annual increase 500
Number of Security Sentries per tower 300
Number of supervisors per tower 010
Number of C luster manager per tower 002
Fixed Expenses
Selling amp Maintenance (INRMonth) 4000000
Annual Escalation 5
Administration overhead (INRMonth) 10000000Annual Escalation 7
AMC Cost of Generator 15 (cost of generator)
Annual Escalation (AMC) 3
For RTT sites security sentries are not required because it will be the responsibility of
the site owner A supervisor will for every 10 sites and a cluster manager for every 50
sites will be required
882019 Major Project (Ramit)
httpslidepdfcomreaderfullmajor-project-ramit 5962
50
Table 94 Long term debtInterest Rate 125 per annum
Moratorium 2 years
Repayment Period 8 years
Tariff related assumptions and date of operations are tabulated below
Table 95 GBT and RTT Tariff Table 96 Life of the projectTariff Plan
Tariff (INRMonth)
No of
operators GBT RTT
1 28000 18000
2 22000 14000
3 0 12000
Annual
increase 3 3
Commercial Operation Date 1-Aug-09
Quarter Ending 30-Sep-09
FY ending COD 31-Mar-10
Project life years 15
End of commercial
operations31-Aug-24
Quarter ending commercial
operations30-Sep-24
FY ending comme rcial
operations31-Mar-25
882019 Major Project (Ramit)
httpslidepdfcomreaderfullmajor-project-ramit 6062
51
Annexure 2 Profit amp Loss accountsTable 97 Profit amp loss account statement
Income Statement (MNINR)Year ending Mar-10 Mar-11 Mar-12 Mar-13 Mar-14 Mar-15
RevenueGBT 406350 28811 89080 197447 379409 527015Operator Fees (GBT) 1411 10004 30678 67998 130664 179664RTT 1209 8575 27269 60443 116146 164264
Operator Fees (RTT) 440 3121 9739 21587 41481 56466Net Revenue 7124 50511 156766 347476 667700 927410
Expenses
VariableSecurity Sentries 1355 9790 28339 64033 125433 158238Supervisors 097 699 2024 4574 8959 11303Cluster Manager 048 350 10 12 2287 4480 5651AMC Cost of Generator 450 3013 7877 16719 31148 54541Sub-total 1950 13852 39252 87612 170021 229734
Fixed
Selling amp Maintenance(INRMonth) 032 050 053 056 058 061
Administration overhead(INRMonth) 080 128 137 147 157 168
Sub-total 112 179 190 203 216 230
EBITDA 5062 36480 117324 259661 497464 697447
Interest on LT loan - - 7341 31200 77479 156198Interest on ST loan - 021 060 130 245 361
EBDT 5062 36459 109923 228331 419739 540888Depreciation 2439 12769 35917 77162 142925 174006
EBT 2624 23691 74006 151169 276814 366881Income Tax 170 4233 14536 29073 53547 77634
PAT 2454 19458 59470 122096 223267 289247
882019 Major Project (Ramit)
httpslidepdfcomreaderfullmajor-project-ramit 6162
52
Annexure 3 Balance sheet
Table 98 B alance sheetsYearend Balance Sheet (MNINR)Year ending Mar-10 Mar-11 Mar-12 Mar-13 Mar-14 Mar-15
AssetsGross Block 75742 328216 833164 1716823 3105430 3105430Accumulated depreciation 2439 15208 51125 128287 271212 445218Net Block 73303 313009 782040 1588536 2834219 2660212Net Working Capital 064 241 620 1335 2515 3707Cash Balance 12979 72089 216513 488856 947982 1294734Total Assets 86346 385339 999172 2078727 3784715 3958653
LiabilitiesEquity 25168 108980 276604 569947 1030914 1030914Reserves amp Surplus 2454 21912 81381 203477 426745 715992Long term Debt 58725 254286 640722 1304302 2325171 2208967WC Borrowings - 161 465 1001 1886 2780Total Liabilities 86346 385339 999172 2078727 3784715 3958653
882019 Major Project (Ramit)
httpslidepdfcomreaderfullmajor-project-ramit 6262
Annexure 4 Cash flow statement
Table 99 Cash flow statements
Year ending Mar-10 Mar-11 Mar-12 Mar-13 Mar-14 Mar-15
InflowsPAT 2454 19458 59470 122096 223267 289247Depreciation 2439 12769 35917 77162 142925 174006Tax adjusted interest - 014 4959 20991 52076 104895Release of WC - - - - - -Salvage Value - - - - - -Sub-Total 4893 32241 100345 220249 418268 568148
OutflowsCapex 75742 252474 504948 883659 1388607 -Change in WorkingCapital 064 177 379 715 1180 1192
Sub-Total 75806 252651 505327 884374 1389787 1192
UFCF (70913) (220410) (404982) (664125) (971519) 566956LFCF (70913) (220424) (409940) (685116) (1023595) 462062
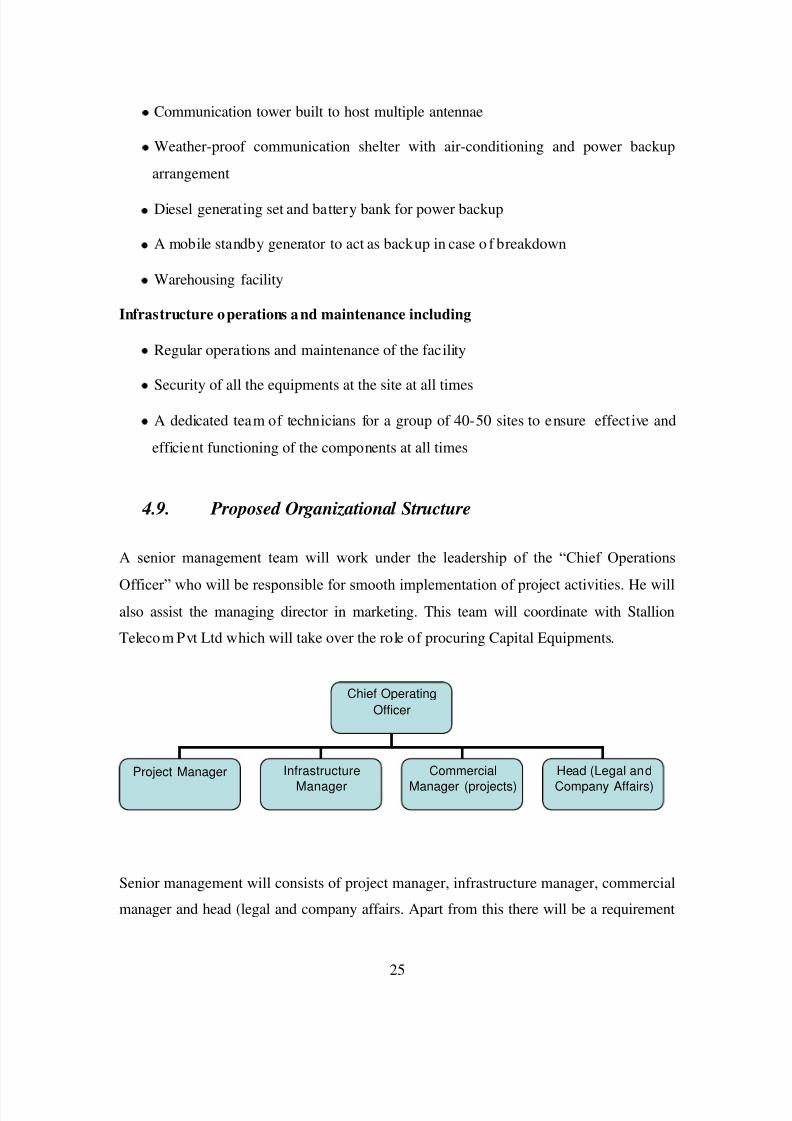
882019 Major Project (Ramit)
httpslidepdfcomreaderfullmajor-project-ramit 3562
26
of security sentries (3 per GBT site) supervisors (one for every 10 sites) and cluster
manager (one for every 50 sites)
Bharat Telemast will carry out the complete Project execution with the assistance of third party ldquoQuality control organizationrdquo and a third party ldquoProject management teamrdquo
Quality control and project management activities will be o utsourced to a third party
882019 Major Project (Ramit)
httpslidepdfcomreaderfullmajor-project-ramit 3662
27
5 METHODOLOGY
The changing face of infrastructure services creates a complex situation which demands
greater understanding of roles of competition regulatory structures and modes of
financing Knowledge of such things is a key decisive factor in building confidence
among investors promoters and government In project finance the project its assets
contract and cash flows are separated from promoter in order to permit credit appraisal
or loan to the project
As part of the financial feasibility analysis a series of related financial statements based
on projected sources and uses of funds during the development and operating phaseproject were created Financial statements consist of expenses associated with
development activities including capital costs like acquisition of land for GBT sites cost
of tower generator shelter batteries etc Most of the data regarding capital costs are
obtained from the promoter of ABC Limited All these capital costs related details are
provided in annexure 1
Assumption regarding depreciation capital structure operating expenses expansion
schedule tenancy ratios tariff or rent operatorrsquos fees and loan amortization schedule are
obtained from professional accountants Promoter and bankers of ABC Limited
Due to unknown factors that could influence the cost of towers or fees associated with
completing the project (soft costs) contingency costs were estimated at 5 of hard and
soft costs respectively If contingency is set too low developers could easily encounter
funding shortfalls upon slight changes in market forces All other costs were estimated
based on talking with industry professionals (Promoters)
A detailed financial model was prepared based on existing accounting standards and
following financial ratios were estimated
882019 Major Project (Ramit)
httpslidepdfcomreaderfullmajor-project-ramit 3762
28
EBITDA margin Profit and loss accounts for the estimated project period (15
Years) were prepared based on which estimated earnings before interests tax
depreciat ion and amortization were calculated for each year Detailed PampL
balance sheet and cash flow statements are provided in annexure 2 3 and 4
EBITDA = Total Revenue ndash (Variable expenses + Fixed Expenses)
EBITDA margin = EBITDA Total Revenue
PAT margin PAT is calculated by subtracting interests pa id on capital debt and
working capital debt depreciation and applicable corporate income tax from
EBITDA
PAT = EBITDA ndash Interest Payable ndash Depreciation ndash Income tax
PAT margin = PATTotal Revenue
Working Capital Working capital requirement is calculated by subtract ing
current liabilities from current assets Current assets are estimated based on 30
days cash requirement and current liabilities are estimated as half of salary
monthly expenses
WC = Current Assets ndash Current Liabilities
UFCF It is defined as the free cash flows available to the firm if the firm has
zero debt liability Purpose of ca lculat ing UFCF for project period is to determinethe project IRR
UFCF = PAT + Depreciation + Interest (tax adjusted) + Release of WC + Salvage
value of the assets ndash CAPEX ndash Change in WC
882019 Major Project (Ramit)
httpslidepdfcomreaderfullmajor-project-ramit 3862
29
LCFF It is defined as the cash floes available to the firm after paying interests on
long term and short term debts
LCFF = UFCF ndash Interest (tax adjusted)
FCFE It is defined as the free cash flow available to equity holders It is
determined to ca lculate equity IRR for equity investors It also includes the tax
benefits which are available as per the Income Tax Act
FCFE PAT + Depreciation + Salvage Value ndash Equity Investment ndash Long term debt
repayment
PIRR Project IRR is defined as the discount rate at which NPV (Net Present
Value) of UFCF is zero It is calculated by using following formula
UFCF 1 (1+PIRR) 0+ UFCF 2 (1+PIRR) 1+ UFCF 3 (1+PIRR) 2+ helliphelliphelliphelliphelliphellip = 0
UFCF 1 = UFCF at the end of first year of operation
UFCF 2 = UFCF at the end of second year of operation
PIRR = Project IRR
EIRR Equity IRR is defined as the discount rate at which NPV of FCFE is zero
It is calculated by using following formula
FCFE1 (1+EIRR) 0+ FCFE 2 (1+EIRR) 1+ FCFE 3 (1+EIRR) 2+ helliphelliphelliphelliphelliphellip = 0
FCFE1 = FCFE at the end of first year of operation
FCFE2 = FCFE at the end of seco nd year of operation
EIRR = Equity IRR
882019 Major Project (Ramit)
httpslidepdfcomreaderfullmajor-project-ramit 3962
30
WACC It is de fined as the percentage of return expected by the investors who
otherwise would have earned some return by investing in some other project
WACC = Cost of Debt (Debt Capital) + Cost of equity (Equity Capital)
882019 Major Project (Ramit)
httpslidepdfcomreaderfullmajor-project-ramit 4062
882019 Major Project (Ramit)
httpslidepdfcomreaderfullmajor-project-ramit 4162
32
62 Funding planAs the telecom sites are rolled out over a 5 year period till FY 2014 investment will be
required for each year ABC Limited will start generating profits from FY 10 only Such
internally generated cash accruals will be ploughed back into the business to meet part of
the project cost Investment required for each year is tabulated below
Table 61 Funding ProposalMillion INR FY 10 FY 11 FY 12 FY 13 FY 14
GBT Tower (Additional) Nos 210 700 1400 2450 3850
RTT Tower (Additional) Nos 90 300 600 1050 1650DE ratio 233 233 233 233 233
Additional CAPEX 83892 279374 558748 977809 1536557
Debt 58725 195562 391124 684466 1075590
Equity 25168 83812 167624 293343 460967
63 Results
Based on assumptions given in Annexure 1 a detailed financial model was preparedResults of the financial model such as PampL account Balance Sheet and cash flow
statements are provided in Annexure 2 3 and 4 Forecasts for the key financial figures for
first five years are provided in the Table below
Forecasts
Table 62 Income StatementMillion INR FY-10 FY11 FY12 FY-13 FY-14
Sales 7124 50511 156766 347476 667700
Cost of sales 1950 13852 39252 87612 170021
Gross 5174 36659 117514 259864 497679
7263 7258 7496 7479 7454
Admin costs 112 179 190 203 216
882019 Major Project (Ramit)
httpslidepdfcomreaderfullmajor-project-ramit 4262
33
Finance cost 0 021 7401 31330 77725
Taxation 170 4233 14536 29073 53547
PAT 2454 19458 59470 122096 223267
As shown in Table above during the expansion period revenue will grow exponentially
In the first year of operation ABC will earn a revenue of INR 7124 million from 300
(210 GBT and 90 RTT) sites with a tenancy ratio of 15 for GBS and 17 for RTS In the
first 2 years of operation the company will not pay any interest on long term debt due to
2 years moratorium period Major cost associated with the project is depreciation due to
which PAT is lower than the operating profits But cash flows to the firm are enough to
result in reasonable returns
Table 63 Balance Shee tYear ending Mar-10 Mar-11 Mar-12 Mar-13 Mar-14
AssetsGross Block 75742 328216 833164 1716823 3105430Accumulated depreciation 2439 15208 51125 128287 271212Net Block 73303 313009 782040 1588536 2834219Net Working Capital 064 241 620 1335 2515Cash Balance 12979 72089 216513 488856 947982
Total Assets 86346 385339 999172 2078727 3784715LiabilitiesEquity 25168 108980 276604 569947 1030914Reserves amp Surplus 2454 21912 81381 203477 426745Long term Debt 58725 254286 640722 1304302 2325171WC Borrowings - 161 465 1001 1886Total Liabilities 86346 385339 999172 2078727 3784715
Note All figures are in Million INR
Table 64 Key financial ratiosMar-11 Mar-12 Mar-13 Mar-14 Mar-15
Revenue Growth 60902 21036 12165 9216 3890EBITDA Growth 62061 22161 12132 9158 4020
PAT Growth 69293 20564 10531 8286 2955
As shown in table above increase in EBITDA is higher than that of revenue This is due
to better operational efficiency of ABCrsquos management and economies of scale S imilarly
882019 Major Project (Ramit)
httpslidepdfcomreaderfullmajor-project-ramit 4362
34
increase in PAT is lesser than that of EBITDA because of high depreciation and interest
expenses
Table 65 Pr ofitability r atios
Mar-11 Mar-12 Mar-13 Mar-14 Mar-15
EBITDA Margin 7222 7484 7473 7450 7520
PAT Margin 3852 3794 3514 3344 3119Return on Net Worth 622 760 769 788 1087
Key profitability ratios are shown in table above Return on net worth in the initial years
is lower because of the ambitious expansion plans of ABC Limited Thereafter return on
net worth increases with increase in PAT
Returns on Investment
Table 66 Financial returnsFinancial Indicators
Project IRR 1813Equity IRR 3609
64 Sensitivity Analysis
A sensitivity analysis has been carried out on the project financials to determine theimpact of key variables on the financial indicators namely
Project IRR
The key variables on which sensitivity analysis have been carried out areCapital expenditure for GBS and RTS1st and 2 nd tenant tariff for GBS1st and 2 nd tenant tariff for RTSTenancy Ratio
Similarly sensitivity analysis has been carried out forEquity IRR
The key variables on which sensitivity analysis have been carried out for EIRR are
Capital structure and interest rate for capital debtRepayment period and moratorium period
882019 Major Project (Ramit)
httpslidepdfcomreaderfullmajor-project-ramit 4462
35
The impact on the financial indicators is shown below
Figure 6-1 Project IRR vs GBT and RTT CAPEX
As shown in Figure 6-1 project IRR is more sensitive to change in CAPEX of RTT sitesas compared to change in CAPEX of GBT sites because tenancy ratio and tariff for RTTsites are higher than those of GBT sites
882019 Major Project (Ramit)
httpslidepdfcomreaderfullmajor-project-ramit 4562
36
Figure 6-2 Project IRR vs GBT Tariff for 1 st tenant (X-axis) and 2 nd tenant (right-hand side)
As shown in Figure 6-2 project IRR varies linearly with GBT tariff In the best casescenario when GBT tariff for 1 st tenant is INR 34000month and GBT tariff for secondtenant is INR 26000month Project IRR is 2101
Figure 6-3 Project IRR vs RTT Tariff for 1 st tenant (X-axis) and 2 nd tenant (right-hand side)
As shown in Figure 6-2 project IRR varies linearly with RTT tariff In the best casescenario when RTT tariff for 1 st tenant is INR 24000month and RTT tariff for second
882019 Major Project (Ramit)
httpslidepdfcomreaderfullmajor-project-ramit 4662
37
tenant is INR 20000month Project IRR is 1932 Project IRR is more sensitivetowards RTT tariff than GBT tariff because in practical business situation RTT siteshave a tenancy ratio of more than two due to which effect of tariff for 1 st tenant almostget nullified after few years
Figure 6-4 Project IRR vs Tenancy ratio for RTT sites (X-axis) and GBT sites
As shown in Figure 6-4 project IRR is very sensitive to tenancy ratio In the best casescenario where GBT sites have a tenancy ratio of 2 and RTT sites have a tenancy ratio of 3 project IRR can be as high as 20
Figure 6-5 Equity IRR vs long term debt interest rate for different leverage level
882019 Major Project (Ramit)
httpslidepdfcomreaderfullmajor-project-ramit 4762
38
As shown in figure 6-5 equity IRR is more sensitive to interest rate on long term debt forhigh level of leverage (lower debt equity ratio) because as the debt equity ratio increasesinterest paid on long term debt also increases significantly
Figure 6-6 Equity IRR vs long term debt repayment period at different level of moratoriumperiods
As shown in figure 6-6 Equity IRR increases with increase in moratorium period anddebt repayment period The variation is from 1654 to 60 for worst case and best casescenarios
882019 Major Project (Ramit)
httpslidepdfcomreaderfullmajor-project-ramit 4862
39
7 RISK ASSESSMENTRisk Mitigation strategyExecution Risk
(Project management landacquisition etc)
Management of ABC has proven expertise in
telecom infrastructure rollout and has executedvarious projects with large telecom operators andMNC vendorsABCrsquos top management team consists of a groupof professionals drawn from leading telecomInfrastructure Company who have immenseexpertise and experience in rolling out telecominfrastructure projects
Market Risk (No entry barriers operators may
share infrastructure betweenthemselves large players withhigh capital may increasecompetition)
India has a huge potential for telecominfrastructure market With increasing
competition falling tariffs and pressure onmargins telecom service providers are beingforced to increase their focus on marketing andreduce their expensesExperienced management healthy capital back-up effective presence in the telecominfrastructure market and value added services atrelatively lesser cost will help ABC to meet theset targets
Financing Risk
(Availability of equity capitalavailability of long term debtinterest rate and moratoriumperiod)
ABC is seeking private equity partner to secure
equity capital Company has already entered intoNDA with 2 major investorsLong term debt at an interest rate of 125 canbe easily arranged because of the credibility of the promoters in the marketMany other similar firms like Indus and GTLhave already secured long term debt for amoratorium period of 2 years Promoters of ABCLimited are confident to secure a long term debtwith a moratorium period of 2 years and apayback period of 8 years
ABC Limited would minimize the workingcapital requirements of its business by securingrentals and operating revenues in advance fromits clients and or by suitably structuring itspayment liabilities to match its cash inflows
Commercial Risk (Tenancy ratio and tariff forGBS and RTS)
ABC would aim to enter into long term contractswith the ldquoanchor tenantrdquo operator and thenrollout the infrastructure so that at least single
882019 Major Project (Ramit)
httpslidepdfcomreaderfullmajor-project-ramit 4962
40
occupancy of each site is ensured at all t imesPromoters will use its knowledge of the businessand its expertise to identify and roll out sites inlocations which have strong multi- tenancypotential to minimize occupancy risk
Revenue Risk (Operating fees may decreasecredit worthiness of the clientsdelay in payment of rentals)
As per the industry sources till now not even asingle operator have dishonored the long termlease contractThe credit risk is diversified as there will bemultiple operatorsABC would aggressively market to get 3G andWiFi broadcasters to use the sites and earnadditional revenues in addition to the assumedrevenue streams
Natural Calamities Risk The Company shall maintain insurance for thesites against these risks and the cost of insurancewill be priced in and passed on to the tenants
882019 Major Project (Ramit)
httpslidepdfcomreaderfullmajor-project-ramit 5062
41
8 CONCLUSION
India is the fastest growing wireless telecom market in the world The continuing
growth in the number of wireless subscribers and MoUs and increasing trend of
outsourcing of business processes to India has led to growing demand for large
investments in the telecom infrastructure in the country
However with increasing competition falling tariffs and pressure on margins
telecom service providers are being forced to increase their focus on marketing
customer acquisitions and branding and minimize their efforts and overheads in
project management and asset acquisition
Further with rising prices of steel cement and real estate the cost of developing
and owning passive infrastructure is increasingly becoming a costly proposition
for most operators and service providers
The compulsion on the part of service providers to reduce their operating costs
and capital expenditure requirements has led to opportunities in passiveinfrastructure outsourcing to independent third party infrastructure providers and
also sharing the infrastructure with other service providers It is expected that
cellular operators will outsource their communications site infrastructure needs as
a means of accelerating access to their markets and preserving capital rather than
constructing and operating their own communications sites and maintaining their
own communications sites service and deve lopment capabilities
Passive infrastructure is highly capital intensive and an integral part of the cellular
service providersrsquo networks Yet being a simple and low technology asset it is
amenable to outsourcing and sharing By transferring the responsibility of
ownership development and maintenance of passive infrastructure service
882019 Major Project (Ramit)
httpslidepdfcomreaderfullmajor-project-ramit 5162
42
providers have an opportunity to transfer a substantial part of their business risk to
third parties
Most telecom operators are facing capacity constraints on their networksCoverage obligations increasing pressure to improve network quality and
competition has led to aggressive roll out plans by existing cellular operators
Installation of cell sites has become a cumbersome process as there are a number
of clearances required and involves labor-intensive micro management
Availability of ready infrastructure from third party providers would enable the
operators to reduce their time to market and accelerate their access to their
customers Cellular service providers generally want to move quickly when
adding more sites and co-location on an existing site is always faster than
building
Ownership and maintenance of telecom towers and other infrastructure by third
parties is an established practice in developed nations like USA and is
increasingly gaining market acceptance in India
The Indian government is seriously considering promoting the infrastructure
sharing route between the telecom operator and private players to achieve future
national tele-density targets and improve rural telecom penetration
ABC being an independent entity with no business conflicts with other service
providers in the telecom space will be best positioned and have an early mover
advantage to capitalize on this emerging opportunity
Further the task of operating and maintaining the passive infrastructure in the cell
is increasingly becoming a cumbersome exercise for the service providers to
handle ABCrsquos composite offering to build passive infrastructure for the cellular
operators and also operate and maintain them will provide a turnkey solution to
address the infrastructure needs of the service providers
882019 Major Project (Ramit)
httpslidepdfcomreaderfullmajor-project-ramit 5262
43
The business model proposed to be followed by ABC is fairly simple with stable
and predictable cash flows as is the case with the business model of the tower
renting companies in USA Most contracts are long term for a period 10 or moreyears with annual price escalators generally ranging from 3 to 4 However
wireless carriers normally tend to renew rentals because suitable alternative sites
may not exist or be available and repositioning a site in a carrierrsquos network is
expensive and may adverse ly affect network quality
Site ownership and operations is a ldquoscalerdquo business operating administration
marketing expenses etc do not rise as quickly as revenues when portfolios are
expanded Incremental operating costs associated with adding wireless tenants to
a communications site are minimal Therefore as additional tenants are added to a
site the substantial majority of incremental revenue contributes to margin
expansion Most tower companies have high EBITDA margins as may be seen
from the financial indicators of some of the tower rental companies in USA
It is expected that site location and capacity price and quality of service and
successful execution of contracts will be the most significant competitive factors
in this business
ABCrsquos revenue and returns on investment will be primarily driven by its ability
to
o Increase the utilization of the space and infrastructure capacity owned by it by
increasing the number of tenants per site and renting out to maximum number
of users As discussed above return on capital employed (PIRR and EIRR) arevery sensitive to tenancy ratio In worst case scenario project IRR can be as
low as 8 and in the best case scenario it can be as high as 20
o Develop acquire sites of strategic importance and high growth potential that
will enable them to secure better commercial terms from users and attract
more number of tenants Infrastructure provisioning fees rentals for sites are
882019 Major Project (Ramit)
httpslidepdfcomreaderfullmajor-project-ramit 5362
44
extremely location sensitive There is a potential to acquire more land than
that of required to capitalize on the increase in real estate prices
o Develop sites in a cost effective manner ABC would consider purchasing
land only for those GBS sites which have sufficient demand and arestrategically located Else for most of its sites land will be leasehold As
shown above returns (PIRR and EIRR) are very sensitive to capital costs In
the worst case scenario project IRR can be as low as 15 whereas it can as
high as 27 in the best case scenario
o Negotiate and secure long term contracts with good credit quality users with
built in price escalation provisions to mitigate financing risk
o Leverage and secure long term financing at attractive terms and involve in
active treasury management to keep low financing cost Results of the
sensitivity analysis indicate that equity IRR can be as high as 60 foe a
moratorium period of 4 years and interest rate of 10
o Minimize working capital requirements
o Maintain low operating and administration expense
o Secure better OampM margins from operators and retain a healthy share of it in
ABC
o Maintain high service standards and build strong customer relationships
The business would have the potential to capture new revenue opportunities
around the existing assets As demand for towers is expected to grow and as
operators migrate to speedier next-generation wireless technologies they will
need the towers and associated passive infrastructure to transmit their new
services in addition to their existing offerings In addition to increasing capacity
and coverage and improving the quality of their networks cellular serviceproviders are deploying high speed data networks driving incremental demand of
sites The business therefore has potential upsides in the form of adding
customers (tenants) in wireless broadband third generation (ldquo3Grdquo) and wireless
data capabilities and also other incremental value propositions by way of hosting
882019 Major Project (Ramit)
httpslidepdfcomreaderfullmajor-project-ramit 5462
45
Billboards Hoardings etc in some of the high visible sites owned and maintained
by it
Based on the assumptions and subject to satisfactory resolution of the key risks
factors project cash flows will be able to meet debt service obligations
This business model is a lucrative investment option for a private equity player
because valuation of each site will increase in the coming years due to
improvement in market conditions increase in the value of land and increase in
the demand for passive infrastructure in rural and semi-urban areas
882019 Major Project (Ramit)
httpslidepdfcomreaderfullmajor-project-ramit 5562
46
REFERENCESAnjan G V A amp N M (2009) telecom infrastructure industry in india GurgaonICRA
Bessler W Norsworthy J amp Shusterman T (2001 12 1) Mergers in the UStelecommunications industry and market valuationeffects IEEE p 288
COAI (2009 march 14) Subscriber Figures Retrieved march 14 2009 fromCOAIcom httpwwwcoaicomstatisticsphp
IDA (2009 march 23) Highlights Retrieved march 23 2009 from idagovsghttpwwwidagovsghomeindexaspx
K R (2008) Time for new business model Delhi Cybermedia
MAXIS (2009 march 8) the malaysian telecommunications industry Retrieved march9 2009 from maxiscommyhttpwwwmaxiscommypersonalabout_usinvestorprospectusprospectus4pdf
P J amp Lisa A (2009) Stimulas spending and American Telecom Industry USACoracle group
PwC (2009 march 12) Indian Telecom Industry Gurgaon Harayana IndiaRamachanran (2009 march 1) Investment in Telecom Infrastructure sector (M RInterviewer)
Vogelsang I (2002) The German Telecommunications Reform Verein fuumlr Socialpolitik (p 26) Innsbruck Boston Press
882019 Major Project (Ramit)
httpslidepdfcomreaderfullmajor-project-ramit 5662
47
ANNEXURES
ANNEXURE 1 Key Assumptions
The occupancy of each site by single two three operators for green-field sites is assumed
to be as follows
Table 91 Expected Tenancy RatiosFY 10 FY 11 FY 12 FY 13 FY 14 FY15
GBT Tenant
Ratio 150 150 170 170 170 200
Single Operator 50 50 30 30 30 0
Two Operator 50 50 70 70 70 100
RTT Tenant
Ratio 170 170 200 200 200 250
Single Operator 30 30 0 0 0 0
Two Operator 70 70 100 100 100 50
Three Operator 0 0 0 0 0 50
From FY 15 onwards tenancy ratio of 2 and 25 for GBT and RTT sites is cons idered
882019 Major Project (Ramit)
httpslidepdfcomreaderfullmajor-project-ramit 5762
48
Capital costs related assumptions are tabulated below
Table 92 GBT and RTT Capital Cost
The lease rentals for RTT sites are reimbursed from the operators and therefore have not
been factored in the revenues as well as the expense For GBT sites land purchase cost of
035 millions assumed which has been escalated by 6 annually to determine the
salvage value of assets
GBT Capital Costs
Million
INR
Delivery cost of Ground Based
Tower (GBT)063
Delivery cost of Generator 030
Civil Work 040Shelter 012
Electrical Works 030
Other Equipments (UPS Battery
etc)045
Construction cost 045
Land 035
Contingency amp Financial Charges 035Total cost 335
RTT Capital Costs
Million
INR
Delivery cost of Roof Top
Tower (RTT) 030
Delivery cost of Generator 020
Civil Work 020Shelter 012
Electrical Works 030
Other Equipments (UPS
Battery etc) 030
Construction cost -
Land -
Contingency amp FinancialCharges 008
Total cost 150
882019 Major Project (Ramit)
httpslidepdfcomreaderfullmajor-project-ramit 5862
49
Ope rating costs related assumptions are tabulated below
Table 93 Operating CostsOperating Costs
Security Sentries (INRMonth) 4000
Supervisors (INRMonth) 6000
Cluster Manager One for Fifty Towers (INRMonth) 15000
Annual increase 500
Number of Security Sentries per tower 300
Number of supervisors per tower 010
Number of C luster manager per tower 002
Fixed Expenses
Selling amp Maintenance (INRMonth) 4000000
Annual Escalation 5
Administration overhead (INRMonth) 10000000Annual Escalation 7
AMC Cost of Generator 15 (cost of generator)
Annual Escalation (AMC) 3
For RTT sites security sentries are not required because it will be the responsibility of
the site owner A supervisor will for every 10 sites and a cluster manager for every 50
sites will be required
882019 Major Project (Ramit)
httpslidepdfcomreaderfullmajor-project-ramit 5962
50
Table 94 Long term debtInterest Rate 125 per annum
Moratorium 2 years
Repayment Period 8 years
Tariff related assumptions and date of operations are tabulated below
Table 95 GBT and RTT Tariff Table 96 Life of the projectTariff Plan
Tariff (INRMonth)
No of
operators GBT RTT
1 28000 18000
2 22000 14000
3 0 12000
Annual
increase 3 3
Commercial Operation Date 1-Aug-09
Quarter Ending 30-Sep-09
FY ending COD 31-Mar-10
Project life years 15
End of commercial
operations31-Aug-24
Quarter ending commercial
operations30-Sep-24
FY ending comme rcial
operations31-Mar-25
882019 Major Project (Ramit)
httpslidepdfcomreaderfullmajor-project-ramit 6062
51
Annexure 2 Profit amp Loss accountsTable 97 Profit amp loss account statement
Income Statement (MNINR)Year ending Mar-10 Mar-11 Mar-12 Mar-13 Mar-14 Mar-15
RevenueGBT 406350 28811 89080 197447 379409 527015Operator Fees (GBT) 1411 10004 30678 67998 130664 179664RTT 1209 8575 27269 60443 116146 164264
Operator Fees (RTT) 440 3121 9739 21587 41481 56466Net Revenue 7124 50511 156766 347476 667700 927410
Expenses
VariableSecurity Sentries 1355 9790 28339 64033 125433 158238Supervisors 097 699 2024 4574 8959 11303Cluster Manager 048 350 10 12 2287 4480 5651AMC Cost of Generator 450 3013 7877 16719 31148 54541Sub-total 1950 13852 39252 87612 170021 229734
Fixed
Selling amp Maintenance(INRMonth) 032 050 053 056 058 061
Administration overhead(INRMonth) 080 128 137 147 157 168
Sub-total 112 179 190 203 216 230
EBITDA 5062 36480 117324 259661 497464 697447
Interest on LT loan - - 7341 31200 77479 156198Interest on ST loan - 021 060 130 245 361
EBDT 5062 36459 109923 228331 419739 540888Depreciation 2439 12769 35917 77162 142925 174006
EBT 2624 23691 74006 151169 276814 366881Income Tax 170 4233 14536 29073 53547 77634
PAT 2454 19458 59470 122096 223267 289247
882019 Major Project (Ramit)
httpslidepdfcomreaderfullmajor-project-ramit 6162
52
Annexure 3 Balance sheet
Table 98 B alance sheetsYearend Balance Sheet (MNINR)Year ending Mar-10 Mar-11 Mar-12 Mar-13 Mar-14 Mar-15
AssetsGross Block 75742 328216 833164 1716823 3105430 3105430Accumulated depreciation 2439 15208 51125 128287 271212 445218Net Block 73303 313009 782040 1588536 2834219 2660212Net Working Capital 064 241 620 1335 2515 3707Cash Balance 12979 72089 216513 488856 947982 1294734Total Assets 86346 385339 999172 2078727 3784715 3958653
LiabilitiesEquity 25168 108980 276604 569947 1030914 1030914Reserves amp Surplus 2454 21912 81381 203477 426745 715992Long term Debt 58725 254286 640722 1304302 2325171 2208967WC Borrowings - 161 465 1001 1886 2780Total Liabilities 86346 385339 999172 2078727 3784715 3958653
882019 Major Project (Ramit)
httpslidepdfcomreaderfullmajor-project-ramit 6262
Annexure 4 Cash flow statement
Table 99 Cash flow statements
Year ending Mar-10 Mar-11 Mar-12 Mar-13 Mar-14 Mar-15
InflowsPAT 2454 19458 59470 122096 223267 289247Depreciation 2439 12769 35917 77162 142925 174006Tax adjusted interest - 014 4959 20991 52076 104895Release of WC - - - - - -Salvage Value - - - - - -Sub-Total 4893 32241 100345 220249 418268 568148
OutflowsCapex 75742 252474 504948 883659 1388607 -Change in WorkingCapital 064 177 379 715 1180 1192
Sub-Total 75806 252651 505327 884374 1389787 1192
UFCF (70913) (220410) (404982) (664125) (971519) 566956LFCF (70913) (220424) (409940) (685116) (1023595) 462062
882019 Major Project (Ramit)
httpslidepdfcomreaderfullmajor-project-ramit 3662
27
5 METHODOLOGY
The changing face of infrastructure services creates a complex situation which demands
greater understanding of roles of competition regulatory structures and modes of
financing Knowledge of such things is a key decisive factor in building confidence
among investors promoters and government In project finance the project its assets
contract and cash flows are separated from promoter in order to permit credit appraisal
or loan to the project
As part of the financial feasibility analysis a series of related financial statements based
on projected sources and uses of funds during the development and operating phaseproject were created Financial statements consist of expenses associated with
development activities including capital costs like acquisition of land for GBT sites cost
of tower generator shelter batteries etc Most of the data regarding capital costs are
obtained from the promoter of ABC Limited All these capital costs related details are
provided in annexure 1
Assumption regarding depreciation capital structure operating expenses expansion
schedule tenancy ratios tariff or rent operatorrsquos fees and loan amortization schedule are
obtained from professional accountants Promoter and bankers of ABC Limited
Due to unknown factors that could influence the cost of towers or fees associated with
completing the project (soft costs) contingency costs were estimated at 5 of hard and
soft costs respectively If contingency is set too low developers could easily encounter
funding shortfalls upon slight changes in market forces All other costs were estimated
based on talking with industry professionals (Promoters)
A detailed financial model was prepared based on existing accounting standards and
following financial ratios were estimated
882019 Major Project (Ramit)
httpslidepdfcomreaderfullmajor-project-ramit 3762
28
EBITDA margin Profit and loss accounts for the estimated project period (15
Years) were prepared based on which estimated earnings before interests tax
depreciat ion and amortization were calculated for each year Detailed PampL
balance sheet and cash flow statements are provided in annexure 2 3 and 4
EBITDA = Total Revenue ndash (Variable expenses + Fixed Expenses)
EBITDA margin = EBITDA Total Revenue
PAT margin PAT is calculated by subtracting interests pa id on capital debt and
working capital debt depreciation and applicable corporate income tax from
EBITDA
PAT = EBITDA ndash Interest Payable ndash Depreciation ndash Income tax
PAT margin = PATTotal Revenue
Working Capital Working capital requirement is calculated by subtract ing
current liabilities from current assets Current assets are estimated based on 30
days cash requirement and current liabilities are estimated as half of salary
monthly expenses
WC = Current Assets ndash Current Liabilities
UFCF It is defined as the free cash flows available to the firm if the firm has
zero debt liability Purpose of ca lculat ing UFCF for project period is to determinethe project IRR
UFCF = PAT + Depreciation + Interest (tax adjusted) + Release of WC + Salvage
value of the assets ndash CAPEX ndash Change in WC
882019 Major Project (Ramit)
httpslidepdfcomreaderfullmajor-project-ramit 3862
29
LCFF It is defined as the cash floes available to the firm after paying interests on
long term and short term debts
LCFF = UFCF ndash Interest (tax adjusted)
FCFE It is defined as the free cash flow available to equity holders It is
determined to ca lculate equity IRR for equity investors It also includes the tax
benefits which are available as per the Income Tax Act
FCFE PAT + Depreciation + Salvage Value ndash Equity Investment ndash Long term debt
repayment
PIRR Project IRR is defined as the discount rate at which NPV (Net Present
Value) of UFCF is zero It is calculated by using following formula
UFCF 1 (1+PIRR) 0+ UFCF 2 (1+PIRR) 1+ UFCF 3 (1+PIRR) 2+ helliphelliphelliphelliphelliphellip = 0
UFCF 1 = UFCF at the end of first year of operation
UFCF 2 = UFCF at the end of second year of operation
PIRR = Project IRR
EIRR Equity IRR is defined as the discount rate at which NPV of FCFE is zero
It is calculated by using following formula
FCFE1 (1+EIRR) 0+ FCFE 2 (1+EIRR) 1+ FCFE 3 (1+EIRR) 2+ helliphelliphelliphelliphelliphellip = 0
FCFE1 = FCFE at the end of first year of operation
FCFE2 = FCFE at the end of seco nd year of operation
EIRR = Equity IRR
882019 Major Project (Ramit)
httpslidepdfcomreaderfullmajor-project-ramit 3962
30
WACC It is de fined as the percentage of return expected by the investors who
otherwise would have earned some return by investing in some other project
WACC = Cost of Debt (Debt Capital) + Cost of equity (Equity Capital)
882019 Major Project (Ramit)
httpslidepdfcomreaderfullmajor-project-ramit 4062
882019 Major Project (Ramit)
httpslidepdfcomreaderfullmajor-project-ramit 4162
32
62 Funding planAs the telecom sites are rolled out over a 5 year period till FY 2014 investment will be
required for each year ABC Limited will start generating profits from FY 10 only Such
internally generated cash accruals will be ploughed back into the business to meet part of
the project cost Investment required for each year is tabulated below
Table 61 Funding ProposalMillion INR FY 10 FY 11 FY 12 FY 13 FY 14
GBT Tower (Additional) Nos 210 700 1400 2450 3850
RTT Tower (Additional) Nos 90 300 600 1050 1650DE ratio 233 233 233 233 233
Additional CAPEX 83892 279374 558748 977809 1536557
Debt 58725 195562 391124 684466 1075590
Equity 25168 83812 167624 293343 460967
63 Results
Based on assumptions given in Annexure 1 a detailed financial model was preparedResults of the financial model such as PampL account Balance Sheet and cash flow
statements are provided in Annexure 2 3 and 4 Forecasts for the key financial figures for
first five years are provided in the Table below
Forecasts
Table 62 Income StatementMillion INR FY-10 FY11 FY12 FY-13 FY-14
Sales 7124 50511 156766 347476 667700
Cost of sales 1950 13852 39252 87612 170021
Gross 5174 36659 117514 259864 497679
7263 7258 7496 7479 7454
Admin costs 112 179 190 203 216
882019 Major Project (Ramit)
httpslidepdfcomreaderfullmajor-project-ramit 4262
33
Finance cost 0 021 7401 31330 77725
Taxation 170 4233 14536 29073 53547
PAT 2454 19458 59470 122096 223267
As shown in Table above during the expansion period revenue will grow exponentially
In the first year of operation ABC will earn a revenue of INR 7124 million from 300
(210 GBT and 90 RTT) sites with a tenancy ratio of 15 for GBS and 17 for RTS In the
first 2 years of operation the company will not pay any interest on long term debt due to
2 years moratorium period Major cost associated with the project is depreciation due to
which PAT is lower than the operating profits But cash flows to the firm are enough to
result in reasonable returns
Table 63 Balance Shee tYear ending Mar-10 Mar-11 Mar-12 Mar-13 Mar-14
AssetsGross Block 75742 328216 833164 1716823 3105430Accumulated depreciation 2439 15208 51125 128287 271212Net Block 73303 313009 782040 1588536 2834219Net Working Capital 064 241 620 1335 2515Cash Balance 12979 72089 216513 488856 947982
Total Assets 86346 385339 999172 2078727 3784715LiabilitiesEquity 25168 108980 276604 569947 1030914Reserves amp Surplus 2454 21912 81381 203477 426745Long term Debt 58725 254286 640722 1304302 2325171WC Borrowings - 161 465 1001 1886Total Liabilities 86346 385339 999172 2078727 3784715
Note All figures are in Million INR
Table 64 Key financial ratiosMar-11 Mar-12 Mar-13 Mar-14 Mar-15
Revenue Growth 60902 21036 12165 9216 3890EBITDA Growth 62061 22161 12132 9158 4020
PAT Growth 69293 20564 10531 8286 2955
As shown in table above increase in EBITDA is higher than that of revenue This is due
to better operational efficiency of ABCrsquos management and economies of scale S imilarly
882019 Major Project (Ramit)
httpslidepdfcomreaderfullmajor-project-ramit 4362
34
increase in PAT is lesser than that of EBITDA because of high depreciation and interest
expenses
Table 65 Pr ofitability r atios
Mar-11 Mar-12 Mar-13 Mar-14 Mar-15
EBITDA Margin 7222 7484 7473 7450 7520
PAT Margin 3852 3794 3514 3344 3119Return on Net Worth 622 760 769 788 1087
Key profitability ratios are shown in table above Return on net worth in the initial years
is lower because of the ambitious expansion plans of ABC Limited Thereafter return on
net worth increases with increase in PAT
Returns on Investment
Table 66 Financial returnsFinancial Indicators
Project IRR 1813Equity IRR 3609
64 Sensitivity Analysis
A sensitivity analysis has been carried out on the project financials to determine theimpact of key variables on the financial indicators namely
Project IRR
The key variables on which sensitivity analysis have been carried out areCapital expenditure for GBS and RTS1st and 2 nd tenant tariff for GBS1st and 2 nd tenant tariff for RTSTenancy Ratio
Similarly sensitivity analysis has been carried out forEquity IRR
The key variables on which sensitivity analysis have been carried out for EIRR are
Capital structure and interest rate for capital debtRepayment period and moratorium period
882019 Major Project (Ramit)
httpslidepdfcomreaderfullmajor-project-ramit 4462
35
The impact on the financial indicators is shown below
Figure 6-1 Project IRR vs GBT and RTT CAPEX
As shown in Figure 6-1 project IRR is more sensitive to change in CAPEX of RTT sitesas compared to change in CAPEX of GBT sites because tenancy ratio and tariff for RTTsites are higher than those of GBT sites
882019 Major Project (Ramit)
httpslidepdfcomreaderfullmajor-project-ramit 4562
36
Figure 6-2 Project IRR vs GBT Tariff for 1 st tenant (X-axis) and 2 nd tenant (right-hand side)
As shown in Figure 6-2 project IRR varies linearly with GBT tariff In the best casescenario when GBT tariff for 1 st tenant is INR 34000month and GBT tariff for secondtenant is INR 26000month Project IRR is 2101
Figure 6-3 Project IRR vs RTT Tariff for 1 st tenant (X-axis) and 2 nd tenant (right-hand side)
As shown in Figure 6-2 project IRR varies linearly with RTT tariff In the best casescenario when RTT tariff for 1 st tenant is INR 24000month and RTT tariff for second
882019 Major Project (Ramit)
httpslidepdfcomreaderfullmajor-project-ramit 4662
37
tenant is INR 20000month Project IRR is 1932 Project IRR is more sensitivetowards RTT tariff than GBT tariff because in practical business situation RTT siteshave a tenancy ratio of more than two due to which effect of tariff for 1 st tenant almostget nullified after few years
Figure 6-4 Project IRR vs Tenancy ratio for RTT sites (X-axis) and GBT sites
As shown in Figure 6-4 project IRR is very sensitive to tenancy ratio In the best casescenario where GBT sites have a tenancy ratio of 2 and RTT sites have a tenancy ratio of 3 project IRR can be as high as 20
Figure 6-5 Equity IRR vs long term debt interest rate for different leverage level
882019 Major Project (Ramit)
httpslidepdfcomreaderfullmajor-project-ramit 4762
38
As shown in figure 6-5 equity IRR is more sensitive to interest rate on long term debt forhigh level of leverage (lower debt equity ratio) because as the debt equity ratio increasesinterest paid on long term debt also increases significantly
Figure 6-6 Equity IRR vs long term debt repayment period at different level of moratoriumperiods
As shown in figure 6-6 Equity IRR increases with increase in moratorium period anddebt repayment period The variation is from 1654 to 60 for worst case and best casescenarios
882019 Major Project (Ramit)
httpslidepdfcomreaderfullmajor-project-ramit 4862
39
7 RISK ASSESSMENTRisk Mitigation strategyExecution Risk
(Project management landacquisition etc)
Management of ABC has proven expertise in
telecom infrastructure rollout and has executedvarious projects with large telecom operators andMNC vendorsABCrsquos top management team consists of a groupof professionals drawn from leading telecomInfrastructure Company who have immenseexpertise and experience in rolling out telecominfrastructure projects
Market Risk (No entry barriers operators may
share infrastructure betweenthemselves large players withhigh capital may increasecompetition)
India has a huge potential for telecominfrastructure market With increasing
competition falling tariffs and pressure onmargins telecom service providers are beingforced to increase their focus on marketing andreduce their expensesExperienced management healthy capital back-up effective presence in the telecominfrastructure market and value added services atrelatively lesser cost will help ABC to meet theset targets
Financing Risk
(Availability of equity capitalavailability of long term debtinterest rate and moratoriumperiod)
ABC is seeking private equity partner to secure
equity capital Company has already entered intoNDA with 2 major investorsLong term debt at an interest rate of 125 canbe easily arranged because of the credibility of the promoters in the marketMany other similar firms like Indus and GTLhave already secured long term debt for amoratorium period of 2 years Promoters of ABCLimited are confident to secure a long term debtwith a moratorium period of 2 years and apayback period of 8 years
ABC Limited would minimize the workingcapital requirements of its business by securingrentals and operating revenues in advance fromits clients and or by suitably structuring itspayment liabilities to match its cash inflows
Commercial Risk (Tenancy ratio and tariff forGBS and RTS)
ABC would aim to enter into long term contractswith the ldquoanchor tenantrdquo operator and thenrollout the infrastructure so that at least single
882019 Major Project (Ramit)
httpslidepdfcomreaderfullmajor-project-ramit 4962
40
occupancy of each site is ensured at all t imesPromoters will use its knowledge of the businessand its expertise to identify and roll out sites inlocations which have strong multi- tenancypotential to minimize occupancy risk
Revenue Risk (Operating fees may decreasecredit worthiness of the clientsdelay in payment of rentals)
As per the industry sources till now not even asingle operator have dishonored the long termlease contractThe credit risk is diversified as there will bemultiple operatorsABC would aggressively market to get 3G andWiFi broadcasters to use the sites and earnadditional revenues in addition to the assumedrevenue streams
Natural Calamities Risk The Company shall maintain insurance for thesites against these risks and the cost of insurancewill be priced in and passed on to the tenants
882019 Major Project (Ramit)
httpslidepdfcomreaderfullmajor-project-ramit 5062
41
8 CONCLUSION
India is the fastest growing wireless telecom market in the world The continuing
growth in the number of wireless subscribers and MoUs and increasing trend of
outsourcing of business processes to India has led to growing demand for large
investments in the telecom infrastructure in the country
However with increasing competition falling tariffs and pressure on margins
telecom service providers are being forced to increase their focus on marketing
customer acquisitions and branding and minimize their efforts and overheads in
project management and asset acquisition
Further with rising prices of steel cement and real estate the cost of developing
and owning passive infrastructure is increasingly becoming a costly proposition
for most operators and service providers
The compulsion on the part of service providers to reduce their operating costs
and capital expenditure requirements has led to opportunities in passiveinfrastructure outsourcing to independent third party infrastructure providers and
also sharing the infrastructure with other service providers It is expected that
cellular operators will outsource their communications site infrastructure needs as
a means of accelerating access to their markets and preserving capital rather than
constructing and operating their own communications sites and maintaining their
own communications sites service and deve lopment capabilities
Passive infrastructure is highly capital intensive and an integral part of the cellular
service providersrsquo networks Yet being a simple and low technology asset it is
amenable to outsourcing and sharing By transferring the responsibility of
ownership development and maintenance of passive infrastructure service
882019 Major Project (Ramit)
httpslidepdfcomreaderfullmajor-project-ramit 5162
42
providers have an opportunity to transfer a substantial part of their business risk to
third parties
Most telecom operators are facing capacity constraints on their networksCoverage obligations increasing pressure to improve network quality and
competition has led to aggressive roll out plans by existing cellular operators
Installation of cell sites has become a cumbersome process as there are a number
of clearances required and involves labor-intensive micro management
Availability of ready infrastructure from third party providers would enable the
operators to reduce their time to market and accelerate their access to their
customers Cellular service providers generally want to move quickly when
adding more sites and co-location on an existing site is always faster than
building
Ownership and maintenance of telecom towers and other infrastructure by third
parties is an established practice in developed nations like USA and is
increasingly gaining market acceptance in India
The Indian government is seriously considering promoting the infrastructure
sharing route between the telecom operator and private players to achieve future
national tele-density targets and improve rural telecom penetration
ABC being an independent entity with no business conflicts with other service
providers in the telecom space will be best positioned and have an early mover
advantage to capitalize on this emerging opportunity
Further the task of operating and maintaining the passive infrastructure in the cell
is increasingly becoming a cumbersome exercise for the service providers to
handle ABCrsquos composite offering to build passive infrastructure for the cellular
operators and also operate and maintain them will provide a turnkey solution to
address the infrastructure needs of the service providers
882019 Major Project (Ramit)
httpslidepdfcomreaderfullmajor-project-ramit 5262
43
The business model proposed to be followed by ABC is fairly simple with stable
and predictable cash flows as is the case with the business model of the tower
renting companies in USA Most contracts are long term for a period 10 or moreyears with annual price escalators generally ranging from 3 to 4 However
wireless carriers normally tend to renew rentals because suitable alternative sites
may not exist or be available and repositioning a site in a carrierrsquos network is
expensive and may adverse ly affect network quality
Site ownership and operations is a ldquoscalerdquo business operating administration
marketing expenses etc do not rise as quickly as revenues when portfolios are
expanded Incremental operating costs associated with adding wireless tenants to
a communications site are minimal Therefore as additional tenants are added to a
site the substantial majority of incremental revenue contributes to margin
expansion Most tower companies have high EBITDA margins as may be seen
from the financial indicators of some of the tower rental companies in USA
It is expected that site location and capacity price and quality of service and
successful execution of contracts will be the most significant competitive factors
in this business
ABCrsquos revenue and returns on investment will be primarily driven by its ability
to
o Increase the utilization of the space and infrastructure capacity owned by it by
increasing the number of tenants per site and renting out to maximum number
of users As discussed above return on capital employed (PIRR and EIRR) arevery sensitive to tenancy ratio In worst case scenario project IRR can be as
low as 8 and in the best case scenario it can be as high as 20
o Develop acquire sites of strategic importance and high growth potential that
will enable them to secure better commercial terms from users and attract
more number of tenants Infrastructure provisioning fees rentals for sites are
882019 Major Project (Ramit)
httpslidepdfcomreaderfullmajor-project-ramit 5362
44
extremely location sensitive There is a potential to acquire more land than
that of required to capitalize on the increase in real estate prices
o Develop sites in a cost effective manner ABC would consider purchasing
land only for those GBS sites which have sufficient demand and arestrategically located Else for most of its sites land will be leasehold As
shown above returns (PIRR and EIRR) are very sensitive to capital costs In
the worst case scenario project IRR can be as low as 15 whereas it can as
high as 27 in the best case scenario
o Negotiate and secure long term contracts with good credit quality users with
built in price escalation provisions to mitigate financing risk
o Leverage and secure long term financing at attractive terms and involve in
active treasury management to keep low financing cost Results of the
sensitivity analysis indicate that equity IRR can be as high as 60 foe a
moratorium period of 4 years and interest rate of 10
o Minimize working capital requirements
o Maintain low operating and administration expense
o Secure better OampM margins from operators and retain a healthy share of it in
ABC
o Maintain high service standards and build strong customer relationships
The business would have the potential to capture new revenue opportunities
around the existing assets As demand for towers is expected to grow and as
operators migrate to speedier next-generation wireless technologies they will
need the towers and associated passive infrastructure to transmit their new
services in addition to their existing offerings In addition to increasing capacity
and coverage and improving the quality of their networks cellular serviceproviders are deploying high speed data networks driving incremental demand of
sites The business therefore has potential upsides in the form of adding
customers (tenants) in wireless broadband third generation (ldquo3Grdquo) and wireless
data capabilities and also other incremental value propositions by way of hosting
882019 Major Project (Ramit)
httpslidepdfcomreaderfullmajor-project-ramit 5462
45
Billboards Hoardings etc in some of the high visible sites owned and maintained
by it
Based on the assumptions and subject to satisfactory resolution of the key risks
factors project cash flows will be able to meet debt service obligations
This business model is a lucrative investment option for a private equity player
because valuation of each site will increase in the coming years due to
improvement in market conditions increase in the value of land and increase in
the demand for passive infrastructure in rural and semi-urban areas
882019 Major Project (Ramit)
httpslidepdfcomreaderfullmajor-project-ramit 5562
46
REFERENCESAnjan G V A amp N M (2009) telecom infrastructure industry in india GurgaonICRA
Bessler W Norsworthy J amp Shusterman T (2001 12 1) Mergers in the UStelecommunications industry and market valuationeffects IEEE p 288
COAI (2009 march 14) Subscriber Figures Retrieved march 14 2009 fromCOAIcom httpwwwcoaicomstatisticsphp
IDA (2009 march 23) Highlights Retrieved march 23 2009 from idagovsghttpwwwidagovsghomeindexaspx
K R (2008) Time for new business model Delhi Cybermedia
MAXIS (2009 march 8) the malaysian telecommunications industry Retrieved march9 2009 from maxiscommyhttpwwwmaxiscommypersonalabout_usinvestorprospectusprospectus4pdf
P J amp Lisa A (2009) Stimulas spending and American Telecom Industry USACoracle group
PwC (2009 march 12) Indian Telecom Industry Gurgaon Harayana IndiaRamachanran (2009 march 1) Investment in Telecom Infrastructure sector (M RInterviewer)
Vogelsang I (2002) The German Telecommunications Reform Verein fuumlr Socialpolitik (p 26) Innsbruck Boston Press
882019 Major Project (Ramit)
httpslidepdfcomreaderfullmajor-project-ramit 5662
47
ANNEXURES
ANNEXURE 1 Key Assumptions
The occupancy of each site by single two three operators for green-field sites is assumed
to be as follows
Table 91 Expected Tenancy RatiosFY 10 FY 11 FY 12 FY 13 FY 14 FY15
GBT Tenant
Ratio 150 150 170 170 170 200
Single Operator 50 50 30 30 30 0
Two Operator 50 50 70 70 70 100
RTT Tenant
Ratio 170 170 200 200 200 250
Single Operator 30 30 0 0 0 0
Two Operator 70 70 100 100 100 50
Three Operator 0 0 0 0 0 50
From FY 15 onwards tenancy ratio of 2 and 25 for GBT and RTT sites is cons idered
882019 Major Project (Ramit)
httpslidepdfcomreaderfullmajor-project-ramit 5762
48
Capital costs related assumptions are tabulated below
Table 92 GBT and RTT Capital Cost
The lease rentals for RTT sites are reimbursed from the operators and therefore have not
been factored in the revenues as well as the expense For GBT sites land purchase cost of
035 millions assumed which has been escalated by 6 annually to determine the
salvage value of assets
GBT Capital Costs
Million
INR
Delivery cost of Ground Based
Tower (GBT)063
Delivery cost of Generator 030
Civil Work 040Shelter 012
Electrical Works 030
Other Equipments (UPS Battery
etc)045
Construction cost 045
Land 035
Contingency amp Financial Charges 035Total cost 335
RTT Capital Costs
Million
INR
Delivery cost of Roof Top
Tower (RTT) 030
Delivery cost of Generator 020
Civil Work 020Shelter 012
Electrical Works 030
Other Equipments (UPS
Battery etc) 030
Construction cost -
Land -
Contingency amp FinancialCharges 008
Total cost 150
882019 Major Project (Ramit)
httpslidepdfcomreaderfullmajor-project-ramit 5862
49
Ope rating costs related assumptions are tabulated below
Table 93 Operating CostsOperating Costs
Security Sentries (INRMonth) 4000
Supervisors (INRMonth) 6000
Cluster Manager One for Fifty Towers (INRMonth) 15000
Annual increase 500
Number of Security Sentries per tower 300
Number of supervisors per tower 010
Number of C luster manager per tower 002
Fixed Expenses
Selling amp Maintenance (INRMonth) 4000000
Annual Escalation 5
Administration overhead (INRMonth) 10000000Annual Escalation 7
AMC Cost of Generator 15 (cost of generator)
Annual Escalation (AMC) 3
For RTT sites security sentries are not required because it will be the responsibility of
the site owner A supervisor will for every 10 sites and a cluster manager for every 50
sites will be required
882019 Major Project (Ramit)
httpslidepdfcomreaderfullmajor-project-ramit 5962
50
Table 94 Long term debtInterest Rate 125 per annum
Moratorium 2 years
Repayment Period 8 years
Tariff related assumptions and date of operations are tabulated below
Table 95 GBT and RTT Tariff Table 96 Life of the projectTariff Plan
Tariff (INRMonth)
No of
operators GBT RTT
1 28000 18000
2 22000 14000
3 0 12000
Annual
increase 3 3
Commercial Operation Date 1-Aug-09
Quarter Ending 30-Sep-09
FY ending COD 31-Mar-10
Project life years 15
End of commercial
operations31-Aug-24
Quarter ending commercial
operations30-Sep-24
FY ending comme rcial
operations31-Mar-25
882019 Major Project (Ramit)
httpslidepdfcomreaderfullmajor-project-ramit 6062
51
Annexure 2 Profit amp Loss accountsTable 97 Profit amp loss account statement
Income Statement (MNINR)Year ending Mar-10 Mar-11 Mar-12 Mar-13 Mar-14 Mar-15
RevenueGBT 406350 28811 89080 197447 379409 527015Operator Fees (GBT) 1411 10004 30678 67998 130664 179664RTT 1209 8575 27269 60443 116146 164264
Operator Fees (RTT) 440 3121 9739 21587 41481 56466Net Revenue 7124 50511 156766 347476 667700 927410
Expenses
VariableSecurity Sentries 1355 9790 28339 64033 125433 158238Supervisors 097 699 2024 4574 8959 11303Cluster Manager 048 350 10 12 2287 4480 5651AMC Cost of Generator 450 3013 7877 16719 31148 54541Sub-total 1950 13852 39252 87612 170021 229734
Fixed
Selling amp Maintenance(INRMonth) 032 050 053 056 058 061
Administration overhead(INRMonth) 080 128 137 147 157 168
Sub-total 112 179 190 203 216 230
EBITDA 5062 36480 117324 259661 497464 697447
Interest on LT loan - - 7341 31200 77479 156198Interest on ST loan - 021 060 130 245 361
EBDT 5062 36459 109923 228331 419739 540888Depreciation 2439 12769 35917 77162 142925 174006
EBT 2624 23691 74006 151169 276814 366881Income Tax 170 4233 14536 29073 53547 77634
PAT 2454 19458 59470 122096 223267 289247
882019 Major Project (Ramit)
httpslidepdfcomreaderfullmajor-project-ramit 6162
52
Annexure 3 Balance sheet
Table 98 B alance sheetsYearend Balance Sheet (MNINR)Year ending Mar-10 Mar-11 Mar-12 Mar-13 Mar-14 Mar-15
AssetsGross Block 75742 328216 833164 1716823 3105430 3105430Accumulated depreciation 2439 15208 51125 128287 271212 445218Net Block 73303 313009 782040 1588536 2834219 2660212Net Working Capital 064 241 620 1335 2515 3707Cash Balance 12979 72089 216513 488856 947982 1294734Total Assets 86346 385339 999172 2078727 3784715 3958653
LiabilitiesEquity 25168 108980 276604 569947 1030914 1030914Reserves amp Surplus 2454 21912 81381 203477 426745 715992Long term Debt 58725 254286 640722 1304302 2325171 2208967WC Borrowings - 161 465 1001 1886 2780Total Liabilities 86346 385339 999172 2078727 3784715 3958653
882019 Major Project (Ramit)
httpslidepdfcomreaderfullmajor-project-ramit 6262
Annexure 4 Cash flow statement
Table 99 Cash flow statements
Year ending Mar-10 Mar-11 Mar-12 Mar-13 Mar-14 Mar-15
InflowsPAT 2454 19458 59470 122096 223267 289247Depreciation 2439 12769 35917 77162 142925 174006Tax adjusted interest - 014 4959 20991 52076 104895Release of WC - - - - - -Salvage Value - - - - - -Sub-Total 4893 32241 100345 220249 418268 568148
OutflowsCapex 75742 252474 504948 883659 1388607 -Change in WorkingCapital 064 177 379 715 1180 1192
Sub-Total 75806 252651 505327 884374 1389787 1192
UFCF (70913) (220410) (404982) (664125) (971519) 566956LFCF (70913) (220424) (409940) (685116) (1023595) 462062
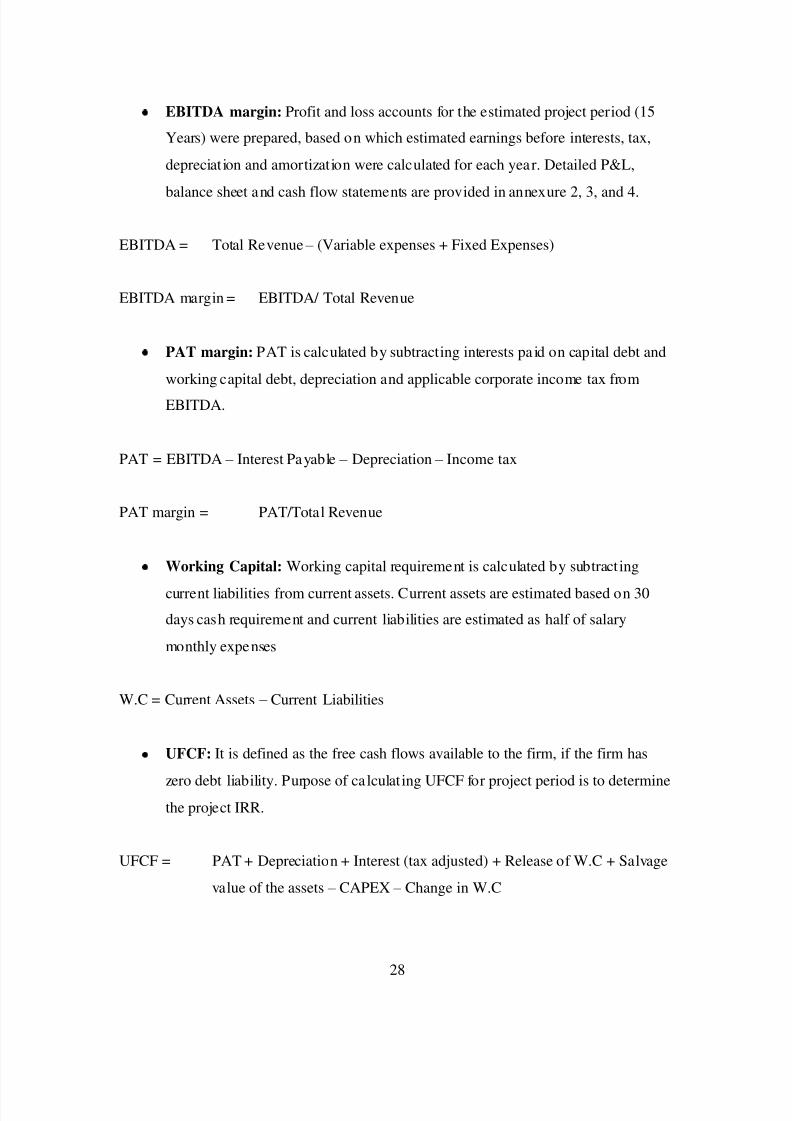
882019 Major Project (Ramit)
httpslidepdfcomreaderfullmajor-project-ramit 3762
28
EBITDA margin Profit and loss accounts for the estimated project period (15
Years) were prepared based on which estimated earnings before interests tax
depreciat ion and amortization were calculated for each year Detailed PampL
balance sheet and cash flow statements are provided in annexure 2 3 and 4
EBITDA = Total Revenue ndash (Variable expenses + Fixed Expenses)
EBITDA margin = EBITDA Total Revenue
PAT margin PAT is calculated by subtracting interests pa id on capital debt and
working capital debt depreciation and applicable corporate income tax from
EBITDA
PAT = EBITDA ndash Interest Payable ndash Depreciation ndash Income tax
PAT margin = PATTotal Revenue
Working Capital Working capital requirement is calculated by subtract ing
current liabilities from current assets Current assets are estimated based on 30
days cash requirement and current liabilities are estimated as half of salary
monthly expenses
WC = Current Assets ndash Current Liabilities
UFCF It is defined as the free cash flows available to the firm if the firm has
zero debt liability Purpose of ca lculat ing UFCF for project period is to determinethe project IRR
UFCF = PAT + Depreciation + Interest (tax adjusted) + Release of WC + Salvage
value of the assets ndash CAPEX ndash Change in WC
882019 Major Project (Ramit)
httpslidepdfcomreaderfullmajor-project-ramit 3862
29
LCFF It is defined as the cash floes available to the firm after paying interests on
long term and short term debts
LCFF = UFCF ndash Interest (tax adjusted)
FCFE It is defined as the free cash flow available to equity holders It is
determined to ca lculate equity IRR for equity investors It also includes the tax
benefits which are available as per the Income Tax Act
FCFE PAT + Depreciation + Salvage Value ndash Equity Investment ndash Long term debt
repayment
PIRR Project IRR is defined as the discount rate at which NPV (Net Present
Value) of UFCF is zero It is calculated by using following formula
UFCF 1 (1+PIRR) 0+ UFCF 2 (1+PIRR) 1+ UFCF 3 (1+PIRR) 2+ helliphelliphelliphelliphelliphellip = 0
UFCF 1 = UFCF at the end of first year of operation
UFCF 2 = UFCF at the end of second year of operation
PIRR = Project IRR
EIRR Equity IRR is defined as the discount rate at which NPV of FCFE is zero
It is calculated by using following formula
FCFE1 (1+EIRR) 0+ FCFE 2 (1+EIRR) 1+ FCFE 3 (1+EIRR) 2+ helliphelliphelliphelliphelliphellip = 0
FCFE1 = FCFE at the end of first year of operation
FCFE2 = FCFE at the end of seco nd year of operation
EIRR = Equity IRR
882019 Major Project (Ramit)
httpslidepdfcomreaderfullmajor-project-ramit 3962
30
WACC It is de fined as the percentage of return expected by the investors who
otherwise would have earned some return by investing in some other project
WACC = Cost of Debt (Debt Capital) + Cost of equity (Equity Capital)
882019 Major Project (Ramit)
httpslidepdfcomreaderfullmajor-project-ramit 4062
882019 Major Project (Ramit)
httpslidepdfcomreaderfullmajor-project-ramit 4162
32
62 Funding planAs the telecom sites are rolled out over a 5 year period till FY 2014 investment will be
required for each year ABC Limited will start generating profits from FY 10 only Such
internally generated cash accruals will be ploughed back into the business to meet part of
the project cost Investment required for each year is tabulated below
Table 61 Funding ProposalMillion INR FY 10 FY 11 FY 12 FY 13 FY 14
GBT Tower (Additional) Nos 210 700 1400 2450 3850
RTT Tower (Additional) Nos 90 300 600 1050 1650DE ratio 233 233 233 233 233
Additional CAPEX 83892 279374 558748 977809 1536557
Debt 58725 195562 391124 684466 1075590
Equity 25168 83812 167624 293343 460967
63 Results
Based on assumptions given in Annexure 1 a detailed financial model was preparedResults of the financial model such as PampL account Balance Sheet and cash flow
statements are provided in Annexure 2 3 and 4 Forecasts for the key financial figures for
first five years are provided in the Table below
Forecasts
Table 62 Income StatementMillion INR FY-10 FY11 FY12 FY-13 FY-14
Sales 7124 50511 156766 347476 667700
Cost of sales 1950 13852 39252 87612 170021
Gross 5174 36659 117514 259864 497679
7263 7258 7496 7479 7454
Admin costs 112 179 190 203 216
882019 Major Project (Ramit)
httpslidepdfcomreaderfullmajor-project-ramit 4262
33
Finance cost 0 021 7401 31330 77725
Taxation 170 4233 14536 29073 53547
PAT 2454 19458 59470 122096 223267
As shown in Table above during the expansion period revenue will grow exponentially
In the first year of operation ABC will earn a revenue of INR 7124 million from 300
(210 GBT and 90 RTT) sites with a tenancy ratio of 15 for GBS and 17 for RTS In the
first 2 years of operation the company will not pay any interest on long term debt due to
2 years moratorium period Major cost associated with the project is depreciation due to
which PAT is lower than the operating profits But cash flows to the firm are enough to
result in reasonable returns
Table 63 Balance Shee tYear ending Mar-10 Mar-11 Mar-12 Mar-13 Mar-14
AssetsGross Block 75742 328216 833164 1716823 3105430Accumulated depreciation 2439 15208 51125 128287 271212Net Block 73303 313009 782040 1588536 2834219Net Working Capital 064 241 620 1335 2515Cash Balance 12979 72089 216513 488856 947982
Total Assets 86346 385339 999172 2078727 3784715LiabilitiesEquity 25168 108980 276604 569947 1030914Reserves amp Surplus 2454 21912 81381 203477 426745Long term Debt 58725 254286 640722 1304302 2325171WC Borrowings - 161 465 1001 1886Total Liabilities 86346 385339 999172 2078727 3784715
Note All figures are in Million INR
Table 64 Key financial ratiosMar-11 Mar-12 Mar-13 Mar-14 Mar-15
Revenue Growth 60902 21036 12165 9216 3890EBITDA Growth 62061 22161 12132 9158 4020
PAT Growth 69293 20564 10531 8286 2955
As shown in table above increase in EBITDA is higher than that of revenue This is due
to better operational efficiency of ABCrsquos management and economies of scale S imilarly
882019 Major Project (Ramit)
httpslidepdfcomreaderfullmajor-project-ramit 4362
34
increase in PAT is lesser than that of EBITDA because of high depreciation and interest
expenses
Table 65 Pr ofitability r atios
Mar-11 Mar-12 Mar-13 Mar-14 Mar-15
EBITDA Margin 7222 7484 7473 7450 7520
PAT Margin 3852 3794 3514 3344 3119Return on Net Worth 622 760 769 788 1087
Key profitability ratios are shown in table above Return on net worth in the initial years
is lower because of the ambitious expansion plans of ABC Limited Thereafter return on
net worth increases with increase in PAT
Returns on Investment
Table 66 Financial returnsFinancial Indicators
Project IRR 1813Equity IRR 3609
64 Sensitivity Analysis
A sensitivity analysis has been carried out on the project financials to determine theimpact of key variables on the financial indicators namely
Project IRR
The key variables on which sensitivity analysis have been carried out areCapital expenditure for GBS and RTS1st and 2 nd tenant tariff for GBS1st and 2 nd tenant tariff for RTSTenancy Ratio
Similarly sensitivity analysis has been carried out forEquity IRR
The key variables on which sensitivity analysis have been carried out for EIRR are
Capital structure and interest rate for capital debtRepayment period and moratorium period
882019 Major Project (Ramit)
httpslidepdfcomreaderfullmajor-project-ramit 4462
35
The impact on the financial indicators is shown below
Figure 6-1 Project IRR vs GBT and RTT CAPEX
As shown in Figure 6-1 project IRR is more sensitive to change in CAPEX of RTT sitesas compared to change in CAPEX of GBT sites because tenancy ratio and tariff for RTTsites are higher than those of GBT sites
882019 Major Project (Ramit)
httpslidepdfcomreaderfullmajor-project-ramit 4562
36
Figure 6-2 Project IRR vs GBT Tariff for 1 st tenant (X-axis) and 2 nd tenant (right-hand side)
As shown in Figure 6-2 project IRR varies linearly with GBT tariff In the best casescenario when GBT tariff for 1 st tenant is INR 34000month and GBT tariff for secondtenant is INR 26000month Project IRR is 2101
Figure 6-3 Project IRR vs RTT Tariff for 1 st tenant (X-axis) and 2 nd tenant (right-hand side)
As shown in Figure 6-2 project IRR varies linearly with RTT tariff In the best casescenario when RTT tariff for 1 st tenant is INR 24000month and RTT tariff for second
882019 Major Project (Ramit)
httpslidepdfcomreaderfullmajor-project-ramit 4662
37
tenant is INR 20000month Project IRR is 1932 Project IRR is more sensitivetowards RTT tariff than GBT tariff because in practical business situation RTT siteshave a tenancy ratio of more than two due to which effect of tariff for 1 st tenant almostget nullified after few years
Figure 6-4 Project IRR vs Tenancy ratio for RTT sites (X-axis) and GBT sites
As shown in Figure 6-4 project IRR is very sensitive to tenancy ratio In the best casescenario where GBT sites have a tenancy ratio of 2 and RTT sites have a tenancy ratio of 3 project IRR can be as high as 20
Figure 6-5 Equity IRR vs long term debt interest rate for different leverage level
882019 Major Project (Ramit)
httpslidepdfcomreaderfullmajor-project-ramit 4762
38
As shown in figure 6-5 equity IRR is more sensitive to interest rate on long term debt forhigh level of leverage (lower debt equity ratio) because as the debt equity ratio increasesinterest paid on long term debt also increases significantly
Figure 6-6 Equity IRR vs long term debt repayment period at different level of moratoriumperiods
As shown in figure 6-6 Equity IRR increases with increase in moratorium period anddebt repayment period The variation is from 1654 to 60 for worst case and best casescenarios
882019 Major Project (Ramit)
httpslidepdfcomreaderfullmajor-project-ramit 4862
39
7 RISK ASSESSMENTRisk Mitigation strategyExecution Risk
(Project management landacquisition etc)
Management of ABC has proven expertise in
telecom infrastructure rollout and has executedvarious projects with large telecom operators andMNC vendorsABCrsquos top management team consists of a groupof professionals drawn from leading telecomInfrastructure Company who have immenseexpertise and experience in rolling out telecominfrastructure projects
Market Risk (No entry barriers operators may
share infrastructure betweenthemselves large players withhigh capital may increasecompetition)
India has a huge potential for telecominfrastructure market With increasing
competition falling tariffs and pressure onmargins telecom service providers are beingforced to increase their focus on marketing andreduce their expensesExperienced management healthy capital back-up effective presence in the telecominfrastructure market and value added services atrelatively lesser cost will help ABC to meet theset targets
Financing Risk
(Availability of equity capitalavailability of long term debtinterest rate and moratoriumperiod)
ABC is seeking private equity partner to secure
equity capital Company has already entered intoNDA with 2 major investorsLong term debt at an interest rate of 125 canbe easily arranged because of the credibility of the promoters in the marketMany other similar firms like Indus and GTLhave already secured long term debt for amoratorium period of 2 years Promoters of ABCLimited are confident to secure a long term debtwith a moratorium period of 2 years and apayback period of 8 years
ABC Limited would minimize the workingcapital requirements of its business by securingrentals and operating revenues in advance fromits clients and or by suitably structuring itspayment liabilities to match its cash inflows
Commercial Risk (Tenancy ratio and tariff forGBS and RTS)
ABC would aim to enter into long term contractswith the ldquoanchor tenantrdquo operator and thenrollout the infrastructure so that at least single
882019 Major Project (Ramit)
httpslidepdfcomreaderfullmajor-project-ramit 4962
40
occupancy of each site is ensured at all t imesPromoters will use its knowledge of the businessand its expertise to identify and roll out sites inlocations which have strong multi- tenancypotential to minimize occupancy risk
Revenue Risk (Operating fees may decreasecredit worthiness of the clientsdelay in payment of rentals)
As per the industry sources till now not even asingle operator have dishonored the long termlease contractThe credit risk is diversified as there will bemultiple operatorsABC would aggressively market to get 3G andWiFi broadcasters to use the sites and earnadditional revenues in addition to the assumedrevenue streams
Natural Calamities Risk The Company shall maintain insurance for thesites against these risks and the cost of insurancewill be priced in and passed on to the tenants
882019 Major Project (Ramit)
httpslidepdfcomreaderfullmajor-project-ramit 5062
41
8 CONCLUSION
India is the fastest growing wireless telecom market in the world The continuing
growth in the number of wireless subscribers and MoUs and increasing trend of
outsourcing of business processes to India has led to growing demand for large
investments in the telecom infrastructure in the country
However with increasing competition falling tariffs and pressure on margins
telecom service providers are being forced to increase their focus on marketing
customer acquisitions and branding and minimize their efforts and overheads in
project management and asset acquisition
Further with rising prices of steel cement and real estate the cost of developing
and owning passive infrastructure is increasingly becoming a costly proposition
for most operators and service providers
The compulsion on the part of service providers to reduce their operating costs
and capital expenditure requirements has led to opportunities in passiveinfrastructure outsourcing to independent third party infrastructure providers and
also sharing the infrastructure with other service providers It is expected that
cellular operators will outsource their communications site infrastructure needs as
a means of accelerating access to their markets and preserving capital rather than
constructing and operating their own communications sites and maintaining their
own communications sites service and deve lopment capabilities
Passive infrastructure is highly capital intensive and an integral part of the cellular
service providersrsquo networks Yet being a simple and low technology asset it is
amenable to outsourcing and sharing By transferring the responsibility of
ownership development and maintenance of passive infrastructure service
882019 Major Project (Ramit)
httpslidepdfcomreaderfullmajor-project-ramit 5162
42
providers have an opportunity to transfer a substantial part of their business risk to
third parties
Most telecom operators are facing capacity constraints on their networksCoverage obligations increasing pressure to improve network quality and
competition has led to aggressive roll out plans by existing cellular operators
Installation of cell sites has become a cumbersome process as there are a number
of clearances required and involves labor-intensive micro management
Availability of ready infrastructure from third party providers would enable the
operators to reduce their time to market and accelerate their access to their
customers Cellular service providers generally want to move quickly when
adding more sites and co-location on an existing site is always faster than
building
Ownership and maintenance of telecom towers and other infrastructure by third
parties is an established practice in developed nations like USA and is
increasingly gaining market acceptance in India
The Indian government is seriously considering promoting the infrastructure
sharing route between the telecom operator and private players to achieve future
national tele-density targets and improve rural telecom penetration
ABC being an independent entity with no business conflicts with other service
providers in the telecom space will be best positioned and have an early mover
advantage to capitalize on this emerging opportunity
Further the task of operating and maintaining the passive infrastructure in the cell
is increasingly becoming a cumbersome exercise for the service providers to
handle ABCrsquos composite offering to build passive infrastructure for the cellular
operators and also operate and maintain them will provide a turnkey solution to
address the infrastructure needs of the service providers
882019 Major Project (Ramit)
httpslidepdfcomreaderfullmajor-project-ramit 5262
43
The business model proposed to be followed by ABC is fairly simple with stable
and predictable cash flows as is the case with the business model of the tower
renting companies in USA Most contracts are long term for a period 10 or moreyears with annual price escalators generally ranging from 3 to 4 However
wireless carriers normally tend to renew rentals because suitable alternative sites
may not exist or be available and repositioning a site in a carrierrsquos network is
expensive and may adverse ly affect network quality
Site ownership and operations is a ldquoscalerdquo business operating administration
marketing expenses etc do not rise as quickly as revenues when portfolios are
expanded Incremental operating costs associated with adding wireless tenants to
a communications site are minimal Therefore as additional tenants are added to a
site the substantial majority of incremental revenue contributes to margin
expansion Most tower companies have high EBITDA margins as may be seen
from the financial indicators of some of the tower rental companies in USA
It is expected that site location and capacity price and quality of service and
successful execution of contracts will be the most significant competitive factors
in this business
ABCrsquos revenue and returns on investment will be primarily driven by its ability
to
o Increase the utilization of the space and infrastructure capacity owned by it by
increasing the number of tenants per site and renting out to maximum number
of users As discussed above return on capital employed (PIRR and EIRR) arevery sensitive to tenancy ratio In worst case scenario project IRR can be as
low as 8 and in the best case scenario it can be as high as 20
o Develop acquire sites of strategic importance and high growth potential that
will enable them to secure better commercial terms from users and attract
more number of tenants Infrastructure provisioning fees rentals for sites are
882019 Major Project (Ramit)
httpslidepdfcomreaderfullmajor-project-ramit 5362
44
extremely location sensitive There is a potential to acquire more land than
that of required to capitalize on the increase in real estate prices
o Develop sites in a cost effective manner ABC would consider purchasing
land only for those GBS sites which have sufficient demand and arestrategically located Else for most of its sites land will be leasehold As
shown above returns (PIRR and EIRR) are very sensitive to capital costs In
the worst case scenario project IRR can be as low as 15 whereas it can as
high as 27 in the best case scenario
o Negotiate and secure long term contracts with good credit quality users with
built in price escalation provisions to mitigate financing risk
o Leverage and secure long term financing at attractive terms and involve in
active treasury management to keep low financing cost Results of the
sensitivity analysis indicate that equity IRR can be as high as 60 foe a
moratorium period of 4 years and interest rate of 10
o Minimize working capital requirements
o Maintain low operating and administration expense
o Secure better OampM margins from operators and retain a healthy share of it in
ABC
o Maintain high service standards and build strong customer relationships
The business would have the potential to capture new revenue opportunities
around the existing assets As demand for towers is expected to grow and as
operators migrate to speedier next-generation wireless technologies they will
need the towers and associated passive infrastructure to transmit their new
services in addition to their existing offerings In addition to increasing capacity
and coverage and improving the quality of their networks cellular serviceproviders are deploying high speed data networks driving incremental demand of
sites The business therefore has potential upsides in the form of adding
customers (tenants) in wireless broadband third generation (ldquo3Grdquo) and wireless
data capabilities and also other incremental value propositions by way of hosting
882019 Major Project (Ramit)
httpslidepdfcomreaderfullmajor-project-ramit 5462
45
Billboards Hoardings etc in some of the high visible sites owned and maintained
by it
Based on the assumptions and subject to satisfactory resolution of the key risks
factors project cash flows will be able to meet debt service obligations
This business model is a lucrative investment option for a private equity player
because valuation of each site will increase in the coming years due to
improvement in market conditions increase in the value of land and increase in
the demand for passive infrastructure in rural and semi-urban areas
882019 Major Project (Ramit)
httpslidepdfcomreaderfullmajor-project-ramit 5562
46
REFERENCESAnjan G V A amp N M (2009) telecom infrastructure industry in india GurgaonICRA
Bessler W Norsworthy J amp Shusterman T (2001 12 1) Mergers in the UStelecommunications industry and market valuationeffects IEEE p 288
COAI (2009 march 14) Subscriber Figures Retrieved march 14 2009 fromCOAIcom httpwwwcoaicomstatisticsphp
IDA (2009 march 23) Highlights Retrieved march 23 2009 from idagovsghttpwwwidagovsghomeindexaspx
K R (2008) Time for new business model Delhi Cybermedia
MAXIS (2009 march 8) the malaysian telecommunications industry Retrieved march9 2009 from maxiscommyhttpwwwmaxiscommypersonalabout_usinvestorprospectusprospectus4pdf
P J amp Lisa A (2009) Stimulas spending and American Telecom Industry USACoracle group
PwC (2009 march 12) Indian Telecom Industry Gurgaon Harayana IndiaRamachanran (2009 march 1) Investment in Telecom Infrastructure sector (M RInterviewer)
Vogelsang I (2002) The German Telecommunications Reform Verein fuumlr Socialpolitik (p 26) Innsbruck Boston Press
882019 Major Project (Ramit)
httpslidepdfcomreaderfullmajor-project-ramit 5662
47
ANNEXURES
ANNEXURE 1 Key Assumptions
The occupancy of each site by single two three operators for green-field sites is assumed
to be as follows
Table 91 Expected Tenancy RatiosFY 10 FY 11 FY 12 FY 13 FY 14 FY15
GBT Tenant
Ratio 150 150 170 170 170 200
Single Operator 50 50 30 30 30 0
Two Operator 50 50 70 70 70 100
RTT Tenant
Ratio 170 170 200 200 200 250
Single Operator 30 30 0 0 0 0
Two Operator 70 70 100 100 100 50
Three Operator 0 0 0 0 0 50
From FY 15 onwards tenancy ratio of 2 and 25 for GBT and RTT sites is cons idered
882019 Major Project (Ramit)
httpslidepdfcomreaderfullmajor-project-ramit 5762
48
Capital costs related assumptions are tabulated below
Table 92 GBT and RTT Capital Cost
The lease rentals for RTT sites are reimbursed from the operators and therefore have not
been factored in the revenues as well as the expense For GBT sites land purchase cost of
035 millions assumed which has been escalated by 6 annually to determine the
salvage value of assets
GBT Capital Costs
Million
INR
Delivery cost of Ground Based
Tower (GBT)063
Delivery cost of Generator 030
Civil Work 040Shelter 012
Electrical Works 030
Other Equipments (UPS Battery
etc)045
Construction cost 045
Land 035
Contingency amp Financial Charges 035Total cost 335
RTT Capital Costs
Million
INR
Delivery cost of Roof Top
Tower (RTT) 030
Delivery cost of Generator 020
Civil Work 020Shelter 012
Electrical Works 030
Other Equipments (UPS
Battery etc) 030
Construction cost -
Land -
Contingency amp FinancialCharges 008
Total cost 150
882019 Major Project (Ramit)
httpslidepdfcomreaderfullmajor-project-ramit 5862
49
Ope rating costs related assumptions are tabulated below
Table 93 Operating CostsOperating Costs
Security Sentries (INRMonth) 4000
Supervisors (INRMonth) 6000
Cluster Manager One for Fifty Towers (INRMonth) 15000
Annual increase 500
Number of Security Sentries per tower 300
Number of supervisors per tower 010
Number of C luster manager per tower 002
Fixed Expenses
Selling amp Maintenance (INRMonth) 4000000
Annual Escalation 5
Administration overhead (INRMonth) 10000000Annual Escalation 7
AMC Cost of Generator 15 (cost of generator)
Annual Escalation (AMC) 3
For RTT sites security sentries are not required because it will be the responsibility of
the site owner A supervisor will for every 10 sites and a cluster manager for every 50
sites will be required
882019 Major Project (Ramit)
httpslidepdfcomreaderfullmajor-project-ramit 5962
50
Table 94 Long term debtInterest Rate 125 per annum
Moratorium 2 years
Repayment Period 8 years
Tariff related assumptions and date of operations are tabulated below
Table 95 GBT and RTT Tariff Table 96 Life of the projectTariff Plan
Tariff (INRMonth)
No of
operators GBT RTT
1 28000 18000
2 22000 14000
3 0 12000
Annual
increase 3 3
Commercial Operation Date 1-Aug-09
Quarter Ending 30-Sep-09
FY ending COD 31-Mar-10
Project life years 15
End of commercial
operations31-Aug-24
Quarter ending commercial
operations30-Sep-24
FY ending comme rcial
operations31-Mar-25
882019 Major Project (Ramit)
httpslidepdfcomreaderfullmajor-project-ramit 6062
51
Annexure 2 Profit amp Loss accountsTable 97 Profit amp loss account statement
Income Statement (MNINR)Year ending Mar-10 Mar-11 Mar-12 Mar-13 Mar-14 Mar-15
RevenueGBT 406350 28811 89080 197447 379409 527015Operator Fees (GBT) 1411 10004 30678 67998 130664 179664RTT 1209 8575 27269 60443 116146 164264
Operator Fees (RTT) 440 3121 9739 21587 41481 56466Net Revenue 7124 50511 156766 347476 667700 927410
Expenses
VariableSecurity Sentries 1355 9790 28339 64033 125433 158238Supervisors 097 699 2024 4574 8959 11303Cluster Manager 048 350 10 12 2287 4480 5651AMC Cost of Generator 450 3013 7877 16719 31148 54541Sub-total 1950 13852 39252 87612 170021 229734
Fixed
Selling amp Maintenance(INRMonth) 032 050 053 056 058 061
Administration overhead(INRMonth) 080 128 137 147 157 168
Sub-total 112 179 190 203 216 230
EBITDA 5062 36480 117324 259661 497464 697447
Interest on LT loan - - 7341 31200 77479 156198Interest on ST loan - 021 060 130 245 361
EBDT 5062 36459 109923 228331 419739 540888Depreciation 2439 12769 35917 77162 142925 174006
EBT 2624 23691 74006 151169 276814 366881Income Tax 170 4233 14536 29073 53547 77634
PAT 2454 19458 59470 122096 223267 289247
882019 Major Project (Ramit)
httpslidepdfcomreaderfullmajor-project-ramit 6162
52
Annexure 3 Balance sheet
Table 98 B alance sheetsYearend Balance Sheet (MNINR)Year ending Mar-10 Mar-11 Mar-12 Mar-13 Mar-14 Mar-15
AssetsGross Block 75742 328216 833164 1716823 3105430 3105430Accumulated depreciation 2439 15208 51125 128287 271212 445218Net Block 73303 313009 782040 1588536 2834219 2660212Net Working Capital 064 241 620 1335 2515 3707Cash Balance 12979 72089 216513 488856 947982 1294734Total Assets 86346 385339 999172 2078727 3784715 3958653
LiabilitiesEquity 25168 108980 276604 569947 1030914 1030914Reserves amp Surplus 2454 21912 81381 203477 426745 715992Long term Debt 58725 254286 640722 1304302 2325171 2208967WC Borrowings - 161 465 1001 1886 2780Total Liabilities 86346 385339 999172 2078727 3784715 3958653
882019 Major Project (Ramit)
httpslidepdfcomreaderfullmajor-project-ramit 6262
Annexure 4 Cash flow statement
Table 99 Cash flow statements
Year ending Mar-10 Mar-11 Mar-12 Mar-13 Mar-14 Mar-15
InflowsPAT 2454 19458 59470 122096 223267 289247Depreciation 2439 12769 35917 77162 142925 174006Tax adjusted interest - 014 4959 20991 52076 104895Release of WC - - - - - -Salvage Value - - - - - -Sub-Total 4893 32241 100345 220249 418268 568148
OutflowsCapex 75742 252474 504948 883659 1388607 -Change in WorkingCapital 064 177 379 715 1180 1192
Sub-Total 75806 252651 505327 884374 1389787 1192
UFCF (70913) (220410) (404982) (664125) (971519) 566956LFCF (70913) (220424) (409940) (685116) (1023595) 462062
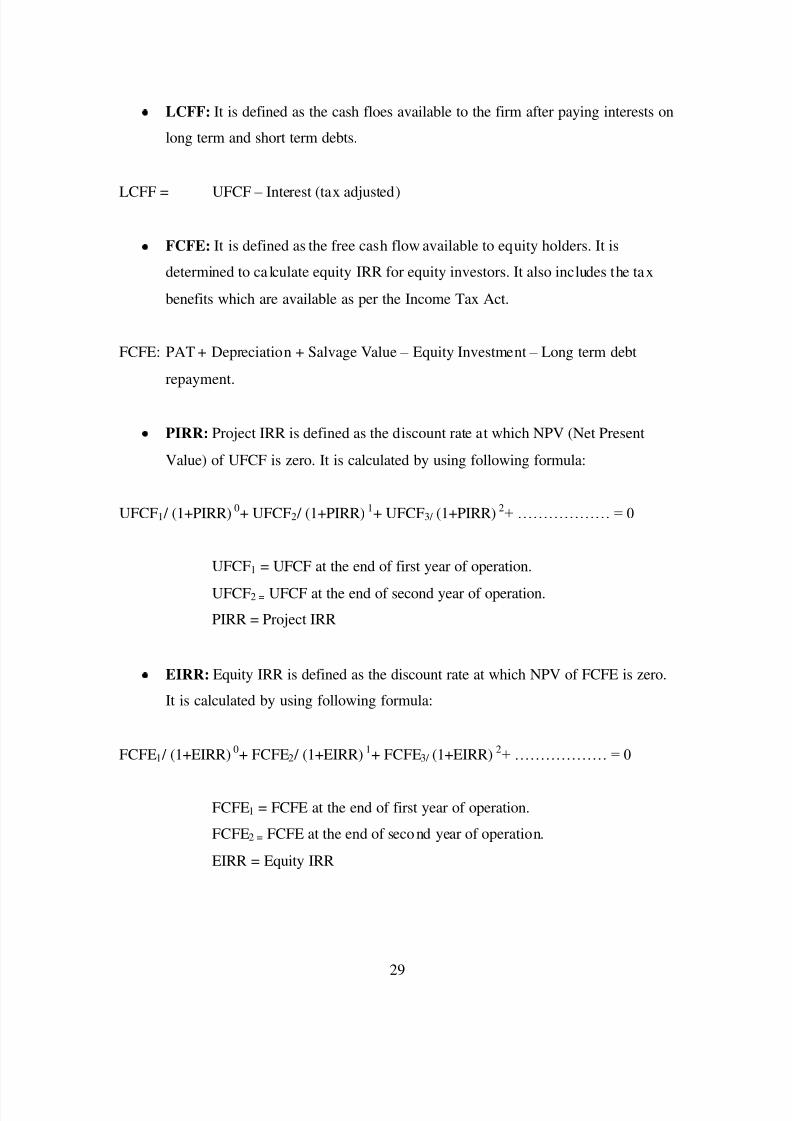
882019 Major Project (Ramit)
httpslidepdfcomreaderfullmajor-project-ramit 3962
30
WACC It is de fined as the percentage of return expected by the investors who
otherwise would have earned some return by investing in some other project
WACC = Cost of Debt (Debt Capital) + Cost of equity (Equity Capital)
882019 Major Project (Ramit)
httpslidepdfcomreaderfullmajor-project-ramit 4062
882019 Major Project (Ramit)
httpslidepdfcomreaderfullmajor-project-ramit 4162
32
62 Funding planAs the telecom sites are rolled out over a 5 year period till FY 2014 investment will be
required for each year ABC Limited will start generating profits from FY 10 only Such
internally generated cash accruals will be ploughed back into the business to meet part of
the project cost Investment required for each year is tabulated below
Table 61 Funding ProposalMillion INR FY 10 FY 11 FY 12 FY 13 FY 14
GBT Tower (Additional) Nos 210 700 1400 2450 3850
RTT Tower (Additional) Nos 90 300 600 1050 1650DE ratio 233 233 233 233 233
Additional CAPEX 83892 279374 558748 977809 1536557
Debt 58725 195562 391124 684466 1075590
Equity 25168 83812 167624 293343 460967
63 Results
Based on assumptions given in Annexure 1 a detailed financial model was preparedResults of the financial model such as PampL account Balance Sheet and cash flow
statements are provided in Annexure 2 3 and 4 Forecasts for the key financial figures for
first five years are provided in the Table below
Forecasts
Table 62 Income StatementMillion INR FY-10 FY11 FY12 FY-13 FY-14
Sales 7124 50511 156766 347476 667700
Cost of sales 1950 13852 39252 87612 170021
Gross 5174 36659 117514 259864 497679
7263 7258 7496 7479 7454
Admin costs 112 179 190 203 216
882019 Major Project (Ramit)
httpslidepdfcomreaderfullmajor-project-ramit 4262
33
Finance cost 0 021 7401 31330 77725
Taxation 170 4233 14536 29073 53547
PAT 2454 19458 59470 122096 223267
As shown in Table above during the expansion period revenue will grow exponentially
In the first year of operation ABC will earn a revenue of INR 7124 million from 300
(210 GBT and 90 RTT) sites with a tenancy ratio of 15 for GBS and 17 for RTS In the
first 2 years of operation the company will not pay any interest on long term debt due to
2 years moratorium period Major cost associated with the project is depreciation due to
which PAT is lower than the operating profits But cash flows to the firm are enough to
result in reasonable returns
Table 63 Balance Shee tYear ending Mar-10 Mar-11 Mar-12 Mar-13 Mar-14
AssetsGross Block 75742 328216 833164 1716823 3105430Accumulated depreciation 2439 15208 51125 128287 271212Net Block 73303 313009 782040 1588536 2834219Net Working Capital 064 241 620 1335 2515Cash Balance 12979 72089 216513 488856 947982
Total Assets 86346 385339 999172 2078727 3784715LiabilitiesEquity 25168 108980 276604 569947 1030914Reserves amp Surplus 2454 21912 81381 203477 426745Long term Debt 58725 254286 640722 1304302 2325171WC Borrowings - 161 465 1001 1886Total Liabilities 86346 385339 999172 2078727 3784715
Note All figures are in Million INR
Table 64 Key financial ratiosMar-11 Mar-12 Mar-13 Mar-14 Mar-15
Revenue Growth 60902 21036 12165 9216 3890EBITDA Growth 62061 22161 12132 9158 4020
PAT Growth 69293 20564 10531 8286 2955
As shown in table above increase in EBITDA is higher than that of revenue This is due
to better operational efficiency of ABCrsquos management and economies of scale S imilarly
882019 Major Project (Ramit)
httpslidepdfcomreaderfullmajor-project-ramit 4362
34
increase in PAT is lesser than that of EBITDA because of high depreciation and interest
expenses
Table 65 Pr ofitability r atios
Mar-11 Mar-12 Mar-13 Mar-14 Mar-15
EBITDA Margin 7222 7484 7473 7450 7520
PAT Margin 3852 3794 3514 3344 3119Return on Net Worth 622 760 769 788 1087
Key profitability ratios are shown in table above Return on net worth in the initial years
is lower because of the ambitious expansion plans of ABC Limited Thereafter return on
net worth increases with increase in PAT
Returns on Investment
Table 66 Financial returnsFinancial Indicators
Project IRR 1813Equity IRR 3609
64 Sensitivity Analysis
A sensitivity analysis has been carried out on the project financials to determine theimpact of key variables on the financial indicators namely
Project IRR
The key variables on which sensitivity analysis have been carried out areCapital expenditure for GBS and RTS1st and 2 nd tenant tariff for GBS1st and 2 nd tenant tariff for RTSTenancy Ratio
Similarly sensitivity analysis has been carried out forEquity IRR
The key variables on which sensitivity analysis have been carried out for EIRR are
Capital structure and interest rate for capital debtRepayment period and moratorium period
882019 Major Project (Ramit)
httpslidepdfcomreaderfullmajor-project-ramit 4462
35
The impact on the financial indicators is shown below
Figure 6-1 Project IRR vs GBT and RTT CAPEX
As shown in Figure 6-1 project IRR is more sensitive to change in CAPEX of RTT sitesas compared to change in CAPEX of GBT sites because tenancy ratio and tariff for RTTsites are higher than those of GBT sites
882019 Major Project (Ramit)
httpslidepdfcomreaderfullmajor-project-ramit 4562
36
Figure 6-2 Project IRR vs GBT Tariff for 1 st tenant (X-axis) and 2 nd tenant (right-hand side)
As shown in Figure 6-2 project IRR varies linearly with GBT tariff In the best casescenario when GBT tariff for 1 st tenant is INR 34000month and GBT tariff for secondtenant is INR 26000month Project IRR is 2101
Figure 6-3 Project IRR vs RTT Tariff for 1 st tenant (X-axis) and 2 nd tenant (right-hand side)
As shown in Figure 6-2 project IRR varies linearly with RTT tariff In the best casescenario when RTT tariff for 1 st tenant is INR 24000month and RTT tariff for second
882019 Major Project (Ramit)
httpslidepdfcomreaderfullmajor-project-ramit 4662
37
tenant is INR 20000month Project IRR is 1932 Project IRR is more sensitivetowards RTT tariff than GBT tariff because in practical business situation RTT siteshave a tenancy ratio of more than two due to which effect of tariff for 1 st tenant almostget nullified after few years
Figure 6-4 Project IRR vs Tenancy ratio for RTT sites (X-axis) and GBT sites
As shown in Figure 6-4 project IRR is very sensitive to tenancy ratio In the best casescenario where GBT sites have a tenancy ratio of 2 and RTT sites have a tenancy ratio of 3 project IRR can be as high as 20
Figure 6-5 Equity IRR vs long term debt interest rate for different leverage level
882019 Major Project (Ramit)
httpslidepdfcomreaderfullmajor-project-ramit 4762
38
As shown in figure 6-5 equity IRR is more sensitive to interest rate on long term debt forhigh level of leverage (lower debt equity ratio) because as the debt equity ratio increasesinterest paid on long term debt also increases significantly
Figure 6-6 Equity IRR vs long term debt repayment period at different level of moratoriumperiods
As shown in figure 6-6 Equity IRR increases with increase in moratorium period anddebt repayment period The variation is from 1654 to 60 for worst case and best casescenarios
882019 Major Project (Ramit)
httpslidepdfcomreaderfullmajor-project-ramit 4862
39
7 RISK ASSESSMENTRisk Mitigation strategyExecution Risk
(Project management landacquisition etc)
Management of ABC has proven expertise in
telecom infrastructure rollout and has executedvarious projects with large telecom operators andMNC vendorsABCrsquos top management team consists of a groupof professionals drawn from leading telecomInfrastructure Company who have immenseexpertise and experience in rolling out telecominfrastructure projects
Market Risk (No entry barriers operators may
share infrastructure betweenthemselves large players withhigh capital may increasecompetition)
India has a huge potential for telecominfrastructure market With increasing
competition falling tariffs and pressure onmargins telecom service providers are beingforced to increase their focus on marketing andreduce their expensesExperienced management healthy capital back-up effective presence in the telecominfrastructure market and value added services atrelatively lesser cost will help ABC to meet theset targets
Financing Risk
(Availability of equity capitalavailability of long term debtinterest rate and moratoriumperiod)
ABC is seeking private equity partner to secure
equity capital Company has already entered intoNDA with 2 major investorsLong term debt at an interest rate of 125 canbe easily arranged because of the credibility of the promoters in the marketMany other similar firms like Indus and GTLhave already secured long term debt for amoratorium period of 2 years Promoters of ABCLimited are confident to secure a long term debtwith a moratorium period of 2 years and apayback period of 8 years
ABC Limited would minimize the workingcapital requirements of its business by securingrentals and operating revenues in advance fromits clients and or by suitably structuring itspayment liabilities to match its cash inflows
Commercial Risk (Tenancy ratio and tariff forGBS and RTS)
ABC would aim to enter into long term contractswith the ldquoanchor tenantrdquo operator and thenrollout the infrastructure so that at least single
882019 Major Project (Ramit)
httpslidepdfcomreaderfullmajor-project-ramit 4962
40
occupancy of each site is ensured at all t imesPromoters will use its knowledge of the businessand its expertise to identify and roll out sites inlocations which have strong multi- tenancypotential to minimize occupancy risk
Revenue Risk (Operating fees may decreasecredit worthiness of the clientsdelay in payment of rentals)
As per the industry sources till now not even asingle operator have dishonored the long termlease contractThe credit risk is diversified as there will bemultiple operatorsABC would aggressively market to get 3G andWiFi broadcasters to use the sites and earnadditional revenues in addition to the assumedrevenue streams
Natural Calamities Risk The Company shall maintain insurance for thesites against these risks and the cost of insurancewill be priced in and passed on to the tenants
882019 Major Project (Ramit)
httpslidepdfcomreaderfullmajor-project-ramit 5062
41
8 CONCLUSION
India is the fastest growing wireless telecom market in the world The continuing
growth in the number of wireless subscribers and MoUs and increasing trend of
outsourcing of business processes to India has led to growing demand for large
investments in the telecom infrastructure in the country
However with increasing competition falling tariffs and pressure on margins
telecom service providers are being forced to increase their focus on marketing
customer acquisitions and branding and minimize their efforts and overheads in
project management and asset acquisition
Further with rising prices of steel cement and real estate the cost of developing
and owning passive infrastructure is increasingly becoming a costly proposition
for most operators and service providers
The compulsion on the part of service providers to reduce their operating costs
and capital expenditure requirements has led to opportunities in passiveinfrastructure outsourcing to independent third party infrastructure providers and
also sharing the infrastructure with other service providers It is expected that
cellular operators will outsource their communications site infrastructure needs as
a means of accelerating access to their markets and preserving capital rather than
constructing and operating their own communications sites and maintaining their
own communications sites service and deve lopment capabilities
Passive infrastructure is highly capital intensive and an integral part of the cellular
service providersrsquo networks Yet being a simple and low technology asset it is
amenable to outsourcing and sharing By transferring the responsibility of
ownership development and maintenance of passive infrastructure service
882019 Major Project (Ramit)
httpslidepdfcomreaderfullmajor-project-ramit 5162
42
providers have an opportunity to transfer a substantial part of their business risk to
third parties
Most telecom operators are facing capacity constraints on their networksCoverage obligations increasing pressure to improve network quality and
competition has led to aggressive roll out plans by existing cellular operators
Installation of cell sites has become a cumbersome process as there are a number
of clearances required and involves labor-intensive micro management
Availability of ready infrastructure from third party providers would enable the
operators to reduce their time to market and accelerate their access to their
customers Cellular service providers generally want to move quickly when
adding more sites and co-location on an existing site is always faster than
building
Ownership and maintenance of telecom towers and other infrastructure by third
parties is an established practice in developed nations like USA and is
increasingly gaining market acceptance in India
The Indian government is seriously considering promoting the infrastructure
sharing route between the telecom operator and private players to achieve future
national tele-density targets and improve rural telecom penetration
ABC being an independent entity with no business conflicts with other service
providers in the telecom space will be best positioned and have an early mover
advantage to capitalize on this emerging opportunity
Further the task of operating and maintaining the passive infrastructure in the cell
is increasingly becoming a cumbersome exercise for the service providers to
handle ABCrsquos composite offering to build passive infrastructure for the cellular
operators and also operate and maintain them will provide a turnkey solution to
address the infrastructure needs of the service providers
882019 Major Project (Ramit)
httpslidepdfcomreaderfullmajor-project-ramit 5262
43
The business model proposed to be followed by ABC is fairly simple with stable
and predictable cash flows as is the case with the business model of the tower
renting companies in USA Most contracts are long term for a period 10 or moreyears with annual price escalators generally ranging from 3 to 4 However
wireless carriers normally tend to renew rentals because suitable alternative sites
may not exist or be available and repositioning a site in a carrierrsquos network is
expensive and may adverse ly affect network quality
Site ownership and operations is a ldquoscalerdquo business operating administration
marketing expenses etc do not rise as quickly as revenues when portfolios are
expanded Incremental operating costs associated with adding wireless tenants to
a communications site are minimal Therefore as additional tenants are added to a
site the substantial majority of incremental revenue contributes to margin
expansion Most tower companies have high EBITDA margins as may be seen
from the financial indicators of some of the tower rental companies in USA
It is expected that site location and capacity price and quality of service and
successful execution of contracts will be the most significant competitive factors
in this business
ABCrsquos revenue and returns on investment will be primarily driven by its ability
to
o Increase the utilization of the space and infrastructure capacity owned by it by
increasing the number of tenants per site and renting out to maximum number
of users As discussed above return on capital employed (PIRR and EIRR) arevery sensitive to tenancy ratio In worst case scenario project IRR can be as
low as 8 and in the best case scenario it can be as high as 20
o Develop acquire sites of strategic importance and high growth potential that
will enable them to secure better commercial terms from users and attract
more number of tenants Infrastructure provisioning fees rentals for sites are
882019 Major Project (Ramit)
httpslidepdfcomreaderfullmajor-project-ramit 5362
44
extremely location sensitive There is a potential to acquire more land than
that of required to capitalize on the increase in real estate prices
o Develop sites in a cost effective manner ABC would consider purchasing
land only for those GBS sites which have sufficient demand and arestrategically located Else for most of its sites land will be leasehold As
shown above returns (PIRR and EIRR) are very sensitive to capital costs In
the worst case scenario project IRR can be as low as 15 whereas it can as
high as 27 in the best case scenario
o Negotiate and secure long term contracts with good credit quality users with
built in price escalation provisions to mitigate financing risk
o Leverage and secure long term financing at attractive terms and involve in
active treasury management to keep low financing cost Results of the
sensitivity analysis indicate that equity IRR can be as high as 60 foe a
moratorium period of 4 years and interest rate of 10
o Minimize working capital requirements
o Maintain low operating and administration expense
o Secure better OampM margins from operators and retain a healthy share of it in
ABC
o Maintain high service standards and build strong customer relationships
The business would have the potential to capture new revenue opportunities
around the existing assets As demand for towers is expected to grow and as
operators migrate to speedier next-generation wireless technologies they will
need the towers and associated passive infrastructure to transmit their new
services in addition to their existing offerings In addition to increasing capacity
and coverage and improving the quality of their networks cellular serviceproviders are deploying high speed data networks driving incremental demand of
sites The business therefore has potential upsides in the form of adding
customers (tenants) in wireless broadband third generation (ldquo3Grdquo) and wireless
data capabilities and also other incremental value propositions by way of hosting
882019 Major Project (Ramit)
httpslidepdfcomreaderfullmajor-project-ramit 5462
45
Billboards Hoardings etc in some of the high visible sites owned and maintained
by it
Based on the assumptions and subject to satisfactory resolution of the key risks
factors project cash flows will be able to meet debt service obligations
This business model is a lucrative investment option for a private equity player
because valuation of each site will increase in the coming years due to
improvement in market conditions increase in the value of land and increase in
the demand for passive infrastructure in rural and semi-urban areas
882019 Major Project (Ramit)
httpslidepdfcomreaderfullmajor-project-ramit 5562
46
REFERENCESAnjan G V A amp N M (2009) telecom infrastructure industry in india GurgaonICRA
Bessler W Norsworthy J amp Shusterman T (2001 12 1) Mergers in the UStelecommunications industry and market valuationeffects IEEE p 288
COAI (2009 march 14) Subscriber Figures Retrieved march 14 2009 fromCOAIcom httpwwwcoaicomstatisticsphp
IDA (2009 march 23) Highlights Retrieved march 23 2009 from idagovsghttpwwwidagovsghomeindexaspx
K R (2008) Time for new business model Delhi Cybermedia
MAXIS (2009 march 8) the malaysian telecommunications industry Retrieved march9 2009 from maxiscommyhttpwwwmaxiscommypersonalabout_usinvestorprospectusprospectus4pdf
P J amp Lisa A (2009) Stimulas spending and American Telecom Industry USACoracle group
PwC (2009 march 12) Indian Telecom Industry Gurgaon Harayana IndiaRamachanran (2009 march 1) Investment in Telecom Infrastructure sector (M RInterviewer)
Vogelsang I (2002) The German Telecommunications Reform Verein fuumlr Socialpolitik (p 26) Innsbruck Boston Press
882019 Major Project (Ramit)
httpslidepdfcomreaderfullmajor-project-ramit 5662
47
ANNEXURES
ANNEXURE 1 Key Assumptions
The occupancy of each site by single two three operators for green-field sites is assumed
to be as follows
Table 91 Expected Tenancy RatiosFY 10 FY 11 FY 12 FY 13 FY 14 FY15
GBT Tenant
Ratio 150 150 170 170 170 200
Single Operator 50 50 30 30 30 0
Two Operator 50 50 70 70 70 100
RTT Tenant
Ratio 170 170 200 200 200 250
Single Operator 30 30 0 0 0 0
Two Operator 70 70 100 100 100 50
Three Operator 0 0 0 0 0 50
From FY 15 onwards tenancy ratio of 2 and 25 for GBT and RTT sites is cons idered
882019 Major Project (Ramit)
httpslidepdfcomreaderfullmajor-project-ramit 5762
48
Capital costs related assumptions are tabulated below
Table 92 GBT and RTT Capital Cost
The lease rentals for RTT sites are reimbursed from the operators and therefore have not
been factored in the revenues as well as the expense For GBT sites land purchase cost of
035 millions assumed which has been escalated by 6 annually to determine the
salvage value of assets
GBT Capital Costs
Million
INR
Delivery cost of Ground Based
Tower (GBT)063
Delivery cost of Generator 030
Civil Work 040Shelter 012
Electrical Works 030
Other Equipments (UPS Battery
etc)045
Construction cost 045
Land 035
Contingency amp Financial Charges 035Total cost 335
RTT Capital Costs
Million
INR
Delivery cost of Roof Top
Tower (RTT) 030
Delivery cost of Generator 020
Civil Work 020Shelter 012
Electrical Works 030
Other Equipments (UPS
Battery etc) 030
Construction cost -
Land -
Contingency amp FinancialCharges 008
Total cost 150
882019 Major Project (Ramit)
httpslidepdfcomreaderfullmajor-project-ramit 5862
49
Ope rating costs related assumptions are tabulated below
Table 93 Operating CostsOperating Costs
Security Sentries (INRMonth) 4000
Supervisors (INRMonth) 6000
Cluster Manager One for Fifty Towers (INRMonth) 15000
Annual increase 500
Number of Security Sentries per tower 300
Number of supervisors per tower 010
Number of C luster manager per tower 002
Fixed Expenses
Selling amp Maintenance (INRMonth) 4000000
Annual Escalation 5
Administration overhead (INRMonth) 10000000Annual Escalation 7
AMC Cost of Generator 15 (cost of generator)
Annual Escalation (AMC) 3
For RTT sites security sentries are not required because it will be the responsibility of
the site owner A supervisor will for every 10 sites and a cluster manager for every 50
sites will be required
882019 Major Project (Ramit)
httpslidepdfcomreaderfullmajor-project-ramit 5962
50
Table 94 Long term debtInterest Rate 125 per annum
Moratorium 2 years
Repayment Period 8 years
Tariff related assumptions and date of operations are tabulated below
Table 95 GBT and RTT Tariff Table 96 Life of the projectTariff Plan
Tariff (INRMonth)
No of
operators GBT RTT
1 28000 18000
2 22000 14000
3 0 12000
Annual
increase 3 3
Commercial Operation Date 1-Aug-09
Quarter Ending 30-Sep-09
FY ending COD 31-Mar-10
Project life years 15
End of commercial
operations31-Aug-24
Quarter ending commercial
operations30-Sep-24
FY ending comme rcial
operations31-Mar-25
882019 Major Project (Ramit)
httpslidepdfcomreaderfullmajor-project-ramit 6062
51
Annexure 2 Profit amp Loss accountsTable 97 Profit amp loss account statement
Income Statement (MNINR)Year ending Mar-10 Mar-11 Mar-12 Mar-13 Mar-14 Mar-15
RevenueGBT 406350 28811 89080 197447 379409 527015Operator Fees (GBT) 1411 10004 30678 67998 130664 179664RTT 1209 8575 27269 60443 116146 164264
Operator Fees (RTT) 440 3121 9739 21587 41481 56466Net Revenue 7124 50511 156766 347476 667700 927410
Expenses
VariableSecurity Sentries 1355 9790 28339 64033 125433 158238Supervisors 097 699 2024 4574 8959 11303Cluster Manager 048 350 10 12 2287 4480 5651AMC Cost of Generator 450 3013 7877 16719 31148 54541Sub-total 1950 13852 39252 87612 170021 229734
Fixed
Selling amp Maintenance(INRMonth) 032 050 053 056 058 061
Administration overhead(INRMonth) 080 128 137 147 157 168
Sub-total 112 179 190 203 216 230
EBITDA 5062 36480 117324 259661 497464 697447
Interest on LT loan - - 7341 31200 77479 156198Interest on ST loan - 021 060 130 245 361
EBDT 5062 36459 109923 228331 419739 540888Depreciation 2439 12769 35917 77162 142925 174006
EBT 2624 23691 74006 151169 276814 366881Income Tax 170 4233 14536 29073 53547 77634
PAT 2454 19458 59470 122096 223267 289247
882019 Major Project (Ramit)
httpslidepdfcomreaderfullmajor-project-ramit 6162
52
Annexure 3 Balance sheet
Table 98 B alance sheetsYearend Balance Sheet (MNINR)Year ending Mar-10 Mar-11 Mar-12 Mar-13 Mar-14 Mar-15
AssetsGross Block 75742 328216 833164 1716823 3105430 3105430Accumulated depreciation 2439 15208 51125 128287 271212 445218Net Block 73303 313009 782040 1588536 2834219 2660212Net Working Capital 064 241 620 1335 2515 3707Cash Balance 12979 72089 216513 488856 947982 1294734Total Assets 86346 385339 999172 2078727 3784715 3958653
LiabilitiesEquity 25168 108980 276604 569947 1030914 1030914Reserves amp Surplus 2454 21912 81381 203477 426745 715992Long term Debt 58725 254286 640722 1304302 2325171 2208967WC Borrowings - 161 465 1001 1886 2780Total Liabilities 86346 385339 999172 2078727 3784715 3958653
882019 Major Project (Ramit)
httpslidepdfcomreaderfullmajor-project-ramit 6262
Annexure 4 Cash flow statement
Table 99 Cash flow statements
Year ending Mar-10 Mar-11 Mar-12 Mar-13 Mar-14 Mar-15
InflowsPAT 2454 19458 59470 122096 223267 289247Depreciation 2439 12769 35917 77162 142925 174006Tax adjusted interest - 014 4959 20991 52076 104895Release of WC - - - - - -Salvage Value - - - - - -Sub-Total 4893 32241 100345 220249 418268 568148
OutflowsCapex 75742 252474 504948 883659 1388607 -Change in WorkingCapital 064 177 379 715 1180 1192
Sub-Total 75806 252651 505327 884374 1389787 1192
UFCF (70913) (220410) (404982) (664125) (971519) 566956LFCF (70913) (220424) (409940) (685116) (1023595) 462062
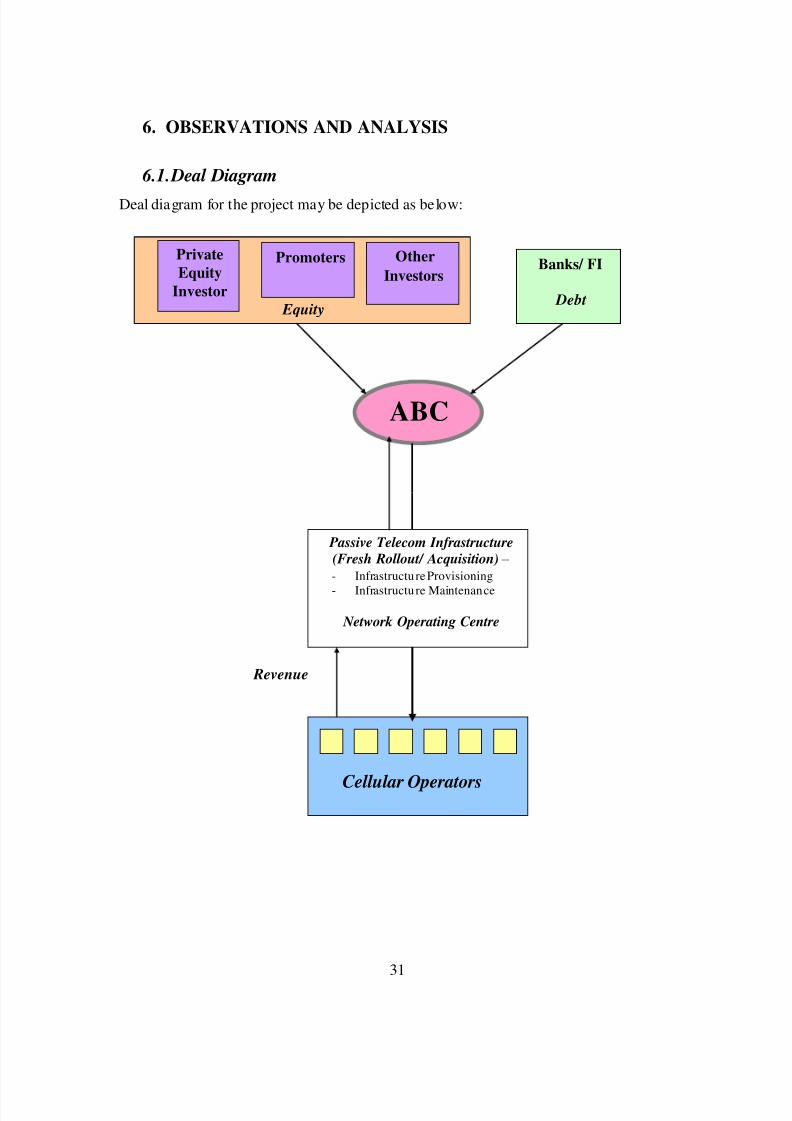
882019 Major Project (Ramit)
httpslidepdfcomreaderfullmajor-project-ramit 4062
882019 Major Project (Ramit)
httpslidepdfcomreaderfullmajor-project-ramit 4162
32
62 Funding planAs the telecom sites are rolled out over a 5 year period till FY 2014 investment will be
required for each year ABC Limited will start generating profits from FY 10 only Such
internally generated cash accruals will be ploughed back into the business to meet part of
the project cost Investment required for each year is tabulated below
Table 61 Funding ProposalMillion INR FY 10 FY 11 FY 12 FY 13 FY 14
GBT Tower (Additional) Nos 210 700 1400 2450 3850
RTT Tower (Additional) Nos 90 300 600 1050 1650DE ratio 233 233 233 233 233
Additional CAPEX 83892 279374 558748 977809 1536557
Debt 58725 195562 391124 684466 1075590
Equity 25168 83812 167624 293343 460967
63 Results
Based on assumptions given in Annexure 1 a detailed financial model was preparedResults of the financial model such as PampL account Balance Sheet and cash flow
statements are provided in Annexure 2 3 and 4 Forecasts for the key financial figures for
first five years are provided in the Table below
Forecasts
Table 62 Income StatementMillion INR FY-10 FY11 FY12 FY-13 FY-14
Sales 7124 50511 156766 347476 667700
Cost of sales 1950 13852 39252 87612 170021
Gross 5174 36659 117514 259864 497679
7263 7258 7496 7479 7454
Admin costs 112 179 190 203 216
882019 Major Project (Ramit)
httpslidepdfcomreaderfullmajor-project-ramit 4262
33
Finance cost 0 021 7401 31330 77725
Taxation 170 4233 14536 29073 53547
PAT 2454 19458 59470 122096 223267
As shown in Table above during the expansion period revenue will grow exponentially
In the first year of operation ABC will earn a revenue of INR 7124 million from 300
(210 GBT and 90 RTT) sites with a tenancy ratio of 15 for GBS and 17 for RTS In the
first 2 years of operation the company will not pay any interest on long term debt due to
2 years moratorium period Major cost associated with the project is depreciation due to
which PAT is lower than the operating profits But cash flows to the firm are enough to
result in reasonable returns
Table 63 Balance Shee tYear ending Mar-10 Mar-11 Mar-12 Mar-13 Mar-14
AssetsGross Block 75742 328216 833164 1716823 3105430Accumulated depreciation 2439 15208 51125 128287 271212Net Block 73303 313009 782040 1588536 2834219Net Working Capital 064 241 620 1335 2515Cash Balance 12979 72089 216513 488856 947982
Total Assets 86346 385339 999172 2078727 3784715LiabilitiesEquity 25168 108980 276604 569947 1030914Reserves amp Surplus 2454 21912 81381 203477 426745Long term Debt 58725 254286 640722 1304302 2325171WC Borrowings - 161 465 1001 1886Total Liabilities 86346 385339 999172 2078727 3784715
Note All figures are in Million INR
Table 64 Key financial ratiosMar-11 Mar-12 Mar-13 Mar-14 Mar-15
Revenue Growth 60902 21036 12165 9216 3890EBITDA Growth 62061 22161 12132 9158 4020
PAT Growth 69293 20564 10531 8286 2955
As shown in table above increase in EBITDA is higher than that of revenue This is due
to better operational efficiency of ABCrsquos management and economies of scale S imilarly
882019 Major Project (Ramit)
httpslidepdfcomreaderfullmajor-project-ramit 4362
34
increase in PAT is lesser than that of EBITDA because of high depreciation and interest
expenses
Table 65 Pr ofitability r atios
Mar-11 Mar-12 Mar-13 Mar-14 Mar-15
EBITDA Margin 7222 7484 7473 7450 7520
PAT Margin 3852 3794 3514 3344 3119Return on Net Worth 622 760 769 788 1087
Key profitability ratios are shown in table above Return on net worth in the initial years
is lower because of the ambitious expansion plans of ABC Limited Thereafter return on
net worth increases with increase in PAT
Returns on Investment
Table 66 Financial returnsFinancial Indicators
Project IRR 1813Equity IRR 3609
64 Sensitivity Analysis
A sensitivity analysis has been carried out on the project financials to determine theimpact of key variables on the financial indicators namely
Project IRR
The key variables on which sensitivity analysis have been carried out areCapital expenditure for GBS and RTS1st and 2 nd tenant tariff for GBS1st and 2 nd tenant tariff for RTSTenancy Ratio
Similarly sensitivity analysis has been carried out forEquity IRR
The key variables on which sensitivity analysis have been carried out for EIRR are
Capital structure and interest rate for capital debtRepayment period and moratorium period
882019 Major Project (Ramit)
httpslidepdfcomreaderfullmajor-project-ramit 4462
35
The impact on the financial indicators is shown below
Figure 6-1 Project IRR vs GBT and RTT CAPEX
As shown in Figure 6-1 project IRR is more sensitive to change in CAPEX of RTT sitesas compared to change in CAPEX of GBT sites because tenancy ratio and tariff for RTTsites are higher than those of GBT sites
882019 Major Project (Ramit)
httpslidepdfcomreaderfullmajor-project-ramit 4562
36
Figure 6-2 Project IRR vs GBT Tariff for 1 st tenant (X-axis) and 2 nd tenant (right-hand side)
As shown in Figure 6-2 project IRR varies linearly with GBT tariff In the best casescenario when GBT tariff for 1 st tenant is INR 34000month and GBT tariff for secondtenant is INR 26000month Project IRR is 2101
Figure 6-3 Project IRR vs RTT Tariff for 1 st tenant (X-axis) and 2 nd tenant (right-hand side)
As shown in Figure 6-2 project IRR varies linearly with RTT tariff In the best casescenario when RTT tariff for 1 st tenant is INR 24000month and RTT tariff for second
882019 Major Project (Ramit)
httpslidepdfcomreaderfullmajor-project-ramit 4662
37
tenant is INR 20000month Project IRR is 1932 Project IRR is more sensitivetowards RTT tariff than GBT tariff because in practical business situation RTT siteshave a tenancy ratio of more than two due to which effect of tariff for 1 st tenant almostget nullified after few years
Figure 6-4 Project IRR vs Tenancy ratio for RTT sites (X-axis) and GBT sites
As shown in Figure 6-4 project IRR is very sensitive to tenancy ratio In the best casescenario where GBT sites have a tenancy ratio of 2 and RTT sites have a tenancy ratio of 3 project IRR can be as high as 20
Figure 6-5 Equity IRR vs long term debt interest rate for different leverage level
882019 Major Project (Ramit)
httpslidepdfcomreaderfullmajor-project-ramit 4762
38
As shown in figure 6-5 equity IRR is more sensitive to interest rate on long term debt forhigh level of leverage (lower debt equity ratio) because as the debt equity ratio increasesinterest paid on long term debt also increases significantly
Figure 6-6 Equity IRR vs long term debt repayment period at different level of moratoriumperiods
As shown in figure 6-6 Equity IRR increases with increase in moratorium period anddebt repayment period The variation is from 1654 to 60 for worst case and best casescenarios
882019 Major Project (Ramit)
httpslidepdfcomreaderfullmajor-project-ramit 4862
39
7 RISK ASSESSMENTRisk Mitigation strategyExecution Risk
(Project management landacquisition etc)
Management of ABC has proven expertise in
telecom infrastructure rollout and has executedvarious projects with large telecom operators andMNC vendorsABCrsquos top management team consists of a groupof professionals drawn from leading telecomInfrastructure Company who have immenseexpertise and experience in rolling out telecominfrastructure projects
Market Risk (No entry barriers operators may
share infrastructure betweenthemselves large players withhigh capital may increasecompetition)
India has a huge potential for telecominfrastructure market With increasing
competition falling tariffs and pressure onmargins telecom service providers are beingforced to increase their focus on marketing andreduce their expensesExperienced management healthy capital back-up effective presence in the telecominfrastructure market and value added services atrelatively lesser cost will help ABC to meet theset targets
Financing Risk
(Availability of equity capitalavailability of long term debtinterest rate and moratoriumperiod)
ABC is seeking private equity partner to secure
equity capital Company has already entered intoNDA with 2 major investorsLong term debt at an interest rate of 125 canbe easily arranged because of the credibility of the promoters in the marketMany other similar firms like Indus and GTLhave already secured long term debt for amoratorium period of 2 years Promoters of ABCLimited are confident to secure a long term debtwith a moratorium period of 2 years and apayback period of 8 years
ABC Limited would minimize the workingcapital requirements of its business by securingrentals and operating revenues in advance fromits clients and or by suitably structuring itspayment liabilities to match its cash inflows
Commercial Risk (Tenancy ratio and tariff forGBS and RTS)
ABC would aim to enter into long term contractswith the ldquoanchor tenantrdquo operator and thenrollout the infrastructure so that at least single
882019 Major Project (Ramit)
httpslidepdfcomreaderfullmajor-project-ramit 4962
40
occupancy of each site is ensured at all t imesPromoters will use its knowledge of the businessand its expertise to identify and roll out sites inlocations which have strong multi- tenancypotential to minimize occupancy risk
Revenue Risk (Operating fees may decreasecredit worthiness of the clientsdelay in payment of rentals)
As per the industry sources till now not even asingle operator have dishonored the long termlease contractThe credit risk is diversified as there will bemultiple operatorsABC would aggressively market to get 3G andWiFi broadcasters to use the sites and earnadditional revenues in addition to the assumedrevenue streams
Natural Calamities Risk The Company shall maintain insurance for thesites against these risks and the cost of insurancewill be priced in and passed on to the tenants
882019 Major Project (Ramit)
httpslidepdfcomreaderfullmajor-project-ramit 5062
41
8 CONCLUSION
India is the fastest growing wireless telecom market in the world The continuing
growth in the number of wireless subscribers and MoUs and increasing trend of
outsourcing of business processes to India has led to growing demand for large
investments in the telecom infrastructure in the country
However with increasing competition falling tariffs and pressure on margins
telecom service providers are being forced to increase their focus on marketing
customer acquisitions and branding and minimize their efforts and overheads in
project management and asset acquisition
Further with rising prices of steel cement and real estate the cost of developing
and owning passive infrastructure is increasingly becoming a costly proposition
for most operators and service providers
The compulsion on the part of service providers to reduce their operating costs
and capital expenditure requirements has led to opportunities in passiveinfrastructure outsourcing to independent third party infrastructure providers and
also sharing the infrastructure with other service providers It is expected that
cellular operators will outsource their communications site infrastructure needs as
a means of accelerating access to their markets and preserving capital rather than
constructing and operating their own communications sites and maintaining their
own communications sites service and deve lopment capabilities
Passive infrastructure is highly capital intensive and an integral part of the cellular
service providersrsquo networks Yet being a simple and low technology asset it is
amenable to outsourcing and sharing By transferring the responsibility of
ownership development and maintenance of passive infrastructure service
882019 Major Project (Ramit)
httpslidepdfcomreaderfullmajor-project-ramit 5162
42
providers have an opportunity to transfer a substantial part of their business risk to
third parties
Most telecom operators are facing capacity constraints on their networksCoverage obligations increasing pressure to improve network quality and
competition has led to aggressive roll out plans by existing cellular operators
Installation of cell sites has become a cumbersome process as there are a number
of clearances required and involves labor-intensive micro management
Availability of ready infrastructure from third party providers would enable the
operators to reduce their time to market and accelerate their access to their
customers Cellular service providers generally want to move quickly when
adding more sites and co-location on an existing site is always faster than
building
Ownership and maintenance of telecom towers and other infrastructure by third
parties is an established practice in developed nations like USA and is
increasingly gaining market acceptance in India
The Indian government is seriously considering promoting the infrastructure
sharing route between the telecom operator and private players to achieve future
national tele-density targets and improve rural telecom penetration
ABC being an independent entity with no business conflicts with other service
providers in the telecom space will be best positioned and have an early mover
advantage to capitalize on this emerging opportunity
Further the task of operating and maintaining the passive infrastructure in the cell
is increasingly becoming a cumbersome exercise for the service providers to
handle ABCrsquos composite offering to build passive infrastructure for the cellular
operators and also operate and maintain them will provide a turnkey solution to
address the infrastructure needs of the service providers
882019 Major Project (Ramit)
httpslidepdfcomreaderfullmajor-project-ramit 5262
43
The business model proposed to be followed by ABC is fairly simple with stable
and predictable cash flows as is the case with the business model of the tower
renting companies in USA Most contracts are long term for a period 10 or moreyears with annual price escalators generally ranging from 3 to 4 However
wireless carriers normally tend to renew rentals because suitable alternative sites
may not exist or be available and repositioning a site in a carrierrsquos network is
expensive and may adverse ly affect network quality
Site ownership and operations is a ldquoscalerdquo business operating administration
marketing expenses etc do not rise as quickly as revenues when portfolios are
expanded Incremental operating costs associated with adding wireless tenants to
a communications site are minimal Therefore as additional tenants are added to a
site the substantial majority of incremental revenue contributes to margin
expansion Most tower companies have high EBITDA margins as may be seen
from the financial indicators of some of the tower rental companies in USA
It is expected that site location and capacity price and quality of service and
successful execution of contracts will be the most significant competitive factors
in this business
ABCrsquos revenue and returns on investment will be primarily driven by its ability
to
o Increase the utilization of the space and infrastructure capacity owned by it by
increasing the number of tenants per site and renting out to maximum number
of users As discussed above return on capital employed (PIRR and EIRR) arevery sensitive to tenancy ratio In worst case scenario project IRR can be as
low as 8 and in the best case scenario it can be as high as 20
o Develop acquire sites of strategic importance and high growth potential that
will enable them to secure better commercial terms from users and attract
more number of tenants Infrastructure provisioning fees rentals for sites are
882019 Major Project (Ramit)
httpslidepdfcomreaderfullmajor-project-ramit 5362
44
extremely location sensitive There is a potential to acquire more land than
that of required to capitalize on the increase in real estate prices
o Develop sites in a cost effective manner ABC would consider purchasing
land only for those GBS sites which have sufficient demand and arestrategically located Else for most of its sites land will be leasehold As
shown above returns (PIRR and EIRR) are very sensitive to capital costs In
the worst case scenario project IRR can be as low as 15 whereas it can as
high as 27 in the best case scenario
o Negotiate and secure long term contracts with good credit quality users with
built in price escalation provisions to mitigate financing risk
o Leverage and secure long term financing at attractive terms and involve in
active treasury management to keep low financing cost Results of the
sensitivity analysis indicate that equity IRR can be as high as 60 foe a
moratorium period of 4 years and interest rate of 10
o Minimize working capital requirements
o Maintain low operating and administration expense
o Secure better OampM margins from operators and retain a healthy share of it in
ABC
o Maintain high service standards and build strong customer relationships
The business would have the potential to capture new revenue opportunities
around the existing assets As demand for towers is expected to grow and as
operators migrate to speedier next-generation wireless technologies they will
need the towers and associated passive infrastructure to transmit their new
services in addition to their existing offerings In addition to increasing capacity
and coverage and improving the quality of their networks cellular serviceproviders are deploying high speed data networks driving incremental demand of
sites The business therefore has potential upsides in the form of adding
customers (tenants) in wireless broadband third generation (ldquo3Grdquo) and wireless
data capabilities and also other incremental value propositions by way of hosting
882019 Major Project (Ramit)
httpslidepdfcomreaderfullmajor-project-ramit 5462
45
Billboards Hoardings etc in some of the high visible sites owned and maintained
by it
Based on the assumptions and subject to satisfactory resolution of the key risks
factors project cash flows will be able to meet debt service obligations
This business model is a lucrative investment option for a private equity player
because valuation of each site will increase in the coming years due to
improvement in market conditions increase in the value of land and increase in
the demand for passive infrastructure in rural and semi-urban areas
882019 Major Project (Ramit)
httpslidepdfcomreaderfullmajor-project-ramit 5562
46
REFERENCESAnjan G V A amp N M (2009) telecom infrastructure industry in india GurgaonICRA
Bessler W Norsworthy J amp Shusterman T (2001 12 1) Mergers in the UStelecommunications industry and market valuationeffects IEEE p 288
COAI (2009 march 14) Subscriber Figures Retrieved march 14 2009 fromCOAIcom httpwwwcoaicomstatisticsphp
IDA (2009 march 23) Highlights Retrieved march 23 2009 from idagovsghttpwwwidagovsghomeindexaspx
K R (2008) Time for new business model Delhi Cybermedia
MAXIS (2009 march 8) the malaysian telecommunications industry Retrieved march9 2009 from maxiscommyhttpwwwmaxiscommypersonalabout_usinvestorprospectusprospectus4pdf
P J amp Lisa A (2009) Stimulas spending and American Telecom Industry USACoracle group
PwC (2009 march 12) Indian Telecom Industry Gurgaon Harayana IndiaRamachanran (2009 march 1) Investment in Telecom Infrastructure sector (M RInterviewer)
Vogelsang I (2002) The German Telecommunications Reform Verein fuumlr Socialpolitik (p 26) Innsbruck Boston Press
882019 Major Project (Ramit)
httpslidepdfcomreaderfullmajor-project-ramit 5662
47
ANNEXURES
ANNEXURE 1 Key Assumptions
The occupancy of each site by single two three operators for green-field sites is assumed
to be as follows
Table 91 Expected Tenancy RatiosFY 10 FY 11 FY 12 FY 13 FY 14 FY15
GBT Tenant
Ratio 150 150 170 170 170 200
Single Operator 50 50 30 30 30 0
Two Operator 50 50 70 70 70 100
RTT Tenant
Ratio 170 170 200 200 200 250
Single Operator 30 30 0 0 0 0
Two Operator 70 70 100 100 100 50
Three Operator 0 0 0 0 0 50
From FY 15 onwards tenancy ratio of 2 and 25 for GBT and RTT sites is cons idered
882019 Major Project (Ramit)
httpslidepdfcomreaderfullmajor-project-ramit 5762
48
Capital costs related assumptions are tabulated below
Table 92 GBT and RTT Capital Cost
The lease rentals for RTT sites are reimbursed from the operators and therefore have not
been factored in the revenues as well as the expense For GBT sites land purchase cost of
035 millions assumed which has been escalated by 6 annually to determine the
salvage value of assets
GBT Capital Costs
Million
INR
Delivery cost of Ground Based
Tower (GBT)063
Delivery cost of Generator 030
Civil Work 040Shelter 012
Electrical Works 030
Other Equipments (UPS Battery
etc)045
Construction cost 045
Land 035
Contingency amp Financial Charges 035Total cost 335
RTT Capital Costs
Million
INR
Delivery cost of Roof Top
Tower (RTT) 030
Delivery cost of Generator 020
Civil Work 020Shelter 012
Electrical Works 030
Other Equipments (UPS
Battery etc) 030
Construction cost -
Land -
Contingency amp FinancialCharges 008
Total cost 150
882019 Major Project (Ramit)
httpslidepdfcomreaderfullmajor-project-ramit 5862
49
Ope rating costs related assumptions are tabulated below
Table 93 Operating CostsOperating Costs
Security Sentries (INRMonth) 4000
Supervisors (INRMonth) 6000
Cluster Manager One for Fifty Towers (INRMonth) 15000
Annual increase 500
Number of Security Sentries per tower 300
Number of supervisors per tower 010
Number of C luster manager per tower 002
Fixed Expenses
Selling amp Maintenance (INRMonth) 4000000
Annual Escalation 5
Administration overhead (INRMonth) 10000000Annual Escalation 7
AMC Cost of Generator 15 (cost of generator)
Annual Escalation (AMC) 3
For RTT sites security sentries are not required because it will be the responsibility of
the site owner A supervisor will for every 10 sites and a cluster manager for every 50
sites will be required
882019 Major Project (Ramit)
httpslidepdfcomreaderfullmajor-project-ramit 5962
50
Table 94 Long term debtInterest Rate 125 per annum
Moratorium 2 years
Repayment Period 8 years
Tariff related assumptions and date of operations are tabulated below
Table 95 GBT and RTT Tariff Table 96 Life of the projectTariff Plan
Tariff (INRMonth)
No of
operators GBT RTT
1 28000 18000
2 22000 14000
3 0 12000
Annual
increase 3 3
Commercial Operation Date 1-Aug-09
Quarter Ending 30-Sep-09
FY ending COD 31-Mar-10
Project life years 15
End of commercial
operations31-Aug-24
Quarter ending commercial
operations30-Sep-24
FY ending comme rcial
operations31-Mar-25
882019 Major Project (Ramit)
httpslidepdfcomreaderfullmajor-project-ramit 6062
51
Annexure 2 Profit amp Loss accountsTable 97 Profit amp loss account statement
Income Statement (MNINR)Year ending Mar-10 Mar-11 Mar-12 Mar-13 Mar-14 Mar-15
RevenueGBT 406350 28811 89080 197447 379409 527015Operator Fees (GBT) 1411 10004 30678 67998 130664 179664RTT 1209 8575 27269 60443 116146 164264
Operator Fees (RTT) 440 3121 9739 21587 41481 56466Net Revenue 7124 50511 156766 347476 667700 927410
Expenses
VariableSecurity Sentries 1355 9790 28339 64033 125433 158238Supervisors 097 699 2024 4574 8959 11303Cluster Manager 048 350 10 12 2287 4480 5651AMC Cost of Generator 450 3013 7877 16719 31148 54541Sub-total 1950 13852 39252 87612 170021 229734
Fixed
Selling amp Maintenance(INRMonth) 032 050 053 056 058 061
Administration overhead(INRMonth) 080 128 137 147 157 168
Sub-total 112 179 190 203 216 230
EBITDA 5062 36480 117324 259661 497464 697447
Interest on LT loan - - 7341 31200 77479 156198Interest on ST loan - 021 060 130 245 361
EBDT 5062 36459 109923 228331 419739 540888Depreciation 2439 12769 35917 77162 142925 174006
EBT 2624 23691 74006 151169 276814 366881Income Tax 170 4233 14536 29073 53547 77634
PAT 2454 19458 59470 122096 223267 289247
882019 Major Project (Ramit)
httpslidepdfcomreaderfullmajor-project-ramit 6162
52
Annexure 3 Balance sheet
Table 98 B alance sheetsYearend Balance Sheet (MNINR)Year ending Mar-10 Mar-11 Mar-12 Mar-13 Mar-14 Mar-15
AssetsGross Block 75742 328216 833164 1716823 3105430 3105430Accumulated depreciation 2439 15208 51125 128287 271212 445218Net Block 73303 313009 782040 1588536 2834219 2660212Net Working Capital 064 241 620 1335 2515 3707Cash Balance 12979 72089 216513 488856 947982 1294734Total Assets 86346 385339 999172 2078727 3784715 3958653
LiabilitiesEquity 25168 108980 276604 569947 1030914 1030914Reserves amp Surplus 2454 21912 81381 203477 426745 715992Long term Debt 58725 254286 640722 1304302 2325171 2208967WC Borrowings - 161 465 1001 1886 2780Total Liabilities 86346 385339 999172 2078727 3784715 3958653
882019 Major Project (Ramit)
httpslidepdfcomreaderfullmajor-project-ramit 6262
Annexure 4 Cash flow statement
Table 99 Cash flow statements
Year ending Mar-10 Mar-11 Mar-12 Mar-13 Mar-14 Mar-15
InflowsPAT 2454 19458 59470 122096 223267 289247Depreciation 2439 12769 35917 77162 142925 174006Tax adjusted interest - 014 4959 20991 52076 104895Release of WC - - - - - -Salvage Value - - - - - -Sub-Total 4893 32241 100345 220249 418268 568148
OutflowsCapex 75742 252474 504948 883659 1388607 -Change in WorkingCapital 064 177 379 715 1180 1192
Sub-Total 75806 252651 505327 884374 1389787 1192
UFCF (70913) (220410) (404982) (664125) (971519) 566956LFCF (70913) (220424) (409940) (685116) (1023595) 462062
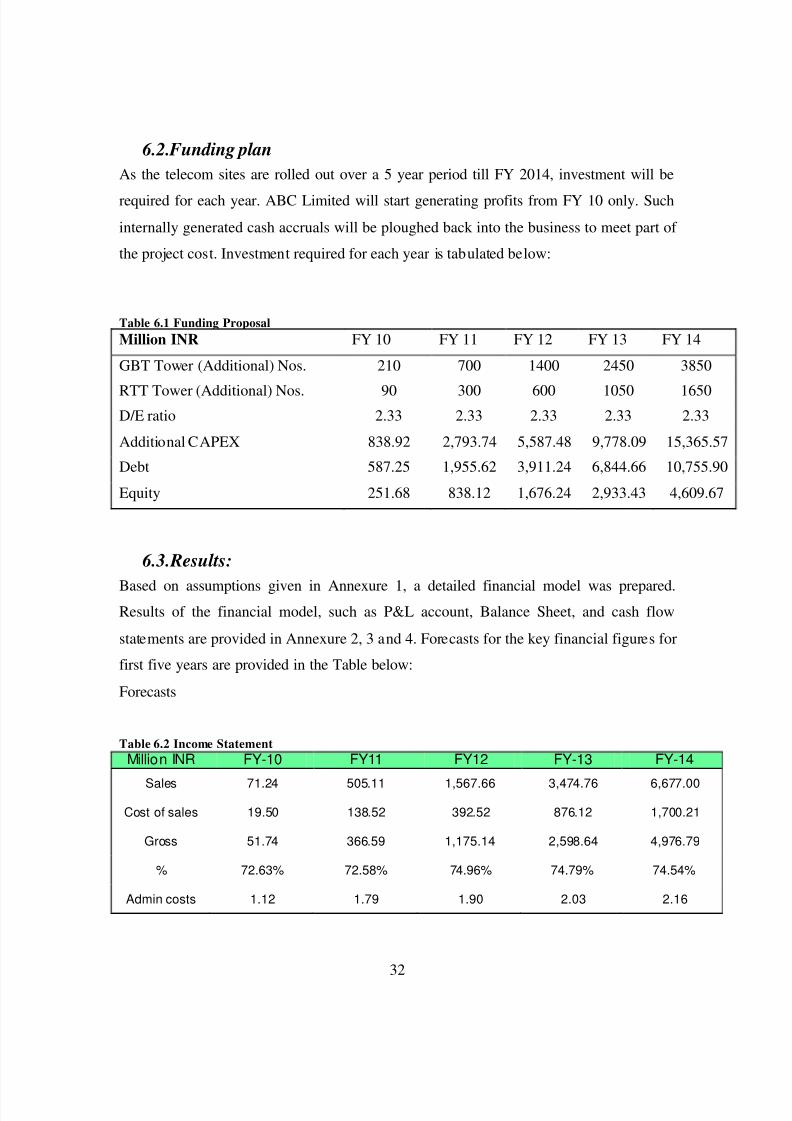
882019 Major Project (Ramit)
httpslidepdfcomreaderfullmajor-project-ramit 4162
32
62 Funding planAs the telecom sites are rolled out over a 5 year period till FY 2014 investment will be
required for each year ABC Limited will start generating profits from FY 10 only Such
internally generated cash accruals will be ploughed back into the business to meet part of
the project cost Investment required for each year is tabulated below
Table 61 Funding ProposalMillion INR FY 10 FY 11 FY 12 FY 13 FY 14
GBT Tower (Additional) Nos 210 700 1400 2450 3850
RTT Tower (Additional) Nos 90 300 600 1050 1650DE ratio 233 233 233 233 233
Additional CAPEX 83892 279374 558748 977809 1536557
Debt 58725 195562 391124 684466 1075590
Equity 25168 83812 167624 293343 460967
63 Results
Based on assumptions given in Annexure 1 a detailed financial model was preparedResults of the financial model such as PampL account Balance Sheet and cash flow
statements are provided in Annexure 2 3 and 4 Forecasts for the key financial figures for
first five years are provided in the Table below
Forecasts
Table 62 Income StatementMillion INR FY-10 FY11 FY12 FY-13 FY-14
Sales 7124 50511 156766 347476 667700
Cost of sales 1950 13852 39252 87612 170021
Gross 5174 36659 117514 259864 497679
7263 7258 7496 7479 7454
Admin costs 112 179 190 203 216
882019 Major Project (Ramit)
httpslidepdfcomreaderfullmajor-project-ramit 4262
33
Finance cost 0 021 7401 31330 77725
Taxation 170 4233 14536 29073 53547
PAT 2454 19458 59470 122096 223267
As shown in Table above during the expansion period revenue will grow exponentially
In the first year of operation ABC will earn a revenue of INR 7124 million from 300
(210 GBT and 90 RTT) sites with a tenancy ratio of 15 for GBS and 17 for RTS In the
first 2 years of operation the company will not pay any interest on long term debt due to
2 years moratorium period Major cost associated with the project is depreciation due to
which PAT is lower than the operating profits But cash flows to the firm are enough to
result in reasonable returns
Table 63 Balance Shee tYear ending Mar-10 Mar-11 Mar-12 Mar-13 Mar-14
AssetsGross Block 75742 328216 833164 1716823 3105430Accumulated depreciation 2439 15208 51125 128287 271212Net Block 73303 313009 782040 1588536 2834219Net Working Capital 064 241 620 1335 2515Cash Balance 12979 72089 216513 488856 947982
Total Assets 86346 385339 999172 2078727 3784715LiabilitiesEquity 25168 108980 276604 569947 1030914Reserves amp Surplus 2454 21912 81381 203477 426745Long term Debt 58725 254286 640722 1304302 2325171WC Borrowings - 161 465 1001 1886Total Liabilities 86346 385339 999172 2078727 3784715
Note All figures are in Million INR
Table 64 Key financial ratiosMar-11 Mar-12 Mar-13 Mar-14 Mar-15
Revenue Growth 60902 21036 12165 9216 3890EBITDA Growth 62061 22161 12132 9158 4020
PAT Growth 69293 20564 10531 8286 2955
As shown in table above increase in EBITDA is higher than that of revenue This is due
to better operational efficiency of ABCrsquos management and economies of scale S imilarly
882019 Major Project (Ramit)
httpslidepdfcomreaderfullmajor-project-ramit 4362
34
increase in PAT is lesser than that of EBITDA because of high depreciation and interest
expenses
Table 65 Pr ofitability r atios
Mar-11 Mar-12 Mar-13 Mar-14 Mar-15
EBITDA Margin 7222 7484 7473 7450 7520
PAT Margin 3852 3794 3514 3344 3119Return on Net Worth 622 760 769 788 1087
Key profitability ratios are shown in table above Return on net worth in the initial years
is lower because of the ambitious expansion plans of ABC Limited Thereafter return on
net worth increases with increase in PAT
Returns on Investment
Table 66 Financial returnsFinancial Indicators
Project IRR 1813Equity IRR 3609
64 Sensitivity Analysis
A sensitivity analysis has been carried out on the project financials to determine theimpact of key variables on the financial indicators namely
Project IRR
The key variables on which sensitivity analysis have been carried out areCapital expenditure for GBS and RTS1st and 2 nd tenant tariff for GBS1st and 2 nd tenant tariff for RTSTenancy Ratio
Similarly sensitivity analysis has been carried out forEquity IRR
The key variables on which sensitivity analysis have been carried out for EIRR are
Capital structure and interest rate for capital debtRepayment period and moratorium period
882019 Major Project (Ramit)
httpslidepdfcomreaderfullmajor-project-ramit 4462
35
The impact on the financial indicators is shown below
Figure 6-1 Project IRR vs GBT and RTT CAPEX
As shown in Figure 6-1 project IRR is more sensitive to change in CAPEX of RTT sitesas compared to change in CAPEX of GBT sites because tenancy ratio and tariff for RTTsites are higher than those of GBT sites
882019 Major Project (Ramit)
httpslidepdfcomreaderfullmajor-project-ramit 4562
36
Figure 6-2 Project IRR vs GBT Tariff for 1 st tenant (X-axis) and 2 nd tenant (right-hand side)
As shown in Figure 6-2 project IRR varies linearly with GBT tariff In the best casescenario when GBT tariff for 1 st tenant is INR 34000month and GBT tariff for secondtenant is INR 26000month Project IRR is 2101
Figure 6-3 Project IRR vs RTT Tariff for 1 st tenant (X-axis) and 2 nd tenant (right-hand side)
As shown in Figure 6-2 project IRR varies linearly with RTT tariff In the best casescenario when RTT tariff for 1 st tenant is INR 24000month and RTT tariff for second
882019 Major Project (Ramit)
httpslidepdfcomreaderfullmajor-project-ramit 4662
37
tenant is INR 20000month Project IRR is 1932 Project IRR is more sensitivetowards RTT tariff than GBT tariff because in practical business situation RTT siteshave a tenancy ratio of more than two due to which effect of tariff for 1 st tenant almostget nullified after few years
Figure 6-4 Project IRR vs Tenancy ratio for RTT sites (X-axis) and GBT sites
As shown in Figure 6-4 project IRR is very sensitive to tenancy ratio In the best casescenario where GBT sites have a tenancy ratio of 2 and RTT sites have a tenancy ratio of 3 project IRR can be as high as 20
Figure 6-5 Equity IRR vs long term debt interest rate for different leverage level
882019 Major Project (Ramit)
httpslidepdfcomreaderfullmajor-project-ramit 4762
38
As shown in figure 6-5 equity IRR is more sensitive to interest rate on long term debt forhigh level of leverage (lower debt equity ratio) because as the debt equity ratio increasesinterest paid on long term debt also increases significantly
Figure 6-6 Equity IRR vs long term debt repayment period at different level of moratoriumperiods
As shown in figure 6-6 Equity IRR increases with increase in moratorium period anddebt repayment period The variation is from 1654 to 60 for worst case and best casescenarios
882019 Major Project (Ramit)
httpslidepdfcomreaderfullmajor-project-ramit 4862
39
7 RISK ASSESSMENTRisk Mitigation strategyExecution Risk
(Project management landacquisition etc)
Management of ABC has proven expertise in
telecom infrastructure rollout and has executedvarious projects with large telecom operators andMNC vendorsABCrsquos top management team consists of a groupof professionals drawn from leading telecomInfrastructure Company who have immenseexpertise and experience in rolling out telecominfrastructure projects
Market Risk (No entry barriers operators may
share infrastructure betweenthemselves large players withhigh capital may increasecompetition)
India has a huge potential for telecominfrastructure market With increasing
competition falling tariffs and pressure onmargins telecom service providers are beingforced to increase their focus on marketing andreduce their expensesExperienced management healthy capital back-up effective presence in the telecominfrastructure market and value added services atrelatively lesser cost will help ABC to meet theset targets
Financing Risk
(Availability of equity capitalavailability of long term debtinterest rate and moratoriumperiod)
ABC is seeking private equity partner to secure
equity capital Company has already entered intoNDA with 2 major investorsLong term debt at an interest rate of 125 canbe easily arranged because of the credibility of the promoters in the marketMany other similar firms like Indus and GTLhave already secured long term debt for amoratorium period of 2 years Promoters of ABCLimited are confident to secure a long term debtwith a moratorium period of 2 years and apayback period of 8 years
ABC Limited would minimize the workingcapital requirements of its business by securingrentals and operating revenues in advance fromits clients and or by suitably structuring itspayment liabilities to match its cash inflows
Commercial Risk (Tenancy ratio and tariff forGBS and RTS)
ABC would aim to enter into long term contractswith the ldquoanchor tenantrdquo operator and thenrollout the infrastructure so that at least single
882019 Major Project (Ramit)
httpslidepdfcomreaderfullmajor-project-ramit 4962
40
occupancy of each site is ensured at all t imesPromoters will use its knowledge of the businessand its expertise to identify and roll out sites inlocations which have strong multi- tenancypotential to minimize occupancy risk
Revenue Risk (Operating fees may decreasecredit worthiness of the clientsdelay in payment of rentals)
As per the industry sources till now not even asingle operator have dishonored the long termlease contractThe credit risk is diversified as there will bemultiple operatorsABC would aggressively market to get 3G andWiFi broadcasters to use the sites and earnadditional revenues in addition to the assumedrevenue streams
Natural Calamities Risk The Company shall maintain insurance for thesites against these risks and the cost of insurancewill be priced in and passed on to the tenants
882019 Major Project (Ramit)
httpslidepdfcomreaderfullmajor-project-ramit 5062
41
8 CONCLUSION
India is the fastest growing wireless telecom market in the world The continuing
growth in the number of wireless subscribers and MoUs and increasing trend of
outsourcing of business processes to India has led to growing demand for large
investments in the telecom infrastructure in the country
However with increasing competition falling tariffs and pressure on margins
telecom service providers are being forced to increase their focus on marketing
customer acquisitions and branding and minimize their efforts and overheads in
project management and asset acquisition
Further with rising prices of steel cement and real estate the cost of developing
and owning passive infrastructure is increasingly becoming a costly proposition
for most operators and service providers
The compulsion on the part of service providers to reduce their operating costs
and capital expenditure requirements has led to opportunities in passiveinfrastructure outsourcing to independent third party infrastructure providers and
also sharing the infrastructure with other service providers It is expected that
cellular operators will outsource their communications site infrastructure needs as
a means of accelerating access to their markets and preserving capital rather than
constructing and operating their own communications sites and maintaining their
own communications sites service and deve lopment capabilities
Passive infrastructure is highly capital intensive and an integral part of the cellular
service providersrsquo networks Yet being a simple and low technology asset it is
amenable to outsourcing and sharing By transferring the responsibility of
ownership development and maintenance of passive infrastructure service
882019 Major Project (Ramit)
httpslidepdfcomreaderfullmajor-project-ramit 5162
42
providers have an opportunity to transfer a substantial part of their business risk to
third parties
Most telecom operators are facing capacity constraints on their networksCoverage obligations increasing pressure to improve network quality and
competition has led to aggressive roll out plans by existing cellular operators
Installation of cell sites has become a cumbersome process as there are a number
of clearances required and involves labor-intensive micro management
Availability of ready infrastructure from third party providers would enable the
operators to reduce their time to market and accelerate their access to their
customers Cellular service providers generally want to move quickly when
adding more sites and co-location on an existing site is always faster than
building
Ownership and maintenance of telecom towers and other infrastructure by third
parties is an established practice in developed nations like USA and is
increasingly gaining market acceptance in India
The Indian government is seriously considering promoting the infrastructure
sharing route between the telecom operator and private players to achieve future
national tele-density targets and improve rural telecom penetration
ABC being an independent entity with no business conflicts with other service
providers in the telecom space will be best positioned and have an early mover
advantage to capitalize on this emerging opportunity
Further the task of operating and maintaining the passive infrastructure in the cell
is increasingly becoming a cumbersome exercise for the service providers to
handle ABCrsquos composite offering to build passive infrastructure for the cellular
operators and also operate and maintain them will provide a turnkey solution to
address the infrastructure needs of the service providers
882019 Major Project (Ramit)
httpslidepdfcomreaderfullmajor-project-ramit 5262
43
The business model proposed to be followed by ABC is fairly simple with stable
and predictable cash flows as is the case with the business model of the tower
renting companies in USA Most contracts are long term for a period 10 or moreyears with annual price escalators generally ranging from 3 to 4 However
wireless carriers normally tend to renew rentals because suitable alternative sites
may not exist or be available and repositioning a site in a carrierrsquos network is
expensive and may adverse ly affect network quality
Site ownership and operations is a ldquoscalerdquo business operating administration
marketing expenses etc do not rise as quickly as revenues when portfolios are
expanded Incremental operating costs associated with adding wireless tenants to
a communications site are minimal Therefore as additional tenants are added to a
site the substantial majority of incremental revenue contributes to margin
expansion Most tower companies have high EBITDA margins as may be seen
from the financial indicators of some of the tower rental companies in USA
It is expected that site location and capacity price and quality of service and
successful execution of contracts will be the most significant competitive factors
in this business
ABCrsquos revenue and returns on investment will be primarily driven by its ability
to
o Increase the utilization of the space and infrastructure capacity owned by it by
increasing the number of tenants per site and renting out to maximum number
of users As discussed above return on capital employed (PIRR and EIRR) arevery sensitive to tenancy ratio In worst case scenario project IRR can be as
low as 8 and in the best case scenario it can be as high as 20
o Develop acquire sites of strategic importance and high growth potential that
will enable them to secure better commercial terms from users and attract
more number of tenants Infrastructure provisioning fees rentals for sites are
882019 Major Project (Ramit)
httpslidepdfcomreaderfullmajor-project-ramit 5362
44
extremely location sensitive There is a potential to acquire more land than
that of required to capitalize on the increase in real estate prices
o Develop sites in a cost effective manner ABC would consider purchasing
land only for those GBS sites which have sufficient demand and arestrategically located Else for most of its sites land will be leasehold As
shown above returns (PIRR and EIRR) are very sensitive to capital costs In
the worst case scenario project IRR can be as low as 15 whereas it can as
high as 27 in the best case scenario
o Negotiate and secure long term contracts with good credit quality users with
built in price escalation provisions to mitigate financing risk
o Leverage and secure long term financing at attractive terms and involve in
active treasury management to keep low financing cost Results of the
sensitivity analysis indicate that equity IRR can be as high as 60 foe a
moratorium period of 4 years and interest rate of 10
o Minimize working capital requirements
o Maintain low operating and administration expense
o Secure better OampM margins from operators and retain a healthy share of it in
ABC
o Maintain high service standards and build strong customer relationships
The business would have the potential to capture new revenue opportunities
around the existing assets As demand for towers is expected to grow and as
operators migrate to speedier next-generation wireless technologies they will
need the towers and associated passive infrastructure to transmit their new
services in addition to their existing offerings In addition to increasing capacity
and coverage and improving the quality of their networks cellular serviceproviders are deploying high speed data networks driving incremental demand of
sites The business therefore has potential upsides in the form of adding
customers (tenants) in wireless broadband third generation (ldquo3Grdquo) and wireless
data capabilities and also other incremental value propositions by way of hosting
882019 Major Project (Ramit)
httpslidepdfcomreaderfullmajor-project-ramit 5462
45
Billboards Hoardings etc in some of the high visible sites owned and maintained
by it
Based on the assumptions and subject to satisfactory resolution of the key risks
factors project cash flows will be able to meet debt service obligations
This business model is a lucrative investment option for a private equity player
because valuation of each site will increase in the coming years due to
improvement in market conditions increase in the value of land and increase in
the demand for passive infrastructure in rural and semi-urban areas
882019 Major Project (Ramit)
httpslidepdfcomreaderfullmajor-project-ramit 5562
46
REFERENCESAnjan G V A amp N M (2009) telecom infrastructure industry in india GurgaonICRA
Bessler W Norsworthy J amp Shusterman T (2001 12 1) Mergers in the UStelecommunications industry and market valuationeffects IEEE p 288
COAI (2009 march 14) Subscriber Figures Retrieved march 14 2009 fromCOAIcom httpwwwcoaicomstatisticsphp
IDA (2009 march 23) Highlights Retrieved march 23 2009 from idagovsghttpwwwidagovsghomeindexaspx
K R (2008) Time for new business model Delhi Cybermedia
MAXIS (2009 march 8) the malaysian telecommunications industry Retrieved march9 2009 from maxiscommyhttpwwwmaxiscommypersonalabout_usinvestorprospectusprospectus4pdf
P J amp Lisa A (2009) Stimulas spending and American Telecom Industry USACoracle group
PwC (2009 march 12) Indian Telecom Industry Gurgaon Harayana IndiaRamachanran (2009 march 1) Investment in Telecom Infrastructure sector (M RInterviewer)
Vogelsang I (2002) The German Telecommunications Reform Verein fuumlr Socialpolitik (p 26) Innsbruck Boston Press
882019 Major Project (Ramit)
httpslidepdfcomreaderfullmajor-project-ramit 5662
47
ANNEXURES
ANNEXURE 1 Key Assumptions
The occupancy of each site by single two three operators for green-field sites is assumed
to be as follows
Table 91 Expected Tenancy RatiosFY 10 FY 11 FY 12 FY 13 FY 14 FY15
GBT Tenant
Ratio 150 150 170 170 170 200
Single Operator 50 50 30 30 30 0
Two Operator 50 50 70 70 70 100
RTT Tenant
Ratio 170 170 200 200 200 250
Single Operator 30 30 0 0 0 0
Two Operator 70 70 100 100 100 50
Three Operator 0 0 0 0 0 50
From FY 15 onwards tenancy ratio of 2 and 25 for GBT and RTT sites is cons idered
882019 Major Project (Ramit)
httpslidepdfcomreaderfullmajor-project-ramit 5762
48
Capital costs related assumptions are tabulated below
Table 92 GBT and RTT Capital Cost
The lease rentals for RTT sites are reimbursed from the operators and therefore have not
been factored in the revenues as well as the expense For GBT sites land purchase cost of
035 millions assumed which has been escalated by 6 annually to determine the
salvage value of assets
GBT Capital Costs
Million
INR
Delivery cost of Ground Based
Tower (GBT)063
Delivery cost of Generator 030
Civil Work 040Shelter 012
Electrical Works 030
Other Equipments (UPS Battery
etc)045
Construction cost 045
Land 035
Contingency amp Financial Charges 035Total cost 335
RTT Capital Costs
Million
INR
Delivery cost of Roof Top
Tower (RTT) 030
Delivery cost of Generator 020
Civil Work 020Shelter 012
Electrical Works 030
Other Equipments (UPS
Battery etc) 030
Construction cost -
Land -
Contingency amp FinancialCharges 008
Total cost 150
882019 Major Project (Ramit)
httpslidepdfcomreaderfullmajor-project-ramit 5862
49
Ope rating costs related assumptions are tabulated below
Table 93 Operating CostsOperating Costs
Security Sentries (INRMonth) 4000
Supervisors (INRMonth) 6000
Cluster Manager One for Fifty Towers (INRMonth) 15000
Annual increase 500
Number of Security Sentries per tower 300
Number of supervisors per tower 010
Number of C luster manager per tower 002
Fixed Expenses
Selling amp Maintenance (INRMonth) 4000000
Annual Escalation 5
Administration overhead (INRMonth) 10000000Annual Escalation 7
AMC Cost of Generator 15 (cost of generator)
Annual Escalation (AMC) 3
For RTT sites security sentries are not required because it will be the responsibility of
the site owner A supervisor will for every 10 sites and a cluster manager for every 50
sites will be required
882019 Major Project (Ramit)
httpslidepdfcomreaderfullmajor-project-ramit 5962
50
Table 94 Long term debtInterest Rate 125 per annum
Moratorium 2 years
Repayment Period 8 years
Tariff related assumptions and date of operations are tabulated below
Table 95 GBT and RTT Tariff Table 96 Life of the projectTariff Plan
Tariff (INRMonth)
No of
operators GBT RTT
1 28000 18000
2 22000 14000
3 0 12000
Annual
increase 3 3
Commercial Operation Date 1-Aug-09
Quarter Ending 30-Sep-09
FY ending COD 31-Mar-10
Project life years 15
End of commercial
operations31-Aug-24
Quarter ending commercial
operations30-Sep-24
FY ending comme rcial
operations31-Mar-25
882019 Major Project (Ramit)
httpslidepdfcomreaderfullmajor-project-ramit 6062
51
Annexure 2 Profit amp Loss accountsTable 97 Profit amp loss account statement
Income Statement (MNINR)Year ending Mar-10 Mar-11 Mar-12 Mar-13 Mar-14 Mar-15
RevenueGBT 406350 28811 89080 197447 379409 527015Operator Fees (GBT) 1411 10004 30678 67998 130664 179664RTT 1209 8575 27269 60443 116146 164264
Operator Fees (RTT) 440 3121 9739 21587 41481 56466Net Revenue 7124 50511 156766 347476 667700 927410
Expenses
VariableSecurity Sentries 1355 9790 28339 64033 125433 158238Supervisors 097 699 2024 4574 8959 11303Cluster Manager 048 350 10 12 2287 4480 5651AMC Cost of Generator 450 3013 7877 16719 31148 54541Sub-total 1950 13852 39252 87612 170021 229734
Fixed
Selling amp Maintenance(INRMonth) 032 050 053 056 058 061
Administration overhead(INRMonth) 080 128 137 147 157 168
Sub-total 112 179 190 203 216 230
EBITDA 5062 36480 117324 259661 497464 697447
Interest on LT loan - - 7341 31200 77479 156198Interest on ST loan - 021 060 130 245 361
EBDT 5062 36459 109923 228331 419739 540888Depreciation 2439 12769 35917 77162 142925 174006
EBT 2624 23691 74006 151169 276814 366881Income Tax 170 4233 14536 29073 53547 77634
PAT 2454 19458 59470 122096 223267 289247
882019 Major Project (Ramit)
httpslidepdfcomreaderfullmajor-project-ramit 6162
52
Annexure 3 Balance sheet
Table 98 B alance sheetsYearend Balance Sheet (MNINR)Year ending Mar-10 Mar-11 Mar-12 Mar-13 Mar-14 Mar-15
AssetsGross Block 75742 328216 833164 1716823 3105430 3105430Accumulated depreciation 2439 15208 51125 128287 271212 445218Net Block 73303 313009 782040 1588536 2834219 2660212Net Working Capital 064 241 620 1335 2515 3707Cash Balance 12979 72089 216513 488856 947982 1294734Total Assets 86346 385339 999172 2078727 3784715 3958653
LiabilitiesEquity 25168 108980 276604 569947 1030914 1030914Reserves amp Surplus 2454 21912 81381 203477 426745 715992Long term Debt 58725 254286 640722 1304302 2325171 2208967WC Borrowings - 161 465 1001 1886 2780Total Liabilities 86346 385339 999172 2078727 3784715 3958653
882019 Major Project (Ramit)
httpslidepdfcomreaderfullmajor-project-ramit 6262
Annexure 4 Cash flow statement
Table 99 Cash flow statements
Year ending Mar-10 Mar-11 Mar-12 Mar-13 Mar-14 Mar-15
InflowsPAT 2454 19458 59470 122096 223267 289247Depreciation 2439 12769 35917 77162 142925 174006Tax adjusted interest - 014 4959 20991 52076 104895Release of WC - - - - - -Salvage Value - - - - - -Sub-Total 4893 32241 100345 220249 418268 568148
OutflowsCapex 75742 252474 504948 883659 1388607 -Change in WorkingCapital 064 177 379 715 1180 1192
Sub-Total 75806 252651 505327 884374 1389787 1192
UFCF (70913) (220410) (404982) (664125) (971519) 566956LFCF (70913) (220424) (409940) (685116) (1023595) 462062
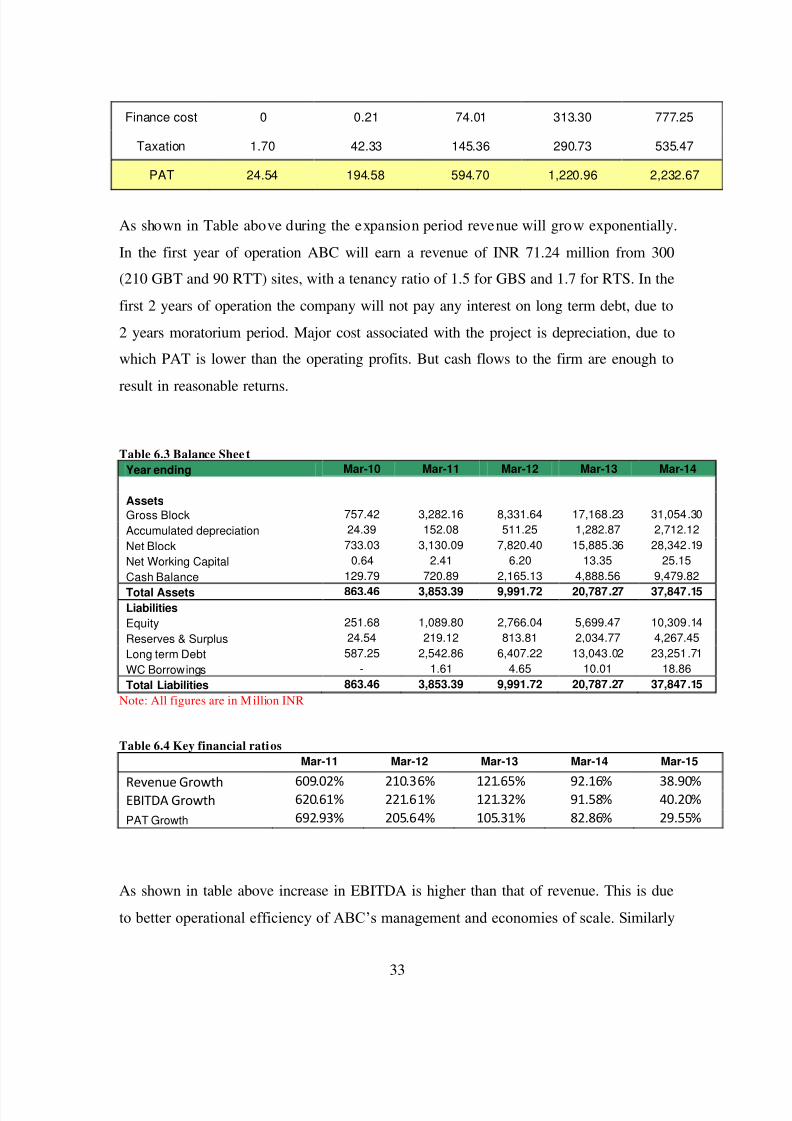
882019 Major Project (Ramit)
httpslidepdfcomreaderfullmajor-project-ramit 4262
33
Finance cost 0 021 7401 31330 77725
Taxation 170 4233 14536 29073 53547
PAT 2454 19458 59470 122096 223267
As shown in Table above during the expansion period revenue will grow exponentially
In the first year of operation ABC will earn a revenue of INR 7124 million from 300
(210 GBT and 90 RTT) sites with a tenancy ratio of 15 for GBS and 17 for RTS In the
first 2 years of operation the company will not pay any interest on long term debt due to
2 years moratorium period Major cost associated with the project is depreciation due to
which PAT is lower than the operating profits But cash flows to the firm are enough to
result in reasonable returns
Table 63 Balance Shee tYear ending Mar-10 Mar-11 Mar-12 Mar-13 Mar-14
AssetsGross Block 75742 328216 833164 1716823 3105430Accumulated depreciation 2439 15208 51125 128287 271212Net Block 73303 313009 782040 1588536 2834219Net Working Capital 064 241 620 1335 2515Cash Balance 12979 72089 216513 488856 947982
Total Assets 86346 385339 999172 2078727 3784715LiabilitiesEquity 25168 108980 276604 569947 1030914Reserves amp Surplus 2454 21912 81381 203477 426745Long term Debt 58725 254286 640722 1304302 2325171WC Borrowings - 161 465 1001 1886Total Liabilities 86346 385339 999172 2078727 3784715
Note All figures are in Million INR
Table 64 Key financial ratiosMar-11 Mar-12 Mar-13 Mar-14 Mar-15
Revenue Growth 60902 21036 12165 9216 3890EBITDA Growth 62061 22161 12132 9158 4020
PAT Growth 69293 20564 10531 8286 2955
As shown in table above increase in EBITDA is higher than that of revenue This is due
to better operational efficiency of ABCrsquos management and economies of scale S imilarly
882019 Major Project (Ramit)
httpslidepdfcomreaderfullmajor-project-ramit 4362
34
increase in PAT is lesser than that of EBITDA because of high depreciation and interest
expenses
Table 65 Pr ofitability r atios
Mar-11 Mar-12 Mar-13 Mar-14 Mar-15
EBITDA Margin 7222 7484 7473 7450 7520
PAT Margin 3852 3794 3514 3344 3119Return on Net Worth 622 760 769 788 1087
Key profitability ratios are shown in table above Return on net worth in the initial years
is lower because of the ambitious expansion plans of ABC Limited Thereafter return on
net worth increases with increase in PAT
Returns on Investment
Table 66 Financial returnsFinancial Indicators
Project IRR 1813Equity IRR 3609
64 Sensitivity Analysis
A sensitivity analysis has been carried out on the project financials to determine theimpact of key variables on the financial indicators namely
Project IRR
The key variables on which sensitivity analysis have been carried out areCapital expenditure for GBS and RTS1st and 2 nd tenant tariff for GBS1st and 2 nd tenant tariff for RTSTenancy Ratio
Similarly sensitivity analysis has been carried out forEquity IRR
The key variables on which sensitivity analysis have been carried out for EIRR are
Capital structure and interest rate for capital debtRepayment period and moratorium period
882019 Major Project (Ramit)
httpslidepdfcomreaderfullmajor-project-ramit 4462
35
The impact on the financial indicators is shown below
Figure 6-1 Project IRR vs GBT and RTT CAPEX
As shown in Figure 6-1 project IRR is more sensitive to change in CAPEX of RTT sitesas compared to change in CAPEX of GBT sites because tenancy ratio and tariff for RTTsites are higher than those of GBT sites
882019 Major Project (Ramit)
httpslidepdfcomreaderfullmajor-project-ramit 4562
36
Figure 6-2 Project IRR vs GBT Tariff for 1 st tenant (X-axis) and 2 nd tenant (right-hand side)
As shown in Figure 6-2 project IRR varies linearly with GBT tariff In the best casescenario when GBT tariff for 1 st tenant is INR 34000month and GBT tariff for secondtenant is INR 26000month Project IRR is 2101
Figure 6-3 Project IRR vs RTT Tariff for 1 st tenant (X-axis) and 2 nd tenant (right-hand side)
As shown in Figure 6-2 project IRR varies linearly with RTT tariff In the best casescenario when RTT tariff for 1 st tenant is INR 24000month and RTT tariff for second
882019 Major Project (Ramit)
httpslidepdfcomreaderfullmajor-project-ramit 4662
37
tenant is INR 20000month Project IRR is 1932 Project IRR is more sensitivetowards RTT tariff than GBT tariff because in practical business situation RTT siteshave a tenancy ratio of more than two due to which effect of tariff for 1 st tenant almostget nullified after few years
Figure 6-4 Project IRR vs Tenancy ratio for RTT sites (X-axis) and GBT sites
As shown in Figure 6-4 project IRR is very sensitive to tenancy ratio In the best casescenario where GBT sites have a tenancy ratio of 2 and RTT sites have a tenancy ratio of 3 project IRR can be as high as 20
Figure 6-5 Equity IRR vs long term debt interest rate for different leverage level
882019 Major Project (Ramit)
httpslidepdfcomreaderfullmajor-project-ramit 4762
38
As shown in figure 6-5 equity IRR is more sensitive to interest rate on long term debt forhigh level of leverage (lower debt equity ratio) because as the debt equity ratio increasesinterest paid on long term debt also increases significantly
Figure 6-6 Equity IRR vs long term debt repayment period at different level of moratoriumperiods
As shown in figure 6-6 Equity IRR increases with increase in moratorium period anddebt repayment period The variation is from 1654 to 60 for worst case and best casescenarios
882019 Major Project (Ramit)
httpslidepdfcomreaderfullmajor-project-ramit 4862
39
7 RISK ASSESSMENTRisk Mitigation strategyExecution Risk
(Project management landacquisition etc)
Management of ABC has proven expertise in
telecom infrastructure rollout and has executedvarious projects with large telecom operators andMNC vendorsABCrsquos top management team consists of a groupof professionals drawn from leading telecomInfrastructure Company who have immenseexpertise and experience in rolling out telecominfrastructure projects
Market Risk (No entry barriers operators may
share infrastructure betweenthemselves large players withhigh capital may increasecompetition)
India has a huge potential for telecominfrastructure market With increasing
competition falling tariffs and pressure onmargins telecom service providers are beingforced to increase their focus on marketing andreduce their expensesExperienced management healthy capital back-up effective presence in the telecominfrastructure market and value added services atrelatively lesser cost will help ABC to meet theset targets
Financing Risk
(Availability of equity capitalavailability of long term debtinterest rate and moratoriumperiod)
ABC is seeking private equity partner to secure
equity capital Company has already entered intoNDA with 2 major investorsLong term debt at an interest rate of 125 canbe easily arranged because of the credibility of the promoters in the marketMany other similar firms like Indus and GTLhave already secured long term debt for amoratorium period of 2 years Promoters of ABCLimited are confident to secure a long term debtwith a moratorium period of 2 years and apayback period of 8 years
ABC Limited would minimize the workingcapital requirements of its business by securingrentals and operating revenues in advance fromits clients and or by suitably structuring itspayment liabilities to match its cash inflows
Commercial Risk (Tenancy ratio and tariff forGBS and RTS)
ABC would aim to enter into long term contractswith the ldquoanchor tenantrdquo operator and thenrollout the infrastructure so that at least single
882019 Major Project (Ramit)
httpslidepdfcomreaderfullmajor-project-ramit 4962
40
occupancy of each site is ensured at all t imesPromoters will use its knowledge of the businessand its expertise to identify and roll out sites inlocations which have strong multi- tenancypotential to minimize occupancy risk
Revenue Risk (Operating fees may decreasecredit worthiness of the clientsdelay in payment of rentals)
As per the industry sources till now not even asingle operator have dishonored the long termlease contractThe credit risk is diversified as there will bemultiple operatorsABC would aggressively market to get 3G andWiFi broadcasters to use the sites and earnadditional revenues in addition to the assumedrevenue streams
Natural Calamities Risk The Company shall maintain insurance for thesites against these risks and the cost of insurancewill be priced in and passed on to the tenants
882019 Major Project (Ramit)
httpslidepdfcomreaderfullmajor-project-ramit 5062
41
8 CONCLUSION
India is the fastest growing wireless telecom market in the world The continuing
growth in the number of wireless subscribers and MoUs and increasing trend of
outsourcing of business processes to India has led to growing demand for large
investments in the telecom infrastructure in the country
However with increasing competition falling tariffs and pressure on margins
telecom service providers are being forced to increase their focus on marketing
customer acquisitions and branding and minimize their efforts and overheads in
project management and asset acquisition
Further with rising prices of steel cement and real estate the cost of developing
and owning passive infrastructure is increasingly becoming a costly proposition
for most operators and service providers
The compulsion on the part of service providers to reduce their operating costs
and capital expenditure requirements has led to opportunities in passiveinfrastructure outsourcing to independent third party infrastructure providers and
also sharing the infrastructure with other service providers It is expected that
cellular operators will outsource their communications site infrastructure needs as
a means of accelerating access to their markets and preserving capital rather than
constructing and operating their own communications sites and maintaining their
own communications sites service and deve lopment capabilities
Passive infrastructure is highly capital intensive and an integral part of the cellular
service providersrsquo networks Yet being a simple and low technology asset it is
amenable to outsourcing and sharing By transferring the responsibility of
ownership development and maintenance of passive infrastructure service
882019 Major Project (Ramit)
httpslidepdfcomreaderfullmajor-project-ramit 5162
42
providers have an opportunity to transfer a substantial part of their business risk to
third parties
Most telecom operators are facing capacity constraints on their networksCoverage obligations increasing pressure to improve network quality and
competition has led to aggressive roll out plans by existing cellular operators
Installation of cell sites has become a cumbersome process as there are a number
of clearances required and involves labor-intensive micro management
Availability of ready infrastructure from third party providers would enable the
operators to reduce their time to market and accelerate their access to their
customers Cellular service providers generally want to move quickly when
adding more sites and co-location on an existing site is always faster than
building
Ownership and maintenance of telecom towers and other infrastructure by third
parties is an established practice in developed nations like USA and is
increasingly gaining market acceptance in India
The Indian government is seriously considering promoting the infrastructure
sharing route between the telecom operator and private players to achieve future
national tele-density targets and improve rural telecom penetration
ABC being an independent entity with no business conflicts with other service
providers in the telecom space will be best positioned and have an early mover
advantage to capitalize on this emerging opportunity
Further the task of operating and maintaining the passive infrastructure in the cell
is increasingly becoming a cumbersome exercise for the service providers to
handle ABCrsquos composite offering to build passive infrastructure for the cellular
operators and also operate and maintain them will provide a turnkey solution to
address the infrastructure needs of the service providers
882019 Major Project (Ramit)
httpslidepdfcomreaderfullmajor-project-ramit 5262
43
The business model proposed to be followed by ABC is fairly simple with stable
and predictable cash flows as is the case with the business model of the tower
renting companies in USA Most contracts are long term for a period 10 or moreyears with annual price escalators generally ranging from 3 to 4 However
wireless carriers normally tend to renew rentals because suitable alternative sites
may not exist or be available and repositioning a site in a carrierrsquos network is
expensive and may adverse ly affect network quality
Site ownership and operations is a ldquoscalerdquo business operating administration
marketing expenses etc do not rise as quickly as revenues when portfolios are
expanded Incremental operating costs associated with adding wireless tenants to
a communications site are minimal Therefore as additional tenants are added to a
site the substantial majority of incremental revenue contributes to margin
expansion Most tower companies have high EBITDA margins as may be seen
from the financial indicators of some of the tower rental companies in USA
It is expected that site location and capacity price and quality of service and
successful execution of contracts will be the most significant competitive factors
in this business
ABCrsquos revenue and returns on investment will be primarily driven by its ability
to
o Increase the utilization of the space and infrastructure capacity owned by it by
increasing the number of tenants per site and renting out to maximum number
of users As discussed above return on capital employed (PIRR and EIRR) arevery sensitive to tenancy ratio In worst case scenario project IRR can be as
low as 8 and in the best case scenario it can be as high as 20
o Develop acquire sites of strategic importance and high growth potential that
will enable them to secure better commercial terms from users and attract
more number of tenants Infrastructure provisioning fees rentals for sites are
882019 Major Project (Ramit)
httpslidepdfcomreaderfullmajor-project-ramit 5362
44
extremely location sensitive There is a potential to acquire more land than
that of required to capitalize on the increase in real estate prices
o Develop sites in a cost effective manner ABC would consider purchasing
land only for those GBS sites which have sufficient demand and arestrategically located Else for most of its sites land will be leasehold As
shown above returns (PIRR and EIRR) are very sensitive to capital costs In
the worst case scenario project IRR can be as low as 15 whereas it can as
high as 27 in the best case scenario
o Negotiate and secure long term contracts with good credit quality users with
built in price escalation provisions to mitigate financing risk
o Leverage and secure long term financing at attractive terms and involve in
active treasury management to keep low financing cost Results of the
sensitivity analysis indicate that equity IRR can be as high as 60 foe a
moratorium period of 4 years and interest rate of 10
o Minimize working capital requirements
o Maintain low operating and administration expense
o Secure better OampM margins from operators and retain a healthy share of it in
ABC
o Maintain high service standards and build strong customer relationships
The business would have the potential to capture new revenue opportunities
around the existing assets As demand for towers is expected to grow and as
operators migrate to speedier next-generation wireless technologies they will
need the towers and associated passive infrastructure to transmit their new
services in addition to their existing offerings In addition to increasing capacity
and coverage and improving the quality of their networks cellular serviceproviders are deploying high speed data networks driving incremental demand of
sites The business therefore has potential upsides in the form of adding
customers (tenants) in wireless broadband third generation (ldquo3Grdquo) and wireless
data capabilities and also other incremental value propositions by way of hosting
882019 Major Project (Ramit)
httpslidepdfcomreaderfullmajor-project-ramit 5462
45
Billboards Hoardings etc in some of the high visible sites owned and maintained
by it
Based on the assumptions and subject to satisfactory resolution of the key risks
factors project cash flows will be able to meet debt service obligations
This business model is a lucrative investment option for a private equity player
because valuation of each site will increase in the coming years due to
improvement in market conditions increase in the value of land and increase in
the demand for passive infrastructure in rural and semi-urban areas
882019 Major Project (Ramit)
httpslidepdfcomreaderfullmajor-project-ramit 5562
46
REFERENCESAnjan G V A amp N M (2009) telecom infrastructure industry in india GurgaonICRA
Bessler W Norsworthy J amp Shusterman T (2001 12 1) Mergers in the UStelecommunications industry and market valuationeffects IEEE p 288
COAI (2009 march 14) Subscriber Figures Retrieved march 14 2009 fromCOAIcom httpwwwcoaicomstatisticsphp
IDA (2009 march 23) Highlights Retrieved march 23 2009 from idagovsghttpwwwidagovsghomeindexaspx
K R (2008) Time for new business model Delhi Cybermedia
MAXIS (2009 march 8) the malaysian telecommunications industry Retrieved march9 2009 from maxiscommyhttpwwwmaxiscommypersonalabout_usinvestorprospectusprospectus4pdf
P J amp Lisa A (2009) Stimulas spending and American Telecom Industry USACoracle group
PwC (2009 march 12) Indian Telecom Industry Gurgaon Harayana IndiaRamachanran (2009 march 1) Investment in Telecom Infrastructure sector (M RInterviewer)
Vogelsang I (2002) The German Telecommunications Reform Verein fuumlr Socialpolitik (p 26) Innsbruck Boston Press
882019 Major Project (Ramit)
httpslidepdfcomreaderfullmajor-project-ramit 5662
47
ANNEXURES
ANNEXURE 1 Key Assumptions
The occupancy of each site by single two three operators for green-field sites is assumed
to be as follows
Table 91 Expected Tenancy RatiosFY 10 FY 11 FY 12 FY 13 FY 14 FY15
GBT Tenant
Ratio 150 150 170 170 170 200
Single Operator 50 50 30 30 30 0
Two Operator 50 50 70 70 70 100
RTT Tenant
Ratio 170 170 200 200 200 250
Single Operator 30 30 0 0 0 0
Two Operator 70 70 100 100 100 50
Three Operator 0 0 0 0 0 50
From FY 15 onwards tenancy ratio of 2 and 25 for GBT and RTT sites is cons idered
882019 Major Project (Ramit)
httpslidepdfcomreaderfullmajor-project-ramit 5762
48
Capital costs related assumptions are tabulated below
Table 92 GBT and RTT Capital Cost
The lease rentals for RTT sites are reimbursed from the operators and therefore have not
been factored in the revenues as well as the expense For GBT sites land purchase cost of
035 millions assumed which has been escalated by 6 annually to determine the
salvage value of assets
GBT Capital Costs
Million
INR
Delivery cost of Ground Based
Tower (GBT)063
Delivery cost of Generator 030
Civil Work 040Shelter 012
Electrical Works 030
Other Equipments (UPS Battery
etc)045
Construction cost 045
Land 035
Contingency amp Financial Charges 035Total cost 335
RTT Capital Costs
Million
INR
Delivery cost of Roof Top
Tower (RTT) 030
Delivery cost of Generator 020
Civil Work 020Shelter 012
Electrical Works 030
Other Equipments (UPS
Battery etc) 030
Construction cost -
Land -
Contingency amp FinancialCharges 008
Total cost 150
882019 Major Project (Ramit)
httpslidepdfcomreaderfullmajor-project-ramit 5862
49
Ope rating costs related assumptions are tabulated below
Table 93 Operating CostsOperating Costs
Security Sentries (INRMonth) 4000
Supervisors (INRMonth) 6000
Cluster Manager One for Fifty Towers (INRMonth) 15000
Annual increase 500
Number of Security Sentries per tower 300
Number of supervisors per tower 010
Number of C luster manager per tower 002
Fixed Expenses
Selling amp Maintenance (INRMonth) 4000000
Annual Escalation 5
Administration overhead (INRMonth) 10000000Annual Escalation 7
AMC Cost of Generator 15 (cost of generator)
Annual Escalation (AMC) 3
For RTT sites security sentries are not required because it will be the responsibility of
the site owner A supervisor will for every 10 sites and a cluster manager for every 50
sites will be required
882019 Major Project (Ramit)
httpslidepdfcomreaderfullmajor-project-ramit 5962
50
Table 94 Long term debtInterest Rate 125 per annum
Moratorium 2 years
Repayment Period 8 years
Tariff related assumptions and date of operations are tabulated below
Table 95 GBT and RTT Tariff Table 96 Life of the projectTariff Plan
Tariff (INRMonth)
No of
operators GBT RTT
1 28000 18000
2 22000 14000
3 0 12000
Annual
increase 3 3
Commercial Operation Date 1-Aug-09
Quarter Ending 30-Sep-09
FY ending COD 31-Mar-10
Project life years 15
End of commercial
operations31-Aug-24
Quarter ending commercial
operations30-Sep-24
FY ending comme rcial
operations31-Mar-25
882019 Major Project (Ramit)
httpslidepdfcomreaderfullmajor-project-ramit 6062
51
Annexure 2 Profit amp Loss accountsTable 97 Profit amp loss account statement
Income Statement (MNINR)Year ending Mar-10 Mar-11 Mar-12 Mar-13 Mar-14 Mar-15
RevenueGBT 406350 28811 89080 197447 379409 527015Operator Fees (GBT) 1411 10004 30678 67998 130664 179664RTT 1209 8575 27269 60443 116146 164264
Operator Fees (RTT) 440 3121 9739 21587 41481 56466Net Revenue 7124 50511 156766 347476 667700 927410
Expenses
VariableSecurity Sentries 1355 9790 28339 64033 125433 158238Supervisors 097 699 2024 4574 8959 11303Cluster Manager 048 350 10 12 2287 4480 5651AMC Cost of Generator 450 3013 7877 16719 31148 54541Sub-total 1950 13852 39252 87612 170021 229734
Fixed
Selling amp Maintenance(INRMonth) 032 050 053 056 058 061
Administration overhead(INRMonth) 080 128 137 147 157 168
Sub-total 112 179 190 203 216 230
EBITDA 5062 36480 117324 259661 497464 697447
Interest on LT loan - - 7341 31200 77479 156198Interest on ST loan - 021 060 130 245 361
EBDT 5062 36459 109923 228331 419739 540888Depreciation 2439 12769 35917 77162 142925 174006
EBT 2624 23691 74006 151169 276814 366881Income Tax 170 4233 14536 29073 53547 77634
PAT 2454 19458 59470 122096 223267 289247
882019 Major Project (Ramit)
httpslidepdfcomreaderfullmajor-project-ramit 6162
52
Annexure 3 Balance sheet
Table 98 B alance sheetsYearend Balance Sheet (MNINR)Year ending Mar-10 Mar-11 Mar-12 Mar-13 Mar-14 Mar-15
AssetsGross Block 75742 328216 833164 1716823 3105430 3105430Accumulated depreciation 2439 15208 51125 128287 271212 445218Net Block 73303 313009 782040 1588536 2834219 2660212Net Working Capital 064 241 620 1335 2515 3707Cash Balance 12979 72089 216513 488856 947982 1294734Total Assets 86346 385339 999172 2078727 3784715 3958653
LiabilitiesEquity 25168 108980 276604 569947 1030914 1030914Reserves amp Surplus 2454 21912 81381 203477 426745 715992Long term Debt 58725 254286 640722 1304302 2325171 2208967WC Borrowings - 161 465 1001 1886 2780Total Liabilities 86346 385339 999172 2078727 3784715 3958653
882019 Major Project (Ramit)
httpslidepdfcomreaderfullmajor-project-ramit 6262
Annexure 4 Cash flow statement
Table 99 Cash flow statements
Year ending Mar-10 Mar-11 Mar-12 Mar-13 Mar-14 Mar-15
InflowsPAT 2454 19458 59470 122096 223267 289247Depreciation 2439 12769 35917 77162 142925 174006Tax adjusted interest - 014 4959 20991 52076 104895Release of WC - - - - - -Salvage Value - - - - - -Sub-Total 4893 32241 100345 220249 418268 568148
OutflowsCapex 75742 252474 504948 883659 1388607 -Change in WorkingCapital 064 177 379 715 1180 1192
Sub-Total 75806 252651 505327 884374 1389787 1192
UFCF (70913) (220410) (404982) (664125) (971519) 566956LFCF (70913) (220424) (409940) (685116) (1023595) 462062
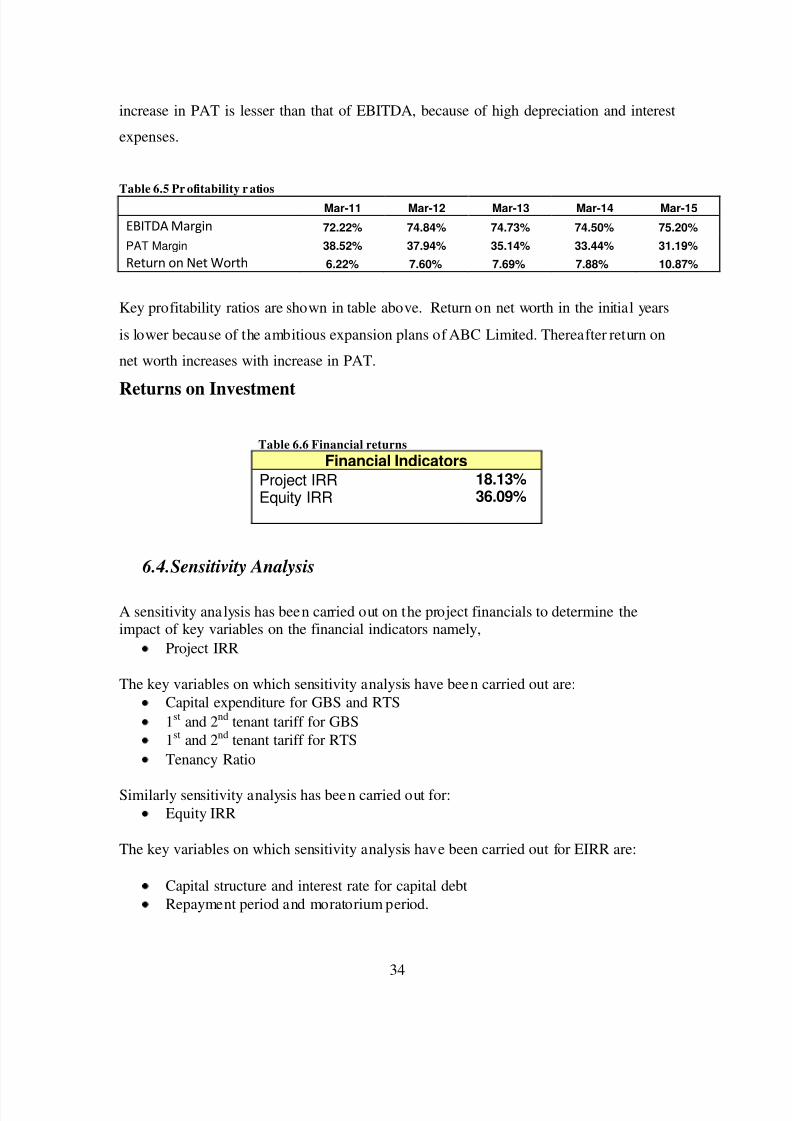
882019 Major Project (Ramit)
httpslidepdfcomreaderfullmajor-project-ramit 4362
34
increase in PAT is lesser than that of EBITDA because of high depreciation and interest
expenses
Table 65 Pr ofitability r atios
Mar-11 Mar-12 Mar-13 Mar-14 Mar-15
EBITDA Margin 7222 7484 7473 7450 7520
PAT Margin 3852 3794 3514 3344 3119Return on Net Worth 622 760 769 788 1087
Key profitability ratios are shown in table above Return on net worth in the initial years
is lower because of the ambitious expansion plans of ABC Limited Thereafter return on
net worth increases with increase in PAT
Returns on Investment
Table 66 Financial returnsFinancial Indicators
Project IRR 1813Equity IRR 3609
64 Sensitivity Analysis
A sensitivity analysis has been carried out on the project financials to determine theimpact of key variables on the financial indicators namely
Project IRR
The key variables on which sensitivity analysis have been carried out areCapital expenditure for GBS and RTS1st and 2 nd tenant tariff for GBS1st and 2 nd tenant tariff for RTSTenancy Ratio
Similarly sensitivity analysis has been carried out forEquity IRR
The key variables on which sensitivity analysis have been carried out for EIRR are
Capital structure and interest rate for capital debtRepayment period and moratorium period
882019 Major Project (Ramit)
httpslidepdfcomreaderfullmajor-project-ramit 4462
35
The impact on the financial indicators is shown below
Figure 6-1 Project IRR vs GBT and RTT CAPEX
As shown in Figure 6-1 project IRR is more sensitive to change in CAPEX of RTT sitesas compared to change in CAPEX of GBT sites because tenancy ratio and tariff for RTTsites are higher than those of GBT sites
882019 Major Project (Ramit)
httpslidepdfcomreaderfullmajor-project-ramit 4562
36
Figure 6-2 Project IRR vs GBT Tariff for 1 st tenant (X-axis) and 2 nd tenant (right-hand side)
As shown in Figure 6-2 project IRR varies linearly with GBT tariff In the best casescenario when GBT tariff for 1 st tenant is INR 34000month and GBT tariff for secondtenant is INR 26000month Project IRR is 2101
Figure 6-3 Project IRR vs RTT Tariff for 1 st tenant (X-axis) and 2 nd tenant (right-hand side)
As shown in Figure 6-2 project IRR varies linearly with RTT tariff In the best casescenario when RTT tariff for 1 st tenant is INR 24000month and RTT tariff for second
882019 Major Project (Ramit)
httpslidepdfcomreaderfullmajor-project-ramit 4662
37
tenant is INR 20000month Project IRR is 1932 Project IRR is more sensitivetowards RTT tariff than GBT tariff because in practical business situation RTT siteshave a tenancy ratio of more than two due to which effect of tariff for 1 st tenant almostget nullified after few years
Figure 6-4 Project IRR vs Tenancy ratio for RTT sites (X-axis) and GBT sites
As shown in Figure 6-4 project IRR is very sensitive to tenancy ratio In the best casescenario where GBT sites have a tenancy ratio of 2 and RTT sites have a tenancy ratio of 3 project IRR can be as high as 20
Figure 6-5 Equity IRR vs long term debt interest rate for different leverage level
882019 Major Project (Ramit)
httpslidepdfcomreaderfullmajor-project-ramit 4762
38
As shown in figure 6-5 equity IRR is more sensitive to interest rate on long term debt forhigh level of leverage (lower debt equity ratio) because as the debt equity ratio increasesinterest paid on long term debt also increases significantly
Figure 6-6 Equity IRR vs long term debt repayment period at different level of moratoriumperiods
As shown in figure 6-6 Equity IRR increases with increase in moratorium period anddebt repayment period The variation is from 1654 to 60 for worst case and best casescenarios
882019 Major Project (Ramit)
httpslidepdfcomreaderfullmajor-project-ramit 4862
39
7 RISK ASSESSMENTRisk Mitigation strategyExecution Risk
(Project management landacquisition etc)
Management of ABC has proven expertise in
telecom infrastructure rollout and has executedvarious projects with large telecom operators andMNC vendorsABCrsquos top management team consists of a groupof professionals drawn from leading telecomInfrastructure Company who have immenseexpertise and experience in rolling out telecominfrastructure projects
Market Risk (No entry barriers operators may
share infrastructure betweenthemselves large players withhigh capital may increasecompetition)
India has a huge potential for telecominfrastructure market With increasing
competition falling tariffs and pressure onmargins telecom service providers are beingforced to increase their focus on marketing andreduce their expensesExperienced management healthy capital back-up effective presence in the telecominfrastructure market and value added services atrelatively lesser cost will help ABC to meet theset targets
Financing Risk
(Availability of equity capitalavailability of long term debtinterest rate and moratoriumperiod)
ABC is seeking private equity partner to secure
equity capital Company has already entered intoNDA with 2 major investorsLong term debt at an interest rate of 125 canbe easily arranged because of the credibility of the promoters in the marketMany other similar firms like Indus and GTLhave already secured long term debt for amoratorium period of 2 years Promoters of ABCLimited are confident to secure a long term debtwith a moratorium period of 2 years and apayback period of 8 years
ABC Limited would minimize the workingcapital requirements of its business by securingrentals and operating revenues in advance fromits clients and or by suitably structuring itspayment liabilities to match its cash inflows
Commercial Risk (Tenancy ratio and tariff forGBS and RTS)
ABC would aim to enter into long term contractswith the ldquoanchor tenantrdquo operator and thenrollout the infrastructure so that at least single
882019 Major Project (Ramit)
httpslidepdfcomreaderfullmajor-project-ramit 4962
40
occupancy of each site is ensured at all t imesPromoters will use its knowledge of the businessand its expertise to identify and roll out sites inlocations which have strong multi- tenancypotential to minimize occupancy risk
Revenue Risk (Operating fees may decreasecredit worthiness of the clientsdelay in payment of rentals)
As per the industry sources till now not even asingle operator have dishonored the long termlease contractThe credit risk is diversified as there will bemultiple operatorsABC would aggressively market to get 3G andWiFi broadcasters to use the sites and earnadditional revenues in addition to the assumedrevenue streams
Natural Calamities Risk The Company shall maintain insurance for thesites against these risks and the cost of insurancewill be priced in and passed on to the tenants
882019 Major Project (Ramit)
httpslidepdfcomreaderfullmajor-project-ramit 5062
41
8 CONCLUSION
India is the fastest growing wireless telecom market in the world The continuing
growth in the number of wireless subscribers and MoUs and increasing trend of
outsourcing of business processes to India has led to growing demand for large
investments in the telecom infrastructure in the country
However with increasing competition falling tariffs and pressure on margins
telecom service providers are being forced to increase their focus on marketing
customer acquisitions and branding and minimize their efforts and overheads in
project management and asset acquisition
Further with rising prices of steel cement and real estate the cost of developing
and owning passive infrastructure is increasingly becoming a costly proposition
for most operators and service providers
The compulsion on the part of service providers to reduce their operating costs
and capital expenditure requirements has led to opportunities in passiveinfrastructure outsourcing to independent third party infrastructure providers and
also sharing the infrastructure with other service providers It is expected that
cellular operators will outsource their communications site infrastructure needs as
a means of accelerating access to their markets and preserving capital rather than
constructing and operating their own communications sites and maintaining their
own communications sites service and deve lopment capabilities
Passive infrastructure is highly capital intensive and an integral part of the cellular
service providersrsquo networks Yet being a simple and low technology asset it is
amenable to outsourcing and sharing By transferring the responsibility of
ownership development and maintenance of passive infrastructure service
882019 Major Project (Ramit)
httpslidepdfcomreaderfullmajor-project-ramit 5162
42
providers have an opportunity to transfer a substantial part of their business risk to
third parties
Most telecom operators are facing capacity constraints on their networksCoverage obligations increasing pressure to improve network quality and
competition has led to aggressive roll out plans by existing cellular operators
Installation of cell sites has become a cumbersome process as there are a number
of clearances required and involves labor-intensive micro management
Availability of ready infrastructure from third party providers would enable the
operators to reduce their time to market and accelerate their access to their
customers Cellular service providers generally want to move quickly when
adding more sites and co-location on an existing site is always faster than
building
Ownership and maintenance of telecom towers and other infrastructure by third
parties is an established practice in developed nations like USA and is
increasingly gaining market acceptance in India
The Indian government is seriously considering promoting the infrastructure
sharing route between the telecom operator and private players to achieve future
national tele-density targets and improve rural telecom penetration
ABC being an independent entity with no business conflicts with other service
providers in the telecom space will be best positioned and have an early mover
advantage to capitalize on this emerging opportunity
Further the task of operating and maintaining the passive infrastructure in the cell
is increasingly becoming a cumbersome exercise for the service providers to
handle ABCrsquos composite offering to build passive infrastructure for the cellular
operators and also operate and maintain them will provide a turnkey solution to
address the infrastructure needs of the service providers
882019 Major Project (Ramit)
httpslidepdfcomreaderfullmajor-project-ramit 5262
43
The business model proposed to be followed by ABC is fairly simple with stable
and predictable cash flows as is the case with the business model of the tower
renting companies in USA Most contracts are long term for a period 10 or moreyears with annual price escalators generally ranging from 3 to 4 However
wireless carriers normally tend to renew rentals because suitable alternative sites
may not exist or be available and repositioning a site in a carrierrsquos network is
expensive and may adverse ly affect network quality
Site ownership and operations is a ldquoscalerdquo business operating administration
marketing expenses etc do not rise as quickly as revenues when portfolios are
expanded Incremental operating costs associated with adding wireless tenants to
a communications site are minimal Therefore as additional tenants are added to a
site the substantial majority of incremental revenue contributes to margin
expansion Most tower companies have high EBITDA margins as may be seen
from the financial indicators of some of the tower rental companies in USA
It is expected that site location and capacity price and quality of service and
successful execution of contracts will be the most significant competitive factors
in this business
ABCrsquos revenue and returns on investment will be primarily driven by its ability
to
o Increase the utilization of the space and infrastructure capacity owned by it by
increasing the number of tenants per site and renting out to maximum number
of users As discussed above return on capital employed (PIRR and EIRR) arevery sensitive to tenancy ratio In worst case scenario project IRR can be as
low as 8 and in the best case scenario it can be as high as 20
o Develop acquire sites of strategic importance and high growth potential that
will enable them to secure better commercial terms from users and attract
more number of tenants Infrastructure provisioning fees rentals for sites are
882019 Major Project (Ramit)
httpslidepdfcomreaderfullmajor-project-ramit 5362
44
extremely location sensitive There is a potential to acquire more land than
that of required to capitalize on the increase in real estate prices
o Develop sites in a cost effective manner ABC would consider purchasing
land only for those GBS sites which have sufficient demand and arestrategically located Else for most of its sites land will be leasehold As
shown above returns (PIRR and EIRR) are very sensitive to capital costs In
the worst case scenario project IRR can be as low as 15 whereas it can as
high as 27 in the best case scenario
o Negotiate and secure long term contracts with good credit quality users with
built in price escalation provisions to mitigate financing risk
o Leverage and secure long term financing at attractive terms and involve in
active treasury management to keep low financing cost Results of the
sensitivity analysis indicate that equity IRR can be as high as 60 foe a
moratorium period of 4 years and interest rate of 10
o Minimize working capital requirements
o Maintain low operating and administration expense
o Secure better OampM margins from operators and retain a healthy share of it in
ABC
o Maintain high service standards and build strong customer relationships
The business would have the potential to capture new revenue opportunities
around the existing assets As demand for towers is expected to grow and as
operators migrate to speedier next-generation wireless technologies they will
need the towers and associated passive infrastructure to transmit their new
services in addition to their existing offerings In addition to increasing capacity
and coverage and improving the quality of their networks cellular serviceproviders are deploying high speed data networks driving incremental demand of
sites The business therefore has potential upsides in the form of adding
customers (tenants) in wireless broadband third generation (ldquo3Grdquo) and wireless
data capabilities and also other incremental value propositions by way of hosting
882019 Major Project (Ramit)
httpslidepdfcomreaderfullmajor-project-ramit 5462
45
Billboards Hoardings etc in some of the high visible sites owned and maintained
by it
Based on the assumptions and subject to satisfactory resolution of the key risks
factors project cash flows will be able to meet debt service obligations
This business model is a lucrative investment option for a private equity player
because valuation of each site will increase in the coming years due to
improvement in market conditions increase in the value of land and increase in
the demand for passive infrastructure in rural and semi-urban areas
882019 Major Project (Ramit)
httpslidepdfcomreaderfullmajor-project-ramit 5562
46
REFERENCESAnjan G V A amp N M (2009) telecom infrastructure industry in india GurgaonICRA
Bessler W Norsworthy J amp Shusterman T (2001 12 1) Mergers in the UStelecommunications industry and market valuationeffects IEEE p 288
COAI (2009 march 14) Subscriber Figures Retrieved march 14 2009 fromCOAIcom httpwwwcoaicomstatisticsphp
IDA (2009 march 23) Highlights Retrieved march 23 2009 from idagovsghttpwwwidagovsghomeindexaspx
K R (2008) Time for new business model Delhi Cybermedia
MAXIS (2009 march 8) the malaysian telecommunications industry Retrieved march9 2009 from maxiscommyhttpwwwmaxiscommypersonalabout_usinvestorprospectusprospectus4pdf
P J amp Lisa A (2009) Stimulas spending and American Telecom Industry USACoracle group
PwC (2009 march 12) Indian Telecom Industry Gurgaon Harayana IndiaRamachanran (2009 march 1) Investment in Telecom Infrastructure sector (M RInterviewer)
Vogelsang I (2002) The German Telecommunications Reform Verein fuumlr Socialpolitik (p 26) Innsbruck Boston Press
882019 Major Project (Ramit)
httpslidepdfcomreaderfullmajor-project-ramit 5662
47
ANNEXURES
ANNEXURE 1 Key Assumptions
The occupancy of each site by single two three operators for green-field sites is assumed
to be as follows
Table 91 Expected Tenancy RatiosFY 10 FY 11 FY 12 FY 13 FY 14 FY15
GBT Tenant
Ratio 150 150 170 170 170 200
Single Operator 50 50 30 30 30 0
Two Operator 50 50 70 70 70 100
RTT Tenant
Ratio 170 170 200 200 200 250
Single Operator 30 30 0 0 0 0
Two Operator 70 70 100 100 100 50
Three Operator 0 0 0 0 0 50
From FY 15 onwards tenancy ratio of 2 and 25 for GBT and RTT sites is cons idered
882019 Major Project (Ramit)
httpslidepdfcomreaderfullmajor-project-ramit 5762
48
Capital costs related assumptions are tabulated below
Table 92 GBT and RTT Capital Cost
The lease rentals for RTT sites are reimbursed from the operators and therefore have not
been factored in the revenues as well as the expense For GBT sites land purchase cost of
035 millions assumed which has been escalated by 6 annually to determine the
salvage value of assets
GBT Capital Costs
Million
INR
Delivery cost of Ground Based
Tower (GBT)063
Delivery cost of Generator 030
Civil Work 040Shelter 012
Electrical Works 030
Other Equipments (UPS Battery
etc)045
Construction cost 045
Land 035
Contingency amp Financial Charges 035Total cost 335
RTT Capital Costs
Million
INR
Delivery cost of Roof Top
Tower (RTT) 030
Delivery cost of Generator 020
Civil Work 020Shelter 012
Electrical Works 030
Other Equipments (UPS
Battery etc) 030
Construction cost -
Land -
Contingency amp FinancialCharges 008
Total cost 150
882019 Major Project (Ramit)
httpslidepdfcomreaderfullmajor-project-ramit 5862
49
Ope rating costs related assumptions are tabulated below
Table 93 Operating CostsOperating Costs
Security Sentries (INRMonth) 4000
Supervisors (INRMonth) 6000
Cluster Manager One for Fifty Towers (INRMonth) 15000
Annual increase 500
Number of Security Sentries per tower 300
Number of supervisors per tower 010
Number of C luster manager per tower 002
Fixed Expenses
Selling amp Maintenance (INRMonth) 4000000
Annual Escalation 5
Administration overhead (INRMonth) 10000000Annual Escalation 7
AMC Cost of Generator 15 (cost of generator)
Annual Escalation (AMC) 3
For RTT sites security sentries are not required because it will be the responsibility of
the site owner A supervisor will for every 10 sites and a cluster manager for every 50
sites will be required
882019 Major Project (Ramit)
httpslidepdfcomreaderfullmajor-project-ramit 5962
50
Table 94 Long term debtInterest Rate 125 per annum
Moratorium 2 years
Repayment Period 8 years
Tariff related assumptions and date of operations are tabulated below
Table 95 GBT and RTT Tariff Table 96 Life of the projectTariff Plan
Tariff (INRMonth)
No of
operators GBT RTT
1 28000 18000
2 22000 14000
3 0 12000
Annual
increase 3 3
Commercial Operation Date 1-Aug-09
Quarter Ending 30-Sep-09
FY ending COD 31-Mar-10
Project life years 15
End of commercial
operations31-Aug-24
Quarter ending commercial
operations30-Sep-24
FY ending comme rcial
operations31-Mar-25
882019 Major Project (Ramit)
httpslidepdfcomreaderfullmajor-project-ramit 6062
51
Annexure 2 Profit amp Loss accountsTable 97 Profit amp loss account statement
Income Statement (MNINR)Year ending Mar-10 Mar-11 Mar-12 Mar-13 Mar-14 Mar-15
RevenueGBT 406350 28811 89080 197447 379409 527015Operator Fees (GBT) 1411 10004 30678 67998 130664 179664RTT 1209 8575 27269 60443 116146 164264
Operator Fees (RTT) 440 3121 9739 21587 41481 56466Net Revenue 7124 50511 156766 347476 667700 927410
Expenses
VariableSecurity Sentries 1355 9790 28339 64033 125433 158238Supervisors 097 699 2024 4574 8959 11303Cluster Manager 048 350 10 12 2287 4480 5651AMC Cost of Generator 450 3013 7877 16719 31148 54541Sub-total 1950 13852 39252 87612 170021 229734
Fixed
Selling amp Maintenance(INRMonth) 032 050 053 056 058 061
Administration overhead(INRMonth) 080 128 137 147 157 168
Sub-total 112 179 190 203 216 230
EBITDA 5062 36480 117324 259661 497464 697447
Interest on LT loan - - 7341 31200 77479 156198Interest on ST loan - 021 060 130 245 361
EBDT 5062 36459 109923 228331 419739 540888Depreciation 2439 12769 35917 77162 142925 174006
EBT 2624 23691 74006 151169 276814 366881Income Tax 170 4233 14536 29073 53547 77634
PAT 2454 19458 59470 122096 223267 289247
882019 Major Project (Ramit)
httpslidepdfcomreaderfullmajor-project-ramit 6162
52
Annexure 3 Balance sheet
Table 98 B alance sheetsYearend Balance Sheet (MNINR)Year ending Mar-10 Mar-11 Mar-12 Mar-13 Mar-14 Mar-15
AssetsGross Block 75742 328216 833164 1716823 3105430 3105430Accumulated depreciation 2439 15208 51125 128287 271212 445218Net Block 73303 313009 782040 1588536 2834219 2660212Net Working Capital 064 241 620 1335 2515 3707Cash Balance 12979 72089 216513 488856 947982 1294734Total Assets 86346 385339 999172 2078727 3784715 3958653
LiabilitiesEquity 25168 108980 276604 569947 1030914 1030914Reserves amp Surplus 2454 21912 81381 203477 426745 715992Long term Debt 58725 254286 640722 1304302 2325171 2208967WC Borrowings - 161 465 1001 1886 2780Total Liabilities 86346 385339 999172 2078727 3784715 3958653
882019 Major Project (Ramit)
httpslidepdfcomreaderfullmajor-project-ramit 6262
Annexure 4 Cash flow statement
Table 99 Cash flow statements
Year ending Mar-10 Mar-11 Mar-12 Mar-13 Mar-14 Mar-15
InflowsPAT 2454 19458 59470 122096 223267 289247Depreciation 2439 12769 35917 77162 142925 174006Tax adjusted interest - 014 4959 20991 52076 104895Release of WC - - - - - -Salvage Value - - - - - -Sub-Total 4893 32241 100345 220249 418268 568148
OutflowsCapex 75742 252474 504948 883659 1388607 -Change in WorkingCapital 064 177 379 715 1180 1192
Sub-Total 75806 252651 505327 884374 1389787 1192
UFCF (70913) (220410) (404982) (664125) (971519) 566956LFCF (70913) (220424) (409940) (685116) (1023595) 462062
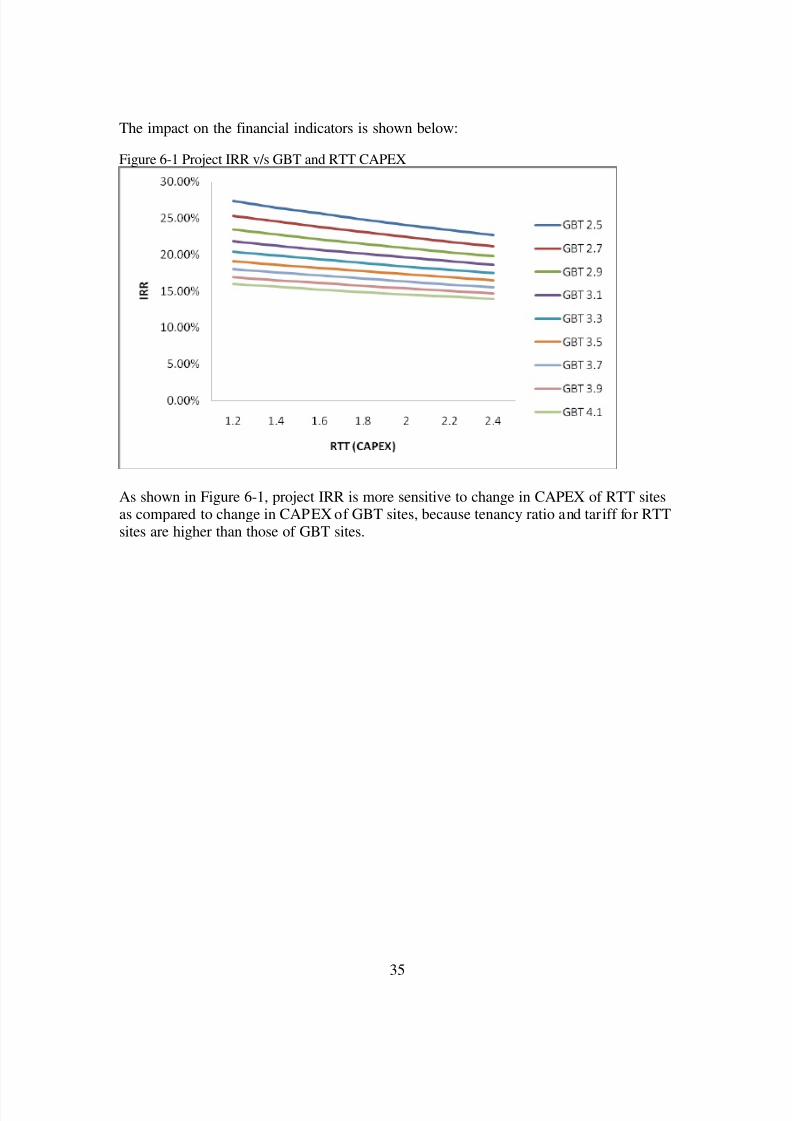
882019 Major Project (Ramit)
httpslidepdfcomreaderfullmajor-project-ramit 4462
35
The impact on the financial indicators is shown below
Figure 6-1 Project IRR vs GBT and RTT CAPEX
As shown in Figure 6-1 project IRR is more sensitive to change in CAPEX of RTT sitesas compared to change in CAPEX of GBT sites because tenancy ratio and tariff for RTTsites are higher than those of GBT sites
882019 Major Project (Ramit)
httpslidepdfcomreaderfullmajor-project-ramit 4562
36
Figure 6-2 Project IRR vs GBT Tariff for 1 st tenant (X-axis) and 2 nd tenant (right-hand side)
As shown in Figure 6-2 project IRR varies linearly with GBT tariff In the best casescenario when GBT tariff for 1 st tenant is INR 34000month and GBT tariff for secondtenant is INR 26000month Project IRR is 2101
Figure 6-3 Project IRR vs RTT Tariff for 1 st tenant (X-axis) and 2 nd tenant (right-hand side)
As shown in Figure 6-2 project IRR varies linearly with RTT tariff In the best casescenario when RTT tariff for 1 st tenant is INR 24000month and RTT tariff for second
882019 Major Project (Ramit)
httpslidepdfcomreaderfullmajor-project-ramit 4662
37
tenant is INR 20000month Project IRR is 1932 Project IRR is more sensitivetowards RTT tariff than GBT tariff because in practical business situation RTT siteshave a tenancy ratio of more than two due to which effect of tariff for 1 st tenant almostget nullified after few years
Figure 6-4 Project IRR vs Tenancy ratio for RTT sites (X-axis) and GBT sites
As shown in Figure 6-4 project IRR is very sensitive to tenancy ratio In the best casescenario where GBT sites have a tenancy ratio of 2 and RTT sites have a tenancy ratio of 3 project IRR can be as high as 20
Figure 6-5 Equity IRR vs long term debt interest rate for different leverage level
882019 Major Project (Ramit)
httpslidepdfcomreaderfullmajor-project-ramit 4762
38
As shown in figure 6-5 equity IRR is more sensitive to interest rate on long term debt forhigh level of leverage (lower debt equity ratio) because as the debt equity ratio increasesinterest paid on long term debt also increases significantly
Figure 6-6 Equity IRR vs long term debt repayment period at different level of moratoriumperiods
As shown in figure 6-6 Equity IRR increases with increase in moratorium period anddebt repayment period The variation is from 1654 to 60 for worst case and best casescenarios
882019 Major Project (Ramit)
httpslidepdfcomreaderfullmajor-project-ramit 4862
39
7 RISK ASSESSMENTRisk Mitigation strategyExecution Risk
(Project management landacquisition etc)
Management of ABC has proven expertise in
telecom infrastructure rollout and has executedvarious projects with large telecom operators andMNC vendorsABCrsquos top management team consists of a groupof professionals drawn from leading telecomInfrastructure Company who have immenseexpertise and experience in rolling out telecominfrastructure projects
Market Risk (No entry barriers operators may
share infrastructure betweenthemselves large players withhigh capital may increasecompetition)
India has a huge potential for telecominfrastructure market With increasing
competition falling tariffs and pressure onmargins telecom service providers are beingforced to increase their focus on marketing andreduce their expensesExperienced management healthy capital back-up effective presence in the telecominfrastructure market and value added services atrelatively lesser cost will help ABC to meet theset targets
Financing Risk
(Availability of equity capitalavailability of long term debtinterest rate and moratoriumperiod)
ABC is seeking private equity partner to secure
equity capital Company has already entered intoNDA with 2 major investorsLong term debt at an interest rate of 125 canbe easily arranged because of the credibility of the promoters in the marketMany other similar firms like Indus and GTLhave already secured long term debt for amoratorium period of 2 years Promoters of ABCLimited are confident to secure a long term debtwith a moratorium period of 2 years and apayback period of 8 years
ABC Limited would minimize the workingcapital requirements of its business by securingrentals and operating revenues in advance fromits clients and or by suitably structuring itspayment liabilities to match its cash inflows
Commercial Risk (Tenancy ratio and tariff forGBS and RTS)
ABC would aim to enter into long term contractswith the ldquoanchor tenantrdquo operator and thenrollout the infrastructure so that at least single
882019 Major Project (Ramit)
httpslidepdfcomreaderfullmajor-project-ramit 4962
40
occupancy of each site is ensured at all t imesPromoters will use its knowledge of the businessand its expertise to identify and roll out sites inlocations which have strong multi- tenancypotential to minimize occupancy risk
Revenue Risk (Operating fees may decreasecredit worthiness of the clientsdelay in payment of rentals)
As per the industry sources till now not even asingle operator have dishonored the long termlease contractThe credit risk is diversified as there will bemultiple operatorsABC would aggressively market to get 3G andWiFi broadcasters to use the sites and earnadditional revenues in addition to the assumedrevenue streams
Natural Calamities Risk The Company shall maintain insurance for thesites against these risks and the cost of insurancewill be priced in and passed on to the tenants
882019 Major Project (Ramit)
httpslidepdfcomreaderfullmajor-project-ramit 5062
41
8 CONCLUSION
India is the fastest growing wireless telecom market in the world The continuing
growth in the number of wireless subscribers and MoUs and increasing trend of
outsourcing of business processes to India has led to growing demand for large
investments in the telecom infrastructure in the country
However with increasing competition falling tariffs and pressure on margins
telecom service providers are being forced to increase their focus on marketing
customer acquisitions and branding and minimize their efforts and overheads in
project management and asset acquisition
Further with rising prices of steel cement and real estate the cost of developing
and owning passive infrastructure is increasingly becoming a costly proposition
for most operators and service providers
The compulsion on the part of service providers to reduce their operating costs
and capital expenditure requirements has led to opportunities in passiveinfrastructure outsourcing to independent third party infrastructure providers and
also sharing the infrastructure with other service providers It is expected that
cellular operators will outsource their communications site infrastructure needs as
a means of accelerating access to their markets and preserving capital rather than
constructing and operating their own communications sites and maintaining their
own communications sites service and deve lopment capabilities
Passive infrastructure is highly capital intensive and an integral part of the cellular
service providersrsquo networks Yet being a simple and low technology asset it is
amenable to outsourcing and sharing By transferring the responsibility of
ownership development and maintenance of passive infrastructure service
882019 Major Project (Ramit)
httpslidepdfcomreaderfullmajor-project-ramit 5162
42
providers have an opportunity to transfer a substantial part of their business risk to
third parties
Most telecom operators are facing capacity constraints on their networksCoverage obligations increasing pressure to improve network quality and
competition has led to aggressive roll out plans by existing cellular operators
Installation of cell sites has become a cumbersome process as there are a number
of clearances required and involves labor-intensive micro management
Availability of ready infrastructure from third party providers would enable the
operators to reduce their time to market and accelerate their access to their
customers Cellular service providers generally want to move quickly when
adding more sites and co-location on an existing site is always faster than
building
Ownership and maintenance of telecom towers and other infrastructure by third
parties is an established practice in developed nations like USA and is
increasingly gaining market acceptance in India
The Indian government is seriously considering promoting the infrastructure
sharing route between the telecom operator and private players to achieve future
national tele-density targets and improve rural telecom penetration
ABC being an independent entity with no business conflicts with other service
providers in the telecom space will be best positioned and have an early mover
advantage to capitalize on this emerging opportunity
Further the task of operating and maintaining the passive infrastructure in the cell
is increasingly becoming a cumbersome exercise for the service providers to
handle ABCrsquos composite offering to build passive infrastructure for the cellular
operators and also operate and maintain them will provide a turnkey solution to
address the infrastructure needs of the service providers
882019 Major Project (Ramit)
httpslidepdfcomreaderfullmajor-project-ramit 5262
43
The business model proposed to be followed by ABC is fairly simple with stable
and predictable cash flows as is the case with the business model of the tower
renting companies in USA Most contracts are long term for a period 10 or moreyears with annual price escalators generally ranging from 3 to 4 However
wireless carriers normally tend to renew rentals because suitable alternative sites
may not exist or be available and repositioning a site in a carrierrsquos network is
expensive and may adverse ly affect network quality
Site ownership and operations is a ldquoscalerdquo business operating administration
marketing expenses etc do not rise as quickly as revenues when portfolios are
expanded Incremental operating costs associated with adding wireless tenants to
a communications site are minimal Therefore as additional tenants are added to a
site the substantial majority of incremental revenue contributes to margin
expansion Most tower companies have high EBITDA margins as may be seen
from the financial indicators of some of the tower rental companies in USA
It is expected that site location and capacity price and quality of service and
successful execution of contracts will be the most significant competitive factors
in this business
ABCrsquos revenue and returns on investment will be primarily driven by its ability
to
o Increase the utilization of the space and infrastructure capacity owned by it by
increasing the number of tenants per site and renting out to maximum number
of users As discussed above return on capital employed (PIRR and EIRR) arevery sensitive to tenancy ratio In worst case scenario project IRR can be as
low as 8 and in the best case scenario it can be as high as 20
o Develop acquire sites of strategic importance and high growth potential that
will enable them to secure better commercial terms from users and attract
more number of tenants Infrastructure provisioning fees rentals for sites are
882019 Major Project (Ramit)
httpslidepdfcomreaderfullmajor-project-ramit 5362
44
extremely location sensitive There is a potential to acquire more land than
that of required to capitalize on the increase in real estate prices
o Develop sites in a cost effective manner ABC would consider purchasing
land only for those GBS sites which have sufficient demand and arestrategically located Else for most of its sites land will be leasehold As
shown above returns (PIRR and EIRR) are very sensitive to capital costs In
the worst case scenario project IRR can be as low as 15 whereas it can as
high as 27 in the best case scenario
o Negotiate and secure long term contracts with good credit quality users with
built in price escalation provisions to mitigate financing risk
o Leverage and secure long term financing at attractive terms and involve in
active treasury management to keep low financing cost Results of the
sensitivity analysis indicate that equity IRR can be as high as 60 foe a
moratorium period of 4 years and interest rate of 10
o Minimize working capital requirements
o Maintain low operating and administration expense
o Secure better OampM margins from operators and retain a healthy share of it in
ABC
o Maintain high service standards and build strong customer relationships
The business would have the potential to capture new revenue opportunities
around the existing assets As demand for towers is expected to grow and as
operators migrate to speedier next-generation wireless technologies they will
need the towers and associated passive infrastructure to transmit their new
services in addition to their existing offerings In addition to increasing capacity
and coverage and improving the quality of their networks cellular serviceproviders are deploying high speed data networks driving incremental demand of
sites The business therefore has potential upsides in the form of adding
customers (tenants) in wireless broadband third generation (ldquo3Grdquo) and wireless
data capabilities and also other incremental value propositions by way of hosting
882019 Major Project (Ramit)
httpslidepdfcomreaderfullmajor-project-ramit 5462
45
Billboards Hoardings etc in some of the high visible sites owned and maintained
by it
Based on the assumptions and subject to satisfactory resolution of the key risks
factors project cash flows will be able to meet debt service obligations
This business model is a lucrative investment option for a private equity player
because valuation of each site will increase in the coming years due to
improvement in market conditions increase in the value of land and increase in
the demand for passive infrastructure in rural and semi-urban areas
882019 Major Project (Ramit)
httpslidepdfcomreaderfullmajor-project-ramit 5562
46
REFERENCESAnjan G V A amp N M (2009) telecom infrastructure industry in india GurgaonICRA
Bessler W Norsworthy J amp Shusterman T (2001 12 1) Mergers in the UStelecommunications industry and market valuationeffects IEEE p 288
COAI (2009 march 14) Subscriber Figures Retrieved march 14 2009 fromCOAIcom httpwwwcoaicomstatisticsphp
IDA (2009 march 23) Highlights Retrieved march 23 2009 from idagovsghttpwwwidagovsghomeindexaspx
K R (2008) Time for new business model Delhi Cybermedia
MAXIS (2009 march 8) the malaysian telecommunications industry Retrieved march9 2009 from maxiscommyhttpwwwmaxiscommypersonalabout_usinvestorprospectusprospectus4pdf
P J amp Lisa A (2009) Stimulas spending and American Telecom Industry USACoracle group
PwC (2009 march 12) Indian Telecom Industry Gurgaon Harayana IndiaRamachanran (2009 march 1) Investment in Telecom Infrastructure sector (M RInterviewer)
Vogelsang I (2002) The German Telecommunications Reform Verein fuumlr Socialpolitik (p 26) Innsbruck Boston Press
882019 Major Project (Ramit)
httpslidepdfcomreaderfullmajor-project-ramit 5662
47
ANNEXURES
ANNEXURE 1 Key Assumptions
The occupancy of each site by single two three operators for green-field sites is assumed
to be as follows
Table 91 Expected Tenancy RatiosFY 10 FY 11 FY 12 FY 13 FY 14 FY15
GBT Tenant
Ratio 150 150 170 170 170 200
Single Operator 50 50 30 30 30 0
Two Operator 50 50 70 70 70 100
RTT Tenant
Ratio 170 170 200 200 200 250
Single Operator 30 30 0 0 0 0
Two Operator 70 70 100 100 100 50
Three Operator 0 0 0 0 0 50
From FY 15 onwards tenancy ratio of 2 and 25 for GBT and RTT sites is cons idered
882019 Major Project (Ramit)
httpslidepdfcomreaderfullmajor-project-ramit 5762
48
Capital costs related assumptions are tabulated below
Table 92 GBT and RTT Capital Cost
The lease rentals for RTT sites are reimbursed from the operators and therefore have not
been factored in the revenues as well as the expense For GBT sites land purchase cost of
035 millions assumed which has been escalated by 6 annually to determine the
salvage value of assets
GBT Capital Costs
Million
INR
Delivery cost of Ground Based
Tower (GBT)063
Delivery cost of Generator 030
Civil Work 040Shelter 012
Electrical Works 030
Other Equipments (UPS Battery
etc)045
Construction cost 045
Land 035
Contingency amp Financial Charges 035Total cost 335
RTT Capital Costs
Million
INR
Delivery cost of Roof Top
Tower (RTT) 030
Delivery cost of Generator 020
Civil Work 020Shelter 012
Electrical Works 030
Other Equipments (UPS
Battery etc) 030
Construction cost -
Land -
Contingency amp FinancialCharges 008
Total cost 150
882019 Major Project (Ramit)
httpslidepdfcomreaderfullmajor-project-ramit 5862
49
Ope rating costs related assumptions are tabulated below
Table 93 Operating CostsOperating Costs
Security Sentries (INRMonth) 4000
Supervisors (INRMonth) 6000
Cluster Manager One for Fifty Towers (INRMonth) 15000
Annual increase 500
Number of Security Sentries per tower 300
Number of supervisors per tower 010
Number of C luster manager per tower 002
Fixed Expenses
Selling amp Maintenance (INRMonth) 4000000
Annual Escalation 5
Administration overhead (INRMonth) 10000000Annual Escalation 7
AMC Cost of Generator 15 (cost of generator)
Annual Escalation (AMC) 3
For RTT sites security sentries are not required because it will be the responsibility of
the site owner A supervisor will for every 10 sites and a cluster manager for every 50
sites will be required
882019 Major Project (Ramit)
httpslidepdfcomreaderfullmajor-project-ramit 5962
50
Table 94 Long term debtInterest Rate 125 per annum
Moratorium 2 years
Repayment Period 8 years
Tariff related assumptions and date of operations are tabulated below
Table 95 GBT and RTT Tariff Table 96 Life of the projectTariff Plan
Tariff (INRMonth)
No of
operators GBT RTT
1 28000 18000
2 22000 14000
3 0 12000
Annual
increase 3 3
Commercial Operation Date 1-Aug-09
Quarter Ending 30-Sep-09
FY ending COD 31-Mar-10
Project life years 15
End of commercial
operations31-Aug-24
Quarter ending commercial
operations30-Sep-24
FY ending comme rcial
operations31-Mar-25
882019 Major Project (Ramit)
httpslidepdfcomreaderfullmajor-project-ramit 6062
51
Annexure 2 Profit amp Loss accountsTable 97 Profit amp loss account statement
Income Statement (MNINR)Year ending Mar-10 Mar-11 Mar-12 Mar-13 Mar-14 Mar-15
RevenueGBT 406350 28811 89080 197447 379409 527015Operator Fees (GBT) 1411 10004 30678 67998 130664 179664RTT 1209 8575 27269 60443 116146 164264
Operator Fees (RTT) 440 3121 9739 21587 41481 56466Net Revenue 7124 50511 156766 347476 667700 927410
Expenses
VariableSecurity Sentries 1355 9790 28339 64033 125433 158238Supervisors 097 699 2024 4574 8959 11303Cluster Manager 048 350 10 12 2287 4480 5651AMC Cost of Generator 450 3013 7877 16719 31148 54541Sub-total 1950 13852 39252 87612 170021 229734
Fixed
Selling amp Maintenance(INRMonth) 032 050 053 056 058 061
Administration overhead(INRMonth) 080 128 137 147 157 168
Sub-total 112 179 190 203 216 230
EBITDA 5062 36480 117324 259661 497464 697447
Interest on LT loan - - 7341 31200 77479 156198Interest on ST loan - 021 060 130 245 361
EBDT 5062 36459 109923 228331 419739 540888Depreciation 2439 12769 35917 77162 142925 174006
EBT 2624 23691 74006 151169 276814 366881Income Tax 170 4233 14536 29073 53547 77634
PAT 2454 19458 59470 122096 223267 289247
882019 Major Project (Ramit)
httpslidepdfcomreaderfullmajor-project-ramit 6162
52
Annexure 3 Balance sheet
Table 98 B alance sheetsYearend Balance Sheet (MNINR)Year ending Mar-10 Mar-11 Mar-12 Mar-13 Mar-14 Mar-15
AssetsGross Block 75742 328216 833164 1716823 3105430 3105430Accumulated depreciation 2439 15208 51125 128287 271212 445218Net Block 73303 313009 782040 1588536 2834219 2660212Net Working Capital 064 241 620 1335 2515 3707Cash Balance 12979 72089 216513 488856 947982 1294734Total Assets 86346 385339 999172 2078727 3784715 3958653
LiabilitiesEquity 25168 108980 276604 569947 1030914 1030914Reserves amp Surplus 2454 21912 81381 203477 426745 715992Long term Debt 58725 254286 640722 1304302 2325171 2208967WC Borrowings - 161 465 1001 1886 2780Total Liabilities 86346 385339 999172 2078727 3784715 3958653
882019 Major Project (Ramit)
httpslidepdfcomreaderfullmajor-project-ramit 6262
Annexure 4 Cash flow statement
Table 99 Cash flow statements
Year ending Mar-10 Mar-11 Mar-12 Mar-13 Mar-14 Mar-15
InflowsPAT 2454 19458 59470 122096 223267 289247Depreciation 2439 12769 35917 77162 142925 174006Tax adjusted interest - 014 4959 20991 52076 104895Release of WC - - - - - -Salvage Value - - - - - -Sub-Total 4893 32241 100345 220249 418268 568148
OutflowsCapex 75742 252474 504948 883659 1388607 -Change in WorkingCapital 064 177 379 715 1180 1192
Sub-Total 75806 252651 505327 884374 1389787 1192
UFCF (70913) (220410) (404982) (664125) (971519) 566956LFCF (70913) (220424) (409940) (685116) (1023595) 462062
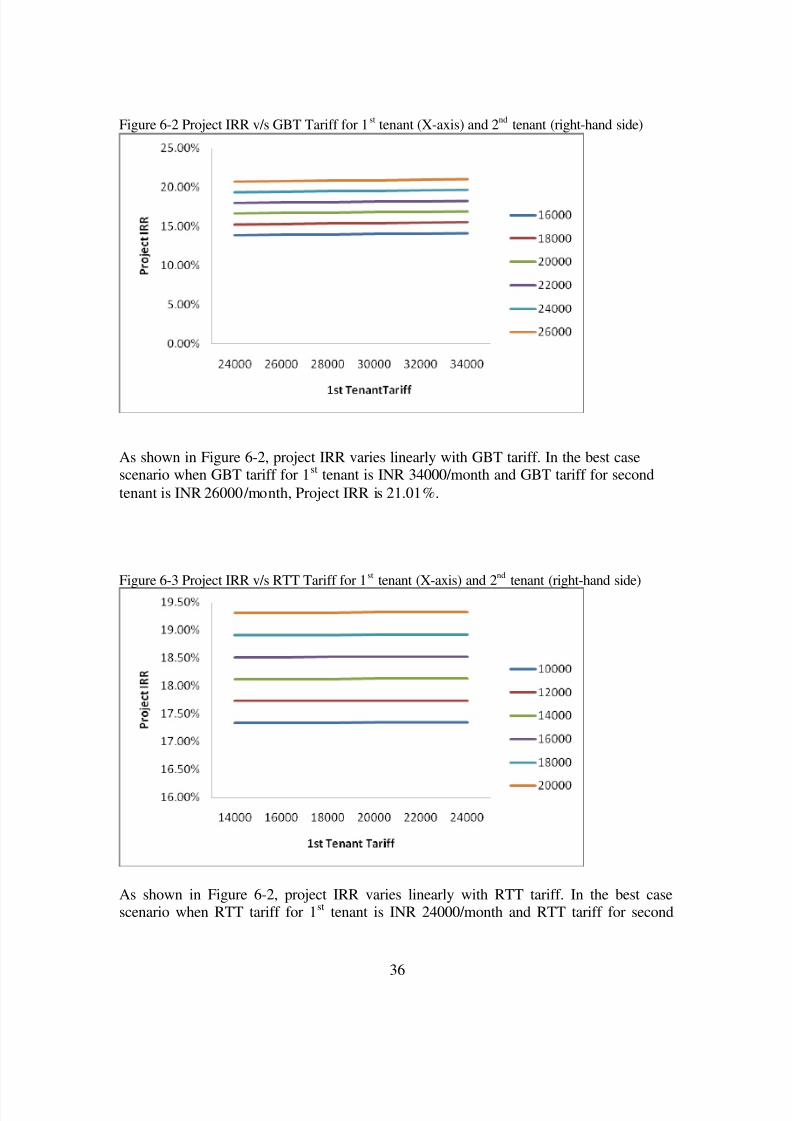
882019 Major Project (Ramit)
httpslidepdfcomreaderfullmajor-project-ramit 4562
36
Figure 6-2 Project IRR vs GBT Tariff for 1 st tenant (X-axis) and 2 nd tenant (right-hand side)
As shown in Figure 6-2 project IRR varies linearly with GBT tariff In the best casescenario when GBT tariff for 1 st tenant is INR 34000month and GBT tariff for secondtenant is INR 26000month Project IRR is 2101
Figure 6-3 Project IRR vs RTT Tariff for 1 st tenant (X-axis) and 2 nd tenant (right-hand side)
As shown in Figure 6-2 project IRR varies linearly with RTT tariff In the best casescenario when RTT tariff for 1 st tenant is INR 24000month and RTT tariff for second
882019 Major Project (Ramit)
httpslidepdfcomreaderfullmajor-project-ramit 4662
37
tenant is INR 20000month Project IRR is 1932 Project IRR is more sensitivetowards RTT tariff than GBT tariff because in practical business situation RTT siteshave a tenancy ratio of more than two due to which effect of tariff for 1 st tenant almostget nullified after few years
Figure 6-4 Project IRR vs Tenancy ratio for RTT sites (X-axis) and GBT sites
As shown in Figure 6-4 project IRR is very sensitive to tenancy ratio In the best casescenario where GBT sites have a tenancy ratio of 2 and RTT sites have a tenancy ratio of 3 project IRR can be as high as 20
Figure 6-5 Equity IRR vs long term debt interest rate for different leverage level
882019 Major Project (Ramit)
httpslidepdfcomreaderfullmajor-project-ramit 4762
38
As shown in figure 6-5 equity IRR is more sensitive to interest rate on long term debt forhigh level of leverage (lower debt equity ratio) because as the debt equity ratio increasesinterest paid on long term debt also increases significantly
Figure 6-6 Equity IRR vs long term debt repayment period at different level of moratoriumperiods
As shown in figure 6-6 Equity IRR increases with increase in moratorium period anddebt repayment period The variation is from 1654 to 60 for worst case and best casescenarios
882019 Major Project (Ramit)
httpslidepdfcomreaderfullmajor-project-ramit 4862
39
7 RISK ASSESSMENTRisk Mitigation strategyExecution Risk
(Project management landacquisition etc)
Management of ABC has proven expertise in
telecom infrastructure rollout and has executedvarious projects with large telecom operators andMNC vendorsABCrsquos top management team consists of a groupof professionals drawn from leading telecomInfrastructure Company who have immenseexpertise and experience in rolling out telecominfrastructure projects
Market Risk (No entry barriers operators may
share infrastructure betweenthemselves large players withhigh capital may increasecompetition)
India has a huge potential for telecominfrastructure market With increasing
competition falling tariffs and pressure onmargins telecom service providers are beingforced to increase their focus on marketing andreduce their expensesExperienced management healthy capital back-up effective presence in the telecominfrastructure market and value added services atrelatively lesser cost will help ABC to meet theset targets
Financing Risk
(Availability of equity capitalavailability of long term debtinterest rate and moratoriumperiod)
ABC is seeking private equity partner to secure
equity capital Company has already entered intoNDA with 2 major investorsLong term debt at an interest rate of 125 canbe easily arranged because of the credibility of the promoters in the marketMany other similar firms like Indus and GTLhave already secured long term debt for amoratorium period of 2 years Promoters of ABCLimited are confident to secure a long term debtwith a moratorium period of 2 years and apayback period of 8 years
ABC Limited would minimize the workingcapital requirements of its business by securingrentals and operating revenues in advance fromits clients and or by suitably structuring itspayment liabilities to match its cash inflows
Commercial Risk (Tenancy ratio and tariff forGBS and RTS)
ABC would aim to enter into long term contractswith the ldquoanchor tenantrdquo operator and thenrollout the infrastructure so that at least single
882019 Major Project (Ramit)
httpslidepdfcomreaderfullmajor-project-ramit 4962
40
occupancy of each site is ensured at all t imesPromoters will use its knowledge of the businessand its expertise to identify and roll out sites inlocations which have strong multi- tenancypotential to minimize occupancy risk
Revenue Risk (Operating fees may decreasecredit worthiness of the clientsdelay in payment of rentals)
As per the industry sources till now not even asingle operator have dishonored the long termlease contractThe credit risk is diversified as there will bemultiple operatorsABC would aggressively market to get 3G andWiFi broadcasters to use the sites and earnadditional revenues in addition to the assumedrevenue streams
Natural Calamities Risk The Company shall maintain insurance for thesites against these risks and the cost of insurancewill be priced in and passed on to the tenants
882019 Major Project (Ramit)
httpslidepdfcomreaderfullmajor-project-ramit 5062
41
8 CONCLUSION
India is the fastest growing wireless telecom market in the world The continuing
growth in the number of wireless subscribers and MoUs and increasing trend of
outsourcing of business processes to India has led to growing demand for large
investments in the telecom infrastructure in the country
However with increasing competition falling tariffs and pressure on margins
telecom service providers are being forced to increase their focus on marketing
customer acquisitions and branding and minimize their efforts and overheads in
project management and asset acquisition
Further with rising prices of steel cement and real estate the cost of developing
and owning passive infrastructure is increasingly becoming a costly proposition
for most operators and service providers
The compulsion on the part of service providers to reduce their operating costs
and capital expenditure requirements has led to opportunities in passiveinfrastructure outsourcing to independent third party infrastructure providers and
also sharing the infrastructure with other service providers It is expected that
cellular operators will outsource their communications site infrastructure needs as
a means of accelerating access to their markets and preserving capital rather than
constructing and operating their own communications sites and maintaining their
own communications sites service and deve lopment capabilities
Passive infrastructure is highly capital intensive and an integral part of the cellular
service providersrsquo networks Yet being a simple and low technology asset it is
amenable to outsourcing and sharing By transferring the responsibility of
ownership development and maintenance of passive infrastructure service
882019 Major Project (Ramit)
httpslidepdfcomreaderfullmajor-project-ramit 5162
42
providers have an opportunity to transfer a substantial part of their business risk to
third parties
Most telecom operators are facing capacity constraints on their networksCoverage obligations increasing pressure to improve network quality and
competition has led to aggressive roll out plans by existing cellular operators
Installation of cell sites has become a cumbersome process as there are a number
of clearances required and involves labor-intensive micro management
Availability of ready infrastructure from third party providers would enable the
operators to reduce their time to market and accelerate their access to their
customers Cellular service providers generally want to move quickly when
adding more sites and co-location on an existing site is always faster than
building
Ownership and maintenance of telecom towers and other infrastructure by third
parties is an established practice in developed nations like USA and is
increasingly gaining market acceptance in India
The Indian government is seriously considering promoting the infrastructure
sharing route between the telecom operator and private players to achieve future
national tele-density targets and improve rural telecom penetration
ABC being an independent entity with no business conflicts with other service
providers in the telecom space will be best positioned and have an early mover
advantage to capitalize on this emerging opportunity
Further the task of operating and maintaining the passive infrastructure in the cell
is increasingly becoming a cumbersome exercise for the service providers to
handle ABCrsquos composite offering to build passive infrastructure for the cellular
operators and also operate and maintain them will provide a turnkey solution to
address the infrastructure needs of the service providers
882019 Major Project (Ramit)
httpslidepdfcomreaderfullmajor-project-ramit 5262
43
The business model proposed to be followed by ABC is fairly simple with stable
and predictable cash flows as is the case with the business model of the tower
renting companies in USA Most contracts are long term for a period 10 or moreyears with annual price escalators generally ranging from 3 to 4 However
wireless carriers normally tend to renew rentals because suitable alternative sites
may not exist or be available and repositioning a site in a carrierrsquos network is
expensive and may adverse ly affect network quality
Site ownership and operations is a ldquoscalerdquo business operating administration
marketing expenses etc do not rise as quickly as revenues when portfolios are
expanded Incremental operating costs associated with adding wireless tenants to
a communications site are minimal Therefore as additional tenants are added to a
site the substantial majority of incremental revenue contributes to margin
expansion Most tower companies have high EBITDA margins as may be seen
from the financial indicators of some of the tower rental companies in USA
It is expected that site location and capacity price and quality of service and
successful execution of contracts will be the most significant competitive factors
in this business
ABCrsquos revenue and returns on investment will be primarily driven by its ability
to
o Increase the utilization of the space and infrastructure capacity owned by it by
increasing the number of tenants per site and renting out to maximum number
of users As discussed above return on capital employed (PIRR and EIRR) arevery sensitive to tenancy ratio In worst case scenario project IRR can be as
low as 8 and in the best case scenario it can be as high as 20
o Develop acquire sites of strategic importance and high growth potential that
will enable them to secure better commercial terms from users and attract
more number of tenants Infrastructure provisioning fees rentals for sites are
882019 Major Project (Ramit)
httpslidepdfcomreaderfullmajor-project-ramit 5362
44
extremely location sensitive There is a potential to acquire more land than
that of required to capitalize on the increase in real estate prices
o Develop sites in a cost effective manner ABC would consider purchasing
land only for those GBS sites which have sufficient demand and arestrategically located Else for most of its sites land will be leasehold As
shown above returns (PIRR and EIRR) are very sensitive to capital costs In
the worst case scenario project IRR can be as low as 15 whereas it can as
high as 27 in the best case scenario
o Negotiate and secure long term contracts with good credit quality users with
built in price escalation provisions to mitigate financing risk
o Leverage and secure long term financing at attractive terms and involve in
active treasury management to keep low financing cost Results of the
sensitivity analysis indicate that equity IRR can be as high as 60 foe a
moratorium period of 4 years and interest rate of 10
o Minimize working capital requirements
o Maintain low operating and administration expense
o Secure better OampM margins from operators and retain a healthy share of it in
ABC
o Maintain high service standards and build strong customer relationships
The business would have the potential to capture new revenue opportunities
around the existing assets As demand for towers is expected to grow and as
operators migrate to speedier next-generation wireless technologies they will
need the towers and associated passive infrastructure to transmit their new
services in addition to their existing offerings In addition to increasing capacity
and coverage and improving the quality of their networks cellular serviceproviders are deploying high speed data networks driving incremental demand of
sites The business therefore has potential upsides in the form of adding
customers (tenants) in wireless broadband third generation (ldquo3Grdquo) and wireless
data capabilities and also other incremental value propositions by way of hosting
882019 Major Project (Ramit)
httpslidepdfcomreaderfullmajor-project-ramit 5462
45
Billboards Hoardings etc in some of the high visible sites owned and maintained
by it
Based on the assumptions and subject to satisfactory resolution of the key risks
factors project cash flows will be able to meet debt service obligations
This business model is a lucrative investment option for a private equity player
because valuation of each site will increase in the coming years due to
improvement in market conditions increase in the value of land and increase in
the demand for passive infrastructure in rural and semi-urban areas
882019 Major Project (Ramit)
httpslidepdfcomreaderfullmajor-project-ramit 5562
46
REFERENCESAnjan G V A amp N M (2009) telecom infrastructure industry in india GurgaonICRA
Bessler W Norsworthy J amp Shusterman T (2001 12 1) Mergers in the UStelecommunications industry and market valuationeffects IEEE p 288
COAI (2009 march 14) Subscriber Figures Retrieved march 14 2009 fromCOAIcom httpwwwcoaicomstatisticsphp
IDA (2009 march 23) Highlights Retrieved march 23 2009 from idagovsghttpwwwidagovsghomeindexaspx
K R (2008) Time for new business model Delhi Cybermedia
MAXIS (2009 march 8) the malaysian telecommunications industry Retrieved march9 2009 from maxiscommyhttpwwwmaxiscommypersonalabout_usinvestorprospectusprospectus4pdf
P J amp Lisa A (2009) Stimulas spending and American Telecom Industry USACoracle group
PwC (2009 march 12) Indian Telecom Industry Gurgaon Harayana IndiaRamachanran (2009 march 1) Investment in Telecom Infrastructure sector (M RInterviewer)
Vogelsang I (2002) The German Telecommunications Reform Verein fuumlr Socialpolitik (p 26) Innsbruck Boston Press
882019 Major Project (Ramit)
httpslidepdfcomreaderfullmajor-project-ramit 5662
47
ANNEXURES
ANNEXURE 1 Key Assumptions
The occupancy of each site by single two three operators for green-field sites is assumed
to be as follows
Table 91 Expected Tenancy RatiosFY 10 FY 11 FY 12 FY 13 FY 14 FY15
GBT Tenant
Ratio 150 150 170 170 170 200
Single Operator 50 50 30 30 30 0
Two Operator 50 50 70 70 70 100
RTT Tenant
Ratio 170 170 200 200 200 250
Single Operator 30 30 0 0 0 0
Two Operator 70 70 100 100 100 50
Three Operator 0 0 0 0 0 50
From FY 15 onwards tenancy ratio of 2 and 25 for GBT and RTT sites is cons idered
882019 Major Project (Ramit)
httpslidepdfcomreaderfullmajor-project-ramit 5762
48
Capital costs related assumptions are tabulated below
Table 92 GBT and RTT Capital Cost
The lease rentals for RTT sites are reimbursed from the operators and therefore have not
been factored in the revenues as well as the expense For GBT sites land purchase cost of
035 millions assumed which has been escalated by 6 annually to determine the
salvage value of assets
GBT Capital Costs
Million
INR
Delivery cost of Ground Based
Tower (GBT)063
Delivery cost of Generator 030
Civil Work 040Shelter 012
Electrical Works 030
Other Equipments (UPS Battery
etc)045
Construction cost 045
Land 035
Contingency amp Financial Charges 035Total cost 335
RTT Capital Costs
Million
INR
Delivery cost of Roof Top
Tower (RTT) 030
Delivery cost of Generator 020
Civil Work 020Shelter 012
Electrical Works 030
Other Equipments (UPS
Battery etc) 030
Construction cost -
Land -
Contingency amp FinancialCharges 008
Total cost 150
882019 Major Project (Ramit)
httpslidepdfcomreaderfullmajor-project-ramit 5862
49
Ope rating costs related assumptions are tabulated below
Table 93 Operating CostsOperating Costs
Security Sentries (INRMonth) 4000
Supervisors (INRMonth) 6000
Cluster Manager One for Fifty Towers (INRMonth) 15000
Annual increase 500
Number of Security Sentries per tower 300
Number of supervisors per tower 010
Number of C luster manager per tower 002
Fixed Expenses
Selling amp Maintenance (INRMonth) 4000000
Annual Escalation 5
Administration overhead (INRMonth) 10000000Annual Escalation 7
AMC Cost of Generator 15 (cost of generator)
Annual Escalation (AMC) 3
For RTT sites security sentries are not required because it will be the responsibility of
the site owner A supervisor will for every 10 sites and a cluster manager for every 50
sites will be required
882019 Major Project (Ramit)
httpslidepdfcomreaderfullmajor-project-ramit 5962
50
Table 94 Long term debtInterest Rate 125 per annum
Moratorium 2 years
Repayment Period 8 years
Tariff related assumptions and date of operations are tabulated below
Table 95 GBT and RTT Tariff Table 96 Life of the projectTariff Plan
Tariff (INRMonth)
No of
operators GBT RTT
1 28000 18000
2 22000 14000
3 0 12000
Annual
increase 3 3
Commercial Operation Date 1-Aug-09
Quarter Ending 30-Sep-09
FY ending COD 31-Mar-10
Project life years 15
End of commercial
operations31-Aug-24
Quarter ending commercial
operations30-Sep-24
FY ending comme rcial
operations31-Mar-25
882019 Major Project (Ramit)
httpslidepdfcomreaderfullmajor-project-ramit 6062
51
Annexure 2 Profit amp Loss accountsTable 97 Profit amp loss account statement
Income Statement (MNINR)Year ending Mar-10 Mar-11 Mar-12 Mar-13 Mar-14 Mar-15
RevenueGBT 406350 28811 89080 197447 379409 527015Operator Fees (GBT) 1411 10004 30678 67998 130664 179664RTT 1209 8575 27269 60443 116146 164264
Operator Fees (RTT) 440 3121 9739 21587 41481 56466Net Revenue 7124 50511 156766 347476 667700 927410
Expenses
VariableSecurity Sentries 1355 9790 28339 64033 125433 158238Supervisors 097 699 2024 4574 8959 11303Cluster Manager 048 350 10 12 2287 4480 5651AMC Cost of Generator 450 3013 7877 16719 31148 54541Sub-total 1950 13852 39252 87612 170021 229734
Fixed
Selling amp Maintenance(INRMonth) 032 050 053 056 058 061
Administration overhead(INRMonth) 080 128 137 147 157 168
Sub-total 112 179 190 203 216 230
EBITDA 5062 36480 117324 259661 497464 697447
Interest on LT loan - - 7341 31200 77479 156198Interest on ST loan - 021 060 130 245 361
EBDT 5062 36459 109923 228331 419739 540888Depreciation 2439 12769 35917 77162 142925 174006
EBT 2624 23691 74006 151169 276814 366881Income Tax 170 4233 14536 29073 53547 77634
PAT 2454 19458 59470 122096 223267 289247
882019 Major Project (Ramit)
httpslidepdfcomreaderfullmajor-project-ramit 6162
52
Annexure 3 Balance sheet
Table 98 B alance sheetsYearend Balance Sheet (MNINR)Year ending Mar-10 Mar-11 Mar-12 Mar-13 Mar-14 Mar-15
AssetsGross Block 75742 328216 833164 1716823 3105430 3105430Accumulated depreciation 2439 15208 51125 128287 271212 445218Net Block 73303 313009 782040 1588536 2834219 2660212Net Working Capital 064 241 620 1335 2515 3707Cash Balance 12979 72089 216513 488856 947982 1294734Total Assets 86346 385339 999172 2078727 3784715 3958653
LiabilitiesEquity 25168 108980 276604 569947 1030914 1030914Reserves amp Surplus 2454 21912 81381 203477 426745 715992Long term Debt 58725 254286 640722 1304302 2325171 2208967WC Borrowings - 161 465 1001 1886 2780Total Liabilities 86346 385339 999172 2078727 3784715 3958653
882019 Major Project (Ramit)
httpslidepdfcomreaderfullmajor-project-ramit 6262
Annexure 4 Cash flow statement
Table 99 Cash flow statements
Year ending Mar-10 Mar-11 Mar-12 Mar-13 Mar-14 Mar-15
InflowsPAT 2454 19458 59470 122096 223267 289247Depreciation 2439 12769 35917 77162 142925 174006Tax adjusted interest - 014 4959 20991 52076 104895Release of WC - - - - - -Salvage Value - - - - - -Sub-Total 4893 32241 100345 220249 418268 568148
OutflowsCapex 75742 252474 504948 883659 1388607 -Change in WorkingCapital 064 177 379 715 1180 1192
Sub-Total 75806 252651 505327 884374 1389787 1192
UFCF (70913) (220410) (404982) (664125) (971519) 566956LFCF (70913) (220424) (409940) (685116) (1023595) 462062
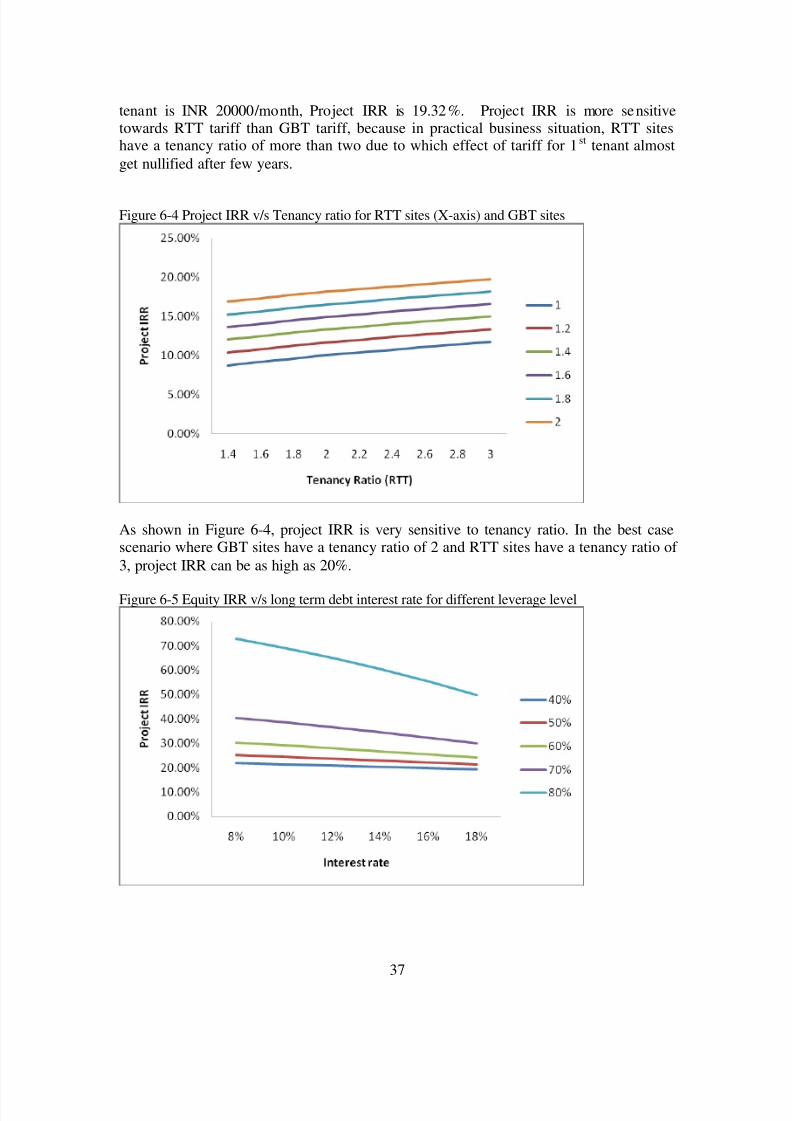
882019 Major Project (Ramit)
httpslidepdfcomreaderfullmajor-project-ramit 4662
37
tenant is INR 20000month Project IRR is 1932 Project IRR is more sensitivetowards RTT tariff than GBT tariff because in practical business situation RTT siteshave a tenancy ratio of more than two due to which effect of tariff for 1 st tenant almostget nullified after few years
Figure 6-4 Project IRR vs Tenancy ratio for RTT sites (X-axis) and GBT sites
As shown in Figure 6-4 project IRR is very sensitive to tenancy ratio In the best casescenario where GBT sites have a tenancy ratio of 2 and RTT sites have a tenancy ratio of 3 project IRR can be as high as 20
Figure 6-5 Equity IRR vs long term debt interest rate for different leverage level
882019 Major Project (Ramit)
httpslidepdfcomreaderfullmajor-project-ramit 4762
38
As shown in figure 6-5 equity IRR is more sensitive to interest rate on long term debt forhigh level of leverage (lower debt equity ratio) because as the debt equity ratio increasesinterest paid on long term debt also increases significantly
Figure 6-6 Equity IRR vs long term debt repayment period at different level of moratoriumperiods
As shown in figure 6-6 Equity IRR increases with increase in moratorium period anddebt repayment period The variation is from 1654 to 60 for worst case and best casescenarios
882019 Major Project (Ramit)
httpslidepdfcomreaderfullmajor-project-ramit 4862
39
7 RISK ASSESSMENTRisk Mitigation strategyExecution Risk
(Project management landacquisition etc)
Management of ABC has proven expertise in
telecom infrastructure rollout and has executedvarious projects with large telecom operators andMNC vendorsABCrsquos top management team consists of a groupof professionals drawn from leading telecomInfrastructure Company who have immenseexpertise and experience in rolling out telecominfrastructure projects
Market Risk (No entry barriers operators may
share infrastructure betweenthemselves large players withhigh capital may increasecompetition)
India has a huge potential for telecominfrastructure market With increasing
competition falling tariffs and pressure onmargins telecom service providers are beingforced to increase their focus on marketing andreduce their expensesExperienced management healthy capital back-up effective presence in the telecominfrastructure market and value added services atrelatively lesser cost will help ABC to meet theset targets
Financing Risk
(Availability of equity capitalavailability of long term debtinterest rate and moratoriumperiod)
ABC is seeking private equity partner to secure
equity capital Company has already entered intoNDA with 2 major investorsLong term debt at an interest rate of 125 canbe easily arranged because of the credibility of the promoters in the marketMany other similar firms like Indus and GTLhave already secured long term debt for amoratorium period of 2 years Promoters of ABCLimited are confident to secure a long term debtwith a moratorium period of 2 years and apayback period of 8 years
ABC Limited would minimize the workingcapital requirements of its business by securingrentals and operating revenues in advance fromits clients and or by suitably structuring itspayment liabilities to match its cash inflows
Commercial Risk (Tenancy ratio and tariff forGBS and RTS)
ABC would aim to enter into long term contractswith the ldquoanchor tenantrdquo operator and thenrollout the infrastructure so that at least single
882019 Major Project (Ramit)
httpslidepdfcomreaderfullmajor-project-ramit 4962
40
occupancy of each site is ensured at all t imesPromoters will use its knowledge of the businessand its expertise to identify and roll out sites inlocations which have strong multi- tenancypotential to minimize occupancy risk
Revenue Risk (Operating fees may decreasecredit worthiness of the clientsdelay in payment of rentals)
As per the industry sources till now not even asingle operator have dishonored the long termlease contractThe credit risk is diversified as there will bemultiple operatorsABC would aggressively market to get 3G andWiFi broadcasters to use the sites and earnadditional revenues in addition to the assumedrevenue streams
Natural Calamities Risk The Company shall maintain insurance for thesites against these risks and the cost of insurancewill be priced in and passed on to the tenants
882019 Major Project (Ramit)
httpslidepdfcomreaderfullmajor-project-ramit 5062
41
8 CONCLUSION
India is the fastest growing wireless telecom market in the world The continuing
growth in the number of wireless subscribers and MoUs and increasing trend of
outsourcing of business processes to India has led to growing demand for large
investments in the telecom infrastructure in the country
However with increasing competition falling tariffs and pressure on margins
telecom service providers are being forced to increase their focus on marketing
customer acquisitions and branding and minimize their efforts and overheads in
project management and asset acquisition
Further with rising prices of steel cement and real estate the cost of developing
and owning passive infrastructure is increasingly becoming a costly proposition
for most operators and service providers
The compulsion on the part of service providers to reduce their operating costs
and capital expenditure requirements has led to opportunities in passiveinfrastructure outsourcing to independent third party infrastructure providers and
also sharing the infrastructure with other service providers It is expected that
cellular operators will outsource their communications site infrastructure needs as
a means of accelerating access to their markets and preserving capital rather than
constructing and operating their own communications sites and maintaining their
own communications sites service and deve lopment capabilities
Passive infrastructure is highly capital intensive and an integral part of the cellular
service providersrsquo networks Yet being a simple and low technology asset it is
amenable to outsourcing and sharing By transferring the responsibility of
ownership development and maintenance of passive infrastructure service
882019 Major Project (Ramit)
httpslidepdfcomreaderfullmajor-project-ramit 5162
42
providers have an opportunity to transfer a substantial part of their business risk to
third parties
Most telecom operators are facing capacity constraints on their networksCoverage obligations increasing pressure to improve network quality and
competition has led to aggressive roll out plans by existing cellular operators
Installation of cell sites has become a cumbersome process as there are a number
of clearances required and involves labor-intensive micro management
Availability of ready infrastructure from third party providers would enable the
operators to reduce their time to market and accelerate their access to their
customers Cellular service providers generally want to move quickly when
adding more sites and co-location on an existing site is always faster than
building
Ownership and maintenance of telecom towers and other infrastructure by third
parties is an established practice in developed nations like USA and is
increasingly gaining market acceptance in India
The Indian government is seriously considering promoting the infrastructure
sharing route between the telecom operator and private players to achieve future
national tele-density targets and improve rural telecom penetration
ABC being an independent entity with no business conflicts with other service
providers in the telecom space will be best positioned and have an early mover
advantage to capitalize on this emerging opportunity
Further the task of operating and maintaining the passive infrastructure in the cell
is increasingly becoming a cumbersome exercise for the service providers to
handle ABCrsquos composite offering to build passive infrastructure for the cellular
operators and also operate and maintain them will provide a turnkey solution to
address the infrastructure needs of the service providers
882019 Major Project (Ramit)
httpslidepdfcomreaderfullmajor-project-ramit 5262
43
The business model proposed to be followed by ABC is fairly simple with stable
and predictable cash flows as is the case with the business model of the tower
renting companies in USA Most contracts are long term for a period 10 or moreyears with annual price escalators generally ranging from 3 to 4 However
wireless carriers normally tend to renew rentals because suitable alternative sites
may not exist or be available and repositioning a site in a carrierrsquos network is
expensive and may adverse ly affect network quality
Site ownership and operations is a ldquoscalerdquo business operating administration
marketing expenses etc do not rise as quickly as revenues when portfolios are
expanded Incremental operating costs associated with adding wireless tenants to
a communications site are minimal Therefore as additional tenants are added to a
site the substantial majority of incremental revenue contributes to margin
expansion Most tower companies have high EBITDA margins as may be seen
from the financial indicators of some of the tower rental companies in USA
It is expected that site location and capacity price and quality of service and
successful execution of contracts will be the most significant competitive factors
in this business
ABCrsquos revenue and returns on investment will be primarily driven by its ability
to
o Increase the utilization of the space and infrastructure capacity owned by it by
increasing the number of tenants per site and renting out to maximum number
of users As discussed above return on capital employed (PIRR and EIRR) arevery sensitive to tenancy ratio In worst case scenario project IRR can be as
low as 8 and in the best case scenario it can be as high as 20
o Develop acquire sites of strategic importance and high growth potential that
will enable them to secure better commercial terms from users and attract
more number of tenants Infrastructure provisioning fees rentals for sites are
882019 Major Project (Ramit)
httpslidepdfcomreaderfullmajor-project-ramit 5362
44
extremely location sensitive There is a potential to acquire more land than
that of required to capitalize on the increase in real estate prices
o Develop sites in a cost effective manner ABC would consider purchasing
land only for those GBS sites which have sufficient demand and arestrategically located Else for most of its sites land will be leasehold As
shown above returns (PIRR and EIRR) are very sensitive to capital costs In
the worst case scenario project IRR can be as low as 15 whereas it can as
high as 27 in the best case scenario
o Negotiate and secure long term contracts with good credit quality users with
built in price escalation provisions to mitigate financing risk
o Leverage and secure long term financing at attractive terms and involve in
active treasury management to keep low financing cost Results of the
sensitivity analysis indicate that equity IRR can be as high as 60 foe a
moratorium period of 4 years and interest rate of 10
o Minimize working capital requirements
o Maintain low operating and administration expense
o Secure better OampM margins from operators and retain a healthy share of it in
ABC
o Maintain high service standards and build strong customer relationships
The business would have the potential to capture new revenue opportunities
around the existing assets As demand for towers is expected to grow and as
operators migrate to speedier next-generation wireless technologies they will
need the towers and associated passive infrastructure to transmit their new
services in addition to their existing offerings In addition to increasing capacity
and coverage and improving the quality of their networks cellular serviceproviders are deploying high speed data networks driving incremental demand of
sites The business therefore has potential upsides in the form of adding
customers (tenants) in wireless broadband third generation (ldquo3Grdquo) and wireless
data capabilities and also other incremental value propositions by way of hosting
882019 Major Project (Ramit)
httpslidepdfcomreaderfullmajor-project-ramit 5462
45
Billboards Hoardings etc in some of the high visible sites owned and maintained
by it
Based on the assumptions and subject to satisfactory resolution of the key risks
factors project cash flows will be able to meet debt service obligations
This business model is a lucrative investment option for a private equity player
because valuation of each site will increase in the coming years due to
improvement in market conditions increase in the value of land and increase in
the demand for passive infrastructure in rural and semi-urban areas
882019 Major Project (Ramit)
httpslidepdfcomreaderfullmajor-project-ramit 5562
46
REFERENCESAnjan G V A amp N M (2009) telecom infrastructure industry in india GurgaonICRA
Bessler W Norsworthy J amp Shusterman T (2001 12 1) Mergers in the UStelecommunications industry and market valuationeffects IEEE p 288
COAI (2009 march 14) Subscriber Figures Retrieved march 14 2009 fromCOAIcom httpwwwcoaicomstatisticsphp
IDA (2009 march 23) Highlights Retrieved march 23 2009 from idagovsghttpwwwidagovsghomeindexaspx
K R (2008) Time for new business model Delhi Cybermedia
MAXIS (2009 march 8) the malaysian telecommunications industry Retrieved march9 2009 from maxiscommyhttpwwwmaxiscommypersonalabout_usinvestorprospectusprospectus4pdf
P J amp Lisa A (2009) Stimulas spending and American Telecom Industry USACoracle group
PwC (2009 march 12) Indian Telecom Industry Gurgaon Harayana IndiaRamachanran (2009 march 1) Investment in Telecom Infrastructure sector (M RInterviewer)
Vogelsang I (2002) The German Telecommunications Reform Verein fuumlr Socialpolitik (p 26) Innsbruck Boston Press
882019 Major Project (Ramit)
httpslidepdfcomreaderfullmajor-project-ramit 5662
47
ANNEXURES
ANNEXURE 1 Key Assumptions
The occupancy of each site by single two three operators for green-field sites is assumed
to be as follows
Table 91 Expected Tenancy RatiosFY 10 FY 11 FY 12 FY 13 FY 14 FY15
GBT Tenant
Ratio 150 150 170 170 170 200
Single Operator 50 50 30 30 30 0
Two Operator 50 50 70 70 70 100
RTT Tenant
Ratio 170 170 200 200 200 250
Single Operator 30 30 0 0 0 0
Two Operator 70 70 100 100 100 50
Three Operator 0 0 0 0 0 50
From FY 15 onwards tenancy ratio of 2 and 25 for GBT and RTT sites is cons idered
882019 Major Project (Ramit)
httpslidepdfcomreaderfullmajor-project-ramit 5762
48
Capital costs related assumptions are tabulated below
Table 92 GBT and RTT Capital Cost
The lease rentals for RTT sites are reimbursed from the operators and therefore have not
been factored in the revenues as well as the expense For GBT sites land purchase cost of
035 millions assumed which has been escalated by 6 annually to determine the
salvage value of assets
GBT Capital Costs
Million
INR
Delivery cost of Ground Based
Tower (GBT)063
Delivery cost of Generator 030
Civil Work 040Shelter 012
Electrical Works 030
Other Equipments (UPS Battery
etc)045
Construction cost 045
Land 035
Contingency amp Financial Charges 035Total cost 335
RTT Capital Costs
Million
INR
Delivery cost of Roof Top
Tower (RTT) 030
Delivery cost of Generator 020
Civil Work 020Shelter 012
Electrical Works 030
Other Equipments (UPS
Battery etc) 030
Construction cost -
Land -
Contingency amp FinancialCharges 008
Total cost 150
882019 Major Project (Ramit)
httpslidepdfcomreaderfullmajor-project-ramit 5862
49
Ope rating costs related assumptions are tabulated below
Table 93 Operating CostsOperating Costs
Security Sentries (INRMonth) 4000
Supervisors (INRMonth) 6000
Cluster Manager One for Fifty Towers (INRMonth) 15000
Annual increase 500
Number of Security Sentries per tower 300
Number of supervisors per tower 010
Number of C luster manager per tower 002
Fixed Expenses
Selling amp Maintenance (INRMonth) 4000000
Annual Escalation 5
Administration overhead (INRMonth) 10000000Annual Escalation 7
AMC Cost of Generator 15 (cost of generator)
Annual Escalation (AMC) 3
For RTT sites security sentries are not required because it will be the responsibility of
the site owner A supervisor will for every 10 sites and a cluster manager for every 50
sites will be required
882019 Major Project (Ramit)
httpslidepdfcomreaderfullmajor-project-ramit 5962
50
Table 94 Long term debtInterest Rate 125 per annum
Moratorium 2 years
Repayment Period 8 years
Tariff related assumptions and date of operations are tabulated below
Table 95 GBT and RTT Tariff Table 96 Life of the projectTariff Plan
Tariff (INRMonth)
No of
operators GBT RTT
1 28000 18000
2 22000 14000
3 0 12000
Annual
increase 3 3
Commercial Operation Date 1-Aug-09
Quarter Ending 30-Sep-09
FY ending COD 31-Mar-10
Project life years 15
End of commercial
operations31-Aug-24
Quarter ending commercial
operations30-Sep-24
FY ending comme rcial
operations31-Mar-25
882019 Major Project (Ramit)
httpslidepdfcomreaderfullmajor-project-ramit 6062
51
Annexure 2 Profit amp Loss accountsTable 97 Profit amp loss account statement
Income Statement (MNINR)Year ending Mar-10 Mar-11 Mar-12 Mar-13 Mar-14 Mar-15
RevenueGBT 406350 28811 89080 197447 379409 527015Operator Fees (GBT) 1411 10004 30678 67998 130664 179664RTT 1209 8575 27269 60443 116146 164264
Operator Fees (RTT) 440 3121 9739 21587 41481 56466Net Revenue 7124 50511 156766 347476 667700 927410
Expenses
VariableSecurity Sentries 1355 9790 28339 64033 125433 158238Supervisors 097 699 2024 4574 8959 11303Cluster Manager 048 350 10 12 2287 4480 5651AMC Cost of Generator 450 3013 7877 16719 31148 54541Sub-total 1950 13852 39252 87612 170021 229734
Fixed
Selling amp Maintenance(INRMonth) 032 050 053 056 058 061
Administration overhead(INRMonth) 080 128 137 147 157 168
Sub-total 112 179 190 203 216 230
EBITDA 5062 36480 117324 259661 497464 697447
Interest on LT loan - - 7341 31200 77479 156198Interest on ST loan - 021 060 130 245 361
EBDT 5062 36459 109923 228331 419739 540888Depreciation 2439 12769 35917 77162 142925 174006
EBT 2624 23691 74006 151169 276814 366881Income Tax 170 4233 14536 29073 53547 77634
PAT 2454 19458 59470 122096 223267 289247
882019 Major Project (Ramit)
httpslidepdfcomreaderfullmajor-project-ramit 6162
52
Annexure 3 Balance sheet
Table 98 B alance sheetsYearend Balance Sheet (MNINR)Year ending Mar-10 Mar-11 Mar-12 Mar-13 Mar-14 Mar-15
AssetsGross Block 75742 328216 833164 1716823 3105430 3105430Accumulated depreciation 2439 15208 51125 128287 271212 445218Net Block 73303 313009 782040 1588536 2834219 2660212Net Working Capital 064 241 620 1335 2515 3707Cash Balance 12979 72089 216513 488856 947982 1294734Total Assets 86346 385339 999172 2078727 3784715 3958653
LiabilitiesEquity 25168 108980 276604 569947 1030914 1030914Reserves amp Surplus 2454 21912 81381 203477 426745 715992Long term Debt 58725 254286 640722 1304302 2325171 2208967WC Borrowings - 161 465 1001 1886 2780Total Liabilities 86346 385339 999172 2078727 3784715 3958653
882019 Major Project (Ramit)
httpslidepdfcomreaderfullmajor-project-ramit 6262
Annexure 4 Cash flow statement
Table 99 Cash flow statements
Year ending Mar-10 Mar-11 Mar-12 Mar-13 Mar-14 Mar-15
InflowsPAT 2454 19458 59470 122096 223267 289247Depreciation 2439 12769 35917 77162 142925 174006Tax adjusted interest - 014 4959 20991 52076 104895Release of WC - - - - - -Salvage Value - - - - - -Sub-Total 4893 32241 100345 220249 418268 568148
OutflowsCapex 75742 252474 504948 883659 1388607 -Change in WorkingCapital 064 177 379 715 1180 1192
Sub-Total 75806 252651 505327 884374 1389787 1192
UFCF (70913) (220410) (404982) (664125) (971519) 566956LFCF (70913) (220424) (409940) (685116) (1023595) 462062
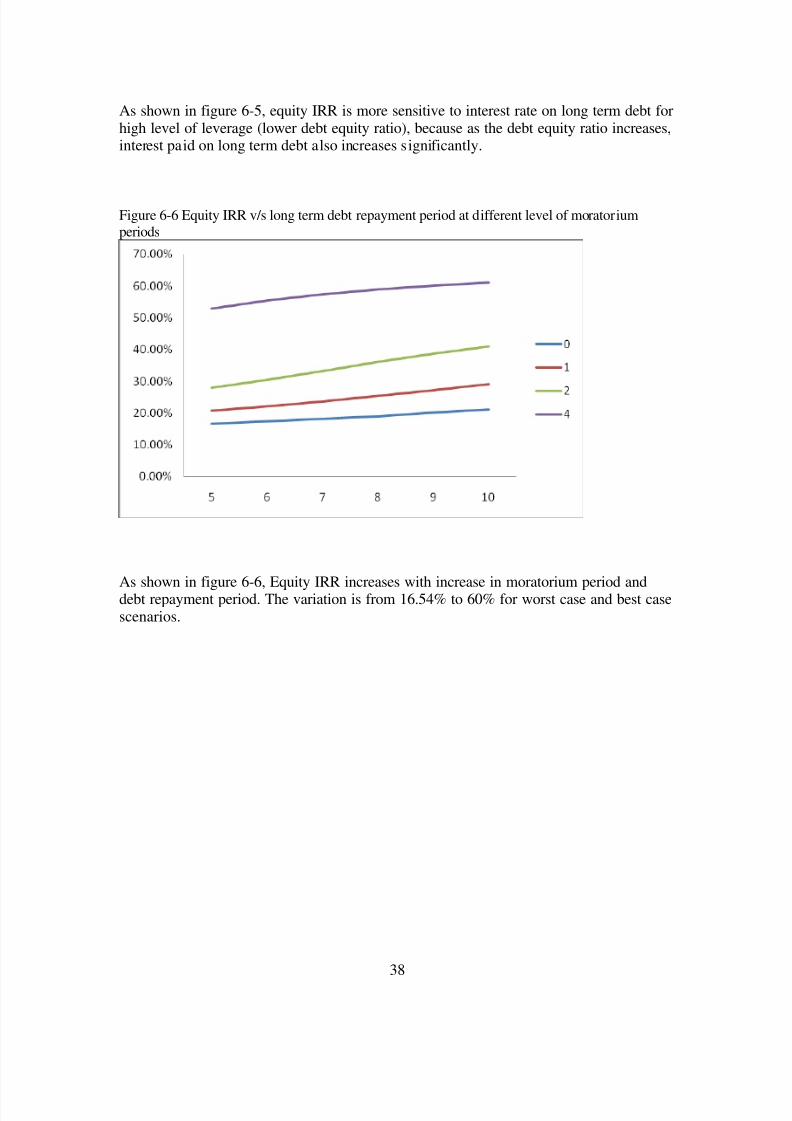
882019 Major Project (Ramit)
httpslidepdfcomreaderfullmajor-project-ramit 4762
38
As shown in figure 6-5 equity IRR is more sensitive to interest rate on long term debt forhigh level of leverage (lower debt equity ratio) because as the debt equity ratio increasesinterest paid on long term debt also increases significantly
Figure 6-6 Equity IRR vs long term debt repayment period at different level of moratoriumperiods
As shown in figure 6-6 Equity IRR increases with increase in moratorium period anddebt repayment period The variation is from 1654 to 60 for worst case and best casescenarios
882019 Major Project (Ramit)
httpslidepdfcomreaderfullmajor-project-ramit 4862
39
7 RISK ASSESSMENTRisk Mitigation strategyExecution Risk
(Project management landacquisition etc)
Management of ABC has proven expertise in
telecom infrastructure rollout and has executedvarious projects with large telecom operators andMNC vendorsABCrsquos top management team consists of a groupof professionals drawn from leading telecomInfrastructure Company who have immenseexpertise and experience in rolling out telecominfrastructure projects
Market Risk (No entry barriers operators may
share infrastructure betweenthemselves large players withhigh capital may increasecompetition)
India has a huge potential for telecominfrastructure market With increasing
competition falling tariffs and pressure onmargins telecom service providers are beingforced to increase their focus on marketing andreduce their expensesExperienced management healthy capital back-up effective presence in the telecominfrastructure market and value added services atrelatively lesser cost will help ABC to meet theset targets
Financing Risk
(Availability of equity capitalavailability of long term debtinterest rate and moratoriumperiod)
ABC is seeking private equity partner to secure
equity capital Company has already entered intoNDA with 2 major investorsLong term debt at an interest rate of 125 canbe easily arranged because of the credibility of the promoters in the marketMany other similar firms like Indus and GTLhave already secured long term debt for amoratorium period of 2 years Promoters of ABCLimited are confident to secure a long term debtwith a moratorium period of 2 years and apayback period of 8 years
ABC Limited would minimize the workingcapital requirements of its business by securingrentals and operating revenues in advance fromits clients and or by suitably structuring itspayment liabilities to match its cash inflows
Commercial Risk (Tenancy ratio and tariff forGBS and RTS)
ABC would aim to enter into long term contractswith the ldquoanchor tenantrdquo operator and thenrollout the infrastructure so that at least single
882019 Major Project (Ramit)
httpslidepdfcomreaderfullmajor-project-ramit 4962
40
occupancy of each site is ensured at all t imesPromoters will use its knowledge of the businessand its expertise to identify and roll out sites inlocations which have strong multi- tenancypotential to minimize occupancy risk
Revenue Risk (Operating fees may decreasecredit worthiness of the clientsdelay in payment of rentals)
As per the industry sources till now not even asingle operator have dishonored the long termlease contractThe credit risk is diversified as there will bemultiple operatorsABC would aggressively market to get 3G andWiFi broadcasters to use the sites and earnadditional revenues in addition to the assumedrevenue streams
Natural Calamities Risk The Company shall maintain insurance for thesites against these risks and the cost of insurancewill be priced in and passed on to the tenants
882019 Major Project (Ramit)
httpslidepdfcomreaderfullmajor-project-ramit 5062
41
8 CONCLUSION
India is the fastest growing wireless telecom market in the world The continuing
growth in the number of wireless subscribers and MoUs and increasing trend of
outsourcing of business processes to India has led to growing demand for large
investments in the telecom infrastructure in the country
However with increasing competition falling tariffs and pressure on margins
telecom service providers are being forced to increase their focus on marketing
customer acquisitions and branding and minimize their efforts and overheads in
project management and asset acquisition
Further with rising prices of steel cement and real estate the cost of developing
and owning passive infrastructure is increasingly becoming a costly proposition
for most operators and service providers
The compulsion on the part of service providers to reduce their operating costs
and capital expenditure requirements has led to opportunities in passiveinfrastructure outsourcing to independent third party infrastructure providers and
also sharing the infrastructure with other service providers It is expected that
cellular operators will outsource their communications site infrastructure needs as
a means of accelerating access to their markets and preserving capital rather than
constructing and operating their own communications sites and maintaining their
own communications sites service and deve lopment capabilities
Passive infrastructure is highly capital intensive and an integral part of the cellular
service providersrsquo networks Yet being a simple and low technology asset it is
amenable to outsourcing and sharing By transferring the responsibility of
ownership development and maintenance of passive infrastructure service
882019 Major Project (Ramit)
httpslidepdfcomreaderfullmajor-project-ramit 5162
42
providers have an opportunity to transfer a substantial part of their business risk to
third parties
Most telecom operators are facing capacity constraints on their networksCoverage obligations increasing pressure to improve network quality and
competition has led to aggressive roll out plans by existing cellular operators
Installation of cell sites has become a cumbersome process as there are a number
of clearances required and involves labor-intensive micro management
Availability of ready infrastructure from third party providers would enable the
operators to reduce their time to market and accelerate their access to their
customers Cellular service providers generally want to move quickly when
adding more sites and co-location on an existing site is always faster than
building
Ownership and maintenance of telecom towers and other infrastructure by third
parties is an established practice in developed nations like USA and is
increasingly gaining market acceptance in India
The Indian government is seriously considering promoting the infrastructure
sharing route between the telecom operator and private players to achieve future
national tele-density targets and improve rural telecom penetration
ABC being an independent entity with no business conflicts with other service
providers in the telecom space will be best positioned and have an early mover
advantage to capitalize on this emerging opportunity
Further the task of operating and maintaining the passive infrastructure in the cell
is increasingly becoming a cumbersome exercise for the service providers to
handle ABCrsquos composite offering to build passive infrastructure for the cellular
operators and also operate and maintain them will provide a turnkey solution to
address the infrastructure needs of the service providers
882019 Major Project (Ramit)
httpslidepdfcomreaderfullmajor-project-ramit 5262
43
The business model proposed to be followed by ABC is fairly simple with stable
and predictable cash flows as is the case with the business model of the tower
renting companies in USA Most contracts are long term for a period 10 or moreyears with annual price escalators generally ranging from 3 to 4 However
wireless carriers normally tend to renew rentals because suitable alternative sites
may not exist or be available and repositioning a site in a carrierrsquos network is
expensive and may adverse ly affect network quality
Site ownership and operations is a ldquoscalerdquo business operating administration
marketing expenses etc do not rise as quickly as revenues when portfolios are
expanded Incremental operating costs associated with adding wireless tenants to
a communications site are minimal Therefore as additional tenants are added to a
site the substantial majority of incremental revenue contributes to margin
expansion Most tower companies have high EBITDA margins as may be seen
from the financial indicators of some of the tower rental companies in USA
It is expected that site location and capacity price and quality of service and
successful execution of contracts will be the most significant competitive factors
in this business
ABCrsquos revenue and returns on investment will be primarily driven by its ability
to
o Increase the utilization of the space and infrastructure capacity owned by it by
increasing the number of tenants per site and renting out to maximum number
of users As discussed above return on capital employed (PIRR and EIRR) arevery sensitive to tenancy ratio In worst case scenario project IRR can be as
low as 8 and in the best case scenario it can be as high as 20
o Develop acquire sites of strategic importance and high growth potential that
will enable them to secure better commercial terms from users and attract
more number of tenants Infrastructure provisioning fees rentals for sites are
882019 Major Project (Ramit)
httpslidepdfcomreaderfullmajor-project-ramit 5362
44
extremely location sensitive There is a potential to acquire more land than
that of required to capitalize on the increase in real estate prices
o Develop sites in a cost effective manner ABC would consider purchasing
land only for those GBS sites which have sufficient demand and arestrategically located Else for most of its sites land will be leasehold As
shown above returns (PIRR and EIRR) are very sensitive to capital costs In
the worst case scenario project IRR can be as low as 15 whereas it can as
high as 27 in the best case scenario
o Negotiate and secure long term contracts with good credit quality users with
built in price escalation provisions to mitigate financing risk
o Leverage and secure long term financing at attractive terms and involve in
active treasury management to keep low financing cost Results of the
sensitivity analysis indicate that equity IRR can be as high as 60 foe a
moratorium period of 4 years and interest rate of 10
o Minimize working capital requirements
o Maintain low operating and administration expense
o Secure better OampM margins from operators and retain a healthy share of it in
ABC
o Maintain high service standards and build strong customer relationships
The business would have the potential to capture new revenue opportunities
around the existing assets As demand for towers is expected to grow and as
operators migrate to speedier next-generation wireless technologies they will
need the towers and associated passive infrastructure to transmit their new
services in addition to their existing offerings In addition to increasing capacity
and coverage and improving the quality of their networks cellular serviceproviders are deploying high speed data networks driving incremental demand of
sites The business therefore has potential upsides in the form of adding
customers (tenants) in wireless broadband third generation (ldquo3Grdquo) and wireless
data capabilities and also other incremental value propositions by way of hosting
882019 Major Project (Ramit)
httpslidepdfcomreaderfullmajor-project-ramit 5462
45
Billboards Hoardings etc in some of the high visible sites owned and maintained
by it
Based on the assumptions and subject to satisfactory resolution of the key risks
factors project cash flows will be able to meet debt service obligations
This business model is a lucrative investment option for a private equity player
because valuation of each site will increase in the coming years due to
improvement in market conditions increase in the value of land and increase in
the demand for passive infrastructure in rural and semi-urban areas
882019 Major Project (Ramit)
httpslidepdfcomreaderfullmajor-project-ramit 5562
46
REFERENCESAnjan G V A amp N M (2009) telecom infrastructure industry in india GurgaonICRA
Bessler W Norsworthy J amp Shusterman T (2001 12 1) Mergers in the UStelecommunications industry and market valuationeffects IEEE p 288
COAI (2009 march 14) Subscriber Figures Retrieved march 14 2009 fromCOAIcom httpwwwcoaicomstatisticsphp
IDA (2009 march 23) Highlights Retrieved march 23 2009 from idagovsghttpwwwidagovsghomeindexaspx
K R (2008) Time for new business model Delhi Cybermedia
MAXIS (2009 march 8) the malaysian telecommunications industry Retrieved march9 2009 from maxiscommyhttpwwwmaxiscommypersonalabout_usinvestorprospectusprospectus4pdf
P J amp Lisa A (2009) Stimulas spending and American Telecom Industry USACoracle group
PwC (2009 march 12) Indian Telecom Industry Gurgaon Harayana IndiaRamachanran (2009 march 1) Investment in Telecom Infrastructure sector (M RInterviewer)
Vogelsang I (2002) The German Telecommunications Reform Verein fuumlr Socialpolitik (p 26) Innsbruck Boston Press
882019 Major Project (Ramit)
httpslidepdfcomreaderfullmajor-project-ramit 5662
47
ANNEXURES
ANNEXURE 1 Key Assumptions
The occupancy of each site by single two three operators for green-field sites is assumed
to be as follows
Table 91 Expected Tenancy RatiosFY 10 FY 11 FY 12 FY 13 FY 14 FY15
GBT Tenant
Ratio 150 150 170 170 170 200
Single Operator 50 50 30 30 30 0
Two Operator 50 50 70 70 70 100
RTT Tenant
Ratio 170 170 200 200 200 250
Single Operator 30 30 0 0 0 0
Two Operator 70 70 100 100 100 50
Three Operator 0 0 0 0 0 50
From FY 15 onwards tenancy ratio of 2 and 25 for GBT and RTT sites is cons idered
882019 Major Project (Ramit)
httpslidepdfcomreaderfullmajor-project-ramit 5762
48
Capital costs related assumptions are tabulated below
Table 92 GBT and RTT Capital Cost
The lease rentals for RTT sites are reimbursed from the operators and therefore have not
been factored in the revenues as well as the expense For GBT sites land purchase cost of
035 millions assumed which has been escalated by 6 annually to determine the
salvage value of assets
GBT Capital Costs
Million
INR
Delivery cost of Ground Based
Tower (GBT)063
Delivery cost of Generator 030
Civil Work 040Shelter 012
Electrical Works 030
Other Equipments (UPS Battery
etc)045
Construction cost 045
Land 035
Contingency amp Financial Charges 035Total cost 335
RTT Capital Costs
Million
INR
Delivery cost of Roof Top
Tower (RTT) 030
Delivery cost of Generator 020
Civil Work 020Shelter 012
Electrical Works 030
Other Equipments (UPS
Battery etc) 030
Construction cost -
Land -
Contingency amp FinancialCharges 008
Total cost 150
882019 Major Project (Ramit)
httpslidepdfcomreaderfullmajor-project-ramit 5862
49
Ope rating costs related assumptions are tabulated below
Table 93 Operating CostsOperating Costs
Security Sentries (INRMonth) 4000
Supervisors (INRMonth) 6000
Cluster Manager One for Fifty Towers (INRMonth) 15000
Annual increase 500
Number of Security Sentries per tower 300
Number of supervisors per tower 010
Number of C luster manager per tower 002
Fixed Expenses
Selling amp Maintenance (INRMonth) 4000000
Annual Escalation 5
Administration overhead (INRMonth) 10000000Annual Escalation 7
AMC Cost of Generator 15 (cost of generator)
Annual Escalation (AMC) 3
For RTT sites security sentries are not required because it will be the responsibility of
the site owner A supervisor will for every 10 sites and a cluster manager for every 50
sites will be required
882019 Major Project (Ramit)
httpslidepdfcomreaderfullmajor-project-ramit 5962
50
Table 94 Long term debtInterest Rate 125 per annum
Moratorium 2 years
Repayment Period 8 years
Tariff related assumptions and date of operations are tabulated below
Table 95 GBT and RTT Tariff Table 96 Life of the projectTariff Plan
Tariff (INRMonth)
No of
operators GBT RTT
1 28000 18000
2 22000 14000
3 0 12000
Annual
increase 3 3
Commercial Operation Date 1-Aug-09
Quarter Ending 30-Sep-09
FY ending COD 31-Mar-10
Project life years 15
End of commercial
operations31-Aug-24
Quarter ending commercial
operations30-Sep-24
FY ending comme rcial
operations31-Mar-25
882019 Major Project (Ramit)
httpslidepdfcomreaderfullmajor-project-ramit 6062
51
Annexure 2 Profit amp Loss accountsTable 97 Profit amp loss account statement
Income Statement (MNINR)Year ending Mar-10 Mar-11 Mar-12 Mar-13 Mar-14 Mar-15
RevenueGBT 406350 28811 89080 197447 379409 527015Operator Fees (GBT) 1411 10004 30678 67998 130664 179664RTT 1209 8575 27269 60443 116146 164264
Operator Fees (RTT) 440 3121 9739 21587 41481 56466Net Revenue 7124 50511 156766 347476 667700 927410
Expenses
VariableSecurity Sentries 1355 9790 28339 64033 125433 158238Supervisors 097 699 2024 4574 8959 11303Cluster Manager 048 350 10 12 2287 4480 5651AMC Cost of Generator 450 3013 7877 16719 31148 54541Sub-total 1950 13852 39252 87612 170021 229734
Fixed
Selling amp Maintenance(INRMonth) 032 050 053 056 058 061
Administration overhead(INRMonth) 080 128 137 147 157 168
Sub-total 112 179 190 203 216 230
EBITDA 5062 36480 117324 259661 497464 697447
Interest on LT loan - - 7341 31200 77479 156198Interest on ST loan - 021 060 130 245 361
EBDT 5062 36459 109923 228331 419739 540888Depreciation 2439 12769 35917 77162 142925 174006
EBT 2624 23691 74006 151169 276814 366881Income Tax 170 4233 14536 29073 53547 77634
PAT 2454 19458 59470 122096 223267 289247
882019 Major Project (Ramit)
httpslidepdfcomreaderfullmajor-project-ramit 6162
52
Annexure 3 Balance sheet
Table 98 B alance sheetsYearend Balance Sheet (MNINR)Year ending Mar-10 Mar-11 Mar-12 Mar-13 Mar-14 Mar-15
AssetsGross Block 75742 328216 833164 1716823 3105430 3105430Accumulated depreciation 2439 15208 51125 128287 271212 445218Net Block 73303 313009 782040 1588536 2834219 2660212Net Working Capital 064 241 620 1335 2515 3707Cash Balance 12979 72089 216513 488856 947982 1294734Total Assets 86346 385339 999172 2078727 3784715 3958653
LiabilitiesEquity 25168 108980 276604 569947 1030914 1030914Reserves amp Surplus 2454 21912 81381 203477 426745 715992Long term Debt 58725 254286 640722 1304302 2325171 2208967WC Borrowings - 161 465 1001 1886 2780Total Liabilities 86346 385339 999172 2078727 3784715 3958653
882019 Major Project (Ramit)
httpslidepdfcomreaderfullmajor-project-ramit 6262
Annexure 4 Cash flow statement
Table 99 Cash flow statements
Year ending Mar-10 Mar-11 Mar-12 Mar-13 Mar-14 Mar-15
InflowsPAT 2454 19458 59470 122096 223267 289247Depreciation 2439 12769 35917 77162 142925 174006Tax adjusted interest - 014 4959 20991 52076 104895Release of WC - - - - - -Salvage Value - - - - - -Sub-Total 4893 32241 100345 220249 418268 568148
OutflowsCapex 75742 252474 504948 883659 1388607 -Change in WorkingCapital 064 177 379 715 1180 1192
Sub-Total 75806 252651 505327 884374 1389787 1192
UFCF (70913) (220410) (404982) (664125) (971519) 566956LFCF (70913) (220424) (409940) (685116) (1023595) 462062
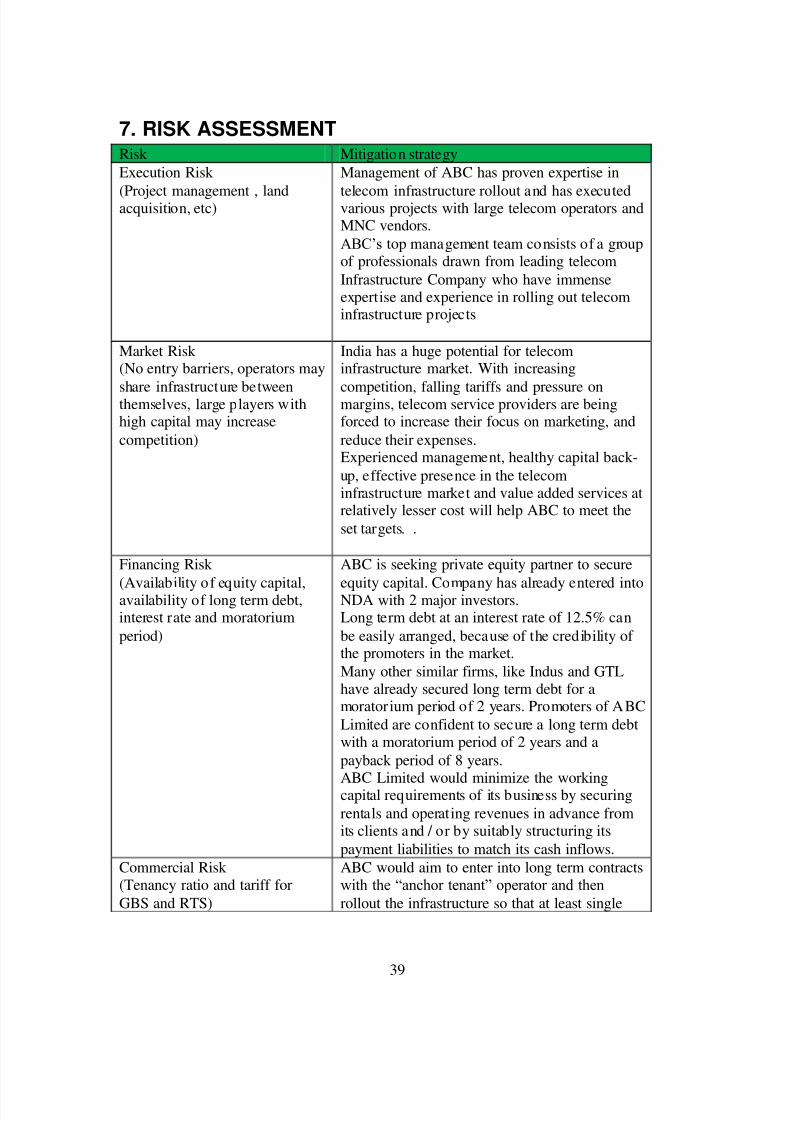
882019 Major Project (Ramit)
httpslidepdfcomreaderfullmajor-project-ramit 4862
39
7 RISK ASSESSMENTRisk Mitigation strategyExecution Risk
(Project management landacquisition etc)
Management of ABC has proven expertise in
telecom infrastructure rollout and has executedvarious projects with large telecom operators andMNC vendorsABCrsquos top management team consists of a groupof professionals drawn from leading telecomInfrastructure Company who have immenseexpertise and experience in rolling out telecominfrastructure projects
Market Risk (No entry barriers operators may
share infrastructure betweenthemselves large players withhigh capital may increasecompetition)
India has a huge potential for telecominfrastructure market With increasing
competition falling tariffs and pressure onmargins telecom service providers are beingforced to increase their focus on marketing andreduce their expensesExperienced management healthy capital back-up effective presence in the telecominfrastructure market and value added services atrelatively lesser cost will help ABC to meet theset targets
Financing Risk
(Availability of equity capitalavailability of long term debtinterest rate and moratoriumperiod)
ABC is seeking private equity partner to secure
equity capital Company has already entered intoNDA with 2 major investorsLong term debt at an interest rate of 125 canbe easily arranged because of the credibility of the promoters in the marketMany other similar firms like Indus and GTLhave already secured long term debt for amoratorium period of 2 years Promoters of ABCLimited are confident to secure a long term debtwith a moratorium period of 2 years and apayback period of 8 years
ABC Limited would minimize the workingcapital requirements of its business by securingrentals and operating revenues in advance fromits clients and or by suitably structuring itspayment liabilities to match its cash inflows
Commercial Risk (Tenancy ratio and tariff forGBS and RTS)
ABC would aim to enter into long term contractswith the ldquoanchor tenantrdquo operator and thenrollout the infrastructure so that at least single
882019 Major Project (Ramit)
httpslidepdfcomreaderfullmajor-project-ramit 4962
40
occupancy of each site is ensured at all t imesPromoters will use its knowledge of the businessand its expertise to identify and roll out sites inlocations which have strong multi- tenancypotential to minimize occupancy risk
Revenue Risk (Operating fees may decreasecredit worthiness of the clientsdelay in payment of rentals)
As per the industry sources till now not even asingle operator have dishonored the long termlease contractThe credit risk is diversified as there will bemultiple operatorsABC would aggressively market to get 3G andWiFi broadcasters to use the sites and earnadditional revenues in addition to the assumedrevenue streams
Natural Calamities Risk The Company shall maintain insurance for thesites against these risks and the cost of insurancewill be priced in and passed on to the tenants
882019 Major Project (Ramit)
httpslidepdfcomreaderfullmajor-project-ramit 5062
41
8 CONCLUSION
India is the fastest growing wireless telecom market in the world The continuing
growth in the number of wireless subscribers and MoUs and increasing trend of
outsourcing of business processes to India has led to growing demand for large
investments in the telecom infrastructure in the country
However with increasing competition falling tariffs and pressure on margins
telecom service providers are being forced to increase their focus on marketing
customer acquisitions and branding and minimize their efforts and overheads in
project management and asset acquisition
Further with rising prices of steel cement and real estate the cost of developing
and owning passive infrastructure is increasingly becoming a costly proposition
for most operators and service providers
The compulsion on the part of service providers to reduce their operating costs
and capital expenditure requirements has led to opportunities in passiveinfrastructure outsourcing to independent third party infrastructure providers and
also sharing the infrastructure with other service providers It is expected that
cellular operators will outsource their communications site infrastructure needs as
a means of accelerating access to their markets and preserving capital rather than
constructing and operating their own communications sites and maintaining their
own communications sites service and deve lopment capabilities
Passive infrastructure is highly capital intensive and an integral part of the cellular
service providersrsquo networks Yet being a simple and low technology asset it is
amenable to outsourcing and sharing By transferring the responsibility of
ownership development and maintenance of passive infrastructure service
882019 Major Project (Ramit)
httpslidepdfcomreaderfullmajor-project-ramit 5162
42
providers have an opportunity to transfer a substantial part of their business risk to
third parties
Most telecom operators are facing capacity constraints on their networksCoverage obligations increasing pressure to improve network quality and
competition has led to aggressive roll out plans by existing cellular operators
Installation of cell sites has become a cumbersome process as there are a number
of clearances required and involves labor-intensive micro management
Availability of ready infrastructure from third party providers would enable the
operators to reduce their time to market and accelerate their access to their
customers Cellular service providers generally want to move quickly when
adding more sites and co-location on an existing site is always faster than
building
Ownership and maintenance of telecom towers and other infrastructure by third
parties is an established practice in developed nations like USA and is
increasingly gaining market acceptance in India
The Indian government is seriously considering promoting the infrastructure
sharing route between the telecom operator and private players to achieve future
national tele-density targets and improve rural telecom penetration
ABC being an independent entity with no business conflicts with other service
providers in the telecom space will be best positioned and have an early mover
advantage to capitalize on this emerging opportunity
Further the task of operating and maintaining the passive infrastructure in the cell
is increasingly becoming a cumbersome exercise for the service providers to
handle ABCrsquos composite offering to build passive infrastructure for the cellular
operators and also operate and maintain them will provide a turnkey solution to
address the infrastructure needs of the service providers
882019 Major Project (Ramit)
httpslidepdfcomreaderfullmajor-project-ramit 5262
43
The business model proposed to be followed by ABC is fairly simple with stable
and predictable cash flows as is the case with the business model of the tower
renting companies in USA Most contracts are long term for a period 10 or moreyears with annual price escalators generally ranging from 3 to 4 However
wireless carriers normally tend to renew rentals because suitable alternative sites
may not exist or be available and repositioning a site in a carrierrsquos network is
expensive and may adverse ly affect network quality
Site ownership and operations is a ldquoscalerdquo business operating administration
marketing expenses etc do not rise as quickly as revenues when portfolios are
expanded Incremental operating costs associated with adding wireless tenants to
a communications site are minimal Therefore as additional tenants are added to a
site the substantial majority of incremental revenue contributes to margin
expansion Most tower companies have high EBITDA margins as may be seen
from the financial indicators of some of the tower rental companies in USA
It is expected that site location and capacity price and quality of service and
successful execution of contracts will be the most significant competitive factors
in this business
ABCrsquos revenue and returns on investment will be primarily driven by its ability
to
o Increase the utilization of the space and infrastructure capacity owned by it by
increasing the number of tenants per site and renting out to maximum number
of users As discussed above return on capital employed (PIRR and EIRR) arevery sensitive to tenancy ratio In worst case scenario project IRR can be as
low as 8 and in the best case scenario it can be as high as 20
o Develop acquire sites of strategic importance and high growth potential that
will enable them to secure better commercial terms from users and attract
more number of tenants Infrastructure provisioning fees rentals for sites are
882019 Major Project (Ramit)
httpslidepdfcomreaderfullmajor-project-ramit 5362
44
extremely location sensitive There is a potential to acquire more land than
that of required to capitalize on the increase in real estate prices
o Develop sites in a cost effective manner ABC would consider purchasing
land only for those GBS sites which have sufficient demand and arestrategically located Else for most of its sites land will be leasehold As
shown above returns (PIRR and EIRR) are very sensitive to capital costs In
the worst case scenario project IRR can be as low as 15 whereas it can as
high as 27 in the best case scenario
o Negotiate and secure long term contracts with good credit quality users with
built in price escalation provisions to mitigate financing risk
o Leverage and secure long term financing at attractive terms and involve in
active treasury management to keep low financing cost Results of the
sensitivity analysis indicate that equity IRR can be as high as 60 foe a
moratorium period of 4 years and interest rate of 10
o Minimize working capital requirements
o Maintain low operating and administration expense
o Secure better OampM margins from operators and retain a healthy share of it in
ABC
o Maintain high service standards and build strong customer relationships
The business would have the potential to capture new revenue opportunities
around the existing assets As demand for towers is expected to grow and as
operators migrate to speedier next-generation wireless technologies they will
need the towers and associated passive infrastructure to transmit their new
services in addition to their existing offerings In addition to increasing capacity
and coverage and improving the quality of their networks cellular serviceproviders are deploying high speed data networks driving incremental demand of
sites The business therefore has potential upsides in the form of adding
customers (tenants) in wireless broadband third generation (ldquo3Grdquo) and wireless
data capabilities and also other incremental value propositions by way of hosting
882019 Major Project (Ramit)
httpslidepdfcomreaderfullmajor-project-ramit 5462
45
Billboards Hoardings etc in some of the high visible sites owned and maintained
by it
Based on the assumptions and subject to satisfactory resolution of the key risks
factors project cash flows will be able to meet debt service obligations
This business model is a lucrative investment option for a private equity player
because valuation of each site will increase in the coming years due to
improvement in market conditions increase in the value of land and increase in
the demand for passive infrastructure in rural and semi-urban areas
882019 Major Project (Ramit)
httpslidepdfcomreaderfullmajor-project-ramit 5562
46
REFERENCESAnjan G V A amp N M (2009) telecom infrastructure industry in india GurgaonICRA
Bessler W Norsworthy J amp Shusterman T (2001 12 1) Mergers in the UStelecommunications industry and market valuationeffects IEEE p 288
COAI (2009 march 14) Subscriber Figures Retrieved march 14 2009 fromCOAIcom httpwwwcoaicomstatisticsphp
IDA (2009 march 23) Highlights Retrieved march 23 2009 from idagovsghttpwwwidagovsghomeindexaspx
K R (2008) Time for new business model Delhi Cybermedia
MAXIS (2009 march 8) the malaysian telecommunications industry Retrieved march9 2009 from maxiscommyhttpwwwmaxiscommypersonalabout_usinvestorprospectusprospectus4pdf
P J amp Lisa A (2009) Stimulas spending and American Telecom Industry USACoracle group
PwC (2009 march 12) Indian Telecom Industry Gurgaon Harayana IndiaRamachanran (2009 march 1) Investment in Telecom Infrastructure sector (M RInterviewer)
Vogelsang I (2002) The German Telecommunications Reform Verein fuumlr Socialpolitik (p 26) Innsbruck Boston Press
882019 Major Project (Ramit)
httpslidepdfcomreaderfullmajor-project-ramit 5662
47
ANNEXURES
ANNEXURE 1 Key Assumptions
The occupancy of each site by single two three operators for green-field sites is assumed
to be as follows
Table 91 Expected Tenancy RatiosFY 10 FY 11 FY 12 FY 13 FY 14 FY15
GBT Tenant
Ratio 150 150 170 170 170 200
Single Operator 50 50 30 30 30 0
Two Operator 50 50 70 70 70 100
RTT Tenant
Ratio 170 170 200 200 200 250
Single Operator 30 30 0 0 0 0
Two Operator 70 70 100 100 100 50
Three Operator 0 0 0 0 0 50
From FY 15 onwards tenancy ratio of 2 and 25 for GBT and RTT sites is cons idered
882019 Major Project (Ramit)
httpslidepdfcomreaderfullmajor-project-ramit 5762
48
Capital costs related assumptions are tabulated below
Table 92 GBT and RTT Capital Cost
The lease rentals for RTT sites are reimbursed from the operators and therefore have not
been factored in the revenues as well as the expense For GBT sites land purchase cost of
035 millions assumed which has been escalated by 6 annually to determine the
salvage value of assets
GBT Capital Costs
Million
INR
Delivery cost of Ground Based
Tower (GBT)063
Delivery cost of Generator 030
Civil Work 040Shelter 012
Electrical Works 030
Other Equipments (UPS Battery
etc)045
Construction cost 045
Land 035
Contingency amp Financial Charges 035Total cost 335
RTT Capital Costs
Million
INR
Delivery cost of Roof Top
Tower (RTT) 030
Delivery cost of Generator 020
Civil Work 020Shelter 012
Electrical Works 030
Other Equipments (UPS
Battery etc) 030
Construction cost -
Land -
Contingency amp FinancialCharges 008
Total cost 150
882019 Major Project (Ramit)
httpslidepdfcomreaderfullmajor-project-ramit 5862
49
Ope rating costs related assumptions are tabulated below
Table 93 Operating CostsOperating Costs
Security Sentries (INRMonth) 4000
Supervisors (INRMonth) 6000
Cluster Manager One for Fifty Towers (INRMonth) 15000
Annual increase 500
Number of Security Sentries per tower 300
Number of supervisors per tower 010
Number of C luster manager per tower 002
Fixed Expenses
Selling amp Maintenance (INRMonth) 4000000
Annual Escalation 5
Administration overhead (INRMonth) 10000000Annual Escalation 7
AMC Cost of Generator 15 (cost of generator)
Annual Escalation (AMC) 3
For RTT sites security sentries are not required because it will be the responsibility of
the site owner A supervisor will for every 10 sites and a cluster manager for every 50
sites will be required
882019 Major Project (Ramit)
httpslidepdfcomreaderfullmajor-project-ramit 5962
50
Table 94 Long term debtInterest Rate 125 per annum
Moratorium 2 years
Repayment Period 8 years
Tariff related assumptions and date of operations are tabulated below
Table 95 GBT and RTT Tariff Table 96 Life of the projectTariff Plan
Tariff (INRMonth)
No of
operators GBT RTT
1 28000 18000
2 22000 14000
3 0 12000
Annual
increase 3 3
Commercial Operation Date 1-Aug-09
Quarter Ending 30-Sep-09
FY ending COD 31-Mar-10
Project life years 15
End of commercial
operations31-Aug-24
Quarter ending commercial
operations30-Sep-24
FY ending comme rcial
operations31-Mar-25
882019 Major Project (Ramit)
httpslidepdfcomreaderfullmajor-project-ramit 6062
51
Annexure 2 Profit amp Loss accountsTable 97 Profit amp loss account statement
Income Statement (MNINR)Year ending Mar-10 Mar-11 Mar-12 Mar-13 Mar-14 Mar-15
RevenueGBT 406350 28811 89080 197447 379409 527015Operator Fees (GBT) 1411 10004 30678 67998 130664 179664RTT 1209 8575 27269 60443 116146 164264
Operator Fees (RTT) 440 3121 9739 21587 41481 56466Net Revenue 7124 50511 156766 347476 667700 927410
Expenses
VariableSecurity Sentries 1355 9790 28339 64033 125433 158238Supervisors 097 699 2024 4574 8959 11303Cluster Manager 048 350 10 12 2287 4480 5651AMC Cost of Generator 450 3013 7877 16719 31148 54541Sub-total 1950 13852 39252 87612 170021 229734
Fixed
Selling amp Maintenance(INRMonth) 032 050 053 056 058 061
Administration overhead(INRMonth) 080 128 137 147 157 168
Sub-total 112 179 190 203 216 230
EBITDA 5062 36480 117324 259661 497464 697447
Interest on LT loan - - 7341 31200 77479 156198Interest on ST loan - 021 060 130 245 361
EBDT 5062 36459 109923 228331 419739 540888Depreciation 2439 12769 35917 77162 142925 174006
EBT 2624 23691 74006 151169 276814 366881Income Tax 170 4233 14536 29073 53547 77634
PAT 2454 19458 59470 122096 223267 289247
882019 Major Project (Ramit)
httpslidepdfcomreaderfullmajor-project-ramit 6162
52
Annexure 3 Balance sheet
Table 98 B alance sheetsYearend Balance Sheet (MNINR)Year ending Mar-10 Mar-11 Mar-12 Mar-13 Mar-14 Mar-15
AssetsGross Block 75742 328216 833164 1716823 3105430 3105430Accumulated depreciation 2439 15208 51125 128287 271212 445218Net Block 73303 313009 782040 1588536 2834219 2660212Net Working Capital 064 241 620 1335 2515 3707Cash Balance 12979 72089 216513 488856 947982 1294734Total Assets 86346 385339 999172 2078727 3784715 3958653
LiabilitiesEquity 25168 108980 276604 569947 1030914 1030914Reserves amp Surplus 2454 21912 81381 203477 426745 715992Long term Debt 58725 254286 640722 1304302 2325171 2208967WC Borrowings - 161 465 1001 1886 2780Total Liabilities 86346 385339 999172 2078727 3784715 3958653
882019 Major Project (Ramit)
httpslidepdfcomreaderfullmajor-project-ramit 6262
Annexure 4 Cash flow statement
Table 99 Cash flow statements
Year ending Mar-10 Mar-11 Mar-12 Mar-13 Mar-14 Mar-15
InflowsPAT 2454 19458 59470 122096 223267 289247Depreciation 2439 12769 35917 77162 142925 174006Tax adjusted interest - 014 4959 20991 52076 104895Release of WC - - - - - -Salvage Value - - - - - -Sub-Total 4893 32241 100345 220249 418268 568148
OutflowsCapex 75742 252474 504948 883659 1388607 -Change in WorkingCapital 064 177 379 715 1180 1192
Sub-Total 75806 252651 505327 884374 1389787 1192
UFCF (70913) (220410) (404982) (664125) (971519) 566956LFCF (70913) (220424) (409940) (685116) (1023595) 462062
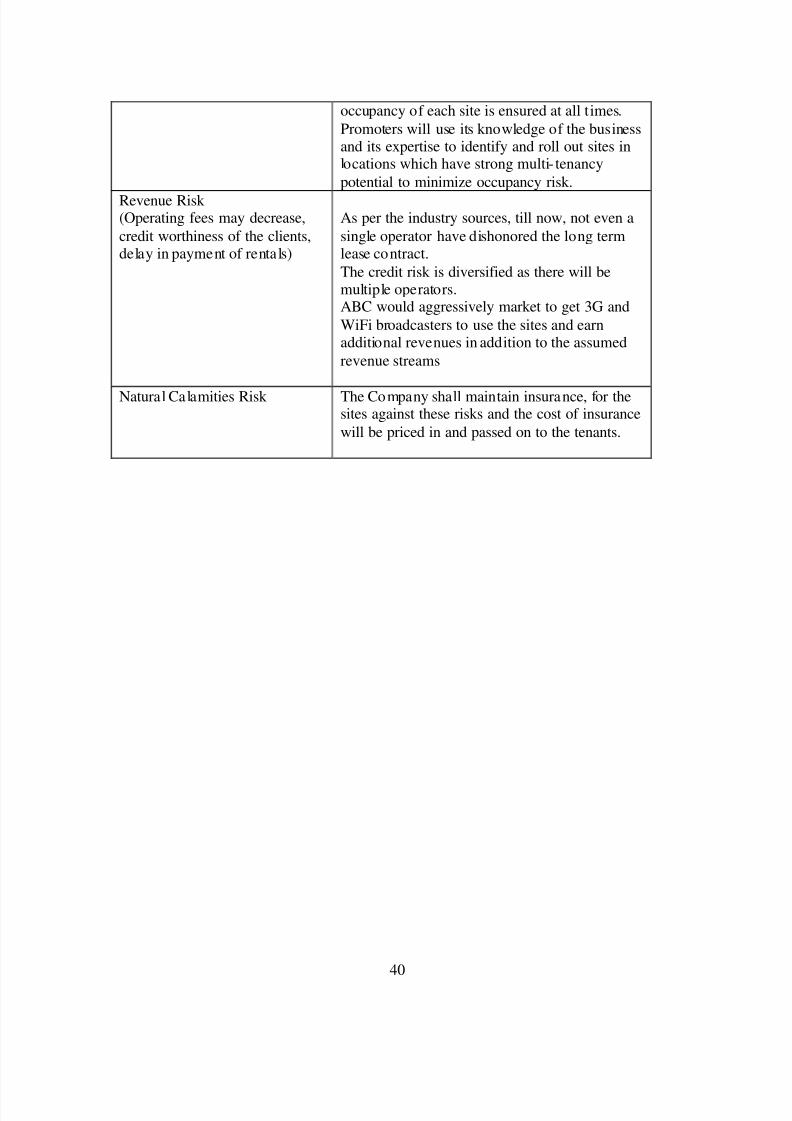
882019 Major Project (Ramit)
httpslidepdfcomreaderfullmajor-project-ramit 4962
40
occupancy of each site is ensured at all t imesPromoters will use its knowledge of the businessand its expertise to identify and roll out sites inlocations which have strong multi- tenancypotential to minimize occupancy risk
Revenue Risk (Operating fees may decreasecredit worthiness of the clientsdelay in payment of rentals)
As per the industry sources till now not even asingle operator have dishonored the long termlease contractThe credit risk is diversified as there will bemultiple operatorsABC would aggressively market to get 3G andWiFi broadcasters to use the sites and earnadditional revenues in addition to the assumedrevenue streams
Natural Calamities Risk The Company shall maintain insurance for thesites against these risks and the cost of insurancewill be priced in and passed on to the tenants
882019 Major Project (Ramit)
httpslidepdfcomreaderfullmajor-project-ramit 5062
41
8 CONCLUSION
India is the fastest growing wireless telecom market in the world The continuing
growth in the number of wireless subscribers and MoUs and increasing trend of
outsourcing of business processes to India has led to growing demand for large
investments in the telecom infrastructure in the country
However with increasing competition falling tariffs and pressure on margins
telecom service providers are being forced to increase their focus on marketing
customer acquisitions and branding and minimize their efforts and overheads in
project management and asset acquisition
Further with rising prices of steel cement and real estate the cost of developing
and owning passive infrastructure is increasingly becoming a costly proposition
for most operators and service providers
The compulsion on the part of service providers to reduce their operating costs
and capital expenditure requirements has led to opportunities in passiveinfrastructure outsourcing to independent third party infrastructure providers and
also sharing the infrastructure with other service providers It is expected that
cellular operators will outsource their communications site infrastructure needs as
a means of accelerating access to their markets and preserving capital rather than
constructing and operating their own communications sites and maintaining their
own communications sites service and deve lopment capabilities
Passive infrastructure is highly capital intensive and an integral part of the cellular
service providersrsquo networks Yet being a simple and low technology asset it is
amenable to outsourcing and sharing By transferring the responsibility of
ownership development and maintenance of passive infrastructure service
882019 Major Project (Ramit)
httpslidepdfcomreaderfullmajor-project-ramit 5162
42
providers have an opportunity to transfer a substantial part of their business risk to
third parties
Most telecom operators are facing capacity constraints on their networksCoverage obligations increasing pressure to improve network quality and
competition has led to aggressive roll out plans by existing cellular operators
Installation of cell sites has become a cumbersome process as there are a number
of clearances required and involves labor-intensive micro management
Availability of ready infrastructure from third party providers would enable the
operators to reduce their time to market and accelerate their access to their
customers Cellular service providers generally want to move quickly when
adding more sites and co-location on an existing site is always faster than
building
Ownership and maintenance of telecom towers and other infrastructure by third
parties is an established practice in developed nations like USA and is
increasingly gaining market acceptance in India
The Indian government is seriously considering promoting the infrastructure
sharing route between the telecom operator and private players to achieve future
national tele-density targets and improve rural telecom penetration
ABC being an independent entity with no business conflicts with other service
providers in the telecom space will be best positioned and have an early mover
advantage to capitalize on this emerging opportunity
Further the task of operating and maintaining the passive infrastructure in the cell
is increasingly becoming a cumbersome exercise for the service providers to
handle ABCrsquos composite offering to build passive infrastructure for the cellular
operators and also operate and maintain them will provide a turnkey solution to
address the infrastructure needs of the service providers
882019 Major Project (Ramit)
httpslidepdfcomreaderfullmajor-project-ramit 5262
43
The business model proposed to be followed by ABC is fairly simple with stable
and predictable cash flows as is the case with the business model of the tower
renting companies in USA Most contracts are long term for a period 10 or moreyears with annual price escalators generally ranging from 3 to 4 However
wireless carriers normally tend to renew rentals because suitable alternative sites
may not exist or be available and repositioning a site in a carrierrsquos network is
expensive and may adverse ly affect network quality
Site ownership and operations is a ldquoscalerdquo business operating administration
marketing expenses etc do not rise as quickly as revenues when portfolios are
expanded Incremental operating costs associated with adding wireless tenants to
a communications site are minimal Therefore as additional tenants are added to a
site the substantial majority of incremental revenue contributes to margin
expansion Most tower companies have high EBITDA margins as may be seen
from the financial indicators of some of the tower rental companies in USA
It is expected that site location and capacity price and quality of service and
successful execution of contracts will be the most significant competitive factors
in this business
ABCrsquos revenue and returns on investment will be primarily driven by its ability
to
o Increase the utilization of the space and infrastructure capacity owned by it by
increasing the number of tenants per site and renting out to maximum number
of users As discussed above return on capital employed (PIRR and EIRR) arevery sensitive to tenancy ratio In worst case scenario project IRR can be as
low as 8 and in the best case scenario it can be as high as 20
o Develop acquire sites of strategic importance and high growth potential that
will enable them to secure better commercial terms from users and attract
more number of tenants Infrastructure provisioning fees rentals for sites are
882019 Major Project (Ramit)
httpslidepdfcomreaderfullmajor-project-ramit 5362
44
extremely location sensitive There is a potential to acquire more land than
that of required to capitalize on the increase in real estate prices
o Develop sites in a cost effective manner ABC would consider purchasing
land only for those GBS sites which have sufficient demand and arestrategically located Else for most of its sites land will be leasehold As
shown above returns (PIRR and EIRR) are very sensitive to capital costs In
the worst case scenario project IRR can be as low as 15 whereas it can as
high as 27 in the best case scenario
o Negotiate and secure long term contracts with good credit quality users with
built in price escalation provisions to mitigate financing risk
o Leverage and secure long term financing at attractive terms and involve in
active treasury management to keep low financing cost Results of the
sensitivity analysis indicate that equity IRR can be as high as 60 foe a
moratorium period of 4 years and interest rate of 10
o Minimize working capital requirements
o Maintain low operating and administration expense
o Secure better OampM margins from operators and retain a healthy share of it in
ABC
o Maintain high service standards and build strong customer relationships
The business would have the potential to capture new revenue opportunities
around the existing assets As demand for towers is expected to grow and as
operators migrate to speedier next-generation wireless technologies they will
need the towers and associated passive infrastructure to transmit their new
services in addition to their existing offerings In addition to increasing capacity
and coverage and improving the quality of their networks cellular serviceproviders are deploying high speed data networks driving incremental demand of
sites The business therefore has potential upsides in the form of adding
customers (tenants) in wireless broadband third generation (ldquo3Grdquo) and wireless
data capabilities and also other incremental value propositions by way of hosting
882019 Major Project (Ramit)
httpslidepdfcomreaderfullmajor-project-ramit 5462
45
Billboards Hoardings etc in some of the high visible sites owned and maintained
by it
Based on the assumptions and subject to satisfactory resolution of the key risks
factors project cash flows will be able to meet debt service obligations
This business model is a lucrative investment option for a private equity player
because valuation of each site will increase in the coming years due to
improvement in market conditions increase in the value of land and increase in
the demand for passive infrastructure in rural and semi-urban areas
882019 Major Project (Ramit)
httpslidepdfcomreaderfullmajor-project-ramit 5562
46
REFERENCESAnjan G V A amp N M (2009) telecom infrastructure industry in india GurgaonICRA
Bessler W Norsworthy J amp Shusterman T (2001 12 1) Mergers in the UStelecommunications industry and market valuationeffects IEEE p 288
COAI (2009 march 14) Subscriber Figures Retrieved march 14 2009 fromCOAIcom httpwwwcoaicomstatisticsphp
IDA (2009 march 23) Highlights Retrieved march 23 2009 from idagovsghttpwwwidagovsghomeindexaspx
K R (2008) Time for new business model Delhi Cybermedia
MAXIS (2009 march 8) the malaysian telecommunications industry Retrieved march9 2009 from maxiscommyhttpwwwmaxiscommypersonalabout_usinvestorprospectusprospectus4pdf
P J amp Lisa A (2009) Stimulas spending and American Telecom Industry USACoracle group
PwC (2009 march 12) Indian Telecom Industry Gurgaon Harayana IndiaRamachanran (2009 march 1) Investment in Telecom Infrastructure sector (M RInterviewer)
Vogelsang I (2002) The German Telecommunications Reform Verein fuumlr Socialpolitik (p 26) Innsbruck Boston Press
882019 Major Project (Ramit)
httpslidepdfcomreaderfullmajor-project-ramit 5662
47
ANNEXURES
ANNEXURE 1 Key Assumptions
The occupancy of each site by single two three operators for green-field sites is assumed
to be as follows
Table 91 Expected Tenancy RatiosFY 10 FY 11 FY 12 FY 13 FY 14 FY15
GBT Tenant
Ratio 150 150 170 170 170 200
Single Operator 50 50 30 30 30 0
Two Operator 50 50 70 70 70 100
RTT Tenant
Ratio 170 170 200 200 200 250
Single Operator 30 30 0 0 0 0
Two Operator 70 70 100 100 100 50
Three Operator 0 0 0 0 0 50
From FY 15 onwards tenancy ratio of 2 and 25 for GBT and RTT sites is cons idered
882019 Major Project (Ramit)
httpslidepdfcomreaderfullmajor-project-ramit 5762
48
Capital costs related assumptions are tabulated below
Table 92 GBT and RTT Capital Cost
The lease rentals for RTT sites are reimbursed from the operators and therefore have not
been factored in the revenues as well as the expense For GBT sites land purchase cost of
035 millions assumed which has been escalated by 6 annually to determine the
salvage value of assets
GBT Capital Costs
Million
INR
Delivery cost of Ground Based
Tower (GBT)063
Delivery cost of Generator 030
Civil Work 040Shelter 012
Electrical Works 030
Other Equipments (UPS Battery
etc)045
Construction cost 045
Land 035
Contingency amp Financial Charges 035Total cost 335
RTT Capital Costs
Million
INR
Delivery cost of Roof Top
Tower (RTT) 030
Delivery cost of Generator 020
Civil Work 020Shelter 012
Electrical Works 030
Other Equipments (UPS
Battery etc) 030
Construction cost -
Land -
Contingency amp FinancialCharges 008
Total cost 150
882019 Major Project (Ramit)
httpslidepdfcomreaderfullmajor-project-ramit 5862
49
Ope rating costs related assumptions are tabulated below
Table 93 Operating CostsOperating Costs
Security Sentries (INRMonth) 4000
Supervisors (INRMonth) 6000
Cluster Manager One for Fifty Towers (INRMonth) 15000
Annual increase 500
Number of Security Sentries per tower 300
Number of supervisors per tower 010
Number of C luster manager per tower 002
Fixed Expenses
Selling amp Maintenance (INRMonth) 4000000
Annual Escalation 5
Administration overhead (INRMonth) 10000000Annual Escalation 7
AMC Cost of Generator 15 (cost of generator)
Annual Escalation (AMC) 3
For RTT sites security sentries are not required because it will be the responsibility of
the site owner A supervisor will for every 10 sites and a cluster manager for every 50
sites will be required
882019 Major Project (Ramit)
httpslidepdfcomreaderfullmajor-project-ramit 5962
50
Table 94 Long term debtInterest Rate 125 per annum
Moratorium 2 years
Repayment Period 8 years
Tariff related assumptions and date of operations are tabulated below
Table 95 GBT and RTT Tariff Table 96 Life of the projectTariff Plan
Tariff (INRMonth)
No of
operators GBT RTT
1 28000 18000
2 22000 14000
3 0 12000
Annual
increase 3 3
Commercial Operation Date 1-Aug-09
Quarter Ending 30-Sep-09
FY ending COD 31-Mar-10
Project life years 15
End of commercial
operations31-Aug-24
Quarter ending commercial
operations30-Sep-24
FY ending comme rcial
operations31-Mar-25
882019 Major Project (Ramit)
httpslidepdfcomreaderfullmajor-project-ramit 6062
51
Annexure 2 Profit amp Loss accountsTable 97 Profit amp loss account statement
Income Statement (MNINR)Year ending Mar-10 Mar-11 Mar-12 Mar-13 Mar-14 Mar-15
RevenueGBT 406350 28811 89080 197447 379409 527015Operator Fees (GBT) 1411 10004 30678 67998 130664 179664RTT 1209 8575 27269 60443 116146 164264
Operator Fees (RTT) 440 3121 9739 21587 41481 56466Net Revenue 7124 50511 156766 347476 667700 927410
Expenses
VariableSecurity Sentries 1355 9790 28339 64033 125433 158238Supervisors 097 699 2024 4574 8959 11303Cluster Manager 048 350 10 12 2287 4480 5651AMC Cost of Generator 450 3013 7877 16719 31148 54541Sub-total 1950 13852 39252 87612 170021 229734
Fixed
Selling amp Maintenance(INRMonth) 032 050 053 056 058 061
Administration overhead(INRMonth) 080 128 137 147 157 168
Sub-total 112 179 190 203 216 230
EBITDA 5062 36480 117324 259661 497464 697447
Interest on LT loan - - 7341 31200 77479 156198Interest on ST loan - 021 060 130 245 361
EBDT 5062 36459 109923 228331 419739 540888Depreciation 2439 12769 35917 77162 142925 174006
EBT 2624 23691 74006 151169 276814 366881Income Tax 170 4233 14536 29073 53547 77634
PAT 2454 19458 59470 122096 223267 289247
882019 Major Project (Ramit)
httpslidepdfcomreaderfullmajor-project-ramit 6162
52
Annexure 3 Balance sheet
Table 98 B alance sheetsYearend Balance Sheet (MNINR)Year ending Mar-10 Mar-11 Mar-12 Mar-13 Mar-14 Mar-15
AssetsGross Block 75742 328216 833164 1716823 3105430 3105430Accumulated depreciation 2439 15208 51125 128287 271212 445218Net Block 73303 313009 782040 1588536 2834219 2660212Net Working Capital 064 241 620 1335 2515 3707Cash Balance 12979 72089 216513 488856 947982 1294734Total Assets 86346 385339 999172 2078727 3784715 3958653
LiabilitiesEquity 25168 108980 276604 569947 1030914 1030914Reserves amp Surplus 2454 21912 81381 203477 426745 715992Long term Debt 58725 254286 640722 1304302 2325171 2208967WC Borrowings - 161 465 1001 1886 2780Total Liabilities 86346 385339 999172 2078727 3784715 3958653
882019 Major Project (Ramit)
httpslidepdfcomreaderfullmajor-project-ramit 6262
Annexure 4 Cash flow statement
Table 99 Cash flow statements
Year ending Mar-10 Mar-11 Mar-12 Mar-13 Mar-14 Mar-15
InflowsPAT 2454 19458 59470 122096 223267 289247Depreciation 2439 12769 35917 77162 142925 174006Tax adjusted interest - 014 4959 20991 52076 104895Release of WC - - - - - -Salvage Value - - - - - -Sub-Total 4893 32241 100345 220249 418268 568148
OutflowsCapex 75742 252474 504948 883659 1388607 -Change in WorkingCapital 064 177 379 715 1180 1192
Sub-Total 75806 252651 505327 884374 1389787 1192
UFCF (70913) (220410) (404982) (664125) (971519) 566956LFCF (70913) (220424) (409940) (685116) (1023595) 462062
882019 Major Project (Ramit)
httpslidepdfcomreaderfullmajor-project-ramit 5462
45
Billboards Hoardings etc in some of the high visible sites owned and maintained
by it
Based on the assumptions and subject to satisfactory resolution of the key risks
factors project cash flows will be able to meet debt service obligations
This business model is a lucrative investment option for a private equity player
because valuation of each site will increase in the coming years due to
improvement in market conditions increase in the value of land and increase in
the demand for passive infrastructure in rural and semi-urban areas
882019 Major Project (Ramit)
httpslidepdfcomreaderfullmajor-project-ramit 5562
46
REFERENCESAnjan G V A amp N M (2009) telecom infrastructure industry in india GurgaonICRA
Bessler W Norsworthy J amp Shusterman T (2001 12 1) Mergers in the UStelecommunications industry and market valuationeffects IEEE p 288
COAI (2009 march 14) Subscriber Figures Retrieved march 14 2009 fromCOAIcom httpwwwcoaicomstatisticsphp
IDA (2009 march 23) Highlights Retrieved march 23 2009 from idagovsghttpwwwidagovsghomeindexaspx
K R (2008) Time for new business model Delhi Cybermedia
MAXIS (2009 march 8) the malaysian telecommunications industry Retrieved march9 2009 from maxiscommyhttpwwwmaxiscommypersonalabout_usinvestorprospectusprospectus4pdf
P J amp Lisa A (2009) Stimulas spending and American Telecom Industry USACoracle group
PwC (2009 march 12) Indian Telecom Industry Gurgaon Harayana IndiaRamachanran (2009 march 1) Investment in Telecom Infrastructure sector (M RInterviewer)
Vogelsang I (2002) The German Telecommunications Reform Verein fuumlr Socialpolitik (p 26) Innsbruck Boston Press
882019 Major Project (Ramit)
httpslidepdfcomreaderfullmajor-project-ramit 5662
47
ANNEXURES
ANNEXURE 1 Key Assumptions
The occupancy of each site by single two three operators for green-field sites is assumed
to be as follows
Table 91 Expected Tenancy RatiosFY 10 FY 11 FY 12 FY 13 FY 14 FY15
GBT Tenant
Ratio 150 150 170 170 170 200
Single Operator 50 50 30 30 30 0
Two Operator 50 50 70 70 70 100
RTT Tenant
Ratio 170 170 200 200 200 250
Single Operator 30 30 0 0 0 0
Two Operator 70 70 100 100 100 50
Three Operator 0 0 0 0 0 50
From FY 15 onwards tenancy ratio of 2 and 25 for GBT and RTT sites is cons idered
882019 Major Project (Ramit)
httpslidepdfcomreaderfullmajor-project-ramit 5762
48
Capital costs related assumptions are tabulated below
Table 92 GBT and RTT Capital Cost
The lease rentals for RTT sites are reimbursed from the operators and therefore have not
been factored in the revenues as well as the expense For GBT sites land purchase cost of
035 millions assumed which has been escalated by 6 annually to determine the
salvage value of assets
GBT Capital Costs
Million
INR
Delivery cost of Ground Based
Tower (GBT)063
Delivery cost of Generator 030
Civil Work 040Shelter 012
Electrical Works 030
Other Equipments (UPS Battery
etc)045
Construction cost 045
Land 035
Contingency amp Financial Charges 035Total cost 335
RTT Capital Costs
Million
INR
Delivery cost of Roof Top
Tower (RTT) 030
Delivery cost of Generator 020
Civil Work 020Shelter 012
Electrical Works 030
Other Equipments (UPS
Battery etc) 030
Construction cost -
Land -
Contingency amp FinancialCharges 008
Total cost 150
882019 Major Project (Ramit)
httpslidepdfcomreaderfullmajor-project-ramit 5862
49
Ope rating costs related assumptions are tabulated below
Table 93 Operating CostsOperating Costs
Security Sentries (INRMonth) 4000
Supervisors (INRMonth) 6000
Cluster Manager One for Fifty Towers (INRMonth) 15000
Annual increase 500
Number of Security Sentries per tower 300
Number of supervisors per tower 010
Number of C luster manager per tower 002
Fixed Expenses
Selling amp Maintenance (INRMonth) 4000000
Annual Escalation 5
Administration overhead (INRMonth) 10000000Annual Escalation 7
AMC Cost of Generator 15 (cost of generator)
Annual Escalation (AMC) 3
For RTT sites security sentries are not required because it will be the responsibility of
the site owner A supervisor will for every 10 sites and a cluster manager for every 50
sites will be required
882019 Major Project (Ramit)
httpslidepdfcomreaderfullmajor-project-ramit 5962
50
Table 94 Long term debtInterest Rate 125 per annum
Moratorium 2 years
Repayment Period 8 years
Tariff related assumptions and date of operations are tabulated below
Table 95 GBT and RTT Tariff Table 96 Life of the projectTariff Plan
Tariff (INRMonth)
No of
operators GBT RTT
1 28000 18000
2 22000 14000
3 0 12000
Annual
increase 3 3
Commercial Operation Date 1-Aug-09
Quarter Ending 30-Sep-09
FY ending COD 31-Mar-10
Project life years 15
End of commercial
operations31-Aug-24
Quarter ending commercial
operations30-Sep-24
FY ending comme rcial
operations31-Mar-25
882019 Major Project (Ramit)
httpslidepdfcomreaderfullmajor-project-ramit 6062
51
Annexure 2 Profit amp Loss accountsTable 97 Profit amp loss account statement
Income Statement (MNINR)Year ending Mar-10 Mar-11 Mar-12 Mar-13 Mar-14 Mar-15
RevenueGBT 406350 28811 89080 197447 379409 527015Operator Fees (GBT) 1411 10004 30678 67998 130664 179664RTT 1209 8575 27269 60443 116146 164264
Operator Fees (RTT) 440 3121 9739 21587 41481 56466Net Revenue 7124 50511 156766 347476 667700 927410
Expenses
VariableSecurity Sentries 1355 9790 28339 64033 125433 158238Supervisors 097 699 2024 4574 8959 11303Cluster Manager 048 350 10 12 2287 4480 5651AMC Cost of Generator 450 3013 7877 16719 31148 54541Sub-total 1950 13852 39252 87612 170021 229734
Fixed
Selling amp Maintenance(INRMonth) 032 050 053 056 058 061
Administration overhead(INRMonth) 080 128 137 147 157 168
Sub-total 112 179 190 203 216 230
EBITDA 5062 36480 117324 259661 497464 697447
Interest on LT loan - - 7341 31200 77479 156198Interest on ST loan - 021 060 130 245 361
EBDT 5062 36459 109923 228331 419739 540888Depreciation 2439 12769 35917 77162 142925 174006
EBT 2624 23691 74006 151169 276814 366881Income Tax 170 4233 14536 29073 53547 77634
PAT 2454 19458 59470 122096 223267 289247
882019 Major Project (Ramit)
httpslidepdfcomreaderfullmajor-project-ramit 6162
52
Annexure 3 Balance sheet
Table 98 B alance sheetsYearend Balance Sheet (MNINR)Year ending Mar-10 Mar-11 Mar-12 Mar-13 Mar-14 Mar-15
AssetsGross Block 75742 328216 833164 1716823 3105430 3105430Accumulated depreciation 2439 15208 51125 128287 271212 445218Net Block 73303 313009 782040 1588536 2834219 2660212Net Working Capital 064 241 620 1335 2515 3707Cash Balance 12979 72089 216513 488856 947982 1294734Total Assets 86346 385339 999172 2078727 3784715 3958653
LiabilitiesEquity 25168 108980 276604 569947 1030914 1030914Reserves amp Surplus 2454 21912 81381 203477 426745 715992Long term Debt 58725 254286 640722 1304302 2325171 2208967WC Borrowings - 161 465 1001 1886 2780Total Liabilities 86346 385339 999172 2078727 3784715 3958653
882019 Major Project (Ramit)
httpslidepdfcomreaderfullmajor-project-ramit 6262
Annexure 4 Cash flow statement
Table 99 Cash flow statements
Year ending Mar-10 Mar-11 Mar-12 Mar-13 Mar-14 Mar-15
InflowsPAT 2454 19458 59470 122096 223267 289247Depreciation 2439 12769 35917 77162 142925 174006Tax adjusted interest - 014 4959 20991 52076 104895Release of WC - - - - - -Salvage Value - - - - - -Sub-Total 4893 32241 100345 220249 418268 568148
OutflowsCapex 75742 252474 504948 883659 1388607 -Change in WorkingCapital 064 177 379 715 1180 1192
Sub-Total 75806 252651 505327 884374 1389787 1192
UFCF (70913) (220410) (404982) (664125) (971519) 566956LFCF (70913) (220424) (409940) (685116) (1023595) 462062
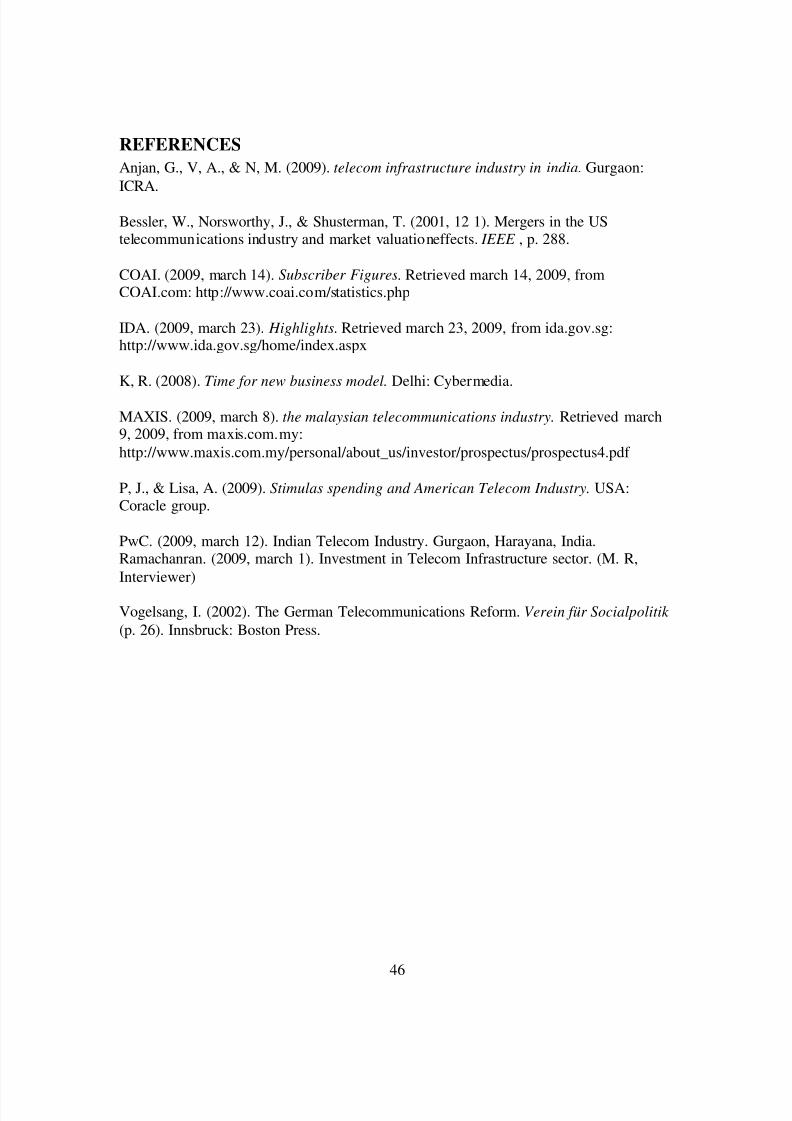
882019 Major Project (Ramit)
httpslidepdfcomreaderfullmajor-project-ramit 5562
46
REFERENCESAnjan G V A amp N M (2009) telecom infrastructure industry in india GurgaonICRA
Bessler W Norsworthy J amp Shusterman T (2001 12 1) Mergers in the UStelecommunications industry and market valuationeffects IEEE p 288
COAI (2009 march 14) Subscriber Figures Retrieved march 14 2009 fromCOAIcom httpwwwcoaicomstatisticsphp
IDA (2009 march 23) Highlights Retrieved march 23 2009 from idagovsghttpwwwidagovsghomeindexaspx
K R (2008) Time for new business model Delhi Cybermedia
MAXIS (2009 march 8) the malaysian telecommunications industry Retrieved march9 2009 from maxiscommyhttpwwwmaxiscommypersonalabout_usinvestorprospectusprospectus4pdf
P J amp Lisa A (2009) Stimulas spending and American Telecom Industry USACoracle group
PwC (2009 march 12) Indian Telecom Industry Gurgaon Harayana IndiaRamachanran (2009 march 1) Investment in Telecom Infrastructure sector (M RInterviewer)
Vogelsang I (2002) The German Telecommunications Reform Verein fuumlr Socialpolitik (p 26) Innsbruck Boston Press
882019 Major Project (Ramit)
httpslidepdfcomreaderfullmajor-project-ramit 5662
47
ANNEXURES
ANNEXURE 1 Key Assumptions
The occupancy of each site by single two three operators for green-field sites is assumed
to be as follows
Table 91 Expected Tenancy RatiosFY 10 FY 11 FY 12 FY 13 FY 14 FY15
GBT Tenant
Ratio 150 150 170 170 170 200
Single Operator 50 50 30 30 30 0
Two Operator 50 50 70 70 70 100
RTT Tenant
Ratio 170 170 200 200 200 250
Single Operator 30 30 0 0 0 0
Two Operator 70 70 100 100 100 50
Three Operator 0 0 0 0 0 50
From FY 15 onwards tenancy ratio of 2 and 25 for GBT and RTT sites is cons idered
882019 Major Project (Ramit)
httpslidepdfcomreaderfullmajor-project-ramit 5762
48
Capital costs related assumptions are tabulated below
Table 92 GBT and RTT Capital Cost
The lease rentals for RTT sites are reimbursed from the operators and therefore have not
been factored in the revenues as well as the expense For GBT sites land purchase cost of
035 millions assumed which has been escalated by 6 annually to determine the
salvage value of assets
GBT Capital Costs
Million
INR
Delivery cost of Ground Based
Tower (GBT)063
Delivery cost of Generator 030
Civil Work 040Shelter 012
Electrical Works 030
Other Equipments (UPS Battery
etc)045
Construction cost 045
Land 035
Contingency amp Financial Charges 035Total cost 335
RTT Capital Costs
Million
INR
Delivery cost of Roof Top
Tower (RTT) 030
Delivery cost of Generator 020
Civil Work 020Shelter 012
Electrical Works 030
Other Equipments (UPS
Battery etc) 030
Construction cost -
Land -
Contingency amp FinancialCharges 008
Total cost 150
882019 Major Project (Ramit)
httpslidepdfcomreaderfullmajor-project-ramit 5862
49
Ope rating costs related assumptions are tabulated below
Table 93 Operating CostsOperating Costs
Security Sentries (INRMonth) 4000
Supervisors (INRMonth) 6000
Cluster Manager One for Fifty Towers (INRMonth) 15000
Annual increase 500
Number of Security Sentries per tower 300
Number of supervisors per tower 010
Number of C luster manager per tower 002
Fixed Expenses
Selling amp Maintenance (INRMonth) 4000000
Annual Escalation 5
Administration overhead (INRMonth) 10000000Annual Escalation 7
AMC Cost of Generator 15 (cost of generator)
Annual Escalation (AMC) 3
For RTT sites security sentries are not required because it will be the responsibility of
the site owner A supervisor will for every 10 sites and a cluster manager for every 50
sites will be required
882019 Major Project (Ramit)
httpslidepdfcomreaderfullmajor-project-ramit 5962
50
Table 94 Long term debtInterest Rate 125 per annum
Moratorium 2 years
Repayment Period 8 years
Tariff related assumptions and date of operations are tabulated below
Table 95 GBT and RTT Tariff Table 96 Life of the projectTariff Plan
Tariff (INRMonth)
No of
operators GBT RTT
1 28000 18000
2 22000 14000
3 0 12000
Annual
increase 3 3
Commercial Operation Date 1-Aug-09
Quarter Ending 30-Sep-09
FY ending COD 31-Mar-10
Project life years 15
End of commercial
operations31-Aug-24
Quarter ending commercial
operations30-Sep-24
FY ending comme rcial
operations31-Mar-25
882019 Major Project (Ramit)
httpslidepdfcomreaderfullmajor-project-ramit 6062
51
Annexure 2 Profit amp Loss accountsTable 97 Profit amp loss account statement
Income Statement (MNINR)Year ending Mar-10 Mar-11 Mar-12 Mar-13 Mar-14 Mar-15
RevenueGBT 406350 28811 89080 197447 379409 527015Operator Fees (GBT) 1411 10004 30678 67998 130664 179664RTT 1209 8575 27269 60443 116146 164264
Operator Fees (RTT) 440 3121 9739 21587 41481 56466Net Revenue 7124 50511 156766 347476 667700 927410
Expenses
VariableSecurity Sentries 1355 9790 28339 64033 125433 158238Supervisors 097 699 2024 4574 8959 11303Cluster Manager 048 350 10 12 2287 4480 5651AMC Cost of Generator 450 3013 7877 16719 31148 54541Sub-total 1950 13852 39252 87612 170021 229734
Fixed
Selling amp Maintenance(INRMonth) 032 050 053 056 058 061
Administration overhead(INRMonth) 080 128 137 147 157 168
Sub-total 112 179 190 203 216 230
EBITDA 5062 36480 117324 259661 497464 697447
Interest on LT loan - - 7341 31200 77479 156198Interest on ST loan - 021 060 130 245 361
EBDT 5062 36459 109923 228331 419739 540888Depreciation 2439 12769 35917 77162 142925 174006
EBT 2624 23691 74006 151169 276814 366881Income Tax 170 4233 14536 29073 53547 77634
PAT 2454 19458 59470 122096 223267 289247
882019 Major Project (Ramit)
httpslidepdfcomreaderfullmajor-project-ramit 6162
52
Annexure 3 Balance sheet
Table 98 B alance sheetsYearend Balance Sheet (MNINR)Year ending Mar-10 Mar-11 Mar-12 Mar-13 Mar-14 Mar-15
AssetsGross Block 75742 328216 833164 1716823 3105430 3105430Accumulated depreciation 2439 15208 51125 128287 271212 445218Net Block 73303 313009 782040 1588536 2834219 2660212Net Working Capital 064 241 620 1335 2515 3707Cash Balance 12979 72089 216513 488856 947982 1294734Total Assets 86346 385339 999172 2078727 3784715 3958653
LiabilitiesEquity 25168 108980 276604 569947 1030914 1030914Reserves amp Surplus 2454 21912 81381 203477 426745 715992Long term Debt 58725 254286 640722 1304302 2325171 2208967WC Borrowings - 161 465 1001 1886 2780Total Liabilities 86346 385339 999172 2078727 3784715 3958653
882019 Major Project (Ramit)
httpslidepdfcomreaderfullmajor-project-ramit 6262
Annexure 4 Cash flow statement
Table 99 Cash flow statements
Year ending Mar-10 Mar-11 Mar-12 Mar-13 Mar-14 Mar-15
InflowsPAT 2454 19458 59470 122096 223267 289247Depreciation 2439 12769 35917 77162 142925 174006Tax adjusted interest - 014 4959 20991 52076 104895Release of WC - - - - - -Salvage Value - - - - - -Sub-Total 4893 32241 100345 220249 418268 568148
OutflowsCapex 75742 252474 504948 883659 1388607 -Change in WorkingCapital 064 177 379 715 1180 1192
Sub-Total 75806 252651 505327 884374 1389787 1192
UFCF (70913) (220410) (404982) (664125) (971519) 566956LFCF (70913) (220424) (409940) (685116) (1023595) 462062
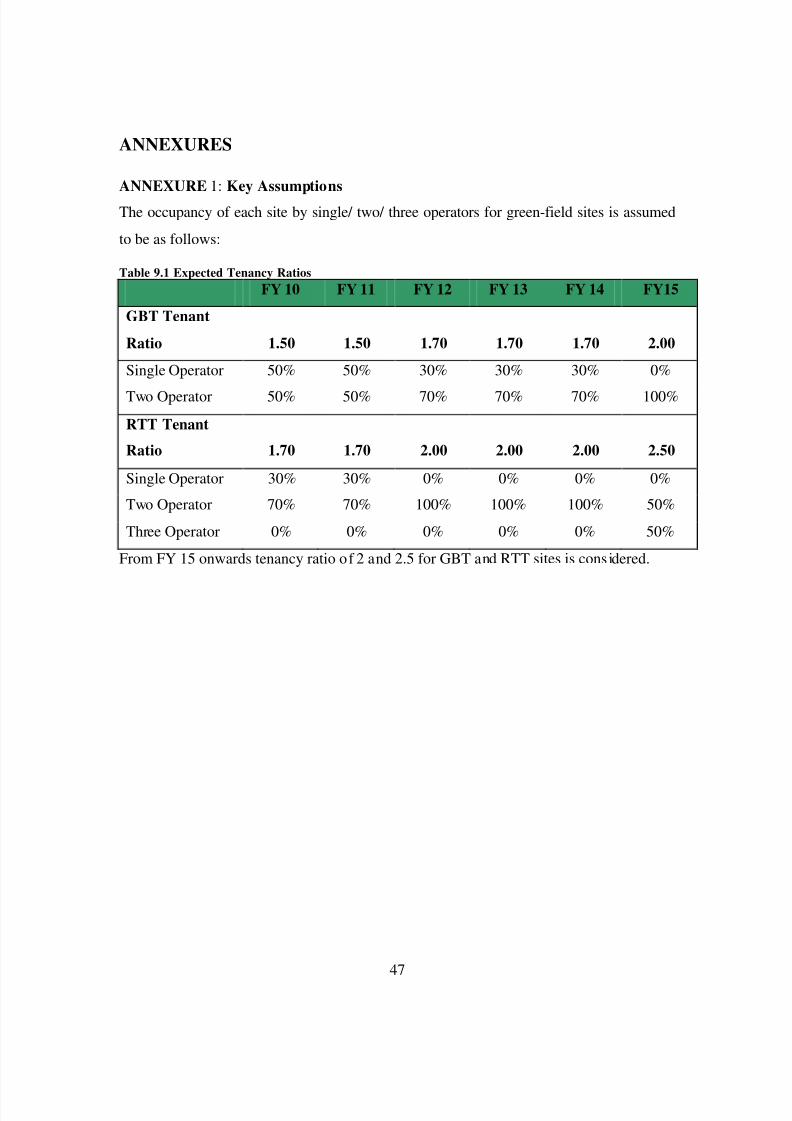
882019 Major Project (Ramit)
httpslidepdfcomreaderfullmajor-project-ramit 5662
47
ANNEXURES
ANNEXURE 1 Key Assumptions
The occupancy of each site by single two three operators for green-field sites is assumed
to be as follows
Table 91 Expected Tenancy RatiosFY 10 FY 11 FY 12 FY 13 FY 14 FY15
GBT Tenant
Ratio 150 150 170 170 170 200
Single Operator 50 50 30 30 30 0
Two Operator 50 50 70 70 70 100
RTT Tenant
Ratio 170 170 200 200 200 250
Single Operator 30 30 0 0 0 0
Two Operator 70 70 100 100 100 50
Three Operator 0 0 0 0 0 50
From FY 15 onwards tenancy ratio of 2 and 25 for GBT and RTT sites is cons idered
882019 Major Project (Ramit)
httpslidepdfcomreaderfullmajor-project-ramit 5762
48
Capital costs related assumptions are tabulated below
Table 92 GBT and RTT Capital Cost
The lease rentals for RTT sites are reimbursed from the operators and therefore have not
been factored in the revenues as well as the expense For GBT sites land purchase cost of
035 millions assumed which has been escalated by 6 annually to determine the
salvage value of assets
GBT Capital Costs
Million
INR
Delivery cost of Ground Based
Tower (GBT)063
Delivery cost of Generator 030
Civil Work 040Shelter 012
Electrical Works 030
Other Equipments (UPS Battery
etc)045
Construction cost 045
Land 035
Contingency amp Financial Charges 035Total cost 335
RTT Capital Costs
Million
INR
Delivery cost of Roof Top
Tower (RTT) 030
Delivery cost of Generator 020
Civil Work 020Shelter 012
Electrical Works 030
Other Equipments (UPS
Battery etc) 030
Construction cost -
Land -
Contingency amp FinancialCharges 008
Total cost 150
882019 Major Project (Ramit)
httpslidepdfcomreaderfullmajor-project-ramit 5862
49
Ope rating costs related assumptions are tabulated below
Table 93 Operating CostsOperating Costs
Security Sentries (INRMonth) 4000
Supervisors (INRMonth) 6000
Cluster Manager One for Fifty Towers (INRMonth) 15000
Annual increase 500
Number of Security Sentries per tower 300
Number of supervisors per tower 010
Number of C luster manager per tower 002
Fixed Expenses
Selling amp Maintenance (INRMonth) 4000000
Annual Escalation 5
Administration overhead (INRMonth) 10000000Annual Escalation 7
AMC Cost of Generator 15 (cost of generator)
Annual Escalation (AMC) 3
For RTT sites security sentries are not required because it will be the responsibility of
the site owner A supervisor will for every 10 sites and a cluster manager for every 50
sites will be required
882019 Major Project (Ramit)
httpslidepdfcomreaderfullmajor-project-ramit 5962
50
Table 94 Long term debtInterest Rate 125 per annum
Moratorium 2 years
Repayment Period 8 years
Tariff related assumptions and date of operations are tabulated below
Table 95 GBT and RTT Tariff Table 96 Life of the projectTariff Plan
Tariff (INRMonth)
No of
operators GBT RTT
1 28000 18000
2 22000 14000
3 0 12000
Annual
increase 3 3
Commercial Operation Date 1-Aug-09
Quarter Ending 30-Sep-09
FY ending COD 31-Mar-10
Project life years 15
End of commercial
operations31-Aug-24
Quarter ending commercial
operations30-Sep-24
FY ending comme rcial
operations31-Mar-25
882019 Major Project (Ramit)
httpslidepdfcomreaderfullmajor-project-ramit 6062
51
Annexure 2 Profit amp Loss accountsTable 97 Profit amp loss account statement
Income Statement (MNINR)Year ending Mar-10 Mar-11 Mar-12 Mar-13 Mar-14 Mar-15
RevenueGBT 406350 28811 89080 197447 379409 527015Operator Fees (GBT) 1411 10004 30678 67998 130664 179664RTT 1209 8575 27269 60443 116146 164264
Operator Fees (RTT) 440 3121 9739 21587 41481 56466Net Revenue 7124 50511 156766 347476 667700 927410
Expenses
VariableSecurity Sentries 1355 9790 28339 64033 125433 158238Supervisors 097 699 2024 4574 8959 11303Cluster Manager 048 350 10 12 2287 4480 5651AMC Cost of Generator 450 3013 7877 16719 31148 54541Sub-total 1950 13852 39252 87612 170021 229734
Fixed
Selling amp Maintenance(INRMonth) 032 050 053 056 058 061
Administration overhead(INRMonth) 080 128 137 147 157 168
Sub-total 112 179 190 203 216 230
EBITDA 5062 36480 117324 259661 497464 697447
Interest on LT loan - - 7341 31200 77479 156198Interest on ST loan - 021 060 130 245 361
EBDT 5062 36459 109923 228331 419739 540888Depreciation 2439 12769 35917 77162 142925 174006
EBT 2624 23691 74006 151169 276814 366881Income Tax 170 4233 14536 29073 53547 77634
PAT 2454 19458 59470 122096 223267 289247
882019 Major Project (Ramit)
httpslidepdfcomreaderfullmajor-project-ramit 6162
52
Annexure 3 Balance sheet
Table 98 B alance sheetsYearend Balance Sheet (MNINR)Year ending Mar-10 Mar-11 Mar-12 Mar-13 Mar-14 Mar-15
AssetsGross Block 75742 328216 833164 1716823 3105430 3105430Accumulated depreciation 2439 15208 51125 128287 271212 445218Net Block 73303 313009 782040 1588536 2834219 2660212Net Working Capital 064 241 620 1335 2515 3707Cash Balance 12979 72089 216513 488856 947982 1294734Total Assets 86346 385339 999172 2078727 3784715 3958653
LiabilitiesEquity 25168 108980 276604 569947 1030914 1030914Reserves amp Surplus 2454 21912 81381 203477 426745 715992Long term Debt 58725 254286 640722 1304302 2325171 2208967WC Borrowings - 161 465 1001 1886 2780Total Liabilities 86346 385339 999172 2078727 3784715 3958653
882019 Major Project (Ramit)
httpslidepdfcomreaderfullmajor-project-ramit 6262
Annexure 4 Cash flow statement
Table 99 Cash flow statements
Year ending Mar-10 Mar-11 Mar-12 Mar-13 Mar-14 Mar-15
InflowsPAT 2454 19458 59470 122096 223267 289247Depreciation 2439 12769 35917 77162 142925 174006Tax adjusted interest - 014 4959 20991 52076 104895Release of WC - - - - - -Salvage Value - - - - - -Sub-Total 4893 32241 100345 220249 418268 568148
OutflowsCapex 75742 252474 504948 883659 1388607 -Change in WorkingCapital 064 177 379 715 1180 1192
Sub-Total 75806 252651 505327 884374 1389787 1192
UFCF (70913) (220410) (404982) (664125) (971519) 566956LFCF (70913) (220424) (409940) (685116) (1023595) 462062
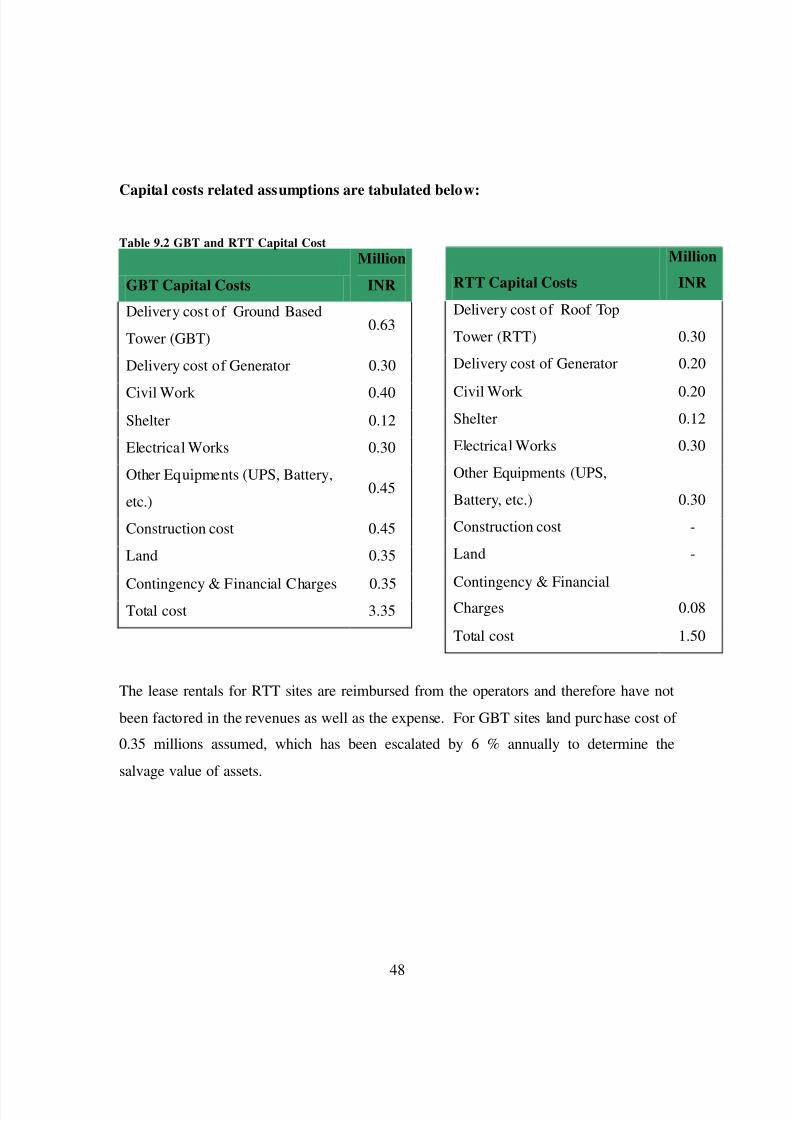
882019 Major Project (Ramit)
httpslidepdfcomreaderfullmajor-project-ramit 5762
48
Capital costs related assumptions are tabulated below
Table 92 GBT and RTT Capital Cost
The lease rentals for RTT sites are reimbursed from the operators and therefore have not
been factored in the revenues as well as the expense For GBT sites land purchase cost of
035 millions assumed which has been escalated by 6 annually to determine the
salvage value of assets
GBT Capital Costs
Million
INR
Delivery cost of Ground Based
Tower (GBT)063
Delivery cost of Generator 030
Civil Work 040Shelter 012
Electrical Works 030
Other Equipments (UPS Battery
etc)045
Construction cost 045
Land 035
Contingency amp Financial Charges 035Total cost 335
RTT Capital Costs
Million
INR
Delivery cost of Roof Top
Tower (RTT) 030
Delivery cost of Generator 020
Civil Work 020Shelter 012
Electrical Works 030
Other Equipments (UPS
Battery etc) 030
Construction cost -
Land -
Contingency amp FinancialCharges 008
Total cost 150
882019 Major Project (Ramit)
httpslidepdfcomreaderfullmajor-project-ramit 5862
49
Ope rating costs related assumptions are tabulated below
Table 93 Operating CostsOperating Costs
Security Sentries (INRMonth) 4000
Supervisors (INRMonth) 6000
Cluster Manager One for Fifty Towers (INRMonth) 15000
Annual increase 500
Number of Security Sentries per tower 300
Number of supervisors per tower 010
Number of C luster manager per tower 002
Fixed Expenses
Selling amp Maintenance (INRMonth) 4000000
Annual Escalation 5
Administration overhead (INRMonth) 10000000Annual Escalation 7
AMC Cost of Generator 15 (cost of generator)
Annual Escalation (AMC) 3
For RTT sites security sentries are not required because it will be the responsibility of
the site owner A supervisor will for every 10 sites and a cluster manager for every 50
sites will be required
882019 Major Project (Ramit)
httpslidepdfcomreaderfullmajor-project-ramit 5962
50
Table 94 Long term debtInterest Rate 125 per annum
Moratorium 2 years
Repayment Period 8 years
Tariff related assumptions and date of operations are tabulated below
Table 95 GBT and RTT Tariff Table 96 Life of the projectTariff Plan
Tariff (INRMonth)
No of
operators GBT RTT
1 28000 18000
2 22000 14000
3 0 12000
Annual
increase 3 3
Commercial Operation Date 1-Aug-09
Quarter Ending 30-Sep-09
FY ending COD 31-Mar-10
Project life years 15
End of commercial
operations31-Aug-24
Quarter ending commercial
operations30-Sep-24
FY ending comme rcial
operations31-Mar-25
882019 Major Project (Ramit)
httpslidepdfcomreaderfullmajor-project-ramit 6062
51
Annexure 2 Profit amp Loss accountsTable 97 Profit amp loss account statement
Income Statement (MNINR)Year ending Mar-10 Mar-11 Mar-12 Mar-13 Mar-14 Mar-15
RevenueGBT 406350 28811 89080 197447 379409 527015Operator Fees (GBT) 1411 10004 30678 67998 130664 179664RTT 1209 8575 27269 60443 116146 164264
Operator Fees (RTT) 440 3121 9739 21587 41481 56466Net Revenue 7124 50511 156766 347476 667700 927410
Expenses
VariableSecurity Sentries 1355 9790 28339 64033 125433 158238Supervisors 097 699 2024 4574 8959 11303Cluster Manager 048 350 10 12 2287 4480 5651AMC Cost of Generator 450 3013 7877 16719 31148 54541Sub-total 1950 13852 39252 87612 170021 229734
Fixed
Selling amp Maintenance(INRMonth) 032 050 053 056 058 061
Administration overhead(INRMonth) 080 128 137 147 157 168
Sub-total 112 179 190 203 216 230
EBITDA 5062 36480 117324 259661 497464 697447
Interest on LT loan - - 7341 31200 77479 156198Interest on ST loan - 021 060 130 245 361
EBDT 5062 36459 109923 228331 419739 540888Depreciation 2439 12769 35917 77162 142925 174006
EBT 2624 23691 74006 151169 276814 366881Income Tax 170 4233 14536 29073 53547 77634
PAT 2454 19458 59470 122096 223267 289247
882019 Major Project (Ramit)
httpslidepdfcomreaderfullmajor-project-ramit 6162
52
Annexure 3 Balance sheet
Table 98 B alance sheetsYearend Balance Sheet (MNINR)Year ending Mar-10 Mar-11 Mar-12 Mar-13 Mar-14 Mar-15
AssetsGross Block 75742 328216 833164 1716823 3105430 3105430Accumulated depreciation 2439 15208 51125 128287 271212 445218Net Block 73303 313009 782040 1588536 2834219 2660212Net Working Capital 064 241 620 1335 2515 3707Cash Balance 12979 72089 216513 488856 947982 1294734Total Assets 86346 385339 999172 2078727 3784715 3958653
LiabilitiesEquity 25168 108980 276604 569947 1030914 1030914Reserves amp Surplus 2454 21912 81381 203477 426745 715992Long term Debt 58725 254286 640722 1304302 2325171 2208967WC Borrowings - 161 465 1001 1886 2780Total Liabilities 86346 385339 999172 2078727 3784715 3958653
882019 Major Project (Ramit)
httpslidepdfcomreaderfullmajor-project-ramit 6262
Annexure 4 Cash flow statement
Table 99 Cash flow statements
Year ending Mar-10 Mar-11 Mar-12 Mar-13 Mar-14 Mar-15
InflowsPAT 2454 19458 59470 122096 223267 289247Depreciation 2439 12769 35917 77162 142925 174006Tax adjusted interest - 014 4959 20991 52076 104895Release of WC - - - - - -Salvage Value - - - - - -Sub-Total 4893 32241 100345 220249 418268 568148
OutflowsCapex 75742 252474 504948 883659 1388607 -Change in WorkingCapital 064 177 379 715 1180 1192
Sub-Total 75806 252651 505327 884374 1389787 1192
UFCF (70913) (220410) (404982) (664125) (971519) 566956LFCF (70913) (220424) (409940) (685116) (1023595) 462062
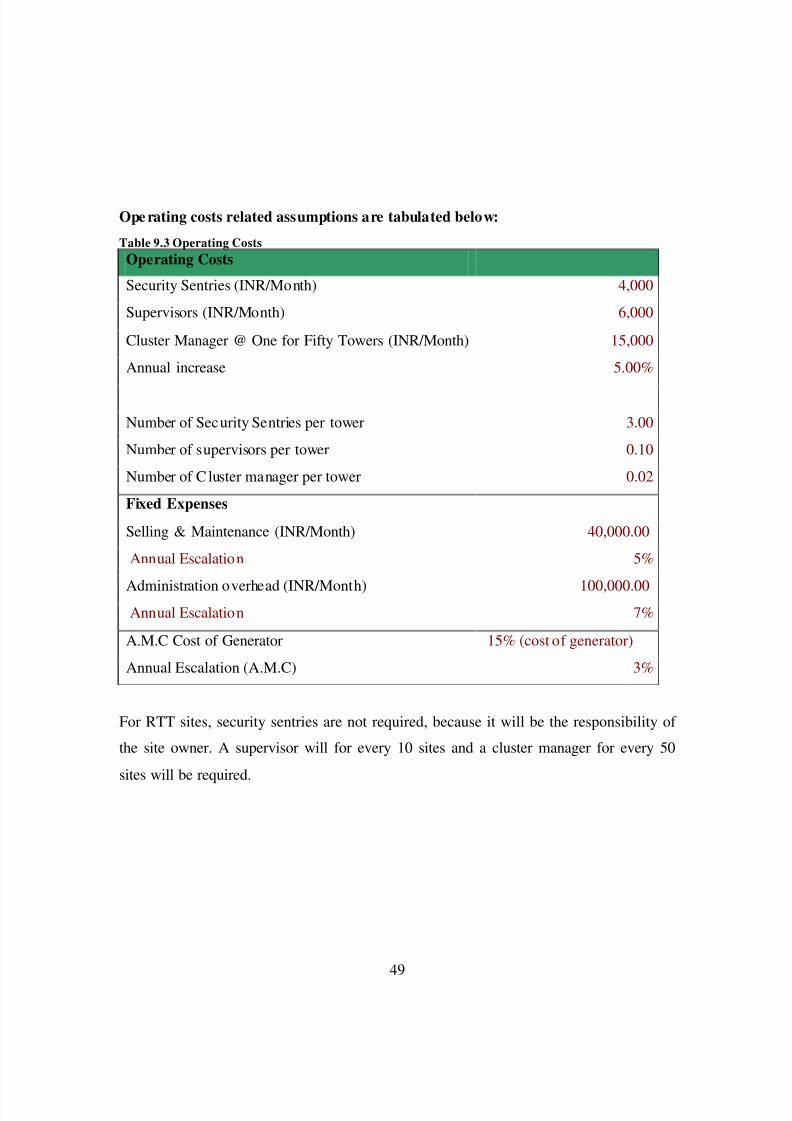
882019 Major Project (Ramit)
httpslidepdfcomreaderfullmajor-project-ramit 5862
49
Ope rating costs related assumptions are tabulated below
Table 93 Operating CostsOperating Costs
Security Sentries (INRMonth) 4000
Supervisors (INRMonth) 6000
Cluster Manager One for Fifty Towers (INRMonth) 15000
Annual increase 500
Number of Security Sentries per tower 300
Number of supervisors per tower 010
Number of C luster manager per tower 002
Fixed Expenses
Selling amp Maintenance (INRMonth) 4000000
Annual Escalation 5
Administration overhead (INRMonth) 10000000Annual Escalation 7
AMC Cost of Generator 15 (cost of generator)
Annual Escalation (AMC) 3
For RTT sites security sentries are not required because it will be the responsibility of
the site owner A supervisor will for every 10 sites and a cluster manager for every 50
sites will be required
882019 Major Project (Ramit)
httpslidepdfcomreaderfullmajor-project-ramit 5962
50
Table 94 Long term debtInterest Rate 125 per annum
Moratorium 2 years
Repayment Period 8 years
Tariff related assumptions and date of operations are tabulated below
Table 95 GBT and RTT Tariff Table 96 Life of the projectTariff Plan
Tariff (INRMonth)
No of
operators GBT RTT
1 28000 18000
2 22000 14000
3 0 12000
Annual
increase 3 3
Commercial Operation Date 1-Aug-09
Quarter Ending 30-Sep-09
FY ending COD 31-Mar-10
Project life years 15
End of commercial
operations31-Aug-24
Quarter ending commercial
operations30-Sep-24
FY ending comme rcial
operations31-Mar-25
882019 Major Project (Ramit)
httpslidepdfcomreaderfullmajor-project-ramit 6062
51
Annexure 2 Profit amp Loss accountsTable 97 Profit amp loss account statement
Income Statement (MNINR)Year ending Mar-10 Mar-11 Mar-12 Mar-13 Mar-14 Mar-15
RevenueGBT 406350 28811 89080 197447 379409 527015Operator Fees (GBT) 1411 10004 30678 67998 130664 179664RTT 1209 8575 27269 60443 116146 164264
Operator Fees (RTT) 440 3121 9739 21587 41481 56466Net Revenue 7124 50511 156766 347476 667700 927410
Expenses
VariableSecurity Sentries 1355 9790 28339 64033 125433 158238Supervisors 097 699 2024 4574 8959 11303Cluster Manager 048 350 10 12 2287 4480 5651AMC Cost of Generator 450 3013 7877 16719 31148 54541Sub-total 1950 13852 39252 87612 170021 229734
Fixed
Selling amp Maintenance(INRMonth) 032 050 053 056 058 061
Administration overhead(INRMonth) 080 128 137 147 157 168
Sub-total 112 179 190 203 216 230
EBITDA 5062 36480 117324 259661 497464 697447
Interest on LT loan - - 7341 31200 77479 156198Interest on ST loan - 021 060 130 245 361
EBDT 5062 36459 109923 228331 419739 540888Depreciation 2439 12769 35917 77162 142925 174006
EBT 2624 23691 74006 151169 276814 366881Income Tax 170 4233 14536 29073 53547 77634
PAT 2454 19458 59470 122096 223267 289247
882019 Major Project (Ramit)
httpslidepdfcomreaderfullmajor-project-ramit 6162
52
Annexure 3 Balance sheet
Table 98 B alance sheetsYearend Balance Sheet (MNINR)Year ending Mar-10 Mar-11 Mar-12 Mar-13 Mar-14 Mar-15
AssetsGross Block 75742 328216 833164 1716823 3105430 3105430Accumulated depreciation 2439 15208 51125 128287 271212 445218Net Block 73303 313009 782040 1588536 2834219 2660212Net Working Capital 064 241 620 1335 2515 3707Cash Balance 12979 72089 216513 488856 947982 1294734Total Assets 86346 385339 999172 2078727 3784715 3958653
LiabilitiesEquity 25168 108980 276604 569947 1030914 1030914Reserves amp Surplus 2454 21912 81381 203477 426745 715992Long term Debt 58725 254286 640722 1304302 2325171 2208967WC Borrowings - 161 465 1001 1886 2780Total Liabilities 86346 385339 999172 2078727 3784715 3958653
882019 Major Project (Ramit)
httpslidepdfcomreaderfullmajor-project-ramit 6262
Annexure 4 Cash flow statement
Table 99 Cash flow statements
Year ending Mar-10 Mar-11 Mar-12 Mar-13 Mar-14 Mar-15
InflowsPAT 2454 19458 59470 122096 223267 289247Depreciation 2439 12769 35917 77162 142925 174006Tax adjusted interest - 014 4959 20991 52076 104895Release of WC - - - - - -Salvage Value - - - - - -Sub-Total 4893 32241 100345 220249 418268 568148
OutflowsCapex 75742 252474 504948 883659 1388607 -Change in WorkingCapital 064 177 379 715 1180 1192
Sub-Total 75806 252651 505327 884374 1389787 1192
UFCF (70913) (220410) (404982) (664125) (971519) 566956LFCF (70913) (220424) (409940) (685116) (1023595) 462062
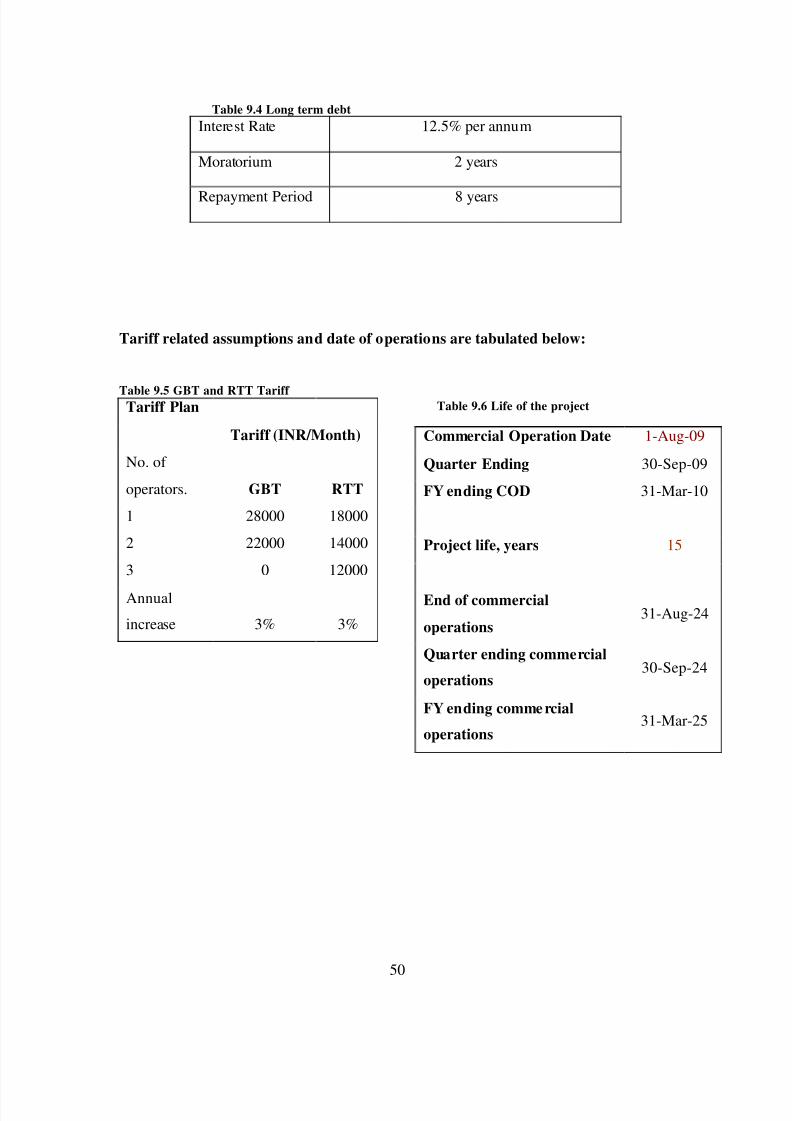
882019 Major Project (Ramit)
httpslidepdfcomreaderfullmajor-project-ramit 5962
50
Table 94 Long term debtInterest Rate 125 per annum
Moratorium 2 years
Repayment Period 8 years
Tariff related assumptions and date of operations are tabulated below
Table 95 GBT and RTT Tariff Table 96 Life of the projectTariff Plan
Tariff (INRMonth)
No of
operators GBT RTT
1 28000 18000
2 22000 14000
3 0 12000
Annual
increase 3 3
Commercial Operation Date 1-Aug-09
Quarter Ending 30-Sep-09
FY ending COD 31-Mar-10
Project life years 15
End of commercial
operations31-Aug-24
Quarter ending commercial
operations30-Sep-24
FY ending comme rcial
operations31-Mar-25
882019 Major Project (Ramit)
httpslidepdfcomreaderfullmajor-project-ramit 6062
51
Annexure 2 Profit amp Loss accountsTable 97 Profit amp loss account statement
Income Statement (MNINR)Year ending Mar-10 Mar-11 Mar-12 Mar-13 Mar-14 Mar-15
RevenueGBT 406350 28811 89080 197447 379409 527015Operator Fees (GBT) 1411 10004 30678 67998 130664 179664RTT 1209 8575 27269 60443 116146 164264
Operator Fees (RTT) 440 3121 9739 21587 41481 56466Net Revenue 7124 50511 156766 347476 667700 927410
Expenses
VariableSecurity Sentries 1355 9790 28339 64033 125433 158238Supervisors 097 699 2024 4574 8959 11303Cluster Manager 048 350 10 12 2287 4480 5651AMC Cost of Generator 450 3013 7877 16719 31148 54541Sub-total 1950 13852 39252 87612 170021 229734
Fixed
Selling amp Maintenance(INRMonth) 032 050 053 056 058 061
Administration overhead(INRMonth) 080 128 137 147 157 168
Sub-total 112 179 190 203 216 230
EBITDA 5062 36480 117324 259661 497464 697447
Interest on LT loan - - 7341 31200 77479 156198Interest on ST loan - 021 060 130 245 361
EBDT 5062 36459 109923 228331 419739 540888Depreciation 2439 12769 35917 77162 142925 174006
EBT 2624 23691 74006 151169 276814 366881Income Tax 170 4233 14536 29073 53547 77634
PAT 2454 19458 59470 122096 223267 289247
882019 Major Project (Ramit)
httpslidepdfcomreaderfullmajor-project-ramit 6162
52
Annexure 3 Balance sheet
Table 98 B alance sheetsYearend Balance Sheet (MNINR)Year ending Mar-10 Mar-11 Mar-12 Mar-13 Mar-14 Mar-15
AssetsGross Block 75742 328216 833164 1716823 3105430 3105430Accumulated depreciation 2439 15208 51125 128287 271212 445218Net Block 73303 313009 782040 1588536 2834219 2660212Net Working Capital 064 241 620 1335 2515 3707Cash Balance 12979 72089 216513 488856 947982 1294734Total Assets 86346 385339 999172 2078727 3784715 3958653
LiabilitiesEquity 25168 108980 276604 569947 1030914 1030914Reserves amp Surplus 2454 21912 81381 203477 426745 715992Long term Debt 58725 254286 640722 1304302 2325171 2208967WC Borrowings - 161 465 1001 1886 2780Total Liabilities 86346 385339 999172 2078727 3784715 3958653
882019 Major Project (Ramit)
httpslidepdfcomreaderfullmajor-project-ramit 6262
Annexure 4 Cash flow statement
Table 99 Cash flow statements
Year ending Mar-10 Mar-11 Mar-12 Mar-13 Mar-14 Mar-15
InflowsPAT 2454 19458 59470 122096 223267 289247Depreciation 2439 12769 35917 77162 142925 174006Tax adjusted interest - 014 4959 20991 52076 104895Release of WC - - - - - -Salvage Value - - - - - -Sub-Total 4893 32241 100345 220249 418268 568148
OutflowsCapex 75742 252474 504948 883659 1388607 -Change in WorkingCapital 064 177 379 715 1180 1192
Sub-Total 75806 252651 505327 884374 1389787 1192
UFCF (70913) (220410) (404982) (664125) (971519) 566956LFCF (70913) (220424) (409940) (685116) (1023595) 462062
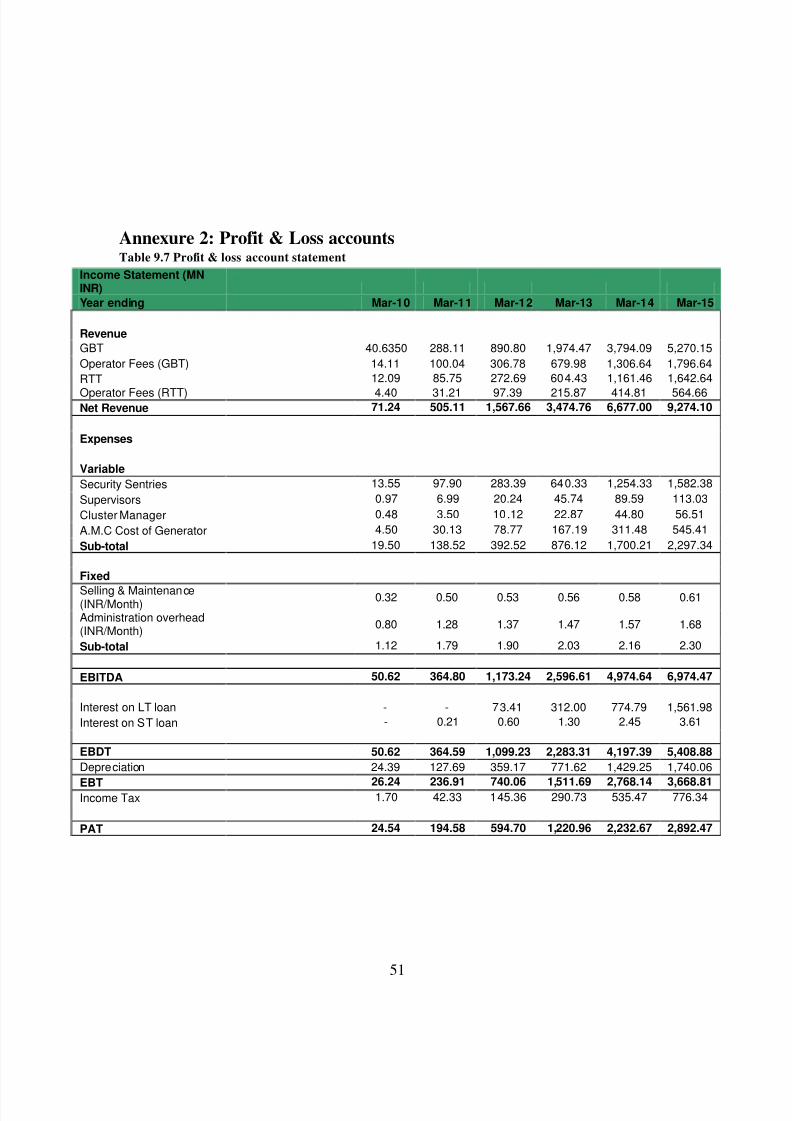
882019 Major Project (Ramit)
httpslidepdfcomreaderfullmajor-project-ramit 6062
51
Annexure 2 Profit amp Loss accountsTable 97 Profit amp loss account statement
Income Statement (MNINR)Year ending Mar-10 Mar-11 Mar-12 Mar-13 Mar-14 Mar-15
RevenueGBT 406350 28811 89080 197447 379409 527015Operator Fees (GBT) 1411 10004 30678 67998 130664 179664RTT 1209 8575 27269 60443 116146 164264
Operator Fees (RTT) 440 3121 9739 21587 41481 56466Net Revenue 7124 50511 156766 347476 667700 927410
Expenses
VariableSecurity Sentries 1355 9790 28339 64033 125433 158238Supervisors 097 699 2024 4574 8959 11303Cluster Manager 048 350 10 12 2287 4480 5651AMC Cost of Generator 450 3013 7877 16719 31148 54541Sub-total 1950 13852 39252 87612 170021 229734
Fixed
Selling amp Maintenance(INRMonth) 032 050 053 056 058 061
Administration overhead(INRMonth) 080 128 137 147 157 168
Sub-total 112 179 190 203 216 230
EBITDA 5062 36480 117324 259661 497464 697447
Interest on LT loan - - 7341 31200 77479 156198Interest on ST loan - 021 060 130 245 361
EBDT 5062 36459 109923 228331 419739 540888Depreciation 2439 12769 35917 77162 142925 174006
EBT 2624 23691 74006 151169 276814 366881Income Tax 170 4233 14536 29073 53547 77634
PAT 2454 19458 59470 122096 223267 289247
882019 Major Project (Ramit)
httpslidepdfcomreaderfullmajor-project-ramit 6162
52
Annexure 3 Balance sheet
Table 98 B alance sheetsYearend Balance Sheet (MNINR)Year ending Mar-10 Mar-11 Mar-12 Mar-13 Mar-14 Mar-15
AssetsGross Block 75742 328216 833164 1716823 3105430 3105430Accumulated depreciation 2439 15208 51125 128287 271212 445218Net Block 73303 313009 782040 1588536 2834219 2660212Net Working Capital 064 241 620 1335 2515 3707Cash Balance 12979 72089 216513 488856 947982 1294734Total Assets 86346 385339 999172 2078727 3784715 3958653
LiabilitiesEquity 25168 108980 276604 569947 1030914 1030914Reserves amp Surplus 2454 21912 81381 203477 426745 715992Long term Debt 58725 254286 640722 1304302 2325171 2208967WC Borrowings - 161 465 1001 1886 2780Total Liabilities 86346 385339 999172 2078727 3784715 3958653
882019 Major Project (Ramit)
httpslidepdfcomreaderfullmajor-project-ramit 6262
Annexure 4 Cash flow statement
Table 99 Cash flow statements
Year ending Mar-10 Mar-11 Mar-12 Mar-13 Mar-14 Mar-15
InflowsPAT 2454 19458 59470 122096 223267 289247Depreciation 2439 12769 35917 77162 142925 174006Tax adjusted interest - 014 4959 20991 52076 104895Release of WC - - - - - -Salvage Value - - - - - -Sub-Total 4893 32241 100345 220249 418268 568148
OutflowsCapex 75742 252474 504948 883659 1388607 -Change in WorkingCapital 064 177 379 715 1180 1192
Sub-Total 75806 252651 505327 884374 1389787 1192
UFCF (70913) (220410) (404982) (664125) (971519) 566956LFCF (70913) (220424) (409940) (685116) (1023595) 462062
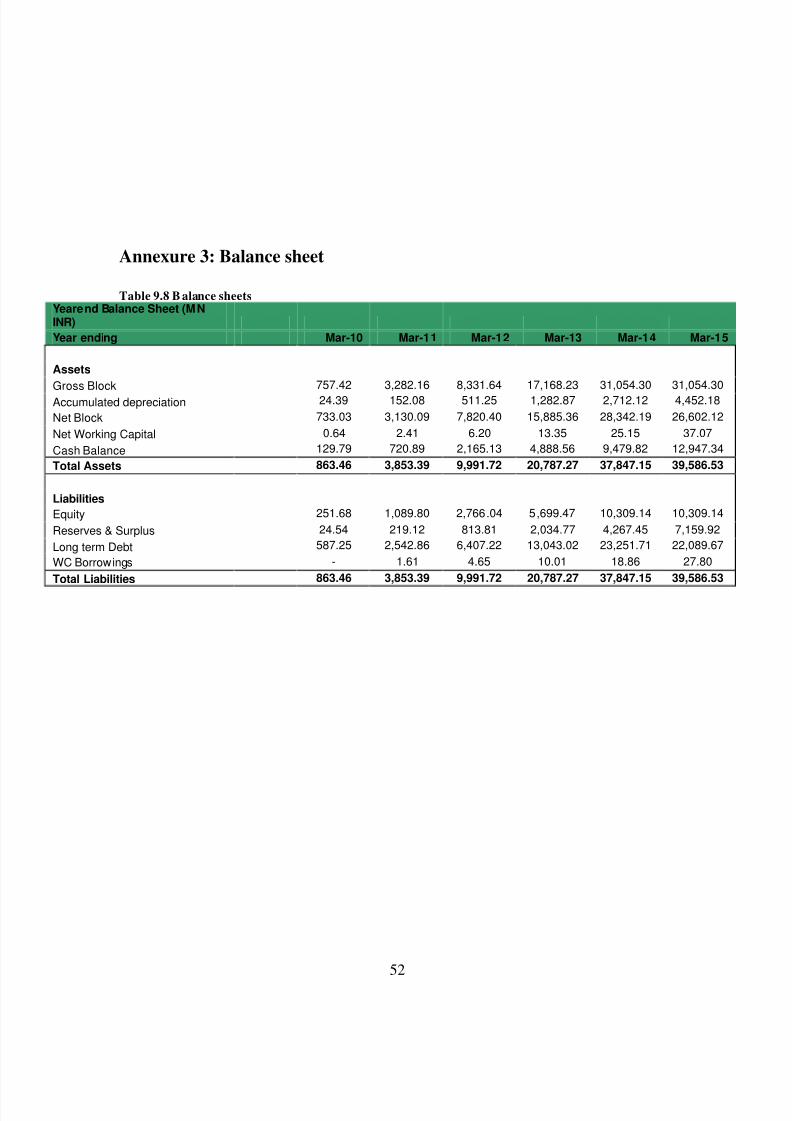
882019 Major Project (Ramit)
httpslidepdfcomreaderfullmajor-project-ramit 6162
52
Annexure 3 Balance sheet
Table 98 B alance sheetsYearend Balance Sheet (MNINR)Year ending Mar-10 Mar-11 Mar-12 Mar-13 Mar-14 Mar-15
AssetsGross Block 75742 328216 833164 1716823 3105430 3105430Accumulated depreciation 2439 15208 51125 128287 271212 445218Net Block 73303 313009 782040 1588536 2834219 2660212Net Working Capital 064 241 620 1335 2515 3707Cash Balance 12979 72089 216513 488856 947982 1294734Total Assets 86346 385339 999172 2078727 3784715 3958653
LiabilitiesEquity 25168 108980 276604 569947 1030914 1030914Reserves amp Surplus 2454 21912 81381 203477 426745 715992Long term Debt 58725 254286 640722 1304302 2325171 2208967WC Borrowings - 161 465 1001 1886 2780Total Liabilities 86346 385339 999172 2078727 3784715 3958653
882019 Major Project (Ramit)
httpslidepdfcomreaderfullmajor-project-ramit 6262
Annexure 4 Cash flow statement
Table 99 Cash flow statements
Year ending Mar-10 Mar-11 Mar-12 Mar-13 Mar-14 Mar-15
InflowsPAT 2454 19458 59470 122096 223267 289247Depreciation 2439 12769 35917 77162 142925 174006Tax adjusted interest - 014 4959 20991 52076 104895Release of WC - - - - - -Salvage Value - - - - - -Sub-Total 4893 32241 100345 220249 418268 568148
OutflowsCapex 75742 252474 504948 883659 1388607 -Change in WorkingCapital 064 177 379 715 1180 1192
Sub-Total 75806 252651 505327 884374 1389787 1192
UFCF (70913) (220410) (404982) (664125) (971519) 566956LFCF (70913) (220424) (409940) (685116) (1023595) 462062
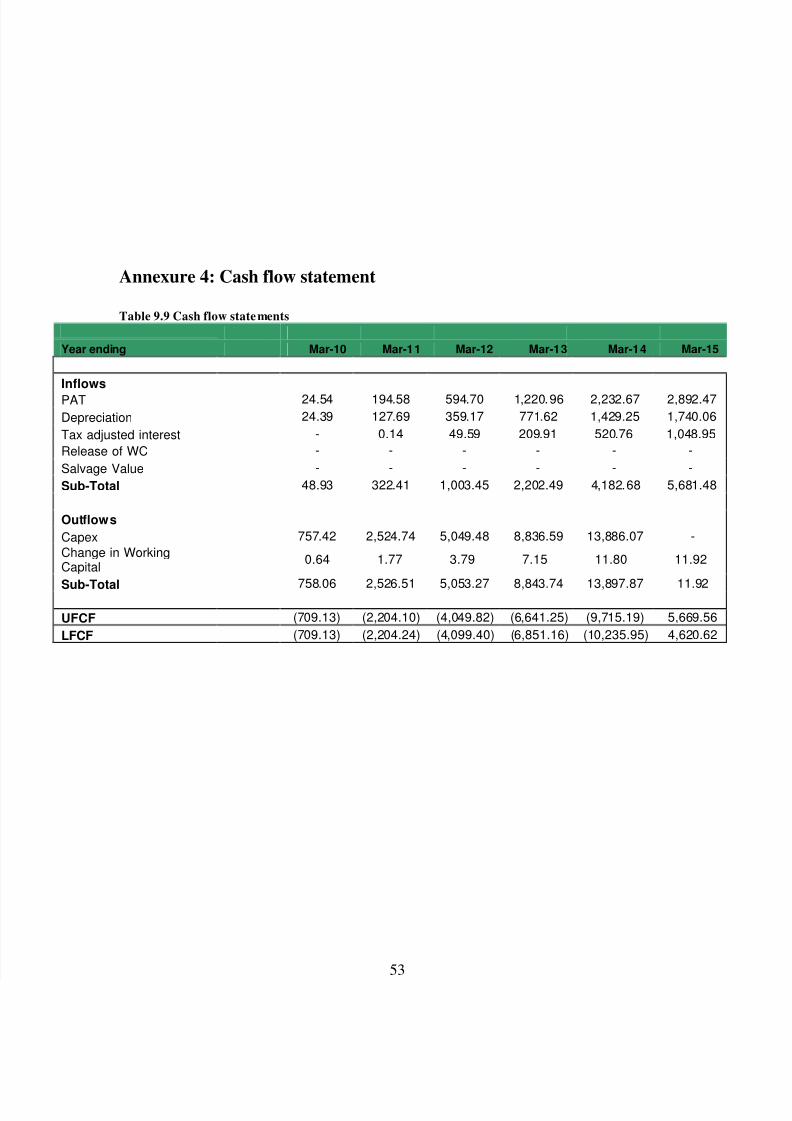
882019 Major Project (Ramit)
httpslidepdfcomreaderfullmajor-project-ramit 6262
Annexure 4 Cash flow statement
Table 99 Cash flow statements
Year ending Mar-10 Mar-11 Mar-12 Mar-13 Mar-14 Mar-15
InflowsPAT 2454 19458 59470 122096 223267 289247Depreciation 2439 12769 35917 77162 142925 174006Tax adjusted interest - 014 4959 20991 52076 104895Release of WC - - - - - -Salvage Value - - - - - -Sub-Total 4893 32241 100345 220249 418268 568148
OutflowsCapex 75742 252474 504948 883659 1388607 -Change in WorkingCapital 064 177 379 715 1180 1192
Sub-Total 75806 252651 505327 884374 1389787 1192
UFCF (70913) (220410) (404982) (664125) (971519) 566956LFCF (70913) (220424) (409940) (685116) (1023595) 462062