major -accident hazards involving dangerous substances for ... · 2008 and 68% in 2005....
15
EN EN EUROPEAN COMMISSION Brussels, 28.6.2013 C(2013) 4035 final REPORT FROM THE COMMISSION Report on the Application in the Member States of Directive 96/82/EC on the control of major-accident hazards involving dangerous substances for the period 2009-2011 (Text with EEA relevance)
Transcript of major -accident hazards involving dangerous substances for ... · 2008 and 68% in 2005....

EN EN
EUROPEAN COMMISSION
Brussels, 28.6.2013
C(2013) 4035 final
REPORT FROM THE COMMISSION
Report on the Application in the Member States of Directive 96/82/EC on the control of
major-accident hazards involving dangerous substances for the period 2009-2011
(Text with EEA relevance)

EN 2 EN
REPORT FROM THE COMMISSION
Report on the Application in the Member States of Directive 96/82/EC on the control of
major-accident hazards involving dangerous substances for the period 2009-2011
(Text with EEA relevance)
1. INTRODUCTION
Council Directive 96/82/EC1 on the control of major-accident hazards involving dangerous
substances, the so-called Seveso II Directive, aims at the prevention of major-accident
hazards involving dangerous substances and at the limitation of the consequences of such
accidents for man and the environment. The Seveso II Directive applies to some ten thousand
industrial establishments where dangerous substances are present.
This report covers the application of the Directive for the period 2009-2011. Article 19(4) of
the Directive obliges Member States to provide the Commission with a three-yearly
implementation report in accordance with the procedure laid down in the Reporting
Standardization Directive2. In line with previous practice these reports are limited to
information relating to upper-tier establishments covered by Articles 6 and 9.
This report summarises in Chapter 2 the information provided by the Member States on the
basis of a questionnaire3. The aim of this summary is to assess the level of implementation
and to identify any shortcomings that need to be addressed. Chapter 3 supplements this with
some figures on accidents resulting from an analysis of the eMARS4 and SPIRS
5 databases,
managed by the Major Accident Hazard Bureau of the Joint Research Centre of the European
Commission, on the basis of information supplied by the Member States. Conclusions and the
way forward follow in Chapter 4. Annex 1 contains an excerpt of provided figures. The full
contributions of the 27 Member States and the voluntary contributions from Norway, Iceland
and Macedonia, as well as the questionnaire, the previous reports for the periods 2000-20026,
2003-20057, and 2006-2008
8 and additional information can be found on the Commission’s
Seveso website9.
2. SUMMARY OF MEMBER STATES REPORTS
All 27 Member States submitted their triennial reports to the European Commission. Two-
thirds met the deadline of 1 October 2012 for providing the information.
1 Directive 96/82/EC, OJ L 10, 14.1.1997, p.13; amended by Directive 2003/105/EC, OJ L 345,
31.12.2003, p.97 2 Directive 91/692/EEC of 23 December 1991, OJ L377, 31.12.1991, p. 48
3 Document C(2008) 5088 final, Commission Decision of 19/09/2008
4 Online Major Accident Reporting System https://emars.jrc.ec.europa.eu
5 "Seveso Plants Information Retrieval System"
6 Document C(2004)3335
7 Document C(2007)3842
8 Document C(2010) 5422 final
9 http://ec.europa.eu/environment/seveso/implementation.htm
EN 3 EN
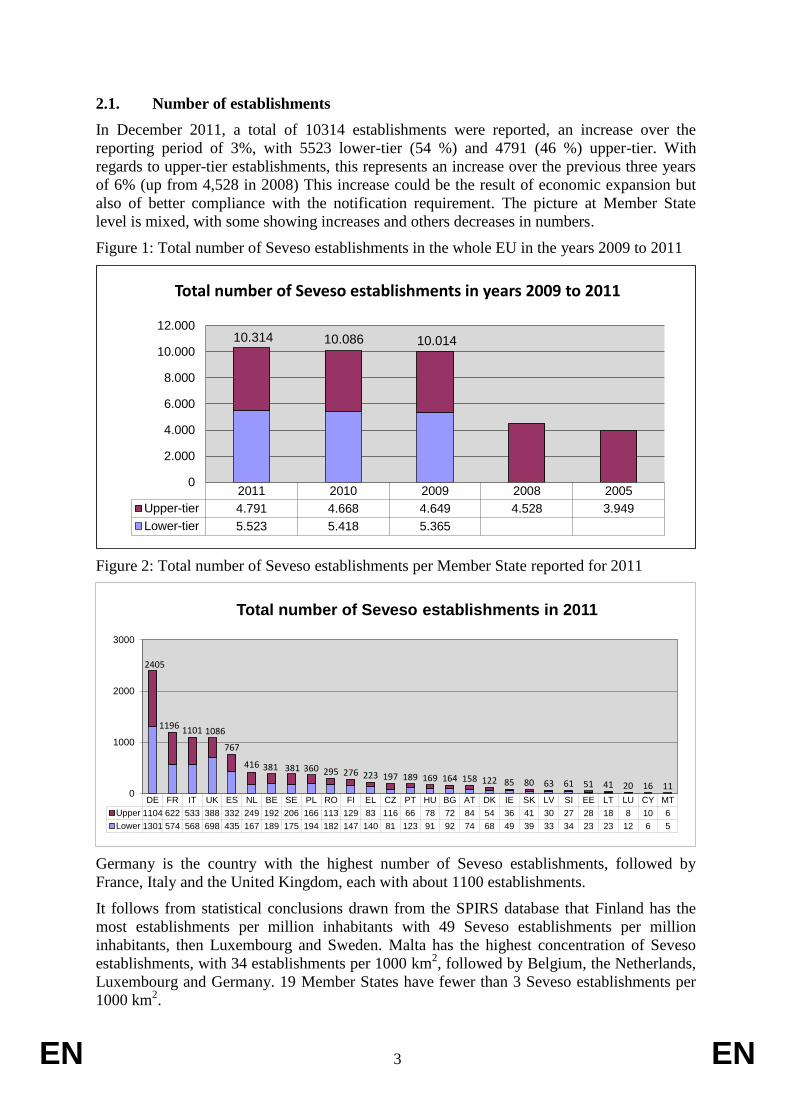
2.1. Number of establishments
In December 2011, a total of 10314 establishments were reported, an increase over the
reporting period of 3%, with 5523 lower-tier (54 %) and 4791 (46 %) upper-tier. With
regards to upper-tier establishments, this represents an increase over the previous three years
of 6% (up from 4,528 in 2008) This increase could be the result of economic expansion but
also of better compliance with the notification requirement. The picture at Member State
level is mixed, with some showing increases and others decreases in numbers.
Figure 1: Total number of Seveso establishments in the whole EU in the years 2009 to 2011
2011 2010 2009 2008 2005
Upper-tier 4.791 4.668 4.649 4.528 3.949
Lower-tier 5.523 5.418 5.365
10.314 10.086 10.014
0
2.000
4.000
6.000
8.000
10.000
12.000
Total number of Seveso establishments in years 2009 to 2011
Figure 2: Total number of Seveso establishments per Member State reported for 2011
DE FR IT UK ES NL BE SE PL RO FI EL CZ PT HU BG AT DK IE SK LV SI EE LT LU CY MT
Upper 1104 622 533 388 332 249 192 206 166 113 129 83 116 66 78 72 84 54 36 41 30 27 28 18 8 10 6
Lower 1301 574 568 698 435 167 189 175 194 182 147 140 81 123 91 92 74 68 49 39 33 34 23 23 12 6 5
2405
1196 1101 1086
767
416 381 381 360 295 276 223 197 189 169 164 158 122 85 80 63 61 51 41 20 16 110
1000
2000
3000
Total number of Seveso establishments in 2011
Germany is the country with the highest number of Seveso establishments, followed by
France, Italy and the United Kingdom, each with about 1100 establishments.
It follows from statistical conclusions drawn from the SPIRS database that Finland has the
most establishments per million inhabitants with 49 Seveso establishments per million
inhabitants, then Luxembourg and Sweden. Malta has the highest concentration of Seveso
establishments, with 34 establishments per 1000 km2, followed by Belgium, the Netherlands,
Luxembourg and Germany. 19 Member States have fewer than 3 Seveso establishments per
1000 km2.

EN 4 EN
In terms of number of Seveso establishments per unit GDP, Estonia and Latvia lead with
approximately 3 Seveso establishments per billion € GDP. Germany is ranked 17th
.
Among the 49 activities used to categorize the Seveso establishments, seven activities
contribute to 50% of establishments:
– Fuel storage (including heating, retail sale, etc.);
– Wholesale and retail storage and distribution (excluding LPG);
– LPG storage;
– General chemicals manufacture;
– Production of basic organic chemicals;
– Power generation, supply and distribution;
– LPG production, bottling and bulk distribution.
2.2. Operators
The main requirements for operators of upper tier establishments relate to the drafting of
safety reports and internal emergency plans.
The Member States' replies indicate that, by 2011, about 2% of operators had not submitted a
safety report to the competent authorities. This percentage has remained rather stable over the
past years: 2% in 2008 and in 2009, 1% in 2010.
The figures for internal emergency plans are similar, as competent authorities mainly have
proof of the existence of such plans through the examination of the safety report. By the end
of 2011, about 1% (67) of the upper-tier establishments did not have an internal emergency
plan (compared to 1% in 2009). In addition, several Member States (Bulgaria, Hungary and
Latvia) reported that this requirement had also been imposed upon operators of lower-tier
establishments, in accordance with their national regulations.
It can thus be concluded that there is overall a high level of compliance with the obligation to
produce safety reports and draw up internal emergency plans. However, a limited number of
Member States need to take measures to further increase compliance with this obligation,
including Malta and Portugal, where less than 90% of upper-tier establishments have
submitted safety reports in the past three years.
Figure 3: Safety reports submitted in 2005, 2008 and 2011

EN 5 EN
AT BE BG CY CZ DE DK EE EL ES FI FR HU IE IT LT LU LV MT NL PL PT RO SE SI SK UK
2005 89 99 100 96 90 100 100 98 92 100 98 100 100 100 62 100 100 83 89 99 95 74 96 100 93
2008 91 94 100 100 98 98 100 100 100 98 100 100 100 97 100 71 88 100 83 100 98 95 97 99 100 98 95
2011 96 99 100 100 97 99 100 100 100 97 100 100 100 97 98 94 100 100 83 92 98 88 99 100 100 100 97
0
10
20
30
40
50
60
70
80
90
100%
Safety Reports submitted (% of upper-tier establishments)
2.3. Competent Authorities
The Seveso II Directive imposes several obligations on competent authorities, of which the
most important are to examine the safety report and to communicate their conclusions to the
operator, to draw up external emergency plans, to ensure that the public liable to be affected
is informed on safety measures, to carry out inspections, to identify groups of establishments
with possible "domino effects", and to take into account land-use planning implications of
major-accident hazards. Member States have provided a lot of specific information in their
national replies. This summary focuses on aspects for which statistically meaningful
evaluations are possible or information can be compared: these are external emergency
planning, inspections, information to the public and the use of coercive instruments.
2.3.1. Elaboration of external emergency plans
Authorities designated for that purpose draw up external emergency plans for the measures to
be taken outside the establishment. These plans are important in containing and controlling
incidents so as to minimize effects and limit damage to man, the environment and property.
The data provided show that 90% of upper-tier establishments had an external emergency
plan drawn up by designated authorities in 2011, 6% were lacking such a plan and 4% had
been exempted from this requirement under Article 11(6). Consequently, on average, 93% of
the upper-tier establishments complied by the end of 2011. This represents a further increase
in comparison with previous reporting periods where the corresponding figures were 91% in
2008 and 68% in 2005. Nevertheless, the situation should still improve, especially in the
Czech Republic, the Netherlands and Portugal, where external emergency plans were drawn
up for less than 80% of upper-tier establishments.
Figure 4: External emergency plans drawn up in 2005, 2008, 2011

EN 6 EN
AT BE BG CY CZ DE DK EE EL ES FI FR HU IE IT LT LU LV MT NL PL PT RO SE SI SK UK
2005 57 57 0 73 62 100 100 100 74 96 68 89 87 68 100 0 76 17 98 94 37 55 73 100 89
2008 87 50 100 100 95 94 100 100 88 71 80 100 100 97 98 100 88 100 100 100 94 37 94 94 100 95 95
2011 93 95 99 100 79 92 93 100 83 88 93 83 92 97 94 100 88 100 100 80 77 70 89 90 100 93 91
0
10
20
30
40
50
60
70
80
90
100%
External Emergency Plans drawn up (% )
2.3.2. Testing and Review of external emergency plans
Emergency plans have to be reviewed and tested at intervals of no longer than three years.
Although no exact statistical evaluation is possible because some plans may have been tested
more than once and other plans not at all in this period, it follows from Member States’
replies that around 73% of the existing External Emergency Plans in EU-27 were tested
between 2009 and 2011. This is 13% more than the reported 60% tested plans for the period
2006-2008 and significantly higher than the reported 40% of plans tested during the period
2003-2005. Despite this increase, there is a significant variation between Member States
(ranging from 100% to only 14% of emergency plans being tested). Improvements are needed
in particular in Belgium, the Czech Republic, Greece, Italy, Portugal and Sweden, where less
than 50 % of external emergency plans were tested in the past three years.
Figure 5: External emergency plans tested in past three reporting periods10
10
Figures > 100% because some Member States may have interpreted the question as number of
establishments for which the emergency plans are tested each year

EN 7 EN
AT BE BG CY CZ DE DK EE EL ES FI FR HU IE IT LT LU LV MT NL PL PT RO SE SI SK UK
2003-2005 96 0 0 5 52 55 0 0 56 0 28 202 55 22 210 0 100 0 0 39 19 38 0 64 63
2006-2008 83 114 77 0 21 70 50 24 112 74 41 100 66 56 306 0 103 33 89 35 81 27 100 150 65
2009-2011 100 41 66 270 30 75 58 36 111 78 114 168 69 35 300 86 100 100 105 22 97 14 93 97 92
0
10
20
30
40
50
60
70
80
90
100%
Tested External Emergency Plans 2005 - 2011 (%)
2.3.3. Information to the public
Information on safety measures and on requisite behaviour in the event of an accident has to
be supplied regularly, without their having to request it, to persons liable to be affected by a
major accident. The Directive leaves it open who is responsible for this. The maximum
period between the repetition of this information to the public is five years (two years longer
than the reporting period). Therefore the questionnaire asked for how many establishments
information had been made available during the period 2007-2012. Not all Member State
replies refer to this period.
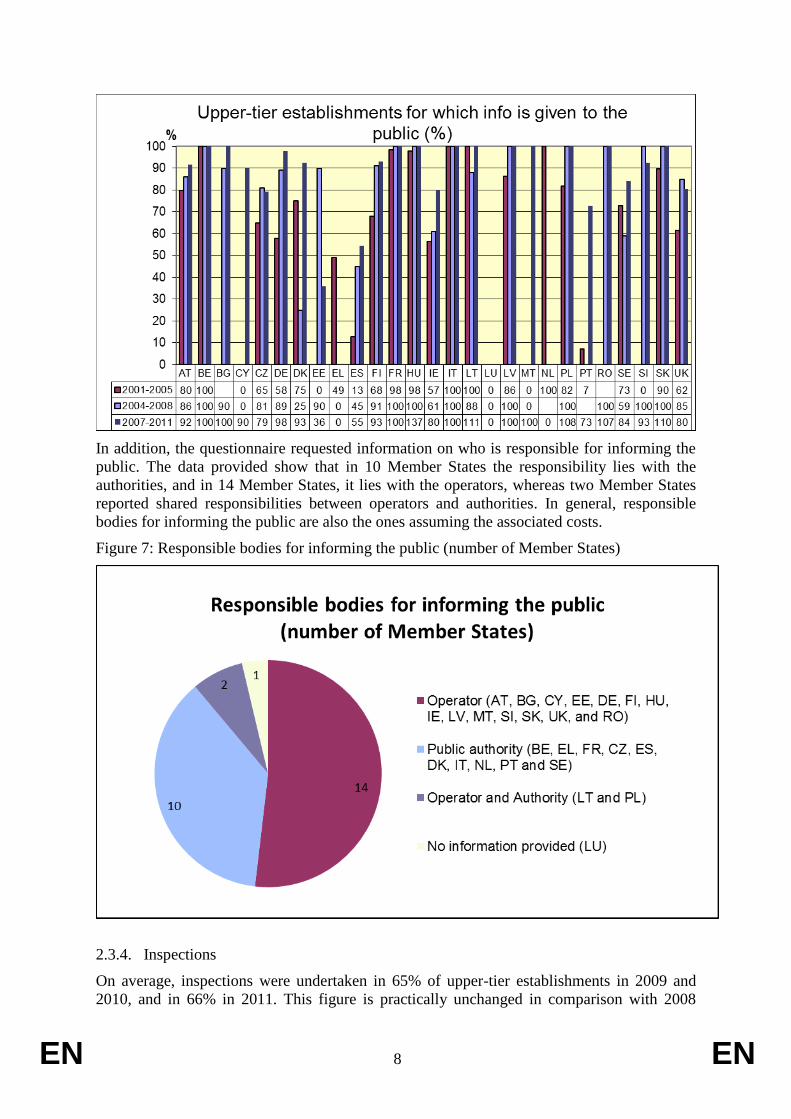
Overall, the public was informed between 2007 and 2012 regarding 4,171 establishments,
representing around 87% of the Seveso upper-tier establishments, and an increase from 80%
in 2008 and 72% in 2005. However, for several Member States, including Greece, Spain,
Luxemburg and the Netherlands, there were no or very few cases where information was
supplied. Furthermore, the figures do not provide information about the quality and
effectiveness of the information provided.
Figure 6: Establishments for which information is given to the public
EN 8 EN
In addition, the questionnaire requested information on who is responsible for informing the
public. The data provided show that in 10 Member States the responsibility lies with the
authorities, and in 14 Member States, it lies with the operators, whereas two Member States
reported shared responsibilities between operators and authorities. In general, responsible
bodies for informing the public are also the ones assuming the associated costs.
Figure 7: Responsible bodies for informing the public (number of Member States)
2.3.4. Inspections
On average, inspections were undertaken in 65% of upper-tier establishments in 2009 and
2010, and in 66% in 2011. This figure is practically unchanged in comparison with 2008

EN 9 EN
when the figure was 66% or 2005 when it was 69%. Inspections in lower-tier establishments
were carried out less frequently as, on average, these were undertaken in 42% of such
establishments in 2009, 41% in 2010, and 43% in 2011. This reflects the fact that the
obligation of yearly inspections only applies to upper-tier establishments, unless a
programme of inspections has been established for a particular establishment, based upon a
systematic appraisal of major-accident hazards of that establishment. No data for inspections
of lower-tier sites are available for previous reporting periods.
Annual figures do not allow clear conclusions to be drawn as the frequency of inspections is
linked to the programme of inspections, and therefore it may not be necessary to inspect all
sites each year. However, a detailed analysis of the information provided by Member States
has identified that inspection coverage among upper-tier establishments may need to be
increased in several Member States, including Greece, Italy, Portugal and Sweden where less
than 50 % of upper-tier establishments have been inspected in the last reporting period.
Figure 8: Percentage (%) of Inspected Establishments in 2005, 2008 and 2011
AT BE BG CY CZ DE DK EE EL ES FI FR HU IE IT LT LU LV MT NL PL PT RO SE SI SK UK
2005 86 82 100 98 52 85 100 27 56 100 95 100 100 33 100 60 66 0 100 100 30 44 92 95 93
2008 39 82 63 100 100 58 84 100 35 49 54 98 100 100 30 88 88 97 100 81 100 16 100 38 100 68 74
2011 74 84 92 100 100 60 83 100 10 63 63 90 100 103 15 100 100 73 100 82 100 11 98 43 93 71 75
0
10
20
30
40
50
60
70
80
90
100
Inspected upper-tier establishments (%)
2.3.5. Use of coercive instruments
All Member States have reported on the use of coercive instruments that can be used in case
of infringement of the legislation. There were 5895 cases where coercive instruments were
applied. The most used instrument has been the formal notice (improvement, compliance,
warning, etc), followed by written orders and compliance orders and administrative fines.
Reliance on the prohibition of use has been very limited (38 cases) and no criminal
proceedings were reported.
Table 1: Use of coercive instruments reported by Member States for the years 2009-2011
Category of instruments MS reporting instruments in this
category
Number of reported uses
2009 2010 2011 Period
total

EN 10 EN
Category of instruments MS reporting instruments in this
category
Number of reported uses
2009 2010 2011 Period
total
Improvement notice/
Compliance notice
BE, BG, CY, DE, DK, EE, ES,
FR, IE, IT, LT, LU, LV, NL, PL,
PT, RO, SI, UK
1321 1420 1354 4501
Written orders/ Compliance
order
BE, BG, CY, DE, DK, EE, ES,
FR, IT, LT, LV, NL, PL, PT, RO,
SE, SI, UK
294 309 312 922
Administrative fine
AT, BE, BG, CZ, DE, EE,ES, FI,
FR, HU, IE, IT, LT, LV, NL, PL,
PT, RO, SI, SK
92 88 117 325
Infringement proceedings
(general )
BE, BG, CY, CZ, DE, EE, ES,
FR, LV, MT, NL, PL, PT, RO, SI,
UK
32 17 11 69
Verbal warnings BE, CY, DK, RO, SI, UK 10 20 30 40
Prohibition of use
AT, BE, BG, CY, CZ, DE,
DK,ES, FI, HU, IT, LT, LU, LV,
MT, NL, PL, PT, RO, SE, SI, SK,
UK
13 14 9 38
Criminal proceedings
(provision for imprisonment)
BE, DE, EE, FR, IT, NL, PL, PT,
UK 0 0 0 0
3. STATISTICS ON ACCIDENTS DRAWN FROM EMARS
The number of major accidents is a key indicator to measure the performance of the Directive
and its aim to prevent accidents. Member States are obliged to report in eMARS, the Major
Accident Reporting System, all major accidents meeting the criteria listed in Annex VI of the
Seveso Directive. They may also report other events11
(other major accidents not meeting
these criteria or not covered by the Seveso Directive, for instance related to transport) and
near misses. Over the period 2000-2011, the number of reported major accidents remained
relatively stable, with an average of 27 per year, despite the increase in the number of sites
covered by the Seveso Directive (3% between 2009 and 2011)12
. Due to delays in accident
reporting mainly caused by the time taken to complete legal proceedings, as well as the time
needed for preparing and approving the reports recorded in the eMARS database, the
statistics from the last 3 years may still raise.
Figure 9: Number of reported major accidents in eMARS
11
Other events may be major accidents not meeting the criteria of annex VI or accidents not covered by
the Seveso Directive, for instance accidents related to transport 12
It is not possible to determine the total increase since 2000 because no data on the number of lower-tier
establishments were reported in the previous reporting periods. However, it can be noted that the
number of upper-tier establishments has increased by 25 % since 2005

EN 11 EN
83 81 79 78
0
20
40
60
80
100
2000-2002 2003-2005 2006-2008 2009-2011
Number of major accidents in the EU
The accidents reported in the database are mainly major accidents in the sense of Seveso.
Near misses and other events are less reported. The main criteria that trigger reporting are:
more than 5% of qualifying quantity of substances involved, injury to persons, and damage to
property.
More accidents from upper tier establishments are reported in the database for every year
between 2000 and 2011 than for lower tier establishments (224 upper-tier accidents, against
43 lower-tier and 54 accidents reported without specifying whether in upper-tier or lower-
tier), reflecting the higher risks of upper tier establishments.
There is a general reducing trend in the number of fatalities and of injuries reported over the
last decade. The total number of fatalities went down from 27 in 2000 to 9 in 2010. In
particular there has been no fatality off-site since 2006. The total number of injuries went
down from 126 in 2000 to 23 in 2010.
Among the hazardous phenomena involved in the accidents reported in eMARS, toxic release
appears to be the most frequent, for every year except 2002, 2003 and 2010, in which
explosions and fires occurred more frequently. The main substance categories involved are:
– Toxic: 91 major accidents;
– Extremely flammable: 80 major accidents;
– Very toxic: 53 major accidents.
Seven activity types have contributed to more than 10 events over the period 2000-2011. The
activities "Processing of metals", “Petrochemical/Oil Refineries” and “General Chemicals
manufacture” have the highest accident frequency in terms of number of accidents per
establishment.
Table 2: Activity types hat have contributed to more than 10 events in the period 2000-201113
Activity Type Number of
Seveso
Events reported
13
Information drawn from the eMARS and SPIRS databases

EN 12 EN
establishments
Total
number %
14
Major
Accidents
Near
Misses
Other
events
Total
events %
15
Freque
ncy16
Plastic and rubber
manufacture 368 3.89 9 1 10 2.8 0.7
Production and storage of
pesticides, biocides,
fungicides
267 2.83 12 1 13 3.6 1.3
Wholesale and retail
storage and distribution
(excluding LPG)
877 9.28 15 1 2 18 5 0.5
Processing of metals 78 0.83 19 2 21 5.9 7
Petrochemical / Oil
Refineries 238 2.52 62 4 6 72 20 8
General chemicals
manufacture (not included
above)
591 6.25 98 1 2 101 28.4 4.5
Other activity 276 2.92 30 4 34 9.5 3.2
Seven accidents have been reported to have transboundary effects.
For over 90% of accidents reported from 2000 to 2011 it was noted that there were lessons
learned. However, in many cases the quality of this information was very poor. This is an
area where improvement will be encouraged by the Commission in future years.
4. CONCLUSIONS AND WAY FORWARD
The above analysis confirms that the Directive is working well and that implementation by
the Member States has substantially improved over the last two reporting periods. Over the
past ten years, despite the large increase in number of establishments resulting mainly from
new Member States joining the EU, the number of major accidents remained relatively stable,
with an average of 27 major accidents reported per year. The significant decrease in the
number of fatalities and injuries reported over the last decade is very encouraging.
The practical implementation and enforcement of the Seveso II Directive has further
improved in most areas, and in particular industry operators are complying to a large extent
14
Number of establishments (for the activity type) against the total number of Seveso establishments
reported in SPIRS (9449 establishments reported) 15
Percentage expressing the number of events (for the activity type) against the total number of events
reported for the period 2000 to 2011 (356 events) 16
Frequency expressed in terms of percentage of events (for the activity type) against the percentage of
establishments (for the same activity type)

EN 13 EN
with the requirements regarding safety reports and internal emergency plans. However,
efforts are still needed in some fields in a number of Member States, in particular with regard
to the development and testing of external emergency plans and the provision of information
to the public. Furthermore, a relatively high number of establishments remain uninspected in
a given year (around 34% of upper-tier establishments), which requires corrective action.
The findings covering the previous reporting period17
have been taken into account by the
Commission in the review of the Seveso II Directive, which has led to the adoption of the
Seveso III Directive 2012/18/EU18
. The new Directive improves the right of the public to be
appropriately informed, making certain provisions also applicable to lower-tier
establishments. It includes detailed rules to guarantee adequate consultation of the public on
individual projects and introduces stricter provisions on inspections. Compliance with the
Seveso III Directive is therefore expected to contribute to the necessary improvements
highlighted in this report.
The Commission will closely monitor progress on these issues and continue to assist Member
States to further improve their level of performance, through various supporting activities and
enforcement action as appropriate.
17
Document C(2010) 5422 final 18
OJ L 197, p. 1 of 24.7.2012

EN 14 EN
MS Upper-tier 2011
Upper-tier
2008
Upper-tier
2005
Safety report not
yet submitted
2011
Internal Emergency plan not yet
drawn up 2011
External Emergency plan not yet
drawn up 2011
External Emergency plan not yet
drawn up 2008
EEPs tested
09+10+11
EEPs tested
06+07+08
Info to the public
09+10+11
Info to the public
06+07+08
Upper-tier inspected 2011
Upper-tier inspected 2008
AT 84 79 79 3 3 4 10 78 57 77 68 62 31
BE 192 174 137 2 0 9 87 74 99 192 174 161 143
BG 72 52 0 0 1 0 47 40 72 47 66 33
CY 10 11 13 0 0 0 0 27 0 9 0 10 11
CZ 116 112 79 3 3 3 6 28 22 92 91 116 112
DE 1104 1077 976 6 4 15 68 762 703 1079 959 662 625
DK 54 44 20 0 1 4 0 29 22 50 11 45 37
EE 28 21 14 0 0 0 0 10 5 10 19 28 21
EL 83 83 100 0 0 14 10 0 0 8 29
ES 332 295 245 11 6 36 85 324 236 181 133 208 145
FI 129 127 84 0 0 9 25 94 75 120 116 81 69
FR 622 553 593 0 12 59 0 587 229 622 553 558 542
HU 78 63 47 0 0 0 0 121 63 107 63 78 63
IE 36 33 23 1 0 1 1 24 21 67 20 37 33
IT 533 518 462 11 11 31 9 177 286 533 518 78 155
LT 18 17 21 1 0 0 0 54 52 20 15 18 15
LU 8 8 5 0 0 0 1 6 0 0 0 8 7
LV 30 30 29 0 0 0 0 30 31 30 30 22 29
MT 6 6 6 1 0 0 0 6 2 6 0 6 6
NL 249 221 188 20 0 51 0 0 205 179
PL 166 161 149 3 3 7 10 133 134 180 161 166 161
PT 66 62 57 8 8 20 39 10 8 48 0 7 10

EN 15 EN
RO 113 113 1 1 9 7 98 86 121 113 111 113
SE 206 195 172 1 4 20 12 26 50 173 115 89 74
SI 27 24 26 0 0 0 0 25 24 25 24 25 24
SK 41 40 39 0 0 1 2 37 57 45 40 29 27
UK 388 409 385 11 11 13 20 328 251 312 348 290 303
EU 4,791 4,528 3,949 83 67 307 392 3,135 2,553 4,171 3,616 3,174 2,995