Maintaining Key Services While Retaining Core Values: NYC
30
123 Maintaining Key Services While Retaining Core Values Maintaining Key Services While Retaining Core Values: NYC Transit’s Environmental Justice Strategies Ted Wang, Alex Lu, Alla Reddy MTA New York City Transit Abstract In a recession, transit agencies aim to provide key services while retaining national core values. When making service changes, federal funding recipients are prohibited from discriminating on the basis of race, color, or national origin and must not place undue burden on Environmental Justice (EJ) populations. To ensure compliance, New York City Transit developed analytical methodologies to identify impacts for the 50 proposed service rationalization initiatives, allowing for proactive mitigation. For 38 routes with span changes, load factor analysis across demographic and income categories (during periods of service elimination) demonstrated that impacts were equitably shared. For route changes, impacts were measured using shortest-path trip time and cost analysis using Census Transportation Planning Package Journey- to-Work data. e “M” and “V” Train modifications and the Co-op City bus restruc- turing illustrate package analysis of complex service changes, capturing mitigating effects of adjacent route restructurings. ese service changes reduced costs while ensuring that Title VI/EJ communities were not disproportionately affected. After extensive EJ work and community outreach, the proposed changes were imple- mented in June 2010.
Transcript of Maintaining Key Services While Retaining Core Values: NYC

123
Maintaining Key Services While Retaining Core Values
Maintaining Key Services While Retaining Core Values: NYC Transit’s
Environmental Justice StrategiesTed Wang, Alex Lu, Alla Reddy
MTA New York City Transit
Abstract
In a recession, transit agencies aim to provide key services while retaining national core values. When making service changes, federal funding recipients are prohibited from discriminating on the basis of race, color, or national origin and must not place undue burden on Environmental Justice (EJ) populations. To ensure compliance, New York City Transit developed analytical methodologies to identify impacts for the 50 proposed service rationalization initiatives, allowing for proactive mitigation. For 38 routes with span changes, load factor analysis across demographic and income categories (during periods of service elimination) demonstrated that impacts were equitably shared. For route changes, impacts were measured using shortest-path trip time and cost analysis using Census Transportation Planning Package Journey-to-Work data. The “M” and “V” Train modifications and the Co-op City bus restruc-turing illustrate package analysis of complex service changes, capturing mitigating effects of adjacent route restructurings. These service changes reduced costs while ensuring that Title VI/EJ communities were not disproportionately affected. After extensive EJ work and community outreach, the proposed changes were imple-mented in June 2010.

Journal of Public Transportation, Vol. 16, No. 1, 2013
124
IntroductionFinding millions of dollars worth of savings in a public transit authority requires shared sacrifice among stakeholders. In 2010, the financial outlook for New York State was deteriorating. Taxes and levies that subsidize New York City Transit (NYCT) fell substantially short of projections. State government was cutting service, and transit needed to do the same to remain solvent. The goal was to keep key public services functioning while seeking budgetary savings. At the same time, the Federal Transit Administration (FTA) requires that funding recipients to comply with Title VI of the Civil Rights Act 1964, ensuring level and quality of service without regard to race, color, and nationality. Executive Order 12898 requires funding recipients to identify and address, as appropriate, disproportionately high and adverse human health and environmental effects, including social and economic effects of programs and activi-ties on minority populations and low income populations (FTA Circular 4702.1A).
FTA provides guidance to transit operators on methods of compliance and allows room for flexibility. It is the operator’s responsibility to develop its own Title VI and Environmental Justice (EJ) programs that comply with FTA and any local standards set by the agency. At the time of this writing, EJ issues are at the forefront of fed-eral rulemaking, as FTA has released two proposed circulars (Circulars 4702.1B and 4703.1) for public comment. The proposals separate Title VI and EJ considerations and reiterate the requirements for service and fare change analysis. There are understandably widespread concerns within the transit practitioner’s community.
This paper demonstrates methods used at NYCT and may serve as an example for other properties concerned with federal compliance when changing route and service span. The purpose of these changes is to seek long-term budgetary savings while minimizing the impact on the community and to safeguard federal funding by remaining in compliance with Title VI and Executive Order 12898. This was achieved through analytical methods detailed in this paper. The service changes discussed in this paper were implemented in June 2010.
Strategic Elements of EJ/Title VITitle VI analysis is also a useful gauge on community relations. Being a good social steward brings positive attention to a business during a difficult time. Transporta-tion infrastructure directly affects job access, property values, and livelihoods. Transit executives need to know the impacts of their decisions.
This information shows its worth when government officials and elected leaders invite transit executives to address concerns of their constituencies. The Oakland

125
Maintaining Key Services While Retaining Core Values
Airport Connector project raised concerns of three San Francisco community groups; they brought the issue to FTA (Thomas and McDaniel 2011), and in 2009, the operator was found to be in violation of Title VI and lost $50 million in federal funding. Ensuring that actions taken by the transit operator are non-discriminatory requires proactive data analysis because outside groups are likely doing this already to influence the outcome. In 1996, Los Angeles County was required by a federal court decision to spend more than $1 billion dollars on its bus system when external groups proved investments on light rail in wealthy neighborhoods were dispropor-tionate compared to the bus network used by the majority of its customers (Garcia 2011). Proactive strategic analysis, therefore, allows operators to take the initiative in matters of decision making, public relations, funding, and control of finances.
Complying with Title VI and Environmental Justice requirements is the law, as well as the right thing to do. However, having first and foremost fulfilled the legal and moral imperatives, taking a proactive approach to Title VI provides the additional benefit of helping to maintain open channels of communication and a good work-ing relationship with community stakeholders and regulators alike. Having a track record of going above and beyond builds an understanding that the operator is well-managed. Satisfying stakeholders consistently indicates that the operator is on the right track in service delivery.
Literature ReviewA literature search for different strategies and analyses yielded a diversity of topics. Some of these reports are unique, such as the analysis done on American Indian tribal territories and transportation in relations to housing and demographics (Ward 2005). One paper described how a transit agency was found to be non-compliant with Title VI and strived to become compliant once again by reviewing the strategies of other operators (Bender et al. 2007). Another paper profiles a list of legal complaints pertaining to alleged Title VI violations (Thomas 2007). Others are more holistic, covering fare analysis, Americans with Disabilities Act (ADA) compliance, and Civil Rights. Recent papers use statistical significance testing to analyze Title VI data (Reddy et al. 2010). This is a logical development since it was already done in many areas: quality control, industrial engineering, and the social sciences, such as crime data mining. Many agencies at the New York Metropolitan Transportation Authority (MTA) have adopted this method of analysis. The con-tribution of NYCT’s experience in 2010 provides focus on a particular case study where a large transit operator faced a financial situation and navigated itself to a fiscally-stronger position using detailed internal analysis as a guide.

Journal of Public Transportation, Vol. 16, No. 1, 2013
126
BackgroundIn 2005, the MTA reduced fares by half for all riders during the holiday season to share with the public an unexpected budgetary surplus. Towards the end of 2007, the world economy entered a recession. Unemployment rose close to 10 percent (New York State Department of Labor 2011). Nationally, those numbers were higher for minority (Holt 2009) and young workers, especially for those with no college degree and even worse for those without a high school diploma (U.S. Department of Labor 2011). Gas prices remained historically high and had made their way past $4 per gallon. Transit provided an alternative means of coping with the cost of auto operation.
Transit also had funding challenges, due to falling tax revenues and rising costs of resources such as fuel and labor. In October 2010, the MTA Board approved fare increases and service reductions for 2011. Title VI analysis found that monthly MetroCard holders tended to be more affluent than other fare media users (Hickey et al. 2010). The decision was to minimize impact on customers least able to pay. An $89 monthly unlimited pass increased to $104; weekly passes increased from $27 to $29; single rides increased by 25 cents to $2.25. Service changes were made to reflect ridership and return on investment. Before any route was discontinued, impact analyses were done to minimize, mitigate, or offset negative effects towards all transit users, especially minority and low-income riders.
Mass transit plays a vital role to those least able to afford private automobiles. Main-taining private auto ownership can cost close to $15,000 annually in New York City (APTA 2011). “At or Below Poverty” is defined as a yearly income of $22,350 for a fam-ily of four and $10,890 for an individual (U.S. Dept. of Health and Human Services 2011). The poverty rate in New York City hovers around 20 percent (Roberts 2010). Despite fare increases, the average annual cost to use transit is a fraction of auto-mobile ownership and can mean the difference between making ends meet or not.
Selection of Analytical TechniquesThere were 50 service rationalization initiatives in 2010. According to guidelines adopted by the MTA in 1988, analysis was not needed if changes are less than 25 per-cent of the net route miles or less than 1 hour of the service span. A total of 14 initia-tives out of the 50 did not surpass thresholds that would require a Title VI Analysis. The remaining initiatives needed a change analysis for route or span. Table 1 shows a selection of initiatives and affected segments and their corresponding analysis types (Span or Route). It was not applicable (N/A) if Title VI analysis was not required.

127
Maintaining Key Services While Retaining Core Values
Table 1. Type of Analysis for Sample List of Services to be Modified
Route SegmentRoute
or Span
% Net Change
Above 25%? Notes
“Q”“N”“W”
Queens ExtensionManhattan LocalAll
RouteN/A
Route
+320
–100
YesNoYes
Extend to AstoriaReplace “W” in NorthEliminated
“V”“M”
Queens EliminationQueens ExtensionBrooklyn Elimination
RouteRouteN/A
–100+71–62
YesYesYes
EliminatedRerouted to replace “V”Discontinued south of Delancey-Essex
“G” Queens EliminationBrooklyn Extension
RouteN/A
–51+14
YesNo
Discontinued East of Court Sq.24hr operation South of Court Sq.
SIR Stadium Service N/A –100 Yes Not a regularly scheduled service
BX25BX26BX28BX30BX38
Co-op CityCo-op CityCo-op CityCo-op CityCo-op City
RouteRouteRouteRouteRoute
–100–33–29–3
+100
YesYesYesNoYes
EliminationRerouted Rerouted
New route
BX55 BX15
BronxBronx
N/AN/A
–23+8
NoNo
BX20 Bronx Span –63 Yes
B1B8B64B70
BrooklynBrooklynBrooklynBrooklyn
RouteRouteRouteRoute
–21–15+41+31
NoNoYesYes
B4 Coney Island Av. East N/A –17 No Modified to operate via Avenue Z
B2B24
BrooklynBrooklyn
SpanSpan
–28–30
YesYes
Weekend discontinuedWeekend discontinued
M22 West of City HallN/A 0 No
Changes recinded due to public hearing
M8M50
ManhattanManhattan
SpanSpan
–32–51
YesYes
Weekend discontinuedWeekend discontinued
S40/90 Staten Island N/A –5 No Discontinued to Howland Hook
S54S76
Staten IslandStaten Island
SpanSpan
–250
YesNo
Q74Q75Q79
QueensQueensQueens
SpanSpanSpan
–100–100–100
YesYesYes
EliminatedEliminatedEliminated
X6 Hylan Blvd Route –100 Yes Express Bus X6 eliminated
Journal of Public Transportation, Vol. 16, No. 1, 2013
128
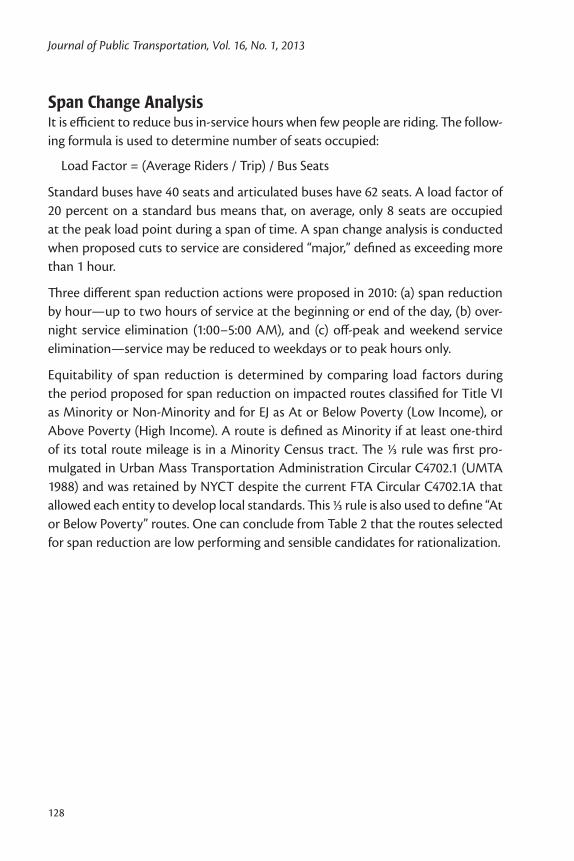
Span Change AnalysisIt is efficient to reduce bus in-service hours when few people are riding. The follow-ing formula is used to determine number of seats occupied:
Load Factor = (Average Riders / Trip) / Bus Seats
Standard buses have 40 seats and articulated buses have 62 seats. A load factor of 20 percent on a standard bus means that, on average, only 8 seats are occupied at the peak load point during a span of time. A span change analysis is conducted when proposed cuts to service are considered “major,” defined as exceeding more than 1 hour.
Three different span reduction actions were proposed in 2010: (a) span reduction by hour—up to two hours of service at the beginning or end of the day, (b) over-night service elimination (1:00–5:00 AM), and (c) off-peak and weekend service elimination—service may be reduced to weekdays or to peak hours only.
Equitability of span reduction is determined by comparing load factors during the period proposed for span reduction on impacted routes classified for Title VI as Minority or Non-Minority and for EJ as At or Below Poverty (Low Income), or Above Poverty (High Income). A route is defined as Minority if at least one-third of its total route mileage is in a Minority Census tract. The ⅓ rule was first pro-mulgated in Urban Mass Transportation Administration Circular C4702.1 (UMTA 1988) and was retained by NYCT despite the current FTA Circular C4702.1A that allowed each entity to develop local standards. This ⅓ rule is also used to define “At or Below Poverty” routes. One can conclude from Table 2 that the routes selected for span reduction are low performing and sensible candidates for rationalization.
129
Maintaining Key Services While Retaining Core Values
Table 2. Bus Routes Analyzed for Service Span Reduction – Load Factor Analysis
(a) Span Reduction by Hour
Non-Minority Minority
Route Day Type Loads*/ Trip Load Factor Route Day Type Loads*/ Trip Load Factor
B64 ALL 4 10% BX34 ALL 3 8%
B67 ALL 3 7% BX32 WKD 12 29%
B2 WKD 4 10% BX33 WKD 4 11%
B9 WKD 4 10% BX33 SAT 7 18%
B16 WKD 6 15% BX33 SUN 6 15%
B9 SAT 4 9% BX17 SUN 5 12%
B9 SUN 3 8% B7 ALL 6 14%
B16 SUN 3 8% B31 ALL 3 7%
M8 ALL 1 3% B45 ALL 4 10%
M16 ALL 3 6% B57 ALL 6 15%
M50 ALL 2 6% B65 ALL 5 13%
M66 ALL 2 5% B11 WKD 4 10%
M11 WKD 7 18% B13 WKD 4 9%
M20 WKD 6 16% B24 WKD 10 24%
M21 WKD 8 20% M1 ALL 2 6%
M20 SAT 6 15% M22 ALL 1 3%
Q30 ALL 3 9% M22 SAT 3 8%
S54 WKD 4 11% M22 SUN 2 6%
S57 WKD 5 13% M100 SAT 6 14%
S66 WKD 12 29% M116 SAT 7 16%
S57 SAT 3 7% Q48 SUN 3 7%
S57 SUN 4 9%

Journal of Public Transportation, Vol. 16, No. 1, 2013
130
Table 2 (cont'd.). Bus Routes Analyzed for Service Span Reduction – Load Factor Analysis
(b) Overnight Service Elimination
Above Poverty At or Below Poverty
Route Day Type Loads*/ Trip Load Factor Route Day Type Loads*/ Trip Load Factor
B2 WKD 4 10% B9 WKD 4 10%
M8 ALL 1 3% B16 WKD 6 15%
M50 ALL 2 6% B9 SAT 4 9%
M66 ALL 2 5% B9 SUN 3 8%
M20 WKD 6 16% B16 SUN 3 8%
M20 SAT 6 15% M16 ALL 3 6%
Q30 ALL 3 9% M11 WKD 7 18%
S54 WKD 4 11% M21 WKD 8 20%
S57 WKD 5 13% BX34 ALL 3 8%
S66 WKD 12 29% BX32 WKD 12 29%
S57 SAT 3 7% BX33 WKD 4 11%
S57 SUN 4 9% BX33 SAT 7 18%
B31 ALL 3 7% BX33 SUN 6 15%
M1 ALL 2 6% BX17 SUN 5 12%
Q48 SUN 3 7% B7 ALL 6 14%
B45 ALL 4 10%
B57 ALL 6 15%
B65 ALL 5 13%
B11 WKD 4 10%
B13 WKD 4 9%
B24 WKD 10 24%
M22 ALL 1 3%
M22 SAT 3 8%
M22 SUN 2 6%
M100 SAT 6 14%
M116 SAT 7 16%

131
Maintaining Key Services While Retaining Core Values
Tabl
e 2
(con
t'd.).
Bus
Rou
tes
Ana
lyze
d fo
r Se
rvic
e Sp
an R
educ
tion
–
Load
Fac
tor
Ana
lysi
s
(c) W
eeke
nd &
Off
Peak
Ser
vice
Elim
inat
ion
Non
-Min
orit
yM
inor
ity
Abo
ve P
over
tyA
t or B
elow
Pov
erty
Rout
eD
ay
Type
AFC
Lo
ads/
Tr
ip
Load
Fa
ctor
Rout
eD
ay
Type
AFC
Lo
ads/
Tr
ip
Load
Fa
ctor
Rout
eD
ay
Type
AFC
Lo
ads/
Tr
ip
Load
Fa
ctor
Rout
eD
ay
Type
AFC
Lo
ads/
Tr
ip
Load
Fa
ctor
B2SA
T12
31%
BX20
SAT
1332
%B2
SAT
1231
%BX
20SA
T13
32%
B2SU
N9
23%
BX20
OFF
PE
AK
1538
%B2
SUN
923
%BX
20O
FF
PEA
K15
38%
M8
SAT
1129
%BX
34SA
T17
43%
M8
SAT
1129
%BX
34SA
T17
43%
M8
SUN
1024
%BX
34SU
N17
43%
M8
SUN
1024
%BX
34SU
N17
43%
M50
SAT
820
%B2
4SA
T22
55%
M50
SAT
820
%B2
4SA
T22
55%
M50
SUN
616
%B2
4SU
N16
41%
M50
SUN
616
%B2
4SU
N16
41%
Q76
SAT
2870
%Q
26O
FF
PEA
K13
31%
Q76
SAT
2870
%Q
84SA
T19
48%
S54
SAT
1128
%Q
31SA
T31
78%
S54
SAT
1128
%Q
84SU
N16
41%
S54
SUN
820
%Q
31SU
N23
57%
S54
SUN
820
%
S76
SAT
3279
%Q
84SA
T19
48%
S76
SAT
3279
%
S76
SUN
2459
%Q
84SU
N16
41%
S76
SUN
2459
%
Q26
OFF
PE
AK
1331
%
Q31
SAT
3178
%
Q31
SUN
2357
%

Journal of Public Transportation, Vol. 16, No. 1, 2013
132
The average load factors shown Table 3 are less than 50 percent any day of the week for any socio-economic category. That means at least half of the bus seats are empty on weekends, overnight, and the first few hours of service at the beginning of the day and the last few hours at the end. When comparing Minority and Non-Minority on a weekday, the difference in average load factors is 1 percent. The difference between High and Low Income is 2 percent. The t-test shows “No disparity” among these groups. Statistically speaking, the differences between groups are not significant.
Table 3. Comparing Load Factors between Community Groups and Determining Disparity Using t-Tests (Dataset in Table 2)
Title VI Environmental Justice
MinorityNon-
MinorityAt or Below
PovertyAbove
Poverty
Weekday Analysis
Average load factor 12% 11% 12% 10%
Variance 0.0038 0.0036 0.0034 0.0039
t-test -2.02 < -0.60 < 2.02 -2.04 < -1.32 < 2.04
Comparison results No disparity No disparity
Weekend Analysis
Average load factor 46% 36% 43% 40%
Variance 0.018 0.049 0.0046 0.0529
t-test -2.12 < -1.32 < 2.12 -2.11 < -0.34 < 2.11
Comparison results No disparity No disparity
The load factor analysis acts on the systemwide level, with each route being a unit of analysis. This analysis is applicable when many routes are having their service spans reduced and essentially tests to see if span reductions are over-represented among certain routes to detect unintentional discrimination, if any. In contrast, route change analysis, discussed in the next section, is a route-by-route method that focuses on equity within the route, with Census tracts being the unit of analysis.
Subway Route ChangeWorking toward the goal of saving $4 million per annum, planners at NYCT pro-posed eliminating the “V” Train and replacing it with a rerouted and extended “M” Train (Figure 1). The “V” Train had relatively low ridership. The neighborhoods that lost and gained service had parity in demographics; thus, equity was preserved. Public hearings were held and comments were collected in March 2010. The route change offered a new Midtown direct service for riders originating from Middle Village, Ridgewood, and Fresh Pond in Queens and Bushwick and Williamsburg in

133
Maintaining Key Services While Retaining Core Values
Brooklyn. This modification was considered major because it changed at least 25 percent of the “M” Train route length and, thus, required a Title VI analysis (NYCT 1985). The results from an Equity Analysis using a t-test showed that average travel times in affected Minority and Non-Minority areas showed no significant difference.
Figure 1. “M” and “V” train service changes: (a) description from 2010 service reduction proposal, (b) schematic map

Journal of Public Transportation, Vol. 16, No. 1, 2013
134
Figure 1 (cont'd.). “M” and “V” train service changes: (a) description from 2010 service reduction proposal, (b) schematic map

135
Maintaining Key Services While Retaining Core Values
Route Analysis MethodsFor routes that are being modified (eliminated or extended), or those that have greater than 25 percent of total revenue miles being changed, NYCT conducts a travel time and cost analysis. All Census tracts within ¼ mile of the route are reviewed. According to FTA Circular 4702.1A, a “Predominantly Minority Area” is a geographic area such as a neighborhood, Census tract, or traffic analysis zone where the proportion of minority persons residing in that area exceeds the average proportion of minority persons in the recipient’s service area. The 2000 citywide average showed minorities to be 65.02 percent of the population of New York City. Thus, a Census tract in New York City is considered to be “Minority” if the minor-ity population is equal to or greater than 65.02 percent; otherwise, it is defined as “Non-Minority.” A Census tract is considered to be “At or Below Poverty” if the population is equal to or greater than the 2000 citywide average of 21.25 percent; otherwise, it is defined as “Above Poverty.”
Thresholding is a necessary part of binary EJ analysis, where the population is divided into only two categories. Some observers feel it would be simpler or more appropriate to set the boundary at 50 percent, such that if more than half the people in a tract are minority, then the entire tract should be considered minority. However, this is problematic for New York City where minorities make up more than half of the population, resulting in most of the city being classified as minority and giving rise to analysis that would not be sensitive to actual disparities between heavily-minority areas versus somewhat-minority areas. Using the metro area aver-age as the threshold is an appropriate way of ensuring that there is approximately same number of tracts in both categories, thereby maximizing the detection power of the statistical t-tests.
Similarly, defining areas of poverty at 50 percent will dramatically reduce the detec-tion power of the analyses since most tracts will not meet the 50 percent threshold, and impact analysis may never be triggered. FTA provides guidelines on thresholds, and NYCT abides by the current standard practice (FTA C 4702.1A, 2007).
An Origin-Destination (O-D) table was created from the 2000 Census Journey-to-Work Matrix, separately for Minority- and Non-Minority-originating Census tracts. The top five tracts in terms of passenger origination within ¼ mile of the route were selected. From these top five origin tracts, the top three destinations within NYCT’s service area were selected, making a selection of 15 O-D pairs with heavy traffic on NYCT’s services, on which travel time and cost analysis were conducted.

Journal of Public Transportation, Vol. 16, No. 1, 2013
136
1. The shortest path using the route being proposed for elimination is selected as the “before” travel time. The shortest path without the use of that route is the “after” travel time. The shortest path is recommended by a generic Web-based shortest-path journey planning tool.
2. If the shortest path is to walk between the origin and destination Census tracts, the walk time is entered and $0 is entered for the fare.
3. In some cases, it is necessary to find the shortest path by forcing a transfer at an intermediate transfer point, as a trip planner is not always able to pick a path using the route in question. Paths are rejected for being unreasonable if they involve circuitous changes of direction (e.g., travel south on a bus in order to go back north on an express bus.)
4. If there is no way to use the subject route (e.g., the Census tract is at the northern end of the subject route, and the O-D pair requires the traveler to travel north; thus, every path involving the subject route results in a “go south to go north” condition), then the shortest path travel time is used for both the before and after conditions (i.e., elimination of route will have no impact for that O-D pair.)
The travel times and costs are found for each O-D pair before and after route modi-fication. The average difference is calculated. A t-test is conducted to determine if the changes in travel times and cost are equitable.
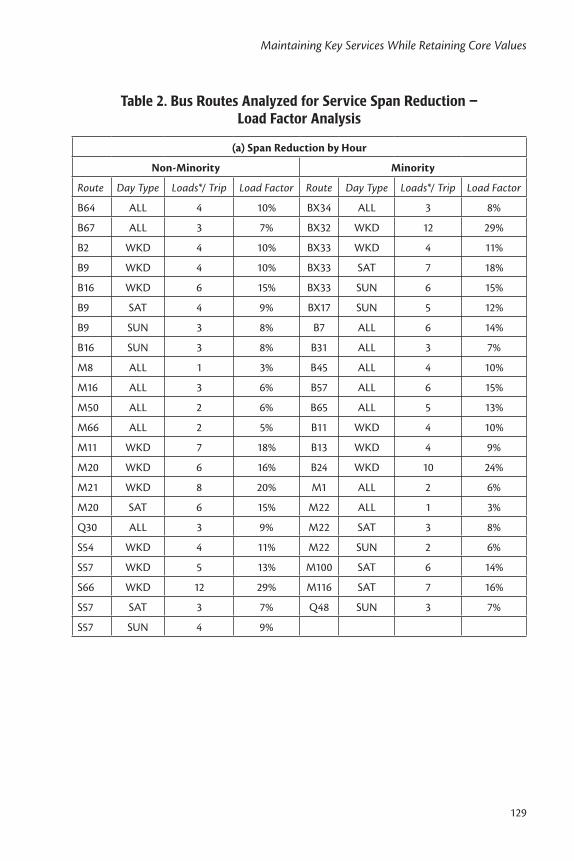
Application and ResultsThis method was applied to the “M” Train modification from Lower Manhattan to South Brooklyn. Prior to the major revamp of the subway map, the “M” Train from Broad Street in Manhattan to Bay Parkway in Brooklyn was a dotted line, indicating a part-time extension. It ran only during rush hours Monday through Friday from 6:30–9:30 AM and 3:30–8:00 PM. There was no service available during midday, evenings, weekends, and late nights. Between Broad Street in Manhattan and 36th Street in Brooklyn, it shared the Montague Street tubes and 4th Avenue subway local tracks with “R” Trains. Then, it shared the West End Line tracks with “D” Trains as far as Bay Parkway. The redundancy reduced the impact of its elimination. Table 4 illustrates the top five origins and top three destinations for the “M” Train. The results are graphed in Table 5 to show the average difference in travel time and cost affecting four demographic categories before and after the “M” Train was modified.

137
Maintaining Key Services While Retaining Core Values
The bar graph shows the differences before and after the “M” Train modification (“M” Elimination). In terms of average travel times for minorities, there is a frac-tion of a minute difference. The same is true for non-minorities. The comparison is between the average difference of minorities and non-minorities. The change was equitably small. The two-tailed test of hypothesis (t-test) confirms this conclusion of “No Significant Disparity.” Due to the “One City, One Fare” policy, the average difference in total cost per trip between minority and non-minority riders are iden-tical; therefore, there was no Title VI disparity. The average difference for Above Poverty and At or Below Poverty was also insignificant according to t-test results.
The new orange “M” Train (“M” Extension) runs from Broadway/Lafayette Street in Manhattan to Forest Hills in Queens. This extension completely replaces—and thus eliminates in name only—the “V” Train. The neighborhoods the “M” now travels through (all former “V” stops) include a largely non-minority and above-poverty population in Manhattan. Once the “M” Train crosses underneath the East River and enters Queens, the population becomes quite diverse in terms of race and income.
The methodology used to analyze the “M” Extension and the “V” Elimination is based on the route change analysis done on the “M” modification in Lower Manhattan to South Brooklyn. There are geographic differences between the eliminated segment of the “M” Train and the extended portion going into Queens. Brooklyn has higher transit density, providing more options for transfers.

Journal of Public Transportation, Vol. 16, No. 1, 2013
138
Tabl
e 4.
Tit
le V
I—M
inor
ity/
Non
-Min
orit
y A
naly
sis

139
Maintaining Key Services While Retaining Core Values
Tabl
e 4
(con
t'd.).
Tit
le V
I—M
inor
ity/
Non
-Min
orit
y A
naly
sis
Journal of Public Transportation, Vol. 16, No. 1, 2013
140
Tabl
e 4
(con
t'd.).
Tit
le V
I—M
inor
ity/
Non
-Min
orit
y A
naly
sis
Tota
l Tra
vel T
ime:
Usin
g a
two-
taile
d te
st o
f hyp
othe
sis w
ith a
5%
err
or (9
5% c
onfid
ence
), th
e re
sulti
ng t-
stat
istic
= -1
.69.
The
t-cr
itica
l val
ues a
re
+/- 2
.05.
Sin
ce -1
.69
> –2
.05
and
< +2
.05,
we
can
ther
efor
e co
nclu
de th
at th
ere
is no
sign
ifica
nt d
iffer
ence
in th
e to
tal t
rave
l tim
e be
fore
and
aft
er
elim
inat
ing
the
prop
osed
rout
e be
twee
n m
inor
ity a
nd n
on-m
inor
ity p
opul
atio
n.
Tota
l Cos
t per
Tri
p: Th
e av
erag
e di
ffere
nce
in to
tal c
ost p
er tr
ip b
etw
een
min
ority
and
non
-min
ority
ride
rs a
re e
qual
; the
refo
re th
ere
is no
Titl
e V
I di
spar
ity.
Not
e: O
-D c
entr
oid
pairs
com
e fro
m C
ensu
s yea
r 200
0 jo
urne
y-to
-wor
k m
atrix
. Tra
cts a
re a
djac
ent t
o aff
ecte
d ro
utes
. Top
5 o
rigin
s and
top
3 de
stin
atio
ns
are
sele
cted
.

141
Maintaining Key Services While Retaining Core Values
Table 5. Travel Time and Cost Analysis: “M” and “V” Subway Restructuring
Travel Cost Analysis
GroupBefore (Mins.)
After (Mins.)
Avg. Diff. Var. t-Test Result
“M” Elim Minority“M” Elim Non-Minority
5.99.1
5.79.2
-0.20.1
0.30.3
-2.05 < -1.69 < 2.05 No disparity
“V” Elim Minority“V” Elim Non-Minority
15.44.7
15.14.7
-0.3-0.1
0.40.1
-2.09 < -1.54 < 2.09 No disparity
“M” Ext Minority“M” Ext Non-Minority
14.94.7
14.94.7
0.00.0
0.00.0
Not required No change
No disparity
“M” Elim Poverty“M” Elim Non-Poverty
5.710.8
5.510.9
-0.20.1
0.30.3
-2.05 < -1.69 < 2.05 No disparity
“V” Elim Poverty“V” Elim Non-Poverty
14.34.7
16.94.7
2.7-0.1
52.80.1
-2.14 < 1.46 < 2.14 No disparity
“M” Ext Poverty“M” Ext Non-Poverty
14.74.7
14.74.7
0.00.0
0.00.0
Not required No change
No disparity

Journal of Public Transportation, Vol. 16, No. 1, 2013
142
Table 5 (cont'd.). Travel Time and Cost Analysis: “M” and “V” Subway Restructuring
Travel Cost Analysis
Group Before AfterAvg. Diff. Var. t-Test Result
“M” Elim Minority“M” Elim Non-Minority
$0.60$1.00
$0.60$1.00
0¢0¢
0¢0¢
Not RequiredNo Change
No disparity
“V” Elim Minority“V” Elim Non-Minority
$1.23$0.90
$1.33$0.90
10¢0¢
15¢0¢
-2.14 < 1.00 < 2.14 No disparity
“M” Ext Minority“M” Ext Non-Minority
$1.43$0.90
$1.43$0.90
0¢0¢
0¢0¢
Not requiredNo change
No disparity
“M” Elim Poverty“M” Elim Non-Poverty
$0.60$1.00
$0.60$1.00
0¢0¢
0¢0¢
Not requiredNo change
No disparity
“V” Elim Poverty“V” Elim Non-Poverty
$0.90$0.90
$1.77$0.90
87¢0¢
523¢0¢
-2.14 < 1.47 < 2.14 No disparity
“M” Ext Poverty“M” Ext Non-Poverty
$2.20$0.90
$2.20$0.90
0¢0¢
0¢0¢
Not requiredNo change
No disparity
DiscussionThe methodology takes into account people who walk distances up to a quarter mile, and there could be several stops in between. The distance between Allen Street at Delancey Street and Crosby Street at Grand Street is easily 4–5 minutes

143
Maintaining Key Services While Retaining Core Values
walking but has four separate subway stations within its vicinity. The variances in these O-D pair comparisons (Table 4) jump to 52.81 when trips between 31 Avenue at 34th Street in Queens and Stone Street at Broad Street in Manhattan are added. The distance between these two points is approximately 7 miles and requires, at minimum, a transfer between two train routes. The difference in travel time could range from 4 to 44 minutes.
The trip planner method has its limitations, and this could be seen when analysis was done on total cost per trip for the “V” Train elimination. The journey planner generates the top 3–5 shortest travel paths for each given O-D pair. On two occa-sions, it recommended use of the Long Island Rail Road (LIRR)—if no “V” Train were available—to travel between 35th Avenue at 71st Street, Queens and Midtown Manhattan, which is a distance of about five miles. The LIRR is a viable, if not more expensive, mode of transport for that trip. However, the trip planner (at time of analysis) could not take into account the fact that the new “M” Train would replace the “V” Train in its entirety and that, in reality, a subway option continued to be available. The journey planner data cannot be modified until these proposals are adopted and MTA releases appropriate timetable data. One can make an excep-tion, but in this study, the method was strictly followed to ensure that NYCT has a consistent and defensible Title VI/EJ analytical method.
As a result of the “V” Train elimination being analyzed separately from the “M” Train re-route, the methodology makes the data appear that At or Below Poverty riders are paying almost twice as much as Above Poverty riders. In actuality, the fare did not change before or after the elimination of the “V” train. Based on new package analysis methodology submitted for FTA review, NYCT will analyze route changes such as the “M” Train and the “V” Train together in the future.
Bus Service Change: Co-op CityCo-op City is a middle-income housing development located on the northeast peninsula of the Bronx, privately built under New York’s Mitchell-Lama limited-profit housing program. It is not a separate municipal jurisdiction but is the name of a neighborhood that contains a high density of co-operatively-owned apartments situated on attractive parkland with easy access to parking and state parkways but not rail rapid public transit. Nearby amenities include a golf course, a beach, a shopping mall, and a municipal park. Per Census data, this neighborhood is Minority and Above Poverty.

Journal of Public Transportation, Vol. 16, No. 1, 2013
144
Consider the Title VI analysis of restructuring four bus lines in Co-op City. The cessation of an entire bus line (BX25) is projected to save $2.8 million per annum. The other three buses (BX26, BX28, BX38) will be altered to absorb the ridership of BX25: 1) reroute the BX26 to match the eliminated BX25 path at all times (the BX25 designation would no longer be used); 2) split the BX28 into two branches, with one serving the northern section of Co-op City (which would be extended to Bay Plaza and numbered BX38) and one serving the southern section of Co-op City (which would be numbered BX28); and 3) BX38 will not enter Asch Loop. These buses serve as feeders to the “2” and “5” Trains going into Manhattan and Brooklyn; they also go to the Metro-North Williams Bridge commuter rail station.
BX25, BX26, and BX28 are considered Minority bus routes because at least ⅓ of their total route mileage is in Minority Census tracts. These Census tracts are defined as Minority when 65.02 percent or more of their population are minority, per the 2000 New York City minority population threshold. Even though 34.98 percent or less are Non-Minorities, the entire Census tract is considered Minority. Thus, non-minorities do exist there even though the methodology treats these Census tracts as one or the other. Despite the route being predominately minority, the analysis compares the experience of minorities and non-minorities within the route by comparing Census tracts. The income levels are also worth mentioning because Co-op City is well known for being a community of the urban middle class popular among minorities and émigrés. The income requirements to live in Co-op City start at $23,160 for up to two people, which is just above poverty.
The method of analysis to determine Title VI compliance in Co-op City is simi-lar to the “M” and “V” Train modification discussed earlier. The difference is the additional variables of four routes being modified as opposed to just two for the “M” and “V” trains. The graphs on Table 6 show the changes in travel time and cost before and after modification. The average differences among the four socio-economic categories are less than half a minute or zero.

145
Maintaining Key Services While Retaining Core Values
Table 6. Travel Time and Cost Analysis: Co-op City
Travel Cost Analysis
GroupBefore (Mins.)
After (Mins.)
Avg. Diff. Var. t-Test Result
BX25 MinorityBX25 Non-Minority
25.524.1
25.524.1
0.00.0
0.00.0
Not requiredNo change
No disparity
BX26 MinorityBX26 Non-Minority
34.20.0
34.60.0
0.40.0
0.00.0
No comparisonData
No disparity
BX28 MinorityBX28 Non-Minority
34.20.0
34.60.0
0.40.0
0.00.0
No comparisonData
No disparity
BX38 MinorityBX38 Non-Minority
24.526.6
24.526.6
0.00.0
0.00.0
Not requiredNo change
No disparity
BX25 PovertyBX25 Non-Poverty
18.430.6
18.430.6
0.00.0
0.00.0
Not requiredNo change
No disparity
BX26 PovertyBX26 Non-Poverty
0.031.9
0.032.3
0.00.4
0.00.0
No comparisonData
No disparity
BX28 PovertyBX28 Non-Poverty
0.031.9
0.032.3
0.40.4
0.00.0
No comparisonData
No disparity
BX38 PovertyBX38 Non-Poverty
16.929.5
16.929.7
0.00.2
0.00.6
Not requiredNo change
No disparity

Journal of Public Transportation, Vol. 16, No. 1, 2013
146
Table 6 (cont'd.). Travel Time and Cost Analysis: Co-op City
Travel Cost Analysis
Group Before AfterAvg. Diff. Var. t-Test Result
BX25 MinorityBX25 Non-Minority
$1.22$1.32
$1.22$1.32
0¢0¢
0¢0¢
Not requiredNo change
No disparity
BX26 MinorityBX26 Non-Minority
$1.10$0.00
$1.10$0.00
0¢0¢
0¢0¢
No comparisonData
No disparity
BX28 MinorityBX28 Non-Minority
$1.10$0.00
$1.10$0.00
0¢0¢
0¢0¢
No comparisonData
No disparity
BX38 MinorityBX38 Non-Minority
$1.51$1.20
$1.51$1.20
0¢0¢
0¢0¢
Not requiredNo change
No disparity
BX25 PovertyBX25 Non-Poverty
$1.53$1.00
$1.53$1.00
0¢0¢
0¢0¢
Not requiredNo change
No disparity
BX26 PovertyBX26 Non-Poverty
$0.00$1.10
$0.00$1.10
0¢0¢
0¢0¢
No comparisonData
No disparity
BX28 PovertyBX28 Non-Poverty
$0.00$1.10
$0.00$1.10
0¢0¢
0¢0¢
No comparisonData
No disparity
BX38 PovertyBX38 Non-Poverty
$1.02$1.19
$1.02$1.19
0¢0¢
0¢0¢
Not requiredNo change
No disparity

147
Maintaining Key Services While Retaining Core Values
The top five origination method has a notable effect on the analysis. BX25 and BX26 travel along a similar path, but the top five origins for each route fall on different Census tracts. BX25 has data to compare between minorities and non-minorities. BX26 top five origins do not fall on any Non-Minority Census tracts, so there are no data to compare with Minority. BX26 top five origins do not fall on any At or Below Poverty Census tracts either, so there are no data to compare with Above Poverty tracts (Table 6).
Public ReactionThe residents of Co-op City formed a “Coalition to Stop the MTA Cuts” and pre-sented a petition to the MTA and their elected representatives signed by thou-sands. Nine months of meetings among the stakeholders yielded “the relocating of a bus stop from under the I-95 overpass to a better lit location closer to Baychester Avenue. A request to add buses to the BX28 line serving the north section of the community during the overnight hours was accepted” (Stuttig 2011, 22).
Still, a local city council believed the concessions have not gone far enough. He called for the MTA to “return to the drawing board and make sure the residents of Co-op City are not stranded” (Stuttig 2011). Having learned that these cuts saves millions of dollar per year, he claimed that “Co-op City has received an unfair share of the cuts made system-wide and as such should be given some consideration for having some of the previous level of service restored.” FTA auditors may be satis-fied and are assured that the reductions have been necessary and fair. However, NYCT strives to be customer-oriented and has maintained communications and negotiations with community leaders and their constituents. There may be no legal requirement to do so, given the exhaustive Title VI and EJ analysis, but it is a matter of working in good faith with stakeholders. One local media outlet reported that “ridership data will be reviewed to determine if service adjustments need to be made. Bronx residents will be given opportunities to speak out at town hall meet-ings” (News 12 2011).
Package Level Analysis Route level analysis is cumbersome and can be misleading because it does not capture the mitigating effects of restructuring other adjacent routes. A segment of the “M” Train in this study was eliminated in one area of Census tracts that have route redundancy mitigating any impacts to riders there. The “V” Train was elimi-nated, but only in the sense that the designation was no longer used. The Queens Boulevard Line local track that the “V” Train traveled was not physically removed.

Journal of Public Transportation, Vol. 16, No. 1, 2013
148
Riders still have access to train service with a different letter (“M”) and, in some sense, can go further with fewer transfers than before. Yet, analysis of the “V” Elimi-nation absent the “M” makes the result appear to impact one group more (albeit negligibly). Nevertheless, a route change has occurred and, thus, Title VI route level analysis must be done. The following formula summarizes when it is important to conduct an impact analysis as a package of changes.
Above X% Net Route Miles Change =
(New Mileage + Eliminated Mileage) / Σ (Original Route Mileage)
The X% is for each operator to decide. At NYCT, if the X% Net Route Miles Change is greater than 25 percent, then a package analysis should be conducted; no action is required if it is under 25 percent. Future NYCT Title VI analysis involving a com-bination of changes will use the method of package analysis in cases such as Co-op City. This method has been reviewed by FTA auditors and yields results that better represent the experiences of the riding public, not to mention making the analysis process easier.
Figure 2 is a hypothetical package analysis on a series of changes made to four routes. The focus of change is on Route 4 (or R4) because it is being eliminated. The original routes are R3, R4, R5, and R6. The gray horizontal line that makes a right-angle turn is R4 and stretches from segments E, F, G, and H, ending at D. The adjacent R5 is being extended to segment E, covering a portion of the R4 elimina-tion. Segment F would not be covered by any bus route, and riders will have to walk to bridge that distance. The adjacent R6 used to run in a straight line but, in order to cover a little more of the R4 elimination, now has to make a turn to run through segment G before heading south again to segment J. The distance of segment H also will not be covered by any bus route. The final segment to cover is D, which is taken over by extending R3. The modification of bus routes R5, R6, and R3 has now made bus route R4 no longer necessary. The percent of net route change is the quotient produced by the above formula. If the percentage is above 25 percent, then a Title VI analysis will be necessary.
This method of rationalization keeps the network relatively intact, which means people can still get to where they need to go but with some impact in connectivity. A rider may be accustomed to riding R5 to the end and transferring to R4 to get towards G. The transfer would be within the same block. Eliminating R4 means the rider has to walk distance F to catch R6 in order to complete the journey.

149
Maintaining Key Services While Retaining Core Values
% Net Route Change = Length (J+F+H+I) / Length (R3+R4+R5+R6)
Figure 2. Net route change example in a package analysis
ConclusionIt is the dynamic communication with the community and the analysis of the cus-tomer base that ensures the provision of the best level of service with the resources available. This effort makes every dollar count. Proving to the public that the impact on travel time for minorities in Co-op City is minimal frames the grievance they may have about losing an entire bus line and counters anecdotal experiences of poor service. Even if the impact can be measured by minutes, it helps to show that, statistically speaking and as a measure on the whole, the change is equal for minori-

Journal of Public Transportation, Vol. 16, No. 1, 2013
150
ties and non-minorities on that route. The effort and methods invested could save the operator from having to reverse their decisions, which in itself is costly.
Analysis of these issues needs to evolve to meet the needs of the operator and the community. In the case of the “M” and “V” trains, it may have been appropriate to analyze them as one route because the two were designed to be complementary as parts of a package of service changes. Likewise, this method could also be used to conduct surface analysis in Co-op City. Although the restructuring of routes in rapid transit is infrequent, the future of these types of service changes will likely be analyzed as a combined “package” of changes to account for the complex and interlinked nature of such system modifications.
Despite the scientific methods, there is still a qualitative element that operators must heed. Title VI analyses are just tools employed in multi-lateral communica-tion, ensuring that the operator, the riding public, and the government are all “on the same page” in terms of the effects of service changes on the community.
These methods for analyzing service changes are being developed at a time when the federal government is tightening the Title VI and EJ enforcement machinery through more thorough and detailed audits, promulgation of new rules, and requirements of transparency and accountability. FTA has affirmed its position through its proposed circulars, requiring all transit agencies to consider Title VI and EJ in service and fare changes that are becoming increasingly commonplace. Proper application of and further developing the methods discussed in this paper will allow the transit industry to move forward and maintain the balance between providing socially necessary services and upholding fiduciary responsibility. Retain-ing national core values require transit operators to go back to the basics: listening to the customers that it serves.
Acknowledgments
The authors would like to acknowledge the assistance of the following col-leagues during this manuscript’s development: Thomas Chennadu, Anthony Cramer, John Cucarese, Michael Kelly, Santosh Kumar, Brian Levine, and Svetlana Rudenko. Responsibility for errors or omissions remains with the authors. Opinions expressed are those of the authors and do not necessarily reflect official policy of Metropolitan Transportation Authority, MTA New York City Transit, or the Federal Transit Administration.

151
Maintaining Key Services While Retaining Core Values
References
American Public Transportation Association (APTA). 2011. Double digit rise in gas prices marks largest savings in nearly three years, giving public transit rid-ers economic edge. http://www.apta.com/mediacenter/pressreleases/2011/Pages/110414_TSR_april.aspx. Accessed June 1, 2011.
Bender, J., C. Bell, and B. Hill. 2007. Title VI: implementing a transit equity program. DMJM Harris and Maryland Transit Administration.
Garcia, R. Transportation equity in Los Angeles: The MTA and beyond. Environ-mental Defense Fund. http://www.edf.org/article.cfm?contentID=1238. Accessed June 10, 2011.
Hickey, R. L., A. V. Reddy, and A. Lu. 2010. Using quantitative methods in equity and demographic analysis to inform transit fare restructuring decisions. Transpor-tation Research Record, TRB Paper #10-0280.
Holt, A. 2009. Women and people of color down for the count in jobless recovery. Huffington Post, October 13. http://www.huffingtonpost.com/arlene-holt/women-and-people-of-color_b_318672.html Accessed June 1, 2011.
MTA New York City Transit. 1985. MTA guidelines—service change procedures. NYCT Operations Planning Department (Report OP - X85006), June 1.
New York State Department of Labor. 2011. Employed, unemployed, and rate of unemployed by place of residence for New York State and major labor areas. May. http://www.labor.ny.gov/stats/pressreleases/prtbur.txt Accessed June 1, 2011.
News 12. 2011. BX28 riders say cuts are hurting service. News 12 The Bronx, April 19.
Reddy, A. V., T. Chennadu, and A. Lu. 2010. Safeguarding minority civil rights and environmental justice in service delivery and reductions: Case study of New York City Transit Authority Title VI Program. Transportation Research Records 2163, TRB Paper #10-1155.
Roberts, S. 2010. Calculating poverty in New York: More by city standard, and less by federal one. The New York Times, March 2.
Stuttig, B. 2011. Benedetto invites MTA chairman to tour Co-op City. Co-op City Times, March 26.
Journal of Public Transportation, Vol. 16, No. 1, 2013
152
Thomas, L. W., and J. B. McDaniel, J.B. 2011. Reductions in transit service or increases in fares: Civil rights, ADA, regulatory, and environmental justice implications. TCRP Legal Research Digest 35: 13–14.
Thomas, L. W. 2007. Civil rights implications of the allocation of funds between bus and rail. TCRP Legal Research Digest.
U.S. Department of Labor, Bureau of Labor Statistics. 2011. Employment status of the civilian population 25 years and over by educational attainment. http://www.bls.gov/news.release/empsit.t04.htm Accessed June 1, 2011.
Urban Mass Transportation Administration (UMTA). 1988. Title VI Program guide-lines for Urban Mass Transportation Administration recipients. Circular UMTA C4702.1 Section I-3, May 26.
Ward, B. G. 2005. Case Studies in environmental justice and public transit Title VI reporting. National Center for Transit Research, University of South Florida.
About the Authors
Ted Wang ([email protected]) has been a Staff Analyst since 2007 in the Divi-sion of Operations Planning at New York City Transit. He has co-authored published papers on profitability of transit operations and transportation workforce devel-opment. His current research interest is in transportation equity and international best practices. He holds an M.A. in Urban Affairs from Queens College, where he focused his interest and thesis on the political feasibility of Bus Rapid Transit for New York City.
Alex Lu ([email protected]) is a transit analyst with 14 years of experience in transportation research and railroad management in the United States and Great Britain. Currently an employee of a U.S. commuter railroad, his research interest is in strategic planning, international best practice, and decision-support analyses and algorithms. He obtained an M.S.T. from the Massachusetts Institute of Technology.
Alla V. Reddy ([email protected]) is the Senior Director of System Data & Research in New York City Transit’s Division of Operations Planning. He obtained an M.S. in Operations Research from Polytechnic University in Brooklyn in 1976. In his more than 30 years of NYCT experience, he has practiced in the areas of industrial engineering, internal auditing, materials management, performance analysis, and environmental justice. His research interest is in using quantitative research to solve management problems and improve system productivity and efficiency.