
Main Results of the Survey on the Impact of Counseling on ...
90
Main Results of the Survey on the Impact of Counseling on Knowledge, Feelings and Actions of Over-Indebted Borrowers IN PARTNERSHIP:
Transcript of Main Results of the Survey on the Impact of Counseling on ...

Main Results of the Survey on the Impact of Counseling on Knowledge, Feelings and Actions of Over-Indebted Borrowers
In pARtneRShIp:

ExEcutivE Summary
A growing body of empirical work suggests that personalized, just-in-time consultation about financial decision-making, with an emphasis on goal-setting, may be more effective to bring about improvements in financial consumer behavior than generalized, classroom-style education. With this in mind, IFC piloted two campaigns to provide free, neutral, on-the-street financial counseling services to consumers in two provincial capitals of Kyrgyzstan – naryn and talas – in October and november 2015. In order to assess the impact of these counseling campaigns on consumers’ knowledge about their financial standing, feelings of readiness and capability to make good decisions, and actions to better balance income and expenses, maintain a household budget, IFC carried out an impact assessment of participants and control groups from talas and naryn at 0-, 3- and 6-months from the time of the counseling campaigns. the results provide valuable insights into the ways in which counseling can prove effective, and unexpected findings about what drives financial consumers to change their behavior. the financial counseling campaigns demonstrated significant positive impacts on planning, budgeting, and even income-generation. Counseling was not a magic bullet, however. Ambitious intentions and behavior improvements were seen mostly in the first three months, and then were muted or disappeared after 6 months. An unexpected result was improvements in planning and income generation among the control group (while in Kyrgyzstan generally, the economy grew more slowly and microfinance portfolios deteriorated); the findings suggest that the survey process itself motivated behavior changes, that the effect of nudging, reminding, or creating social pressure turned out to be a very powerful tool, even in the absence of counseling. the study also suggests that consumers’ feelings of self-confidence and optimism correlate with proactive financial decision-making, as evidenced by stark differences in behavior and feelings between the two provinces.

3
OvErviEw
A growing body of empirical work suggests that personalized, just-in-time consultation about financial decision-making, with an emphasis on goal-setting, may be more effective to bring about improvements in financial consumer behavior than generalized, classroom-style education. With this in mind, IFC piloted two campaigns to provide free, neutral, on-the-street financial counseling services to consumers in two provincial capitals of Kyrgyzstan – naryn and talas – in October and november 2015. the two provinces were selected as extreme cases of both household over-indebtedness (parallel credits, high repayments relative to income) and loan arrears, according to credit bureau data. With the cooperation of national Bank of Kyrgyz Republic and provincial and municipal governments, IFC carried out two, week-long campaigns in these cities, attracting more than one thousand adult financial consumers to each location, to participate in private, confidential counseling sessions of about 30-40 minutes duration per person, which included identification of personal financial goals, mapping out of major upcoming expenses and income, identification of risks, and opportunities for savings. each campaign culminated with a day-long festival based on the “edu-tainment” model, that is, combining local cultural attractions and entertainment with educational sessions about financial decision-making, and counseling. In order to assess the impact of these counseling campaigns on consumers’ knowledge about their financial standing, feelings of readiness and capability to make good decisions, and actions to better balance income and expenses, maintain a household budget, IFC carried out an impact assessment of participants and control groups from talas and naryn at 0-, 3- and 6-months from the time of the counseling campaigns. the results provide valuable insights into the ways in which counseling can prove effective, and unexpected findings about what drives financial consumers to change their behavior.
participants’ immediate responses were very positive, with most rating the quality and usefulness of consultations at 4 or 5, on a scale from 0(not useful) to 5(extremely useful). participants’ feedback indicates that they would like more counseling, more often, more accessibly, preferably with visual materials that would make complicated concepts easier to understand. participants also demand “real help”, meaning interventions that would concretely change their debt exposures; by this, the team infers that participants would benefit from counseling that financial institutions might provide at the time of credit prolongation and/or restructuring. that would be a critical “teachable moment”, when clients and credit officers could benefit tremendously from an in-depth discussion of the borrower’s income and expenses, financial goals, and steps which he might take to put himself on track to a manageable debt profile.
the financial counseling campaigns also demonstrated significant positive impacts on planning, budgeting, and even income-generation. At baseline, the target audience showed 65% of borrowers did not expect that their repayments would be as large as they are, and only 26% of participants could identify their monthly income and expenses with certainty. Following counseling, there was a 15% increase in those who had made a family budget. the proportion of respondents who could identify their incomes and expenses with certainty doubled after counseling. eighty percent of participants indicated they could find ways to make savings, reduce expenditures. the percentage of respondents who were surprised by the size of their monthly repayments fell, among those who participated in counseling, from 65 to 41%. Counseling had impacts on consumers’ outlook, too. Among those who participated in counseling, there was a 43% increase in those who said they felt they could get advice and guidance from their financial institutions; there was also a significant increase in feelings of self-confidence about financial planning. Interestingly, counseling showed impacts on debt exposure and income generation. half of respondents who participated in counseling showed reductions in the ratio of repayments to monthly income over the six-month period. the most vulnerable group—for whom debt repayments represented more than monthly income—declined by 9% in numbers after counseling. Both the intervention and the control groups showed reduction in the number of outstanding credits, and increase in income over the study period.
Counseling was not a magic bullet, however. Ambitious intentions and behavior improvements were seen mostly in the first three months; for example, the intervention group that took new credits in the 3 months after counseling shifted toward credit for long-term goals (compared to the control group that continued borrowing for short-term goals during that period), and there was a significant increase in family budgeting and planning. however, many of

4
the impacts that seemed strong at 3-months following consultation were muted or disappeared after 6 months. For example, there was a decline in planning and budgeting activity among the intervention group by 6 months. At 6 months, many more respondents said they needed “real help”, and counseling didn’t appear to improve borrowers’ repayment status (indeed, naryn showed a 41% reduction in borrowers indicating that they were making on-time repayments at 6-months following baseline).
the study revealed an unexpected impact of the survey itself on the control group. It should be noted that the control group was drawn from the same locations as the intervention group, and likewise expressed difficulty in making debt repayments at baseline, although the control group answered basic financial literacy questions correctly twice as frequently as the intervention group at baseline, a possible bias in the selection. perhaps it is not surprising, then, that the control group showed higher percentage of respondents making family budgets initially compared to intervention group (they may have been better planners in the first place, or participants seeking counseling may have had greater concerns that their finances were out of control). It is noteworthy that the study revealed increasing incomes over the 6-month period, and decreasing repayment-to-income ratios among both the intervention and the control groups, while the trend in Kyrgyzstan generally over the past year has been toward stalling economic growth and deteriorating microfinance loan portfolios, particularly in the two targeted provinces. What would have caused both groups to improve performance? perhaps the survey process itself motivated behavior changes, including greater attention to household budgeting, and more diligent efforts to increase income (or self-consciousness that motivated over-reporting of household income growth). By setting up predictable, quarterly interviews in the respondents’ homes, the researchers may have had the effect of nudging, reminding, or creating social pressure toward improved financial behavior. the results suggest that these “nudges” may have been unexpectedly powerful tools to motivate respondents to make household budgets, seek additional income sources and limit further borrowing.
the study also suggests that consumers’ feelings of self-confidence and optimism correlate with proactive financial decision-making. the people of talas and naryn differed greatly in this respect. Residents of talas showed significantly more optimism (in response to questions about whether they expected to be better-off next year than this year) and certainty about their financial estimations throughout the study period (although both provinces showed severe arrears and parallel credits). At the 6-month interview, 68% of naryn residents indicated pessimistic outlooks on their financial future, as compared to 11% of talas residents. Respondents in talas seemed to get more out of financial counseling than their peers in naryn; participants in talas showed greater propensity to make a family budget, greater propensity to discuss finances with family, greater confidence in estimating household income and expenses, and the percentage who said they “spent enough on basic household needs—food, clothing, transport” increased from 77 to 92% over the 6-month study period. By contrast, their peers in naryn not only fared worse in planning, budgeting, communication, and confidence, but the number responding that they “spend enough” on household basics declined from 70% to 51% over the 6-month period. part of the differences between provinces may be accounted by their income sources (talas is home to bean-growers, who saw a four-fold decline in bean prices, while naryn is home to shepherds, who saw a collapse of mutton prices), geographical and trade constraints. But mentality does seem to play an important role. Do difficult debt situations drive introverted, shamed or secretive behavior, which in turn inhibit family discussion of income and expenses, and therefore family budgeting? Or do feelings of hopelessness cause the borrower to shut-down, and give up on measures that might be helpful to ease his situation? It’s difficult to say, but the stark contrast of talas and naryn illustrate a problem which financial institutions might find elsewhere, that suggests serious challenges for building financial capability in some populations. A combination of social and cultural nudges, together with counseling, might be a start.
the pilot campaigns are another step toward building financial capability at the grassroots level, and the effort is being expanded and adapted. Learning from these early experiments may help to inform broader and more impactful interventions in the future.

5
ContentGLOSSARY ............................................................................................................................................................................................ 6
FOReWORD .......................................................................................................................................................................................... 8
MethODOLOGY ................................................................................................................................................................................. 9
SURVeY SUMMARY ........................................................................................................................................................................... 14
MAIn ReSULtS .................................................................................................................................................................................... 18
LeVeL OF OVeR-InDeBteDneSS .................................................................................................................................................. 18
eVALUAtIOn OF COnSULtAtIOnS ............................................................................................................................................... 27
KnOWLeDGe ....................................................................................................................................................................................... 32
peRCeptIOn ........................................................................................................................................................................................ 51
ACtIOnS ............................................................................................................................................................................................... 64
AppenDIXeS ........................................................................................................................................................................................ 73
AppenDIX 1. DeGRee OF OVeR-InDeBteDneSS .................................................................................................................... 73
AppenDIX 2. DeteRMInInG InCOMeS AnD eXpenSeS ....................................................................................................... 75
AppenDIX 3. peRCeptIOnS ........................................................................................................................................................... 77
AppenDIX 4. ACtIOnS ..................................................................................................................................................................... 84

6
1. GlossaryCa – consulting agency;
Interviewer – a specialist conducting a survey;
Kr –Kyrgyz Republic;
MCC – microcredit companies;
MCo – microcredit organizations;
MM – mass media;
Multiple choice – a question that allows selecting multiple answers;
n – the sample size of population pooled by specific signs / relevant to the parameters in question, namely – the total number of respondents subject to consideration in this particular case;
n – the number of respondents representing a specific sign/matching parameter n. (example: number of respondents n=1002, males - 47,6% (n=477), females – 52,4% (n=525));
nBKr – national Bank of the Kyrgyz Republic;
nsC – national Statistical Committee;
respondent – a person being interviewed;
ta – target audience;

7
rEpOrt StructurE
this report describes the following work of the specialists of M-Vector Consulting Agency: fieldwork to collect baseline data, control and analyze them, and define main results of the survey.
the report contains:
• Theglossary;
• Thesurveymethodologycontainingthedescriptionofthesampledpopulation,methodsandtoolsofthesurvey;
• Thesummaryofthesurveycontaininginformationonthemainconclusions,mainresultsofthesurvey;
• The findings of the survey representing themain results andmain findings acquired during the survey and analysis.Information reflected in the report is based on the baseline survey findings and two follow-up quantitative surveys;
• Annexes.

8
2. Foreword
According to the nBKR data as of March 31, 2016, the Kyrgyz Republic has 25 commercial banks, 323 branches of commercial banks, and 103 microcredit companies, 6 microcredit companies, 56 microcredit agencies and 118 credit unions1.
As of January 1, 2016, the number of active borrowers in Kyrgyzstan is 536 thousand 662 people. Out of them 376,428 people are borrowers of commercial banks, 194 thousand are borrowers of microfinance organizations.
At the beginning of 2016, 15% of active borrowers have had delay in payments for 30 days. the total number of loans with delays in payment was 471,8652. As compared to 2014, the percentage of overdue loans in 2015 increased from 8.6% to 18.6%.
the number of borrowers having two or more loans across the country is 77 thousand people. As compared to 2014, their number has decreased by 14 thousand. Out of 77 thousand, 91% have 2 loans, 8% have 3 loans, and only 1% has 4 or more loans.
Despite the increasing number of people using services of MFOs/MCCs, not all borrowers stay satisfied and benefit from the loan as expected. this situation is related to multiple factors, one of which is the insufficient financial literacy and irrational financial budget planning by borrowers, which causes further repayment difficulties.
Based on the similar surveys carried out by M-Vector, and also in the opinion of many financial experts, in order to decrease the level of over-indebtedness in the country it is necessary to work with the population with regard to financial literacy and budget planning. this survey was carried out to evaluate and monitor the results of financial consultations provided to the population. In order to evaluate the effectiveness of the impact of consultations on the knowledge, feelings and actions of borrowers regarding financial planning, the survey was organized in 3 stages:
1. Baseline survey was carried out to evaluate the initial level of knowledge of borrowers about the rights, options for improving their financial situation; feelings about financial control and readiness for future; actions to improve financial planning before consultations.
2. Interim survey was carried out to evaluate the level after financial planning consultations.
3. Final survey was carried out to evaluate the impact of consultations in the long run.
1. http://www.nbkr.kg/index1.jsp?item=69&lang=RUS2. Review of the loan market in 2015. https://www.akchabar.kg/article/loans/loan-market-review-2015/

9
3. MethodoloGy
ObjEctivE Of thE SurvEy:
As part of the survey, it was necessary to monitor and evaluate the impact of financial planning consultations on borrowers with difficulties to repay debts, namely on their:
•knowledgeaboutrightsandoptionsforimprovingtheirfinancialsituation;
•feelingsaboutfinancialcontrolandreadinessforthefuture;
•actionstoimprovethesustainabilityoftheirfinancialposition.
LOcatiOnS:
the survey covered two locations – the cities of naryn and talas. the surveyed cities were identified on the basis of statistical data of the level of over-indebtedness of local people in the city with the highest level of people having parallel loans and arrears in monthly repayments.
targEt audiEncE:
the target audience of the survey was borrowers3 who self-identified themselves as "with difficulties to repay debts"4.
two targets groups of borrowers were identified to meet the objective of the survey:
1) Intervention group – borrowers with difficulties to repay any debts (loans, debts, borrowings from relatives, friends), who participated in the consultations.
2) Control group – borrowers with difficulties to repay any debts (loans, debts, borrowings from relatives, friends), who did not participate in the consultations.
the social-demographic profile of the target audience:
- Gender: Males and females
- Age: 18 years and older;
- Income level: all levels;
- education level: all levels.
3. Borrowers: borrowers from any types of financial institutions (banks, MFOs, credit unions, etc.), as well as from relatives, acquaintances, friends, etc.4. “With difficulties to repay debts” - 1) Several parallel loans (when one loan is taken to pay off the previous loan); 2) Delays in payments to pay off a loan.

10
SurvEy mEthOdOLOgy:
In talas and naryn, IFC in cooperation with mayors and governors held a week-long campaign to offer free-of-charge counseling on financial planning in tents on the street. Consultations were provided by independent consultants, who did not represent any financial institution in the form of private, personal interviews. the duration of each consultation was approximately 35 minutes. As a result, about 1,000 personal consultations were provided for consumers of financial services in each of the cities.
the survey was arranged in 3 stages: baseline, interim and final surveys. Baseline survey was carried out to document the level of knowledge, feelings, financial activity (actions) regarding financial planning of the surveyed tA before the impact of consultations on the intervention group. Interim and final surveys were carried out to evaluate the level after the consultations. the results obtained during the interim and final surveys were to be compared with the baseline survey results, i.e. to evaluate the impact of financial planning consultations on borrowers with difficulties to repay debts. thus, the comparison of the results of evaluation of control and intervention groups aimed to produces a “purer” evaluation of the impact of consultations on intervention group. nevertheless, as shown by the survey results, the control group respondents were also motivated to change their financial behavior. they did not receive any professional financial advice, but took part in a series of personal interviews about their financial situation. It is likely that these interviews served as reminders or social pressure on respondents to improve their financial situation. Despite the slowdown in overall economic growth in Kyrgyzstan and the deterioration of microfinance portfolios observed over the period of study, participants in both interventional and control groups showed progress against several indicators.
A financial planning community fair was organized for a simplified selection of respondents to intervention group in every surveyed city. the fairs were held in October 2015. the fair was held by the IFC in association with M-Vector CA and leading MFOs, such as Kompanion and Finca. the people that identified themselves as “with difficulties to repay debts”5 were invited to the event in response to advertisement (radio, print media, or in response to SMS sent to their financial institutions). Financial planning consultations and entertainment program were provided as part of the fair. the fair made it possible to select respondents to intervention group, initially evaluate their knowledge, feelings and actions, and then to provide consultations to them. A more detailed baseline survey chart is as follows:
5. “With difficulties to repay debts” - 1) Several parallel loans (when one loan is taken to pay off the previous loan); 2) Delays in payments to pay off a loan.

11
1. BaselIne survey:• InterventIon group survey
1.1. rEgiStratiOn Of fair viSitOrS:
target audience: all fair visitors above 18 years.
Approach: the survey was carried out as a face-to-face interview using a specific questionnaire for the registration of fair visitors. All visitors above 18 were registered by interviewers-registrars.
Interviewers provided bracelets with identification numbers to visitors who said they had difficulties to repay debts, loans and other types of debts, and referred them to M-Vector tents, where they were asked to fill out the main questionnaire. When some people entered the community fair premises unregistered, 6 interviewers-controllers “circulated” the community fair area and identified them visually (visitors without bracelets) and registered.
InteRVIeWeRS’ LOCAtIOn SCheMe DURInG the FAIR FOR the ReGIStRAtIOn OF VISItORS:
- interviewers-registrars
- interviewers-controllers
- tents with consultants
- interview tent
1.2. main SurvEy aftEr rEgiStratiOn
target audience: visitors that claimed they had difficulties to repay debts, loans and other kinds of debts.
Approach: the survey was carried out as a face-to-face interview. Visitors filled out the main questionnaire. If necessary, interviewers worked in tents to explain the questions arising in respondents regarding the questionnaire.
A little reward (a chocolate bar) was given to visitors taking part in the main questionnaire survey. After the survey, respondents were asked to visit other tents for 7-minute financial planning consultation.
1.3. cOnSuLtatiOnS and OffEr Of fOLLOw-up cOnSuLtatiOnS and participatiOn in thE fOrthcOming SurvEy
target audience: visitors who claimed they had difficulties to repay debts, loans and other types of debts that filled out the main questionnaire.
Approach: Опрос the survey was carried out as a face-to-face interview. After the consultations, consultants offered participation in the forthcoming consultations and survey and entered their responses into a special form.

12
1.4. EvaLuatiOn Of cOnSuLtatiOnS and EvEntS
MFO consultants provided every visitor, after consultation, with a consultation and community fair evaluation questionnaire.
the evaluation was carried out anonymously. every visitor put the filled out evaluation questionnaire into the general evaluation box.
• cOntrOL grOup SurvEy
target audience: borrowers with difficulties to repay debts that did not take part in the community fair and consultations.
Approach: the survey was carried out as a face-to-face interview. Respondents were selected from households by the snowball method, i.e. every selected respondent was asked to recommend one or several borrowers that are in the target group of the survey. Respondents filled out the questionnaire and could ask follow-up questions to the interviewer, when necessary.
For intervention group, IFC organized additional consultations via phone calls, SMS, personal meetings with consultants, self-help groups during the baseline and interim surveys. these consultations were mainly intended to remind the borrowers of the need of budget financial planning rather than to improve their financial literacy.
the questionnaire for the borrowers of control group consisted of 2 sections:
1. Main section containing questions identical to the main questionnaire for intervention group;
2. Offer to participate in the subsequent survey.
2. intErim SurvEy
3 months after the baseline survey, interviewers contacted the respondents of intervention and control groups for the interim survey (follow-up survey no. 1).
the place of the survey was agreed with respondents and was mainly the place of residence or place of work of respondents. During the survey, there were respondents that did not reside in the surveyed cities. In these cases, interviewers visited villages where those respondents resided.
Interviewers tried to convince respondents to take part in the similar survey in 3 months (for extra compensation in the form of top up scratch cards).
Approach: the survey was carried out as a face-to-face interview. Respondents filled out the questionnaire and could ask follow-up questions to the interviewer, when necessary.

13
3. FInal survey
3 months after the interim survey, the final survey was organized for respondents from intervention group and control group.
the survey procedure and toolkit were identical to the ones applied in the interim survey.
extra compensation was also provided for respondents for their participation in the survey.
SampLing
table 1 shows the sample size in every survey:
tABLe 1. SAMpLe SIZe, nUMBeR OF peOpLe
intervention group control groupnaryn talas naryn talas
1st survey Registered -1062 Registered -1112 45 45Surveyed under main
questionnaire - 200 Surveyed under main
questionnaire - 2002nd survey 110 111 45 363rd survey 108 103 45 34
1. QuaLity cOntrOL Of intErviEwErS
20% control of randomly selected questionnaires of every interviewer was conducted. Control was carried out by a phone call.
Control of interviewers was conducted throughout the fieldwork. the agency developed specific control-questionnaire containing a list of main questions and characteristics, such as the fact of interview, length of interview, and several questions from the main questionnaire. experienced controllers of the company conducted quality control.
2. data prOcESSing, anaLySiS and SubmiSSiOn
After the quality control, the questionnaire data were encoded and entered into the electronic database. Further statistical data manipulation was performed via SpSS and Microsoft excel.
Descriptive statistics cross analysis methods were used to process and analyze data.

14
4. survey suMMarythe survey was carried out by order of IFC. the objective of the survey was to obtain data on existing knowledge about rights, feelings and practices of financial planning, control of funds, as well as on the changes in this level after financial planning consultations. the results provide valuable insights into the ways in which counseling can prove effective, and unexpected findings about what drives financial consumers to change their behavior. the financial counseling campaigns demonstrated significant positive impacts on planning, budgeting, and even income-generation. Counseling was not a magic bullet, however. Ambitious intentions and behavior improvements were seen mostly in the first three months, and then were muted or disappeared after 6 months. An unexpected result was improvements in planning and income generation among the control group (while in Kyrgyzstan generally, the economy grew more slowly and microfinance portfolios deteriorated); the findings suggest that the survey process itself motivated behavior changes, that the effect of nudging, reminding, or creating social pressure turned out to be a very powerful tool, even in the absence of counseling. the study also suggests that consumers’ feelings of self-confidence and optimism correlate with proactive financial decision-making, as evidenced by stark differences in behavior and feelings between the two provinces.
findingS aS tO thE LEvEL Of OvEr-indEbtEdnESS Of rESpOndEntS:
• Resultsofthesurveyshowedthatinterventiongroupandcontrolgrouphadadecreaseinthepercentageofpeoplewithdebts. the decrease in the percentage of borrowers was caused more by the objective fact – the time between the surveys: e.g., people had paid back their short-term loans for they have almost repaid their loans in full by the time of the 1st survey.
•Halfofrespondentsfrominterventiongroupthatpaidbacktheirloansbythetimeofthe3rd survey mentioned in the baseline survey that their payments were equal to or exceeded their income. thus, those borrowers found options to pay back their loans despite the fact that their payments exceeded their income. In control group, this ratio did not exceed 30% of all respondents that paid back their loans.
•Delaysinpaymentstopaybackloans,borrowingsoccurnotonlyamongrespondentswhosepaymentsexceedtheirmonthlyincome, but also among borrowers with income exceeding their payments. thus, more than 50% of borrowers had to make payments that were lower than their monthly income by the time of final survey.
findingS aS tO thE EvaLuatiOn Of financiaL pLanning cOnSuLtatiOnS:
• Resultsofevaluationofconsultationscarriedout for interventiongroupshowedthatconsultationsweregenerally takenpositively by borrowers. the majority of respondents mentioned that consultations were mostly useful for them and they would want similar consultations to be regular. however, the evaluation of consultations tended to decrease during the 2nd and 3rd surveys as compared to the evaluation made by respondents right after the consultations. this situation can be explained by the diminished impact of consultations with time.
• Consultations in the formofphonecalls andSMSare lesspopular among respondents.Over ahalfof respondents thatreceived such types of consultations for various reasons stated they did not receive them.

15
findingS aS tO thE EvaLuatiOn Of financiaL LitEracy Of bOrrOwErS and LEvEL Of knOwLEdgE abOut thEir rightS bEfOrE crEdit inStitutiOnS, and aLSO OptiOn Of imprOvEmEnt Of thEir financiaL SituatiOn:
•Accordingtotheresultsofevaluationoffinancialliteracylevelsinborrowersduringthebaselinesurveyininterventiongroup,the percentage of respondents with high level of financial literacy was fairly low (26%). In control group, the percentage was higher (50%). the results of evaluation indicate the general increase in the level of financial literacy in respondents of intervention and control groups. A more significant growth of literacy is typical for intervention group (+52%), than for control group (+24%). talas-based respondents initially have higher level of financial literacy and more significant growth of this level, compared to naryn-based respondents.
•Generally,thereisagrowthofthepercentageofrespondentswhocancalculatetheirincomeandexpenses.
• Respondentsseethemainsourceofconsultationsoncopingwithrepaymentdifficultiesinabank,MCO,wheretheytookout their loans. the percentage of respondents that consider the bank, MCO as their assistant in this issue tends to decline. In intervention group, the percentage increased by 43% by the time of the 3rd survey, if compared with the baseline survey. 11% of respondents considered International Financial Corporation that held the financial planning fair as the service.
•Theanswersbyrespondentsthinkingtheyhavetherighttorequestreschedulingofpaymentsandthinkingotherwisedividedalmost equally in the baseline survey. the percentage of respondents thinking they have the right to request rescheduling of payments has increased by 11% in intervention group, and by 5% in control group by the time of the 3rd survey as compared with the baseline survey.
•Thepercentageofrespondentsthinkingtheyhavetherighttorequestrestructuringofdebtvariedslightlybetweenthetwogroups and was about 50% in intervention group and 40% in control group.
findingS aS tO thE EvaLuatiOn Of fEELingS abOut financiaL cOntrOL and rEadinESS fOr futurE:
•Analysisoffeelingsofborrowersabouttheamountofdebtshowedthatthemajorityofborrowers(about65%)withproblemloans in both groups did not expect that the loan amount would be as large as it is. According to the final survey, this percentage decreased to 41% in both groups. this decrease could be caused by the heightened attention of borrowers to the terms and conditions of loan.
•Analysisofthechangesintheincomelevelofrespondentsshowedtheincreaseofthepercentageofrespondentsthatincreasedtheir income level as compared to the income reported during the baseline survey. the increase is higher in intervention group than in control group.
• In general, the analysis of feelings of respondents shows improvements. More significant positive changes are seen inintervention group than in control group.
•Themajorityofrespondentsthinkloanimprovestheirlifestyle(answers:“stronglyagree”and“sometimeagree”).Byresultsofthe 3rd survey (+5% as compared to baseline level), intervention group encounters the increase in the percentage of respondents that don’t think that loan improve their lifestyle. In control group, this percentage decreased (-8% as compared to baseline level).
•About90%ofrespondentsfeelconfidentaboutfinancialplanning.Ifcomparedtobaselinelevel,thelevelofrespondentsinintervention group that feel absolutely confident about financial planning has increased after consultations: by 5% in the 2nd survey, by 13% in the 3rd survey.
•Incontrolgroup,thisindicatordecreasedby5%ascomparedtobaselinelevelbythetimeofthe3rdsurvey.

16
•Themajorityofrespondents(about80%)aresuretheycanbemorecostefficient.
•Themajorityofrespondentsthinktheyhavenomajordifficultiestorepaydebts.Thus,only15-20%inbothgroupssaidtheyhad difficulties to repay debts. Less than 20% of respondents in intervention group think they have no difficulties to repay debts; however, they have arrears in payments. this level is higher (28-36%) in control group. thus, despite the fact that some borrowers can repay debts without delays, they do have payment arrears.
•IninterventiongroupinNaryn,thepercentageofrespondentsthataresuretheycankeepthecollateralproperty;controltheirfinancial situation; become more cost efficient; improve their financial situation in the following year is significantly lower than in talas.
•Theaggregateindicatorofrespondents’feelingsabouttheirfinancialsituation,andtheirreadinessforfutureshowsahigherpercentage of optimistic respondents in talas, than in naryn. the level of pessimistic respondents is very high in naryn and equals to 68% in the 3rd survey, whereas in talas it equals to 11%. the situation is otherwise in control group – in naryn there are more optimists than in talas.
• In interventiongroupofNaryn,the2ndsurveyshowstheincreasedpercentageofpositiveandneutralrespondentsafterconsultations, but it decreases in the 3rd survey with the growing number of pessimistic respondents. In talas, the percentage of respondents feeling neutral and positive about their financial future is constantly increasing.
findingS aS tO thE anaLySiS Of actiOnS cOmmittEd in rEgard tO financiaL pLanning.
• After consultations, interventiongroupencounters aminor increase in thepercentageof respondents thatmade familybudget (+15%) as compared to the decrease in control group (-5%) during the 2nd survey. there is a growing trend in talas in making family budget, its discussion with the family, whereas in naryn this percentage increases steeply by the time of the 2nd survey than in talas, and then decreases.
•Baselinesurveyshowedthatinterventiongrouphadabout60%ofrespondentsthatmadefinancialplans,whereasincontrolgroup this percentage was higher – 76%. In intervention group the percentage of respondents that made financial plans by the time of the 2nd survey increased sharply in naryn (+20%) and remained almost at the same level in talas. however, in the 3rd survey, naryn showed the decrease in this level by 19%, and talas showed the increase by 18%. In control group, the percentage of people that made financial plans tends to decline in naryn, and grow in talas..
•ThepercentageofrespondentsthatdiscussedtheirincomeandexpenseswiththefamiliesishigherinTalasthaninNaryn.this level in intervention group increased by 4% by the time of the 2nd survey in naryn and remained almost the same in talas. however, by the time of the 3rd survey, it decreased by 8% in naryn and increased by 8% in talas. In control group, this indicator in naryn decreased by 5%, and in talas decreased by 26% prior to the 2nd survey, and during the 3rd survey it reached the recent level in naryn (56%), and increased by 20% in talas as compared to the 2nd survey.
•Themajorityofrespondentsspendenoughmoneytokeeptheirfamilieswell:food,clothing,transport,etc.Ininterventiongroup, the percentage of respondents with improved lifestyle in this regard increased from 77% in baseline survey to 92% in the 3rd survey in talas; whereas in naryn this indicator decreased from 70% to 51%. In control group, this indicator tends to decline in two cities.
•Therefore,itmaybeconcludedthatininterventiongroupthereisanupwardtrendintheactionsofrespondentsregardingtheissues of making and discussion of family budget, sufficiency of money to keep the family well, setting financial goals in talas, whereas in naryn the level of financial activity increases sharply prior to the 2nd survey, unlike talas, and then decreases. these differences imply that consultations had a longer-term impact on talas-based respondents, than on naryn-based respondents.

17
•Therearenosignificantdifferencesinthepreferencestosaveorborrowmoney.Morethanahalfofrespondentsprefertosavemoney in advance than to borrow.
• Analysisof theaggregate indicatordescribing thegeneralfinancialactivityof respondents showedthatTalashashigheractivity than naryn. Respondents from naryn usually have more passive behavior. By the end of survey and after consultations on intervention group, the level of respondents in talas, whose financial activity increased compared to baseline level, increased by 22%, and in naryn – decreased by 12%.
•Theresultsofthestudyshowedthatparticipantsinthecontrolgroupalsodemonstratedsomeprogressintermsofplanning,budgeting and income generation. It could be that interviews conducted every 3 months during personal meetings with the control group served as a reminder motivating interviewees to pay more attention to planning, budgeting, and improve their financial situation. Due to the unfeasibility of direct comparison between “control for the control group” and the control group, we could only compare the results of the control group with the general trends observed among over-indebted borrowers in Kyrgyzstan. thus, improvements can be observed in terms of financial behavior in the control group as compared to borrowers who were not involved in this study.

18
5. MaIn results5.1. LEvEL Of OvEr-indEbtEdnESS
the problem of over-indebtedness of people means signifi cant excess of borrower’s debt payments over their income, which makes borrowers economize on their basic needs (food, clothing, transport), and also delay in payments. this problem is still relevant in the Kyrgyz Republic.
this section discusses the change in the number of loans of borrowers of intervention and control groups. this evaluation allows seeing the changes in the level of over-indebted respondents.
For 6 months, both intervention and control groups have encountered the general decrease in the percentage of people with loans, borrowings and other types of debts. By the time of the 3rd survey, about 20% of respondents paid back their loans.
FIGURe 5.1.1. “DO YOU CURRentLY hAVe A LOAn?”InteRVentIOn (n=211) COntROL (n=79)
In naryn, control group has more active decrease in the number of borrowers compared to intervention group. In talas, intervention group has more active decrease compared to control group.
FIGURe 5.1.2. “DO YOU CURRentLY hAVe A LOAn?” nARYnInteRVentIOn(n=108) COntROL (n=45)
20
figuRe 5.1.3. “do you cuRRently have a loan?». talasinteRvention (n=103) contRol (n=34)
a more detailed analysis of the change in the number of parallel loans in respondents allows to see the behavior of respondents regarding taking of new loans, borrowings after the repayment of existing loans.
according to table 5.1.1, almost all (99%) borrowers that paid off their loans by the time of the 2nd survey never took new loans, borrowings or took short-term ones and repaid them in between the surveys. this situation is typical for control group and intervention group.
table 5.1.1. “do you cuRRently have a loan?”by the nuMbeR of loans available in Respondents by the tiMe of the 1st suRvey
number of loans,
borrowings in baseline
survey
intervention control
n 1st survey 2nd survey 3rd survey n 1st survey 2nd survey 3rd survey
1 102 yes 100%
yes 94%yes; 79%
34 yes 100%yes 97%
yes; 82%no; 15% no; 15%
no 6%yes; 0%
no 3%yes; 0%
no; 6% no; 3%
2 52 yes100%yes 98%
yes; 88%
19 yes 100%yes 100%
yes; 84%no; 10% no; 16%
no 2%yes; 0%
no 0%yes; 0%
no; 2% no; 0%
3 13 yes 100%yes 92%
yes; 77%
15 yes 100%yes 100%
yes; 53%no; 15% no; 47%
no 8%yes; 0%
no 0%yes; 0%
no; 8% no; 0%
4 11 yes 100%yes 100%
yes; 82%
7 yes 100%yes 86%
yes; 72%no; 18% no; 14%
no 0%yes; 0%
no 14%yes; 0%
no; 0% no; 14%
19
5. MaIn results5.1. LEvEL Of OvEr-indEbtEdnESS
the problem of over-indebtedness of people means significant excess of borrower’s debt payments over their income, which makes borrowers economize on their basic needs (food, clothing, transport), and also delay in payments. this problem is still relevant in the Kyrgyz Republic.
this section discusses the change in the number of loans of borrowers of intervention and control groups. this evaluation allows seeing the changes in the level of over-indebted respondents.
for 6 months, both intervention and control groups have encountered the general decrease in the percentage of people with loans, borrowings and other types of debts. by the time of the 3rd survey, about 20% of respondents paid back their loans.
figuRe 5.1.1. “do you cuRRently have a loan?”inteRvention (n=211) contRol (n=79)
in naryn, control group has more active decrease in the number of borrowers compared to intervention group. in talas, intervention group has more active decrease compared to control group.
figuRe 5.1.2. “do you cuRRently have a loan?”. naRyninteRvention(n=108) contRol (n=45)

19
FIGURe 5.1.3. “DO YOU CURRentLY hAVe A LOAn?» tALASInteRVentIOn (n=103) COntROL (n=34)
A more detailed analysis of the change in the number of parallel loans in respondents allows to see the behavior of respondents regarding taking of new loans, borrowings after the repayment of existing loans.
According to table 5.1.1, almost all (99%) borrowers that paid off their loans by the time of the 2nd survey never took new loans, borrowings or took short-term ones and repaid them in between the surveys. this situation is typical for control group and intervention group.
tABLe 5.1.1. “DO YOU CURRentLY hAVe A LOAn?”BY the nUMBeR OF LOAnS AVAILABLe In ReSpOnDentS BY the tIMe OF the 1St SURVeY
number of loans,
borrowings in baseline
survey
intervention control
n 1st survey 2nd survey 3rd survey n 1st survey 2nd survey 3rd survey
1 102 Yes 100%
Yes 94%Yes; 79%
34 Yes 100%Yes 97%
Yes; 82%no; 15% no; 15%
no 6%Yes; 0%
no 3%Yes; 0%
no; 6% no; 3%
2 52 Yes100%Yes 98%
Yes; 88%
19 Yes 100%Yes 100%
Yes; 84%no; 10% no; 16%
no 2%Yes; 0%
no 0%Yes; 0%
no; 2% no; 0%
3 13 Yes 100%Yes 92%
Yes; 77%
15 Yes 100%Yes 100%
Yes; 53%no; 15% no; 47%
no 8%Yes; 0%
no 0%Yes; 0%
no; 8% no; 0%
4 11 Yes 100%Yes 100%
Yes; 82%
7 Yes 100%Yes 86%
Yes; 72%no; 18% no; 14%
no 0%Yes; 0%
no 14%Yes; 0%
no; 0% no; 14%
20
figuRe 5.1.3. “do you cuRRently have a loan?». talasinteRvention (n=103) contRol (n=34)
a more detailed analysis of the change in the number of parallel loans in respondents allows to see the behavior of respondents regarding taking of new loans, borrowings after the repayment of existing loans.
according to table 5.1.1, almost all (99%) borrowers that paid off their loans by the time of the 2nd survey never took new loans, borrowings or took short-term ones and repaid them in between the surveys. this situation is typical for control group and intervention group.
table 5.1.1. “do you cuRRently have a loan?”by the nuMbeR of loans available in Respondents by the tiMe of the 1st suRvey
number of loans,
borrowings in baseline
survey
intervention control
n 1st survey 2nd survey 3rd survey n 1st survey 2nd survey 3rd survey
1 102 yes 100%
yes 94%yes; 79%
34 yes 100%yes 97%
yes; 82%no; 15% no; 15%
no 6%yes; 0%
no 3%yes; 0%
no; 6% no; 3%
2 52 yes100%yes 98%
yes; 88%
19 yes 100%yes 100%
yes; 84%no; 10% no; 16%
no 2%yes; 0%
no 0%yes; 0%
no; 2% no; 0%
3 13 yes 100%yes 92%
yes; 77%
15 yes 100%yes 100%
yes; 53%no; 15% no; 47%
no 8%yes; 0%
no 0%yes; 0%
no; 8% no; 0%
4 11 yes 100%yes 100%
yes; 82%
7 yes 100%yes 86%
yes; 72%no; 18% no; 14%
no 0%yes; 0%
no 14%yes; 0%
no; 0% no; 14%
19
5. MaIn results5.1. LEvEL Of OvEr-indEbtEdnESS
the problem of over-indebtedness of people means significant excess of borrower’s debt payments over their income, which makes borrowers economize on their basic needs (food, clothing, transport), and also delay in payments. this problem is still relevant in the Kyrgyz Republic.
this section discusses the change in the number of loans of borrowers of intervention and control groups. this evaluation allows seeing the changes in the level of over-indebted respondents.
for 6 months, both intervention and control groups have encountered the general decrease in the percentage of people with loans, borrowings and other types of debts. by the time of the 3rd survey, about 20% of respondents paid back their loans.
figuRe 5.1.1. “do you cuRRently have a loan?”inteRvention (n=211) contRol (n=79)
in naryn, control group has more active decrease in the number of borrowers compared to intervention group. in talas, intervention group has more active decrease compared to control group.
figuRe 5.1.2. “do you cuRRently have a loan?”. naRyninteRvention(n=108) contRol (n=45)
19
5. MaIn results5.1. LEvEL Of OvEr-indEbtEdnESS
the problem of over-indebtedness of people means significant excess of borrower’s debt payments over their income, which makes borrowers economize on their basic needs (food, clothing, transport), and also delay in payments. this problem is still relevant in the Kyrgyz Republic.
this section discusses the change in the number of loans of borrowers of intervention and control groups. this evaluation allows seeing the changes in the level of over-indebted respondents.
for 6 months, both intervention and control groups have encountered the general decrease in the percentage of people with loans, borrowings and other types of debts. by the time of the 3rd survey, about 20% of respondents paid back their loans.
figuRe 5.1.1. “do you cuRRently have a loan?”inteRvention (n=211) contRol (n=79)
in naryn, control group has more active decrease in the number of borrowers compared to intervention group. in talas, intervention group has more active decrease compared to control group.
figuRe 5.1.2. “do you cuRRently have a loan?”. naRyninteRvention(n=108) contRol (n=45)

20
5 и более 10 Yes 100%Yes 80%
Yes; 70%
4 Yes 100%Yes 100%
Yes; 75%no; 10% no; 25%
no 20%Yes; 20%
no 0%Yes; 0%
no; 0% no; 0%
Затрудня-юсь отве-
тить23 Yes 100%
Yes 96%Yes; 83% tOtAL n=79no; 13%
no 4%Yes; 0%no; 4%
tOtAL n=211
According to table 5.1.2and figure 5.1.4, we can keep track of the behavior of respondents regarding the number of loans existing at the baseline and changed behavior 3 and 6 months later.
Figure 5.1.4 shows that the majority of borrowers (up to 80% of respondents in intervention group and up to 76% in control group) had the same number of loans by the time of the 3rd survey, and about 20% of respondents repaid their loans.
In control group, 10 respondents with one loan reported at the baseline survey (30%) increased the number of loans to two loans; 4 borrowers with 2 loans each reported at the baseline survey increased the number of loans to 3 each by the time of the 3rd survey.
the percentage of respondents with the increased number of loans per results of the 3rd survey decreased in intervention group compared to control group. thus, 18% of respondents with 1loan, borrowing (19 persons) increased the number of loans to two by the time of final survey.
this difference may have been caused by the impact of consultations on borrowers that could evaluate their financial capacities and decided either not to take loans, or to pay them off within a short time.
tABLe 5.1.2. LOAn StAtUS
intervention control1st survey 2nd survey 3rd survey % 1st survey 2nd survey 3rd survey %
1 loan
no loan no loan 6%
1 loan
1 no loan 15%1 no loan 10% 2 1 15%1 1 34% 3 1 6%2 1 10% 1 1 26%1 2 10% 2 2 9%2 2 8% 1 2 21%
Other 23% Other 9%tOtAL n=102 100% tOtAL n=34 100%

21
intervention control1st survey 2nd survey 3rd survey % 1st survey 2nd survey 3rd survey %
2 loans
2 no loan 6%
2 loans
1 no loan 5%1 1 21% 2 no loan 11%2 1 17% 3 no loan 5%2 2 17% 1 1 16%1 2 17% 2 1 5%
Other 21% 3 1 11%tOtAL n=52 100% 2 2 11%
3 2 16% 2 3 5% 3 3 5% Other 11% tOtAL n=19 100%
intervention control1st survey 2nd survey 3rd survey % 1st survey 2nd survey 3rd survey %
3 loans
no loan no loan 8%
3 loans
1 no loan 13%1 no loan 15% 2 no loan 20%1 1 15% 3 no loan 7%2 1 23% 5 no loan 7%3 1 8% 1 1 13%2 2 8% 3 1 13%3 3 15% 2 2 13%4 2 8% 5 2 7%
Other 21% 3 3 0%tOtAL n=13 100% Other 7%
tOtAL n=15 100%intervention control
1st survey 2nd survey 3rd survey % 1st survey 2nd survey 3rd survey %
4 loans
1 no loan 18%
4 loans
2 no loan 14%1 1 18% 1 1 14%2 1 18% 3 1 14%1 2 18% no loan 2 14%3 1 9% 1 2 14%2 2 9% 1 3 14%4 4 0% 4 3 14%
Other 9% tOtAL n=7 100%tOtAL n=11 100%

22
intervention control group1st survey 2nd survey 3rd survey % 1st survey 2nd survey 3rd survey %
5+ loans
1 no loan 10%
5+ loans
2 no loan 25%no loan 1 20% 2 2 25%
1 1 30% 2 3 25%2 1 20% 1 5 25%2 2 10% tOtAL n=4 100%5 5 10%
tOtAL n=10 100%
FIGURe 5.1.4. ChAnGe In the nUMBeR OF LOAnS In BORROWeRS COMpAReD tO the InItIAL nUMBeR OF LOAnS6 InteRVentIOn (n=188) COntROL (n=79)
In intervention group and control group there’s a reduction of the percentage of people with delays in payments in naryn. In talas, the number of people with delays in payments remained unchanged in intervention group.
When comparing the percentage of respondents that paid off their loans, the intervention group has more borrowers that repaid their debts in talas than in naryn. Control group has more borrowers that repaid their debts in naryn than in talas.
FIGURe 5.1.5. “DO YOU hAVe ARReARS In LOAn RepAYMent?” nARYnInteRVentIOn (n=108) COntROL (n=45)
6. Analysis excludes answers of respondents that refused to answer a given question during the baseline survey
23
intervention control group1st survey 2nd survey 3rd survey % 1st survey 2nd survey 3rd survey %
5+ loans
1 no loan 10%
5+ loans
2 no loan 25%no loan 1 20% 2 2 25%
1 1 30% 2 3 25%2 1 20% 1 5 25%2 2 10% total n=4 100%5 5 10%
total n=10 100% figuRe 5.1.4. change in the nuMbeR of loans in boRRoweRs coMpaRed to the initial nuMbeR of loans6 inteRvention (n=188) contRol (n=79)
in intervention group and control group there’s a reduction of the percentage of people with delays in payments in naryn. in talas, the number of people with delays in payments remained unchanged in intervention group.
when comparing the percentage of respondents that paid off their loans, the intervention group has more borrowers that repaid their debts in talas than in naryn. control group has more borrowers that repaid their debts in naryn than in talas.
figuRe 5.1.5. “do you have aRReaRs in loan RepayMent?”. naRyninteRvention (n=108) contRol (n=45)
6. analysis excludes answers of respondents that refused to answer a given question during the baseline survey 23
intervention control group1st survey 2nd survey 3rd survey % 1st survey 2nd survey 3rd survey %
5+ loans
1 no loan 10%
5+ loans
2 no loan 25%no loan 1 20% 2 2 25%
1 1 30% 2 3 25%2 1 20% 1 5 25%2 2 10% total n=4 100%5 5 10%
total n=10 100% figuRe 5.1.4. change in the nuMbeR of loans in boRRoweRs coMpaRed to the initial nuMbeR of loans6 inteRvention (n=188) contRol (n=79)
in intervention group and control group there’s a reduction of the percentage of people with delays in payments in naryn. in talas, the number of people with delays in payments remained unchanged in intervention group.
when comparing the percentage of respondents that paid off their loans, the intervention group has more borrowers that repaid their debts in talas than in naryn. control group has more borrowers that repaid their debts in naryn than in talas.
figuRe 5.1.5. “do you have aRReaRs in loan RepayMent?”. naRyninteRvention (n=108) contRol (n=45)
6. analysis excludes answers of respondents that refused to answer a given question during the baseline survey 24
figuRe 5.1.6. “do you have aRReaRs in loan RepayMent?”. talasinteRvention (n=103) contRol (n=34)
one of the active causes of difficulties to repay debts is the payment to family income ratio. according to the results of baseline survey, borrowers with payments that are lower than a monthly income comprise 47% in intervention group and 63% in control group. thus, only a half of respondents can repay their debts depending on their income. by the time of final survey, about 40% of respondents from intervention and control groups have their loan payments either equal to or exceeding the aggregate family income. this percentage decreased in intervention group by 9% compared to the figure reported at the baseline survey. in control group the decrease is minor – 2%. the total decrease of the number of borrowers whose loan payments increase monthly income in intervention group is 12%, in control group – 3%.
figuRe 5.1.7. can you calculate youR loan and debt payMents and also youR household’s loan and debt payMents peR Month?inteRvention (n=211) contRol (n=79)
the number of respondents whose payments are significantly lower than the family’s monthly income reduced by the time of the 3rd survey compared to the baseline survey in intervention group and remained at the same level in control group.
Report on Main Results of the Survey on the Impact of Counseling on Knowledge, Feelings and Actions of Over-Indebted Borrowers, 2016
20
The number of respondents whose payments are significantly lower than the family’s monthly income reduced by the time of the 3rd survey compared to the baseline survey in intervention group and remained at the same level in control group.
FIGURE 5.1.8. “CAN YOU CALCULATE YOUR LOAN AND DEBT PAYMENTS AND YOUR HOUSEHOLD’S LOAN AND DEBT PAYMENTS PER MONTH?” INTERVENTION. N=211
FIGURE 5.1.9. “CAN YOU CALCULATE YOUR LOAN AND DEBT PAYMENTS AND YOUR HOUSEHOLD’S LOAN AND DEBT PAYMENTS PER MONTH?” CONTROL. N=89
Figure 5.1.10 shows respondents that repaid their loans by the time of final survey in terms of loan payments and incomes.About 50% of respondents of intervention group that repaid their loans, credits by the time of the 3rd survey said at the baseline that their loan payments were equal to or exceeding their income. In control group this percentage doesn’t exceed 30% of all respondents that repaid their debts. Thus, these borrowers found either alternative sources of income, or found ways to save on a budget.
Significantly lower than the family’s monthly income Slightly lower than the family’s monthly income Equal to the family’s monthly income Slightly exceeding the family’s monthly income Significantly exceeding the family’s monthly income
No loan
Refused to answer
Significantly lower than the family’s monthly income Slightly lower than the family’s monthly income
Equal to the family’s monthly income
Slightly exceeding the family’s monthly income
Significantly exceeding the family’s monthly income
No loan
Baseline Interim Final
Baseline Interim Final
24
figuRe 5.1.6. “do you have aRReaRs in loan RepayMent?”. talasinteRvention (n=103) contRol (n=34)
one of the active causes of difficulties to repay debts is the payment to family income ratio. according to the results of baseline survey, borrowers with payments that are lower than a monthly income comprise 47% in intervention group and 63% in control group. thus, only a half of respondents can repay their debts depending on their income. by the time of final survey, about 40% of respondents from intervention and control groups have their loan payments either equal to or exceeding the aggregate family income. this percentage decreased in intervention group by 9% compared to the figure reported at the baseline survey. in control group the decrease is minor – 2%. the total decrease of the number of borrowers whose loan payments increase monthly income in intervention group is 12%, in control group – 3%.
figuRe 5.1.7. can you calculate youR loan and debt payMents and also youR household’s loan and debt payMents peR Month?inteRvention (n=211) contRol (n=79)
the number of respondents whose payments are significantly lower than the family’s monthly income reduced by the time of the 3rd survey compared to the baseline survey in intervention group and remained at the same level in control group.
Report on Main Results of the Survey on the Impact of Counseling on Knowledge, Feelings and Actions of Over-Indebted Borrowers, 2016
20
The number of respondents whose payments are significantly lower than the family’s monthly income reduced by the time of the 3rd survey compared to the baseline survey in intervention group and remained at the same level in control group.
FIGURE 5.1.8. “CAN YOU CALCULATE YOUR LOAN AND DEBT PAYMENTS AND YOUR HOUSEHOLD’S LOAN AND DEBT PAYMENTS PER MONTH?” INTERVENTION. N=211
FIGURE 5.1.9. “CAN YOU CALCULATE YOUR LOAN AND DEBT PAYMENTS AND YOUR HOUSEHOLD’S LOAN AND DEBT PAYMENTS PER MONTH?” CONTROL. N=89
Figure 5.1.10 shows respondents that repaid their loans by the time of final survey in terms of loan payments and incomes.About 50% of respondents of intervention group that repaid their loans, credits by the time of the 3rd survey said at the baseline that their loan payments were equal to or exceeding their income. In control group this percentage doesn’t exceed 30% of all respondents that repaid their debts. Thus, these borrowers found either alternative sources of income, or found ways to save on a budget.
Significantly lower than the family’s monthly income Slightly lower than the family’s monthly income Equal to the family’s monthly income Slightly exceeding the family’s monthly income Significantly exceeding the family’s monthly income
No loan
Refused to answer
Significantly lower than the family’s monthly income Slightly lower than the family’s monthly income
Equal to the family’s monthly income
Slightly exceeding the family’s monthly income
Significantly exceeding the family’s monthly income
No loan
Baseline Interim Final
Baseline Interim Final
Report on Main Results of the Survey on the Impact of Counseling on Knowledge, Feelings and Actions of Over-Indebted Borrowers, 2016
20
The number of respondents whose payments are significantly lower than the family’s monthly income reduced by the time of the 3rd survey compared to the baseline survey in intervention group and remained at the same level in control group.
FIGURE 5.1.8. “CAN YOU CALCULATE YOUR LOAN AND DEBT PAYMENTS AND YOUR HOUSEHOLD’S LOAN AND DEBT PAYMENTS PER MONTH?” INTERVENTION. N=211
FIGURE 5.1.9. “CAN YOU CALCULATE YOUR LOAN AND DEBT PAYMENTS AND YOUR HOUSEHOLD’S LOAN AND DEBT PAYMENTS PER MONTH?” CONTROL. N=89
Figure 5.1.10 shows respondents that repaid their loans by the time of final survey in terms of loan payments and incomes.About 50% of respondents of intervention group that repaid their loans, credits by the time of the 3rd survey said at the baseline that their loan payments were equal to or exceeding their income. In control group this percentage doesn’t exceed 30% of all respondents that repaid their debts. Thus, these borrowers found either alternative sources of income, or found ways to save on a budget.
Significantly lower than the family’s monthly income Slightly lower than the family’s monthly income Equal to the family’s monthly income Slightly exceeding the family’s monthly income Significantly exceeding the family’s monthly income
No loan
Refused to answer
Significantly lower than the family’s monthly income Slightly lower than the family’s monthly income
Equal to the family’s monthly income
Slightly exceeding the family’s monthly income
Significantly exceeding the family’s monthly income
No loan
Baseline Interim Final
Baseline Interim Final

23
23
intervention control group1st survey 2nd survey 3rd survey % 1st survey 2nd survey 3rd survey %
5+ loans
1 no loan 10%
5+ loans
2 no loan 25%no loan 1 20% 2 2 25%
1 1 30% 2 3 25%2 1 20% 1 5 25%2 2 10% total n=4 100%5 5 10%
total n=10 100% figuRe 5.1.4. change in the nuMbeR of loans in boRRoweRs coMpaRed to the initial nuMbeR of loans6 inteRvention (n=188) contRol (n=79)
in intervention group and control group there’s a reduction of the percentage of people with delays in payments in naryn. in talas, the number of people with delays in payments remained unchanged in intervention group.
when comparing the percentage of respondents that paid off their loans, the intervention group has more borrowers that repaid their debts in talas than in naryn. control group has more borrowers that repaid their debts in naryn than in talas.
figuRe 5.1.5. “do you have aRReaRs in loan RepayMent?”. naRyninteRvention (n=108) contRol (n=45)
6. analysis excludes answers of respondents that refused to answer a given question during the baseline survey 23
intervention control group1st survey 2nd survey 3rd survey % 1st survey 2nd survey 3rd survey %
5+ loans
1 no loan 10%
5+ loans
2 no loan 25%no loan 1 20% 2 2 25%
1 1 30% 2 3 25%2 1 20% 1 5 25%2 2 10% total n=4 100%5 5 10%
total n=10 100% figuRe 5.1.4. change in the nuMbeR of loans in boRRoweRs coMpaRed to the initial nuMbeR of loans6 inteRvention (n=188) contRol (n=79)
in intervention group and control group there’s a reduction of the percentage of people with delays in payments in naryn. in talas, the number of people with delays in payments remained unchanged in intervention group.
when comparing the percentage of respondents that paid off their loans, the intervention group has more borrowers that repaid their debts in talas than in naryn. control group has more borrowers that repaid their debts in naryn than in talas.
figuRe 5.1.5. “do you have aRReaRs in loan RepayMent?”. naRyninteRvention (n=108) contRol (n=45)
6. analysis excludes answers of respondents that refused to answer a given question during the baseline survey
FIGURe 5.1.6. “DO YOU hAVe ARReARS In LOAn RepAYMent?” tALASInteRVentIOn (n=103) COntROL (n=34)
One of the active causes of diffi culties to repay debts is the payment to family income ratio. According to the results of baseline survey, borrowers with payments that are lower than a monthly income comprise 47% in intervention group and 63% in control group. thus, only a half of respondents can repay their debts depending on their income. By the time of fi nal survey, about 40% of respondents from intervention and control groups have their loan payments either equal to or exceeding the aggregate family income. this percentage decreased in intervention group by 9% compared to the fi gure reported at the baseline survey. In control group the decrease is minor – 2%. the total decrease of the number of borrowers whose loan payments increase monthly income in intervention group is 12%, in control group – 3%.
FIGURe 5.1.7. CAn YOU CALCULAte YOUR LOAn AnD DeBt pAYMentS AnD ALSO YOUR hOUSehOLD’S LOAn AnD DeBt pAYMentS peR MOnth?InteRVentIOn (n=211) COntROL (n=79)
the number of respondents whose payments are signifi cantly lower than the family’s monthly income reduced by the time of the 3rd survey compared to the baseline survey in intervention group and remained at the same level in control group.
24
figuRe 5.1.6. “do you have aRReaRs in loan RepayMent?”. talasinteRvention (n=103) contRol (n=34)
one of the active causes of difficulties to repay debts is the payment to family income ratio. according to the results of baseline survey, borrowers with payments that are lower than a monthly income comprise 47% in intervention group and 63% in control group. thus, only a half of respondents can repay their debts depending on their income. by the time of final survey, about 40% of respondents from intervention and control groups have their loan payments either equal to or exceeding the aggregate family income. this percentage decreased in intervention group by 9% compared to the figure reported at the baseline survey. in control group the decrease is minor – 2%. the total decrease of the number of borrowers whose loan payments increase monthly income in intervention group is 12%, in control group – 3%.
figuRe 5.1.7. can you calculate youR loan and debt payMents and also youR household’s loan and debt payMents peR Month?inteRvention (n=211) contRol (n=79)
the number of respondents whose payments are significantly lower than the family’s monthly income reduced by the time of the 3rd survey compared to the baseline survey in intervention group and remained at the same level in control group.
Report on Main Results of the Survey on the Impact of Counseling on Knowledge, Feelings and Actions of Over-Indebted Borrowers, 2016
20
The number of respondents whose payments are significantly lower than the family’s monthly income reduced by the time of the 3rd survey compared to the baseline survey in intervention group and remained at the same level in control group.
FIGURE 5.1.8. “CAN YOU CALCULATE YOUR LOAN AND DEBT PAYMENTS AND YOUR HOUSEHOLD’S LOAN AND DEBT PAYMENTS PER MONTH?” INTERVENTION. N=211
FIGURE 5.1.9. “CAN YOU CALCULATE YOUR LOAN AND DEBT PAYMENTS AND YOUR HOUSEHOLD’S LOAN AND DEBT PAYMENTS PER MONTH?” CONTROL. N=89
Figure 5.1.10 shows respondents that repaid their loans by the time of final survey in terms of loan payments and incomes.About 50% of respondents of intervention group that repaid their loans, credits by the time of the 3rd survey said at the baseline that their loan payments were equal to or exceeding their income. In control group this percentage doesn’t exceed 30% of all respondents that repaid their debts. Thus, these borrowers found either alternative sources of income, or found ways to save on a budget.
Significantly lower than the family’s monthly income Slightly lower than the family’s monthly income Equal to the family’s monthly income Slightly exceeding the family’s monthly income Significantly exceeding the family’s monthly income
No loan
Refused to answer
Significantly lower than the family’s monthly income Slightly lower than the family’s monthly income
Equal to the family’s monthly income
Slightly exceeding the family’s monthly income
Significantly exceeding the family’s monthly income
No loan
Baseline Interim Final
Baseline Interim Final
Report on Main Results of the Survey on the Impact of Counseling on Knowledge, Feelings and Actions of Over-Indebted Borrowers, 2016
20
The number of respondents whose payments are significantly lower than the family’s monthly income reduced by the time of the 3rd survey compared to the baseline survey in intervention group and remained at the same level in control group.
FIGURE 5.1.8. “CAN YOU CALCULATE YOUR LOAN AND DEBT PAYMENTS AND YOUR HOUSEHOLD’S LOAN AND DEBT PAYMENTS PER MONTH?” INTERVENTION. N=211
FIGURE 5.1.9. “CAN YOU CALCULATE YOUR LOAN AND DEBT PAYMENTS AND YOUR HOUSEHOLD’S LOAN AND DEBT PAYMENTS PER MONTH?” CONTROL. N=89
Figure 5.1.10 shows respondents that repaid their loans by the time of final survey in terms of loan payments and incomes.About 50% of respondents of intervention group that repaid their loans, credits by the time of the 3rd survey said at the baseline that their loan payments were equal to or exceeding their income. In control group this percentage doesn’t exceed 30% of all respondents that repaid their debts. Thus, these borrowers found either alternative sources of income, or found ways to save on a budget.
Significantly lower than the family’s monthly income Slightly lower than the family’s monthly income Equal to the family’s monthly income Slightly exceeding the family’s monthly income Significantly exceeding the family’s monthly income
No loan
Refused to answer
Significantly lower than the family’s monthly income Slightly lower than the family’s monthly income
Equal to the family’s monthly income
Slightly exceeding the family’s monthly income
Significantly exceeding the family’s monthly income
No loan
Baseline Interim Final
Baseline Interim Final

24
FIGURe 5.1.8. “CAn YOU CALCULAte YOUR LOAn AnD DeBt pAYMentS AnD YOUR hOUSehOLD’S LOAn AnD DeBt pAYMentS peR MOnth?” InteRVentIOn. n=211
FIGURe 5.1.9. “CAn YOU CALCULAte YOUR LOAn AnD DeBt pAYMentS AnD YOUR hOUSehOLD’S LOAn AnD DeBt pAYMentS peR MOnth?” COntROL. n=89
Figure 5.1.10 shows respondents that repaid their loans by the time of fi nal survey in terms of loan payments and incomes.
About 50% of respondents of intervention group that repaid their loans, credits by the time of the 3rd survey said at the baseline that their loan payments were equal to or exceeding their income. In control group this percentage doesn’t exceed 30% of all respondents that repaid their debts. thus, these borrowers found either alternative sources of income, or found ways to save on a budget.
Report on Main Results of the Survey on the Impact of Counseling on Knowledge, Feelings and Actions of Over-Indebted Borrowers, 2016
20
The number of respondents whose payments are significantly lower than the family’s monthly income reduced by the time of the 3rd survey compared to the baseline survey in intervention group and remained at the same level in control group.
FIGURE 5.1.8. “CAN YOU CALCULATE YOUR LOAN AND DEBT PAYMENTS AND YOUR HOUSEHOLD’S LOAN AND DEBT PAYMENTS PER MONTH?” INTERVENTION. N=211
FIGURE 5.1.9. “CAN YOU CALCULATE YOUR LOAN AND DEBT PAYMENTS AND YOUR HOUSEHOLD’S LOAN AND DEBT PAYMENTS PER MONTH?” CONTROL. N=89
Figure 5.1.10 shows respondents that repaid their loans by the time of final survey in terms of loan payments and incomes.About 50% of respondents of intervention group that repaid their loans, credits by the time of the 3rd survey said at the baseline that their loan payments were equal to or exceeding their income. In control group this percentage doesn’t exceed 30% of all respondents that repaid their debts. Thus, these borrowers found either alternative sources of income, or found ways to save on a budget.
Significantly lower than the family’s monthly income Slightly lower than the family’s monthly income Equal to the family’s monthly income Slightly exceeding the family’s monthly income Significantly exceeding the family’s monthly income
No loan
Refused to answer
Significantly lower than the family’s monthly income Slightly lower than the family’s monthly income
Equal to the family’s monthly income
Slightly exceeding the family’s monthly income
Significantly exceeding the family’s monthly income
No loan
Baseline Interim Final
Baseline Interim Final
26
figuRe 5.1.10. can you calculate youR loan and debt payMents and youR household’s loan and debt payMents peR Month?7 inteRvention (n=37) contRol (n=18)
figure 5.1.11shows the structure of respondents with delays in payments in terms of the loan payments and their incomes. it is important to note that in 45%-69% of respondents with delays in payments have payments lower than the family’s monthly income. thus, these respondents are capable of repaying the loans on time, yet they have other reasons for doing otherwise.
figuRe 5.1.11. can you calculate youR loan and debt payMents and you’Re youR household’s loan and debt payMents peR Month?8 inteRvention contRol
7. analysis of answers only by respondents that repaid loans by the time of final survey8. analysis of answers only by respondents that have delays in loan payments26
figuRe 5.1.10. can you calculate youR loan and debt payMents and youR household’s loan and debt payMents peR Month?7 inteRvention (n=37) contRol (n=18)
figure 5.1.11shows the structure of respondents with delays in payments in terms of the loan payments and their incomes. it is important to note that in 45%-69% of respondents with delays in payments have payments lower than the family’s monthly income. thus, these respondents are capable of repaying the loans on time, yet they have other reasons for doing otherwise.
figuRe 5.1.11. can you calculate youR loan and debt payMents and you’Re youR household’s loan and debt payMents peR Month?8 inteRvention contRol
7. analysis of answers only by respondents that repaid loans by the time of final survey8. analysis of answers only by respondents that have delays in loan payments

25
FIGURe 5.1.10. CAn YOU CALCULAte YOUR LOAn AnD DeBt pAYMentS AnD YOUR hOUSehOLD’S LOAn AnD DeBt pAYMentS peR MOnth?7 InteRVentIOn (n=37) COntROL (n=18)
Figure 5.1.11shows the structure of respondents with delays in payments in terms of the loan payments and their incomes. It is important to note that in 45%-69% of respondents with delays in payments have payments lower than the family’s monthly income. thus, these respondents are capable of repaying the loans on time, yet they have other reasons for doing otherwise.
FIGURe 5.1.11. CAn YOU CALCULAte YOUR LOAn AnD DeBt pAYMentS AnD YOU’Re YOUR hOUSehOLD’S LOAn AnD DeBt pAYMentS peR MOnth?8 InteRVentIOn COntROL
7. Analysis of answers only by respondents that repaid loans by the time of fi nal survey8. Analysis of answers only by respondents that have delays in loan payments26
figuRe 5.1.10. can you calculate youR loan and debt payMents and youR household’s loan and debt payMents peR Month?7 inteRvention (n=37) contRol (n=18)
figure 5.1.11shows the structure of respondents with delays in payments in terms of the loan payments and their incomes. it is important to note that in 45%-69% of respondents with delays in payments have payments lower than the family’s monthly income. thus, these respondents are capable of repaying the loans on time, yet they have other reasons for doing otherwise.
figuRe 5.1.11. can you calculate youR loan and debt payMents and you’Re youR household’s loan and debt payMents peR Month?8 inteRvention contRol
7. analysis of answers only by respondents that repaid loans by the time of final survey8. analysis of answers only by respondents that have delays in loan payments26
figuRe 5.1.10. can you calculate youR loan and debt payMents and youR household’s loan and debt payMents peR Month?7 inteRvention (n=37) contRol (n=18)
figure 5.1.11shows the structure of respondents with delays in payments in terms of the loan payments and their incomes. it is important to note that in 45%-69% of respondents with delays in payments have payments lower than the family’s monthly income. thus, these respondents are capable of repaying the loans on time, yet they have other reasons for doing otherwise.
figuRe 5.1.11. can you calculate youR loan and debt payMents and you’Re youR household’s loan and debt payMents peR Month?8 inteRvention contRol
7. analysis of answers only by respondents that repaid loans by the time of final survey8. analysis of answers only by respondents that have delays in loan payments

26
findingS Of chaptEr 5.1:
•Forsixmonthstherehasbeenageneraldecreaseinthepercentageofpeoplewithdebts.Thisoutcomehasbeenseenbothin intervention group and in control group. the decrease in the percentage of borrowers has been caused by the objective fact – the time between the surveys: e.g., people have paid back their short-terms loans because at the baseline survey they have repaid their loans almost in full.
•Analysisofchangesinthenumberofloansavailabletorespondentsshowedthat80%ofrespondentsfrominterventiongroupdidn’t increase the initial number of their loans. this number is lower in control group (78%).
•Thenumberofrespondentswithdelayshasalsodecreased.
• Thecomparisonofloanpaymentsandincomesofrespondentsshowedthatabout40%ofrespondentshadtomakeloanpayments equal to or exceeding the aggregate family income. If compared to the baseline survey, this percentage decreased in intervention group by 9%, in control group by 2%.
•Halfofrespondentsfrominterventiongroupthatrepaidtheirloansbythetimeofthe3rdsurveynotedatthebaselinesurveythat their payments were equal to or exceeded their income. thus, these borrowers found ways to pay back their loans despite the fact that their payments exceeded their incomes. In control group this percentage was below 30% of all respondents that paid back their loans.
• Notonly respondentswhosepaymentsexceedmonthly income,butalso respondentswith incomeexceeding their loanpayments have delays in loan, credit payments. thus, over 50% of borrowers had to make payments that were lower than their monthly income by the time of final survey.

27
5.2. evaluatIon oF ConsultatIonsDuring the survey, respondents were asked a series of questions intended to evaluate consultations, and the community fair. the results served to improve the quality of future consultations.
In the baseline survey, consultations were evaluated anonymously. Respondents fi lled out the evaluation questionnaire and put it into general evaluation boxes. Sometime after the fi rst evaluation of consultations respondents were asked to evaluate the same consultations once again (in 2nd and 3rd surveys). table 5.2.1 shows results of evaluation of consultations held at the community fair. the average score decreased as more time passed after consultations. however, the general score of the impact of consultations is rather high.
tABLe5.2.1. “pLeASe eVALUAte FROM “1” tO “5” the USeFULneSS OF thIS COnSULtAtIOn FOR YOU”
1st survey 2nd survey 3rd surveynaryn talas naryn talas naryn talas
1 0% 0% 2% 7% 4% 0%2 1% 0% 0% 5% 11% 0%3 2% 1% 21% 7% 21% 10%4 4% 8% 33% 26% 33% 72%5 93% 91% 44% 54% 31% 18%n 123 116 108 103 108 103
Average score
4,9 4,9 4,2 4,2 3,8 4,14,9 4,2 3,9
At every survey, respondents were asked:“What are your suggestions to improve consultations in the future?”
Below are the main answers of respondents. the majority of suggestions on improvement of consultations were the same in the three surveys.
nARYnpOSItIVe FeeDBACK:
Report on Main Results of the Survey on the Impact of Counseling on Knowledge, Feelings and Actions of Over-Indebted Borrowers, 2016
23
General words of gratitude such as “Thank you”, “It was useful” – about 60 people; Wish to have more similar consultations - 40 people:
We need to have more similar consultations; Visit us more often; You should broadcast such consultations via TV, other media sources, newspapers, radio; You should spread this information at the national level; Farmers need information about drop in prices, sales, seed prices; We need similar consultations at schools – grades 10-11; You should open offices in communities and provide similar consultations on a regular
basis; We need such consultations in rural areas; Many people that really need these consultations failed to receive them. We need more
consultations; We need consultations on other topics such as agriculture, upbringing of children, etc.
5.2. Evaluation of Consultations During the survey, respondents were asked a series of questions intended to evaluate consultations, and the community fair. The results served to improve the quality of future consultations. In the baseline survey, consultations were evaluated anonymously. Respondents filled out the evaluation questionnaire and put it into general evaluation boxes. Sometime after the first evaluation of consultations respondents were asked to evaluate the same consultations once again (in 2nd and 3rd surveys). Table 5.2.1 shows results of evaluation of consultations held at the community fair. The average score decreased as more time passed after consultations. However, the general score of the impact of consultations is rather high.
TABLE 5.2.1. “PLEASE EVALUATE FROM “1” TO “5” THE USEFULNESS OF THIS CONSULTATION FOR YOU”
1st survey 2nd survey 3rd survey
Naryn Talas Naryn Talas Naryn Talas 1 0% 0% 2% 7% 4% 0%
2 1% 0% 0% 5% 11% 0%
3 2% 1% 21% 7% 21% 10%
4 4% 8% 33% 26% 33% 72%
5 93% 91% 44% 54% 31% 18%
n 123 116 108 103 108 103
Average score
4.9 4.9 4.2 4.2 3.8 4.1 4.9 4.2 3.9
At every survey, respondents were asked: “What are your suggestions to improve consultations in the future?” Below are the main answers of respondents. The majority of suggestions on improvement of consultations were the same in the three surveys.
Naryn Positive feedback:

28
neGAtIVe FeeDBACK:
tALASpOSItIVe FeeDBACK:
neGAtIVe FeeDBACK:
Respondents evaluated consultations in terms of the usefulness of information on finance management and planning almost at the same level as the usefulness of consultations in general.
Report on Main Results of the Survey on the Impact of Counseling on Knowledge, Feelings and Actions of Over-Indebted Borrowers, 2016
24
I expected business consultations; We need visual information materials; We need educational materials; We need real help; Banks should control – if a person has a loan, banks shouldn’t extend second loan.
General words of gratitude such as “Thank you”, “It was useful” – about 401 people; Wish to have more similar consultations - 75 people:
We need such consultations in rural areas, villages – over 20 people; We need similar consultations on agriculture – how and at what price should we sell our
crops, agricultural forecasts, legal matters, business development, mortgages, etc.; You should spread this information via mass media (television, radio, newspapers); You need to open your office with consultants in Talas so that we could receive more
consultations; You should provide this information at schools.
We need subsidies; We need real help; We need lower interest rates; You should provide this information in a more understandable form.
Negative feedback
Talas Positive feedback:
Negative feedback:
Respondents evaluated consultations in terms of the usefulness of information on finance management and planning almost at the same level as the usefulness of consultations in general.
TABLE 5.2.2. “PLEASE EVALUATE HOW USEFUL WERE CONSULTATIONS FOR YOU IN TERMS OF INFORMATION ON FINANCE MANAGEMENT AND PLANNING”
1st survey 2nd survey 3rd survey
Naryn Talas Naryn Talas Naryn Talas 1 2% 0% 3% 6% 4% 0%
2 2% 0% 2% 5% 10% 1%
3 6% 0% 15% 8% 21% 9%
4 7% 25% 36% 23% 31% 68%
5 83% 75% 44% 44% 33% 22%
n 123 4 108 103 108 103
Average score
4.7 4.8 4.2 4.1 3.8 4.1 4.7 4.1 4.0
Below are main answers of respondents to the question: “Any suggestions to improve such consultations in future in terms of information on finance management and planning?” Summary of comments:

29
tABLe5.2.2. “pLeASe eVALUAte hOW USeFUL WeRe COnSULtAtIOnS FOR YOU In teRMS OF InFORMAtIOn On FInAnCe MAnAGeMent AnD pLAnnInG”
1st survey 2nd survey 3rd surveynaryn talas naryn talas naryn talas
1 2% 0% 3% 6% 4% 0%2 2% 0% 2% 5% 10% 1%3 6% 0% 15% 8% 21% 9%4 7% 25% 36% 23% 31% 68%5 83% 75% 44% 44% 33% 22%n 123 4 108 103 108 103
Average score
4,7 4,8 4,2 4,1 3,8 4,14,7 4,1 4,0
Below are main answers of respondents to the question: Any suggestions to improve such consultations in future in terms of information on fi nance management and planning?”
SUMMARY OF COMMentS:nARYn:
tALAS:
tABLe 5.2.3. GeneRAL eVALUAtIOn OF COnSULtAtIOnS DURInG COMMUnItY FAIR AnD OtheR DAYS
city consultant’s idconsultations
average scoren % of total number
naryn
1 30 4 4,82 30 4 4,73 63 9 4,94 68 10 55 53 8 4,96 62 9 5
total in naryn 306 45 4,9
Report on Main Results of the Survey on the Impact of Counseling on Knowledge, Feelings and Actions of Over-Indebted Borrowers, 2016
25
General words of gratitude such as “Thank you”, “It was useful” – 14 people; Wish to have more similar consultations - 18 people:
You need to open a permanent office so that we could have more consultations You should provide consultations throughout Kyrgyzstan You should teach people using these consultations via mass media – television etc.
General words of gratitude such as “Thank you”, “It was useful” – 7 people. Wish to have more similar consultations - 10 people.
Naryn:
Talas:
TABLE 5.2.3. GENERAL EVALUATION OF CONSULTATIONS DURING COMMUNITY FAIR AND OTHER
DAYS
City Consultant’s ID
Consultations Average
score N % of total number
Naryn
1 30 4 4.8 2 30 4 4.7 3 63 9 4.9 4 68 10 5 5 53 8 4.9 6 62 9 5
Total in Naryn 306 45 4.9
Talas
1 84 12 4.9 2 74 11 4.9 3 60 9 4.8 4 41 6 4.9 5 52 8 5 6 63 9 4.9
Total in Talas 374 55 4.9 TOTAL 680 100 4.9
TABLE 5.2.4. PLEASE EVALUATE FROM “1” TO “5” HOW MUCH YOU LIKED ORGANIZATION OF THE COMMUNITY FAIR (ENTERTAINMENT, FOOD, DANCE, ETC.)
City Consultant’s Consultations Average

30
talas
1 84 12 4,92 74 11 4,93 60 9 4,84 41 6 4,95 52 8 56 63 9 4,9
total in talas 374 55 4,9total 680 100 4,9
tABLe 5.2.4. pLeASe eVALUAte FROM “1” tO “5” hOW MUCh YOU LIKeD ORGAnIZAtIOn OF the COMMUnItY FAIR (enteRtAInMent, FOOD, DAnCe, etC.)
city consultant’s idconsultations
average scoren % of total number
naryn
1 16 7 4,82 12 5 4,83 25 10 4,64 24 10 4,75 20 8 4,46 26 11 3,4
total in naryn 123 51 4,4
talas
1 32 13 4,92 27 11 4,93 14 6 5,04 14 6 4,95 15 6 4,96 14 6 4,7
total in talas 116 49 4,9total 239 100 4,6
Below are main answers to the question: :“Any suggestions to improve event organization in the future?”
SUMMARY OF COMMentS:nARYn:
tALAS:
Report on Main Results of the Survey on the Impact of Counseling on Knowledge, Feelings and Actions of Over-Indebted Borrowers, 2016
26
The music was too loud - 5 people; The event should be advertised because many people didn’t know about the community
fair.
Generally, words of gratitude and wishes to have more consultations.
ID N % of total
number score
Naryn
1 16 7 4.8 2 12 5 4.8 3 25 10 4.6 4 24 10 4.7 5 20 8 4.4 6 26 11 3.4
Total in Naryn 123 51 4.4
Talas
1 32 13 4.9 2 27 11 4.9 3 14 6 5.0 4 14 6 4.9 5 15 6 4.9 6 14 6 4.7
Total in Talas 116 49 4.9 TOTAL 239 100 4.6
Below are main answers to the question: “Any suggestions to improve event organization in the future?” Summary of comments: Naryn:
Talas: Between the baseline and interim surveys, intervention group had additional consultations via telephone calls, SMS, personal meetings with consultants, self-help groups. Respondents were asked at the interim survey about the ways of additional consultations. The following inconsistencies have been identified when comparing the survey results and actual IFC data on the number of respondents that received any type of consultation:
1. During the 2nd survey, 71 of 126 respondents that received additional consultations said they received consultation only during the community fair.
2. 10 respondents said they received additional consultations, although, according to IFC, they never did.
This situation can be explained by the fact that some people, by the time of the second survey, may have forgotten they did receive such consultations; some respondents may have taken phone calls and SMS not as consultations since they didn’t exceed 5 minutes; telephone consultations may have been provided not to the borrower, but to his/her family members; respondents may have paid no attention to consultations via SMS, etc. Findings of chapter 5.2:

31
Between the baseline and interim surveys, intervention group had additional consultations via telephone calls, SMS, personal meetings with consultants, self-help groups.
Respondents were asked at the interim survey about the ways of additional consultations. the following inconsistencies have been identified when comparing the survey results and actual IFC data on the number of respondents that received any type of consultation:
1. During the 2nd survey, 71 of 126 respondents that received additional consultations said they received consultation only during the community fair.
2. 10 respondents said they received additional consultations, although, according to IFC, they never did.
this situation can be explained by the fact that some people, by the time of the second survey, mayhave forgotten they did receive such consultations; some respondents mayhave taken phone calls and SMS not as consultations since they didn’t exceed 5 minutes; telephone consultations may have been provided not to the borrower, but to his/her family members; respondents may have paid no attention to consultations via SMS, etc.
findingS Of chaptEr 5.2:
•Generally,borrowerstookconsultationspositively.Themajorityofrespondentsnotedthatconsultationswereveryusefulforthem and would like to receive similar consultations on a regular basis.
•Theaveragescoreofusefulnessofconsultationcarriedoutduringthecommunityfairamongrespondentsofinterventiongroup was very high (4.7 out of 5). however, the evaluation of consultations during 2nd and 3rd sureys tends to decline. this situation can be explained by the weakened effect of consultations over time.
•ConsultationsviaphonecallsandSMSarelesspopularamongrespondents.Morethanahalfofrespondentsthatreceivedsuch types of consultations for various reasons said they never received them.

32
5.3. KnowledGe:
5.3.1. financiaL LitEracy
Financial literacy is one of the most important factors of successful budget management and rational distribution of financial incomes and expenses.
this chapter analyzes the level of financial literacy about various issues on the way to receive a loan, and also the aggregate indicator of financial literacy.
to find out the level of financial literacy of respondents, a series of checking questions were asked in the questionnaire:
Only one answer was correct in each of two questions.
As table 5.3.1 shows,at the baseline survey only 61% of respondents from intervention group and 49% from control group managed to answer first question correctly. After consultations, intervention group shows the increase in this level by 14% at the 2nd survey, and then a minor decrease at the 3rd survey (-7%). this indicator behaves similarly in control group. the number of respondents that find it difficult to answer the first question in intervention group decreases with every new survey, whereas in control group it only increases.
there are no significant variations in answers between sex and age.
tABLe5.3.1. WhAt DO YOU thInK the teRM “pRInCIpAL” MeAn In A LOAn AGReeMent?
Intervention (n=211) Control (n=79)1st survey 2nd survey 3rd survey 1st survey 2nd survey 3rd survey
Loan amount 61% 75% 68% 49% 66% 47%Loan amount
plus interest on loan
6% 13% 18% 43% 28% 42%
Report on Main Results of the Survey on the Impact of Counseling on Knowledge, Feelings and Actions of Over-Indebted Borrowers, 2016
28
5.3.Knowledge: 5.3.1. Financial Literacy
Financial literacy is one of the most important factors of successful budget management and rational distribution of financial incomes and expenses.
This chapter analyzes the level of financial literacy about various issues on the way to receive a loan, and also the aggregate indicator of financial literacy.
To find out the level of financial literacy of respondents, a series of checking questions were asked in the questionnaire:
1. “What do you think the term “Principal” means in a loan agreement?”
2. “Is it necessary to do the following prior to signing the loan agreement:1) Read the loan payment schedule;2) Seek explanation from officers of credit institutions;3) Study the loan agreement thoroughly;4) Take more time to make a final decision;5) Read the terms and conditions of other microcredit institutions and choose the most
preferred one”.
3. “If you take a $1000 loan at 15 per cent annual interest, how much will you owe to the bank in 2 years?”
Only one answer was correct in each of two questions.
As Table 5.3.1 shows, at the baseline survey only 61% of respondents from intervention group and 49% from control group managed to answer first question correctly. After consultations, intervention group shows the increase in this level by 14% at the 2nd survey, and then a minor decrease at the 3rd survey (-7%). This indicator behaves similarly in control group. The number of respondents that find it difficult to answer the first question in intervention group decreases with every new survey, whereas in control group it only increases.
There are no significant variations in answers between sex and age.
TABLE 5.3.1. WHAT DO YOU THINK THE TERM “PRINCIPAL” MEAN IN A LOAN AGREEMENT?Intervention (N=211) Control (N=79)
1st survey 2nd survey 3rd survey 1st survey 2nd survey 3rd surveyLoan amount 61% 75% 68% 49% 66% 47%Loan amount plus interest on loan 6% 13% 18% 43% 28% 42%
Loan amount plus interest on loan plus any amount of loan fee
11% 3% 8% 8% 3% 5%
I don’t know 22% 9% 7% 0% 4% 6%

33
Loan amount plus interest on
loan plus any amount of loan
fee
11% 3% 8% 8% 3% 5%
I don’t know 22% 9% 7% 0% 4% 6%
If we look at the answers to the first question (table 5.3.2) in terms of cities, we will see that the number of respondents who clearly understand the meaning of the term “principal” in a loan agreement in talas is much higher than in naryn. If compared to the identical level of those who answered correctly the question at the baseline survey, the number of respondents who answered correctly is increasing faster at the 2nd survey (+22%) in talas than in naryn (+7%). In control group the percentage of respondents who answered correctly is more in talas (+16%) than in naryn (+9%). At the final survey, in intervention group this indicator keeps on increasing in talas, whereas in naryn it decreases. In control group, the percentage of respondents who answered the first question correctly decreases in two cities at the 3rd survey compared to the 2nd survey.
tABLe5.3.2. WhAt DO YOU thInK DOeS the teRM “pRInCIpAL” MeAn In A LOAn AGReeMent?
Intervention Control
naryn (n=108) talas (n=103) naryn (n=45) talas (n=34)
1st survey
Loan amount 61% 61% 38% 65%Loan amount plus interest
on loan 6% 7% 53% 29%
Loan amount plus interest on loan plus any amount
of loan fee12% 10% 9% 6%
I don’t know 21% 22% 0% 0%
2nd survey
Loan amount 69% 83% 47% 91%Loan amount plus interest
on loan 19% 7% 47% 3%
Loan amount plus interest on loan plus any amount
of loan fee5% 1% 4% 0%
I don’t know 8% 10% 2% 6%
3rd survey
Loan amount 47% 90% 29% 71%Loan amount plus interest
on loan 29% 6% 60% 18%
Loan amount plus interest on loan plus any amount
of loan fee13% 2% 9% 0%
I don’t know 11% 2% 2% 12%
In the second question, respondents should have checked all 5 answers as correct. In this question, respondents were divided into 3 groups:

34
1. high level; checked 4-5 choices;
2. Average level; checked 2-3 choices;
3. Low level; checked 1 or none choices.
In general, many respondents answered this question correctly. the results of baseline survey showed that 85% of respondents in intervention group and 75% of respondents in control group had this knowledge. After consultations, the percentage of respondents who answered correctly remained almost at the same level in intervention group. At the 2nd survey, this indicator in control group increased in talas and decreased in naryn. (table 5.3.3)
As the results of all three surveys showed, the percentage of correct answers to the 2nd question is higher in talas than in naryn, which is the evidence of a higher level of financial literacy in this city. there are no significant differences in the answers in terms of age, sex and income level.
tABLe5.3.3. UnDeRStAnDInG OF WhAt tO DO BeFORe SIGnInG A LOAn AGReeMent, SpLIt BY CItIeS
Intervention Controlnaryn
(n=108)talas
(n=103) total naryn (n=45)
talas (n=34) total
1st survey
high 80% 90% 85% 73% 77% 75%Average 6% 5% 5% 9% 12% 10%
Low 7% 5% 6% 18% 12% 15%I don’t know 7% 0% 4% 0% 0% 0%
2nd survey
high 83% 93% 88% 60% 82% 70%Average 12% 5% 9% 31% 15% 24%
Low 4% 2% 3% 9% 3% 6%I don’t know 1% 0% 1% 0% 0% 0%
3rd survey
high 79% 92% 85% 67% 94% 79%Average 16% 5% 10% 31% 6% 20%
Low 5% 3% 4% 2% 0% 1%I don’t know 1% 0% 1% 0% 0% 0%
It was also important to understand which conditions were deemed obligatory by the majority of respondents before signing a loan agreement. the following priority was determined after three surveys:
1 – Read the loan payment schedule;
2 – Seek explanation from officers of credit institutions;
3 – Compare terms and conditions in other credit institutions and choose the best ones;
4 – Read the loan agreement thoroughly.
It should be noted that the priority of conditions has not changed in all three surveys.
Depending on the selected answers to the third question, respondents were divided into 3 groups:
1. those who answered correctly (amount: $1150-$2000);
2. those who answered wrong (more or less than the correct amount);
3. those who found it difficult to answer.

35
Based on the results, we can see that the level of correct answers to this question kept growing in both groups at every survey. thus, the percentage of respondents in intervention group who answered correctly increased from 25% to 80%, whereas in control group this indicator also increased, but to a lesser extent – from 46% to 61%. (table 5.3.4)
tABLe 5.3.4. “IF YOU tAKe A $1000 LOAn At 15 peR Cent AnnUAL InteReSt, hOW MUCh WILL YOU OWe tO the BAnK In 2 YeARS?”
Intervention Control
1st surveyCorrect 25% 46%Wrong 12% 18%
I don’t know 63% 37%
2nd surveyCorrect 58% 49%Wrong 12% 19%
I don’t know 30% 32%
3rd surveyCorrect 79% 61%Wrong 3% 20%
I don’t know 19% 19%n 211 79
the rate of increase of the percentage of correct answers to the third question (table 5.3.5) is higher in talas than in naryn (in intervention group, the percentage of correct answered increased to +67% and +42%, respectively, at the final survey compared to the baseline survey). this trend is maintained in control group (+23% и +9%).
tABLe5.3.5. IF YOU tAKe A $1000 LOAn At 15 peR Cent AnnUAL InteReSt, hOW MUCh WILL YOU OWe tO the BAnK In 2 YeARS?
Intervention Control
naryn talas naryn talas
1st surveyCorrect 20% 29% 38% 56%Wrong 9% 16% 22% 12%
I don’t know 70% 55% 40% 32%
2nd surveyCorrect 49% 68% 42% 59%Wrong 17% 7% 13% 27%
I don’t know 34% 25% 44% 15%
3rd surveyCorrect 62% 96% 47% 79%Wrong 5% 1% 31% 6%
I don’t know 33% 3% 22% 15%n 108 103 45 34
Based on the above questions, an aggregate indicator of financial literacy was calculated. By results of answers to 3 questions about financial literacy, respondents were divided into 3 groups:
1. high level of financial literacy (answered correctly to 3 questions);
2. Average level of financial literacy (answered correctly to 2 questions);
3. Low level of financial literacy (answered wrong to all questions/answered correctly to one question).

36
the general level of financial literacy tends to grow throughout the whole survey period. In intervention group there is a more active growth than in control group. In intervention group at the 3rd survey the level of financial literacy increased by 52% as compared to the baseline survey, in control group – by 24% only.
tABLe5.3.6. LeVeL OF FInAnCIAL LIteRACY
Intervention Control
1st surveyhigh 26% 43%
Average 34% 37%Low 40% 20%
2nd surveyhigh 58% 49%
Average 14% 30%Low 28% 20%
3rd surveyhigh 78% 67%
Average 12% 20%Low 10% 13%
n 211 79
In general, respondents in talas had higher initial level of financial literacy and more significant increase of this indicator than respondents in naryn. thus, in intervention group the general level of financial literacy increased at the 3rd survey by 62% in talas and 43% in naryn as compared to the baseline survey. In control group, by 32% and 18%, respectively.
tABLe5.3.7. LeVeL OF FInAnCIAL LIteRACY
Intervention Control
naryn talas naryn talas
1st surveyhigh 21% 31% 38% 50%
Average 37% 30% 51% 18%Low 42% 39% 11% 32%
2nd surveyhigh 47% 69% 44% 56%
Average 20% 8% 44% 12%Low 32% 23% 11% 32%
3rd surveyhigh 64% 93% 56% 82%
Average 19% 5% 29% 9%Low 18% 2% 16% 9%
n 108 103 45 34

37
5.3.2. caLcuLatiOn Of incOmE and ExpEnSES
the ability to calculate own income and expenses is the integral part of budget planning. therefore, respondents were asked a series of questions about the level of their awareness of their monthly income, expenses, loan payments. the level of knowledge of their rights before a credit institution; relation between the payments and real situation; changes in the feelings of their income level have been evaluated, as well. these aspects allow to see how the respondents’ fi nancial behavior has changed.
According to the results of survey, more than a half of respondents cannot calculate their income or can calculate it with some certainty. In intervention group there is a decrease in the percentage of respondents who cannot calculate their income. At the fi nal survey, the percentage of respondents who couldn’t calculate their income decreased in intervention group (-6%), and remained the same in control group (3%) as compared to the baseline survey. About 40-50% of respondents were able to calculate their income with great certainty. In intervention group the percentage of people who could calculate their income with great certaintyat the 3rd survey increased by 4% compared to the baseline level. In control group this percentage increased a little more – by 6%. the percentage of respondents in intervention group who could calculate their income with great certainty increased at the 2nd survey as compared to the baseline survey, and then decreased at the 3rd survey as compared to the 2nd survey. this situation can refl ect the positive impact of consultations, which diminishes by the time of the 3rd survey.
FIGURe 5.3.1. “CAn YOU CALCULAte the InCOMe YOU AnD YOUR hOUSehOLD eXpeCt tO MAKe thIS MOnth?” InteRVentIOn. n=211
FIGURe 5.3.2. “CAn YOU CALCULAte the InCOMe YOU AnD YOUR hOUSehOLD eXpeCt tO MAKe thIS MOnth?” COntROL. n=89
the structure of answers to the question of the ability to calculate income varies for naryn and talas.
Report on Main Results of the Survey on the Impact of Counseling on Knowledge, Feelings and Actions of Over-Indebted Borrowers, 2016
33
5.3.2. Calculation of Income and Expenses
The ability to calculate own income and expenses is the integral part of budget planning. Therefore, respondents were asked a series of questions about the level of their awareness of their monthly income, expenses, loan payments. The level of knowledge of their rights before a credit institution; relation between the payments and real situation; changes in the feelings of their income level have been evaluated, as well. These aspects allow to see how the respondents’ financial behavior has changed.
According to the results of survey, more than a half of respondents cannot calculate their income or can calculate it with some certainty. In intervention group there is a decrease in the percentage of respondents who cannot calculate their income. At the final survey, the percentage of respondents who couldn’t calculate their income decreased in intervention group (-6%), and remained the same in control group (3%) as compared to the baseline survey. About 40-50% of respondents were able to calculate their income with great certainty. In intervention group the percentage of people who could calculate their income with great certainty at the 3rd survey increased by 4% compared to the baseline level. In control group this percentage increased a little more – by 6%. The percentage of respondents in intervention group who could calculate their income with great certainty increased at the 2nd survey as compared to the baseline survey, and then decreased at the 3rd survey as compared to the 2nd survey. This situation can reflect the positive impact of consultations, which diminishes by the time of the 3rd survey.
FIGURE 5.3.1. “CAN YOU CALCULATE THE INCOME YOU AND YOUR HOUSEHOLD EXPECT TO MAKE THIS MONTH?” INTERVENTION. N=211
FIGURE 5.3.2. “CAN YOU CALCULATE THE INCOME YOU AND YOUR HOUSEHOLD EXPECT TO MAKE THIS MONTH?” CONTROL. N=89
Yes, with great certainty
With some certainty
No
Yes, with great certainty
With some certainty
No
Baseline Interim Final
Baseline Interim Final

In intervention groupin talas the percentage of respondents who cannot calculate their income decreased by the time of the fi nal survey more (-11%) than in naryn (-3%). the changes in the percentage of respondents that can calculate their income with great certainty tend to decline in naryn and to grow in talas. thus, at the 3rd survey the percentage of respondents that can calculate their income with great certainty decreased in naryn by 6%, and increased in talas by 14% as compared to the baseline survey.
In control group the percentage of respondents that cannot calculate their income varied slightly at the fi nal survey compared to the baseline level. the percentage of respondents who can calculate their income with great certainty changed slightly (2%) in naryn and increased by 12% in talas.
FIGURe 5.3.3. “CAn YOU CALCULAte the InCOMe YOU AnD YOUR hOUSehOLD eXpeCt tO MAKe thIS MOnth?”. nARYnInteRVentIOn (n=108) COntROL (n=45)
FIGURe 5.3.4. “CAn YOU CALCULAte the InCOMe YOU AnD YOUR hOUSehOLD eXpeCt tO MAKe thIS MOnth?”. tALASInteRVentIOn (n=103) COntROL (n=34)
Analysis of answers to the question “Can you calculate the income you and your household expect to make this month?” showed there was no diff erence in terms of the level of fi nancial literacy. It means that many people (about 40%), even with a low level of fi nancial literacy, tend to think that they can calculate their income with great certainty.
the percentage of people who can calculate their expenses with great certainty increased both in intervention group (+4%) and in control group (+12%) at the 3rd survey as compared to the baseline level. the increase was more signifi cant in control group than in intervention group. Generally, the changes in the indicator showing the ability of respondents to calculate their expenses are similar to the changes in the income calculation indicator.
38 39
in intervention groupin talas the percentage of respondents who cannot calculate their income decreased by the time of the final survey more (-11%) than in naryn (-3%). the changes in the percentage of respondents that can calculate their income with great certainty tend to decline in naryn and to grow in talas. thus, at the 3rd survey the percentage of respondents that can calculate their income with great certainty decreased in naryn by 6%, and increased in talas by 14% as compared to the baseline survey.
in control group the percentage of respondents that cannot calculate their income varied slightly at the final survey compared to the baseline level. the percentage of respondents who can calculate their income with great certainty changed slightly (2%) in naryn and increased by 12% in talas.
figuRe 5.3.3. “can you calculate the incoMe you and youR household eXpect to MaKe this Month?”. naRyninteRvention (n=108) contRol (n=45)
figuRe 5.3.4. “can you calculate the incoMe you and youR household eXpect to MaKe this Month?”. talasinteRvention (n=103) contRol (n=34)
analysis of answers to the question “can you calculate the income you and your household expect to make this month?” showed there was no difference in terms of the level of financial literacy. it means that many people (about 40%), even with a low level of financial literacy, tend to think that they can calculate their income with great certainty.
the percentage of people who can calculate their expenses with great certainty increased both in intervention group (+4%) and in control group (+12%) at the 3rd survey as compared to the baseline level. the increase was more significant in control group than in intervention group. generally, the changes in the indicator showing the ability of respondents to calculate their expenses are similar to the changes in the income calculation indicator.
Report on Main Results of the Survey on the Impact of Counseling on Knowledge, Feelings and Actions of Over-Indebted Borrowers, 2016
33
5.3.2. Calculation of Income and Expenses
The ability to calculate own income and expenses is the integral part of budget planning. Therefore, respondents were asked a series of questions about the level of their awareness of their monthly income, expenses, loan payments. The level of knowledge of their rights before a credit institution; relation between the payments and real situation; changes in the feelings of their income level have been evaluated, as well. These aspects allow to see how the respondents’ financial behavior has changed.
According to the results of survey, more than a half of respondents cannot calculate their income or can calculate it with some certainty. In intervention group there is a decrease in the percentage of respondents who cannot calculate their income. At the final survey, the percentage of respondents who couldn’t calculate their income decreased in intervention group (-6%), and remained the same in control group (3%) as compared to the baseline survey. About 40-50% of respondents were able to calculate their income with great certainty. In intervention group the percentage of people who could calculate their income with great certainty at the 3rd survey increased by 4% compared to the baseline level. In control group this percentage increased a little more – by 6%. The percentage of respondents in intervention group who could calculate their income with great certainty increased at the 2nd survey as compared to the baseline survey, and then decreased at the 3rd survey as compared to the 2nd survey. This situation can reflect the positive impact of consultations, which diminishes by the time of the 3rd survey.
FIGURE 5.3.1. “CAN YOU CALCULATE THE INCOME YOU AND YOUR HOUSEHOLD EXPECT TO MAKE THIS MONTH?” INTERVENTION. N=211
FIGURE 5.3.2. “CAN YOU CALCULATE THE INCOME YOU AND YOUR HOUSEHOLD EXPECT TO MAKE THIS MONTH?” CONTROL. N=89
Yes, with great certainty
With some certainty
No
Yes, with great certainty
With some certainty
No
Baseline Interim Final
Baseline Interim Final
39
in intervention groupin talas the percentage of respondents who cannot calculate their income decreased by the time of the final survey more (-11%) than in naryn (-3%). the changes in the percentage of respondents that can calculate their income with great certainty tend to decline in naryn and to grow in talas. thus, at the 3rd survey the percentage of respondents that can calculate their income with great certainty decreased in naryn by 6%, and increased in talas by 14% as compared to the baseline survey.
in control group the percentage of respondents that cannot calculate their income varied slightly at the final survey compared to the baseline level. the percentage of respondents who can calculate their income with great certainty changed slightly (2%) in naryn and increased by 12% in talas.
figuRe 5.3.3. “can you calculate the incoMe you and youR household eXpect to MaKe this Month?”. naRyninteRvention (n=108) contRol (n=45)
figuRe 5.3.4. “can you calculate the incoMe you and youR household eXpect to MaKe this Month?”. talasinteRvention (n=103) contRol (n=34)
analysis of answers to the question “can you calculate the income you and your household expect to make this month?” showed there was no difference in terms of the level of financial literacy. it means that many people (about 40%), even with a low level of financial literacy, tend to think that they can calculate their income with great certainty.
the percentage of people who can calculate their expenses with great certainty increased both in intervention group (+4%) and in control group (+12%) at the 3rd survey as compared to the baseline level. the increase was more significant in control group than in intervention group. generally, the changes in the indicator showing the ability of respondents to calculate their expenses are similar to the changes in the income calculation indicator.
Report on Main Results of the Survey on the Impact of Counseling on Knowledge, Feelings and Actions of Over-Indebted Borrowers, 2016
33
5.3.2. Calculation of Income and Expenses
The ability to calculate own income and expenses is the integral part of budget planning. Therefore, respondents were asked a series of questions about the level of their awareness of their monthly income, expenses, loan payments. The level of knowledge of their rights before a credit institution; relation between the payments and real situation; changes in the feelings of their income level have been evaluated, as well. These aspects allow to see how the respondents’ financial behavior has changed.
According to the results of survey, more than a half of respondents cannot calculate their income or can calculate it with some certainty. In intervention group there is a decrease in the percentage of respondents who cannot calculate their income. At the final survey, the percentage of respondents who couldn’t calculate their income decreased in intervention group (-6%), and remained the same in control group (3%) as compared to the baseline survey. About 40-50% of respondents were able to calculate their income with great certainty. In intervention group the percentage of people who could calculate their income with great certainty at the 3rd survey increased by 4% compared to the baseline level. In control group this percentage increased a little more – by 6%. The percentage of respondents in intervention group who could calculate their income with great certainty increased at the 2nd survey as compared to the baseline survey, and then decreased at the 3rd survey as compared to the 2nd survey. This situation can reflect the positive impact of consultations, which diminishes by the time of the 3rd survey.
FIGURE 5.3.1. “CAN YOU CALCULATE THE INCOME YOU AND YOUR HOUSEHOLD EXPECT TO MAKE THIS MONTH?” INTERVENTION. N=211
FIGURE 5.3.2. “CAN YOU CALCULATE THE INCOME YOU AND YOUR HOUSEHOLD EXPECT TO MAKE THIS MONTH?” CONTROL. N=89
Yes, with great certainty
With some certainty
No
Yes, with great certainty
With some certainty
No
Baseline Interim Final
Baseline Interim Final
Report on Main Results of the Survey on the Impact of Counseling on Knowledge, Feelings and Actions of Over-Indebted Borrowers, 2016
33
5.3.2. Calculation of Income and Expenses
The ability to calculate own income and expenses is the integral part of budget planning. Therefore, respondents were asked a series of questions about the level of their awareness of their monthly income, expenses, loan payments. The level of knowledge of their rights before a credit institution; relation between the payments and real situation; changes in the feelings of their income level have been evaluated, as well. These aspects allow to see how the respondents’ financial behavior has changed.
According to the results of survey, more than a half of respondents cannot calculate their income or can calculate it with some certainty. In intervention group there is a decrease in the percentage of respondents who cannot calculate their income. At the final survey, the percentage of respondents who couldn’t calculate their income decreased in intervention group (-6%), and remained the same in control group (3%) as compared to the baseline survey. About 40-50% of respondents were able to calculate their income with great certainty. In intervention group the percentage of people who could calculate their income with great certainty at the 3rd survey increased by 4% compared to the baseline level. In control group this percentage increased a little more – by 6%. The percentage of respondents in intervention group who could calculate their income with great certainty increased at the 2nd survey as compared to the baseline survey, and then decreased at the 3rd survey as compared to the 2nd survey. This situation can reflect the positive impact of consultations, which diminishes by the time of the 3rd survey.
FIGURE 5.3.1. “CAN YOU CALCULATE THE INCOME YOU AND YOUR HOUSEHOLD EXPECT TO MAKE THIS MONTH?” INTERVENTION. N=211
FIGURE 5.3.2. “CAN YOU CALCULATE THE INCOME YOU AND YOUR HOUSEHOLD EXPECT TO MAKE THIS MONTH?” CONTROL. N=89
Yes, with great certainty
With some certainty
No
Yes, with great certainty
With some certainty
No
Baseline Interim Final
Baseline Interim Final

39
FIGURe 5.3.5. “CAn YOU CALCULAte the eXpenSeS YOU AnD YOUR hOUSehOLD eXpeCt tO pAY OUt thIS MOnth?” InteRVentIOn. n=211
FIGURe 5.3.6. “CAn YOU CALCULAte the eXpenSeS YOU AnD YOUR hOUSehOLD eXpeCt tO pAY OUt thIS MOnth?” COntROL. n=79
the changes in the structure of answers to the question of the ability to calculate expenses diff er for naryn and talas and are similar to the changes in the structure of answers to the question about the ability to calculate income.
In intervention group, according to the results of fi nal survey, the percentage of respondents that cannot calculate their expenses remained at the same level in naryn as before consultations, and decreased in talas (-13%). the percentage of respondents who can calculate their expenses with great certainty tends to decline in naryn and to grow in talas. thus, at the 3rd survey the percentage of respondents who can calculate their expenses with great certainty declined by 3% in naryn and increased by 13% in talas as compared to the baseline level.
In control groupat the fi nal survey the percentage of respondents who can calculate expenses remained unchanged in naryn, just like in intervention group, and declined by 6% in talas as compared to the baseline survey. the percentage of people who can calculate their expenses with great certainty slightly changed in naryn (2%) and increased by 32% in talas.
Report on Main Results of the Survey on the Impact of Counseling on Knowledge, Feelings and Actions of Over-Indebted Borrowers, 2016
35
FIGURE 5.3.5. “CAN YOU CALCULATE THE EXPENSES YOU AND YOUR HOUSEHOLD EXPECT TO PAY OUT THIS MONTH?” INTERVENTION. N=211
FIGURE 5.3.6. “CAN YOU CALCULATE THE EXPENSES YOU AND YOUR HOUSEHOLD EXPECT TO PAY OUT THIS MONTH?” CONTROL. N=79
The changes in the structure of answers to the question of the ability to calculate expenses differ for Naryn and Talas and are similar to the changes in the structure of answers to the question about the ability to calculate income.In intervention group, according to the results of final survey, the percentage of respondents that cannot calculate their expenses remained at the same level in Naryn as before consultations, and decreased in Talas (-13%). The percentage of respondents who can calculate their expenses with great certainty tends to decline in Naryn and to grow in Talas. Thus, at the 3rd survey the percentage of respondents who can calculate their expenses with great certainty declined by 3% in Naryn and increased by 13% in Talas as compared to the baseline level.In control group at the final survey the percentage of respondents who can calculate expenses remained unchanged in Naryn, just like in intervention group, and declined by 6% in Talas as compared to the baseline survey. The percentage of people who can calculate their expenses with great certainty slightly changed in Naryn (2%) and increased by 32% in Talas.
Yes, with great certainty
With some certainty
No
Yes, with great certainty
With some certainty
No
Baseline Interim Final
Baseline Interim Final
39
in intervention groupin talas the percentage of respondents who cannot calculate their income decreased by the time of the final survey more (-11%) than in naryn (-3%). the changes in the percentage of respondents that can calculate their income with great certainty tend to decline in naryn and to grow in talas. thus, at the 3rd survey the percentage of respondents that can calculate their income with great certainty decreased in naryn by 6%, and increased in talas by 14% as compared to the baseline survey.
in control group the percentage of respondents that cannot calculate their income varied slightly at the final survey compared to the baseline level. the percentage of respondents who can calculate their income with great certainty changed slightly (2%) in naryn and increased by 12% in talas.
figuRe 5.3.3. “can you calculate the incoMe you and youR household eXpect to MaKe this Month?”. naRyninteRvention (n=108) contRol (n=45)
figuRe 5.3.4. “can you calculate the incoMe you and youR household eXpect to MaKe this Month?”. talasinteRvention (n=103) contRol (n=34)
analysis of answers to the question “can you calculate the income you and your household expect to make this month?” showed there was no difference in terms of the level of financial literacy. it means that many people (about 40%), even with a low level of financial literacy, tend to think that they can calculate their income with great certainty.
the percentage of people who can calculate their expenses with great certainty increased both in intervention group (+4%) and in control group (+12%) at the 3rd survey as compared to the baseline level. the increase was more significant in control group than in intervention group. generally, the changes in the indicator showing the ability of respondents to calculate their expenses are similar to the changes in the income calculation indicator.
Report on Main Results of the Survey on the Impact of Counseling on Knowledge, Feelings and Actions of Over-Indebted Borrowers, 2016
33
5.3.2. Calculation of Income and Expenses
The ability to calculate own income and expenses is the integral part of budget planning. Therefore, respondents were asked a series of questions about the level of their awareness of their monthly income, expenses, loan payments. The level of knowledge of their rights before a credit institution; relation between the payments and real situation; changes in the feelings of their income level have been evaluated, as well. These aspects allow to see how the respondents’ financial behavior has changed.
According to the results of survey, more than a half of respondents cannot calculate their income or can calculate it with some certainty. In intervention group there is a decrease in the percentage of respondents who cannot calculate their income. At the final survey, the percentage of respondents who couldn’t calculate their income decreased in intervention group (-6%), and remained the same in control group (3%) as compared to the baseline survey. About 40-50% of respondents were able to calculate their income with great certainty. In intervention group the percentage of people who could calculate their income with great certainty at the 3rd survey increased by 4% compared to the baseline level. In control group this percentage increased a little more – by 6%. The percentage of respondents in intervention group who could calculate their income with great certainty increased at the 2nd survey as compared to the baseline survey, and then decreased at the 3rd survey as compared to the 2nd survey. This situation can reflect the positive impact of consultations, which diminishes by the time of the 3rd survey.
FIGURE 5.3.1. “CAN YOU CALCULATE THE INCOME YOU AND YOUR HOUSEHOLD EXPECT TO MAKE THIS MONTH?” INTERVENTION. N=211
FIGURE 5.3.2. “CAN YOU CALCULATE THE INCOME YOU AND YOUR HOUSEHOLD EXPECT TO MAKE THIS MONTH?” CONTROL. N=89
Yes, with great certainty
With some certainty
No
Yes, with great certainty
With some certainty
No
Baseline Interim Final
Baseline Interim Final
Report on Main Results of the Survey on the Impact of Counseling on Knowledge, Feelings and Actions of Over-Indebted Borrowers, 2016
33
5.3.2. Calculation of Income and Expenses
The ability to calculate own income and expenses is the integral part of budget planning. Therefore, respondents were asked a series of questions about the level of their awareness of their monthly income, expenses, loan payments. The level of knowledge of their rights before a credit institution; relation between the payments and real situation; changes in the feelings of their income level have been evaluated, as well. These aspects allow to see how the respondents’ financial behavior has changed.
According to the results of survey, more than a half of respondents cannot calculate their income or can calculate it with some certainty. In intervention group there is a decrease in the percentage of respondents who cannot calculate their income. At the final survey, the percentage of respondents who couldn’t calculate their income decreased in intervention group (-6%), and remained the same in control group (3%) as compared to the baseline survey. About 40-50% of respondents were able to calculate their income with great certainty. In intervention group the percentage of people who could calculate their income with great certainty at the 3rd survey increased by 4% compared to the baseline level. In control group this percentage increased a little more – by 6%. The percentage of respondents in intervention group who could calculate their income with great certainty increased at the 2nd survey as compared to the baseline survey, and then decreased at the 3rd survey as compared to the 2nd survey. This situation can reflect the positive impact of consultations, which diminishes by the time of the 3rd survey.
FIGURE 5.3.1. “CAN YOU CALCULATE THE INCOME YOU AND YOUR HOUSEHOLD EXPECT TO MAKE THIS MONTH?” INTERVENTION. N=211
FIGURE 5.3.2. “CAN YOU CALCULATE THE INCOME YOU AND YOUR HOUSEHOLD EXPECT TO MAKE THIS MONTH?” CONTROL. N=89
Yes, with great certainty
With some certainty
No
Yes, with great certainty
With some certainty
No
Baseline Interim Final
Baseline Interim Final

40
FIGURe 5.3.7. “CAn YOU CALCULAte the eXpenSeS YOU AnD YOUR hOUSehOLD eXpeCt tO pAY OUt thIS MOnth?”. nARYnInteRVentIOn (n=108) COntROL (n=45)
FIGURe 5.3.8. “CAn YOU CALCULAte the eXpenSeS YOU AnD YOUR hOUSehOLD eXpeCt tO pAY OUt thIS MOnth?”. tALASInteRVentIOn (n=103) COntROL (n=34)
there are diff erences in answers to the question about the ability to calculate expenses depending on the level of fi nancial literacy. thus, in intervention group at the baseline survey the percentage of respondents with low level of fi nancial literacy who could calculate their expenses with great certainty was higher than in other levels of fi nancial literacy.
At the 3rd survey the percentage of respondents with low level of fi nancial literacy who could calculate their expenses with great certainty declined in intervention group (-17%) as compared to the baseline survey and increased in control group (+25%). Among respondents with high level of fi nancial literacy this percentage increased both in intervention group (+19%) and in control group (14%).
tABLe 5.3.8. CAn YOU CALCULAte the eXpenSeS YOU AnD YOUR hOUSehOLD eXpeCt tO pAY OUt thIS MOnth? SpLIt BY the LeVeLS OF FInAnCIAL LIteRACY
Intervention Control
Levels of fi nancial literacy Levels of fi nancial literacyhigh average low high average low
1st survey
yes, with great
certainty22% 31% 41% 24% 45% 25%
with some certainty 65% 38% 47% 76% 52% 56%
no 13% 31% 12% 0% 3% 19%n 55 71 85 34 29 16
41
figuRe 5.3.7. “can you calculate the eXpenses you and youR household eXpect to pay out this Month?”. naRyninteRvention (n=108) contRol (n=45)
figuRe 5.3.8. “can you calculate the eXpenses you and youR household eXpect to pay out this Month?”. talasinteRvention (n=103) contRol (n=34)
there are differences in answers to the question about the ability to calculate expenses depending on the level of financial literacy. thus, in intervention group at the baseline survey the percentage of respondents with low level of financial literacy who could calculate their expenses with great certainty was higher than in other levels of financial literacy.
at the 3rd survey the percentage of respondents with low level of financial literacy who could calculate their expenses with great certainty declined in intervention group (-17%) as compared to the baseline survey and increased in control group (+25%). among respondents with high level of financial literacy this percentage increased both in intervention group (+19%) and in control group (14%).
table 5.3.8. can you calculate the eXpenses you and youR household eXpect to pay out this Month?split by the levels of financial liteRacy
intervention control
levels of financial literacy levels of financial literacyhigh average low high average low
1st survey
yes, with great
certainty22% 31% 41% 24% 45% 25%
with some certainty 65% 38% 47% 76% 52% 56%
no 13% 31% 12% 0% 3% 19%n 55 71 85 34 29 16
Report on Main Results of the Survey on the Impact of Counseling on Knowledge, Feelings and Actions of Over-Indebted Borrowers, 2016
35
FIGURE 5.3.5. “CAN YOU CALCULATE THE EXPENSES YOU AND YOUR HOUSEHOLD EXPECT TO PAY OUT THIS MONTH?” INTERVENTION. N=211
FIGURE 5.3.6. “CAN YOU CALCULATE THE EXPENSES YOU AND YOUR HOUSEHOLD EXPECT TO PAY OUT THIS MONTH?” CONTROL. N=79
The changes in the structure of answers to the question of the ability to calculate expenses differ for Naryn and Talas and are similar to the changes in the structure of answers to the question about the ability to calculate income.In intervention group, according to the results of final survey, the percentage of respondents that cannot calculate their expenses remained at the same level in Naryn as before consultations, and decreased in Talas (-13%). The percentage of respondents who can calculate their expenses with great certainty tends to decline in Naryn and to grow in Talas. Thus, at the 3rd survey the percentage of respondents who can calculate their expenses with great certainty declined by 3% in Naryn and increased by 13% in Talas as compared to the baseline level.In control group at the final survey the percentage of respondents who can calculate expenses remained unchanged in Naryn, just like in intervention group, and declined by 6% in Talas as compared to the baseline survey. The percentage of people who can calculate their expenses with great certainty slightly changed in Naryn (2%) and increased by 32% in Talas.
Yes, with great certainty
With some certainty
No
Yes, with great certainty
With some certainty
No
Baseline Interim Final
Baseline Interim Final
42
2nd survey
yes, with great
certainty41% 30% 25% 36% 42% 25%
with some certainty 52% 57% 63% 64% 46% 63%
no 7% 13% 12% 0% 13% 13%n 122 30 59 39 24 16
3rd survey
yes, with great
certainty41% 24% 24% 38% 63% 50%
with some certainty 52% 40% 52% 60% 31% 50%
no 7% 36% 24% 2% 6% 0%n 165 25 21 53 16 10
figure 5.3.9 shows that more than a half of respondents can calculate their income and expenses with the same level of certainty. the percentage of respondents who can calculate their income better than expenses is higher than the percentage of respondents who can calculate their expenses better than income.
figuRe 5.3.9. coMpaRisonofceRtaintyof calculation of incoMe and eXpensesinteRvention (n=211) contRol (n=79)
at the 2nd survey the percentage of respondents who know their payments on personal loans with great certainty increased as compared to the baseline survey by 6% in intervention group and declined by 8% in control group. at the 3rd survey this percentage declined in both groups. this decline occurred due to the increased percentage of borrowers that repaid their loans. the increase in the percentage of respondents who know their payments on loans, debts with great certainty in intervention group at the 2nd survey, and the decline of the percentage at the 3rd survey as compared to the 2nd survey can reflect the positive impact of consultations, which declined with time.

41 41
figuRe 5.3.7. “can you calculate the eXpenses you and youR household eXpect to pay out this Month?”. naRyninteRvention (n=108) contRol (n=45)
figuRe 5.3.8. “can you calculate the eXpenses you and youR household eXpect to pay out this Month?”. talasinteRvention (n=103) contRol (n=34)
there are differences in answers to the question about the ability to calculate expenses depending on the level of financial literacy. thus, in intervention group at the baseline survey the percentage of respondents with low level of financial literacy who could calculate their expenses with great certainty was higher than in other levels of financial literacy.
at the 3rd survey the percentage of respondents with low level of financial literacy who could calculate their expenses with great certainty declined in intervention group (-17%) as compared to the baseline survey and increased in control group (+25%). among respondents with high level of financial literacy this percentage increased both in intervention group (+19%) and in control group (14%).
table 5.3.8. can you calculate the eXpenses you and youR household eXpect to pay out this Month?split by the levels of financial liteRacy
intervention control
levels of financial literacy levels of financial literacyhigh average low high average low
1st survey
yes, with great
certainty22% 31% 41% 24% 45% 25%
with some certainty 65% 38% 47% 76% 52% 56%
no 13% 31% 12% 0% 3% 19%n 55 71 85 34 29 16
Report on Main Results of the Survey on the Impact of Counseling on Knowledge, Feelings and Actions of Over-Indebted Borrowers, 2016
35
FIGURE 5.3.5. “CAN YOU CALCULATE THE EXPENSES YOU AND YOUR HOUSEHOLD EXPECT TO PAY OUT THIS MONTH?” INTERVENTION. N=211
FIGURE 5.3.6. “CAN YOU CALCULATE THE EXPENSES YOU AND YOUR HOUSEHOLD EXPECT TO PAY OUT THIS MONTH?” CONTROL. N=79
The changes in the structure of answers to the question of the ability to calculate expenses differ for Naryn and Talas and are similar to the changes in the structure of answers to the question about the ability to calculate income.In intervention group, according to the results of final survey, the percentage of respondents that cannot calculate their expenses remained at the same level in Naryn as before consultations, and decreased in Talas (-13%). The percentage of respondents who can calculate their expenses with great certainty tends to decline in Naryn and to grow in Talas. Thus, at the 3rd survey the percentage of respondents who can calculate their expenses with great certainty declined by 3% in Naryn and increased by 13% in Talas as compared to the baseline level.In control group at the final survey the percentage of respondents who can calculate expenses remained unchanged in Naryn, just like in intervention group, and declined by 6% in Talas as compared to the baseline survey. The percentage of people who can calculate their expenses with great certainty slightly changed in Naryn (2%) and increased by 32% in Talas.
Yes, with great certainty
With some certainty
No
Yes, with great certainty
With some certainty
No
Baseline Interim Final
Baseline Interim Final
Report on Main Results of the Survey on the Impact of Counseling on Knowledge, Feelings and Actions of Over-Indebted Borrowers, 2016
35
FIGURE 5.3.5. “CAN YOU CALCULATE THE EXPENSES YOU AND YOUR HOUSEHOLD EXPECT TO PAY OUT THIS MONTH?” INTERVENTION. N=211
FIGURE 5.3.6. “CAN YOU CALCULATE THE EXPENSES YOU AND YOUR HOUSEHOLD EXPECT TO PAY OUT THIS MONTH?” CONTROL. N=79
The changes in the structure of answers to the question of the ability to calculate expenses differ for Naryn and Talas and are similar to the changes in the structure of answers to the question about the ability to calculate income.In intervention group, according to the results of final survey, the percentage of respondents that cannot calculate their expenses remained at the same level in Naryn as before consultations, and decreased in Talas (-13%). The percentage of respondents who can calculate their expenses with great certainty tends to decline in Naryn and to grow in Talas. Thus, at the 3rd survey the percentage of respondents who can calculate their expenses with great certainty declined by 3% in Naryn and increased by 13% in Talas as compared to the baseline level.In control group at the final survey the percentage of respondents who can calculate expenses remained unchanged in Naryn, just like in intervention group, and declined by 6% in Talas as compared to the baseline survey. The percentage of people who can calculate their expenses with great certainty slightly changed in Naryn (2%) and increased by 32% in Talas.
Yes, with great certainty
With some certainty
No
Yes, with great certainty
With some certainty
No
Baseline Interim Final
Baseline Interim Final
41
figuRe 5.3.7. “can you calculate the eXpenses you and youR household eXpect to pay out this Month?”. naRyninteRvention (n=108) contRol (n=45)
figuRe 5.3.8. “can you calculate the eXpenses you and youR household eXpect to pay out this Month?”. talasinteRvention (n=103) contRol (n=34)
there are differences in answers to the question about the ability to calculate expenses depending on the level of financial literacy. thus, in intervention group at the baseline survey the percentage of respondents with low level of financial literacy who could calculate their expenses with great certainty was higher than in other levels of financial literacy.
at the 3rd survey the percentage of respondents with low level of financial literacy who could calculate their expenses with great certainty declined in intervention group (-17%) as compared to the baseline survey and increased in control group (+25%). among respondents with high level of financial literacy this percentage increased both in intervention group (+19%) and in control group (14%).
table 5.3.8. can you calculate the eXpenses you and youR household eXpect to pay out this Month?split by the levels of financial liteRacy
intervention control
levels of financial literacy levels of financial literacyhigh average low high average low
1st survey
yes, with great
certainty22% 31% 41% 24% 45% 25%
with some certainty 65% 38% 47% 76% 52% 56%
no 13% 31% 12% 0% 3% 19%n 55 71 85 34 29 16
Report on Main Results of the Survey on the Impact of Counseling on Knowledge, Feelings and Actions of Over-Indebted Borrowers, 2016
35
FIGURE 5.3.5. “CAN YOU CALCULATE THE EXPENSES YOU AND YOUR HOUSEHOLD EXPECT TO PAY OUT THIS MONTH?” INTERVENTION. N=211
FIGURE 5.3.6. “CAN YOU CALCULATE THE EXPENSES YOU AND YOUR HOUSEHOLD EXPECT TO PAY OUT THIS MONTH?” CONTROL. N=79
The changes in the structure of answers to the question of the ability to calculate expenses differ for Naryn and Talas and are similar to the changes in the structure of answers to the question about the ability to calculate income.In intervention group, according to the results of final survey, the percentage of respondents that cannot calculate their expenses remained at the same level in Naryn as before consultations, and decreased in Talas (-13%). The percentage of respondents who can calculate their expenses with great certainty tends to decline in Naryn and to grow in Talas. Thus, at the 3rd survey the percentage of respondents who can calculate their expenses with great certainty declined by 3% in Naryn and increased by 13% in Talas as compared to the baseline level.In control group at the final survey the percentage of respondents who can calculate expenses remained unchanged in Naryn, just like in intervention group, and declined by 6% in Talas as compared to the baseline survey. The percentage of people who can calculate their expenses with great certainty slightly changed in Naryn (2%) and increased by 32% in Talas.
Yes, with great certainty
With some certainty
No
Yes, with great certainty
With some certainty
No
Baseline Interim Final
Baseline Interim Final
Report on Main Results of the Survey on the Impact of Counseling on Knowledge, Feelings and Actions of Over-Indebted Borrowers, 2016
35
FIGURE 5.3.5. “CAN YOU CALCULATE THE EXPENSES YOU AND YOUR HOUSEHOLD EXPECT TO PAY OUT THIS MONTH?” INTERVENTION. N=211
FIGURE 5.3.6. “CAN YOU CALCULATE THE EXPENSES YOU AND YOUR HOUSEHOLD EXPECT TO PAY OUT THIS MONTH?” CONTROL. N=79
The changes in the structure of answers to the question of the ability to calculate expenses differ for Naryn and Talas and are similar to the changes in the structure of answers to the question about the ability to calculate income.In intervention group, according to the results of final survey, the percentage of respondents that cannot calculate their expenses remained at the same level in Naryn as before consultations, and decreased in Talas (-13%). The percentage of respondents who can calculate their expenses with great certainty tends to decline in Naryn and to grow in Talas. Thus, at the 3rd survey the percentage of respondents who can calculate their expenses with great certainty declined by 3% in Naryn and increased by 13% in Talas as compared to the baseline level.In control group at the final survey the percentage of respondents who can calculate expenses remained unchanged in Naryn, just like in intervention group, and declined by 6% in Talas as compared to the baseline survey. The percentage of people who can calculate their expenses with great certainty slightly changed in Naryn (2%) and increased by 32% in Talas.
Yes, with great certainty
With some certainty
No
Yes, with great certainty
With some certainty
No
Baseline Interim Final
Baseline Interim Final
2nd survey
yes, with great
certainty41% 30% 25% 36% 42% 25%
with some certainty 52% 57% 63% 64% 46% 63%
no 7% 13% 12% 0% 13% 13%n 122 30 59 39 24 16
3rd survey
yes, with great
certainty41% 24% 24% 38% 63% 50%
with some certainty 52% 40% 52% 60% 31% 50%
no 7% 36% 24% 2% 6% 0%n 165 25 21 53 16 10
Figure 5.3.9 shows that more than a half of respondents can calculate their income and expenses with the same level of certainty. the percentage of respondents who can calculate their income better than expenses is higher than the percentage of respondents who can calculate their expenses better than income.
FIGURe 5.3.9. COMpARISOn OF CeRtAIntY OF CALCULAtIOn OF InCOMe AnD eXpenSeSInteRVentIOn (n=211) COntROL (n=79)
At the 2nd survey the percentage of respondents who know their payments on personal loans with great certainty increased as compared to the baseline survey by 6% in intervention group and declined by 8% in control group. At the 3rd survey this percentage declined in both groups. this decline occurred due to the increased percentage of borrowers that repaid their loans. the increase in the percentage of respondents who know their payments on loans, debts with great certainty in intervention group at the 2nd survey, and the decline of the percentage at the 3rd survey as compared to the 2nd survey can refl ect the positive impact of consultations, which declined with time.
42
2nd survey
yes, with great
certainty41% 30% 25% 36% 42% 25%
with some certainty 52% 57% 63% 64% 46% 63%
no 7% 13% 12% 0% 13% 13%n 122 30 59 39 24 16
3rd survey
yes, with great
certainty41% 24% 24% 38% 63% 50%
with some certainty 52% 40% 52% 60% 31% 50%
no 7% 36% 24% 2% 6% 0%n 165 25 21 53 16 10
figure 5.3.9 shows that more than a half of respondents can calculate their income and expenses with the same level of certainty. the percentage of respondents who can calculate their income better than expenses is higher than the percentage of respondents who can calculate their expenses better than income.
figuRe 5.3.9. coMpaRisonofceRtaintyof calculation of incoMe and eXpensesinteRvention (n=211) contRol (n=79)
at the 2nd survey the percentage of respondents who know their payments on personal loans with great certainty increased as compared to the baseline survey by 6% in intervention group and declined by 8% in control group. at the 3rd survey this percentage declined in both groups. this decline occurred due to the increased percentage of borrowers that repaid their loans. the increase in the percentage of respondents who know their payments on loans, debts with great certainty in intervention group at the 2nd survey, and the decline of the percentage at the 3rd survey as compared to the 2nd survey can reflect the positive impact of consultations, which declined with time.

42
FIGURe 5.3.10. “DO YOU KnOW hOW MUCh RepAYMent YOU OWe On YOUR OWn LOAnS AnD DeBtS thIS MOnth?”InteRVentIOn. n=211
FIGURe 5.3.11. “DO YOU KnOW hOW MUCh RepAYMent YOU OWe On YOUR OWn LOAnS AnD DeBtS thIS MOnth?” COntROL. n=89
the level of awareness of the amount of payments on personal loans is higher than on general loans of the household (family). the percentage of respondents that don’t know how much repayment their household owes declined by 7% at the fi nal survey as compared to the baseline survey in intervention group, whereas it remained unchanged in control group.
FIGURe 5.3.12. “DO YOU KnOW hOW MUCh RepAYMent YOUR hOUSehOLD OWeS On LOAnS AnD DeBtS thIS MOnth?” InteRVentIOn. n=211
Report on Main Results of the Survey on the Impact of Counseling on Knowledge, Feelings and Actions of Over-Indebted Borrowers, 2016
37
n 165 25 21 53 16 10
Figure 5.3.9 shows that more than a half of respondents can calculate their income and expenses with the same level of certainty. The percentage of respondents who can calculate their income better than expenses is higher than the percentage of respondents who can calculate their expenses better than income.
FIGURE 5.3.9. COMPARISON OF CERTAINTY OF CALCULATION OF INCOME AND EXPENSES INTERVENTION (N=211) CONTROL (N=79)
At the 2nd survey the percentage of respondents who know their payments on personal loans with great certainty increased as compared to the baseline survey by 6% in intervention group and declined by 8% in control group. At the 3rd survey this percentage declined in both groups. This decline occurred due to the increased percentage of borrowers that repaid their loans. The increase in the percentage of respondents who know their payments on loans, debts with great certainty in intervention group at the 2nd survey, and the decline of the percentage at the 3rd survey as compared to the 2nd survey can reflect the positive impact of consultations, which declined with time.
FIGURE 5.3.10. “DO YOU KNOW HOW MUCH REPAYMENT YOU OWE ON YOUR OWN LOANS AND DEBTS THIS MONTH?” INTERVENTION. N=211
FIGURE 5.3.11. “DO YOU KNOW HOW MUCH REPAYMENT YOU OWE ON YOUR OWN LOANS AND DEBTS THIS MONTH?” CONTROL. N=89
Yes, with great certainty
With some certainty
No
No loan
Yes, with great certainty
With some certainty
No
No loan
Baseline Interim Final
Baseline Interim Final
Report on Main Results of the Survey on the Impact of Counseling on Knowledge, Feelings and Actions of Over-Indebted Borrowers, 2016
38
The level of awareness of the amount of payments on personal loans is higher than on general loans of the household (family). The percentage of respondents that don’t know how much repayment their household owes declined by 7% at the final survey as compared to the baseline survey in intervention group, whereas it remained unchanged in control group.
FIGURE 5.3.12. “DO YOU KNOW HOW MUCH REPAYMENT YOUR HOUSEHOLD OWES ON LOANS AND DEBTS THIS MONTH?” INTERVENTION. N=211
FIGURE 5.3.13. “DO YOU KNOW HOW MUCH REPAYMENT YOUR HOUSEHOLD OWES ON LOANS AND DEBTS THIS MONTH?” CONTROL. N=89
There are no significant differences in the knowledge of repayments on own loans of households in terms of the levels of financial literacy. This situation shows that the majority of respondents do know how much repayment they own on loans regardless of their level of financial literacy.
Table 5.3.9 shows that the majority (over 85%) of respondents that know how much repayment they owe with great certainty also know with great certainty how much repayment their household owes. The majority of respondents that know how much repayment their household owes on loans “with some certainty” or don’t know at all do know about their personal loans “with great certainty”.
TABLE 5.3.9. DO YOU KNOW HOW MUCH REPAYMENT YOU OWE ON YOUR PERSONAL LOANS AND DEBTS THIS MONTH? & DO YOU KNOW HOW MUCH REPAYMENT YOU OWE ON YOUR
PERSONAL LOANS AND DEBTS THIS MONTH?
Yes, with great certainty
With some certainty
No
No loan
Yes, with great certainty
With some certainty
No
No loan
Baseline Interim Final
Baseline Interim Final

43
Report on Main Results of the Survey on the Impact of Counseling on Knowledge, Feelings and Actions of Over-Indebted Borrowers, 2016
38
The level of awareness of the amount of payments on personal loans is higher than on general loans of the household (family). The percentage of respondents that don’t know how much repayment their household owes declined by 7% at the final survey as compared to the baseline survey in intervention group, whereas it remained unchanged in control group.
FIGURE 5.3.12. “DO YOU KNOW HOW MUCH REPAYMENT YOUR HOUSEHOLD OWES ON LOANS AND DEBTS THIS MONTH?” INTERVENTION. N=211
FIGURE 5.3.13. “DO YOU KNOW HOW MUCH REPAYMENT YOUR HOUSEHOLD OWES ON LOANS AND DEBTS THIS MONTH?” CONTROL. N=89
There are no significant differences in the knowledge of repayments on own loans of households in terms of the levels of financial literacy. This situation shows that the majority of respondents do know how much repayment they own on loans regardless of their level of financial literacy.
Table 5.3.9 shows that the majority (over 85%) of respondents that know how much repayment they owe with great certainty also know with great certainty how much repayment their household owes. The majority of respondents that know how much repayment their household owes on loans “with some certainty” or don’t know at all do know about their personal loans “with great certainty”.
TABLE 5.3.9. DO YOU KNOW HOW MUCH REPAYMENT YOU OWE ON YOUR PERSONAL LOANS AND DEBTS THIS MONTH? & DO YOU KNOW HOW MUCH REPAYMENT YOU OWE ON YOUR
PERSONAL LOANS AND DEBTS THIS MONTH?
Yes, with great certainty
With some certainty
No
No loan
Yes, with great certainty
With some certainty
No
No loan
Baseline Interim Final
Baseline Interim Final
FIGURe 5.3.13. “DO YOU KnOW hOW MUCh RepAYMent YOUR hOUSehOLD OWeS On LOAnS AnD DeBtS thIS MOnth?” COntROL. n=89
there are no signifi cant diff erences in the knowledge of repayments on own loans of households in terms of the levels of fi nancial literacy. this situation shows that the majority of respondents do know how much repayment they own on loans regardless of their level of fi nancial literacy.
table5.3.9 shows that the majority (over 85%) of respondents that know how much repayment they owe with great certainty also know with great certainty how much repayment their household owes. the majority of respondents that know how much repayment their household owes on loans “with some certainty” or don’t know at all do know about their personal loans “with great certainty”.
tABLe5.3.9. DO YOU KnOW hOW MUCh RepAYMent YOU OWe On YOUR peRSOnAL LOAnS AnD DeBtS thIS MOnth? & DO YOU KnOW hOW MUCh RepAYMent YOU OWe On YOUR peRSOnAL LOAnS AnD DeBtS thIS MOnth?
Intervention ControlDo you know how much repayment your household owes on loans and
debts this month?
Do you know how much repayment your household owes on loans and
debts this month?Yes, with
great certainty
With some certainty no no
loan
Yes, with great
certainty
With some
certaintyno no
loan
Do you know how
much repayment
you owe on your personal loans and debts this
month?
1st survey
Yes, with great
certainty89% 55% 43% 90% 63% 100%
With some
certainty9% 37% 18% 10% 38% 0%
no 2% 8% 39% 0% 0% 0%
n 134 49 28 58 16 5
Report on Main Results of the Survey on the Impact of Counseling on Knowledge, Feelings and Actions of Over-Indebted Borrowers, 2016
38
The level of awareness of the amount of payments on personal loans is higher than on general loans of the household (family). The percentage of respondents that don’t know how much repayment their household owes declined by 7% at the final survey as compared to the baseline survey in intervention group, whereas it remained unchanged in control group.
FIGURE 5.3.12. “DO YOU KNOW HOW MUCH REPAYMENT YOUR HOUSEHOLD OWES ON LOANS AND DEBTS THIS MONTH?” INTERVENTION. N=211
FIGURE 5.3.13. “DO YOU KNOW HOW MUCH REPAYMENT YOUR HOUSEHOLD OWES ON LOANS AND DEBTS THIS MONTH?” CONTROL. N=89
There are no significant differences in the knowledge of repayments on own loans of households in terms of the levels of financial literacy. This situation shows that the majority of respondents do know how much repayment they own on loans regardless of their level of financial literacy.
Table 5.3.9 shows that the majority (over 85%) of respondents that know how much repayment they owe with great certainty also know with great certainty how much repayment their household owes. The majority of respondents that know how much repayment their household owes on loans “with some certainty” or don’t know at all do know about their personal loans “with great certainty”.
TABLE 5.3.9. DO YOU KNOW HOW MUCH REPAYMENT YOU OWE ON YOUR PERSONAL LOANS AND DEBTS THIS MONTH? & DO YOU KNOW HOW MUCH REPAYMENT YOU OWE ON YOUR
PERSONAL LOANS AND DEBTS THIS MONTH?
Yes, with great certainty
With some certainty
No
No loan
Yes, with great certainty
With some certainty
No
No loan
Baseline Interim Final
Baseline Interim Final

44
Do you know how
much repayment
you owe on your personal loans and debts this
month?
2nd survey
Yes, with great
certainty94% 70% 69% 0% 85% 74% 50% 0%
With some
certainty5% 26% 27% 0% 11% 22% 0% 0%
no 1% 4% 4% 0% 4% 4% 50% 0%no loan 0% 0% 0% 100% 0% 0% 0% 100%
n 121 53 26 11 46 27 4 2
3rd survey
Yes, with great
certainty88% 34% 58% 0% 97% 52% 60% 0%
With some
certainty11% 62% 8% 0% 3% 48% 20% 0%
no 1% 3% 33% 0% 0% 0% 20% 0%no loan 0% 0% 0% 100% 0% 0% 0% 100%
n 101 61 12 37 33 23 5 18
Figures 5.3.14-5.4.15show information about the knowledge of respondents about their rights when interacting with a credit institution. Answers by respondents who think they have the right to request to reschedule the debt and those who think otherwise divided almost by halves at the baseline survey. the percentage of respondents who think they have the right to request to reschedule the debt increased by 11% in intervention group and by 5% in control group at the 3rd survey as compared to the baseline level.
FIGURe 5.3.14. I hAVe the RIGht tO ReQUeSt MY FInAnCIAL InStItUtIOn (BAnK, MICROFInAnCe ORGAnIZAtIOn, CReDIt UnIOn) tO ReSCheDULe MY pAYMentSInteRVentIOn (n=211) COntROL (n=79)
the percentage of respondents who think they have the right to request to restructure their debt varied slightly in both groups and is equal to about 50% in intervention group and 40% in control group.
46
figuRe 5.3.14. ihavetheRighttoReQuest My financial institution (banK, MicRofinance oRganiZation, cRedit union) to Reschedule My payMentsinteRvention (n=211) contRol (n=79)
the percentage of respondents who think they have the right to request to restructure their debt varied slightly in both groups and is equal to about 50% in intervention group and 40% in control group.
figuRe 5.3.15. ihavetheRighttoReQuestMyfinancialinstitution (banK, MicRofinanceoRganiZation, cReditunion) toRestRuctuReMydebtinteRvention (n=211) contRol (n=79)
the changes in answers to the question about the right to forgive part of or all debts are similar in intervention and control groups. the percentage of respondents who agreed with the question declined at the 3rd survey as compared to the baseline level by 21% in intervention group and 20% in control group.
figuRe 5.3.16. ihavetheRighttoReQuestMyfinancialinstitution (banK, MicRofinanceoRganiZation, cReditunion) tofoRgive paRt oR all of My debtinteRvention (n=211) contRol (n=79)

45
46
figuRe 5.3.14. ihavetheRighttoReQuest My financial institution (banK, MicRofinance oRganiZation, cRedit union) to Reschedule My payMentsinteRvention (n=211) contRol (n=79)
the percentage of respondents who think they have the right to request to restructure their debt varied slightly in both groups and is equal to about 50% in intervention group and 40% in control group.
figuRe 5.3.15. ihavetheRighttoReQuestMyfinancialinstitution (banK, MicRofinanceoRganiZation, cReditunion) toRestRuctuReMydebtinteRvention (n=211) contRol (n=79)
the changes in answers to the question about the right to forgive part of or all debts are similar in intervention and control groups. the percentage of respondents who agreed with the question declined at the 3rd survey as compared to the baseline level by 21% in intervention group and 20% in control group.
figuRe 5.3.16. ihavetheRighttoReQuestMyfinancialinstitution (banK, MicRofinanceoRganiZation, cReditunion) tofoRgive paRt oR all of My debtinteRvention (n=211) contRol (n=79)
FIGURe 5.3.15. I hAVe the RIGht tO ReQUeSt MY FInAnCIAL InStItUtIOn (BAnK, MICROFInAnCe ORGAnIZAtIOn, CReDIt UnIOn) tO ReStRUCtURe MY DeBtInteRVentIOn (n=211) COntROL (n=79)
the changes in answers to the question about the right to forgive part of or all debts are similar in intervention and control groups. the percentage of respondents who agreed with the question declined at the 3rd survey as compared to the baseline level by 21% in intervention group and 20% in control group.
FIGURe 5.3.16. I hAVe the RIGht tO ReQUeSt MY FInAnCIAL InStItUtIOn (BAnK, MICROFInAnCe ORGAnIZAtIOn, CReDIt UnIOn) tO FORGIVe pARt OR ALL OF MY DeBtInteRVentIOn (n=211) COntROL (n=79)
Figures 5.3.17 and 5.3.18 show answers to the questions about the borrower’s rights to a monthly loan statement and its explanation. the majority (75%-85%) of respondents in both groups think they have the right to a monthly debt statement. this indicator varied slightly at the 2nd survey as compared to the baseline level and declined by 20% at the 3rd survey. however, we cannot say this decline was caused by the change of opinions in respondents; it was likely to be caused by the increase in the number of respondents who repaid their loans.
In intervention group the percentage of respondents who think they have the right to the explanation of the loan statement declined by 14% at the 2nd survey as compared to the baseline level. this decline was caused also by the increase (6%) in the number of respondents who don’t think they have the right to the explanation of the loan statement. At the 3rd survey the percentage of respondents who agree with this statement also declined as compared to the 2nd survey. In control group the percentage of respondents who agree with the statement that they have the right to the explanation of the loan statement slightly declined.
It should be noted that the percentage of respondents who think they have the right to the explanation is higher than that of respondents who think they have the right to the loan statement in both groups. this situation is contradictory and can be explained by the fact that not all respondents understood what the loan statement meant.
46
figuRe 5.3.14. ihavetheRighttoReQuest My financial institution (banK, MicRofinance oRganiZation, cRedit union) to Reschedule My payMentsinteRvention (n=211) contRol (n=79)
the percentage of respondents who think they have the right to request to restructure their debt varied slightly in both groups and is equal to about 50% in intervention group and 40% in control group.
figuRe 5.3.15. ihavetheRighttoReQuestMyfinancialinstitution (banK, MicRofinanceoRganiZation, cReditunion) toRestRuctuReMydebtinteRvention (n=211) contRol (n=79)
the changes in answers to the question about the right to forgive part of or all debts are similar in intervention and control groups. the percentage of respondents who agreed with the question declined at the 3rd survey as compared to the baseline level by 21% in intervention group and 20% in control group.
figuRe 5.3.16. ihavetheRighttoReQuestMyfinancialinstitution (banK, MicRofinanceoRganiZation, cReditunion) tofoRgive paRt oR all of My debtinteRvention (n=211) contRol (n=79)

46
FIGURe 5.3.17. I hAVe the RIGht tO A MOnthLY BAnK StAteMent ABOUt MY DeBtInteRVentIOn (n=211) COntROL (n=79)
FIGURe 5.3.18. I hAVe the RIGht tO An eXpLAnAtIOn OF the SAID BAnK StAteMent (An eXpLAnAtIOn ReGARDInG the LOAn AMOUnt, nUMBeR OF pAYMentS, eFFeCtIVe InteReSt RAte etC.)InteRVentIOn (n=211) COntROL (n=79)
the question about the right of respondents to make a complaint was asked in order to identify the personality type of borrowers, i.e. whether they generally tend to fi le complaints to any organizations. the majority of respondents think they have the right to make complaints. It is impossible to state that there are certain changes in respondents opinion as the percentage of people who have repaid their loans increased among those who participated in the 2nd and 3rd follow-up surveys.
FIGURe 5.3.19. I hAVe the RIGht tO MAKe A COMpLAInt InteRVentIOn (n=211) COntROL (n=79)
47
figures 5.3.17 and 5.3.18show answers to the questions about the borrower’s rights to a monthly loan statement and its explanation. the majority (75%-85%) of respondents in both groups think they have the right to a monthly debt statement. this indicator varied slightly at the 2nd survey as compared to the baseline level and declined by 20% at the 3rd survey. however, we cannot say this decline was caused by the change of opinions in respondents; it was likely to be caused by the increase in the number of respondents who repaid their loans.
in intervention group the percentage of respondents who think they have the right to the explanation of the loan statement declined by 14% at the 2nd survey as compared to the baseline level. this decline was caused also by the increase (6%) in the number of respondents who don’t think they have the right to the explanation of the loan statement. at the 3rd survey the percentage of respondents who agree with this statement also declined as compared to the 2nd survey. in control group the percentage of respondents who agree with the statement that they have the right to the explanation of the loan statement slightly declined.
it should be noted that the percentage of respondents who think they have the right to the explanation is higher than that of respondents who think they have the right to the loan statement in both groups. this situation is contradictory and can be explained by the fact that not all respondents understood what the loan statement meant.
figuRe 5.3.17. i have the Right to a Monthly banK stateMent about My debtinteRvention (n=211) contRol (n=79)
figuRe 5.3.18. i have the Right to an eXplanation of the said banK stateMent (aneXplanationRegaRdingtheloanaMount, nuMbeRofpayMents, effective inteRest Rate etc.)inteRvention (n=211) contRol (n=79)
the question about the right of respondents to make a complaint was asked in order to identify the personality type of borrowers, i.e. whether they generally tend to file complaints to any organizations. the majority of respondents think they have the right to make complaints. it is impossible to state that there are certain changes in respondents opinion as the percentage of people who have repaid their loans increased among those who participated in the 2nd and 3rd follow-up surveys.
48
figuRe 5.3.19. i have the Right to MaKe a coMplaint inteRvention (n=211) contRol (n=79)
the first survey with an intervention group showed low awareness of existing services that are available to guide borrowers to cope with loan repayment difficulties. 89% of them didn’t know what services existed. after the consultations the awareness percentage started to grow. thus, by the 3rd survey the percentage increased by 43%. in the control group the percentage of respondents who are not aware of the consulting services staid more or less the same as during the 1st survey.
the respondents see banks and Mfis, where they took their loans, as the main source of consulting support on coping with loan repayment difficulties. the percentage of respondents, who consider their bank, Mfi to be a source of assistance in this matter, tends to grow. this percentage in the intervention group increased by 43% by the 3rd survey in comparison with the 1st one. 11% of respondents replied that they consider the international finance corporation, that conducted a community fair on financial planning, to be such a service for them.

47
47
figures 5.3.17 and 5.3.18show answers to the questions about the borrower’s rights to a monthly loan statement and its explanation. the majority (75%-85%) of respondents in both groups think they have the right to a monthly debt statement. this indicator varied slightly at the 2nd survey as compared to the baseline level and declined by 20% at the 3rd survey. however, we cannot say this decline was caused by the change of opinions in respondents; it was likely to be caused by the increase in the number of respondents who repaid their loans.
in intervention group the percentage of respondents who think they have the right to the explanation of the loan statement declined by 14% at the 2nd survey as compared to the baseline level. this decline was caused also by the increase (6%) in the number of respondents who don’t think they have the right to the explanation of the loan statement. at the 3rd survey the percentage of respondents who agree with this statement also declined as compared to the 2nd survey. in control group the percentage of respondents who agree with the statement that they have the right to the explanation of the loan statement slightly declined.
it should be noted that the percentage of respondents who think they have the right to the explanation is higher than that of respondents who think they have the right to the loan statement in both groups. this situation is contradictory and can be explained by the fact that not all respondents understood what the loan statement meant.
figuRe 5.3.17. i have the Right to a Monthly banK stateMent about My debtinteRvention (n=211) contRol (n=79)
figuRe 5.3.18. i have the Right to an eXplanation of the said banK stateMent (aneXplanationRegaRdingtheloanaMount, nuMbeRofpayMents, effective inteRest Rate etc.)inteRvention (n=211) contRol (n=79)
the question about the right of respondents to make a complaint was asked in order to identify the personality type of borrowers, i.e. whether they generally tend to file complaints to any organizations. the majority of respondents think they have the right to make complaints. it is impossible to state that there are certain changes in respondents opinion as the percentage of people who have repaid their loans increased among those who participated in the 2nd and 3rd follow-up surveys.
48
figuRe 5.3.19. i have the Right to MaKe a coMplaint inteRvention (n=211) contRol (n=79)
the first survey with an intervention group showed low awareness of existing services that are available to guide borrowers to cope with loan repayment difficulties. 89% of them didn’t know what services existed. after the consultations the awareness percentage started to grow. thus, by the 3rd survey the percentage increased by 43%. in the control group the percentage of respondents who are not aware of the consulting services staid more or less the same as during the 1st survey.
the respondents see banks and Mfis, where they took their loans, as the main source of consulting support on coping with loan repayment difficulties. the percentage of respondents, who consider their bank, Mfi to be a source of assistance in this matter, tends to grow. this percentage in the intervention group increased by 43% by the 3rd survey in comparison with the 1st one. 11% of respondents replied that they consider the international finance corporation, that conducted a community fair on financial planning, to be such a service for them.
the fi rst survey with an intervention group showed low awareness of existing services that are available to guide borrowers to cope with loan repayment diffi culties. 89% of them didn’t know what services existed. After the consultations the awareness percentage started to grow. thus, by the 3rd survey the percentage increased by 43%. In the control group the percentage of respondents who are not aware of the consulting services staid more or less the same as during the 1st survey.
the respondents see banks and MFIs, where they took their loans, as the main source of consulting support on coping with loan repayment diffi culties. the percentage of respondents, who consider their bank, MFI to be a source of assistance in this matter, tends to grow. this percentage in the intervention group increased by 43% by the 3rd survey in comparison with the 1st one. 11% of respondents replied that they consider the International Finance Corporation, that conducted a community fair on fi nancial planning, to be such a service for them.
FIGURe 5.3.10. ARe YOU AWARe OF AnY SeRVICeS thAt ARe AVAILABLe tO GUIDe YOU tO COpe WIth RepAYMent DIFFICULtIeS?
Intervention group Control group
1 survey
I don’t know 89%
1 survey
I don’t know 68%nGO 5% Bank experts 23%
Bank experts 3% Friends 5%Do not need any
consultations 1% Lawyer 4%
Lawyer 1%
2 survey
I don’t know 66%negotiations, consultations,
booklets 1% Bank experts 25%
2 survey
I don’t know 59% Lawyer 9%Bank experts 25%
3 surveyI don’t know 65%
International Finance Corporation 11% Bank experts 35%
Lawyer 3%Do not need any
consultations 1%
Commercial on tV regarding fi nancial diffi culties 1%
Relatives 1%
3 survey
I don’t know 46%Bank experts 38%
International Finance Corporation 11%
Lawyer 2%Do not need any
consultations 1%
Friends 1%Creditor rights protection
society 1%
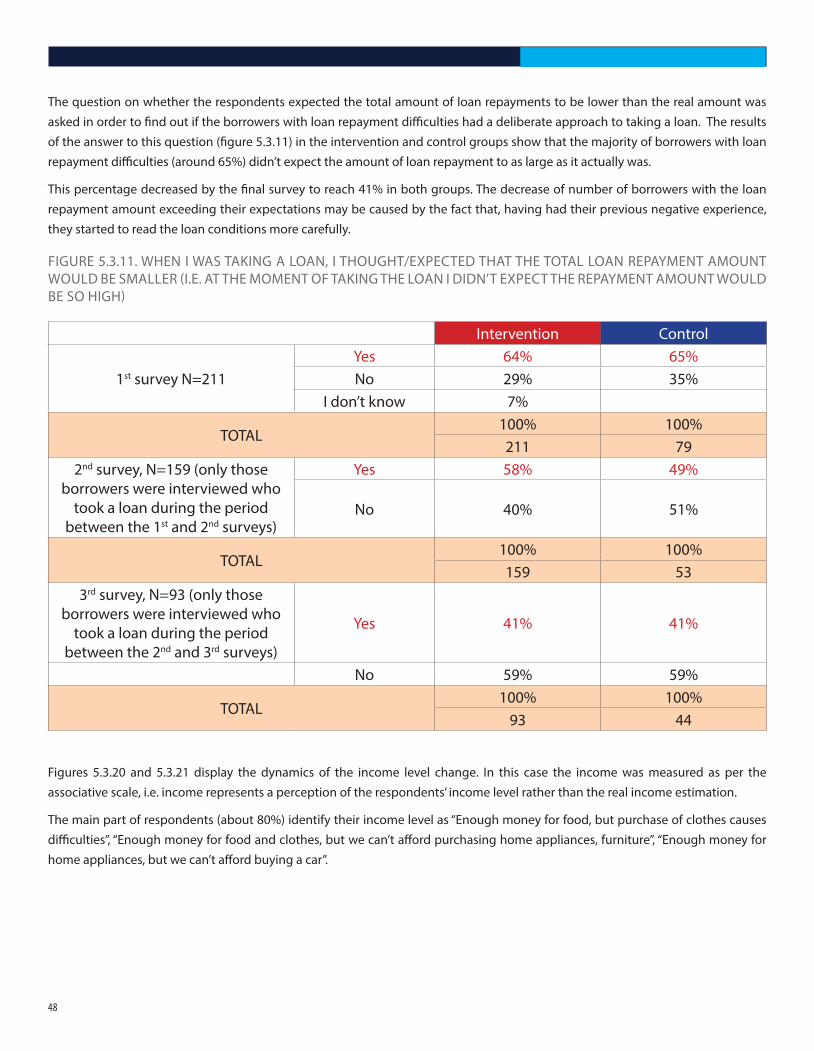
48
the question on whether the respondents expected the total amount of loan repayments to be lower than the real amount was asked in order to fi nd out if the borrowers with loan repayment diffi culties had a deliberate approach to taking a loan. the results of the answer to this question (fi gure 5.3.11) in the intervention and control groups show that the majority of borrowers with loan repayment diffi culties (around 65%) didn’t expect the amount of loan repayment to as large as it actually was.
this percentage decreased by the fi nal survey to reach 41% in both groups. the decrease of number of borrowers with the loan repayment amount exceeding their expectations may be caused by the fact that, having had their previous negative experience, they started to read the loan conditions more carefully.
FIGURe 5.3.11. When I WAS tAKInG A LOAn, I thOUGht/eXpeCteD thAt the tOtAL LOAn RepAYMent AMOUnt WOULD Be SMALLeR (I.e. At the MOMent OF tAKInG the LOAn I DIDn’t eXpeCt the RepAYMent AMOUnt WOULD Be SO hIGh)
Intervention Control
1st survey n=211Yes 64% 65%no 29% 35%
I don’t know 7%
tOtAL100% 100%211 79
2nd survey, n=159 (only those borrowers were interviewed who
took a loan during the period between the 1st and 2nd surveys)
Yes 58% 49%
no 40% 51%
tOtAL100% 100%159 53
3rd survey, n=93 (only those borrowers were interviewed who
took a loan during the period between the 2nd and 3rd surveys)
Yes 41% 41%
no 59% 59%
tOtAL100% 100%
93 44
Figures 5.3.20 and 5.3.21 display the dynamics of the income level change. In this case the income was measured as per the associative scale, i.e. income represents a perception of the respondents’ income level rather than the real income estimation.
the main part of respondents (about 80%) identify their income level as “enough money for food, but purchase of clothes causes diffi culties”, “enough money for food and clothes, but we can’t aff ord purchasing home appliances, furniture”, “enough money for home appliances, but we can’t aff ord buying a car”.

49
FIGURe 5.3.20. “pLeASe, eVALUAte the FInAnCIAL COnDItIOn OF YOUR FAMILY” InteRVentIOn. n=211
FIGURe 5.3.21. “pLeASe, eVALUAte the FInAnCIAL COnDItIOn OF YOUR FAMILY” COntROL. n=79
Figure 5.3.22 contains the information on income level change in relation to the income level in the 1st survey. thus, we can see that the percentage of respondents whose income increased is higher in the intervention group than in the control group. percentage of respondents whose income stayed at the same level as during the 1st survey is higher in the intervention group than in the control group. percentage of respondents whose income decreased is lower in the intervention group. this indicator tends to decrease in the intervention group and increase in the control group. these results demonstrate the fact that the level of prosperity in the intervention group raised more than in the control group.
FIGURe 5.3.22. ChAnGe OF InCOMe LeVeL In COMpARISOn WIth the InCOMe LeVeL ReGISteReD DURInG the FIRSt SURVeY InteRVentIOn (n=211) COntROL (n=79)
50
figuRe 5.3.11. when i was taKing a loan, i thought/eXpected that the total loan RepayMent aMount would be sMalleR (i.e. at the MoMent of taKing the loan i didn’t eXpect the RepayMent aMount would be so high)
intervention control
1st survey n=211yes 64% 65%no 29% 35%
i don’t know 7%
total100% 100%211 79
2nd survey, n=159 (only those borrowers were interviewed who
took a loan during the period between the 1st and 2nd surveys)
yes 58% 49%
no 40% 51%
total100% 100%159 53
3rd survey, n=93 (only those borrowers were interviewed who
took a loan during the period between the 2nd and 3rd surveys)
yes 41% 41%
no 59% 59%
total100% 100%
93 44figures 5.3.20 and 5.3.21 display the dynamics of the income level change. in this case the income was measured as per the associative scale, i.e. income represents a perception of the respondents’ income level rather than the real income estimation.
the main part of respondents (about 80%) identify their income level as “enough money for food, but purchase of clothes causes difficulties”, “enough money for food and clothes, but we can’t afford purchasing home appliances, furniture”, “enough money for home appliances, but we can’t afford buying a car”.
figuRe 5.3.20. “please, evaluate the financial condition of youR faMily” inteRvention. n=211
Report on Main Results of the Survey on the Impact of Counseling on Knowledge, Feelings and Actions of Over-Indebted Borrowers, 2016
44
FIGURE 5.3.20. “PLEASE, EVALUATE THE FINANCIAL CONDITION OF YOUR FAMILY”INTERVENTION. N=211
FIGURE 5.3.21. “PLEASE, EVALUATE THE FINANCIAL CONDITION OF YOUR FAMILY” CONTROL. N=79
Figure 5.3.22 contains the information on income level change in relation to the income level in the 1st survey. Thus, we can see that the percentage of respondents whose income increased is higher in the intervention group than in the control group. Percentage of respondents whose income stayedat the same level as during the 1st survey is higher in the intervention group than in the control group. Percentage of respondents whose income decreased is lower in the intervention group. Thisindicator tends to decrease in the intervention group and increase in the control group. These resultsdemonstrate the fact that the level of prosperity in the intervention group raised more than in the control group.
FIGURE 5.3.22. CHANGE OF INCOME LEVEL IN COMPARISON WITH THE INCOME LEVELREGISTERED DURING THE FIRST SURVEY
INTERVENTION (N=211) CONTROL (N=79)
51
figuRe 5.3.21. “please, evaluate the financial condition of youR faMily” contRol. n=79
figure 5.3.22 contains the information on income level change in relation to the income level in the 1st survey. thus, we can see that the percentage of respondents whose income increased is higher in the intervention group than in the control group. percentage of respondents whose income stayed at the same level as during the 1st survey is higher in the intervention group than in the control group. percentage of respondents whose income decreased is lower in the intervention group. this indicator tends to decrease in the intervention group and increase in the control group. these results demonstrate the fact that the level of prosperity in the intervention group raised more than in the control group.
figuRe 5.3.22. change of incoMe level in coMpaRison with the incoMe level RegisteRed duRing the fiRst suRvey inteRvention (n=211) contRol (n=79)
Report on Main Results of the Survey on the Impact of Counseling on Knowledge, Feelings and Actions of Over-Indebted Borrowers, 2016
44
FIGURE 5.3.20. “PLEASE, EVALUATE THE FINANCIAL CONDITION OF YOUR FAMILY”INTERVENTION. N=211
FIGURE 5.3.21. “PLEASE, EVALUATE THE FINANCIAL CONDITION OF YOUR FAMILY” CONTROL. N=79
Figure 5.3.22 contains the information on income level change in relation to the income level in the 1st survey. Thus, we can see that the percentage of respondents whose income increased is higher in the intervention group than in the control group. Percentage of respondents whose income stayedat the same level as during the 1st survey is higher in the intervention group than in the control group. Percentage of respondents whose income decreased is lower in the intervention group. Thisindicator tends to decrease in the intervention group and increase in the control group. These resultsdemonstrate the fact that the level of prosperity in the intervention group raised more than in the control group.
FIGURE 5.3.22. CHANGE OF INCOME LEVEL IN COMPARISON WITH THE INCOME LEVELREGISTERED DURING THE FIRST SURVEY
INTERVENTION (N=211) CONTROL (N=79)

50
findingS Of chaptEr 5.3:
•Accordingtotheresultsofthefirst(initial)surveyintheinterventiongroup,thepercentageofrespondentswithhighlevelof financial literacy was quite low (26%). this percentage was higher in the control group (50%). the evaluation results show general raise of the respondents’ financial literacy level in both intervention and control groups. the intervention group tends to have a more significant raise of financial literacy (+52%) then the control group (+24%).
•RespondentsinTalastendtohaveahigherleveloffinancialliteracyaswellasamoresignificantraiseofthisindicator,thaninnaryn.
•Thereisageneralincreaseinpercentageofrespondentswhoareabletocalculatetheirincomeandexpenses.
•Themajorpartoftherespondentsisabletocalculateboththeirincomeandexpenseswithsimilarcertainty.Amongthoserespondents, who cannot calculate their income and expenses with similar certainty, are able to determine their income more precisely than their expenses.
•Thepercentageofrespondentswhoknowexactlytheamountsoftheirdebtsrepaymentshasincreasedintheinterventiongroup by 6% by the 2nd survey compared to the initial level, and decreased by 8% in the control group. By the 3rd survey this percentage decreased in both groups.
•Respondentswhoknowexactlytheamountsoftheirrepaymentsaregenerallywellawareofthewholehouseholdrepayments.
•Themajorityofrespondents(around65%)whohaddifficultywithloanrepaymentsinbothgroupsdidn’texpecttheamountsof loan repayments would be as significant as it appeared to be in reality. As the final survey showed, this percentage decreased to 41% in both groups. Such a decrease may be caused by the heightened attention of the borrowers to the loan conditions.
• Theincomelevelanalysisshowedtheincreaseofthepercentageofrespondentswhoraisedtheir incomelevelabovetheincome that was registered during the initial survey. the increase was higher in the intervention group than in the control group.

51
5.4. PerCePtIonthis chapter will describe the perception by the borrowers having problems with debts repayment of their loans feasibility, level of certainty of repayment, their attitude to fi nancial planning. A complex indicator integrating diff erent aspects is used to summarize evaluation of the respondents’ attitude to taking and repaying loans.
As the research results showed, only 51% of people in the intervention group and 61% in the control group were sure during the initial survey (or mostly sure) of keeping their collaterald property. During further surveys the percentage increased. In the intervention group by the 3rd survey the overall percentage of borrowers certain that their collateral will not be taken by fi nancial institution as a loan repayment increased by 20%, whereas in control group – by 17%.
the percentage of borrowers who are not sure or not certain that they are sure of not losing their collateral decreased in both groups. In the intervention group decrease of percentage of the respondents who cannot answer with certainty to which degree they are sure they will keep the collateral (-15%) is more signifi cant than in the control group (-10%).
FIGURe 5.4.1. “hOW SURe ARe YOU thAt YOU WILL Get tO Keep YOUR COLLAteRAL (the FInAnCe InStItUtIOn WILL nOt tAKe It AS A RepAYMent OF the DeBt)?” InteRVentIOn
FIGURe 5.4.2. “hOW SURe ARe YOU thAt YOU WILL Get tO Keep YOUR COLLAteRAL (the FInAnCIAL InStItUtIOn WILL nOt tAKe It AS A RepAYMent OF the DeBt)?» COntROL
In the structure of replies to this question in naryn and talas the general trend stays the same, but there are diff erences in the level of certainty/uncertainty regarding keeping the loan collateral.
In the intervention group. During the initial survey in naryn a lower percentage of borrowers sure of keeping the loan collateral was registered (21%) in comparison with talas (45%). In naryn the percentage increased by the 2nd survey after consultations by 16%
Report on Main Results of the Survey on the Impact of Counseling on Knowledge, Feelings and Actions of Over-Indebted Borrowers, 2016
46
5.4.Perception
This chapter will describe the perception by the borrowers having problems with debts repayment oftheir loans feasibility, level of certainty of repayment, their attitude to financial planning. A complexindicator integrating different aspects is used to summarize evaluation of the respondents’ attitude to taking and repaying loans.
As the research results showed, only 51% of people in the intervention group and 61% in thecontrol group were sure during the initial survey (or mostly sure) of keeping their collaterald property. During further surveys the percentage increased. In the intervention group by the 3rd
survey the overall percentage of borrowers certain that their collateral will not be taken by financial institution as a loan repayment increased by 20%, whereas in control group – by 17%.The percentage of borrowers who are not sure or not certain that they are sure of not losing theircollateral decreased in both groups. In the intervention group decrease of percentage of therespondents who cannot answer with certainty to which degree they are sure they will keep the collateral (-15%) is more significant than in the control group (-10%).
FIGURE 5.4.1. “HOW SURE ARE YOU THAT YOU WILL GET TO KEEP YOUR COLLATERAL (THEFINANCE INSTITUTION WILL NOT TAKE IT AS A REPAYMENT OF THE DEBT)?” INTERVENTION
FIGURE 5.4.2. “HOW SURE ARE YOU THAT YOU WILL GET TO KEEP YOUR COLLATERAL (THEFINANCIAL INSTITUTION WILL NOT TAKE IT AS A REPAYMENT OF THE DEBT)?» CONTROL
Absolutely sure
Mostly sure
Neither sure, nor uncertain
Mostly not sure
Absolutely not sure
Absolutely sure
Mostly sure
Neither sure, nor uncertain
Mostly not sure
Absolutely not sure
Baseline Interim Final
Baseline Interim Final

52
compared to the initial level, and then decreased by 13%. In talas the percentage of borrowers absolutely sure of not losing their loan collateral increased by the 3rd survey by 34% compared to the initial survey. the percentage of respondents not sure how to answer that question is signifi cantly higher in naryn than in talas. During the initial survey this indicator showed 48% in naryn and decreased to 43% by the 3rd survey, whereas in talas it decreased from 29% to 3%.
In the control group. During the initial survey a higher percentage of the borrowers sure of keeping their collateral (60%) was registered in naryn, than in talas (23%). however, during further surveys a much lower percentage of borrowers absolutely sure of keeping their property was registered in naryn, than in talas. Increase of percentage of borrowers “absolutely” sure of not losing the collateral was more signifi cant in talas (+33%). In naryn during the 3rd survey the percentage of respondents “mostly sure” of keeping their collateral property increased signifi cantly (+52%).
having compared the results for the intervention group and control group, we can state that, whereas during the 2nd survey in talas the percentage of respondents absolutely sure of keeping their property signifi cantly increased, the percentage of people not able to answer this question decreased in both groups to 29% and 20% correspondingly. then in the fi nal survey the percentage of people not able to answer the question again increased in the control group by 18%, and the percentage of borrowers absolutely sure of keeping their collateral decreased; whereas in the intervention group the percentage of respondents unable to answer that question kept on decreasing to 3%. this situation in the control group is probably caused by their overestimating of their abilities (signifi cant increase of the percentage of “absolutely” sure in the 2nd survey) of repaying the loan by the borrowers in the second survey (after this question was repeated) and more realistic estimation of their abilities by the 3rd survey (3 months later). Since borrowers from the intervention group in talas, having received consultation support, became more literate in terms of fi nance (which is confi rmed by the chapter 5.3.1) and conducted a better evaluation of their fi nancial abilities, which aff ected the level of their certainty of being able to repay the loan.
FIGURe 5.4.3. “hOW SURe ARe YOU thAt YOU WILL Get tO Keep YOUR COLLAteRAL (the FInAnCIAL InStItUtIOn WILL nOt tAKe It AS A RepAYMent OF the DeBt)?” InteRVentIOn. nARYn
FIGURe 5.4.4. “hOW SURe ARe YOU thAt YOU WILL Get tO Keep YOUR COLLAteRAL (the FInAnCIAL InStItUtIOn WILL nOt tAKe It AS A RepAYMent OF the DeBt)?” COntROL
Report on Main Results of the Survey on the Impact of Counseling on Knowledge, Feelings and Actions of Over-Indebted Borrowers, 2016
47
In the structure of replies to this question in Naryn and Talas the general trend stays the same, butthere are differences in the level of certainty/uncertainty regarding keeping the loan collateral.In the intervention group. During the initial survey in Naryn a lower percentage of borrowers sure ofkeeping the loan collateral was registered (21%) in comparison with Talas (45%). In Naryn thepercentage increased by the 2nd survey after consultations by 16% compared to the initial level, and then decreased by 13%. In Talas the percentage of borrowers absolutely sure of not losing theirloan collateral increased by the 3rd survey by 34% compared to the initial survey. The percentage ofrespondents not sure how to answer that question is significantly higher in Naryn than in Talas. During the initial survey this indicator showed 48% in Naryn and decreased to 43% by the 3rd
survey, whereas in Talas it decreased from 29% to 3%.In the control group. During the initial survey a higher percentage of the borrowers sure of keepingtheir collateral (60%) was registered in Naryn, than in Talas (23%). However, during furthersurveys a much lower percentage of borrowers absolutely sure of keeping their property was registered in Naryn, than in Talas. Increase of percentage of borrowers “absolutely” sure of not losing the collateral was more significant in Talas (+33%). In Naryn during the 3rd survey thepercentage of respondents “mostly sure” of keeping their collateral property increased significantly (+52%). Having compared the results for the intervention group and control group, we can state that, whereas during the 2nd survey in Talas the percentage of respondents absolutely sure of keeping their property significantly increased, the percentage of people not able to answer this question decreased in both groups to 29% and 20% correspondingly. Then in the final survey the percentageof people not able to answer the question again increased in the control group by 18%, and thepercentage of borrowers absolutely sure of keeping their collateral decreased; whereas in the intervention group the percentage of respondents unable to answer that question kept on decreasing to 3%. This situation in the control group is probably caused by their overestimating of their abilities(significant increase of the percentage of “absolutely” sure in the 2nd survey) of repaying the loan by the borrowers in the second survey (after this question was repeated) and more realistic estimation of their abilities by the 3rd survey (3 months later). Since borrowers from the intervention group inTalas, having received consultation support, became more literate in terms of finance (which is confirmed by the chapter 5.3.1) and conducted a better evaluation of their financial abilities, which affected the level of their certainty of being able to repay the loan.
FIGURE 5.4.3. “HOW SURE ARE YOU THAT YOU WILL GET TO KEEP YOUR COLLATERAL (THE FINANCIAL INSTITUTION WILL NOT TAKE IT AS A REPAYMENT OF THE DEBT)?”
INTERVENTION. NARYN
Absolutely sure
Mostly sure
Neither sure, nor uncertain
Mostly not sure
Absolutely not sure
Baseline Interim Final
Report on Main Results of the Survey on the Impact of Counseling on Knowledge, Feelings and Actions of Over-Indebted Borrowers, 2016
48
FIGURE 5.4.4. “HOW SURE ARE YOU THAT YOU WILL GET TO KEEP YOUR COLLATERAL (THE FINANCIAL INSTITUTION WILL NOT TAKE IT AS A REPAYMENT OF THE DEBT)?” CONTROL.
NARYN
FIGURE 5.4.5. “HOW SURE ARE YOU THAT YOU WILL GET TO KEEP YOUR COLLATERAL (THE FINANCIAL INSTITUTION WILL NOT TAKE IT AS A REPAYMENT OF THE DEBT)?”
INTERVENTION. TALAS
FIGURE 5.4.6. “HOW SURE ARE YOU THAT YOU WILL GET TO KEEP YOUR COLLATERAL (THE FINANCIAL INSTITUTION WILL NOT TAKE IT AS A REPAYMENT OF THE DEBT)?” CONTROL.
TALAS
Absolutely sure
Mostly sure
Neither sure, nor uncertain
Mostly not sure
Absolutely not sure
Absolutely sure
Mostly sure
Neither sure, nor uncertain
Mostly not sure
Absolutely not sure
Absolutely sure
Mostly sure
Neither sure, nor uncertain
Mostly not sure
Absolutely not sure
Baseline Interim Final
Baseline Interim Final
Baseline Interim Final

53
Report on Main Results of the Survey on the Impact of Counseling on Knowledge, Feelings and Actions of Over-Indebted Borrowers, 2016
47
In the structure of replies to this question in Naryn and Talas the general trend stays the same, butthere are differences in the level of certainty/uncertainty regarding keeping the loan collateral.In the intervention group. During the initial survey in Naryn a lower percentage of borrowers sure ofkeeping the loan collateral was registered (21%) in comparison with Talas (45%). In Naryn thepercentage increased by the 2nd survey after consultations by 16% compared to the initial level, and then decreased by 13%. In Talas the percentage of borrowers absolutely sure of not losing theirloan collateral increased by the 3rd survey by 34% compared to the initial survey. The percentage ofrespondents not sure how to answer that question is significantly higher in Naryn than in Talas. During the initial survey this indicator showed 48% in Naryn and decreased to 43% by the 3rd
survey, whereas in Talas it decreased from 29% to 3%.In the control group. During the initial survey a higher percentage of the borrowers sure of keepingtheir collateral (60%) was registered in Naryn, than in Talas (23%). However, during furthersurveys a much lower percentage of borrowers absolutely sure of keeping their property was registered in Naryn, than in Talas. Increase of percentage of borrowers “absolutely” sure of not losing the collateral was more significant in Talas (+33%). In Naryn during the 3rd survey thepercentage of respondents “mostly sure” of keeping their collateral property increased significantly (+52%). Having compared the results for the intervention group and control group, we can state that, whereas during the 2nd survey in Talas the percentage of respondents absolutely sure of keeping their property significantly increased, the percentage of people not able to answer this question decreased in both groups to 29% and 20% correspondingly. Then in the final survey the percentageof people not able to answer the question again increased in the control group by 18%, and thepercentage of borrowers absolutely sure of keeping their collateral decreased; whereas in the intervention group the percentage of respondents unable to answer that question kept on decreasing to 3%. This situation in the control group is probably caused by their overestimating of their abilities(significant increase of the percentage of “absolutely” sure in the 2nd survey) of repaying the loan by the borrowers in the second survey (after this question was repeated) and more realistic estimation of their abilities by the 3rd survey (3 months later). Since borrowers from the intervention group inTalas, having received consultation support, became more literate in terms of finance (which is confirmed by the chapter 5.3.1) and conducted a better evaluation of their financial abilities, which affected the level of their certainty of being able to repay the loan.
FIGURE 5.4.3. “HOW SURE ARE YOU THAT YOU WILL GET TO KEEP YOUR COLLATERAL (THE FINANCIAL INSTITUTION WILL NOT TAKE IT AS A REPAYMENT OF THE DEBT)?”
INTERVENTION. NARYN
Absolutely sure
Mostly sure
Neither sure, nor uncertain
Mostly not sure
Absolutely not sure
Baseline Interim Final
Report on Main Results of the Survey on the Impact of Counseling on Knowledge, Feelings and Actions of Over-Indebted Borrowers, 2016
48
FIGURE 5.4.4. “HOW SURE ARE YOU THAT YOU WILL GET TO KEEP YOUR COLLATERAL (THE FINANCIAL INSTITUTION WILL NOT TAKE IT AS A REPAYMENT OF THE DEBT)?” CONTROL.
NARYN
FIGURE 5.4.5. “HOW SURE ARE YOU THAT YOU WILL GET TO KEEP YOUR COLLATERAL (THE FINANCIAL INSTITUTION WILL NOT TAKE IT AS A REPAYMENT OF THE DEBT)?”
INTERVENTION. TALAS
FIGURE 5.4.6. “HOW SURE ARE YOU THAT YOU WILL GET TO KEEP YOUR COLLATERAL (THE FINANCIAL INSTITUTION WILL NOT TAKE IT AS A REPAYMENT OF THE DEBT)?” CONTROL.
TALAS
Absolutely sure
Mostly sure
Neither sure, nor uncertain
Mostly not sure
Absolutely not sure
Absolutely sure
Mostly sure
Neither sure, nor uncertain
Mostly not sure
Absolutely not sure
Absolutely sure
Mostly sure
Neither sure, nor uncertain
Mostly not sure
Absolutely not sure
Baseline Interim Final
Baseline Interim Final
Baseline Interim Final
FIGURe 5.4.5. “hOW SURe ARe YOU thAt YOU WILL Get tO Keep YOUR COLLAteRAL (the FInAnCIAL InStItUtIOn WILL nOt tAKe It AS A RepAYMent OF the DeBt)?” InteRVentIOn. tALAS
FIGURe 5.4.6. “hOW SURe ARe YOU thAt YOU WILL Get tO Keep YOUR COLLAteRAL (the FInAnCIAL InStItUtIOn WILL nOt tAKe It AS A RepAYMent OF the DeBt)?” COntROL. tALAS
the respondents were asked about the benefi t they have from the loans taken (fi gures 5.4.7-5.4.11). Some of the borrowers took loans again after the initial survey. In that case they were asked to give their opinion about the new loan. two types of borrowers were considered to compare the perception changes:
1. Respondents who didn’t take new loans after the fi rst survey. In this case it was possible to research the dynamics of their answers on the same loan during the whole period of research.
2. Respondents who said they took loans during the 2nd and 3rd surveys. thus, these borrowers took loans at least twice after the initial survey. Consideration of these borrowers gives an opportunity to evaluate how the respondents answers changed regarding the new loans compared to their answers regarding those considered during the fi rst survey.
At the fi gure 5.4.7 we can see the dynamics of replies of the respondents to the question on the purposes of the loan taken before the start of the research. the intervention group shows that the loan amount was spent usefully in the long-term perspective by 52% of respondents during the fi rst survey. the percentage of respondents who stayed of the same opinion was the same during the intermediary survey. During the 3rd survey only 39% of respondents replied so. however, the percentage of respondents who thought that the borrowed funds are useful in the longer term increased by 13% by the 3rd survey in comparison with the initial one. there was an insignifi cant number of borrowers in the control group who didn’t take new loans after the initial survey – 4 people. the only perception change regarding the purposes of taking a loan took place when a borrower, who was unsure about the answer during the fi rst survey, later replied that the loan was meant for getting benefi t in the short-run.
Report on Main Results of the Survey on the Impact of Counseling on Knowledge, Feelings and Actions of Over-Indebted Borrowers, 2016
48
FIGURE 5.4.4. “HOW SURE ARE YOU THAT YOU WILL GET TO KEEP YOUR COLLATERAL (THE FINANCIAL INSTITUTION WILL NOT TAKE IT AS A REPAYMENT OF THE DEBT)?” CONTROL.
NARYN
FIGURE 5.4.5. “HOW SURE ARE YOU THAT YOU WILL GET TO KEEP YOUR COLLATERAL (THE FINANCIAL INSTITUTION WILL NOT TAKE IT AS A REPAYMENT OF THE DEBT)?”
INTERVENTION. TALAS
FIGURE 5.4.6. “HOW SURE ARE YOU THAT YOU WILL GET TO KEEP YOUR COLLATERAL (THE FINANCIAL INSTITUTION WILL NOT TAKE IT AS A REPAYMENT OF THE DEBT)?” CONTROL.
TALAS
Absolutely sure
Mostly sure
Neither sure, nor uncertain
Mostly not sure
Absolutely not sure
Absolutely sure
Mostly sure
Neither sure, nor uncertain
Mostly not sure
Absolutely not sure
Absolutely sure
Mostly sure
Neither sure, nor uncertain
Mostly not sure
Absolutely not sure
Baseline Interim Final
Baseline Interim Final
Baseline Interim Final

54
FIGURe 5.4.7. I Spent the MOneY tAKen AS A LOAn FOR the pURpOSeS thAt ARe GOOD/BeneFICIAL9 InteRVentIOn (n=31) COntROL (n=4)
In the interventions group of borrowers who evaluated diff erent loans during each of the surveys it can be seen that the percentage of borrowers, who took the loan for benefi cial purposes in the short term, decreased by the 3rd survey by 7% compared to the initial survey, and the percentage of borrowers considering their loans to be benefi cial in the long term increased by 10%. the situation in the control group is the opposite – the percentage of borrowers who consider their loans to be useful in the short term increased by 14% by the 3rd survey compared to the initial level, and the percentage of respondents considering their loan to be useful in the long term decreased. thus, it may be concluded that after consultations a percentage of borrowers who took loans for benefi t in the long term increased in the interventions group, and in the control group – for the short-term benefi t.
FIGURe 5.4.8. I Spent the MOneY tAKen AS A LOAn FOR the pURpOSeS thAt ARe GOOD/BeneFICIAL10 InteRVentIOn (n=72) COntROL (n=11)
As a more detailed analysis of the answers to this question intervention group shows, the loans purposes evaluated in the 2nd survey are the same as in the fi rst survey for 51% of borrowers. 46% of respondents took loans during the period between the fi rst and intermediary surveys for the purposes other than those of the loans considered during the fi rst survey. the purposes of the loans stayed the same by the 3rd survey for 65% of borrowers, but diff er for 28% of borrowers. More borrowers changed their loan purposes in the control group than in the intervention group.
9. the opinion of the respondents who didn’t take loans after the fi rst survey is under consideration here10. Opinion of the respondents who took a loan at least twice after consultations (i.e. those who stated during the 2nd and 3rd surveys to have taken a loan during the last 3 months)
56
figuRe 5.4.7. i spent the Money taKen as a loan foR the puRposes that aRe good/beneficial9 inteRvention (n=31) contRol (n=4)
in the interventions group of borrowers who evaluated different loans during each of the surveys it can be seen that the percentage of borrowers, who took the loan for beneficial purposes in the short term, decreased by the 3rd survey by 7% compared to the initial survey, and the percentage of borrowers considering their loans to be beneficial in the long term increased by 10%. the situation in the control group is the opposite – the percentage of borrowers who consider their loans to be useful in the short term increased by 14% by the 3rd survey compared to the initial level, and the percentage of respondents considering their loan to be useful in the long term decreased. thus, it may be concluded that after consultations a percentage of borrowers who took loans for benefit in the long term increased in the interventions group, and in the control group – for the short-term benefit.
figuRe 5.4.8. i spent the Money taKen as a loan foR the puRposes that aRe good/beneficial10 inteRvention (n=72) contRol (n=11)
as a more detailed analysis of the answers to this question intervention group shows, the loans purposes evaluated in the 2nd survey are the same as in the first survey for 51% of borrowers. 46% of respondents took loans during the period between the first and intermediary surveys for the purposes other than those of the loans considered during the first survey. the purposes of the loans stayed the same by the 3rd survey for 65% of borrowers, but differ for 28% of borrowers. More borrowers changed their loan purposes in the control group than in the intervention group.
9. the opinion of the respondents who didn’t take loans after the first survey is under consideration here10. opinion of the respondents who took a loan at least twice after consultations (i.e. those who stated during the 2nd and 3rd surveys to have taken a loan during the last 3 months)
57
figuRe 5.4.9. analysis of siMilaRities of the loans puRposes11 inteRvention (n=72) contRol (n=11))
the percentage of borrowers, who stated during further surveys that the loan was useful for both the borrower and his family, increased in the intervention group.
figuRe 5.4.10. i spent the Money taKen as a loan foR the puRposes that aRe good/beneficial 12 inteRvention (n=31) contRol (n=4)
among the borrowers who took new loans after the first survey the percentage of respondents who borrowed funds for themselves and their families increased.
figuRe 5.4.11. i spent the Money taKen as a loan foR the puRposes that aRe good/beneficial 13 inteRvention (n=72) contRol (n=11)
11. opinion of the respondents who took a loan at least twice after consultations (i.e. those who stated during the 2nd and 3rd surveys to have taken a loan during the last 3 months)12. opinion of the respondents who did not take any loans after the first survey 13. opinion of the respondents who took a loan at least twice after consultations (i.e. those who stated during the 2nd and 3rd surveys to have taken a loan during the last 3 months)

55 56
figuRe 5.4.7. i spent the Money taKen as a loan foR the puRposes that aRe good/beneficial9 inteRvention (n=31) contRol (n=4)
in the interventions group of borrowers who evaluated different loans during each of the surveys it can be seen that the percentage of borrowers, who took the loan for beneficial purposes in the short term, decreased by the 3rd survey by 7% compared to the initial survey, and the percentage of borrowers considering their loans to be beneficial in the long term increased by 10%. the situation in the control group is the opposite – the percentage of borrowers who consider their loans to be useful in the short term increased by 14% by the 3rd survey compared to the initial level, and the percentage of respondents considering their loan to be useful in the long term decreased. thus, it may be concluded that after consultations a percentage of borrowers who took loans for benefit in the long term increased in the interventions group, and in the control group – for the short-term benefit.
figuRe 5.4.8. i spent the Money taKen as a loan foR the puRposes that aRe good/beneficial10 inteRvention (n=72) contRol (n=11)
as a more detailed analysis of the answers to this question intervention group shows, the loans purposes evaluated in the 2nd survey are the same as in the first survey for 51% of borrowers. 46% of respondents took loans during the period between the first and intermediary surveys for the purposes other than those of the loans considered during the first survey. the purposes of the loans stayed the same by the 3rd survey for 65% of borrowers, but differ for 28% of borrowers. More borrowers changed their loan purposes in the control group than in the intervention group.
9. the opinion of the respondents who didn’t take loans after the first survey is under consideration here10. opinion of the respondents who took a loan at least twice after consultations (i.e. those who stated during the 2nd and 3rd surveys to have taken a loan during the last 3 months)
56
figuRe 5.4.7. i spent the Money taKen as a loan foR the puRposes that aRe good/beneficial9 inteRvention (n=31) contRol (n=4)
in the interventions group of borrowers who evaluated different loans during each of the surveys it can be seen that the percentage of borrowers, who took the loan for beneficial purposes in the short term, decreased by the 3rd survey by 7% compared to the initial survey, and the percentage of borrowers considering their loans to be beneficial in the long term increased by 10%. the situation in the control group is the opposite – the percentage of borrowers who consider their loans to be useful in the short term increased by 14% by the 3rd survey compared to the initial level, and the percentage of respondents considering their loan to be useful in the long term decreased. thus, it may be concluded that after consultations a percentage of borrowers who took loans for benefit in the long term increased in the interventions group, and in the control group – for the short-term benefit.
figuRe 5.4.8. i spent the Money taKen as a loan foR the puRposes that aRe good/beneficial10 inteRvention (n=72) contRol (n=11)
as a more detailed analysis of the answers to this question intervention group shows, the loans purposes evaluated in the 2nd survey are the same as in the first survey for 51% of borrowers. 46% of respondents took loans during the period between the first and intermediary surveys for the purposes other than those of the loans considered during the first survey. the purposes of the loans stayed the same by the 3rd survey for 65% of borrowers, but differ for 28% of borrowers. More borrowers changed their loan purposes in the control group than in the intervention group.
9. the opinion of the respondents who didn’t take loans after the first survey is under consideration here10. opinion of the respondents who took a loan at least twice after consultations (i.e. those who stated during the 2nd and 3rd surveys to have taken a loan during the last 3 months)
FIGURe 5.4.9. AnALYSIS OF SIMILARItIeS OF the LOAnS pURpOSeS11 InteRVentIOn (n=72) COntROL (n=11)
the percentage of borrowers, who stated during further surveys that the loan was useful for both the borrower and his family, increased in the intervention group.
FIGURe 5.4.10. I Spent the MOneY tAKen AS A LOAn FOR the pURpOSeS thAt ARe GOOD/BeneFICIAL 12 InteRVentIOn (n=31) COntROL (n=4)
Among the borrowers who took new loans after the fi rst survey the percentage of respondents who borrowed funds for themselves and their families increased.
FIGURe 5.4.11. I Spent the MOneY tAKen AS A LOAn FOR the pURpOSeS thAt ARe GOOD/BeneFICIAL 13 InteRVentIOn (n=72) COntROL (n=11)
11. Opinion of the respondents who took a loan at least twice after consultations (i.e. those who stated during the 2nd and 3rd surveys to have taken a loan during the last 3 months)12. Opinion of the respondents who did not take any loans after the fi rst survey 13. Opinion of the respondents who took a loan at least twice after consultations (i.e. those who stated during the 2nd and 3rd surveys to have taken a loan during the last 3 months)
57
figuRe 5.4.9. analysis of siMilaRities of the loans puRposes11 inteRvention (n=72) contRol (n=11))
the percentage of borrowers, who stated during further surveys that the loan was useful for both the borrower and his family, increased in the intervention group.
figuRe 5.4.10. i spent the Money taKen as a loan foR the puRposes that aRe good/beneficial 12 inteRvention (n=31) contRol (n=4)
among the borrowers who took new loans after the first survey the percentage of respondents who borrowed funds for themselves and their families increased.
figuRe 5.4.11. i spent the Money taKen as a loan foR the puRposes that aRe good/beneficial 13 inteRvention (n=72) contRol (n=11)
11. opinion of the respondents who took a loan at least twice after consultations (i.e. those who stated during the 2nd and 3rd surveys to have taken a loan during the last 3 months)12. opinion of the respondents who did not take any loans after the first survey 13. opinion of the respondents who took a loan at least twice after consultations (i.e. those who stated during the 2nd and 3rd surveys to have taken a loan during the last 3 months)

56
Figure 5.4.12 shows that the major part of the respondents consider their loans to have improved their quality of living (the responses “absolutely agree”, “partially agree”). As the results of the 3rd survey have shown (+5% compared to the initial level), in the intervention group there is an increase of the percentage of respondents who don’t think that the loan money improve their quality of life. this percentage decreased in the control group (-8% compared to the initial level).
FIGURe 5.4.12. I ChOOSe tO tAKe A LOAn BeCAUSe It IMpROVeS the QUALItY OF MY LIFeInteRVentIOn (n=211) COntROL (n=79)
Consideration of the answers to this question during the fi rst survey, taking into account the initial survey, shows that around 50% of respondents kept the same opinion (red print). Among respondents of the intervention group, who absolutely did not agree that loans improve their quality of life, only 21% stayed of the same opinion. the major part of the respondents (76%) responded that they agreed with the statement during the 2nd survey. In the control group the percentage of the respondents who changed their opinion from disagreement to consent with the statement (44%) was lower during the 2nd survey in comparison with the initial one and than in the interventional group (76%).
tABLe 5.4.1. OpInIOn OF the ReSpOnDent thAt LOAnS IMpROVe the QUALItY OF LIFe In COMpARISOn WIth AnSWeRS DURInG the FIRSt SURVeY
Intervention 1st survey Control 1st survey
Absolutely agree
partially agree
Absolutely disagree
I don’t know
Absolutely agree
partially agree
Absolutely disagree
2nd survey
Absolutely agree 42% 37% 29% 64% 65% 28% 22%
partially agree 49% 50% 47% 27% 29% 56% 22%
Absolutely disagree 9% 13% 21% 9% 6% 15% 56%
I don’t know 0% 0% 3% 0%
3rd survey
Absolutely agree 30% 29% 15% 18% 52% 41% 44%
partially agree 53% 53% 47% 55% 45% 56% 56%
Absolutely disagree 18% 17% 38% 27% 3% 3% 0%
tOtaLn 74 92 34 11 31 39 9% 100% 100% 100% 100% 100% 100% 100%
58
figure 5.4.12 shows that the major part of the respondents consider their loans to have improved their quality of living (the responses “absolutely agree”, “partially agree”). as the results of the 3rd survey have shown (+5% compared to the initial level), in the intervention group there is an increase of the percentage of respondents who don’t think that the loan money improve their quality of life. this percentage decreased in the control group (-8% compared to the initial level).
figuRe 5.4.12. i choose to taKe a loan because it iMpRoves the Quality of My lifeinteRvention (n=211) contRol (n=79)
consideration of the answers to this question during the first survey, taking into account the initial survey, shows that around 50% of respondents kept the same opinion (red print). among respondents of the intervention group, who absolutely did not agree that loans improve their quality of life, only 21% stayed of the same opinion. the major part of the respondents (76%) responded that they agreed with the statement during the 2nd survey. in the control group the percentage of the respondents who changed their opinion from disagreement to consent with the statement (44%) was lower during the 2nd survey in comparison with the initial one and than in the interventional group (76%).
table 5.4.1. opinion of the Respondent that loans iMpRove the Quality of life in coMpaRison with answeRs duRing the fiRst suRvey
intervention 1st survey control 1st survey
absolutely agree
partially agree
absolutely disagree
i don’t know
absolutely agree
partially agree
absolutely disagree
2nd survey
absolutely agree 42% 37% 29% 64% 65% 28% 22%
partially agree 49% 50% 47% 27% 29% 56% 22%
absolutely disagree 9% 13% 21% 9% 6% 15% 56%
i don’t know 0% 0% 3% 0%
3rd survey
absolutely agree 30% 29% 15% 18% 52% 41% 44%
partially agree 53% 53% 47% 55% 45% 56% 56%
absolutely disagree 18% 17% 38% 27% 3% 3% 0%
tOtaLn 74 92 34 11 31 39 9% 100% 100% 100% 100% 100% 100% 100%
59
there are differences between naryn and talas in terms of certainty that the financial situation is under control. thus, in the intervention group the percentage of those who was sure of the control over their financial situation in talas was higher than in naryn by 14% during the 1st survey, by 18% during the 2nd survey, and by 54% during the 3rd survey. in naryn this percentage increased by the 2nd survey (+12%) after consultations and then significantly decreased (-27%). there is a growing trend in talas during the whole period of research.
in the control group of naryn the percentage of those certain of their control over their financial situation has increased by 12% by the 2nd survey in comparison with the initial level, and then dropped down by 27% by the time of the 3rd survey. this percentage in talas is growing. in the control group of naryn the percentage of people sure of having their financial situation under control is decreasing, whereas in talas it is increasing.
figuRe 5.4.13. My financial situation, possibility to save up Money and My debt aRe undeR My contRol. naRyninteRvention (n=108) contRol (n=45)
figuRe 5.4.14. My financial situation, possibility to save up Money and My debt aRe undeR My contRol. talas(n=103) contRol (n=34)
around 90% of the respondents feel confident making their financial plans. in comparison with the initial level in the intervention group the number of respondents, who feel absolutely confident making their financial plans, has increased after consultations: by 5% by the 2nd survey, and by 13% by the 3rd survey. this indicator in the control group decreased by 5% by the time of the 3rd survey in comparison with the initial level.
figuRe 5.4.18. i feel confident MaKing financial plansinteRvention(n=211) contRol (n=79)

57 58
figure 5.4.12 shows that the major part of the respondents consider their loans to have improved their quality of living (the responses “absolutely agree”, “partially agree”). as the results of the 3rd survey have shown (+5% compared to the initial level), in the intervention group there is an increase of the percentage of respondents who don’t think that the loan money improve their quality of life. this percentage decreased in the control group (-8% compared to the initial level).
figuRe 5.4.12. i choose to taKe a loan because it iMpRoves the Quality of My lifeinteRvention (n=211) contRol (n=79)
consideration of the answers to this question during the first survey, taking into account the initial survey, shows that around 50% of respondents kept the same opinion (red print). among respondents of the intervention group, who absolutely did not agree that loans improve their quality of life, only 21% stayed of the same opinion. the major part of the respondents (76%) responded that they agreed with the statement during the 2nd survey. in the control group the percentage of the respondents who changed their opinion from disagreement to consent with the statement (44%) was lower during the 2nd survey in comparison with the initial one and than in the interventional group (76%).
table 5.4.1. opinion of the Respondent that loans iMpRove the Quality of life in coMpaRison with answeRs duRing the fiRst suRvey
intervention 1st survey control 1st survey
absolutely agree
partially agree
absolutely disagree
i don’t know
absolutely agree
partially agree
absolutely disagree
2nd survey
absolutely agree 42% 37% 29% 64% 65% 28% 22%
partially agree 49% 50% 47% 27% 29% 56% 22%
absolutely disagree 9% 13% 21% 9% 6% 15% 56%
i don’t know 0% 0% 3% 0%
3rd survey
absolutely agree 30% 29% 15% 18% 52% 41% 44%
partially agree 53% 53% 47% 55% 45% 56% 56%
absolutely disagree 18% 17% 38% 27% 3% 3% 0%
tOtaLn 74 92 34 11 31 39 9% 100% 100% 100% 100% 100% 100% 100%
there are diff erences between naryn and talas in terms of certainty that the fi nancial situation is under control. thus, in the intervention group the percentage of those who was sure of the control over their fi nancial situation in talas was higher than in naryn by 14% during the 1st survey, by 18% during the 2nd survey, and by 54% during the 3rd survey. In naryn this percentage increased by the 2nd survey (+12%) after consultations and then signifi cantly decreased (-27%). there is a growing trend in talas during the whole period of research.
In the control group of naryn the percentage of those certain of their control over their fi nancial situation has increased by 12% by the 2nd survey in comparison with the initial level, and then dropped down by 27% by the time of the 3rd survey. this percentage in talas is growing. In the control group of naryn the percentage of people sure of having their fi nancial situation under control is decreasing, whereas in talas it is increasing.
FIGURe 5.4.13. MY FInAnCIAL SItUAtIOn, pOSSIBILItY tO SAVe Up MOneY AnD MY DeBt ARe UnDeR MY COntROL. nARYnInteRVentIOn (n=108) COntROL (n=45)
FIGURe 5.4.14. MY FInAnCIAL SItUAtIOn, pOSSIBILItY tO SAVe Up MOneY AnD MY DeBt ARe UnDeR MY COntROL. tALAS(n=103) COntROL (n=34)
Around 90% of the respondents feel confi dent making their fi nancial plans. In comparison with the initial level in the intervention group the number of respondents, who feel absolutely confi dent making their fi nancial plans, has increased after consultations: by 5% by the 2nd survey, and by 13% by the 3rd survey. this indicator in the control group decreased by 5% by the time of the 3rd survey in comparison with the initial level.
FIGURe 5.4.18. I FeeL COnFIDent MAKInG FInAnCIAL pLAnSInteRVentIOn(n=211) COntROL (n=79)
59
there are differences between naryn and talas in terms of certainty that the financial situation is under control. thus, in the intervention group the percentage of those who was sure of the control over their financial situation in talas was higher than in naryn by 14% during the 1st survey, by 18% during the 2nd survey, and by 54% during the 3rd survey. in naryn this percentage increased by the 2nd survey (+12%) after consultations and then significantly decreased (-27%). there is a growing trend in talas during the whole period of research.
in the control group of naryn the percentage of those certain of their control over their financial situation has increased by 12% by the 2nd survey in comparison with the initial level, and then dropped down by 27% by the time of the 3rd survey. this percentage in talas is growing. in the control group of naryn the percentage of people sure of having their financial situation under control is decreasing, whereas in talas it is increasing.
figuRe 5.4.13. My financial situation, possibility to save up Money and My debt aRe undeR My contRol. naRyninteRvention (n=108) contRol (n=45)
figuRe 5.4.14. My financial situation, possibility to save up Money and My debt aRe undeR My contRol. talas(n=103) contRol (n=34)
around 90% of the respondents feel confident making their financial plans. in comparison with the initial level in the intervention group the number of respondents, who feel absolutely confident making their financial plans, has increased after consultations: by 5% by the 2nd survey, and by 13% by the 3rd survey. this indicator in the control group decreased by 5% by the time of the 3rd survey in comparison with the initial level.
figuRe 5.4.18. i feel confident MaKing financial plansinteRvention(n=211) contRol (n=79)

58
Despite the fact that respondents participating in the research were borrowers with problems in loan repayment, the majority of them replied that they did not have major diffi culties with repayment of loans. thus, only 15-20% of both groups replied that they had diffi culties with loan repayment.
FIGURe 5.4.19. I CAn eASILY AFFORD MOnthLY pAYMentS On MY LOAn/DeBtInteRVentIOn (n=211) COntROL (n=79)
the fi gure 5.4.2 contains the information on perception of diffi culties with repayments and delays in loans repayments. thus, less than 20% of respondents in the intervention group consider to have no diffi culties with loans repayments, and still they have delays in repayments. this indicator is higher in the control group (28-36%).
tABLe 5.4.2. I CAn eASILY AFFORD MOnthLY pAYMentS On MY LOAn/DeBt AnD DO YOU hAVe pAYMent DeLAYS On YOUR LOAn/DeBt
do you have payment delays on your loan/
debt?
i can easily aff ord monthly payments on my loan/debt
intervention controlabsolutely
agreepartially
agreeabsolutely
disagreei don’t know
absolutely agree
partially agree
absolutely disagree
1st survey
yes 17% 56% 23% 5% 34% 48% 18%no 27% 48% 23% 3% 28% 45% 28%
no loan 0% 0% 0% 0% i don’t know 29% 29% 0% 43%
2nd survey
yes 19% 57% 24% 0% 28% 54% 18%no 45% 45% 9% 1% 34% 55% 11%
no loan 55% 18% 18% 9% 50% 50% 0%i don’t know
3rd survey
yes 19% 61% 19% 36% 52% 12%no 28% 56% 15% 19% 64% 17%
no loan 38% 43% 19% 50% 39% 11%
the question on life quality perception during increasing expenditures on food, clothing and transportation yielded similar response patterns in both intervention and control groups across three surveys.
60
despite the fact that respondents participating in the research were borrowers with problems in loan repayment, the majority of them replied that they did not have major difficulties with repayment of loans. thus, only 15-20% of both groups replied that they had difficulties with loan repayment.
figuRe 5.4.19. i can easily affoRd Monthly payMents on My loan/debtinteRvention (n=211) contRol (n=79)
the figure 5.4.2 contains the information on perception of difficulties with repayments and delays in loans repayments. thus, less than 20% of respondents in the intervention group consider to have no difficulties with loans repayments, and still they have delays in repayments. this indicator is higher in the control group (28-36%).
table 5.4.2. i can easily affoRd Monthly payMents on My loan/debt and do you have payMent delays on youR loan/debt
do you have payment delays on your loan/
debt?
i can easily afford monthly payments on my loan/debt
intervention controlabsolutely
agreepartially
agreeabsolutely
disagreei don’t know
absolutely agree
partially agree
absolutely disagree
1st survey
yes 17% 56% 23% 5% 34% 48% 18%no 27% 48% 23% 3% 28% 45% 28%
no loan 0% 0% 0% 0% i don’t know 29% 29% 0% 43%
2nd survey
yes 19% 57% 24% 0% 28% 54% 18%no 45% 45% 9% 1% 34% 55% 11%
no loan 55% 18% 18% 9% 50% 50% 0%i don’t know
3rd survey
yes 19% 61% 19% 36% 52% 12%no 28% 56% 15% 19% 64% 17%
no loan 38% 43% 19% 50% 39% 11%
the question on life quality perception during increasing expenditures on food, clothing and transportation yielded similar response patterns in both intervention and control groups across three surveys.
61
figuRe 5.4.20 even if My eXpendituRes on food, tRanspoRt and food incRease, My life Quality will ReMain the saMeinteRvention (n=211) contRol (n=79)
the majority of respondents (approximately 80%) are confident they are capable of being more efficient with their expenditures. degrees of confidence in capability of being more efficient with expenditures in talas and naryn are noticeably different. number of respondents firmly confident in capability of being more expenditure efficient in higher in talas than in naryn for the intervention group. in talas, the segment of respondents firmly confident in capability of higher expenditure efficiency has grown at a significantly higher rate than in naryn. the baseline survey in the control group showed that the percentage of respondents confident of their capability of being more cost efficient was lower in talas than in naryn. the following surveys, however, revealed an opposite situation – percentage of respondents of such respondents was higher in talas.
figuRe 5.4.21 do you thinK you can be MoRe cost efficient?inteRvention (n=211) contRol (n=79)
figuRe 5.4.22 do you thinK you can be MoRe cost efficient? naRyninteRvention (n=108) contRol (n=45)

59 60
despite the fact that respondents participating in the research were borrowers with problems in loan repayment, the majority of them replied that they did not have major difficulties with repayment of loans. thus, only 15-20% of both groups replied that they had difficulties with loan repayment.
figuRe 5.4.19. i can easily affoRd Monthly payMents on My loan/debtinteRvention (n=211) contRol (n=79)
the figure 5.4.2 contains the information on perception of difficulties with repayments and delays in loans repayments. thus, less than 20% of respondents in the intervention group consider to have no difficulties with loans repayments, and still they have delays in repayments. this indicator is higher in the control group (28-36%).
table 5.4.2. i can easily affoRd Monthly payMents on My loan/debt and do you have payMent delays on youR loan/debt
do you have payment delays on your loan/
debt?
i can easily afford monthly payments on my loan/debt
intervention controlabsolutely
agreepartially
agreeabsolutely
disagreei don’t know
absolutely agree
partially agree
absolutely disagree
1st survey
yes 17% 56% 23% 5% 34% 48% 18%no 27% 48% 23% 3% 28% 45% 28%
no loan 0% 0% 0% 0% i don’t know 29% 29% 0% 43%
2nd survey
yes 19% 57% 24% 0% 28% 54% 18%no 45% 45% 9% 1% 34% 55% 11%
no loan 55% 18% 18% 9% 50% 50% 0%i don’t know
3rd survey
yes 19% 61% 19% 36% 52% 12%no 28% 56% 15% 19% 64% 17%
no loan 38% 43% 19% 50% 39% 11%
the question on life quality perception during increasing expenditures on food, clothing and transportation yielded similar response patterns in both intervention and control groups across three surveys.
FIGURe 5.4.20 eVen IF MY eXpenDItUReS On FOOD, tRAnSpORt AnD FOOD InCReASe, MY LIFe QUALItY WILL ReMAIn the SAMeInteRVentIOn (n=211) COntROL (n=79)
the majority of respondents (approximately 80%) are confi dent they are capable of being more effi cient with their expenditures. Degrees of confi dence in capability of being more effi cient with expenditures in talas and naryn are noticeably diff erent. number of respondents fi rmly confi dent in capability of being more expenditure effi cient in higher in talas than in naryn for the intervention group. In talas, the segment of respondents fi rmly confi dent in capability of higher expenditure effi ciency has grown at a signifi cantly higher rate than in naryn. the baseline survey in the control group showed that the percentage of respondents confi dent of their capability of being more cost effi cient was lower in talas than in naryn. the following surveys, however, revealed an opposite situation – percentage of respondents of such respondents was higher in talas.
FIGURe 5.4.21 DO YOU thInK YOU CAn Be MORe COSt eFFICIent?InteRVentIOn (n=211) COntROL (n=79)
FIGURe 5.4.22 DO YOU thInK YOU CAn Be MORe COSt eFFICIent? nARYnInteRVentIOn (n=108) COntROL (n=45)
61
figuRe 5.4.20 even if My eXpendituRes on food, tRanspoRt and food incRease, My life Quality will ReMain the saMeinteRvention (n=211) contRol (n=79)
the majority of respondents (approximately 80%) are confident they are capable of being more efficient with their expenditures. degrees of confidence in capability of being more efficient with expenditures in talas and naryn are noticeably different. number of respondents firmly confident in capability of being more expenditure efficient in higher in talas than in naryn for the intervention group. in talas, the segment of respondents firmly confident in capability of higher expenditure efficiency has grown at a significantly higher rate than in naryn. the baseline survey in the control group showed that the percentage of respondents confident of their capability of being more cost efficient was lower in talas than in naryn. the following surveys, however, revealed an opposite situation – percentage of respondents of such respondents was higher in talas.
figuRe 5.4.21 do you thinK you can be MoRe cost efficient?inteRvention (n=211) contRol (n=79)
figuRe 5.4.22 do you thinK you can be MoRe cost efficient? naRyninteRvention (n=108) contRol (n=45)

60
FIGURe 5.4.23 DO YOU thInK YOU CAn Be MORe COSt eFFICIent? tALASInteRVentIOn (n=103) COntROL (n=34)
the rate of optimistic respondents, those who are confi dent in improvement of their fi nancial standings, is higher in talas than in naryn across the intervention groups. the increase of this % towards the 3rd survey could be caused by the increase of the respondent group who paid off their loans (Chapter 1).
FIGURe 5.4.24 I BeLIeVe MY FInAnCIAL StAnDInG neXt YeAR WILL Be BetteR thAn thIS YeAR. nARYnInteRVentIOn (n=108) COntROL (n=45)
FIGURe 5.4.25 I BeLIeVe MY FInAnCIAL StAnDInG neXt YeAR WILL Be BetteR thAn thIS YeAR. tALASInteRVentIOn (n=103) COntROL (n=34)
table 5.4.3. reviews answers of respondents who paid off their debts to the fi nal survey moment. It maybe noted that the % of loaners who are confi dent in improvement of their fi nancial standings has signifi cantly grown by the 3rd survey. therefore if could be concluded that with debt payoff s the respondent become more fi nancially confi dent.
62
figuRe 5.4.23 do you thinK you can be MoRe cost efficient? talasinteRvention (n=103) contRol (n=34)
the rate of optimistic respondents, those who are confident in improvement of their financial standings, is higher in talas than in naryn across the intervention groups. the increase of this % towards the 3rd survey could be caused by the increase of the respondent group who paid off their loans (chapter 1)
figuRe 5.4.24 i believe My financial standing neXt yeaR will be betteR than this yeaR. naRyninteRvention (n=108) contRol (n=45)
figuRe 5.4.25 i believe My financial standing neXt yeaR will be betteR than this yeaR. talasinteRvention (n=103) contRol (n=34)
table 5.4.3. reviews answers of respondents who paid off their debts to the final survey moment. it maybe noted that the % of loaners who are confident in improvement of their financial standings has significantly grown by the 3rd survey. therefore if could be concluded that with debt payoffs the respondent become more financially confident.

61 62
figuRe 5.4.23 do you thinK you can be MoRe cost efficient? talasinteRvention (n=103) contRol (n=34)
the rate of optimistic respondents, those who are confident in improvement of their financial standings, is higher in talas than in naryn across the intervention groups. the increase of this % towards the 3rd survey could be caused by the increase of the respondent group who paid off their loans (chapter 1)
figuRe 5.4.24 i believe My financial standing neXt yeaR will be betteR than this yeaR. naRyninteRvention (n=108) contRol (n=45)
figuRe 5.4.25 i believe My financial standing neXt yeaR will be betteR than this yeaR. talasinteRvention (n=103) contRol (n=34)
table 5.4.3. reviews answers of respondents who paid off their debts to the final survey moment. it maybe noted that the % of loaners who are confident in improvement of their financial standings has significantly grown by the 3rd survey. therefore if could be concluded that with debt payoffs the respondent become more financially confident.
62
figuRe 5.4.23 do you thinK you can be MoRe cost efficient? talasinteRvention (n=103) contRol (n=34)
the rate of optimistic respondents, those who are confident in improvement of their financial standings, is higher in talas than in naryn across the intervention groups. the increase of this % towards the 3rd survey could be caused by the increase of the respondent group who paid off their loans (chapter 1)
figuRe 5.4.24 i believe My financial standing neXt yeaR will be betteR than this yeaR. naRyninteRvention (n=108) contRol (n=45)
figuRe 5.4.25 i believe My financial standing neXt yeaR will be betteR than this yeaR. talasinteRvention (n=103) contRol (n=34)
table 5.4.3. reviews answers of respondents who paid off their debts to the final survey moment. it maybe noted that the % of loaners who are confident in improvement of their financial standings has significantly grown by the 3rd survey. therefore if could be concluded that with debt payoffs the respondent become more financially confident.
tABLe 5.4.3. I BeLIeVe MY FInAnCIAL StAnDInG neXt YeAR WILL Be BetteR thAn thIS YeAR 14
Intervention n=37 Control n=181st survey 2nd survey 3rd survey 1st survey 2nd survey 3rd survey
Absolutely agree 43% 62% 70% 50% 39% 83%partially agree 38% 35% 24% 44% 56% 11%
Absolutely disagree 14% 3% 5% 6% 6% 6%
I don’t know 5%
For evaluation of respondents’ stance on their debts a complex indicator which includes criteria listed in table 5.4.1. was developed. this index characterizes the responders’ degree of confi dence in control of their fi nancial situation.
tABLe 5.4.1. peRCeptIOn RAte CLASSIFICAtIOn
Criteria1 2 3
Optimistic perception neutral perception pessimistic perceptionI choose to contract a loan/debt because it will increase
my life quality.Absolutely agree partially agree Absolutely disagree
I control my fi nancial standing, expenditures and
debts.Absolutely agree partially agree Absolutely disagree
I can easily aff ord monthly payments on my loan/debt Absolutely agree partially agree Absolutely disagree
even if my expenditures on food, transport and food
increase, my life quality will remain the same
Absolutely agree partially agree Absolutely disagree
I believe my fi nancial standing next year will be better than
this year.Absolutely agree partially agree Absolutely disagree
What’s your level of confi dence in keeping your
collateral assets (the fi nancial institution doesn’t take
possession of you collateral to pay off your loan)?
Absolutely sure OR pretty sure
neither sure nor uncertain
Absoletely not sure OR pretty unsure
Charts 5.4.26 and 5.4.27 indicate that across intervention groups the % of respondents who are optimistic about their fi nancial standings is higher in talas than in naryn. Amount of pessimistic respondents in naryn was quite high (68%) in the 3rd survey whereas in talas it was only 11%. Across the control group the situation is opposite - there were more optimists in naryn than in talas.
14. Analysis of respondents who stated they have no debts in the 3rd survey

62
naryn intervention group revealed increase of % of positive and neutral and positive respondents in the 2nd survey, although it decreased in the 3rd survey with increase of pessimists. talas shows continuous growth of rate of neutral and positive respondents.
FIGURe 5.4.26 OVeRALL ReSpOnDent peRCeptIOn OF LOAnS. nARYnInteRVentIOn (n=108) COntROL (n=45)
FIGURe 5.4.27. OVeRALL ReSpOnDent peRCeptIOn OF LOAnS. tALASInteRVentIOn (n=103) COntROL (n=34)
64
naryn intervention group revealed increase of % of positive and neutral and positive respondents in the 2nd survey, although it decreased in the 3rd survey with increase of pessimists. talas shows continuous growth of rate of neutral and positive respondents.
figuRe 5.4.26 oveRall Respondent peRception of loans. naRyninteRvention (n=108) contRol (n=45)
figuRe 5.4.27. oveRall Respondent peRception of loans. talasinteRvention (n=103) contRol (n=34)

63 64
naryn intervention group revealed increase of % of positive and neutral and positive respondents in the 2nd survey, although it decreased in the 3rd survey with increase of pessimists. talas shows continuous growth of rate of neutral and positive respondents.
figuRe 5.4.26 oveRall Respondent peRception of loans. naRyninteRvention (n=108) contRol (n=45)
figuRe 5.4.27. oveRall Respondent peRception of loans. talasinteRvention (n=103) contRol (n=34)
64
naryn intervention group revealed increase of % of positive and neutral and positive respondents in the 2nd survey, although it decreased in the 3rd survey with increase of pessimists. talas shows continuous growth of rate of neutral and positive respondents.
figuRe 5.4.26 oveRall Respondent peRception of loans. naRyninteRvention (n=108) contRol (n=45)
figuRe 5.4.27. oveRall Respondent peRception of loans. talasinteRvention (n=103) contRol (n=34)
findingS Of chaptEr 5.4.
•Generalanalysisofrespondents’perceptionistrendedupward.Theinterventiongrouprevealedmoresignificantpositivechangesthan in the control group.
•Inthebasicsurveyhalfofrespondentswasnotconfidentonlosingtheircollateralassets.Therateofrespondentsfullyconfidentthat the bank/MFI won’t take possession of their collateral assets to compensate the debt has increase after consultations. Whereas in the control group this parameter didn’t change.
•Intheinterventiongroupperceptionofshort-termloanobjectivesshiftedtowardslong-termobjectivesinthe3rdsurvey.Inthecontrol group it went towards short-term objectives.
•Themajorityofrespondentbelievethatloansimprovetheirlifequality(answered“stronglyagree”and“partlyagree”).The3rd survey showed that in the intervention group increased rate (+5% of base level) of respondent who do not believe borrowed money improve their life quality. In the control group this % decreased (-8% of base level).
•Approximately90%ofrespondentsfeelconfidentmakingfinancialplans.Acrosstheinterventiongrouprateofrespondentswhofeel confi dent making fi nancial plans grew after consultations by 5% of base level in the second survey and 13% in the 3rd survey. In the control group this parameter decreased in the 3rd survey by 5% of base level.
•Themajorityofrespondents(approximately80%)areconfidenttheyarecapableofbeingmoreefficientwiththeirexpenditures.
• Most respondent believe their loanpayments are not difficult tomake. Only 15-20% in bothgroupsmentioned that theyexperienced diffi culties paying off their loans. In the intervention group less than 20% think they have no diffi culties with payoff s but have delays. this % is higher in the control group (28-36%). thus, even though those borrowers are able to make payments in time they still make delays.
•AcrossNaryninterventiongroupthe%ofrespondentswhoarefirmlyconfidentinkeepingtheircollaterals,incapabilityofbeingmore cost effi cient and improvement of their fi nancial situation next year is signifi cantly lower that in talas.
•Theaggregateparameterofrespondents’perceptionoftheirfinancialsituationandthedegreeofpreparednessintheinterventiongroup shows higher % of optimistic respondents in talas than in naryn. the amount of pessimistic respondents in naryn was quite high (68%) in the 3rd survey whereas in talas it was only 11% Across the control group the situation is opposite – there were more optimists in naryn than in talas.
•Naryninterventiongrouprevealedincreaseof%ofpositiveandneutralandpositiverespondentsinthe2nd survey, although it decreased in the 3rd survey with increase of pessimists. talas shows continuous growth of rate of neutral and positive respondents.

64
5.5. aCtIonsWithin the framework of this study was important to fi gure out how consultations infl uenced actions of borrowers. Because eventually only real actions can lead to future fi nancial stability.
Financial awareness and perception of loans were reviewed in the previous sections of this report. this section reviews practical actions taken by borrowers in order to improve their fi nancial situation (My last payment was made on time; I sold property to make loan/debt payments; I set fi nancial goals for the next several months; I discussed our incomes and expenditures with my family etc.), their fi nancial future plans (I will make the next payment on my loan/debt on time; If I encounter diffi culties with loan payments in the future than I will...).
the majority of borrowers (over 80%) made their previous payments promptly as the result of basic survey indicate. In the second survey the % of borrowers who had payment delays decreased by 2% across the intervention group. At the same time 5% of borrowers paid off their debts. In the control group this parameter increased by 8% and 3% paid off their debts.
FIGURe 5.5.1. MY LASt pAYMent On MY LOAn/DeBt WAS MADe On tIMeInteRVentIOn (n=211) COntROL (n=79)
Almost all borrowers believe they will make their next payment on time. this situation is enforced by the high % of respondents who are convinced they can control their fi nancial situation (Section 5.4). In the intervention group the rate of respondents uncertain they can make next payment on time increased by 15% in the 3rd survey against the previous survey. For the control group this parameter did not change.
the number of borrowers who think they will delay next loan payment is higher than the number of borrowers who delayed their previous payment across the intervention group. In the control group this number is higher in the 3rd survey only.
FIGURe 5.5.2. I WILL MAKe neXt pAYMent On MY LOAn/DeBt On tIMeInteRVentIOn (n=211) COntROL (n=79)
66
5.5. aCtIonswithin the framework of this study was important to figure out how consultations influenced actions of borrowers. because eventually only real actions can lead to future financial stability.
financial awareness and perception of loans were reviewed in the previous sections of this report. this section reviews practical actions taken by borrowers in order to improve their financial situation (My last payment was made on time; i sold property to make loan/debt payments; i set financial goals for the next several months; i discussed our incomes and expenditures with my family etc.), their financial future plans (i will make the next payment on my loan/debt on time; if i encounter difficulties with loan payments in the future than i will...).
the majority of borrowers (over 80%) made their previous payments promptly as the result of basic survey indicate. in the second survey the % of borrowers who had payment delays decreased by 2% across the intervention group. at the same time 5% of borrowers paid off their debts. in the control group this parameter increased by 8% and 3% paid off their debts.
figuRe 5.5.1. My last payMent on My loan/debt was Made on tiMeinteRvention (n=211) contRol (n=79)
almost all borrowers believe they will make their next payment on time. this situation is enforced by the high % of respondents who are convinced they can control their financial situation (section 5.4). in the intervention group the rate of respondents uncertain they can make next payment on time increased by 15% in the 3rd survey against the previous survey. for the control group this parameter did not change.
the number of borrowers who think they will delay next loan payment is higher than the number of borrowers who delayed their previous payment across the intervention group. in the control group this number is higher in the 3rd survey only.
figuRe 5.5.2. i will MaKe neXt payMent on My loan/debt on tiMeЯinteRvention (n=211) contRol (n=79)
67
almost all borrowers believe they will make their next payment on time. this situation is enforced by the high % of respondents who are convinced they can control their financial situation (section 5.4). in the intervention group the rate of respondents uncertain they can make next payment on time increased by 15% in the 3rd survey against the previous survey. for the control group this parameter did not change.
the number of borrowers who think they will delay next loan payment is higher than the number of borrowers who delayed their previous payment across the intervention group. in the control group this number is higher in the 3rd survey only.
figuRe 5.5.3. i Made pRevious payMent and will MaKe neXt payMent My loan/debt on tiMe. naRyninteRvention (n=108) contRol (n=45)
figuRe 5.5.4. i Made pRevious payMent and will MaKe neXt payMent My loan/debt on tiMe. talasinteRvention (n=103) contRol (n=34)
the basic survey indicates that a significant number (over 30%) of responders stated they consulted their financial organization about debt payment postponement/restructuring. later on this number decreased across the intervention group as well as the number of respondent without difficulties making payments increased by 50%. increase of the number of respondents free of difficulties making debt payments observed in the control group was bigger.
figuRe 5.5.5. i consulted with My financial institution (banK, Mfi) about postponeMent/RestRuctuRing of My active debt in the past thRee MonthsinteRvention (n=211) contRol (n=79)

65
66
5.5. aCtIonswithin the framework of this study was important to figure out how consultations influenced actions of borrowers. because eventually only real actions can lead to future financial stability.
financial awareness and perception of loans were reviewed in the previous sections of this report. this section reviews practical actions taken by borrowers in order to improve their financial situation (My last payment was made on time; i sold property to make loan/debt payments; i set financial goals for the next several months; i discussed our incomes and expenditures with my family etc.), their financial future plans (i will make the next payment on my loan/debt on time; if i encounter difficulties with loan payments in the future than i will...).
the majority of borrowers (over 80%) made their previous payments promptly as the result of basic survey indicate. in the second survey the % of borrowers who had payment delays decreased by 2% across the intervention group. at the same time 5% of borrowers paid off their debts. in the control group this parameter increased by 8% and 3% paid off their debts.
figuRe 5.5.1. My last payMent on My loan/debt was Made on tiMeinteRvention (n=211) contRol (n=79)
almost all borrowers believe they will make their next payment on time. this situation is enforced by the high % of respondents who are convinced they can control their financial situation (section 5.4). in the intervention group the rate of respondents uncertain they can make next payment on time increased by 15% in the 3rd survey against the previous survey. for the control group this parameter did not change.
the number of borrowers who think they will delay next loan payment is higher than the number of borrowers who delayed their previous payment across the intervention group. in the control group this number is higher in the 3rd survey only.
figuRe 5.5.2. i will MaKe neXt payMent on My loan/debt on tiMeЯinteRvention (n=211) contRol (n=79)
Almost all borrowers believe they will make their next payment on time. this situation is enforced by the high % of respondents who are convinced they can control their fi nancial situation (Section 5.4). In the intervention group the rate of respondents uncertain they can make next payment on time increased by 15% in the 3rd survey against the previous survey. For the control group this parameter did not change.
the number of borrowers who think they will delay next loan payment is higher than the number of borrowers who delayed their previous payment across the intervention group. In the control group this number is higher in the 3rd survey only.
FIGURe 5.5.3. I MADe pReVIOUS pAYMent AnD WILL MAKe neXt pAYMent MY LOAn/DeBt On tIMe. nARYnInteRVentIOn (n=108) COntROL (n=45)
FIGURe 5.5.4. I MADe pReVIOUS pAYMent AnD WILL MAKe neXt pAYMent MY LOAn/DeBt On tIMe. tALASInteRVentIOn (n=103) COntROL (n=34)
the basic survey indicates that a signifi cant number (over 30%) of responders stated they consulted their fi nancial organization about debt payment postponement/restructuring. Later on this number decreased across the intervention group as well as the number of respondent without diffi culties making payments increased by 50%. Increase of the number of respondents free of diffi culties making debt payments observed in the control group was bigger.
FIGURe 5.5.5. I COnSULteD WIth MY FInAnCIAL InStItUtIOn (BAnK, MFI) ABOUt pOStpOneMent/ReStRUCtURInG OF MY ACtIVe DeBt In the pASt thRee MOnthSInteRVentIOn (n=211) COntROL (n=79)
67
almost all borrowers believe they will make their next payment on time. this situation is enforced by the high % of respondents who are convinced they can control their financial situation (section 5.4). in the intervention group the rate of respondents uncertain they can make next payment on time increased by 15% in the 3rd survey against the previous survey. for the control group this parameter did not change.
the number of borrowers who think they will delay next loan payment is higher than the number of borrowers who delayed their previous payment across the intervention group. in the control group this number is higher in the 3rd survey only.
figuRe 5.5.3. i Made pRevious payMent and will MaKe neXt payMent My loan/debt on tiMe. naRyninteRvention (n=108) contRol (n=45)
figuRe 5.5.4. i Made pRevious payMent and will MaKe neXt payMent My loan/debt on tiMe. talasinteRvention (n=103) contRol (n=34)
the basic survey indicates that a significant number (over 30%) of responders stated they consulted their financial organization about debt payment postponement/restructuring. later on this number decreased across the intervention group as well as the number of respondent without difficulties making payments increased by 50%. increase of the number of respondents free of difficulties making debt payments observed in the control group was bigger.
figuRe 5.5.5. i consulted with My financial institution (banK, Mfi) about postponeMent/RestRuctuRing of My active debt in the past thRee MonthsinteRvention (n=211) contRol (n=79)

66
Most respondents did not sell their property to repay the debts. there is a noticeable decline in the share of borrowers who sold their property for debt repayment in regards to the 2 groups in the second measurement.
FIGURe 5.5.6. I SOLD MY pROpeRtY FOR DeBt/LOAn RepAYMent InteRVentIOn (n=211) COntROL (n=79)
Dynamics of borrowers who are planning to take a new loan while repaying the current loan, or within 12 months after the repayment of debt has a decreasing trend. the percentage of respondents planning to take a new loan while still repaying current debt is slightly below the percentage of borrowers who are planning to take a new loan after closing previous one. Most likely this is due to the fact that borrowers understand the diffi culty of repaying several parallel loans. the percentage of respondents planning to take new loans has a decreasing trend. As mentioned earlier it is impossible to fully assert that the respondents in the control group were not infl uenced.
FIGURe 5.5.7. I pLAn tO BORROW AGAIn (WIthIn 12 MOnthS) AFteR RepAYInG thIS LOAnInteRVentIOn (n=211) COntROL (n=79)
FIGURe 5.5.8. I pLAn tO BORROW AGAIn WhILe StILL RepAYInG thIS LOAnInteRVentIOn (n=211) COntROL (n=79)
Only about half (47%) of respondents in the intervention group said that they made family budget before baseline survey. percentage of respondents who planned family budget is higher in the control group than in the intervention.
68
Most respondents did not sell their property to repay the debts. there is a noticeable decline in the share of borrowers who sold their property for debt repayment in regards to the 2 groups in the second measurement.
figuRe 5.5.6. i sold My pRopeRty foR debt/loan RepayMent inteRvention (n=211) contRol (n=79)
dynamics of borrowers who are planning to take a new loan while repaying the current loan, or within 12 months after the repayment of debt has a decreasing trend. the percentage of respondents planning to take a new loan while still repaying current debt is slightly below the percentage of borrowers who are planning to take a new loan after closing previous one. Most likely this is due to the fact that borrowers understand the difficulty of repaying several parallel loans. the percentage of respondents planning to take new loans has a decreasing trend. as mentioned earlier it is impossible to fully assert that the respondents in the control group were not influenced.
figuRe 5.5.7. i plan to boRRow again (within 12 Months) afteR Repaying this loaninteRvention (n=211) contRol (n=79)
figuRe 5.5.8. i plan to boRRow again while still Repaying this loaninteRvention (n=211) contRol (n=79)
only about half (47%) of respondents in the intervention group said that they made family budget before baseline survey. percentage of respondents who planned family budget is higher in the control group than in the intervention.
69
figuRe 5.5.9. i have Made a faMily budget (wRitten down incoMes and eXpenses) in the past 3 MonthsinteRvention (n=211) contRol (n=79)
in the 2nd survey in naryn and talas, the share of respondents that made family budget in the aftermath of consultations has increased. then by the 3rd measurement this level decreased in naryn (-21%) and continued to grow in talas (+ 6%). it can be assumed that the consultation gave a more long-term effect on the respondents from talas than from naryn.
figuRe 5.5.10. i have Made a faMily budget (wRitten down eXpenses and incoMes) in the past 3 Months, naRyninteRvention (n=108) contRol (n=45)
figuRe 5.5.11. i have Made a faMily budget (wRitten down eXpenses and incoMes) in the past 3 Months, talasinteRvention (n=103) contRol (n=34)
baseline survey showed that 60% of the respondents in the intervention group made finance planning, this percentage is higher in control group constituting 76%. in intervention group the proportion of respondents who made finance planning by the 2nd measurement sharply increased in naryn (+ 20%) and remained virtually unchanged in talas. however, by the 3rd measurement in naryn this level decreased by 19% and increased by 18% in talas. in the control group, the percentage of people who set financial goals has a decreasing trend in naryn and increasing trend in talas.

67 68
Most respondents did not sell their property to repay the debts. there is a noticeable decline in the share of borrowers who sold their property for debt repayment in regards to the 2 groups in the second measurement.
figuRe 5.5.6. i sold My pRopeRty foR debt/loan RepayMent inteRvention (n=211) contRol (n=79)
dynamics of borrowers who are planning to take a new loan while repaying the current loan, or within 12 months after the repayment of debt has a decreasing trend. the percentage of respondents planning to take a new loan while still repaying current debt is slightly below the percentage of borrowers who are planning to take a new loan after closing previous one. Most likely this is due to the fact that borrowers understand the difficulty of repaying several parallel loans. the percentage of respondents planning to take new loans has a decreasing trend. as mentioned earlier it is impossible to fully assert that the respondents in the control group were not influenced.
figuRe 5.5.7. i plan to boRRow again (within 12 Months) afteR Repaying this loaninteRvention (n=211) contRol (n=79)
figuRe 5.5.8. i plan to boRRow again while still Repaying this loaninteRvention (n=211) contRol (n=79)
only about half (47%) of respondents in the intervention group said that they made family budget before baseline survey. percentage of respondents who planned family budget is higher in the control group than in the intervention.
68
Most respondents did not sell their property to repay the debts. there is a noticeable decline in the share of borrowers who sold their property for debt repayment in regards to the 2 groups in the second measurement.
figuRe 5.5.6. i sold My pRopeRty foR debt/loan RepayMent inteRvention (n=211) contRol (n=79)
dynamics of borrowers who are planning to take a new loan while repaying the current loan, or within 12 months after the repayment of debt has a decreasing trend. the percentage of respondents planning to take a new loan while still repaying current debt is slightly below the percentage of borrowers who are planning to take a new loan after closing previous one. Most likely this is due to the fact that borrowers understand the difficulty of repaying several parallel loans. the percentage of respondents planning to take new loans has a decreasing trend. as mentioned earlier it is impossible to fully assert that the respondents in the control group were not influenced.
figuRe 5.5.7. i plan to boRRow again (within 12 Months) afteR Repaying this loaninteRvention (n=211) contRol (n=79)
figuRe 5.5.8. i plan to boRRow again while still Repaying this loaninteRvention (n=211) contRol (n=79)
only about half (47%) of respondents in the intervention group said that they made family budget before baseline survey. percentage of respondents who planned family budget is higher in the control group than in the intervention.
FIGURe 5.5.9. I hAVe MADe A FAMILY BUDGet (WRItten DOWn InCOMeS AnD eXpenSeS) In the pASt 3 MOnthSInteRVentIOn (n=211) COntROL (n=79)
In the 2nd survey in naryn and talas, the share of respondents that made family budget in the aftermath of consultations has increased. then by the 3rd measurement this level decreased in naryn (-21%) and continued to grow in talas (+ 6%). It can be assumed that the consultation gave a more long-term eff ect on the respondents from talas than from naryn.
FIGURe 5.5.10. I hAVe MADe A FAMILY BUDGet (WRItten DOWn eXpenSeS AnD InCOMeS) In the pASt 3 MOnthS, nARYnInteRVentIOn (n=108) COntROL (n=45)
FIGURe 5.5.11. I hAVe MADe A FAMILY BUDGet (WRItten DOWn eXpenSeS AnD InCOMeS) In the pASt 3 MOnthS, tALASInteRVentIOn (n=103) COntROL (n=34)
Baseline survey showed that 60% of the respondents in the intervention group made fi nance planning, this percentage is higher in control group constituting 76%. In intervention group the proportion of respondents who made fi nance planning by the 2nd measurement sharply increased in naryn (+ 20%) and remained virtually unchanged in talas. however, by the 3rd measurement in naryn this level decreased by 19% and increased by 18% in talas. In the control group, the percentage of people who set fi nancial goals has a decreasing trend in naryn and increasing trend in talas.
69
figuRe 5.5.9. i have Made a faMily budget (wRitten down incoMes and eXpenses) in the past 3 MonthsinteRvention (n=211) contRol (n=79)
in the 2nd survey in naryn and talas, the share of respondents that made family budget in the aftermath of consultations has increased. then by the 3rd measurement this level decreased in naryn (-21%) and continued to grow in talas (+ 6%). it can be assumed that the consultation gave a more long-term effect on the respondents from talas than from naryn.
figuRe 5.5.10. i have Made a faMily budget (wRitten down eXpenses and incoMes) in the past 3 Months, naRyninteRvention (n=108) contRol (n=45)
figuRe 5.5.11. i have Made a faMily budget (wRitten down eXpenses and incoMes) in the past 3 Months, talasinteRvention (n=103) contRol (n=34)
baseline survey showed that 60% of the respondents in the intervention group made finance planning, this percentage is higher in control group constituting 76%. in intervention group the proportion of respondents who made finance planning by the 2nd measurement sharply increased in naryn (+ 20%) and remained virtually unchanged in talas. however, by the 3rd measurement in naryn this level decreased by 19% and increased by 18% in talas. in the control group, the percentage of people who set financial goals has a decreasing trend in naryn and increasing trend in talas.

68
FIGURe 5.5.12. I hAVe Set FInAnCIAL GOALS FOR the neXt FeW MOnthS, nARYnInteRVentIOn (n=108) COntROL (n=45)
FIGURe 5.5.13. I hAVe Set FInAnCIAL GOALS FOR the neXt FeW MOnthS. tALASInteRVentIOn (n=103) COntROL(n=34)
the percentage of respondents who discussed their incomes and expenses with their families is higher in talas than in naryn. this level has increased by 4% by the second measurement in naryn and remained virtually unchanged in talas. But by the 3rd
measurement it decreased by 8% in naryn and increased by 8% in talas. In the control group this fi gure by the 2nd measurement decreased by 5% in naryn and 26% in talas, while by the 3rd measurement it reached previous level (56%) in naryn and increased by 20% in talas in comparison to the 2nd measurement.
FIGURe 5.5.14. I hAVe DISCUSSeD WIth MY FAMILY OUR InCOMeS AnD eXpenSeS, nARYnInteRVentIOn (n=108) COntROL (n=45)
FIGURe 5.5.15. I hAVe DISCUSSeD WIth MY FAMILY OUR InCOMeS AnD eXpenSeS. tALASInteRVentIOn (n=103) COntROL(n=34)
Intervention group. More than 70% of respondents indicated in the baseline survey that they spend enough money for family. however, the percentage of respondents who do not spend enough money in the baseline survey was quite high (over 20%). After
70
figuRe 5.5.12. i have set financial goals foR the neXt few Months, naRyninteRvention (n=108) contRol (n=45)
figuRe 5.5.13. i have set financial goals foR the neXt few Months. talasinteRvention (n=103) contRol(n=34)
the percentage of respondents who discussed their incomes and expenses with their families is higher in talas than in naryn. this level has increased by 4% by the second measurement in naryn and remained virtually unchanged in talas. but by the 3rd measurement it decreased by 8% in naryn and increased by 8% in talas. in the control group this figure by the 2nd measurement decreased by 5% in naryn and 26% in talas, while by the 3rd measurement it reached previous level (56%) in naryn and increased by 20% in talas in comparison to the 2nd measurement.
figuRe 5.5.14. i have discussed with My faMily ouR incoMes and eXpenses, naRyninteRvention (n=108) contRol (n=45)
figuRe 5.5.15. i have discussed with My faMily ouR incoMes and eXpenses. talasinteRvention (n=103) contRol(n=34)
intervention group. More than 70% of respondents indicated in the baseline survey that they spend enough money for family. however, the percentage of respondents who do not spend enough money in the baseline survey was quite high (over 20%). after
71
providing consultation by the 2nd measurement the share of borrowers in naryn who believe that they spend enough money for family has increased by 6%, in talas by 9%. then by the 3rd measurement this indicator fell sharply in naryn by 25% and grew in talas by another 6%.
control group. the percentage of respondents who spend sufficient money for families in naryn first fell by the 2nd measurement (-13%), and then increased by 27%. in talas this level increased all the time and by the final survey reached 100%.
figuRe 5.5.16. i spend enough Money on food, clothing, tRanspoRt to Keep My faMily well. naRyninteRvention (n=108) contRol(n=45)
figuRe 5.5.17. i spend enough Money on food, clothing, tRanspoRt to Keep My faMily well, talasinteRvention (n=103) contRol(n=34)
level of respondents inclined towards borrowing rather than saving in advance is higher in naryn than in talas.
figuRe 5.5.18. i pRefeR to boRRow Money (when i need theM) RatheR than save in advance, naRyninteRvention (n=108) contRol(n=45)
figuRe 5.5.19. i pRefeR to boRRow Money (when i need theM) RatheR than save in advance, talasinteRvention (n=103) contRol(n=34)

69 70
figuRe 5.5.12. i have set financial goals foR the neXt few Months, naRyninteRvention (n=108) contRol (n=45)
figuRe 5.5.13. i have set financial goals foR the neXt few Months. talasinteRvention (n=103) contRol(n=34)
the percentage of respondents who discussed their incomes and expenses with their families is higher in talas than in naryn. this level has increased by 4% by the second measurement in naryn and remained virtually unchanged in talas. but by the 3rd measurement it decreased by 8% in naryn and increased by 8% in talas. in the control group this figure by the 2nd measurement decreased by 5% in naryn and 26% in talas, while by the 3rd measurement it reached previous level (56%) in naryn and increased by 20% in talas in comparison to the 2nd measurement.
figuRe 5.5.14. i have discussed with My faMily ouR incoMes and eXpenses, naRyninteRvention (n=108) contRol (n=45)
figuRe 5.5.15. i have discussed with My faMily ouR incoMes and eXpenses. talasinteRvention (n=103) contRol(n=34)
intervention group. More than 70% of respondents indicated in the baseline survey that they spend enough money for family. however, the percentage of respondents who do not spend enough money in the baseline survey was quite high (over 20%). after
70
figuRe 5.5.12. i have set financial goals foR the neXt few Months, naRyninteRvention (n=108) contRol (n=45)
figuRe 5.5.13. i have set financial goals foR the neXt few Months. talasinteRvention (n=103) contRol(n=34)
the percentage of respondents who discussed their incomes and expenses with their families is higher in talas than in naryn. this level has increased by 4% by the second measurement in naryn and remained virtually unchanged in talas. but by the 3rd measurement it decreased by 8% in naryn and increased by 8% in talas. in the control group this figure by the 2nd measurement decreased by 5% in naryn and 26% in talas, while by the 3rd measurement it reached previous level (56%) in naryn and increased by 20% in talas in comparison to the 2nd measurement.
figuRe 5.5.14. i have discussed with My faMily ouR incoMes and eXpenses, naRyninteRvention (n=108) contRol (n=45)
figuRe 5.5.15. i have discussed with My faMily ouR incoMes and eXpenses. talasinteRvention (n=103) contRol(n=34)
intervention group. More than 70% of respondents indicated in the baseline survey that they spend enough money for family. however, the percentage of respondents who do not spend enough money in the baseline survey was quite high (over 20%). after
providing consultation by the 2nd measurement the share of borrowers in naryn who believe that they spend enough money for family has increased by 6%, in talas by 9%. then by the 3rd measurement this indicator fell sharply in naryn by 25% and grew in talas by another 6%.
Control group. the percentage of respondents who spend suffi cient money for families in naryn fi rst fell by the 2nd measurement (-13%), and then increased by 27%. In talas this level increased all the time and by the fi nal survey reached 100%.
FIGURe 5.5.16. I SpenD enOUGh MOneY On FOOD, CLOthInG, tRAnSpORt tO Keep MY FAMILY WeLL. nARYnInteRVentIOn (n=108) COntROL(n=45)
FIGURe 5.5.17. I SpenD enOUGh MOneY On FOOD, CLOthInG, tRAnSpORt tO Keep MY FAMILY WeLL, tALASInteRVentIOn (n=103) COntROL(n=34)
Level of respondents inclined towards borrowing rather than saving in advance is higher in naryn than in talas.
FIGURe 5.5.18. I pReFeR tO BORROW MOneY (When I neeD theM) RAtheR thAn SAVe In ADVAnCe, nARYnInteRVentIOn (n=108) COntROL(n=45)
FIGURe 5.5.19. I pReFeR tO BORROW MOneY (When I neeD theM) RAtheR thAn SAVe In ADVAnCe, tALASInteRVentIOn (n=103) COntROL(n=34)
71
providing consultation by the 2nd measurement the share of borrowers in naryn who believe that they spend enough money for family has increased by 6%, in talas by 9%. then by the 3rd measurement this indicator fell sharply in naryn by 25% and grew in talas by another 6%.
control group. the percentage of respondents who spend sufficient money for families in naryn first fell by the 2nd measurement (-13%), and then increased by 27%. in talas this level increased all the time and by the final survey reached 100%.
figuRe 5.5.16. i spend enough Money on food, clothing, tRanspoRt to Keep My faMily well. naRyninteRvention (n=108) contRol(n=45)
figuRe 5.5.17. i spend enough Money on food, clothing, tRanspoRt to Keep My faMily well, talasinteRvention (n=103) contRol(n=34)
level of respondents inclined towards borrowing rather than saving in advance is higher in naryn than in talas.
figuRe 5.5.18. i pRefeR to boRRow Money (when i need theM) RatheR than save in advance, naRyninteRvention (n=108) contRol(n=45)
figuRe 5.5.19. i pRefeR to boRRow Money (when i need theM) RatheR than save in advance, talasinteRvention (n=103) contRol(n=34)

70
the percentage of respondents who do not know what to do in the event of diffi culties in payment of loans has a decreasing trend in the two groups. however, in the 2nd measurement the intervention group has a greater decrease (-9%) than control group (-5%). Also percentage of respondents who would apply to other MFI for new loans has decreased: this reduction in intervention group by 2nd measurement constituted 12%, in the control group – 10%. the most popular source of help in solving the problems with the payment is a loan institution where respondents obtain their loans. the total increase in the percentage of respondents who perceive their loan institution as an advisor in the intervention group was 31%, in the control group 27%.
Results of the 2nd survey showed that lower percentage of respondents in intervention group will part with their assets to repay some part of their loans than in control group.
FIGURe 5.5.20. “WhAt WILL YOU DO In the eVent OF DIFFICULtIeS WIth LOAn RepAYMent In the FUtURe?” InteRVentIOn GROUp. n=211
FIGURe 5.5.21. “WhAt WILL YOU DO In the eVent OF DIFFICULtIeS WIth LOAn RepAYMent In the FUtURe?” COntROL GROUp. n=79
the issues discussed in this chapter describe the actions, activities that respondents have undertaken or plan to take in relation to fi nancial planning. Respondents were classifi ed into 3 groups by the degree of their action.
Report on Main Results of the Survey on the Impact of Counseling on Knowledge, Feelings and Actions of Over-Indebted Borrowers, 2016
64
Level of respondents inclined towards borrowing rather than saving in advance is higher in Naryn than in Talas.
FIGURE 5.5.18. I PREFER TO BORROW MONEY (WHEN I NEED THEM) RATHER THAN SAVE IN ADVANCE, NARYN
INTERVENTION (N=108) CONTROL(N=45)
FIGURE 5.5.19. I PREFER TO BORROW MONEY (WHEN I NEED THEM) RATHER THAN SAVE IN
ADVANCE, TALASINTERVENTION (N=103) CONTROL(N=34)
The percentage of respondents who do not know what to do in the event of difficulties in payment of loans has a decreasing trend in the two groups. However, in the 2nd measurement the intervention group has a greater decrease (-9%) than control group (-5%). Also percentage of respondents who would apply to other MFI for new loans has decreased: this reduction in intervention group by 2nd
measurement constituted 12%, in the control group - 10%. The most popular source of help in solving the problems with the payment is a loan institution where respondents obtain their loans. The total increase in the percentage of respondents who perceive their loan institution as an advisor in the intervention group was 31%, in the control group 27%.
Results of the 2nd survey showed that lower percentage of respondents in intervention group will part with their assets to repay some part of their loans than in control group.
FIGURE 5.5.20. “WHAT WILL YOU DO IN THE EVENT OF DIFFICULTIES WITH LOANREPAYMENT IN THE FUTURE?” INTERVENTION GROUP. N=211
I will do nothing because I do not know what to do I will approach some other loan institution to obtain a new loan
I perceive loan company as my adviser
I will part with some assets in order to repay a part of loan
Seek an advice from my relatives
Sell livestock, agricultural products
No difficulties
I will save more (cut down expenses)
Baseline Interim Final
Report on Main Results of the Survey on the Impact of Counseling on Knowledge, Feelings and Actions of Over-Indebted Borrowers, 2016
65
FIGURE 5.5.21. “WHAT WILL YOU DO IN THE EVENT OF DIFFICULTIES WITH LOAN REPAYMENT IN THE FUTURE?” CONTROL GROUP. N=79
The issues discussed in this chapter describe the actions, activities that respondents have undertaken or plan to take in relation to financial planning. Respondents were classified into 3 groups by the degree of their action. Classification by the degree of financial activity was based on the following questions:
I made my previous debt payment on time.
I will make my next debt payment on time.
I have consulted with my financial institution about restructuring/rescheduling my debt during last 3 months.
I sold property in order to repay loans in the past 3 months.
I plan to borrow again (within 12 months) after repaying this loan.
I plan to borrow again while repaying this loan.
I have made a family budget (written down expenses and income) in the past 3 months.
I have set financial goals for the future in the past 3 months.
I have discussed with my family our income and expenses in the past 3 months.
I am spending enough money on food, clothing, transportation to keep my family well.
What will you do in the event of difficulties with loan repayment in the future?
I will do nothing because I do not know what to do
I will approach some other loan institution to obtain a new loan
I perceive loan company as my adviser
I will part with some assets in order to repay a part of loan
Seek an advice from my relatives
Sell livestock, agricultural products
Baseline Interim Final
73
classification by the degree of financial activity was based on the following questions:
percentage of respondents with active financial behavior is significantly higher in talas than in naryn.
intervention group. by the 2nd measurement there is a greater growth of active respondents in naryn (+17%) than in talas (+9%). however, later by the final survey this level decreased in naryn (-19%) and increased in talas (+13%). level of passive respondents in naryn decreased after consultations by the 2nd measurement (-9%) and increased by 12% by the 3rd survey. there is a decreasing trend in terms of passive respondents in talas and by the 3rd measurement there were no passive respondents.
control group. there were no significant changes in terms of financial activity. a growth in active respondents is observed in talas.
figuRe 5.5.22. financial activity. naRyninteRvention (n=108) contRol(n=45)
figuRe 5.5.23. financial activity. talasinteRvention (n=103) contRol(n=34)
Report on Main Results of the Survey on the Impact of Counseling on Knowledge, Feelings and Actions of Over-Indebted Borrowers, 2016
64
Level of respondents inclined towards borrowing rather than saving in advance is higher in Naryn than in Talas.
FIGURE 5.5.18. I PREFER TO BORROW MONEY (WHEN I NEED THEM) RATHER THAN SAVE IN ADVANCE, NARYN
INTERVENTION (N=108) CONTROL(N=45)
FIGURE 5.5.19. I PREFER TO BORROW MONEY (WHEN I NEED THEM) RATHER THAN SAVE IN
ADVANCE, TALASINTERVENTION (N=103) CONTROL(N=34)
The percentage of respondents who do not know what to do in the event of difficulties in payment of loans has a decreasing trend in the two groups. However, in the 2nd measurement the intervention group has a greater decrease (-9%) than control group (-5%). Also percentage of respondents who would apply to other MFI for new loans has decreased: this reduction in intervention group by 2nd
measurement constituted 12%, in the control group - 10%. The most popular source of help in solving the problems with the payment is a loan institution where respondents obtain their loans. The total increase in the percentage of respondents who perceive their loan institution as an advisor in the intervention group was 31%, in the control group 27%.
Results of the 2nd survey showed that lower percentage of respondents in intervention group will part with their assets to repay some part of their loans than in control group.
FIGURE 5.5.20. “WHAT WILL YOU DO IN THE EVENT OF DIFFICULTIES WITH LOANREPAYMENT IN THE FUTURE?” INTERVENTION GROUP. N=211
I will do nothing because I do not know what to do I will approach some other loan institution to obtain a new loan
I perceive loan company as my adviser
I will part with some assets in order to repay a part of loan
Seek an advice from my relatives
Sell livestock, agricultural products
No difficulties
I will save more (cut down expenses)
Baseline Interim Final
Report on Main Results of the Survey on the Impact of Counseling on Knowledge, Feelings and Actions of Over-Indebted Borrowers, 2016
65
FIGURE 5.5.21. “WHAT WILL YOU DO IN THE EVENT OF DIFFICULTIES WITH LOANREPAYMENT IN THE FUTURE?” CONTROL GROUP. N=79
The issues discussed in this chapter describe the actions, activities that respondents have undertaken or plan to take in relation to financial planning. Respondents were classified into 3 groups by the degree of their action. Classification by the degree of financial activity was based on the following questions:
I made my previous debt payment on time.
I will make my next debt payment on time.
I have consulted with my financial institution about restructuring/rescheduling my debt during last 3 months
I sold property in order to repay loans in the past 3 months
I plan to borrow again (within 12 months) after repaying this loan
I plan to borrow again while repaying this loan
I have made a family budget (written down expenses and income) in the past 3 months
I have set financial goals for the future in the past 3 months
I have discussed with my family our income and expenses in the past 3 months
I am spending enough money on food, clothing, transportation to keep my family well.
What will you do in the event of difficulties with loan repayment in the future?
I will do nothing because I do not know what to do
I will approach some other loan institution to obtain a new loan
I perceive loan company as my adviser
I will part with some assets in order to repay a part of loan
Seek an advice from my relatives
Sell livestock, agricultural products
Baseline Interim Final

71
Classifi cation by the degree of fi nancial activity was based on the following questions:
percentage of respondents with active fi nancial behavior is signifi cantly higher in talas than in naryn.
Intervention group. By the 2nd measurement there is a greater growth of active respondents in naryn (+17%) than in talas (+9%). however, later by the fi nal survey this level decreased in naryn (-19%) and increased in talas (+13%). Level of passive respondents in naryn decreased after consultations by the 2nd measurement (-9%) and increased by 12% by the 3rd survey. there is a decreasing trend in terms of passive respondents in talas and by the 3rd measurement there were no passive respondents.
Control group. there were no signifi cant changes in terms of fi nancial activity. A growth in active respondents is observed in talas.
FIGURe 5.5.22. FInAnCIAL ACtIVItY. nARYnInteRVentIOn (n=108) COntROL(n=45)
FIGURe 5.5.23. FInAnCIAL ACtIVItY. tALASInteRVentIOn (n=103) COntROL(n=34)
Report on Main Results of the Survey on the Impact of Counseling on Knowledge, Feelings and Actions of Over-Indebted Borrowers, 2016
65
FIGURE 5.5.21. “WHAT WILL YOU DO IN THE EVENT OF DIFFICULTIES WITH LOAN REPAYMENT IN THE FUTURE?” CONTROL GROUP. N=79
The issues discussed in this chapter describe the actions, activities that respondents have undertaken or plan to take in relation to financial planning. Respondents were classified into 3 groups by the degree of their action. Classification by the degree of financial activity was based on the following questions:
I made my previous debt payment on time.
I will make my next debt payment on time.
I have consulted with my financial institution about restructuring/rescheduling my debt during last 3 months.
I sold property in order to repay loans in the past 3 months.
I plan to borrow again (within 12 months) after repaying this loan.
I plan to borrow again while repaying this loan.
I have made a family budget (written down expenses and income) in the past 3 months.
I have set financial goals for the future in the past 3 months.
I have discussed with my family our income and expenses in the past 3 months.
I am spending enough money on food, clothing, transportation to keep my family well.
What will you do in the event of difficulties with loan repayment in the future?
I will do nothing because I do not know what to do
I will approach some other loan institution to obtain a new loan
I perceive loan company as my adviser
I will part with some assets in order to repay a part of loan
Seek an advice from my relatives
Sell livestock, agricultural products
Baseline Interim Final
73
classification by the degree of financial activity was based on the following questions:
percentage of respondents with active financial behavior is significantly higher in talas than in naryn.
intervention group. by the 2nd measurement there is a greater growth of active respondents in naryn (+17%) than in talas (+9%). however, later by the final survey this level decreased in naryn (-19%) and increased in talas (+13%). level of passive respondents in naryn decreased after consultations by the 2nd measurement (-9%) and increased by 12% by the 3rd survey. there is a decreasing trend in terms of passive respondents in talas and by the 3rd measurement there were no passive respondents.
control group. there were no significant changes in terms of financial activity. a growth in active respondents is observed in talas.
figuRe 5.5.22. financial activity. naRyninteRvention (n=108) contRol(n=45)
figuRe 5.5.23. financial activity. talasinteRvention (n=103) contRol(n=34)
Report on Main Results of the Survey on the Impact of Counseling on Knowledge, Feelings and Actions of Over-Indebted Borrowers, 2016
64
Level of respondents inclined towards borrowing rather than saving in advance is higher in Naryn than in Talas.
FIGURE 5.5.18. I PREFER TO BORROW MONEY (WHEN I NEED THEM) RATHER THAN SAVE IN ADVANCE, NARYN
INTERVENTION (N=108) CONTROL(N=45)
FIGURE 5.5.19. I PREFER TO BORROW MONEY (WHEN I NEED THEM) RATHER THAN SAVE IN
ADVANCE, TALASINTERVENTION (N=103) CONTROL(N=34)
The percentage of respondents who do not know what to do in the event of difficulties in payment of loans has a decreasing trend in the two groups. However, in the 2nd measurement the intervention group has a greater decrease (-9%) than control group (-5%). Also percentage of respondents who would apply to other MFI for new loans has decreased: this reduction in intervention group by 2nd
measurement constituted 12%, in the control group - 10%. The most popular source of help in solving the problems with the payment is a loan institution where respondents obtain their loans. The total increase in the percentage of respondents who perceive their loan institution as an advisor in the intervention group was 31%, in the control group 27%.
Results of the 2nd survey showed that lower percentage of respondents in intervention group will part with their assets to repay some part of their loans than in control group.
FIGURE 5.5.20. “WHAT WILL YOU DO IN THE EVENT OF DIFFICULTIES WITH LOANREPAYMENT IN THE FUTURE?” INTERVENTION GROUP. N=211
I will do nothing because I do not know what to do I will approach some other loan institution to obtain a new loan
I perceive loan company as my adviser
I will part with some assets in order to repay a part of loan
Seek an advice from my relatives
Sell livestock, agricultural products
No difficulties
I will save more (cut down expenses)
Baseline Interim Final
Report on Main Results of the Survey on the Impact of Counseling on Knowledge, Feelings and Actions of Over-Indebted Borrowers, 2016
65
FIGURE 5.5.21. “WHAT WILL YOU DO IN THE EVENT OF DIFFICULTIES WITH LOANREPAYMENT IN THE FUTURE?” CONTROL GROUP. N=79
The issues discussed in this chapter describe the actions, activities that respondents have undertaken or plan to take in relation to financial planning. Respondents were classified into 3 groups by the degree of their action. Classification by the degree of financial activity was based on the following questions:
I made my previous debt payment on time.
I will make my next debt payment on time.
I have consulted with my financial institution about restructuring/rescheduling my debt during last 3 months
I sold property in order to repay loans in the past 3 months
I plan to borrow again (within 12 months) after repaying this loan
I plan to borrow again while repaying this loan
I have made a family budget (written down expenses and income) in the past 3 months
I have set financial goals for the future in the past 3 months
I have discussed with my family our income and expenses in the past 3 months
I am spending enough money on food, clothing, transportation to keep my family well.
What will you do in the event of difficulties with loan repayment in the future?
I will do nothing because I do not know what to do
I will approach some other loan institution to obtain a new loan
I perceive loan company as my adviser
I will part with some assets in order to repay a part of loan
Seek an advice from my relatives
Sell livestock, agricultural products
Baseline Interim Final
Report on Main Results of the Survey on the Impact of Counseling on Knowledge, Feelings and Actions of Over-Indebted Borrowers, 2016
65
FIGURE 5.5.21. “WHAT WILL YOU DO IN THE EVENT OF DIFFICULTIES WITH LOANREPAYMENT IN THE FUTURE?” CONTROL GROUP. N=79
The issues discussed in this chapter describe the actions, activities that respondents have undertaken or plan to take in relation to financial planning. Respondents were classified into 3 groups by the degree of their action. Classification by the degree of financial activity was based on the following questions:
I made my previous debt payment on time.
I will make my next debt payment on time.
I have consulted with my financial institution about restructuring/rescheduling my debt during last 3 months
I sold property in order to repay loans in the past 3 months
I plan to borrow again (within 12 months) after repaying this loan
I plan to borrow again while repaying this loan
I have made a family budget (written down expenses and income) in the past 3 months
I have set financial goals for the future in the past 3 months
I have discussed with my family our income and expenses in the past 3 months
I am spending enough money on food, clothing, transportation to keep my family well.
What will you do in the event of difficulties with loan repayment in the future?
I will do nothing because I do not know what to do
I will approach some other loan institution to obtain a new loan
I perceive loan company as my adviser
I will part with some assets in order to repay a part of loan
Seek an advice from my relatives
Sell livestock, agricultural products
Baseline Interim Final
73
classification by the degree of financial activity was based on the following questions:
percentage of respondents with active financial behavior is significantly higher in talas than in naryn.
intervention group. by the 2nd measurement there is a greater growth of active respondents in naryn (+17%) than in talas (+9%). however, later by the final survey this level decreased in naryn (-19%) and increased in talas (+13%). level of passive respondents in naryn decreased after consultations by the 2nd measurement (-9%) and increased by 12% by the 3rd survey. there is a decreasing trend in terms of passive respondents in talas and by the 3rd measurement there were no passive respondents.
control group. there were no significant changes in terms of financial activity. a growth in active respondents is observed in talas.
figuRe 5.5.22. financial activity. naRyninteRvention (n=108) contRol(n=45)
figuRe 5.5.23. financial activity. talasinteRvention (n=103) contRol(n=34)
Report on Main Results of the Survey on the Impact of Counseling on Knowledge, Feelings and Actions of Over-Indebted Borrowers, 2016
64
Level of respondents inclined towards borrowing rather than saving in advance is higher in Naryn than in Talas.
FIGURE 5.5.18. I PREFER TO BORROW MONEY (WHEN I NEED THEM) RATHER THAN SAVE IN ADVANCE, NARYN
INTERVENTION (N=108) CONTROL(N=45)
FIGURE 5.5.19. I PREFER TO BORROW MONEY (WHEN I NEED THEM) RATHER THAN SAVE IN
ADVANCE, TALASINTERVENTION (N=103) CONTROL(N=34)
The percentage of respondents who do not know what to do in the event of difficulties in payment of loans has a decreasing trend in the two groups. However, in the 2nd measurement the intervention group has a greater decrease (-9%) than control group (-5%). Also percentage of respondents who would apply to other MFI for new loans has decreased: this reduction in intervention group by 2nd
measurement constituted 12%, in the control group - 10%. The most popular source of help in solving the problems with the payment is a loan institution where respondents obtain their loans. The total increase in the percentage of respondents who perceive their loan institution as an advisor in the intervention group was 31%, in the control group 27%.
Results of the 2nd survey showed that lower percentage of respondents in intervention group will part with their assets to repay some part of their loans than in control group.
FIGURE 5.5.20. “WHAT WILL YOU DO IN THE EVENT OF DIFFICULTIES WITH LOANREPAYMENT IN THE FUTURE?” INTERVENTION GROUP. N=211
I will do nothing because I do not know what to do I will approach some other loan institution to obtain a new loan
I perceive loan company as my adviser
I will part with some assets in order to repay a part of loan
Seek an advice from my relatives
Sell livestock, agricultural products
No difficulties
I will save more (cut down expenses)
Baseline Interim Final
Report on Main Results of the Survey on the Impact of Counseling on Knowledge, Feelings and Actions of Over-Indebted Borrowers, 2016
65
FIGURE 5.5.21. “WHAT WILL YOU DO IN THE EVENT OF DIFFICULTIES WITH LOANREPAYMENT IN THE FUTURE?” CONTROL GROUP. N=79
The issues discussed in this chapter describe the actions, activities that respondents have undertaken or plan to take in relation to financial planning. Respondents were classified into 3 groups by the degree of their action. Classification by the degree of financial activity was based on the following questions:
I made my previous debt payment on time.
I will make my next debt payment on time.
I have consulted with my financial institution about restructuring/rescheduling my debt during last 3 months
I sold property in order to repay loans in the past 3 months
I plan to borrow again (within 12 months) after repaying this loan
I plan to borrow again while repaying this loan
I have made a family budget (written down expenses and income) in the past 3 months
I have set financial goals for the future in the past 3 months
I have discussed with my family our income and expenses in the past 3 months
I am spending enough money on food, clothing, transportation to keep my family well.
What will you do in the event of difficulties with loan repayment in the future?
I will do nothing because I do not know what to do
I will approach some other loan institution to obtain a new loan
I perceive loan company as my adviser
I will part with some assets in order to repay a part of loan
Seek an advice from my relatives
Sell livestock, agricultural products
Baseline Interim Final
Report on Main Results of the Survey on the Impact of Counseling on Knowledge, Feelings and Actions of Over-Indebted Borrowers, 2016
65
FIGURE 5.5.21. “WHAT WILL YOU DO IN THE EVENT OF DIFFICULTIES WITH LOANREPAYMENT IN THE FUTURE?” CONTROL GROUP. N=79
The issues discussed in this chapter describe the actions, activities that respondents have undertaken or plan to take in relation to financial planning. Respondents were classified into 3 groups by the degree of their action. Classification by the degree of financial activity was based on the following questions:
I made my previous debt payment on time.
I will make my next debt payment on time.
I have consulted with my financial institution about restructuring/rescheduling my debt during last 3 months
I sold property in order to repay loans in the past 3 months
I plan to borrow again (within 12 months) after repaying this loan
I plan to borrow again while repaying this loan
I have made a family budget (written down expenses and income) in the past 3 months
I have set financial goals for the future in the past 3 months
I have discussed with my family our income and expenses in the past 3 months
I am spending enough money on food, clothing, transportation to keep my family well.
What will you do in the event of difficulties with loan repayment in the future?
I will do nothing because I do not know what to do
I will approach some other loan institution to obtain a new loan
I perceive loan company as my adviser
I will part with some assets in order to repay a part of loan
Seek an advice from my relatives
Sell livestock, agricultural products
Baseline Interim Final

72
findingS Of chaptEr 5.5.
As survey results have shown there is a positive dynamics in activities of respondents. Following represent main results in the analysis of activities of borrowers:
•Majority(morethan70%)ofrespondentshavemadetheirpreviousdebtrepaymentontime.Thispercentageisgreaterinintervention group than in control group.
•Astheresultsof3rdsurveyhaveshowntheactualpictureonmakingpreviouspaymentsunderloansturnedoutbetterthanexpected by respondents on carrying out these payments.
•Thereisadecreaseinpercentageofrespondentswhoapproachedtheirfinancialinstitutionfordebtrestructuringinbothgroups. Following from this background there is a growth in percentage of borrowers who did not experience difficulties in loan repayment.
•decreaseisobservedbothininterventionandcontrolgroups.Levelofrespondentswhoareplanningtoobtainaloanwhilestill repaying current loan is lower than the level of respondents who are planning to obtain a new loan after closing current loan.
• Afterconductionofconsultations in interventiongroupthere isasmallgrowth inpercentageof respondentswhomadetheir family budgets (+15%) in comparison to the decreased in control group (-5%). there is also a growing tendency in relation to questions on making family budget, discussing it with the family in talas, whereas in naryn this percentage increases more significantly by the 2nd measurement than in talas, and then decreases.
• Baseline survey showed that about 60% of respondents in intervention group were doing financial planning, and thisindicator in control group was greater – 76%. In intervention group by 2nd measurement the share of respondents who were making financial plans had a greater growth in naryn (+20%) and remained virtually unchanged in talas. however, in the 3rd measurement this level decreased by 19% in naryn, and increased by 18% in talas. In control group percentage of people who made financial plans has a decreasing trend in naryn and increasing trend in talas.
• PercentageofrespondentswhodiscussedtheirincomesandexpenseswiththeirfamiliesisgreaterinTalasthaninNaryn.this level in intervention group increased by 4% by the 2nd measurement in naryn and remained virtually unchanged in talas. however, by the 3rd measurement it decreased by 8% in naryn and increased by 8% in talas. In control group this indicator by the 2nd measurement decreased by 5% in naryn and by 26% in talas. By 3rd measurement it reached previous levels in naryn (56%), and increased in talas by 20% in comparison to the 2nd measurement.
• Majorityof respondentsspendenoughmoney for familymaintenance: food,clothing, transportationetc. In interventiongroup level of respondents whose quality of life from this perspective has increased from 77% in baseline measurement to 92% in the 3rd measurement in talas, however, this indicator has decreased from 70% to 51% in naryn. In intervention group there is a growth of this indicator in both cities.
• Thus,onecanconcludethat intermsofmakinganddiscussingfamilybudget,sufficientspendingonfamilymaintaining,setting financial goals there is a growing trend in talas. the level of financial activity in naryn rises significantly by the 2nd measurement than in talas and then it starts declining. these differences allow to assume that consultations in talas had a longer term effect on respondents than in naryn.
•Therearenosignificantchangesinpreferencetosaveorborrowfunding.Morethanhalfofrespondentsprefertosavemoneyrather than borrow.
•Analysisofcomprehensiveindicator,characterizingfinancialactivityofrespondentsshowedthatsuchactivityissignificantlyhigher in talas than in naryn. Respondents in naryn have a more passive behavior. By the end of survey after consultations in intervention group the level of respondents in talas with increased financial activity in comparison to baseline level has increased by 22%, whereas it declined in naryn by 12%.

73
6. aPPendIXesAppendixes contain tables which were not included into the main part of the report. Appendixes are divided in line with the report chapters and are named accordingly.
appEndix 1. dEgrEE Of OvEr-indEbtEdnESS
tABLe 1. DO YOU CURRentLY hAVe A LOAn In the FInAnCIAL InStItUtIOn?
Intervention group Control group
naryn (n=108) talas (n=103) naryn (n=45) talas (n=34)
1st surveyyes 94% 100% 100% 100%no 6% 0% 0% 0%
2nd surveyyes 95% 84% 93% 94%no 4% 6% 4% 3%
no loan 1% 10% 2% 3%
3rd surveyyes 76% 71% 62% 82%no 14% 4% 11% 0%
no loan 10% 25% 27% 18%
tABLe 2. DO YOU hAVe A LOAn WIth COLLAteRAL?
Intervention group Control group
Men (n=66) Women (n=145) Men (n=66) Women
(n=145)
1st survey
yes 48% 58% 53% 63%no 45% 40% 47% 37%
refused to answer 6% 2%
2nd surveyyes 45% 47% 56% 56%no 47% 49% 44% 40%
no loan 8% 4% 0% 5%
3rd surveyyes 36% 32% 39% 40%no 41% 53% 36% 40%
no loan 23% 15% 25% 21%

74
tABLe 3. CAn YOU CALCULAte YOUR LOAn AnD DeBt pAYMentS AnD YOUR hOUSehOLD’S LOAn AnD DeBt pAYMentS peR MOnth?”
Intervention group1st survey 2nd survey 3rd survey
naryn talas naryn talas naryn talasSignificantly lower than the
monthly family income 25% 30% 35% 21% 14% 12%
Slightly lower than the monthly family income 23% 17% 36% 23% 35% 24%
Equal to the monthly family income 18% 18% 11% 22% 23% 18%
Slightly higher than the monthly family income 14% 22% 8% 15% 12% 18%
Significantly higher than the monthly family income 15% 11% 8% 8% 6% 2%
no loan 1% 10% 10% 25%no answer 6% 2% 0% 1%
total100% 100% 100% 100% 100% 100%
108 103 108 103 108 103
tABLe 4. CAn YOU CALCULAte YOUR LOAn AnD DeBt pAYMentS AnD YOUR hOUSehOLD’S LOAn AnD DeBt pAYMentS peR MOnth?”
Control group
1st survey 2nd survey 3rd survey
naryn talas naryn talas naryn talasSignificantly lower than the
monthly family income 27% 9% 16% 9% 27% 9%
Slightly lower than the monthly family income 49% 38% 44% 56% 24% 21%
equal to the monthly family income 11% 26% 27% 18% 9% 32%
Slightly higher than the monthly family income 4% 12% 11% 3% 13% 21%
Significantly higher than the monthly family income 9% 15% 0% 12% 0% 0%
no loan 2% 3% 27% 18%no answer
total100% 100% 100% 100% 100% 100%
45 34 45 34 45 34

75
appEndix 2. dEtErmining incOmES and ExpEnSES
tABLe 1. CAn YOU CALCULAte the InCOMe YOU AnD YOUR hOUSehOLD eXpeCt tO MAKe thIS MOnth?
Intervention group Control group
Men (n=66) Women (n=145) Men (n=66) Women (n=145)
1st survey
yes, with great certainty 29% 41% 58% 40%
with some certainty 58% 43% 39% 58%no 14% 16% 3% 2%
2nd survey
yes, with great certainty 44% 43% 47% 42%
with some certainty 41% 48% 39% 51%no 15% 9% 14% 7%
3rd survey
yes, with great certainty 33% 45% 47% 60%
with some certainty 56% 48% 47% 40%no 11% 8% 6% 0%
tABLe 2. CAn YOU CALCULAte the eXpenSeS YOU AnD YOUR hOUSehOLD eXpeCt tO pAY OUt thIS MOnth?
Intervention group Control group
Men (n=66) Women (n=145) Men (n=66) Women (n=145)
1st survey
yes, with great certainty 26% 36% 44% 21%
Some certainty 53% 47% 47% 77%no 21% 17% 8% 2%
2nd survey
yes, with great certainty 33% 36% 39% 33%
Some certainty 56% 56% 53% 63%no 11% 8% 8% 5%
3rd survey
yes, with great certainty 33% 39% 36% 51%
Some certainty 50% 50% 61% 47%no 17% 10% 3% 2%

76
tABLe 3. DO YOU KnOW hOW MUCh RepAYMent YOU OWe On YOUR OWn LOAnS thIS MOnth?
Intervention group Control group
naryn (n=108)
talas (n=103)
Men (n=66)
Women (n=145)
naryn (n=45)
talas (n=34)
Men (n=66)
Women (n=145)
1st survey
yes, with great
certainty70% 80% 77% 74% 87% 82% 86% 84%
Some certainty 18% 16% 12% 19% 13% 18% 14% 16%
no 12% 5% 11% 8% 0% 0% 0% 0%
2nd survey
yes, with great
certainty85% 76% 75% 83% 71% 85% 78% 77%
Some certainty 14% 12% 17% 11% 18% 9% 17% 12%
no 1% 3% 2% 2% 9% 3% 6% 7%no loan 0% 9% 6% 3% 2% 3% 0% 5%
3rd survey
yes, with great
certainty44% 68% 48% 59% 56% 65% 53% 65%
Some certainty 41% 6% 26% 23% 16% 18% 19% 14%
no 6% 1% 3% 3% 2% 0% 3% 0%no loan 10% 25% 23% 15% 27% 18% 25% 21%
tABLe 4. DO YOU KnOW hOW MUCh RepAYMent YOUR hOUSehOLD OWeS thIS MOnth?
intervention group control group
naryn (n=108)
talas (n=103)
men (n=66)
women (n=145)
naryn (n=45)
talas (n=34)
men (n=66)
women (n=145)
1st survey
yes, with great certainty 60% 67% 56% 67% 78% 68% 72% 74%
Some certainty 25% 21% 27% 21% 18% 24% 17% 23%no 15% 12% 17% 12% 4% 9% 11% 2%
2nd survey
yes, with great certainty 59% 57% 43% 65% 49% 71% 56% 60%
Some certainty 29% 22% 37% 20% 40% 26% 39% 30%no 12% 13% 14% 12% 9% 0% 6% 5%
no loan 0% 9% 6% 3% 2% 3% 0% 5%

77
3rd survey
yes, with great certainty 43% 53% 38% 52% 36% 50% 36% 47%
Some certainty 42% 16% 35% 26% 31% 26% 28% 30%Нет 6% 6% 5% 6% 7% 6% 11% 2%
Нет кредита 10% 25% 23% 15% 27% 18% 25% 21%
appEndix 3. pErcEptiOnS
tABLe 1. hOW SURe ARe YOU thAt YOU WILL Get tO Keep YOUR COLLAteRAL (the FInAnCIAL InStItUtIOn WILL nOt tAKe It AS A RepAYMent OF the DeBt)?
intervention group control group
men(n=66) women (n=145) men (n=66) women (n=145)
1st survey
absolutely sure 22% 36% 42% 37%mostly sure 22% 17% 26% 19%
neither sure nor uncertain 47% 36% 26% 37%
mostly not sure 8% 6% 0% 4%absolutely not sure 0% 6% 5% 4%
total100% 100% 100% 100%
36 87 19 27
2nd survey
absolutely sure 47% 50% 40% 42%mostly sure 20% 26% 40% 17%
neither sure nor uncertain 20% 22% 20% 29%
mostly not sure 3% 1% 0% 4%absolutely not sure 10% 0% 0% 8%
total100% 100% 100% 100%
30 68 20 24
3rd survey
absolutely sure 38% 57% 43% 35%mostly sure 21% 22% 21% 53%
neither sure nor uncertain 38% 17% 36% 12%
mostly not sure 4% 4% 0% 0%absolutely not sure 0% 0% 0% 0%
total100% 100% 100% 100%
24 46 14 17

78
tABLe 2. I pUt the MOneY I BORROW tO pURpOSeS thAt ARe GOOD/BeneFICIAL
intervention group control group
men (n=66) women (n=145) men (n=66) women
(n=145)
1st survey
Only for a short term after receiving a loan 50% 60% 47% 44%
for a long term (several years) 36% 26% 42% 47%
i don’t know 14% 14% 11% 9%
2nd survey
Only for a short term after receiving a loan 44% 50% 42% 47%
for a long term (several years) 45% 43% 53% 47%
i don’t know 11% 7% 6% 7%
3rd survey
Only for a short term after receiving a loan 32% 45% 47% 65%
for a long term (several years) 55% 47% 47% 30%
i don’t know 14% 8% 6% 5%
tABLe 3. I pUt the MOneY I BORROW tO pURpOSeS thAt ARe GOOD/BeneFICIAL
intervention group control group
naryn (n=108) talas (n=103) naryn (n=45) talas (n=34)
1st survey
Only for a short term after
receiving a loan54% 60% 53% 35%
for a long term (several years) 29% 29% 38% 53%
i don’t know 18% 11% 9% 12%
2nd survey
Only for a short term after
receiving a loan41% 56% 49% 38%
for a long term (several years) 53% 34% 42% 59%
i don’t know 6% 10% 9% 3%
3rd survey
Only for a short term after
receiving a loan22% 60% 60% 53%
for a long term (several years) 66% 32% 33% 44%
i don’t know 12% 8% 7% 3%

79
tABLe 4. I pUt the MOneY I BORROW tO pURpOSeS thAt ARe GOOD/BeneFICIAL
intervention group control groupnaryn
(n=108)talas
(n=103)men
(n=66)women (n=145)
naryn (n=45)
talas (n=34)
men (n=66)
women (n=145)
1st survey
for me personally 11% 11% 11% 11% 18% 6% 22% 5%
for myself and my family 50% 52% 52% 51% 58% 59% 56% 60%
Only for my family 27% 36% 30% 32% 24% 32% 19% 35%
i don’t know 12% 1% 8% 6% 0% 3% 3% 0%
2nd survey
for me personally 16% 3% 18% 7% 18% 0% 14% 7%
for myself and my family 49% 68% 53% 60% 53% 85% 72% 63%
Only for my family 28% 24% 20% 28% 27% 9% 11% 26%
i don’t know 7% 6% 9% 5% 2% 6% 3% 5%
3rd survey
for me personally 28% 1% 15% 14% 20% 3% 14% 12%
for myself and my family 45% 75% 61% 59% 64% 71% 75% 60%
Only for my family 22% 17% 15% 22% 16% 24% 8% 28%
i don’t know 5% 7% 9% 4% 0% 3% 3% 0%
tABLe 5. I ChOOSe tO BORROW, BeCAUSe It IMpROVeS MY LIFeStYLe
Intervention group Control groupMen (n=66) Women (n=145) Men (n=66) Women (n=145)
1st survey
absolutely agree 36% 34% 47% 33%partially agree 50% 41% 44% 53%
absolutely disagree 11% 19% 8% 14%
i don’t know 3% 6%
2nd survey
absolutely agree 42% 37% 44% 40%partially agree 47% 48% 33% 49%
absolutely disagree 11% 14% 22% 12%
i don’t know 0% 1%

80
3rd survey
absolutely agree 24% 28% 42% 49%partially agree 55% 51% 56% 49%
absolutely disagree 21% 21% 3% 2%
i don’t know
tABLe 6. MY FInAnCIAL SItUAtIOn, ABILItY tO SAVe AnD InDeBteDneSS ARe UnDeR MY COntROL
intervention group control group
men (n=66) women (n=145) men (n=66) women
(n=145)
1st survey
absolutely agree 50% 50% 61% 60%
partially agree 42% 36% 33% 37%absolutely disagreeн 3% 10% 6% 2%
i don’t know 5% 4%
2nd survey
absolutely agree 64% 63% 61% 53%
partially agree 30% 29% 22% 37%absolutely
disagree 6% 7% 17% 9%
i don’t know 0% 1%
3rd survey
absolutely agree 45% 58% 61% 51%
partially agree 38% 32% 33% 44%absolutely
disagree 17% 10% 6% 5%
i don’t know
tABLe 7. I FeeL COnFIDent MAKInG FInAnCIAL pLAnS
intervention group control groupnaryn
(n=108)talas
(n=103)men
(n=66)women (n=145)
naryn (n=45)
talas (n=34)
men (n=66)
women (n=145)
1st survey
absolutely agree 45% 65% 62% 52% 58% 59% 58% 58%
partially agree 42% 19% 24% 34% 42% 38% 39% 42%
absolutely disagree 7% 9% 6% 9% 0% 3% 3% 0%
i don’t know 6% 7% 8% 6%

81
2nd survey
absolutely agree 51% 70% 65% 58% 36% 50% 44% 40%
partially agree 43% 27% 33% 36% 56% 29% 42% 47%
absolutely disagree 6% 2% 0% 6% 9% 21% 14% 14%
i don’t know 0% 1% 2% 0%
3rd survey
absolutely agree 59% 86% 71% 73% 44% 65% 47% 58%
partially agree 31% 13% 23% 21% 49% 35% 47% 40%
absolutely disagree 10% 1% 6% 6% 7% 0% 6% 2%
tABLe 8. I hAVe nO MAJOR DIFFICULtIeS In ALLOCAtInG MOnthLY FUnDS FOR LOAn RepAYMent
intervention group control groupnaryn
(n=108)talas
(n=103)men
(n=66)women (n=145)
naryn (n=45)
talas (n=34)
men (n=66)
women (n=145)
1st survey
absolutely agree 16% 30% 18% 25% 47% 12% 39% 26%
partially agree 52% 50% 64% 45% 40% 56% 42% 51%
absolutely disagree 24% 19% 14% 26% 13% 32% 19% 23%
i don’t know 8% 1% 5% 5%
2nd survey
absolutely agree 27% 45% 30% 38% 38% 24% 42% 23%
partially agree 53% 44% 58% 44% 53% 56% 44% 63%
absolutely disagree 19% 11% 9% 18% 9% 21% 14% 14%
i don’t know 1% 1% 3% 0%
3rd survey
absolutely agree 19% 36% 29% 27% 40% 21% 33% 30%
partially agree 56% 55% 55% 56% 42% 71% 50% 58%
absolutely disagree 25% 9% 17% 17% 18% 9% 17% 12%

82
tABLe 9. eVen IF MY eXpenSeS On FOOD, tRAnSpORtAtIOn, CLOthInG InCReASe SLIGhtLY, I BeLIeVe MY LIFeStYLe WILL ReMAIn At the SAMe LeVeL
intervention group control groupnaryn
(n=108)talas
(n=103)men
(n=66)women (n=145)
naryn (n=45)
talas (n=34)
men (n=66)
women (n=145)
1st survey
absolutely agree 23% 47% 32% 36% 49% 26% 44% 35%
partially agree 48% 39% 47% 42% 40% 44% 44% 40%
absolutely disagree 20% 9% 14% 15% 11% 29% 11% 26%
i don’t know 8% 6% 8% 7%
2nd survey
absolutely agree 34% 39% 36% 37% 40% 29% 33% 37%
partially agree 44% 46% 48% 43% 49% 47% 53% 44%
absolutely disagree 21% 16% 15% 20% 11% 24% 14% 19%
i don’t know
3rd survey
absolutely agree 25% 57% 36% 43% 42% 21% 31% 35%
partially agree 50% 34% 48% 39% 42% 74% 61% 51%
absolutely disagree 25% 9% 15% 18% 16% 6% 8% 14%
tABLe 10. DO YOU thInK CAn YOU Be MORe COSt eFFICIent?
intervention group control group
naryn (n=108)
talas (n=103)
men (n=66)
women (n=145)
naryn (n=45)
talas (n=34)
men (n=66)
women (n=145)
1st survey
i surely can 31% 44% 35% 39% 36% 21% 31% 28%most likely i
can 42% 38% 38% 41% 56% 56% 56% 56%
most likely i can't 14% 11% 14% 12% 4% 21% 11% 12%
i surely can't 6% 6% 9% 5% 4% 3% 3% 5%i don't know 6% 2% 5% 4%

83
2nd survey
i surely can 32% 50% 45% 39% 31% 38% 36% 33%most likely i
can 49% 28% 42% 37% 40% 29% 47% 26%
most likely i can't 16% 15% 8% 19% 27% 29% 14% 40%
i surely can't 3% 6% 5% 4% 2% 3% 3% 2%i don't know 0% 2% 0% 1%
3rd survey
i surely can 36% 76% 64% 52% 33% 65% 56% 40%most likely i
can 52% 21% 27% 41% 60% 26% 39% 51%
most likely i can't 9% 2% 8% 5% 4% 6% 6% 5%
i surely can't 3% 1% 2% 2% 2% 3% 0% 5%
tABLe 11. I BeLIeVe I WILL Be BetteR OFF FInAnCIALLY neXt YeAR thAn thIS YeAR
intervention group control group
naryn (n=108)
talas (n=103)
men (n=66)
women (n=145)
naryn (n=45)
talas (n=34)
men (n=66)
women (n=145)
1st survey
absolutely agree 33% 62% 47% 48% 53% 29% 47% 40%
partially agree 49% 31% 44% 39% 42% 56% 47% 49%absolutely
disagree 11% 5% 5% 10% 4% 15% 6% 12%
i don’t know 6% 2% 5% 4%
2nd survey
absolutely agree 50% 53% 52% 52% 40% 35% 44% 33%
partially agree 39% 39% 42% 37% 49% 59% 53% 53%absolutely
disagree 10% 7% 5% 10% 11% 6% 3% 14%
i don’t know 1% 1% 2% 1%
3rd survey
absolutely agree 34% 77% 64% 51% 58% 65% 67% 56%
partially agree 56% 22% 30% 44% 33% 29% 25% 37%absolutely
disagree 9% 1% 6% 5% 9% 6% 8% 7%
i don’t know

84
appEndix 4. actiOnS
tABLe 1. I MADe MY pReVIOUS DeBt pAYMent On tIMe
intervention group control group
naryn (n=108)
talas (n=103)
men (n=66)
women (n=145)
naryn (n=45)
talas (n=34)
men (n=66)
women (n=145)
1st survey
yes 74% 86% 79% 81% 89% 82% 86% 86%no 18% 13% 18% 14% 11% 18% 14% 14%
no loan refused
to answer 8% 1% 3% 6%
2nd survey
yes 82% 81% 79% 83% 76% 76% 81% 72%no 17% 9% 14% 12% 22% 21% 19% 23%
no loan 1% 10% 8% 4% 2% 3% 0% 5%refused
to answer 0% 1% 0% 1%
3rd survey
yes 67% 71% 65% 70% 64% 79% 67% 74%no 23% 4% 12% 14% 9% 3% 8% 5%
no loan 10% 25% 23% 15% 27% 18% 25% 21%
tABLe 2. I WILL MAKe MY neXt DeBt pAYMent On tIMe
intervention group control groupnaryn
(n=108)talas
(n=103)men
(n=66)women (n=145)
naryn (n=45)
talas (n=34)
men (n=66)
women (n=145)
1st survey
yes 75% 85% 74% 83% 89% 91% 92% 88%no 14% 10% 17% 10% 11% 9% 8% 12%
no loan refused to
answer 11% 5% 9% 8%
2nd survey
yes 80% 85% 80% 83% 71% 94% 78% 84%no 19% 3% 12% 11% 27% 3% 22% 12%
no loan 1% 10% 8% 4% 2% 3% 0% 5%refused to
answer 0% 2% 0% 1%
3rd survey
yes 41% 74% 53% 59% 49% 76% 58% 63%no 49% 1% 24% 26% 24% 6% 17% 16%
no loan 10% 25% 23% 15% 27% 18% 25% 21%

85
tABLe 3. I MADe MY pReVIOUS DeBt pAYMent On tIMe AnD WILL MAKe MY neXt DeBt pAYMent On tIMe
intervention group control group
men (n=66) women (n=145) men (n=66) women
(n=145)
1st survey
i have made and will make payment on 68% 75% 81% 77%
i have not made or will not make
payment 32% 25% 19% 23%
2nd survey
i have made and will make payment on 71% 77% 72% 70%
i have not made or will not make
payment 21% 19% 28% 26%
no loan 8% 4% 0% 5%
3rd survey
i have made and will make payment on 44% 52% 53% 58%
i have not made or will not make
payment 33% 33% 22% 21%
no loan 23% 15% 25% 21%
tABLe 4. I hAVe COnSULteD WIth MY FInAnCIAL InStItUtIOn (BAnK, MFI) ABOUt ReStRUCtURInG/ReSCheDULInG MY DeBt
intervention group control group
naryn (n=108)
talas (n=103)
men (n=66)
women (n=145)
naryn (n=45)
talas (n=34)
men (n=66)
women (n=145)
1st survey
yes 30% 34% 27% 34% 58% 26% 47% 42%no 61% 65% 70% 60% 42% 74% 53% 58%
refused to answer 9% 1% 3% 6%
2nd survey
yes 24% 12% 17% 19% 11% 12% 11% 12%no 28% 17% 20% 24% 20% 26% 25% 21%
no loan 1% 10% 8% 4% 2% 3% 0% 5%i did not
experience difficulties in repaying the
loan
67% 59% 64% 63%
refused to answer 47% 61% 56% 53%

86
3rd survey
yes 16% 16% 11% 18% 24% 15% 22% 19%no 19% 23% 20% 21% 20% 32% 22% 28%
no loan 10% 25% 23% 15% 27% 18% 25% 21%i did not
experience difficulties in repaying the
loan
29% 35% 31% 33%
refused to answer 56% 36% 47% 46%
tABLe 5. I SOLD pROpeRtY In ORDeR tO RepAY the DeBt/LOAn
intervention group control group
naryn (n=108)
talas (n=103)
men (n=66)
women (n=145)
naryn (n=45)
talas (n=34)
men (n=66)
women (n=145)
1st survey
yes 38% 27% 41% 29% 62% 35% 56% 47%no 56% 73% 58% 67% 38% 65% 44% 53%
refused to
answer 2% 4%
2nd survey
yes 25% 4% 15% 15% 27% 6% 19% 16%no 74% 86% 77% 81% 47% 76% 56% 63%
no loan 1% 10% 8% 4% 27% 18% 25% 21%
3rd survey
yes 31% 6% 27% 15% 33% 18% 39% 16%no 58% 69% 50% 70% 64% 79% 61% 79%
no loan 10% 25% 23% 15% 2% 3% 0% 5%
tABLe 6. I pLAn tO BORROW AGAIn (WIthIn 12 MOnthS) AFteR RepAYInG thIS LOAn
intervention group control group
naryn (n=108)
talas (n=103)
men (n=66)
women (n=145)
naryn (n=45)
talas (n=34)
men (n=66)
women (n=145)
1st survey
yes 56% 58% 59% 56% 73% 41% 69% 51%no 39% 42% 39% 41% 27% 59% 31% 49%
refused to
answer6% 0% 2% 3%
2nd survey
yes 42% 45% 46% 42% 44% 44% 50% 40%no 57% 45% 46% 53% 53% 53% 50% 56%
no loan 1% 10% 8% 4% 2% 3% 0% 5%

87
3rd survey
yes 47% 35% 41% 41% 53% 12% 31% 40%no 43% 40% 36% 43% 20% 71% 44% 40%
no loan 10% 25% 23% 15% 27% 18% 25% 21%
tABLe 7. I pLAn tO BORROW AGAIn WhILe RepAYInG thIS LOAn
intervention group control groupnaryn
(n=108)talas
(n=103)men
(n=66)women (n=145)
naryn (n=45)
talas (n=34)
men (n=66)
women (n=145)
1st survey
yes 40% 38% 42% 37% 69% 15% 50% 42%no 56% 61% 56% 59% 31% 85% 50% 58%
refused to answer 5% 1% 2% 3%
2nd survey
yes 37% 29% 38% 31% 53% 12% 33% 37%no 62% 60% 52% 65% 44% 85% 67% 58%
no loan 1% 10% 8% 4% 2% 3% 0% 5%refused
to answer 0% 1% 2% 0%
3rd survey
yes 32% 23% 26% 29% 33% 9% 17% 28%no 57% 51% 52% 56% 40% 74% 58% 51%
no loan 10% 25% 23% 15% 27% 18% 25% 21%
tABLe 8. I hAVe MADe A FAMILY BUDGet (WRItten DOWn eXpenSeS AnD InCOMe) In the pASt 3 MOnthS
intervention group control groupmen (n=66) women (n=145) men (n=66) women (n=145)
1st survey
yes 36% 52% 72% 65%no 64% 44% 28% 35%
refused to answer 0% 3%
2nd survey
yes 62% 61% 69% 58%no 38% 39% 31% 37%
refused to answer 0% 5%
3rd surveyyes 53% 54% 64% 74%no 47% 46% 36% 26%

88
tABLe 9. I hAVe Set FInAnCIAL GOALS FOR the neXt FeW MOnthS
intervention group control groupmen (n=66) women (n=145) men (n=66) women (n=145)
1st survey
yes 58% 61% 69% 65%no 39% 32% 31% 35%
refused to answer 3% 7%
2nd survey
yes 76% 68% 72% 67%no 24% 32% 28% 28%
refused to answer 0% 5%
3rd surveyyes 67% 71% 56% 63%no 33% 29% 44% 37%
tABLe 10. I hAVe DISCUSSeD WIth MY FAMILY OUR InCOMe AnD eXpenSeS
intervention group control groupmen (n=66) women (n=145) men (n=66) women (n=145)
1st surveyyes 68% 74% 58% 77%no 26% 21% 42% 23%
refused to answer 6% 6%
2nd surveyyes 82% 70% 61% 49%no 18% 29% 39% 47%
refused to answer 0% 1% 0% 5%
3rd surveyyes 73% 74% 67% 65%no 27% 26% 33% 35%
tABLe 11. I AM SpenDInG enOUGh MOneY On FOOD, CLOthInG, tRAnSpORt tO Keep MY FAMILY WeLL
intervention group control group
men (n=66) women (n=145) men (n=66) women (n=145)
1st surveyyes 74% 73% 50% 67%no 23% 22% 50% 33%
refused to answer 3% 5%
2nd surveyyes 88% 78% 72% 51%no 12% 21% 28% 44%
refused to answer 0% 1% 0% 5%
3rd surveyyes 73% 70% 92% 93%no 27% 30% 8% 7%

89
tABLe 12. I pReFeR tO BORROW (When I neeD It) RAtheR thAn SAVe In ADVAnCe
intervention group control group
naryn (n=108)
talas (n=103)
men (n=66)
women (n=145)
naryn (n=45)
talas (n=34)
men (n=66)
women (n=145)
1st survey
yes 41% 23% 36% 30% 62% 9% 44% 35%no 53% 76% 62% 65% 38% 91% 56% 65%
refused to
answer6% 1% 2% 5%
2nd survey
yes 33% 31% 33% 32% 44% 18% 31% 35%no 67% 69% 67% 68% 56% 82% 69% 65%
3rd survey
yes 38% 18% 33% 26% 49% 15% 31% 37%no 62% 82% 67% 74% 51% 85% 69% 63%
tABLe 13. FInAnCIAL ACtIVItY
intervention group control groupmen (n=66) women (n=145) men (n=66) women (n=145)
1st surveyactive behavior 42% 54% 39% 49%
neutral behavior 44% 37% 56% 49%passive behavior 14% 8% 6% 2%
2nd surveyactive behavior 62% 65% 50% 49%
neutral behavior 36% 32% 50% 44%passive behavior 2% 3% 0% 7%
3rd surveyactive behavior 55% 55% 47% 49%
neutral behavior 36% 37% 47% 49%passive behavior 9% 8% 6% 2%

this report can be obtained in print or electronic formatat the following address:
Business Centre Orion, 4th Floorerkindik boulevard, 21Bishkek, Kyrgyz Republic 720040tel.: +(996 312) 62 61 62www.ifc.org
In pARtneRShIp:
July, 2016