Main Report Project for the Comprehensive Flood...
106
Main Report Chapter 10 Master Plan Project for the Comprehensive Flood Management Plan for the Chao Phraya River Basin in the Kingdom of Thailand 10-130 CTI Engineering International Co., Ltd. Oriental Consultants Co., Ltd. Nippon Koei Co., Ltd. CTI Engineering Co., Ltd. 10.3 Hydraulic Examination on Combination of Countermeasures 10.3.1 Simulation Case To find the best combination of countermeasures and evaluate its effectiveness on flood control, flood simulation with flood analysis model explained in CHAPTER 8 shall be conducted. Simulation case is shown in Table 10.3.1. Table 10.3.1 Flood Simulation Condition in Chao Phraya River No. Case Countermeasures 1 Case 0-1: Existing Condition - 2011 Flood without dyke breaches, - Dyke elevating around the protection area by DOH, DOR near Bangkok area. 2 Case 1-1: SCWRM M/P Full Menu - 2011 Flood without dyke breaches, - Dyke elevating around the protection area by DOH, DOR near Bangkok area, C2: Flood control by new dams, C4: Flood control by retention ponds, C5-1: Dyke elevating up to DHWL + freeboard of 0.5m (The Chao Phraya River), C6-1: East or west diversion channels (1,500 m 3 /s), C6-2: Outer ring road diversion channels (500 m 3 /s), C7: Effective operation of existing dams. 3 Case 11-0: Proposed Combination 1 - 2011 Flood without dyke breaches, - Dyke elevating around the protection area by DOH, DOR near Bangkok area, C5-1: Dyke elevating up to DHWL + freeboard of 0.5m (Lower Reaches of the Chao Phraya River), C5-1: Dyke elevating up to DHWL + freeboard of 0.5m (Lower Reaches of the Tha Chin River), C5-1: 4 Shortcut channels (Lower reaches of the Tha Chin River), C5-2: Ayutthaya bypass channel (1,400m 3 /s), C6-2: Outer ring road diversion channel (500 m 3 /s), C7: Effective operation of existing dams. 4 Case 11-1 Proposed Combination 2 - 2011 Flood without dyke breaches, - Dyke elevating around the protection area by DOH, DOR near Bangkok area, C5-1: Dyke elevating up to DHWL + freeboard of 0.5m (Lower Reaches of the Chao Phraya River), C5-1: Dyke elevating up to DHWL + freeboard of 0.5m (Lower Reaches of the Tha Chin River), C5-1: 4 Shortcut channels (Lower reaches of the Tha Chin River), C5-2: Ayutthaya bypass channel (1,400m 3 /s), C6-2: Outer ring road diversion channel (500 m 3 /s), C7: Effective operation of existing dams.
Transcript of Main Report Project for the Comprehensive Flood...

Main Report
Chapter 10 Master Plan
Project for the Comprehensive Flood Management Plan
for the Chao Phraya River Basin in the Kingdom of Thailand
10-130 CTI Engineering International Co., Ltd.
Oriental Consultants Co., Ltd.
Nippon Koei Co., Ltd.
CTI Engineering Co., Ltd.
10.3 Hydraulic Examination on Combination of Countermeasures
10.3.1 Simulation Case
To find the best combination of countermeasures and evaluate its effectiveness on flood control, flood simulation with flood analysis model explained in CHAPTER 8 shall be conducted. Simulation case is shown in Table 10.3.1.
Table 10.3.1 Flood Simulation Condition in Chao Phraya River
No. Case Countermeasures
1 Case 0-1: Existing Condition
- 2011 Flood without dyke breaches, - Dyke elevating around the protection area by DOH, DOR near Bangkok area.
2 Case 1-1: SCWRM M/P Full Menu
- 2011 Flood without dyke breaches, - Dyke elevating around the protection area by DOH, DOR near Bangkok area,
C2: Flood control by new dams, C4: Flood control by retention ponds, C5-1: Dyke elevating up to DHWL + freeboard of 0.5m
(The Chao Phraya River), C6-1: East or west diversion channels (1,500 m3/s), C6-2: Outer ring road diversion channels (500 m3/s), C7: Effective operation of existing dams.
3 Case 11-0: Proposed Combination 1
- 2011 Flood without dyke breaches, - Dyke elevating around the protection area by DOH, DOR near Bangkok area, C5-1: Dyke elevating up to DHWL + freeboard of 0.5m
(Lower Reaches of the Chao Phraya River), C5-1: Dyke elevating up to DHWL + freeboard of 0.5m
(Lower Reaches of the Tha Chin River), C5-1: 4 Shortcut channels (Lower reaches of the Tha Chin River), C5-2: Ayutthaya bypass channel (1,400m3/s), C6-2: Outer ring road diversion channel (500 m3/s), C7: Effective operation of existing dams.
4 Case 11-1 Proposed Combination 2
- 2011 Flood without dyke breaches, - Dyke elevating around the protection area by DOH, DOR near Bangkok area, C5-1: Dyke elevating up to DHWL + freeboard of 0.5m
(Lower Reaches of the Chao Phraya River), C5-1: Dyke elevating up to DHWL + freeboard of 0.5m
(Lower Reaches of the Tha Chin River), C5-1: 4 Shortcut channels (Lower reaches of the Tha Chin River), C5-2: Ayutthaya bypass channel (1,400m3/s), C6-2: Outer ring road diversion channel (500 m3/s), C7: Effective operation of existing dams.

Project for the Comprehensive Flood Management Plan
for the Chao Phraya River Basin in the Kingdom of Thailand
Main Report
Chapter 10 Master Plan
CTI Engineering International Co., Ltd.
Oriental Consultants Co., Ltd.
Nippon Koei Co., Ltd.
CTI Engineering Co., Ltd.
10-131
10.3.2 Result
(1) Calculation Results (Case 0-1: Existing Condition)
Figu
re 1
0.3.
1 L
ongi
tudi
nal S
ectio
n of
Cha
o Ph
raya
Riv
er (C
ase
0-1:
Exi
stin
g C
ondi
tion)
(Dyk
e el
evat
ing
arou
nd th
e pr
otec
tion
area
by
DO
H, D
OR
nea
r B
angk
ok a
rea)

Main Report
Chapter 10 Master Plan
Project for the Comprehensive Flood Management Plan
for the Chao Phraya River Basin in the Kingdom of Thailand
10-132 CTI Engineering International Co., Ltd.
Oriental Consultants Co., Ltd.
Nippon Koei Co., Ltd.
CTI Engineering Co., Ltd.
Figure 10.3.2 Maximum Flood Discharge Diagram (Case 0-1: Existing Condition)
(Dyke Elevating around the Protection Area by DOH, DOR near Bangkok Area)

Project for the Comprehensive Flood Management Plan
for the Chao Phraya River Basin in the Kingdom of Thailand
Main Report
Chapter 10 Master Plan
CTI Engineering International Co., Ltd.
Oriental Consultants Co., Ltd.
Nippon Koei Co., Ltd.
CTI Engineering Co., Ltd.
10-133
Figure 10.3.3 Flood Inundation Area and Depth (Case 0-1: Existing Condition)
(Dyke Elevating around the Protection Area by DOH, DOR near Bangkok Area)

Main Report
Chapter 10 Master Plan
Project for the Comprehensive Flood Management Plan
for the Chao Phraya River Basin in the Kingdom of Thailand
10-134 CTI Engineering International Co., Ltd.
Oriental Consultants Co., Ltd.
Nippon Koei Co., Ltd.
CTI Engineering Co., Ltd.
(2) Calculation Results (Case 1-1: SCWRM M/P Full Menu)
Figu
re 1
0.3.
4 L
ongi
tudi
nal S
ectio
n of
Cha
o Ph
raya
Riv
er (C
ase
1-1:
SC
WR
M M
/P F
ull M
enu)
(C
2: N
ew D
ams,
C4
: Ret
entio
n Po
nds,
C5-
1: D
yke
DH
WL
+0.5
m -
Cha
o Ph
raya
Riv
er, C
6-1:
Div
ersio
n C
hann
el 1
,500
m3 /s
,
C6-
2: O
uter
Rin
g R
oad
Div
ersi
on C
hann
el 5
00 m
3 /s, C
7: E
ffec
tive
Dam
Ope
ratio
n)

Project for the Comprehensive Flood Management Plan
for the Chao Phraya River Basin in the Kingdom of Thailand
Main Report
Chapter 10 Master Plan
CTI Engineering International Co., Ltd.
Oriental Consultants Co., Ltd.
Nippon Koei Co., Ltd.
CTI Engineering Co., Ltd.
10-135
Figure 10.3.5 Maximum Flood Discharge Diagram (Case 1-1: SCWRM M/P Full Menu)
(C2: New Dams, C4 : Retention Ponds, C5-1: Dyke DHWL+0.5m - Chao Phraya River, C6-1: Diversion Channel 1,500 m3/s, C6-2: Outer Ring Road Diversion Channel 500 m3/s,
C7: Effective Dam Operation)

Main Report
Chapter 10 Master Plan
Project for the Comprehensive Flood Management Plan
for the Chao Phraya River Basin in the Kingdom of Thailand
10-136 CTI Engineering International Co., Ltd.
Oriental Consultants Co., Ltd.
Nippon Koei Co., Ltd.
CTI Engineering Co., Ltd.
Figure 10.3.6 Flood Inundation Area and Depth (Case 1-1: SCWRM M/P Full Menu)
(C2: New Dams, C4 : Retention Ponds, C5-1: Dyke DHWL+0.5m - Chao Phraya River, C6-1: Diversion Channel 1,500 m3/s, C6-2: Outer Ring Road Diversion Channel 500 m3/s,
C7: Effective Dam Operation)

Project for the Comprehensive Flood Management Plan
for the Chao Phraya River Basin in the Kingdom of Thailand
Main Report
Chapter 10 Master Plan
CTI Engineering International Co., Ltd.
Oriental Consultants Co., Ltd.
Nippon Koei Co., Ltd.
CTI Engineering Co., Ltd.
10-137
(3) Calculation Results (Case 11-0: Proposed Combination 1)
Figu
re 1
0.3.
7 L
ongi
tudi
nal S
ectio
n of
Cha
o Ph
raya
Riv
er (C
ase
11-0
: Pro
pose
d C
ombi
natio
n 1)
(C5-
1: D
yke
DH
WL
+ 0
.5m
– C
hao
Phra
ya L
ower
Rea
ches
, C5-
1: D
yke
DH
WL
+ 0
.5m
– T
ha C
hin
Low
er L
each
es,
C
5-1:
4 S
hort
cut C
hann
els –
Tha
Chi
n, C
5-2:
Ayu
tthay
a By
pass
1,4
00m
3 /s, C
6-2:
Out
er R
ing
Roa
d D
iver
sion
Cha
nnel
500
m3 /s,
C
7: E
ffect
ive
Dam
Ope
ratio
n)

Main Report
Chapter 10 Master Plan
Project for the Comprehensive Flood Management Plan
for the Chao Phraya River Basin in the Kingdom of Thailand
10-138 CTI Engineering International Co., Ltd.
Oriental Consultants Co., Ltd.
Nippon Koei Co., Ltd.
CTI Engineering Co., Ltd.
Figure 10.3.8 Maximum Flood Discharge Diagram (Case 11-0: Proposed Combination 1)
(C5-1: Dyke DHWL + 0.5m – Chao Phraya Lower Reaches, C5-1: Dyke DHWL + 0.5m – Tha Chin Lower Leaches, C5-1: 4 Shortcut Channels – Tha Chin,
C5-2: Ayutthaya Bypass 1,400m3/s, C6-2: Outer Ring Road Diversion Channel 500 m3/s, C7: Effective Dam Operation)

Project for the Comprehensive Flood Management Plan
for the Chao Phraya River Basin in the Kingdom of Thailand
Main Report
Chapter 10 Master Plan
CTI Engineering International Co., Ltd.
Oriental Consultants Co., Ltd.
Nippon Koei Co., Ltd.
CTI Engineering Co., Ltd.
10-139
Figure 10.3.9 Flood Inundation Area and Depth (Case 11-0: Proposed Combination 1)
(C5-1: Dyke DHWL + 0.5m – Chao Phraya Lower Reaches, C5-1: Dyke DHWL + 0.5m – Tha Chin Lower Leaches, C5-1: 4 Shortcut Channels – Tha Chin,
C5-2: Ayutthaya Bypass 1,400m3/s, C6-2: Outer Ring Road Diversion Channel 500 m3/s, C7: Effective Dam Operation)

Main Report
Chapter 10 Master Plan
Project for the Comprehensive Flood Management Plan
for the Chao Phraya River Basin in the Kingdom of Thailand
10-140 CTI Engineering International Co., Ltd.
Oriental Consultants Co., Ltd.
Nippon Koei Co., Ltd.
CTI Engineering Co., Ltd.
(4) Calculation Results (Case 11-1: Proposed Combination 2)
Figu
re 1
0.3.
10
Lon
gitu
dina
l Sec
tion
of C
hao
Phra
ya R
iver
(Cas
e 11
-1: P
ropo
sed
Com
bina
tion
2)
(C5-
1: D
yke
DH
WL
+ 0
.5m
– C
hao
Phra
ya L
ower
Rea
ches
, C5-
1: D
yke
DH
WL
+ 0
.5m
– T
ha C
hin
Low
er L
each
es,
C
5-1:
4 S
hort
cut C
hann
els –
Tha
Chi
n, C
5-2:
Ayu
tthay
a By
pass
1,4
00m
3 /s, C
6-2:
Out
er R
ing
Roa
d D
iver
sion
Cha
nnel
1,0
00 m
3 /s,
C7:
Eff
ectiv
e D
am O
pera
tion)

Project for the Comprehensive Flood Management Plan
for the Chao Phraya River Basin in the Kingdom of Thailand
Main Report
Chapter 10 Master Plan
CTI Engineering International Co., Ltd.
Oriental Consultants Co., Ltd.
Nippon Koei Co., Ltd.
CTI Engineering Co., Ltd.
10-141
Figure 10.3.11 Maximum Flood Discharge Diagram (Case 11-1: Proposed Combination 2)
(C5-1: Dyke DHWL + 0.5m – Chao Phraya Lower Reaches, C5-1: Dyke DHWL + 0.5m – Tha Chin Lower Leaches, C5-1: 4 Shortcut Channels – Tha Chin,
C5-2: Ayutthaya Bypass 1,400m3/s, C6-2: Outer Ring Road Diversion Channel 500 m3/s, C7: Effective Dam Operation)

Main Report
Chapter 10 Master Plan
Project for the Comprehensive Flood Management Plan
for the Chao Phraya River Basin in the Kingdom of Thailand
10-142 CTI Engineering International Co., Ltd.
Oriental Consultants Co., Ltd.
Nippon Koei Co., Ltd.
CTI Engineering Co., Ltd.
Figure 10.3.12 Flood Inundation Area and Depth (Case 11-1: Proposed Combination 2)
(C5-1: Dyke DHWL + 0.5m – Chao Phraya Lower Reaches, C5-1: Dyke DHWL + 0.5m – Tha Chin Lower Leaches, C5-1: 4 Shortcut Channels – Tha Chin,
C5-2: Ayutthaya Bypass 1,400m3/s, C6-2: Outer Ring Road Diversion Channel 500 m3/s, C7: Effective Dam Operation)
Project for the Comprehensive Flood Management Plan
for the Chao Phraya River Basin in the Kingdom of Thailand
Main Report
Chapter 10 Master Plan
CTI Engineering International Co., Ltd.
Oriental Consultants Co., Ltd.
Nippon Koei Co., Ltd.
CTI Engineering Co., Ltd.
10-143
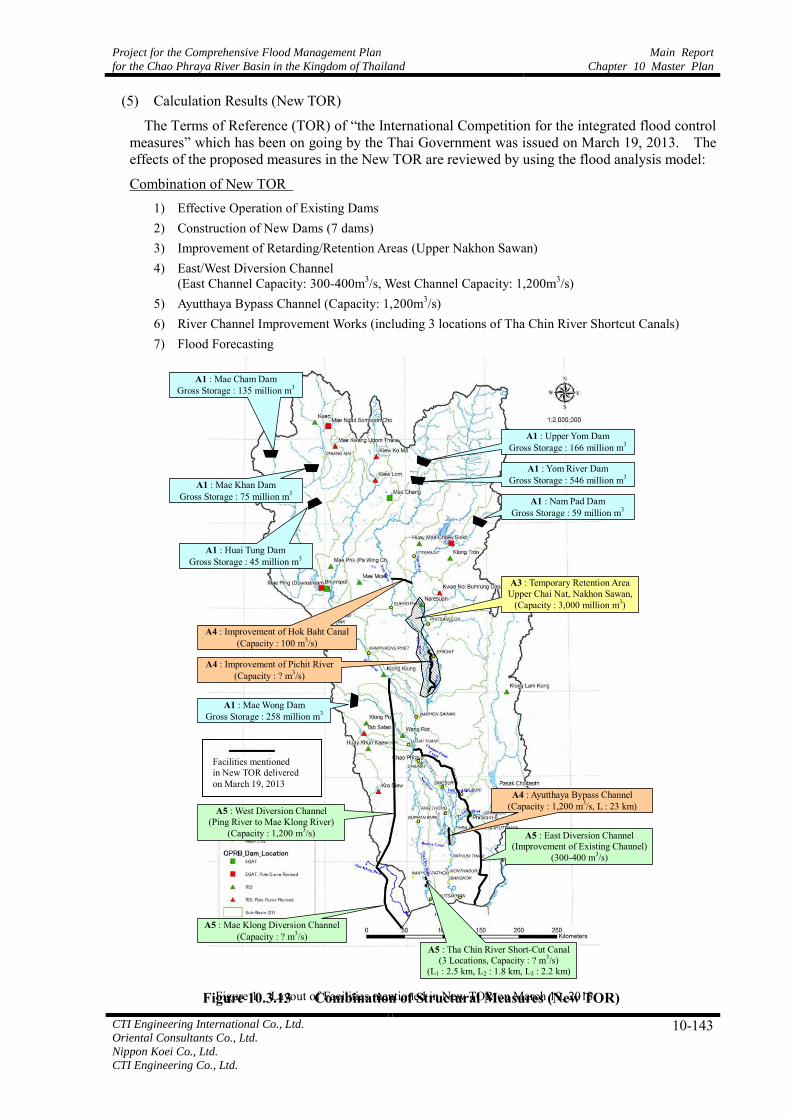
(5) Calculation Results (New TOR)
The Terms of Reference (TOR) of “the International Competition for the integrated flood control measures” which has been on going by the Thai Government was issued on March 19, 2013. The effects of the proposed measures in the New TOR are reviewed by using the flood analysis model:
Combination of New TOR 1) Effective Operation of Existing Dams 2) Construction of New Dams (7 dams) 3) Improvement of Retarding/Retention Areas (Upper Nakhon Sawan) 4) East/West Diversion Channel
(East Channel Capacity: 300-400m3/s, West Channel Capacity: 1,200m3/s) 5) Ayutthaya Bypass Channel (Capacity: 1,200m3/s) 6) River Channel Improvement Works (including 3 locations of Tha Chin River Shortcut Canals) 7) Flood Forecasting
Figure 1 Layout of Facilities mentioned in New TOR on March 19, 2013
Facilities mentioned in New TOR delivered on March 19, 2013
A1 : Upper Yom Dam Gross Storage : 166 million m3
A1 : Yom River Dam Gross Storage : 546 million m3
A5 : East Diversion Channel (Improvement of Existing Channel)
(300-400 m3/s)
A4 : Ayutthaya Bypass Channel (Capacity : 1,200 m3/s, L : 23 km) A5 : West Diversion Channel
(Ping River to Mae Klong River) (Capacity : 1,200 m3/s)
A3 : Temporary Retention Area Upper Chai Nat, Nakhon Sawan,
(Capacity : 3,000 million m3)
A5 : Mae Klong Diversion Channel (Capacity : ? m3/s)
A5 : Tha Chin River Short-Cut Canal (3 Locations, Capacity : ? m3/s)
(L1 : 2.5 km, L2 : 1.8 km, L3 : 2.2 km)
A4 : Improvement of Hok Baht Canal (Capacity : 100 m3/s)
A4 : Improvement of Pichit River (Capacity : ? m3/s)
A1 : Nam Pad Dam Gross Storage : 59 million m3
A1 : Mae Cham Dam Gross Storage : 135 million m3
A1 : Mae Khan Dam Gross Storage : 75 million m3
A1 : Huai Tung Dam Gross Storage : 45 million m3
A1 : Mae Wong Dam Gross Storage : 258 million m3
Figure 10.3.13 Combination of Structural Measures (New TOR)

Main Report
Chapter 10 Master Plan
Project for the Comprehensive Flood Management Plan
for the Chao Phraya River Basin in the Kingdom of Thailand
10-144 CTI Engineering International Co., Ltd.
Oriental Consultants Co., Ltd.
Nippon Koei Co., Ltd.
CTI Engineering Co., Ltd.
Figu
re 1
0.3.
14
Lon
gitu
dina
l Sec
tion
of C
hao
Phra
ya R
iver
(New
TO
R)

Project for the Comprehensive Flood Management Plan
for the Chao Phraya River Basin in the Kingdom of Thailand
Main Report
Chapter 10 Master Plan
CTI Engineering International Co., Ltd.
Oriental Consultants Co., Ltd.
Nippon Koei Co., Ltd.
CTI Engineering Co., Ltd.
10-145
Figure 10.3.15 Maximum Flood Discharge Diagram (New TOR)

Main Report
Chapter 10 Master Plan
Project for the Comprehensive Flood Management Plan
for the Chao Phraya River Basin in the Kingdom of Thailand
10-146 CTI Engineering International Co., Ltd.
Oriental Consultants Co., Ltd.
Nippon Koei Co., Ltd.
CTI Engineering Co., Ltd.
Figure 10.3.16 Flood Inundation Area and Depth (New TOR)

Project for the Comprehensive Flood Management Plan
for the Chao Phraya River Basin in the Kingdom of Thailand
Main Report
Chapter 10 Master Plan
CTI Engineering International Co., Ltd.
Oriental Consultants Co., Ltd.
Nippon Koei Co., Ltd.
CTI Engineering Co., Ltd.
10-147
(6) Calculation Results (Flow Capacity)
Figure 10.3.18 shows river flow capacity considering secondary dykes (refer to Figure 10.3.17) with river improvement works under proposed Combination 1 or Combination 2.
Figure 10.3.17 River Flow Section considering Secondary Dykes
Figure 10.3.18 River Flow Capacity Diagram
(Simulation Result, with River Improvement Works under Combination 1 or 2)
Upstream of 151km from the Chao Phraya River mouth
Primary Dike
Secondary Dike
Road embankment along irrigation canal called “secondary dyke”
River area and primary dykes
Actually, flood water flows down through the area between secondary dyke.

Main Report
Chapter 10 Master Plan
Project for the Comprehensive Flood Management Plan
for the Chao Phraya River Basin in the Kingdom of Thailand
10-148 CTI Engineering International Co., Ltd.
Oriental Consultants Co., Ltd.
Nippon Koei Co., Ltd.
CTI Engineering Co., Ltd.
10.4 Hydraulic Examination by Selected Six Types of Flood
10.4.1 Outline of the Six Representative Floods
(1) Flow of Selection of Six Representative Floods
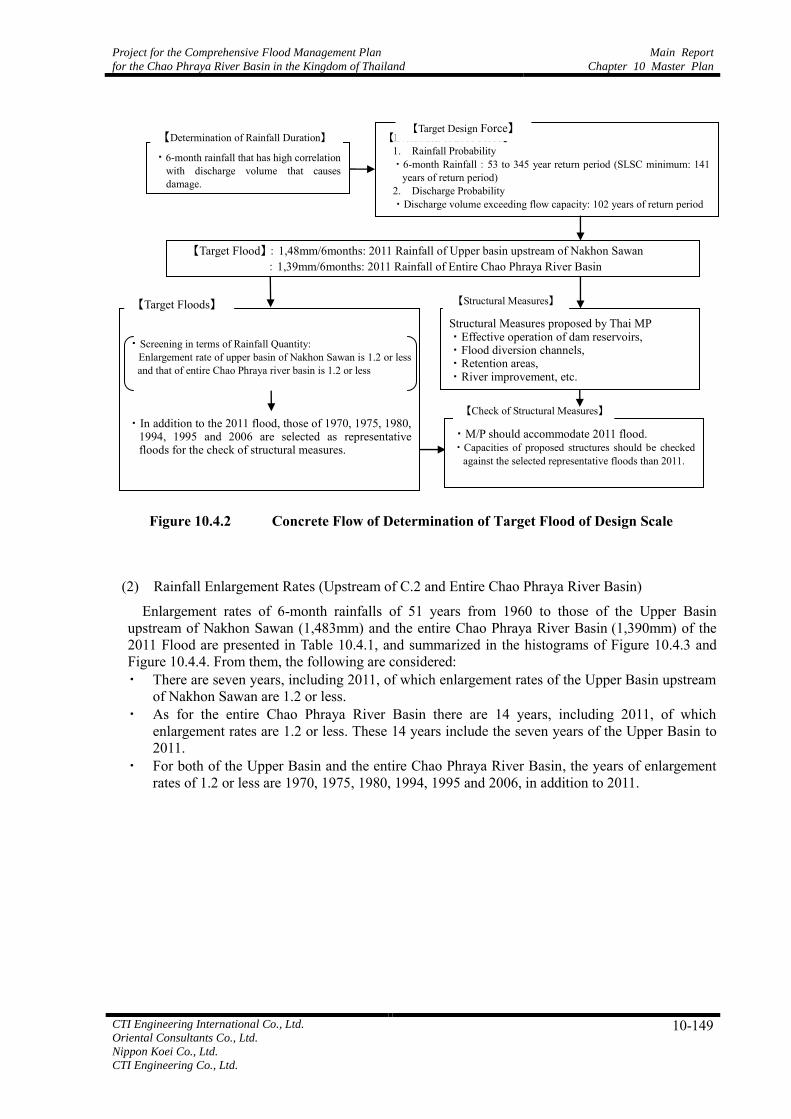
Although the actual rainfall of the 2011 flood is set as the Target Design Force, it is also desirable to check capacities of proposed flood regulation facilities against several different rainfalls from the 2011 flood in terms of spatial and temporal rainfall distributions. An image of the determination method of target floods of design scale is illustrated in Figure 10.4.1, and its concrete determination flow is presented in Figure 10.4.2.
Figure 10.4.1 Image of Determination Method of Target Flood of Design Scale
Project for the Comprehensive Flood Management Plan
for the Chao Phraya River Basin in the Kingdom of Thailand
Main Report
Chapter 10 Master Plan
CTI Engineering International Co., Ltd.
Oriental Consultants Co., Ltd.
Nippon Koei Co., Ltd.
CTI Engineering Co., Ltd.
10-149
Figure 10.4.2 Concrete Flow of Determination of Target Flood of Design Scale
(2) Rainfall Enlargement Rates (Upstream of C.2 and Entire Chao Phraya River Basin)
Enlargement rates of 6-month rainfalls of 51 years from 1960 to those of the Upper Basin upstream of Nakhon Sawan (1,483mm) and the entire Chao Phraya River Basin (1,390mm) of the 2011 Flood are presented in Table 10.4.1, and summarized in the histograms of Figure 10.4.3 and Figure 10.4.4. From them, the following are considered: ・ There are seven years, including 2011, of which enlargement rates of the Upper Basin upstream
of Nakhon Sawan are 1.2 or less. ・ As for the entire Chao Phraya River Basin there are 14 years, including 2011, of which
enlargement rates are 1.2 or less. These 14 years include the seven years of the Upper Basin to 2011.
・ For both of the Upper Basin and the entire Chao Phraya River Basin, the years of enlargement rates of 1.2 or less are 1970, 1975, 1980, 1994, 1995 and 2006, in addition to 2011.
【Evaluation of 2011 Flood】 1. Rainfall Probability ・6-month Rainfall:53 to 345 year return period (SLSC minimum: 141
years of return period) 2. Discharge Probability ・Discharge volume exceeding flow capacity: 102 years of return period
・M/P should accommodate 2011 flood. ・Capacities of proposed structures should be checked
against the selected representative floods than 2011.
【Check of Structural Measures】
・6-month rainfall that has high correlation with discharge volume that causes damage.
【Determination of Rainfall Duration】
・Screening in terms of Rainfall Quantity: Enlargement rate of upper basin of Nakhon Sawan is 1.2 or less
and that of entire Chao Phraya river basin is 1.2 or less
・In addition to the 2011 flood, those of 1970, 1975, 1980,
1994, 1995 and 2006 are selected as representative floods for the check of structural measures.
【Target Flood】:1,48mm/6months: 2011 Rainfall of Upper basin upstream of Nakhon Sawan 【目標とする :1,39mm/6months: 2011 Rainfall of Entire Chao Phraya River Basin
【Target Floods】 Structural Measures proposed by Thai MP ・Effective operation of dam reservoirs, ・Flood diversion channels, ・Retention areas, ・River improvement, etc.
【Structural Measures】
【Target Design Force】

Main Report
Chapter 10 Master Plan
Project for the Comprehensive Flood Management Plan
for the Chao Phraya River Basin in the Kingdom of Thailand
10-150 CTI Engineering International Co., Ltd.
Oriental Consultants Co., Ltd.
Nippon Koei Co., Ltd.
CTI Engineering Co., Ltd.
1 1
5
13
11
5
9
5
1
1 2
7
20
31
36
45
50 51
0
10
20
30
40
50
60
0
2
4
6
8
10
12
14
1.0 1.0 to 1.1 1.1 to 1.2 1.2 to 1.3 1.3 to 1.4 1.4 to 1.5 1.5 to 1.6 1.6 to 1.7 1.7 to 1.8
Acc
umla
ted
Num
ber
of Y
ears
Num
ber
of y
ears
Upper Basin upstream of Nakorn Sawan
Number of Years
Accumlated Number
Figure 10.4.3 Histogram of Enlargement Rates (Upstream of Nakhon Sawan)
1 1
1211
9 9
6
1 1
1 2
14
25
34
43
49 50 51
0
10
20
30
40
50
60
0
2
4
6
8
10
12
14
1.0 1.0 to 1.1 1.1 to 1.2 1.2 to 1.3 1.3 to 1.4 1.4 to 1.5 1.5 to 1.6 1.6 to 1.7 1.7 to 1.8
Accum
lat
ed
Num
ber
of
Ye
ars
Number of years
Entire Chao Phraya River Basin
Number of Years
Accumlated Number
Figure 10.4.4 Histogram of Enlargement Rates (Entire Chao Phraya River Basin)

Project for the Comprehensive Flood Management Plan
for the Chao Phraya River Basin in the Kingdom of Thailand
Main Report
Chapter 10 Master Plan
CTI Engineering International Co., Ltd.
Oriental Consultants Co., Ltd.
Nippon Koei Co., Ltd.
CTI Engineering Co., Ltd.
10-151
Table 10.4.1 Enlargement Rates of Rainfalls
6-month rainfall of Upper Basin (1,483mm) Enlargement rate
2011 rainfall 1,483 (mm) 2011 rainfall 1,390 (mm) Hatching: year of 1.2 or less Ranking
Rainfall Enlargement Judgement ranking Rainfall Enlargement Judgement ranking (m3/s)
(mm) Rate (mm) Rate (m3/s) (MCM) (MCM) 7 Target Floods
1961 1,208 1.228 > 1.2 11 1,135 1.225 > 1.2 17 1961 1961 4,712 2 4,712 33,006 6,534
1962 1,117 1.328 > 1.2 22 1,124 1.237 > 1.2 18 1962 1962 3,812 9 3,812 24,096 2,989
1963 1,235 1.201 > 1.2 8 1,209 1.150 ○ 5 1963 1963 2,935 13 2,935 23,717 339
1964 1,163 1.275 > 1.2 19 1,186 1.172 ○ 7 1964 1964 3,825 8 5,170 30,419 5,367 Bhumipol Dam
1965 979 1.514 > 1.2 38 991 1.402 > 1.2 35 1965 1965 1,531 39 2,004 18,657 0 started operation
1966 1,065 1.392 > 1.2 31 1,113 1.250 > 1.2 21 1966 1966 2,930 14 3,919 24,115 1,494 in 1964.
1967 974 1.522 > 1.2 40 943 1.475 > 1.2 40 1967 1967 2,768 17 4,200 18,446 1,339
1968 911 1.628 > 1.2 46 891 1.560 > 1.2 47 1968 1968 1,263 47 1,642 12,963 0
1969 1,055 1.406 > 1.2 33 1,040 1.337 > 1.2 28 1969 1969 2,827 15 4,300 23,212 1,797
1970 1,266 1.172 ○ 4 1,232 1.128 ○ 3 1970 1970 ○ 4,420 4 5,830 38,524 7,291
1971 1,144 1.296 > 1.2 20 1,076 1.293 > 1.2 25 1971 1971 2,370 23 3,356 25,320 1,080
1972 888 1.669 > 1.2 48 930 1.495 > 1.2 42 1972 1972 1,301 45 2,000 14,596 0
1973 1,207 1.228 > 1.2 12 1,101 1.263 > 1.2 23 1973 1973 2,590 19 4,539 24,164 2,029
1974 1,058 1.402 > 1.2 32 1,061 1.311 > 1.2 26 1974 1974 1,925 31 2,672 22,551 21 Sirikitl Dam
1975 1,254 1.183 ○ 7 1,166 1.193 ○ 13 1975 1975 ○ 4,336 5 5,535 40,180 10,518 started operation
1976 1,174 1.263 > 1.2 16 1,150 1.209 > 1.2 16 1976 1976 2,605 18 4,285 28,786 2,669 in 1974.
1977 948 1.564 > 1.2 42 876 1.587 > 1.2 49 1977 1977 1,967 29 3,532 18,486 1,002
1978 1,214 1.222 > 1.2 10 1,179 1.180 ○ 9 1978 1978 3,540 11 4,700 34,990 5,585
1979 949 1.563 > 1.2 41 893 1.556 > 1.2 46 1979 1979 1,390 43 1,784 13,013 0
1980 1,255 1.181 ○ 6 1,207 1.152 ○ 6 1980 1980 ○ 4,320 6 5,839 35,623 7,112
1981 1,083 1.369 > 1.2 30 1,030 1.351 > 1.2 31 1981 1981 1,663 35 3,943 27,166 490
1982 938 1.580 > 1.2 45 915 1.519 > 1.2 45 1982 1982 1,596 37 3,362 19,236 474
1983 1,099 1.349 > 1.2 24 1,163 1.196 ○ 14 1983 1983 2,290 25 3,763 25,294 1,386
1984 1,015 1.461 > 1.2 35 960 1.448 > 1.2 38 1984 1984 1,249 48 2,442 19,200 0
1985 1,093 1.357 > 1.2 26 1,031 1.349 > 1.2 30 1985 1985 2,137 26 3,068 26,208 561
1986 1,001 1.481 > 1.2 36 975 1.426 > 1.2 37 1986 1986 1,456 40 2,251 16,839 0
1987 975 1.520 > 1.2 39 929 1.497 > 1.2 43 1987 1987 1,633 36 3,109 16,605 134
1988 1,166 1.271 > 1.2 17 1,177 1.182 ○ 10 1988 1988 1,907 32 3,980 23,528 632
1989 1,024 1.448 > 1.2 34 980 1.419 > 1.2 36 1989 1989 1,447 41 2,347 15,325 0
1990 983 1.508 > 1.2 37 995 1.397 > 1.2 34 1990 1990 1,141 49 1,688 14,909 0
1991 906 1.637 > 1.2 47 882 1.576 > 1.2 48 1991 1991 1,427 42 2,602 15,308 9
1992 947 1.566 > 1.2 44 954 1.458 > 1.2 39 1992 1992 1,379 44 2,343 13,691 0
1993 842 1.761 > 1.2 51 817 1.702 > 1.2 51 1993 1993 1,066 50 1,900 8,539 0
1994 1,313 1.130 ○ 3 1,168 1.191 ○ 12 1994 1994 ○ 2,533 20 4,268 33,587 4,877
1995 1,262 1.175 ○ 5 1,230 1.130 ○ 4 1995 1995 ○ 4,820 1 5,612 38,741 10,144
1996 1,166 1.272 > 1.2 18 1,116 1.246 > 1.2 20 1996 1996 3,002 12 4,109 31,211 3,008
1997 884 1.678 > 1.2 50 838 1.659 > 1.2 50 1997 1997 1,300 46 2,550 13,625 4
1998 884 1.678 > 1.2 49 926 1.502 > 1.2 44 1998 1998 973 51 2,297 10,027 0
1999 1,196 1.240 > 1.2 14 1,176 1.182 ○ 11 1999 1999 2,317 24 3,912 30,476 1,721
2000 1,093 1.356 > 1.2 25 1,053 1.320 > 1.2 27 2000 2000 1,928 30 3,017 27,314 293
2001 1,185 1.252 > 1.2 15 1,092 1.274 > 1.2 24 2001 2001 2,072 27 4,215 28,587 1,170
2002 1,201 1.234 > 1.2 13 1,110 1.253 > 1.2 22 2002 2002 3,997 7 5,547 35,129 7,199
2003 947 1.565 > 1.2 43 938 1.482 > 1.2 41 2003 2003 1,736 34 3,403 15,513 444
2004 1,091 1.360 > 1.2 27 1,007 1.381 > 1.2 32 2004 2004 1,575 38 3,450 20,655 758
2005 1,085 1.366 > 1.2 29 999 1.392 > 1.2 33 2005 2005 1,818 33 3,869 22,229 2,313
2006 1,375 1.078 ○ 2 1,266 1.099 ○ 2 2006 2006 ○ 3,808 10 6,385 44,332 12,244
2007 1,214 1.221 > 1.2 9 1,154 1.205 > 1.2 15 2007 2007 2,457 22 4,032 23,304 1,180
2008 1,114 1.331 > 1.2 23 1,122 1.240 > 1.2 19 2008 2008 2,517 21 3,728 27,243 1,200
2009 1,090 1.360 > 1.2 28 1,031 1.348 > 1.2 29 2009 2009 2,008 28 4,559 19,077 890
2010 1,135 1.306 > 1.2 21 1,180 1.178 ○ 8 2010 2010 2,815 16 5,077 26,630 3,810
2011 1,483 1.000 ○ 1 1,390 1.000 ○ 1 2011 2011 ○ 4,686 3 6,857 55,570 15,154
7 14 7
※ The maximum discharge of the year 2006 is an estimated value based on the rating curve of the year 2011
(The raw observed data provided by RID is 5,450m3/s.)
Number of years of 1.2 or less
(including 2011)
UpperBasin Entire Basin
Selected
as
Represen
tative
Floods
Actual
Discharg
eRemarks
Discharge
Volume
exceeting flow
Year
6-month rainfall of Entire Chao Phraya River Basin(1,390mm)
Maximum Discharge Annual Volume
Estimated discharge without dam reservoirs

Main Report
Chapter 10 Master Plan
Project for the Comprehensive Flood Management Plan
for the Chao Phraya River Basin in the Kingdom of Thailand
10-152 CTI Engineering International Co., Ltd.
Oriental Consultants Co., Ltd.
Nippon Koei Co., Ltd.
CTI Engineering Co., Ltd.
(3) Maximum Discharge and Runoff Volumes of 6 Representative Floods
The maximum discharges at Nakhon Sawan, estimated discharges at Nakhon Sawan without dam reservoirs, total volumes of the estimated discharges at Nakhon Sawan without dam reservoirs and total volume of the estimated discharges exceeding flow capacity at Nakhon Sawan without dam reservoirs for the 51 years from 1961 to 2011 are presented in Figure 10.4.5, Figure 10.4.6, Figure 10.4.7 and Figure 10.4.8. Following are considered from the figure:
・ Years of which the maximum discharges at Nakhon Sawan are large are included in the 6 representative years. This tendency is clearer in the case of the estimated discharges without dam reservoirs.
・ The 6 representative years are the largest or larger in terms of total discharge volume and total volume of discharge exceeding flow capacity, too.
-0.1
0.1
0.3
0.5
0.7
0.9
1.1
1.3
1.5
0
1,000
2,000
3,000
4,000
5,000
6,000
7,000
1961
1962
1963
1964
1965
1966
1967
1968
1969
1970
1971
1972
1973
1974
1975
1976
1977
1978
1979
1980
1981
1982
1983
1984
1985
1986
1987
1988
1989
1990
1991
1992
1993
1994
1995
1996
1997
1998
1999
2000
2001
2002
2003
2004
2005
2006
2007
2008
2009
2010
2011
Enlargement RateDischarge(m3/s) Observed Discharge at Nakorn Sawan
Actual Discharge
7 Target Floods
Upper Basin
Entire Basin
Figure 10.4.5 Observed Discharge at Nakhon Sawan
0.0
0.2
0.4
0.6
0.8
1.0
1.2
1.4
1.6
0
1,000
2,000
3,000
4,000
5,000
6,000
7,000
1961
1962
1963
1964
1965
1966
1967
1968
1969
1970
1971
1972
1973
1974
1975
1976
1977
1978
1979
1980
1981
1982
1983
1984
1985
1986
1987
1988
1989
1990
1991
1992
1993
1994
1995
1996
1997
1998
1999
2000
2001
2002
2003
2004
2005
2006
2007
2008
2009
2010
2011
Enlargement rateDischarge (m3/s) Estimated Discharge at Nakorn Sawan without Dam Reservoirs
Maximum Discharge
7 Target Floods
Upper Basin
Entire Basin
Figure 10.4.6 Estimated Discharge at Nakhon Sawan
without Dam Reservoirs
Enlargement Rate: 1.2
Enlargement Rat: 1.2

Project for the Comprehensive Flood Management Plan
for the Chao Phraya River Basin in the Kingdom of Thailand
Main Report
Chapter 10 Master Plan
CTI Engineering International Co., Ltd.
Oriental Consultants Co., Ltd.
Nippon Koei Co., Ltd.
CTI Engineering Co., Ltd.
10-153
0.0
0.2
0.4
0.6
0.8
1.0
1.2
1.4
1.6
0
10,000
20,000
30,000
40,000
50,000
60,000
1961
1962
1963
1964
1965
1966
1967
1968
1969
1970
1971
1972
1973
1974
1975
1976
1977
1978
1979
1980
1981
1982
1983
1984
1985
1986
1987
1988
1989
1990
1991
1992
1993
1994
1995
1996
1997
1998
1999
2000
2001
2002
2003
2004
2005
2006
2007
2008
2009
2010
2011
Enlargement RateVolume(MCM)Annual Volume of Easimated Discharge at Nakorn Sawan without Dam Reservoirs
Annual Volume 7 Target Floods
Upper Basin Entire Basin
Figure 10.4.7 Estimated Annual Discharge Volume at Nakhon Sawan
without Dam Reservoirs
※:流下能力2500m3/sと設定
0.0
0.2
0.4
0.6
0.8
1.0
1.2
1.4
1.6
0
2,000
4,000
6,000
8,000
10,000
12,000
14,000
16,000
1961
1962
1963
1964
1965
1966
1967
1968
1969
1970
1971
1972
1973
1974
1975
1976
1977
1978
1979
1980
1981
1982
1983
1984
1985
1986
1987
1988
1989
1990
1991
1992
1993
1994
1995
1996
1997
1998
1999
2000
2001
2002
2003
2004
2005
2006
2007
2008
2009
2010
2011
Enlargement RateVolume(MCM) Volume Exceeding Flow Capacity of Estimated Discharge at Nakorn Sawan Without Dam Reservoirs
Discharge Volume exceeting flowcapacity7 Target Floods
Upper Basin
Entire Basin
Note: Flow capacity near Nakhon Sawan is assumed to be 2,500m3/s.
Figure 10.4.8 Estimated Annual Discharge Volume Exceeding Flow Capacity at Nakhon Sawan without Dam Reservoirs
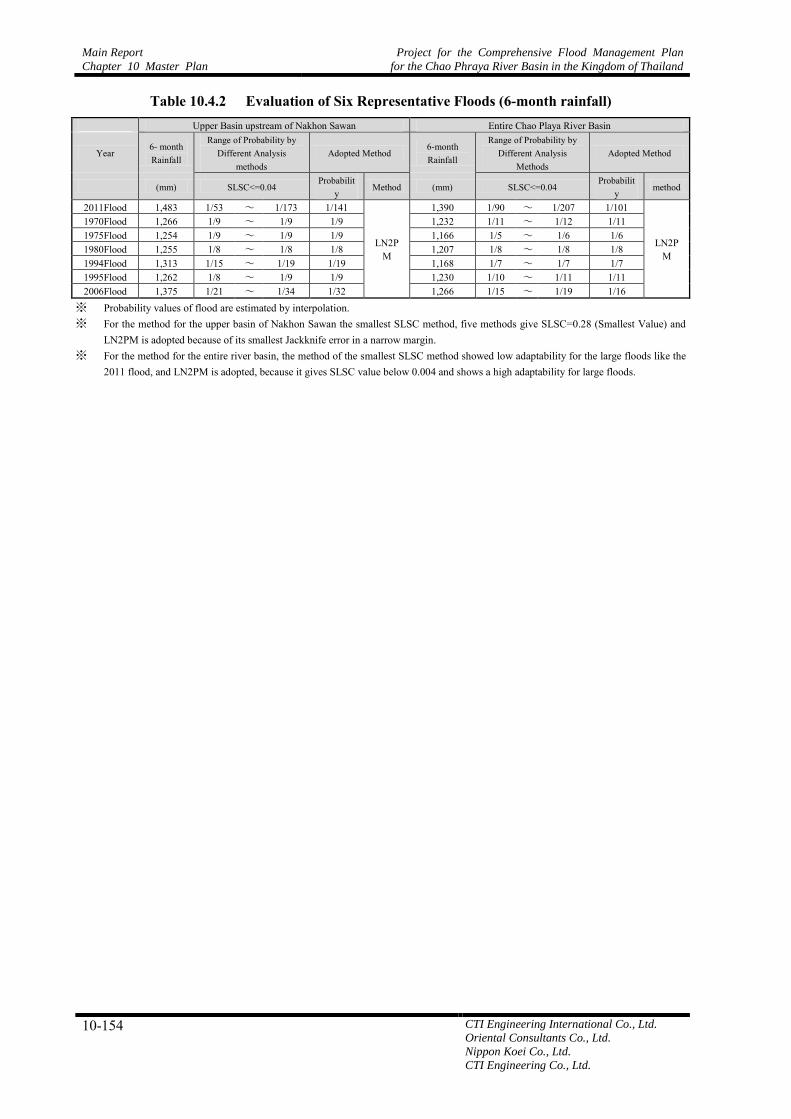
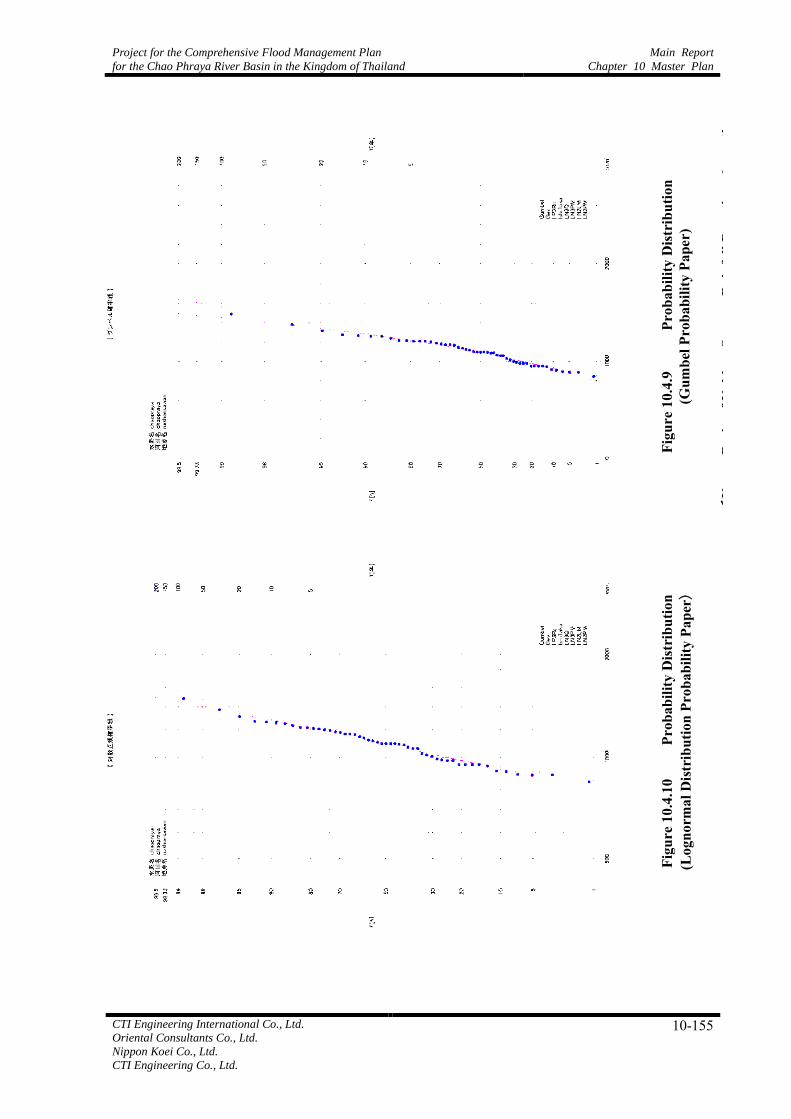
(4) Frequency Evaluation of the Rainfalls (6-month rainfalls) of the Representative Six Floods
Table 10.4.2 shows the results of the frequency analysis on the rainfalls of the representative 6 floods. It is outlined as follows:
・ According to the results of the frequency analysis, the rainfall (1,390 mm) of the 2011 flood is analyzed as the probability of 1/90 ~1/200.
・ Except the 2011 flood, the maximum rainfall was 1,266 mm in 2006, which is analyzed as a probability of 1/20. The minimum rainfall among the 6 representative floods was 1,166 mm in 1975, evaluated as a probability of 1/6.
Enlargement Rate: 1.2
Enlargement Rat: 1.2
Main Report
Chapter 10 Master Plan
Project for the Comprehensive Flood Management Plan
for the Chao Phraya River Basin in the Kingdom of Thailand
10-154 CTI Engineering International Co., Ltd.
Oriental Consultants Co., Ltd.
Nippon Koei Co., Ltd.
CTI Engineering Co., Ltd.
Table 10.4.2 Evaluation of Six Representative Floods (6-month rainfall) Upper Basin upstream of Nakhon Sawan Entire Chao Playa River Basin
Year 6- month Rainfall
Range of Probability by Different Analysis
methods Adopted Method
6-month Rainfall
Range of Probability by Different Analysis
Methods Adopted Method
(mm) SLSC<=0.04 Probabilit
y Method (mm) SLSC<=0.04
Probability
method
2011Flood 1,483 1/53 ~ 1/173 1/141
LN2PM
1,390 1/90 ~ 1/207 1/101
LN2PM
1970Flood 1,266 1/9 ~ 1/9 1/9 1,232 1/11 ~ 1/12 1/11 1975Flood 1,254 1/9 ~ 1/9 1/9 1,166 1/5 ~ 1/6 1/6 1980Flood 1,255 1/8 ~ 1/8 1/8 1,207 1/8 ~ 1/8 1/8 1994Flood 1,313 1/15 ~ 1/19 1/19 1,168 1/7 ~ 1/7 1/7 1995Flood 1,262 1/8 ~ 1/9 1/9 1,230 1/10 ~ 1/11 1/11 2006Flood 1,375 1/21 ~ 1/34 1/32 1,266 1/15 ~ 1/19 1/16
※ Probability values of flood are estimated by interpolation. ※ For the method for the upper basin of Nakhon Sawan the smallest SLSC method, five methods give SLSC=0.28 (Smallest Value) and
LN2PM is adopted because of its smallest Jackknife error in a narrow margin. ※ For the method for the entire river basin, the method of the smallest SLSC method showed low adaptability for the large floods like the
2011 flood, and LN2PM is adopted, because it gives SLSC value below 0.004 and shows a high adaptability for large floods.
Project for the Comprehensive Flood Management Plan
for the Chao Phraya River Basin in the Kingdom of Thailand
Main Report
Chapter 10 Master Plan
CTI Engineering International Co., Ltd.
Oriental Consultants Co., Ltd.
Nippon Koei Co., Ltd.
CTI Engineering Co., Ltd.
10-155
Figu
re 1
0.4.
9 Pr
obab
ility
Dist
ribu
tion
(Gum
bel P
roba
bilit
y Pa
per)
<U
pper
Bas
in o
f Nak
hon
Saw
an,
Rai
nfal
l Dur
atio
n: 6
mon
ths
(183
day
s)>
Figu
re 1
0.4.
10
Prob
abili
ty D
istri
butio
n (L
ogno
rmal
Dist
ribu
tion
Prob
abili
ty P
aper)
<U
pper
Bas
in o
f Nak
hon
Saw
an,
Rai
nfal
l Dur
atio
n: 6
mon
ths
(18
3 da
ys)>

Main Report
Chapter 10 Master Plan
Project for the Comprehensive Flood Management Plan
for the Chao Phraya River Basin in the Kingdom of Thailand
10-156 CTI Engineering International Co., Ltd.
Oriental Consultants Co., Ltd.
Nippon Koei Co., Ltd.
CTI Engineering Co., Ltd.
Figu
re 1
0.4.
11
Prob
abili
ty D
istri
butio
n (G
umbe
l Pro
babi
lity
Pape
r)
<W
hole
Cha
o Pl
aya
Riv
er B
asin
6 m
onth
s (18
3day
s)>
Figu
re 1
0.4.
12
Prob
abili
ty D
istri
butio
n (L
ogno
rmal
Dist
ribu
tion
Prob
abili
ty P
aper
)
<W
hole
Cha
o Pl
aya
Riv
er B
asin
, Rai
nfal
l dur
atio
n, 6
mon
ths>
(183
day
s)>

Project for the Comprehensive Flood Management Plan
for the Chao Phraya River Basin in the Kingdom of Thailand
Main Report
Chapter 10 Master Plan
CTI Engineering International Co., Ltd.
Oriental Consultants Co., Ltd.
Nippon Koei Co., Ltd.
CTI Engineering Co., Ltd.
10-157
Table 10.4.3 Results of Probability Analysis by Different Methods (Upper Basin of Nakhon Sawan, 6-month rainfall)
annual rainfall series (sumple size N=51)
log-nomal distributiontwo-parameter log-nomal
distribution
Iwai ishihara・takase quantile product moment L-moments product moment
Exp Gumbel SqrtEt Gev LP3Rs LogP3 Iwai IshiTaka LN3Q LN3PM LN2LM LN2PMX-COR(99%) 0.936 0.981 0.974 0.991 0.992 - - 0.992 0.991 0.992 0.992 0.992P-COR(99%) 0.920 0.986 0.986 0.995 0.994 - - 0.994 0.992 0.994 0.994 0.994SLSC(99%) 0.072 0.039 0.048 0.040 0.028 - - 0.028 0.029 0.028 0.028 0.028
log likelihood -309.500 -324.300 -324.700 -323.200 - - - -323.100 -323.100 -323.100 -323.100 -323.100pAIC 622.900 652.700 653.500 652.400 0.000 - - 652.200 652.200 652.200 650.200 650.200
X-COR(50%) 0.983 0.986 0.986 0.976 0.981 - - 0.982 0.984 0.982 0.982 0.982P-COR(50%) 0.980 0.982 0.982 0.988 0.987 - - 0.986 0.985 0.986 0.986 0.986SLSC(50%) 0.098 0.066 0.089 0.077 0.048 - - 0.048 0.053 0.048 0.048 0.048
returnperiod(year)
Exp Gumbel SqrtEt Gev LP3Rs LogP3 Iwai IshiTaka LN3Q LN3PM LN2LM LN2PM
2 1,046 1,071 1,069 1,090 1,089 - - 1,087 1,082 1,087 1,087 1,0873 1,111 1,133 1,137 1,153 1,150 - - 1,148 1,143 1,148 1,149 1,1485 1,192 1,201 1,214 1,215 1,210 - - 1,209 1,207 1,209 1,211 1,20910 1,302 1,287 1,315 1,282 1,277 - - 1,278 1,281 1,277 1,282 1,27820 1,412 1,369 1,415 1,336 1,335 - - 1,337 1,347 1,337 1,344 1,33930 1,477 1,417 1,474 1,363 1,366 - - 1,369 1,384 1,368 1,377 1,37150 1,558 1,476 1,550 1,394 1,402 - - 1,407 1,428 1,406 1,416 1,41080 1,633 1,531 1,620 1,420 1,434 - - 1,440 1,467 1,439 1,451 1,444100 1,668 1,556 1,654 1,431 1,448 - - 1,455 1,485 1,454 1,467 1,459120 1,697 1,577 1,682 1,439 1,460 - - 1,467 1,500 1,467 1,480 1,472140 1,721 1,595 1,706 1,446 1,470 - - 1,477 1,512 1,477 1,491 1,482150 1,732 1,603 1,717 1,449 1,474 - - 1,482 1,518 1,481 1,495 1,487160 1,743 1,610 1,727 1,452 1,478 - - 1,486 1,523 1,485 1,500 1,491180 1,761 1,624 1,745 1,457 1,485 - - 1,494 1,532 1,493 1,508 1,499200 1,778 1,636 1,762 1,462 1,492 - - 1,501 1,540 1,500 1,515 1,506300 1,843 1,683 1,826 1,477 1,516 - - 1,526 1,572 1,525 1,542 1,533400 1,888 1,716 1,873 1,488 1,533 - - 1,544 1,594 1,543 1,561 1,551600 1,953 1,762 1,939 1,501 1,556 - - 1,569 1,625 1,568 1,587 1,577
2011Flood 1,483 - 1/53 - - 1/173 - - 1/153 1/98 1/154 1/126 1/1411970Flood 1,266 - 1/9 - - 1/9 - - 1/9 1/9 1/9 1/9 1/91975Flood 1,254 - 1/9 - - 1/9 - - 1/9 1/9 1/9 1/9 1/91980Flood 1,255 - 1/8 - - 1/8 - - 1/8 1/8 1/8 1/8 1/81994Flood 1,313 - 1/15 - - 1/19 - - 1/19 1/16 1/19 1/16 1/191995Flood 1,262 - 1/8 - - 1/9 - - 1/9 1/8 1/9 1/8 1/92006Flood 1,375 - 1/21 - - 1/34 - - 1/33 1/27 1/33 1/30 1/32
flood scale occurred in 2011less than 0.04(SLSC)
Jackknife returnperiod(year)
Exp Gumbel SqrtEt Gev LP3Rs LogP3 Iwai IshiTaka LN3Q LN3PM LN2LM LN2PM
2 19 19 20 24 22 - - 22 18 22 19 193 20 21 23 24 22 - - 22 19 22 21 215 23 24 27 25 24 - - 25 24 25 24 2410 30 29 35 30 31 - - 31 36 31 29 2920 39 35 43 41 42 - - 42 52 41 34 3430 44 39 48 49 49 - - 49 63 48 37 3750 51 44 55 59 59 - - 58 78 58 41 4180 58 49 61 70 69 - - 68 92 67 44 44100 61 51 64 75 74 - - 72 99 72 46 46120 63 53 67 79 78 - - 76 105 75 47 47140 66 54 69 83 81 - - 79 110 79 48 48150 67 55 70 84 83 - - 81 112 80 49 49160 67 56 71 86 84 - - 82 114 81 49 49180 69 57 73 88 87 - - 85 118 84 50 50200 71 58 75 91 90 - - 87 122 86 51 51300 76 62 81 100 99 - - 96 136 95 54 53400 81 65 86 106 106 - - 103 146 101 56 56600 87 69 92 115 116 - - 112 161 110 59 58
estimatestandarderrors
Peason typeⅢ
distribution
exponentialdistribution
GumbelDistribution
squre-rootexpotentialtype maximumdistribution
extramevalue
distribution
Peason typeⅢ
distribution(real-space)
※ As for the smallest SLSC method, five methods give SLSC=0.028 (Smallest Value), but LN2PM is adopted
because of its smallest Jackknife error in a narrow margin.

Main Report
Chapter 10 Master Plan
Project for the Comprehensive Flood Management Plan
for the Chao Phraya River Basin in the Kingdom of Thailand
10-158 CTI Engineering International Co., Ltd.
Oriental Consultants Co., Ltd.
Nippon Koei Co., Ltd.
CTI Engineering Co., Ltd.
Table 10.4.4 A Summary of Probability Analysis by Different Methods (Chao Playa River Basin, 6-Month Rainfall)
annual rainfall series (sumple size N=51)
log-nomal distributiontwo-parameter log-nomal
distribution
Iwai ishihara・takase quantile product moment L-moments product moment
Exp Gumbel SqrtEt Gev LP3Rs LogP3 Iwai IshiTaka LN3Q LN3PM LN2LM LN2PMX-COR(99%) 0.913 0.968 0.959 0.989 0.990 - 0.989 0.989 0.987 0.989 0.988 0.988P-COR(99%) 0.903 0.985 0.986 0.994 0.993 - 0.992 0.992 0.991 0.992 0.992 0.991SLSC(99%) 0.084 0.050 0.058 0.060 0.030 - 0.031 0.031 0.032 0.031 0.031 0.031
log likelihood -304.500 -320.600 -320.800 -318.400 -318.100 - -318.200 -318.200 -318.300 -318.200 -318.300 -318.300pAIC 613.000 645.100 645.600 642.800 642.300 - 642.400 642.400 642.700 642.400 640.700 640.600
X-COR(50%) 0.971 0.974 0.975 0.960 0.968 - 0.969 0.969 0.972 0.969 0.971 0.971P-COR(50%) 0.971 0.973 0.974 0.983 0.981 - 0.981 0.981 0.978 0.981 0.979 0.979SLSC(50%) 0.122 0.095 0.116 0.119 0.070 - 0.070 0.070 0.078 0.070 0.076 0.076
returnperiod(year)
Exp Gumbel SqrtEt Gev LP3Rs LogP3 Iwai IshiTaka LN3Q LN3PM LN2LM LN2PM
2 1,017 1,039 1,038 1,061 1,060 - 1,059 1,058 1,053 1,059 1,054 1,0543 1,075 1,095 1,101 1,118 1,114 - 1,113 1,113 1,108 1,113 1,110 1,1095 1,149 1,157 1,174 1,172 1,167 - 1,166 1,166 1,163 1,166 1,167 1,16510 1,249 1,235 1,268 1,227 1,223 - 1,223 1,223 1,226 1,223 1,231 1,22720 1,348 1,310 1,361 1,270 1,270 - 1,271 1,271 1,281 1,271 1,286 1,28230 1,407 1,353 1,416 1,291 1,294 - 1,296 1,297 1,311 1,297 1,316 1,31150 1,480 1,406 1,486 1,313 1,322 - 1,326 1,327 1,346 1,326 1,352 1,34680 1,548 1,456 1,552 1,331 1,346 - 1,351 1,352 1,377 1,352 1,383 1,376100 1,580 1,479 1,584 1,339 1,357 - 1,362 1,364 1,392 1,364 1,397 1,390120 1,607 1,498 1,610 1,345 1,366 - 1,372 1,373 1,403 1,373 1,409 1,401140 1,629 1,514 1,632 1,350 1,373 - 1,379 1,381 1,413 1,381 1,418 1,411150 1,639 1,521 1,642 1,352 1,376 - 1,383 1,384 1,417 1,384 1,423 1,415160 1,648 1,528 1,651 1,354 1,379 - 1,386 1,387 1,421 1,387 1,427 1,419180 1,665 1,540 1,669 1,357 1,384 - 1,392 1,393 1,428 1,393 1,434 1,426200 1,680 1,551 1,684 1,360 1,389 - 1,397 1,398 1,435 1,398 1,440 1,432300 1,739 1,594 1,744 1,370 1,406 - 1,415 1,417 1,459 1,417 1,464 1,455400 1,780 1,623 1,787 1,377 1,418 - 1,428 1,431 1,476 1,430 1,481 1,472600 1,838 1,666 1,848 1,385 1,434 - 1,446 1,449 1,499 1,448 1,504 1,494
2011Flood 1,390 - - - - 1/207 - 1/176 1/170 1/98 1/171 1/90 1/1011970Flood 1,232 - - - - 1/12 - 1/12 1/12 1/11 1/12 1/11 1/111975Flood 1,166 - - - - 1/5 - 1/6 1/6 1/6 1/6 1/5 1/61980Flood 1,207 - - - - 1/8 - 1/8 1/8 1/8 1/8 1/8 1/81994Flood 1,168 - - - - 1/7 - 1/7 1/7 1/7 1/7 1/7 1/71995Flood 1,230 - - - - 1/11 - 1/11 1/11 1/11 1/11 1/10 1/112006Flood 1,266 - - - - 1/19 - 1/19 1/18 1/16 1/18 1/15 1/16
flood scale occurred in 2011less than 0.04(SLSC)
Jackknife return Exp Gumbel SqrtEt Gev LP3Rs LogP3 iwai※ ishitaka※ LN3Q※ LN3PM LN2LM LN2PM2 18 18 18 23 20 - - - - 22 18 183 18 18 21 22 20 - - - - 22 18 195 19 20 25 21 21 - - - - 22 20 2110 24 23 32 24 25 - - - - 22 24 2420 31 28 40 31 33 - - - - 22 27 2830 35 31 45 37 39 - - - - 23 30 3050 40 35 51 45 47 - - - - 24 33 3380 46 39 58 53 54 - - - - 26 35 36100 48 40 61 57 58 - - - - 27 37 37120 50 42 63 60 61 - - - - 28 38 38140 52 43 65 62 64 - - - - 29 39 39150 53 44 66 63 65 - - - - 30 39 40160 54 44 67 64 66 - - - - 30 39 40180 55 45 69 66 68 - - - - 31 40 41200 56 46 71 68 70 - - - - 32 41 41300 61 49 77 74 77 - - - - 34 43 44400 64 52 81 79 83 - - - - 37 45 45600 69 55 88 84 90 - - - - 40 47 47
estimatestandarderrors
Peason typeⅢ
distribution
exponentialdistribution
GumbelDistribution
squre-rootexpotentialtype maximumdistribution
extramevalue
distribution
Peason typeⅢ
distribution(real-space)
※ No evaluation errors, because Jackknife error could not be properly calculated.

Project for the Comprehensive Flood Management Plan
for the Chao Phraya River Basin in the Kingdom of Thailand
Main Report
Chapter 10 Master Plan
CTI Engineering International Co., Ltd.
Oriental Consultants Co., Ltd.
Nippon Koei Co., Ltd.
CTI Engineering Co., Ltd.
10-159
(5) Reference: About the 2002 flood
The peak discharge and the volume of the 2002 flood are comparatively large, but not selected as representative six (6) large floods. Because the 6-month rainfall at the upper basin of Nakhon Sawan was 1,201 mm, which is ranked 13th among the 51 floods and the enlargement rates of the flood exceeded 1.2.
Figure 10.4.13 shows actual rainfalls during the fixed periods (One year, 2 months, 1 month and a half month) ・ About the 6-month rainfall, the 2002 flood is ranked 13th among the 51 years and not an
exceptional large rainfall. ・ However, about the rainfalls of short period (half a month, one month and two months), the
2002 flood is the largest among the 51 years. ・ The large peak discharge and volume of the 2002 flood are estimated to be caused by the
rainfall concentrated in a short period.
Actual Rainfall in the Upper Basin of Nakhon Sawan
0
200
400
600
800
1,000
1,200
1,400
1,600
1961年
1962年
1963年
1964年
1965年
1966年
1967年
1968年
1969年
1970年
1971年
1972年
1973年
1974年
1975年
1976年
1977年
1978年
1979年
1980年
1981年
1982年
1983年
1984年
1985年
1986年
1987年
1988年
1989年
1990年
1991年
1992年
1993年
1994年
1995年
1996年
1997年
1998年
1999年
2000年
2001年
2002年
2003年
2004年
2005年
2006年
2007年
2008年
2009年
2010年
2011年
6-Month Rainfall(mm)
0
100
200
300
400
500
600
700
800
900
1,000
2-Month、
1-Month、
0.5-Month Rainfall(mm)
6-M (L-Axis)
7 floods
1-M (R-Axis)
0.5-M (R-Axis)
2-M (R-Axis)
Figure 10.4.13 Rainfalls of Short Periods in the Upper Basin of Nakhon Sawan
0
20
40
60
80
100
Rai
nfal
l(m
m/d
ay)
0
500
1000
1500
2000
2500
Tot
al r
ainf
all(m
m)
10months 7months 6months 5months 3months 2months tatal rainfall
Capacity Flow
0
1000
2000
3000
4000
5000
6000
7000
8000
02/0
1/01
02/0
1/15
02/0
1/29
02/0
2/12
02/0
2/26
02/0
3/12
02/0
3/26
02/0
4/09
02/0
4/23
02/0
5/07
02/0
5/21
02/0
6/04
02/0
6/18
02/0
7/02
02/0
7/16
02/0
7/30
02/0
8/13
02/0
8/27
02/0
9/10
02/0
9/24
02/1
0/08
02/1
0/22
02/1
1/05
02/1
1/19
02/1
2/03
02/1
2/17
02/1
2/31
Dis
char
ge(m
3/s)
Discharge(containing the water held back by dums m3/s) Discharge(observation value m3/s) Capacity Flow
Figure 10.4.14 Actual Discharge without Dams at Nakhon Sawan (in 2002)
Actual Rainfall in the Upper Basin of Nakhon Sawan
0
200
400
600
800
1,000
1,200
1,400
1,600
1961年
1962年
1963年
1964年
1965年
1966年
1967年
1968年
1969年
1970年
1971年
1972年
1973年
1974年
1975年
1976年
1977年
1978年
1979年
1980年
1981年
1982年
1983年
1984年
1985年
1986年
1987年
1988年
1989年
1990年
1991年
1992年
1993年
1994年
1995年
1996年
1997年
1998年
1999年
2000年
2001年
2002年
2003年
2004年
2005年
2006年
2007年
2008年
2009年
2010年
2011年
6-Month Rainfall(mm)
0
100
200
300
400
500
600
700
800
900
1,000
2-Month、1-Month、0.5-Month Rainfall(mm)
6-M (L-Axis)
7 floods
1-M (R-Axis)
0.5-M (R-Axis)
2-M (R-Axis)
In 2002 the 6-month rainfall is not large, but rainfalls in short period (0.5-month, 1-month) are largest in 51 years.

Main Report
Chapter 10 Master Plan
Project for the Comprehensive Flood Management Plan
for the Chao Phraya River Basin in the Kingdom of Thailand
10-160 CTI Engineering International Co., Ltd.
Oriental Consultants Co., Ltd.
Nippon Koei Co., Ltd.
CTI Engineering Co., Ltd.
10.4.2 Study Case
The list of calculation case and condition are shown in following table.
Tab
le 1
0.4.
5 L
ist o
f Cal
cula
tion
Cas
e
Ta
ble
- C
alc
ula
tio
n C
ase
on C
ha
o P
hra
ya
Riv
er
Ba
sin
As o
f 4 J
une 2
013
Co
nstr
uctio
n o
f
flo
od
wa
ys(e
ast
an
d/o
r w
est)
Co
nstr
uctio
n o
f
ce
ntr
al flo
od
wa
y
(ca
pa
city
50
0m
3/s
)
Sh
ort
cu
t o
f T
ha
Ch
in R
ive
r
Wid
en
ing
of T
ha
Ch
in R
ive
r
Flo
od
pro
tectio
n
wa
ll o
f T
ha
Ch
in
Riv
er
Lo
ca
tio
n
up
str
ea
m 3
16
km
fro
m r
ive
r m
ou
th
Lo
ca
tio
n
up
str
ea
m 1
28
km
fro
m r
ive
r m
ou
th
sh
ort
cu
t ch
an
ne
l9
0k -
20
0k
0k -
90
k
case0
Repro
duction c
alc
ula
tion 2
011yr
flood,
with r
ain
fall
Consid
ering d
ike b
reaks
case0-0
Without
dik
e b
reaks
case0-1
●●
case1
●●
●●
●●
●
(1,5
00m
3/s)
case1-1
●●
●●
●●
●
(1,5
00m
3/s)
●
(500m
3/s)
case2
●●
●●
●●
●
(1,5
00m
3/s)
●
case2-1
●●
●●
●●
●
(1,5
00m
3/s)
●●
(500m
3/s)
case5
●●
●
case7
●●
●●
(1,5
00m
3/s)
case8
●●
●
case8-1
●●
●●
●●
●
case9-1
●●
●
case9-2
●●
●
case9-3
●●
●
case9-4
●●
●
case9-5
●●
●
(500m
3/s)
case9-6
●●
●
(1,5
00m
3/s)
case9-6
-1●
●●
(3,0
00m
3/s)
Additio
nal 22 J
an 2
013
case9-7
●●
●●
(1,5
00m
3/s)
case10-0
●●
●●
●
(500m
3/s)
case10-1
●●
●●
●
(1,0
00m
3/s)
case10-2
-4sc-n
g●
●●
●●
(1,0
00m
3/s)
● (
4 s
hort
cut
/no g
ate)
*1)
case10-2
-2sc-n
g●
●●
●●
(1,0
00m
3/s)
● (
2 s
hort
cut
/no g
ate)
*2)
case10-2
-4sc-w
g●
●●
●●
(1,0
00m
3/s)
● (
4 s
hort
cut
/w
ith g
ate) *
1)
case10-3
-4sc-n
g●
●●
●●
(1,0
00m
3/s)
● (
4 s
hort
cut
/no g
ate)
*1)
●
case10-4
-4sc-n
g●
●●
●●
(1,0
00m
3/s)
● (
4 s
hort
cut
/no g
ate) *
1)
●●
(Left
Em
bankm
ent)
case10-6
●●
●●
●
(1,0
00m
3/s)
●(R
ight
and
Left
em
bankm
ent)
case10-7
-4sc-n
g●
●●
●●
(1,0
00m
3/s)
● (
4 s
hort
cut
/no g
ate) *
1)
●(R
ight
and
Left
em
bankm
ent)
case11-0
●●
●●
●
(500m
3/s)
● (
4 s
hort
cut
/no g
ate) *
1)
● (
Left
Em
bankm
ent)
case11-1
●●
●●
●
(1,0
00m
3/s)
● (
4 s
hort
cut
/no g
ate) *
1)
● (
Left
Em
bankm
ent)
*1) 4
sho
rtcut
: No.
1(75
.9-8
7.1k
), N
o.2(
60.7
-70.
8k),
No.
3(29
.3-4
8.2k
), N
o.4(
21.4
-27.
3k)
*2) 2
sho
rtcut
: No.
1(75
.9-8
7.1k
), N
o.2(
60.7
-70.
8k)
Dik
e e
leva
tin
g to
DH
WH
+
fre
eb
oa
rd o
f
0.5
m
(all r
ive
r/ca
na
l)
Dik
e e
leva
tin
g
alo
ng
pri
ma
ry
dik
e u
p to
DH
WL
+ fre
eb
oa
rd o
f
0.5
m(a
ll
rive
r/ca
na
l)
Ayu
tth
aya
Byp
ass
(1,400m
3/s)
Rem
ark
sS
tud
y C
ase
Pro
tectio
n d
ike
aro
un
d th
e
eco
no
mic
zo
ne
Dik
e e
leva
tin
g o
n
Ch
ao
Ph
raya
Riv
er
an
d P
asa
k
Riv
er
by B
MA
an
d D
OH
Imp
rove
d
exis
tin
g d
am
op
era
tio
n
Co
nstr
uctio
n o
f
da
ms(n
ew
)
Imp
rove
me
nt o
f
the
re
ten
tio
n
are
as (
mo
nke
y
ch
ee
ks)

Project for the Comprehensive Flood Management Plan
for the Chao Phraya River Basin in the Kingdom of Thailand
Main Report
Chapter 10 Master Plan
CTI Engineering International Co., Ltd.
Oriental Consultants Co., Ltd.
Nippon Koei Co., Ltd.
CTI Engineering Co., Ltd.
10-161
Table 10.4.6 Calculation Condition
Target Flood Item Study conditions for 2011
proposed measures
(Enlarged) Calculation conditions for the 6 typical floods
(1970,1975,1980,1994,1995,2006)
Runoff calculation
Evapotranspiration 0.8 times the observed values in 2011 (TMD)
0.8 times the averages of observed values during 1980-2011 (TMD)
Rainfall Observed values in 2011
Enlarged rate of representative 6 months 1970yr: x 1.128 1975yr: x 1.192 1980yr: x 1.152 1994yr: x 1.190 1995yr: x 1.130 2006yr: x 1.098
Initial values for calculation
Water level on Jan 1, 2011 in the sequential calculation for the past 30 years.
Averages on Jan 1 for the past 30 years (Each average on Jan 1 during 1981-2011).
Inundation calculation
Runoff at the end of upstream
WANG Observed discharges (W.10A) Calculated runoff in Basin 5+6
PING Water volume discharged from Bhumibol Dam (Discharges with current & modified operations)
YOM Observed discharges (Y.20) Calculated runoff in Basin 8
NAN Water volume discharged from Sirikit Dam (Discharges with current & modified operations)
TAB SALAO
Observed water volume discharged from Tab Salao Dam
Calculated runoff in Basin 22
KRA SIEW
Observed water volume discharged from Kra Siew Dam
Calculated runoff in Basin 26
MAE WANG
Observed discharges (Ct.5A) Calculated runoff in Basin 21
KWAE NOI
Water volume discharged from Kwae Noi Dam (Discharges with current & modified operations)
PASAK Water volume discharged from Pasak Dam (Discharges with current & modified operations)
Tidal level
Observed values in 2011 ・Chao Phraya: Pomprachul Station (16cm below the observed after correcting std. height) ・Tha Chin: Samut Sakhon Station (34cm below the observed after
correcting std. height)
Evapotranspiration & Under seepage
Considering penetration and un-modeled discharge system, to set the average of pan evaporation for the past 30 years deriving from inundation meshes plus 10mm/day at most.
10.4.3 Result of the Study
The effectiveness of countermeasures proposed in M/P study against 2011 flood is examined. The evaluation items is discharge, water level, inundation area/depth and inundated volume in flood plain.
The other rainfall patterns to be evaluated age shown below:

Main Report
Chapter 10 Master Plan
Project for the Comprehensive Flood Management Plan
for the Chao Phraya River Basin in the Kingdom of Thailand
10-162 CTI Engineering International Co., Ltd.
Oriental Consultants Co., Ltd.
Nippon Koei Co., Ltd.
CTI Engineering Co., Ltd.
Table 10.4.7 Other Rainfall Patterns to be evaluated
Flood Year
6-month Rainfall (mm) Peak Discharge at Nakhon Sawan (m3/s)
Remarks Upper Nakhon Sawan [C.A. =
105,000km2]
Whole River Basin
[C.A. = 162,000km2]
Observed Value Calculated
Value (without Dams)
2011 1,483 1,390 4,686 6,857 Design Flood 1970 1,266 1,232 4,420 5,830
Other Rainfall Pattern
1975 1,254 1,166 4,336 5,535 1980 1,255 1,207 4,320 5,839 1994 1,313 1,168 2,533 4,268 1995 1,262 1,230 4,820 5,612 2006 1,375 1,266 5,450 * 6,385
* 5,450 m3/s is the recorded peak discharge in 2006. However, the observed peak water level in 2006 is much lower than the value in 2011. Based on the H – Q curve of the year 2011, it is estimated that the peak discharge in 2006 is approximately 3,800 m3/s.
About effectiveness of “Proposed Combination 1 and 2” against other rainfall patterns, Table 10.4.8
shows calculation results against actual rainfalls of other years. On the other hand, Table 10.4.9 shows calculation results against rainfalls which are enlarged to the same quantity as the design external force (2011’s 6-month rainfall). As the result of the flood analysis mentioned-above, it could be said that proposed countermeasures, “Proposed Combination 1 (Case 11-0)” or “Proposed Combination 2 (Case 11-1)” is effective against the six representative floods (rainfall scale is 100-year return period) and could protect the protection area including the Bangkok Metropolitan Area from inundation damage.
The longitudinal profile including calculated discharge and water level is shown in Supporting Report Sector E.
Table 10.4.8 Verification Results of Project Effectiveness against Other Actual Rainfalls
Flood Year
Peak Discharge (m3/s)
Remarks
Dyke Elevating around Protection Area
Without Countermeasures
Dyke Elevating around Protection Area
With Combination 1
Dyke Elevating around Protection Area
With Combination 2
Nakhon Sawan
Ayuttha-ya
Bang Sai
Nakhon Sawan
Ayuttha-ya
Bang Sai
Nakhon Sawan
Ayuttha-ya
Bang Sai
2011 4,800 1,100 4,000 4,400 300 3,800 4,400 300 3,500 Design Flood
1970 3,600 1,000 3,500 3,200 300 2,900 3,200 300 2,400
Other Rainfall Pattern
1975 3,700 1,000 3,000 3,200 300 2,600 3,200 300 2,100
1980 4,200 1,000 3,700 3,800 300 3,100 3,800 300 2,700
1994 3,500 1,000 2,900 3,000 300 2,600 3,000 300 2,200
1995 4,100 1,000 3,800 3,500 300 3,100 3,500 300 2,700
2006 4,400 1,000 3,700 3,600 300 2,900 3,600 300 2,500

Project for the Comprehensive Flood Management Plan
for the Chao Phraya River Basin in the Kingdom of Thailand
Main Report
Chapter 10 Master Plan
CTI Engineering International Co., Ltd.
Oriental Consultants Co., Ltd.
Nippon Koei Co., Ltd.
CTI Engineering Co., Ltd.
10-163
Table 10.4.9 Verification Results of Project Effectiveness against Rainfalls enlarged to Same Quantity as 2011’s 6-month Rainfall
Flood Year
Peak Discharge (m3/s)
Remarks
Dyke Elevating around Protection Area
Without Countermeasures
Dyke Heightening around Protection Area
With Combination 1
Dyke Heightening around Protection Area
With Combination 2
Nakhon Sawan
Ayuttha-ya
Bang Sai
Nakhon Sawan
Ayuttha-ya
Bang Sai
Nakhon Sawan
Ayuttha-ya
Bang Sai
2011 4,800 1,100 4,000 4,400 300 3,800 4,400 300 3,500 Design Flood
1970 4,300 1,000 3,900 4,000 300 3,500 4,000 300 3,100
Other Rainfall Pattern
1975 4,800 1,100 4,400 4,400 300 3,800 4,400 300 3,400
1980 4,800 1,100 4,400 4,600 300 3,900 4,600 300 3,600
1994 5,000 1,000 4,200 4,500 300 3,600 4,500 300 3,200
1995 4,600 1,100 4,400 4,300 300 3,900 4,300 300 3,600
2006 4,800 1,100 4,200 4,400 300 3,600 4,400 300 3,200

Main Report
Chapter 10 Master Plan
Project for the Comprehensive Flood Management Plan
for the Chao Phraya River Basin in the Kingdom of Thailand
10-164 CTI Engineering International Co., Ltd.
Oriental Consultants Co., Ltd.
Nippon Koei Co., Ltd.
CTI Engineering Co., Ltd.
10.5 Proposed Combination of Countermeasures
Effective combination of countermeasures have been selected and compared with the combination of SCWRM M/P. To effectively protect the national economic center of Bangkok and its vicinity from floods, it is necessary to select countermeasures for reducing the flood stage:
1) To reduce the flood peak discharge of 400 m³/s at Nakhon Sawan from the upper basin by the effective operation of Bhumibol and Sirikit dams.
2) To reduce flood stage of the river stretch between Ayutthaya and Bang Sai including the confluence of the Pasak River, the New Bypass Channel has been proposed as river channel improvement, because it is very difficult for the stretch to conduct river improvement works such as rising river banks and widening river channel.
3) To reduce flood volume of the Chao Phraya River after the confluence of the Pasak River, the Outer Ring Road Diversion Channel has been proposed.
4) To protect the economic zone (Protection Area), the dyke improvement of lower reaches of the Chao Phraya River has been proposed.
5) To increase discharge capacity of the Tha Chin River and eliminate the negative impact of the left side dyke heightening for protection of the economic zone, the dyke improvement at left side of lower reaches of the Tha Chin River and four (4) shortcut channels have been proposed.
The proposed combination of structural and nonstructural measures are the following two alternatives.
Proposed Combination 1
1) Effective Operation of Existing Dams; 2) Outer Ring Road Diversion Channel (Capacity 500m3/s); 3) River Channel Improvement Works and 4) Ayutthaya Bypass Channel (Capacity 1,400m3/s).
Proposed Combination 2
1) Effective Operation of Existing Dams; 2) Outer Ring Road Diversion Channel (Capacity 1,000m3/s); 3) River Channel Improvement Works; and 4) Ayutthaya Bypass Channel (Capacity 1,400m3/s).
Effectiveness of each proposed combinations is compared with the proposed combination of
SCWRM. The combination of SCWRM M/P is shown as follows:
Combination of SCWRM M/P
1) Effective Operation of Existing Dams; 2) Construction of New Dams; 3) Improvement of Retarding/Retention Areas; 4) East/West Diversion Channel (Capacity 1,500m3/s); and 5) Outer Ring Road Diversion Channel (Capacity 500m3/s); and 6) River Channel Improvement Works. Together with the proposed combinations, the following measures for sustainable development in the
basin are proposed in the Master Plan: ・ Reforestation and restoration of the degraded forest area in the upper basin. ・ Promotion of controlled inundation in the central plain including land use control and
supplemental structural measures.

Project for the Comprehensive Flood Management Plan
for the Chao Phraya River Basin in the Kingdom of Thailand
Main Report
Chapter 10 Master Plan
CTI Engineering International Co., Ltd.
Oriental Consultants Co., Ltd.
Nippon Koei Co., Ltd.
CTI Engineering Co., Ltd.
10-165
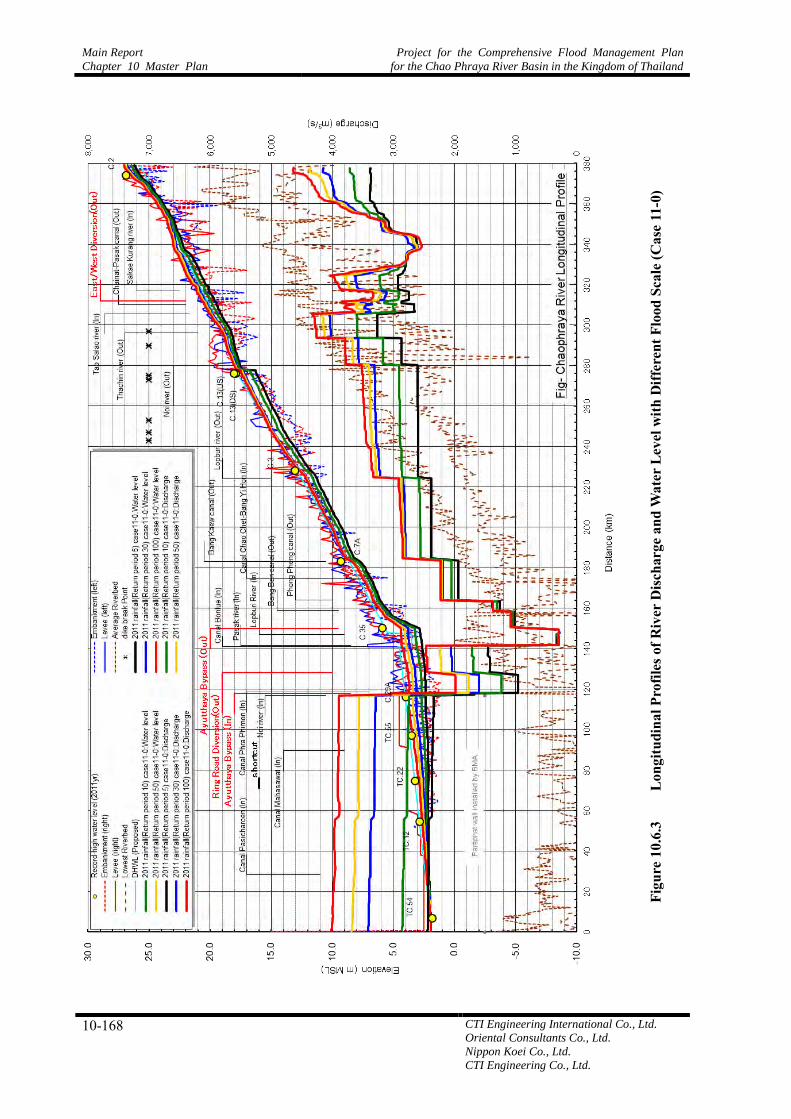
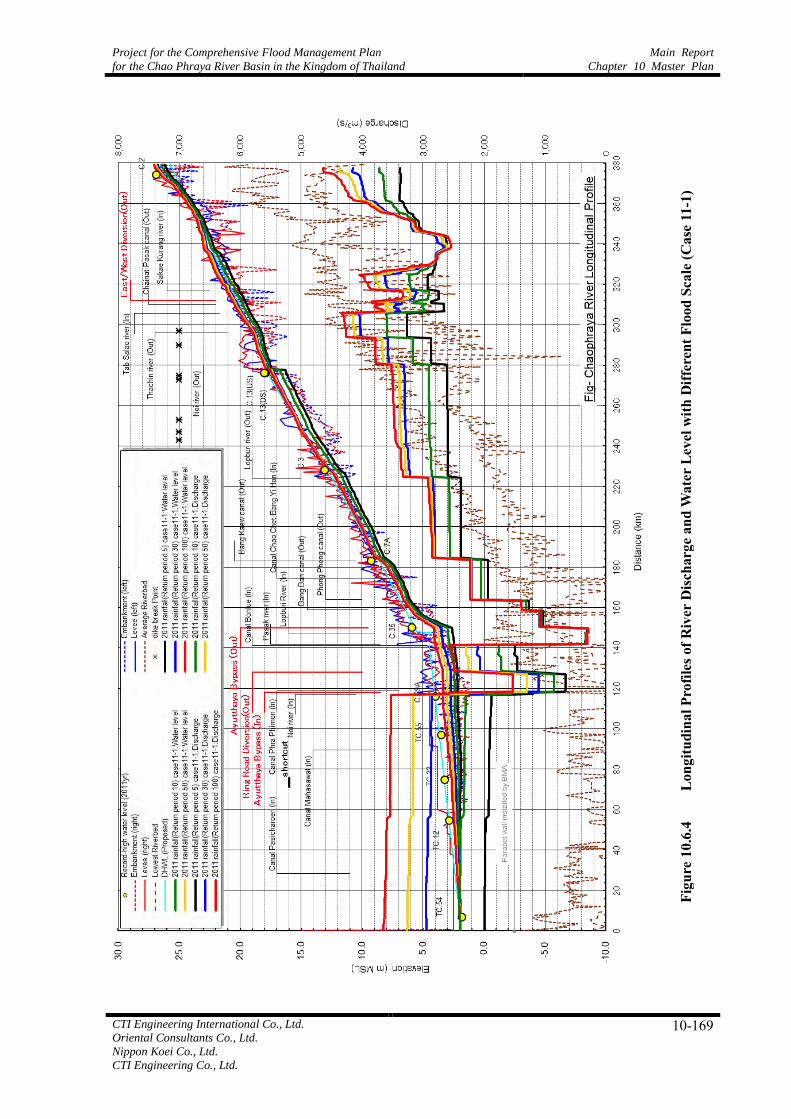
10.6 Hydraulic Examination (Different Flood Scale)
To understand the flood condition in different flood scale including discharge, inundated area, inundation depth and so on, additional flood analysis is done. In this study, the flood analysis under 5-year, 10-year, 30-year, 50-year and 100-year return period is conducted. Table 10.6.2 and Table 10.6.3 show the discharge at major point in Chao Phraya River, and the longitudinal profiles of discharge and water level are shown from Figure 10.6.1 to Figure 10.6.4. The inundation maps are as shown in Supporting Report (1/2), Sector D.
Table 10.6.1 Probable Rainfall in Chao Phraya River Basin
Return Period
Rainfall (mm/6month) Upper Nakhon Sawan (C.2) Whole Basin
Area: 105,000km2 Area:163,000km2 5 1,209 1,165
10 1,278 1,227 30 1,371 1,311 50 1,410 1,346 100 1,459 1,390
*Rainfall Duration: 6 month, equal to 183days Probability density function: LN2PM
Table 10.6.2 Discharge in Different Flood Scale (1/2)
Return Period
Peak Discharge (m3/s)
Remarks Case 0-1: Existing Condition Case 1-1: SCWRM M/P Full Menu
Nakhon Sawan Ayutthaya Bang Sai Nakhon
Sawan Ayutthaya Bang Sai
M/P Study 4,800 1,100 4,300 4,200 1,000 3,500
5 3,800 900 3,000 3,200 700 1,800 Different flood scale
10 4,000 900 3,400 3,500 750 2,100
30 4,500 1,000 3,800 3,800 800 2,400
50 4,700 1,050 4,100 4,000 900 3,000
100 4,800 1,100 4,300 4,200 1,000 3,500
Table 10.6.3 Discharge in Different Flood Scale (2/2)
Return Period
Peak Discharge (m3/s)
Remarks Case 11-0: Proposed Combination 1 Case 11-1: Proposed Combination 2
Nakhon Sawan Ayutthaya Bang Sai Nakhon
Sawan Ayutthaya Bang Sai
M/P Study 4,400 300 3,800 4,400 300 3,500 Design flood
5 3,400 300 2,300 3,400 300 1,900 Different flood scale
10 3,600 300 2,900 3,600 300 2,300
30 4,000 300 3,300 4,000 300 2,800
50 4,200 300 3,600 4,200 300 3,200
100 4,400 300 3,800 4,400 300 3,500

Main Report
Chapter 10 Master Plan
Project for the Comprehensive Flood Management Plan
for the Chao Phraya River Basin in the Kingdom of Thailand
10-166 CTI Engineering International Co., Ltd.
Oriental Consultants Co., Ltd.
Nippon Koei Co., Ltd.
CTI Engineering Co., Ltd.
Figu
re 1
0.6.
1 L
ongi
tudi
nal P
rofil
es o
f Riv
er D
ischa
rge
and
Wat
er L
evel
with
Diff
eren
t Flo
od S
cale
(Cas
e 0-
1)

Project for the Comprehensive Flood Management Plan
for the Chao Phraya River Basin in the Kingdom of Thailand
Main Report
Chapter 10 Master Plan
CTI Engineering International Co., Ltd.
Oriental Consultants Co., Ltd.
Nippon Koei Co., Ltd.
CTI Engineering Co., Ltd.
10-167
Figu
re 1
0.6.
2 L
ongi
tudi
nal P
rofil
es o
f Riv
er D
ischa
rge
and
Wat
er L
evel
with
Diff
eren
t Flo
od S
cale
(Cas
e 1-
1)
Main Report
Chapter 10 Master Plan
Project for the Comprehensive Flood Management Plan
for the Chao Phraya River Basin in the Kingdom of Thailand
10-168 CTI Engineering International Co., Ltd.
Oriental Consultants Co., Ltd.
Nippon Koei Co., Ltd.
CTI Engineering Co., Ltd.
Figu
re 1
0.6.
3 L
ongi
tudi
nal P
rofil
es o
f Riv
er D
ischa
rge
and
Wat
er L
evel
with
Diff
eren
t Flo
od S
cale
(Cas
e 11
-0)
Project for the Comprehensive Flood Management Plan
for the Chao Phraya River Basin in the Kingdom of Thailand
Main Report
Chapter 10 Master Plan
CTI Engineering International Co., Ltd.
Oriental Consultants Co., Ltd.
Nippon Koei Co., Ltd.
CTI Engineering Co., Ltd.
10-169
Figu
re 1
0.6.
4 L
ongi
tudi
nal P
rofil
es o
f Riv
er D
ischa
rge
and
Wat
er L
evel
with
Diff
eren
t Flo
od S
cale
(Cas
e 11
-1)

Main Report
Chapter 10 Master Plan
Project for the Comprehensive Flood Management Plan
for the Chao Phraya River Basin in the Kingdom of Thailand
10-170 CTI Engineering International Co., Ltd.
Oriental Consultants Co., Ltd.
Nippon Koei Co., Ltd.
CTI Engineering Co., Ltd.
10.7 Consideration on Climate Change and Storm Surge
10.7.1 Sea Level Rise Caused by Climate Change
This master plan study focuses on the estimation of change of runoff discharge due to climate change. Judgment whether to change design discharges according to the projected impacts is left to the Thai side. If characteristics of the Chao Phraya River Basin are taken into consideration, countermeasures should be sought separately for the upper basin (upstream of Nakhon Sawan), the middle basin (Ayutthaya to Nakhon Sawan) and the lower basin (the river mouth to Ayutthaya).
The upper basin, in which frequency of large floods will increase, will not be affected since planned structural measures will be changed. On the other hand, the lower basin, which is under the tidal effects, will likely be affected by flood inundation risk augmented by sea level rise and storm surges in addition to rainfall increase. If the impact is very much, the basic specifications of the structural countermeasures including DHWL (Design High Water Level) should be modified.
10.7.2 Previous Studies on Climate Change
(1) Study in Thailand
There are three available study reports on Climate Change in Thailand as shown in Table 10.7.1. The first and second reports are the same in terms of contents. Projection results of the WB (The World Bank) Study1 and the START Study2 are summarized in Table 10.7.2 and Table 10.7.3.
Table 10.7.1 Study Report in Thailand on Climate Change
No. Report Outline
1 Climate Risks and Adaptation in Asian Coastal Megacities, A Synthesis Report
Released in 2010, this report provided impact projection data to the 2009 WB study published in March 2009.
2 Climate Change Impact and Adaptation Study for Bangkok Metropolitan Region (Final Report)
This is the 2009 WB study by Panya Consultant.
3
Preparation of climate Change Scenarios for Climate Change Impact Assessment in Thailand, Southeast Asia START Regional Center, 2010 (START Study)
Projection of 4 variables, maximum and minimum temperature, annual precipitation and sea level rise
Table 10.7.2 Climate Change Impact Projection in 2050 (WB Study)
IPCC Scenario Temperature increase (ºC)
Mean Seasonal Precipitation Increase (%)
Sea Level Rise (m) Storm Surge (m)
B1 1.2 2 0.19 0.61 A1FI 1.9 3 0.29 0.61
1 Climate Change Impact and Adaptation Study for Bangkok Metropolitan Region, Panya Consultants Co., Ltd.
March 2009 2 Preparation of Climate Change Scenarios for Climate Change Impact Assessment in Thailand, Southeast Asia
START Regional Center, January 2010

Project for the Comprehensive Flood Management Plan
for the Chao Phraya River Basin in the Kingdom of Thailand
Main Report
Chapter 10 Master Plan
CTI Engineering International Co., Ltd.
Oriental Consultants Co., Ltd.
Nippon Koei Co., Ltd.
CTI Engineering Co., Ltd.
10-171
Table 10.7.3 Summary of Climate Change Impact Projection by START
Scenario Prediction Note M
axim
um
Tem
pera
ture
SRES A1B (2045-2065)
Rise by 3-4 degrees
In the Chao Phraya River Basin, 3-month estimated temperature, esp. March to May was largely out of the median.
SRES A2 (21st Century) Upward tendency Current temperature (33-35 degrees) may rise
up to 37-39 degrees in the end of 21st Century. SRES B2
(21st Century) Upward tendency Upward tendency in temperature, but without large changes.
Min
imum
Te
mpe
ratu
re SRES A1B
(2045-2065) Rise by
4 degrees In the Chao Phraya River Basin, 23.74 deg. of current temperature may rise up to 27.76 deg.
SRES A2 (21st Century) Upward tendency Current temperature (22-26 deg.) may rise up
to 26-28 deg. in the end of 21st Century. SRES B2
(21st Century) Upward tendency Upward tendency in temperature, but without large changes.
Prec
ipita
tion
SRES A1B (2045-2065)
Rise by 10 %
Upward tendency in the rainy season, namely 1,095 to 1,210mm/y.
SRES A2 (21st Century) Upward tendency
A remarkable rise in precipitation to be observed in the Gulf of Thailand in later 21st Century.
SRES B2 (21st Century) Upward tendency Upward tendency in precipitation, but without
large changes.
Sea
Leve
l R
ise
DIVA & POM (2010-2029)
Rise by 5-10 cm
The coastal area of the Gulf of Thailand including the estuary of Chao Phraya River may be affected most. Effects on the sea level rise vary by season because of affection of monsoon seasons.
DIVA & POM (2030-2049)
Rise by 10-20 cm
(2) Projection of Rainfall
It is very important for flood mitigation planners to know how precipitation will change due to climate change. In the Chao Phraya River Basin where evaporation is much, evaporation is also very important. According to the WB report, precipitation will increase by 2 to 3%. Since the design rainfall duration is assumed to be 6 months in this JICA Study, it is desirable that impact projection results for monthly rainfall are available, at least. However, they have not been found yet as of January 201). Neither have been projection results of evaporation.
According to the START Study in Table 10.7.3, future trends in precipitation are predicted as follows:
・ The Central Plain and Chao Phraya River Basin: There will be higher precipitation throughout the rainy season. Annual precipitation in the future may increase from the present level by approximately 10%, from 1,095mm to 1,210mm.
・ The Gulf of Thailand Coastal Zone: There will be significantly higher precipitation throughout the year. Total annual precipitation could change from 1,857mm to 2,603mm, approximately 40% up. Results from climate models show that precipitation will be significantly increased during the north-east monsoon season during November to February.
(3) Projection of Sea Level Rise
For the Chao Phraya River Basin which has the capital, Bangkok in the lowest tidal area, sea level rise is a very serious issue. According to the WB report, the sea level rise of the Gulf of Thailand will be 19 to 29 cm in 2050. The sea level rise in the global level was presented with a map in the IPCC Fourth Assessment Report (AR4) in 2007 as shown in Figure 10.7.1. The adopted scenario is A1B, and a rise of 21 to 48cm is projected all over the globe. However, there is no information (Blank) in the Gulf of Thailand. Due to the previous studies on Climate Change, the sea level rise in the Gulf of Thailand is not much different from the average of global sea level rise.
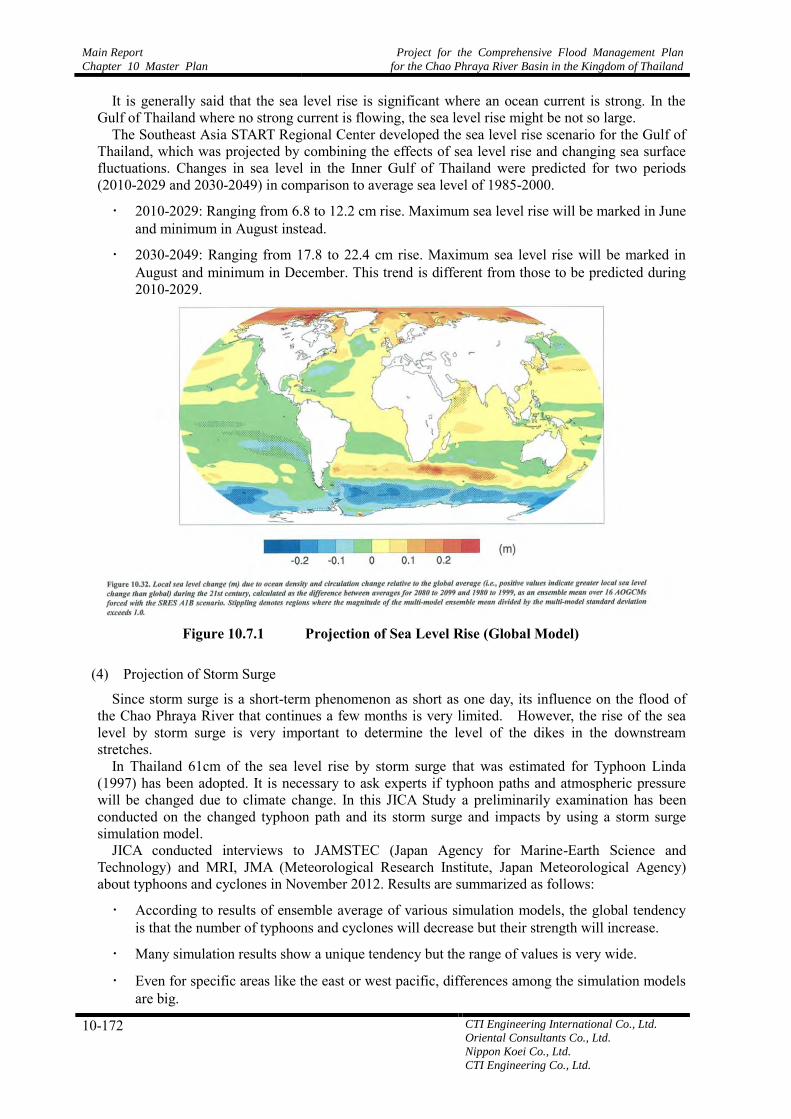
Main Report
Chapter 10 Master Plan
Project for the Comprehensive Flood Management Plan
for the Chao Phraya River Basin in the Kingdom of Thailand
10-172 CTI Engineering International Co., Ltd.
Oriental Consultants Co., Ltd.
Nippon Koei Co., Ltd.
CTI Engineering Co., Ltd.
It is generally said that the sea level rise is significant where an ocean current is strong. In the Gulf of Thailand where no strong current is flowing, the sea level rise might be not so large.
The Southeast Asia START Regional Center developed the sea level rise scenario for the Gulf of Thailand, which was projected by combining the effects of sea level rise and changing sea surface fluctuations. Changes in sea level in the Inner Gulf of Thailand were predicted for two periods (2010-2029 and 2030-2049) in comparison to average sea level of 1985-2000.
・ 2010-2029: Ranging from 6.8 to 12.2 cm rise. Maximum sea level rise will be marked in June and minimum in August instead.
・ 2030-2049: Ranging from 17.8 to 22.4 cm rise. Maximum sea level rise will be marked in August and minimum in December. This trend is different from those to be predicted during 2010-2029.
Figure 10.7.1 Projection of Sea Level Rise (Global Model)
(4) Projection of Storm Surge
Since storm surge is a short-term phenomenon as short as one day, its influence on the flood of the Chao Phraya River that continues a few months is very limited. However, the rise of the sea level by storm surge is very important to determine the level of the dikes in the downstream stretches.
In Thailand 61cm of the sea level rise by storm surge that was estimated for Typhoon Linda (1997) has been adopted. It is necessary to ask experts if typhoon paths and atmospheric pressure will be changed due to climate change. In this JICA Study a preliminarily examination has been conducted on the changed typhoon path and its storm surge and impacts by using a storm surge simulation model.
JICA conducted interviews to JAMSTEC (Japan Agency for Marine-Earth Science and Technology) and MRI, JMA (Meteorological Research Institute, Japan Meteorological Agency) about typhoons and cyclones in November 2012. Results are summarized as follows:
・ According to results of ensemble average of various simulation models, the global tendency is that the number of typhoons and cyclones will decrease but their strength will increase.
・ Many simulation results show a unique tendency but the range of values is very wide.
・ Even for specific areas like the east or west pacific, differences among the simulation models are big.
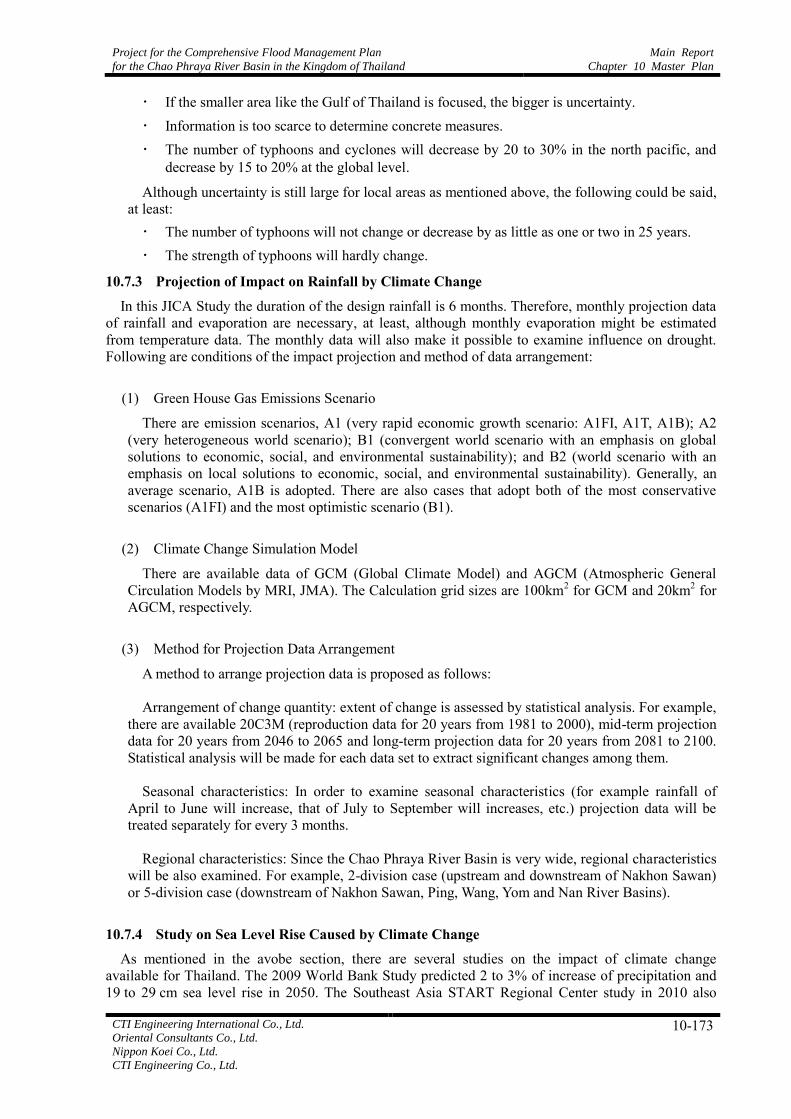
Project for the Comprehensive Flood Management Plan
for the Chao Phraya River Basin in the Kingdom of Thailand
Main Report
Chapter 10 Master Plan
CTI Engineering International Co., Ltd.
Oriental Consultants Co., Ltd.
Nippon Koei Co., Ltd.
CTI Engineering Co., Ltd.
10-173
・ If the smaller area like the Gulf of Thailand is focused, the bigger is uncertainty. ・ Information is too scarce to determine concrete measures. ・ The number of typhoons and cyclones will decrease by 20 to 30% in the north pacific, and
decrease by 15 to 20% at the global level.
Although uncertainty is still large for local areas as mentioned above, the following could be said, at least: ・ The number of typhoons will not change or decrease by as little as one or two in 25 years. ・ The strength of typhoons will hardly change.
10.7.3 Projection of Impact on Rainfall by Climate Change
In this JICA Study the duration of the design rainfall is 6 months. Therefore, monthly projection data of rainfall and evaporation are necessary, at least, although monthly evaporation might be estimated from temperature data. The monthly data will also make it possible to examine influence on drought. Following are conditions of the impact projection and method of data arrangement:
(1) Green House Gas Emissions Scenario
There are emission scenarios, A1 (very rapid economic growth scenario: A1FI, A1T, A1B); A2 (very heterogeneous world scenario); B1 (convergent world scenario with an emphasis on global solutions to economic, social, and environmental sustainability); and B2 (world scenario with an emphasis on local solutions to economic, social, and environmental sustainability). Generally, an average scenario, A1B is adopted. There are also cases that adopt both of the most conservative scenarios (A1FI) and the most optimistic scenario (B1).
(2) Climate Change Simulation Model
There are available data of GCM (Global Climate Model) and AGCM (Atmospheric General Circulation Models by MRI, JMA). The Calculation grid sizes are 100km2 for GCM and 20km2 for AGCM, respectively.
(3) Method for Projection Data Arrangement
A method to arrange projection data is proposed as follows: Arrangement of change quantity: extent of change is assessed by statistical analysis. For example,
there are available 20C3M (reproduction data for 20 years from 1981 to 2000), mid-term projection data for 20 years from 2046 to 2065 and long-term projection data for 20 years from 2081 to 2100. Statistical analysis will be made for each data set to extract significant changes among them.
Seasonal characteristics: In order to examine seasonal characteristics (for example rainfall of
April to June will increase, that of July to September will increases, etc.) projection data will be treated separately for every 3 months.
Regional characteristics: Since the Chao Phraya River Basin is very wide, regional characteristics
will be also examined. For example, 2-division case (upstream and downstream of Nakhon Sawan) or 5-division case (downstream of Nakhon Sawan, Ping, Wang, Yom and Nan River Basins).
10.7.4 Study on Sea Level Rise Caused by Climate Change
As mentioned in the avobe section, there are several studies on the impact of climate change available for Thailand. The 2009 World Bank Study predicted 2 to 3% of increase of precipitation and 19 to 29 cm sea level rise in 2050. The Southeast Asia START Regional Center study in 2010 also
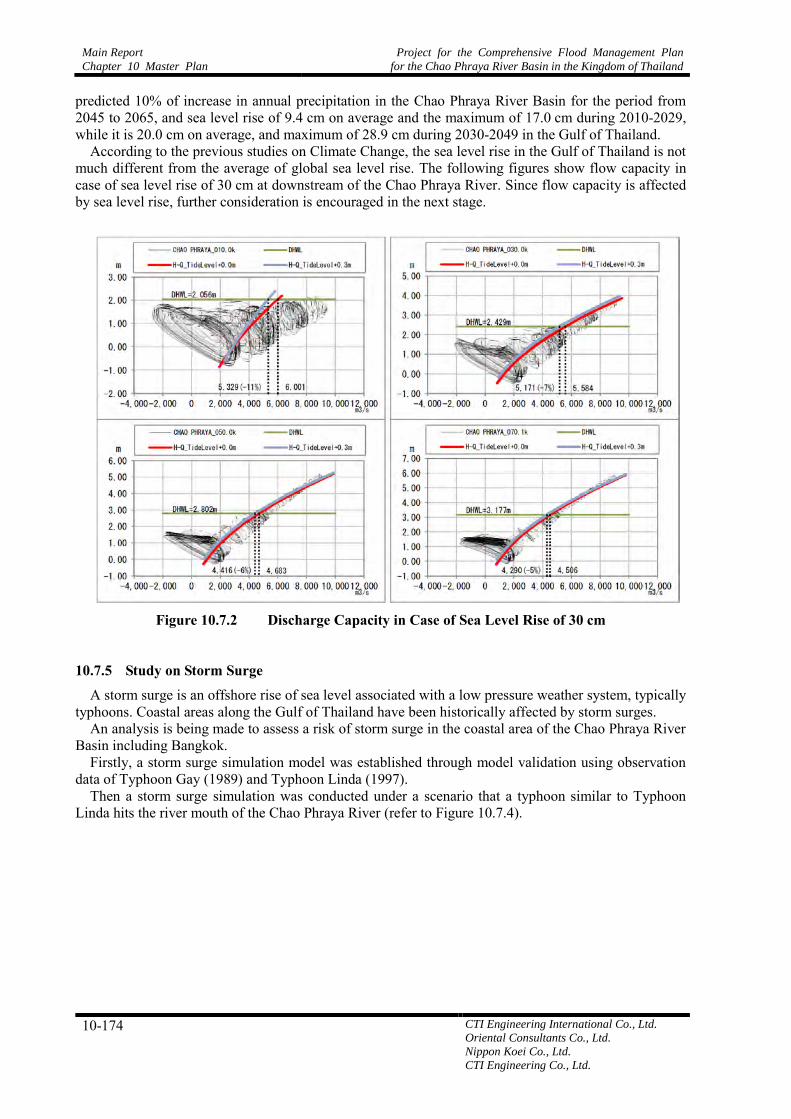
Main Report
Chapter 10 Master Plan
Project for the Comprehensive Flood Management Plan
for the Chao Phraya River Basin in the Kingdom of Thailand
10-174 CTI Engineering International Co., Ltd.
Oriental Consultants Co., Ltd.
Nippon Koei Co., Ltd.
CTI Engineering Co., Ltd.
predicted 10% of increase in annual precipitation in the Chao Phraya River Basin for the period from 2045 to 2065, and sea level rise of 9.4 cm on average and the maximum of 17.0 cm during 2010-2029, while it is 20.0 cm on average, and maximum of 28.9 cm during 2030-2049 in the Gulf of Thailand.
According to the previous studies on Climate Change, the sea level rise in the Gulf of Thailand is not much different from the average of global sea level rise. The following figures show flow capacity in case of sea level rise of 30 cm at downstream of the Chao Phraya River. Since flow capacity is affected by sea level rise, further consideration is encouraged in the next stage.
Figure 10.7.2 Discharge Capacity in Case of Sea Level Rise of 30 cm
10.7.5 Study on Storm Surge
A storm surge is an offshore rise of sea level associated with a low pressure weather system, typically typhoons. Coastal areas along the Gulf of Thailand have been historically affected by storm surges.
An analysis is being made to assess a risk of storm surge in the coastal area of the Chao Phraya River Basin including Bangkok.
Firstly, a storm surge simulation model was established through model validation using observation data of Typhoon Gay (1989) and Typhoon Linda (1997).
Then a storm surge simulation was conducted under a scenario that a typhoon similar to Typhoon Linda hits the river mouth of the Chao Phraya River (refer to Figure 10.7.4).

Project for the Comprehensive Flood Management Plan
for the Chao Phraya River Basin in the Kingdom of Thailand
Main Report
Chapter 10 Master Plan
CTI Engineering International Co., Ltd.
Oriental Consultants Co., Ltd.
Nippon Koei Co., Ltd.
CTI Engineering Co., Ltd.
10-175
Figure 10.7.3 Track of Typhoon Linda in 1997
Figure 10.7.4 Modified Typhoon Route Figure 10.7.5 Simulated Maximum Surge
Moreover, a flood inundation simulation for the 2011 flood was also conducted with water level rise at river mouth by the estimated storm surge as the boundary condition at the river end. The following conditions were set.
・ The storm surge with the highest sea water rise occurred in October 30, 2011 at the time of the highest river water level;
・ The seawater rise was max. 2.0m (refer to Figure 10.7.5) and lasted for 24 hours (refer to Figure 10.7.6); and
・ The simulation on the reproduction of the 2011 Flood is executed with i) the dyke elevation around the economic zone along the Chao Phraya River and Pa Sak River, ii) Effective Operation of Existing Dams, iii) Ayutthaya Bypass and iv) Outer Ring Road Diversion Channel.
11/1
11/2 11/3
11/4

Main Report
Chapter 10 Master Plan
Project for the Comprehensive Flood Management Plan
for the Chao Phraya River Basin in the Kingdom of Thailand
10-176 CTI Engineering International Co., Ltd.
Oriental Consultants Co., Ltd.
Nippon Koei Co., Ltd.
CTI Engineering Co., Ltd.
Figure 10.7.6 Application of Sea Level at Estuary of the Chao Phraya River and Tha Chin River
Estimated inundation area is shown in Figure 10.7.7 and Figure 10.7.8. These figures show that the effect of storm surge to floods in Chao Phraya River Basin is not negligible. Inundated volume to the flood plain was estimated as 3,600 MCM due to storm surge. In case of a huge storm surge, countermeasures including road elevation along the coastline, river improvement works, construction of tide wall etc., would be necessary.
Maximum difference of 2.0m
24hr

Project for the Comprehensive Flood Management Plan
for the Chao Phraya River Basin in the Kingdom of Thailand
Main Report
Chapter 10 Master Plan
CTI Engineering International Co., Ltd.
Oriental Consultants Co., Ltd.
Nippon Koei Co., Ltd.
CTI Engineering Co., Ltd.
10-177
With
Sto
rm S
urge
(Ele
vatio
n of
Sea
Lev
el b
y 2m
)
Figu
re 1
0.7.
7 E
stim
ated
Inun
datio
n A
rea
in C
hao
Phra
ya R
iver
Bas
in
With
out S
torm
Sur
ge

Main Report
Chapter 10 Master Plan
Project for the Comprehensive Flood Management Plan
for the Chao Phraya River Basin in the Kingdom of Thailand
10-178 CTI Engineering International Co., Ltd.
Oriental Consultants Co., Ltd.
Nippon Koei Co., Ltd.
CTI Engineering Co., Ltd.
(October 30)
(October 31)
Figure 10.7.8 Simulation on 2m of Storm Surge with 2011 Flood
1,100MCM 800MCM
1,700MCM
Seawater crosses over coastal line.
Increased river water due to storm surge exceeds river dyke.

Project for the Comprehensive Flood Management Plan
for the Chao Phraya River Basin in the Kingdom of Thailand
Main Report
Chapter 10 Master Plan
CTI Engineering International Co., Ltd.
Oriental Consultants Co., Ltd.
Nippon Koei Co., Ltd.
CTI Engineering Co., Ltd.
10-179
10.8 Cost Estimation and Implementation Plan for the Master Plan
10.8.1 General
(1) Components of Measures
In the master plan, several countermeasures as shown in Figure 10.8.1 have been studied. Among them, this chapter deals with the cost estimate for the following measures.
1) River Improvement (Ayutthaya Bypass Channel and Dyke Improvement) (C5);
2) Construction of new dams (C2);
3) Construction of flood diversion channel (C6);
4) Improvement of retarding/retention areas (C4); and
Figure 10.8.1 Location of Master Plan Countermeasures
(2) Conditions of Cost Estimate
(a) Price Level and Currency
Price level of the project cost is the domestic price level as of December, 2012 indicated in Thai Baht. The applied exchange rate is as follows:
・ 1 USD = 30.7775 Baht (1 Baht = 0.032 USD) ・ 100 JPY = 35.7960 Baht (1 Baht = 2.794 JPY)
[Bank of Thailand Selling Rate as of 28 December, 2012]

Main Report
Chapter 10 Master Plan
Project for the Comprehensive Flood Management Plan
for the Chao Phraya River Basin in the Kingdom of Thailand
10-180 CTI Engineering International Co., Ltd.
Oriental Consultants Co., Ltd.
Nippon Koei Co., Ltd.
CTI Engineering Co., Ltd.
(b) Composition of Project Cost and Estimation Method
The project cost (financial cost) of each component is composed of the following items: ・ Construction Cost ・ Engineering Cost (cost for survey and design) ・ Other Costs (costs for EIA and government administration) ・ Physical Contingency ・ VAT ・ Land Cost ・ Compensation Cost ・ Price Escalation
Item 1) is composed of direct construction cost and indirect construction cost. Direct construction cost was estimated multiplying the work quantity of the major work item based on the preliminary facility design by the unit cost of such work item. The unit cost was set based on the collected cost information such as cost estimation report in the feasibility study by RID and contract document of the previous relevant project by RID, as shown in Table 10.8.1.
Table 10.8.1 Reference Cost Information provided by RID
Document Prepared by Feasibility Study Report
Water Management Project East of Chao Phraya River (West Diversion Channel), 2012 Panya Consultant, etc.
Feasibility Study on the Development of Flood Prone Low-Land in Chao Phraya River Basin, 2009 Team Consultant, etc.
Contract Document Mae Kuang Irrigated Agriculture Development Project Phase II (contract signed in 1987)
Consultant: Sanyu Consultants, etc.; Contractor: Vianini Lavori
Pasak Irrigation Project (Kaeng Khoi – Ban Mo Pumping Irrigation) (contract signed in 2001)
Consultant: Sanyu Consultants, etc.; Contractor: See Sang Karn Yotah
Indirect construction cost was estimated to be 15% to the direct construction cost, based on the
instance of feasibility study and previous construction contract. Item 2) to Item 5) was estimated by the ratio to Item 1) and/or sum of other items. The ratio is as shown in Table 10.8.2.
Table 10.8.2 Ratio for Cost Estimation of Items 2), 3), 4) and 5)
Item Ratio to Item 1) 2) Engineering Cost
Site survey (Topographic, Geotechnical, etc.) Design work
5% of 1) 5% of 1)
3) Other Costs EIA Government administration
5% of [ 1) + 2) ]
10% of [ 1) + 2) ] 4) Contingency 10% of [ 1) + 2) + 3) ] 5) VAT 7% of [ 1) + 2) + 3) + 4) ]
Items 6) and 7) were estimated on the basis of necessary land to be acquired and
houses/factories to be relocated worked out based on the preliminary design and the unit cost. The unit cost was set based on the data in the feasibility study.
Item 8) was set on the assumption that the annual price escalation is 2.5%, based on the IMF estimate of inflation 2012–2017.

Project for the Comprehensive Flood Management Plan
for the Chao Phraya River Basin in the Kingdom of Thailand
Main Report
Chapter 10 Master Plan
CTI Engineering International Co., Ltd.
Oriental Consultants Co., Ltd.
Nippon Koei Co., Ltd.
CTI Engineering Co., Ltd.
10-181
10.8.2 River Improvement
(1) Project Features
(a) Improvement of Chao Phraya River
Longitudinal height of parapet wall is horizontal and step wise, which is higher than record-high water level in the 2011 flood, but actual slope of water level is slanted. In addition, some part of the parapet wall is lower than DHWL + freeboard (50cm). Therefore, dike elevation up to DHWL + freeboard shall be executed.
Bangkok
Ayutthaya
Economic Zone (protected area)
Paknam0.0
1.0
2.0
3.0
4.0
5.0
6.0
7.0
8.0
9.0
10.0
0 10 20 30 40 50 60 70 80 90 100 110 120 130 140 150
Ele
vatio
n (m
M.S
.L)
Distance (km)
Fig- Design High Water Level in Chao Phraya River
DHWL (proposed in the study)DHWL + Freeboard (+0.5m)Height of parapet wall installed by BMARecord-high water level 2011yr flood
Figure 10.8.2 Installation of Parapet Wall along the Lower Chao Phraya River
(b) Improvement of Tha Chin River
To increase discharge capacity at lower reaches of the Tha Chin River and to protect the economic zone, the following countermeasures are adopted:
i) Four (4) shortcuts are installed;
ii) Primary dyke or concrete parapet wall is newly constructed at left side from river mouth (Samut Sakhon Province, Mueang Samut Sakhon) to 90 km point (Nakhon Pathom Province, Nakhon Chai Si);
iii) Secondary dyke at left side is elevated to “Design High Water Level plus Freeboard” from 90 km to 141 km point (Suphan Buri, Song Phi Nong); and
iv) South side dyke along Bunlue Canal is elevated to “Design High Water Level plus Freeboard”.
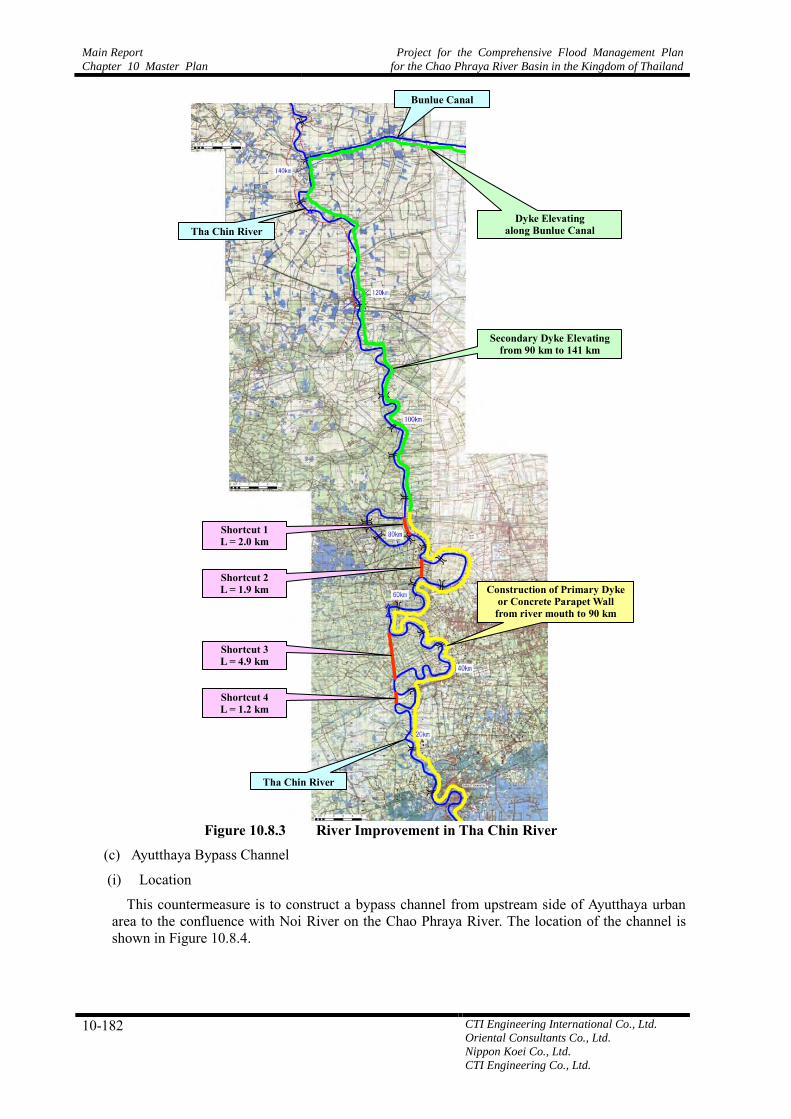
Main Report
Chapter 10 Master Plan
Project for the Comprehensive Flood Management Plan
for the Chao Phraya River Basin in the Kingdom of Thailand
10-182 CTI Engineering International Co., Ltd.
Oriental Consultants Co., Ltd.
Nippon Koei Co., Ltd.
CTI Engineering Co., Ltd.
Figure 10.8.3 River Improvement in Tha Chin River
(c) Ayutthaya Bypass Channel
(i) Location
This countermeasure is to construct a bypass channel from upstream side of Ayutthaya urban area to the confluence with Noi River on the Chao Phraya River. The location of the channel is shown in Figure 10.8.4.
Tha Chin River
Bunlue Canal
Tha Chin River
Shortcut 1 L = 2.0 km
Shortcut 2 L = 1.9 km
Shortcut 3 L = 4.9 km
Shortcut 4 L = 1.2 km
Secondary Dyke Elevating from 90 km to 141 km
Construction of Primary Dyke or Concrete Parapet Wall
from river mouth to 90 km
Dyke Elevating along Bunlue Canal
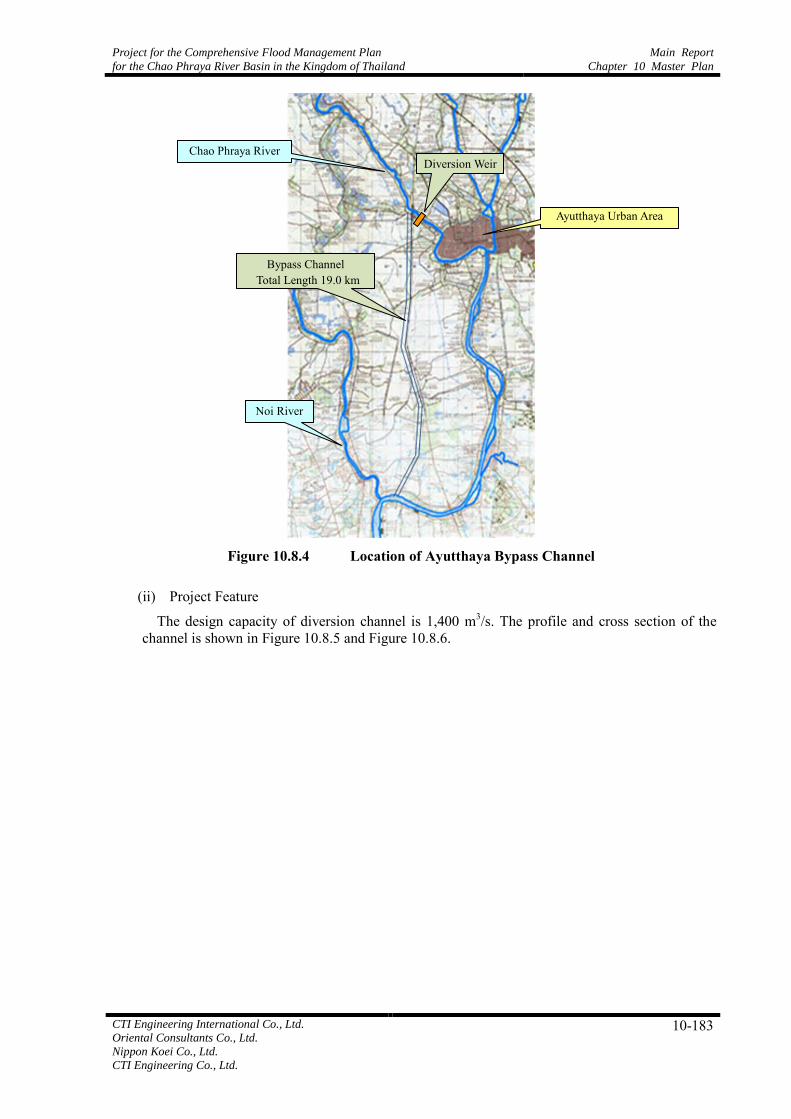
Project for the Comprehensive Flood Management Plan
for the Chao Phraya River Basin in the Kingdom of Thailand
Main Report
Chapter 10 Master Plan
CTI Engineering International Co., Ltd.
Oriental Consultants Co., Ltd.
Nippon Koei Co., Ltd.
CTI Engineering Co., Ltd.
10-183
Figure 10.8.4 Location of Ayutthaya Bypass Channel
(ii) Project Feature
The design capacity of diversion channel is 1,400 m3/s. The profile and cross section of the channel is shown in Figure 10.8.5 and Figure 10.8.6.
Ayutthaya Urban Area
Chao Phraya River
Bypass Channel Total Length 19.0 km
Diversion Weir
Noi River

Main Report
Chapter 10 Master Plan
Project for the Comprehensive Flood Management Plan
for the Chao Phraya River Basin in the Kingdom of Thailand
10-184 CTI Engineering International Co., Ltd.
Oriental Consultants Co., Ltd.
Nippon Koei Co., Ltd.
CTI Engineering Co., Ltd.
Source: JICA study team
Figure 10.8.5 Profile of Ayutthaya Bypass Channel
Source: JICA study team
Figure 10.8.6 Standard Cross Section of Ayutthaya Bypass Channel
The construction work is composed of the following major work item: ・ Earth Works (including ground improvement works) ・ Road Works ・ Concrete Works (Canal lining concrete) ・ Crossing Facilities (Bridge, Gate, Siphon)
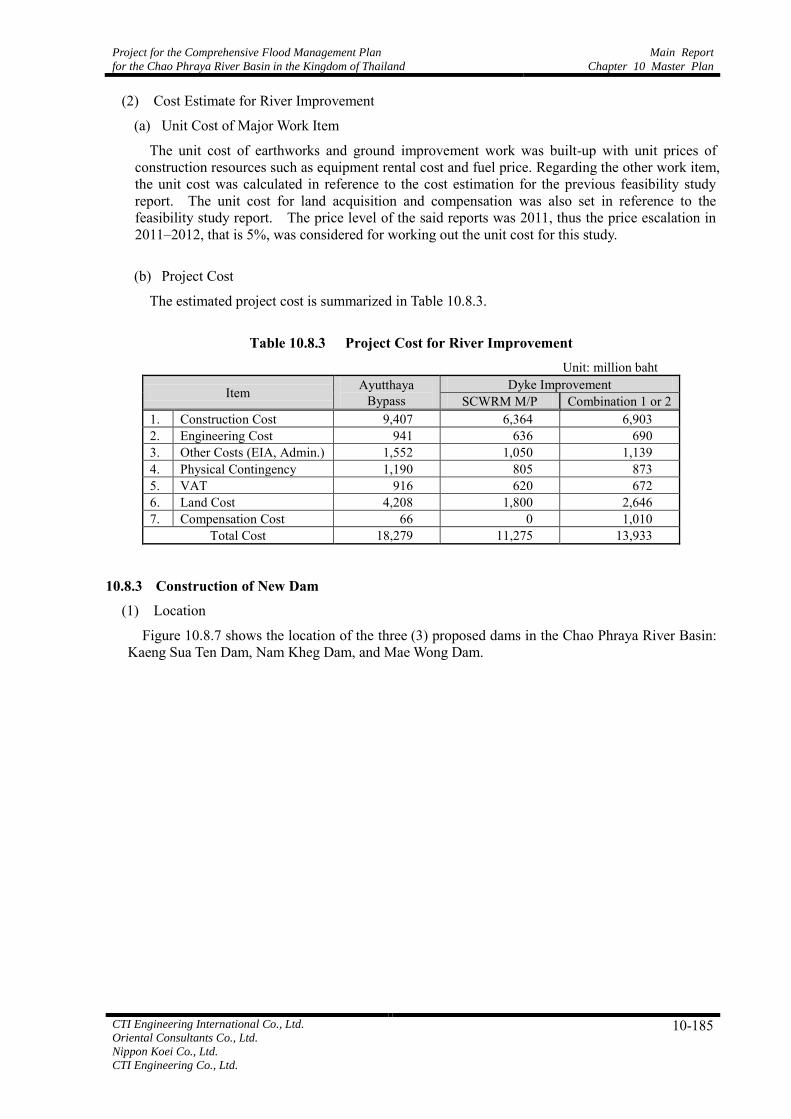
Project for the Comprehensive Flood Management Plan
for the Chao Phraya River Basin in the Kingdom of Thailand
Main Report
Chapter 10 Master Plan
CTI Engineering International Co., Ltd.
Oriental Consultants Co., Ltd.
Nippon Koei Co., Ltd.
CTI Engineering Co., Ltd.
10-185
(2) Cost Estimate for River Improvement
(a) Unit Cost of Major Work Item
The unit cost of earthworks and ground improvement work was built-up with unit prices of construction resources such as equipment rental cost and fuel price. Regarding the other work item, the unit cost was calculated in reference to the cost estimation for the previous feasibility study report. The unit cost for land acquisition and compensation was also set in reference to the feasibility study report. The price level of the said reports was 2011, thus the price escalation in 2011–2012, that is 5%, was considered for working out the unit cost for this study.
(b) Project Cost
The estimated project cost is summarized in Table 10.8.3.
Table 10.8.3 Project Cost for River Improvement Unit: million baht
Item Ayutthaya Bypass
Dyke Improvement SCWRM M/P Combination 1 or 2
1. Construction Cost 9,407 6,364 6,903 2. Engineering Cost 941 636 690 3. Other Costs (EIA, Admin.) 1,552 1,050 1,139 4. Physical Contingency 1,190 805 873 5. VAT 916 620 672 6. Land Cost 4,208 1,800 2,646 7. Compensation Cost 66 0 1,010
Total Cost 18,279 11,275 13,933
10.8.3 Construction of New Dam
(1) Location
Figure 10.8.7 shows the location of the three (3) proposed dams in the Chao Phraya River Basin: Kaeng Sua Ten Dam, Nam Kheg Dam, and Mae Wong Dam.

Main Report
Chapter 10 Master Plan
Project for the Comprehensive Flood Management Plan
for the Chao Phraya River Basin in the Kingdom of Thailand
10-186 CTI Engineering International Co., Ltd.
Oriental Consultants Co., Ltd.
Nippon Koei Co., Ltd.
CTI Engineering Co., Ltd.
Kaeng Sua Ten Dam
Mae Wong Dam
Nam Kheg Dam
Figure 10.8.7 Location Map of New Dams Proposed in the Chao Phraya River Basin
(2) Project Feature
Table 10.8.4 shows the project feature of the three dams, based on the feasibility study by RID. The design feature of Nam Kheg and Mae Wong dam were determined by analogy to the design of Kaeng Sua Ten Dam.

Project for the Comprehensive Flood Management Plan
for the Chao Phraya River Basin in the Kingdom of Thailand
Main Report
Chapter 10 Master Plan
CTI Engineering International Co., Ltd.
Oriental Consultants Co., Ltd.
Nippon Koei Co., Ltd.
CTI Engineering Co., Ltd.
10-187
Table 10.8.4 Project Feature of Proposed New Dams
Item Kaeng Sua Ten Dam Nam Kheg Dam Mae Wong Dam River Basin Yom River Nam River Sakae Krang River Planning Feature
Catchment Area 3,538 km2 937 km2 612 km2 Crest Elevation 261m MSL 538 m MSL 210 m MSL Crest Length 540 m 757 m 903 m Reservoir Area 66.8 km2 11.2 km2 17.6 km2 HWL/LWL 258 m/218 m 530 m/421 m 205 m/180 m Effective Storage 1,125 MCM 542 MCM 238 MCM Maximum Design Discharge 5,360 m3/s 3,030 m3/s 2,470 m3/s
Design Feature Dam Type Rock Fill Type Rock Fill Type Rock Fill Type Dam Hight 69 m 128 m 56 m Dam Slope (Up/Down stream) 1 : 3.0 / 1 :2.0 1 : 3.0 / 1 : 2.0 1 : 3.0 / 1 : 2.0 Dam Crest Width 10.0 m 8.0 m 12.0 m Dam Bottom Width 355.0 m 648.0 m 292.0 m Dam Embankment Volume 3,910,000 m3 18,275,000 m3 4,420,000 m3 Diversion Tunnel D 10.0m, L=455m D 7.5m, L=748 m D 6.8m, L=392m Grouting L=35m x 722 nos. L=65m x 1011 nos. L=30m x 1206 nos.
The construction work is composed of the following major work item:
・ Construction of diversion tunnel ・ Excavation and transportation for dam foundation and spillway ・ Quarry excavation and transportation (spoil) ・ Quarry excavation (rock) and transportation for dam embankment ・ Dam embankment (core) ・ Dam embankment (rock) ・ Grouting ・ Spillway concrete ・ Spillway gate
The work volume was calculated based on the preliminary design for the said feasibility study
and with several assumptions.
(3) Cost Estimate for Construction of New Dam
(a) Unit Cost of Major Work Items
The unit costs of major work items were worked out in reference to the Contract BQ (Bill of Quantities) of a previous and relevant project, the Mae Kuang Project conducted by RID, and converted to the 2012 price level.
(b) Project Cost
The estimated project cost is summarized in Table 10.8.5.

Main Report
Chapter 10 Master Plan
Project for the Comprehensive Flood Management Plan
for the Chao Phraya River Basin in the Kingdom of Thailand
10-188 CTI Engineering International Co., Ltd.
Oriental Consultants Co., Ltd.
Nippon Koei Co., Ltd.
CTI Engineering Co., Ltd.
Table 10.8.5 Project Cost for New Dam Unit: million baht
Item Kaeng Sua Ten Dam Nam Kheg Dam Mae Wong Dam Total of Three
Dams 1. Construction Cost 12,944 21,182 6,945 41,071 2. Engineering Cost 1,294 2,118 695 4,107 3. Other Cost (EIA, Admin.) 2,136 3,495 1,146 6,777 4. Physical Contingency 1,637 2,680 879 5,196 5. VAT 1,261 2,063 677 4,001 6. Land Cost 5,460 874 1,373 7,706 7. Compensation Cost 647 1,059 347 2,054
Total Cost 25,379 33,471 12,061 70,911
10.8.4 Construction of Flood Diversion Channels
(1) Location
Figure 10.8.8 shows the planned route of three diversion channels: (i) West Diversion Channel; (ii) East Diversion Channel; and (iii) Outer Ring Road Diversion Channel.
Figure 10.8.8 Location Map of Three New Diversion Channels
East Diversion Channel
Pasak River
Chao Phraya River
Tha Chin River
West Diversion Channel
Outer Ring Road Diversion
Channel
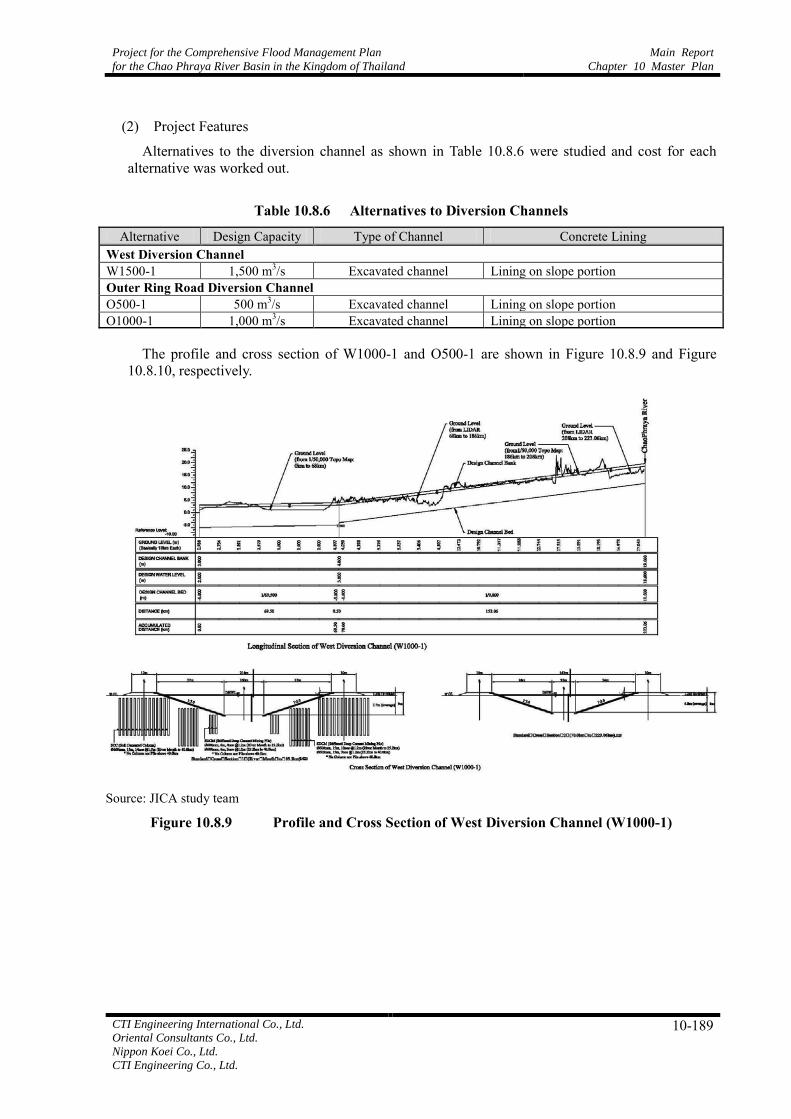
Project for the Comprehensive Flood Management Plan
for the Chao Phraya River Basin in the Kingdom of Thailand
Main Report
Chapter 10 Master Plan
CTI Engineering International Co., Ltd.
Oriental Consultants Co., Ltd.
Nippon Koei Co., Ltd.
CTI Engineering Co., Ltd.
10-189
(2) Project Features
Alternatives to the diversion channel as shown in Table 10.8.6 were studied and cost for each alternative was worked out.
Table 10.8.6 Alternatives to Diversion Channels
Alternative Design Capacity Type of Channel Concrete Lining West Diversion Channel W1500-1 1,500 m3/s Excavated channel Lining on slope portion Outer Ring Road Diversion Channel O500-1 500 m3/s Excavated channel Lining on slope portion O1000-1 1,000 m3/s Excavated channel Lining on slope portion
The profile and cross section of W1000-1 and O500-1 are shown in Figure 10.8.9 and Figure 10.8.10, respectively.
Source: JICA study team
Figure 10.8.9 Profile and Cross Section of West Diversion Channel (W1000-1)
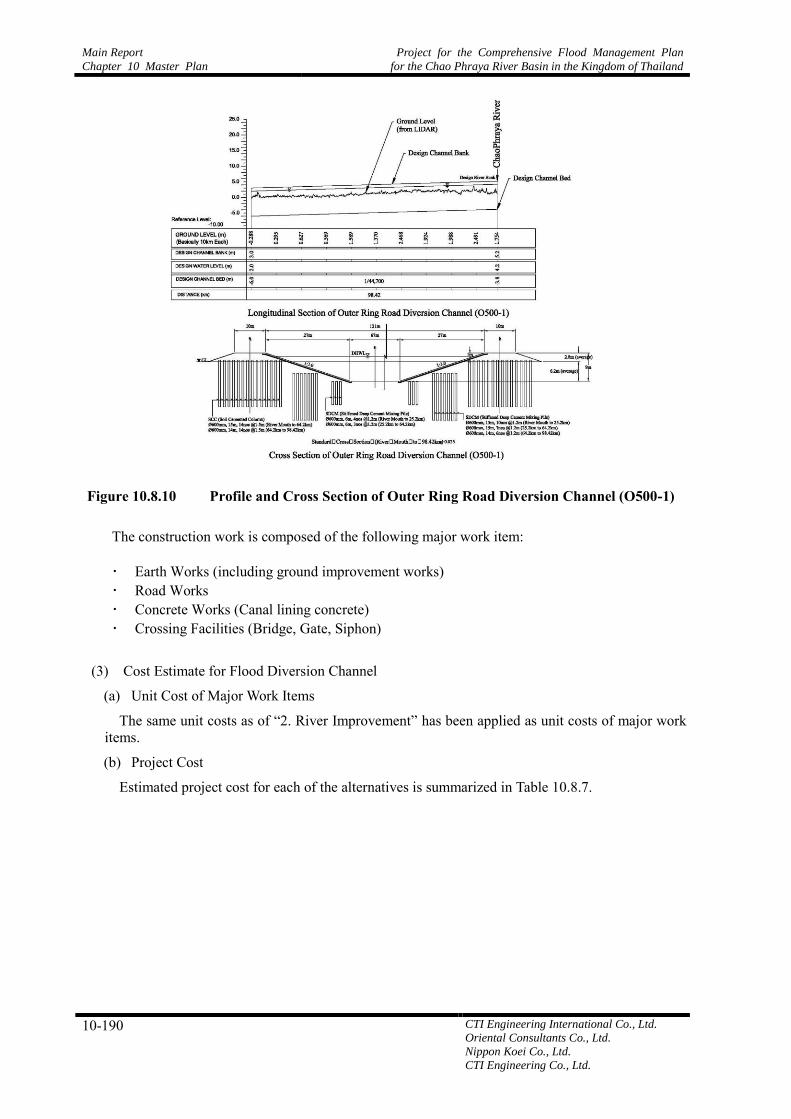
Main Report
Chapter 10 Master Plan
Project for the Comprehensive Flood Management Plan
for the Chao Phraya River Basin in the Kingdom of Thailand
10-190 CTI Engineering International Co., Ltd.
Oriental Consultants Co., Ltd.
Nippon Koei Co., Ltd.
CTI Engineering Co., Ltd.
Figure 10.8.10 Profile and Cross Section of Outer Ring Road Diversion Channel (O500-1)
The construction work is composed of the following major work item: ・ Earth Works (including ground improvement works) ・ Road Works ・ Concrete Works (Canal lining concrete) ・ Crossing Facilities (Bridge, Gate, Siphon)
(3) Cost Estimate for Flood Diversion Channel
(a) Unit Cost of Major Work Items
The same unit costs as of “2. River Improvement” has been applied as unit costs of major work items.
(b) Project Cost
Estimated project cost for each of the alternatives is summarized in Table 10.8.7.
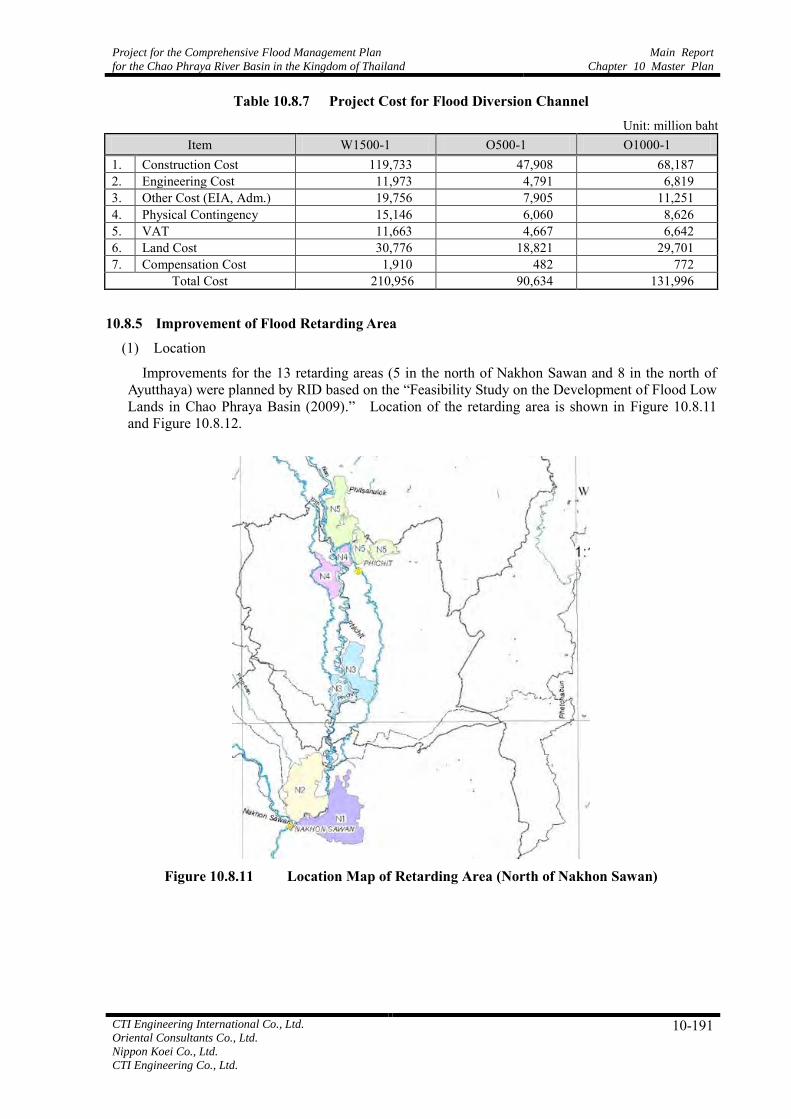
Project for the Comprehensive Flood Management Plan
for the Chao Phraya River Basin in the Kingdom of Thailand
Main Report
Chapter 10 Master Plan
CTI Engineering International Co., Ltd.
Oriental Consultants Co., Ltd.
Nippon Koei Co., Ltd.
CTI Engineering Co., Ltd.
10-191
Table 10.8.7 Project Cost for Flood Diversion Channel Unit: million baht
Item W1500-1 O500-1 O1000-1 1. Construction Cost 119,733 47,908 68,187 2. Engineering Cost 11,973 4,791 6,819 3. Other Cost (EIA, Adm.) 19,756 7,905 11,251 4. Physical Contingency 15,146 6,060 8,626 5. VAT 11,663 4,667 6,642 6. Land Cost 30,776 18,821 29,701 7. Compensation Cost 1,910 482 772
Total Cost 210,956 90,634 131,996
10.8.5 Improvement of Flood Retarding Area
(1) Location
Improvements for the 13 retarding areas (5 in the north of Nakhon Sawan and 8 in the north of Ayutthaya) were planned by RID based on the “Feasibility Study on the Development of Flood Low Lands in Chao Phraya Basin (2009).” Location of the retarding area is shown in Figure 10.8.11 and Figure 10.8.12.
Figure 10.8.11 Location Map of Retarding Area (North of Nakhon Sawan)

Main Report
Chapter 10 Master Plan
Project for the Comprehensive Flood Management Plan
for the Chao Phraya River Basin in the Kingdom of Thailand
10-192 CTI Engineering International Co., Ltd.
Oriental Consultants Co., Ltd.
Nippon Koei Co., Ltd.
CTI Engineering Co., Ltd.
Figure 10.8.12 Location Map of Retarding Area (North of Ayutthaya)
(2) Project Feature
The feature of the retarding area to be improved is shown in Table 10.8.8.
Table 10.8.8 Feature of Retarding Area
Name Retention Area (km2)
Capacity (MCM)
Ave. Water Depth (m)
North of Nakhon Sawan N1 Borapetch Swamp – Chum Sang 219 233 1.1 N2 Chum Sang – Gao Liao 165 238 1.4 N3 Tapan Hin – Bang Moon Nak – Po Talay 147 240 1.6 N4 Mueang PhitchitPhichit – Po Tab Chang 86 147 1.7 N5 Bang Kratum 209 303 1.2 North of Ayutthaya C1 Bang Ban 1 52 126 2.4 C2 Pa Moke – Phak Hai 190 125 0.7 C3 Phak Hai – Bang Yeehon 190 257 1.4 C4 Bang Ban 2 117 279 2.4 C5 Don Pud - Maharaj 152 257 1.7 C6 Tung Pookhao Thong – Bang Pahun 89 249 2.8 C7 Chaiyo – Baan Prak 166 259 1.6 C8 Angthong (West side) 99 186 1.9
The works for improvement of the above of each retarding area is composed of construction
/restoration of the following facilities: ・ Pumping stations ・ Gate ・ Siphon, Culvert canal ・ Natural canal, Irrigation canal ・ Bridge ・ Dyke embankment, Road

Project for the Comprehensive Flood Management Plan
for the Chao Phraya River Basin in the Kingdom of Thailand
Main Report
Chapter 10 Master Plan
CTI Engineering International Co., Ltd.
Oriental Consultants Co., Ltd.
Nippon Koei Co., Ltd.
CTI Engineering Co., Ltd.
10-193
The amount of the above works for each of the retarding area was set according to the facility plan presented in the said feasibility study report.
(3) Cost Estimate for Improvement of Flood Retarding Area
(a) Unit Cost
The unit cost of the above work was worked out in reference to the said feasibility study report and converted to 2012 price level.
(b) Project Cost
The estimated project cost for each retarding basin is summarized in Table 10.8.9.
Table 10.8.9 Project Cost for Improvement of Flood Retarding Area Unit: million baht
Item N1 – N5 C1 – C8 Total 1. Construction Cost 8,855 21,710 30,564 2. Engineering Cost 885 2,171 3,056 3. Other Costs (EIA, Admin.) 1,461 3,582 5,043 4. Physical Contingency 1,120 2,746 3,866 5. VAT 862 2,115 2,977 6. Land Cost 11 1,072 1,083 7. Compensation Cost - - -
Total Cost 13,195 33,396 46,590
10.8.6 Flood Forecasting System
Estimated project cost for the flood forecasting system is summarized in Table 10.8.10.
Table 10.8.10 Summary of Project Cost for Flood Forecasting System Unit: million baht
Item Flood Forecasting System 1. Construction Cost 2,727 2. Engineering Cost 273 3. Other Costs (EIA, Admin.) 450 4. Physical Contingency 345 5. VAT 266 6. Land Cost 0 7. Compensation Cost 0
Total Cost 4,061
10.8.7 Project Cost without Price Escalation
(1) Alternative Combination Cases
Three alternative combination cases as shown in Table 10.8.11 were studied for comparison.

Main Report
Chapter 10 Master Plan
Project for the Comprehensive Flood Management Plan
for the Chao Phraya River Basin in the Kingdom of Thailand
10-194 CTI Engineering International Co., Ltd.
Oriental Consultants Co., Ltd.
Nippon Koei Co., Ltd.
CTI Engineering Co., Ltd.
Table 10.8.11 Alternative Combination Cases
Cases Measures SCWRM M/P C2: New Dams Kaeng Sua Ten, Nam Kheg and Mae Wong Dam C4: Improvement of Retarding Area Total of N1 to N5 and C1 to C8 C5: River Improvement Dyke Improvement C6: Diversion Channel West Diversion Channel (W1500-1) Outer Ring Road Diversion Channel (O500-1) C8: Flood Forecasting System Forecasting System Proposed C5: River Improvement Dyke Improvement Combination 1 Ayutthaya Bypass Channel C6: Diversion Channel Outer Ring Road Diversion Channel (O500-1) C8: Flood Forecasting System Forecasting System Proposed C5: River Improvement Dyke Improvement Combination 2 Ayutthaya Bypass Channel C6: Diversion Channel Outer Ring Road Diversion Channel (O1000-1) C8: Flood Forecasting System Forecasting System
(2) Project Cost without Price Escalation
Estimated project cost without price escalation is summarized in the following table.
Table 10.8.12 Project Cost without Price Escalation
SCWRM M/P Module Description Capacity (m3/s)
Project Cost (million baht) SCWRM
M/P Proposed
Combination 1 Proposed
Combination 2 C1 Reforestation - - NE * NI ** NI
C2 Construction of New Dams 3 dams - 70,911 NI NI
C3 Land Use Control for Flood Area - - NE NI NI
C4 Improvement of Retarding / Retention Areas 13 retention ponds - 46,590 NI NI
C5 River Improvement River channel improvement - 11,275 13,933 **** 13,933 **** Ayutthaya Bypass Channel (L=19km) 1,400 NI 18,279 18,279
C6 Flood Diversion Channel
West diversion channel (L=223km) 1,500 210,956 NI NI
Outer ring road diversion channel (L=98km)
500 90,634 90,634 - 1,000 - - 131,996
C7 Operation Efficiency of Existing Dams
Bhumibol, Sirikit, Kwae Noi, Pa Sak dams - NB *** NB NB
C8 Flood Forecasting System - - 4,061 4,061 4,061 Total - - 434,428 126,907 168,270
* NE: Not estimated (included in SCWRM M/P) ** NI : Not included in the proposed combinations *** NB: Budget allocation is not necessary **** Including river improvement of the Tha Chin River Note 1: The costs in the respective columns include construction, engineering service, administration, land
acquisition, resettlement, physical contingency, price escalation and valued added tax. Note 2: Nonstructural measures proposed in the study are not included in the cost estimate.
10.8.8 Disbursement Schedule
(1) SCWRM Master Plan
(a) Implementation Schedule
Figure 10.8.13 shows the implementation schedule for SCWRM Master Plan.

Project for the Comprehensive Flood Management Plan
for the Chao Phraya River Basin in the Kingdom of Thailand
Main Report
Chapter 10 Master Plan
CTI Engineering International Co., Ltd.
Oriental Consultants Co., Ltd.
Nippon Koei Co., Ltd.
CTI Engineering Co., Ltd.
10-195
2013 2014 2015 2016 2017 2018 2019 2020 2021 2022 2023
Survey and Design
EIA
Land Acquisition& Conpensation
Construction
Figure 10.8.13 Implementation Schedule for SCWRM Master Plan
As shown above, prior to commencement of the construction works, EIA, land acquisition and compensation will be commenced. The construction period is estimated to be at least 8 years.
(b) Disbursement Schedule
Based on the above implementation schedule, the disbursement schedule for SCWRM M/P was worked out. The disbursement schedule is summarized in Table 10.8.13.
Table 10.8.13 Disbursement Schedule for SCWRM Master Plan Unit: million baht
Item Total 2013 2014 2015 2016 2017 2018 2019 2020 2021 2022 2023
Base Cost 434,428 28,420 28,478 28,478 39,555 39,555 54,171 68,788 47,708 33,092 33,092 33,092 Price Escalation 73,527 710 1,442 2,190 4,106 5,198 8,651 12,979 10,420 8,235 9,268 10,327
Total 507,955 29,130 29,920 30,668 43,661 44,753 62,822 81,767 58,128 41,327 42,360 43,419
(2) Proposed Combination 1 and Combination 2
(a) Implementation Schedule
Figure 10.8.14 shows the implementation schedule for the proposed Combination 1 and Combination 2.
2013 2014 2015 2016 2017 2018 2019 2020
Survey and Design
EIA
Land Acquisition& Conpensation
Construction
Figure 10.8.14 Implementation Schedule for Proposed Combination 1 and Combination 2
As shown above, prior to commencement of the construction works, EIA, land acquisition and
compensation will be commenced. The construction period is estimated to be at least 5 years.

Main Report
Chapter 10 Master Plan
Project for the Comprehensive Flood Management Plan
for the Chao Phraya River Basin in the Kingdom of Thailand
10-196 CTI Engineering International Co., Ltd.
Oriental Consultants Co., Ltd.
Nippon Koei Co., Ltd.
CTI Engineering Co., Ltd.
(b) Disbursement Schedule
Based on the above implementation schedule, the disbursement schedule for the proposed Combination 1 and Combination 2 were worked out. The disbursement schedule is summarized in Table 10.8.14 and Table 10.8.15.
Table 10.8.14 Disbursement Schedule for Proposed Combination 1 Unit: million baht
Item Total 2013 2014 2015 2016 2017 2018 2019 2020
Base Cost 126,907 9,623 11,199 11,199 11,643 27,402 27,402 19,522 8,919 Price Escalation 16,485 241 567 861 1,209 3,601 4,376 3,684 1,948
Total 143,393 9,863 11,765 12,060 12,851 31,002 31,777 23,206 10,868
Table 10.8.15 Disbursement Schedule for Proposed Combination 2 Unit: million baht
Item Total 2013 2014 2015 2016 2017 2018 2019 2020
Base Cost 168,270 13,122 15,175 15,175 15,462 35,994 35,994 25,728 11,621 Price Escalation 21,739 328 768 1,167 1,605 4,730 5,748 4,854 2,538
Total 190,009 13,450 15,943 16,342 17,067 40,724 41,742 30,582 14,159
(3) Project Cost with Price Escalation
Estimated project cost with price escalation is summarized in the following table.
Table 10.8.16 Project Cost with Price Escalation
SCWRM M/P Module Description Capacity (m3/s)
Project Cost (million baht) SCWRM
M/P Proposed
Combination 1 Proposed
Combination 2 C1 Reforestation - - NE * NI ** NI
C2 Construction of New Dams 3 dams - 70,911 NI NI
C3 Land Use Control for Flood Area - - NE NI NI
C4 Improvement of Retarding / Retention Areas 13 retention ponds - 46,590 NI NI
C5 River Improvement River channel improvement - 11,275 13,933 **** 13,933 **** Ayutthaya Bypass Channel (L=19km) 1,400 NI 18,279 18,279
C6 Flood Diversion Channel
West diversion channel (L=223km) 1,500 210,956 NI NI
Outer ring road diversion channel (L=98km)
500 90,634 90,634 - 1,000 - - 131,996
C7 Operation Efficiency of Existing Dams
Bhumibol, Sirikit, Kwae Noi, Pa Sak dams - NB *** NB NB
C8 Flood Forecasting System - - 4,061 4,061 4,061 Price Escalation (2013 to 2020 or 2023) - - 73,527 16,485 21,739
Total - - 507,955 143,393 190,009
* NE: Not estimated (included in SCWRM M/P) ** NI : Not included in the proposed combinations *** NB: Budget allocation is not necessary **** Including river improvement of the Tha Chin River Note 1: The costs in the respective columns include construction, engineering service, administration, land
acquisition, resettlement, physical contingency, price escalation and valued added tax. Note 2: Nonstructural measures proposed in the study are not included in the cost estimate.

Project for the Comprehensive Flood Management Plan for the Chao Phraya River Basin in the Kingdom of Thailand
Main Report Chapter 11 Project Evaluation
CTI Engineering International Co., Ltd. Oriental Consultants Co., Ltd. Nippon Koei Co., Ltd. CTI Engineering Co., Ltd.
11-1
CHAPTER 11 PROJECT EVALUATION
11.1 Economic Evaluation
11.1.1 Methodology
(1) General
The main objective of the economic evaluation here is to examine the investment efficiency of the component of the Master Plan from the viewpoint of national economy using cost-benefit analysis in cases where it can be applied. Market prices have been converted to economic ones where the influence of market distortion is removed, (the so-called shadow prices). Opportunity costs are used for the costs of goods and services whose markets do not exist. Economic Internal Rate of Return (EIRR) is used here as the indicator of efficiency of project investment.
(2) Preconditions
The following preconditions are assumed in the economic evaluation. Additional preconditions will be clarified as necessary.
(a) With-Project and Without-Project
“Without-Project” is the case where flood is managed by the currently existing systems. “With-Project” is the case where the project component is implemented into the currently existing systems.
(b) Evaluation Period
Evaluation period covers the whole project life from the preparation of construction. It is decided as 2013 to 2050 (38 years after the commencement of the project).
(c) Standard Conversion Factor (SCF)
A conversion factor is the ratio between the economic price value and the financial price value for a project output or input. When it is calculated for the economy as a whole, it is called as Standard Conversion Factor (SCF) or an average conversion factor. Since border prices are regarded as economic prices, SCF is used for bringing such goods that are valued in domestic price level and those that are valued in border price level to a common base. In addition, SCF is simply the inverse of the Shadow Exchange Rate Factor (SERF), which is the ratio of the shadow exchange rate to the official exchange rate by definition. SCF of Thailand is estimated as 1 (one).
(d) Shadow Wage Rate Factor
Considering the low unemployment rate and its downward trend in Thailand, Shadow Wage Rate Factor (SWRF) or the ratio between its shadow wage rate and its price for unskilled labor can be estimated as 1 (one).
(e) Price Level
Price level is set at 2012. Price data before 2012 is adjusted to the 2012 level by applying the inflation rate.
(f) Social Discount Rate
Twelve percent (12%) is employed as the social discount rate for this economic analysis.
(3) Costs
Incremental costs are included in the evaluation by comparing “with-project” and “without-project situations.” Costs are calculated in the form of cash flow of each year during the evaluation period. The following cost items are considered:

Main Report Chapter 11 Project Evaluation
Project for the Comprehensive Flood Management Plan for the Chao Phraya River Basin in the Kingdom of Thailand
11-2 CTI Engineering International Co., Ltd. Oriental Consultants Co., Ltd. Nippon Koei Co., Ltd. CTI Engineering Co., Ltd.
(a) Capital Cost
Capital cost includes costs of construction of facilities and equipment, and consulting services. Economic evaluation includes physical contingencies but excludes price escalations.
(b) Operation and Maintenance Cost
Operation and maintenance cost for each year is included. Price escalation is not included.
(c) Depreciation
Since the money allocated and subject to depreciation is not actually spent at that time, it is not included in the cost items.
(4) Benefits
Incremental benefits are included in the evaluation by comparing with-project and without-project situations. The benefits are calculated in the form of cash flow of each year during the evaluation period. Benefits of a flood management project are the reduction or mitigation of damages caused by floods.
As for the direct damage caused by flood, generally, it can be calculated by the following formula:
[Direct Damage in the Area (Baht)] = [Area Size (km2)] × [Damageable Value (Baht/km2)] × [Damage Rate by Inundation Depth] The damageable value is the maximum amount of asset value that will be damaged by the
inundation. It is assumed that damage rate is a function of inundation depth (m) and the function should be estimated. Since the flood causing inundation is a probability event, the damage value to be calculated is the yearly expected value based on the probability of flood occurrence (sum of damages multiplied by each flood probability). In this project, the flood analysis in different five flood scales, 2-year, 10-year, 30-year, 50-year and 100-year return period, are conducted. In the economic evaluation, conceivable flood risk has to be considered even after completion of the project and the flood analysis considering the dike breaches is done. The assumed dike break points are selected according to the following conditions,
i) Flood analysis counting dike breaches is done for Chao Phraya River and Pasak River. The
dike breaches in the both rivers would damage the economic zone. ii) Relative elevation between embankment and dike exceeds more than 2.0m and, duration that
water level is higher than DHWL in Chao Phraya River, and the average dike height minus 50cm in Pasak River, is more than thirty days. In 2011yr, dike breaches occurred intensively in the sections with high relative elevation (refer to Chapter 2, 2.1.4 River System) and the longer duration of water lever keeping high, the more risk of dike breach due to seepage failure of dike body increases.
The Inundation maps in different flood scales and assumed dike breach points are shown in
Supporting Report, Sector P: Economic Evaluation. Estimation of indirect damages varies for each category. It will be discussed later in actual
calculation for each category.

Project for the Comprehensive Flood Management Plan for the Chao Phraya River Basin in the Kingdom of Thailand
Main Report Chapter 11 Project Evaluation
CTI Engineering International Co., Ltd. Oriental Consultants Co., Ltd. Nippon Koei Co., Ltd. CTI Engineering Co., Ltd.
11-3
11.2 Economic Evaluation of Master Plan
11.2.1 Conditions of Evaluation
(1) Economic Prospects of Thailand
One of the Japanese prestigious commercial banks, the Bank of Tokyo-Mitsubishi UFJ, published a report on the middle-term economic prospects of Thailand in January 2013. Following is the scenario of the economic growth of Thailand up to 2022.
(a) 2012 to 2014: Average growth rate is 4.5% to 4.9%.
The growth rate in 2012 would increase to the middle of 5% level due to the rebound from flood damage in 2011 but that in 2013 will lower again due to the rebound by high growth in 2012. Investment for flood management by the Government as well as increase in direct investment with the expectation of ASEAN Economic Community (AEC) establishment will keep a steady growth. Significant increase in minimum wage in 2012-2013 will increase consumption and support the growth.
(b) 2015 to 2018: Average growth rate is the middle of 4% level.
Thailand will strengthen its role as a production center of ASEAN taking advantage of the AEC establishment. Expansion of consumption as well as increase in export within ASEAN will speed up the growth gradually and the growth rate will reach 5% level in 2018.
(c) 2019 to 2022: Average growth rate is 4.0% to 4.4%.
Growth rate will lower gradually as Thailand will enter a population onus period and the effect of transition of Chinese economy to stable growth economy will materialize. Production of low value-added products will shift to CLM countries due to the increase in labor costs in Thailand. Its dependence on export will lower relatively although it is still a driving force of growth. On the other hand, increase in urbanization as well as increase in per capita GDP to 8,000 USD will pull up the growth by expanding mature consumption such as services.
[Reference]
Oxford Economics, an economic forecasting company in UK, made the following forecast for the Thai economy in the “County Economic Forecast” dated May 24, 2012. It forecasted higher growth than that of the Bank of Tokyo-Mitsubishi UFJ for a few years after the flood recovery.
Year 2011 2012 2013 2014 2015 2016 GDP Growth
(%) 0.1 5.3 6.5 5.6 5.4 4.9
Source: Oxford Economics, “Country Economic Forecast,” May 24, 2012.
(2) Analysis of Questionnaire Survey on Flood Damage
(a) Manufacturing
In order to examine economic impacts by the 2011 flood, flood damage analysis is conducted with data obtained from a questionnaire survey in manufacturing factories of the seven flooded industrial estates (Aug-Oct 2012). Examinations, results and evaluation of the analysis are as follows:
(i) Relationship between Inundation Depth and Damage Rate of Assets (Whole Sectors)
Examinations are done with all effective data on relationship between inundation depth above the floor and damage rate of assets such as fixed and inventory assets. Data show that lots of damage rate values are scattered at the same depth, indicating no statistically significant relations. The determination coefficients (R2), 0.0042 for fixed assets and 0.015 for inventory assets also support the results.

Main Report Chapter 11 Project Evaluation
Project for the Comprehensive Flood Management Plan for the Chao Phraya River Basin in the Kingdom of Thailand
11-4 CTI Engineering International Co., Ltd. Oriental Consultants Co., Ltd. Nippon Koei Co., Ltd. CTI Engineering Co., Ltd.
Inudation Depth above Floor vs. Damage Rate
(Fixed Assets)
y = -0.0201x + 0.4905
R2 = 0.0042
0.0
0.2
0.4
0.6
0.8
1.0
0 1 2 3 4 5Inundation Depth above Floor (m)
Dam
age
Rat
e
Figure 11.2.1 Relationship between Inundation Depth and Damage Rate
(Fixed Assets)
Inudation Depth above Floor vs. Damage Rate
(Inventory Assets)
y = 0.0476x + 0.3881
R2 = 0.0149
0.0
0.2
0.4
0.6
0.8
1.0
0 1 2 3 4 5
Inundation Depth above Floor (m)
Dam
age
Rat
e
Figure 11.2.2 Relationship between Inundation Depth and Damage Rate
(Inventory Assets)
(ii) Relationship between Inundation Depth and Damage Rate of Assets (by Sector)
Considering no relations using the data in whole sectors, another examination is conducted by dividing the data by sector such as: I) Food & Textile; II) Chemical & Metals; III) General Machinery; IV) Electronic Machinery; and V) Others. They indicate that all determination correlations are much lower than those for statistical significance in both assets.
(b) Households
Like the case in manufacturing, damage analysis on households is conducted with data obtained from a questionnaire survey from the residents living in the flooded areas in the Chao Phraya River Basin (Aug-Oct 2012). Examinations, results and evaluation of the analysis are as follows:
(i) Relationship between Inundation Depth and Damage Rate of Assets (Whole Households)
Similar to the method in Manufacturing, examinations are done with all effective data on relationship between inundation depth above the floor and damage rate of assets such as buildings and household goods.
The determination correlations (R2) obtained from the graphics indicate little significant relations in statistics with 0.0994 for buildings and 0.1161 for household goods.

Project for the Comprehensive Flood Management Plan for the Chao Phraya River Basin in the Kingdom of Thailand
Main Report Chapter 11 Project Evaluation
CTI Engineering International Co., Ltd. Oriental Consultants Co., Ltd. Nippon Koei Co., Ltd. CTI Engineering Co., Ltd.
11-5
Inundation Depth above Floor vs. Damage Rate (Buildings)
y = 0.0862x + 0.2853
R2 = 0.0994
0
0.25
0.5
0.75
1
0 1 2 3 4 5
Inundation Depth above Floor (m)
Dam
age
Rat
e
Figure 11.2.3 Relationship between Inundation Depth and Damage Rate (Buildings)
Inundation Depth above Floor vs. Damage Rate
(Household Goods)
y = 0.1345x + 0.377
R2 = 0.1161
0
0.25
0.5
0.75
1
0 1 2 3 4 5Inundation Depth above Floor (m)
Dam
age
Rat
e
Figure 11.2.4 Relationship between Inundation Depth and Damage Rate
(Household Goods)
(ii) Relationship between Inundation Depth and Damage Rate of Assets (by Floor Space)
To examine the scale of damage by living standards, per capita floor space of a house is assumed to be a factor of living standards. Three classifications of floor space are set as: I) less than 30m2/head; II) 30-100 m2/head; and III) more than 100m2/head, considering the balance of data volume. The values of R2 seem to be better by the classification but all values could not be statistically significant for using flood damage estimation.
(iii) Relationship between Inundation Depth and Damage Rate of Assets (by Story of House)
Based on an assumption that the house structure might give an effect on damages by the flood, the relationship between inundation depth and damage rate of assets by story of house (one- and two-story) is evaluated.
The results show no significant relationships were found between the two parameters, even though a tendency of higher correlations for two-story houses is observed. A negative correlation is seen in the building damage with one-story houses.

Main Report Chapter 11 Project Evaluation
Project for the Comprehensive Flood Management Plan for the Chao Phraya River Basin in the Kingdom of Thailand
11-6 CTI Engineering International Co., Ltd. Oriental Consultants Co., Ltd. Nippon Koei Co., Ltd. CTI Engineering Co., Ltd.
11.2.2 Costs
Costs are economic ones where the transfer payments; namely, taxes and duties, are excluded. Following items are included in the cost calculation: (i) Construction; (ii) Engineering; (iii) Other (EIA, admnistration); (iv) Physical contingencies; (v) Land aqiusition; (vi) Compensation; and (vii) O&M. Costs of (i) to (vi) will accrue once as capital costs before and/or in the construction period. O&M cost will accrue every year after the construction is completed and the facilites start to be used. Capital costs are shown in the followint table.
Table 11.2.1 Economic Capital Costs (SCWRM M/P) (Unit: Million Baht)
Item
New Dams Retarding Area
River Improve-
ment Diversion Channel
Flood Forecasting
System Total Kaeng Sua
Ten, Nam Kheg and
Mae Wong Dam
Total of N1 - N5, C1
- C8
Dyke Improvement
West Diversion Channel
(W1500-1)
Outer Ring Road
Diversion Channel (O500-1)
1. Construction 41,071 30,564 6,364 119,733 47,908 2,727 248,368 2. Engineering 4,107 3,056 636 11,973 4,791 273 24,837 3. Other (EIA, Adm.) 6,777 5,043 1,050 19,756 7,905 450 40,981
4. Physical Contingency 5,196 3,866 805 15,146 6,060 345 31,419
5. Land Acquisition 7,706 1,083 1,800 30,776 18,821 0 60,186 6. Compensation 2,054 0 0 1,910 482 0 4,446
Total 66,911 43,613 10,655 199,294 85,968 3,795 410,236
Table 11.2.2 Economic Capital Costs (Proposed Combination 1) (Unit: Million Baht)
Item
River Improvement Diversion Channel Flood Forecasting
System Total Dyke Improvement
Ayutthaya By-Pass
Outer Ring Road Diversion Channel
(O500-1)
1. Construction 6,903 9,407 47,908 2,727 66,945 2. Engineering 690 941 4,791 273 6,694 3. Other (EIA, Adm.) 1,139 1,552 7,905 450 11,046 4. Physical Contingency 873 1,190 6,060 345 8,469 5. Land Acquisition 2,646 4,208 18,821 0 25,675 6. Compensation 1,010 66 482 0 1,558
Total 13,261 17,363 85,968 3,795 120,387
Table 11.2.3 Economic Capital Costs (Proposed Combination 2) (Unit: Million Baht)
Item
River Improvement Diversion Channel Flood Forecasting
System Total Dyke Improvement Ayutthaya By-Pass
Outer Ring Road Diversion Channel
(O1000-1)
1. Construction 6,903 9,407 68,187 2,727 87,223 2. Engineering 690 941 6,819 273 8,722 3. Other (EIA, Adm.) 1,139 1,552 11,251 450 14,392 4. Physical Contingency 873 1,190 8,626 345 11,034 5. Land Acquisition 2,646 4,208 29,701 0 36,555 6. Compensation 1,010 66 772 0 1,848
Total 13,261 17,363 125,355 3,795 159,774

Project for the Comprehensive Flood Management Plan for the Chao Phraya River Basin in the Kingdom of Thailand
Main Report Chapter 11 Project Evaluation
CTI Engineering International Co., Ltd. Oriental Consultants Co., Ltd. Nippon Koei Co., Ltd. CTI Engineering Co., Ltd.
11-7
11.2.3 Benefits
As mentioned in the section of methodology, benefits of the project are captured in the form of expected direct/indirect damage reduction. Damages are examined and estimated for each sector including manufacturing, households, agriculture, other industries and infrastructure/public sector below.
(1) Manufacturing Sector
(a) Direct Damages
(i) Damageable Values of Manufacturing Sector
Fixed assets (building, machinery, vehicle, office appliances, equipment, etc.) and inventory assets (materials and components, work in progress, finished goods, goods purchased for resale) of factories are considered as the damageable property of the manufacturing sector. Available Data
“Factory Data 2011” is available from the website of the Department of Industrial Work (DIW), Ministry of Industry. This data include name, type, address, land area, number of employees, etc., of each factory. There are 40,594 factories included in the data for the 24 provinces that are relevant to the potential inundation areas.
The National Statistical Office (NSO) published “The 2007 Industrial Census,” which includes the fixed asset data and inventory asset data in book value in addition to the number of persons engaged by industrial division for each province as of December 31, 2006.
Damageable values are calculated as follows: (1) Values of fixed assets and inventory assets per person engaged are calculated by the
division for each province using ‘The 2007 Industrial Census.” (2) Asset values of each factory are calculated by multiplying asset values per person
engaged by the number of person engaged in the factory which is included in the “Factory Data 2011.”
(3) Since factory data in the “Factory Data 2011” have location data, the location of asset values is identified, which can be utilized to the flood simulation results.
Modification of Calculation Results
Asset values of factories calculated above are modified for the following reasons: (1) Asset values calculated above are summed up to estimate the total asset value for each
Province and compared with the data of “The 2007 Industrial Census” which includes the actual total asset value for each Province, and then the former figures are modified to coincide with the latter data.
(2) Since the values are indicated in 2006 price, they are adjusted to the 2011 price by multiplying with 1.288, which is the wholesale price escalation since 2006.
Table 11.2.4 Wholesale Price Index of Thailand
2005 2006 2007 2008 2009 2010 2011 Wholesale price index (2005 = 100) 100.0 107.1 110.5 124.3 119.6 130.8 137.9 Comparison with 2006 (times) – 1.000 1.032 1.160 1.116 1.221 1.288 Source: World Bank Note: Data is available for years up to 2011
Estimation Result of Damageable Values
Table 11.2.5 presents the damageable values in a potential inundation area of about 35,000 km2 that is delineated so as to cover inundation areas of past major floods as shown in Figure 11.2.5.

Main Report Chapter 11 Project Evaluation
Project for the Comprehensive Flood Management Plan for the Chao Phraya River Basin in the Kingdom of Thailand
11-8 CTI Engineering International Co., Ltd. Oriental Consultants Co., Ltd. Nippon Koei Co., Ltd. CTI Engineering Co., Ltd.
Table 11.2.5 Damageable Values of Factories in Potential Inundation Area
Number Province Damageable Values (Million Baht) Fixed Assets Inventory Assets Total
1 Bangkok 458,158 213,011 671,169 2 Nonthaburi 36,352 15,324 51,676 3 Pathum Thani 365,725 91,629 457,354 4 Ayutthaya 244,642 57,851 302,493 5 Ang Thong 10,192 2,416 12,608 6 Lopburi 12,830 4,413 17,243 7 Singburi 10,144 5,471 15,615 8 Chainat 2,436 1,036 3,472 9 Saraburi 45,169 14,537 59,706 10 Samut Prakarn 440,810 196,883 637,693 11 Chachoengsao 121,789 47,093 168,882 12 Nakhon Nayok 942 359 1,301 13 Ratchaburi 1,231 551 1,782 14 Suphan Buri 7,040 2,296 9,336 15 Nakhon Pathom 57,889 23,067 80,956 16 Samut Sakhon 136,800 102,835 239,635 17 S. Songkhram 334 124 458 18 Uttaradit 2,146 1,058 3,203 19 Nakhon Sawan 9,841 2,569 12,410 20 Uthai Thani 830 160 990 21 Kampaeng Phet 29 10 39 22 Sukhothai 1,607 615 2,222 23 Phitsanu Lok 5,677 1,222 6,899 24 Phichit 2,499 1,244 3,743
Total 1,975,112 785,774 2,760,886
(ii) Damage Calculation
Direct damages are estimated by multiplying the damageable values by damage rates that vary according to flood inundation depth. The flood simulation gives inundation depth of each 2km x 2km grid cell in the floodplains. Accordingly the damage calculation is also made on the grid cell basis.
Damageable Values for 2km x 2km Grid Cells
Fortunately, the “Factory Data 2011” of DIW includes the address information at tambon level of factories. By assuming that the density of the damageable values in a tambon is uniform, the values in the tambon are distributed uniformly to grid cells in the tambon. Following figure shows the cell-based damageable values obtained in this way.

Project for the Comprehensive Flood Management Plan for the Chao Phraya River Basin in the Kingdom of Thailand
Main Report Chapter 11 Project Evaluation
CTI Engineering International Co., Ltd. Oriental Consultants Co., Ltd. Nippon Koei Co., Ltd. CTI Engineering Co., Ltd.
11-9
Fig
ure
11.2
.5
Dis
trib
uti
on
of
Dam
ag
eab
le V
alu
es

Main Report Chapter 11 Project Evaluation
Project for the Comprehensive Flood Management Plan for the Chao Phraya River Basin in the Kingdom of Thailand
11-10 CTI Engineering International Co., Ltd. Oriental Consultants Co., Ltd. Nippon Koei Co., Ltd. CTI Engineering Co., Ltd.
Floor Level and Damage Rate
To estimate direct damages to fixed and inventory assets, two parameters, floor level and damage rates have to be determined.
The floor level can be defined as the maximum level that generates no damage to the factories. Since Thai people are generally familiar with floods, it might be assumed that factory buildings are built with a certain margin above the habitual flood water level, at the 2-year return period inundation water level, at least, for example, based on past experiences. According to the series of site visits, it is also deemed that industrial estates in the protection area (the economic zone of Bangkok and its vicinity) that were badly affected during the 2011 flood are of lower floor level and more vulnerable. Therefore, it is assumed that the floor level is at the 2-year return period inundation water level in the protection area, and that it is 50cm above the 2-year return period inundation water level in the other areas.
House or
Factory
Maximum Flood Water Level
Ave. Ground Level
Floor Level
Dm
ax
Max
imum
Wat
er D
epth
De
Effe
ctiv
e
Wat
er D
epth
Hf
Flo
or H
eigh
t
No
Dam
age
Dam
aged
Figure 11.2.6 Floor Level
Regarding the damage rate, there is no significant relationship found between damage and
water depth in the interview survey. Therefore, damage rates used in Japan are applied as presented in the following table.
Table 11.2.6 Floor Level and Damage Rates Floor Level Damage Rate*
Protection Area Other Areas Damageable Value
Flood Depth over Floor Level
0-0.5m 0.5-1m 1-2m 2-3m Greater than 3m
Flood inundation level of 2-year return period
Flood inundation level of 2-year return period + 50cm
Fixed Assets 0.232 0.453 0.789 0.966 0.995
Stocks 0.128 0.267 0.586 0.897 0.982
*Source: “Manual for Economic Analysis for Flood Control Projects in Japanese”, Ministry of Infrastructure, Land and Transport, Japan
Estimation of Direct Damages by 2011 Flood
Using the above damageable values, floor levels and damage rates, direct damages are estimated according to flood inundation depths obtained from the flood simulation. The following table compares the estimated direct damages with those estimated by the Ministry of Industry.
According to Table 11.2.7, the total estimated damage is 644 billion THB, which is very close to 514 billion THB by the Ministry of Industry. Especially, those of Bangkok, Nonthaburi, Pathum Thani, and Ayutthaya provinces in the economic zone (Protection Area) are also close to those by the Ministry of Industry, respectively. Therefore, it might be considered that the values of the floor level and damage rates are set properly.

Project for the Comprehensive Flood Management Plan for the Chao Phraya River Basin in the Kingdom of Thailand
Main Report Chapter 11 Project Evaluation
CTI Engineering International Co., Ltd. Oriental Consultants Co., Ltd. Nippon Koei Co., Ltd. CTI Engineering Co., Ltd.
11-11
Table 11.2.7 Estimated Direct Damages for 2011 Flood
No. Province Estimated by JICA Study Team (Mil. THB) Estimated by Ministry of Industry (Mil. THB)
Fixed Assets Inventory Assets Total 7 industrial
estates Others Total
1 Bangkok 135,123 40,400 175,523 39,100 39,100 2 Nonthaburi 33,768 8,327 42,096 31,200 31,200 3 Pathum Thani 134,925 19,830 154,756
237,400 62,900
391,600 4 Ayutthaya 80,686 11,063 91,749 91,300 5 Ang Thong 478 65 543 1,400 1,400 6 Lopburi 3,445 889 4,335 37,500 37,500 7 Singburi 458 129 587 8 Chainat 383 97 480 4,400 4,400 9 Saraburi 748 143 892 10 Samut Prakarn 44,908 12,918 57,825 11 Chachoengsao 15,829 3,419 19,248 12 Nakhon Nayok 18 2 20 13 Ratchaburi 0 0 0 14 Suphan Buri 862 139 1,001 15 Nakhon Pathom 24,567 6,041 30,609 16 Samut Sakhon 42,038 18,340 60,378 17 S. Songkhram 0 0 0 18 Uttaradit 5 4 9 19 Nakhon Sawan 1,158 202 1,360 8,300 8,300 20 Uthai Thani 115 26 141 200 200 21 Kampaeng Phet 989 38 1,026 22 Sukhothai 142 37 179 23 Phitsanu Lok 601 84 686 24 Phichit 526 52 578 Total 521,772 122,248 644,020 237,400 276,400 513,800
Estimation of Direct Damage for Future Scenario
Direct damage for several future development scenario cases are estimated as presented in the following table.
Table 11.2.8 Estimated Direct Damages for Future Scenario Cases
Case No. Return Period Direct Damages to Manufacture Sector (Mil. THB) Fixed Assets Inventory Assets Total
Reproduction of 2011 Flood 521,772 122,248 644,020
0-1 (Without Project)
2 years 6,327 1,626 7,954 10 years 155,891 30,764 186,655 30 years 187,727 36,860 224,587 50 years 204,844 42,733 247,578 100 years 303,341 68,661 372,001
1-1 (Master Plan by
SCWRM)
2 years - - 0 10 years 138,466 25,952 164,418 30 years 146,279 28,829 175,108 50 years 158,943 31,316 190,259 100 years 183,827 35,441 219,269
11-0 (Proposed
Combination-1)
2 years - - 0 10 years 145,928 27,384 173,312 30 years 170,293 32,722 203,015 50 years 162,888 32,684 195,572 100 years 193,114 37,807 230,922
11-1 (Proposed
Combination-2)
2 years - - 0 10 years 145,511 27,134 172,645 30 years 161,781 31,617 193,398 50 years 163,230 32,441 195,670 100 years 188,546 36,587 225,133

Main Report Chapter 11 Project Evaluation
Project for the Comprehensive Flood Management Plan for the Chao Phraya River Basin in the Kingdom of Thailand
11-12 CTI Engineering International Co., Ltd. Oriental Consultants Co., Ltd. Nippon Koei Co., Ltd. CTI Engineering Co., Ltd.
(b) Indirect Damages
Indirect damages of the manufacturing sector are estimated with the percentages to the total one resulting from the research by the Ministry of Finance and the World Bank in order to get the EIRR and other indicators. Detailed data is shown in (4) Other Sectors and Indirect Damages.
(2) Household Sector
(a) Direct Damages
(i) Damageable Values of Household Sector
Floods cause damages directly on houses and assets of households. Weighted average value of houses and assets per household are estimated and the total value of households in each area is calculated with household number data in the area issued by Department of Provincial Administration (DOPA).
Weighted Average House Value per Household
Weighted average construction cost of house per household is estimated with the following data:
1) Number of houses by type (debouched house, townhouse, condominium, etc.) and by construction material (wood, brick) for each province in “The 2010 Population and Housing Census” by NSO.
2) Construction cost of house by house type and material for each province published by the Ministry of Finance.
3) Standard total floor size by house type by the Ministry of Interior.
4) Average number of stories of highrise buildings such as condominiums and apartments by the City Planning Department of related provinces.
It is assumed that high-rise buildings are directly damaged at their first floor. Hence, the house
value of high-rise buildings with n stories is reduced to 1/n. Finally, the values were depreciated by 50% because it is assumed that the ratios of houses are
all the same for ages after the construction.
Weighted Average Asset Value per Household
Weighted average value of household asset per household is estimated with the following data:
1) Ownership rates of household assets (television, VCD/DVD player, computer, refrigerator, microwave cooker, washing machine, air conditioner, car, motorcycle, etc.) for each province in “The 2010 Population and Housing Census” by NSO.
2) Standard price of commodities published by the Ministry of Commerce.
The asset values of high-rise buildings with n stories are reduced to 1/n for the same reason as
their house value. Finally, their value is depreciated by 50% because it is assumed that the ratios of commodities
are all the same for ages after the purchase.
Estimation Result of Damageable Values
By using the above average values per household and the household number data, the damageable values of the households are estimated as presented in Table 11.2.9.

Project for the Comprehensive Flood Management Plan for the Chao Phraya River Basin in the Kingdom of Thailand
Main Report Chapter 11 Project Evaluation
CTI Engineering International Co., Ltd. Oriental Consultants Co., Ltd. Nippon Koei Co., Ltd. CTI Engineering Co., Ltd.
11-13
Table 11.2.9 Damageable Values of Households by Province
Number Province Number of Households
Damageable Values (Million THB) House
Buildings Household
Assets Total
1 Bangkok 2,337,074 564,559 381,232 945,791 2 Nonthaburi 556,018 168,451 127,497 295,948 3 Pathum Thani 471,813 131,841 84,800 216,641 4 Ayutthaya 286,925 81,280 38,737 120,017 5 Ang Thong 89,282 24,305 17,623 41,928 6 Lopburi 71,178 20,172 15,009 35,181 7 Singburi 70,306 21,977 13,918 35,895 8 Chainat 74,391 22,206 13,457 35,663 9 Saraburi 100,084 32,134 21,353 53,487 10 Samut Prakarn 531,985 141,410 87,606 229,016 11 Chachoengsao 119,656 36,709 23,874 60,583 12 Nakhon Nayok 19,388 5,849 3,907 9,756 13 Ratchaburi 24,719 8,138 5,372 13,510 14 Suphan Buri 134,367 39,128 27,891 67,019 15 Nakhon Pathom 336,977 112,743 73,062 185,804 16 Samut Sakhon 240,518 73,702 29,339 103,041 17 S. Songkhram 7,022 1,791 1,137 2,928 18 Uttaradit 93,758 25,374 16,200 41,574 19 Nakhon Sawan 209,380 61,871 38,000 99,871 20 Uthai Thani 23,773 7,251 4,065 11,315 21 Kampaeng Phet 526 142 95 236 22 Sukhothai 135,815 31,030 23,186 54,216 23 Phitsanu Lok 208,699 59,324 40,568 99,892 24 Phichit 148,104 35,986 25,937 61,923
Total 6,291,756 1,707,370 1,113,866 2,821,235
(ii) Damage Calculation
Direct damages are estimated by multiplying the damageable values by damage rates that vary according to flood inundation depth. The flood simulation gives inundation depth of each 2km x 2km grid cell in the flood plains. Accordingly, the damage calculation is also made on the grid cell basis.
Damageable Values for 2km x 2km Grid Cells
Household numbers in 2011 at “tambon” level are available from the Department of Provincial Administration (DOPA). Similar to the industrial sector, by assuming that the density of the damageable values in a tambon is uniform, the values of the tambon are distributed uniformly to grid cells in the tambon. Figure 11.2.5 shows the cell-based damageable values obtained in this way.
Floor Level and Damage Rate
Similar to the manufacturing sector, two parameters, floor level and damage rates have to be determined. According to site surveys, house owners seem to be more careful than those of factories, probably because of inherited memories of past floods. Houses are generally of higher floor levels. Therefore, it is assumed that the floor level is as high as 50cm above the 5-year return period inundation level, regardless of in or out of the Protection Area.
As for the damage rates, there is no significant relationship found between damages and water depths of the interview survey. Therefore, damage rates used in Japan are applied as presented in Table 11.2.10.

Main Report Chapter 11 Project Evaluation
Project for the Comprehensive Flood Management Plan for the Chao Phraya River Basin in the Kingdom of Thailand
11-14 CTI Engineering International Co., Ltd. Oriental Consultants Co., Ltd. Nippon Koei Co., Ltd. CTI Engineering Co., Ltd.
Table 11.2.10 Floor Level and Damage Rates
Floor Level
Damage Rate*
Damageable Value
Flood Depth over Floor Level
0-0.5m 0.5-1m 1-2m 2-3m Greater than 3m
Flood inundation level of 5-year return period +50cm
House Buildings 0.092 0.119 0.266 0.580 0.834
Household Assets 0.145 0.326 0.508 0.928 0.991
* Source: “Manual for Economic Analysis for Flood Control Projects in Japanese”, Ministry of Infrastructure, Land and Transport, Japan
Estimation of Direct Damages by 2011 Flood
Using the above damageable values, floor level and damage rates, the direct damages are estimated according to flood inundation depths obtained from the flood simulation. Table 11.2.11 compares the estimated direct damages with those estimated under the Post Disaster Needs Assessment (PDNA) by the World Bank and MoF. According to the table, the estimated number of affected houses is very close to that of PDNA. Therefore, the above assumption of the floor level could be regarded reasonable, at least, while the Japanese damage rates generated larger damages than PDNA.
Table 11.2.11 Estimated Direct Damages for 2011 Flood
No. Province
Estimated by JICA Study Team Estimated under PDNA Number of Affected
Households
Direct Damages (Mil. THB) Number of Affected
Households
Direct Damages (Mil. THB) House
buildings Household
Assets Total House buildings
Household Assets Total
1 Bangkok 994,159 22,302 24,454 46,756 761,725 1,954 14,843 16,797 2 Nonthaburi 509,095 14,190 16,927 31,117 204,920 654 3,974 4,628 3 Pathum Thani 243,902 6,270 6,357 12,627 237,394 1,116 4,616 5,732 4 Ayutthaya 128,323 3,383 2,637 6,020 196,929 1,294 3,835 5,129 5 Ang Thong 5,638 141 161 303 50,579 263 981 1,244 6 Lopburi 38,717 1,564 2,177 3,741 33,280 173 645 818 7 Singburi 5,057 145 145 291 21,078 91 408 499 8 Chainat 17,802 759 810 1,569 20,088 106 389 495 9 Saraburi 5,484 162 169 331 23,459 192 455 647
10 Samut Prakarn 17,088 666 694 1,359 - - - - 11 Chachoengsao 84 2 2 5 61,780 326 1,198 1,524 12 Nakhon Nayok 1,414 39 41 81 19,942 199 386 585 13 Ratchaburi 0 0 0 0 - - - - 14 Suphan Buri 30,113 807 907 1,713 84,841 418 1,645 2,063 15 Nakhon Pathom 132,953 4,097 4,202 8,299 89,571 358 1,737 2,095 16 Samut Sakhon 56,188 1,781 1,520 3,300 19,378 31 378 409 17 S. Songkhram 0 0 0 0 - - - - 18 Uttaradit 3,558 264 273 537 - - - - 19 Nakhon Sawan 86,161 2,357 2,328 4,685 51,411 396 1,005 1,401 20 Uthai Thani 10,646 309 302 611 4,440 23 86 109 21 Kampaeng Phet 9,846 305 412 717 - - - - 22 Sukhothai 6,202 438 436 875 - - - - 23 Phitsanu Lok 22,732 728 1,020 1,748 10,946 44 212 256 24 Phichit 21,197 475 544 1,019 14,826 63 287 350 Total 2,346,359 61,184 66,518 127,702 1,906,587 7,701 37,080 44,781
Estimation of Direct Damages for Future Scenarios
Direct damages for several future development scenario cases are estimated as presented in the following table.

Project for the Comprehensive Flood Management Plan for the Chao Phraya River Basin in the Kingdom of Thailand
Main Report Chapter 11 Project Evaluation
CTI Engineering International Co., Ltd. Oriental Consultants Co., Ltd. Nippon Koei Co., Ltd. CTI Engineering Co., Ltd.
11-15
Table 11.2.12 Estimated Direct Damages for Future Scenario Cases
Case No. Return Period
Number of Affected
Households
Direct Damages to Households (Mil. THB) House
buildings Households
Assets Total
Reproduction of 2011 Flood 2,346,359 61,184 66,518 127,702
0-1 (Without Project)
2 years - - - 0 10 years 230,469 6,749 6,556 13,305 30 years 418,839 13,477 16,078 29,555 50 years 521,828 18,437 22,713 41,150
100 years 656,637 24,187 28,961 53,148
1-1 (Master Plan by SCWRM)
2 years - - - 0 10 years 22,969 799 732 1,531 30 years 197,678 5,891 5,584 11,475 50 years 292,421 8,718 8,635 17,352
100 years 383,362 11,405 11,702 23,107
11-0 (Proposed Combination-1)
2 years - - - 0 10 years 96,435 2,832 2,692 5,524 30 years 270,240 8,241 8,354 16,594 50 years 306,706 9,433 9,821 19,255
100 years 436,994 13,768 15,872 29,640
11-1 (Proposed Combination-2)
2 years - - - 0 10 years 77,137 2,262 2,148 4,410 30 years 245,635 7,520 7,598 15,118 50 years 296,099 9,091 9,436 18,527
100 years 409,633 12,632 14,238 26,869
(b) Indirect Damages
Indirect damages of the household sector are estimated with the percentages to the total which results from the research by the Ministry of Finance and the World Bank in order to get the EIRR and other indicators. Detailed data is shown in (4) Other Sectors and Indirect Damages.
(3) Agricultural Sector
Agricultural damage brought about by the 2011 flood is found as fairly smaller than what had initially been expected from the heaviest disaster with the return period of over 100 years in view of the agricultural policy orientation practiced for years by MOAC and RID before the flood occurrence. However, the population could not get rid of such damages as submergence of their cars, agricultural machinery and cultured fish in their fishponds. Such inevitable damages resulted in per-capita loss of about 1,500 Baht on average.
In this economic context, annual farm income level of farm household is estimated at 249 thousand Baht for north provinces and 381 thousand Baht for southern ones, implying that the flood damage is equivalent to 0.4-0.6% of household income. It follows that such a catastrophic flood actually affected farmers to the same extent as they experience every year as yield fluctuations of their routine crop species. It should be kept in mind that some agricultural damages have not yet been made public, including damages of agricultural machinery, agricultural product-processing units, rice mills, etc. Allowing these invisible damages to additionally count, the actually experienced agricultural damage values would not exceed a few percent of total farm household income.

Main Report Chapter 11 Project Evaluation
Project for the Comprehensive Flood Management Plan for the Chao Phraya River Basin in the Kingdom of Thailand
11-16 CTI Engineering International Co., Ltd. Oriental Consultants Co., Ltd. Nippon Koei Co., Ltd. CTI Engineering Co., Ltd.
Table 11.2.13 Total Value of Agricultural Flood Damages (Unit: Million Baht)
Category
Area Annual Crop
Fruit Trees
Other Tree Crop Livestock
Inland Fish
Culture
Agri. Prod.
Facilities
Farmland Rehabili-
tation Total
Northern CP 488 931 31 44 436 1,445 552 3,927 Central CP 1,465 7,509 254 236 415 2,590 401 12,870 Total 1,953 8,440 285 280 851 4,034 953 16,797 (Share) (11.6%) (50.2%) (1.7%) (1.7%) (5.1%) (24.0%) (5.7%) (100.0%) Source: Ministry of Agriculture and Cooperatives (Notes) Annual Crop: maize, cassava, sugar cane, etc. Fruit Trees: banana, mango, etc. Other Tree Crop: oil palm, para-rubber, etc. Livestock: cattle, swine, poultry, etc.
(4) Other Sectors and Indirect Damages
The summary of the research on the flood in 2011 by the Ministry of Finance and the World Bank is shown below. Since damages of the industrial sector and the household sector amount to 88.8% in direct damage and 76.5% in total, these sectors actually dominated the whole damage by the flood in 2011. Considering other industries, tourism is one of the most important industries in Thailand. Its share of direct damages is just 0.8% while that of indirect damages is 11.3%. Further, the share of direct damages of other industries (excluding manufacturing, household and agriculture) in total is 10.3% while that of indirect damages, 28.8%.
Table 11.2.14 Damage by 2011 Flood (Unit: Million Baht)
Direct Damage Indirect Damage Total Infrastructure Water Resources Management 8,715 1.4% - - 8,715 0.6% Transport 23,538 3.7% 6,938 0.9% 30,476 2.1% Telecommunication 1,290 0.2% 2,558 0.3% 3,848 0.3% Electricity 3,186 0.5% 5,716 0.7% 8,901 0.6% Water Supply and Sanitation 3,497 0.6% 1,984 0.2% 5,481 0.4% Productive Agriculture, Livestock and Fishery 5,666 0.9% 34,715 4.4% 40,381 2.8% Manufacturing 513,881 81.5% 493,258 62.0% 1,007,139 70.6% Tourism 5,134 0.8% 89,673 11.3% 94,808 6.7% Finance & Banking - - 115,276 14.5% 115,276 8.1% Social Health 1,684 0.3% 2,133 0.3% 3,817 0.3% Social - - - - - - Education 13,051 2.1% 1,798 0.2% 14,849 1.0% Housing 45,908 7.3% 37,889 4.8% 83,797 5.9% Cultural Heritage 4,429 0.7% 3,076 0.4% 7,505 0.5% Cross Cutting Environment 375 0.1% 176 0.0% 551 0.0% TOTAL 630,354 100.0% 795,191 100.0% 1,425,544 100.0% Source: Ministry of Finance, Royal Thai Government and World Bank, "Thailand Flooding 2554 Rapid
Assessment for Resilient Recovery and Reconstruction Planning
11.2.4 EIRR Calculation
Damages other than direct damages of the manufacturing and household sectors is estimated with the percentages to the total one which resulted from the research by the Ministry of Finance and the World Bank in order to get the EIRR and other indicators. Further, following are assumed in the EIRR calculation:
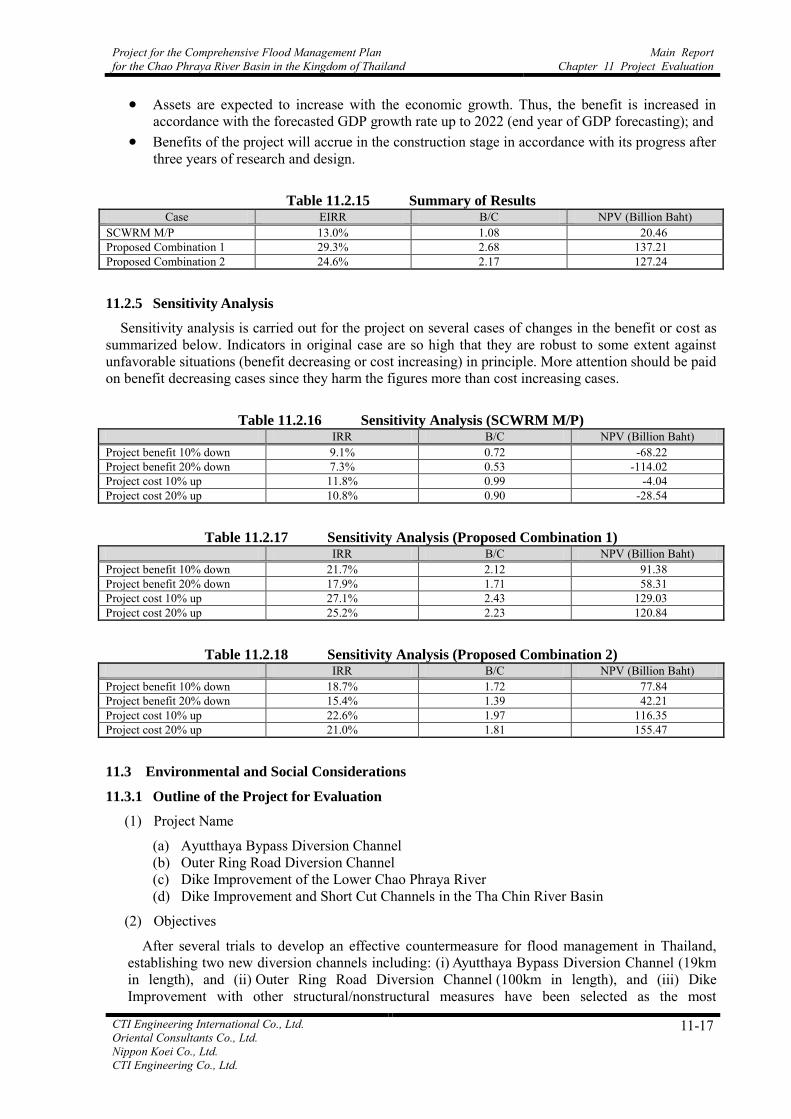
Project for the Comprehensive Flood Management Plan for the Chao Phraya River Basin in the Kingdom of Thailand
Main Report Chapter 11 Project Evaluation
CTI Engineering International Co., Ltd. Oriental Consultants Co., Ltd. Nippon Koei Co., Ltd. CTI Engineering Co., Ltd.
11-17
Assets are expected to increase with the economic growth. Thus, the benefit is increased in accordance with the forecasted GDP growth rate up to 2022 (end year of GDP forecasting); and
Benefits of the project will accrue in the construction stage in accordance with its progress after three years of research and design.
Table 11.2.15 Summary of Results Case EIRR B/C NPV (Billion Baht)
SCWRM M/P 13.0% 1.08 20.46 Proposed Combination 1 29.3% 2.68 137.21 Proposed Combination 2 24.6% 2.17 127.24
11.2.5 Sensitivity Analysis
Sensitivity analysis is carried out for the project on several cases of changes in the benefit or cost as summarized below. Indicators in original case are so high that they are robust to some extent against unfavorable situations (benefit decreasing or cost increasing) in principle. More attention should be paid on benefit decreasing cases since they harm the figures more than cost increasing cases.
Table 11.2.16 Sensitivity Analysis (SCWRM M/P) IRR B/C NPV (Billion Baht) Project benefit 10% down 9.1% 0.72 -68.22 Project benefit 20% down 7.3% 0.53 -114.02 Project cost 10% up 11.8% 0.99 -4.04 Project cost 20% up 10.8% 0.90 -28.54
Table 11.2.17 Sensitivity Analysis (Proposed Combination 1) IRR B/C NPV (Billion Baht) Project benefit 10% down 21.7% 2.12 91.38 Project benefit 20% down 17.9% 1.71 58.31 Project cost 10% up 27.1% 2.43 129.03 Project cost 20% up 25.2% 2.23 120.84
Table 11.2.18 Sensitivity Analysis (Proposed Combination 2) IRR B/C NPV (Billion Baht) Project benefit 10% down 18.7% 1.72 77.84 Project benefit 20% down 15.4% 1.39 42.21 Project cost 10% up 22.6% 1.97 116.35 Project cost 20% up 21.0% 1.81 155.47
11.3 Environmental and Social Considerations
11.3.1 Outline of the Project for Evaluation
(1) Project Name
(a) Ayutthaya Bypass Diversion Channel (b) Outer Ring Road Diversion Channel (c) Dike Improvement of the Lower Chao Phraya River (d) Dike Improvement and Short Cut Channels in the Tha Chin River Basin
(2) Objectives
After several trials to develop an effective countermeasure for flood management in Thailand, establishing two new diversion channels including: (i) Ayutthaya Bypass Diversion Channel (19km in length), and (ii) Outer Ring Road Diversion Channel (100km in length), and (iii) Dike Improvement with other structural/nonstructural measures have been selected as the most

Main Report Chapter 11 Project Evaluation
Project for the Comprehensive Flood Management Plan for the Chao Phraya River Basin in the Kingdom of Thailand
11-18 CTI Engineering International Co., Ltd. Oriental Consultants Co., Ltd. Nippon Koei Co., Ltd. CTI Engineering Co., Ltd.
cost-efficient and significantly effective for protecting the lower Chao Phraya River Basin where the industrial centers are integrated. In this section, evaluation for the two planning diversion channels is to be conducted from the viewpoint of environmental and social aspects, respectively. In addition, for the flood-prone Tha Chin River Basin, (iv) Dike Improvement and Short Cut Channels were selected to mitigate the future floods in this area.
11.3.2 Activities Requiring Environmental and Social Considerations
In the projects including the two diversion channels and dike improvement in the Chao Phraya River Basin and dike improvement and short cut channels of the Tha Chin River, activities requiring environmental and social considerations are as follows:
(1) Canal work (Earthwork, road, canal lining, and ground improvement)
(2) Facility work (Road Bridge, floodgate)
(3) Riverbank work (Embankment)
(4) Dike work (Wall, elevation)
(5) Material handling (Truck operating)
Outline of the work required is shown in Table 11.3.1
Table 11.3.1 Outline of the Canal and Facility Work
Work Type Work Items Outline Main Equipment
Canal
Earthworks Excavation, Soil disposal, Embankment Backhoe, Bulldozer
Road Works Basement (sub-base and base course); Finishing (asphalt concrete pavement)
Motor grader, Vibratory roller, Tire roller, Asphalt finisher
Canal Lining Lining with concrete Concrete mixing vehicle, Crane
Facility Road Bridges Bridges across canals Concrete mixing vehicle,
Crane, Pile driver
Floodgates With both connecting sites of the river Truck-mounted Crane; Backhoe, Bulldozer, Pile driver, Vibratory hammer
River bank Embankment Earthfill to build riverbanks Backhoe, Bulldozer, Scraper
Dike Wall Works Parapet wall installation
Backhoe, Bulldozer, Concrete mixing vehicle, Crane
Elevation Works Elevation of walls for enough wall and dike height
Concrete mixing vehicle, Crane
11.3.3 Categories of Project and Environmental Assessment
According the Thai laws1, 34 project types and activities require Environmental Impact Assessment (EIA) and approval through the national approval process. However, the diversion channels and dike improvement are definitely outside of the scope of the EIA category in accordance with the Thai environmental assessment system at present.
On the other hand, impacts on the environment may arise mainly by the construction activities for the project. A case is probable to make the residents or houses resettled in the project area to other location. Taking the situation into account, it is concluded that conducting an Initial Environmental Examination
1 The Enhancement and Conservation of National Environmental Quality Act (NEQA) of B.E. 2535 (1992)

Project for the Comprehensive Flood Management Plan for the Chao Phraya River Basin in the Kingdom of Thailand
Main Report Chapter 11 Project Evaluation
CTI Engineering International Co., Ltd. Oriental Consultants Co., Ltd. Nippon Koei Co., Ltd. CTI Engineering Co., Ltd.
11-19
(IEE) should be essential according to the JICA Guidelines for Environmental and Social Considerations.
11.3.4 Project Area Outlook and Scopes of Assessment
(1) Ayutthaya Bypass Diversion Channel
The planning area is located along the west side of Route 347 where both ends intersect with the right banks of the Chao Phraya River between the north area of the central Phra Nakhon Si Ayutthaya (Ayutthaya) and south Bang Sai. The area is mostly occupied with plain arable fields, and houses are found in a few sites such as the intersection of the planned bypass channel with Route 3263. Major industrial centers including an industrial estate developed along the left bank of the Chao Phraya River. Ethnic groups, national or natural parks, precious wild lives and historical memorials are not distributed over the whole planned area. The planning bypass channel also intersects with 14 existing canals and two vehicle roads running through the paddy field.
(2) Outer Ring Road Diversion Channel
The planning channel starts from the left bank of Chao Phraya River in the south part of Bang Pa-in Industrial Estate in Phra Nakhon Si Ayutthaya and develops toward south in parallel with the east side of the Eastern Outer Ring Road (R9) until the Gulf of Thailand at Klong Dan, through the east side of Suvarnabhumi International Airport. The area lies low and occupies paddy fields and social activity aggregations (houses, commercial facilities, schools, etc.). In general, social activity aggregations lie in the upper area and paddies or swamps in the lower area, but the lower area has been developing into social activity areas as a result of the recent development plans in East Bangkok. Ethnic groups, national or natural parks, precious wildlife and historical memorials are not distributed over the whole planning area. Swamps in the whole planning area that develop some ponds and canals spreading out around the area mainly contribute to the area’s ecosystem with small-scale shrubs. The planning diversion channel intersects with 14 major roads, two railways and some 85 canals.
(3) Dike Improvement of the Lower Chao Phraya River
The target area of the dike improvement is in lower Chao Phraya River from the estuary to approx. 100km upstream. This basin lies in the Chao Phraya Delta where business and industrial activities focus on. Bangkok and its vicinities cover the most area of the project. No specific land acquisition is required for the dike improvement because most works are to add the height of the existing parapet walls (0-60km points, constructed by BMA) and dike roads (constructed by DOH). All the work areas are within the Right-of-way of the RID and authorities concerned. Like the Ayutthaya project, no specific concerns like ethnic groups, national or natural parks, precious wildlife and historical memorials have been observed over the area.
(4) Dike Improvement and Short Cut Channels in the Tha Chin River Basin
Tha Chin River is a distributary of the Chao Phraya River and located in Thailand’s central plain. In this project, dike improvement starts from the left bank of the Tha Chin River at the estuary to the connecting point with Bunlue Canal. Short Cut Channels are to be constructed within this dike improvement area. Along the target river area, some facilities like temples, houses and shops are established. Most of lands are for agricultural use. The densely inhabited area is only around the estuary. Six major roads and one railway cross over the River within the project area. The River functions with multipurpose uses such as transportation, irrigation, water supply and recreation as well as waste water discharge.
11.3.5 Natural Environmental Consideration
(1) Common Matter
During the construction, generation of noise and vibration from construction traffic or machinery and increase in traffic volume are possible issues. Treating by-products such as excavated soil can

Main Report Chapter 11 Project Evaluation
Project for the Comprehensive Flood Management Plan for the Chao Phraya River Basin in the Kingdom of Thailand
11-20 CTI Engineering International Co., Ltd. Oriental Consultants Co., Ltd. Nippon Koei Co., Ltd. CTI Engineering Co., Ltd.
be also a task. In-use period of the channels, considerations should be required as to surface water (turbidity with sand/soil) and groundwater (water level), ground (topography/geographical features, ground subsidence) and landscape. Impacts on rare species of animals and plants are expected minor because most of the planning area is covered with secondary woodland and arable fields. However, the impact on soil organisms by soil excavation is to be considered.
(2) Ayutthaya Bypass Diversion Channel
Some influences on landscape in-use stage may be concerned because few large structures except Route 347 are found near the planning area.
(3) Outer Ring Road Diversion Channel
Salinization of surface water or soil is a possible problem in case the seawater would run up from the mouth at the Gulf of Thailand. Some influences on landscape in-use stage may be concerned though some large structures are found near/in the planning area.
(4) Dike Improvement of the Lower Chao Phraya Rive
There are no specific considerations.
(5) Dike Improvement and Short Cut Channels in the Tha Chin River Basin
Like the case of Ayutthaya Bypass Diversion Channel, landscape after the completion may be a trouble factor by some residents. Short cut channel construction may cause salt water intrusion toward more upstream from the Gulf of Thailand because of shrinking the river length.
11.3.6 Social Environmental Consideration
(1) Common Matter
Land acquisition or expropriation is needed for the channels and roads for trucks used during the construction work. In addition, income compensation due to loss of opportunities of crop production would be necessary because both planning areas stretch out in paddy/arable fields. At the intersections with existing main roads, coordination with competent authorities is essential. For resettlement and compensation for the houses scattered in the planning area, an intensive household survey and compensatory negotiation complying with the Thai legislation will be required for smoother progress.
(2) Ayutthaya Bypass Diversion Channel
More than eighty houses are expected to be eligible even though most project area in arable fields (see Figure 11.3.1 and Figure 11.3.2)
(3) Outer Ring Road Diversion Channel
The expected number of eligible houses or the Project Affected Persons (PAPs) vary depending on the discharge capacity set up: about 600 houses at 500m3/s capacity and about 900 houses at 1,000m3/s, respectively. Intersection with existing infrastructures spreads over the project area (see Figure 11.3.3 and Figure 11.3.4).
(4) Dike Improvement of the Lower Chao Phraya River
No involuntary resettlement of people is expected because the target area is already developed (see Figure 11.3.5).
(5) Dike Improvement and Short Cut Channels in the Tha Chin River Basin
For the parapet wall installation, some people in the estuary area are expected to be eligible but the number of PAPs is uncertain. No or little affection in any other project areas is estimated (see Figure 11.3.6 and Figure 11.3.7).

Project for the Comprehensive Flood Management Plan for the Chao Phraya River Basin in the Kingdom of Thailand
Main Report Chapter 11 Project Evaluation
CTI Engineering International Co., Ltd. Oriental Consultants Co., Ltd. Nippon Koei Co., Ltd. CTI Engineering Co., Ltd.
11-21
Figure 11.3.1 Planning Area (Overall)
- Ayutthaya Bypass Diversion Channel -
Sta. 150km
House Dense Area
Sta. 150km
House Dense Area
Figure 11.3.2 Planning Area
(House Dense Area)
Outer Ring Road Diversion Channel
Figure 11.3.3 Planning Area (Overall)
- Outer Ring Road Diversion Channel -
Outer Ring RoadDiversion Channel
Intersection
Outer Ring RoadDiversion Channel
IntersectionIntersection
Figure 11.3.4 Planning Area
(Lower Area)

Main Report Chapter 11 Project Evaluation
Project for the Comprehensive Flood Management Plan for the Chao Phraya River Basin in the Kingdom of Thailand
11-22 CTI Engineering International Co., Ltd. Oriental Consultants Co., Ltd. Nippon Koei Co., Ltd. CTI Engineering Co., Ltd.
Figure 11.3.5 Planning Area (Overall) - Dike Improvement
of the Lower Chao Phraya River -
Figure 11.3.6 Planning Area (Short Cut
Channels) - Dike Improvement and Short
Cut Channels in the Tha Chin River Basin -
Figure 11.3.7 Planning Area
(Populated Area at the Estuary) - Dike
Improvement and Short Cut Channels in
the Tha Chin River Basin -
DID of Bangkok
Metropolitan Chao Phraya River
Gulf of Thailand
Short cut 2
Short cut 1
Short cut 1
Short cut 2
Short cut 3
Short cut 4
Tha Chin River
Densely Inhabited Area
Gulf of Thailand

Project for the Comprehensive Flood Management Plan for the Chao Phraya River Basin in the Kingdom of Thailand
Main Report Chapter 11 Project Evaluation
CTI Engineering International Co., Ltd. Oriental Consultants Co., Ltd. Nippon Koei Co., Ltd. CTI Engineering Co., Ltd.
11-23
11.3.7 Influence Factors on Natural and Social Environment
Both projects are expected to give minor impacts on natural and social environment by taking into account the area characteristics. However, the items listed in Table 11.3.2 should be considered and measures taken.
Table 11.3.2 List of Influence Factors on Natural and Social Environment
Project Stage Pre- / At-work In-use
Work Type Facility Canal Operation Excavation Levee Natural Environmental Consideration
Air Quality Dust ○ - Noise/Vibration ○ - Offensive Odor - ○ - ○
Water Quality
Surface Pollution ○ ○ Salt Intrusion - ○
Ground Water Level - ○ - ○ Salinization - ○
Soil Environment
Topographic / Geographic Features ○ ○ Ground Subsidence by Lowering Groundwater Level ○ ○
Ecology (Fauna & Flora) ○ ○ Landscape ○ ○
Wastes Derived from Construction Work ○ - -
Social Environmental Consideration Land Acquisition / Compensation ○ - Involuntary Relocation ○ ○ Effect on Existing Infrastructure (Roads, canals, etc.) ○ -
Note: Items marked “○” are considered to have potential impact(s) on natural or social environment.
11.3.8 Comprehensive Evaluation and Mitigation Measures
It is considered feasible in general to avoid or reduce severe impacts derived from construction works or caused by direct reform from the existence of these new diversion channels when conducting the mitigation measures shown in Table 11.3.3. In particular, careful consideration and measures will be essential to implement land acquisition and involuntary resettlement of inhabitants affected by the project progress.

Main Report Chapter 11 Project Evaluation
Project for the Comprehensive Flood Management Plan for the Chao Phraya River Basin in the Kingdom of Thailand
11-24 CTI Engineering International Co., Ltd. Oriental Consultants Co., Ltd. Nippon Koei Co., Ltd. CTI Engineering Co., Ltd.
Table 11.3.3 Summary of the Mitigation Measures
Influence Factor Mitigation Measures
Natural Environmental Consideration
Air Quality
Equalize construction works. Decentralize transport routes of construction trucks. Thoroughly implement maintenance for construction machines. Monitor the air quality to comply with legislations.
Water Quality Introduce sewage treatment units and do monitoring. Monitor the water quality to comply with legislations.
Salt Intrusion/ Salinization
Install a barrage at the estuary (floodgate) Discharge fresh water downstream in order to exclude the salted water
Topographic/ Geographic Features
Investigate vulnerable topography / geographical features by a field survey or literature search.
Ground Subsidence Avoid construction working on weak ground. Monitor the ground water level.
Ecology (Fauna & Flora)
Confirm precious species before construction. (In case of existing precious species) Mitigate and conserve the species.
Landscape Allocate a construction yard and roads for trucks properly. Building consensus with stakeholders at the planning stage by showing the finishing drawing.
Wastes Prevent excavated materials from contamination, and process properly (Recycling if possible).
Socio-Environmental Consideration
Land Acquisition / Compensation
Promote understanding with affected persons through measures like public consultation, etc. Establish and implement a resettlement action plan (RAP) for affected persons and follow them up.
Involuntary Relocation
Establish the Resettlement Action Plan (RAP) reflecting the regional conditions. Ensure that the resettled people do not receive inconvenience in their livelihood due to the construction work (e.g. Follow-up by interview).
Effect on Existing Infrastructure Develop a closer relationship with relevant ministries and agencies.
11.4 Project Evaluation
The most cost-effective combination of projects is sought, since cost of all the projects is expected to exceed the budget for flood management.
The proposed combination 1 or 2 projects needs only less than 40% of SCWRM M/P cost, while the evaluation of the project, in other words, Economic Internal Rate of Return (EIRR) is more than 25%, which is very high compared with the SCWRM M/P.
Based on the Thai laws, an EIA is not needed for the projects and there is no need to get approval through the national approval process because both the by-pass channel and diversion channel projects are outside the scope of the EIA category in accordance with the Thai environmental assessment system at present.
On the other hand, impacts on the environment may arise mainly due to the project construction activities. However, it is probable that residents or houses in the project area will be resettled to other locations. Taking the situation into account, it is concluded that an Initial Environmental Examination (IEE) is essential according to the JICA Guidelines for Environmental and Social Considerations.
From environmental and social consideration aspects, the proposed channels seem to have no severe environmental and social adverse impacts. However, careful considerations and measures will be

Project for the Comprehensive Flood Management Plan for the Chao Phraya River Basin in the Kingdom of Thailand
Main Report Chapter 11 Project Evaluation
CTI Engineering International Co., Ltd. Oriental Consultants Co., Ltd. Nippon Koei Co., Ltd. CTI Engineering Co., Ltd.
11-25
essential to implement land acquisition and involuntary resettlement of inhabitants that would be affected by the project progress.
From the above considerations, it is recommended to prioritize implementation of the proposed combination, which includes:
(1) Effective Operation of Existing Dams;
(2) Outer Ring Road Diversion Channel (Capacity: 500 or 1,000 m3/s);
(3) River Improvement Works (including Tha Chin River Improvement);
(4) Ayutthaya Bypass Channel (Capacity: 1,400 m3/s); and
(5) Flood Forecasting.
Note : Peak flow discharge at Bang Sai has been estimated at 3,800 m3/s in Combination 1 and
3,500 m3/s in Combination 2. Since daily peak flow discharge of 3,900 m3/s at Bang Sai was recorded during the 2011 flood without any damage caused by overflow of water in the lower reaches of the Chao Phraya River (downstream of Bang sai), EIRR and B/C calculated as the damage caused by flooding does not come out with the discharge of 3,800 m3/s. In case that damage comes out with the discharge of 3,800 m3/s, EIRR and B/C of Combination 2 may become values bigger than those of Combination 1.

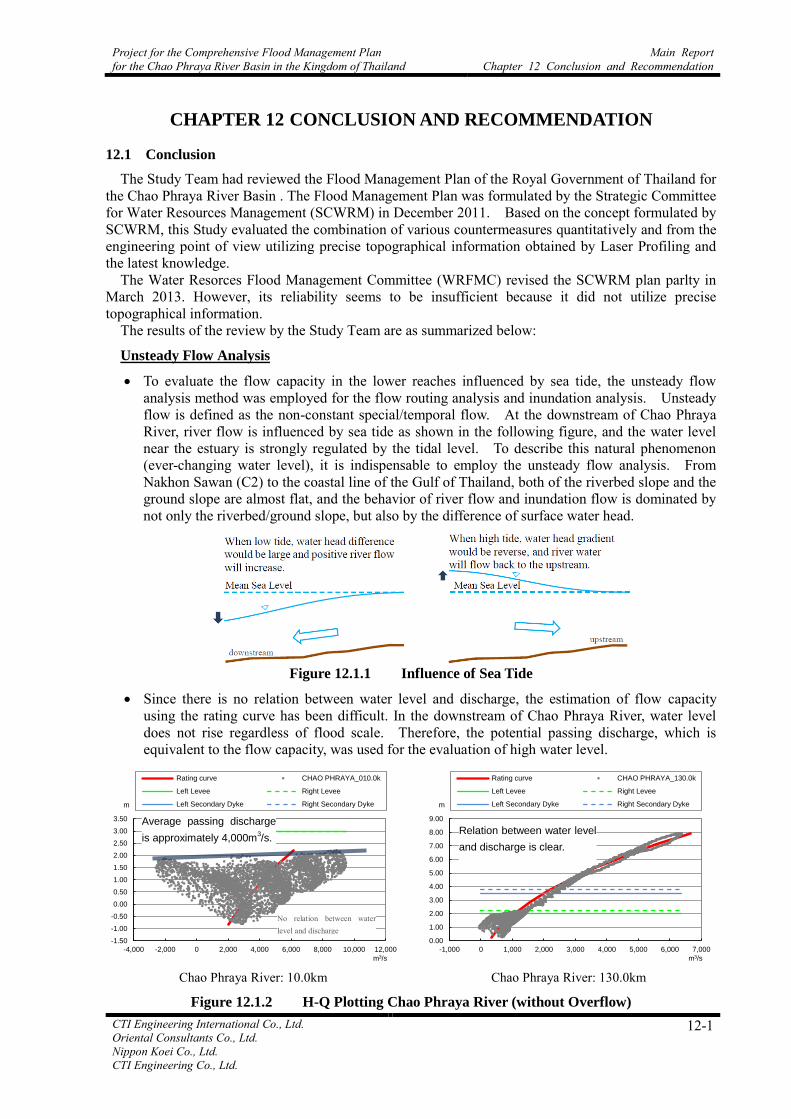
Project for the Comprehensive Flood Management Plan for the Chao Phraya River Basin in the Kingdom of Thailand
Main Report Chapter 12 Conclusion and Recommendation
CTI Engineering International Co., Ltd. Oriental Consultants Co., Ltd. Nippon Koei Co., Ltd. CTI Engineering Co., Ltd.
12-1
CHAPTER 12 CONCLUSION AND RECOMMENDATION
12.1 Conclusion
The Study Team had reviewed the Flood Management Plan of the Royal Government of Thailand for the Chao Phraya River Basin . The Flood Management Plan was formulated by the Strategic Committee for Water Resources Management (SCWRM) in December 2011. Based on the concept formulated by SCWRM, this Study evaluated the combination of various countermeasures quantitatively and from the engineering point of view utilizing precise topographical information obtained by Laser Profiling and the latest knowledge.
The Water Resorces Flood Management Committee (WRFMC) revised the SCWRM plan parlty in March 2013. However, its reliability seems to be insufficient because it did not utilize precise topographical information.
The results of the review by the Study Team are as summarized below:
Unsteady Flow Analysis
To evaluate the flow capacity in the lower reaches influenced by sea tide, the unsteady flow analysis method was employed for the flow routing analysis and inundation analysis. Unsteady flow is defined as the non-constant special/temporal flow. At the downstream of Chao Phraya River, river flow is influenced by sea tide as shown in the following figure, and the water level near the estuary is strongly regulated by the tidal level. To describe this natural phenomenon (ever-changing water level), it is indispensable to employ the unsteady flow analysis. From Nakhon Sawan (C2) to the coastal line of the Gulf of Thailand, both of the riverbed slope and the ground slope are almost flat, and the behavior of river flow and inundation flow is dominated by not only the riverbed/ground slope, but also by the difference of surface water head.
Figure 12.1.1 Influence of Sea Tide
Since there is no relation between water level and discharge, the estimation of flow capacity using the rating curve has been difficult. In the downstream of Chao Phraya River, water level does not rise regardless of flood scale. Therefore, the potential passing discharge, which is equivalent to the flow capacity, was used for the evaluation of high water level.
-1.50
-1.00
-0.50
0.00
0.50
1.00
1.50
2.00
2.50
3.00
3.50
-4,000 -2,000 0 2,000 4,000 6,000 8,000 10,000 12,000
m
m3/s
Rating curve CHAO PHRAYA_010.0k
Left Levee Right Levee
Left Secondary Dyke Right Secondary Dyke
0.00
1.00
2.00
3.00
4.00
5.00
6.00
7.00
8.00
9.00
-1,000 0 1,000 2,000 3,000 4,000 5,000 6,000 7,000
m
m3/s
Rating curve CHAO PHRAYA_130.0k
Left Levee Right Levee
Left Secondary Dyke Right Secondary Dyke
Chao Phraya River: 10.0km Chao Phraya River: 130.0km
Figure 12.1.2 H-Q Plotting Chao Phraya River (without Overflow)
Relation between water level
and discharge is clear.
No relation between water level and discharge
Average passing discharge
is approximately 4,000m3/s.
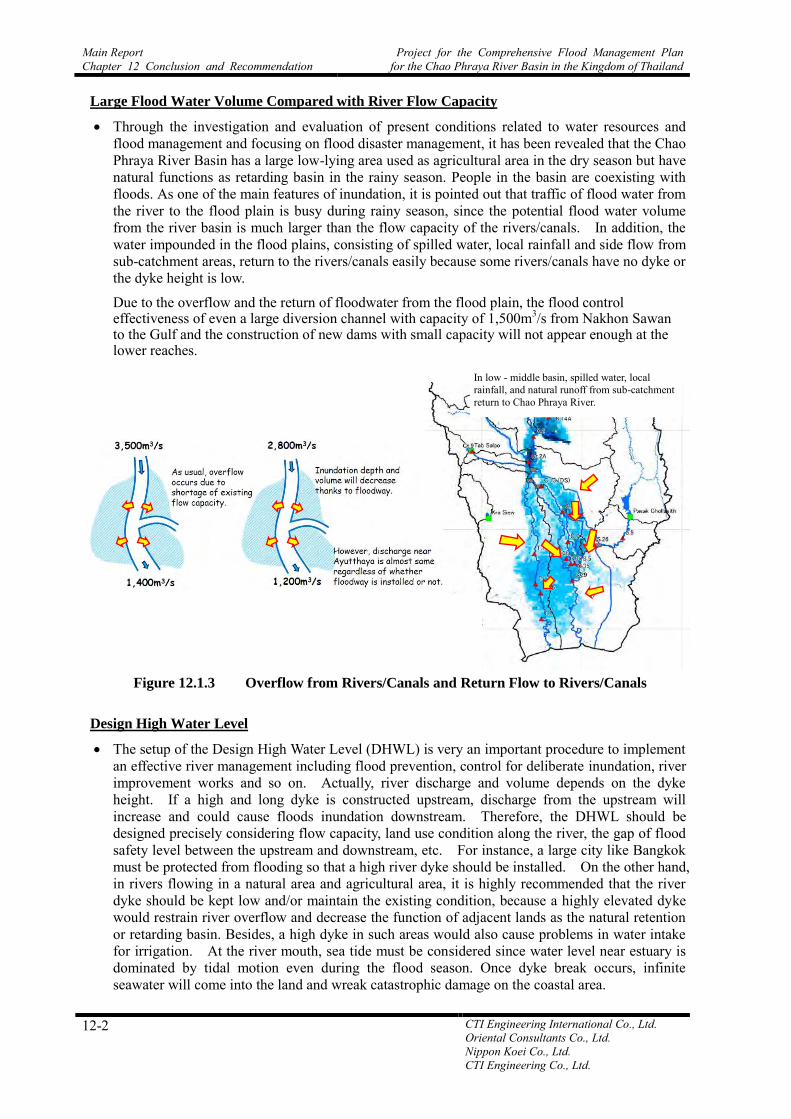
Main Report Chapter 12 Conclusion and Recommendation
Project for the Comprehensive Flood Management Plan for the Chao Phraya River Basin in the Kingdom of Thailand
12-2 CTI Engineering International Co., Ltd. Oriental Consultants Co., Ltd. Nippon Koei Co., Ltd. CTI Engineering Co., Ltd.
Large Flood Water Volume Compared with River Flow Capacity
Through the investigation and evaluation of present conditions related to water resources and flood management and focusing on flood disaster management, it has been revealed that the Chao Phraya River Basin has a large low-lying area used as agricultural area in the dry season but have natural functions as retarding basin in the rainy season. People in the basin are coexisting with floods. As one of the main features of inundation, it is pointed out that traffic of flood water from the river to the flood plain is busy during rainy season, since the potential flood water volume from the river basin is much larger than the flow capacity of the rivers/canals. In addition, the water impounded in the flood plains, consisting of spilled water, local rainfall and side flow from sub-catchment areas, return to the rivers/canals easily because some rivers/canals have no dyke or the dyke height is low.
Due to the overflow and the return of floodwater from the flood plain, the flood control effectiveness of even a large diversion channel with capacity of 1,500m3/s from Nakhon Sawan to the Gulf and the construction of new dams with small capacity will not appear enough at the lower reaches.
Figure 12.1.3 Overflow from Rivers/Canals and Return Flow to Rivers/Canals
Design High Water Level
The setup of the Design High Water Level (DHWL) is very an important procedure to implement an effective river management including flood prevention, control for deliberate inundation, river improvement works and so on. Actually, river discharge and volume depends on the dyke height. If a high and long dyke is constructed upstream, discharge from the upstream will increase and could cause floods inundation downstream. Therefore, the DHWL should be designed precisely considering flow capacity, land use condition along the river, the gap of flood safety level between the upstream and downstream, etc. For instance, a large city like Bangkok must be protected from flooding so that a high river dyke should be installed. On the other hand, in rivers flowing in a natural area and agricultural area, it is highly recommended that the river dyke should be kept low and/or maintain the existing condition, because a highly elevated dyke would restrain river overflow and decrease the function of adjacent lands as the natural retention or retarding basin. Besides, a high dyke in such areas would also cause problems in water intake for irrigation. At the river mouth, sea tide must be considered since water level near estuary is dominated by tidal motion even during the flood season. Once dyke break occurs, infinite seawater will come into the land and wreak catastrophic damage on the coastal area.
In low - middle basin, spilled water, local rainfall, and natural runoff from sub-catchment return to Chao Phraya River.

Project for the Comprehensive Flood Management Plan for the Chao Phraya River Basin in the Kingdom of Thailand
Main Report Chapter 12 Conclusion and Recommendation
CTI Engineering International Co., Ltd. Oriental Consultants Co., Ltd. Nippon Koei Co., Ltd. CTI Engineering Co., Ltd.
12-3
In Chao Phraya River from 0km to 90km, near the Bangkok metropolitan area, Bangkok Metropolitan Administration (BMA) is scheduled to install parapet wall for flood prevention. It seems, however, that the height of parapet wall was set based on a record-high water level in Chao Phraya River, and the height was setup in stair-steps as illustrated in the following figure (broken line). In actual practice, however, the slope of surface water level is never in the form of stair-steps and longitudinally, the dyke slope is slanted according to the gradient of water level. Therefore, JST recommends that the parapet wall installed near Bangkok be slanted based on the DHWL proposed in this study.
Bangkok
Ayutthaya
Economic Zone (protected area)
Paknam0.0
1.0
2.0
3.0
4.0
5.0
6.0
7.0
8.0
9.0
10.0
0 10 20 30 40 50 60 70 80 90 100 110 120 130 140 150
Ele
va
tio
n (
m M
.S.L
)
Distance (km)
Fig- Design High Water Level in Chao Phraya River
DHWL (proposed in the study)
DHWL + Freeboard (+0.5m)
Height of parapet wall installed by BMA
Record-high water level 2011yr flood
Figure 12.1.4 Proposed Design High Water Level for Lower Reaches of Chao Phraya River
Influence by Road Heightening Works
As of end of June 2013, the road heightening works by DOH and DOR around the economically important zone has started. The comparative study between Simulation Case-0 (existing condition) and Simulation Case 0-1 (after completion of road dyke heightening works), clearly shows that the inundation depth and volume at Lat Bua Luang northwest from Bang Sai (see inundation block LO14 in the following figure) will dramatically increase due to the heightening works, but this is an extreme case. However, continuous structures like highway with embankment and road dyke would change the inundation condition to some extent, so that the influence of structures should be examined by flood inundation analysis and, if any, some countermeasures shall be designed so as to decrease the flood damage due to the continuous structures.
Figure 12.1.5 Inundation Volume (Influence of Road Dyke Elevation)
0
500
1,000
1,500
2,000
2,500
3,000
3,500
6/1 7/1 8/1 9/1 10/1 11/1 12/1
Ave
rag
e I
nun
da
ted
Vo
lum
e (
MC
M)
Fig- Inundated Volume (Block-LO14)
Case 0
Case 0- 1
Inundation volume increases widely because the elevated dyke stems inundated water flowing from north to south and impounds inundated water at LO14.
With elevated road dyke
Alignment of road dyke elevation around economically important zone by DOH/DOR

Main Report Chapter 12 Conclusion and Recommendation
Project for the Comprehensive Flood Management Plan for the Chao Phraya River Basin in the Kingdom of Thailand
12-4 CTI Engineering International Co., Ltd. Oriental Consultants Co., Ltd. Nippon Koei Co., Ltd. CTI Engineering Co., Ltd.
Current Capacity of Pumps installed in the Protection Area
A circle levee such as the road dyke heightening works being done by DOH and DOR could aggravate inland flooding since local rainfall would not spread and could accumulate resulting in deeper inundation. With regard to the lower reaches of the Chao Phraya River, it is almost flat and accumulated local rainfall would be drained to the rivers or canals not by gravitational drainage but by pumping. In this study, examined was whether or not the existing capacity of pumps of approximately 1,590m3/s is enough to drain inundation water (see Main Report Chapter 10, Subsection 10.2.12, Inland Storm Water Drainage). The study results show that the current capacity of pumps is enough for inland flooding caused by floods of the 2011 flood scale; however, this is just the result of a brief survey for the whole lower basin. Therefore, a more detailed study on inland flooding in a local area is recommended to be carried out separately.
Comprehensive Flood Management Plan
The Master Plan (M/P) formulated by the Thai Government had aimed to attain integrated and sustainable water resources and flood management of the Chao Phraya River Basin. All measures proposed in the M/P are more or less effective for the mitigation of flood risk. However, the priority and feasibility of the proposed measures should be examined in various terms such as technical, economic, social and environmental aspects before implementation. The measures are composed of structural and non-structural measures, and the optimum combination of measures should be examined as to their effectiveness before implementation in order to attain the objectives within a limited term, because some of the measures might take a long time for implementation.
It has been revealed that the operation of the existing dams during the 2011 flood was effective to reduce flood disaster risks, since Bhumibol Dam and Sirikit Dam stored about 12 billion m³ of floodwater. However, there is still room for modification of the operation rules of the existing dams from the flood control and water use aspects. More effective operation of the existing dams will be possible. In this study, “Target Curve” and “Alert Curve for Drought” are proposed. “Target Curve” is the target storage volume for water use and the upper limit for flood control. “Alert Curve for Drought” can provide indicators to judge whether a drought year. “10% Probability” and “20% Probability” mean the risk of drought once in every 10 years and once in every 5 years, respectively.
The Study proposes that the reservoir levels should follow the recommended “Target Curve” until the end of July, and from August, discharges should be stored in reservoirs with maximum outflows of 210m³/s for Bhumibol Dam and 190m³/s for Sirikit Dam. If the proposed dam operation is applied for the 2011 flood, the peak discharge at Nakhon Sawan (C2) could be reduced by 400m³/s. If the storage volume is less than the proposed Target Curve, the inflow should be stored in the reservoir. The released discharge shall not be less than the minimum discharges of 8m³/s at Bhumibol Dam and the 35m³/s at Sirikit Dam. Dam operation will have more flexibility to manage water resources with the minimization of flood damage as well as provision of water for irrigation purpose.
It has been revealed that there are two types of primary flood dykes along the river banks and secondary dykes of road-cum embankments of irrigation canals along the Chao Phraya River. The secondary dykes are considered as flood prevention measures. However, many local cities and communities are located along the river and numerous people are living between the two dykes. Also, even after the implementation of the proposed measures, a large part of the inundation area in the central plain will remain so that people should live with floods. Therefore, measures such as community-based flood disaster management are indispensable for the promotion of controlled inundation.
The Study proposes the combinations of: (i) Effective Operation of Existing Dams; (ii) Construction of the Outer Ring Road Diversion Channel;(iii) Implementation of River Improvement Works including the Tha Chin River Improvement; and (iv) Construction of the Ayutthaya Bypass Channel as the optimum combination for the protection area of Bangkok and

Project for the Comprehensive Flood Management Plan for the Chao Phraya River Basin in the Kingdom of Thailand
Main Report Chapter 12 Conclusion and Recommendation
CTI Engineering International Co., Ltd. Oriental Consultants Co., Ltd. Nippon Koei Co., Ltd. CTI Engineering Co., Ltd.
12-5
its vicinity to prevent flood disasters from the Chao Phraya River. The proposed combinations are feasible in technical, economic and environmental terms and for appropriate implementation of the proposed flood disaster management, nonstructural measures are required. It is recommended to prioritize implementation of the proposed combination as soon as possible.
Proposed combinations of measures are as follows: (1) Proposed Combination 1
a) Effective operation of existing dams b) Outer ring road diversion channel (Capacity: 500m³/s) c) River improvement works d) Ayutthaya Bypass Channel (Capacity: 1,400m³/s)
(2) Proposed Combination 2 a) Effective operation of existing dams b) Outer ring road diversion channel (Capacity: 1,000m³/s) c) River improvement works d) Ayutthaya Bypass Channel (Capacity 1,400m³/s)
(3) Other Nonstructural Measures a) Re-forestation b) Flood Forecasting. c) Land use control in inundation areas
As a result of the Study, GIS database has been developed based on the data collected which should be utilized by the RID after the Study.
As a basin-wide hydrological and hydraulic analysis model (using Mike 11 and Mike 21) incorporating the new topographical data, a runoff and flood analysis model has been developed. It is recommended that the simulation of flood runoff and inundation areas should be utilized for the flood risk management more precisely.
12.2 Recommendation
To avoid flood disasters in the protection areas and reduce the flood risks in the Chao Phraya River Basin, the Study recommends that the Thai Government should take immediate measures and arrangements for the implementation of the Comprehensive Flood Management Plan for the Chao Phraya River Basin.
Above all, the following remarks should be recommended.
The precise topographical information obtained in the JICA Study should be distributed immediately to all organizations and agencies concerned. They should carry out the necessary investigations based on it. If this accurate topographical information is not used, any proposal in extremely lowland area like the Chao Phraya River Basin would have few engineering rationality and hardly make scientific sense.
As indicated in the explanation of unsteady flow analysis, the amount of flood water volume stored in the entire Chao Phraya River channel is large, fluctuate itself in the river channel and inundation area, and volume is very large. So the effectiveness of even a large diversion channel from the upper reaches to the Gulf gradually decreases and may disappear at the lower reaches depending on the location of the inlet structure. Therefore, based on the idea that the effectiveness of the diversion channel is not changed regardless of the location, flood management plan by combination of channels with fixed flow capacity should not be avoided. It leads to a misdirected plan.
This Study stated the method of evaluation of flow capacity in the area subject to tidal action. It is very important and fundamental issues of river management in the Bangkok Area until now and in the futures. It should be well understood.

Main Report Chapter 12 Conclusion and Recommendation
Project for the Comprehensive Flood Management Plan for the Chao Phraya River Basin in the Kingdom of Thailand
12-6 CTI Engineering International Co., Ltd. Oriental Consultants Co., Ltd. Nippon Koei Co., Ltd. CTI Engineering Co., Ltd.
Recommendation about Comprehensive Flood Management Plan
To conduct effective operation of the existing dams (Bhumibol and Sirikit dams) as proposed by the Study.
To conduct a feasibility study (F/S) on the proposed combination of structural measures, i.e., river improvement works including the Tha Chin river improvement works, the Outer Ring Road Diversion Channel (500m³/s or 1000m³/s), the Ayutthaya Bypass Channel (Capacity: 1,400m³/s), and the nonstructural measures proposed by the Study.
About prioritization of implementation, it is indispensable to consider the flood safety level of upstream/downstream. If Ayutthaya bypass channel is constructed before installation of Outer Ring Road Diversion Channel, river water flowing into the downstream around protection area is supposed to enlarge by approximately 300m3/s, according to the flood analysis, which could increase the flood risk at downstream. Therefore, it is highly recommended that Outer Ring Road Diversion Channel should be constructed before Ayutthaya bypass channel.
To promote controlled inundation, it is necessary to conduct the following: (i) To develop an accurate base map for the low-lying floodplain areas of the Chao Phraya River Basin based on the LP data prepared by JICA in 2012; (ii) To establish land use control and develop land use plan for the urban areas in the controlled inundation area; (iii) To promote community based flood disaster risk management including the implementation of structural and non-structural measures required due to the types of inundation zones; and (iv) To enhance public awareness on flood disaster risk management through improvement of dissemination of information and communication and education.
As decision support and managing tools, the GIS data base and the river models developed in the Study should be maintained and updated in a sustainable manner for the effective flood disaster management of the Chao Phraya River Basin.

Project for the Comprehensive Flood Management Plan for the Chao Phraya River Basin in the Kingdom of Thailand
Main Report Chapter 12 Conclusion and Recommendation
CTI Engineering International Co., Ltd. Oriental Consultants Co., Ltd. Nippon Koei Co., Ltd. CTI Engineering Co., Ltd.
12-7
Recommendations on the Hydrological Data Observation System
The issues identified in the hydrological data observation system are as described in the following table.
No. Issues Recommendations
1
Shortage of Rainfall Station and inhomogeneous distribution In this project, JST collected the rainfall data from approx. 700 stations in the Chao Phraya River Basin. Although the density of rainfall stations in the Chao Phraya River Basin is not so high at approx. 300km2/station, many of the rainfall stations are located disproportionately, and most of stations under RID are concentrated in the irrigation area downstream of Nakhon Sawan (C.2). In order to examine the exact water resource and establish the flood control and water use plans, etc., it is necessary to install more rainfall stations. In Japan, it is believed that the ideal density of rainfall stations is 50km2/station as a precautionary measure against torrential rainfall.
Rainfall stations should be installed especially in the middle basins, such as the Pa Sak River Basin, the area from Nakhon Sawan to Sukhothai and so on. It is ideal that rainfall stations should be distributed across the nation. Naturally, a higher density of stations in mountainous area is better.
Locations of Rainfall Station (as of 2011)
2
Observation Interval (Water Level Station) Basically, it is enough to use daily data when rainfall analysis in the Chao Phraya River Basin is conducted because flood arrival time is long. However, in tidal sections, hourly water level observation should be carried out. Water level in tidal sections fluctuates periodically and usually high/low tide occurs twice a day due to sea tide, which regulates river flow. As of June 2013, JST has confirmed that hourly observation on water level has been done at telemetry stations TC.54, TC.12, TC.22, TC.55 and C.29A. However, observed data at most stations included errors and hourly water level data was not available.
Firstly, the existing water level station recording hourly data should be repaired and maintained. At least up to Ayutthaya (upstream of 141km from estuary), hourly observation should be done since river bed slope from estuary to Ayutthaya is almost flat and influenced by sea tide. Hourly water level observation should then be carried out not only in Chao Phraya River but also in Tha Chin River.
3
Discharge Observation during Flood Season Obtained hydrological data during flood events is very valuable; especially discharge data at tidal sections near the estuary. It is desirable that hourly discharge observation is conducted with ADCP (Acoustic Doppler Current Profiler).
It is highly recommended that hourly discharge observation at tidal sections during flood events shall be done by using ADCP. Currently, discharge data obtained with ADCP seems to be the most accurate. The RID monitoring team, which can observe discharge with ADCP, should expand their activities to other sites.
4
Installation of Hydrological Station Monitoring Water Level and/or Discharge By using the flood analysis model, it was found that overflow and return flow from the flood plain is frequent from Nakhon Sawan to Ayutthaya. In order to clarify the phenomenon, water level/discharge observation should be done.
Understanding of overflow volume and return flow to the rivers/canals is necessary to control flooding and inundation so that new hydrological stations should be installed. Hydrological stations are required, especially, from Chao Phraya Dam to Nakhon Sawan because there are no water level stations in the area. In addition, water level/discharge observation should be carried out in major tributaries including Noi River, Lop Buri River, Chainat Pasak Canal and so on, since inflow from tributaries could impact on the flow regime at the mainstream.

Main Report Chapter 12 Conclusion and Recommendation
Project for the Comprehensive Flood Management Plan for the Chao Phraya River Basin in the Kingdom of Thailand
12-8 CTI Engineering International Co., Ltd. Oriental Consultants Co., Ltd. Nippon Koei Co., Ltd. CTI Engineering Co., Ltd.
Recommendation about Hydrological Data Management
Observed hydrological data including water level, discharge, and rainfall is valuable information for the establishment of an integrated water management plan, flood control, irrigation planning and so on. The issues on data management noticed through the Study are as listed in the following table.
No. Issues Recommendations
1
Status of Hydrological Station The location of some rainfall gauging stations is not correct and the working condition (working or not-working) is unclear, which hinders the planning of flood control and other related projects.
To conduct site survey for all stations and find the current situation, not only the exact location (latitude/longitude), but also the elevation at site shall be measured. It is desired that official RID benchmarks shall be established near the hydrological station by reference to first-class benchmark defined by RTSD. Especially, stations near estuary should require considerable attention, because the elevation of water level gauge may be lowered by ground subsidence.
2
Data Collection System It seems that there is room to improve the data collection system. Mainly, the RID Hydro Center maintains and collects observed data/information and posts them in their website. However, the frequency of update depends on the Hydro Center and information is not always updated. Besides, latest data is not always sent to the headquarters.
Observed data should be managed in an integrated fashion in the headquarters. The data collection system shall be reviewed and a technical guideline on data collection shall be prepared and distributed to provincial offices. In addition, periodical maintenance work on hydrological equipment should be done thoroughly.
3
Quality Control Observed data could have a margin of error caused by mistake of recording data, trouble of equipment and so on. Observed data shall be examined carefully.
To keep/ensure high accuracy and reliability of observed data, they should be examined by comparison of historical data and cross-checking with related data. Together with data collection, a technical guideline on data quality control should be prepared.
4
Image Recording during Flood Event The more information on flood situation, the more effective and efficient is the formulation of a flood control plan, etc.
Moving images during flood events should be recorded and stored, because they are crucially important for understanding the hydraulic behavior of rivers and for establishment of the flood control plan. It is desired that CCTV cameras shall be installed in major hydrological stations and recorded images be saved/stocked and shared with related agencies. River flow condition near the RID office should at least be recorded by digital video camera, etc.
5
Cross-Section Survey The planning of water management such as flood control plan, water resources and so on should be studied considering latest natural condition.
River cross section could be changed by river improvement works, land development, etc. In Lower Chao Phraya river basin, the construction of road dyke surrounding the economically important zone has been carried out by DOH and DOR, and this would change flow regimes and inundation conditions during the rainy season. Therefore, the river cross-section should be measured periodically and the transition of river shape should also be checked, especially in Chao Phraya River after the confluence of Noi River where a deep river bed erosion occurred which could develop more after completion of the road dyke.
Recommendation about Hourly and Daily Flow Capacities in the Lower Reaches
In addition, hourly and daily flow capacities in the lower reaches of the Chao Phraya River should be surveyed and clarified. During the 2011 flood, the recorded daily peak flow discharge of 3,900m3/m at Bang Sai indicate that there was no damage caused by overflow of water in the lower reaches of the Chao Phraya River. Since the lower reaches of the Chao Phraya River is subject to tidal action, the recorded data in 2011 was based on the hourly automatic measurement of H-Q by H-ADCP (Horizontal Acoustic Doppler Current Profiler). However, although the river width at Bang Sai is more than 500m, the maximum range of this H-ADCP is 300m only, so that it is difficult to conclude whether or not this recorded data is correct. Therefore, continuous measurement by the V-ADCP (Vertical Acoustic Doppler Current Profiler) during flood is recommended in order to clarify hourly and daily flow capacities in the lower reaches of the Chao

Project for the Comprehensive Flood Management Plan for the Chao Phraya River Basin in the Kingdom of Thailand
Main Report Chapter 12 Conclusion and Recommendation
CTI Engineering International Co., Ltd. Oriental Consultants Co., Ltd. Nippon Koei Co., Ltd. CTI Engineering Co., Ltd.
12-9
Phraya River. Clarification of the maximum hourly and daily flow capacity in the lower reaches considering tidal action is one of the most important values for evaluation of flood risk.
Figure 12.2.1 River Surveyor M9 (V-ADCP) prepared by RID
The following figures show the results of simulation. During the 2011 flood with dyke elevating by DOH and DOR, the daily peak flow discharges at Bang Sai (112km from river mouth), at TC12 (59km from river mouth), at 20km from river mouth and at the river mouth have been simulated as about 4,300m3/s, 4,320m3/s, 4,440m3/s and 4,490m3/s, respectively. At this time, hourly peak water elevation is 4.1m MSL, 2.9m MSL, 2.2m MSL and 1.9m MSL, respectively.
On the other hand, the crest elevation of existing parapet wall at TC12, at 20km point and at the river mouth is 3.0m MSL, 2.5m MSL and 2.0m MSL, respectively. It means the river water level is still lower than the crest elevation of parapet wall around Bangkok.

Main Report Chapter 12 Conclusion and Recommendation
Project for the Comprehensive Flood Management Plan for the Chao Phraya River Basin in the Kingdom of Thailand
12-10 CTI Engineering International Co., Ltd. Oriental Consultants Co., Ltd. Nippon Koei Co., Ltd. CTI Engineering Co., Ltd.
Chaophraya River 112.0km (Bang Sai, C.29A)
-3,000
-2,000
-1,000
0
1,000
2,000
3,000
4,000
5,000
6,000
7,000
8/1/2011 9/1/2011 10/2/2011 11/2/2011 12/3/2011
Dis
char
ge (m
3/s)
2011 Observed (Hourly) 2011 Simulation (Hourly) 2011 Simulation (Daily)
Chaophraya River 112.0km (Bang Sai, C.29A)
-2.0
-1.0
0.0
1.0
2.0
3.0
4.0
5.0
8/1/2011 9/1/2011 10/2/2011 11/2/2011 12/3/2011
Wat
er L
evel
(m M
SL)
2011 Observed (Hourly) 2011 Simulation (Hourly) DHWL Existing Dyke Crest Dyke Crest to be elevated
Chaophraya River 112.0km (Bang Sai, C.29A)
-2.0
-1.0
0.0
1.0
2.0
3.0
4.0
5.0
-3,000 -2,000 -1,000 0 1,000 2,000 3,000 4,000 5,000 6,000 7,000Discharge (m3/s)
Wat
er L
evel
(m M
SL)
2011 Observed (Hourly) 2011 Simulation (Hourly) 2011 Simulation (Daily) DHWL Existing Dyke Crest Dyke Crest to be elevated
4,296 m3/s (Daily)
4.12 m MSL (Hourly)
Figure 12.2.2 Water Level and Discharge at 112km Point from River Mouth (Bang Sai, C29A)

Project for the Comprehensive Flood Management Plan for the Chao Phraya River Basin in the Kingdom of Thailand
Main Report Chapter 12 Conclusion and Recommendation
CTI Engineering International Co., Ltd. Oriental Consultants Co., Ltd. Nippon Koei Co., Ltd. CTI Engineering Co., Ltd.
12-11
Chaophraya River 59.0km (TC12)
-3,000
-2,000
-1,000
0
1,000
2,000
3,000
4,000
5,000
6,000
7,000
8/1/2011 9/1/2011 10/2/2011 11/2/2011 12/3/2011
Dis
char
ge (m
3/s)
2011 Simulation (Hourly) 2011 Simulation (Daily)
Chaophraya River 59.0km (TC12)
-2.0
-1.0
0.0
1.0
2.0
3.0
4.0
5.0
8/1/2011 9/1/2011 10/2/2011 11/2/2011 12/3/2011
Wat
er L
evel
(m M
SL)
2011 Observed at TC12 (Hourly) 2011 Simulation (Hourly) DHWL Existing Dyke Crest Dyke Crest to be elevated
Chaophraya River 59.0km (TC12)
-2.0
-1.0
0.0
1.0
2.0
3.0
4.0
5.0
-3,000 -2,000 -1,000 0 1,000 2,000 3,000 4,000 5,000 6,000 7,000Discharge (m3/s)
Wat
er L
evel
(m M
SL)
2011 Simulation (Hourly) 2011 Simulation (Daily) DHWL Existing Dyke Crest Dyke Crest to be elevated
4,315 m3/s (Daily)
2.91 m MSL (Hourly)
Figure 12.2.3 Water Level and Discharge at 59 km Point from River Mouth (TC12)

Main Report Chapter 12 Conclusion and Recommendation
Project for the Comprehensive Flood Management Plan for the Chao Phraya River Basin in the Kingdom of Thailand
12-12 CTI Engineering International Co., Ltd. Oriental Consultants Co., Ltd. Nippon Koei Co., Ltd. CTI Engineering Co., Ltd.
Chaophraya River 20.0km
-3,000
-2,000
-1,000
0
1,000
2,000
3,000
4,000
5,000
6,000
7,000
8/1/2011 9/1/2011 10/2/2011 11/2/2011 12/3/2011
Dis
char
ge (m
3/s)
2011 Simulation (Hourly) 2011 Simulation (Daily)
Chaophraya River 20.0km
-2.0
-1.0
0.0
1.0
2.0
3.0
4.0
5.0
8/1/2011 9/1/2011 10/2/2011 11/2/2011 12/3/2011
Wat
er L
evel
(m M
SL)
2011 Simulation (Hourly) DHWL Existing Dyke Crest Dyke Crest to be elevated
Chaophraya River 20.0km
-2.0
-1.0
0.0
1.0
2.0
3.0
4.0
5.0
-3,000 -2,000 -1,000 0 1,000 2,000 3,000 4,000 5,000 6,000 7,000Discharge (m3/s)
Wat
er L
evel
(m M
SL)
2011 Simulation (Hourly) 2011 Simulation (Daily) DHWL Existing Dyke Crest Dyke Crest to be elevated
4,441 m3/s (Daily)
2.19 m MSL (Hourly)
Figure 12.2.4 Water Level and Discharge at 20km Point from River Mouth
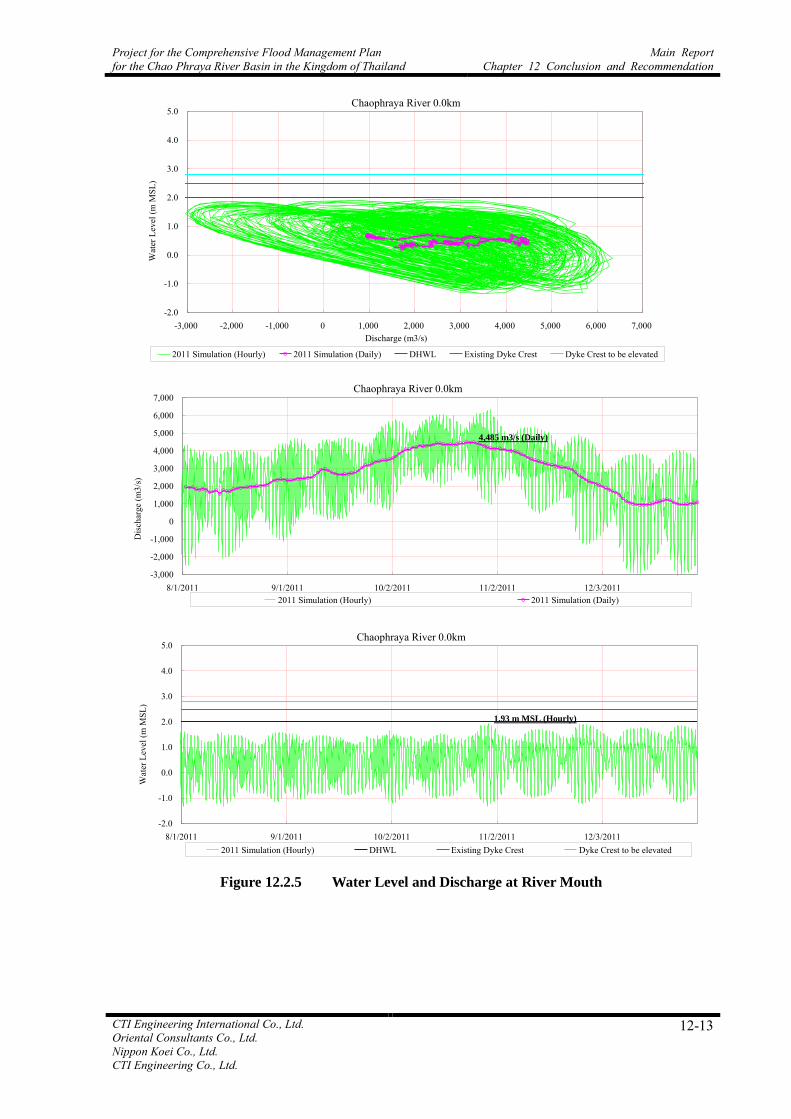
Project for the Comprehensive Flood Management Plan for the Chao Phraya River Basin in the Kingdom of Thailand
Main Report Chapter 12 Conclusion and Recommendation
CTI Engineering International Co., Ltd. Oriental Consultants Co., Ltd. Nippon Koei Co., Ltd. CTI Engineering Co., Ltd.
12-13
Chaophraya River 0.0km
-3,000
-2,000
-1,000
0
1,000
2,000
3,000
4,000
5,000
6,000
7,000
8/1/2011 9/1/2011 10/2/2011 11/2/2011 12/3/2011
Dis
char
ge (m
3/s)
2011 Simulation (Hourly) 2011 Simulation (Daily)
Chaophraya River 0.0km
-2.0
-1.0
0.0
1.0
2.0
3.0
4.0
5.0
8/1/2011 9/1/2011 10/2/2011 11/2/2011 12/3/2011
Wat
er L
evel
(m M
SL)
2011 Simulation (Hourly) DHWL Existing Dyke Crest Dyke Crest to be elevated
Chaophraya River 0.0km
-2.0
-1.0
0.0
1.0
2.0
3.0
4.0
5.0
-3,000 -2,000 -1,000 0 1,000 2,000 3,000 4,000 5,000 6,000 7,000Discharge (m3/s)
Wat
er L
evel
(m M
SL)
2011 Simulation (Hourly) 2011 Simulation (Daily) DHWL Existing Dyke Crest Dyke Crest to be elevated
4,485 m3/s (Daily)
1.93 m MSL (Hourly)
Figure 12.2.5 Water Level and Discharge at River Mouth