Main Report on Energy Outlook and Saving Potential in the ... · Energy Outlook and Energy Saving...
55
Chapter 1 Main Report September 2016 This chapter should be cited as Han, P., S. Kimura, and C. Malik (2016), ‘Main Report’, in Kimura, S. and P. Han. (eds.) in Energy Outlook and Energy Saving Potential in East Asia 2016. ERIA Research Project Report 2015-5, Jakarta: ERIA, pp.1–54.
Transcript of Main Report on Energy Outlook and Saving Potential in the ... · Energy Outlook and Energy Saving...

Chapter 1
Main Report
September 2016
This chapter should be cited as
Han, P., S. Kimura, and C. Malik (2016), ‘Main Report’, in Kimura, S. and P. Han.
(eds.) in Energy Outlook and Energy Saving Potential in East Asia 2016.
ERIA Research Project Report 2015-5, Jakarta: ERIA, pp.1–54.

C h a p t e r 1
Main Report on Energy Outlook
and Saving Potential in the East Asia Region
HAN PHOUMIN, ENERGY ECONOMIST, ECONOMIC RESEARCH INSTITUTE FOR ASEAN
AND EAST ASIA (ERIA)
SHIGERU KIMURA, SPECIAL ADVISOR ON ENERGY AFFAIRS TO THE ERIA PRESIDENT
CECILYA LAKSMIWATI MALIK, REGIONAL CONSULTANT ON ENERGY POLICY PLANNING
1. Introduction
ustained population and economic growth in the East Asia Summit (EAS)
region have nearly doubled energy demand for both primary and final
energy consumption. The increasing energy demand poses a threat to the
region’s energy security. Hence, potential energy saving is key to reducing energy
demand and carbon dioxide (CO2) emissions.
In 2007, leaders from the Association of Southeast Asian Nations (ASEAN)
member countries, as well as Australia, the People’s Republic of China
(henceforth, China), India, Japan, the Republic of Korea, and New Zealand,
adopted the Cebu Declaration, which focuses on energy security. The leaders
agreed to promote energy efficiency, new renewable energy, and the clean use of
coal. Subsequently, the EAS Energy Cooperation Task Force (ECTF) was
established in response to the Cebu Declaration, and Japan proposed to
undertake a study on energy savings and CO2 emission reduction potential, one
of the agreed areas of cooperation where the Economic Research Institute for
ASEAN and East Asia (ERIA) also officially requested through the EAS Energy
Ministers Meeting (EAS–EMM) to support studies in the agreed areas of energy
work streams.
This study shows energy saving potential using both the Business-as-Usual
scenario (BAU) and Alternative Policy Scenarios (APS). The BAU was developed for
S

2
Energy Outlook and Energy Saving Potential in East Asia
each EAS economy, outlining future sectoral and economy-wide energy
consumption assuming no significant changes to government policies. APS were
set out to examine the potential impacts if additional energy efficiency goals,
action plans, or policies that are currently, or likely to be, under considered were
developed. The difference between the BAU and the APS in both final and
primary energy supply represents potential energy savings. The difference in CO2
emissions between the two scenarios represents the potential for reducing
greenhouse gas (GhG) emissions.
The findings of this study continue to shed light on the policy implications for
decision-making to ensure that the region can enjoy both economic growth and
investment opportunities without compromising on averting the threat to energy
security and of environmental problems as a result of rising CO2 emissions.
1.1. The East Asia Summit
The EAS is a collection of diverse countries, with wide variations among them in
terms of per capita income, standards of living, population density, energy
resource endowments, climate, and energy consumption per capita. It is
composed of the 10 ASEAN member countries – Brunei Darussalam, Cambodia,
Indonesia, Lao PDR, Malaysia, Myanmar, the Philippines, Singapore, Thailand, and
Viet Nam, and six other countries – Australia, China, India, Japan, Republic of
Korea (henceforth, Korea), and New Zealand (The Ministry of Foreign Affairs of
Japan, 2005).
Whereas some EAS countries are what might be called mature economies, the
majority are regarded as developing economies. Several countries have a per
capita gross domestic product (GDP) of less than US$1,000 (in 2005 prices1).
Countries with mature economies have higher energy consumption per capita,
whereas developing countries generally have lower energy consumption per
capita. A large percentage of the people in the latter countries still meet their
energy needs mainly with traditional biomass fuels.
1 All US$ (US dollars) in this document are 2005 constant prices unless specified.
3
Main Report
These differences partly explain why energy efficiency and conservation (EEC)
goals, action plans, and policies are assigned different priorities across countries.
Countries with developed economies may be very keen to reduce energy
consumption, whereas developing countries tend to put more emphasis on
economic growth and improving standards of living. However, as the economies
of these countries grow, energy consumption per capita is expected to grow as
well.
Despite the differences among the 16 countries, the EAS leaders agreed that the
EAS ‘could play a significant role in community building,’ which could be an
important cornerstone for the development of regional cooperation in the years
to come (Ministry of Foreign Affairs of Japan, 2005).
Table 1-1 shows the geographic, demographic, and economic profiles of the 16
EAS countries. Table 1-2 shows their economic structure and energy consumption
profiles.

4
Energy Outlook and Energy Saving Potential in East Asia
Table 1-1. Geographic, Demographic, and Economic Profiles, 2013
Land Area
(thousand
sq. km.)*
Population
(million)
Population
Density
(persons/
sq. km.)
GDP
(billion
2005
US$)
GDP per
Capita
(2005
US$/
person)
Australia 7,682 23.13 3.01 867.09 37,489
Brunei Darussalam 5.3 0.41 77.08 10.10 24,874
Cambodia 181 15.08 83.31 10.72 711
China 9,327 1,360.72 145.88 4,912.96 3,611
India 2,973 1,252.14 421.14 1,489.78 1,190
Indonesia 1,812 246.86 136.27 449.14 1,819
Japan 365 127.34 349.35 4,685.52 36,796
Korea, Rep. of 97 50.22 517.20 1,199.01 23,875
Lao PDR 231 6.58 28.51 5.09 774
Malaysia 329 29.47 89.68 207.95 7,057
Myanmar 653 52.98 81.10 24.93 471
New Zealand 263 4.44 16.87 120.14 27,046
Philippines 298 98.20 329.34 155.61 1,585
Singapore 0.7 5.40 7,713.14 202.42 37,491
Thailand 511 67.45 132.03 230.37 3,415
Viet Nam 310 89.71 289.32 92.28 1,029
sq. km. = square kilometres; GDP = gross domestic product.
Note: * Information on the land area data of Cambodia was provided by the Government
of Cambodia.
Source: World Development Indicators, World Bank Database, November 2013.

5
Main Report
Table 1-2. Economic Structure and Energy Consumption, 2013
GDP
(billion
2005
US$)
Share of
Industry
in GDP,
percent*
Share of
Services
in GDP,
percent*
Share of
Agriculture
in GDP,
percent*
Primary
Energy
Supply
(Mtoe)
Energy
Consumption
per Capita
(toe/person)
Australia 867.1 28.2 69.2 2.6 129.1 5.6
Brunei
Darussalam 10.1 60.9 38.3 0.8 2.9 7.1
Cambodia 10.7 29.9 43.0 27.1 6.8 0.5
China 4,913.0 48.8 43.5 7.7 3,021.9 2.2
India 1,489.8 33.5 52.0 14.5 775.4 0.6
Indonesia 449.1 39.7 49.7 10.6 223.9 0.9
Japan 4,685.5 28.1 70.7 1.3 454.7 3.6
Korea, Rep. of 1,199.0 39.6 57.8 2.6 263.8 5.3
Lao PDR 5.1 31.5 42.7 25.8 2.5 0.4
Malaysia 208.0 39.4 53.4 7.2 74.5 2.5
Myanmar 24.9 25.9 41.8 32.3 16.5 0.3
New Zealand 120.1 23.7 71.9 4.4 19.5 4.4
Philippines 155.6 33.8 56.4 9.9 44.5 0.5
Singapore 202.4 32.7 67.2 0.0 28.7 5.3
Thailand 230.4 37.4 54.4 8.2 132.3 2.0
Viet Nam 92.3 42.0 40.9 17.1 60.1 0.7
Note: * Sectoral shares to GDP of Myanmar and New Zealand are 2004 and 2009 values,
respectively.
Source: World Development Indicators, World Bank Database, November 2013;
International Energy Agency (IEA) (2014), Energy Balances of Organisation for Economic
Co-operation and Development (OECD) countries 2013.
6
Energy Outlook and Energy Saving Potential in East Asia
1.2. Objective and Rationale
This study aims to analyse the potential impact of proposed additional energy
saving goals, action plans, and policies in the EAS region on energy consumption
by fuel and sector and GhG emissions. The study also provides a platform for
energy collaboration and capacity building on energy modelling and policy
development among EAS countries.
The study supports the Cebu Declaration, which highlights a number of goals
including the following:
improving the efficiency and environmental performance of fossil fuel use;
reducing the dependence on conventional fuels through intensified EEC
programmes, increasing the share of hydropower, expanding renewable
energy systems and biofuel production/utilisation, and, for interested
parties, civilian nuclear power; and
mitigating GhG emissions through effective policies and measures, thus
contributing to global climate change abatement.
The Government of Japan asked ERIA to conduct a study on energy saving and
potential on CO2 emission reduction in the East Asia region. As a result, the
Working Group for this study on the Analysis of Energy Saving Potential was
convened. Members from all 16 EAS countries are represented in the Working
Group to support this study.
2. Data and Methodology
2.1. The Scenarios
The study continues to examine two scenarios, as in the studies conducted
annually from 2007 to the present – a BAU reflecting each country’s current goals,
action plans, and policies; and an APS.
7
Main Report
The APS includes additional goals, action plans, and policies reported every year
to the East Asia Energy Ministers Meeting (EAS–EMM). The latest updated policies
were reported at the 9th EAS–EMM held on 8 October 2015 in Kuala Lumpur,
Malaysia.
One might be tempted to call the APS a ‘maximum effort’ case, but that would
not be accurate. One reason is that goals, action plans, and policies for reducing
energy consumption are still relatively new in most countries. There are still many
potential EEC policies and technological options that have not been examined or
incorporated in the APS.
In 2014, the APS assumptions were grouped into four – (i) more efficient final
energy consumption (APS1), (ii) more efficient thermal power generation (APS2),
(iii) higher consumption of new and renewable energy (NRE) and biofuels (APS3),
and (iv) introduction or higher utilisation of nuclear energy (APS4). The energy
models are able to estimate the individual impacts of these assumptions on both
primary energy supply and CO2 emissions. The combination of these assumptions
constitutes the assumptions of the APS. The main report highlights only the BAU
and APS. However, each country report will analyse all the APS scenarios from
APS1 to APS4.
Detailed assumptions for each APS are follows:
The assumptions in APS1 are the reduction targets in sectoral final energy
consumption, assuming that more efficient technologies are utilised and energy
saving practices implemented in the industrial, transport, residential,
commercial, and even the agricultural sectors for some countries. This scenario
resulted in less primary energy and CO2 emission in proportion to the reduction
in final energy consumption.
In APS2, the utilisation of more efficient thermal power plant technologies
in the power sector is assumed. This assumption resulted in lower primary
energy supply and CO2 emission in proportion to the efficiency improvement in
thermal power generation. The most efficient coal and natural gas combined–
cycle technologies are assumed to be utilised for the construction of new power
8
Energy Outlook and Energy Saving Potential in East Asia
plants in this scenario.
In APS3, higher contributions of NRE for electricity generation and
utilisation of liquid biofuels in the transport sector are assumed. This resulted in
lower CO2 emission as NRE is considered carbon-neutral or would not emit
additional CO2 in the atmosphere. However, primary energy supply may not
decrease as NRE, like biomass and geothermal energy, are assumed to have
lower efficiencies compared with fossil fuel–fired generation when converting
electricity generated from these NRE sources into its primary energy equivalent.
APS4 assumes introduction of nuclear energy or a higher contribution of
nuclear energy in countries that are already using this energy source. This
scenario is expected to emit less CO2 because of nuclear energy’s minimal CO2
emission. However, as the assumption of thermal efficiency when converting
nuclear energy output into primary energy is only 33 percent, primary energy
supply is not expected to be lower than for the BAU in this scenario.
All EAS countries are actively developing and implementing EEC goals, action
plans, and policies, but progress so far has varied widely. Some countries are
quite advanced in their efforts, whereas others are just getting started. A few
countries already have significant energy savings goals, action plans, and policies
built into the BAU, whereas others have only just started to quantify their goals.
However, significant potential does exist in these countries at the sectoral and
economy-wide levels.
In every country, a great deal can be learned from experience on what works and
what does not. It is worthwhile updating this study periodically, as the quality and
scope of the national goals, action plans, and policies are likely to improve
considerably over time, allowing for valuable collaboration across countries.
2.2. Data
For consistency, the historical energy data used in this analysis came from the
International Energy Agency’s (IEA) energy balances for Organisation of Economic
Co-operation and Development (OECD) and non-OECD countries, except for
Australia and Lao PDR. Australian national energy data was converted from gross
calorific value (GCV) into net calorific value (NCV) to be consistent with IEA

9
Main Report
energy balances. Estimations of national energy data from Lao PDR were made
using the same methodology as used by the IEA.
The socio-economic data for 15 countries were obtained from the World Bank’s
online World Databank – World Development Indicators (WDI) and Global
Development Finance (GDF) – and the data of Myanmar were obtained from the
United Nations Statistics Division (UNSD) Statistical Databases. Other data, such
as those relating to transportation, buildings, and industrial production indices,
were provided by the Working Group members from each EAS country where
such data are available. Where official data were not available, estimates were
obtained from other sources or developed by the Institute of Energy Economics,
Japan (IEEJ).
2.3. Methodology
In 2007, the primary model used was the IEEJ World Energy Outlook Model,
which is used by IEEJ in preparing their Asia/World Energy Outlook (Ito et al.,
2014). In 2014, all 10 ASEAN member countries utilised their own energy models.
Australia used its own national model as well. The remaining countries provided
key assumptions to IEEJ on population and GDP growth; electric generation fuel
mixes; and EEC goals, action plans, and policies. The IEEJ models were then used
to develop energy projections for these countries. In the next section, brief
descriptions of the energy models in this study are provided.
Australia: Australian projections were developed using the country’s E4cast
model,2 a dynamic partial equilibrium framework that provides a detailed
treatment of the Australian energy sector focusing on domestic energy use and
supply. The Australian energy system is divided into 24 conversion and end use
sectors, and fuels comprise 19 primary and secondary fuels with all states and
territories represented. Energy demand for each fuel is modelled based on
econometrically estimated price and income elasticities.
2 E4cast is a partial equilibrium model of the Australian energy sector used to project Australia's
long-term energy consumption, production, and trade.

10
Energy Outlook and Energy Saving Potential in East Asia
ASEAN countries: The energy models of ASEAN countries were developed using
the Long-range Energy Alternative Planning System (LEAP) software, an
accounting system used to develop projections of energy balance tables based
on final energy consumption and energy input/output in the transformation
sector. Final energy consumption is forecast using energy demand equations by
energy and sector and future macroeconomic assumptions. For this study, all 10
member countries used the LEAP model.
Other countries: Other countries used the IEEJ model, which has a macro-
economic module that calculates coefficients for various explanatory variables
based on exogenously specified GDP growth rates. The macro-economic module
also projects prices for natural gas and coal based on exogenously specified oil
price assumptions. Demand equations are econometrically calculated in another
module using historical data, and future parameters are projected using the
explanatory variables from the macro-economic module. An econometric
approach means that future demand and supply will be heavily influenced by
historical trends. However, the supply of energy and new technologies are treated
exogenously. For electricity generation, the Working Group members were asked
to specify assumptions about the future electricity generation mix in their
respective countries by energy source. These assumptions were used to
determine the future electricity generation mix.
3. Assumptions of the Study
Growth in energy consumption and GhG emissions is driven by a variety of socio-
economic factors. In the EAS region, these factors, including increasing
population, sustained economic growth, increasing vehicle ownership, and
increasing access to electricity, will tend to increase energy demand. Together
they create what might be called a huge growth ‘headwind’ that works against
efforts to limit energy consumption. Understanding the nature and size of this
‘headwind’ is critical for any analysis of energy demand in the EAS region.
However, an increase in consumption of energy services is fundamental for
achieving a range of socio-economic development goals.

11
Main Report
In this section, assumptions regarding key socio-economic indicators and energy
policies until 2040 for EAS countries are discussed.
3.1. Population
In the models used for this study, changes in population to 2040 are set
exogenously. It is assumed there is no difference in population between the BAU
and the APS. Assumed changes in population were submitted by EAS countries,
except China, for which the population projections from the United Nations were
used.
In 2013, the total population of the EAS region was about 3.43 billion. Based on
forecasts, it is projected to increase at an average annual rate of about 0.6
percent, reaching about 4 billion in 2040. Error! Reference source not found. 1-1
shows the 2013 and projected 2040 population by country.
Figure 1-1. Assumed Population in the EAS Region, 2013 and 2040
EAS = East Asia Summit (AUS = Australia; BRN = Brunei Darussalam; KHM =
Cambodia; CHN = China; IND = India; INA = Indonesia; JPN = Japan; KOR = South
Korea; LAO = Lao PDR; MAS = Malaysia; MMR = Myanmar; NZL = New Zealand; PHI =
Philippines; SIN = Singapore; THA = Thailand; VNM = Viet Nam).
Source: United Nations Statistics Division (2014), United Nations Statistics Division
(UNSD) Statistical Databases. https://unstats.un.org/unsd/databases.htm (accessed
June 2016).
12
Energy Outlook and Energy Saving Potential in East Asia
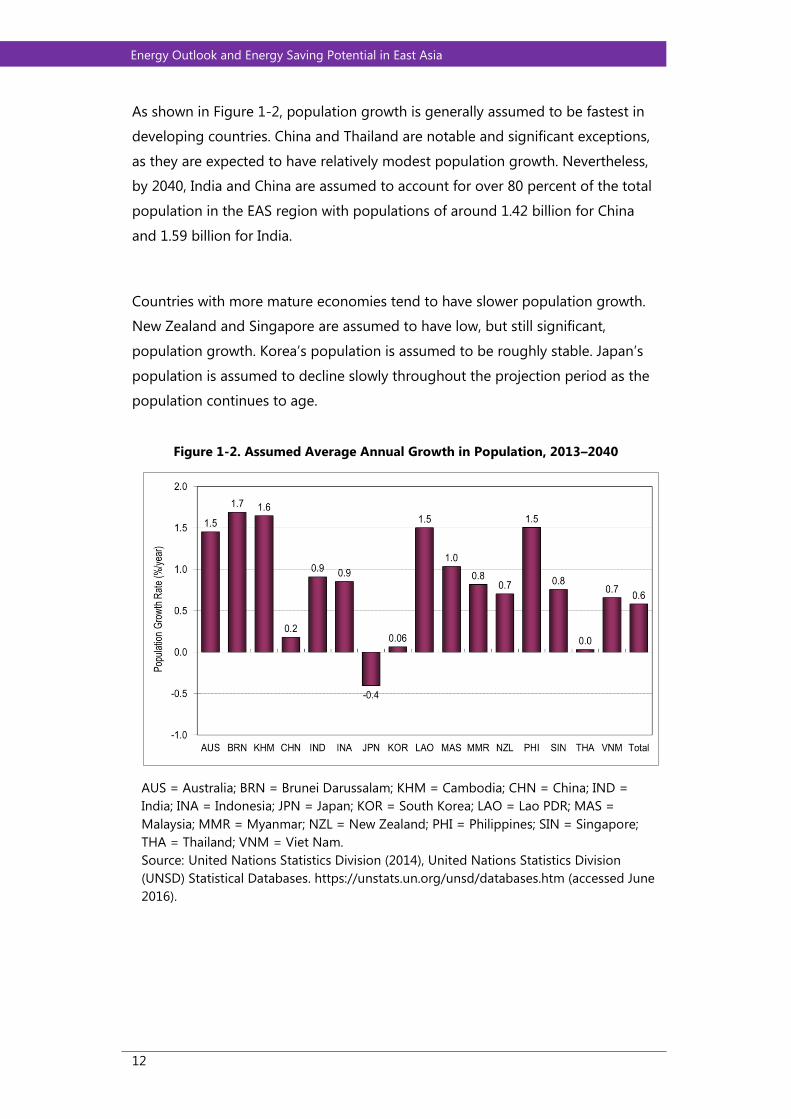
As shown in Figure 1-2, population growth is generally assumed to be fastest in
developing countries. China and Thailand are notable and significant exceptions,
as they are expected to have relatively modest population growth. Nevertheless,
by 2040, India and China are assumed to account for over 80 percent of the total
population in the EAS region with populations of around 1.42 billion for China
and 1.59 billion for India.
Countries with more mature economies tend to have slower population growth.
New Zealand and Singapore are assumed to have low, but still significant,
population growth. Korea’s population is assumed to be roughly stable. Japan’s
population is assumed to decline slowly throughout the projection period as the
population continues to age.
Figure 1-2. Assumed Average Annual Growth in Population, 2013–2040
AUS = Australia; BRN = Brunei Darussalam; KHM = Cambodia; CHN = China; IND =
India; INA = Indonesia; JPN = Japan; KOR = South Korea; LAO = Lao PDR; MAS =
Malaysia; MMR = Myanmar; NZL = New Zealand; PHI = Philippines; SIN = Singapore;
THA = Thailand; VNM = Viet Nam.
Source: United Nations Statistics Division (2014), United Nations Statistics Division
(UNSD) Statistical Databases. https://unstats.un.org/unsd/databases.htm (accessed June
2016).

13
Main Report
3.2. Economic Activity
In the models used for this study, assumed changes in economic output to 2040
are set exogenously. GDP data (in 2005 US$) were obtained from the World Bank
(2014). Assumed GDP growth rates to 2040 were submitted by all EAS countries.
In general, these assumptions took into account actual GDP growth rates from
2005 to 2013, which already reflect the economic recession and recovery in the
United States and other countries in the world. No difference in growth rates was
assumed between the BAU and APS.
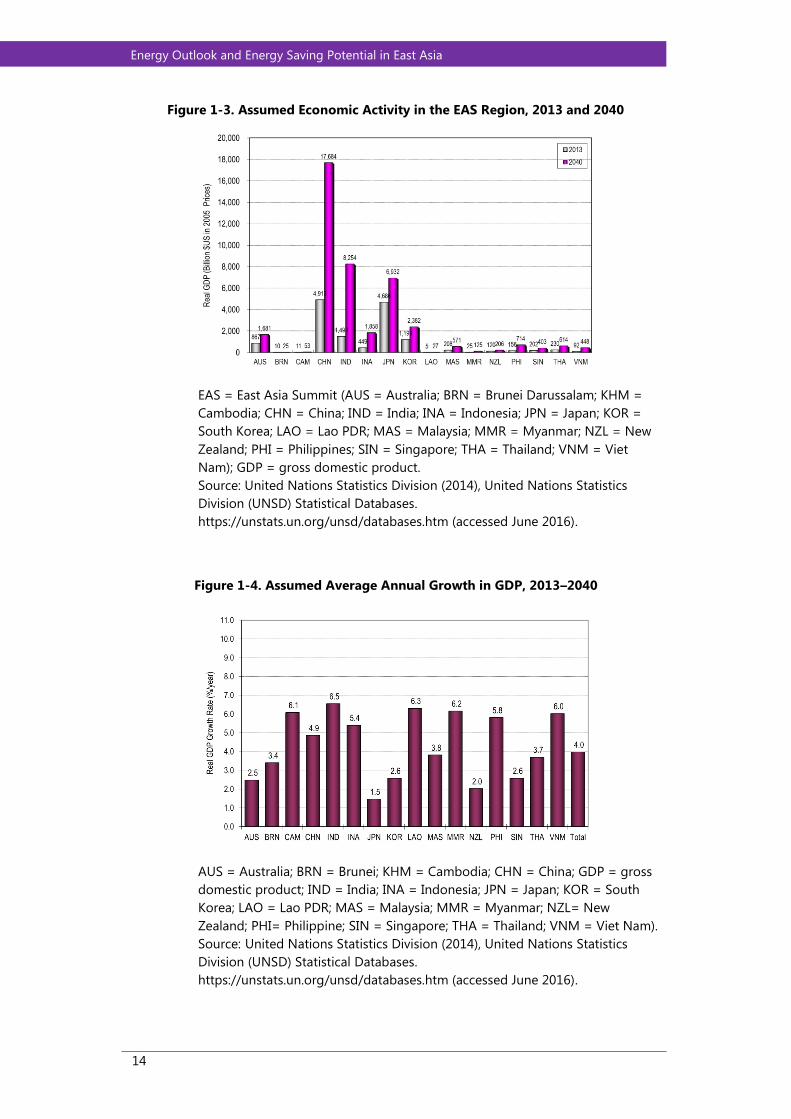
In 2013, total GDP in the EAS region was about 14.7 trillion in 2005 US$ and it
accounted for about 26 percent of global GDP. The GDP of the EAS region is
assumed to grow at an average annual rate of about 4 percent from 2013 to
2040. This implies that by 2040, total GDP of the EAS region will reach about 42
trillion in 2005 US$.
China is projected to be the largest economy in terms of real GDP of about 17.6
trillion by 2040. India and Japan are projected to be the next largest economies
with projected GDPs of about 8.2 trillion 2005 US$ and 6.9 trillion 2005 US$,
respectively in 2040 (Figure 1-3).
As shown in Figure 1-4, long-term economic growth rates are assumed to be quite
high in the developing countries, with the highest growth rates in India, Lao PDR,
Myanmar, Cambodia, Viet Nam, and the Philippines. Economic growth in other
developing countries is also assumed to be relatively rapid. Due to the large size
of their economies, the rapid growth in China, India, and Indonesia is likely to be
especially significant for energy demand. Countries with more mature economies
– Australia, Singapore, Brunei, Japan, Korea, and New Zealand – are assumed to
experience slower, but still significant, economic growth.
14
Energy Outlook and Energy Saving Potential in East Asia
Figure 1-3. Assumed Economic Activity in the EAS Region, 2013 and 2040
EAS = East Asia Summit (AUS = Australia; BRN = Brunei Darussalam; KHM =
Cambodia; CHN = China; IND = India; INA = Indonesia; JPN = Japan; KOR =
South Korea; LAO = Lao PDR; MAS = Malaysia; MMR = Myanmar; NZL = New
Zealand; PHI = Philippines; SIN = Singapore; THA = Thailand; VNM = Viet
Nam); GDP = gross domestic product.
Source: United Nations Statistics Division (2014), United Nations Statistics
Division (UNSD) Statistical Databases.
https://unstats.un.org/unsd/databases.htm (accessed June 2016).
Figure 1-4. Assumed Average Annual Growth in GDP, 2013–2040
AUS = Australia; BRN = Brunei; KHM = Cambodia; CHN = China; GDP = gross
domestic product; IND = India; INA = Indonesia; JPN = Japan; KOR = South
Korea; LAO = Lao PDR; MAS = Malaysia; MMR = Myanmar; NZL= New
Zealand; PHI= Philippine; SIN = Singapore; THA = Thailand; VNM = Viet Nam).
Source: United Nations Statistics Division (2014), United Nations Statistics
Division (UNSD) Statistical Databases.
https://unstats.un.org/unsd/databases.htm (accessed June 2016).

15
Main Report
Average real GDP per capita in the EAS region is assumed to increase from about
US$4,270 in 2013 to about US$10,500 in 2040. However, as shown in Figure 1-5,
there are, and will continue to be, significant differences in GDP per capita. In
2013, per capita GDP ranged from about US$471 in Myanmar to over US$36,000
in Australia, Japan, and Singapore. In 2040, per capita GDP is assumed to range
from about US$1,896 in Myanmar to over US$60,000 in Japan and Singapore.
3.3. Vehicle Ownership
Growth in the transport sector is one of the primary drivers of growth in energy
consumption, and the major driver of oil consumption. In the model used in this
study, energy demand by all forms of transport is modelled. However, road vehicle
ownership is a key exogenous input. Assumed changes in road vehicle ownership
were made for 14 countries, except for Lao PDR and Viet Nam. There is assumed
to be no difference in road vehicle ownership between the BAU and APS.
Figure 1-5. Real GDP per Capita, 2013 and 2040
AUS = Australia; BRN = Brunei Darussalam; KHM= Cambodia; CHN = China; IND =
India; GDP = gross domestic product; INA = Indonesia; JPN = Japan; KOR = South
Korea; LAO = Lao PDR; MAS = Malaysia; MMR = Myanmar; NZL = New Zealand; PHI
= Philippines; SIN = Singapore; THA = Thailand; VNM = Viet Nam.
Source: United Nations Statistics Division (2014), United Nations Statistics Division
(UNSD) Statistical Databases. https://unstats.un.org/unsd/databases.htm (accessed
November 2014).

16
Energy Outlook and Energy Saving Potential in East Asia
Strong population and economic growth is projected to drive significant
increases in demand for transport services in the EAS region. By 2040, the number
of road vehicles in EAS is projected to increase to about 808.9 million, increasing
almost threefold from 2013. However, rail is expected to meet an increasing share
of total transport demand due to repaid acceleration of rail transportation
connectivity in the ASEAN region.
Average per capita vehicle ownership in the EAS region is projected to increase
from 0.081 to 0.202 from 2013 to 2040. However, vehicle ownership on a per
capita basis is projected to vary significantly among countries.
3.4. Electricity Generation
3.4.1. Electricity generation thermal efficiency
The thermal efficiency of electricity generation reflects the amount of fuel
required to generate a unit of electricity. Thermal efficiency was another
exogenous assumption used in this study. Base year 2013 thermal efficiencies by
fuel type (coal, gas, and oil) were derived from International Energy Agency data
(IEA, 2011). Thermal efficiencies by fuel (coal, gas, and oil) were projected by the
following countries: Australia, Brunei Darussalam, Indonesia, Japan, Malaysia,
Philippines, Singapore, Thailand, and Viet Nam, and growth rates in thermal
efficiency were derived from these projections. For the remaining countries,
assumptions about the potential changes in thermal efficiency were based on the
IEEJ’s Asia/World Energy Outlook 2014.
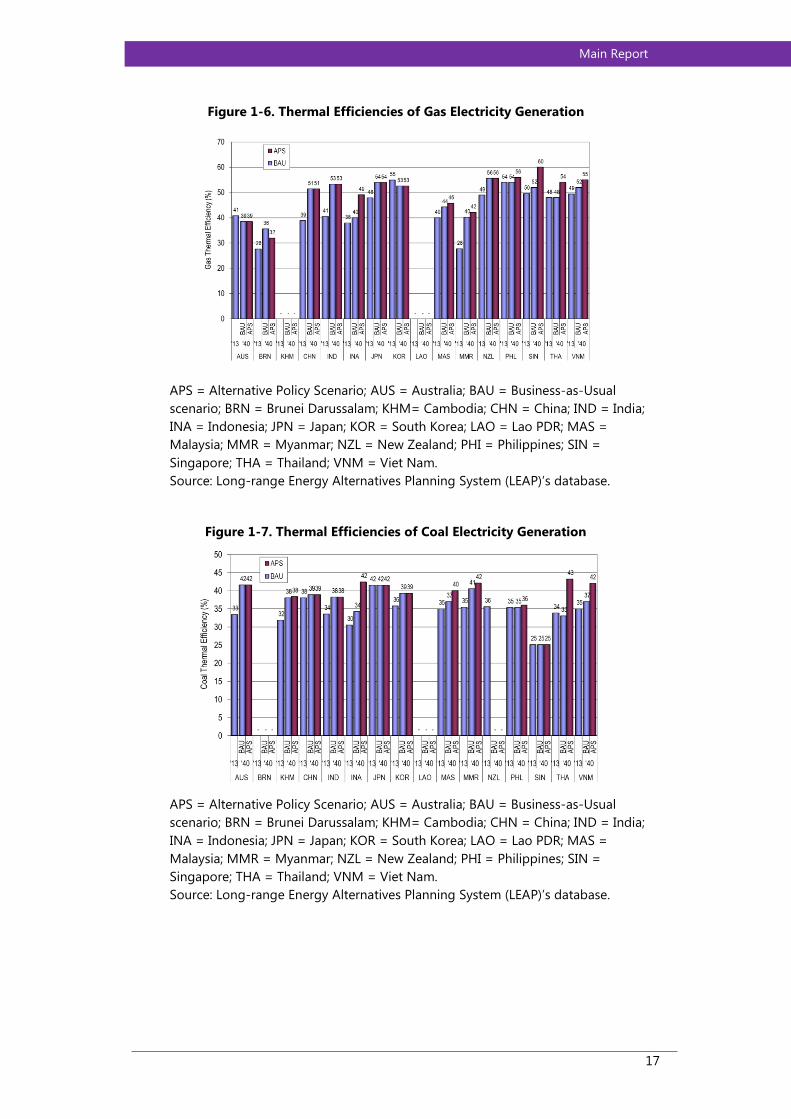
Thermal efficiencies may differ significantly between countries due to differences
in technological availability, age, cost of technology, temperatures, and the cost
and availability of fuel inputs. Thermal efficiency in the EAS countries is expected
to improve considerably over time in the BAU as more advanced generation
technologies such as natural gas combined cycle and supercritical coal-fired
power plants become available. In many countries, there are also assumed to be
additional improvements in the APS (see Figures 1-6 and 1-7).
17
Main Report
Figure 1-6. Thermal Efficiencies of Gas Electricity Generation
APS = Alternative Policy Scenario; AUS = Australia; BAU = Business-as-Usual
scenario; BRN = Brunei Darussalam; KHM= Cambodia; CHN = China; IND = India;
INA = Indonesia; JPN = Japan; KOR = South Korea; LAO = Lao PDR; MAS =
Malaysia; MMR = Myanmar; NZL = New Zealand; PHI = Philippines; SIN =
Singapore; THA = Thailand; VNM = Viet Nam.
Source: Long-range Energy Alternatives Planning System (LEAP)’s database.
Figure 1-7. Thermal Efficiencies of Coal Electricity Generation
APS = Alternative Policy Scenario; AUS = Australia; BAU = Business-as-Usual
scenario; BRN = Brunei Darussalam; KHM= Cambodia; CHN = China; IND = India;
INA = Indonesia; JPN = Japan; KOR = South Korea; LAO = Lao PDR; MAS =
Malaysia; MMR = Myanmar; NZL = New Zealand; PHI = Philippines; SIN =
Singapore; THA = Thailand; VNM = Viet Nam.
Source: Long-range Energy Alternatives Planning System (LEAP)’s database.

18
Energy Outlook and Energy Saving Potential in East Asia
3.4.2. Electricity generation fuel mix
The combination of fuels used in electricity generation differs among countries,
reflecting both historical and current conditions, including access to and cost of
resources and technology. It was, therefore, an exogenous input to the model. It
is an important input, not only because it is a key driver of demand for primary
fuels, but also because the fuel mix used can have important implications for GhG
emissions. The projected electricity generation mix is shown in Figure 1-8.
Figure 1-8. Share of Fuel Type in the Electricity Generation Mix in the EAS Region
EAS = East Asia Summit; BAU = Business-as-Usual scenario; APS = Alternative Policy
Scenario(s).
(AUS=Australia; BRN=Brunei; KHM= Cambodia; CHN= China; IND= India; INA=
Indonesia; JPN= Japan; KOR= South Korea; LAO= Lao PDR; MAS= Malaysia; MMR=
Myanmar; NZL= New Zealand; PHI= Philippine; SIN= Singapore; THA= Thailand; VNM=
Viet Nam).
Source: Country Energy Saving Potential Report – sub-report of this main report, 2016.
Coal is projected to remain the dominant source of electricity generation in the
EAS region as a whole in both the BAU and APS. However, the share of coal in
electricity generation in the EAS region is projected to decline from about 58.4
percent in the BAU to about 44.6 percent in the APS by 2040, as countries are
assumed to implement policies designed to reduce the emissions intensity of
electricity generation. In the APS, the share of lower emission fuels such as hydro,
nuclear, and non-hydro renewable energy are expected to be higher than in the

19
Main Report
BAU on average in the EAS region. The use of oil in electricity generation is
assumed to decline to almost negligible levels across the EAS region as a whole.
3.4.3. Access to electricity
Currently, many households in developing countries lack access to electricity, and
resolving this problem is a major development goal. At the Working Group
meetings, a number of the developing countries reported on initiatives to
significantly expand access to electricity in their countries by 2040. Although this
increasing access to electricity is another one of the drivers of increasing energy
demand in the EAS region, it was not explicitly represented in the model used for
this study. Nevertheless, the impact of increasing access to electricity on
electricity demand should be largely reflected through the increased demand for
electricity as a result of the relatively rapid GDP growth that is assumed to be
experienced in these same countries.
Table 1-3 shows electricity access in ASEAN and the East Asia region. It also
informed the progress of access to electricity in urban versus rural area from 1990
to 2012. Whereas tremendous progress of almost 100 percent of energy access
has been observed in Malaysia, Singapore, Thailand, Viet Nam, China, Korea,
Japan, Australia, and New Zealand, some countries in the Southeast Asia have
struggled to improve energy access for their population.
3.5. Use of Biofuels
The Working Group members from each country were asked to include
information regarding the potential use of biofuels in the BAU and APS. Some,
but not all, countries in the EAS region have plans to increase the contribution of
biofuels in the transport fuel mix to enhance energy security or meet other policy
objectives. For China and Japan, the assumptions on the use of biofuels were
based on the IEEJ Asia/World Energy Outlook 2014. Table 1-4 summarises the
assumptions regarding use of biofuels.

20
Energy Outlook and Energy Saving Potential in East Asia
Table 1-3. Access to Electricity
1990 2000 2012
Rural Urban National Rural Urban National Rural Urban National
Cambodia 5.0 36.6 19.2 9.0 49.9 16.6 18.8 91.3 31.1
Myanmar . . . . . . . . 32*
Lao PDR 39.7 100.0 51.5 40.0 68.7 46.3 54.8 97.9 70.0
Brunei
Darussalam 56.4 70.5 65.7 61.2 72.7 69.4 67.1 79.0 76.2
India 38.7 86.5 50.9 48.4 98.6 62.3 69.7 98.2 78.7
Indonesia . . 66.9 . . . . . 74**
Viet Nam 84.5 100.0 87.9 86.6 96.9 89.1 97.7 100.0 99.0
Philippines 46.4 85.5 65.4 51.9 92.3 71.3 81.5 93.7 87.5
Malaysia 89.2 97.3 93.2 93.0 98.5 96.4 100.0 100.0 100.0
Singapore 99.0 100.0 100.0 99.0 100.0 100.0 99.0 100.0 100.0
Thailand 82.0 75.2 80.0 87.0 72.6 82.5 99.8 100.0 100.0
Australia 100.0 100.0 100.0 100.0 100.0 100.0 100.0 100.0 100.0
China 92.0 100.0 94.2 95.3 100.0 98.0 100.0 100.0 100.0
Korea, Rep.
of 92.0 95.0 94.2 95.3 98.7 98.0 100.0 100.0 100.0
Japan 100.0 100.0 100.0 100.0 100.0 100.0 100.0 100.0 100.0
New
Zealand 100.0 100.0 100.0 100.0 100.0 100.0 100.0 100.0 100.0
* The number was taken from the presentation of Khin Seint Wint (2014), Renewable
Energy Association of Myanmar.
** The number was taken from ASEAN Guideline on Off-grid Rural Electrification
Approaches, ASEAN Center for Energy (ACE, 2013).
Source: World Development Indicators, 2014.

21
Main Report
Table 1-4. Assumptions on Biofuels – Summary by Country
Country Period Assumptions
Australia No targets on biofuels
Brunei
Darussalam
No targets on biofuels
Cambodia No targets on biofuels
China 2030 BAU: 20 billion litres ; APS: 60 billion litres
India 2017 20 percent blending of biofuels, both for
bio-diesel and bio-ethanol
Indonesia 2025 Bioethanol: 15 percent blend from 3–7
percent in 2010
Bio-diesel: 20 percent blend from 1–5
percent in 2010
Japan 2005–2030 No biofuel targets submitted
Republic of
Korea
2012
2020
2030
Replace 1.4 percent of diesel with biodiesel
Replace 6.7 percent of diesel with biodiesel
Replace 11.4 percent of diesel with
biodiesel
Lao PDR 2030 Utilise biofuels equivalent to 10 percent of
road transport fuels
Malaysia 2030 Replace 5 percent of diesel in road
transport with biodiesel
Myanmar 2020 Replace 8 percent of transport diesel with
biodiesel
New Zealand 2012–2030 Mandatory biofuels sales obligation of 3.4
percent by 2012
Philippines 2025–2035 BAU: The Biofuels Law requires 10 percent
bio-ethanol/gasoline blend and 2 percent
biodiesel/diesel blend 2 years from
enactment of the law (roughly 2009)
APS: Displace 20 percent of diesel and
gasoline with biofuels by 2025
Thailand Biofuels to displace 12.2 percent of transport energy
demand
Viet Nam 2020 10 percent ethanol blend in gasoline for road
transport
BAU = Business-as-Usual scenario; APS = Alternative Policy Scenario.
Source: Country Energy Saving Potential Report – sub-report of this main report, 2016.
22
Energy Outlook and Energy Saving Potential in East Asia
The largest increases in consumption of biofuels in the APS are expected in India
and China. In all countries, biofuels are expected to meet only a small portion of
the transport fuel demand by 2040.
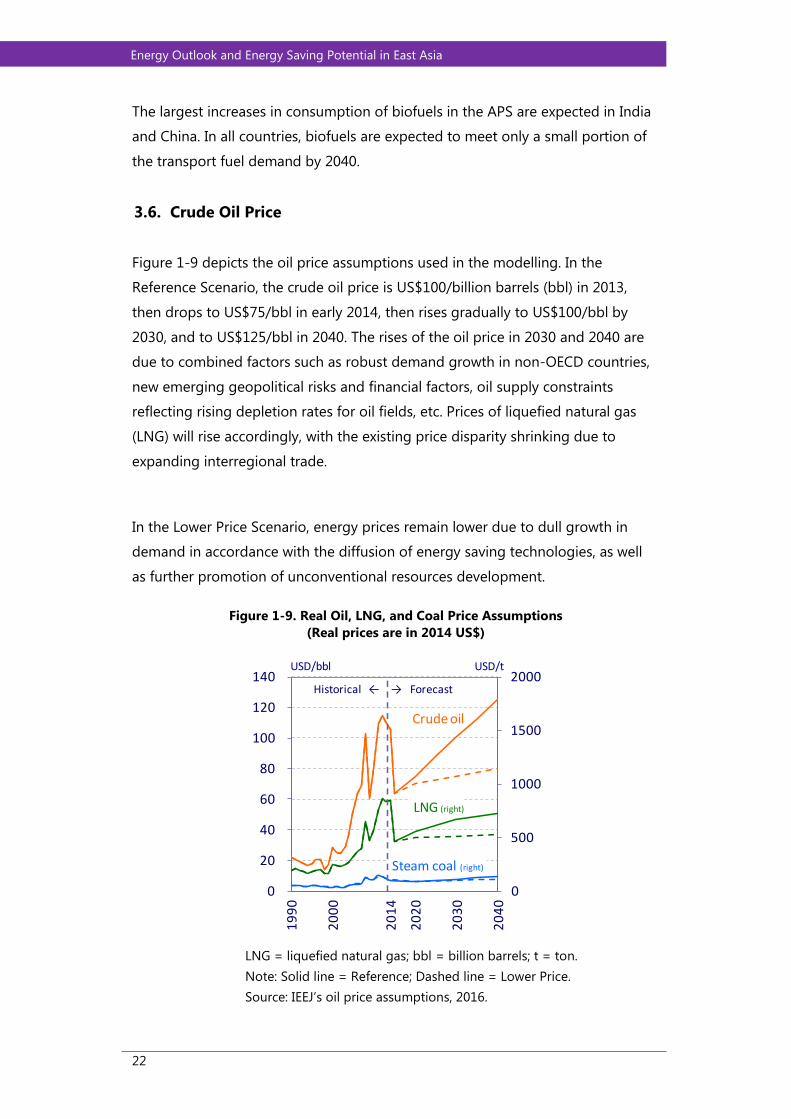
3.6. Crude Oil Price
Figure 1-9 depicts the oil price assumptions used in the modelling. In the
Reference Scenario, the crude oil price is US$100/billion barrels (bbl) in 2013,
then drops to US$75/bbl in early 2014, then rises gradually to US$100/bbl by
2030, and to US$125/bbl in 2040. The rises of the oil price in 2030 and 2040 are
due to combined factors such as robust demand growth in non-OECD countries,
new emerging geopolitical risks and financial factors, oil supply constraints
reflecting rising depletion rates for oil fields, etc. Prices of liquefied natural gas
(LNG) will rise accordingly, with the existing price disparity shrinking due to
expanding interregional trade.
In the Lower Price Scenario, energy prices remain lower due to dull growth in
demand in accordance with the diffusion of energy saving technologies, as well
as further promotion of unconventional resources development.
Figure 1-9. Real Oil, LNG, and Coal Price Assumptions
(Real prices are in 2014 US$)
LNG = liquefied natural gas; bbl = billion barrels; t = ton.
Note: Solid line = Reference; Dashed line = Lower Price.
Source: IEEJ’s oil price assumptions, 2016.
0
500
1000
1500
2000
0
20
40
60
80
100
120
140
19
90
20
00
20
14
20
20
20
30
20
40
LNG (right)
Crude oil
Steam coal (right)
USD/t
Historical ← → Forecast
USD/bbl

23
Main Report
3.7. Assumption of Fossil Fuel Production Outlook
3.7.1. Analytical method
The fossil fuel production outlook is generated through the Delphi process’
‘expert’s judgment.’ First, a historical data set of production volume is collected
from British Petroleum and IEA statistics. The data is utilised to understand the
transition of production volume in each country. Second, a reference was made
to the IEA World Energy Outlook 2015 and the IEEJ Asia-World Energy Outlook
2015 in order to understand the future direction of changes in production
volume. The estimated fossil fuel outlook also utilises supplementary information
such as the national plans and targets provided by each Working Group member
and the country analyses issued by the EIA (see Figure 1-10 and Table 1-5).
Figure 1-10. Approach of Estimation
IEA = International Energy Agency; BP = British Petroleum; IEEJ = Institute of Energy
Economics, Japan; AWEO = ASIA Energy Outlook; EIA = [US] Energy Information
Administration; WEO = World Economic Outlook.
Source: Working Group of this study, 2016.
Approach
IEA, BP statistic(historical trend)
IEA WEO2015(outlook)
IEEJ AWEO2015(outlook)
National information(supplemental information)
EIA Analysis(supplemental information)
Production outlook

24
Energy Outlook and Energy Saving Potential in East Asia
Table 1-5. Reference Materials and their Estimation
IEA WEO 2015 IEEJ AWEO 2015
Oil ・Employ the New Policies Scenario,
among the Current Policies
Scenario, New Policies Scenario,
450 Scenario, Low Oil Price
Scenario.
・Production increase until 2020 and
decline after that time.
・Employ the Advanced
Technologies Case, among the
Reference Case, Advanced
Technologies Case, Low Oil Price
Case.
・Production is estimated to
decrease in many Asian countries.
Natural gas ・Employ the New Policies Scenario.
・Production steadily increases
towards 2040.
・Employ the Advanced
Technologies Case.
・Production is estimated to
increase in line with IEA WEO
2015.
Coal ・Employ the New Policies Scenario.
・Production increase in major
producing countries, except China
where demand for power
generation and industry sectors are
estimated to decrease.
・Employ the Advanced
Technologies Case.
・Production is estimated to
decrease as demand declines.
IEA = International Energy Agency; WEO = World Energy Outlook; IEEJ = Institute of Energy
Economics, Japan.
Source: Working Group of the study, 2016.
3.7.2. Results of the fossil fuel production outlook
Tables 1-6 and 1-7 present the assumptions of the fossil fuel production outlook.
The results indicate that:
For crude oil, many countries will not be able to maintain recent production
levels except in some cases such as Australia and Philippines where the oil
production amount surpasses that of 2014. In most countries, oil reserves
are estimated to be depleted in the future, an estimate based on the size of
a country’s oil reservoir (ERIA, 2015). Although some countries have
untapped oil resources, their size seems too small to maintain current
production amounts. In addition, insufficient investment in exploring new
fields will hamper increasing production amounts. Furthermore, some fields
may be too costly to exploit due to their geographical condition, such as
deep sea and mountainous areas.

25
Main Report
For natural gas, production is estimated to increase in almost all gas-
producing countries. On the whole, the region is relatively rich in natural
gas resources compared with oil, and therefore many countries are
promoting indigenous natural gas production. In particular, Australia and
China, both richly endowed with conventional and unconventional gas
resources, are expected to increase production, with Australia aiming to
export and China for domestic supply. Some countries, such as Viet Nam,
put natural gas at the centre of their energy mix, so they are boosting
production activities.
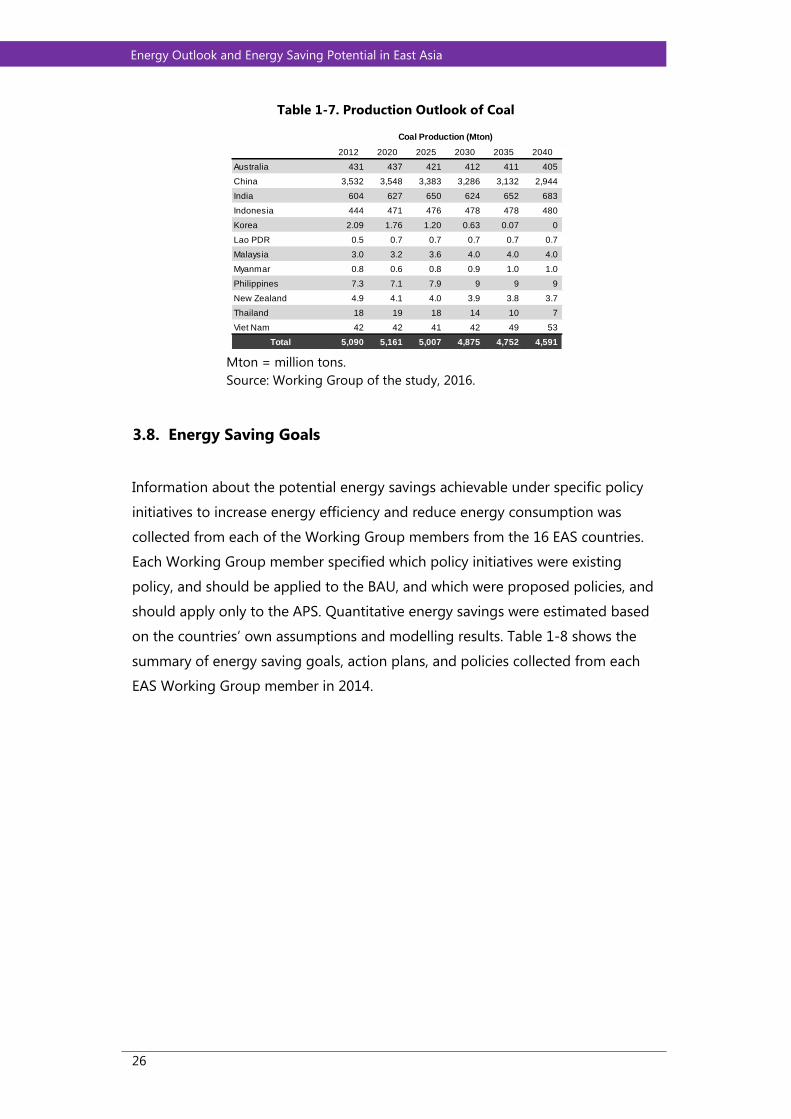
Coal (thermal + coking) production is estimated to decrease in China, the
major coal-producing country, whereas India, the second largest coal
consumer, will increase production. Their energy policies are different.
China has changed its policy to pursue cleaner energy use, so it intends to
curb coal consumption, whereas India’s priority is to ensure energy supply
at an affordable price, so it plans to increase domestically available cheap
energy sources such as coal. Australia, a major coal exporter, is estimated
to decrease production as global coal demand declines due to its gradual
shift to a low-carbon society. Another major exporter, Indonesia, will
increase production to meet its own consumption.
Table 1-6. Production Outlook of Oil and Gas
b/d = barrel/day; Bcm = billion cubic metre.
Source: Working Group of the study, 2016.
2014 2020 2025 2030 2035 2040 2014 2020 2025 2030 2035 2040
Australia 448 600 650 650 600 600 58.8 133.0 144.5 165.5 175.5 174.0
Brunei 138 140 130 130 120 120 11.9 12.5 12.5 12.5 12.5 12.5
China 4,341 4,300 4,250 4,200 4,100 4,000 134.5 172.0 212.0 255.0 299.0 342.0
India 895 740 680 680 700 720 31.7 38.0 45.0 55.0 69.0 89.0
Indonesia 852 830 820 800 780 770 73.4 80.0 82.0 83.0 84.0 85.0
Japan 17 15 15 15 15 15 3.9 3.5 3.0 3.0 3.0 2.5
Korea 20 15 15 15 15 15 0.5 0.5 0.5 0.5 0.5 0.5
Malaysia 666 650 620 600 600 600 66.4 68.0 70.0 67.0 65.0 65.0
Myanmar 20 20 20 20 20 20 16.8 17.5 18.5 18.5 18.5 18.5
Philippines 24 39 35 30 30 30 3.4 3.0 4.0 7.0 7.0 8.0
New Zealand 47 27 10 3 1 1 5.4 4.0 3.0 2.0 1.0 1.0
Thailand 453 480 470 460 450 440 42.1 42.0 41.0 40.0 40.0 40.0
Vietnam 365 360 350 330 320 320 11.1 11.0 15.0 18.0 22.0 25.0
Other Asia Pacific 144 150 140 130 130 130 73.7 77.0 76.0 75.0 74.0 74.0
Total Asia Pacific 8,430 8,366 8,205 8,063 7,881 7,781 533.6 662.0 727.0 802.0 871.0 937.0
Oil Production (1000b/d) Gas Production (Bcm)
26
Energy Outlook and Energy Saving Potential in East Asia
Table 1-7. Production Outlook of Coal
Mton = million tons.
Source: Working Group of the study, 2016.
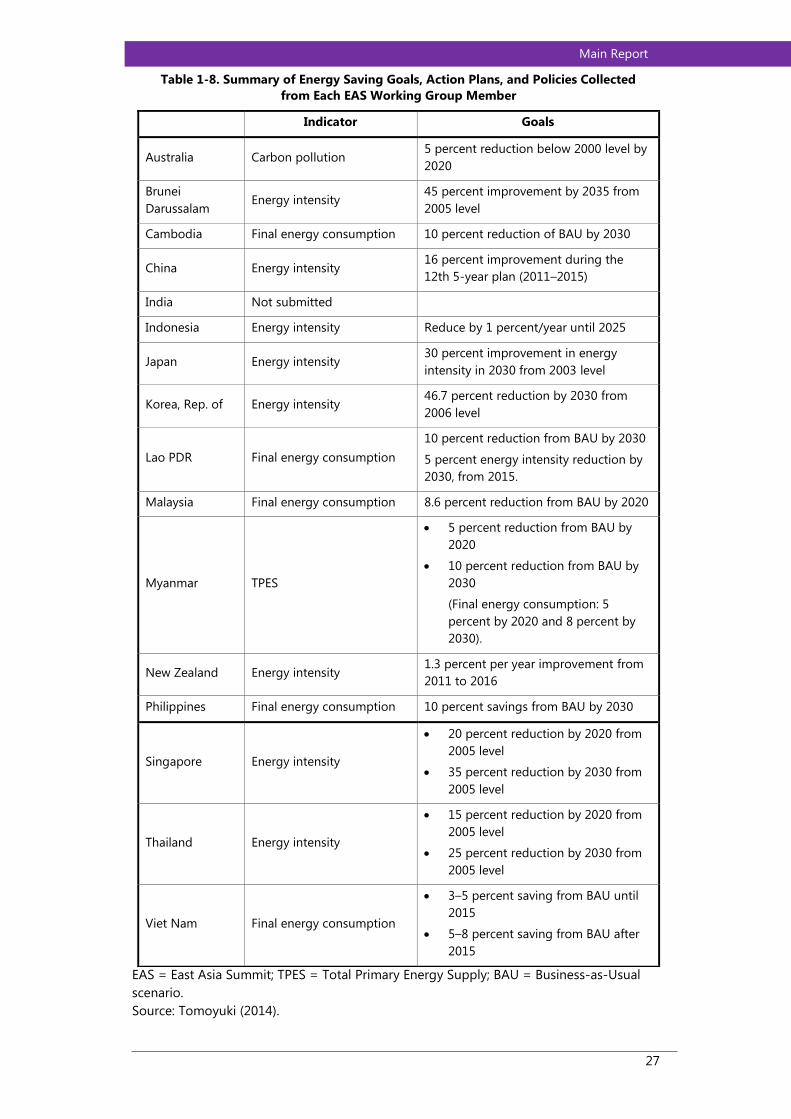
3.8. Energy Saving Goals
Information about the potential energy savings achievable under specific policy
initiatives to increase energy efficiency and reduce energy consumption was
collected from each of the Working Group members from the 16 EAS countries.
Each Working Group member specified which policy initiatives were existing
policy, and should be applied to the BAU, and which were proposed policies, and
should apply only to the APS. Quantitative energy savings were estimated based
on the countries’ own assumptions and modelling results. Table 1-8 shows the
summary of energy saving goals, action plans, and policies collected from each
EAS Working Group member in 2014.
2012 2020 2025 2030 2035 2040
Australia 431 437 421 412 411 405
China 3,532 3,548 3,383 3,286 3,132 2,944
India 604 627 650 624 652 683
Indonesia 444 471 476 478 478 480
Korea 2.09 1.76 1.20 0.63 0.07 0
Lao PDR 0.5 0.7 0.7 0.7 0.7 0.7
Malaysia 3.0 3.2 3.6 4.0 4.0 4.0
Myanmar 0.8 0.6 0.8 0.9 1.0 1.0
Philippines 7.3 7.1 7.9 9 9 9
New Zealand 4.9 4.1 4.0 3.9 3.8 3.7
Thailand 18 19 18 14 10 7
Viet Nam 42 42 41 42 49 53
Total 5,090 5,161 5,007 4,875 4,752 4,591
Coal Production (Mton)
27
Main Report
EAS = East Asia Summit; TPES = Total Primary Energy Supply; BAU = Business-as-Usual
scenario.
Source: Tomoyuki (2014).
Table 1-8. Summary of Energy Saving Goals, Action Plans, and Policies Collected
from Each EAS Working Group Member
Indicator Goals
Australia Carbon pollution 5 percent reduction below 2000 level by
2020
Brunei
Darussalam Energy intensity
45 percent improvement by 2035 from
2005 level
Cambodia Final energy consumption 10 percent reduction of BAU by 2030
China Energy intensity 16 percent improvement during the
12th 5-year plan (2011–2015)
India Not submitted
Indonesia Energy intensity Reduce by 1 percent/year until 2025
Japan Energy intensity 30 percent improvement in energy
intensity in 2030 from 2003 level
Korea, Rep. of Energy intensity 46.7 percent reduction by 2030 from
2006 level
Lao PDR Final energy consumption
10 percent reduction from BAU by 2030
5 percent energy intensity reduction by
2030, from 2015.
Malaysia Final energy consumption 8.6 percent reduction from BAU by 2020
Myanmar TPES
5 percent reduction from BAU by
2020
10 percent reduction from BAU by
2030
(Final energy consumption: 5
percent by 2020 and 8 percent by
2030).
New Zealand Energy intensity 1.3 percent per year improvement from
2011 to 2016
Philippines Final energy consumption 10 percent savings from BAU by 2030
Singapore Energy intensity
20 percent reduction by 2020 from
2005 level
35 percent reduction by 2030 from
2005 level
Thailand Energy intensity
15 percent reduction by 2020 from
2005 level
25 percent reduction by 2030 from
2005 level
Viet Nam Final energy consumption
3–5 percent saving from BAU until
2015
5–8 percent saving from BAU after
2015

28
Energy Outlook and Energy Saving Potential in East Asia
3.8. Economic Growth and Climate Change Mitigation
Economic growth in the EAS countries is needed to provide for the region’s
growing population and improving living standards. Economic growth is assumed
to exceed population growth from 2013 to 2040. This relatively strong economic
growth and rising per capita incomes in the EAS countries could mean significant
reductions in poverty and significant increases in living standards for hundreds of
millions of people.
With economic growth will come increasing access to, and demand for, electricity
and rising levels of vehicle ownership. The continued reliance on fossil fuels to
meet the increases in energy demand may be associated with increased GhG
emissions and climate change challenges unless low emission technologies are
used. Even if fossil fuel resources are sufficient, much of the fuel is likely to be
imported from other regions, and no assurance can be given that they will be
secure or affordable.
Fossil fuel consumption using today’s technologies will lead to considerable
increases in GhG emissions, potentially creating new longer-term threats to the
region’s living standards and economic vitality. Growing adverse health impacts
throughout the region are also likely as a result of particulate emissions.
Given this, considerable improvements in energy efficiency and greater uptake of
cleaner energy technologies and renewable energy are required to address a
range of energy, environmental, and economic challenges. Yet, efforts to limit
energy consumption and GhG will be very challenging given such strong growth.
However, as will be discussed in Section 4.3, sharp reductions in GhG are being
called for by scientists. This huge ‘headwind’ working against EEC and emission
reductions poses a challenge to the EAS region that needs to be addressed.

29
Main Report
4. Energy and Environmental Outlook for the EAS Region
4.1. Business-as-Usual Scenario
4.1.1. Final energy consumption
Between 2013 and 2040, total final energy consumption3 in the 16 EAS countries
is projected to grow at an average annual rate of 2.3 percent, reflecting the
assumed 4.0 percent annual GDP growth and 0.6 percent population growth.
Final energy consumption is projected to increase from 3,347 million tons of oil
equivalent (Mtoe) in 2013 to 6,129 Mtoe in 2040. By sector, transport energy
demand is projected to grow most rapidly, increasing by 3.3 percent per year, as
a result of motorisation driven by increasing disposable income as EAS
economies grow. Demand in the commercial and residential (‘Others’) sectors will
grow 1.9 percent per year, slower than that of the industry sector. Energy demand
in the industry sector is projected to grow at an average annual rate of 2.1
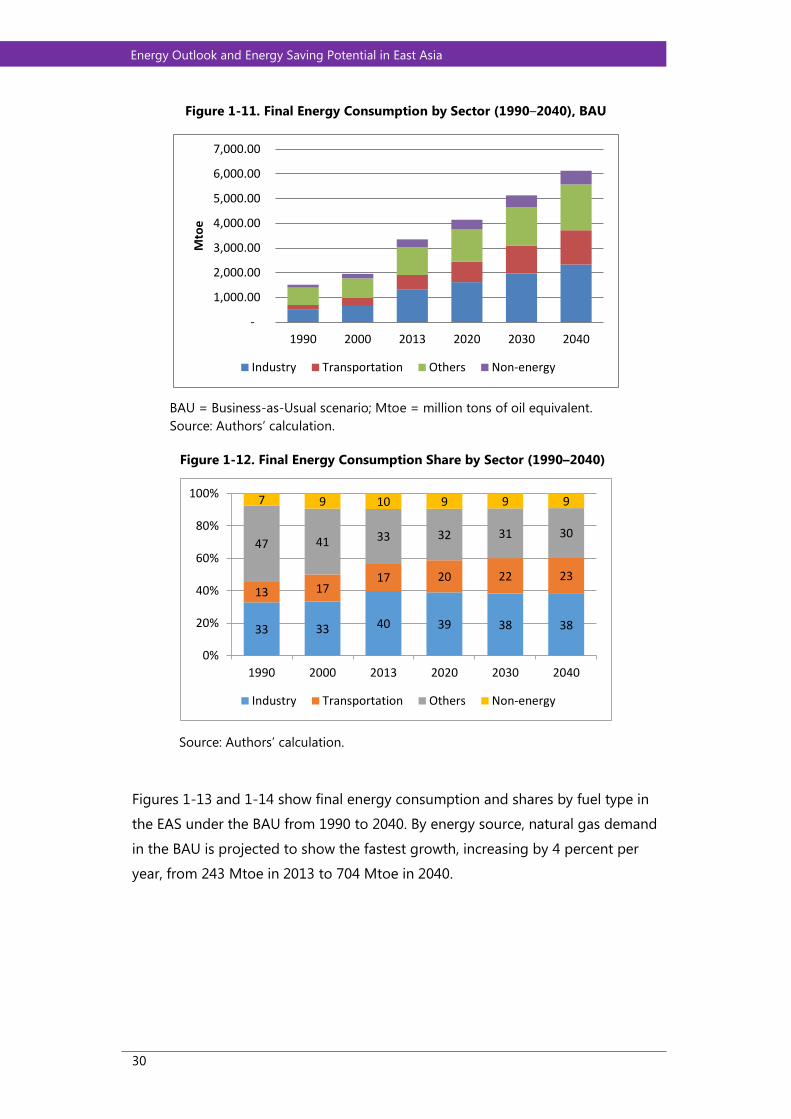
percent. Figure 1-11 shows final energy consumption by sector under BAU in EAS,
from 1990 to 2040.
The shares of final energy consumption by sector in 2013–2040 indicate that the
transport sector is projected to have an increasing share, growing from 17.2
percent to 22.6 percent in 2013–2040. The industrial and other (largely residential
and commercial) sectors are projected to have decreasing shares – 39.8 percent
to 38.0 percent for industry, and 33.4 percent to 30.3 percent for ‘Others’ – from
2013 to 2040. The share of non-energy demand is also projected to have a
decreasing share, from 19.6 percent to 9.1 percent, during 2013–2040. Details of
sectoral shares in final energy consumption are shown in Figure 1-12.
3 Refers to energy in the form in which it is actually consumed, i.e. including electricity, but not
including the fuels and/or energy sources used to generate electricity.
30
Energy Outlook and Energy Saving Potential in East Asia
Figure 1-11. Final Energy Consumption by Sector (1990–2040), BAU
BAU = Business-as-Usual scenario; Mtoe = million tons of oil equivalent.
Source: Authors’ calculation.
Figure 1-12. Final Energy Consumption Share by Sector (1990–2040)
Source: Authors’ calculation.
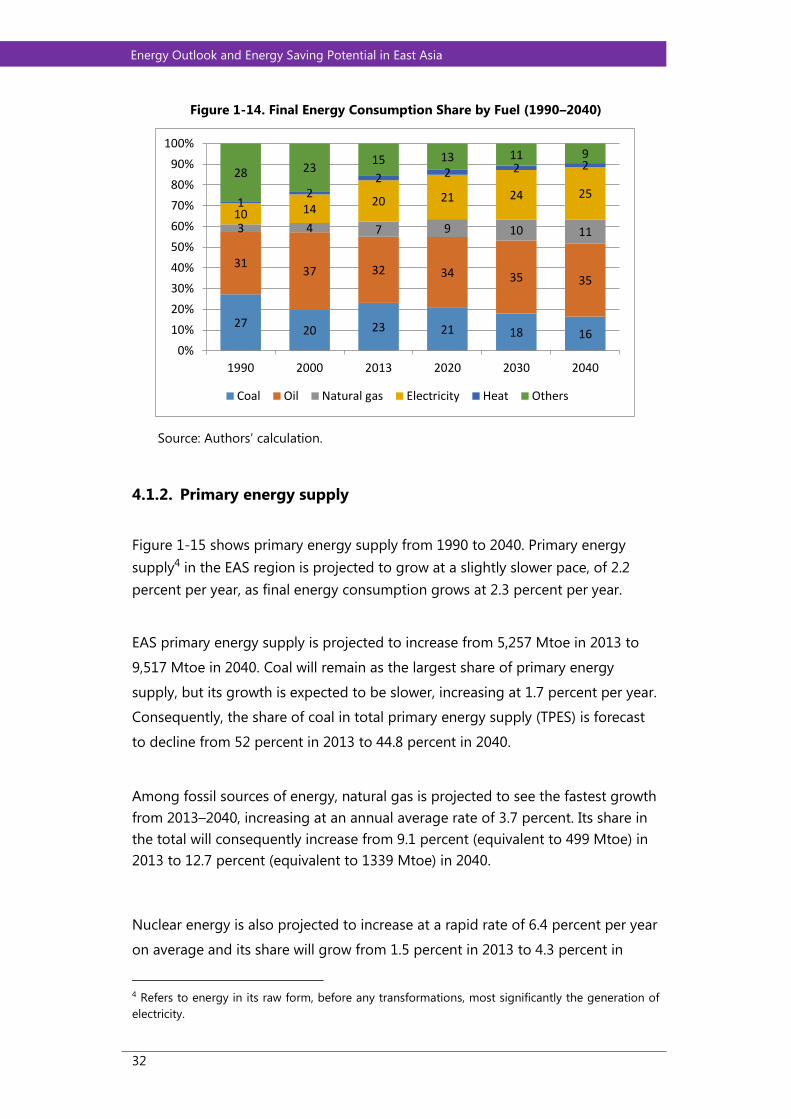
Figures 1-13 and 1-14 show final energy consumption and shares by fuel type in
the EAS under the BAU from 1990 to 2040. By energy source, natural gas demand
in the BAU is projected to show the fastest growth, increasing by 4 percent per
year, from 243 Mtoe in 2013 to 704 Mtoe in 2040.
-
1,000.00
2,000.00
3,000.00
4,000.00
5,000.00
6,000.00
7,000.00
1990 2000 2013 2020 2030 2040
Mto
e
Industry Transportation Others Non-energy
33 33 40 39 38 38
13 1717 20 22 23
47 41 33 32 31 30
7 9 10 9 9 9
0%
20%
40%
60%
80%
100%
1990 2000 2013 2020 2030 2040
Industry Transportation Others Non-energy

31
Main Report
Although oil will retain the largest share of total final energy consumption, it is
projected to grow at a lower rate of 2.6 percent per year in 2013–2040, reaching
2,164 Mtoe in 2040, compared with the average annual growth of 3.8 percent
over the last 2 decades. However, its share will still increase from 32 percent in
2013 to 35.3 percent in 2040. Demand for electricity will grow at a relatively fast
rate of 3.2 percent per year. Its share will increase from 20 percent in 2012 to 25.4
percent in 2040, surpassing the share of coal. Coal demand will grow at a slower
rate of 1 percent per year on average, reaching 1,010 Mtoe in 2040. Other fuels,
which are mostly solid and liquid biofuels, will have a slow annual growth rate of
0.5 percent on average, but consumption of liquid biofuels will grow rapidly,
reaching 579 Mtoe in 2040. Consequently, the share of other fuels will decline
from 15.3 percent in 2013 to 9.4 percent in 2035. This slow growth is due to the
gradual shift from non-commercial biomass to conventional fuels such as
liquefied petroleum gas (LPG) and electricity in the residential sector.
Figure 1-13. Final Energy Consumption by Fuel (1990–2040)
Mtoe = million tons of oil equivalent.
Source: Authors’ calculation.
-
1,000.00
2,000.00
3,000.00
4,000.00
5,000.00
6,000.00
7,000.00
1990 2000 2013 2020 2030 2040
Mto
e
Coal Oil Natural gas Electricity Heat Others
32
Energy Outlook and Energy Saving Potential in East Asia
Figure 1-14. Final Energy Consumption Share by Fuel (1990–2040)
Source: Authors’ calculation.
4.1.2. Primary energy supply
Figure 1-15 shows primary energy supply from 1990 to 2040. Primary energy
supply4 in the EAS region is projected to grow at a slightly slower pace, of 2.2
percent per year, as final energy consumption grows at 2.3 percent per year.
EAS primary energy supply is projected to increase from 5,257 Mtoe in 2013 to
9,517 Mtoe in 2040. Coal will remain as the largest share of primary energy
supply, but its growth is expected to be slower, increasing at 1.7 percent per year.
Consequently, the share of coal in total primary energy supply (TPES) is forecast
to decline from 52 percent in 2013 to 44.8 percent in 2040.
Among fossil sources of energy, natural gas is projected to see the fastest growth
from 2013–2040, increasing at an annual average rate of 3.7 percent. Its share in
the total will consequently increase from 9.1 percent (equivalent to 499 Mtoe) in
2013 to 12.7 percent (equivalent to 1339 Mtoe) in 2040.
Nuclear energy is also projected to increase at a rapid rate of 6.4 percent per year
on average and its share will grow from 1.5 percent in 2013 to 4.3 percent in
4 Refers to energy in its raw form, before any transformations, most significantly the generation of
electricity.
2720 23 21 18 16
3137 32 34 35 35
3 4 7 9 10 11
10 1420 21 24 25
12
2 2 2 228 23
15 13 11 9
0%
10%
20%
30%
40%
50%
60%
70%
80%
90%
100%
1990 2000 2013 2020 2030 2040
Coal Oil Natural gas Electricity Heat Others

33
Main Report
2040. This is due to the assumed resumption of nuclear power generation in
Japan, the expansion of nuclear power generation capacity in China and India,
and the introduction of this energy source in Viet Nam.
Figure 1-15. Primary Energy Supply in EAS (1990–2040)
Mtoe = million tons of oil equivalent.
Source: Authors’ calculation.
Figure 1-16. Share of Primary Energy Mix by Sources in EAS (1990–2040)
EAS = East Asia Summit.
Source: Authors’ calculation.
-
1,000.00
2,000.00
3,000.00
4,000.00
5,000.00
6,000.00
7,000.00
8,000.00
9,000.00
10,000.00
1990 2000 2013 2020 2030 2040
Mto
e
Coal Oil Natural gas Nuclear Hydro Geothermal Others
0%
20%
40%
60%
80%
100%
1990 2000 2013 2020 2030 2040
Coal Oil Natural gas
Nuclear Hydro Geothermal
Others Biomass Solar, Wind, Ocean

34
Energy Outlook and Energy Saving Potential in East Asia
Among the energy sources, ‘Others’ – which is made up of solar, wind, and solid
and liquid biofuels – will see the slowest growth rate of 1.4 percent.
Consequently, the share of these other sources of energy will decrease from 11.1
percent in 2013 to 8.9 percent in 2040. Geothermal energy will increase at a rapid
pace of 4.1 percent per year, but its share will remain low and will reach only 1.1
percent in 2040, a slight increase from 0.7 percent in 2013. The growth of hydro
will be 2.0 percent per year and its share will remain low, at around 2.0 percent
from 2013 to 2040. Figure 1-16 shows the shares of each energy source in the
total primary energy mix from 1990 to 2040.
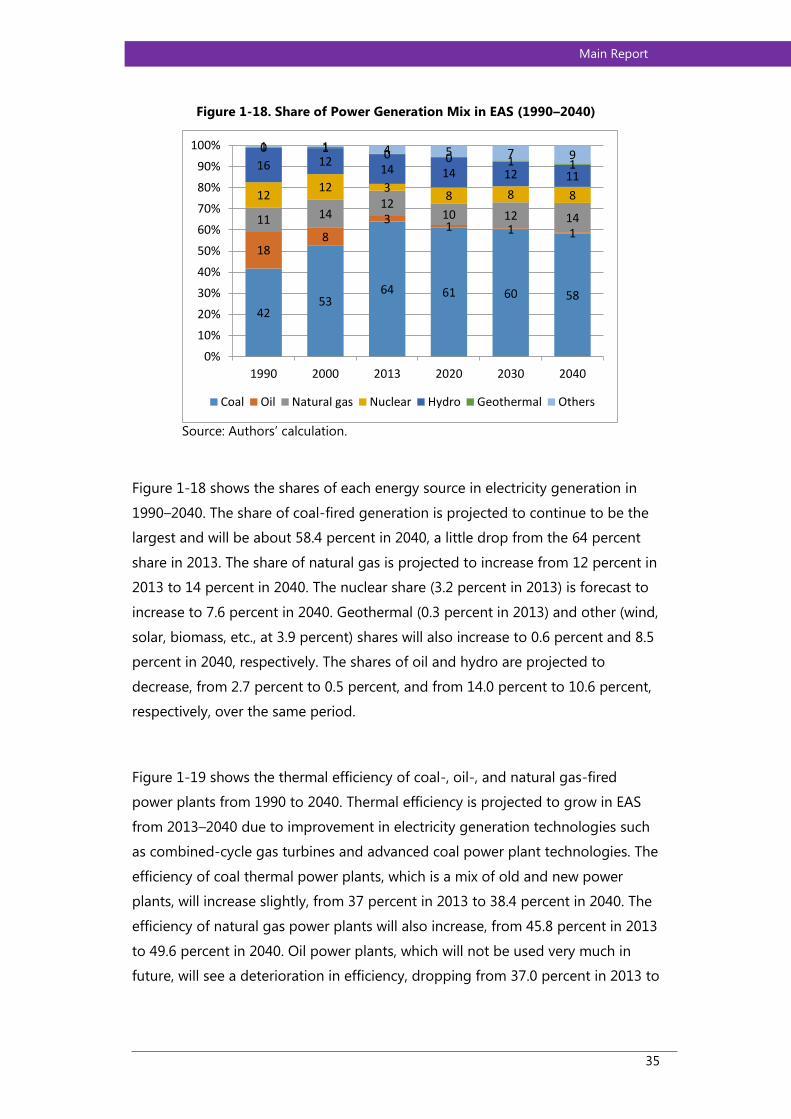
4.1.3. Power generation in EAS
Figure 1-17 shows the power generation output in the EAS region. Total EAS
power generation is projected to grow at 3.1 percent per year on average, from
2013 (equivalent to 9,282 TWh) to 2040 (equivalent to 21,015 TWh). However, the
growth rate from 1990 to 2013 was 6.5 percent, more than twice as high as the
projected growth rate from 2013 to 2040.
Figure 1-17. Power Generation in EAS (1990–2040)
EAS = East Asia Summit; TWh = terawatt-hour.
Source: Authors’ calculation.
-
5,000.00
10,000.00
15,000.00
20,000.00
25,000.00
1990 2000 2013 2020 2030 2040
TWh
Coal Oil Natural gas Nuclear Hydro Geothermal Others
35
Main Report
Figure 1-18. Share of Power Generation Mix in EAS (1990–2040)
Source: Authors’ calculation.
Figure 1-18 shows the shares of each energy source in electricity generation in
1990–2040. The share of coal-fired generation is projected to continue to be the
largest and will be about 58.4 percent in 2040, a little drop from the 64 percent
share in 2013. The share of natural gas is projected to increase from 12 percent in
2013 to 14 percent in 2040. The nuclear share (3.2 percent in 2013) is forecast to
increase to 7.6 percent in 2040. Geothermal (0.3 percent in 2013) and other (wind,
solar, biomass, etc., at 3.9 percent) shares will also increase to 0.6 percent and 8.5
percent in 2040, respectively. The shares of oil and hydro are projected to
decrease, from 2.7 percent to 0.5 percent, and from 14.0 percent to 10.6 percent,
respectively, over the same period.
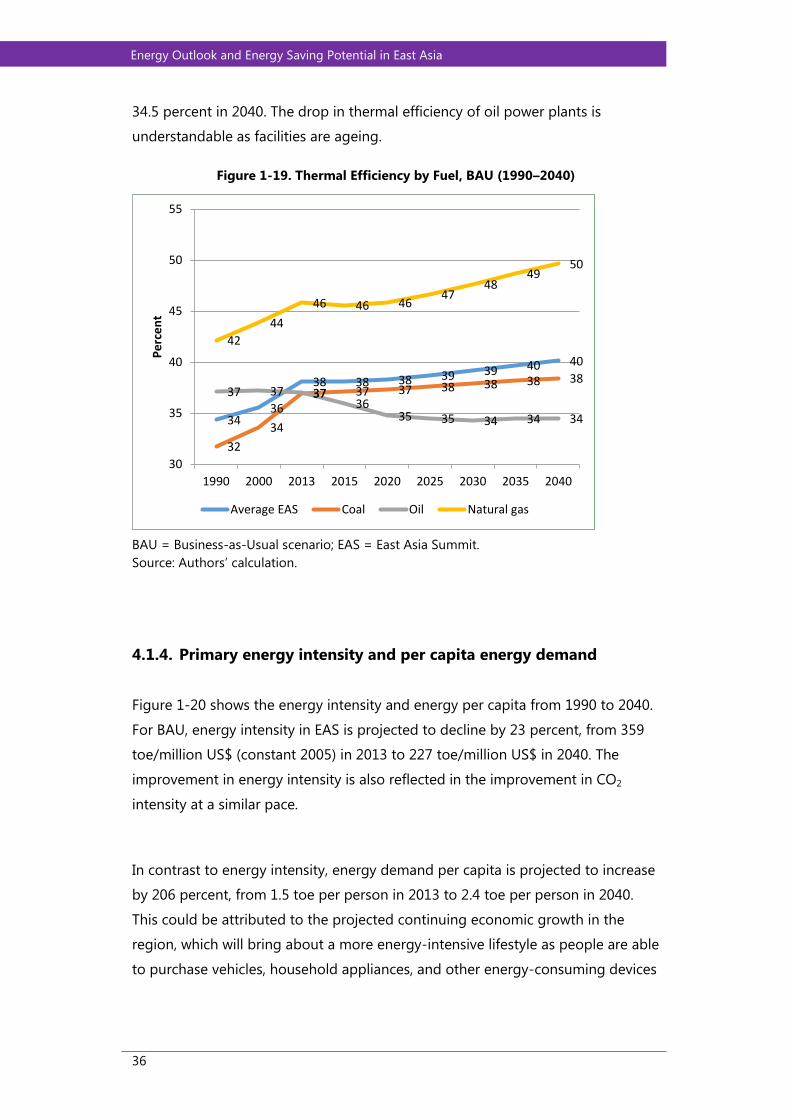
Figure 1-19 shows the thermal efficiency of coal-, oil-, and natural gas-fired
power plants from 1990 to 2040. Thermal efficiency is projected to grow in EAS
from 2013–2040 due to improvement in electricity generation technologies such
as combined-cycle gas turbines and advanced coal power plant technologies. The
efficiency of coal thermal power plants, which is a mix of old and new power
plants, will increase slightly, from 37 percent in 2013 to 38.4 percent in 2040. The
efficiency of natural gas power plants will also increase, from 45.8 percent in 2013
to 49.6 percent in 2040. Oil power plants, which will not be used very much in
future, will see a deterioration in efficiency, dropping from 37.0 percent in 2013 to
4253
64 61 60 58
188
31 1 1
11 1412
10 12 14
1212 3
8 8 8
16 1214 14 12 11
0 1 0 0 1 1
1 1 4 5 7 9
0%
10%
20%
30%
40%
50%
60%
70%
80%
90%
100%
1990 2000 2013 2020 2030 2040
Coal Oil Natural gas Nuclear Hydro Geothermal Others
36
Energy Outlook and Energy Saving Potential in East Asia
34.5 percent in 2040. The drop in thermal efficiency of oil power plants is
understandable as facilities are ageing.
Figure 1-19. Thermal Efficiency by Fuel, BAU (1990–2040)
BAU = Business-as-Usual scenario; EAS = East Asia Summit.
Source: Authors’ calculation.
4.1.4. Primary energy intensity and per capita energy demand
Figure 1-20 shows the energy intensity and energy per capita from 1990 to 2040.
For BAU, energy intensity in EAS is projected to decline by 23 percent, from 359
toe/million US$ (constant 2005) in 2013 to 227 toe/million US$ in 2040. The
improvement in energy intensity is also reflected in the improvement in CO2
intensity at a similar pace.
In contrast to energy intensity, energy demand per capita is projected to increase
by 206 percent, from 1.5 toe per person in 2013 to 2.4 toe per person in 2040.
This could be attributed to the projected continuing economic growth in the
region, which will bring about a more energy-intensive lifestyle as people are able
to purchase vehicles, household appliances, and other energy-consuming devices
3436
38 38 38 39 39 40 40
32
34
37 37 37 38 38 38 3837 37 37
3635 35 34 34 34
42
44
46 46 4647
4849
50
30
35
40
45
50
55
1990 2000 2013 2015 2020 2025 2030 2035 2040
Pe
rce
nt
Average EAS Coal Oil Natural gas

37
Main Report
due to rise in disposable income. As energy demand per capita increases, CO2 per
capita is projected to increase at a similar rate.
Figure 1-20. Energy Indicators in EAS
EAS = East Asia Summit; CO2 = carbon dioxide.
Source: Authors’ calculation.
4.2. Comparison of BAU and APS
4.2.1. Total final energy consumption – BAU vs APS
In the APS case, final energy consumption is projected to rise to 5,349
Mtoe, 779 Mtoe or 12.7 percent lower than in the BAU case in 2040. This is
due to the various energy efficiency plans and programmes, presented in
Section 3 above, on both the supply and demand sides that are to be
implemented by EAS countries. Figure 1-21 shows the evolution of final
energy consumption in 1990–2040 in both BAU and APS.
1990 2000 2013 2020 2030 2040
Energy Intensity 100 98 105 94 79 67
Energy per Capita 100 120 197 227 266 306
CO2 per Energy 100 101 116 113 113 112
CO2 Intensity 100 99 123 107 89 75
CO2 per Capita 100 122 230 257 300 343
050
100150200250300350400
19
90
=10
0

38
Energy Outlook and Energy Saving Potential in East Asia
Figure 1-21. Total Final Energy Consumption, BAU and APS
BAU = Business-as-Usual scenario; APS = Alternative Policy Scenario; Mtoe =
million tons of oil equivalent.
Source: Authors’ calculation.
4.2.2. Final energy consumption by sector – BAU vs APS
Figure 1-22 shows the composition of final energy consumption by sector in both
the BAU and APS. Final energy consumption in most sectors is significantly
reduced in the APS case compared with the BAU case. In percentage terms, the
reduction is largest in the industry sector (13.4 percent), followed by the ‘others’
sector (14.8 percent), the transport sector (13.8 percent); non-energy demand will
not be significantly different from the BAU.
0
2000
4000
6000
8000
10000
12000
BAU APS
1990 2013 2040
Mill
ion
To
ns
of
Oil
Equ
ival
en
t 779.29Mtoe,-12.7
percent

39
Main Report
Figure 1-22. Final Energy Consumption by Sector, BAU vs APS
BAU = Business-as-Usual scenario; APS = Alternative Policy Scenario.
Source: Authors’ calculation.
4.2.3. Primary energy supply by sources – BAU vs APS
Figure 1-23 shows primary energy supply by fuel sources. In the APS case, growth
in final energy consumption for all fuels is lower compared with the BAU case.
The growth rate in final energy consumption of APS is projected to be 1.6 percent
per year on average from 2013 to 2040. This rate is lower than the BAU case in
which the growth rate is projected to be 2.2 percent. In absolute terms, the
largest reduction will be in coal demand, by 1,268 Mtoe or 29.8 percent, from the
BAU’s 4,261 Mtoe to 2,993 Mtoe in the APS. The saving potentials for other fuels
are projected to be 306 Mtoe for oil (equivalent to a 13 percent reduction from
BAU), and 275 Mtoe for gas (equivalent to a 20.6 percent reduction from the
BAU).

40
Energy Outlook and Energy Saving Potential in East Asia
Figure 1-23. Primary Energy Supply by Sources, BAU and APS
BAU = Business-as-Usual scenario; APS = Alternative Policy Scenario.
Source: Authors’ calculation.
4.2.4. Total primary energy supply – BAU vs APS
Figure 1-24 shows TPES in both BAU and APS. The total saving potential in the
TPES is expected to be 1,491 Mtoe, a consumption reduction from 9,518 Mtoe in
BAU to 8,026 Mtoe in APS. This saving potential represents a 15.7 percent
reduction from BAU to APS.
The energy saving potential is brought about by improvements in both the
transformation sector, particularly power generation, and the final energy
consumption sector where efficiencies of household appliances and more
efficient building designs are expected. For the ‘others’ sector, there is an
expected increase of renewable energy in the energy supply, which is projected
to be a 21.4 percent increase from the BAU to APS.

41
Main Report
Figure 1-24. Total Primary Energy Supply – BAU and APS
BAU = Business-as-Usual scenario; APS = Alternative Policy Scenario; Mtoe = million
tons of oil equivalent.
Source: Authors’ calculation.
4.3. CO2 Emissions from Energy Consumption
4.3.1. CO2 emissions
As shown in Figure 1-25, CO2 emissions from energy consumption in the BAU
case are projected to increase from 4,023 million tons of Carbon (Mt–C) in 2013
to 7,010 Mt–C in 2040, implying an average annual growth rate of 2.1 percent.
This is slightly lower than growth in TPES of 2.2 percent per year. In the APS case,
CO2 emissions are projected to be 5,223 Mt–C in 2040, 25.5 percent lower than
under the BAU.
At the Paris climate conference (COP21) in December 2015, 195 countries
adopted the first-ever universal, legally binding global climate deal. The
agreement sets out a global action plan to put the world on track to avoid
dangerous climate change by limiting global warming to well below 2 degrees
Celsius (°C). The Paris Agreement is a bridge between today's policies and climate
neutrality before the end of the century.

42
Energy Outlook and Energy Saving Potential in East Asia
Although the emission reductions under the APS are significant, CO2 emissions
from energy demand in the APS case in 2040 will still be above 2013 levels and
more than three times higher than 1990 levels. Scientific evidence suggests that
these reductions will not be adequate to prevent severe climate change impacts.
Analysis by the Intergovernmental Panel on Climate Change (IPCC) suggests that
to keep the increase in global mean temperature to not much more than 2oC
compared with pre-industrial levels, global CO2 emissions would need to peak
between 2000 and 2015.
In the adopted version of the Paris Agreement, the parties will also ‘pursue
efforts’ to limit the temperature increase to 1.5°C, which will require zero
emissions sometime between 2030 and 2050, according to the scientists.
However, this study shows that even in the APS, the emission will be about 4,870
Mt-C. It is supposed to be at zero emission for the efforts to limit the temperature
increase to 1.5°C to be successful.
Figure 1-25. Total CO2 Emissions – BAU and APS
CO2 = carbon dioxide; BAU = Business-as-Usual scenario; APS = Alternative Policy
Scenario; Mtoe = million tons of oil equivalent.
Source: Authors’ calculation.

43
Main Report
Although much depends on the mitigation achieved in other regions, it would
appear unlikely that global emissions could meet either of these profiles given
the contribution of the EAS region to global total emissions under the APS
results. Therefore, it is very important that the COP21 through the Intended
Nationally Determined Contributions (INDCs) will need to seriously implement
the GhG abatement and traces the way to achieving the targets set in INDCs.
4.4. Necessary Investment Cost for Power Sector
Based on the energy outlook results, BAU and APS, the Working Group estimated
the necessary investment in the power sector, especially power generation
facilities, which comprise of coal, gas, nuclear, hydro, geothermal, solar
photovoltaic (PV), wind, and biomass power generation plants. It drew on several
sources of information to obtain the current capital cost of each power plant, but
it did not forecast future capital cost due to its uncertainty. For all EAS countries
taken together, approximately US$4 trillion would be needed due to the rapid
increase in electricity demand in the region. Figures 1-26 and 1-27 show the
investment shares by power generation type for the BAU and the APS. It is clear
that investment in power generation under the APS could shift to low-carbon
power generation sources such as nuclear and PV/wind/biomass.
Figure 1-26. Investment Share by Power Sources (EAS–BAU)
EAS = East Asia Summit; BAU = Business-as-Usual scenario; PV = photovoltaic.
Source: Authors’ calculation.
Coal41%
Gas6%
Nuclear19%
Hydro/Geothermal13%
PV/Wind/Biomass21%
44
Energy Outlook and Energy Saving Potential in East Asia
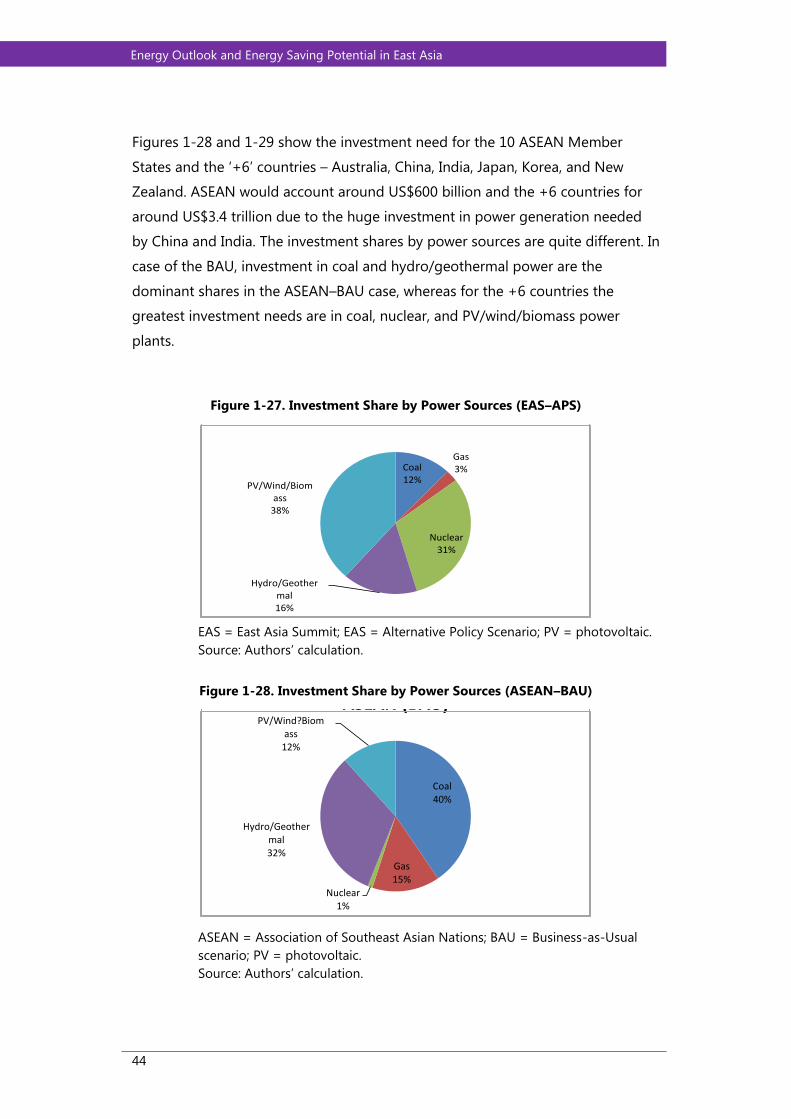
Figures 1-28 and 1-29 show the investment need for the 10 ASEAN Member
States and the ‘+6’ countries – Australia, China, India, Japan, Korea, and New
Zealand. ASEAN would account around US$600 billion and the +6 countries for
around US$3.4 trillion due to the huge investment in power generation needed
by China and India. The investment shares by power sources are quite different. In
case of the BAU, investment in coal and hydro/geothermal power are the
dominant shares in the ASEAN–BAU case, whereas for the +6 countries the
greatest investment needs are in coal, nuclear, and PV/wind/biomass power
plants.
Figure 1-27. Investment Share by Power Sources (EAS–APS)
EAS = East Asia Summit; EAS = Alternative Policy Scenario; PV = photovoltaic.
Source: Authors’ calculation.
Figure 1-28. Investment Share by Power Sources (ASEAN–BAU)
ASEAN = Association of Southeast Asian Nations; BAU = Business-as-Usual
scenario; PV = photovoltaic.
Source: Authors’ calculation.
Coal12%
Gas3%
Nuclear31%
Hydro/Geothermal16%
PV/Wind/Biomass
38%
APS
Coal40%
Gas15%
Nuclear1%
Hydro/Geothermal32%
PV/Wind?Biomass
12%
ASEAN (BAU)

45
Main Report
Figure 1-29. Investment Share by Power Sources (+6 – BAU)
BAU = Business-as-Usual scenario: PV = photovoltaic.
Source: Authors’ calculation.
In the APS case, ASEAN will shift from coal to hydro/geothermal and
PV/wind/biomass, whereas the +6 countries will shift from coal to nuclear and
PV/wind/biomass.
Figures 1-30 and 1-31 show the investment share by power sources under the
APS for ASEAN and the +6 countries. The increase of the renewable share in
power generation could be expected as the operation rate of renewable energy
such as solar PV and wind power plants is quite low. If the policy to promote solar
PV and wind is implemented, a large capacity of solar PV and wind will be
needed; this means initial capital (investment) costs could be higher.
Figure 1-30. Investment Share by Power Sources (ASEAN–APS)
ASEAN = Association of Southeast Asian Nations; APS = Alternative Policy
Scenario.
Source: Authors’ calculation.
Coal41%
Gas4%
Nuclear22%
Hydro/Geothermal10%
PV/Wind/Biomass
23%
+6 (BAU)
Coal20%
Gas8%
Nuclear7%
Hydro/Geothermal40%
PV/Wind/Biomass
25%
ASEAN (APS)

46
Energy Outlook and Energy Saving Potential in East Asia
Figure 1-31. Investment Share by Power Sources (+6–APS)
APS = Alternative Policy Scenario.
Source: Authors’ calculation.
5. Conclusions and Recommendations
At the third Working Group meeting, the members discussed the key findings
and implications of the analysis based on the two energy outlook scenarios – BAU
and APS.
5.1. Key Findings
Based on projected changes in socio-economic factors, energy consumption, and
C02 emissions in the BAU and the APS, the Working Group members identified
several key findings:
Sustained population and economic growth in the EAS region will lead to
significant increases in energy demand. Total final energy consumption in
2040 will increase 1.8 times from 2013, with natural gas increasing 2.9 times
during this period. Oil will increase 2.0 times, but will retain its highest fuel
share in final consumption at 2,164 Mtoe. Transportation sector demand –
which is dominated by road transport – will increase 2.4 times to 1,388 Mtoe
in 2040.
Electricity generation from 2013 to 2040 will increase 2.3 times, to 21015.3
GWh from 2013, and coal is projected to increase 2.1 times. Although
Coal11%
Gas1%
Nuclear35%
Hydro/Geothermal12%
PV/Wind/Biomass
41%
+6 (APS)
47
Main Report
nuclear will increase 5.4 times and NRE 2.5 times during this period, coal
will still have the largest share, at 58.4 percent, in 2040. Electricity
generation will be the source of 64.4 percent of the 4,261 Mtoe of primary
consumption of coal in the EAS region in 2040.
TPES will increase 1.8 times in 2013–2040. But even in the BAU, the EAS
region’s energy elasticity, which is defined as the growth rate of primary
energy supply divided by the growth rate of GDP from 2013 to 2040, is
projected to improve to 0.56 (2.2/4.0), compared with 1.06 (4.2/4.0) from
1990 to 2013.
The continuing reliance on fossil fuels to meet increasing energy demand
will also be associated with significant increases in CO2 emissions. However,
even in the BAU, CO2 elasticity, defined as the growth rate of CO2 emissions
divided by the growth rate of GDP in 2013–2040, will be 26 percent lower
than energy elasticity. There are two reasons for this. The first is
diversification among fossil energy from coal to gas. Coal’s share of the
total primary energy mix is forecast to decline from around 52 percent in
2013 to 45 percent in 2040. On the other hand, the share of gas is projected
to increase to 14.0 percent from 9.5 percent over the same period. The
second reason is the increased use of carbon-neutral energy, such as
nuclear power, hydro power, geothermal power, and NRE. The share of
carbon-neutral energy in 2013 was 15.4 percent, but is forecast to increase
to 16.3 percent in 2040.
Overall, the EAS energy mix in the BAU will change in 2013–2040. The share
of coal and oil will fall from 75 percent to 70 percent. The diversification of
the regional energy mix, which increases the share of low-carbon and
carbon-neutral energy, will contribute to improvements in carbon intensity.
Industry remains a major consumer of energy, but the transport sector’s
consumption continues to increase rapidly. These two sectors are
challenging sectors in terms of improving energy efficiency and reducing
CO2 emissions. Hence, appropriate EEC programmes and low-emission
technologies are needed in these sectors.
Throughout the region, there is strong potential to increase energy
efficiency to reduce growth in energy consumption and CO2 emissions. The
results of this analysis indicate that by 2035 the implementation of currently
proposed energy efficiency goals, action plans, and policies across the EAS

48
Energy Outlook and Energy Saving Potential in East Asia
region could lead to the following reductions:
o 13.2 percent in primary energy supply;
o 13.2 percent in energy intensity; and
o 23.8 percent in energy derived CO2 emissions.
Based on the key findings, this study also quantifies the power generation
investment needed for the EAS region for both BAU and APS. It shows that the
investment requirement for power generation for the total EAS countries will be
around US$3.8 trillion under the BAU to increase the generation capacity to meet
the demand over the 2013–2040 period. Most of the investment (41 percent)
under the BAU will be for additional coal power plants, assumed to be mainly
supercritical plants. Investment for additional nuclear power plants will be around
19 percent and 34 percent for NRE plants.
In the APS, although electricity demand is lower due to the implementation of
efficiency measures, the estimated investment will be larger (US$4 trillion), mainly
because of the increased share of renewable imposed under the APS in addition
to the EEC measures. The largest share of total investment will be for additional
capacity of NRE plants such as hydro, geothermal, solar PV, wind, and biomass,
projected to account for about 54 percent. The investment share for additional
capacity of nuclear power plants will also be high, at 31 percent. Investment for
additional coal power plants will account for only 12 percent and the remaining 3
percent will be that of gas combined cycle plants.
5.2. Policy Implications
Based on the above key findings, the Working Group members identified a
number of policy implications, which were aggregated into five major categories.
The identified policy implications are based on a shared desire to enhance action
plans in specific sectors, prepare appropriate energy efficiency policies, shift from
fossil energy to non-fossil energy, rationalise energy pricing mechanisms, and a
need for accurate energy consumption statistics. The implications identified by
the Working Group are listed below. It should be noted that appropriate policies

49
Main Report
will differ between countries based on differences in country circumstances,
policy objectives, and market structures and that not all members necessarily
agreed to all recommendations.
1) Energy efficiency action plans in final consumption sectors: The
industry sector would be a major source of energy savings because it will
still be the largest energy-consuming sector by 2040. There are several EEC
action plans to be implemented, which include building design and
replacement of existing facilities and equipment with more efficient ones.
Those policies are listed by areas/sectors:
The building sector would need both passive and active design policies
such as:
o Building codes and rewards for green building will need to be set
up and enforced by law.
o Governments need to provide financial support to implement
building energy efficiency measures for both new buildings and
existing buildings (retrofit).
o Governments need to establish funds such as the Energy Service
Company. There are ways to raise funds such as levies on petroleum.
o A good and practical green building business model will need to be
explored and established meet to the context and situation.
o Energy building codes will need to be implemented, and designated
large consumers for energy audit and applied green building need
to be chosen. For example, some public buildings in Indonesia have
targets of 10 percent electricity saving, and the government
established energy building awards to promote the energy
efficiency activity in public and commercial building sector.
Change the industrial structure from heavy to light industries – a shift of
energy-intensive industry to less energy–intensive industries would
reduce energy consumption per unit of GDP output.
The road transport sector will need to consider measures to reduce
energy consumption per unit of transport activities such as:
o Improve fuel economy;
o Shift from personal to mass transportation mode;

50
Energy Outlook and Energy Saving Potential in East Asia
o Shift to more efficient technologies such as hybrid vehicles and
clean alternative fuels;
Other sectors will need to consider measures to improve energy efficiency
such as:
o Use demand management systems such as household energy
management systems (HEMS) and building energy management
systems (BEMS);
o Improve thermal efficiency in the power generation sector by
constructing or replacing existing facilities with new and more
efficient generation technologies.
2) Renewable energy policies: There is a need to shift from fossil to non-
fossil fuels. This could be attained by increasing the share of NRE as well as
nuclear energy in the energy mix of each country. Several policies and
actions will need to be considered:
Renewable technologies are not as competitive as thermal power
generation technologies using fossil fuel. Supportive renewable energy
policies are needed, therefore, and they can be categorised as energy
policies and financial policies. The former mainly include policies such as
Feed-in-Tariff (FiT), Renewable Portfolio Standard (RPS), net metering,
carbon tax, or carbon cap and trade. Financial policies include public
financing, carbon financing, and banking regulations with sustainability
requirements. The key to incentivise private investment in renewable
energy is to lower the risks related to renewable energy projects and
improve the profitability prospects.
The intermittent nature of renewable energy sources poses significant
challenges in integrating renewable energy generation with existing
electricity grids. Thus, government investment in electricity storage
technologies, especially for solar and wind power, will be very important.
3) Technology development policies: To curb the increasing CO2 emissions,
environmental technologies will need to be considered:
The development of carbon capture and storage (CCS) technology will
be very important in controlling the release of greenhouse gases into

51
Main Report
the atmosphere. Continued research and development (R&D) will be
important to ensure the future economic viability of deploying CCS
technology.
Hydrogen fuel could be extracted during the process of fossil fuel
combustion, and thus make thermal efficiency very high (for the
power plant, it is IGFC – Integrated Gasification Fuel-cell). Hydrogen
fuel development is very promising and could be commercialised in
the future. Continued R&D in fuel cells will be important for future
clean fuel utilisation.
There needs to be a carbon market to speed up environmental
technology development. Hence, development of clean coal
technology (CCT) will need to be accelerated in the ASEAN region with
the help of attractive financial frameworks, lowering the borrowing
costs of long-term loans.
Technological cooperation and technology diffusion will be need to
be accelerated in the ASEAN region.
4) Energy supply security policies: The region is largely depending on
imported oil and gas. Thus, measures to secure the supply of energy will be
very important for the region. Several measures are identified:
Promote regional energy cooperation such as the trans-ASEAN gas
pipeline and the ASEAN Power Grid;
Diversify sources of import;
Strengthen energy infrastructure including the construction of
receiving LNG terminals and re-gasification plants;
To have an optimal energy mix (the share of energy supply from
various sources), especially increasing the share of renewable energy;
For the oil and gas producing countries, the management of and
policies for up-stream activity such as oil and gas exploration and
down-stream activity such as oil and gas end-use regulation will be
essential;
ASEAN may need to look into the strategic reserve or stock piling
requirement in the near future under the ASEAN Petroleum Security
Agreement to support the ASEAN countries in case of events such as
oil supply shocks or disruptions.
52
Energy Outlook and Energy Saving Potential in East Asia
5.3. Recommendations
According to this energy outlook study, energy consumption in the EAS region
will increase rapidly due to stable economic and population growth, and will
continue to depend largely on fossil fuel energy, such as coal, oil, and gas up until
2040 (BAU). But if EAS countries dedicate themselves to implementing their EEC
policies and increase low-carbon energy technologies such as nuclear power
generation and solar PV/wind (APS), the EAS region could achieve remarkable
energy savings in the APS, especially through fossil fuel savings compared with
BAU, and significantly reduce carbon dioxide emissions. It is essential, therefore,
that EAS countries implement their EEC and renewable energy policies (energy
saving targets and action plans) in accordance with their respective timetables.
This energy outlook study also shows that a lot of energy savings, especially on
oil and electricity consumption by final users, will come from energy efficiency
activities. So the EEC policies (specified by energy saving targets and action plans)
of EAS countries, which will be applied across sectors – industry, transport,
residential, and commercial – should be appropriate and feasible. Government
support for the activities of energy efficiency and conservation service companies
is also essential.
Increasing the share of renewable energy such as hydro, geothermal, solar PV,
wind, and biomass will contribute to a reduction in fossil fuel consumption and
mitigate carbon dioxide emissions. It will require appropriate government policies
such as renewable targets, legal approaches such as FIT/RPS, and revised FIT to
include bidding and tendering processes.
Energy supply security in the EAS region is a top priority energy issue. EEC and
renewable energy contribute to maintain regional energy security through
reducing fossil fuel consumption and increasing the use of domestic energy.
Moreover, energy supply sources can be diversified through regional energy
networks such as the Trans-ASEAN Gas Pipeline and the ASEAN Power Grid, LNG
receiving terminals, and oil stockpiling through the ASEAN Petroleum Security

53
Main Report
Agreement. And nuclear power generation is another option to maintain energy
supply security in the region.
According to the Energy Outlook’s results, as coal power generation will be still
dominant in the EAS region in 2040, greater use of clean coal technology (CCT)
and development of carbon capture storage (CCS) technology is critical because
as it will make coal power plants in the region carbon free. Hydrogen technology
also has a key role as an alternative to use of fossil fuels, as it can be applied
across sectors such as the power generation, industrial, and residential sectors.
This Energy Outlook study has started to estimate the necessary investment cost
for the power generation sector. The indication is that the EAS region will need
around US$4 trillion for the construction of power plants. ASEAN will need
US$600 billion, the ‘+6’ countries US$3.4 trillion for power generation facilities.
But the share of investment cost by type of power plant is quite different between
the BAU and the APS. In the BAU, a lot of money will be allocated to coal power
plants (CCT), whereas under the APS more money will be allocated to renewable
energy electricity, such as hydro and solar PV/wind in ASEAN and renewable
energy electricity and nuclear power plants in the +6 countries. If EAS countries
could achieve their existing renewable energy policies (APS), they would be able
to allocate significant funds for developing nuclear, hydro, and solar PV/wind
power plants.

54
Energy Outlook and Energy Saving Potential in East Asia
References
ASEAN Secretariat (2007), Cebu Declaration on East Asian Energy Security 2007. Jakarta: ASEAN Secretariat. http://www.aseansec.org/19319.htm (accessed 27 February 2008).
Energy Department, Prime Minister’s Office (2015), Brunei Darussalam Energy White
Paper. Bandar Seri Begawan.
ERIA (2015), ‘Scenario Analysis of Energy Security in the East Asia Summit Region’,
Jakarta: ERIA.
http://www.eria.org/publications/research_project_reports/FY2014/No.35.html
International Energy Agency (2015), Energy Balances of OECD Countries 2014. Paris: OECD Publishing.
International Energy Agency (2015), Energy Balances of Non-OECD Countries 2015. Paris: OECD Publishing.
IPCC (2007), Summary for Policymakers in Climate Change 2007: Mitigation. Contribution of Working Group III to the Fourth Assessment Report of the Intergovernmental Panel on Climate Change (B. Metz, O.R. Davidson, P.R. Bosch, R. Dave, L.A. Meyer [eds.]). Cambridge, United Kingdom and New York, NY: Cambridge University Press.
Ito, K. et al. (2014), Asia/World Energy Outlook 2014. Tokyo: The Institute of Energy Economics, Japan (IEEJ).
Japan Automobile Manufacturers Association (2014), World Vehicle Statistics, 2014. Tokyo: Japan Automobile Manufacturers Association.
Ministry of Economy, Trade and Industry (METI) (2007), ‘EAS Cooperation on Energy Efficiency and Conservation’. Paper Submitted to the 3rd ECTF Meeting in Tokyo in June 2007.
Syed, A. (2014), Australian Energy Projections. Canberra: Bureau of Resources and
Energy Economics (BREE), Government of Australia.
The Ministry of Foreign Affairs of Japan (2005), Kuala Lumpur Declaration on the East Asia Summit, 2005. Tokyo: The Ministry of Foreign Affairs of Japan. http://www.mofa.go.jp/region/asia-paci/eas/joint0512.html (accessed 27 February 2008).
The Ministry of Foreign Affairs of Japan (2005), Prime Minister Junichiro Koizumi Attends
the EAS, ASEAN+3, and Japan–ASEAN Summit Meetings, (Overview and
Preliminary Evaluation), 2005. Tokyo: The Ministry of Foreign Affairs of Japan.
http://www.mofa.go.jp/region/asia-paci/eas/summary0512.html (accessed 28
February 2008).
World Bank (2016), World Databank – World Development Indicators (WDI) and Global
Development Finance (GDF). Washington, DC: The World Bank.
http://databank.worldbank.org/ddp/home.do (accessed June 2016).