Maiden Scientific Voyage RRS James Cook Cruise JC007 · Cruise Report Maiden Scientific Voyage RRS...
59
Cruise Report Maiden Scientific Voyage RRS James Cook Cruise JC007 Tenerife, 5 March 2007 to Tenerife, 17 April 2007 Geological and Geophysical Studies of the Mid-Atlantic Ridge, 12º30’N to 14º30’N R, C. Searle, C. J. MacLeod, B. J. Murton and the JC007 Shipboard Scientific Party Durham University, Department of Earth Sciences, 2007
-
Upload
nguyentuyen -
Category
Documents
-
view
219 -
download
0
Transcript of Maiden Scientific Voyage RRS James Cook Cruise JC007 · Cruise Report Maiden Scientific Voyage RRS...

Cruise Report
Maiden Scientific Voyage RRS James Cook Cruise JC007
Tenerife, 5 March 2007 to Tenerife, 17 April 2007
Geological and Geophysical Studies of the Mid-Atlantic Ridge,
12º30’N to 14º30’N
R, C. Searle, C. J. MacLeod, B. J. Murton and the JC007 Shipboard Scientific Party
Durham University, Department of Earth Sciences, 2007

Personnel
Science party Roger Searle Durham University Principal Scientist Chris MacLeod University of Cardiff Co-investigator Bramley Murton National Oceanography Centre Co-investigator Jack Casey University of Houston Project partner Chris Mallows Durham University PhD student Sam Unsworth National Oceanography Centre PhD student Kay Achenbach University of Wyoming PhD student David Wallis BGS Drill engineer Ian Pheasant BGS Drill engineer Davie Baxter BGS Drill engineer Mike Baxter BGS Drill engineer
NMF-SS Science Support Team Mick Myers NMF-SS Science Systems Manager Duncan Matthew NMF-SS TOBI Lee Fowler NMF-SS TOBI Paul Duncan NMF-SS Computing Alan Davies NMF-SS Instruments Kevin Smith NMF-SS Science
Ship’s crew Antonio Gatti Master Peter Reynolds First officer Titus Owoso Second Officer Robert Clarke Third Officer Martin Holt Chief Engineer Glynn Collard Second Engineer Philip Andrews Third Engineer Phil Parker ETO Peter Allery Deck Engineer Paul Lucas Purser/Catering Officer Thomas Lewis CPO Deck Martin Harrison CPO Science Robert Spencer PO Deck Stephen Day SG1A Perry Dollery SG1A Ian Cantlie SG1A Charles Cooney SG1A John Smith Engine Room PO Stephen Nagle Head chef Lloyd Sutton Chef Peter Robinson Steward Dean Hope Catering Assistant

Introduction and Background Roger Searle
In recent years the region of the Mid-Atlantic Ridge (MAR) either side of Fifteen-Twenty Fracture Zone (FTFZ, Figure 1) has come to be thought of as a type area for the study of low-magmatic seafloor spreading [Dick and Mével, 1996; Smith et al., 2006]. Sampling by dredging and submersible indicated that, unusually for the MAR, peridotite outcrops over distances of tens of kilometres, and that these areas are associated with a blocky topography unlike the usual linear abyssal hill trends of the MAR [Cannat and Casey, 1995; Cannat et al., 1997].
Geophysical studies showed that areas of blocky topography and peridotite outcrop are
associated with high residual mantle Bouguer anomalies (RMBA) indicating thin crust or unusually
Figure 1. Bathymetry of the FTFZ area [Fujiwara et al., 2003; Smith et al., 2006]

low density crust or mantle [Escartin and Cannat, 1999; Fujiwara et al., 2003]. The region also contains a large number of corrugated massifs, interpreted as oceanic core complexes (OCC) , including, unusually, some that currently exist on the outside corners (OC) of ridge-transform intersections (RTI) [MacLeod et al., 2002; Fujiwara et al., 2003].
One of these OCCs, at 15°45’N, was the focus of a detailed study by one of us
(CJM) during James Clark Ross cruise JR63 in 2001. On this cruise, the BRIDGE oriented rock drill was used to obtain 63 samples of material on and around the massif together with 32 dredge stations [MacLeod et al., 2002; Escartin et al., 2003a]. This showed that the corrugated surface was characterised by fault rocks, but that gabbro and peridotite cropped out around the flanks of the massif just below the level of the fault rocks, which were taken to indicate that the corrugated surface is a major detachment fault exhuming deep crustal and mantle rocks in its footwall.
Extensive sampling (see [Kelemen et al., 2004] for comprehensive references) has revealed a geochemical anomaly of mantle enrichment in the region south of FTFZ, and mantle peridotites have undergone unusually high degrees of melting, in apparent contrast to the low amounts of melting occurring regionally.
The region was targeted by Ocean Drilling Program (ODP) Leg 209, which included the objective of testing models of mantle upwelling by drilling an along-strike transect of holes either side of FTFZ [Shipboard Scientific Party, 2003; Kelemen et al., 2004]. The idea was to test whether mantle is focused in 3D towards the centres of spreading segments or rises in some other geometry, such as a 2D sheet along the plate boundary (Figure 2). Four sites were drilled south of FTFZ and three to the north. Between them they recovered mostly harzburgite, dunite and gabbro. Although attempts have been made to estimate tectonic rotations using palaeomagnetism from these unoriented cores [Garcés and Gee, 2007], this requires several assumptions that are fraught with uncertainty and their conclusions are questionable.
Smith and others recently extended the [Fujiwara et al., 2003] geophysical study southwards across the Marathon fracture zone (MFZ) at 12°30’N, and revealed a further extensive region of blocky topography with several actual or incipient OCCs and extensive microseismicity [Escartin et al., 2003b; Smith et al., 2006]. On the basis of their new topographic data they suggested a sequence of development for OCCs, including initial steep back-tilting of ridge-axis-parallel normal faults.

Objectives and strategy Roger Searle
Original objectives The three key objectives of our original
proposal, were:
1. Test the hypothesis that mantle upwelling and melting is focused at the centres of slow spreading ridge segments and transposed by sub-horizontal flow away from there. (Figure 2).
2. Test the hypothesis that plate accretion and separation mechanisms are fundamentally different in ‘magma-starved’ areas.
3. Test mechanisms of detachment faulting and extensional strain localisation in the lower crust and upper mantle.
We proposed to achieve these objectives by detailed sampling across an extensive region of magma-poor seafloor spreading around FTFZ, coupled with microstructural, geochemical and palaeomagnetic analyses (Figure 3). TOBI deep-towed sidescan and magnetic data were to be obtained both to inform the choice of sampling sites and to aid in structural, lithological and geodynamic interpretations.
Figure 2. End-member models for mantle upwelling.
Figure 3. Originally proposed study areas (yellow boxes)

Survey strategy Our proposal was written in 2003, and science has moved on since then. During our passage from Tenerife to the study area we held a series of detailed seminars to pool our knowledge, and carefully re-evaluated our strategy in the light of existing knowledge. We came to the following conclusions:
1) The segments north of the FTFZ are relatively well characterised by work carried out on cruise JR63 [MacLeod et al., 2002; Escartin et al., 2003a] and ODP Leg 209 [Kelemen et al., 2004]. Although this area appears to contain continuous exposure of peridotite along the western median valley wall from about 15º32’N to 15º49’N ([Fujiwara et al., 2003]’s segment N2) this is of relatively limited geographical extent, and the intervening FTFZ would make it difficult to integrate results from here and with sites south of FTFZ.
2) The segments immediately south of FTFZ (Fujiwara et al.’s segments S1 and S2) also display extensive peridotite outcrop and show the blocky, poorly lineated topography characteristic of magma-poor spreading. However, again the along-ridge extent of such features is limited, in this case to some 25 miles between 14º40’N and 15º10’N, although the northernmost part of this may be complicated by the proximity of the FTFZ.
3) Since our proposal was written, a new study has taken place adjacent to and south of Fujiwara et al.’s ([Smith et al., 2006] and in prep.; Figure 1). This has extended bathymetric and geophysical coverage south across Marathon Fracture Zone (MFZ) at 12º40’N. We are indebted to Debbie Smith and her colleagues for permission to use their new data for our cruise planning purposes. These data reveal a 60-mile-long section of ridge between 12º52’N and 13º52’N that is characterised by blocky, poorly lineated topography and the occurrence of several massifs that appear to be young and developing OCCs [Smith et al., 2006]. Little sampling had been carried out here, although there were reports that a newly discovered hydrothermal vent site (Ashadze) was hosted by peridotite, and during our passage colleagues on the French ship Pourquoi pas? working in this area reported a dredge in the neighbourhood of Ashadze that recovered peridotite. Moreover, this area borders on well-lineated, apparently magma-rich spreading segments to north and south
4) The area between MFZ and 13º52’N therefore appeared to have all the characteristics required for our study, with the added advantage that is much more extensive along axis than either of the two areas suggested in our proposal, without the intervening complication of the FTFZ.
We therefore reconfigured our survey to concentrate on this southern area. We identified for our prime focus four flat-topped to turtle-back-shaped massifs that appeared to be OCCs in various stages of development, surmising that these were most likely to expose peridotite, though we also planned to sample other targets such as normal faults in the median valley walls. For convenience we named these, from north to south: Donatello (14º48’N), Leonardo (14º30’N), Michelangelo (14º19’N), and Raphael (possibly a pair of merged OCCs at 13º00’N and 13º10’N).
Survey operations and priorities We decided to first attempt a rock drill on Donatello, the nearest massif to Tenerife, in order to
test the drill and allow time during subsequent work for any adjustments to the drill. We also carried out dredges at Donatello, Leonardo and Michelangelo to confirm that they did indeed expose mantle lithologies. All four sites returned peridotite or serpentinite. We then began a planned 12-day TOBI survey to extend from Michelangelo to Donatello and cover the edge of the magmatically robust area to the north (Figure 4). TOBI failed after 6 days and we resumed drilling operations while it was repaired. A further 4.5 days of TOBI work followed before it failed again. This time, having completed most of the main survey, we moved the remaining two TOBI lines to a lower priority and concentrated on sampling. Towards the end of our study we attempted further

TOBI work targeting the western median valley wall and adjacent flank of Raphael, but TOBI failed repeatedly before reaching operating depth, so further TOBI work was abandoned.
Dredging versus drilling Our initial strategy was to use
the drill to sample critical parts of OCCs identified from TOBI in order to obtain in-situ peridotite, to sample a range of lithologies, and to obtain oriented samples on which to estimate tectonic rotations. As our sampling progressed, it became apparent that obtaining successful cores would not be as easy here as it had been on JR63. One initial difficulty was mechanical failures in the drill (mostly with the newly-developed fibre-optic connections), though these were satisfactorily overcome by site BR114 on day 90. The other main problem was that suitable outcrops were just very hard to find. We had expected that the detachment surfaces of at least Leonardo and Michelangelo, which appear to be emerging very close to the ridge axis, would have little sediment cover (and certainly less than at the 15º45’N OCC studies on JR63). However, these surfaces were ubiquitously covered with pelagic sediment (too deep for our maximum 1-metre drill penetration where attempted) and usually also basalt rubble (probably abraded from the edge of the hanging wall). We also attempted to target the very crests or lips of fault scarps in the hope that these would provide outcrop on not-too-steep surfaces; this was successful to a certain extent, but in many places there was no useful outcrop between sedimented shelves (many of which themselves dipped at approximately 30º) and near- (and sometimes actually) vertical scarps.
Thus, while the drill was out of action, and as a supplement to drilling, we dredged, with three objectives. First, to carry out rapid reconnaissance to prove the existence of suitable lithologies (e.g., peridotite) to target with the drill; secondly to obtain peridotite samples for geochemical and structural studies (see below); and third to sample basalts and other melt products for geochemical analysis to investigate the relation of melt to parent peridotite (e.g., the nature of mantle melting, depth, and melt fraction) and to test the hypotheses for along-axis melt migration in a magma-poor environment. Thus, dredges were targeted at critical parts (crests, flanks, breakaways and terminations) of OCCs and at axial volcanic ridges adjacent to and between OCCs, and in magma-rich segments for comparison.
We concluded that peridotite samples obtained by dredging could help address our primary objective of constraining mantle emplacement geometry. We argue that we can measure on the same sample both the remanent magnetisation direction and crystal microfabrics. If mantle
Figure 4. Planned TOBI survey at beginning of cruise. All but the northern two lines were completed (compare Figure **).

upwelling is largely sheet-like (Figure 2a), then the angle between these vectors should show little variation, independent of the actual (unknown) orientation of the sample, and should be consistently at a high angle to the magnetic remanence direction. On the other hand, if upwelling is columnar at depth and horizontal along-axis near the surface (Figure 2b), these vectors will be at shallower and more variable angles to each other, and will tend to be sub-parallel north of the upwelling and anti-parallel to the south, again independent of actual sample orientation.

Narrative Roger Searle
All times GMT. Details of individual operations are given in Table 1 and the individual sample site descriptions in the appendices. Figure 5 shows the overall cruise track, Figure 6 the ship track in the study area, Figure 7 the track of the TOBI vehicle, and Figure 8 the sampling stastions.
5 March 2007, Julian day 064 1912: Departed Santa Cruz de Tenerife, on passage to work area. 6 March, day 065 1200: Position 27º 00.9’N, 18º 58.8’W. Scientific watches begin. 1300: Heaving to for station 001 Sound velocity profiler. 1320: SVP in water. 1415: SVP stopped at 3000 m. 1510: SVP on board. Resume passage to work area. 7 March, day 066 1200: Position 25º 20’N, 23º 04’W, on passage. 1720: XBT. 8 March, day 067 1030: XBT. 1200: Position 23º 30.8’N, 27º 30.3’W. 1713-1825: Station 002, SVP. 9 March, day 068 0900 – 1100: Gravimeter off line. 1200: Position 24 55’N, 31º 22’W, on passage. 1230: XBT. 1300: Deployed magnetometer. 1930: Alter course for new start point. 2000: Magnetometer failed due to overheating. 10 March, day 069 0139: Magnetometer restarted with external fan to cool. 1000: Spoke R/V Professor Logachev 11 km on beam. 1039: Recover magnetometer prior to water test of BGS oriented drill. 1155: Drill in water. Lowered to 20 m. 1200: Position 19º 46’N, 35º 18’W, on passage. 1245: Drill recovered. Test successful. 1300: Gravimeter turned off. 1330: Resume passage; magnetometer deployed. 1600: Gravimeter back on. 11 March, day 070 1200: Position 17º 26’N, 39º 05’W, on passage. 1336: XBT. 12 March, day 071 1200: Position 15º 05.8’N, 42º 51.43’W, on passage. 1330: XBT.

13 March, day 072 0058: Recovered magnetometer. Begin survey for first drill site BR101 on “Donatello” massif. 0137: On station, 13º 47.55’, 44º 52.85’. 0154: Drill in water. 0244: Lost communication at depth ~1900 m. 0330: Drill on deck. End of station. Move to site of dredge D01 on Donatello. 0521: On station, 13º 49.2’N, 44º 56.60’W, begin D01. 1045: Dredge on deck. End of D02. Recovered dunite, harzburgite and dolerite. Move to BR101
position. 1145: On station, 13º 47.64’, 44º 52.73’, restart BR101. 1157: Drill in water. 1339: Drill near bottom – searching for outcrop. 1451: On bottom. Position 13º 47.638’N, 44º 52.797’E. Multibeam depth 2005 m. 1501: Start drilling. Penetrating very slowly. 1546: Stopped drilling. 1553: Hauling in. 1600: Wire jumped off sheave at 1798m wire out. Delay to re-rig. 1818: Drill on deck. End of BR101. Recovered weathered harzburgite. 1900: Moved to next dredge site 2030: Conducting tests on winch that had a jumped wire – all appeared normal. 2200: Conducted short multibeam survey over dredge site. 2349: Begin dredge D02 on corrugated part of “Leonardo” massif. Position 13º 29.19N, 44º
54.10’E. 14 March, day 073 0445: Dredge on deck. End of D02. Recovered dunite and dolerite. 0500: Move to next dredge site. 0652: On station, begin dredge D03 on “Michelangelo” massif. 1103: Dredge on deck. End of station D03. Recovered small pebble of sheared serpentinite and
large amount of sediment. Set course for basin to carry out SVP. 1230: Begin SVP to 4000 m depth. 1530: End of SVP. Set course for TOBI deployment at point T00. 1900: Begin TOBI deployment. 2048: TOBI at 500 m depth. Begin “Figure 8” turn for calibration of TOBI magnetometer. 2250: Magnetic calibration complete. Begin southernmost EW line of TOBI survey (line 1). 15 March day 074 0024: Ship passed waypoint T1.. 0115: TOBI passed T1, E end of TOBI line 1 1500: Ship at T2. 1615: TOBI passed T2, end of line 1. 1624: As the ship came onto a heading of 090º a strong north-easterly wind, coupled with the
unavailability of the azimuth thruster, generated considerable leeway. This increased the lateral angle of the tow cable, causing it to jump one track in the gantry sheave and threatening to jump again and jam in the sheave (it appeared that the sheave had a limited angle of movement – at one point there was an angle of 30º between the plane of the sheave and the plane of the tow-cable). Ship’s head was turned back to NE, tow cable shortened to 2500m, and the ship finally brought round and back onto the next line. Decided in future to carry out turns by shortening tow cable and then speeding ship around turns.
2100: Ship at T3.

2150: TOBI at T3, start of line 2. 16 March, day 075 1122: Ship at T4. 1210: TOBI at T4, end of line 2. Started turn with TOBI depth at 1700m. Ship speeded up to 3.5
knots which raised TOBI eventually to 1200 m. Turn accomplished with no repeat of previous problems.
1418: Ship at T5. 1510: TOBI at T5, start line 3. 17 March, day 076 0345: Ship at T6. 0440: TOBI at T6, end of line 3. 0915: Ship at T7. 1018: TOBI at T7, start of line 4. 2335: Ship at T8. 18 March, day 077 0022: TOBI at T8, end of line 4. 0233: Ship at T9. 0325: TOBI at T9, start of line 5. 1618: Ship at T10. 1648 TOBI at T10, end of line 5. 2000: Ship at T11. 2100: TOBI at T11, start of line 6. 19 March, day 078 1020: Ship at T12. 1106: TOBI at T12, end of line 6. 1318: Ship at T13. 1416: TOBI at T13, start of line 7. 2002: Lost modem on TOBI. 2030: TOBI CTD and gyro signals down. 2119: TOBI power cycled off/on to reset system. 2129: TOBI running again, appears OK. 10 minutes data lost. 20 March, day 079 0425: Ship passed T14. 0508: TOBI passed T14, end of line 7. 0915: Ship passed T15. 0952: TOBI passed T15, start of line 8.. 1700: Loss of all TOBI signals – open circuit on line. Begin recovery. 1902: Magnetometer recovered. 2008: TOBI on deck. Await initial assessment. 2150: Moving to Michelangelo for three rock drills. 2354: Begin rock drill station BR102, at crest of smooth, lineated surface of Michelangelo. No
outcrop seen, drilled into sediment, so sample not necessarily in situ. 21 M arch, day 080 0551: End of BR102. Recovered short core of plag-ol-phyric basalt talus and several pebbles. 0600: Start BR103 on toe of Michelangelo.

1133: Recovering drill. 1224: Winch developed a crossing turn. 1410: Drill on deck. End of BR103. No sample recovered. Set course for TOBI deployment
position. NMF staff decide to stream deep-tow cable in attempt to resolve spooling problem. 1503: Begin streaming deep-tow cable. Various attempts to haul and veer and adjustr spooling
mechanism. 22 March, day 081 0107: Recovered streamed cable. 0230: On station for TOBI deployment. 0250: TOBI in the water 0356: Magnetometer deployed. 0610: Good sidescan record begins – approximately 1 hour overlap achieved. 0800: TOBI magnetics failed – system rebooted. 0830: TOBI back on line: ~ 2 minutes data lost. 1314: Ship at T16. 1414: TOBI at T16, end of line 8. 1554: Ship at T17. 1644: TOBI at T17, start of line 9 23 March, day 082 0830: Ship at T18. 0924: TOBI at T18, end of line 9. 1209: Ship at T19. 1246: TOBI at T19, start of line 10. 24 March, day 083 0130: Ship at T20. 0240: TOBI at T20, end of line 10. 0400: Ship at T21. 0500: TOBI at T21, start of line 11. 1854: Ship at T22. 1946: TOBI at T22, end of line 11. 2211: Ship at T23. 2304: TOBI at T23, start of line 12. 25 March, day 084 1156: Ship at T24. 1238: TOBI at T24, end of line 12. 1412: Ship at T25. 1452: TOBI at T25, start of line 13. 26 March, day 085 0335: Ship at T26. 0430: TOBI at T26, end of line 13. 0755: Ship at T27. 0830: TOBI at T27, start of line 14. 1016: Short circuit on TOBI; system shut down. 1022: Began recovering TOBI. 1300: Magnetometer recovered. 1413: TOBI on deck. 1430: Set course for rock drill sites on Michelangelo.

1800: Begin BR104 on Michelangelo summit plateau. 1945: Digital communications on drill failed. 1954: Recover drill. 2130: Drill on deck; end of BR104. No recvovery. Set course for dredge station. 2207: On station, begin dredge D04 on NE block of Michelangelo. 27 March, day 086 0145: Dredge on deck; end of D4. One small piece of schistose serpentinite recovered. 0220: Restart drill station BR104. 0630: Drill on deck; end of BR104. Small, un-oriented angular basalt talus recovered. 0710: Begin station BR105 on summit plateau of Michelangelo. 1230: Drill on deck. End of BR105. No sample recovered. 1230: Begin BR106 on breakaway spine of Michelangelo. 1806: End of BR106. Flush pump not working; very little penetration achieved, no recovery. 1952: Flush pump replaced. Begin BR107, same site as BR106. Station was on steep slope, lift
cable of drilling platform jammed on deployment. 2316: Stop drilling. Recover. 28 March, day 087 0056: Drill on board; end BR107. Pelagic sediment and some talus recovered. 0106: Begin dredge D05, up SW flank of Michelangelo.. 0535: Dredge on deck. End of D05. Recovered basalt and dolerite. 0731: Begin dredge D06, up E side of breakaway ridge. 1100: Dredge on deck. End of D06. Recovered basalt, dolerite and fault breccia. 1155: Begin BR108, same site as BR107. On outcrops of elongated pillows interspersed with
sediment. 1623: Drill on deck. End of BR108. Made approximately 5 attempts to drill, all failed, mostly in
sediment. Recovered pelagic sediment. 1738: Begin dredge D07 on SE flank of main dome of Michelangelo. 2148: Dredge on deck. End of D07. Recovered basalt, dolerite and serpentinised harzburgite. 2313: Begin BR109 on lava flow to NE of Michelangelo toe. Drilled for total penetration of 7 cm. 29 March, day 088 0400: Drill on deck. End of BR109. No core recovered. Problems with fibre optic cable during
recovery. 0504: Begin BR110 on northern tip of AVR south of Michelangelo toe. 0939: Drill on deck. End of BR110. Recovered small, oriented plag-phyric basalt. Cable
birdcaged, needed retermination. 1127: Begin D08 near tip of AVR north of Michelangelo toe. 1500: Dredge on deck. End of D08. Recovered one small piece of harzburgite (possibly from
talus at foot of Michelangelo?) 1652: Begin D09 up E flank of upper Michelangelo massif, above striated surface. 2055: Dredge on deck. End of D09. Recovered dolerite fault breccia, sheared serpentinite
peridotite mylonite, harzburgite, basalt and dolerite. 2152: Begin D10 on north face of Michelangelo’s striated surface. 30 March, day 089 0330: Dredge on deck. End D10. Recovered basalt, massive sulphide and oxidised hydrothermal
material. 0430: Begin BR111, same site as BR108. 0532: Drill communications failed: station aborted.

0640: Drill on deck. End of BR111. No sample recovered. 0837: Begin D11, across AVR near 13º16’N. 1208: Dredge on deck. End D11. Recovered pillow basalt. 1417: Begin D12, up eastern valley wall fault facing Michelangelo. 1902: Dredge on deck. End of D12. Recovered pillow basalt. 2009: Begin BR112 at toe of Michelangelo. 2107: Drill communications failed – station aborted. 2203: Drill on deck. End of BR112. No sample recovered. 2224: Begin D13 at toe of Michelangelo. 31 March, day 090 0235: Dredge on deck. End of D13. Recovered large specimens of harzburgite, dolerite and fault
rock.. 0326: Begin BR113 on breakaway spine of Michelangelo. 0633: Drill on deck. End BR113. Drill operated successfully and penetrated rock, but no sample
recovered. 0800: Begin BR114 at toe of Michelangelo. 1012: After initial drilling, communications lost. Aborted station. 1222: Drill on deck. End of BR 114. No sample recovered. 1301: Begin D14 in inter-AVR area on hanging wall of Michelangelo detachment. 1826: Dredge on deck. End of D14. Fresh glassy pillow lava and harzburgite recovered. 1930: Begin BR115 at toe of Michelangelo. 1 April, day 091 0005: Drill on deck. End of BR115. Recovered small oriented piece of serpentised dunite. 0142: Begin D15 across median valley axis near 13º 04’ N. 0728: Dredge on deck. End of D15. Fresh, glassy pillow lava recovered. 0825: Begin D16 across median valley floor and east wall near 13º02’N. 1405: Dredge on deck. End of D16. Recovered fresh, glassy pillow basalt, harzburgite, dunite and
fault breccia. 1426: Start D17 along median valley axis near 12º59’N. 2007: Dredge on deck. End of D17. Few very small fragments of rock and glass recovered. 2222: Begin TOBI deployment at T31. 2310: Short circuit in TOBI. Recovering. 2 April, day 092 0020: TOBI on deck. Short circuit traced to umbilical, which will be replaced with spare. 0136: Begin D18, up west wall of median valley near Ashadze vent sites. 0439: Dredge stuck fast on bottom. Manoeuvring to free it. 0710: Week link broke. Recovered cable. Dredge and chain lost. 0828: End of D18. 0958: Begin D19, across median valley axis near 12º 47’N. 1553: Dredge on deck. End of D19. Recovered fresh, glassy pillow lava. 2053: Begin D20 on west wall of median valley near 13º 00’N. 3 April, day 093 0135: Dredge on deck. End of D 20. Recovered dolerite, gabbro, plagio-granite, dolerite fault
breccia, schistose serpentinite, harzburgite and dunite. 0250: Begin TOBI deployment at T31. 0530: Lost TOBI power supply at 3170 m wire out. Recovering. 0845: TOBI on deck. Swivel had leaked.

0956: Begin D21 on western median valley wall near 13º01’N. 1535: Dredge on deck. End D21. Recovered harzburgite. 1727: Begin BR116 at top of spur in median valley wall near 12º 57’N. 2340: Drill on deck. End BR116. Bottom was covered in sediment. Recovered pelagic sediment. 4 April, day 094 0011: Begin BR117 on W wall of median valley near 13º 01’N. 0536: Drill on deck. End BR117. Recovered small pieces of gabbro. 0625: Begin BR118 on W wall of median valley near 13º 06’N. 1225: Drill on deck. End BR118. Recovered small length of oriented harzburgite. 1406: Begin BR119 on W wall of median valley near 13º 00’N. ????: Drill on deck. End of BR119. Recovered gabbro fragments. 2115: Begin BR120 on W wall of median valley near 12º 57’N. Steep sedimented slopes . 5 April, day 095 0250 Drill on deck. End BR120. Recovered pelagic sediment. 0251: Set course for Leonardo massif. 0758: Begin BR121 on toe of Leonardo. 1225: Drill on deck. End of BR121. Recovered serpentinite mud and sulphides. 1304: Begin BR122 on steep slope at southern edge of Leonardo’s toe. 1822: Drill on deck. End of BR122. Recovered oriented schistose serpentinite over dunite and
harzburgite. 1900: Begin BR123 on NE part of Leonardo’s toe. 6 April, day 096 0028 : Drill on deck. End of BR123. Recovered oriented altered dolerite with chilled margin. 0055: Begin D22 on toe of Leonardo. 0430: Dredge became fast to seafloor; efforts to remove it failed. Dredge lost. 0820: Recovered cable. End of D22. 1220: Begin BR124 on eastern tip of Leonardo’s toe. Site drilled adjacent to ~40[?] m vertical
cliff with probable peridotite outcrop. 1625: Drill on deck. End of BR124. Core barrel empty. 1722: Begin D23 up steep scarp at toe of Leonardo. 2128: Dredge on deck. End of D23. Recovered massive sulphide, basalt, mylonite and blue
serpentine mud. 2205: Begin D24 on AVR opposite Leonardo’s toe. 7 April, day 097 0325: Dredge on deck. End of D24. Recovered basalt and glass. 0510: Begin D25 on AVR between Leonardo and Michelangelo. 1135: Dredge on deck. End of D25. Sheer pins had gone, bag was inside out, but some basalt and
fresh glass in pipe. Subsequently welded up the bridle to the dredge frame, dispensing with shear pins.
1338: Begin D26 on AVR between Leonardo and Donatello. 1837 Dredge on deck. End of D26. Recovered glassy pillows. 2005: Begin D27 on faulted toe of Donatello. 2122: Drill on deck. Bag, pipe and chain tangled. End of D27. Recovered three small chips of
basalt. 8 April, day 098 0106: Begin BR125 above toe of Donatello.

0530: Drill on deck. Recovered scribed core of very altered peridotite. 0627: Begin BR126 on south wall of Donatello. 1030: Drill on deck. End of BR126. Drill was unable to penetrate; no core recovered. 1040: Begin BR127 at same position as BR126. (NB BR127 is described as BR126A in drill video
and files). 1405: Drill on deck. End of BR127. Recovered manganese crust and small pebbles. 1714: Begin BR128 at top of scarp on NE side of Michelangelo central massif. 2111: Drill on deck. End BR128. Recovered four basalt pebbles. 2152: Begin BR129 on scarp on SE side of Michelangelo central massif. 2310: Seabed in sight. Begin drifting east. 9 April, day 099 0027: Landed on small outcrop. Drill communications failed. Lifted off and comms. returned.
Out of sight of outcrop, continued drifting east. 0135: Only featureless sediment and scattered rubble seen. Decide to return to 0027 USBL
position. Ship moved there. 0204: Outcrop in sight. Landed. Moved ship to far side of outcrop, lifted off, landed when close.
Repeated twice[?]. 0256: Landed on outcrop! Successful USBL recovery of previous position. 0302: Attempt drilling. Drill fails to rotate. Several attempts to free/start drill with no success. 0323: Lift off and recover to surface. 0450: Drill on board. End of BR129. No sample recovered. Transit to next station. 0911: Begin D28 at westernmost NS fault on Donatello core complex. 1423: Dredge on board. End of D28. Recovered peridotite, gabbro, plagiogranite, diabase, and
several types of mylonite. 1603: Begin D29 on AVR north of Donatello near 13º54’N. 2053: Dredge on bopard. End of D29. Recovered fresh and older basalt and much glass. 2210: Begin D30 on AVR at centre of 14ºN geochemical anomaly. 10 April, day 100 0240: Dredge on board. End of D30. Recovered pillow basalt and glassy fragments. Begin transit
to last station. 0448: Begin BR130 on steep outward sloping east flank of Donatello. 0945: Drill on deck. End of BR130. Recovered short pieces of scribed basalt with manganese
coating. 0949: Begin passage to Tenerife logging EM120 multibeam and gravity. End of scientific
watches. 1540: Deploy magnetometer. 13 April, day 103 1418: End of EM120 logging. 15 April, day 105 1630: End of magnetometer logging. 17 April, day 107 0700: Arrive Tenerife.

Table 1: Summary of operations JC007 Operations (durations in hours)
Start End
Item Day Time GMT
Day Time GMT
Passage Transit Drill Dredge TOBI SVP Contin-gency
In Tenerife 64 07:00:00 64 19:12:00 12.2
Depart Tenerife 64 19:12:00 65 13:20:00 18.1
SVP 65 13:20:00 65 15:10:00 1.8
Passage 65 15:10:00 72 00:58:00 153.8
BR101 72 00:58:00 72 03:35:00 2.6
Passage 72 03:35:00 72 05:21:00 1.8
D01 72 05:21:00 72 10:45:00 5.4
Passage 72 10:45:00 72 11:54:00 1.1
BR101 72 11:54:00 72 19:00:00 7.1
Passage 72 19:00:00 72 20:30:00 1.5
Winch tests 72 20:30:00 72 22:00:00 1.5
Passage 72 22:00:00 72 23:49:00 1.8
D02 72 23:49:00 73 04:45:00 4.9
Passage 73 04:45:00 73 06:52:00 2.1
D03 73 06:52:00 73 11:03:00 4.2
Passage 73 11:03:00 73 12:30:00 1.5
SVP 73 12:30:00 73 15:30:00 3.0
Passage 73 15:30:00 73 19:00:00 3.5
TOBI (T0 - T15.1) 73 19:00:00 79 21:50:00 146.8
Passage 79 21:50:00 79 23:54:00 2.1
BR102 79 23:54:00 80 05:51:00 6.0
BR103 80 05:51:00 80 14:10:00 8.3
Passage 80 14:10:00 80 15:03:00 0.9
Stream cable 80 15:03:00 81 02:30:00 11.5
TOBI (T15.2 - T27.1)
81 02:30:00 85 14:13:00 107.7
Passage 85 14:13:00 85 18:00:00 3.8
BR104 85 18:00:00 85 21:30:00 3.5
Passage 85 21:30:00 85 22:07:00 0.6
D04 85 22:07:00 86 01:45:00 3.6
BR104a 86 01:45:00 86 06:30:00 4.7
Passage 86 06:30:00 86 07:10:00 0.7
BR105 86 07:10:00 86 12:30:00 5.3

Passage 86 12:30:00 86 13:05:00 0.6
BR106 86 13:05:00 86 18:06:00 5.0
BR107 86 18:06:00 87 00:56:00 6.8
D05 87 00:56:00 87 05:35:00 4.6
D06 87 05:35:00 87 11:20:00 5.8
BR108 87 11:20:00 87 17:38:00 6.3
D07 87 17:38:00 87 21:45:00 4.1
Passage 87 21:45:00 87 23:13:00 1.5
BR109 87 23:13:00 88 00:04:00 0.8
BR110 88 00:04:00 88 09:39:00 9.6
D08 88 09:39:00 88 15:00:00 5.3
D09 88 15:00:00 88 20:55:00 5.9
D10 88 20:55:00 89 03:30:00 6.6
BR111 89 03:30:00 89 06:40:00 3.2
D11 89 06:40:00 89 12:08:00 5.5
D12 89 12:08:00 89 19:02:00 6.9
Item Day Time GMT
Day Time GMT
Passage Transit Drill Dredge TOBI SVP Contin-gency
BR112 89 19:02:00 89 20:02:00 1.0
D13 89 20:02:00 90 02:35:00 6.5
BR113 90 02:35:00 90 06:33:00 4.0
BR114 90 06:33:00 90 12:22:00 5.8
D14 90 12:22:00 90 18:26:00 6.1
BR115 90 18:26:00 91 00:05:00 5.7
Passage 91 00:05:00 91 01:42:00 1.6
D15 91 01:42:00 : 91 07:28:00 5.8
D16 91 07:28:00 91 14:05:00 6.6
D17 91 14:05:00 91 20:07:00 6.0
TOBI (T31) 91 20:07:00 92 00:20:00 4.2
D18 92 00:20:00 92 08:28:00 8.1
D19 92 08:28:00 92 15:53:00 7.4
D20 92 15:53:00 93 01:35:00 9.7
TOBI (T31) 93 01:35:00 93 08:45:00 7.2
D21 93 08:45:00 93 15:35:00 6.8
BR116 93 15:35:00 93 23:40:00 8.1
BR117 93 23:40:00 94 05:36:00 5.9
BR118 94 05:36:00 94 12:25:00 6.8
BR119 94 12:25:00 94 20:30:00 8.1

BR120 94 20:30:00 95 02:50:00 6.3
Transit 95 02:50:00 95 07:58:00 5.1
BR121 95 07:58:00 95 12:25:00 4.5
BR122 95 12:25:00 95 18:22:00 6.0
BR123 95 18:22:00 96 00:28:00 6.1
D22 96 00:28:00 96 12:20:00 11.9
BR124 96 12:20:00 96 16:25:00 4.1
D23 96 16:25:00 96 21:28:00 5.1
D24 96 21:28:00 97 03:25:00 6.0
D25 97 03:25:00 97 11:35:00 8.2
D26 97 11:35:00 97 18:37:00 7.0
D27 97 18:37:00 97 21:22:00 2.8
BR125 97 21:22:00 98 05:30:00 8.1
BR126 98 05:30:00 98 10:30:00 5.0
BR127 98 10:30:00 98 14:05:00 3.6
Transit 98 14:05:00 98 17:14:00 3.1
BR128 98 17:14:00 98 21:11:00 4.0
BR129 98 21:11:00 99 04:50:00 7.6
Transit 99 04:50:00 99 09:11:00 4.4
D28 99 09:11:00 99 14:23:00 5.2
D29 99 14:23:00 99 20:53:00 6.5
Transit 99 20:53:00 99 22:10:00 1.3
D30 99 22:10:00 100 02:40:00 4.5
Transit 99 02:40:00 100 04:48:00 26.1
BR130 100 04:48:00 100 09:45:00 4.9
Passage to Tenerife
100 09:45:00 107 10:00:00 168.3
Total (days) 14.7 2.7 7.3 7.6 11.1 0.2 0.5
Budget (days) 15.0 0.0 12.0 0.0 15.0 0.0 2.0
Variance (days) 0.3 -2.7 4.7 -7.6 3.9 -0.2 1.5
Total science 0.0 2.7 7.3 7.6 11.1 0.2 0.5
Budget science 0.0 0.0 12.0 0.0 15.0 0.0 2.0

Figure 5. Overall ship track.
Figure 6. Ship track in study area.

Figure 7. TOBI track

Figure 8. Sampling stations.

TOBI Operations TOBI Team (Duncan Matthew, Lee Fowler, A. Guest)
System Description TOBI - Towed Ocean Bottom Instrument - is the National Oceanography Centre's deep towed
vehicle. It is capable of operating in 6000m of water. The maximum water depth encountered during the TOBI surveys during this cruise was around 4500m.
Although TOBI is primarily a sidescan sonar vehicle a number of other instruments are fitted to make use of the stable platform TOBI provides. For this cruise the instrument complement was:
1. 30kHz sidescan sonar with swath bathymetry capability (Built by IOSDL)
2. 8kHz chirp profiler sonar (Built by IOSDL/SOC) 3. Three-axis fluxgate magnetometer. (Ultra Electronics Magnetics Division MB5L)
4. CTD (Falmouth Scientific Instruments Micro-CTD)
5. Pitch & Roll sensor (G + G Technics ag SSY0091)
6. Gyrocompass (S.G.Brown SGB 1000U)
7. Light backscattering sensor (WET labs LBSS)
A fuller specification of the TOBI instrumentation is given in Appendix **.
An Autohelm ST50 GPS receiver provides the TOBI logging system with navigational data. An MPD 1604 9-tonne instrumented sheave provides wire out, load and rate information both to its own instrument box and wire out count signals to the logging system. The instrumented sheave is an optional extra if such an item is not available on the chosen ship. If available on the ship, then the wire out is recorded on the ship’s own data network. This facility was available on the James Cook.
The TOBI system uses a two-bodied tow system to provide a highly stable platform for the on-board sonars. The vehicle weighs 2.5 tonnes in air but is made neutrally buoyant in water by using syntactic foam blocks. A neutrally buoyant umbilical connects the vehicle to the 600kg depressor weight. This in turn is connected via a conducting swivel to the main armoured coaxial tow cable. All signals and power pass through this single conductor.
The deck electronic systems and the logging and monitoring systems were set up in the James Cook’s Main Laboratory on the starboard side. The TOBI replay computer was mounted on the next spare bench space, starboard side. As TOBI has been used previously on the ship, mobilisation of the major components was easily accomplished.
TOBI Deployments The James Cook is equipped with a wide, stern-mounted hydraulic 'A' frame that allows TOBI to
be deployed and recovered in a thwartships position. This gives good control of the vehicle during these operations. A main sheave block on the ‘A’ frame was used for deploying and recovering the TOBI vehicle as well as deploying and recovering the depressor weight and towing the complete system during the survey. No major problems were encountered during any of the launch or recovery operations, which is a very great credit to the deck crews involved.
TOBI was launched and recovered a total of 6 times during the cruise. The times are listed below along with relevant comments:

Deployment Start day/time End day/time Comments
Run#1 073/20:13:26 079/16:49:16 Main Survey Area. Short circuit, water in termination bottle.
Run#1A 081/03:23:46 085/10:13:28 Main Survey Area - continued. Power fluctuation then short, water in swivel.
Run#2 091/22:10:00 091/23:06:00 Short circuit during deployment, swivel fault.
Run#2A 092/-----------1756? Umbilical fault during deployment.
Run#2B 092/----------- ?? Swivel fault during deployment.
Run#2C 093/04:03:00 093/05:34:00 Short circuit during dive to start line, swivel fault.
Total TOBI time collecting data was 10.14 days, with a cruise budget of 15 days. The final 24 hour, 2 line run, was not achieved (see Run#2 – 2C). Total agreed time lost was 24 hours.
The M-O disks used and their relevant numbers, files and times are listed in Appendix **
TOBI Watch Keeping TOBI watch keeping was split into three four-hour watches repeating every 12 hours. Watch
keepers kept the TOBI vehicle flying at a target height of 400m above the seabed by varying wire out and/or ship speed. Ship speed was usually kept at 2.5 knots over the ground with fine adjustments carried out by using the winch. As well as flying the vehicle and monitoring the instruments, watch keepers also kept track of disk changes and course alterations.
The bathymetry charts of the work area comprised previously surveyed blocks and EM120 runs prior to deployment. Both of these helped immensely when flying the vehicle.
Instrument Performance The following are immediate observations of the instrumentation performance. A more detailed
engineering analysis, involving the data collected, will home in on any problem areas highlighted by these observations.
Vehicle
During Runs 1 and 1A the vehicle performed well apart from a number of remote ‘reboots’ of the CTD/Gyro instruments. The CTD was the suspected instrument locking up the serial data stream that links the CTD and Gyro to the embedded microcontroller (K42) in the vehicle. Prior to Run 2 the CTD was swapped out for the spare unit.
Umbilical and Swivel
The umbilical performed well up until Run 2A when the power-up test, with vehicle and umbilical in water prior to the deployment of depressor weight/swivel, failed. On-deck tests pointed to an umbilical failure so the vehicle was recovered. Prior to Run 2B the umbilical was replaced by the spare.

The swivel was the main source of system down time. Failure ending Run 1B was traced to major water ingress into the unit. Subsequent failures, Runs 2, 2B and 2C were attributed to component failures in the swivel unit.
Sidescan
The system performed well with excellent records of mid-ocean ridge structures which aided in planning dredge and rock drill sites as well as geological interpretation. The power failure ending Run 1A resulted in a damaged sonar chassis with multiple component failures in both profiler and sidescan electronics. This was due to the repeated power dropouts prior to total power failure. The sonar electronics chassis was replaced with the spare unit.
Magnetometer
The unit worked well throughout the cruise providing valuable data on the spreading ridges in the survey area. The output did lock up (frozen display values) when a power cycle was conducted too quickly. A few minutes of power down to allow voltages to fully fall solved this. Magnetometer was calibrated at start of Run 1 involving 180º and 360º turns in the vehicle track, at a shallow vehicle depth (300-400m), prior to descent down to survey altitude.
Gyro
The unit performed well with the data stream only being corrupted when the CTD locked up. The system returned to normal once the CTD had been correctly rebooted. The gyro proved a valuable aid to processing and geographically referencing sidescan swaths.
CTD – FSI Serial No. 1426
For the majority of the cruise the CTD worked well, although during the survey the unit had to be rebooted numerous times. This had the effect of freezing the CTD and gyrocompass readings until the CTD could be fully rebooted. Due to time pressure and the ability to reboot the unit remotely it was decided not to recover the vehicle to try the other spare. A full assessment of this unit, in and out of the vehicle, will be done back at NOC. The spare unit (Serial No. 1425, with Subconn connector) was fitted prior to Run 2 but due to other failures was not fully run in-situ.
The CTD unit has provided valuable data with a possible location of plume up-welling (a large change in salinity measurements). This is being processed by the scientific party.
Pitch/Roll
This unit performed well for the whole cruise.
LSS
The light scattering sensor was used throughout the cruise. Again there is initial indication of variation in data related to possible hydrothermal plumes. This is, again, being analysed by the scientific party.
Swath bathymetry
The unit performed well with only occasional periods of the port side being washed out at the far range. From observations in this cruise, it could be seen that there is a good 1.5 km range for the starboard swath with approximately 1km for the port side.
Deck Unit
The system proved very reliable in operation throughout the cruise. A voltage of 320V was used to power the vehicle with a current of approximately 600mA.

Instrumented Sheave
Not required on this cruise since James Cook had the facilities in place and wire out data were available in a text file. It was noted that the double grooved sheave on the James Cook has poor lateral movement which resulted in the cable jumping grooves. This needs remedying before further deep-tow use and preferably a single grooved sheave with wider lateral swing installed.
Winch – TOBI Portable
Not required on this cruise, James Cook had a fully operational deep tow winch with an inner coaxial cable for power, communication and data streams.
Data Recording and Display
Data from the TOBI vehicle is recorded onto 1.2 Gbyte magneto-optical (M-O) disks. One side of each disk gives approximately 16 hours 9 minutes of recording time. All data from the vehicle is recorded along with the ship position taken from the TOBI portable GPS receiver. Data was recorded using TOBI programme LOG.
As well as recording sidescan and digital telemetry data, LOG displays real-time slant-range corrected sidescan and logging system data, and outputs the sidescan to a Raytheon TDU850 thermal recorder. PROFDISP displays the chirp profiler signals and outputs them to a Raytheon TDU850. DIGIO9 displays the real-time telemetry from the vehicle – magnetometer, CTD, pitch and roll, LSS – plus derived data such as sound speed, heading, depth, vertical rate and salinity.
LOG, PROFDISP and DIGIO9 are all run on separate computers, each having its own dedicated interface systems.
Data recorded on the M-O disks were copied onto CD-ROMs for archive and for importation into the portable NOC image processing system (PRISM), which was used on board for further processing and mosaicing.
Deliverable Items • Copies of M-O discs on CD-ROM plus associated document files, numbered 301 – 316. • Real time thermal printout of raw sidescan (only Time Varied Gain applied). • Real time thermal printout of raw non-motion-compensated profiler (made available but not
generally looked at at sea). • Copies of raw data on DVDs and portable hard disk drive supplied by scientific party. • Digital data stripped out of data files and put in text files for easy scientific access, since there
were problems with PRISM in achieving this.
Summary The system performed well overall, with some excellent sidescan imagery. This provided vital
data to aid nominating sites for rock drill and dredging operations. The system will be reviewed, in light of the reported faults, back at NOC in preparedness for further cruises this year. As summarised earlier 10.14 days of data was achieved, out of a budget of 15 days, with 24 hours down time. The primary source of breakdown is the deep tow swivel unit.
Reference and Contacts TOBI technical reference: ‘TOBI, a vehicle for deep ocean survey’, C. Flewellen, N. Millard and
I. Rouse, Electronics and Communication Engineering Journal April 1993.
e-mail: [email protected], url: http://www.noc.soton.ac.uk

JC007 TOBI Side-Scan Sonar Processing Method Using PRISM C.Mallows
1 Importing the Data The raw TOBI data were imported directly from CD into PRISM using the following syntax:
# raw2prism_tobi -i/media/cdrecorder/TOBI.DAT -o jc007p<passnumber>.cdf -f4
The -f argument refers to the sub-sampling factor imposed on the data. It is recommended in the PRISM manual [Le Bas, 2002] that a sub-sampling factor of 8 is used (i.e. smooth data over 8 pixels), which results in a final pixel resolution of 6 metres, close to the physical resolution of the sonar. However, it was found that using a sub-sampling factor of 8 greatly reduced the dynamic range of the data, with features seeming to take on either a black or white appearance and restricted mid-tones. A trial was conducted using a sub-sampling factor of 1 – giving full resolution data at 0.75 metres per pixel. This vastly improved the dynamic range, allowing for a greater array of textures to be visible in the final image, but this increased the file size and processing time to the point where it would have been impractical to process the whole survey area by this method. As a result, a sub-sampling factor of 4 was decided upon, which provided a compromise between pixel resolution (3 metres), dynamic range and processing time. It was also decided that after the survey, areas of specific interest might be re-processed at a higher resolution.
2 Navigation Data A log of the ship’s geographic position varying with time was downloaded daily from the ship’s
computer, as was winch data – giving values for cable out and also haul and veer rates with respect to time. These two files were formatted separately and tested for abnormal variations in, for example, speed, heading, position and veer rate using the programs navedit and testcable. It was found that the data rarely contained any erroneous points, and any such occurrence was usually corrected manually in a text editor. Data were available every second, but it was decided this should be decimated to minutes to reduce file size with negligible loss in positional accuracy.
After the continuity of the data had been checked in the .nav and .cable files, a program called wireout was used to dynamically model TOBI's position. This program produces a .veh_nav (vehicle navigation) file which is later correlated in the time domain with the imagery header files to give the exact location of each ping (see section 4 mrgnav_inertia).
3 Testing Imagery Data After the .cdf files had been imported using the method outlined in section 1, they were tested
for abnormalities within the image content and the header information associated with each TOBI pass. It was often found (using the headergraph program) that TOBI header files contained several anomalous pressure recordings per pass, in which case these were simply eliminated and interpolated across manually. Heading directions would also apparently instantaneously switch between, for example, -90º and +270º, although this was found to have no effect on the final imagery.
TOBI altitude values were often very “rough” looking (i.e. having large steps from ping to ping with a distinct lack of continuity) and so for each pass the user called the program widealt, which uses search parameters to detect the first arrival of energy back-scattered from the sea floor. This process could have been carried out automatically within the PRISM processing flow, but it was thought that in areas where the sea-surface reflection is more complex, the automated process would not establish accurate altitude values. These values could then be extracted and re-written to

the original header file and corresponding cdf image. The general syntax for calling the widealt program is as follows;
# widealt -i jc007p<passnumber>.cdf -o jc007p<passnumber>.cdfnew -s -r3.0 -a
where -s plots the altitude values onto the output file so that they can be visually examined for accuracy and continuity, -r is the pixel resolution in metres and -a switches on fish altitude smoothing along detection of the first break. Additionally, the -f argument can be used to force widealt to start its search from a given altitude (this is especially useful when the start of the imagery corresponds with a distinct sea-surface reflection – usually on turns where TOBI is towed at a higher altitude), and the -w argument to specify the threshold values and search parameters for detecting the first arrival.
It was found that for the majority of each pass (>90%), the widealt program would successfully detect the first arrival of sonar energy and give a good approximation of TOBI altitude. However, in areas where the sea-surface reflection crossed the first arrival of useful data (i.e. where the time it takes for energy to travel from TOBI to the sea-surface and back is less than the time for energy to travel from TOBI to the sea floor and back), widealt struggled to give an accurate measurement of TOBI altitude (as it could not 'look' beyond the high amplitude sea-surface reflection). In these instances, the user either:
1. applied suppress_tobi (see section 4) to the imagery data and then re-ran widealt, or, 2. measured altitude values manually from raw imagery and modelled the curve which would
best fit the data. This could in part be done using the -b option in widealt, which will linearly interpolate between two specified values that are known to be an accurate representation of TOBI altitude (this option is not yet documented in the PRISM manual).
4 TOBI Processing Flow Before the TOBI data were processed, the PRISM processing flow was tailored in order to
maximise the signal to noise ratio. Individual parameters were manually adjusted, the effects of which were monitored visually in the imagery, and then either accepted or rejected depending on the outcome. This process was repeated until it was thought the signal to noise ratio could not be increased further. The final processing flow/sequence (as shown in the commands.cfg file in the JC007 /nav directory) was as follows:
------------------------------------------------------------------
suppress_tobi -i %1 -o %0 suppress_tobi -i %1 -o %0 # tobtvg -i %1 -o %0 -a mrgnav_inertia -i %1 -o %0 -u 200 -n navfile.veh_nav # mrgnav_usbl -i %1 -o %0 -n navfile.veh_nav tobtvg -i %1 -o %0 -h -l 50 # use track heading tobslr -i %1 -o %0 -r 3 , res # foldtobi -i %1 -o %0 -t 400 edge16 -i %1 -o %0 -m drpout -i %1 -o %0 -t 100 -f -p -k 201 drpout -i %1 -o %0 -t 100 -f -p -k 51 shade_tobi -i %1 -o %0 -t1,4095
------------------------------------------------------------------
Working through the processing flow in order:

suppress_tobi is a program that searches along the amplitude of each ping until it finds a spike that occurs as a result of sea-surface reflection. It then removes this effect by smoothing the amplitude of points adjacent to the spike. This was run twice as it was occasionally observed that after running it once, traces of the sea-surface reflection still remained – possibly as a result of decreasing the pixel size from 6 metres to 3 metres. In the final imagery, traces of the sea-surface reflection are still present, where PRISM seemingly either fails to detect the reflection or fails to interpolate across it. Figure 9 demonstrates the effects of suppressing sea-surface reflections using PRISM:
Figure 9: TOBI sonar imagery pre-sea-surface-suppression (left) and post-sea-surface-suppression (right). The
reflection is still visible as a faint line in the right hand image.
tobtvg is a program that smoothes out TOBI altitude values. As this process was carried out manually by the user using widealt (see section 3), it was commented out and hence not applied during the final processing sequence. The effects of applying tobtvg and widealt on the same image file is to create 'footballs' in the data – where tobtvg apparently smoothes the altitude values specified from widealt into the dark area – where the sonar signal is travelling down through the water column – at the centre of the raw data.
mrgnav_inertia calculates the position of each ping from the vehicle navigation (.veh_nav) file and TOBI header file. The umbilical length was set to 200 metres (-u argument) and it was specified that the program should use cable values inherent in the cable file and not the TOBI header file (this was done by removing the -t option).
tobtvg smoothes out the gyro heading values contained within the TOBI header file across 15 pings (as per the PRISM manual suggestion). It was initially thought the heading values would not

need to be smoothed, although processing without this part of the sequence led to 'bow-ties' in the final image as a result of misaligned pings.
tobslr is a slant range correction that was adjusted to include a 3 metre pixel resolution.
foldtobi can be used to see if noise correlates from port to starboard side, in which case it is removed and replaced with an average value from adjacent pixels. It was found that this process merely reduced the clarity of useful data, indicating there was little coherent noise from port to starboard, and hence it was excluded from the processing flow.
edge16 applies a median filter to the data in order to reduce 'speckle' noise which is frequently observed along the edges of TOBI tracks as a result of the high time-varied gain amplifying noise here. There are a variety of filters available to the PRISM user, including: Laplacian filter, Sobel's edge enhancement and Kirsch's edge enhancement. It was found, however, that applying these filters removed 'speckle' noise at the expense of maintaining an acceptable contrast at the edge of each TOBI profile, and hence the default cross pattern filter was used (denoted by the -m option). Figure 10 shows the effects of speckle noise removal:
Figure 10: TOBI sonar imagery pre-speckle-noise-removal (left) and pos -speckle-noise-removal (right). The effects
of this processing stage are slight, but there is a general increase in signal to noise ratio apparent along the edges of the right hand image.
drpout corrects for the effect of vehicle yaw on the imagery. TOBI has a beam sensitivity of 0.8º [Le Bas, 2002], and hence vehicle yaw within the 4 second ping greater than this value can mean that
data is essentially transmitted but not received. drpout examines the data for a large negative gradient indicative of these ping dropouts, and interpolates across them. A gradient threshold value of 100 (denoted by -t 100) was found to remove the majority of dropouts from the data without vastly compromising signal to noise ratio (higher threshold values seemed to lead to features having better resolution in the final image with dropouts still remaining, and vice versa). The -k argument was set, following the PRISM manual, to 201. This value specifies that drpout searches for total ping dropouts. Figure 11 shows the effects of dropout removal processing on TOBI imagery:

Figure 11: TOBI sonar imagery pre-dropout-removal (left) and post-dropout-removal (right). There is a slight
decrease in resolution on the right hand image.
drpout with a k value of 51 eliminates partial line dropouts (using the method outlined above) that occur when vehicle movement is such that a partial signal is received from the transmitted sonar energy.
shade_tobi equalises the illumination of near and far offset pixels by assuming that the average amplitude over a given range of pixels should remain constant. LeBas (2002) states that near- and far-offset pixels appear dark because they are near the edge of the transducer’s beam pattern and (at far range) have a low angle of incidence. Hence the amplitude of near and far offset pixels are increased by 1.5 and mid-range pixels are reduced in amplitude by a factor of 0.8.
5 Creation of Map Directories PRISM has a built in program called mapchoose that identifies the position of each of the TOBI
passes stored in the cdf directory, and then logically groups segments of each pass together into a map so that the processing of the final imagery files using the ERDAS Imagine software is more straightforward. In general, mapchoose will define approximately 8-12 maps per 10 TOBI passes (this is partially dependent on pixel resolution), which can then be processed as detailed in section 6. Running the command mapchoose will print to screen a list of the maximum and minimum latitudes and longitudes for each map – the four extremes (WESN) should be noted down at this point for the creation of 3D Fledermaus files at a later point (see section 7). If they are not recorded, each map’s position can be determined later on from the mapn.dat file in each map directory (where n is the map number). These should all be checked to determine the maximum and minimum values.
Alternatively, mapcreate could be called to allow the user to manually define the WESN co-ordinates of the map and the number of imagery files to be processed. This was found to be a useful

program if areas of specific geological interest were re-processed at greater resolution (for explanation see section 1).
6 PRISM processing After sections 1 to 5 had successfully been completed, it was possible to process the data using
the PRISM command. This essentially calls the processing flow defined in the file commands.cfg (see section 4) and systematically implements it to the segments of data that are allocated to whichever map is being processed. There are 11 options that must be satisfied to run the PRISM command, which are as follows:
1. Data type 2. Map number 3. Cruise name 4. First pass number 5. Last pass number 6. Specify whether to delete intermediate files 7. Maximum course deviation before splitting layer (see section 1.7) 8. Line increment 9. Resolution in metres 10. Location of imagery files 11. Location of navigation data
The syntax typically used to execute PRISM processing when the current directory is the map directory to be processed is as follows:
# prismcom tobi 1 jc007 1 11 y 360 20 3 ../../cdf ../../nav
Maximum course deviation was set to 360º as it was found that the relocation of each ping was accurate enough for the data to be modelled around corners, meaning individual maps did not have to be excessively layered.
The output from running PRISM is a set of .dxf files and a layered .lan file (per map) that could then be exported into ERDAS Imagine (Windows OS) for a map mosaic to be created.
7 Image creation using ERDAS Imagine and DMagic The PRISM .lan and .dxf files were imported into ERDAS Imagine, which converts them into a
single .img file for each map area. As the TOBI lines were spaced at 6 kilometres, there was very little or often no overlap between adjacent passes, meaning the .img files were normally composed of a single layer. However, if overlap occurred (typically on corners), the .img file would then comprise a number of layers which could systematically be switched on and off. In this scenario, the user had to define an area of interest (AOI) around each layer and stencil these together to create an .img file of just one layer. There is a known bug in ERDAS whereby an area of interest with too many acute angles (i.e. a complex AOI) will result in a grid of dashed lines being superimposed on the final image upon stencilling the layers together. This often meant AOIs had to be simplified to overcome this effect.
After each of the maps had been stencilled into a single layer, particularly noisy areas could then simply be trimmed from the imagery. The maps were then mosaicked together, creating a final

image of the survey area. It was found that a gamma correction was needed to slightly equalise the contrast between areas of high and low backscatter (e.g., neovolcanics and sediment), as this made the final image easier to interpret.
At this point, the resultant .img file could either be exported as a high resolution .tif file (for use, in say, ArcGIS), converted into an ERDAS .map file with gridlines for plotting (this was commonly used for dredge and drill site selection purposes) or converted from 16 to 8 bit (which was subsequently exported as a .tif - this was necessary for Fledermaus .sd files to be created).
To create a 3D TOBI sidescan image for visualisation in Fledermaus, the program DMagic was used (from the File menu > create textured 3D surface). The 8 bit .tif file and bathymetry .dtm must then be specified, as must the bounding geographical co-ordinates of the sidescan imagery (see section 5 for how to determine this). This is often a slow process, but the resultant .sd file can then be viewed in Fledermaus.
It is also possible to export .grd files for use in GMT [Wessel and Smith, 1998].
Figures 15 below shows a summary of the data and processing flow from raw data to importation into Fledermaus.

Figure 15. Summary of the data and processing flow from raw data to importation into Fledermaus.
Cable data
Ship’s navigation
data
Raw TOBI
Data
TOBI vehicle
navigation
PRISM
.lan files
.dxf files
ERDAS Imagine
.tif files
e.g. ArcGIS
ERDAS .map files
16 to 8 bit conversion of .img file
.tif files
D-Magic
Raw bathymetry
data
Neptune
.xyz file
.grd file
GMT
.dtm file
Fledermaus

TOBI magnetic and depth processing Roger Searle
Preliminary processing Magnetic data were forwarded by the TOBI team in the form of files JC007_$m (where $m = pass number as 1, 1A, 2, etc.):
Hr min sec day/year magx magy magz
0 37 48 074/2007 -156006 51351 48636
where magx, magy and magz are the uncalibrated magnetic signals along the port, forward and down axes of the TOBI vehicle.
TOBI attitude (in degrees), depth and CTD data were forwarded separately in files jc007p$n: (where $n = pass number as 301, 301A, 302, etc.)
Year mon day hr min sec roll pitch gyro press temp cond cable
2007 3 15 0 37 48 -4.34 0.234 -57.1 1156.13 2.81 24.60125 200
where roll is positive down to starboard and pitch is positive nose down. These latter files were converted to Excel spreadsheets, had magx, magy, and magz inserted by hand, and the manufacturer’s magnetic calibration applied as follows:
where Bx, By, Bz are the three components of magnetic field, in nT, along the port, forward and down axes of the TOBI vehicle, and B is the total field. No correction was made for vehicle pitch or roll at this stage, nor for the magnetic field of the vehicle itself. These corrections should be applied in future processing, but are not likely to have a large effect (apart from a DC shift) on our observations along straight E-W tracks. Decimal Julian day was sometimes added for convenience. The final spreadsheet is as follows: jc007p$n-mag.xls:
222
and ;321
0296533.1 0068992.0 0070859.00465985.0 0322001.1 0037991.00745943.0 0057871.0 9996297.0
;0000618.00002495.00001508.0
321
;524288/45.2*magzmagymagx
zyx BBBB
VVV
BzByBx
VzVyVx
VVV
VzVyVx
++=
⎟⎟⎟
⎠
⎞
⎜⎜⎜
⎝
⎛×⎟⎟⎟
⎠
⎞
⎜⎜⎜
⎝
⎛ −−=
⎟⎟⎟
⎠
⎞
⎜⎜⎜
⎝
⎛
⎟⎟⎟
⎠
⎞
⎜⎜⎜
⎝
⎛
−+−
+⎟⎟⎟
⎠
⎞
⎜⎜⎜
⎝
⎛=
⎟⎟⎟
⎠
⎞
⎜⎜⎜
⎝
⎛
⎟⎟⎟
⎠
⎞
⎜⎜⎜
⎝
⎛=
⎟⎟⎟
⎠
⎞
⎜⎜⎜
⎝
⎛

Yr mon day hr min sec magx magy magz Vx Vy Vz V1 V2 V3 Bx By Bz B roll pitch gyro press temp cond cable
2007 3 15 0 37 48 -156006 51351 48636 -0.74 0.24 0.23 -0.74 0.25 0.23
-30499.33 10439.2 9405.8701 33580.595 -4.34 0.234 -57.1 1156.13 2.81 24.60125 200
Split TOBI passes on the same magneto-optical disc (e.g. following a system restart) are numbered 1, 1A, etc. But the PRISM processing suite will only accept numerical filenames! Therefore for consistency, at this point the magnetic files jc007p$1-mag.xls etc. were now renumbered to match the files used for sidescan processing in PRISM. Thus 1 is 1, 1A becomes 2, 2 becomes 3, etc. Table 1 gives the time ranges and numbers of lines in each file.
Table 1: Times and numbers of lines in file used for PRISM and magnetic processing. Note these file names are numbered sequentially, unlike files on original TOBI data discs which are split as 1, 1A, etc. where more than one file occurs on each physical disc.
These files were then combined into new files jc007_mag_line1.xls etc. which correspond to the TOBI survey lines, numbered from south to north.
At this point the TOBI navigation data were obtained from the PRISM processing in a single file jc007_veh_nav.dat
We then used a modified version of the Matlab program getline.m, written by Simon Allerton during Charles Darwin cruise CD99, to merge TOBI navigation with the jc007p$n-mag files to yield
line2_mag.nav etc. (unformatted output from getline) and
line2_mag.nav1 etc. (formatted output from getline):
File No. of lines Yr Mon Day Hr M S Yr Mon Day H M S
Start End
jc007p2.cdf 9847 07 03 15 01 37 40 07 03 15 12 34 04
jc007p3.cdf 14536 07 03 15 12 34 12 07 03 16 04 43 12
jc007p4.cdf 14536 07 03 16 04 43 16 07 03 16 20 52 20
jc007p5.cdf 14536 07 03 16 20 52 24 07 03 17 13 01 22
jc007p6.cdf 14536 07 03 17 13 01 28 07 03 18 05 10 32
jc007p7.cdf 14536 07 03 18 05 10 36 07 03 18 21 19 38
jc007p8.cdf 14536 07 03 18 21 19 42 07 03 19 13 28 46
jc007p9.cdf 7046 07 03 19 13 28 50 07 03 19 21 18 32
jc007p10.cdf 7490 07 03 19 21 28 14 07 03 20 05 47 34
jc007p11.cdf 9923 07 03 20 05 47 42 07 03 20 16 49 16
Year Mon Day Hr Min Sec JD magx magy magz Vz Vy Vz V1
V2 V3 Bx By Bz B roll pitch gyro press temp conduct cable Jsecs TOBI_lat TOBI_lon
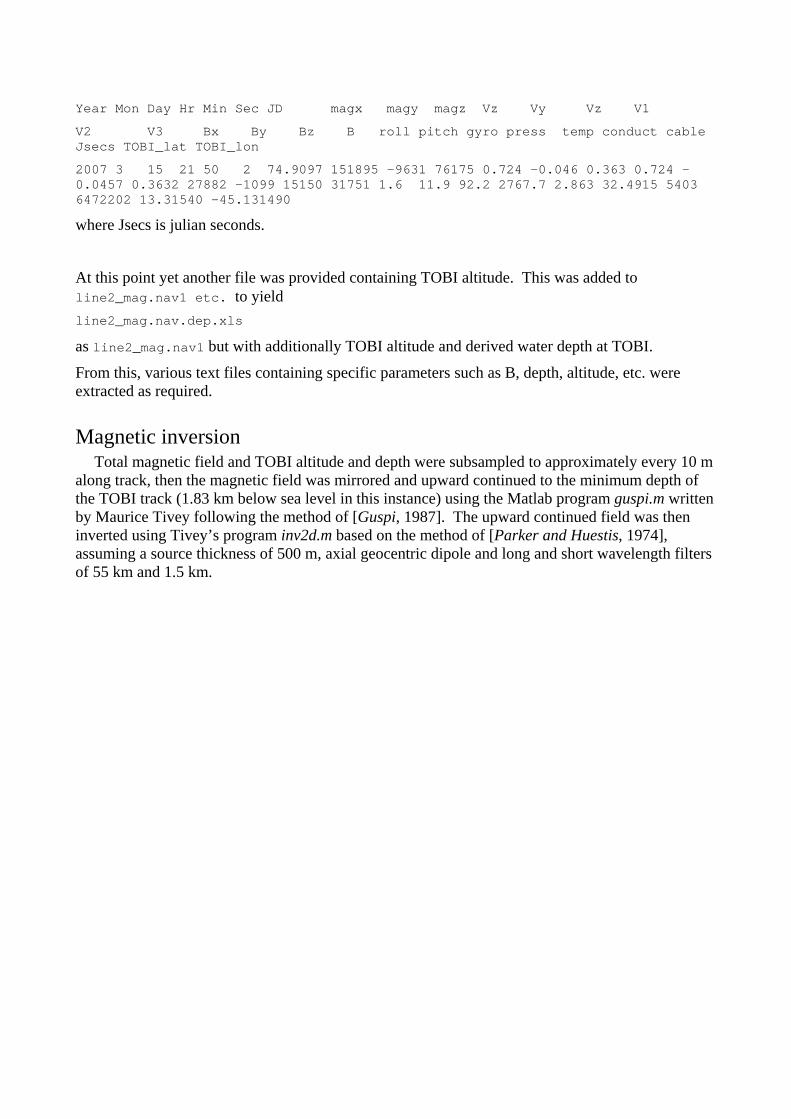
2007 3 15 21 50 2 74.9097 151895 -9631 76175 0.724 -0.046 0.363 0.724 -0.0457 0.3632 27882 -1099 15150 31751 1.6 11.9 92.2 2767.7 2.863 32.4915 5403 6472202 13.31540 -45.131490
where Jsecs is julian seconds.
At this point yet another file was provided containing TOBI altitude. This was added to line2_mag.nav1 etc. to yield line2_mag.nav.dep.xls
as line2_mag.nav1 but with additionally TOBI altitude and derived water depth at TOBI.
From this, various text files containing specific parameters such as B, depth, altitude, etc. were extracted as required.
Magnetic inversion Total magnetic field and TOBI altitude and depth were subsampled to approximately every 10 m
along track, then the magnetic field was mirrored and upward continued to the minimum depth of the TOBI track (1.83 km below sea level in this instance) using the Matlab program guspi.m written by Maurice Tivey following the method of [Guspi, 1987]. The upward continued field was then inverted using Tivey’s program inv2d.m based on the method of [Parker and Huestis, 1974], assuming a source thickness of 500 m, axial geocentric dipole and long and short wavelength filters of 55 km and 1.5 km.

The ‘BRIDGE’ seabed rock drill Chris MacLeod
The British Geological Survey (BGS) ‘BRIDGE’ seabed drill is designed to take metre-long orientated rock cores from hard substrates in full ocean depths (now up to 5500m). It is so named because the original development of the drill was funded by the NERC BRIDGE (‘British Ridge Inter-Disciplinary Global Experiment’) programme in 1996-98 {Allerton, 1999 #3030}{MacLeod, 1998 #3753}(MacLeod et al., 1998b). All subsequent development has been funded by the BGS directly.
The device (Figures 20, 21) utilises a high-speed rotary diamond drill mounted vertically on a tripod frame. It has the unique ability (for a seabed device) of being able to take geographically orientated cores. A scriber is fitted immediately above the core catcher on the inside of a non-rotating inner core barrel, and carves a scratch into the core as it enters the barrel. The scriber is fixed relative to the drill frame, and its orientation measured by means of two compasses mounted on the frame. Combined with readings from the accompanying pitch and roll sensors, the geographical orientation of the cores can be recovered. A video camera on the drill frame allows the operators to assess the seabed and find suitable outcrops to drill.
For cruise JC007 the BRIDGE drill was used for the first time on a fibre-optic cable, allowing real-time video to be transmitted to the surface. On previous expeditions a conducting cable had been used. With the consequent restrictions on band-width, only single frames (transmitted once every 90 seconds) were able to be viewed. The hope was, therefore, that efficiency of site selection would be much improved compared to previous operations.
The drill had undergone successful trials in 1998 on Atlantis Bank (SW Indian Ridge), from the RRS James Clark Ross (cruise JR31), when 16 sites were cored, to a maximum water depth of 800m. In 2001 on cruise JR63, also on James Clark Ross, the system was used for a second time, this time as the principal sampling tool, in surveying the 15°45’N oceanic core complex on the Mid-Atlantic Ridge, in depths of up to 4500m and on slopes of up to 44°. During that cruise {MacLeod, 2002 #3754}{Escartin, 2003 #4075} 73 sites were occupied over the course of 12 days, 63 of which were successful in recovering some kind of core. Approximately 75% of these cores were successfully scribed.
On cruise JC007 we made 30 deployments of the BRIDGE rock drill (Figures 22 to 26 In keeping with previous cruises, sites were designated ‘BRxxx', in this case from BR101 through to BR130 inclusive (JR31 sites were named BR01 to BR16 inclusive; JR63 sites from BR21 to BR93). On the subsequent pages details of the site locations, aims, operations and results are given for each deployment. Reflections upon our sampling strategy, and how we revised it during the course of the cruise, are included there. Visual core descriptions (VCDs) from the successful sites are
Figure 20. The BRIDGE drill during deployment

tabulated separately (appendix 1). Seafloor images from the drill sites are included with the VCDs or with the site narratives where appropriate.
Core was recovered at only 18 of the 30 sites attempted during JC007. Only 7 were successfully scribed. This is a much lower number and proportion than during JR63, from what was a very similar geological (and thus, one would pre-suppose, similar seabed) environment. The additional capability of the live video feed during JC007 should theoretically have increased the efficacy of our sampling.
One reason was that many more technical problems with the drill were encountered during JC007 than on previous trips, several attributable to the new (and essentially untested) fibre-optic communications system. Deployments were curtailed or aborted as a result of technical problems on seven occasions. On three further occasions hard rock was drilled but no core was recovered. However, the inability of the core catcher to do its job in these cases may have been a function of the physical characteristics of the lithology: two at least of the sites were in pillow basalt, which is notoriously brittle and difficult to drill through without it shattering. At a number of the remaining sites, the drill clearly recovered talus fragments (e.g. sites BR102 and BR104). These tended to jam in the drill bit and prevent further penetration.
The other, and perhaps principal, reason for our relative lack of success in comparison with previous cruises is probably the geological environment. Outcrops were few and far between; most of the seabed was covered by unconsolidated pelagic sediment or by talus. Why it should be so different from the otherwise very similar setting of the 15°45’N oceanic core complex, at which basement outcrops were relatively easy to find (even without live video), is not evident. Because the 15°45’N core complex is inactive (1-2 Myr old) it should, if anything, be more thickly covered by pelagic sediment. It is possible that that massif has been stripped of sediment by currents that do not operate in the 13°-14°N area. It is also distinctly possible that, because the present survey area is so seismically active {Smith, 2006 #4774}{Escartin, 2003 #4076}, pelagic sediment drapes are being shaken down slope into the rift valley to blanket the basement.
All BRIDGE drill compass heading directions included in this report have been corrected to true north. Magnetic variation in the survey area of cruise JC007 is 18.1° west: i.e. magnetic north is 18.1° west of true north. Note that this was NOT done in the JR63 cruise report (MacLeod et al., 2001), in which otherwise identical VCDs report compass headings relative to magnetic north (which at 15°45’N is 17.7° west of true north).
Figure 21 Surface monitor panel for the BRIDGE drill

Figure 22. Locations of all JC007 drill sites

Figure 23. Locations of drill sites on Donatello massif

Figure 24. Locations of drill sites on Leonardo massif
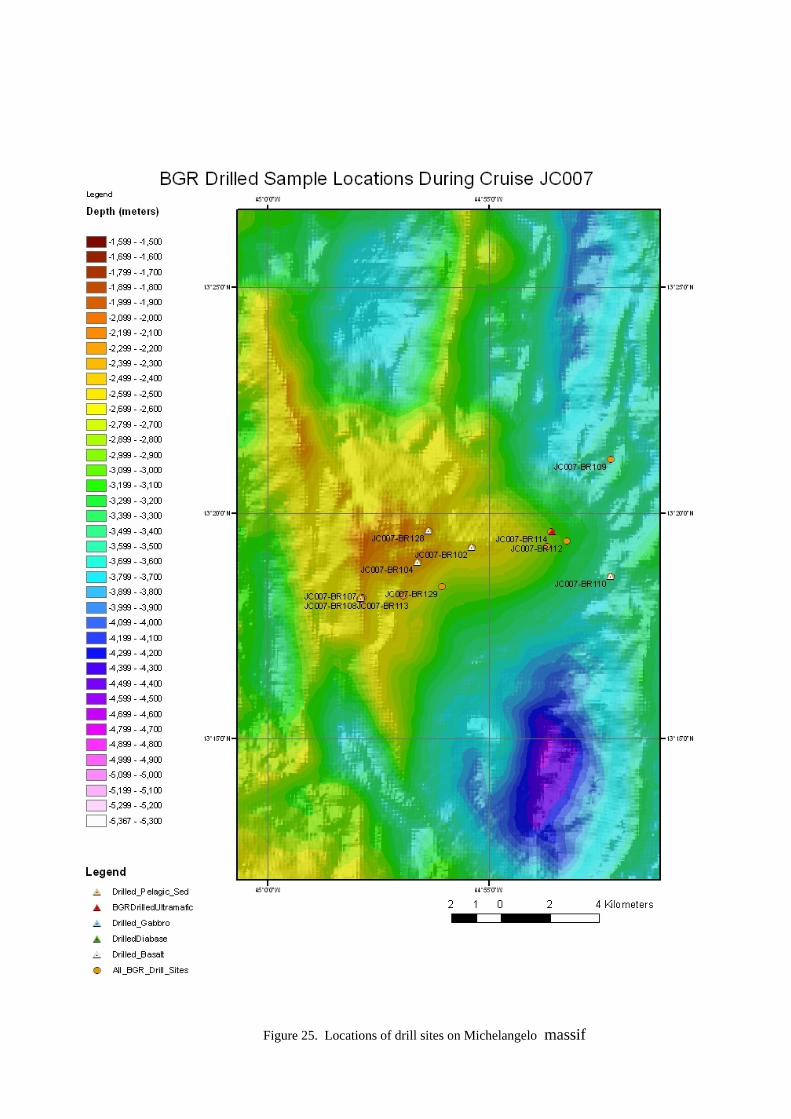
Figure 25. Locations of drill sites on Michelangelo massif

Figure 26. Locations of drill sites in southern part of study area

Oriented Drill use on JC007 D Wallis
Description The Oriented Drill created as part of the BRIDGE programme allows the drilling out and
scribing of rock core from exposed bedrock on the sea bed with the scribe mark indicating the orientation of said core. Due to the limitations of supplying power down a 10 km length of coaxial cable the drill has only a limited number of functions and controls. There are however a multitude of sensors allowing fairly complete monitoring of core collecting operations, as well as a live video feed giving a view of the sea bed alongside the drill.
There are three motors on the drill and because of space limitations it is only possible to run two of these at any one time. The motors power a rotating drill drive, a flush water pump and a retract winch assembly. As the drill and retract functions were felt to be mutually exclusive, only one of these may be carried out at any one time. Flush is available whenever required.
The core collected can be up to 888 mm long and 32 mm diameter and is enclosed in a non-rotating inner barrel, while the drill bit is attached to the outer barrel which is driven by the drill motor and gearbox. The non-rotating inner barrel has at its base a standard core catcher with an oriented scribe. This ensures a score on the core which has been manually lined up with Leg 2on the drill. Leg 2 is also the chosen reference point for the two installed compasses in the system.
Narrative The drill was shipped to Tenerife onboard the RRS James Cook and assembled prior to
departure. Testing was carried out on passage to the work site.
At the chosen location at the Mid-Atlantic Ridge around 13°N the drill carried out 30 sampling dives from which a number of scribed cores were obtained. Not all sites allowed core recovery for a number of reasons. Principally among these reasons was the fact that the sea bed on location was largely covered by sediment or rock detritus and rubble, preventing access to the exposed bedrock for which the drill was designed. However there were a number of component failures on the drill which also hindered the operations.
There were two unrelated connector failures, both attributable to system age or random failure: The main HV input to the drill transformer and a connector for the flush pump motor. The main failing with the system was with the Fibre-Optic link cable between the TOBI deployment cable termination and the drill multiplexer bottle. It was not until site 14 on the cruise where an effective method of making this link was established and this new link was sustained until the end of the survey. Before that time the F-O link gave some results but also failed on a number of dives.
Another source of equipment downtime was with the TOBI termination allowing water ingress on two occasions. This was easily cured, although the cure involved some 8 hours when drill operations were impossible.
Finally the repeated, fairly hard, landings on the sea bed where at times the drill fell over, resulted in some mechanical damage to the drill which stopped operations on two occasions. That the drill could survive most landings undamaged is a tribute to the original design engineer in Galashiels.

Fibre-optic Link This allowed real-time video on the ship which gave scientist an opportunity to view prospective
sites before landing. It also gave the chance to undertake some limited survey prior to selecting a landing spot and as the cruise progressed this ability to select the landing using the vessel DP and the drill compass, gradually improved.

Dredging Bramley Murton
Summary This section contains the following parts:
Rational
Summary Maps
Summary Sheets (one for each dredge)
Hydrothermal Summary
Appendix 2 at the end of the report contains a spreadsheet in which all the dredged samples are described.
Rational Behind Dredge Site Selection In the original cruise plan, dredging was to be both contingent on failure of the BGS
Drill to recover peridotite, and as a way of rapidly sampling a limited number of volcanic sites.
As described elsewhere in this report, a limited quantity of mantle material recovered by the BGS Drill was suitably fresh to enable geochemical analyses. To increase our chances of recovering a more representative sample fresher mantle material, we resorted to dredging at several of the oceanic core complexes. This increased our yield of material, much of which appeared to be variably altered, with some fresh olivine and pyroxene. As such, this material appears to be suitable to fulfil the peridotite geochemical and fabric study objectives.
A suggestion by Kay Achenbach to use unoriented dredged peridotite samples to test the hypotheses for focused vs. distributed mantle upwelling may prove very useful. She suggested comparing the difference in angle between mantle fabric (crystallographic lineation) and palaeomagnetic pole direction. Samples where this angle is small might represent along axis oriented flow whereas those with a high angle will represent either vertical or across-axis flow. Like all palaeomagnetic and fabric studies, this approach requires a statistically viable suite of samples, such as that recovered in the dredged material.
During TOBI and BGS drill down-time, we initiated regional-scale sampling of the basalts. The objectives, as outlined in the original science proposal, were to test the various hypotheses for along axis melt distribution, study the relationship between melt and residual mantle and to explore for signatures relating to low-magma budget spreading (including sites between and opposite oceanic core complexes). The along-axis volcanic sampling objectives were achieved with ten short dredges, each of about 4 hours duration, totalling about 1 3/4 days of science time. The samples collected from the centre of the segment will enable characterisation of the geochemical anomaly at 14°N. The dredge from the southern-end of the segment, just north of the Marathon fracture zone, will capture the full geographic range of compositions.
In general, the segment centre basalts are characterised by plagioclase phyric, variable vesicular pillow lavas. The samples of the southern-end are aphyric and avesicular. Basalts recovered from opposite the oceanic core complexes Michelangelo and Leonard were cpx-phyric, many with ol-plag-cpx assemblages indicating deep, primitive fractionation consistent with a thick lithosphere and a low geothermal gradient.

Elsewhere, our initial impression is that mantle fabrics exhibit the strongest deformation styles towards the centre of the segment, with weaker ones towards the segment-end. The oceanic core complexes exhibit a range of deformation conditions from initial high-temperature ductile flow to final low-temperature brittle faulting. Also on the core complexes, a range of hyperbyssal material was recovered, especially from Raphael and Donatello (the southern and northern OCCs respectively). This material comprised dolerite, diorite and plagio-granite. The acidic rocks attesting to highly evolved, closed system fractionation, possibly during the last phases of magmatism at the onset of detachment faulting, mantle abduction and core complex formation.
Below are a general location map of the dredge sites (Figure 27), dredge locations at Michelangelo and Leonardo OCCs (Figure 29), in the northern half of the study area (Figure 30) and in the southern half of the study area (Figure 31).
Figure 27. Overall summary of dredge site locations.

Figure 29. Dredge site locations at Leonardo and Michelangelo massifs..

Figure 30. Dredge site locations in the northern part of the study area.

Figure 31. Dredge site locations in the southern part of the study area.

LaCoste and Romberg Marine Gravity meter S-75 D Wallis
This meter was asked for at short notice and supplied by BGS along with their drill system. It too was mobilised at Tenerife and the intention is to demobilise on return to Tenerife, using local port base-stations to tie in to the Earth Gravity Network.
The meter concerned had recently had a refit and upgrade at ZLS in Texas and this allowed the upgrades to be tested under real conditions.
During the cruise the system was initially set to work using a computer running XP operating system but as this proved unworkable, the system was reverted to DOS for the period over the Mid-Atlantic Ridge The gravity data were transmitted to the shipboard computer system for logging purposes and a separate set of log files was kept on the host PC and backed up in addition.
The transit to and from the worksite were used to investigate the problems with the XP version and the gravity data were not all logged on the shipboard system during this period. The data files are available for use later if required.

Ship scientific systems Mick Myers, SSM
This report contains details of ship fitted and portable equipments utilised specifically for JC007. For TOBI and BGS Rock Drill please see separate reports.
Scientific Winch System Winches Used
For both TOBI and Rock Drill operations the Deep Tow winch and cable were employed, with the drill deployed at the starboard deployment position and TOBI from its usual aft deployment position. Two problems leading to downtime occurred. Whilst recovering the Rock Drill from the seabed the Deep Tow Jumped No. 6 sheave on the CTCU. The situation was recovered by using the profiled block to clamp the wire outboard of the hangar top sheaves which allowed slack to be given in the winch room and the cable was then re-run through the CTCU before the load was again taken up and the clamp released. Once the drill was recovered to the deck trials were carried out on the winch and CTCU using a 1 ton weight to simulate the package in order to ensure the system was safe to use on future deployments. The tests revealed no further problems and the system was returned to use. Subsequently it was noticed that the Deep Tow Storage winch was not spooling correctly, which led to a riding turn on the drum. In an attempt to rectify this drogues were deployed and the cable streamed to 6000m and recovered whilst the spooling was monitored. This did cure the riding turn but problems with the lays on the drum still existed. It was felt that this could be managed so the winch was put back into use with restrictions on its hauling speed (40m/m) throughout all further operations this was successful and no further problems were encountered. Whilst on transit to Tenerife an area of deeper water was selected and the deep tow was again streamed, this time down to the bottom lay on the drum (9760m wire out). The wire was then recovered once again (and washed on its way in) and this appears to have rectified the problem.
Some concern was expressed during the planning stage about using the Rock Drill on this wire without a swivel, this arrangement has been used previously by BGS on a number of BAS cruises and again worked well on James Cook with the only damage noted to the cable occurring at the point where it rested on the roller during deployment/recovery.
During JC005 trials cruise, speed dependant vibration, which if unchecked developed into resonance, was noted at the CTCU mounting when using this system. This was carefully monitored during JC007 but with the winch speed not exceeding 60 m/m no further evidence of this effect was noticed.
Dredging was carried out using the Trawl wire as the main warp and the only minor problem encountered with this winch system was that on two occasions loose turns occurred on the drum. On both occasions this was easily rectified by veering until the loose turns were taken off the drum and then recommencing hauling.
The CTD wire was used for the deployment of the sound velocity probe on three occasions and this system worked well.
Seabed Dredging
A total of 30 dredges were carried out. Two dredges (D18 & D22) were not recovered. After several dredges returned empty with their bags turned inside out it was decided to

weld the towing bridles into position and dispense with the shear pins in an attempt to stop the mouth of the dredge from turning over; this appears to have been successful.
The major perceived problem with the dredges was the lack of ability to utilise a pinger. The pingers carried operate on 10 KHz whereas the ship fitted EA600 echo sounder operates at 12 KHz. To resolve this conflict the EA500 was retro-fitted to the STBD Drop keel prior to departure from Southampton. Unfortunately the TDR connection flooded when deployed and therefore we were unable to test the system during JC005 trials cruise. During the Mob period in Tenerife the TDR connection was repaired but the echo sounder failed to work once at sea. Extensive fault finding indicated probable failure of the 10 KHz TX/RX board for which no spares were carried on this cruise. It was anticipated that the EA600 would be capable of communicating despite the difference in operating frequencies and indeed after synchronising the sounder and pinger together it appeared that this would be the case. However, after a period of tracking the pinger at a fixed depth of 35m the trace began to drift eventually apparently “tracking” the pinger all the way to the seabed despite the fact that it had not actually moved. (Note: a later attempt at syncing the pinger/sounder indicated that the pinger had become airborne!) EA500 to be repaired during NOC port call which should resolve this issue.
The deck winch provided for this operation was in a generally poor state of repair when delivered to the vessel and it was noticed that the scroll follower was sticking at one end of the winch. Investigation revealed damage to the scroll shaft. In order to continue using the winch the scroll follower was disconnected and the pennant wire hand scrolled onto the winch when used. It was also noted that the hydraulic hoses supplied were also in a somewhat less than perfect condition and this was evidenced by a burst on the supply to the dauntless 2.4t
CLAM The Cable Logging And Monitoring system performed to specification throughout the
cruise. Some 30 drill deployments, 30 dredge operations and 1 successful and 3 aborted TOBI missions were monitored without problems.
An operational characteristic was discovered during the 12 day continuous TOBI deployment in that after a number of days an internal buffer is exhausted and the PC has to be stopped and rebooted. An augmentation to the system is proposed during the forthcoming Southampton port call in which additional system resources will be fitted together with a reinstallation of the operating system. This should clear out any redundant files and result in a more efficient utilisation during subsequent cruises. A text file of the complete winch operating data is available for viewing should this be required.
During the cruise an additional monitor was fitted beneath the parallelogram on the starboard deck to facilitate viewing by the winch operator whilst out on deck, this proved to be a popular addition to the system.
Computing TECHSAS/Level C Data Logging
As well as being the first scientific cruise of the RRS James Cook, this is our first experience of logging data exclusively with Ifremer's TECHSAS logging system, rather than with the older RVS developed Level A and B systems.
The following data was logged via TECHSAS:
• Ship's Gyro • Position data from the Applanix POSMV

• Satellite data from the Applanix POSMV • Attitude data from the Applanix POSMV • Gravity data from the BGS gravity meter • Magnetometer data • Winch data from the SuperCLAM system • Bathymetry from the Kongsberg EA-600
We would normally hope to log water speed via the Chernikeeff EM log, but the system has yet to work correctly.
The TECHSAS system closes its current files and opens new ones at midnight GMT. During the day these files were transferred over to the Level C and read into Level C data streams. One of the utilities that is used to do this currently has a problem with the EA-600 data file, and so at present this data is only available as a NetCDF file.
Once the data are in Level C data streams, we can use our software to examine the data and do any processing. During JC007 a daily combined ASCII file of winch and navigation data was provided to the scientific party. As well as this, the graphical data editor was used to edit large spikes from the magnetometer data, which was then processed using the promag software to derive a magnetic anomaly value.
As well as providing data files for use on the Level C, the TECHSAS system was used to create the serial data streams used by the scientific ship display system (SSDS) boxes mounted at various places around the ship.
During the cruise there have been some niggles with the TECHSAS system – some of which have been sorted out now, and some of which still need to be sorted out.
The Linux system on which TECHSAS runs jumped to BST during the cruise. This caused incorrect times in all data files for a few days. The Level C utility modtime was used to correct this and the TECHSAS boxes were set up to always stay in GMT.
There were initially problems in getting the magnetometer to log, and we eventually asked the TECHSAS support people at Ifremer what we were doing wrong. There was quite a fast response, and with their help the acquisition module was finished. This particular, rather old, magnetometer was never meant to be used on this cruise, but unfortunately was needed because the new magnetometers had not arrived in time.
The version of TECHSAS currently in use on RRS James Cook appears to have a memory leak. This causes the program to slowly use up all available physical memory, and after that, all available virtual memory until the operating system crashes. This necessitated regular reboots of the TECHSAS system throughout the cruise. A new version of the software is waiting at Southampton.
Hydrographic Suite Kongsberg EM-120 Deep Multibeam System
This system was run for the majority of the cruise. Because of the extraordinarily good weather, the data are better than we expected. However there is still noticeable noise (caused by aeration) on the data, even at relatively low speeds.
Two major sections of data (the two sections of the TOBI survey) had various amounts of processing done to them during the cruise. All the data have had position spikes removed and the navigation data smoothed out, then divided into blocks for data cleaning. These blocks have then been exported in gridded ASCII XYZ format, so that the scientific party can get a quick look at the data. At the time of writing five of the eight blocks of data which comprise the first part of the TOBI survey have been cleaned and re-exported.

This data cleaning has been relatively time consuming compared to data obtained from the EM-12 system on RRS Charles Darwin for two reasons:
2. The greater number of beams – the EM-12 has 81, whereas the EM-120 has 191; 3. Aeration noise in the data caused mainly by the bulbous bow.
In addition to the two sections of the TOBI survey, an ad-hoc survey was made up of some data logged during small passages between stations. This was fully position-processed and cleaned.
Simrad SBP120 Sub Bottom Profiler
Run but not used extensively by the scientific party.
Simrad EA500 10KHz Single Beam Echo Sounder
The EA500 system was fitted in Southampton prior to sailing on JC005 trials cruise. The transducer is fitted to the starboard drop keel and the deck unit mounted in the main lab. On sailing the drop keel was deployed and the TDR connection flooded. This was repaired in Tenerife but unfortunately it was discovered on commissioning the system that a fault still existed. The transducer was checked correct and it was found that the echo sounder does transmit but is unable to receive either echoes or transmissions from the pinger. After in-depth fault finding was carried out it was discovered that the TX/RX board was not functioning correctly, no spare for this unit was carried on this cruise and therefore this needs to be rectified on return to NOC.
Simrad EA600 12KHz Single Beam Echo Sounder
Run continuously throughout the cruise. Some concern was expressed over the accuracy of this system when compared to the depth indication from the multibeam. It appeared that during TOBI operations the depth indicated by the EA600 was more accurate than that from the multibeam whilst when drilling the EM120 appeared to give more accurate data. Both systems were fed with the same sound velocity profile. Generally it would be expected that the EA600 would provide more accurate indication of depth due to its narrower beam width than that achievable from the EM systems. However, when using DP to remain on station or make small “bunny hops” during drill operations the failure of the azimuth thrusters meant that there was a much higher demand placed on the tunnel thrusters which is believed to have caused the observed loss of accuracy.
Navigational suite USBL (Ultra Short Base Line)
Two units, Sonardyne 7970 Super Sub Minis, were used with one always on permanent charging giving continuous operational coverage. These were used in conjunction with the ship fitted Sonardyne Fusion Navigation System. The primary use was to provide positioning of the BGS Rock Drill. Due to the units’ 4000m rating all but one drill site was covered by the USBL system.
The units performed very well and in particular showed their value at a drill site late in the cruise by being use to reposition the drill back onto a favoured site after moving some way off. The original USBL position of the favoured site were keyed into the ship’s Dynamic Positioning system and allowed the site to be relocated.

Waterfall Display / 10 KHz Pingers
This system was to assist in dredging operations. The 10 kHz pinger was attached to the wire 100m above the dredge. The unit was then to be tracked using either the EA600 / EA500 or waterfall display, the latter being the primary tracking system. Neither system was able to track the pinger. Further tests were conducted by attaching the 10 kHz pinger to the rock drill on all deployments giving numerous test periods while the rock drill was descending and ascending the water column. Again there was no success in tracking. This needs further investigation on trials cruise JC009.
Portable Equipment Magnetometer
The magnetometer was towed on passage and during all TOBI operations, with the deck unit mounted in he Deck Lab. It failed once during use, the cause of which was identified as overheating and was rectified by the use of an external cooling fan. Some difficulties with logging the measured data on Techsas logging system arose and were resolved by a combination of onboard and shore-based technical support. Due to water ingress as a result of splashing when using the adjacent rock saw, the magnetometer plug surge protection tripped; this in turn caused an earth on the ship’s supply; however, as the equipment was not in use at the time no down time resulted. The rock saw was re-sited to the Water Sampling Lab, which appears to be a better place to use it, and the magnetometer was repaired. Unfortunately, the investigation to find the earth on the ship’s supply led to multiple system shutdowns including Techsas (resulting in an approximately 30 minute gap in logging data), MDM400, both Sun Computers, XBT, and PC02.
Sound Velocity probe (SVP)
Used as required to update the sound velocity profile on the EM120 and EA600 systems; deployed using the CTD wire over the hydro boom. No problems encountered, however lack of a suitable weight for deployment on board meant having to use a lump of chains for this.
XBT/XCTD System
Several XBT drops were conducted early in the cruise to calibrate the echosounders. However, it was found that the current XBT deck unit is not capable of exporting temperature or sound velocity profile information in a useable format. A purchase order for a replacement system (Lockheed Martin Sippican MK21 USB) has now been placed; this replacement system is housed in a 19 inch rack mountable enclosure which is compatible with laptops and PCs running Windows 2000/Windows XP or higher. The software has automatic GPS input (NMEA 0813) and outputs in ASCII text format enabling the user to readily generate profiles using other applications or export into Kongsberg systems.
The MK21 when used with XBT probes has an overall system accuracy of ±0.2°C and a depth accuracy of 4.6m or 2% of depth whichever is greater.
The temporary arrangement for launching of XBT probes which existed at the beginning of the cruise was replaced with a permanent installation via outdoor socket and permanent wiring which will facilitate easy deployment in the future.

Bibliography Cannat, M., and J.F. Casey, An ultramafic lift at the Mid-Atlantic Ridge: Successive stages
of magmatism in serpentinized peridotites from the 15°N region, in Mantle and Lower Crust Exposed in Oceanic Ridges and in Ophiolites, edited by R.L.M. Vissers, and A. Nicolas, pp. 5-34, Kluwer Academic Publishers, The Netherlands, 1995.
Cannat, M., Y. Lagabrielle, H. Bougault, J. Casey, N de Coutures, L. Dmitriev, and Y. Fouguet, Ultramafic and gabbroic exposures at the Mid-Atlantic Ridge: Geological mapping in the 15°N region, Tectonophysics, 279, 193-213, 1997.
Dick, H.J.B., and C. Mével, The Oceanic Lithosphere & Scientific Drilling into the 21st Century, pp. 89, JOI/US-SSP, Woods Hole, 1996.
Escartin, J., and M. Cannat, Ultramafic exposures and the gravity signature of the lithosphere near the Fifteen-Twenty Fracture Zone (Mid-Atlantic Ridge, 14°-16.5°N), Earth and Planetary Science Letters, 171, 411-424, 1999.
Escartin, J., C. Mevel, C.J. MacLeod, and A.M. McCaig, Constraints on deformation conditions and the origin of oceanic detachments: The Mid-Atlantic Ridge core complex at 15°45'N, Geochemistry Geophysics Geosystems, 4, art. no.-1067, 2003a.
Escartin, J., D.K. Smith, and M. Cannat, Parallel bands of seismicity at the Mid-Atlantic Ridge, 12-14 degrees N, Geophysical Research Letters, 30 (12), art. no.-1620, 2003b.
Fujiwara, T., J. Lin, T. Matsumoto, P.B. Kelemen, B.E. Tucholke, and J.F. Casey, Crustal evolution of the Mid-Atlantic Ridge near Fifteen-Twenty Fracture Zone in the last 5 Ma, Geochemistry, Geophysics, Geosystems, 4, article 1024, doi: 10.1029/2002GC000364, 2003.
Garcés, M., and J.S. Gee, Paleomagnetic evidence of large footwall rotations associated with low-angle faults at the Mid-Atlantic Ridge, Geology, 35 (3), 279–282; doi: 10.1130/G23165A.1, 2007.
Guspi, F., Frequency-domain reduction of potential field measurements to a horizontal plane, Geoexploration, 24, 87-98, 1987.
Kelemen, P.B., E. Kikawa, and D.J. Miller, Proceedings of the Ocean Drilling Program, Initial Reports, 209, Ocean Drilling program, College Station, Texas, 2004.
Le Bas, T., PRISM Processing Manual., National Oceanography Centre, Southampton, 2002.MacLeod, C.J., J. Escartin, D. Banerji, G.J. Banks, M. Gleeson, D.H.B. Irving, R.M. Lilly, A.M. McCaig, Y. Niu, S. Allerton, and D.K. Smith, Direct geological evidence for oceanic detachment faulting: The Mid-Atlantic Ridge, 15°45'N, Geology, 30, 879-882, 2002.
Parker, R.L., and S.P. Huestis, The inversion of magnetic anomalies in the presence of topography, Journal of Geophysical Research, 79, 1587-1593, 1974.
Shipboard Scientific Party, Leg 209 Preliminary Report: Drilling mantle peridotite along the Mid-Atlantic Ridge from 14° to 16°N, 6 May 2003 - 6 July 2003, pp. 160, Ocean Drilling Program, College Station, TX, http://www-odp.tamu.edu/publications/prelim/209_prel/ro9toc.html, 2003.
Smith, D.K., J.R. Cann, and J. Escartin, Widespread active detachment faulting and core complex formation near 13°N on the Mid-Atlantic Ridge, Nature, 442, 440-443, doi:10.1038/nature04950, 2006.
Wessel, P., and W.H.F. Smith, New, improved version of Generic Mapping Tools released, EOS, Transactions of the American Geophysical Union, 79 (47), 579, 1998.