MAGYAR TELEKOM GROUP Q4 2017 RESULTS … · Further expansion of 4G indoor coverage and 4G+...
16
MAGYAR TELEKOM GROUP Q4 2017 RESULTS PRESENTATION FEBRUARY 21, 2018
Transcript of MAGYAR TELEKOM GROUP Q4 2017 RESULTS … · Further expansion of 4G indoor coverage and 4G+...

MAGYAR TELEKOM GROUP Q4 2017 RESULTS PRESENTATION FEBRUARY 21, 2018
2 2
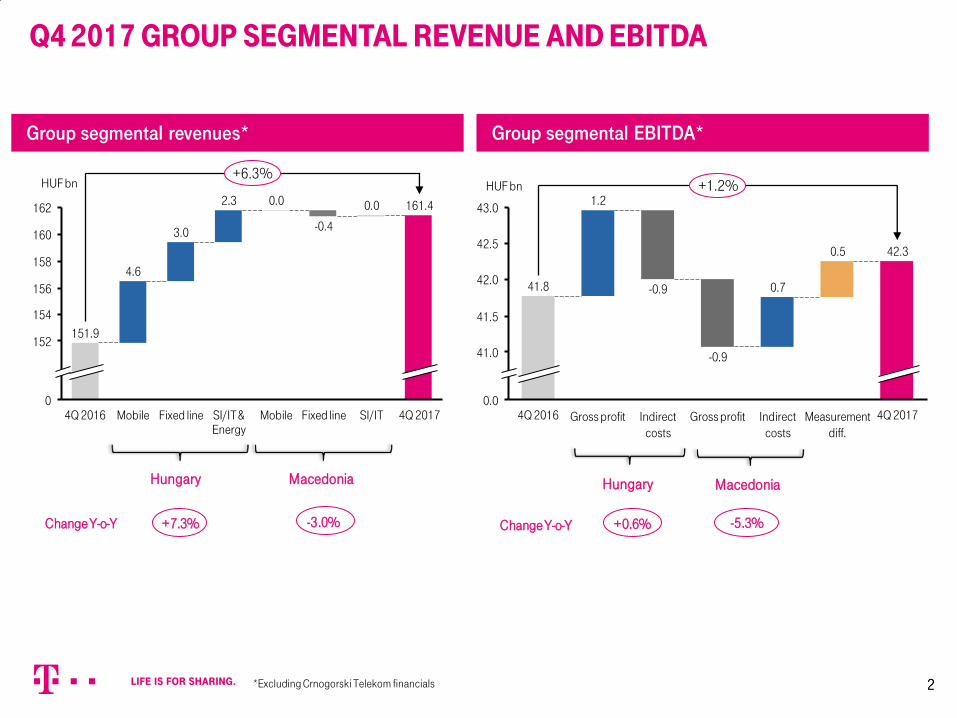
Q4 2017 GROUP SEGMENTAL REVENUE AND EBITDA
Group segmental revenues* Group segmental EBITDA*
162
160
158
156
152
0
154
+6.3%
4Q 2017
161.4
SI/IT
151.9
4Q 2016
4.6
2.3
Mobile SI/IT & Energy
3.0
0.0
Mobile
-0.4
Fixed line
0.0
Fixed line
HUF bn
Change Y-o-Y +7.3% -3.0%
Hungary Macedonia
41.0
0.0
42.0
43.0
41.5
42.5
4Q 2017
0.7
Indirect costs
0.5
Measurement diff.
41.8
42.3
4Q 2016
1.2
-0.9
-0.9
Gross profit
+1.2%
Indirect costs
Gross profit
Change Y-o-Y
HUF bn
+0.6% -5.3%
Hungary Macedonia
*Excluding Crnogorski Telekom financials

3 3
2017 HIGHLIGHTS
MACEDONIA Decline in revenues driven by intensifying competition and delay in SI/IT projects
EBITDA reflects gross profit pressure mitigated by cost enhancing measures
MOBILE Ca. 700 thousand subscribers signed up to new postpaid tariff plans (launched in March 2017)
Continued strong growth in data boosted by hard cut limits and the introduction of unlimited packages
FIXED
Increased broadband download speed offering to enhance competitiveness and better exploit network capabilities – ca. 60% of customers subscribed to a high speed internet package
Continued dynamic growth in TV customer base with ca. 90% of gross adds subscribed to the high-end package
REGULATORY CHANGES
Obligatory prepaid registration concluded with over 95% of prepaid revenues secured
Adverse impacts of EU roaming regulation mitigated by increased visitor data usage
Change in the loyalty legislation allayed with increased focus on device offerings
NETWORKS HSI network (above 30 Mbps capabilities) rolled out to over 270 thousand households in 2017 and now
reaches over 3 million households
Further expansion of 4G indoor coverage and 4G+ availability; launch of VoLTE
FMC
Continued strategic focus on the segment as one of the key drivers of future growth
Expanded Magenta1 offering
Expansion of number of households on FMC tariff plan; now stands at 11% of total households
4 4
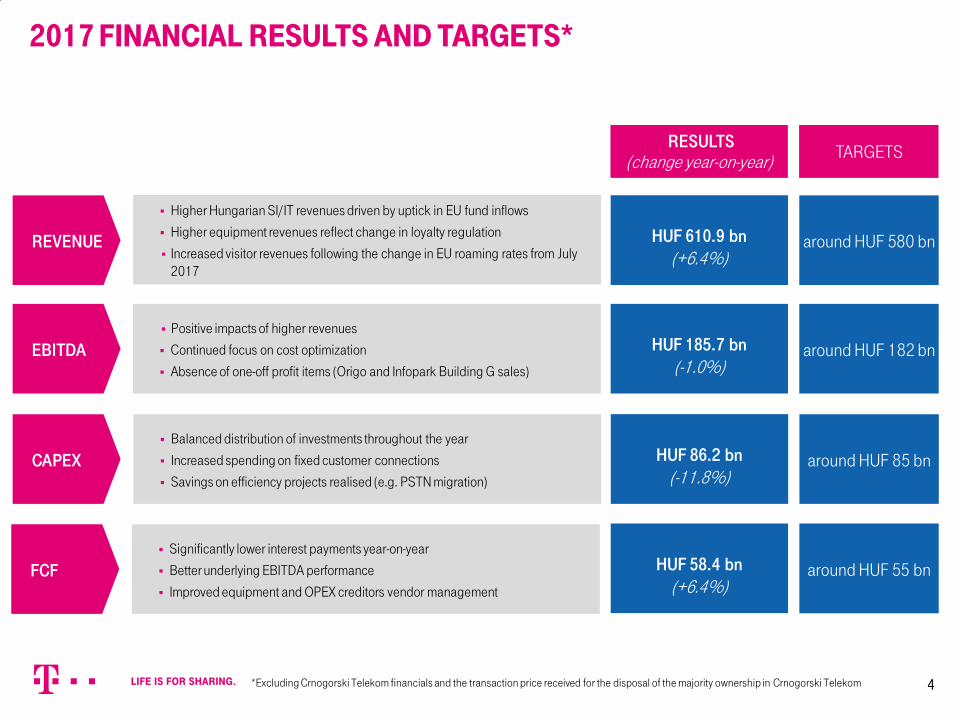
2017 FINANCIAL RESULTS AND TARGETS*
Higher Hungarian SI/IT revenues driven by uptick in EU fund inflows
Higher equipment revenues reflect change in loyalty regulation
Increased visitor revenues following the change in EU roaming rates from July 2017
around HUF 580 bn
Positive impacts of higher revenues
Continued focus on cost optimization
Absence of one-off profit items (Origo and Infopark Building G sales)
around HUF 182 bn
Balanced distribution of investments throughout the year
Increased spending on fixed customer connections
Savings on efficiency projects realised (e.g. PSTN migration)
around HUF 85 bn
REVENUE
TARGETS
EBITDA
CAPEX
*Excluding Crnogorski Telekom financials and the transaction price received for the disposal of the majority ownership in Crnogorski Telekom
Significantly lower interest payments year-on-year
Better underlying EBITDA performance
Improved equipment and OPEX creditors vendor management
FCF around HUF 55 bn
HUF 610.9 bn (+6.4%)
HUF 185.7 bn (-1.0%)
HUF 86.2 bn (-11.8%)
RESULTS (change year-on-year)
HUF 58.4 bn (+6.4%)
5 5
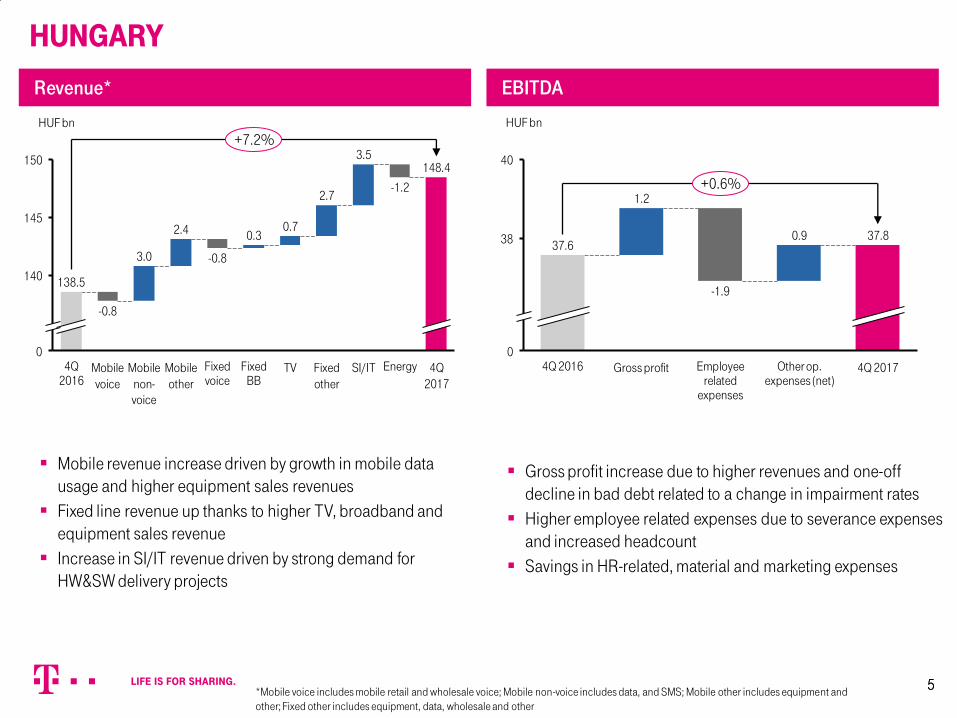
HUNGARY
Revenue* EBITDA
150
145
140
0
-1.2
SI/IT
3.5
Fixed other
2.7
TV
0.7
Fixed BB
0.3
Fixed voice
-0.8
Mobile other
2.4
Mobile non-voice
3.0
Mobile voice
-0.8
+7.2%
4Q 2017
148.4
Energy 4Q 2016
138.5
0
38
40
+0.6%
4Q 2017
37.8
Other op. expenses (net)
0.9
Employee related
expenses
-1.9
Gross profit
1.2
4Q 2016
37.6
Mobile revenue increase driven by growth in mobile data usage and higher equipment sales revenues
Fixed line revenue up thanks to higher TV, broadband and equipment sales revenue
Increase in SI/IT revenue driven by strong demand for HW&SW delivery projects
Gross profit increase due to higher revenues and one-off decline in bad debt related to a change in impairment rates
Higher employee related expenses due to severance expenses and increased headcount
Savings in HR-related, material and marketing expenses
HUF bn HUF bn
*Mobile voice includes mobile retail and wholesale voice; Mobile non-voice includes data, and SMS; Mobile other includes equipment and other; Fixed other includes equipment, data, wholesale and other
6 6
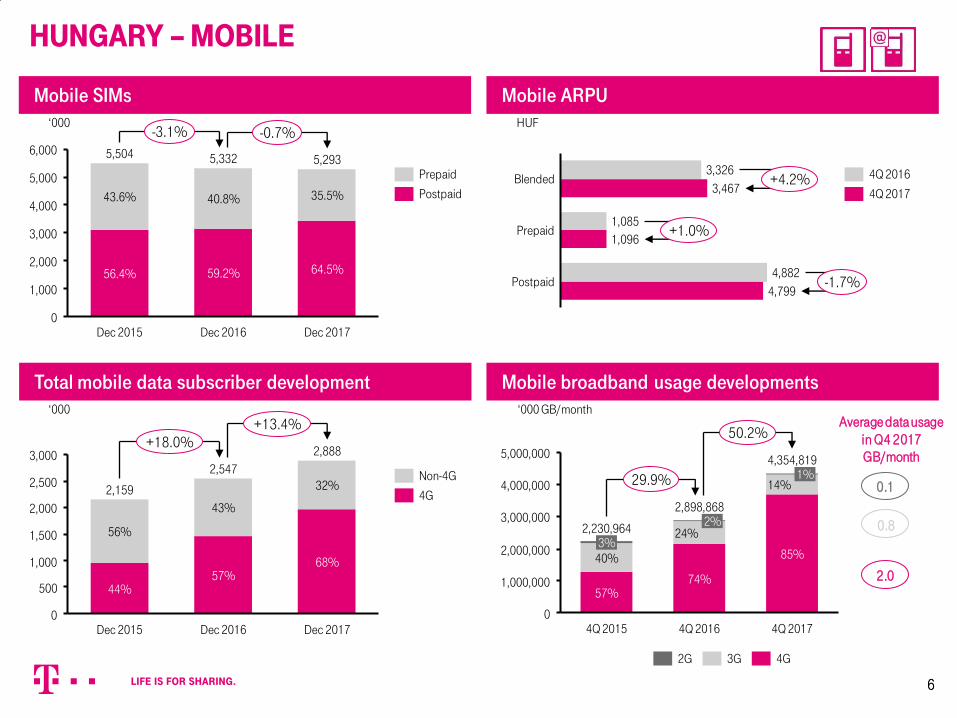
HUNGARY – MOBILE
Mobile SIMs Mobile ARPU
1,000
6,000
4,000
3,000
0
2,000
5,000
35.5%
64.5%
40.8%
56.4%
Dec 2015
-3.1%
59.2%
43.6%
Dec 2017 Dec 2016
-0.7%
5,293 5,504 5,332 Prepaid
Postpaid
Postpaid
+1.0% 1,085
4,882
Prepaid 1,096
4,799
Blended 3,467
-1.7%
3,326 +4.2%
‘000 HUF
Mobile broadband usage developments ‘000
3,000
500
2,500
2,000
1,000
0
1,500
Dec 2017
2,888
32%
+18.0% +13.4%
Dec 2016
57%
2,547
43%
68%
Dec 2015
2,159
44%
56%
Non-4G
4G
Total mobile data subscriber development ‘000 GB/month
3,000,000
4,000,000
2,000,000
1,000,000
0
5,000,000
3% 2,230,964
57%
40%
74%
24% 2%
4Q 2015
4,354,819
2,898,868
4Q 2017
1%
4Q 2016
29.9%
50.2%
85%
14%
3G 4G 2G
Average data usage in Q4 2017 GB/month
0.1
0.8
2.0
4Q 2017
4Q 2016

7 7
HUNGARY – FIXED VOICE, BROADBAND AND TV
Fixed line customer number development
Fixed Voice, BB and TV ARPU developments
Fixed voice
3,557
2,502
2,340
Pay TV 3,325
Fixed BB
+3.4% 3,437
3,494
-6.5%
-1.8%
4Q 2016
4Q 2017
HUF
Fixed line multiplay residential ARPU developments
3Play
2Play 5,730
1Play
+3.7%
8,264
8,323
5,713
3,079
Blended 6,102
3,154
-0.7%
+0.3%
+2.4%
5,886 Annual churn
11%
15%
11%
8%
Fixed line multiplay residential subs. development
0
1,500
1,000
500
1,410
36%
34%
30%
39%
32%
Dec 2015
29% 28%
1,373
Dec 2016
28%
Dec 2017
1,400
44%
1Play
3Play
2Play
‘000
996 962 969
0
500
1,000
1,500
Dec 2015 Dec 2016
1,461
1,016 1,027
1,412 1,423
1,074
Dec 2017
‘000
PayTV
Broadbad
Voice
4Q 2017 4Q 2016
HUF
8 8
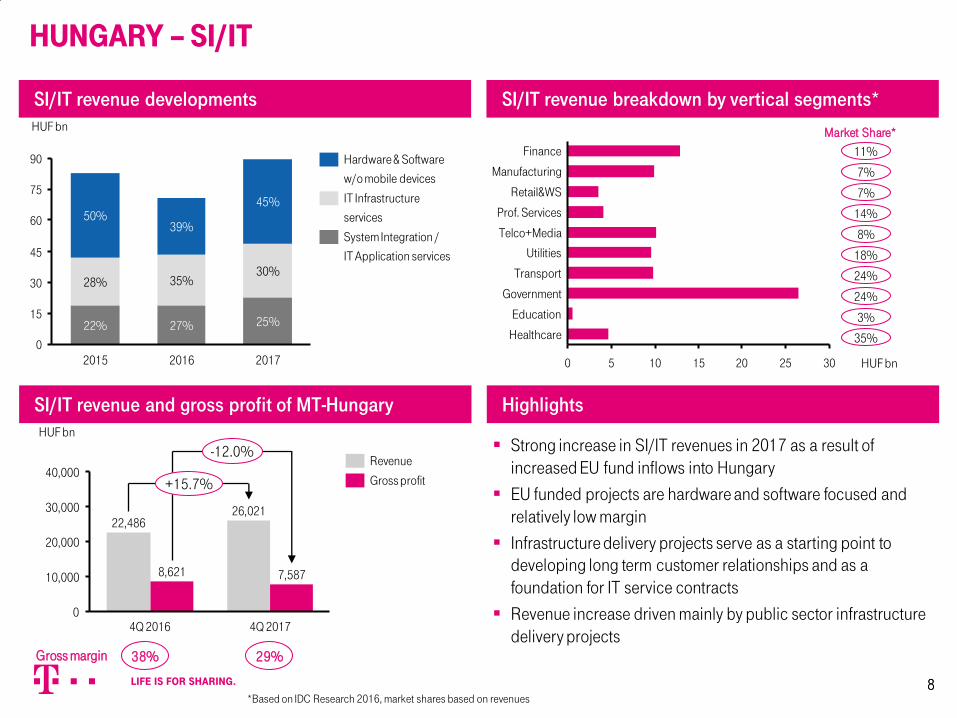
HUNGARY – SI/IT
SI/IT revenue developments
SI/IT revenue breakdown by vertical segments*
SI/IT revenue and gross profit of MT-Hungary Highlights
Strong increase in SI/IT revenues in 2017 as a result of increased EU fund inflows into Hungary
EU funded projects are hardware and software focused and relatively low margin
Infrastructure delivery projects serve as a starting point to developing long term customer relationships and as a foundation for IT service contracts
Revenue increase driven mainly by public sector infrastructure delivery projects
40,000
30,000
20,000
10,000
0
-12.0%
+15.7%
4Q 2017
7,587
26,021
4Q 2016
8,621
22,486
Gross profit
Revenue
HUF bn
HUF bn
*Based on IDC Research 2016, market shares based on revenues
38% 29% Gross margin
0
15
30
45
60
75
90
2016
27%
35%
39%
2015
22%
28%
50%
2017
25%
30%
45%
System Integration /
IT Application services
IT Infrastructure
services
Hardware & Software
w/o mobile devices
0 5 10 15 20 25 30
Healthcare
Education
Government
Transport
Utilities
Telco+Media
Prof. Services
Retail&WS
Manufacturing
Finance
HUF bn
Market Share*
11%
7%
7%
14%
8%
18%
24%
24%
3%
35%

9 9
MACEDONIA
Financials Mobile market
0
2,500,000
2,000,000
1,500,000
1,000,000
500,000
+0.2% +2.2%
Dec 2017
48.6%
51.4%
Dec 2016
50.2%
49.8%
Dec 2015
47.3%
28.0%
24.7% Telekom
One.Vip
VIP (T. Austria)
One (T. Slovenia)*
327
487
566
463
515
522
426
327
-8.0%
0.0%
+5.8%
-7.8%
KPIs (mobile/fixed voice/fixed BB/TV) Highlights
4Q 2017
4Q 2016
22,600
0
2,650
2,700
-3.4%
4Q 2017
2,592
-6
4Q 2016
2,684
Mobile
-87
Fixed SI/IT
154
800
1,000
900
700
0
-4.2%
Other expenses
(net)
4Q 2016
923
-193
884
Gross profit
4Q 2017
customer number QoQ change
ARPU (MKD)
Subscribers Revenues (MKD mn) EBITDA (MKD mn)
Increase in mobile data revenues offset by 30% cut in the mobile termination rate, which took effect in December 2016
Intensifying competition in the mobile segment put pressure on ARPU levels
Equipment sales supported by increased subsidy levels on promotional offers
Strong TV revenue growth partly mitigates competition induced revenue pressure in fixed voice and broadband
Temporary SI/IT revenue pressure due to delayed projects
EBITDA decline driven by gross profit pressure, partly counterbalanced by cost savings measures
-3%
+2%
+9%
-4%
10 10
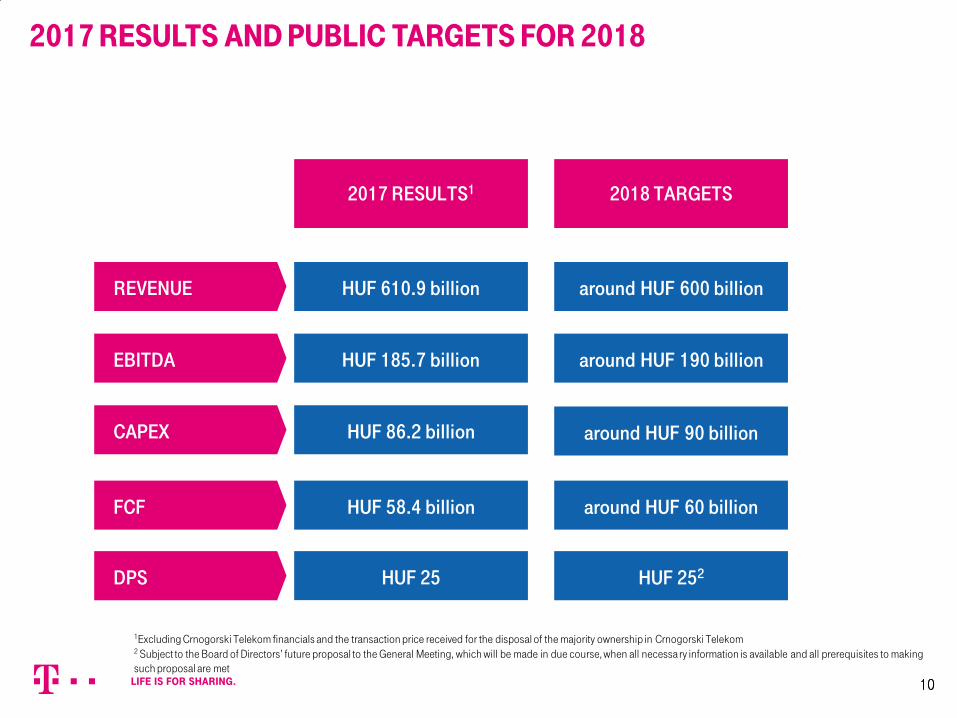
2018 TARGETS
EBITDA around HUF 190 billion
CAPEX
REVENUE around HUF 600 billion HUF 610.9 billion
HUF 185.7 billion
HUF 86.2 billion
2017 RESULTS1
HUF 58.4 billion FCF around HUF 60 billion
1Excluding Crnogorski Telekom financials and the transaction price received for the disposal of the majority ownership in Crnogorski Telekom 2 Subject to the Board of Directors’ future proposal to the General Meeting, which will be made in due course, when all necessa ry information is available and all prerequisites to making such proposal are met
around HUF 90 billion
2017 RESULTS AND PUBLIC TARGETS FOR 2018
HUF 25 DPS HUF 252

APPENDIX
12 12
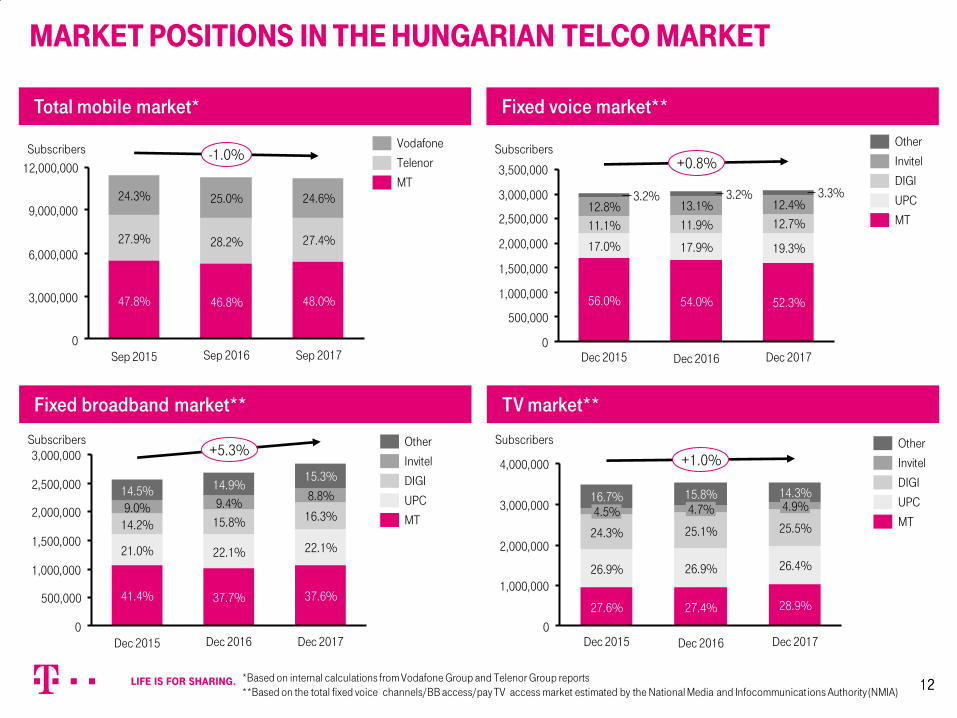
Total mobile market* Fixed voice market**
Fixed broadband market** TV market**
MARKET POSITIONS IN THE HUNGARIAN TELCO MARKET
3,000,000
9,000,000
6,000,000
12,000,000
0 Sep 2017
48.0%
24.6%
27.4%
-1.0%
Sep 2016
46.8%
25.0%
47.8%
27.9%
24.3%
28.2%
Sep 2015
3,000,000
2,500,000
2,000,000
1,000,000
500,000
1,500,000
0
37.7%
21.0%
14.5%
14.2%
14.9%
41.4%
22.1%
Dec 2015
9.4% 9.0% 15.8%
+5.3%
Dec 2017
37.6%
22.1%
16.3%
8.8%
15.3%
Dec 2016
4,000,000
2,000,000
0
3,000,000
1,000,000
28.9%
+1.0%
Dec 2017
14.3%
24.3% 25.1%
Dec 2016 Dec 2015
4.5%
27.4%
15.8% 16.7% 4.9%
25.5%
26.4% 26.9%
4.7%
27.6%
26.9%
0
1,000,000
500,000
2,000,000
1,500,000
3,500,000
3,000,000
2,500,000 12.8%
+0.8%
11.9% 11.1%
3.2%
12.7%
52.3%
Dec 2017
3.3%
56.0%
12.4%
17.0%
13.1%
Dec 2016
3.2%
54.0%
17.9% 19.3%
Dec 2015
Invitel
UPC
Other
MT
DIGI
DIGI
Invitel
MT
UPC
Other Subscribers
Subscribers
Subscribers
Subscribers
MT
Telenor
Vodafone
UPC
Invitel
Other
MT
DIGI
*Based on internal calculations from Vodafone Group and Telenor Group reports **Based on the total fixed voice channels/BB access/pay TV access market estimated by the National Media and Infocommunicat ions Authority (NMIA)
13 13
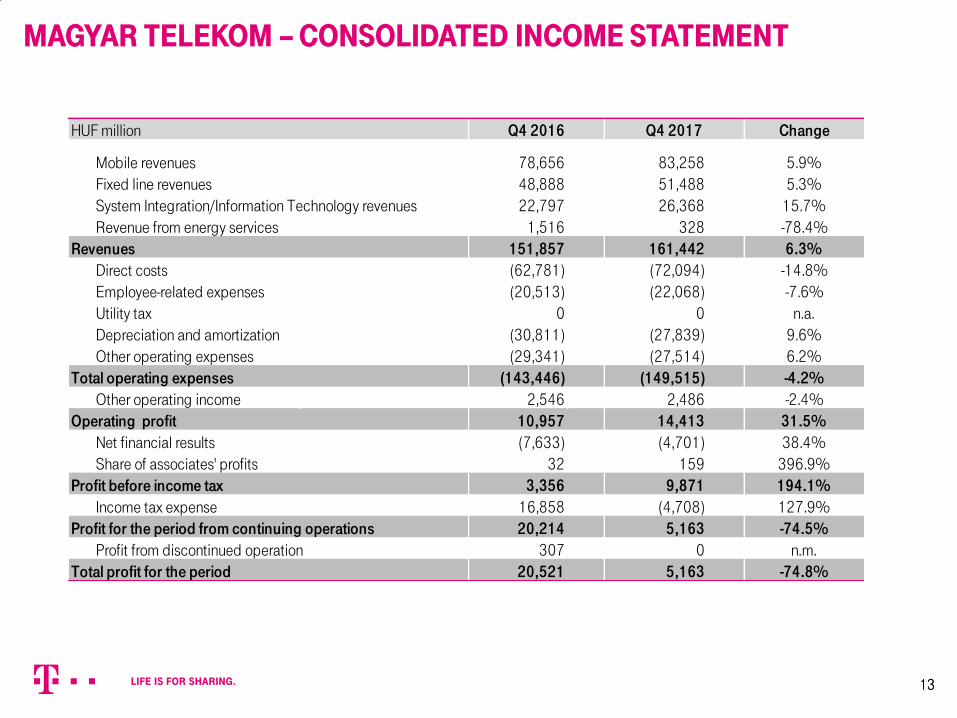
MAGYAR TELEKOM – CONSOLIDATED INCOME STATEMENT
HUF million Change
Mobile revenues 78,656 83,258 5.9%
Fixed line revenues 48,888 51,488 5.3%System Integration/Information Technology revenues 22,797 26,368 15.7%
Revenue from energy services 1,516 328 -78.4%Revenues 151,857 161,442 6.3%
Direct costs (62,781) (72,094) -14.8%
Employee-related expenses (20,513) (22,068) -7.6%Utility tax 0 0 n.a.
Depreciation and amortization (30,811) (27,839) 9.6%Other operating expenses (29,341) (27,514) 6.2%
Total operating expenses (143,446) (149,515) -4.2%
Other operating income 2,546 2,486 -2.4%Operating profit 10,957 14,413 31.5%
Net financial results (7,633) (4,701) 38.4%Share of associates' profits 32 159 396.9%
Profit before income tax 3,356 9,871 194.1%
Income tax expense 16,858 (4,708) 127.9%Profit for the period from continuing operations 20,214 5,163 -74.5%
Profit from discontinued operation 307 0 n.m.Total profit for the period 20,521 5,163 -74.8%
Q4 2016 Q4 2017

14 14
MAGYAR TELEKOM – CONSOLIDATED BALANCE SHEET
HUF million Change
Current assets 193,978 189,027 -2.6%Cash and cash equivalents 10,805 5,399 -50.0%
Other current financial assets 5,104 8,162 59.9%
Non current assets 981,551 920,634 -6.2%Property, plant and equipment - net 483,174 458,343 -5.1%
Intangible assets 260,165 229,174 -11.9%
Total assets 1,175,529 1,109,661 -5.6%
Equity 581,333 580,073 -0.2%
Current liabilites 277,561 226,581 -18.4%Financial liabilities to related parties 72,589 35,191 -51.5%
Other financial liabilities 22,600 8,757 -61.3%
Non current liabilites 316,635 303,007 -4.3%
Financial liabilities to related parties 247,179 231,646 -6.3%Other financial liabilities 50,098 47,608 -5.0%
Total equity and liabilites 1,175,529 1,109,661 -5.6%
Dec 31, 2016 Dec 31, 2017

15 15
MAGYAR TELEKOM – CONSOLIDATED CASH FLOW STATEMENT
*Free cash flow defined as Net cash generated from operating activities plus Net cash used in investing activities, adjusted with Proceeds from / Payments for other financial assets and Repayment of other financial liabilities
HUF million Change
Net cash generated from operating activities 154,825 157,388 1.7%
Investments in tangible and intangible assets (97,723) (86,197) 11.8%
Adjustments to cash purchases 1,327 (4,603) 446.9%
Purchase of subsidiaries and business units (128) (3,791) n.m.
Cash acquired through business combinations 0 0 n.a.
Payments for / proceeds from other financial assets - net (88) (2,867) n.m.
Proceeds from disposal of subsidiaries 3,484 1 n.m.
Proceeds from disposal of PPE and intangible assets 9,902 2,629 -73.4%
Payments for interests in associates and joint ventures 0 0 n.a.Net cash used in investing activities (83,226) (94,828) -13.9%
Dividends paid to shareholders and minority interest (21,312) (29,403) -38.0%
Net payments of loans and other borrowings (40,423) (67,732) -67.6%
Repayment of other financial liabilities (8,347) (7,485) 10.3%
Repurchase of treasury shares (550) (2,139) -288.9%
Net cash used in financing activities (70,632) (106,759) -51.1%
Free cash flow from continuing operation 57,297 58,440 2.0%
Dec 31, 2016 Dec 31, 2017
For further questions please contact the IR department:
In addition to figures prepared in accordance with IFRS, Magyar Telekom also presents non-GAAP financial performance measures, including, among others, EBITDA, EBITDA margin, and net debt. These non-GAAP measures should be considered in addition to, but not as a substitute for, the information prepared in accordance with IFRS. Non-GAAP financial performance measures are not subject to IFRS or any other generally accepted accounting principles. Other companies may define these terms in different ways. For further information relevant to the interpretation of these terms, please refer to the chapter “Reconciliation of pro forma figures”, which is posted on Magyar Telekom’s Investor Relations webpage at www.telekom.hu/investor_relations.
Abbreviations: 3G: third generation, 4G: fourth generation, ARPU: average revenue per user, BB: broadband, IP: internet protocol, IT: information technology, LTE: long term evolution, MOU: minutes of use, MTR: mobile termination rate, NRA: National Regulatory Authority, POD: points of delivery, R/E: real estate, RPC: revenue producing customer, SAC: subscriber acquisition cost, SRC: subscriber retention cost, SI: system integration, SIM: subscriber identity module, SMB: small and medium businesses, TWM: Total Workforce Management, VAS: value added services, WS: wholesale
DISCLAIMER This investor presentation contains forward-looking statements. Statements that are not historical facts, including statements about our beliefs and expectations, are forward-looking statements. These statements are based on current plans, estimates and projections, and therefore should not have undue reliance placed upon them. Forward-looking statements speak only as of the date they are made, and we undertake no obligation to update publicly any of them in light of new information or future events. Forward-looking statements involve inherent risks and uncertainties. We caution you that a number of important factors could cause actual results to differ materially from those contained in any forward-looking statement. Such factors are described in, among other things, our Annual Reports for the year ended December 31, 2016 available on our website at http://www.telekom.hu.
Péter Bauer Head of Investor Relations Phone: +36 1 481-7676 e-mail: [email protected]
Rita Walfisch Investor Relations Manager Phone: +36 1 457-6084 e-mail: [email protected]