Magnon and electromagnon excitations in multiferroic...
12
PHYSICAL REVIEW B 93, 094403 (2016) Magnon and electromagnon excitations in multiferroic DyFeO 3 T. N. Stanislavchuk, 1 , * Yazhong Wang, 2 Y. Janssen, 3 G. L. Carr, 4 S.-W. Cheong, 2 and A. A. Sirenko 1 1 Department of Physics, New Jersey Institute of Technology, Newark, New Jersey 07102, USA 2 Department of Physics and Astronomy, Rutgers Center for Emergent Materials, Rutgers University, Piscataway, New Jersey 08854, USA 3 Department of Chemistry, Stony Brook University, Stony Brook, New York 11794, USA 4 National Synchrotron Light Source, Brookhaven National Laboratory, Upton, New York 11973, USA (Received 10 November 2015; revised manuscript received 3 February 2016; published 4 March 2016) Optical properties of orthorhombic DyFeO 3 single crystals have been studied in the far-infrared spectral range of 11–120 cm −1 at temperatures between 1.5 and 50 K and in magnetic fields up to 7 T. The temperature and magnetic-field dependencies of the antiferromagnetic (AFM) resonance spectra have been measured below and above the AFM ordering temperature of Dy 3+ moments with T Dy N = 4.2 K. Hardening of the quasiferromagnetic mode frequency of the AFM resonance due to ordering of Dy 3+ moments is observed. Below T Dy N two electric dipole-active magnetic excitations, or electromagnons, appear in the spectra at ∼20 and ∼50 cm −1 . The electromagnons vanish with the application of a strong magnetic field along the a or b axis which changes the magnetic structures of Fe 3+ and Dy 3+ moments into the ones compatible with the spatial inversion symmetry. We show that the electromagnon at ∼20 cm −1 provides a significant contribution to the static electric permittivity ε. The energies of the electromagnons as well as static electric permittivity manifest a strong hysteresis upon cycling of an external magnetic field at T<T Dy N . DOI: 10.1103/PhysRevB.93.094403 I. INTRODUCTION Rare-earth orthoferrites crystallize in the orthorhombi- cally distorted perovskite structure (Pbnm) with four RFeO 3 molecules per unit cell [1]. In all studied orthoferrites the Fe-Fe exchange interaction leads to an antiferromagnetic (AFM) ordering of the Fe subsystem with a weak ferromagnetic (FM) canting due to Dzyaloshinskii-Moriya interaction at N´ eel temperatures T N in the range between 650 and 700 K [2]. The resulted spin structure 4 (G x A y F z ) persists down to the lowest temperatures in orthoferrites with nonmagnetic R ions (R = Y, La, and Lu). In other RFeO 3 compounds, the magnetic rare-earth ions are polarized by R-Fe exchange interaction, and the degree of polarization increases with the temperature decrease. The increase in polarization results in an increase in magnetic anisotropy of the rare-earth subsystem that can lead to a spin-reorientation (SR) transition. In most rare-earth orthoferrites, the SR transition occurs via two second-order phase transitions, which result in the change in the spin configuration of the Fe subsystem from 4 (G x A y F z ) with the net magnetization directed along the c axis to 2 (F x C y G z ) with the net magnetization directed along the a axis. DyFeO 3 is the only nonsubstituted member of the orthoferrite family in which the spin configuration of the Fe subsystem changes from weakly ferromagnetic 4 to purely AFM 1 (A x G y C z ) via the Morin-type phase transition at T M ∼ 50 K [3,4]. In the temperature range between 1.5 and 4 K several orthoferrites show spin ordering of the rare-earth subsystem. In particular, Dy 3+ spins order antiferromagnetically in the 5 (g x a y ) spin configuration at T Dy N ≈ 4K[3,5]. Application of a high enough magnetic field along the principal crystallographic axes of DyFeO 3 results in SR phase transitions [4,6]. For example, application of a magnetic field along the a axis results in * Author to whom correspondence should be addressed: stantar@ njit.edu a spin-screw transition of the Fe subsystem from the 1 configuration to the 2 one, application along the b axis—in a spin-flop transition from the 1 to the 4 configuration and application along the c axis—in a spin-screw transition from the 1 to the 4 configuration. Spin configurations 1 , 2 , and 4 observed in the Fe subsystem of DyFeO 3 (and other rare-earth orthoferrites) are compatible with the space inversion operation and, hence, do not allow either a linear magnetoelectric (ME) effect or a spontaneous electric polarization. Below T Dy N , Dy moments order into the 5 (g x a y ) configuration which together with the 1 configuration of Fe spins form a 222 nonpolar magnetic symmetry group. This symmetry still does not allow spontaneous ferroelectric polarization but, due to breaking of inversion symmetry, allows a linear magnetoelectric effect with diagonal components of the magnetoelectric tensor α ii (i = x,y,z)[7]. A magnetic field applied along the c axis can reorient Fe spins from the 1 to the 4 configuration that together with the 5 Dy spin configuration results in a polar magnetic group 2m m and, hence, existence of spontaneous polarization along the c axis becomes possible (the ME tensor remains diagonal so that α zz = 0). The appearance of spontaneous polarization along the c axis in DyFeO 3 below T Dy N and in high magnetic fields H c (Fe spins are in the 4 configuration) was reported by Tokunaga et al. [8]. The exchange striction between adjacent Fe 3+ and Dy 3+ layers was proposed as the origin of the ferroelectric polarization in the low-temperature multiferroic phase [8]. Ordering of Dy moments below T Dy N allows for a linear magnetoelectric effect and, hence, opens up a possibility for the observation of dynamic magnetoelectric effects in a form of the so-called electromagnons, which are magnetic resonances excited by the electric e vector of light [9–11]. Literature on electromagnons in magnetic oxides includes per- ovskite RMnO 3 [12–16], hexagonal YMnO 3 [17], RMn 2 O 5 [18], Ba 2 CoGe 2 O 7 [19], and CuO [20] compounds. In iron- based multiferroics electromagnons were reported in BiFeO 3 2469-9950/2016/93(9)/094403(12) 094403-1 ©2016 American Physical Society
Transcript of Magnon and electromagnon excitations in multiferroic...
PHYSICAL REVIEW B 93, 094403 (2016)
Magnon and electromagnon excitations in multiferroic DyFeO3
T. N. Stanislavchuk,1,* Yazhong Wang,2 Y. Janssen,3 G. L. Carr,4 S.-W. Cheong,2 and A. A. Sirenko1
1Department of Physics, New Jersey Institute of Technology, Newark, New Jersey 07102, USA2Department of Physics and Astronomy, Rutgers Center for Emergent Materials, Rutgers University, Piscataway, New Jersey 08854, USA
3Department of Chemistry, Stony Brook University, Stony Brook, New York 11794, USA4National Synchrotron Light Source, Brookhaven National Laboratory, Upton, New York 11973, USA
(Received 10 November 2015; revised manuscript received 3 February 2016; published 4 March 2016)
Optical properties of orthorhombic DyFeO3 single crystals have been studied in the far-infrared spectral rangeof 11–120 cm−1 at temperatures between 1.5 and 50 K and in magnetic fields up to 7 T. The temperature andmagnetic-field dependencies of the antiferromagnetic (AFM) resonance spectra have been measured below andabove the AFM ordering temperature of Dy3+ moments with T
DyN = 4.2 K. Hardening of the quasiferromagnetic
mode frequency of the AFM resonance due to ordering of Dy3+ moments is observed. Below TDyN two
electric dipole-active magnetic excitations, or electromagnons, appear in the spectra at ∼20 and ∼50 cm−1.The electromagnons vanish with the application of a strong magnetic field along the a or b axis which changesthe magnetic structures of Fe3+ and Dy3+ moments into the ones compatible with the spatial inversion symmetry.We show that the electromagnon at ∼20 cm−1 provides a significant contribution to the static electric permittivityε. The energies of the electromagnons as well as static electric permittivity manifest a strong hysteresis uponcycling of an external magnetic field at T < T
DyN .
DOI: 10.1103/PhysRevB.93.094403
I. INTRODUCTION
Rare-earth orthoferrites crystallize in the orthorhombi-cally distorted perovskite structure (Pbnm) with four RFeO3
molecules per unit cell [1]. In all studied orthoferrites the Fe-Feexchange interaction leads to an antiferromagnetic (AFM)ordering of the Fe subsystem with a weak ferromagnetic(FM) canting due to Dzyaloshinskii-Moriya interaction at Neeltemperatures TN in the range between 650 and 700 K [2]. Theresulted spin structure �4(GxAyFz) persists down to the lowesttemperatures in orthoferrites with nonmagnetic R ions (R =Y, La, and Lu). In other RFeO3 compounds, the magneticrare-earth ions are polarized by R-Fe exchange interaction,and the degree of polarization increases with the temperaturedecrease. The increase in polarization results in an increasein magnetic anisotropy of the rare-earth subsystem that canlead to a spin-reorientation (SR) transition. In most rare-earthorthoferrites, the SR transition occurs via two second-orderphase transitions, which result in the change in the spinconfiguration of the Fe subsystem from �4(GxAyFz) with thenet magnetization directed along the c axis to �2(FxCyGz)with the net magnetization directed along the a axis. DyFeO3
is the only nonsubstituted member of the orthoferrite familyin which the spin configuration of the Fe subsystem changesfrom weakly ferromagnetic �4 to purely AFM �1(AxGyCz)via the Morin-type phase transition at TM ∼ 50 K [3,4]. In thetemperature range between 1.5 and 4 K several orthoferritesshow spin ordering of the rare-earth subsystem. In particular,Dy3+ spins order antiferromagnetically in the �5(gxay) spinconfiguration at T Dy
N ≈ 4 K [3,5]. Application of a high enoughmagnetic field along the principal crystallographic axes ofDyFeO3 results in SR phase transitions [4,6]. For example,application of a magnetic field along the a axis results in
*Author to whom correspondence should be addressed: [email protected]
a spin-screw transition of the Fe subsystem from the �1
configuration to the �2 one, application along the b axis—ina spin-flop transition from the �1 to the �4 configuration andapplication along the c axis—in a spin-screw transition fromthe �1 to the �4 configuration.
Spin configurations �1, �2, and �4 observed in the Fesubsystem of DyFeO3 (and other rare-earth orthoferrites) arecompatible with the space inversion operation and, hence, donot allow either a linear magnetoelectric (ME) effect or aspontaneous electric polarization. Below T
DyN , Dy moments
order into the �5 (gxay) configuration which together withthe �1 configuration of Fe spins form a 222 nonpolarmagnetic symmetry group. This symmetry still does not allowspontaneous ferroelectric polarization but, due to breaking ofinversion symmetry, allows a linear magnetoelectric effectwith diagonal components of the magnetoelectric tensorαii(i = x,y,z) [7]. A magnetic field applied along the c axiscan reorient Fe spins from the �1 to the �4 configuration thattogether with the �5 Dy spin configuration results in a polarmagnetic group 2m′m′ and, hence, existence of spontaneouspolarization along the c axis becomes possible (the MEtensor remains diagonal so that αzz �= 0). The appearance ofspontaneous polarization along the c axis in DyFeO3 belowT
DyN and in high magnetic fields H ‖ c (Fe spins are in the
�4 configuration) was reported by Tokunaga et al. [8]. Theexchange striction between adjacent Fe3+ and Dy3+ layerswas proposed as the origin of the ferroelectric polarization inthe low-temperature multiferroic phase [8].
Ordering of Dy moments below TDyN allows for a linear
magnetoelectric effect and, hence, opens up a possibilityfor the observation of dynamic magnetoelectric effects in aform of the so-called electromagnons, which are magneticresonances excited by the electric �e vector of light [9–11].Literature on electromagnons in magnetic oxides includes per-ovskite RMnO3 [12–16], hexagonal YMnO3 [17], RMn2O5
[18], Ba2CoGe2O7 [19], and CuO [20] compounds. In iron-based multiferroics electromagnons were reported in BiFeO3
2469-9950/2016/93(9)/094403(12) 094403-1 ©2016 American Physical Society

T. N. STANISLAVCHUK et al. PHYSICAL REVIEW B 93, 094403 (2016)
[21,22], SmFe3(BO3)4 [23], Ba2Mg2Fe12O22 [24,25], andCuFe1−xGaxO2 [26]. Although electromagnons were observedin a number of magnetoelectric materials, electromagnonspectra were not reported so far for rare-earth orthoferrites.
The spin-wave spectrum of the Fe subsystem in DyFeO3
consists of four modes of homogeneous magnetic oscilla-tions, two of which are exchange modes with frequencies∼1000 cm−1 and the other two are acoustic modes, whichat k = 0 correspond to quasiferromagnetic (quasi-FM) andquasiantiferromagnetic (quasi-AFM) resonances with fre-quencies below 20 cm−1. The properties of the last two ex-citations were studied in literature only above the temperatureof Dy-spin ordering using Raman scattering [27,28], infrared(IR) spectroscopy [29], and neutron scattering [30]. At roomtemperature the frequency of the quasi-AFM mode is 17 cm−1
and is higher than the frequency of the quasi-FM mode that is≈13 cm−1. With decreasing temperature, the sharp softeningof the quasi-AFM mode occurs: It crosses the quasi-FM modeand reaches its minimum at the point of Morin-type SRtransition at TM = 50 K. At the same time, the frequency ofthe quasi-FM mode does not show any peculiarities at the SRphase transition. With a further decrease in the temperature,the frequency of the quasi-AFM mode increases and reaches≈8 cm−1 at T = 4.2 K. The strongest anomalies at the SRphase transition were observed for the values of magnonoscillator strengths and damping constants which exhibitpronounced discontinuities [29].
Although the properties of magnetic excitations werecarefully studied in literature above the temperature of DyAFM ordering T
DyN ≈ 4 K here we show experimental data on
magnons’ behavior at T < TDyN (down to 1.5 K) and in external
magnetic fields up to 7 T. We also report on the observation oftwo electromagnons positioned at ∼20 and ∼50 cm−1 whichappear in the spectra below T
DyN , i.e. in magnetoelectric phase
of DyFeO3.
II. EXPERIMENT
The floating-zone growth technique was utilized to producebulk crystals of DyFeO3. Single crystals were oriented usingx-ray diffraction, cut and mechanically polished in a form ofplatelets oriented along the orthorhombic a, b, and c directions.The in-plane cross-sectional areas were about 5 × 5 mm2,and the 0.3-mm thickness of all samples was optimized fortransmission measurements. To minimize the interferencefringes in optical experiments, the opposite sides of thesamples were wedged at an angle of about 5◦. The transmissionexperiments were carried out at the National SynchrotronLight Source, Brookhaven National Laboratory at the U4IRbeamline equipped with a Bruker i66v IR spectrometer anda LHe-pumped (∼1.6-K) bolometer. Far-IR transmittancespectra were measured using synchrotron radiation with aspectral resolution of 0.3 cm−1 in the spectral range between11 and 230 cm−1. The low-frequency cutoff was determinedby diffraction at the entrance diamond window for the U4IRbeamline. The light polarization in transmission experimentswas controlled by wire-grid linear polarizers. An externalmagnetic field of up to 7 T was applied in the Faradayconfiguration so that the directions of the light propagation and
the field coincided. Correspondingly, the electric and magneticfields of light were always perpendicular to the externalmagnetic field. In the text below we will use the notationof transmission geometry where a subindex of the electricor magnetic fields of light will indicate its direction withrespect to the crystallographic axes. For example, the eahb
configuration means that electric field of light �e is along thea axis, magnetic field of light �h is along the b axis, and thedirection of light propagation and external magnetic field (ifany) are both along the missing third index: the c axis. The rawdata of transmittance spectra were normalized to transmittancethrough an empty aperture with a size equal to that of thesample. For samples with strong thickness interference fringeswe normalized the transmitted intensity to that measured athigh temperatures or high magnetic fields where no magnonswere present. Temperature and magnetic-field dependenciesfor static values of ε(H,T ) were measured using an LCR meterat 27 kHz.
III. EXPERIMENTAL RESULTS
A. Far-IR spectra of magnons and electromagnons in a zeromagnetic field
In this section we will discuss temperature and magnetic-field dependencies of transmittance spectra of DyFeO3 inthe far-infrared spectral range in several complementaryexperimental configurations ebha , echa , ebhc, and echb.The magnon temperature dependencies and correspondingtransmittance maps for the frequency-temperature parameterspace are shown in Figs. 1–4 for ebha , echa , ebhc, and echb
T, K
Fre
quen
cy, c
m−
1
ebh
a H=0
quasi−FM mode
↓T
NDy
0 10 20 30 40
15
20
25
30
T, K
Fre
quen
cy, c
m−
1 TNDy
quasi−FM
2 4 6 8
0.5 1
0
0.5
1
1.5
MD
y(T)/
MD
y(0)
00.51.0
12
14
16
18
20
22
2K
6K
t
Fre
quen
cy, c
m−
1
FIG. 1. Temperature dependence of the quasi-FM mode fre-quency (green circles) measured in DyFeO3 single crystals in theebha configuration. The right part of the inset shows a normalizedtransmittance map vs temperature and light frequency for the temper-ature range around T
DyN = 4.2 K (the left scale is for frequency). The
black curve shows temperature dependence of the relative changes inDy magnetization MDy(T ) (right scale) calculated using Eq. (3). Theleft part of the inset shows two spectra for normalized transmittancet measured near the region of magnon absorption at 2 K (T < T
DyN )
and 6 K (T > TDyN ).
094403-2

MAGNON AND ELECTROMAGNON EXCITATIONS IN . . . PHYSICAL REVIEW B 93, 094403 (2016)
0 10 20 30 40
15
20
25
30
T, K
Fre
quen
cy, c
m−
1
ech
a H=0
quasi−FM mode
EM1
↓T
NDy
T, K
Fre
quen
cy, c
m−
1
TNDy
EM1
EM2
quasi−FM
4 6 8
20
30
40
50
60
70
0 0.2 0.4 0.6 0.800.51.0
20
30
40
50
60
70
3.2K
6K
t
FIG. 2. Temperature dependence of the quasi-FM mode mea-sured in the echa configuration in the temperature range between3 and 45 K. The position of two electromagnons EM1 and EM2 isshown with blue squares in the temperature range below T
DyN = 4.2 K.
The right part of the inset shows a normalized transmittance mapmeasured in the temperature range around T
DyN = 4.2 K. An artifact
of the measurement between 27 and 29 cm−1, which is due to theminimum of the beam-splitter transmittance, is smeared out in thecolor map. The left part of the inset shows two spectra for normalizedtransmittance t measured at 3.2 K (T < T
DyN ) and 6 K (T > T
DyN ).
configurations, respectively. To interpret the spectra ofmagnons we used the selection rules for magnetic dipole exci-tation of quasi-FM and quasi-AFM modes of AFM resonance(AFMR) in the Pbnm structure of DyFeO3 [31,32], whichare summarized in Table I. In this section we will focus first
FIG. 3. Temperature dependence of the quasi-AFM mode fre-quency. Open circles are experimental data for the quasi-AFM modefrom Ref. [29], blue circles are experimental data from this paper.The inset shows four spectra of transmittance measured at T = 1.5,2.2, 5, and 10 K in the ebhc configuration.
T, K
(b)
EM1
EM2
TNDy
2 3 4 5 6 7
20
30
40
50
60
70
0 0.2 0.4 0.6 0.8
0.51.0
20
30
40
50
60
70
t
Fre
quen
cy, c
m−
1
ech
b H=0
(a)
1.5K3K4.5K
FIG. 4. Temperature dependence of normalized transmittance t
measured in the echb configuration in zero magnetic field (H = 0)near the region of EM1 and EM2 electromagnon absorptions. (a) Threespectra for normalized transmittance t measured at T = 1.5, 3, and4.5 K. (b) A normalized transmittance map vs temperature and lightfrequency. An artifact of the measurement between 27 and 29 cm−1,which is due to the minimum of the beam-splitter transmittance, issmeared out in the color map.
on the temperature behavior of the magnon and electromagnonmodes at H = 0. After that we will describe the magnetic-fielddependencies of the magnons and electromagnons.
1. Quasi-FM mode
Figure 1 shows temperature dependence of transmissionspectra in the ebha configuration below the Morin-type phase-transition temperature TM ∼ 50 K when iron spins are in the�1(Gy) configuration. The experimental spectra are dominatedby one absorption line positioned between 12 and 14 cm−1
at T > 4.2 K. This line is observed only in configurationswith h ‖ a as one can also see in the complementary echa
configuration (Fig. 2). We attribute it to the quasi-FM modewhich, according to Table I, can be excited only by ha
component of electromagnetic field in the �1(Gy) phase.This interpretation is in agreement with Balbashov et al. [29]where a quasi-FM mode of AFMR positioned at 14 cm−1
was observed in transmission spectra of DyFeO3 with h⊥c
at T � 4 K. The main new experimental finding is that atT < 4.2 K the frequency of the quasi-FM mode increases from
TABLE I. Selection rules for quasi-FM and quasi-AFM modesof AFMR in DyFeO3 [31,32].
Quasi-FM Quasi-AFM
Oscillation OscillationFe phase quantities Activity quantities Activity
�1(Gy) GzFx h ‖ a GxFz h ‖ c
�2(GzFx) FyFzGx h ‖ b, h ‖ c GyFxGz h ‖ a
�4(GxFz) GzFxFy h ‖ a, h ‖ b GyGxFz h ‖ c
094403-3

T. N. STANISLAVCHUK et al. PHYSICAL REVIEW B 93, 094403 (2016)
14 to 19 cm−1. This magnon hardening at low temperatures canbe naturally attributed to the magnetic ordering of Dy spins inthe ab plane.
2. Quasi-AFM mode
Figure 3 shows temperature dependence of transmissionspectra in the ebhc configuration for the temperature rangebetween 1.5 and 10 K. Below T
DyN = 4.2 K, a narrow absorp-
tion line is observed at ≈14 cm−1. This line is observed onlyin h ‖ c configurations at T < T
DyN . For example it is also
observed in the magnetic-field dependence of transmissionspectra in the eahc configuration at H = 0 and T = 1.5 K (seeFig. 5). Thus we attribute this line to a purely magnetic dipolepolarized along the c axis. We note here that this magnonmode is clearly distinguished from the quasi-FM one as thelatter has energy of about 19 cm−1 at T = 1.5 K (see Fig. 1).We assume that the excitation we observe in Figs. 3 and 5 isa quasi-AFM mode. Indeed, in the �1(Gy) phase of Fe spinsthe quasi-AFM mode can be excited by the hc componentof the electromagnetic field only (see Table I). Balbashovet al. [29] reported the observation of the quasi-AFM mode inh ‖ c polarized transmission spectra of DyFeO3. At T = 4.2 Kthe quasi-AFM mode’s energy is 8 cm−1 that is beyond ouraccessible spectral range and thus we cannot observe it inour spectra. But as the temperature goes below T
DyN = 4.2 K,
the AFM ordering of Dy spins enhances the energy of thequasi-AFM mode from 8 cm−1 at T = 4.2 K to 14 cm−1 atT = 1.5 K that is now falling into the accessible spectral rangefor our measurements. The increase in the quasi-AFM modeenergy by 6 cm−1 is quite reasonable taking into account thatmagnetic ordering of Dy spins increases the energy of thequasi-FM mode by 5 cm−1, namely, from 14 cm−1 at 4.2 K to19 cm−1 at 1.5 K as shown in Fig. 1.
Magnetic field, T
(b)
quasi−AFM mode
μ0H
crb
0 2 4 6
14
16
18
20
22
24
26
0.2 0.4 0.6 0.8
0.51.0
14
16
18
20
22
24
26
t
Fre
quen
cy, c
m−
1
eah
c H||b T=1.5K
(a)
1T5T
FIG. 5. Magnetic-field (H ‖ b) dependence of normalized trans-mittance t measured in the eahc configuration at T = 1.5 K. (a)Two spectra for normalized transmittance t measured at μ0H =1 T(H<Hb
cr ) and 5 T(H>Hbcr ). (b) A normalized transmittance map
vs magnetic field and light frequency. The quasi-AFM mode is fieldindependent below μ0H
bcr = 1.3 T.
B. Electromagnon excitations
Figure 2 shows that in the echa configuration two wideabsorption lines appear below T
DyN : a strong one at 22 cm−1
denoted EM1 and a weaker one at 58 cm−1 denoted EM2.These lines are observed only in the e ‖ c configurationsand only below T
DyN . For example, they are also seen in the
echb configuration at T < 4.2 K (see Fig. 4) but cannot bedetected in the orthogonal ebha configuration (Fig. 1). Thus,EM1 and EM2 lines are electric dipole active along the c axis.Among the possible candidates for electric dipole excitationsin the far-IR spectral region are phonons and crystal-field(CF) transitions in Dy3+ ions. The lowest-frequency phononin rare-earth orthoferrites is known to be at ∼100 cm−1 [28],which is well above the frequency of the observed two lines.Now let us discuss whether electronic transitions in Dy3+ ionscan be responsible for EM1 and EM2 lines. The Dy ionsoccupy four sites in the crystalline unit cell of the DyFeO3
orthoferrite and have two nonequivalent positions describedby the point symmetry group Cs. Since Dy3+ is a Kramer’sion, i.e., has odd number of electrons, the local CF of Cs
symmetry splits the multiplets of the Dy3+ ions into Kramer’sdoublets, which remain doubly degenerate at the absenceof a magnetic field (external or internal due to magneticordering). Thus, the ground multiplet 6H15/2 of the Dy3+ ionsis split into eight doublets by the CF of DyFeO3. The earlyspectroscopic study of DyFeO3 in the IR spectral region bySchuchert et al. in 1960s [33] showed that the first four CFdoublets of the Dy3+ ions are at 0, 52, 147, and 225 cm−1
correspondingly. Although the Dy3+ doublet at 52 cm−1 issomewhat close to the observed EM2 line at 58 cm−1, theEM1 line at 22 cm−1 does not correlate with the Dy3+ CFspectrum. Furthermore, magnetization [3] and Mossbauer [34]measurements of DyFeO3 have shown that the ground doubletof the Dy3+ ions can be interpreted as a close to a pure |±15/2〉state with the axis of quantization lying in the ab plane at anangle of ϕ0 ≈ ±60◦ to the a axis (the signs ± in the valueof ϕ0 correspond to two nonequivalent positions of Dy ions).As a result, the g-factor tensor of the ground Dy3+ doubletis highly anisotropic: gz′ ≈ 19.7, gx ′ = gy ′ = 0 (in the x ′y ′z′coordinate system, z′ is directed along the axis of quantization,and x ′ is directed along the c axis). Such a big value of gz′
should result in splitting of the ground doublet in the externalmagnetic field applied along (or having projection on) theaxis of quantization z′ and thus in shifting of the CF linescorresponding to the transitions from the ground doublet tothe excited doublets of the Dy3+ ions. As we will show inthe next section, the application of the external magnetic fieldalong the a and b crystallographic axes has not led to anynoticeable shift of the EM1 and EM2 lines (see Figs. 9 and11) pointing that they are not related to the CF transitions.Moreover, although the ground doublet of Dy3+ does not havea nonzero g factor along the c axis, the Dy subsystem doespossess an appreciable magnetic susceptibility χc along the c
axis at low temperatures [35]. It was shown [36] that χc canbe explained by Van Vleck contribution from the first excitedCF level of Dy3+ ions, and the calculated value of χc is ingood agreement with the magnetization measurements [35]provided that the first excited CF level is at ∼52 cm−1. FinallyMossbauer measurements [34] of DyFeO3 at temperatures up
094403-4

MAGNON AND ELECTROMAGNON EXCITATIONS IN . . . PHYSICAL REVIEW B 93, 094403 (2016)
Magnetic field, T
geff
=2.1
quasi−FM mode
μ0H
crc ≈3T
ωFMextrap≈15.2 cm−1
(b)
0 1 2 3 4
14
16
18
20
22
24
26
0.4 0.6 0.8
0.51.0
14
16
18
20
22
24
26
t
Fre
quen
cy, c
m−
1
ebh
a H||c T=1.5K
(a)
0T3.25T4.75T
FIG. 6. Magnetic-field (H ‖ c) dependence of normalized trans-mittance t measured in the ebha configuration at T = 1.5 K. (a)Three spectra for normalized transmittance t measured at μ0H =0 T(H<Hc
cr ), 3.25 T, and 4.75 T (H>Hccr ). (b) A normalized
transmittance map vs magnetic field and light frequency. The dashedstraight line shows linear dependence of the quasi-FM mode on thefield for H>Hc
cr with an effective g-factor of 2.1.
to 50 K are consistent with population of only the groundDy doublet, thus proving that the first excited CF level isabove 50 K (∼35 cm−1). Based on the above arguments, wecan exclude both phonons and electronic transitions from thecandidates of excitations responsible for the observed EM1 andEM2 absorption lines. We note, that EM1 and EM2 lines appearonly below T
DyN when linear magnetoelectric effect is allowed.
As we will show in the next section, the application of strongenough magnetic field along the a or b axis, which changes
the magnetic structures of Fe3+ and Dy3+ moments into theones compatible with spatial inversion symmetry, results invanishing of the EM1 and EM2 lines (see Figs. 9 and 11).Thus we conclude that these lines are observed only in themagnetoelectric phase of DyFeO3 and attribute them to electricdipole active magnetic excitations or electromagnons.
C. Far-IR spectra of magnons and electromagnons in anexternal magnetic field
1. Quasi-FM mode
As was shown above, in the �1(Gy) state of Fe spins thequasi-FM mode is polarized along the a axis (h||a) and thusis observed in transmission spectra in two complementaryconfigurations: ebha and echa . It is convenient to choose theebha configuration to monitor the behavior of the quasi-FMmode since in this configuration the quasi-FM mode is notoverlapped with EM1 absorption which is observed in theecha configuration below T
DyN (see Fig. 2). Figure 6 shows
magnetic-field dependence (H ‖ c) of the quasi-FM modemeasured in the ebha configuration at T = 1.5 K. At H = 0the Fe subsystem is in the �1(Gy) state and the Dy subsystemis in the �5(gxay) state. With the field increase the magnon’sfrequency is insensitive to magnetic fields up to μ0H
ccr ≈ 3 T.
At Hccr the Fe subsystem reorients from the �1(Gy) state to
the canted �4(GxFz) state while the magnetic structure ofthe Dy moments remains unchanged. At H>Hc
cr quasi-FMmode frequency ωFM reveals a close to linear dependence onH with the effective g-factor geff ≈ 2.1 which we define asfollows: �ωFM = geffμBμ0�H , where �ωFM is a frequencyshift measured in (cm−1) induced by a change in the magnitudeof the magnetic field by �H , μB is a Bohr magneton(μB ≈ 0.4669 cm−1 T−1), and μ0 is a magnetic constant.The extrapolated value of ωFM at H>Hc
cr towards H = 0is ω
extrapFM ≈ 15.2 cm−1 which is close to the frequency of
Magnetic field, T
μ0H
crb
quasi−FM mode↓
←
(b)
0 2 4 612
14
16
18
20
22
24
26(b))
0.4 0.6 0.8
0.51.012
14
16
18
20
22
24
26
t
Fre
quen
cy, c
m−
1
ech
a H||b T=5K
(a)
0T3T
Magnetic field, T
μ0H
crb
EM1
quasi−FM mode↓
(d)
0 2 4 612
14
16
18
20
22
24
26(d)(d)d
0 0.2 0.4 0.6 0.8
0.51.012
14
16
18
20
22
24
26
t
Fre
quen
cy, c
m−
1
ech
a H||b T=1.5K
(c)
0T2.5T
FIG. 7. Magnetic-field (H ‖ b) dependence of normalized transmittance t measured in the echa configuration at (a) and (b) T = 5 Kand (c) and (d) 1.5 K. (a) Two spectra for normalized transmittance t measured at μ0H = 0 T(H<Hb
cr ) and 3T (H>Hbcr ). (b) A normalized
transmittance map vs magnetic field (H ‖ b) and light frequency measured at T = 5 K. (c) Two spectra for normalized transmittance t measuredat μ0H = 0 T(H<Hb
cr ) and 2.5 T (H>Hbcr ). (d) A normalized transmittance map vs magnetic field (H ‖ b) and light frequency measured at
T = 1.5 K. Critical magnetic fields μ0Hbcr of 0.6 T at T = 5 K and 1.3 T at T = 1.5 K are shown in (b) and (d) with vertical arrows. Stars in
(b) and (d) show the positions of the quasi-FM modes.
094403-5

T. N. STANISLAVCHUK et al. PHYSICAL REVIEW B 93, 094403 (2016)
the quasi-FM mode ωFM|H=0T =5K ≈ 14 cm−1 in zero field and
temperatures just above TDyN (see Fig. 1) when Fe spins are in
�4(GxFz) phase and Dy ions are paramagnetic.Figure 7 shows magnetic-field dependence (H ‖ b) of
transmittance measured in the echa configuration at T = 5 K(a) and (b) and at T = 1.5 K (c) and (d). At T = 5 K and H = 0the quasi-FM mode is observed at 13.7 cm−1. With the fieldincrease above μ0H
bcr ≈ 0.6 T, the quasi-FM mode vanishes
but above 2 T another magnon is observed at ∼12.5 cm−1,and its position practically does not change with the furtherincrease in magnetic field. The magnetic field applied alongthe b axis causes the SR transition of the Fe subsystem from�1(Gy) to �4(GxFz) spin configuration [6]. Thus the magnonat ∼12.5 cm−1 is observed in the �4(GxFz) phase of Fe spins(H>Hb
cr ) and is magnetic dipole active along the a axis (theecha configuration of measurements). Based on selection rulesfrom Table I, we attribute this magnon to the quasi-FM mode,which is active in the �4(GxFz) phase for h ‖ a.
At T = 1.5 K and H = 0 [Figs. 7(c) and 7(d)] the quasi-FMmode, enhanced by Dy ordering, is at ∼19 cm−1 (see, forexample, Fig. 1) that falls into the region of EM1 absorptionand is not explicitly observed in our spectra. Above μ0H
bcr ≈
1.3 T the EM1 and quasi-FM mode absorptions vanish due tothe onset of a �1 → �4 spin-reorientation transition of Fe spinsaccompanied by the reorientation of Dy moments from the�5(gxay) to the �3 (fycx) state [37]. At μ0Hb > 2 T, the quasi-FM mode appears at ∼12.5 cm−1 [Figs. 7(c) and 7(d)] just likein the case of spectra at T = 5 K [Figs. 7(a) and 7(b)]. We notethat the frequency of the quasi-FM mode in the field-induced�4 state of Fe spins and extrapolated towards H = 0 is differentfor H ‖ c [ωextrap
FM ≈ 15.2 cm−1; see Fig. 6(b)] and for H ‖ b
[ωFM ≈ 12.5 cm−1; see Figs. 7(b) and 7(d)]. The difference canbe due to different magnetic structures of the Dy subsystem.For H ||b and T = 1.5 K the Dy structure is �3 (fycx) aboveμ0Hb ≈ 2 T, where ωFM ≈ 12.5 cm−1 is observed. For H ‖b and T = 5 K the Dy subsystem is paramagnetic and ispolarized by the external magnetic field in the �3 (fycx)configuration. At μ0Hb ≈ 2 T the splitting of the groundDy doublet is � = gz′μBμ0Hb sin ϕ0 ≈ 14.5 cm−1(≈20 K).Such a splitting at T = 5 K means that only the lowestsublevel of the split ground Dy doublet is populated and themagnetization of Dy is close to saturation. Thus the magneticstate of the Dy moments at μ0Hb > 2 T is approximately thesame for both T = 5 and T = 1.5 K, which results in thesame frequency ωFM ≈ 12.5 cm−1 of the quasi-FM mode. Incontrast to the case of H ‖ b, for H ‖ c and T = 1.5 K themagnetic structure of the Dy spins is �5(gxay) and does notchange with the field increase. The �5(gxay) structure of theDy spins renormalizes the frequency of the quasi-FM modein a different way than the �3 (fycx) structure does, whichresults in the observed difference between ω
extrapFM ≈ 15.2 cm−1
at H ‖ c [see Fig. 6(b)] and ωFM ≈ 12.5 cm−1 at H ‖ b [seeFigs. 7(b) and 7(d)].
2. Quasi-AFM mode
In the �1(Gy) state of Fe spins the quasi-AFM mode ispolarized along the c axis (h ‖ c) and thus is observed in theeahc and ebhc configurations. Figure 8 shows a magnetic-fielddependence (H ‖ a) of transmittance measured in the ebhc
Magnetic field, T
Wav
enum
ber
(cm
−1 )
quasi−AFM mode
quasi−FM mode
(b)
μ0H
cra
0 1 2 3 412
14
16
18
20
22
24
26
0.3
0.4
0.5
0.6
0.7
0.8
0.9
12 14 16 18 20 22 240
0.2
0.4
0.6
0.8
1
Wavenumber (cm−1)
Tra
nsm
ittan
ce (
arb.
uni
ts)
ebh
c H||a T=1.5K
(a)
↑quasi−AFM mode
quasi−FM mode↑
0T1T1.4T
FIG. 8. Magnetic-field (H ‖ a) dependence of normalized trans-mittance t measured in the ebhc configuration at T = 1.5 K. (a) Threespectra for normalized transmittance t measured in the interval ofmagnetic fields around SR transition at about μ0H
acr = 1 T. Two
AFMR modes are observed simultaneously at H = Hacr . (b) A
normalized transmittance map vs magnetic field (H ‖ a) and lightfrequency. The positions of quasi-FM and quasi-AFM modes aremarked with crosses and stars correspondingly.
configuration at T = 1.5 K. The quasi-AFM mode is observedat ωAFM ≈ 14 cm−1 for H = 0, and its frequency is insensitiveto magnetic fields up to μ0H
acr = 1 T. Just above Ha
cr ,another line appears at ∼17 cm−1, and its frequency graduallyincreases and stabilizes at 22.5 cm−1 in the field of 2 T. Themagnetic field applied along the a axis causes a spin-screwtransition of the Fe subsystem from the �1(Gy) to the �2(GzFx)configurations [4,6] accompanied by spin reorientation of Dymoments from the �5(aygx) to the �2 (fxcy) state. Accordingto selection rules from Table I, in the �2(GzFx) phase of Fespins the quasi-AFM mode can be excited by the ha componentof the electromagnetic field only and thus cannot be observedin the ebhc configuration in Figs. 8(a) and 8(b) for H > Ha
cr .Instead, in the �2(GzFx) phase the conditions for the excitationof the quasi-FM mode are h ‖ b or h ‖ c. Thus we concludedthat the line observed in Figs. 8(a) and 8(b) for H > Ha
cr
is the quasi-FM mode. The fact that its frequency graduallyincreases and stabilizes at 22.5 cm−1 in the field of 2 T might
094403-6
MAGNON AND ELECTROMAGNON EXCITATIONS IN . . . PHYSICAL REVIEW B 93, 094403 (2016)
indicate that between 1 and 2 T Fe spins continue to rotatefrom the �1 structure to the �2 structure until they stabilizeat 2 T. Indeed, as was shown by Gnatchenko et al. [38] thereorientation of the Fe spins in H ‖ a at T < TM (TM ∼ 50 Kis a temperature of Morin transition) occurs in a sequence�4 (Gy) → �12(FxGyGz) → �2(FxGz) through continuousrotation of G vector and is completed by a second-order phasetransition to a �2 phase. The stabilization of the quasi-FMmode’s frequency above 2 T indicates that the mode’s effectiveg-factor along the a axis when Fe spins are in the �2 phase isnegligible in the studied magnetic-field region (up to 4 T).
The magnetic-field dependence of transmittance (H ‖ b) inthe eahc configuration at T = 1.5 K is shown in Fig. 5. Thequasi-AFM mode is observed at 14 cm−1 at zero magneticfield, and its frequency is insensitive to magnetic fields up toμ0H
bcr ≈ 1.3 T. At H > Hb
cr the quasi-AFM mode absorptionvanishes. It was shown [4,6] that a magnetic field appliedalong the b axis of DyFeO3 causes spin reorientation of the Fesubsystem from the �1(Gy) to the �4(GxFz) state accompaniedby the reorientation of Dy moments from the �5(aygx) tothe �3 (fycx) state [37]. In the field-induced �4 phase of Fespins the quasi-AFM mode is excited by the hc componentof the electromagnetic field, just like in the �1(Gy) phase (seeTable I). Thus the quasi-AFM mode is expected to be observedin eahc spectra for both H < Hb
cr (�1 state) and H > Hbcr (�4
state) whereas in our measurements it was observed only forH < Hb
cr (see Fig. 5). As was shown above, the ordering ofthe Dy subsystem in the �5(aygx) state increases the quasi-FMmode’s frequency from 14 to 19 cm−1 (see Fig. 1) when theFe subsystem is in the �1 configuration whereas the field-induced (H ‖ b) reorientation of Fe spins from the �1(Gy)to the �4(GxFz) state accompanied by the reorientation of Dymoments from the �5(aygx) to the �3 (fycx) state decreases thequasi-FM mode’s frequency from 19 cm−1 (see Fig. 1) down to∼12.5 cm−1 [see Fig. 7(d)]. Previously we concluded that theobservation of the quasi-AFM mode at T = 1.5 K is possiblebecause Dy ordering in �5(aygx) state increases the quasi-AFM mode’s frequency from 8 to 14 cm−1. Hence, we assumethat at H > Hb
cr when the Fe and Dy subsystems are reorientedinto �4(GxFz) and �3 (fycx) configurations correspondingly,the frequency of the quasi-AFM mode is decreased, just likein the case of ωFM, so that it no longer falls into the spectralregion of our measurements.
3. Electromagnons
Transmission spectra of a DyFeO3 crystal at zero magneticfield revealed two EM1 and EM2 absorption lines at 22 cm−1
and 58 cm−1 which appear at T < TDyN and are electric dipole
active along the c axis. Figure 9(b) shows a magnetic-fielddependence (H ‖ b) of transmission spectra in the echa
configuration at T = 1.5 K in the region from 0 to 2 T.At H = 0 the EM1 and EM2 lines are at 20 and 50 cm−1
correspondingly. With the increase in magnetic field, theEM1,2 lines become weaker and vanish at μ0H
bcr ≈ 1.3 T
when the spin reorientations of the Fe spins from the �1(Gy)to the �4(GxFz) state and Dy moments from the �5(aygx)to the �3 (fycx) state occur. In contrast to the �5(gxay)configuration, the �3 (fycx) configuration of Dy moments iscompatible with spatial inversion symmetry [7] and thus at
H>Hbcr , when EM1,2 absorptions vanish, the magnetoelectric
effect in DyFeO3 is not allowed. Similar behavior of EM1,2
lines is observed in transmission spectra when the magneticfield is directed along the a axis. Figure 11(b) shows amagnetic-field dependence (H ‖ a) of transmission spectrain the echb configuration at T = 1.5 K in the region from0 to 3 T. At H = 0 the EM1 and EM2 lines are at 18and 48 cm−1 correspondingly. At Ha
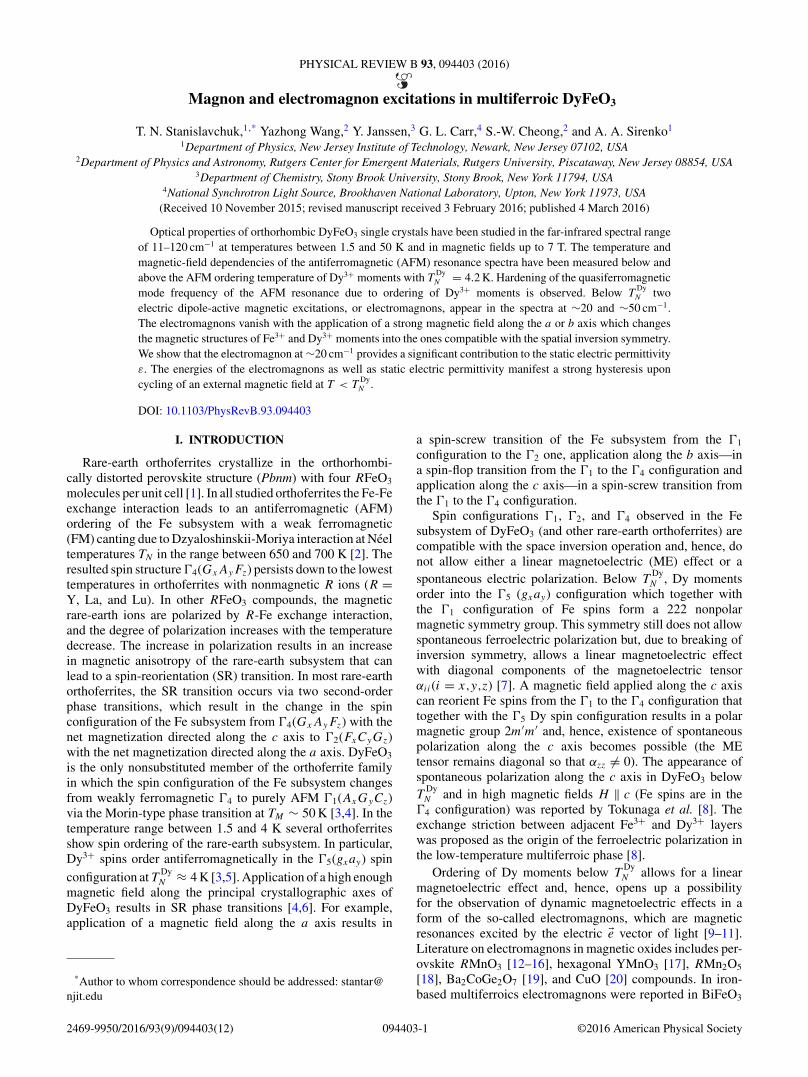
cr ≈ 1 T the reorientationtransition of Fe spins from the �1(Gy) to the �2(FxGz) stateand Dy moments from the �5(gxay) to the �2 (fxcy) stateoccur and EM1,2 absorptions vanish. Just as in the caseof the �3 (fycx) configuration, the �2 (fxcy) configurationof Dy moments is compatible with spatial inversion, and,hence, magnetoelectricity is not allowed [7]. Since EM1 andEM2 absorptions are observed only in magnetoelectric phasesof DyFeO3 and, as was shown above, are not related tophonon modes or electronic transitions in Dy3+ ions, weattribute them to electric dipole-active magnetic excitationsor electromagnons. The existence of electric dipole-activemagnetic excitations in rare-earth orthoferrites was theoret-ically predicted by Yablonskii and Krivoruchko back in 1988[39] and attributed to rare-earth magnetic modes which areodd under inversion symmetry. Our experimental observationof electromagnons in DyFeO3 at the temperatures below themagnetic ordering of Dy3+ moments is in agreement with thattheoretical prediction. The exact mechanisms of such dynamicexcitations that definitely include ordered rare-earth spinswould require a separate theoretical study. The role of Fe3+spins may not be strong because both the EM1 electromagnonand the quasi-FM mode were observed simultaneously inFigs. 2 and 9(c). Note, however, that the appearance ofEM1 correlated with a decrease of the oscillator strengthfor quasi-FM mode at low temperatures compared to thatat T > 4 K (see inset in Fig. 2) thus indicating a possiblecontribution of Fe3+ spins into the formation of electromagnonexcitations.
The EM1 and EM2 electromagnons demonstrate stronghysteresis upon cycling of an external magnetic field alongthe b axis [see Figs. 9(a)–9(d)]. At H = 0 the EM1 andEM2 lines are at 20 and 50 cm−1 correspondingly. Withthe increase in magnetic field along the b axis, the EM1,2
lines become weaker and vanish at μ0Hbcr ≈ 1.3 T. Upon
decreasing the magnetic field below Hbcr only one broad
electromagnon EM1 is observed at 30 cm−1. With furtherdecreasing the magnetic field another phase transition takesplace at μ0H
bcr2 ≈ 0.2 T, and the EM1 at 30 cm−1 vanishes
whereas the EM1 at ∼20 cm−1 appears again as at zero field.The weak EM2 electromagnon at 50 cm−1 was not “restored”(at least it is not clearly seen in our spectra) even when wereduced the magnetic field to zero. The observation of EM1
electromagnon at 30 cm−1 can indicate on the existence of anintermediate state of Fe/Dy magnetic moments upon sweepingthe magnetic field down at T < T
DyN when spin reorientation
of Fe subsystem from the �4 to the �1 configuration takesplace. As was shown by Gnatchenko et al. [37] the spin reori-entation in DyFeO3 in H ‖ b and T < T
DyN can occur in two
stages: �1 (Gy) → �1234(FxFyFzGxGyGz) → �4(FxGy) forFe spins and �5 (gxay) → �2358(gxyaxyfxycxy) → �3(fycx)for Dy spins. The observation of EM1 at 30 cm−1 may berelated to irreversibility of the above sequence of phases in
094403-7
T. N. STANISLAVCHUK et al. PHYSICAL REVIEW B 93, 094403 (2016)
Magnetic field, T
Fre
quen
cy, c
m−
1
ech
a H||b T=1.5K
EM1
EM2
(b)
μ0H
crb
direction of
quasi−↓
0 0.5 1 1.5 2
0 0.2 0.4 0.6 0.8 1
0.51.0
20
30
40
50
60
t
Fre
quen
cy, c
m−
1
(a)
0T0.8T2T
Magnetic field, T
μ0H
crb μ
0H
cr2b
(c)
EM1
EM1
intermediate state
FM mode →↓
magnetic field ramp
00.51.01.5 0.5 1.0
20
30
40
50
60
t
Fre
quen
cy, c
m−
1
(d)
0T0.8T2T
FIG. 9. Magnetic-field (H ‖ b) dependence of normalized transmittance t measured in the echa configuration at T = 1.5 K during rampingfield (a) and (b) up and (c) and (d) down. (a) Three spectra for normalized transmittance t measured during ramping field up for μ0H =0 T, 0.8 T (H<Hb
cr ) and 2 T (H>Hbcr ). (b) A normalized transmittance map vs magnetic field and light frequency measured during ramping
field up. (c) A normalized transmittance map measured during ramping field down. (d) Three spectra for normalized transmittance t measuredat μ0H = 0 T (H<Hb
cr2), 0.8 T(Hbcr2<H<Hb
cr ), and 2 T (H>Hbcr ) during ramping field down. A quasi-FM mode is marked with a white arrow.
Critical magnetic fields μ0Hbcr ≈ 1.3 T in (b) and (c) and μ0H
bcr2 ≈ 0.2 T in (c) are shown with vertical arrows. An artifact of the measurement
between 27 and 29 cm−1 is due to the minimum of the beam-splitter transmittance.
Fe and Dy subsystems upon sweeping of the magnetic field.Also we note that an irreversible state of Fe spins was recentlyobserved in DyFeO3 at T < T
DyN upon sweeping the magnetic
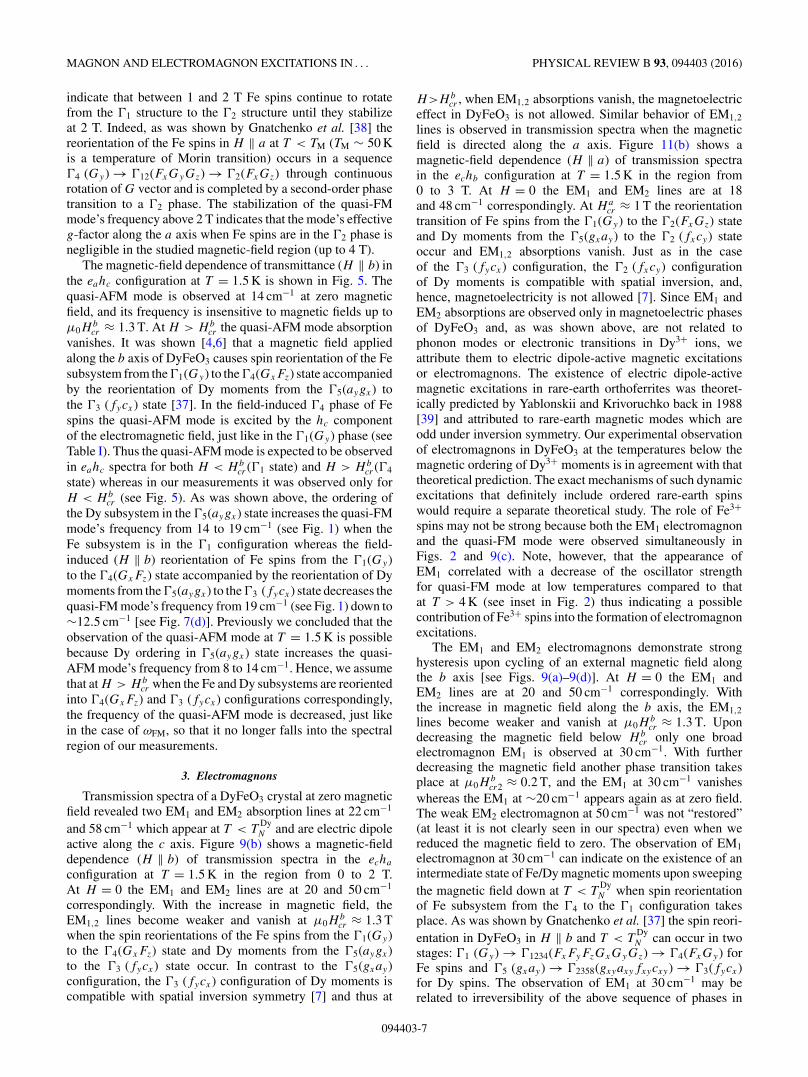
field along the c axis [40].The existence of an EM1 electromagnon with a strong
frequency hysteresis upon cycling of the magnetic field shouldresult in a hysteresis in the corresponding component of thestatic dielectric constant ε(H ). Figure 10(a) shows the εc(H )hysteresis loop measured at 2 K in magnetic fields H ‖ b
and electric field E ‖ c, the latter having a sweep frequencyof f = 27 kHz. As the field is ramped up from 0 to 2 T,εc(H ) drastically drops from 24.2 to 23.1 at μ0H
bcr = 0.4 T
when the Fe subsystem reorients from the �1 to the �4 spinconfiguration. As the field is ramped down, the quasistaticε partially restores at μ0H
bcr = 0.4 T and then, as the field
is further removed from 0.4 T to 0, it gradually restores tothe initial value of 24.1. Thus, both the EM1 electromagnonand the static ε demonstrate hysteresis upon cycling of themagnetic field at T < T
DyN . We note here that the value
of the critical magnetic fields Hbcr at which the spin-flop
transition of the Fe subsystem takes place is different in the IRtransmittance (μ0H
bcr ≈ 1.3 T) and dielectric (μ0H
bcr = 0.4 T)
measurements. As was shown in Ref. [37] the value of Hbcr is
sensitive to the angle β between the direction of the magneticfield and the b axis of the crystal. Thus the observed differencein Hb
cr might be related to slightly different angles β in opticaland dielectric measurements.
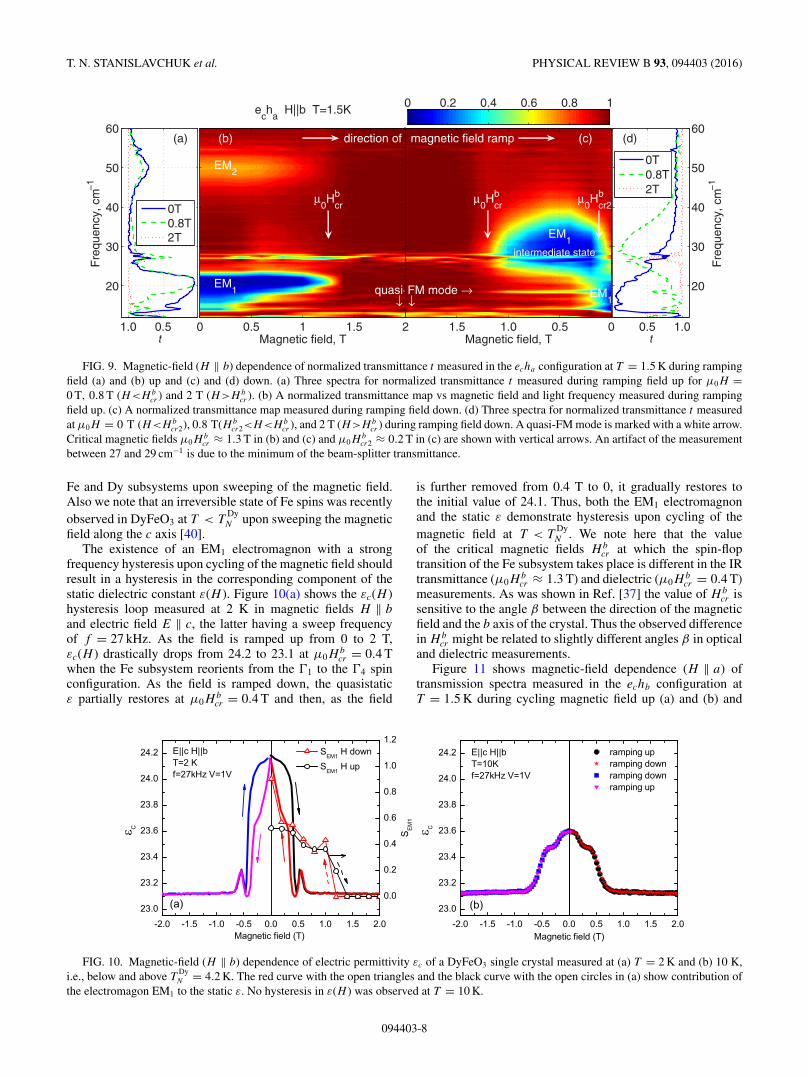
Figure 11 shows magnetic-field dependence (H ‖ a) oftransmission spectra measured in the echb configuration atT = 1.5 K during cycling magnetic field up (a) and (b) and
FIG. 10. Magnetic-field (H ‖ b) dependence of electric permittivity εc of a DyFeO3 single crystal measured at (a) T = 2 K and (b) 10 K,i.e., below and above T
DyN = 4.2 K. The red curve with the open triangles and the black curve with the open circles in (a) show contribution of
the electromagon EM1 to the static ε. No hysteresis in ε(H ) was observed at T = 10 K.
094403-8

MAGNON AND ELECTROMAGNON EXCITATIONS IN . . . PHYSICAL REVIEW B 93, 094403 (2016)
Magnetic field, T
Wav
enum
ber
(cm
−1 )
ech
b H||a T=1.5K
(b)
EM2
EM1
μ0H
cra
0 0.5 1.0 1.5 2.0 2.5 3.0
0 0.2 0.4 0.6 0.8
0.51.0
20
30
40
50
60
70
t
Fre
quen
cy, c
m−
1
(a)
0T3T
Magnetic field, T
Wav
enum
ber
(cm
−1 )EM
2
(c)
EM1
μ0H
cra
00.51.01.52.02.5 0.5 1.0
20
30
40
50
60
70
t
Fre
quen
cy, c
m−
1
(d)
0T3T
direction of magnetic field ramp
FIG. 11. Magnetic-field (H ‖ a) dependence of normalized transmittance t measured in the echb configuration at T = 1.5 K duringramping field (a) and (b) up and (c) and (d) down. (a) Two spectra for normalized transmittance t measured at μ0H = 0 T(H<Ha
cr ) and 3 T(H>Ha
cr ) during ramping field up. (b) A normalized transmittance map vs magnetic field and light frequency measured during ramping fieldup. (c) A normalized transmittance map measured during ramping field down. (d) Two spectra for normalized transmittance t measured atμ0H = 0 T (H<Ha
cr ) and 3 T (H>Hacr ) during ramping field down. An artifact of the measurement between 27 and 29 cm−1 is smeared out in
the color map. Critical magnetic field μ0Hacr ≈ 1 T in (b) and (c) is shown with vertical arrows.
down (c) and (d). With increasing the field starting fromHa = 0 the EM1 and EM2 electromagnons at 18 and 48 cm−1
are observed up to μ0Hacr ≈ 1 T and vanish at H > Ha
cr .With decreasing the magnetic field at H < Ha
cr the EM1,2
appear again but in slightly different positions: EM1 appearsat 20 cm−1, and EM2 appears at 57 cm−1. We note here thata weak shift in the EM1 and EM2 lines was also observedin the temperature dependence of transmission spectra in theechb configuration in zero magnetic field (see Fig. 4): with thetemperature increase from 2 to 4 K, the EM1 line changes itsposition from 20 to 22 cm−1, and the EM2 line shifts from 48to 55 cm−1.
IV. DISCUSSION AND CONCLUSIONS
A. Quasi-FM mode hardening below T DyN
Figure 1 shows that the frequency of the quasi-FM modeincreases from 14 to 19 cm−1 below T
DyN = 4.2 K when the
ordering of Dy spins occurs in the ab plane. The observedmagnon hardening indicates a strong Dy-Fe interaction. BelowT
DyN , only the lowest |±15/2〉 Dy doublet is populated, and
thus, it governs the magnetic properties of Dy subsystem atthese temperatures. For our estimations we will consider theDy subsystem in a two sublattice approximation with the Dymoments ordered in a collinear antiferromagnetic structure inthe ab plane. In this case, the magnetization MDy of one of thetwo Dy sublattices below T
DyN = 4.2 K can be described in the
Weiss mean-field theory approach as follows:
MDy(Heff) = NμDy tanh
(μDyλMDy
kBT
). (1)
Here N is a number of Dy3+ ions in one of the sublatticesper unit volume; μDy is a magnetic moment of a split Dyground state doublet sublevel μDy ≈ 9.2μB [3,33]; tanh(x) isa Brillouin function BS(x) for S = 1/2 (since only the lowestDy doublet level is relevant); λ is a mean-field constant. Intro-
ducing reduced magnetization m = MDy/NμDy and reducedtemperature t = T kB/Nμ2
Dyλ Eq. (1) can be rewritten as
m = tanh(x), m = xt. (2)
Solving graphically Eqs. (2) we obtain reduced mag-netization at a given reduced temperature, where m = 1corresponds to the saturated magnetization MDy = NμDy andt = 1 corresponds to the Neel temperature T
DyN = Nμ2
Dyλ/kB .The obtained temperature dependence of MDy is shown in theinset of Fig. 1 in normalized units with the black solid curve.The quasi-FM mode frequency below T
DyN can be described as
follows:
ωFM(T ) = 14 cm−1 + kMDy(T ), (3)
where k is a matching coefficient. Using Eq. (3) we demon-strate that the calculated frequency ωFM(T ) nicely correlateswith the experimental data below T
DyN (see the inset of Fig. 1).
B. Effective g-factor of the quasi-FM mode at T < T DyN
Figure 6 shows that at T = 1.5 K and H>Hccr when Fe
spins are in the �4(GxFz) phase, the frequency of the quasi-FMmode linearly depends on the external magnetic field along thec axis with effective g-factor geff ≈ 2.1. The frequency of thequasi-FM mode can be obtained from the equations of motionof magnetic order parameters G and F ,
d �Fdt
= −γ [ �F × �HF ] − γ [ �G × �HG],
(4)d �Gdt
= −γ [ �F × �HG] − γ [ �G × �HF ],
where �G = ( �M1 − �M2)/2, �F = ( �M1 + �M2)/2 are antiferro-and ferromagnetism vectors, �M1,2 are magnetic moments of Fesublattices, �HF = −∂ /∂ �F , �HG = −∂ /∂ �G, γ ≈ 2μB/� isthe gyromagnetic ratio for Fe spins and is the nonequilibrium
094403-9

T. N. STANISLAVCHUK et al. PHYSICAL REVIEW B 93, 094403 (2016)
thermodynamic potential of DyFeO3. At low temperatureswhen only the lowest Dy doublet is populated and the Dysubsystem is paramagnetic is given by the expression [36],
= 1/
2A �F 2 + 1/
2b2G2y + 1
/2b3G
2z
+d1GxFz + d3GzFx − (1 + ηz)FzHz
−τ1GxHz + fourth-order terms, (5)
where A and d1 ≈ −d3 = −d are isotropic and antisymmetricDzyaloshinskii-Morija constants; b2 and b3 are anisotropyconstants renormalized by Dy-Fe interaction; ηz = χcλF andτ1 ≈ χcλG cos ϕ0, where χc is a Van Vleck susceptibilityof Dy ions along the c axis, λF and λG are constants ofthe isotropic and anisotropic Dy-Fe exchange interactions.Linearizing and solving Eqs. (4) using the thermodynamicpotential from Eq. (5) the following expression for ωFM
(H ‖ c) can be obtained for the �4(GxFz) phase of Fe spins:
ωFM =√
ω20 + γ 2H (H + H eff
D ), where ω0 is the magnon’s
frequency in zero field, and H effD is the effective Dzyaloshinskii
field. In external magnetic fields which are small compared toH eff
D the frequency ωFM can be written as follows:
ωFM ≈ ω0 + γ 2H effD
2ω0H. (6)
We note that Eq. (6) was derived using thermodynamicpotential (5) where the Dy subsystem was considered paramag-netic. For more accurate results at T < T
DyN , weak interaction
between Dy magnetic moments should be taken into accountin the expression for thermodynamic potential . At thesame time as a first approximation we will use Eq. (6)to estimate the Dzyaloshinskii field H eff
D at T < TDyN . At
T = 1.5 K ωFM linearly depends on the external magnetic fieldalong the c axis ωFM = ω
extrapFM + geffμBμ0H where geff ≈ 2.1
and ω0 = ωextrapFM ≈ 15.2 cm−1 [see Fig. 6(b)]. Comparing this
to Eq. (6) we get μ0HeffD ≈ 34 T. Earlier room-temperature
studies of quasi-FM mode behavior in the magnetic field H ‖ c
showed that μ0HeffD in DyFeO3 is 16.5 T [31] which is smaller
by a factor of ∼2 compared to the value we obtained forT = 1.5 K. Taking into account that Dzyaloshinskii field HD
practically does not depend on temperature in YFeO3 [41,42]where Y is a nonmagnetic ion, the increase in H eff
D at lowtemperatures in DyFeO3 can be attributed to the increase inthe Dy-Fe interaction.
C. Contribution of the electromagnon EM1 to the static ε uponcycling of magnetic field H ‖ b at T < T Dy
N
To evaluate the contribution of the electromagnon excitationEM1 to the changes in εc(H ) shown in Fig. 10(a) thetransmission spectra from Fig. 9 were modeled and fitted.The obtained magnetic-field-dependent parameters of the EM1
excitation, such as oscillator strength SEM, eigenfrequencyωEM, and damping constant γEM are shown in Table II. Themodeling of transmission spectra measured during rampingthe field up was more complicated and less reliable as theform of the EM1 spectral line was not nicely fitted with oneoscillator and required introduction of two closely positionedand overlapping Lorentz oscillators. For this reason in Table IIwe indicate only the combined oscillator strength of two
TABLE II. Parameters of the EM1 electromagnon [see Eq. (7)]obtained from the modeling of the transmission spectra of DyFeO3
measured in the echa configuration at T = 1.5 K as the magnetic fieldwas ramped up from 0 to 2 T and then down from 2 T to 0.
μ0H (T) SupEM1 Sdown
EM1 ωdownEM1 (cm−1) γ down
EM1 (cm−1)
2–1.4 0 01.2 0.19 01.0 0.36 0.43 29.8 330.8 0.36 0.34 29.8 300.6 0.39 0.44 29.4 140.4 0.49 0.55 30.2 150.2 0.52 0.57 28.5 13.40 0.52 0.9 17.5 9.3
Lorentz oscillators used for the fit of EM1 during ramping thefield up and do not indicate the eigenfrequency and dampingconstant of EM1. The contribution to the electric susceptibilityspectrum due to the EM1 excitation can be described using aLorentz oscillator,
χEM(ω) = SEMω2EM
ω2EM − ω2 + iγEMω
. (7)
At ω = 0 Eq. (7) gives the EM1 contribution to staticpermittivity εc: �εEM = χEM(0) = SEM which is equal to theoscillator strength of the EM1 excitation. The magnetic-fielddependence of SEM from Table II is plotted in Fig. 10(a)above the high-field value of εc ≈ 23.1 (black curve withopen circles for ramping field up and red curve with opentriangles for ramping field down). At low magnetic fields(H<Hb
cr ) SEM ∼ 0.5 and accounts for ∼45% of the totalchange of quasistatic εc during the cycling of magnetic field[�εmax(1.5 K) = 24.2 − 23.1 = 1.1]. Figure 10(b) shows theεc(H ) hysteresis loop measured at T = 10 K that is above T
DyN .
At this temperature εc(H ) does not manifest any hysteresis. Atthe same time εc still experiences change �εmax(10K) ≈ 0.6during the spin-reorientation transition of the Fe subsystem atμ0H
bcr = 0.6 T, which is no longer related to the contribution
from the electromagnon EM1. The difference between thetotal change in quasistatic εc observed during the cycling ofthe magnetic field at T = 1.5 and 10 K is �εmax(1.5K) −�εmax(10K) = 0.5 which is close to the oscillator strengthof EM1 in low magnetic fields (SEM ∼ 0.5) indicating thatthis difference can be mainly due to the contribution from theelectromagnon EM1.
V. CONCLUSIONS
We have studied magnetic excitations in a DyFeO3 singlecrystal in the far-IR spectral region in external magneticfields along all three main crystallographic directions and lowtemperatures down to 1.5 K, i.e., below T
DyN . The frequencies
of both quasi-FM and quasi-AFM magnon modes demonstratehardening upon magnetic ordering of Dy spins at T Dy
N = 4.2 Kthat can be attributed to the appearance of an additionaleffective magnetic field at Fe sites due to Dy-Fe interaction.The quasi-FM mode’s g-factor along the c axis at T < T
DyN and
low external magnetic fields is zero; at high enough magnetic
094403-10

MAGNON AND ELECTROMAGNON EXCITATIONS IN . . . PHYSICAL REVIEW B 93, 094403 (2016)
fields when the Fe subsystem is at the �4 spin configurationgeff = 2.1 which is nearly twice as big as reported earlierfor T = 300 K. The increase in geff can be attributed to therenormalization of the effective Dzyaloshinskii field H eff
D dueto the increase in Dy-Fe interaction at low temperatures. Twoelectric dipole-active magnetic excitations EM1 and EM2,or electromagnons, have been found at ∼20 and ∼50 cm−1
in the magnetoelectric phase of DyFeO3 below TDyN . The
electromagnons vanish with the application of a strong enoughmagnetic field along the a or b axis which changes themagnetic structures of the Fe3+ and Dy3+ moments into theones compatible with spatial inversion symmetry. We showthat the electromagnon at ∼20 cm−1 provides a significantcontribution to the static electric permittivity ε. The energiesof the electromagnons as well as static electric permittivity
manifest a strong hysteresis upon cycling of the externalmagnetic field at T < T
DyN .
ACKNOWLEDGMENTS
The authors are grateful to R. Basistyy for help withmodeling of experimental data and to S. Artyukhin for interestand useful discussions. Work at the New Jersey Instituteof Technology and Rutgers University was supported bythe U.S. Department of Energy under Contract No. DE-FG02-07ER46382. Use of the National Synchrotron LightSource, Brookhaven National Laboratory, was supported bythe U.S. Department of Energy under Contract No. DE-AC02-98CH10886.
[1] M. Marezio, J. P. Remeika, and P. D. Dernier, The CrystalChemistry of Rare Earth Orthoferrites, Acta Crystallogr., Sect.B: Struct. Crystallogr. Cryst. Chem. 26, 2008 (1970).
[2] R. L. White, Review of Recent Work on the Magneticand Spectroscopic Properties of the Rare-Earth Orthoferrites,J. Appl. Phys. 40, 1061 (1969).
[3] G. Gorodetsky, B. Sharon, and S. Shtrikman, Magnetic Prop-erties of an Antiferromagnetic Orthoferrite, J. Appl. Phys. 39,1371 (1968).
[4] K. P. Belov, A. K. Zvezdin, A. M. Kadomtseva, and I. B.Krynetskii, New orientational transitions induced in orthofer-rites by an external field, Sov. Phys. JETP 40, 980 (1975).
[5] A. Berton and B. Sharon, Specific Heat of DyFeO3 from 1.2°–80 ° K, J. Appl. Phys. 39, 1367 (1968).
[6] C. E. Johnson, L. A. Prelorendjo, and M. F. Thomas, Fieldinduced spin reorientation in orthoferrites DyFeO3, HoFeO3
and ErFeO3, J. Magn. Magn. Mater. 15, 557 (1980).[7] T. Yamaguchi and K. Tsushima, Magnetic Symmetry of Rare-
Earth Orthochromites and Orthoferrites, Phys. Rev. B 8, 5187(1973).
[8] Y. Tokunaga, S. Iguchi, T. Arima, and Y. Tokura, Magnetic-Field-Induced Ferroelectric State in DyFeO3, Phys. Rev. Lett.101, 097205 (2008).
[9] N. Kida and Y. Tokura, Terahertz magnetoelectric response viaelectromagnons in magnetic oxides, J. Magn. Magn. Mater. 324,3512 (2012).
[10] A. P. Pyatakov and A. K. Zvezdin, Magnetoelectric andmultiferroic media, Phys.-Usp. 55, 557 (2012).
[11] V. N. Krivoruchko, Electrically active magnetic excitations inantiferromagnets (Review Article), Low Temp. Phys. 38, 807(2012).
[12] A. Pimenov, A. M. Shuvaev, A. A. Mukhin, and A. Loidl,Electromagnons in multiferroic manganites, J. Phys.: Condens.Matter 20, 434209 (2008).
[13] D. Senff, N. Aliouane, D. N. Argyriou, A. Hiess, L. P. Regnault,P. Link, K. Hradil, Y. Sidis, and M. Braden, Magnetic excitationsin a cycloidal magnet: the magnon spectrum of multiferroicTbMnO3, J. Phys.: Condens. Matter 20, 434212 (2008).
[14] N. Kida, Y. Takahashi, J. S. Lee, R. Shimano, Y. Yamasaki,Y. Kaneko, S. Miyahara, N. Furukawa, T. Arima, and Y.Tokura, Terahertz time-domain spectroscopy of electromagnons
in multiferroic perovskite manganites, J. Opt. Soc. Am. B 26,A35 (2009).
[15] A. Pimenov, A. Shuvaev, A. Loidl, F. Schrettle, A. A. Mukhin,V. D. Travkin, V. Y. Ivanov, and A. M. Balbashov, Magnetic andMagnetoelectric Excitations in TbMnO3, Phys. Rev. Lett. 102,107203 (2009).
[16] A. M. Shuvaev, V. D. Travkin, V. Y. Ivanov, A. A. Mukhin, andA. Pimenov, Evidence of Electroactive Excitation of The SpinCycloid in TbMnO3, Phys. Rev. Lett. 104, 097202 (2010).
[17] S. Pailhes, X. Fabreges, L. P. Regnault, L. Pinsard-Godart,I. Mirebeasu, F. Moussa, M. Hennion, and S. Petit, HybridGoldstone modes in multiferroic YMnO3 studied by polarizedinelastic neutron scattering, Phys. Rev. B 79, 134409 (2009).
[18] A. B. Sushkov, R. Valdes Aguilar, S. Park, S.-W. Cheong,and H. D. Drew, Electromagnons in Multiferroic YMn2O5 andTbMn2O5, Phys. Rev. Lett. 98, 027202 (2007).
[19] I. Kezsmarki, N. Kida, H. Murakawa, S. Bordacs, Y. Onose, andY. Tokura, Enhanced Directional Dichroism of Terahertz Lightin Resonance with Magnetic Excitations of the MultiferroicBa2CoGe2O7 Oxide Compound, Phys. Rev. Lett. 106, 057403(2011).
[20] S. P. P. Jones, S. M. Gaw, K. I. Doig, D. Prabhakaran, E.M. Hetroy Wheeler, A. T. Boothroyd, and J. Lloyd-Hughes,High-temperature electromagnons in the magnetically inducedmultiferroic cupric oxide driven by intersublattice exchange,Nat. Commun. 5, 3787 (2014).
[21] M. Cazayous, Y. Gallais, A. Sacuto, R. de Sousa, D. Lebeugle,and D. Colson, Possible Observation of Cycloidal Electro-magnons in BiFeO3, Phys. Rev. Lett. 101, 037601 (2008).
[22] P. Rovillain, R. de Sousa, Y. Gallais, A. Sacuto, M. A. Measson,D. Colson, A. Forget, M. Bibes, A. Barthelemy, and M.Cazayous, Electric-field control of spin waves at room tem-perature in multiferroic BiFeO3, Nature Mater. 9, 975 (2010).
[23] A. M. Kuzmenko, A. Shuvaev, V. Dziom, A. Pimenova, M.Schiebl, A. A. Mukhin, V. Y. Ivanov, L. N. Bezmaternykh,and A. Pimenov, Giant gigahertz optical activity in multiferroicferroborate, Phys. Rev. B 89, 174407 (2014).
[24] N. Kida, D. Okuyama, S. Ishiwata, Y. Taguchi, R. Shimano, K.Iwasa, T. Arima, and Y. Tokura, Electric-dipole-active magneticresonance in the conical-spin magnet Ba2Mg2Fe12O22, Phys.Rev. B 80, 220406(R) (2009).
094403-11

T. N. STANISLAVCHUK et al. PHYSICAL REVIEW B 93, 094403 (2016)
[25] N. Kida, S. Kumakura, S. Ishiwata, Y. Taguchi, and Y. Tokura,Gigantic terahertz magnetochromism via electromagnons in thehexaferrite magnet Ba2Mg2Fe12O22, Phys. Rev. B 83, 064422(2011).
[26] S. Seki, N. Kida, S. Kumakura, R. Shimano, and Y. Tokura,Electromagnons in the Spin Collinear State of a Triangu-lar Lattice Antiferromagnet, Phys. Rev. Lett. 105, 097207(2010).
[27] R. M. White, R. J. Nemanich, and Conyers Herring, Lightscattering from magnetic excitations in orthoferrites, Phys. Rev.B 25, 1822 (1982).
[28] S. Venugopalan, M. Dutta, A. K. Ramdas, and J. P. Remeika,Magnetic and vibrational excitations in rare-earth orthofer-rites: A Raman scattering study, Phys. Rev. B 31, 1490(1985).
[29] A. M. Balbashov, A. A. Volkov, S. P. Lebedev, A. A. Mukhin,and A. S. Prokhorov, High-frequency magnetic properties ofdysprosium orthoferrite, Sov. Phys. JETP 61, 573 (1985).
[30] S. M. Shapiro, J. D. Axe, and J. P. Remeika, Neutron-scatteringstudies of spin waves in rare-earth orthoferrites, Phys. Rev. B10, 2014 (1974).
[31] A. M. Balbashov, G. V. Kozlov, A. A. Mukhin, and A. S.Prokhorov, Submillimeter spectroscopy of antiferromagnetic di-electrics: rare-earth orthoferrites, in High Frequency Processesin Magnetic Materials, edited by G. Srinivasan, A. Slavin (WorldScientific, Singapore, 1995), Part I, pp. 56–98.
[32] V. G. Bar’yakhtar, I. M. Vitebskii, and D. A. Yablonskii,Symmetry and magnetic-resonance frequencies in magneticallyordered crystals, Sov. Phys. JETP 49, 703 (1979).
[33] H. Schuchert, S. Hofner, and R. Faulhaber, Optical Investigationof DyFeO3, Z. Phys. 220, 273 (1969).
[34] I. Nowik and H. J. Williams, Magnetic properties and param-agnetic relaxation of dysprosium in DyFeO3 below the Curiepoint, Phys. Lett. 20, 154 (1966).
[35] K. P. Belov, A. K. Zvezdin, A. M. Kadomtseva, and I. B.Krynetskii, New orientational transitions induced in orthofer-rites by an external field, Sov. Phys. JETP 40, 980 (1974).
[36] A. K. Zvezdin and V. M. Matveev, Theory of the magneticproperties of dysprosium orthoferrite, Sov. Phys. JETP 50, 543(1979).
[37] S. L. Gnatchenko, K. Piotrowski, A. Szewczyk, R. Szymczak,and H. Szymczak, Two-step metamagnetic phase transitioninduced by a magnetic field parallel to the b-axis in DyFeO3,J. Magn. Magn. Mater. 129, 307 (1994).
[38] S. L. Gnatchenko, N. F. Kharchenko, P. P. Lebedev, K.Piotrowski, H. Szymczak, and R. Szymczak, Magneto-opticalstudies of H-T phase diagram for DyFeO3 (H ‖ a), J. Magn.Magn. Mater. 81, 125 (1989).
[39] D. A. Yablonskii and V. N. Krivoruchko, Antiferroelectricresonance in rare-earth orthoferrites, Sov. Phys. Solid State 30,1765 (1988).
[40] Z. Y. Zhao, X. Zhao, H. D. Zhou, F. B. Zhang, Q. J. Li, C.Fan, X. F. Sun, and X. G. Li, Ground state and magnetic phasetransitions of orthoferrite DyFeO3, Phys. Rev. B 89, 224405(2014).
[41] A. M. Balbashov, A. G. Berezin, Y. M. Gufan, G. S. Kolyadko,P. Y. Marchukov, and E. G. Rudashevskii, Soft mode and energygap in spin-wave spectrum in a second-order orientational phasetransition. AFMR in YFeO3, Sov. Phys. JETP 66, 174 (1987).
[42] S. Jacobs, H. F. Burne, and L. M. Levinson, Field-Induced SpinReorientation in YFeO3 and YCrO3, J. Appl. Phys. 42, 1631(1971).
094403-12