Magnetometer and radar study of the ionospheric convection response to sudden changes in the...
27
Magnetometer and radar Magnetometer and radar study of the ionospheric study of the ionospheric convection convection response to sudden response to sudden changes in the changes in the interplanetary magnetic interplanetary magnetic field field R. A. D. Fiori R. A. D. Fiori 1,2 1,2 , D. Boteler , D. Boteler 1 , A. , A. V. Koustov V. Koustov 2 1 Natural Resources Canada, Geomagnetic Observatory, Ottawa, ON, Canada Natural Resources Canada, Geomagnetic Observatory, Ottawa, ON, Canada 2 University of Saskatchewan, Institute for Space and Atmospheric Studies, University of Saskatchewan, Institute for Space and Atmospheric Studies, Saskatoon, SK, Canada Saskatoon, SK, Canada
-
date post
21-Dec-2015 -
Category
Documents
-
view
219 -
download
5
Transcript of Magnetometer and radar study of the ionospheric convection response to sudden changes in the...

Magnetometer and radar study of Magnetometer and radar study of the ionospheric convectionthe ionospheric convection
response to sudden changes in the response to sudden changes in the interplanetary magnetic fieldinterplanetary magnetic field
R. A. D. FioriR. A. D. Fiori1,21,2, D. Boteler, D. Boteler11, A. V. Koustov, A. V. Koustov22
11Natural Resources Canada, Geomagnetic Observatory, Ottawa, ON, CanadaNatural Resources Canada, Geomagnetic Observatory, Ottawa, ON, Canada22University of Saskatchewan, Institute for Space and Atmospheric Studies, University of Saskatchewan, Institute for Space and Atmospheric Studies,
Saskatoon, SK, CanadaSaskatoon, SK, Canada

Effect to be InvestigatedEffect to be Investigated
Following a southward turning of the IMF the convection pattern must Following a southward turning of the IMF the convection pattern must transition from a Btransition from a Bzz<0 multi-celled to a B<0 multi-celled to a Bzz<0 two-celled convection pattern<0 two-celled convection pattern
?
Bz > 0 Bz < 0

Two reconfiguration scenariosTwo reconfiguration scenarios
Scenario 1:Scenario 1: Ionospheric convection Ionospheric convection response begins at the dayside cusp response begins at the dayside cusp region and propagates toward the region and propagates toward the nightside.nightside.
Scenario 2:Scenario 2: The entire high-latitude The entire high-latitude ionosphere responds simultaneously in ionosphere responds simultaneously in all MLT sectors.all MLT sectors.

ObjectiveObjective In this work, simultaneous observations and mapping In this work, simultaneous observations and mapping
of measurements from both the SuperDARN and of measurements from both the SuperDARN and ground-based magnetometer instruments are ground-based magnetometer instruments are examined to attempt a more comprehensive picture of examined to attempt a more comprehensive picture of the phenomenon.the phenomenon.
Resolve peculiarities!Resolve peculiarities!

Event StudyEvent Study CriteriaCriteria
ACE data availableACE data available Sudden (<5 min) transition from at least +5nT to -5nT Sudden (<5 min) transition from at least +5nT to -5nT
preceded by at least 1 hour of relatively stable IMF Bpreceded by at least 1 hour of relatively stable IMF Bzz SuperDARN data available on a large scale (>500 points)SuperDARN data available on a large scale (>500 points) SuperMAG data available (2000 or 2001)SuperMAG data available (2000 or 2001) Transition in the early to mid afternoon to ensure good Transition in the early to mid afternoon to ensure good
radar locationradar location Events selectedEvents selected
January 20, 2001January 20, 2001 November 02, 2001November 02, 2001

IMFIMF
A sharp southward transition in the IMF BA sharp southward transition in the IMF Bzz at 10:25 UT is expected at 10:25 UT is expected to arrive at the ionosphere at 11:58 UTto arrive at the ionosphere at 11:58 UT

Magnetometer-observed responseMagnetometer-observed response
Magnetometer response time was identified as the start of any noticeable Magnetometer response time was identified as the start of any noticeable change to the perturbation magnetic fieldchange to the perturbation magnetic field
In general, responses were delayed on the nightside compared to the daysideIn general, responses were delayed on the nightside compared to the dayside
10.3 MLT
(dayside)
1.5 MLT
(nightside)
delay=0
delay=12

Magnetometer-observed responseMagnetometer-observed response The perturbation The perturbation
in the H component in the H component of the magnetic of the magnetic field was generated field was generated for all stations for all stations available from the available from the SuperMAG data SuperMAG data repositoryrepository
Station locations Station locations are mapped in are mapped in MLAT/MLT MLAT/MLT coordinates at coordinates at 12:00 UT12:00 UT
14 MLT10 MLT
05 MLT
03 MLT

Magnetometer-observed responseMagnetometer-observed response
The perturbation magnetic field enhanced to more positive or more negative values in response to a The perturbation magnetic field enhanced to more positive or more negative values in response to a sharp transition in the IMF Bzsharp transition in the IMF Bz
The shortest delays of 0-1 minutes were observed in the 10 MLT sectors, and the longest delays of The shortest delays of 0-1 minutes were observed in the 10 MLT sectors, and the longest delays of 9-12 minutes were observed in the 14 MLT sector9-12 minutes were observed in the 14 MLT sector
delay=6-8 min delay=0-8 min delay=0-1 min delay=5-12 min

MLT/MLAT dependence observed MLT/MLAT dependence observed by magnetometersby magnetometers
For the January and November events, 142 and 157 magnetometer traces were examined and For the January and November events, 142 and 157 magnetometer traces were examined and 38 and 26 events were identified as having clear transition onsets.38 and 26 events were identified as having clear transition onsets.
Red and blue dots indicate enhancements and depressions in the magnetic fieldRed and blue dots indicate enhancements and depressions in the magnetic field Ionospheric response was first observed 1-2 MLT before noon, and then progressed toward Ionospheric response was first observed 1-2 MLT before noon, and then progressed toward
midnight over 10-15 minutesmidnight over 10-15 minutes MLAT dependence is suggested by the November eventMLAT dependence is suggested by the November event
January Event
November Event
37 km/s
21 km/s 1.5 km/s

MLT/MLAT dependence observed MLT/MLAT dependence observed by magnetometersby magnetometers
For the January and November events, 142 and 157 magnetometer traces were examined and For the January and November events, 142 and 157 magnetometer traces were examined and 38 and 26 events were identified as having clear transition onsets.38 and 26 events were identified as having clear transition onsets.
Red and blue dots indicate positive and negative gradients in the magnetic fieldRed and blue dots indicate positive and negative gradients in the magnetic field Ionospheric response was first observed 1-2 MLT before noon, and then progressed toward Ionospheric response was first observed 1-2 MLT before noon, and then progressed toward
midnight over 10-15 minutesmidnight over 10-15 minutes MLAT dependence is suggested by the November eventMLAT dependence is suggested by the November event
January Event
November Event
37 km/s
21 km/s 1.5 km/s
#1

SuperDARN-observed responseSuperDARN-observed response The gridded l-o-s The gridded l-o-s
velocity was plotted velocity was plotted for all grid cells of for all grid cells of the 8 SuperDARN the 8 SuperDARN radars available for radars available for this event.this event.
Radar fields-of-Radar fields-of-view and sample view and sample grid cells are grid cells are mapped in mapped in MLAT/MLT MLAT/MLT coordinates at coordinates at 12:00 UT.12:00 UT.

SuperDARN-observed responseSuperDARN-observed response
The average response time was 11 minutes for the PGR, KOD, and KAP radars located in the early The average response time was 11 minutes for the PGR, KOD, and KAP radars located in the early morning sectormorning sector
The average response time was 5 and 9 minutes for the SAS and STO radars located in the late The average response time was 5 and 9 minutes for the SAS and STO radars located in the late morning sector morning sector
delay=~10-15 min
delay=~5 min
delay=~10 min
delay=~5 min
delay=~10 min
SuperDARN-observed responseSuperDARN-observed response
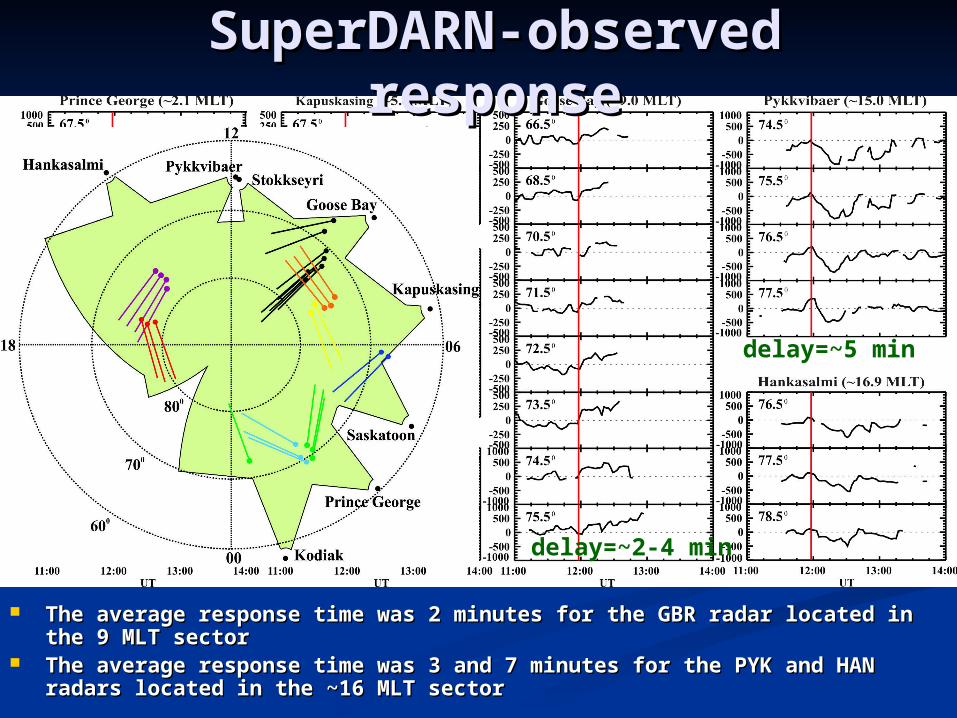
The average response time was 2 minutes for the GBR radar located in the 9 MLT sectorThe average response time was 2 minutes for the GBR radar located in the 9 MLT sector The average response time was 3 and 7 minutes for the PYK and HAN radars located in the ~16 The average response time was 3 and 7 minutes for the PYK and HAN radars located in the ~16
MLT sectorMLT sector
delay=~2-4 min
delay=~5 min

SuperDARN-observed responseSuperDARN-observed response
The average response time was 2 minutes for the GBR radar located in the 9 MLT sectorThe average response time was 2 minutes for the GBR radar located in the 9 MLT sector The average response time was 3 and 7 minutes for the PYK and HAN radars located in the ~16 The average response time was 3 and 7 minutes for the PYK and HAN radars located in the ~16
MLT sectorMLT sector
#2
delay=~2-4 min
delay=~5 min

MLT/MLAT dependence observed MLT/MLAT dependence observed by SuperDARNby SuperDARN
For the January and November events, 171 and 116 grip points were identified as having For the January and November events, 171 and 116 grip points were identified as having clear transition onsetsclear transition onsets
Ionospheric response was first observed in the pre-noon sector and then progressed toward Ionospheric response was first observed in the pre-noon sector and then progressed toward midnight in 5-20 minutesmidnight in 5-20 minutes
Ionospheric response was observed first at higher latitudes and then increasingly lower Ionospheric response was observed first at higher latitudes and then increasingly lower latitudes for the November event (opposite to magnetic data)latitudes for the November event (opposite to magnetic data)
January Event
November Event
23 km/s
17 km/s 1.5 km/s

MLT/MLAT dependence observed MLT/MLAT dependence observed by SuperDARNby SuperDARN
For the January and November events, 171 and 116 grip points were identified as having For the January and November events, 171 and 116 grip points were identified as having clear transition onsetsclear transition onsets
Ionospheric response was first observed in the pre-noon sector and then progressed toward Ionospheric response was first observed in the pre-noon sector and then progressed toward midnight in 5-20 minutesmidnight in 5-20 minutes
Ionospheric response was observed first at higher latitudes and then increasingly lower Ionospheric response was observed first at higher latitudes and then increasingly lower latitudes for the November event (opposite to magnetic data)latitudes for the November event (opposite to magnetic data)
January Event
November Event
23 km/s
17 km/s 1.5 km/s#1
#3

CPCPCPCP
Dawnside vortex begins close to midnight and then shifts eastward at onset, reaching a steady position near 4 Dawnside vortex begins close to midnight and then shifts eastward at onset, reaching a steady position near 4 MLT after 16 minutesMLT after 16 minutes
Location of the duskside vortex was highly variable until after the transition onset where it settled at 16 MLT Location of the duskside vortex was highly variable until after the transition onset where it settled at 16 MLT During periods of BDuring periods of Bzz>0 the CPCP was small, compared to periods of B>0 the CPCP was small, compared to periods of Bzz<0<0 Transition was marked by an immediate increase in the CPCP, reaching a maximum value ~40 minutes later.Transition was marked by an immediate increase in the CPCP, reaching a maximum value ~40 minutes later.

Residual convection-1Residual convection-1
At 12:04 a positive cell starts to form near midnight and then shifts eastward over the next At 12:04 a positive cell starts to form near midnight and then shifts eastward over the next four intervals.four intervals.

Residual convection-2Residual convection-2
At 12:14 UT the vortex of the dawnside convection cell settles at 07 MLTAt 12:14 UT the vortex of the dawnside convection cell settles at 07 MLT After 12:14 UT convection evolves becoming stronger, but the vortices are stationaryAfter 12:14 UT convection evolves becoming stronger, but the vortices are stationary
Summary of convection response based Summary of convection response based on the residual convection patternon the residual convection pattern
Convection vortices do not simply ‘snap’ to Convection vortices do not simply ‘snap’ to their final location, but develop over a period their final location, but develop over a period of timeof time
Dawnside convection vortex takes 4-6 minutes Dawnside convection vortex takes 4-6 minutes to form and 8-10 minutes to move to a final to form and 8-10 minutes to move to a final location and then continues to enhance until a location and then continues to enhance until a steady state is reached ~40 minutes after the steady state is reached ~40 minutes after the initial onsetinitial onset
#4

Summary and Conclusions – 1Summary and Conclusions – 1 Line-plots of the perturbation magnetic field were generated in Line-plots of the perturbation magnetic field were generated in
the 03, 05, 10, and 14 MLT sectors. The delay between the the 03, 05, 10, and 14 MLT sectors. The delay between the expected arrival time of the ionospheric onset and the expected arrival time of the ionospheric onset and the magnetometer-observed response was shorter for stations in magnetometer-observed response was shorter for stations in the 10 and 14 MLT sectors, and longer in the 03 and 05 MLT the 10 and 14 MLT sectors, and longer in the 03 and 05 MLT sectors.sectors.
Line plots of the gridded l-o-s velocity were generated Line plots of the gridded l-o-s velocity were generated throughout the 02-17 MLT sector. The delay between the throughout the 02-17 MLT sector. The delay between the expected arrival time of the ionospheric onset and the expected arrival time of the ionospheric onset and the SuperDARN-observed response varied from 0-20 minutes, SuperDARN-observed response varied from 0-20 minutes, with shorter delays observed in the 09-17 MLT region and with shorter delays observed in the 09-17 MLT region and longer delays closer to 02 MLT. longer delays closer to 02 MLT.
Ionospheric onset times were determined for all available Ionospheric onset times were determined for all available magnetometer stations and all available SuperDARN grid-magnetometer stations and all available SuperDARN grid-cells. For both data sets, the initial onset was observed near cells. For both data sets, the initial onset was observed near noon and propagated toward the nightside.noon and propagated toward the nightside.
Summary and Conclusions - 2Summary and Conclusions - 2 Prior to the southward transition, the vortex of the Prior to the southward transition, the vortex of the
dawnside convection cell was located close to dawnside convection cell was located close to midnight. After the southward transition, the vortex midnight. After the southward transition, the vortex of the dawnside cell propagated eastward and settled of the dawnside cell propagated eastward and settled at ~05 MLT within 12-16 minutes. at ~05 MLT within 12-16 minutes.
The location of the duskside convection cell was The location of the duskside convection cell was erratic during periods of northward IMF, but settled erratic during periods of northward IMF, but settled at 16 MLT within ~16 minutes of the southward at 16 MLT within ~16 minutes of the southward transition.transition.
The southward transition of the IMF was immediately The southward transition of the IMF was immediately marked by an increase in the CPCP determined by marked by an increase in the CPCP determined by SuperDARN.SuperDARN.

Two-stage processTwo-stage process
Stage 1 (~15 min): Stage 1 (~15 min): Noon-to-midnight progression of the ionospheric Noon-to-midnight progression of the ionospheric
onset of the observed magnetic and electric field onset of the observed magnetic and electric field response (5-6 min)response (5-6 min)
Foci of the Dungey convection cells moves from Foci of the Dungey convection cells moves from the nightside to the dayside (8-10 min)the nightside to the dayside (8-10 min)
Stage 2 (~25 min): Stage 2 (~25 min): Overall convection pattern intensifiesOverall convection pattern intensifies

CuriositiesCuriosities
(1) Noon to midnight progression not really (1) Noon to midnight progression not really seen on the dusk sideseen on the dusk side
(2) Conflicting results for the PYK/HAN (2) Conflicting results for the PYK/HAN radars and magnetometer dataradars and magnetometer data
(3) MLAT dependency for magnetometers and (3) MLAT dependency for magnetometers and SuperDARN dataSuperDARN data
(4) CPCP shows immediate response but (4) CPCP shows immediate response but residual convection shows a delay of 5-6 residual convection shows a delay of 5-6 minutesminutes

The EndThe End