Magnetically induced directed Cell Migration as a new...
125
Magnetically induced directed Cell Migration as a new Approach for Therapy of Glioblastoma multiforme Dissertation zur Erlangung des Doktorgrades des Fachbereichs Chemie der Fakultät für Mathematik, Informatik und Naturwissenschaften der Universität Hamburg vorgelegt von Birte Mucha Hamburg 2011
Transcript of Magnetically induced directed Cell Migration as a new...

Magnetically induced directed
Cell Migration as a new Approach
for Therapy of Glioblastoma multiforme
Dissertation
zur Erlangung des Doktorgrades
des Fachbereichs Chemie
der Fakultät für Mathematik,
Informatik und Naturwissenschaften
der Universität Hamburg
vorgelegt von
Birte Mucha
Hamburg
2011
Dissertation
Gutachter 1:
Prof. Dr. Ulrich Hahn
Gutachter 2:
Prof. Dr. Regine Willumeit
Disputation
04.November 2011
Gutachter 1:
Prof. Dr. Ulrich Hahn
Gutachter 2:
Prof. Dr. Alf Mews
Gutachter 3:
PD Dr. Edzard Spillner

Gott gebe mir die Gelassenheit
Dinge hinzunehmen,
die ich nicht ändern kann,
den Mut Dinge zu ändern,
die ich ändern kann
und die Weisheit
das Eine vom Anderen zu unterscheiden.
Friedrich Christoph Oetinger
CCoonntteenntt
Content
I Introduction 1
I.1 Overview of the Cells of the central nervous system (CNS) 1
I.2 The role of Astrocytes in the brain 1
I.3 Gliomas 3
I.3.1 Glioblastoma multiforme 4
I.3.2 Pathogenesis 4
I.3.3 Pathology 6
I.3.4 Therapy 6
I.3.5 Problems in therapy 7
I.4 Magnetic nanoparticles in medicine 9
I.5 Magnetotaxis in Bacteria 10
I.6 Principle of Cell Migration 11
I.7 Aim of this thesis 16
I.7.1 Open questions at the beginning of the thesis 16
II Materials and Methods 17
II.1 Materials 17
II.1.1 Consumables 17
II.1.2 Chemicals 17
II.1.3 Kits 18
II.1.4 Buffer and solutions 19
II.1.5 Media 20
II.1.6 Human cells 20
II.1.7 Equipment 21
II.2 Methods: 23
II.2.1 Preparation of nanoparticles 23
II.2.2 Cell culture methods 24
II.2.2.1 Thawing of cells 24
II.2.2.2 Cultivation of cells 24

CCoonntteenntt
II.2.2.3 Splitting procedure 24
II.2.2.4 Cryopreservation 25
II.2.2.5 Measurement of cell proliferation 26
II.2.3 Immunochemical and Biochemical Investigations 26
II.2.3.1 Berliner Blue Staining 26
II.2.3.2 Live Dead Staining 27
II.2.3.3 Actin Staining including immunhistochemical experiment 28
II.2.3.4 Cell Organelle Staining 29
II.2.4 Physio-chemical Methods 30
II.2.4.1 Iron quantification using
Inductively Coupled Plasma Mass Spectrometry (ICP-MS) 30
II.2.4.2 Magnetically directed Migration assay 33
II.2.5 Statistic 33
III Results 34
III.1 Nanoparticle uptake 34
III.1.1 Berliner Blue Staining 34
III.1.2 Measurement of the Iron content in using ICP-MS 36
III.1.3 Measurement of cell sizes 37
III.1.4 Summary 40
III.2 Evaluation of Toxicity 41
III.2.1 Proliferation assay 41
III.2.1.1 Proliferation assays of astrocytes incubated
with NP-MA or NP-LA supplemented media. 41
III.2.1.2 Proliferation assays of glioblastoma cells incubated
with NP-MA or NP-LA supplemented media. 42
III.2.1.3 Toxicity after an incubation time of 48h 44
III.3 Summary of Nanoparticle uptake and Toxicity 45
III.4 Development of the magnetic field and the migration assay 46
III.4.1 Cell culture material 46
III.4.2 Form of the magnetic field 46
III.4.2.1 The following governing criteria should be fulfilled 48

CCoonntteenntt
III.4.3 Orientation of magnetic lines of flux 48
III.5 Live Dead Staining 52
III.5.1 Where are the Nanoparticles 55
III.5.2 Cell Organelle Staining 58
III.5.2.1 Cell Organelle Staining of Astrocytes 58
III.5.2.2 Cell Organelle Staining of Glioblastoma multiforme (G55) 65
III.5.2.3 Astrocytes versus G55 73
III.6 Magnetically directed Migration 75
III.6.1 Migration of Astrocytes 75
III.6.2 Migration of Glioblastoma G55 77
III.7 Biochemical Effects 80
III.7.1 Immunhistochemical analyzes of Astrocytes 81
III.7.2 Immunhistochemical analyzes of Glioblastoma multiforme G55 84
IV Discussion 88
IV.1 Nanoparticle uptake and Toxicity 88
IV.2 Cell-organelle Staining and Localisation of Ferrofluids in Cells 90
IV.3 Magnetically Activated Migration
and Immuno-histochemical Analyses 94
V Summary 99
V.1 English version 99
V.2 German version 100
VI References 101
VII List of figures 114
VIII Abbreviations 116
IX Acknowledgements … 120

II IInnttrroodduuccttiioonn
1
I Introduction
Several works exist in the field of treatment for Glioblastoma. This work has
developed a new approach, using interdisciplinary methods. The following chapters
present an overview regarding cells in brain, as well as defining the astrocytes and
glioblastoma cells used in this study. In focus is glioblastoma, a grade IV tumor, for
which there is at present no successful therapeutic treatment.
I.1 Overview of the Cells of the central nervous system (CNS):
Neurons: electrical signalling
Neuroglia
Astrocytes: communicating with neurons and feeding of neurons
Oligodendrocytes: electrical isolation of neurons by myelin
Ependymal cells: cell layer of the ventricle system and the
central canal
Plexus epithelial cells: excretion of Liquor cerebrospinalis
Radialglia: leading structure during brain development,
in adult brain structure in retina (muellerglia)
Microglia: residential macrophage
I.2 The role of Astrocytes in the brain:
Fifty percent of all glia cells in the brain are astrocytes. These cells were chosen as a
standard control as they represent healthy cells of the brain and because they are
easier to handle within in vitro studies compared to neurons.
Astrocytes have a specific role in the brain: they clasp with their long excrescences
the abluminal surfaces of capillary endothelial cells and they regulated the blood flow
in the brain areas after neuronal stimulation (Wolf and Kirchhoff, 2008). Here the

II IInnttrroodduuccttiioonn
2
diffusion of soluble reagents is blocked. In other words astrocytes act as “door-
keepers”. Hence these cells are able to control the transport of metabolites between
the blood and the neuropil area. Other brain cells are also well protected against
toxic metals like lead and mercury.
To act as door keepers, the cells need a good protection to stand the glycolysis and
neurotransmission (Benarroch, 2005, Ralph Dringen 2003) caused by toxic metals.
Astrocytes are able to import and export iron actively and they are most likely
involved in the transfer of iron from the periphery in the neuropil (Ralph Dringen,
2007).
Iron is essential for life (e.g. as a component of the haem groups or as an iron-
sulphite reservoir in proteins), high iron depletion or increase can be lethal for cells.
Unbound iron can catalyze the accumulation of toxic reactive oxygen species (ROS).
Therefore iron transport and storage is a finely tuned process. The toxicity of iron is
founded in its redox attribute. In the Fenton reaction H2O2 is reduced to a hydroxyl
radical and a hydroxyl anion, while Fe2+ is oxidized to Fe3+. The Fe3+ of this reaction
can then be reduced again to Fe2+ by superoxide. This reduced agent (Fe2+) is
omnipresent and H2O2 is constantly produced during the cellular oxygen metabolism.
The formation of cytotoxic hydroxyl radicals is a potential risk which can damage
proteins via hydration. Cells minimize this risk by storing the iron in a redox inactive
form: Ferritin and by rapidly transforming H2O2 into water via the enzymes catalase
and gluthathione peroxidase (Dringen, 2006).
Astrocytes that incorporate in vitro larger amounts of iron very rapidly reach their
storage capacity. As a consequence they become more sensitive to oxidative stress
(Hoepken, 2004). This manifestation of reactive oxygen species can lead to cellular
protection dysfunction but also to iron-dependent process damage. Normally
astrocytes efficiently detoxify peroxides via glutathione peroxidases (Liddell and
Liddell, 2006). Additionally they are able to absorb and store large amounts of iron,
normally as ferritin (in vitro; Torti, 2002).
Ferritin is a globular protein complex consisting of 24 protein sub-units, made up of
light and heavy chains (19 kDA and 21 kDA respectively) and which is able to store
4500 iron atoms. The heavy chain performs a ferroxidase activity function, which can
transform bivalent iron to trivalent iron, thus it can be stored in a redox inactive form.
Kirschvink et al. (1992) found that magnetic particles from the maghemite-magnetite
family are present in the human brain, with a very similar structure to the crystal

II IInnttrroodduuccttiioonn
3
morphology of magnetotatic bacteria and fish. They found a minimum of 5 million
crystals per gram and a maximum of more than 100 million per gram. In fresh tissue
(shock frozen) the iron content is 4 to 10 times higher (Dobson and Grassi, 1995;
Banaclocha, 2009). It is suggested that astrocytes like neurons are involved in the
magnetic-based storage of memory (Fredrik Stormer, 2009). Kobayashi et al. (1997)
suggested that natural magnetite crystals in the brain and tumours are formed by
Ferritin, but not spontaneously.
I.3 Gliomas:
Accounting for more than 40% of all brain tumors, gliomas are the most common
primary tumors to occur in adults. Based on their aggressiveness and malignancy,
these neoplasms can be categorized into three histo-pathological (specific type of
cell) subgroups: ependymomas (ependymal cells), oligendendrogliomas (oligoden-
drocytes), and astrocytomas (astrocytes).
The World Health Organization (WHO) ratified a comprehensive classification of
neoplasms affecting the central nervous system (Louis DN et al. 2007). According to
this classification, ependymomas which usually grow slowly and are well delineated
from the adjacent brain structures (but not often totally resected by neurosurgeons,
de Hauwer et al. 1997) belong to the grade I (least aggressive), i.e., tumours which
are slow-growing, non-malignant, and associated with long-term survival.
The oligodendrogliomas are also slowly growing tumours but are difficult to remove.
This is because they have a tendency to infiltrate neighbouring brain structures and
hence their histopathologic grading is controversial. Oligodendrogliomas are
generally dichotomized into grade II (low grade) and grade III (high grade) tumours.
Astrocytic tumours (astrocytomas) are very heterogeneous (see figure 1) on a
pathologic as well as on the genetic level and are characterized by their diffuse
infiltration of the surrounding brain parenchyma. Astrocytomas can be low- or high-
graded tumours (Kleihues et al. 1993).

II IInnttrroodduuccttiioonn
4
I.3.1 Glioblastoma multiforme:
Malignant gliomas are the most common and deadly brain tumours (van Meir et al
2010). Between 12 and 15% of all brain tumors are glioblastoma. The survival time
for patients suffering from glioblastoma multiforme (the most aggressive form; WHO
classification grade IV) has been extended from 10 months up to 14 months in the
last five years, given better diagnosis and current standard proedures including
aggressive surgery, radiation and chemotherapy (Van Meir et al. 2010).
Up to now no adequate / efficient therapy exists for malignant gliomas. This is mainly
due to the fact that the cells are extremely mobile and infiltrate the brain by forming
metastases (De Hauwer 1997). The metastases are always found to have spread
within the brain and not to other tissues types.
I.3.2 Pathogenesis:
More often low grade astrocytic tumours progress during growth to higher levels of
malignancy (anaplastic astrocytomas and glioblastomas see table 1; De Hauwer,
1997; Kleihues et al. 1995) then ependymomas or oligendendrogliomas. Hence
astrocytomas represent the most aggressive form of gliomas (Mc Black 1991;
Kleihues 1992). The pathogenesis of glioblastoma multiforme can be therefore de
novo or as result of the progression of lower grade astrocytomas after therapy.
Some investigators have postulated a viral cause for malignant glioma, possibly
SV40 (Miller 2009).In the studies of Regis et al. (2003) it was found that SV40 had a
significant association with brain tumors, bone cancers, malignant mesothelioma
(cancer of the mesothelium) and non-Hodgkin’s lymphoma (a form of blood cancer).
Another hypothesis is that the Anopheles mosquito transmit a virus, which then leads
to brain tumour formation (Lehrer 2010).

II IInnttrroodduuccttiioonn
5
WHO
Grade
WHO
designation
St.
Anne/Mayo
Histopathology Associated
genetic
alterations
I Pilocytic
astrocytoma
Pilocytic
astrocytoma
Bipolar, “piloid” cells,
Rosenthal fibers,
eosinophilic granular
bodies
Accumulation of
P53 (>50%)
Deletion of
17q/NF1 (<20%)
II Ependymomas
are Low grade
astrocytoma
Astrocytoma
Grade 1 and
2
Neoplastic fibrillary,
or gemistocystic
astroyctes; nuclear
atypia
P53 accumulation
(>40%), p53
mutation
(>25%), LOH 17p
(>20%)
III Anaplastic
astrocytoma
Astrocytoma
Grade 3
Neoplastic fibrillary,
or gemistocystic
astrocytes; nuclear
atypia, mitotic activity
P53 accumulation
(>50%), p53
mutation
(>30%), LOH 17p
(40%), p16
deletion (>30%),
LOH 10 (>15%,
17p (25%))
IV Glioblastoma
multifome
Astrocytoma
Grade 4
Cellular anaplasia,
nuclear atypia,
mitoses,
vascular proliferation,
necrosis
P53 accumulation
(40%),p53
mutation
(>25%), LOH 10
(>60%), 17p
(25%)
19q (24%),p16
deletion (>60%)E,
GF-R (>30%) and
CDK4 (70%)
amplification
Table1: Comparison of the World Health Organization (WHO) and St.
Anne/Mayo grading system for astrocytomas -
Modified from Kleihues et al. 1993

II IInnttrroodduuccttiioonn
6
I.3.3 Pathology:
The macroscopic aspect of glioblastoma multiforme is characterized by its
inhomogeneous and multiple appearance: the tumour cross section often
demonstrates single and multiple haemorrhage with yellowish necrosis (Kleihues
1995). Glioblastoma multiforme are histological astrocytic sophisticated tumours. The
cells have multi-polar fine fibric- astrocytic differentiated appendages, or they show a
fatted cellular differentiation with foamed cytoplasm. Giant cells with bizarre nuclei or
minor cellular areas with less expanded cytoplasm are also possible. Here the nuclei
are mostly rich in chromatin and polymorph (Cavenee 2000).
The preferential location for glioblastomas to form is within the fronto-temporal region
of the brain, but the parietal lobes are also frequently affected. Typically is a rapid
spreading along compact myelinated pathways is observed, similar to butterfly
gliomas: a bilateral symmetric lesion after an infiltration through the corpus callosum
with extension in their contralateral hemisphere (Kleihues 1995).
I.3.4 Therapy:
The standard and actual therapy for glioblastoma multiforme is a combination of
aggressive surgery with chemotherapy and radiation. It is hoped that new therapies /
methodologies can be developed within the next 10 years will improve the current
poor prognosis for treating this form of cancer.
Radiotherapy for example, a standard tool in the therapy of such lesions, has
improved in its ability to focus the beam, to better tailor it to the irregular structures of
brain tumours. This has been achieved via the modulation of intensity, side effects
and dose, so that damage to nearby critical structures is minimized (Stieber 2007).
For some patients a new local chemotherapy with biodegradable GLIADEL® Wafer
(polifeprosan 20 with carmustine implant; Gliadel; Eisai Inc, Woodcliff Lake, NJ) used
after surgical resection of newly diagnosed glioblastomas and recurrent malignant
gliomas has extended the time line of disease progression and overall survival
chances (Westphal 2003; Brem 1995).
Temozolomide, is a chemotherapeutical agent with a lower toxicity profile than older
agents (e.g. carmustine) that is used in conjunction with radiotherapy. Following

II IInnttrroodduuccttiioonn
7
chemotherapy this combination has clearly improved the overall survival and due to
its relatively simple administration it has the advantage of wide applicability (Stupp).
The therapeutic effect of temozolomide depends on its ability to alkylate / methylate
DNA, which mostly occurs at the N-7 or O-6 positions of guanine residues, thus
generating DNA damages and methylation and activating thereby the death of
tumour cells (Jacinto 2007).
In the first tests performed using magnetic nanoparticles they were bound with BCNU
(carmustine) to concentrate the chemotherapeutics on targeted sites in vitro and in
vivo using an external magnet. When applied to brain tumours, magnetic targeting
increased the concentration and retention of bound – BCNU-3 (Hua et al. 2010).
Biodegradable polymer fibre carriers were tested in vitro as a direct drug delivery
system due to their ability to deliver BCNU over longer periods, the intension was to
improve the therapeutic efficacy and reduce toxicity effects (Xux et al. 2006; Seong
2003). To further enhance the efficiency of anti-cancer drug-based therapies, micro-
electromechanical devices (Li et al. 2004) and polymeric microchips (Grayson et al.
2003) have been designed.
Another approach is a therapy employing bevacuzimab, an antibody targeted against
vascular endothelial growth factor (VEGF). This targeted therapy has found its way
into clinical practice for the treatment of recurrent or progressive glioblastomas
(Norden 2008).
I.3.5 Problems in therapy:
Beside the problem that most agents are unable to cross the blood brain barrier
(BBB) (Lawson 2007; Groothuis 2000) and thus achieve therapeutic concentrations,
most therapeutic concentrations of any drug within the central nervous system (CNS)
increases the risk of systemic toxicity (Sampath 1998). Additionally, enthusiasm
raised by good results obtained from new drugs must be viewed critically; because of
the ability such tumours have to become resistant to such therapies (Van Meir 2010).
This resistance can be explained by the high proliferation ability of cancer stem cells
for self-renewal and therefore sustained tumour growth (Clarke et al. 2006), coupled
with their resistance to conventional radiation and pharmacological treatments (Bao

II IInnttrroodduuccttiioonn
8
et al.; Liu et al. 2006). Most chemotherapeutics are alkylating agents which damage
the DNA primarily by pairing of O6methylguanine with thymine during replication,
leading to point mutation from guanine : cytosine to adenine : thymine (Coulondre
1977). Beside their point mutagenic potential, O6methylguanine residues are also re-
combinogenic and cytotoxic (Rasouli – Nia et al. 1994). As such this can lead to
mutation of healthy cells and induce cancer.
Additionally, Temozolomide is a standard alkylating agent, inducing DNA damage
that can be repaired by repair enzymes, such as methylguanylmethyltransferase
(MGMT) for example (Hegi 2005). It has been shown that the survival times for
patients are elongated if they have an MGMT non expressing tumour and if the
therapy is combined with radiation (Stupp et al. 2005).
However the biggest problem during glioblastoma therapy is related to their mobility
characteristics. The cells can migrate very rapidly, leading to high invasiveness
(Demuth 2004). It is well known that cell motility is not a de novo feature emerging
coincident to carcinogenesis, several cell types migrate actively during the stages of
embryonic development, or macrophages as course of immune response (Demuth
2004). The motile behaviour of all cells is strictly controlled (refer chapter I.6),
suggesting that the reappearance of a motile phenotype in cancer cells is a result of
loosing of normal inhibitor controls or the cessations of these (Graham 1994), leading
to high invasiveness of this tumors. Part of this invasiveness is the increased
expression of proteases of the glioblastoma cells digesting the intracellular matrix.
The proteases ADAMTS4 and ADMTS5 were identified as such candidates (Held-
Feindt 2006). Demuth et.al. (2008) found an up regulation of the CTGF (connective
tissue growth factor) in migratory glioma cell lines, but less is known about the
different gene expressions. The most studies about glioblastoma cell migration want
to identify involved genes using them as target for therapy. This is because the
migration behaviour, in combination with a very fast growth rate, is what makes such
tumours so dangerous.
Prior to, and also as a consequence of treatment, patients can exhibit the following
symptoms: Aphasia, a change of personality, partial disorders or paralysis of the
respiratory centre.
In standard therapies only the main tumours can be treated and removed, thus
leaving many invasive cells in the surrounding tissue after surgery. This always leads
to a recurrence of the tumor.

II IInnttrroodduuccttiioonn
9
I.4 Magnetic nanoparticles in medicine:
One of the most critical points in the treatment of cancer is its imaging (i.e., detection
of small tumours and metastases) because only early detection allows for successful
treatment (Grodzinski 2006). One method to improve the resolution of imaging has
been through the introduction of super-paramagnetic iron oxide nanoparticles in
Magnetic Resonance Imaging (MRI) (Morawski 2005). Commercial products like
Sinerem®, Resovist®, Combidex®, or Endorem® consist of carbohydrate-polymer
(dextran) coated magnetite and maghemite nanoparticles diluted in water (Alexiou
2006). Using such products it is possible to detect pathological alterations in many
tissues, e.g. spleen, liver, lymph nodes and brain (Stark 1988; Suzuki 1996).
Apart from their use as contrast agents magnetic nanoparticles could more widely be
employed in the field of biomedical applications and techniques, for example in
magnetic separation (cell and macromolecule separation and purification),
immunoassays, controlled drug release, gene therapy, hyperthermia or as a
magnetically guidable carrier e.g. in drug delivery systems (Alexiou 2006; Babincova
2009).
This has led to many different types of small particles being developed including
magnetic microparticles, magnetoliposomes (Kubo 2000; Kückelhaus 2004) and
various magnetic nanoparticles.
Several studies approaches have focused on specific nanoparticles that have been
designed to be able to target different types of cancer, such as for breast cancer for
example (Li X 2009).
Depending on the approach employed, different types of magnetic fields
(homogeneous, alternating and inhomogeneous), magnetic strengths and magnetic
gradients are required. Another important parameter is the size of the nanoparticles.
Particles with a hydrodynamic diameter of about 100nm seem to be most suitable;
these consist of conglomerates made up of single domain particles of 10-15nm
diameter (Alexiou 2006) and are super paramagnetic. Larger particles rather than
smaller one are incorporated by the Mononuclear Phagocyte System (MPS)
(Sachdeva 1998).

II IInnttrroodduuccttiioonn
10
I.5 Magnetotaxis in Bacteria
Magnetic orientated migration of single cells is known for some prokaryotes, they use
biomagnetic functions to orientate themselves.
Several types of bacteria originating from different families are classified as magnetic
bacteria e.g. Desulfovibrio magneticus RS-1 (Sakaguchi et al. 2002)
Magnetobacterium bavaricum (Spring 1995), Magnetotactic multicellular Prokaryote
(MMB) (Greenberg 2005), Marine magnetotactic coccus (Frankel 1997),
Magnetospirillum gryphiswaldense (Schultheiss 2004) and Magnetospirillum
magneticum AMB-1. As it is possible to cultivate Magnetospirillum magneticum AMB-
1 under in vitro conditions, it has been relatively well studied.
Magnetotactic bacteria contain so called magnetosomes: Intracellular single domain
magnetic crystals surrounded by phospholipid membranes (Gorby et al. 1988).
Transmission electron microscopy studies have shown that the magnetite crystals
(50-100nm in diameter) are enveloped by a bilayer membrane of approximately 2-4
nm in thickness (Matsunaga 2003).
The magnetosomes are structured in chain-lines perpendicular to the cell axis
(Matsunaga 2003). The result here is rather like a compass needle.
This results in a structure somewehat like a compass needle and allows the cell to
migrate along the Earth’s geomagnetic field lines, positioning the bacteria within the
boundary of the oxic-anoxic transition zone (OATZ) (Bazylinski 1999). This magnetic
sensing is coupled with an aerotactic sensory mechanism (Frankel 1997).
Magnetotactic bacteria use this guidance after exposure to oxidative stress to reach
habitats with low or no oxygen and/ or redox gradients (Frankel 1997). In the
northern hemisphere the cells swim parallel to the Earth’s magnetic field (north-
seeking motility) whereas bacteria in the southern hemisphere swim in the opposite
direction (south-seeking motility). This results in the bacteria migrating along the
downward or upward- inclined geomagnetic field lines in the respective hemispheres
(Blakemore et al. 1980).
Prokaryotes have potential for use as a model system to gain a better understanding
of the magnetotaxis of more highly organized forms of life e.g. vertebrates or

II IInnttrroodduuccttiioonn
11
eukaryote cells, and to optimize culture conditions for industrial–scale production of
biotechnological processes (Mastunaga1996). One example is in the use of natural
magnetite crystals for biomedical therapies like hyperthermia. Because the
magnetosomes are produced by a living organism and not artificial it should be
possible via genetic engineering to design special natural biomimetic nanoparticles
for different applications. Another idea is to use induced magneto taxis for cancer
treatment.
I.6 Principle of Cell Migration
n mammals most cells move via crawling, with one exception being sperm that
swims. During embryogenesis the structure of an animal is organized by the
migration of single cells (Lauffenburger 1996), which define the location and the
coordinated migration of whole epithelial layers. Long distance migration is needed,
for example, in the construction of the full nervous system. Here actin-rich growth
cones that form on the leading edge of a newly built axon must find their way to their
synaptic goal. This is achieved through a combination of soluble and on cell surfaces
and matrix bound signals (Dent 2003).
Unfortunately the issue of cell migration is very important for certain cancer types. If
cells of a primary tumour for example infiltrate neighbouring tissues (e.g.
glioblastoma) or / and pass into the blood and lymph system (e.g. breast cancer),
they can move to different locations within the body and thus build metastases in
these regions. The movement of the cells is a highly complex integrated process,
consisting of the actin-rich cortex under a plasma membrane (see figure 2, Alberts
2011). This moving process can be well organized and fluent with no observable
change of phenotype (e.g. keratinocytes of a fish), while in other cells like fibroblasts
the movement activities are independent of each other, leading to a jerky movement
(Wen Tien Chen 1981).
Depending on cell type the type of built movement structure will differ, e.g. filopodia,
lammelipodia or pseudopodia.

II IInnttrroodduuccttiioonn
12
Filopodia: Are a one dimensional long and thin structure with a long core of bundled
actin filaments, formed by moving leading edges and some fibroblasts.
Lamellipodia: Are two dimensional structures similar in form to leaves, with an
orthogonal Network of actin filaments, most of them parallel to the subsoil. These
structures are formed by epithelial cells, fibroblast and some nerve cells such as
astrocytes.
Pseudopodia: Are three dimensional short structures filled with a gel of actin
filaments, formed by amoeba and neutrophile cells.
Best known is the structure of lammelipodia and hence it is primarily used as an
example of actin nucleation and resulting cell migration.
The actin filaments in this lammelipodia are orientated into plus (forward) and minus
(to cell nucleus). The minus ends are hidden by the Arp2/3 (actin related protein)
complex; this protects degradation of the actin filament and assists the nucleation of
the actin at the plus end (forward) (Millard 2004). Arp2/3 are linked to other actin
filaments building a two dimensional network (see figure 3).
Figure 1: Model of cell
movement
Three different processes are
involved: excrescence, whereby
actin-rich structures at the top of the
cells stretch out;
Adhesion, in this state the actin
cytoskeleton is connected with the
subsoil through the plasma
membrane, and tension which pulls
the cytoplasm forward (adapted from
Alberts 2011, Molekulare
Zellbiologie, Wiley VCH, chapter 16).
II IInnttrroodduuccttiioonn
13
The tractive forces created by a moving cell transmit considerable tension on the
substrate. Contrariwise is generated mechanical tension and distension in cells
responsible for building stress fibres and focal adhesions such that the cell becomes
more contractile (Harris 1980). Although poorly understood, it is thought that the
mechanical interaction between cells and their real environment is a fundamental
factor in the self organisation of mammal tissue. For locomotion a cell initially needs
a polarisation (definition of front, back etc.) to achieve a defined direction of
movement.
Netto filament
degradation
behind the leading
edge
Cofilin
Capping
protein
Diffusion of
actin
monomere
Netto filament assembly
at the leading edge
ARP-Complex
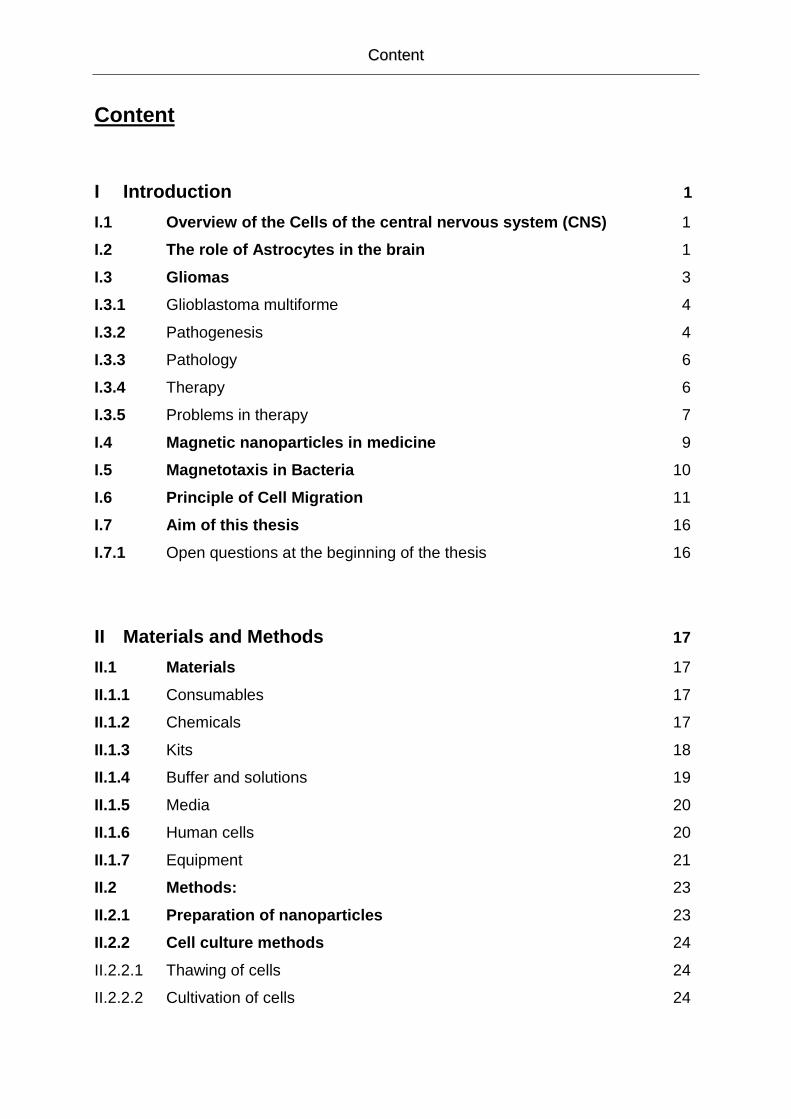
Figure 2: Model of the forward movement of actin network at the leading
edge. (adapted from Molekularbiologie der Zelle, 2011, Wiley VCH)
Presented is the time interval of a forward movement of a lamellipodia (new structures bright
colour). Germ building is mediated by the Arp2/3 complex at the front. Newly built actin
filaments are linked to the network in an angle of 70 degrees. Via the elongation of the actin
filaments the plasma membrane is pushed forwards, because the retrial network acts as an
anchor. With consistent speed the plus ends of the actin filaments are capped. After
hydrolysis of ATP in the new branches, the retrial network can be depolymerised by cofilin.
This cycle causes regional disconnection between the netto-filament degradation and netto
filament.

II IInnttrroodduuccttiioonn
14
Figure 3: Effects of Rac, Rho and Cdc42 to the actin organisation of
Fibroblasts
Staining of the actin filaments with the fluorescent marker phalloidin.
A) Fibroblast, incubated without Serum, showing actin filaments mainly at the cell cortex and
relatively low stress fibres. B) Micro-injection of a constitutive activated form of Rho resulting
in a fast building of many stress fibres. C) Micro-injection of a constitutive activated form of
Rac, a monomere GTPase (Rho family), resulting in the formation of a large lamellipodium
surrounding the whole cell. D) Micro-injection of a constitutive activated form of Cdc42 (as
well Rho family) resulting in the formation of many small filopodia at the cell surface. The
different effects of these three GTPases on the organisation of the cytoskeleton are mediated
by many other proteins and regulated by other GTPases. N-WASP and other proteins named
in this chapter belonging to these cytoskeleton organisation proteins (pictures: Hall 1998, text
adapted from Alberts 2011).
C) Rac-activation D) Cdc42- activation
A) relaxing cell B) Rho- activation
Actin-Staining Actin-Staining
20µm

II IInnttrroodduuccttiioonn
15
Later it was found that human Scar binds to the Arp2/3 complex and that this
interaction stimulates the actin filament nucleation activity of the complex (Machesky
1999; Machesky 1998).
Rohatgi et. al (1999) demonstrating that binding of N-WASP with an active form of
Cdc42 enhances the ability of the protein to activate Arp2/3. So for the first time a
signalling pathway for actin nucleation was identified.
Nucleation process with Arp2/3 drives locomotion forward and is regulated by WASP
(Wiskott Aldrich Syndrom Protein) family members.polymerisation at the front
(Pollard 2003), resulting in a forward movement by stationary filaments to the
substrate.
In Mammals five WASP family members have been identified:
WASP, N-WASP (Neural WASP), Scar/WAVE1, Scar/WAVE2 and Scar/WAVE3
(Miki 1998).
In connection with Cdc42 (cell division cycle protein 42; see figure 4), a small
GTPase known as an important actin regulator (Symons 1996), WASP was originally
described as a protein that could induce actin polymerisation.
Changes of the main structures of cytoskeletons are mediated by some GTPases
(Hall 1998), all members of the Rho family (see figure 4). In the case of Cdc42 the
cell shows a high activity with the building of many Filopodia, the cell migrates.
Because Cdc42 is interacting close with N-WASP to activate actin nucleation, this
was a focal point for this work. Because Cdc42 also regulates signalling pathways
controlling diverse cellular functions e.g. cell morphology, endocytosis, migration and
cell cycle progression, for this thesis an analysis for the activity of the N-WASP was
more suitable.

II IInnttrroodduuccttiioonn
16
I.7 Aim of this thesis
Fundamental to this study has been the invasive migratory nature of Glioblastoma
multiforme tumor cells and the fact that currently there are insufficient therapy
approaches to remove these from regions surrounding a tumor. This has led to the
idea of making use of the otherwise poor migratory behaviour of tumour cells in
combination with the magnetic properties of nanoparticles, creating thereby a new
therapeutic model for medically handling of such aggressive cancers.
The aim of this thesis was to develop a new therapy whereby nanoparticle loaded
cells are polarized in an external magnetic field and thereby activated through
magnetically induced gradients to purposefully migrate.
This therapy, if applied to patients in the future, should make it possible to collect the
invasive and inaccessible cells from the region of the brain adjacent to the tumor and
purposely migrate these cells to a pre-defined location for further medical treatment.
I.7.1 Open questions at the beginning of the thesis:
Since at the start of this work no parameters were known the work has concentrated
itself on answering the following fundamental questions:
Are the nanoparticles incorporated by the cells and do they have toxic
properties?
What form must the magnetic field take for basic in vitro research studies and
how strong must the magnetic field be?
If the cells incorporate the nanoparticles, where are the nanoparticles located in
the cells and how high must the iron content be within a cell for it to be moved in
a magnetic field?
Last but not least if it’s possible to achieve a directed movement of the cells,
which biochemical changes can be detected in the cells?

IIII MMaatteerriiaallss aanndd MMeetthhooddss
17
II Materials and Methods
II.1 Materials
II.1.1 Consumables:
6 Well-Plates Greiner Bio-One GmbH, D
12 Well-Plates Greiner, Nürtingen, D
Nonreturnable Pipettes TPP,Trasadingen, Ch
15ml+ 50ml Polypropylentubes Greiner Bio-one GmbH, D
Cryo Tank MVE Inc. Bloomington, USA
Mini Tubes Eppendorf AG, Hamburg, D
Pipette Tips Eppendorf AG, Hamburg, D
Cell culture flasks NalgeNunc International, NY, USA
Cryotube NalgeNunc International, NY, USA
Chamber Slides (Lab-Tek) NalgeNunc International, NY, USA
Chambered Coverglasses (Lab-TekII) NalgeNunc International, NY, USA
T 75 cell culture flasks blue filter cap NalgeNunc International, NY, USA
II.1.2 Chemicals:
Anti N-WASP phospho-specific Millipore, D
Bisbenzimide Hoechst 33342 Sigma Aldrich, USA
Counter Isoton II Diluent Beckman Coulter Inc, USA
DMEM® InvitrogenTM, Grand Island, N.Y., USA
DMSO Sigma Aldrich, USA
Cell mask (membrane) InvitrogenTM, Grand Island, N.Y., USA
ER Tracker InvitrogenTM, Grand Island, N.Y., USA
Fetal Calf Serum (FCS) PAA Laboratories GmbH, Austria
37% Formaldehyd Sigma Aldrich, USA
HP-Sätze H 301, 311, 314, 317, 331, 351
P 260, 280.1-3,7, 301+310, 303+361+353, 304+340, 305+351+338, 308+313, 403+233
IIII MMaatteerriiaallss aanndd MMeetthhooddss
18
Eosin B Sigma Aldrich, USA
100% Ethanol Merck KgaA, Darmstadt, D
HP-Sätze H 225 P 210, 403+233
Hydrochloric acid fuming (37% HCl) Merck KgaA, Darmstadt, D
HP-Sätze H 314, 335 P 260, 280.1-3+7, 301+330+331, 303+361+353, 305+351+338, 310
IgG (H+L) goat anti rabbit Dianova
KCl Merck KgaA, Darmstadt, D
KH2PO4 Merck KgaA, Darmstadt, D
LIVE/DEAD® InvitrogenTM, Grand Island, N.Y., USA
(Viability/Cytotoxicity Kit for mammalian cells)
Lyso Tracker Yellow InvitrogenTM, Grand Island, N.Y., USA
Lyso Tracker Red InvitrogenTM, Grand Island, N.Y., USA
NaCl Merck KgaA, Darmstadt, D
Na2HPO4 Merck KgaA, Darmstadt, D
Nitric acid Suprapure Sigma Aldrich, USA
HP-Sätze H 272, 314 P 220, 260, 280.1-3+7, 303+361+353, 304+340, 305+351+338, 310
Nanoparticles solutions Academy-Timisoara Devision, Romania
Paraffin-oil Sigma Aldrich, USA
Penicillin/Streptomycin Gibco, invitrogen, NY, USA
Potassium ferrocyanide trihydrate Sigma Aldrich, USA
HP-Sätze H 412 P 273
RNA Later Applied Biosystems
Trypsin-EDTA (0,05%) Gibco, invitrogen, NY, USA
Yttrium Standard for ICPMS Merck KgaA, Darmstadt, D
II.1.3 Kits
iScript RT-qPCR Sample Preparation Reagent Biorad, D
iScript cDNA Synthesis Kit Biorad, D

IIII MMaatteerriiaallss aanndd MMeetthhooddss
19
II.1.4 Buffer and solutions
Actin-Staining solution 1 mL 1x PBS
25 µL phalloidin
10 µL DAPI –solution
1% BSA
Antibody Solution 1 Anti N-WASP 1:1000 diluted
in Blocking solution
Antibody Solution 2 Texas Red marked Antibody
1:100 in Blocking solution
Blocking Solution 1xPBS
1% Triton X100
2% BSA
DAPI-Stock solution 5 mg DAPI
10 mL ddH2O
Store at 2-8°C
DAPI-Working solution 1 µL DAPI stock solution
49 µL ddH2O (=1 µg/µL)
Life-Dead-Staining-Solution 2 µL Calcein AM
5 µL Ethidiumhomodimer-1
5 mL PBS
Fibronectin solution 100 µL Fibronectin
Stocksolution (100ng/mL)
900 µL PBS
3.7% Formaldehyde solution 1 mL Formaldehyde (37%)
9 mL PBS

IIII MMaatteerriiaallss aanndd MMeetthhooddss
20
10% Formaldehyde solution 10mL Formaldehyde (37%)
27 mL dH2O
20% hydrochloric acid 20 mL HCl (37%)
17mL dH2O
PBS (Phosphate buffered saline) 8.00 g NaCl
0.20 g KCl
1.44 g Na2HPO4
0.24 g KH2PO4
. 1L ddH2O
pH 7.4 with 10 M NaOH
10% Potassium ferrocyanide solution 10 g Potassium ferrocyanide
trihydrate
Filled up to 100 mL with dH2O
II.1.5 Media
DMEM GlutaMAX-I:
Gibco® DMEM(1x)(+)Glucose 4,5 g/L(+)GlutaMAXTM(+)Pyruvat (GlutaMAX)
For the cultivation of cells the medium was completed with Fetal Calf Serum (FCS).
Media for the cultivation of Glioblastoma multiforme:
GlutaMAX-I +10% (V/V) FCS
Media for the cultivation of human primary Astrocytes:
GlutaMAX-I + 15% (V/V) FCS
II.1.6 Human cells
Glioblastoma multiforme: G44, G55, G112, G122
Primary Astrocytes1

IIII MMaatteerriiaallss aanndd MMeetthhooddss
21
The cancer cells used for this thesis were provided by Professor Katrin Lamszus
(Neurosurgery, University Clinical Eppendorf, Hamburg, Germany).
The cells were chosen due to their efficient migration behaviour. Primary astrocytes,
represent 50% of normal brain tissue. Therefore, they were chosen as the control in
this study.
II.1.7 Equipment
Incubator Thermo Scientific BBD 6220,
Heraeus CO2/O2 Heracell 150i incubator
Heraeus instrumentsTM
Pipettes EppendorfTM
Microscope Axiovert 25, ZeissTM
Clean Bench Cl.2 Hera Save, Heraeus instrumentsTM ;
Scanlaf cell culture bench
Water bath Fa. Memmert
Ice machine Scotsman AF-80
Flüssigstickstoffbehälter MVE SC20/20, CHART/MVE
Cell counter Particle count & analyzer Z2, CoulterTM
Centrifuge (15ml+ 50ml tubes) Labofuge 400R, Heraeus instrumentsTM
Table-Centrifuge (Minitubes) Heraeus Biofuge Pico
Cooling Centrifuge (Minitubes) Eppendorf centrifuge 5415C
Rotoshake Genie Scientific Industries, Bohemia, NY
Cold room (4°C) Viessmann
N2-container SC20/20
- 80°C freezer Viessmann
- 25°C freezer National Lab
Fridge Bosch
Ultrasonic bath (small) SONOREX
Microscope Nikon TIS Eclipse, Nikon, Japan
Microwave Severin MW7800 microwave
Dishwasher Miele

IIII MMaatteerriiaallss aanndd MMeetthhooddss
22
Autoclave Gössner GVA 4.6
Magnet stirrer IKAMAG RCT
Analyse balance Scaltech SBA 32
Vortex Genie 2 Scientific Industries, Bohemia, NY
Mastercycler Personel Eppendorf
Real time PCR C1000 Thermo Cycler CFX96, Biorad
pH-meter Hannah pH 211

IIII MMaatteerriiaallss aanndd MMeetthhooddss
23
II.2 Methods:
II.2.1 Preparation of nanoparticles:
Two different magnetic ferrofluids (Bica 2007) were used in the study, synthesized by
Doina Bica. They consisted of magnetite nanoparticles, that were stabilized by
coating with a double layer of two types of fatty acid (NP-MA = double layer of
myristic acid and NP-LA = double layer of lauric acid).
The nanoparticles were synthesized through chemical co-precipitation followed by
sterical stabilization in a water carrier of the resulting magnetic nanoparticles.
The main steps of the preparation route are given below:
215mL of 1M FeSO4 solution and 130mL of 2.8M FeCl3 solution were applied under
atmospheric conditions resulting in a Fe3+/Fe2+ factor of 1.7. The reaction mixture
was heated to 80-82°C under continuous stirring, and 300mL of NaOH(6N) was then
added.
After co-precipitation the magnetite nanoparticles were coated by a surfactant via the
addition of 24g of myristic or lauric acid at 80°C. The phases were separated after
20min by decantation, the resulting magnetic organosol was washed with distilled
water to eliminate any residual salts.
The nanoparticles that had been coated with a double layer of fatty acid were
dispersed in a weak solution of NaOH or NH4OH to obtain the required pH. At least
100 mL of the resulting magnetic fluids were purified by magnetic decantation /
filtration with a saturation magnetization of 12kA/m.
The mean diameter of the nanoparticles determined using TEM analysis was 4.3 ±
0.08 nm with a standard deviation of 1.3 ± 0.07nm for NP-MA particles and a mean
diameter of 6.1 ± 0.15 nm with a standard deviation of 2.4 ± 0.13 nm for NP-LA
particles.
Structural characterisation of the nanoparticle containg solutions was carried out by
small-angle scattering with polarized neutrons (Feoktystov 2009).
The iron content of the ferrofluids for biological purposes was analyzed after sterile
filtration (0.22 µm pore size) using ICPMS.

IIII MMaatteerriiaallss aanndd MMeetthhooddss
24
II.2.2 Cell culture methods:
II.2.2.1 Thawing of cells:
The cells were gently warmed to room temperature. Two cell culture flasks with
preheated DMEM Glutamax I media containing 10% FCS (fetal calf serum) for
Glioblastoma cells and 15% FCS for astrocytes (4mL, 10 mL or 25 mL for small,
medium or large sized flasks) were prepared.
The thawed cell suspension was gently mixed by pipetting up and down.
The suspension was divided into two prepared cell culture flasks in which the cells
were incubated at 37°C with 90% relative humidity and 5% CO2.
In order to remove any dead cells and DMSO the media was changed on the
following day.
II.2.2.2 Cultivation of cells
The cells were grown to a confluence of 80%. As stated above the environment
consisted of a temperature of 37°C with a relative humidity of 90% and 5% CO2.
The medium was changed every two or three days. If and when the cells reached
90% confluence, they were divided.
II.2.2.3 Splitting procedure
Normally the denseness of the cells should measure approximately 80% confluence.
If the density however increased beyond this limit the cells were split. Here the
medium was removed and the cells were washed once with 1x PBS (phosphate
buffered saline). After removing the PBS the flasks were filled with 2mL, 4mL or 6 mL
Trypsin (for small, medium or large sized flasks).
To detach the cells from the surface of the flasks, the flasks were incubated for 3min
at 37°C. After this incubation time the cells were loosened by gently knocking on the
Small flask Middle flask Big flask
2ml Trypsin 4ml Trypsin 6ml Trypsin
+ 4ml medium + 6ml medium +10ml medium

IIII MMaatteerriiaallss aanndd MMeetthhooddss
25
flask. To stop the enzymatic reaction, the cell – trypsin suspension was mixed with
medium containing FCS.
To get a homogeneous cell suspension with single cells, the mixture was gently
pipetted up and down and transferred into a 15mL or 50mL polypropylentube. A
sample of 50µL was retained for cell counting and transferred into 10mL of cell
coulter solution (or CASY solution). Cell counting was performed at Cell Coulter or
CASY.
The polypropylentubes with the cell suspension were centrifuged for 5min at
1500rpm to pellet the cells. After centrifuging the supernatant was removed and the
cells were resuspended in fresh medium containing FCS.
For a large cell culture flask, 500.000 cells of Glioblastoma or 300.000 cells of
astrocytes were cultivated in 25mL complete medium. The cells were used for
experiments or grown at 37°C, 90% relative humidity and 5% CO2 in the incubator.
II.2.2.4 Cryopreservation
For long-term storage the cells were frozen. Here the cells were first trypsinized, see
II.2.2.3. After pelleting the cells using centrifuging, the supernatant was removed and
the cells were washed with 3mL 1x PBS. The cells were then once again centrifuged
for 5min at 1500rpm. After removing the supernatant the cells were resuspended in
FCS containing 10% DMSO for a final concentration of 1Mio/mL.
The cell suspension was filled in a cryo tube up to a maximum of 1mL. The cryo
tubes were transferred into a freezing box filled with isopropanol (room temperature),
thereafter the box was placed into a freezer at -80°C.
Isopropanol cools at a constant rate of -1°C/min , thus avoiding the formation of ice
crystals within the cells. For long-term storage the cryo tubes were transferred after
24h into a nitrogen container (-175°C).

IIII MMaatteerriiaallss aanndd MMeetthhooddss
26
II.2.2.5 Measurement of cell proliferation
The cells were grown to 70% confluence. After removing from the media, the cells
were washed with 1x PBS and trypsinized (37°C, 3 min). The Trypsin reaction
was stopped by adding a media containing FBS. 50µl of the cell suspension was
transferred into 10mL of coulter solution and counted with the cell coulter.
The remaining cells were pelletised by centrifuging for 5min at 1,500 rpm.
Subsequently the supernatant was discarded and the cells resuspended in an
adequate volume of fresh culture medium to reach a concentration of 1 Mio/mL.
Five 12-well plates were prepared by adding 2 mL of: culture media (i. e., 4 wells),
culture media complemented with 0.25 µL/mL (21 µg Fe/mL) of nanoparticle
containing solution (i. e., 4 wells), and culture media complemented with
0.5 µL/mL (42 µg Fe/mL) of nanoparticle containing solution (i. e., 4 wells).
In every well 20,000 cells were seeded and incubated for 1 to 5 days at 37°C.
On the third day, 500 µL of fresh medium was added (“to feed the cells”).
One plate was analyzed each day. Here, the cells were washed with 2 mL 1x
PBS and then treated with 500 µL trypsine (37°C, 3min). The reaction was
stopped with 2mL of a cell specific medium and homogenized via pipetting
thoroughly. 50 µL of this suspension was used for cell counting. Furthermore
quadruplicate cell numbers for every concentration per day could be achieved by
applying this procedure.
II.2.3 Immunochemical and Biochemical Investigations
II.2.3.1 Berliner Blue Staining
Berliner blue staining was conducted to show that the cells incorporated the
nanoparticles. The reaction is iron dependent and builds a blue color complex.
Protocol is modified by Perls (1867).

IIII MMaatteerriiaallss aanndd MMeetthhooddss
27
20,000 cells were seeded in 12 well plates or chamber-slides and incubated at 37°C
overnight with different concentrations of nanoparticles in the media (0; 21 µg Fe/mL
and 42 µg Fe/mL). After 48 h the media were soaked and the cells were washed with
1x PBS and afterwards fixed with 10% formaldehyde (1h).
To remove formaldehyde deposits the cell were washed 3 times with 1x 1mL PBS for
1 min. After 5min pre-incubation with potassium ferrocyanide trihydrate solution
(1mL; 10%), 1mL of 20% hydrochloric acid was added and incubation took place for
a further 30 min. After washing four times with dH2O for 5 min, 1 mL eosin B was
added and incubated for 30 min. Thereafter the cells were again washed twice for
5 min and then dried with ethanol as outlined below:
- 2min ethanol 60%
- 2min ethanol 70%
- 2min ethanol 80%
- 2min ethanol 96%
The cells were covered with paraffin-oil (1 mL/well; if using a well plate) or with
DAKO mounting medium (one drop; if a chamber-slide had been used) and a cover-
glass.
II.2.3.2 Live Dead Staining
Calcein AM and Ethidiumhomodimer-1 must always to be stored at -20°C. After
preparation of the staining solution this solutions was immediately returned to the
refrigerator. Additionally to avoid hydrolyses of calcein AM the staining solution was
always prepared directly prior to staining.
The cells were seeded in the first two wells of chamber cover glasses (20,000
cells/well) which contained 400µL medium supplemented with nanoparticles-solution
to final concentrations of 21µg Fe/mL and 42µg Fe/mL, or zero (this was performed
twice) for two days. After an incubation time of 48h the media was then removed and
the cells were washed with 1x PBS.
IIII MMaatteerriiaallss aanndd MMeetthhooddss
28
400µL of fresh medium containing no nanoparticles was added to each well.
Thereafter half of the chamber cover glasses were placed in a magnetic field. The
other half were used as the control group, not having undergone exposure to the
magnetic field. The cells were incubated again for 24h at 37°C, 90% relative humidity
and 5% CO2.
For the staining procedure the media was removed and the cells washed with 1x
PBS. In each well 50µL of LIVE- DEAD staining solution was added and incubated
for 20min at 37°C in total darkness. On approaching the end of the incubation time
the staining solution was replaced with PBS. Micrographs were immediately taken to
identify living cells. (Invitrogen)
II.2.3.3 Actin Staining including immunhistochemical experiment
The actin staining was performed with Alexa Fluor 488 phalloidin, a toxin from the
fungus Death Cap against F-actin marked with a green fluorescence dye. For
staining of the nuclei DAPI was used.
Antibody 1 (Anti N-Wasp, rabbit anti human) is an antibody against the phospho
specific form (active form) of N-WASP, a protein involved in the nucleation process of
F-actin.
Antibody 2 is an IgG (H+L) goat anti rabbit Texas Red conjugate.
In the first two wells of chamber cover glasses 400µL of cell culture media (DMEM
Glutamax-I) containing zero, 0.25µL/mL (21µg Fe/mL) or 0.5µL/mL (42µg Fe/mL) of
nanoparticles and 5000 cells were added.
The cells were incubated at 37°C in the incubator for 2 days.
After incubation the cells were washed with 1x PBS and further incubated for 24h
within a nanoparticle free media in a magnetic field. For the control a chamber cover
glass with cells having undergone the same pre-incubation were again incubated
without exposure to the magnetic field.
The cells were washed with 1xPBS and fixed with 3.7% formaldehyde for 10min,
then washed twice with 1xPBS. Thereafter the fixed cells were incubated for 2h with
IIII MMaatteerriiaallss aanndd MMeetthhooddss
29
a blocking solution. The solution was then removed and antibody solution 1 was
added and this was then incubated for 1h in a relative humidity of 90%.
The cells were washed again three times with 1x PBS for 5min, then incubated with
antibody solution 2 for 1h. Again the cells were washed three times with 1xPBS for
5min.
Counterstaining
200 µL actin –staining solution was further added to each well. The lids from each
chamber cover glass were closed and these then stored in darkness at room
temperature for 20min.
Staining was completed after this incubation step. Prior to proceeding with
microscopy and storage, the cells were washed once with 1x PBS and covered with
400 µL 1x PBS.
Microscopy:
3D Photographs were taken in fluorescence modus using a Nikon Ti-S microscope
with an automated Prior Maerzhaueser xy- table and z-drive at 100x magnification.
II.2.3.4 Cell Organelle Staining
In the first two wells of chamber cover glasses, 400 µL cell culture media (DMEM
Glutamax-I) containing zero, 0.25µL/mL (21µg Fe/mL) or 0.5µL/mL (42µg Fe/mL)
nanoparticles and 5000 cells were added.
The cells were incubated at 37°C in the incubator for 2 days.
Thereafter the cells were washed with 1x PBS and incubated for 24h with
nanoparticle free media within a magnetic field. As a control, a chamber cover glass
with cells having the same pre-incubation was incubated without exposure to the
magnetic field.
To proceed with the cell organelle staining the cells were washed with pre-warmed
1x PBS. Here 200µL of PBS per well was added that contained DAPI, Lyso Tracker
Red and ER-Tracker as indicated below in the given concentrations.

IIII MMaatteerriiaallss aanndd MMeetthhooddss
30
Staining solution Ex Em Filter Concentration
Lyso Tracker Red 577 590 Texas Red 50mM in PBS
ER-Tracker 504 511 FITC 1µM in PBS
DAPI 340 465 DAPI 1µL /mL in PBS
Table 2: Filter and concentration set ups for cell organelle staining
The cells were incubated for 30min at 37°C in total darkness. For longterm storage
the cells were fixed in 3.7% Formaldehyde for 5min.
II.2.4 Physio-chemical Methods
II.2.4.1 Iron quantification using
Inductively Coupled Plasma Mass Spectrometry (ICP-MS)
Inductively coupled plasma mass spectrometry (ICP-MS) represents an important
method for the parallel quantitative determination of multiple elements in various
sample matrixes. Depending on the sample introduction system; liquid, gaseous or
solid samples can be analyzed.
The main advantages of this technique is its high sensitivity (normally in the low ng L-
1 range for most elements) as well as the possibility of analyzing nearly all elements
of the periodic table with only a few exceptions. Figure 4 indicates the elements
detectable by ICP-MS.
Preparation of the consumables
Three polypropylene tubes for each sample, +10 (calibration) were prepared ???.
To each 15mL polypropylene tube 1mL nitric acid and 9ml ddH2O were added. The
closed polypropylene tubes were gently shaken and incubated for two days under the
extractor hood. The acid solution was discarded in the appropriate acid waste. The
tubes were washed twice with ddH2O and air-dried under a clean-bench. The dried
tubes were closed and stored in a plastic bag until required.

IIII MMaatteerriiaallss aanndd MMeetthhooddss
31
Figure 4: Schematic view of the periodic table indicating ICP-MS detectable elements.
Experimental procedure
1. The cells were trypsinized, counted and pelletised by centrifugation. The cells
were then resuspended to obtain a final concentration of cells per mL media of
2Mio/mL.
Three T75 cell culture flasks were filled with 10mL media containing zero, 0.25µL/mL
(21µg Fe/mL) and 0.5µl/ml nanoparticles (42µg Fe/mL) of NP-MA or NP-LA.
Thereafter 750µL cells (1,5Mio) were added and then incubated at 37°C for two days.
The cells were then trypsinized, counted and pelletised.
The pre-incubated cells were used for different experiments in the following matter:
As a base line sample cells were resuspended in media to a
final concentration of 2Mio/mL.
a. Magnetically directed migration
50,000 cells per chamber-slide and sample were used.
(Description in results: Development of the magnetic field and
magnetically directed migration assay)

IIII MMaatteerriiaallss aanndd MMeetthhooddss
32
2. The remaining cells (minimum 400,000) were centrifuged, removed from the
supernatants, washed with 1x PBS and centrifuged again. The supernatants were
discarded and the cells resuspended in ddH2O to a final concentration of 1mio cells
/mL. The samples were collected and stored at -20°C until step 3.
3. The samples were ultrasonically homogenised for 2min at 15°C.
Each sample was split into three: 100µL into each of the prepared falcons, where
50µL of the Yttrium standard solution and 900µL of sub boiled nitric acid (65%) were
added. The samples were incubated overnight at room temperature under the
extractor hood.
4. On the following day 8,950µL of ddH2O was added to a total volume of 10mL. This
was carefully homogenised by shaking and then measured for iron concentration on
an Agilent 7500cs ICP-MS detector system using the experimental conditions
indicated in Table 3.
Table 3: Instrumental conditions used for measurements.
The analysis of iron using ICP-MS is hampered due to the formation of polyatomic
ions such as 40Ar16O+, which are formed inside the plasma. To overcome this
problem an ICP-MS system with an octopole collision and reaction cell has been
ICP-MS Agilent 7500c
RF power 1500 W
Carrier gas 0.84 L min-1
Makeup gas 0.28 L min-1
Extraction lens 1 5 V
Extraction lens 2 - 180 V
Octopole bias - 18 V
Quadrupole bias - 16 V
Cell gas 5 mL min-1 H2
Spray chamber Temperature 4 °C
Measured isotopes 54Fe, 56Fe, 57Fe, 89Y, 115I
Dwell time 0.1 s
IIII MMaatteerriiaallss aanndd MMeetthhooddss
33
used. It features an off-axis octopole ion guide operated in an RF-only mode, which
helps reduce the abundance of interfering polyatomic ions via the introduction of
different gases, into the cell.
For the reduction of interferences on the main isotope 56Fe, H2 efficiently reduces
interfering polyatoms due to a proton and charge transfer reactions as given below:
(1) 40Ar16O+ + H2 40Ar16O1H+ + H
(2) 40Ar16O+ + H2 40Ar16O + H2+
In addition kinetic energy discrimination obtained by the settings of the octopole and
quadrupole bias was applied to further reduce the background on the main iron
isotope.
II.2.4.2 Magnetically directed Migration assay
Preparations:
For the migration experiment Chamber slides (NUNC) with a glass surface were
used and were coated with fibronectin. Therefore 2mL 1x PBS (phosphate buffered
saline) with 10ng fibronectin /mL were transferred in the chamber slides and rotated
softly for one hour. Afterwards this slides were stored (closed with parafilm) at 4°C.
For the migration assay the cells collected from the ICP-MS preparation were used
and 50 µL (1 Mio/mL) were transferred to a marked area on the prepared chamber
slides. The cells were incubated for 6h at 37°C to adhere. Afterwards the cells were
washed with prewarmed media and sucked of to extract loose cells from the chamber
slide. Than 2mL of nanoparticles free media was added and the chamber slides were
placed into the magnetic field (+B) or without (-B) in the cell culture incubator for 24h.
Pictures were taken with a Nikon Microscope TiS at point 0 (start) and after 24h.
II.2.5 Statistic
Statistic was performed with the program Sigma Plot 11.0 using One Way ANOVA
and the Holm Sidak method.

IIIIII RReessuullttss
34
III Results:
At the beginning of this study two different types of nanoparticles were made
available. Both possess a core of magnetite and are covered by fatty acids. The
nanoparticles are designated as NP-LA and NP-MA. NP-LA is characterized by a
bilayer coating of lauric acid, while the other variant NP-MA contains myristic acid as
its coating. Initially it was unknown whether these particles were biocompatible and if
they would be taken up by the investigated cancer cells.
III.1 Nanoparticle uptake
In order to develop a methodology to direct migrating cells in a magnetic field it was
extremely important to select nanoparticles that could be successfully incorporated
into the cells in a pre-determined concentration and that the nanoparticles show none
or very low levels of toxicity.
In order to investigate these aspects different imaging and analytical procedures
within the cells, and Inductively Coupled Plasma Mass Spectrometry (ICP-MS)
enabled the measurement of the iron content within the cells.
III.1.1 Berliner Blue Staining
BBS is a staining method based on a reaction of potassium ferrocyanide with iron
contained in the ferrofluids of a blue dye complex (the natural iron content of the cells
can be detected using this method.) The presence and rough location of iron within
the cells were determined after staining using microscope based techniques.
IIIIII RReessuullttss
35
Results
Berliner Blue Staining
100 µm
Control 0,25 µL/mL 0,5 µL/mL
Berliner Blue Staining
100 µm
Control 0,25 µL/mL 0,5 µL/mL
100 µm
0,5 µL/mL
100 µm
0,5 µL/mL
Control
100 µm
0,5 µL/mL 0,25 µL/mL
Glioblastoma cells (G55) after incubation with nanoparticles (NP-MA) for 2
days.
Detection of Iron by Berliner Blue Staining
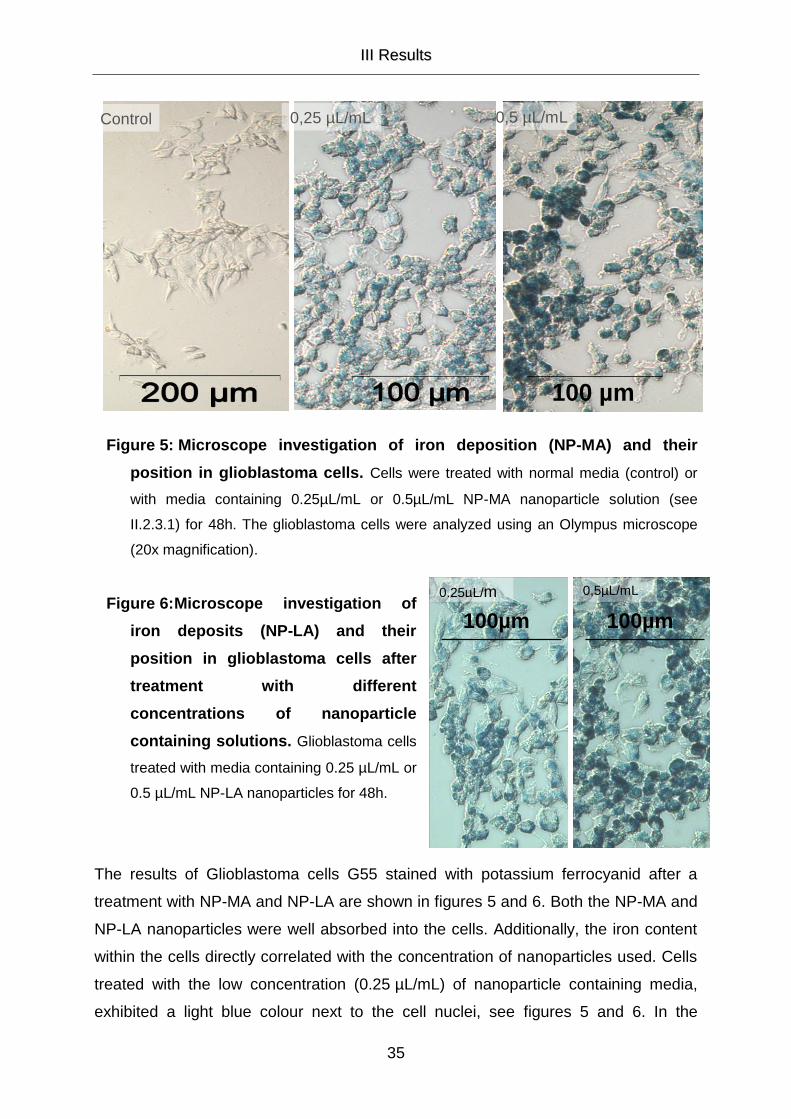
Figure 5: Microscope investigation of iron deposition (NP-MA) and their
position in glioblastoma cells. Cells were treated with normal media (control) or
with media containing 0.25µL/mL or 0.5µL/mL NP-MA nanoparticle solution (see
II.2.3.1) for 48h. The glioblastoma cells were analyzed using an Olympus microscope
(20x magnification).
Figure 6: Microscope investigation of
iron deposits (NP-LA) and their
position in glioblastoma cells after
treatment with different
concentrations of nanoparticle
containing solutions. Glioblastoma cells
treated with media containing 0.25 µL/mL or
0.5 µL/mL NP-LA nanoparticles for 48h.
The results of Glioblastoma cells G55 stained with potassium ferrocyanid after a
treatment with NP-MA and NP-LA are shown in figures 5 and 6. Both the NP-MA and
NP-LA nanoparticles were well absorbed into the cells. Additionally, the iron content
within the cells directly correlated with the concentration of nanoparticles used. Cells
treated with the low concentration (0.25 µL/mL) of nanoparticle containing media,
exhibited a light blue colour next to the cell nuclei, see figures 5 and 6. In the
0,5µL/mL 0,25µl/mL
100µm
100µm 100µm
0,25µL/m
L

IIIIII RReessuullttss
36
micrographs for cells treated with the high concentration (0.5 µL/mL NP-MA and
0.5 µL/mL NP-LA) of nanoparticles; most of the cells are completely blue.
III.1.2 Measurement of the Iron content in cells using ICP-MS
The use of BBS enables only a subjective representation of nanoparticle uptake by
the cells. This is because it is not capable of discerning to what extent the different
components of the particles affect colouring, hence only coarse differences in iron
uptake can be identified. This was overcome by employing an ICP-MS to make iron
content measurements. Due to its high sensitivity, the ICP-MS made it possible to
precisely measure the iron content of cells within very small sample volumes (100 µL
a100, 000 cells). This was performed after a 2-day incubation period.
0,00E+00
1,00E-06
2,00E-06
3,00E-06
4,00E-06
5,00E-06
6,00E-06
7,00E-06
8,00E-06
9,00E-06
0,25 NP-MA 0,5 NP-MA 0,25 NP-LA 0,5 NP-LA
Iro
n C
on
ten
t (µ
g)
/
Cel
l
Astro G55
Figure 7: Iron content per cell after a 2d incubation period measured using
ICP-MS The results have been normalized to control (non treated cells, natural iron
content). Both particles (NP-MA and NP-LA) are incorporated significant by concentration for
astrocytes. For G55 it was not possible to achieve a significant concentration dependent
nanoparticles uptake for NP-LA. Tested with One way ANOVA and the Holm – Sidak method
pair wise against each other n= 6 -19. p=0.01
Figure 7 shows the measured iron content normalized with respect to the control
(natural iron content of the cells). The natural iron content of astrocytes is 1.51*10-7
µg/cell and is 1.33*10-7µg/cell for G55.
Astrocytes and glioblastoma cells G55 exhibit an uptake dependent on nanoparticles
concentration for NP-MA. For NP-LA the uptake is only for astrocytes concentration
dependent, the significance test for G55 failed.
* * * * * * *

IIIIII RReessuullttss
37
The astrocytes have an increased net-content of iron per cell for NP-MA compared
with G55. Incorporation of NP-MA in the cell (astrocytes and G55) is proportional to
the nanoparticle concentration. The iron content for astrocytes is 3.1*10-6µg/cell (0.25
NP-MA) and 6.5*10-6µg/cell (0.5 NP.MA).
For glioblastoma G55 the iron level per cell (NP-MA) is approximately 20% lower
than for astrocytes.
Astrocytes incorporate 20% less nanoparticles NP-LA (0.9*10-6µg/cell for 0.25 and
1.4*10-6µg/cell for 0.5) in comparison to the values of G55.
NP-LA uptake within the cells was characterized by large variations even though
preparations for incubation were undertaken with the greatest of care to avoid
measurement error. Hence the bars as seen in Figure 7 exhibit a high standard error
therefore the uptake of NP-LA in G55 cells is not concentration dependent.
Additionally, NP-LA uptake was 40-50% lower compared to NP-MA incorporation for
both types of cell.
III.1.3 Measurement of cell sizes
The astrocytes and the glioblastoma cells are very different in their phenotypes,
especially in the size of their cells. As it was not known what effect cell size would
have on the experimental results, this was investigated. This simplified the
comparisons made between the cells and may affect the nanoparticles uptake and
the interpretation of following attempts.
Figure 8: Astrocytes cell size and nucleus measurement.
Spherical cells are observed in the left hand micrograph from which measurements
attempts were made to determine the total cell volume. The right hand micrograph is after
DAPI staining, this enables the size of the nuclei to be evaluated.

IIIIII RReessuullttss
38
For measurement purposes the cells were trypsinized and the cell suspension was
measured (figure 8 and 9 left). This was performed in order to improve the accuracy
of the measurements; in the adherent state the cells have many small growths of
varying thickness which makes accurate measurement of the cells very difficult.
Figure 9: Glioblastoma G55 cell size and nucleus measurements
The left hand micrograph shows spherical cells, cell measurements were made in order to
determine the total cell volume. The right hand micrograph is after DAPI staining, and
enables the size of the cell nuclei to be evaluated.
After detachment from the substrate the cells formed a spherical shape. This made it
easier to analyze the cells when using the NIS-elements software (NIKON).
Minimum sample sizes of 60 cells were measured for each condition in order to
improve the size distribution statistics. The total volume of cells and the volume of the
nuclei (figures 8 and 9, DAPI staining) were determined enabling the cytoplasm
volume to be calculated (figure 13). In the case of ferrofluids the iron content of a
particle and the magnetic volume were calculated. With the calculated iron content
per cell, the total number of particles per cell was determined as well as the magnetic
volume. The ratios (average of the cytoplasm volumes: average of magnetic particle
volumes) are presented in figure 10.

IIIIII RReessuullttss
39
PAGE 11
VCell = 4 / 3 r 3
VNucleus = 4 / 3 ab 2
VCytoplasma = VCell - VCore
Vcell VNucleus VCytoplasma
Astro 12,90 *10-9
cm3
1,67 *10-9
cm3
11,22 *10-9
cm3
G55 3,45*10-9
cm3
2,39 *10-9
cm3
1,01*10-9
cm3
magneticVParticle mFe/ Particle
NP-MA 4,77*10-20 cm3 1,74*10-13 µg
NP-LA 10,7*10-20 cm3 3,93*10-13 µg
Figure 10: Results of Cell measurements
The figure indicates the calculated cells and nanoparticle volumes along with the
formulas used in the calculations.
The figure shows that the astrocyte cell volume is five times larger than the
glioblastoma cell volume. However, they have significantly smaller nuclei, the
glioblastoma cells having nuclei twice as large.
For the case of the cytoplasm, the calculations indicate an 11 times larger volume of
astrocytes compared to G55. Figure 11 indicates that the uptake of nanoparticles in
G55 in comparison to astrocytes is 8-9 times as high when treated with NP-MA, while
this difference is even greater; 15 times at the low concentration and 24 times at the
higher concentration, for NP-LA.
0,00E+00
2,00E-04
4,00E-04
6,00E-04
8,00E-04
1,00E-03
1,20E-03
1,40E-03
1,60E-03
0,25 NP-MA 0,5 NP-MA 0,25 NP-LA 0,5 NP-LA
% o
f m
ag
ne
tic
vo
lum
e
of
na
no
pa
rtic
les
/ c
ell
Astro G55
Figure 11: Iron content normalized to cell volume
Ratio of the available cytoplasm volume to magnetic volume normalized against the control.

IIIIII RReessuullttss
40
III.1.4 Summary
The results of the nanoparticle uptake investigations demonstrate that the
incorporation of NP-LA into astrocytes is less pronounced than for NP-MA. This is
preferable from the point of view of therapeutic treatment because it would be less
stress for the brain cells. However, the uptake of NP-LA into glioblastoma cells is
very heterogeneous and not significant concentration dependent.
With reference to the nanoparticle volume to cytoplasm volume ratio, the G55 cells
contain 900-2400% more nanoparticles than astrocytes.

IIIIII RReessuullttss
41
III.2 Evaluation of Toxicity
In the first above described results it was shown that both ferrofluids were
incorporated into the cells, albeit to different extents.
Here it should be stated that only a combination of both - good cell assimilation of the
ferrofluids (concentration-dependant) AND very low toxicity meet the requirements
for future human brain neoplasm therapy. Hence nanoparticle biocompatibility has
been assessed with proliferation assays. Human primary astrocytes were used as
the control in all following experiments. Additionally, similar assays were performed
on brain tumour cells (glioblastoma cells).
III.2.1 Proliferation assay
III.2.1.1 Proliferation assays of astrocytes incubated with NP-MA or NP-LA
supplemented media.
a
0,00E+00
8,00E+04
1,60E+05
2,40E+05
3,20E+05
4,00E+05
1 2 3 4 5
Days
Nu
mb
er o
f cell
s
Control 0,25 NP-MA 0,5 NP-MA
b
0,00E+00
8,00E+04
1,60E+05
2,40E+05
3,20E+05
4,00E+05
1 2 3 4 5
Days
Nu
mb
er o
f c
ells
Control 0,25 NP-LA 0,5 NP-LA
Figure 12: Proliferation of astrocytes incubated with (a) NP-MA or (b) NP-LA
supplemented media. The Astrocytes were incubated with 0.25µL/mL or 0.5µL/mL of
nanoparticles and the cell number was measured over a 5 day period. Astrocytes without
nanoparticles were used as a control. The mean and standard deviation for n=4 were
calculated.

IIIIII RReessuullttss
42
Only small deviations between the control and the treated-groups (0.25 NP-MA and
0.5 NP-MA) were detected, although the differences were not statistically significant.
This means that neither NP-MA nor NP-LA (figure 12) have a negative effect on cell
proliferation. Accordingly, these two varieties of nanoparticles exhibited no toxicity in
astrocytes.
III.2.1.2 Proliferation assays of glioblastoma cells incubated with NP-MA or NP-
LA supplemented media.
a
0,00E+00
5,00E+05
1,00E+06
1,50E+06
2,00E+06
2,50E+06
3,00E+06
1 2 3 4 5
Days
Nu
mb
er o
f cell
s
Control 0,25 NP-MA 0,5 NP-MA
b
0,00E+00
5,00E+05
1,00E+06
1,50E+06
2,00E+06
2,50E+06
3,00E+06
1 2 3 4 5
Days
Nu
mb
er o
f cell
s
Control 0,25 NP-LA 0,5 NP-LA
Figure 13: Proliferation of glioblastoma cells G55 incubated with (a) NP-MA or
(b) NP-LA supplemented media. G55 cells without nanoparticles were used as control.
The number of G55 cells during incubation with 0.25 µL/mL and 0.5 µL/mL of nanoparticles,
as well as for the control, was measured over a 5 day period.
The toxicity of NP-MA and NP-LA nanoparticles was assessed in two glioblastoma
cell lines, G44 and G55.
The G55 cells in the control and treated cells groups showed only very small
differences for up to 3 days incubation, figure 13a. However after day 4, the control
group showed a significantly higher proliferation rate than either the 0.25 or the 0.5
NP-MA treated groups. The groups treated with nanoparticles exhibit to day 4 slightly
different from each other, then both concentrations reached a similar endpoint. At
day 5 the groups treated with nanoparticles show deviations from an average of 1.25
million cells from the control group, or approximately 50%.

IIIIII RReessuullttss
43
a
0,00E+00
8,00E+04
1,60E+05
2,40E+05
3,20E+05
4,00E+05
1 2 3 4 5
Days
Nu
mb
er o
f cell
s
Control 0,25 NP-MA 0,5 NP-MA
Between days 4 and 5 the number of NP-LA treated cells depends on the
concentration, unlike for NP-MA treated cells (figure 13b). This implies that the toxic
effect of the nanoparticles depends on concentration, with the higher concentration
showing greater toxicity. This results in only 500,000 cells remaining in the 0.5 NP-LA
treated cells compared to 850,000 for the 0.25 NP-LA treated group and over 1.4
million cells in the control group. Compared to the control group these values
correspond to 61% for 0.25 NP-LA - and 35% for 0.5 NP-LA.
On comparing different cancer cells (specifically G55 and G44, figures 13 and 14)
treated with NP-MA, it can be seen that major differences in not only growth
behaviour but also in response to nanoparticle concentration exist. The proliferation
and toxicity of the individual cell lines show big differences, based on their inherent
phenotypes.
Figure 14: Proliferation of
glioblastoma cells G44
incubated with NP-MA-
supplemented media. G44 without
nanoparticles were used as a control.
The number of G44 cells after
incubation with 0.25µL/mL and
0.5µL/mL of nanoparticles was
measured over a 5-day period.
Comparing Figure 14 for G44 cells and Figure 13a for G55 cells both treated with
NP-MA it is clear that not all cancer cells respond with the same sensitivity to the
nanoparticle concentration. Although the growth behaviour of the G44 cells up to day
3 is similar to that for G55 cells, differences develop on day 4 and 5. For the G44
cells treated with 0.25 NP-MA the number of cells is 88% of that for the control group
and approximately 77% for cells treated with 0.5 NP-MA.

IIIIII RReessuullttss
44
In both figures 13 and 14 it can be seen that cell growth behaviour is very
inhomogeneous. The starting point for exponential growth varies between day 2 and
3. The cell proliferation rate varies strongly between the divers cell line. For example
on day 5, 2.5*106 cells were measured for the G55 control group whereas only
2.5*105 cells were measured in the G44 control group. Such differences were
observed in all experiments. Consequently, in order to create stable and reproducible
conditions, the incubation time of further tests was set to two days (figure15).
III.2.1.3 Toxicity after an incubation time of 48h
0,00%
20,00%
40,00%
60,00%
80,00%
100,00%
120,00%
0,25 µL/mL NP-MA 0,5 µL/mL NP-MA 0,25 µL/mL NP-LA 0,5 µL/mL NP-LA
Astrocytes G44 G55 G112 G122
Figure 15: Results of cell viability investigations (determined by cell counting)
plotted as a percentage of the control values after a 2-day incubation period for different
nanoparticle (NP-LA and NP-MA) concentrations. * Statistically significant using One Way
ANOVA with multiple comparisons against the control group (Holm-Sidak-Method). p=0.01
Proliferation measurements using other cell lines with regard to a control were made
after 2 days (see figure 15). Recognizable is the heterogeneity of the various cancer
cell lines, compared to astrocytes. With regard to the different nanoparticle types, the
Astrocytes and G44 cells are not affected in terms of growth pattern after 48h. For
the G55 and G112 cell lines lower ferrofluid concentrations give rise to a significant
reduction in cell number, which becomes more significant for high concentrations.
G55 and G112 cells treated with NP-LA show a cell number reduction to
* * * * * * * * * *
Viability

IIIIII RReessuullttss
45
approximately 70-80% for the lower concentration and to about 65% for the higher
concentration of nanoparticles (figure 15). During incubation with NP-MA particles,
G55 cells behave like cells treated with NP-LA. G112, however, they demonstrate the
highest sensitivity for incubation with NP-MA ferrofluid. For the case of incubation
with NP-MA, the reduction in cell number is by about 36% for 0.25 NP-MA and
around 50% for 0.5 NP-MA. G122 demonstrate after incubation for 48h with 0.5 NP-
MA a reduction of the cell growth by around 20-30%.
Considering the cell viability results as a whole there is no obvious trend that one
type of the nanoparticles is more toxic than the other, toxicity depending on cell type
and line.
III.3 Summary of Nanoparticle uptake and Toxicity Investigations:
From the outset it was clear that nanoparticle uptake should be limited to a short
period in order to exploit the increased metabolism of the cancer cells, and also
enabling therapeutic use with a minimal dose to avoid patient side effects. For the
establishment of the migration assay and the magnetic field reproducible and stable
results are necessary, therefore the results of nanoparticles uptake and toxicity were
used for selection of basic parameters and nanoparticles type.
The toxicity tests demonstrate that astrocytes are slightly affected by the
nanoparticles while glioblastoma cells (G55), which contain fewer particles, are more
sensitive. For toxicity no relevant differences between the nanoparticles types were
found. However the proliferation data demonstrated that for all experiments it was
only possible to achieve reproducible circumstances (linear growth) during the first
two days of incubation.
The results of the nanoparticle uptake investigations showed that the incorporation of
NP-LA into astrocytes was less than for NP-MA. This is preferable for therapeutic use
because it connoted less stress for the healthy brain tissue. However the uptake of
NP-LA into glioblastoma cells is very heterogeneous and independent of
concentration. Hence a controlled uptake of this type of nanoparticle is very
uncertain. Uncontrollable experimental growth conditions made it difficult to establish
reproducible condition for the migration experiments. Consequently, all experiments
were limited to a time period of 48h and NP-MA was chosen as favored the
nanoparticle type.

IIIIII RReessuullttss
46
III.4 Development of the magnetic field and the migration assay
“The goal is to direct nanoparticle loaded glioblastoma cells, with the help of an
external magnetic field to a defined point.’’
In order to achieve the goal of directed magnetic migration of glioblastoma cells a
new methodology had to be developed. Commercially available migration assays
were unsuitable because these are normally based on diffusion of biological or
chemical concentration-gradients, e.g. cytokines or proteins. Additionally the
migrations of the cells are measured about very short distances circular or vertical.
The challenge here was two fold, (i) to produce cells with super paramagnetic
behaviour through insertion of supermagnetic nanoparticles and (ii) to direct the
migration of these cells using an external magnetic field. Hence a horizontal
migration assay was required in order to observe the migration of the loaded cells
under the influence of the magnetic field. Furthermore, various methods such as
LIVE DEAD staining, cell organelle staining, goal directed migration and immune
histochemical analyses should be observable under the same magnetic conditions.
Consequently these considerations were incorporated into the planning and
development of the magnetic field.
III.4.1 Cell culture material
Cell culture consumables consisted of chamber slides and/or chambered
cover glasses. The reason for this was due to their similar sizes and practical
reasons during analytical as well as microscopic analyses under magnetic
field conditions. Typically invasive glioblastoma cells are found at a distance of
1-3 cm away from the main tumour (pathology results, Demuth 2004, Kleihues
1995). By correctly choosing the size of the chamber slides this distance could
be simulated.
III.4.2 Form of the magnetic field
To achieve a directed force on the super paramagnetic nanoparticles (and so
on the cells) a gradient magnetic field is required.
Preliminary test runs made with a 300 mTesla magnet on one side of the
chamber slides showed that this natural magnetic field form was insufficient.

IIIIII RReessuullttss
47
The strength of the magnetic field fell off exponentially on moving from magnet
to start area of the cells. The desired magnetic field gradient was
geometrically too short. Especially due to the external form of the chamber
slides, the inner test room is several millimetres away from the magnet.
Additionally the area where the cells should be placed at the beginning of the
test should be a minimum of 1cm away from the chamber slide wall.
Consequently these tests demonstrated that a magnetic field with a relatively
strong gradient (155mTesla; for a distance of 7.6cm air gap (length of a
chamber slide)) was required.
S
Magnet
Iron
Gradient
155mTGradient
50mT
8 Position of
viewed Area
Magnetic Field Lines
Exchangeable Parts =
adjustable Magnetic Field
1,0 cm
22
N
7 Chamberslide
4
5
- 14 mT -
3 4
1
6
a b9
Figure 16: Design of the magnetic field; two magnet type
Top view; all grey parts = iron (h*w*l); 1) vertical main bar 3*3*18cm; 2) side bars
3*3*7,5cm; 3) magnetic pole shoe 1 = 3*2,6*2,5cm; 4) magnetic pole shoe 2 =
3*2,6*2,5cm; 5) left side plate 3*3*0,5cm, 6) magnet D3*3*0,5cm, 1,48 Tesla, 7)
chamberslide ca. 7,6cm; 8) diameter of viewed area position 8mm, 9) magnetic field
lines; shown gradient was measured with two magnet in these construction.
To solve this problem, a U-magnetic field form was chosen (Figure 16), this structure
enlarged the gradient by several centimetres, thus extending the test area of the
experiment.

IIIIII RReessuullttss
48
III.4.2.1 The following governing criteria should be fulfilled.
a) The size of the construction has to fit in an incubator fan, so that 6
magnetic fields could be used in parallel for experiments.
b) It should be possible to put the construction on the microscope table
without changing the experimental conditions or disturbing the camera
and the computer.
As a consequence a permanent magnetic field consisting of ferro neodymium
magnets was employed.
III.4.3 Orientation of magnetic lines of flux
Since the investigated cells grow adhering to their underground and then
actively migrate it became evident that a prime requirement of the magnetic
field was that it operates on the plane of the cells. Furthermore, migrating cells
should consolidate in the direction of the magnetic gradient in order to
concentrate themselves in the smallest possible area. Hence the magnetic
poles or so called shoes (figure 16: 3+4) when designing a magnetic field
needed to fulfill the following specific requirements.
In order to strengthen the magnetic flow density B on the one side, it was
necessary that magnetic pole shoe 1 (item 3 in figure 16) have a reducing
surface in both the horizontal and vertical planes as compared to pole shoe 2
(item 5 in figure 16). The larger surface area of magnetic pole shoe 2 ensured
that the magnetic flow field would be weaker on this side of the magnet.
These specifications were then incorporated into the magnet field as depicted
in figure 17.

IIIIII RReessuullttss
49
a
b
Figure 17: Magnet, two magnet type
a) topview b) lateral view: The experimental area with the chamber slides is a little lower
than the rest allowing for work on the microscope image plane.
The laterally laying form of the magnetic field (17+18) produces a slight one-sided
distortion of the magnetic field. With a vertically oriented variant standing over the
sample this would not be a problem but:
The lying variant was however necessary for microscopy in that this form did not
impede or block the optical light path. Further this form ensured the same conditions
applied for all experiments, because it has not been changed for life cell imaging.

IIIIII RReessuullttss
50
In the case of design of the magnetic field between the front surfaces of the magnet
pole shoes 1+2, this nevertheless results in a symmetrical form of the chamber slide
area, whose influence is depicted in figure 18. This is due mainly to the conical form
of magnet pole shoe 1.
The magnets were placed each in one pan with more than 20cm distance to each
other, so that no disturbance of the magnetic field test room could be detected (figure
18). And the cells in the different samples have the same incubator conditions
(opening frequencies and other external influences).
In order to ensure good reproducibility if was found that cell experiments required a
maximum distance of 1-2cm to the magnetic pole shoe 1, since there is the greatest
influence of the magnetic field. This is in line with the start of the strongly rising
exponential gradient depicted in (figur 19).
Figure 18: Magnetic field lines; two magnet type
The air gap (test area) shows a symmetrical form of the magnetic field, with nearly parallel
magnetic field lines at the cells starting area (1). The magnetic field has a small distortion to
the inner field (2), without measurable disturbance of the test area.
2
1

IIIIII RReessuullttss
51
0102030405060708090
100110120130140150160170
0 1 2 3 4 5 6 7 7,5
cm
mT
es
la
Mg1 Mg1.1 Mg1.2
StartpointN S
Figure 19: Gradient of the magnetic field, two magnet type.
The gradients of the magnetic field as measured over the distance of the air gap (length of
the Chamber slides) are presented here. The exponential path in the center (4cm distance) is
contributed to magnetic leakage fluxes.
The developed magnetic field leads to following questions:
Will the magnetic field potentiate the toxic effects on the cells especially on
astrocytes?
Is the cell structure of nanoparticles containing cells modified by the magnetic force?
And if astrocytes are only less influenced, is it possible to induce directed cell
migration of the glioblastoma cells?
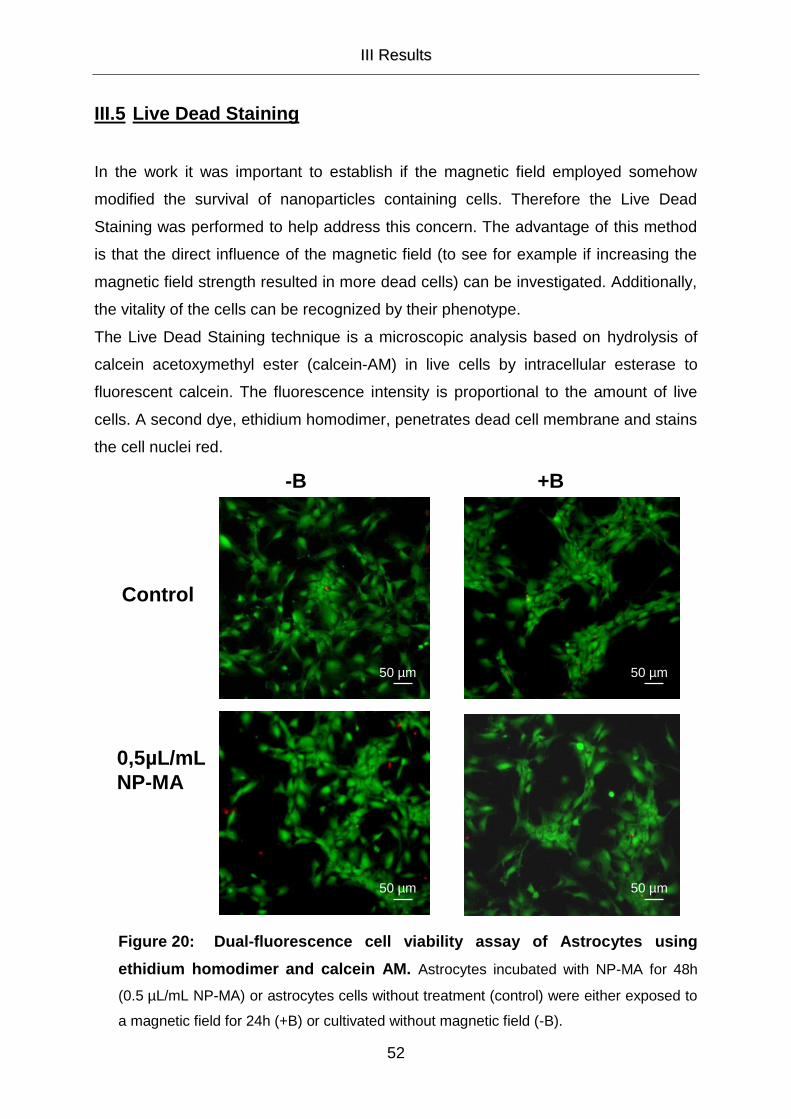
IIIIII RReessuullttss
52
III.5 Live Dead Staining
In the work it was important to establish if the magnetic field employed somehow
modified the survival of nanoparticles containing cells. Therefore the Live Dead
Staining was performed to help address this concern. The advantage of this method
is that the direct influence of the magnetic field (to see for example if increasing the
magnetic field strength resulted in more dead cells) can be investigated. Additionally,
the vitality of the cells can be recognized by their phenotype.
The Live Dead Staining technique is a microscopic analysis based on hydrolysis of
calcein acetoxymethyl ester (calcein-AM) in live cells by intracellular esterase to
fluorescent calcein. The fluorescence intensity is proportional to the amount of live
cells. A second dye, ethidium homodimer, penetrates dead cell membrane and stains
the cell nuclei red.
-B +B
Control
0,5µL/mL
NP-MA
Figure 20: Dual-fluorescence cell viability assay of Astrocytes using
ethidium homodimer and calcein AM. Astrocytes incubated with NP-MA for 48h
(0.5 µL/mL NP-MA) or astrocytes cells without treatment (control) were either exposed to
a magnetic field for 24h (+B) or cultivated without magnetic field (-B).
50 µm
50 µm
50 µm
50 µm

IIIIII RReessuullttss
53
In this set of experiments, astrocytes and glioblastoma cells G55 were incubated for
48h with either normal media (the control) or media supplemented with 0.5µL/mL
nanoparticles. After incubation the media employed was replaced by nanoparticle
free media and the cells either exposed to the magnetic field (with incubation) or
incubated without magnetic exposure under standard conditions. The aim was to see
if the combination of nanoparticles and magnetic field had an influence on the cells.
Both cell types were mostly unaffected after the 2-day incubation period and
subsequent exposure to a magnetic field for 24h. The astrocytes (figure 20) show no
phenotypic signs of stress. There were very few dead cells found, and when
compared to the control cells, their number can be considered as normal. This result
correlates well with the observations during the cell proliferation tests.
-B +B
Control
0,5µL/mL
NP-MA
Figure 21: Dual-fluorescence cell viability assay of G55 using ethidium
homodimer and calcein AM. Control cells were incubated without ferrofluids with
normal media. The pictures on the left hand side demonstrate the results without a
magnetic field (-B), while the right hand side micrographs show Glioblastoma cells G55
after an incubation time of 48h with NP-MA and subsequent exposure to a magnetic
field for 24h (+B).
50 µm
50 µm
50 µm
50 µm

IIIIII RReessuullttss
54
The G55 control cells incubated in the magnetic field show no changes in cell
number and viability. In contrast the cells treated with 0.5µL/mL NP-MA (figure 21)
show a 50 % decrease in the number of cells compared to the control group.
Additionally double the number of dead cells was found but no significant influence of
the magnetic field could be detected.
Consequently this result does not explain the differences in growth pattern observed
in the cell proliferation tests.
If the astrocytes are unaffected by the different circumstances and the glioblastoma
cells showing a distinct growth pattern, this leads to some more questions:
Where in the cells are the nanoparticles?
How, do the nanoparticles disturb cell growth?
Is the cell structure of nanoparticles containing cells modified by the magnetic
force?

IIIIII RReessuullttss
55
III.5.1 Where are the nanoparticles?
Magnetite quenches fluorescence was used to localize nanoparticles (agglomerates
or large accumulations) within the cell. The blue fluorescence light emitted by
excessive irradiation at specific-DAPI excitation wavelength (about 341 nm) was
identified as a more than capable technique of visualizing the nanoparticles within the
cells. Under green and red light (approximate wavelengths of 510 nm and 650 nm,
respectively) the particles however, were difficult to identify.
To mark the outer borders of the cells DAPI staining was combined with actin
staining. This was realized by phalloidin Alexa 488 (a toxin from the death cap
(Amanita phalloides), which binds F-actin and is labeled with a fluorescent analog for
light microscopy).
Individual particles and small agglomerates are not visible by light microscopy. When
employing light microscopy, only the high concentrated nanoparticle supplemented
media was used. In order to show that the ferrofluids were inside the cells the
samples were analyzed as 3D captions, at 100x magnification using a Nikon Ti-S
microscope. The cross on the captions identifies the origin of the slices in reference
to the x and y axis. The original pictures can be found on the data CD at the back
cover of this work.
When exposed to visible light, it is possible to detect dark shadows in cells treated
with nanoparticles. These accumulations of the magnetic beads (agglomerates or
storage forms) were localized within the cell body.
For both cell types it was found that these accumulations have a circular shape
(figure 22 and 23). However, significant differences were also observed:
In astrocytes (figure 22) fewer shadows are detectable, some next to the nucleus,
others several micrometers away.
In the glioblastoma cells (figure 23) large accumulations (sometimes more than one
micrometer) were found in the immediate vicinity of the nucleus, but also distributed
on the center of the cell body. In the “cell feed” region light shadows could also be
observed.

IIIIII RReessuullttss
56
Control
Control
0.5 NP-MA
0.5 NP-MA
Figure 22: Visualization of the nanoparticles in astrocytes
Presented are 3D captions of astrocytes cells stained with DAPI and actin phalloidin,
analyzed at 100x magnification (Nikon Ti-S). The cross through the original caption depicts
the origin of the slices. Actin was used to mark the cell borders. In astrocytes treated with the
high nanoparticle concentration small agglomerations of ferrofluids could be detected (white
arrows).
Bearing in mind the results of ICP-MS (iron measurement) this result here is irritating,
because for astrocytes higher concentrations of iron were measured than compared
to glioblastoma cells. Glioblastoma cells however always demonstrate more visible
agglomerates of ferrofluids. This is very interesting because the glioblastoma cells,
especially G55 and G112 show the highest reduction in cell growth (chapter III.2), a
possible reason perhaps for the measured cytotoxicity.

IIIIII RReessuullttss
57
0.5 NP-MA
0.5 NP-MA
Control
Control
Figure 23: Visualization of the nanoparticles in glioblastoma cells
Presented are 3D captions of gioblastoma cells stained with DAPI and actin phalloidin. Actin
was used to mark the cell borders. The cross through the original caption depicts the origin of
the slices. Cells treated with ferrofluids show large agglomerates of ferrofluids.
Due to the circular form of the agglomerates this lead to the question as to whether
the nanoparticles were stored in some kind of cell organelle?
To find answers to these question lysosomes (known for the waste management of
the cells) as well as the endoplasmic reticulum, being the transport system of the cell
were investigated. Consequently cell organelle staining was employed.
IIIIII RReessuullttss
58
III.5.2 Cell organell Staining
A cell organell staining with ER-Tracker™ (green) and LysoTracker™ (red) (both
Molecular Probes, Invitrogen) was performed to observe where exactly the
nanoparticles were within the cells. The nucleus was counterstained with DAPI
(blue).
ER-Tracker dyes are cell-permeant live cell stains that are highly selective for the
endoplasmic reticulum (ER). ER-Tracker green is the drug conjugate glibenclamide
BODIPY® FL respectively. Glibenclamide binds to the suphonylurea receptors of
ATP-sensitive K+ channels, which are prominent on ER (Molecular Probes).
Weak basic amines selectively accumulate in cellular compartments with low internal
pH and can be used to investigate the biosynthesis and pathogenesis of lysosomes
(Dingle et.al. 1988). The LysoTracker® probes of Invitrogen consist of a flurophore
linked to a weak base that is only protonated at neutral pH. This allows LysoTracker®
probes to freely permeate cell membranes enabling them to label live cells.
LysoTracker® probes are highly selective for acidic organelles (Invitrogen a). Their
mechanism of retention has not been firmly established but is likely to involve
protonation and retention in the membranes of the organelles.
III.5.2.1 Cell Organelle Staining of Astrocytes
Fluorescence micrographs of the astrocytes were taken and a 3D caption compiled
(the layer thickness of the total photographs amounts to 17* 400µm.) so as to be
certain that larger accumulations of ferrous fluids or their aggregates had actually
accumulated in the cells and cell organelles. As standard method the fluorescence
pictures were analyzed by fluorescence-intensity using Nis-Elements software
(Nikon). Here the colors red and green were used to improve comparability when
presenting the results in terms of light intensity plots. Due to the decomposition of the
microscope (0.1µm/px on non biological standards) it is not possible to quantify the
lysosomes sizes (uncountable), pursuant to the literature their sizes vary between
0.1µm and 1.2µm (Kuehnel 2003).

IIIIII RReessuullttss
59
Figure 24: Fluorescence analyzes of Astrocytes control –B
1) Multicolor picture including ER-Tracker, LysoTracker and DAPI stained Nucleus.
2) Green channel: Localisation of Endoplasmic Reticulum
2a) Light Intensity surface plot of green channel
3) Red channel: Localisation of Lysosomes
3a) Light Intensity Surface plot of Red channel
1
2
3
2a
3a
Lut`s
Lut`s
Intensity surface plot in Light
Intensity Units (Lut`s):
Legend in Rainbow colours starting
at 10Lut`s= black violet in 15 steps
up to 150Lut`s = red.
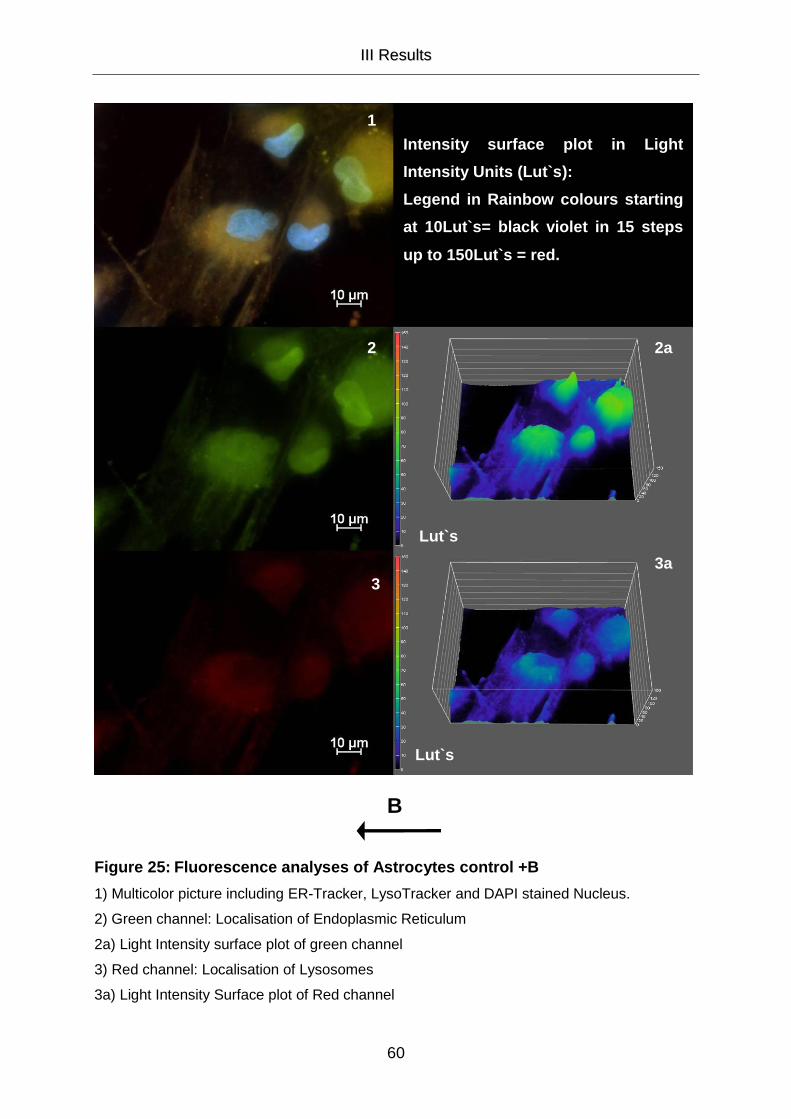
IIIIII RReessuullttss
60
Figure 25: Fluorescence analyses of Astrocytes control +B
1) Multicolor picture including ER-Tracker, LysoTracker and DAPI stained Nucleus.
2) Green channel: Localisation of Endoplasmic Reticulum
2a) Light Intensity surface plot of green channel
3) Red channel: Localisation of Lysosomes
3a) Light Intensity Surface plot of Red channel
Intensity surface plot in Light
Intensity Units (Lut`s):
Legend in Rainbow colours starting
at 10Lut`s= black violet in 15 steps
up to 150Lut`s = red.
Intensity surface plot in Light
Intensity Units (Lut`s):
Legend in Rainbow colours starting
1
Lut`s
Lut`s
3
1
2 2a
3a
B
1
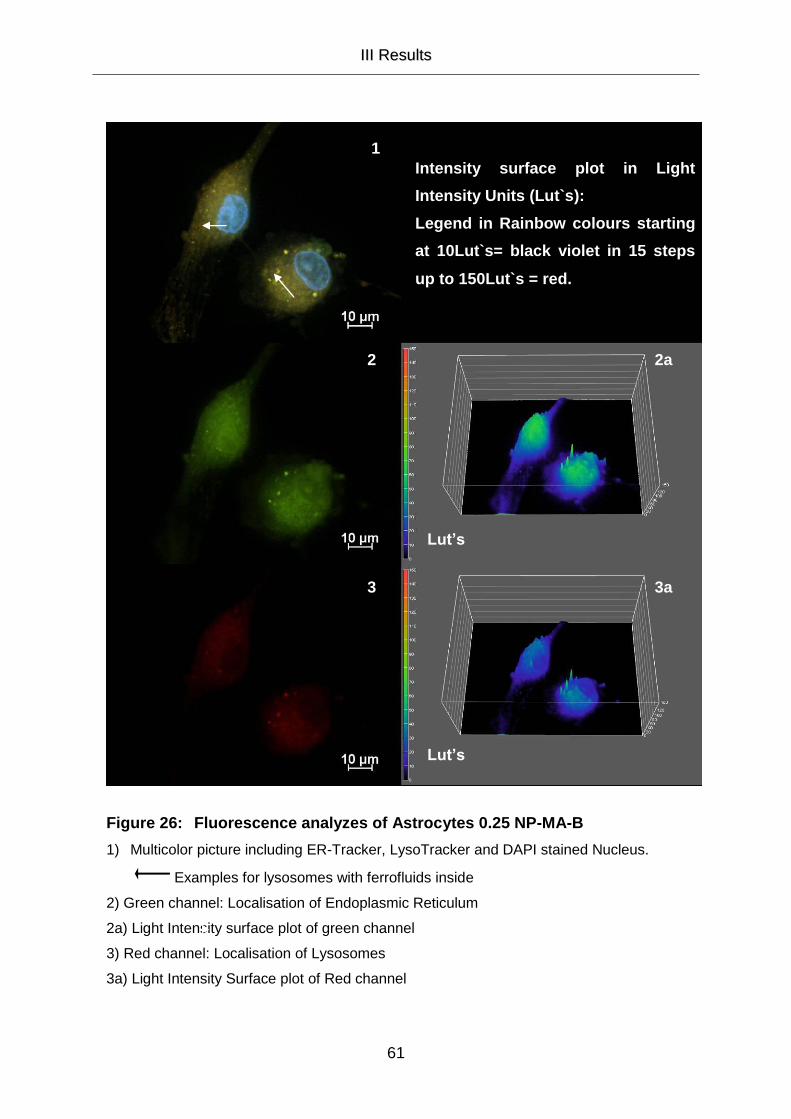
IIIIII RReessuullttss
61
Figure 26: Fluorescence analyzes of Astrocytes 0.25 NP-MA-B
1) Multicolor picture including ER-Tracker, LysoTracker and DAPI stained Nucleus.
Examples for lysosomes with ferrofluids inside
2) Green channel: Localisation of Endoplasmic Reticulum
2a) Light Intensity surface plot of green channel
3) Red channel: Localisation of Lysosomes
3a) Light Intensity Surface plot of Red channel
2 2a
Intensity surface plot in Light
Intensity Units (Lut`s):
Legend in Rainbow colours starting
at 10Lut`s= black violet in 15 steps
up to 150Lut`s = red.
1
2a
3
2
3a
Lut’s
Lut’s

IIIIII RReessuullttss
62
Figure 27: Fluorescence analyzes of Astrocytes 0.25NP-MA+B
1) Multicolor picture including ER-Tracker, LysoTracker and DAPI stained Nucleus.
Examples for lysosomes with ferrofluids inside
2) Green channel: Localisation of Endoplasmic Reticulum
2a) Light Intensity surface plot of green channel
3) Red channel: Localisation of Lysosomes
3a) Light Intensity Surface plot of Red channel
Intensity surface plot in Light
Intensity Units (Lut`s):
Legend in Rainbow colours starting
at 10Lut`s= black violet in 15 steps
up to 150Lut`s = red.
1
Lut`s
Lut`s
2
3
2a
3a
B

IIIIII RReessuullttss
63
Figure 28: Fluorescence analyzes of Astrocytes 0.5NP-MA –B
1) Multicolor picture including ER-Tracker, LysoTracker and DAPI stained Nucleus.
Examples for lysosomes with ferrofluids inside
2) Green channel: Localisation of Endoplasmic Reticulum
2a) Light Intensity surface plot of green channel
3) Red channel: Localisation of Lysosomes
3a) Light Intensity Surface plot of Red channel
Intensity surface plot in Light
Intensity Units (Lut`s):
Legend in Rainbow colours starting
at 10Lut`s= black violet in 15 steps
up to 150Lut`s = red.
1
2
3
2a
3a
Lut`s
Lut`s

IIIIII RReessuullttss
64
Figure 29: Fluorescence analyzes of Astrocytes 0.5NP-MA +B
1) Multicolor picture including ER-Tracker, LysoTracker and DAPI stained Nucleus.
Examples for lysosomes with ferrofluids inside
2) Green channel: Localisation of Endoplasmic Reticulum
2a) Light Intensity surface plot of green channel
3) Red channel: Localisation of Lysosomes
3a) Light Intensity Surface plot of Red channel
Intensity surface plot in Light
Intensity Units (Lut`s):
Legend in Rainbow colours
starting at 10Lut`s= black violet in
15 steps up to 150Lut`s = red.
1
2
3 3a
2a
Lut`s
Lut`s
B
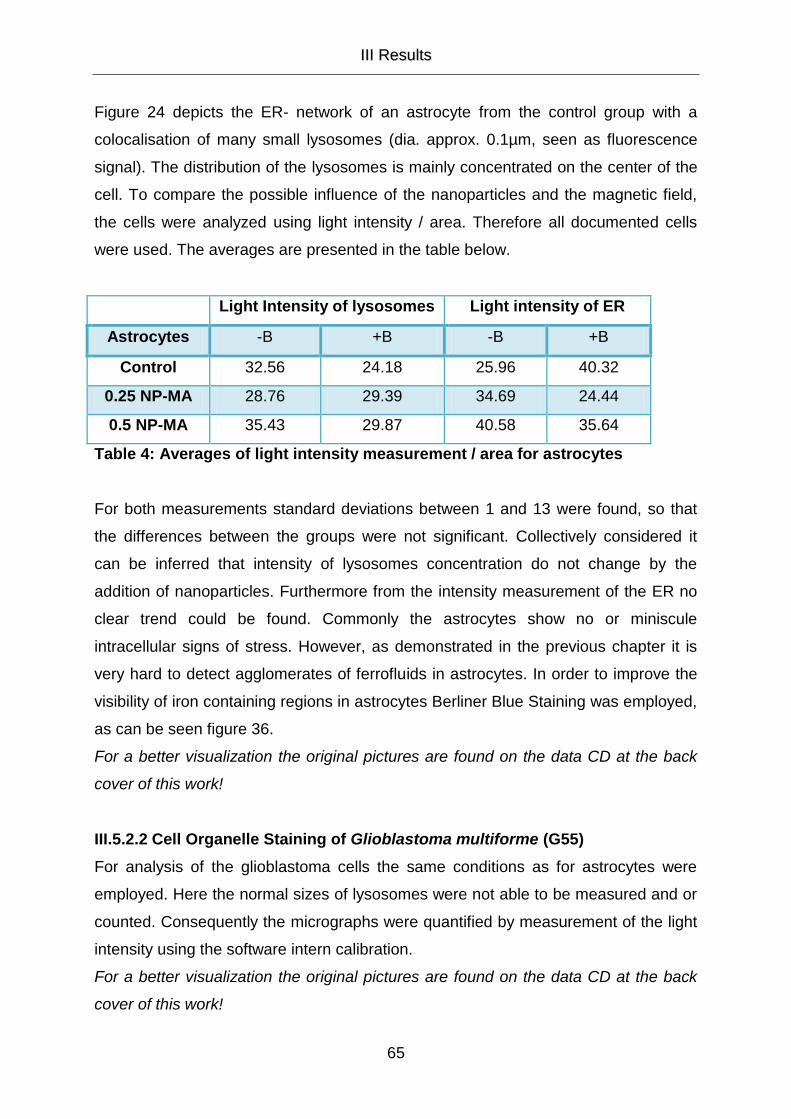
IIIIII RReessuullttss
65
Figure 24 depicts the ER- network of an astrocyte from the control group with a
colocalisation of many small lysosomes (dia. approx. 0.1µm, seen as fluorescence
signal). The distribution of the lysosomes is mainly concentrated on the center of the
cell. To compare the possible influence of the nanoparticles and the magnetic field,
the cells were analyzed using light intensity / area. Therefore all documented cells
were used. The averages are presented in the table below.
Light Intensity of lysosomes Light intensity of ER
Astrocytes -B +B -B +B
Control 32.56 24.18 25.96 40.32
0.25 NP-MA 28.76 29.39 34.69 24.44
0.5 NP-MA 35.43 29.87 40.58 35.64
Table 4: Averages of light intensity measurement / area for astrocytes
For both measurements standard deviations between 1 and 13 were found, so that
the differences between the groups were not significant. Collectively considered it
can be inferred that intensity of lysosomes concentration do not change by the
addition of nanoparticles. Furthermore from the intensity measurement of the ER no
clear trend could be found. Commonly the astrocytes show no or miniscule
intracellular signs of stress. However, as demonstrated in the previous chapter it is
very hard to detect agglomerates of ferrofluids in astrocytes. In order to improve the
visibility of iron containing regions in astrocytes Berliner Blue Staining was employed,
as can be seen figure 36.
For a better visualization the original pictures are found on the data CD at the back
cover of this work!
III.5.2.2 Cell Organelle Staining of Glioblastoma multiforme (G55)
For analysis of the glioblastoma cells the same conditions as for astrocytes were
employed. Here the normal sizes of lysosomes were not able to be measured and or
counted. Consequently the micrographs were quantified by measurement of the light
intensity using the software intern calibration.
For a better visualization the original pictures are found on the data CD at the back
cover of this work!
2 2a

IIIIII RReessuullttss
66
Figure 30: Fluorescence analyzes of G55 control-B
1) Multicolor picture including ER-Tracker, LysoTracker and DAPI stained Nucleus.
2) Green channel: Localisation of Endoplasmic Reticulum
2a) Light Intensity surface plot of green channel
3) Red channel: Localisation of Lysosomes
3a) Light Intensity Surface plot of Red channel
Intensity surface plot in Light
Intensity Units (Lut`s):
Legend in Rainbow colours starting
at 10Lut`s= black violet in 15 steps
up to 150Lut`s = red.
Lut`s
Lut`s
3a 3

IIIIII RReessuullttss
67
Figure 31: Fluorescence analyses of G55 control +B
1) Multicolor picture including ER-Tracker, LysoTracker and DAPI stained Nucleus.
2) Green channel: Localisation of Endoplasmic Reticulum
2a) Light Intensity surface plot of green channel
3) Red channel: Localisation of Lysosomes
3a) Light Intensity Surface plot of Red channel
Intensity surface plot in Light
Intensity Units (Lut`s):
Legend in Rainbow colours starting
at 10Lut`s= black violet in 15 steps
up to 150Lut`s = red.
1
3a 3
2a 2
Lut`s
Lut`s
B
Size bar

IIIIII RReessuullttss
68
Figure 32: Fluorescence analyzes of G55 0.25NP-MA-B
1) Multicolor picture including ER-Tracker, LysoTracker and DAPI stained Nucleus.
Examples for lysosomes with ferrofluids inside
2) Green channel: Localisation of Endoplasmic Reticulum
2a) Light Intensity surface plot of green channel
3) Red channel: Localisation of Lysosomes
3a) Light Intensity Surface plot of Red channel
Intensity surface plot in Light
Intensity Units (Lut`s):
Legend in Rainbow colours starting
at 10Lut`s= black violet in 15 steps
up to 150Lut`s = red.
1
2
2
3 3a
2a
Lut`s
Lut`s

IIIIII RReessuullttss
69
Figure 33: Fluorescence analyzes of G55 0.25 NP-MA +B
1) Multicolor picture including ER-Tracker, LysoTracker and DAPI stained Nucleus.
Examples for lysosomes with ferrofluids inside?
2) Green channel: Localisation of Endoplasmic Reticulum
2a) Light Intensity surface plot of green channel
3) Red channel: Localisation of Lysosomes
3a) Light Intensity Surface plot of Red channel
Intensity surface plot in Light
Intensity Units (Lut`s):
Legend in Rainbow colours starting
at 10Lut`s= black violet in 15 steps
up to 150Lut`s = red.
Lut`s
Lut`s
1
2
3 3a
2a
B

IIIIII RReessuullttss
70
Figure 34: Fluorescence analyzes of G55 0.5NP-MA-B
1) Multicolor picture including ER-Tracker, LysoTracker and DAPI stained Nucleus.
Examples for lysosomes with ferrofluids inside
2) Green channel: Localisation of Endoplasmic Reticulum
2a) Light Intensity surface plot of green channel
3) Red channel: Localisation of Lysosomes
3a) Light Intensity Surface plot of Red channel
Intensity surface plot in Light
Intensity Units (Lut`s):
Legend in Rainbow colours starting
at 10Lut`s= black violet in 15 steps
up to 150Lut`s = red.
Lut`s
Lut`s
1
2
3
2a
3a

IIIIII RReessuullttss
71
Figure 35: Fluorescence analyzes of G55 0.5NP-MA+B
1) Multicolor picture including ER-Tracker, LysoTracker and DAPI stained Nucleus.
Examples for lysosomes with ferrofluids inside
2) Green channel: Localisation of Endoplasmic Reticulum
2a) Light Intensity surface plot of green channel
3) Red channel: Localisation of Lysosomes
3a) Light Intensity Surface plot of Red channel
Intensity surface plot in Light
Intensity Units (Lut`s):
Legend in Rainbow colours starting
at 10Lut`s= black violet in 15 steps
up to 150Lut`s = red.
Lut`s
Lut`s
1
2 2a
3 3a
B

IIIIII RReessuullttss
72
Glioblastoma cells show interesting physical differences compared with control cells
and cells fed with nanoparticles, as well as cells incubated with and without the
influence of a magnetic field. For example cells incubated without influence of the
magnetic field demonstrate a well elongated cell body, whereas cells incubated in the
magnetic field are more spherical in appearance and the endoplasmic reticulum and
the lysosomes are concentrated more towards the center of the cell (figure 31+35).
This is in comparison to control cells figure 30+32 (B-) where the lysosomes show a
very even distribution throughout the cell body. In the case of cells incubated
containing nanoparticles these demonstrate an amplification of the size and
lysosomes intensity dependent on nanoparticles concentration. Results are as
presented in the table below. The standard deviation for each is between 2 and 6
Lut´s.
Light Intensity of lysosomes Light intensity of ER
G55 -B +B -B +B
Control 20.09 25.05 34.38 29.01
0.25 NP-MA 31.89 39.14 39.51 27.96
0.5 NP-MA 30.49 50.25 41.91 18.63
Table 5: Results of intensity measurement / area for G55 cells
Nanoparticles containing cells not exposed to the magnetic field, Figure 32 (0.25NP-
MA) and Figure 34 (0.5NP-MA) demonstrate at equivalent fluorescence strength a
less clear structure and reduction of the ER’s (see table 5), while strong spherical
structures are seen to form in the vicinity of the lysosomes. Within these cells a clear
deposit of opaque ferrous fluids (agglomerates) is observed in the lysosomes. These
results are correlating with the findings in figure 23, where large spherical
agglomerates of nanoparticles could be detected in cells treated with NP-MA.
When observed under the optical light microscope these structures (figure 32+33
(0.25NP-MA) and figure 34+35 (0.5NP-MA)) appear very different.
In Figure 32 (in magnetic field) for example, the majority of lysosomes and the ER
are no longer recognizable as individual cell compartments, rather as a large mass
essentially concentrated at one point within the cell. These agglomerations show a
preference towards the bottom left of the cell in accordance with the magnetic field.

IIIIII RReessuullttss
73
Here most of the cell bodies align their self to the magnetic gradient (figure 32) and
that the nucleus at least is also pulled in this direction.
Ferrous fluids however are difficult to visualize but in general are to be found as
agglomerates in the lysosomes (Levy 2010). In the case of cells with the highest
concentration of nanoparticles and where these cells were incubated in the magnetic
field, Figure 35, they demonstrate a decrease in the ER’s (fluorescence decreases to
18.63 Luts), while simultaneously there is much less demarcation of the cells visible.
Aggregates of ferrous fluids in the lysosomes are also clearly recognizable. As too is
the structure of the cell which is clearly different from all other cells. Furthermore
these cells are injured and maybe dying.
III.5.2.3 Astrocytes versus G55
When comparing Astrocytes and G55, the G55 cells show a larger quantity and
magnification of lysosomes as a result of the incorporated magnetite ferrofluids.
Astrocytes show no or miniscule differentiation of the investigated cell organelles.
However, the changes of the normal cell-structure are much more pronounced in the
glioblastoma cells.
Furthermore, when the results of cells exposed to a magnetic field were compared,
Astrocytes showed no reaction, while G55 appeared more rounded and less
stretched. When focusing on cells containing nanoparticles, here large differences
were observed. G55 demonstrated an interesting reaction after treatment with the
low ferrofluid concentration and application of the magnetic field, this being that most
of the cells gathered in the direction to the magnetic gradient (figure 33). Astrocytes
with the high concentration when exposed to the magnetic field showed no reaction,
while glioblastoma cells looks really stressed and injured.
Looking at the distribution of particles in the cell, large differences could be observed
between astrocytes and glioblastoma multiforme cells.
When employing cell organelle staining in astrocytes it is very difficult to see hot
spots (accumulations) of ferrofluids (figure 26-29) correlating to figure 22, hence a
Berliner blue staining was used for a closer view. The result of astrocytes iron
incorporation reveals a completely different picture (figure 36). The distribution is

IIIIII RReessuullttss
74
decentralized and focused on several small, well-defined areas spread over the
whole cell. Hot spots of iron were found in cells appendages. The area around the
cell nuclei can be seen to be largely free.
Figure 36: Berliner blue
staining of astrocytes
treated with media containing
nano-particles 0.5 µL/mL NP-
MA for 48h.
In the glioblastoma cells, the nanoparticles are concentrated around the nuclei (see
chapter III.1. figure 5, III.6 figure 23 and III.7). In these areas are located the
endoplasmic reticulum with ribosome’s, liposome’s, and the Golgi apparatus. From
the figures 32, 34 and 35 it is clear that large amounts of nanoparticles are
detectable in the lysosomes.
All things considered it is evident that due to the nanoparticles, the astrocytes only
have marginal influence on cell compartmental formation, while the influence of the
magnetic field is difficult to determine. In comparison with the glioblastoma cells
however, a very strong change in internal cell structure can be observed and
differences in organizational structure in the magnetic field are considerable. This is a
plausible reason for the reduced cell proliferation of G55.
The cell migration experiments clearly demonstrate differences in cell behavior.

IIIIII RReessuullttss
75
III.6 Magnetically directed Migration
The previous chapters have shown that no negative effect on astrocytes could be
observed when using nanoparticles in combination with the developed magnetic field.
Glioblastoma cells showed varied forms of reactions after incorporation of the
ferrofluid, especially in combination with the magnetic field. Of interest now is
whether this difference could be observed under conditions of cell migration. To
establish the migration assay the samples were placed one centimeter away from the
highest gradient (magnets left arm; as depicted on figure 16; page 66). This was the
best place for the starting area, because here the highest density of the parallel
magnetic field lines is located, having a relatively good magnetic value of 30mT.
III.6.1 Migration of Astrocytes
Unloaded astrocytes (as control) and cells loaded with magnetic particles (incubated
for 2 days with 0.25 mL/mL or 0.5 mL/mL NP-MA (nanoparticles / medium)), were
tested with and without magnetic field for 24h.
Figure 37: Start and result of
migration for Astrocytes
control cells.
At the beginning of the
experiment the cells are located
in the black circle; the cells have
at this point not reached their fully
adhered form. After 24h the cells
are now fully adhered but no
migration could be observed.
Because the start cells are barely
visible the data are saved as
Power Point Astro- Migration on
the CD at the end of this work!
Control Start+ B - B
Control 24hB

IIIIII RReessuullttss
76
Figure 38:
Start and result of
Astrocytes pre-incubated
with 0.25NP-MA (38a) and
0.5NP-MA (38b)
It was found that the cells
behave like the control cells.
No differences between cells
incubated with or without
exposure magnetic field could
be observed.
In this study natural
independent movement of
cells is classified as 0 since
no points of reference are
present. This is due to the
type of documentation, start
and result are presented as
scan pictures so only the
individual momentary state
was able to capture.
For Astrocytes figure 37+ 38
no differences between
cells incubated for 24h in
the magnetic field or without
magnetic field (both cell
culture incubator 37ºC, 90%
relative humidity). The cells
always show normal
behaves for adhesion and
are fully stretched after 24h.
The cells do not migrate.
0.5NP-MA 24h
0.5NP-MA Start+ B - B
B
0.25NP-MA Start+ B - B
0.25NP-MA 24h
B
38a
38b

IIIIII RReessuullttss
77
III.6.2 Migration of Glioblastoma G55
Unloaded glioblastoma cells (as control) and cells loaded with magnetic particles
(incubated for 2 days with 0.25 mL/mL or 0.5 mL/mL NP-MA (nanoparticles /
medium)), were tested with and without magnetic field for 24h. Comparisons of the
pictures taken at the start and after 24h demonstrate that more cells occupy the
marked regions than were initially present, but also that cells occupy and close the
holes deliberately produced by the tip of a pipette. In this study natural independent
movement of cells is classified as 0 since no points of reference are present.
However, using the current form of visualization (scan-picture made up of 150 single
images) differentiation of small cell movements as described for Glioblastoma cells
(De Hauwer, 1997) were not able to be captured. Cells that were not exposed to an
external magnetic field showed only a minor natural mobility. It could be observe that
cells without nanoparticles (control) move more than loaded cells and mainly to one
side. In contrast, cells loaded with minimal nanoparticle- (0.25 NP-MA, figure 41)
when exposed to the magnetic field moved the most. During exposure to the
magnetic field, heavily loaded cells (0.5 NP-MA, figure 43) however did not and
uncharged cells (control) only moved a little.
Control Start
Control 24h
+ B - B
Mean Co = 6925 µm ± 4000µm
1 2
3 4
Figure 39: Start and result of migration for G55 control cells.
The cells were pre-incubated using nanoparticles free media (control), and then incubated
with and without exposure to the developed magnetic field for 24h.
B

IIIIII RReessuullttss
78
µm
µm
µm
µm
G55 0,25 NP-MA Start
G55 0,25NP-MA 24h
+ B - B5 6
7 8
Figure 40: Start and result of migration for G55 0.25NP-MA cells
The cells were pre-incubated with media supplemented with 0.25µL/mL NP-MA, and then
incubated with and without exposure to the developed magnetic field for 24h.
Figure 41:
Length distribution of
migration
green) measurements to left side
inside the green circle mean=
7913.31 ± 1861µm , n=67, red)
measurements to left side outside
the green circle, mean= 10903.22
± 968,37µm, n=22;
turquoise) measurements to right
side inside the green circle, mean=
7287.58 ± 1312.08µm, n=12, blue)
measurements to right side outside
the green circle, mean= 11879.51
± 1000µm n=5
Mean 0.25NP-MA = 8159µm ± 4000µm
B

IIIIII RReessuullttss
79
Strong divergences in the migration distribution patterns were observable. For control
cells (figure 39), no definite movements were detectable (when placed in the
magnetic field), while 84% of the low-loaded cancer cells shift to the magnetic wall. A
small part is ascribed to any particular direction and a few cell spheres move in an
opposite direction to the gradient. Because cells moving to the left side are stopped
automatically by the end of the chamber wall, whereas cells moving in the opposite
direction are not hindered, a two part analysis is required for better comparison:
The green circle (figure 40) shown at 0.25 NPMA 24h represents the limit of the track
when the cells move unhindered straight forward. The measurement of migration is
divided into two parts: with the magnetic field and against the major gradient (figure
40+41), as well as within and outside of the circle.
The result is that many more cells 84% move to the larger magnetic gradient. In
contrast, 16% move laterally to the chamber and against the major gradients. Some
of the cells are still at the marked starting area. These are not included in the
measurement, since no movement could be measured (with these assay and type of
documentation only measurements over long distance migration is possible).
G55 0,5 NP-MA Start
G55 0,5NP-MA 24h
+ B - B
Figure 42: Results of migration experiment with G55 0,5 NP-MA cells
Start and result of migration for glioblastoma cells G55 pre-incubated with 0.5 NP-MA,
without and with magnetic field.
B

IIIIII RReessuullttss
80
III.7 Biochemical Effects
Following the promising results of magnetically migration it was questioned whether
this was a result of active migration or only magnetic force. For an active migration
the cell must up regulate the nucleation process of actin filaments. This is mediated
by the Arp2/3 complex and regulated by WASP (Wiskott Aldrich Syndrom Protein)
family members (Wu 2004).
N-WASP was here of greatest interest because Rohatgi et.al. (1999) demonstrated
that binding of N-WASP with an active form of Cdc42 enhances the ability of the
protein to activate Arp2/3. So for the first time a signalling pathway for actin
nucleation was identified.
For a magnetically induced active migration of cells it can be expected that the cells
demonstrate an up regulation of active N-WASP (phosphorised form). An inactive
form of the protein however is also present in the cell, and hence the investigated
method must be able to differ between both forms of this protein. The best chance of
observing this was found to be using immunhistochemical staining in combination
with a marker for actin filaments.
Therefore in this experiment, the cell cytoskeletons (actin-based) were stained with
phospho - specific anti N-WASP (a protein involved in actin nucleation) antibody
(second antibody, labeled with Texas red) and phalloidin Alexa 488 (a toxin from the
death cap (Amanita phalloides), it binds F-actin and is labeled with a fluorescent
analog for lightmicroscopy) and the cell nuclei with DAPI.

IIIIII RReessuullttss
81
III.7.1 Immunhistochemical analyzes of Astrocytes
-B +B
Figure 43: Visualisation of Actin and N-WASP in Astrocytes control
1+2) Results of Actin (green) and N-WASP (red) Staining,
Counterstaining of Nucleus with DAPI (blue)
1a+2a) Fluorescence channel of N-WASP in white
1b+2b) Light Intensity Surface plot of N-WASP channel
1
B
Lut`s Lut`s
2
1a 2a
1b 2b

IIIIII RReessuullttss
82
-B +B
Figure 44: Visualisation of Actin and N-WASP in Astrocytes 0.25NP-MA
1+2) Results of Actin (green) and N-WASP (red) Staining,
Counterstaining of Nucleus with DAPI (blue)
1a+2a) Fluorescence channel of N-WASP in white
1b+2b) Light Intensity Surface plot of N-WASP channel
B
Lut`s Lut`s
1 2
1a 2a
1b 2b

IIIIII RReessuullttss
83
-B +B
Figure 45: Visualisation of Actin and N-WASP in Astrocytes 0.5NP-MA
1+2) Results of Actin (green) and N-WASP (red) Staining,
Counterstaining of Nucleus with DAPI (blue)
1a+2a) Fluorescence channel of N-WASP in white
1b+2b) Light Intensity Surface plot of N-WASP channel
Between the different groups of Astrocytes no differences were found for the
expression of N-WASP. The values detected by fluorescence measurement all show
a 10 to maximal 30Lut’s mainly located in the corpse of the cells.
B
Lut`s Lut`s
1 2
1a 2a
1b 2b

IIIIII RReessuullttss
84
III.7.2 Immunhistochemical analyzes of Glioblastoma multiforme G55
-B +B
Figure 46: Visualisation of Actin and N-WASP in G55 control
1+2) Results of Actin (green) and N-WASP (red) Staining,
Counterstaining of Nucleus with DAPI (blue)
1a+2a) Fluorescence channel of N-WASP in white
1b+2b) Light Intensity Surface plot of N-WASP channel
1
1b
1a
2
2a
2b
Lut`s Lut`s
B

IIIIII RReessuullttss
85
-B +B
Figure 47: Visualisation of Actin and N-WASP in G55 0.25NP-MA
1+2) Results of Actin (green) and N-WASP (red) Staining,
Counterstaining of Nucleus with DAPI (blue)
1a+2a) Fluorescence channel of N-WASP in white
1b+2b) Light Intensity Surface plot of N-WASP channel
B
1
1a
1b
2
2a
2b
Lut`s Lut`s

IIIIII RReessuullttss
86
-B +B
Figure 48: Visualisation of Actin and N-WASP in G55 0.5NP-MA
1+2) Results of Actin (green) and N-WASP (red) Staining,
Counterstaining of Nucleus with DAPI (blue)
1a+2a) Fluorescence channel of N-WASP in white
1b+2b) Light Intensity Surface plot of N-WASP channel
B
Lut`s Lut`s
IIIIII RReessuullttss
87
The results of N-WASP studies demonstrate that the cancer cells have a Lut’s value
of 40 around the nucleus, whereas fort the cell boundary this ranges between 10 to
20 Lut’s. Differences between normally incubated cells and those exposed to the
magnetic field cannot be differentiated. Furthermore the cytoskeletons all have a
similar appearance with boundaries lightly frayed and stronger actin fibers with a fine
transverse network orientated towards the cell nucleus (figure 46-48).
An exception to this is found for the cells incubated with a concentration of
0.25µL/mL NP-MA and then exposed to the magnetic field (figure 47). These cells
show a strong increase in the N-WASP content and the entire cell appears red,
corresponding to a Lut’s value of up to 90 in the region of the cell nucleus and
between 50 and 60 Lut’s for the cell boundary. In addition the cells appear
morphologically very different from other types investigated in this study. For
example in the region of the cell boundary the actin fibers are much longer building
filipodia, which gives the cell a strong frayed appearance. Furthermore the boundary
region is not so strongly flattened.
This coincides with observations documented in the migration experiments where
pre-incubated cells having 0.25µL/mL NP-MA (figure 40+ 47) could be observed to
move more actively in the magnetic field as opposed to cells treated with higher
concentrations (figure 42 + 48) hardly moving at all.

IIVV DDiissccuussssiioonn
88
IV Discussion
IV.1 Nanoparticle uptake and Toxicity
When introducing nanoparticles into brain cells it’s particularly important that
nanoparticle uptake within the cells is dependent on particle concentration. This
ensures accuracy of dosage but also good reproducibility of results coming from
experimental investigation. Furthermore, it is essential that the employed
nanoparticles be compatible with cells found within the brain, especially normal
healthy cells required by the brain to function properly. This also applies in terms of
toxicity, with the exception that any negative toxic effects only occur for cancerous
cells, since the ultimate goal is their eradication without harm to these normal cells.
With regard to the criterion of nanoparticle uptake in cancer cells, having to be
dependent on both tested particle concentration, this was only achieved for NP-MA.
NP-LA demonstrated far too inconsistent admission under the investigated
experimental conditions. Were it the goal however to restrict particle uptake into the
astrocytes, since this constitutes reduced levels of stress placed on the cell; this
criterion could be fulfilled employing NP-LA. To this end it would be worthwhile
developing nanoparticles with shell material out of a mixture of NP-MA and NP-LA.
The mix-coat particles should then ideally demonstrate concentration dependent
uptake into the cells just as was the case for NP-MA, but with a much reduced
uptake in the astrocytes (see results for NP-LA). Ideal shell-mixture ratios of NP-MA
and NP-LA are however to be determined, including possible side effects (e.g.
toxicity) to the cells.
A material’s toxicity has repercussions in the development of any therapeutic
application wishing to make use of this material. As such astrocytes (control group)
were also tested in this study. Astrocytes constitute 20-50% of brain cells and play a
central role in iron metabolism within the brain (refer Introduction).
The results of proliferation experiments demonstrate clear differences in the growth
behavior between astrocytes and cancer cells, due to the presence of magnetic
nano-particles. Whereas astrocytes exhibit no change in growth behavior,

IIVV DDiissccuussssiioonn
89
glioblastoma cell lines (G55, G112, G122) demonstrate a statistically significant
reduction in cell number after two days of incubation, and when compared with the
control cells.
This result has been confirmed via Live-Dead Staining. Here the number of
astrocytes and G55 correlates well with the results of proliferation experiments. The
astrocytes demonstrate no toxicity in relation to the nanoparticles and exhibit a
normal stretched cell structure, where as glioblastoma cells demonstrate a strong
reduction in the number of living cells. This result for astrocytes and G55 is very
much unexpected and in contrast to what was observed during the daily work with
astrocytes. Here they react very sensitively to any changes of medium. While
glioblastoma like G55 are known to be resistant to chemotherapy (see chapter I.3.5
page 7) and other such therapies, these demonstrated hindered growth in the
presence of ferrofluids.
So what happens to the nanoparticles in different cells?
Levy et.al (2010) postulated that the magnetic and crystallographic properties of iron
oxide particles are conserved throughout degradation, while the concentration of
soluble iron species decreases. The group headed by Prof. Weller (2011)
demonstrated that iron oxide nanoparticles like magnetite are degraded to iron ions;
this reaction is cell type specific and time dependent. The mechanism and involved
proteins are still unknown. This means that the cells have to deal with iron overload
and this can lead to oxidative stress (Nel 2006, Naqvi 2010). A second possibility is
that due to the large amounts of nanoparticles in the cells, some cell organelles may
be blocked by strong accumulations of the magnetite particles (Levy 2010).
Key elements here are the lysosomes with their acidic PH value. These act as
detoxification centers for metallic compounds, as well as waste regulators within the
cell. Cases of lysosomal disorders are known as Lysosomal Storage Diseases
(LSDs), here the accumulation of macromolecules leads to the dysfunction of these
cell organelles (Seregin 2011). McLeland (2011) postulate that nanoparticles may
cause lysosomal pathologies, since they are likely to accumulate in lysosomes.
Micrographs have shown that it was possible to visualize plentiful circular opaque
structures (agglomerates of nanoparticles) in cells treated with nanoparticles.

IIVV DDiissccuussssiioonn
90
Interestingly in astrocytes only few agglomerates were found, whereas in
glioblastoma cells high concentrations could be observed. Additionally the sizes of
these agglomerates were often up to 2 micrometers and placed in the vicinity of the
nuclei. Here the structure and distribution in the cells were cell organelle like.
So where are the nanoparticles localized?
It was important to determine which structural changes and associated reactions
resulted as a consequence of introducing a foreign material (nanoparticles) into the
cell.
IV.2 Cell-organelle Staining and Localisation of Ferrofluids in Cells
Several studies have shown that metallic nanoparticles always accumulate in the
lysosomes (Levy 2010, Tan 2010, Islam 2009), whereas they are rarely found in the
endoplasmic reticulum (Singh 2010).
The results of cell organelle staining clearly show a nanoparticle concentration-
dependent increase of lysosomes size and intensity for G55 cells.
Astrocytes on the other hand demonstrate significantly less reaction compared to
cancer cells. This can be contributed to, on the one hand by the smaller number of
nanoparticles / cytoplasm volume, but on the other hand these don’t demonstrate any
change in the magnetic field, although the total iron content per cell is higher than for
G55.
In comparison the cancer cell line G55 exhibit serious differences in cell structure.
This speaks volumes for the fact that the cells deal differently with an introduction of
biological materials (both type and dosage).
Studies by (Behrendt 2009) demonstrate that the make-up of shell material (oleic
acid) used for nanoparticles can influence their accumulation in the lysosomes. It is
conceivable that this has also been the case in this study, since particle coating
material consisted of myristic acid (C14H28O2), which only differs from oleic acid

IIVV DDiissccuussssiioonn
91
(C18H34O2) in terms of length of the carbon chain. This pre-supposes however that
the nanoparticle shells are themselves not affected during transport into the
lysosomes, a point, which to date has not been clarified. Another possibility is that
the organic shell components are degraded before the nanoparticles are included
into the lysosomes. Many different nanoparticles (for example: magnetite, silver;
Konczol 2011, Greulich 2010) are found in lysosomes. The figure below shows the
intracellular transport paths.
Plasmamembrane
LysosomeLate
endosome
early
endosome
Endoplasmic
reticulum
Nucleus
membrane
Golgi
apparatus
Secretoric
vesicles
Cisterne
Figure 49: Vesicle transport in cells
Shown are the transport ways of endocytosis (green), exocytose (red) and re-transport
between the different cell compartments (blue). All cell compartments communicate with one
other and with the extracellular periphery. The biosynthetic – secretoric way (red arrows)
transport protein molecules from the ER to the plasma membrane by (passing late
endosomes) to the lysosomes. For the endocytose pathway molecules are incorporated in
vesicles and then transported to early endosomes (passing the late endosomes), which then
end in the lysosomes. The blue arrows indicate that many endocytic molecules are re-
transported from the early endosomes to the plasma membrane. Similarly some molecules

IIVV DDiissccuussssiioonn
92
are back transported from endosomes and Golgi apparatus to Golgi apparatus or ER.
(Picture and text adapted from Alberts 2011.)
For G55, a strong reduction in cell numbers (proliferation data) would imply an
increase in the number of dead cells. This however was demonstrated not to be the
case. The most likely cause here is being disruption of intracellular mechanisms
within the cell. A possible explanation is that large quantities of nanoparticles within
the cells and the lysosomes result in active blocking of certain cell organelle
functions, without killing the cells. Hence this may explain why so few dead cells
were observed. Parts of the cells die, and due to large amounts of iron accumulation
in the lysosomes, both cell metabolism (like autophagy pathway, McLeland 2011)
proliferation is massively inhibited. As observed, the ER in nanoparticle containing
cancer cells shows a modified structure similar to the lysosomes. Such results imply
that part of the ferrofluids is transported into the ER, and may be mediated by the
myristic acid shell. Secondly the possibility exist that a re-transport to the lysosomes
takes place.
Blocking of the lysosomes and ER via large quantities of nanoparticles is likely to
cause a restructuring of the cell, which obstructs cell division and hence inhibits cell
growth (like for the different forms of Lysosomal Storage Diseases). Bear in mind that
iron oxide particles induce oxidative stress (Nel 2006, Naqvi 2010) leading to cell
injury and death (Naqvi 2010), which can explain the found toxicity of NP-MA for
glioblastoma cells.
G55 exhibits clear deposition of opaque magnetite in the lysosomes (see chapter
III.5.2.2. page 65-71). The deposit locations correspond with the results produced via
BBS (III.1.1. page 34), the exception being localization for G55 0.25NP-MA after
exposure to the magnetic field. In this instance nanoparticles are barely visible.
The displacement of lysosomes leads one to suspect however that these contain an
even larger accumulation of nanoparticles, since they align themselves with the
magnetic field gradient. However, visual evidence of this localization is difficult to
determine and BBS is unable to help any further. This is due to the complexity of the
colouring which forms, and hence no exact picture of particle location is possible,
because during staining the magnetite is dissolved by the hydrochloric acid (Weller
2011).

IIVV DDiissccuussssiioonn
93
In the case of the astrocytes, even with their high concentration of ferrous fluids, it
was difficult to gauge because single particles were too small to detect employing
optical light microscopy. The difficulty here was that only well lit up regions throw
shadows making boundary regions indiscernible (when the fluorescence of the
nucleus stained with DAPI was used). Hence Berlin-Blue staining was employed to
try to overcome this problem. Via this technique it was possible to visualize for the
case of the astrocytes a decentralized distribution of iron within the cell. However,
this only partially corresponded to the localization within the lysosomes (or ER) (see
chapter III.5.2 page 58). These differences in comparison to the iron content of the
cells led to the thought that astrocytes were able to degrade the nanoparticles in
lysosomes by combined effect of acidic pH, lysosomal hydrolases and eventually iron
chelators involved in iron regulation (Levy 2010). Stormer (2008) assumed that
astrocytes play a role in the magnetite based memory in the brain, implying that they
have the necessary equipment for destruction of such crystals. Levy (2010)
described that the kinetics of iron oxide dissolution strongly depends on the
nanoparticles surface coating. Organic materials like myristic acid (shell component
of NP-MA) as natural element within cells represents therefore no obstruction for
destruction. The dissolution of the ferrofluids would also explain why it is so difficult to
visualize them, even though the measurable iron content is high. However, if one
regards the fact that actrocytes play a key role in the metabolism of iron within the
brain (see I.2), then it can be assumed that this also help to protect the cell from
oxidation damage, particularly when confronted with too much iron.
Astrocytes are known, to be able to store large amounts of iron in Ferritin, converted
to a less oxidative and non-toxic form (Dringen 2007). This would explain why
astrocytes do not respond to the magnetic field, within the dissolution of the
nanoparticles, since they loose their magnetic behavior (Weller 2011).
Microscopic analyses like TEM (transmission electron microscopy) or similar would
likely be more useful in a more exact analysis of particle localization, since this
methodology has a far higher local resolution. Hence future work on this theme is
necessary in order to be able to define what is actually occurring inside of the cells.
The result obtained for migration experiments conducted on 0.25NP-MA cells
indicate that direction orientated migration of cancer cells is possible. Results already
IIVV DDiissccuussssiioonn
94
show an adjustment of the lysosomes in the direction of the magnetic field, while
cells also demonstrate good vitality. In the case of G55 0.5NP-MA cells however, this
is not to be expected (only those cells with minor iron content) because of their
strongly changing and severely stressed cell structure.
IV.3 Magnetically Activated Migration and Immuno-histochemical
Analyses
The methodology developed in context to this work has successfully demonstrated
that it is possible to activate glioblastoma cells to purposefully migrate under the
influence of a magnetic field. Furthermore, this methodology promises a new therapy
for the treatment of aggressive brain cancer (glioblastoma in its associated forms).
Important to note here is that cells, which constitute healthy brain tissue, are not able
to migrate.
The horizontal form of the magnetic field and the resulting methodology were chosen
to study the directional migration of cells independent of the gravity. With this method
it is as well possible to visualise the influence of the magnetic field, in terms of the
migration behaviour of the cells, making it possible to modify parts (e.g. magnetic
shoes) of the magnet for better adjustment. Hence the developed method is well
suited to the visualisation and quality of migration (direction, length) of cells. A
negative point however is that the quantity analysis is very difficult to conduct. Here
cells always build small spheres so that it is almost impossible to say how many cells
are exactly there. Video tracking normally used for migration analyses (e.g. Nikon)
does not overcome this problem. This method only allows for the tracking of single
cells over a relative short period, because the permanent cell division of the cancer
cells is not traceable using this software (Nikon, Zeiss 2009).
Therefore future work is required to quantify a second parallel method, consisting of
a vertical test system based on Inserts, with 3 micrometer sized holes in the
membrane, located in a well plate. The whole experiment looks than like a sandwich.
On the membrane pre-incubated cells are added in the space below. Here a medium
is added between well and membrane.

IIVV DDiissccuussssiioonn
95
Below the well plate a plate with fixed ferro-neodymium magnets reveals as
attractant Cells reacting to the magnetic field and pass the membrane by active
migration where they are collected by the well below. Consequently it is possible to
analyse the number of cells by cell counting or colorimetric assays. Such a test
system was developed in this work, but not finished.
If one accepts the migratory behavior of the control cells as natural behavior, no
preferential migratory direction is recognizable and cell movement is coincidental.
Furthermore, for control groups of both cell types no obvious movement within the
samples is recognizable.
With regard to the astrocytes, these exhibited no reaction to the magnetic field in the
migration assay. This corresponds with the other experimental trials, for example
toxicity, cell-organelle staining and immune coloring by application of Actin-phalloidin
and N-WASP (see chapter III.7. page 84-86).
The reasons for this are postulated as follows:
1. The nanoparticle / cell-volume relationship is much smaller for astrocytes and
as such magnetization is considerably reduced.
2. Localization of the nanoparticles is decisive for the attraction, transmission and
activation of cell migration. This is differently weighted with regard the
astrocytes.
3. Nanoparticles taken up in the iron specializing astrocytes no longer exist in their
original form, as discussed in the previous chapter.
Clearly evident from the results of migration experiments for nanoparticle loaded G55
cells (0.25 NP-MA), is that these cells demonstrate distinctly more movement than
unloaded cells, when each are placed in the magnetic field. In fact the majority of
nanoparticle loaded cells orientates and distribute themselves in the direction of the
gradient of the magnetic field (see chapter III.6. page 77). For samples G55 0.5 NP-
MA, as examined with and without influence of the magnetic field, it is clear, and
based on the definition for migration (given above) that these do not migrate (refer
III.6 page 79). This confers with what was expected from the results of toxicity and

IIVV DDiissccuussssiioonn
96
cell-organelle staining analyses (Chapter III.6. and III.8). Here the cells show stress
reactions and appear injured (Naqvi 2010) after exposition to a magnetic field.
To be sure that the observed migration occurs through active movement of the cell
and not as a result of magnetic attraction, histochemical analysis via Actin-Phalloidin
and N-Wasp was introduced to the study. The protein N-WASP (activated by Cdc42,
see I.6 page 11) is only marked by the used antibody in its phosphorous activated
form. Under conditions of strong activation N-WASP starts Actin-polymerization and
bundling in the cell, which is mediated by the activiation of the GTPase Cdc42
(Alberts 2011). Hall (1998) demonstrated that when microinjecting Cdc42 into cells
this leads to the formation of many long Filopodia. The resulting phenotype of these
cells (shown in chapter I) is very similar to the findings of G55 0.25NP-MA cells
(incubated for 24h in a magnetic field). These results confirm that the magnetic field
induces active cell migration of these G55 cells. Furthermore, this is complemented
by the findings coming from cell-organelle staining and migration (see III.7 page 80
and III.6 page 75). Common for all investigating experiments is that the investigated
cancer cells demonstrate an orientation in the direction of the magnetic gradient.
Additionally, it was found that the cells are more contractile than control cells. Fritsch
et al. (2010) reported that the contraction of cancer cells can pre-strain and thus
stiffen the cytoskeletons, reducing a cells ability to form adhesive contacts with other
cells. Moreover, contractile tumor cells migrate significantly better through the
extracellular matrix; this could play a key role in metastasis.
How is it then possible that the cells are activated?
In reference to the results what’s most conspicuous is the fact that G55 0,25NP-MA
entails a misalignment of the lysosomes towards the magnetic gradient when placed
in a magnetic field. This demonstrates that the lysosomes are somehow involved in
the process. But what is the link between small cell organelles and directed migration
processed by active actin-nucleation?
Components of the cytoskeleton are the microtubules, hollow cylinders with a
diameter of 25 nm, which consist of the protein Tubulin and intracellular engine
proteins Dynein and Kinesin. They are responsible for movement and longer
transport pathways, e.g. responsible for intracellular transport of organelles in the
cytosol (Alberts 2011). Moeller et al. (2000) analyzed the motion of phagosomes and

IIVV DDiissccuussssiioonn
97
their connection to cytoskeletal filaments in human cells via incorporation of
micrometers sized magnetite particles. Here they employed an external magnetic
field to induce a twisting of the magnetic phagosomes; they found that elastically
stored energy does not force the phagosome back to their initial orientation.
Especially for longer twisting durations (over 1min) they measured that the fraction of
recoverable strain decreases and disappears, which originates from a dissipation of
the elastic energy due to the stochastic phagosome motion and cytoskeletal
rearrangements. Marugg (2010) used similar cytomagnetometric experiments to
demonstrate that actin filaments contribute to the movements of lysosomes. This
indicates that it is possible to transfer via magnetic attracted lysosomes shear stress
and strain to the actin skeleton. Like the findings of Moeller (2000) it is theoretically
possible that the cells react with an active rearrangement of the actin. This explains
why the cells are directed toward the gradient, i.e. by the permanent strain the
activity of process involved proteins being up regulated and demonstrated by the
results of this work.
Cancer cells with the appropriate loading of nanoparticles migrate actively in the
magnetic field, since they feel the effect of the field.
The nanoparticles employed in this work have super paramagnetic characteristics.
They demonstrate that they can be magnetized very strongly in an external magnetic
field with no residual magnetism once the field is removed. If larger quantities of
nanoparticles accumulate in a cell, it is likely that this obstructs and or brakes natural
motion of the cell due to an increase of oxidative stress induced via iron oxide
particles.
If one exposes cells loaded with ferrous nanoparticles to a magnetic field, the
nanoparticles experience magnetization. Here the cells are draw under the influence
of the magnetic field on the particles in the lysosomes so that they align themselves
in the direction of the magnetic gradient.
As a consequence cells aligned in the direction of the magnetic field are stimulated to
activate the GTPase Cdc42 (see chapter I.7. figure 3) resulting in cell polarization
(Tzima 2003) and Actin nucleation (high N-WASP activity; refer Actin N-WASP
coloring, chapter III.8. figure 44). Through influence of the magnetic field on the
nanoparticles, the otherwise random movement of the cells is translated into an
active and visible migration of the cells towards the magnet.
IIVV DDiissccuussssiioonn
98
A small portion of the cells (G55 Control and 0.25 NP-MA; figure 40, page 78)
migrate in the opposite direction. At the moment there exists no explanation for this
phenomenon.
By further improving the magnetic field it should be possible to move cells more
strongly to one point or in one direction. The prototype developed in this study has
served for the development of a methodology where actual parameters were initially
unknown.
The developed methodology presents a promising therapeutic way of treating of
Glioblastoma multiforme, whereby the invasive migratory cancer cells, which cannot
be operatively removed from the brain, are redirected to a more accessible location
for treatment and or removal.
To prove the hypothesis, that magnetically induced lysosomal shear stress leads to
activation of actin nucleation in glioblastoma cells, further investigations should
however be undertaken.
One possibility is to create transgenic cancer cell lines which express a fusion-protein
of actin and clip tag (BioLabs). The fusion-protein alone is non fluorescent; this can
be achieved by adding special substrates (different colors) to the living cells. By
covalent binding of one substrate to the protein this then become fluorescent. If used
for live cell imaging together with the Lyso-tracker, this should then allow for the
visualization of actin nucleation, since the color of the actin fusion-protein can be
exchanged during experimention. Similar investigations can clarify the involvement of
other proteins e.g. Cdc42 in this process.

VV SSuummmmaarryy
99
V Summary
Magnetically induced directed Cell Migration as a new Approach for Therapy of Glioblastoma multiforme
The predominating problem investigated in this doctoral thesis has been the development of a therapy for dealing with Glioblastoma multiforme (malignant brain tumors of the type class 4). Despite all efforts including surgical removal of the main tumor, chemotherapy and irradiation, the chance of survival after 6 months still lies under 2% (Van Meir et al. 2010). This can be attributed to an inability of such therapies to completely eliminate invasive and migratory cancerous cells from in and around the near vicinity of the tumors. Fundamental to this work has been the idea of employing the so called negative aspects of Glioblastoma behaviour, namely their ability to migrate and use this for positive therapeutic application against brain cancer. Here magnetically activated and biocompatible nanoparticles were transferred into the cells. Thereafter the cells were placed in a magnetic field where it was possible to induce actively migration of these cells in the direction of the magnetic field. For this to occur it was first necessary to investigate and establish parameters (inclusive here is cell culture) and necessary conditions for the magnetic field, whose flow had to be concentrated on the cell level. The findings have led to a patent being filed (Mucha 2009) for future therapeutic application in removing Glioblastoma cells from the brain. The thesis discusses findings with regard to the uptake of nano-particles in the cells and their compatibility concerning Glioblastoma cells and primary human astrocytes (as control group for healthy cells) under in vitro conditions, with and without influence of the magnetic field. The results demonstrate that the employed ferrous fluids are taken up concentration-dependent by the cells and are very compatible for use with astrocytes (Avdeev, Mucha et al. 2010), whereby it was also observed that several Glioblastoma cell-lines had a significant reduction in cell growth. Microscopic analyses of the cell-organelle structure demonstrated a concentration-dependent increase and enlargement of the lysosomes, which are substantially more pronounced with the Glioblastoma cell, and further correlated with the reduction in cell growth. Analyses after 24h exposure time to the magnetic field led nanoparticle rich glioblastoma cells to polarize with adjustment of the lysosomes to magnetic gradients, whereas astrocytes did not show a reaction to the magnetic field. Thus the goal of the study (purposeful migration of Glioblastoma cells) has been achieved and continuously improved throughout the course of this work. Immunhistochemical analyses of components of the cytoskeleton and their structure involved protein N-WASP confirmed that an active migration of the cells takes place. Here nanoparticle containing cancer cells (0.25NP-MA) demonstrate not only a strong polarization in the direction of the magnetic field but also show very strong activity of N-WASP and the building of many Filopodia necessary for cell migration. This active migration is caused by the stress induced by these nanoparticles within the cells and is steered in all probability via the Cdc42 signal path. Astrocytes however do not show a reaction to the magnetic field. The results clearly demonstrate that magnetically induced purposeful cell migration and its conversion as therapy for use in living patients is indeed promising, since the penetration depth of the invasive cells amounts to on average 1-3 cm around a main tumor and an active migration of cancer cells is needed a fundamental requirement for their extraction.

VV SSuummmmaarryy
100
Magnetisch induzierte zielgerichtete Zellmigration als neuer Ansatz für die Therapie von Glioblastoma multiforme
Diesem Thema lag die vorherrschende Problematik bei der Therapie von Glioblastoma multiforme (maligner Hirntumor Grad IV) zugrunde, dass trotz maximalem Standard-Therapieeinsatzes bestehend aus chirurgischer Entfernung des Haupttumors, Chemotherapie und Bestrahlung nur eine geringe Verbesserung der Überlebenschance von unter 2% nach 6 Monaten erzielt werden kann (Van Meir et al. 2010). Das Hauptproblem hierbei sind invasive infiltrierende Tumorzellen, die bei den oben genannten Therapieansätzen nicht erfaßt und entfernt werden können, da sie bereits ins umliegende Gewebe eingewandert sind. Grundidee dieser Arbeit war es diese negative Eigenschaft der Glioblastomazellen auszunutzen, um diese zu positivem Zweck für die Therapie dieses Gehirnkrebses umzuwandeln. Hierfür wurden biokompatible magnetische Nanopartikel verwendet, die in die Zellen eingeschleust wurden. Nach Aufnahme der magnetischen Nanopartikel wurden die nun magnetisierbaren Zellen in einem externen Magnetfeld zur zielgerichteten Migration angeregt, um bei einer künftigen Anwendung am Patienten die Glioblastoma Zellen aus dem gesunden Gewebe zu separieren (Mucha 2009). Sämtliche hierfür nötigen Parameter und die benötigte Beschaffenheit des Magnetfeldes mussten zu diesem Zweck etabliert werden. Ein permanentes Magnetfeld wurde entwickelt, dessen Magnetfluss auf die Zellebene konzentriert ist. Die Aufnahme der Nanopartikel in die Zellen und deren Verträglichkeit, wurde an Glioblastomzellen und primären humanen Astrocyten (als Kontrollgruppe für gesundes Gewebe) unter in vitro Bedingungen mit und ohne Magnetfeld getestet. Die Ergebnisse zeigten, dass die verwendeten Ferrofluide von den Zellen konzentrationsabhängig aufgenommen werden und sehr gut verträglich für die Astrocyten sind (Avdeev, Mucha et al. 2010) während bei mehreren Glioblastom-Zelllinien eine signifikante Reduktion des Zellwachstums beobachtet werden konnte. Mikroskopische Analysen der Zellorganell-Struktur demonstrierten eine konzentrationsabhängige Zunahme und Vergrößerung der Lysosomen, die bei den Glioblastomazellen wesentlich ausgeprägter ist und mit der Reduktion des Zellwachstums korrelierte. Analysen nach 24h Expositionszeit im Magnetfeld führten bei nanopartikelhaltigen Glioblastomazellen zu Polarisierung der Zellen mit Ausrichtung der Lysosomen zum magnetischen Gradienten, während Astrocyten keine Reaktion auf das Magnetfeld zeigten. Mit Glioblastomazellen konnte das angestrebte Ziel einer zielgerichteten Migration erreicht und im Laufe der Arbeit stetig verbessert werden. Immunhistochemische Analysen von Komponenten des Zytoskeletts und an deren Aufbau beteiligtem Protein N-WASP bestätigten, dass es sich hierbei um eine aktive Migration der Zellen handelt. Nanopartikelhaltige Krebszellen weisen im Magnetfeld nicht nur eine Starke Polarisierung zum Gradienten auf sondern zeigen eine sehr starke Aktivität von N-WASP und die Ausbildung vieler Filopodien. Diese aktive Migration wird durch die in den Zellen enthaltenen Nanopartikel Zugstress abhängig induziert und möglicherweise über den Cdc42 Signalweg gesteuert. Astrocyten hingegen zeigen keine Reaktion auf das Magnetfeld. Die Ergebnisse zeigen das die magnetisch induzierte zielgerichtete Zellmigration für die Umsetzung als Therapie im Patienten sehr hoffnungsvoll ist, da die Eindringtiefe der invasiven Zellen durchschnittlich 2-3 cm um den Haupttumor beträgt und eine aktive Migration der Krebszellen für deren Separation benötigt wird.

VVII RReeffeerreenncceess
101
VI References
Alberts Bray, Hopkin J, Lewis R, Roberts W (2011): Molekulare Zellbiologie, Wiley
VCH, chapter 13+16
Alexiou C; Jurgons R, Seliger C, Iro H (2006): Medical Applications of Magnetic
Nanoparticles. J. of Nanoscience and Nanotechnology Vol. 6: 2762-2768
Avdeev M, Mucha B, Lamszus K, Vekas L, Garamus V, Feoktystov A, Marinica O,
Turcu R, Willumeit R (2010): Structure and in Vitro Biological Testing of Water-Based
Ferrofluids Stabilized by Monocarboxylic Acids; Langmuir 2010, 26(11):8503-8509
Babincova M, Babinec P. (2009): Magnetic drug delivery and targeting: principles
and applications. Biomed Pap Med Fac Univ Palacky Olomouc Czech Repub.
153(4):243-50
Banaclocha MAM, Bókkon I, Banaclocha HM (2009): Long-term memory in brain
magnetite Med Hypotheses. 74(2):254-7. Epub 2009 Oct 7.
Bao et al. (2006): Glioma stem cells promote radioresistance by preferential
activation of the DNA damage response. Nature 444: 756- 760
Bazylinski DA (1999): Synthesis of the bacterial magnetosome: the making of a
magnetic personality. Int. Microbiol. 2: 71-80
Beason R and Semm P (1996): Does the avian ophthalmic nerve carry magnetic
navigational information? J Exp Biol 199:1241-1244
Benarroch EE (2005): Neuron-astrocyte interactions: partnership for normal function
and disease in the central nervous system. Mayo Clin Proc 80: 1326-1338
Behrendt M, Sandros MG, McKinney RA, McDonald K, Przybytkowski E, Tabrizian M
and Maysinger D: Imaging and organelle distribution of fluorescent InGaP/ZnS
nanoparticles in glial cells; Nanomedicine (2009) 4 (7),747-761

VVII RReeffeerreenncceess
102
Bica D, Vekas L, Avdeev MV, Marinica O, Socoliuc V, Balasoiu M, Garamus VM
(2007): Sterically stabilized water based magnetic fluids: synthesis, structure and
properties; Journal of Magnetism and Magnetic Materials 311 17-21.
Black, P. Mc L. (1991) Brain Tumours (second part)
The new England journal of medicine 324, 1555-1564;
Blakemore RP, Frankel RB, and Kalmijn AJ, (1980): South-seeking magneto-tactic
bacteria in the southern hemisphere, Nature, 236, 384-385,
Brem H, Piantodosi S, Burger PC, et al. (1995): Placebo controlled trial of safety and
efficacy of intra operative controlled delivery by biodegradable polymers of
chemotherapy for recurrent gliomas.
The Polymer brain Tumor Treatment Group. Lancet 345:1008-1012
Cavenee WK et al. (2000): Glioblastoma In: WHO Classification of Tumours. Lyon
IARC Press
Clarke et al. (2006): Cancer stem cells-perspectives on current status and future
directions: AACR workshop on cancer stem cells. Cancer Res. 66: 9339-9344
Coulondre C, Miller JH (1977): Genetic studies of the lac repressor.
Nucleic Acid residues, J.Mol. Biol. 117 525-567
Davila AF, Winklhofer M, Shcherbakov V, Petersen N (2005): Magnetic pulse affects
a putative magnetoreceptor mechanism. Biophys J, 89(1), 56-63
Demuth T and Berens ME (2004): Molecular mechanism of glioma cell migration and
invasion. J Neuro Onc 70: 217-228
Demuth T, Rennert JL, Hoelzinger DB et al.(2008):
Glioma cells on the run - the migratory transciptome of 10 human glioma cell lines.
BMC Genomics 2008, 9:54doi:10.1186/1471-2164-9-54
VVII RReeffeerreenncceess
103
Dent EW & Gertler FB (2003): Cytoskeletal dynamics and transport in growth cone
motility and axon guidance. Neuron 40, 209-207
Dingle JT et al., (1988): Lysosomes in Biology and Pathology, Eds., North Holland
Publications Co. (1969), Cell 52, 329
Dobson J and Grassi P (1996): Magnetic Properties of Human Hippocampal Tissue -
Evaluation of Artefact and Contamination Sources. Brain Res. Bull., vol. 39: 255-259.
Dringen R, Hirrlinger J (2003): Gluthatione pathways in the brain.
Biol Chem 384:505-516
Dringen R, Liddell JR, Knorpp T et al. (2006): Detoxification of hydrogen peroxide by
astrocytes. In : Häussinger D, Kircheis G, Scliess F (eds) Hepathic Encephalopathy
and Nitrogen Metabolism, Springer, Dordrecht, The Netherlands, pp 50-59
Dringen R, Bishop GM, Koeppe M, Dang T and Robinson SR (2007):
The pivotal role of astrocytes in the metabolism of iron in the brain.
Neurochem. Res. 32, 1884-1890.
Fritsch A, Höckel M, Kiessling T, Nnetu KD,Wetzel F, Zink M and Käs JA (2010):
Are biomechanical changes necessary for tumor Progression?
NATURE PHYSICS Vol 6 October 2010
Feoktystov AV, Avdeev MV, Aksenov VL, Petrenko VI, Bulavin LA, Bica D, Vekas L,
Garamus VM, Willumeit R (2009): Contrast Variation in Small-Angle Neutron
Scattering from Magnetic Fluids Stabilized by Different Mono-Carboxylic Acids. Solid
State Phenomena, 152-153 (2009) 186-189.
Frankel RB, Bazylinski DA, Johnson MS, BL Taylor (1997): Magneto-Aerotaxis in
Marine Coccoid Bacteria, Biophys J. Vol.73; 1997:994-1000

VVII RReeffeerreenncceess
104
Graham CH, Conelly I, MacDougall JR, Kerbel RS,Stetler-Stevenson WG, Lala PK
(1994): Resistance of malignant trophoplast cells to both the anti-proliferative and anti-
invasive effects of transforming growth factor-beta. Exp Cell Res 214: 93-99,1994
Gorby YA, Beveridge TJ, Blakemore RP (1988): Characterization of the bacterial
magnetosome membrane; J. Bacteriol., Vol 170, 834-841.
Grayson RAC., et al. (2003): Multi pulse drug delivery from a resorbable polymeric
microchip device. Nat Mater 767-72
Greenberg M, Canter K, Mahler I, Tomheim A (2005): Observation of
Magnetoreceptive Behaviour in a Multicellular Magnetotactic Prokaryote in Higher
Geomagnetic Fields. Biophys. J. Vol. 88:1496-1499
Greulich C, Diendorf J, Simon T, Eggeler G, Epple M, Köller M (Epup. 2010): Uptake
and Intracellular distribution of silver nanoparticles in human mesenchymal stem
cells. Acta Biomaterialia 2011; 7(1):347-54
Grodzinski P, Silver M, Molnar L (2006): Nanotechnologie for cancer diagnostics:
promises and challenges. Expert. Rev. Mol. Diagn. 6(3): 307-318
Groothuis DR (2000): The blood –brain and blood –tumours barriers: a review for
strategies for increasing drug delivery. Neuro Oncol 2: 45-59
Hall A (1998): Rho GTPases and the Actin Cytoskeleton; Science 279:509-514
Harris AK, Wild P and Stopak D (1980): Silicone rubber substrata: a new wrinkle in
the study of cell locomotion, Science 1980; 208:177-179
de Hauwer C, Camby I, Darro F, Decaestecker C, Gras T, Salmon I, Kiss R, Van
Ham P (1997): Dynamic characterizations of cell motility Biochem. and Biophys.
Research Communications 232; 267-272

VVII RReeffeerreenncceess
105
Held-Feindt J, Bernedo Paredes E, Blömer U, Seidenbecher C, Stark AM,
Mehdorn HM and Mentlein R (2006): Matrix-degrading proteases ADAMTS4 and
ADAMTS5 (disintegrins and metalloproteinases with thrombospondin motifs 4 and 5)
are expressed in human glioblastomas. Int. J. Cancer: 118,55-61 (2006)
Hoepken HH, Korten T, Robinson SR et al. (2004): Iron accumulation, iron- mediated
toxicity and altered levels of ferritin and transferrin receptor in cultured astrocytes
during incubation with ferric ammonium citrate. J Neurochem 88:1194-1202
Hegi ME et al. (2005): MGMT gene silencing and benefit from temozolomide in
glioblastoma. N Engl J Med 352:997-1003
Hua MY et al. (2010): The effectiveness of a magnetic nanoparticles-based delivery
system for BCNU in the treatment of gliomas.
Biomaterials Volume 32, Issue 2, January 2011, Pages 516-527
Invitrogen http://probes.invitrogen.com/media/pis/mp03224
Invitrogen a; http:// products.invitrogen.com/ivgn/product/L7528
Islam T, Wolf G (2009): The pharmacokinetics of the lymphotropic nanoparticle MRI
contrast agent ferumoxtran-10. Cancer Biomark 2009;5:69-73
Jacinto FV, Esteller M (2007): MGMT hypermethylation: a prognostic foe, a predictive
friend; DNA Repair 6 (8): 1155–1160
Karlsson HL, Gustafsson J, Cronholm P and Möller L (2009): Size-dependent toxicity
of metal oxide particles—A comparison between nano- and micrometer size
Toxicology Letters Volume 188, Issue 2, 24 July 2009, Pages 112-118
Kleihues P, Burger PC and Scheithauer BW (1992): Histological typing of the
tumours of the central nervous system, Springer-Verlag Berlin, Cancer Biomark.
2009;5(2):69-73.

VVII RReeffeerreenncceess
106
Kleihues P, Burger PC, and Scheithauer BW (1993): The new WHO classification of
brain tumours. Brain Pathol 1993; 3:255-268.
Kleihues P, Soylemezoglu F; Schäuble B, Scheithauer BW,and Burger PC (1995):
Histopathology, classification, and grading of gliomas. glia 15, 211-221
Kirschvink JL, and Gould JL (1981) Biogenic magnetite as a basis for magnetic field
detection in animals biosystems Volume 13, Issue 3, 1981, Pages 181-201
Kirschvink JL, Kirschvink AK and Woodford B. J (1992a): Magnetite biomineralization
in the human brain. Proc. Natl. Acad. Sci. USA.89:7683-7687
Kirschvink JL, Kobayashi-Kirschvink A, Diaz-Ricci JC and Kirschvink SJ (1992b):
Ferromagnetic material in human tissue: implications for background levels of ELF
exposure. Bioelectromagnetics Suppl. 1:101-113.
Kirschvink JL, Walker MM, Diebel CE (2001): Magnetite-based magnetoreception.
Curr Opin Neurobiol. , 11:462-467
Kobayashi A, Yamamoto N and Kirschvink J (1997): Studies of Inorganic Crystals in
Biological Tissue: Magnetite in Human Tumor: Kirschvink Reprinted from Journal of
the Japan Society of Powder and Powder Metallurgy 44, 294
Ko nczo l M, Ebeling S, Goldenberg E, Treude F, Gminski R, ier R, rob ty B,
Rothen-Rutishauser B, Merfort I, Mersch-Sundermann V (2011): Cytotoxicity and
Genotoxicity of Size-Fractionated Iron Oxide (Magnetite) in A549 Human Lung
Epithelial Cells: Role of ROS, JNK, and NF-κB. Chem Res Toxicol. 2011 Jul 18
Kubo T, Sugita T, Shimose S, Nitta Y, Ikuta Y, Murakami T (2000): Targeted delivery
of anticancer drugs with intravenously administered magnetic liposomes in
osteosarcoma-bearing hamsters. Int J Oncol. 17(2):309-15.
Kuehnel, W (2003): Color Atlas of Cytology, Histology, & Microscopic Anatomy (4th
ed.). Thieme. pp. 34. ISBN 1-58890-175-0.

VVII RReeffeerreenncceess
107
Kückelhaus S, Reis SC, Carneira MF, Tedesco AC, Oliveira DM, Lima ECD,. Morais
PC. Azevedo RB and. Lacava ZGM (2004): In vivo investigation of cobalt ferrite-
based magnetic fluid and magnetoliposomes using morphological tests. Journal of
Magnetism and Magnetic Materials Volumes 272-276, Part 3, May 2402-2403
Lauffenburger DA and Horwitz AF (1996): Cell migration: a physically integrated
molecular process. Cell 84, 359-369
Lawson HC, Sampath P, Bohan E et al. (2007): Interstitial chemotherapy for
malignant gliomas: the John Hopkins experience. J Neurooncol 83:61-70
Lévy M, Lagarde F, Maraloiu VA, Blanchin MG, Gendron F, Wilhelm C, Gazeau F
(2010): Degradability of superparamagnetic nanoparticles in a model of intracellular
environment: follow-up of magnetic, structural and chemical properties.
Nanotechnology. 2010 Oct 1;21(39):395103. Epub 2010 Sep 6.
Liu et al. (2006): Analysis of gene expression and chemoresistance of CD133+
cancer stem cells in glioblastoma. Mol Cancer 5: 67
Lehrer S (2010): Anopheles mosquito transmission of brain tumor; Medical
Hypotheses Volume 74, Issue 1, January 2010, Pages 167-168
McLeland CB, Rodriguez J, Stern ST (2011): Autophagy monitoring assay:
qualitative analysis of MAP LC3-I to II conversion by immunoblot.
Methods Mol Biol. 2011;697:199-206.
Liu H, Liu Y, Liu S, Pang DW, Xiao G (2011): Clathrin-mediated endocytosis in living
host cells visualized through quantum dot labeling of infectious hematopoietic
necrosis virus. J Virol. 2011 Jul;85(13):6252-62. Epub 2011 Apr 27.
Li Y et al. (2004): In vivo release from a drug delivery MEMS device.
J Control Release 100:211-9

VVII RReeffeerreenncceess
108
Li X, Du X, Huo T, Liu X, Zhang S, Yuan F. (2009): Specific targeting of breast tumor
by octreotide-conjugated ultrasmall superparamagnetic iron oxide particles using a
clinical 3.0-Tesla magnetic resonance scanner. Acta Radiol. Jul; 50(6):583-94
Liddell JR, Hoepken HH, Crack PJ et al. (2006): Gluthatione peroxidase 1 and
gluthathione are required to protect mouse astrocytes from iron-mediated hydrogen
peroxide toxicity. J Neurosci Res 84:578-586
Liddell JR, Dringen R, Crack PJ et al. (2006): Gluthatione peroxidase 1 and a high
cellular gluthatione concentration are essential for effective organic hydroperoxide
detoxification in astrocytes. Glia 54:873-879
Louis DN et al. 2007: The WHO classification of tumours of the central nervous
system. Acta Neuropathologica. 114(2):97-109
Machesky L M, Mullins RD, Higgs HN, Kaiser DA, Blanchoin L, May RC, Hall ME and
Pollard TD (1999): Scar, a WASp-related protein, activates nucleation of actin
filaments by the Arp2/3 complex.
Proc. Natl. Acad. Sci. U.S.A. 96, 3739–3744
Machesky LM and Insall RH (1998): Scar1 and the related Wiskott–Aldrich syndrome
protein, WASP, regulate the actin cytoskeleton through the Arp2/3 complex. Curr.
Biol. 8, 1347–1356
Mastunaga T et al. (1996): Enhancement of magnetic particle production by nitrate
and succinate fed-batch culture of Magnetospirillum sp. AMB-1.
Biotechnol. Tech. 10: 495-500
Matsunaga T, Okamura Y (2003): Genes and proteins involved in bacterial magnetic
particle formation. Trends in Microbiol. Vol. 11: 536-541
van Meir et al. (2010): Exciting new advances in neuro-oncology: the avenue to a
cure for malignant glioma.
CA Cancer J Clin. 60(3)166-193

VVII RReeffeerreenncceess
109
Miki H, Suetsugu S and Takenawa T (1998): WAVE, a novel WASP-family protein
involved in actin reorganization induced by Rac. EMBO J. 17, 6932–6941
Millard TH, Sharp SJ and Machewsky LM (2004): 1 Signalling to actin assembly via
the WASP (Wiskott-Aldrich syndrome protein)-family proteins and the Arp2/3
complex; Biochem. J. 380, 1-17
Miller G (2009): Brain cancer. A viral link to glioblastoma? Science;323(5910):30–1
Möller W, Nemoto I, Matsuzaki T, Hofer T, Heyder J. (2000): Magnetic phagosome
motion in J774A.1 macrophages: influence of cytoskeletal drugs.
Biophys J. 2000 Aug;79(2):720-30.
Mora CV, Davison M, Wild JM, Walker MM (2004): Magnetoreception and its
trigeminal mediation in the homing pigeon. Nature 432:508-511.
Morawski AM, Lanza GA, Wickline SA (2005): Targeted contrast agents for magnetic
resonance imaging and ultrasound. Curr. Opin. Biotechnol. 16(1): 89-92
Mucha B, Willumeit R, Lamszus K; Patentnummer WO 2011/058018; HZG
Geesthacht, UK-Eppendorf
Naqvi S, Samim M, Abdin M, Ahmed FJ, Maitra A, Prashant C, Dinda AK (2010):
Concentration-dependent toxicity of iron oxide nanoparticles mediated by increased
oxidative stress. Int J Nanomedicine. 2010 Nov 16;5:983-9.
Nel A, Xia T, Mädler L and Li N (2006): Toxic Potential of Materials at the Nanolevel
Science 3 February 2006:Vol. 311 no. 5761 pp. 622-627
Nikon 2009 Personal information of technician personal (Detlef Puetz and Christoph
Hamers) Biotechnica
Norden AD, Young GS, Setayesh K, et al. (2008): Bevacuzimab for recurrent
malignant gliomas; efficacy, toxicity and patterns of recurrence.
VVII RReeffeerreenncceess
110
Neurology 70:779-787
Perls M (1867): Nachweis von Eisenoxyd in gewissen Pigmenten. Virchows Archiv
für pathologische Anatomie und Physiologie und für klinische Medizin 39, 42-48
Pollard TD, Borisy GG (2003): Cellular motility driven by assembly and self assembly
of actin filaments, Cell 112 453-465
Rasouli– Nia A et al. (1994): Day 3rd, On the quantitative relationship between
O6methylguanine residues in genomic DNA and production of sister-chromatid
exchanges, mutations and lethal events in a Mer-human tumor cell line, Mutat. Res.
314 99-113
Regis A, Vilchez MD, Kozinetz CA, Arrington AS, Madden CR and Butel JS (2003):
Simian virus 40 in human cancers; The American Journal of Medicine Volume 114,
Issue 8, 1 June 2003, Pages 675-684
Rohatgi, R, Ma L, Miki H, Lopez M, Kirchhausen T, Takenawa T and Kirschner MW
(1999): The interaction between N-WASP and the Arp2/3 complex links Cdc42-
dependent signals to actin assembly. Cell 97, 221–231
Sachdeva MS (1998): Drug targeting systems for cancer chemotherapy.
Expert Opin Investig Drugs. 7(11):1849-64.
Sakaguchi T et al. (2002): Desulvovibrio magnetics sp.nov. a Novel Sulfyae
Reducing Bacterium That Produces Intracellullar Single-Domain-Sized Magnetite
Particles. Int. J. Syst. Evol. Microbiol. 52, 215-221
Sampath P, Brem H (1998): Implantable slow release chemotherapeutics polymers
for the treatment of malignant brain tumours. Cancer Control 5:130-137
Schneider T, Thalau H-P, Semm P, Wiltschko W (1994): Melatonin is crucial for the
migratory orientation of pied flycatchers Ficedula hypoleuca pallas.
J Exp Biol 1994, 194:255-262.

VVII RReeffeerreenncceess
111
Schulten K, Swenberg C, Weller A (1978): A biomagnetic sensory mechanism based
on magnetic field modulated coherent electron spin motion. Z Phys Chem 1978,
NF111:1-5.
Schultheiss D, Kube M, Schueler D (2004): Inactivation of the Flagellin Gene flaA in
Magnetospirillum gryphiswaldense Results in Nonmagnetotactic Mutants Lacking
Flagellar Filaments. Applied and environmental Microbiology: 3624-3631
Seregin SS, Amalfitano A (2011): Gene Therapy for Lysosomal Storage Diseases:
Progress, Challenges and Future Prospects. Curr Pharm Des. 2011 Jul 21
Seong H et al. (2003): BCNU –loaded poly (d,l-lactide-co-glycolide) wafer and
antitumor activity against XF-498 human CNS tumor cells in vitro. Int J Pharm 2003;
251:1-12
Singh S, Kumar A, Karakoti A, Seal A and Self WT (2010):
Unveiling the mechanism of uptake and sub-cellular distribution of cerium oxide
nanoparticles. Mol Biosyst. 2010 October 1;6 (10): 1813-1820.
Spring S and Schleifer KH (1995): Diversity of Magnetotactic bacteria. Syst. Appl.
Microbiol. 18, 147-153
Stark DD, Weissleder R, Elizondo G, Hahn PF, Saini S, Todd LE, Wittenberg J, and
Ferrucci JT (1988): Superparamagnetic iron oxide: clinical application as a contrast
agent for MR imaging of the liver. Radiology August 1988 168:297-301
Stieber VW, Mehta MP (2007): Advances in radiation therapy for brain tumours.
Neurol Clin 2007; 25:1005-1033
Stormer F et al. (2009) Are the Astrocytes involved in magnetite based memory?
medical hypotheses 73 (2009) 1072-1080
Stupp R, Mason WP, van den Bent MJ, et al. (2005): Radiotherapy plus concomitant
and adjuvant temozolomide for glioblastoma. N Engl J Med 2005;352:987-996
VVII RReeffeerreenncceess
112
Suzuki M, Honda H, Kobayashi T, Wakabayashi T, Yoshida J, Takahashi M. (1996):
Development of a target-directed magnetic resonance contrast agent using
monoclonal antibody-conjugated magnetic particles. Brain tumor Pathology 1996
Nov;13(2):127-32
Symons M, Derry JM, Karlak B, Jiang S, Lemahieu V, McCormick F, Francke U and
Abo A (1996): Wiskott–Aldrich syndrome protein, a novel effector for the GTPase
CDC42Hs, is implicated in actin polymerization. Cell 84, 723–734
Tan YB, Wu XY, Zhang JF, Zhang MM (2010): [Magnetic resonance signal detection
of superparamagnetic iron oxide nanoparticles and its biological effects on
endothelial cells]. Zhejiang Da Xue Xue Bao Yi Xue Ban. 2010 Mar;39(2):118-24.
Torti FM, Torti SV, (2002): Regulation of Ferritin genes and protein,
Blood 99: 3505-3516
Tzima E, Kiosses WB, del Pozo MA and Schwartz MA (2003): Localized Cdcd42
Activation, detected using a novel assay, mediates microtubule organizing center
positioning in endothelial cells in response to fluid shear stress, J of Bio Chem Vol.
278 No 33, 31020-31023
Valberg PA, Albertini DF (1985): Cytoplasmic motions, rheology, and structure
probed by a novel magnetic particle method.
J Cell Biol. 1985 Jul;101(1):130-40.
Weller Prof. Dr. (2011) Personal talk at 28.07.2011 at the University Hamburg,
Department for Chemistry
Wen Tien Chen (1981): Mechanism of retraction of the trailing edge during fibroblast
movement, J. Cell Biol. 1981 July1 90(1) 187-200
Westphal M, Hilt DC, Bortey E et al. (2003): A phase 3 trial of local chemotherapy
with biodegradable carmustine (BCNU) wafers (Gliadel wafers) in patients with
primary malignant glioma. Neuro Oncol 2003;5:75-88
VVII RReeffeerreenncceess
113
Wolf F and Kirchhoff F (2008): Imaging Astrocyte Activity Science Vol320, 2008
Wu X, Suetsugu S, Cooper LA, Takenawa T, Guan JL (2004): Focal adhesion
Kinnase Regulation of N-WASP Subcellular Localization and Function,
J of Biol ChemVol. 279; 10:9965-9576
Xux et al (2006): BCNU loaded PEG-PLLA ultrafine fibers and their in vitro antitumor
activity against glioma C6 cells. J Control Release 2006; 114:307-316
Xu H, Dai W, Han Y, Xiong F,Zhang Y and Cao JM J Nanosci (2010):
Differential internalization of superparamagnetic iron oxide nanoparticles in different
types of cells. Nanotechnol. 2010 Nov; 10(11):7406-10
Zeiss 2009 Personal information of technician personal. Biotechnica

VVIIII LLiisstt ooff ffiigguurreess
114
VII List of figures
Figure 1: Model of cell movement 12
Figure 2: Model of the forward movement of actin
network at the leading edge. 13
Figure 3: Effects of Rac, Rho and Cdc42 to the actin
organisation of Fibroblasts 14
Figure 4: Schematic view of the periodic table indicating
ICP-MS detectable elements. 31
Figure 5: Microscope investigation of iron deposition (NP-MA)
and their position in glioblastoma cells. 35
Figure 6: Microscope investigation of iron deposits (NP-LA) and
their position in glioblastoma cells 35
Figure 7: Iron content per cell after a 2d incubation period
measured using ICP-MS 36
Figure 8: Astrocytes cell size and nucleus measurement. 37
Figure 9: Glioblastoma G55 cell size and nucleus measurements 38
Figure 10: Results of Cell measurements 39
Figure 11: Iron content normalized to cell volume 39
Figure 12: Proliferation of astrocytes incubated with (a) NP-MA or
(b) NP-LA supplemented media. 41
Figure 13: Proliferation of glioblastoma cells G55 incubated with (a) NP-MA
or (b) NP-LA supplemented media. 42
Figure 14: Proliferation of glioblastoma cells G44 incubated with
NP-MA-supplemented media 43
Figure 15: Results of cell viability investigations 44
Figure 16: Design of the magnetic field; two magnet type 47
Figure 17: Magnet, two magnet type 49
Figure 18: Magnetic field lines; two magnet type 50
Figure 19: Gradient of the magnetic field, two magnet type. 51
Figure 20: Dual-fluorescence cell viability assay of Astrocytes
using ethidium homodimer and calcein AM. 52
Figure 21: Dual-fluorescence cell viability assay of G55
using ethidium homodimer and calcein AM. 53

VVIIII LLiisstt ooff ffiigguurreess
115
Figure 22: Visualization of the nanoparticles in astrocytes 56
Figure 23: Visualization of the nanoparticles in glioblastoma cells 57
Figure 24: Fluorescence analyzes of Astrocytes control –B 59
Figure 25: Fluorescence analyses of Astrocytes control +B 60
Figure 26: Fluorescence analyzes of Astrocytes 0.25 NP-MA-B 61
Figure 27: Fluorescence analyzes of Astrocytes 0.25NP-MA+B 62
Figure 28: Fluorescence analyzes of Astrocytes 0.5NP-MA –B 63
Figure 29: Fluorescence analyzes of Astrocytes 0.5NP-MA +B 64
Figure 30: Fluorescence analyzes of G55 control-B 66
Figure 31: Fluorescence analyses of G55 control +B 67
Figure 32: Fluorescence analyzes of G55 0.25NP-MA-B 68
Figure 33: Fluorescence analyzes of G55 0.25 NP-MA +B 69
Figure 34: Fluorescence analyzes of G55 0.5NP-MA-B 70
Figure 35: Fluorescence analyzes of G55 0.5NP-MA+B 71
Figure 36: Berliner blue staining of astrocytes 74
Figure 37: Start and result of migration for Astrocytes control cells. 75
Figure 38: Start and result of Astrocytes pre-incubated with
0.25NP-MA (38a) and 0.5NP-MA (38b) 76
Figure 39: Start and result of migration for G55 control cells. 77
Figure 40: Start and result of migration for G55 0.25NP-MA cells 78
Figure 41: Length distribution of migration 78
Figure 42: Results of migration experiment with G55 0,5 NP-MA cells 79
Figure 43: Visualisation of Actin and N-WASP in Astrocytes control 81
Figure 44: Visualisation of Actin and N-WASP in Astrocytes 0.25NP-MA 82
Figure 45: Visualisation of Actin and N-WASP in Astrocytes 0.5NP-MA 83
Figure 46: Visualisation of Actin and N-WASP in G55 control 84
Figure 47: Visualisation of Actin and N-WASP in G55 0.25NP-MA 85
Figure 48: Visualisation of Actin and N-WASP in G55 0.5NP-MA 86
Figure 49: Vesicle transport in cells 91
Lut`s

VVIIII LLiisstt ooff ffiigguurreess
116
VIII Abbreviations
ANOVA Analysis of Variance
ADAMTS4+5 Disintegrins and metalloproteins with thrombospondin
motifs 4+5
Arp 2/3 Actin related protein
ATP Adenosintriphosphate
BBB Blood Brain Barrier
BBS Berliner Blue Staining
BCNU Trade name for carmustine
CASY Electric field cell counting system
Cdc42 Cell division cycle protein 42
cDNA Complementary DNA
CFX Computational Fluid Dynamics program
CNS Central nervous system
DAPI 4´,6-diamindino-2-phenylindole
DMEM Dulbecco´s Modified Eagle Medium
DMSO Dimethyl Sulfoxid
DNA Desoxyribonucleinacid
ER Endoplasmic Reticulum
FAD Photopigment flavin dehydrogenase
FCS Fetal Calf Serum
GTP Guanosine triphosphate
ICP-MS Inductively coupled plasma mass spectrometry
IgG Immunglobulin G
KCl Potassiumchloride
KH2PO4 Monopotassiumphophate
Lyso Lysosomes
MGMT methylguanylmethyltransferase
MMB Magnetotactic Multicellular Prokaryote
MPS Mononuclear Phagocyte System
MRI Magnetic Resonance Imaging
mT Milli Tesla

VVIIII LLiisstt ooff ffiigguurreess
117
MTOC Microtubule organization center
Na2HPO4 Disodium Hydrogen Phosphate
NaCl Sodiumchloride
NP-LA Nanoparticles coated with lauricacid
NP-MA Nanoparticles coated with myristicacid
OATZ Oxic –anoxic transition zone
PBS Phosphate buffered saline
pH Measure of acidity or alkalinity
Rac Monomere GTPases, Rho family
rcf Relative centrifuge force
RF Radio Frequency
Rho GTPases
RNA Ribonucleinacid
ROS Reactive oxygen species
rRNA Ribosomale RNA
RT-qPCR Real-Time quantitative Poly Chain Reaction
Scar/WAVE 1 WASP-family protein
SV40 Simian Virus 40
TEM Transmission Electron Microscopy
TfRC Transferrin receptor C
VEGF Vascular endothelial growth factor
WASP Wiskott Aldrich Syndrom Protein
WHO World Health Organization
µm micrometer
3D Three dimensional

IIXX AAcckknnoowwlleeddggeemmeennttss
118
IX Acknowledgements
This work was funded by the Helmholtz Russian Joint Research Group 016 and has
been performed at the Institute of Materials Research, Department of Structural
Research on Macromolecules, at the Helmholtz Centre Geesthacht.
First of all I want to thank my supervisor Prof. Regine Willumeit, I’m deeply indebted
for having me offered the opportunity of research on this fascinating theme and for all
the valuable discussions, the contribution of my work and the detailed proofreading.
Not forgetting for all the other times she was “pushing“ me forwards.
Prof. Ulrich Hahn I want to thank for the “official” supervising and all the answers he
gave me.
I´m really appreciated that it was possible to accomplish the ICP-MS in the working
group of Prof. Andreas Prange. Dr. Daniel Pröfrock gets my gratefulness for the help
with the measurements. Prof. Horst Weller and Prof. Lothar Renwrantz I want to
thank for their time and the interesting discussions about tricky little things called
nanoparticles and lysosomes.
Special thanks as well to our nice cooperation partners Prof. Katrin Lamszus, Dr.
Ladislaus Vekas, Dr. Mikhail Avdeev and all the others supporting this work, it was a
pleasure to work with you.
I’m very grateful for Dr. Anna Schuster believing that mothers can do this and the
never-ending motivation. Thank you, you are really a friend.
Dipl. Ing Gerhard Kozik and Bernhard Eltzschig were helping me constructing the
magnets, Gerhard always risk his fingers, if the magnets had to be changed.
Dipl. Ing. Rudolf Zettler and Dr. Jonathan Paul: Thanks so much for the English
proofreading, I’m starting to think English now.
My working group – WPS - I want to say: I had a great time with very special people,
much cake, coffee and some barbecue, lab- party AND very nice support. Thank you,
I was feeling home the last years. I have also received considerable assistance by
our technician Gabriele Salamon, often starting incubations at the weekend.
Last but not least, I’m very grateful to my family, they were always catching me up,
motivating and supporting me, when I lost believe. My husband I want to thank for
living, loving and laughing with me during all this time.

Erklärung über frühere Promotionsversuche
Hiermit erkläre ich, dass vorher keine
weiteren
Promotionsversuche unternommen worden sind, oder an einer anderen Stelle
vorgelegt wurden.
Hamburg, den ............................
……………………………………
(Unterschrift)
Eidesstattliche Versicherung
Hiermit erkläre ich an Eides statt, dass die vorliegende Dissertationsschrift
selbständig und allein von mir unter den angegebenen Hilfsmitteln angefertigt wurde.
Hamburg, den ………………….
……………………………………
(Unterschrift)