Magnetic Resonance Imaging - pdfs.semanticscholar.org · different tracer pharmacokinetic models...
8
Early assessment of breast cancer response to neoadjuvant chemotherapy by semi-quantitative analysis of high-temporal resolution DCE-MRI: Preliminary results Richard G. Abramson a, b, c, ⁎, Xia Li a, b , Tamarya Lea Hoyt a, c , Pei-Fang Su d , Lori R. Arlinghaus a, b , Kevin J. Wilson a, b , Vandana G. Abramson c, e , A. Bapsi Chakravarthy c, f , Thomas E. Yankeelov a, b, c, g, h, i a Department of Radiology and Radiological Sciences, Vanderbilt University, Nashville, TN b Institute of Imaging Science, Vanderbilt University, Nashville, TN c Vanderbilt-Ingram Center, Vanderbilt University, Nashville, TN d Department of Statistics, National Cheng Kung University, Taiwan e Department of Medicine, Vanderbilt University, Nashville, TN f Department of Radiation Oncology, Vanderbilt University, Nashville, TN g Department of Cancer Biology, Vanderbilt University, Nashville, TN h Department of Biomedical Engineering, Vanderbilt University, Nashville, TN i Department of Physics and Astronomy, Vanderbilt University, Nashville, TN abstract article info Article history: Received 12 February 2013 Revised 28 May 2013 Accepted 2 July 2013 Available online xxxx Keywords: Response assessment Preoperative chemotherapy Primary chemotherapy Imaging biomarkers Operable breast cancer DCE-MRI Neoadjuvant therapy Neoadjuvant chemotherapy Enhancement kinetics Purpose: To evaluate whether semi-quantitative analysis of high temporal resolution dynamic contrast- enhanced MRI (DCE-MRI) acquired early in treatment can predict the response of locally advanced breast cancer (LABC) to neoadjuvant chemotherapy (NAC). Materials and Methods: As part of an IRB-approved prospective study, 21 patients with LABC provided informed consent and underwent high temporal resolution 3 T DCE-MRI before and after 1 cycle of NAC. Using measurements performed by two radiologists, the following parameters were extracted for lesions at both examinations: lesion size (short and long axes, in both early and late phases of enhancement), radiologist's subjective assessment of lesion enhancement, and percentages of voxels within the lesion demonstrating progressive, plateau, or washout kinetics. The latter data were calculated using two filters, one selecting for voxels enhancing ≥50% over baseline and one for voxels enhancing ≥100% over baseline. Pretreatment imaging parameters and parameter changes following cycle 1 of NAC were evaluated for their ability to discriminate patients with an eventual pathological complete response (pCR). Results: All 21 patients completed NAC followed by surgery, with 9 patients achieving a pCR. No pretreatment imaging parameters were predictive of pCR. However, change after cycle 1 of NAC in percentage of voxels demonstrating washout kinetics with a 100% enhancement filter discriminated patients with an eventual pCR with an area under the receiver operating characteristic curve (AUC) of 0.77. Changes in other parameters, including lesion size, did not predict pCR. Conclusion: Semi-quantitative analysis of high temporal resolution DCE-MRI in patients with LABC can discriminate patients with an eventual pCR after one cycle of NAC. © 2013 Elsevier Inc. All rights reserved. 1. Introduction Neoadjuvant chemotherapy (NAC) is offered to selected patients with locally advanced breast cancer (LABC) to reduce tumor burden before surgery and to allow for possible earlier treatment of occult micrometastatic disease [1]. Studies have confirmed that patients undergoing NAC have a lower risk of requiring mastectomy (i.e., are more likely to qualify for breast conservation therapy) and have equivalent survival to patients undergoing adjuvant chemotherapy [2,3]. With more breast cancer patients receiving NAC as a component of therapeutic management, the need for noninvasive assessment of treatment response has emerged as an important challenge for imaging. Because NAC is typically given in multiple cycles over several weeks, the ability to identify patients early in treatment who are not responding to a particular chemotherapy would allow the treating oncologist to discontinue an ineffective treatment (with Magnetic Resonance Imaging xxx (2013) xxx–xxx ⁎ Corresponding author. Vanderbilt University Medical Center, Department of Radiology and Radiological Sciences, 1161 21st Ave South, CCC-1121 MCN, Nashville, TN 37232-2675. E-mail address: [email protected] (R.G. Abramson). 0730-725X/$ – see front matter © 2013 Elsevier Inc. All rights reserved. http://dx.doi.org/10.1016/j.mri.2013.07.002 Contents lists available at SciVerse ScienceDirect Magnetic Resonance Imaging journal homepage: www.mrijournal.com Please cite this article as: Abramson RG, et al, Early assessment of breast cancer response to neoadjuvant chemotherapy by semi- quantitative analysis of high-temporal resolution D..., Magn Reson Imaging (2013), http://dx.doi.org/10.1016/j.mri.2013.07.002
Transcript of Magnetic Resonance Imaging - pdfs.semanticscholar.org · different tracer pharmacokinetic models...

Magnetic Resonance Imaging xxx (2013) xxx–xxx
Contents lists available at SciVerse ScienceDirect
Magnetic Resonance Imaging
j ourna l homepage: www.mr i journa l .com
Early assessment of breast cancer response to neoadjuvant chemotherapyby semi-quantitative analysis of high-temporal resolution DCE-MRI:Preliminary results
Richard G. Abramson a,b,c,⁎, Xia Li a,b, Tamarya Lea Hoyt a,c, Pei-Fang Su d, Lori R. Arlinghaus a,b,Kevin J. Wilson a,b, Vandana G. Abramson c,e, A. Bapsi Chakravarthy c,f, Thomas E. Yankeelov a,b,c,g,h, i
a Department of Radiology and Radiological Sciences, Vanderbilt University, Nashville, TNb Institute of Imaging Science, Vanderbilt University, Nashville, TNc Vanderbilt-Ingram Center, Vanderbilt University, Nashville, TNd Department of Statistics, National Cheng Kung University, Taiwane Department of Medicine, Vanderbilt University, Nashville, TNf Department of Radiation Oncology, Vanderbilt University, Nashville, TNg Department of Cancer Biology, Vanderbilt University, Nashville, TNh Department of Biomedical Engineering, Vanderbilt University, Nashville, TNi Department of Physics and Astronomy, Vanderbilt University, Nashville, TN
⁎ Corresponding author. Vanderbilt University MedRadiology and Radiological Sciences, 1161 21st ANashville, TN 37232-2675.
E-mail address: [email protected] (R
0730-725X/$ – see front matter © 2013 Elsevier Inc. Alhttp://dx.doi.org/10.1016/j.mri.2013.07.002
Please cite this article as: Abramson RG,quantitative analysis of high-temporal reso
a b s t r a c t
a r t i c l e i n f oArticle history:
Received 12 February 2013Revised 28 May 2013Accepted 2 July 2013Available online xxxxKeywords:Response assessmentPreoperative chemotherapyPrimary chemotherapyImaging biomarkersOperable breast cancerDCE-MRINeoadjuvant therapyNeoadjuvant chemotherapyEnhancement kinetics
Purpose: To evaluate whether semi-quantitative analysis of high temporal resolution dynamic contrast-enhanced MRI (DCE-MRI) acquired early in treatment can predict the response of locally advanced breastcancer (LABC) to neoadjuvant chemotherapy (NAC).Materials and Methods: As part of an IRB-approved prospective study, 21 patients with LABC providedinformed consent and underwent high temporal resolution 3 T DCE-MRI before and after 1 cycle of NAC.Usingmeasurements performed by two radiologists, the following parameters were extracted for lesions atboth examinations: lesion size (short and long axes, in both early and late phases of enhancement),radiologist's subjective assessment of lesion enhancement, and percentages of voxels within the lesiondemonstrating progressive, plateau, or washout kinetics. The latter data were calculated using two filters,one selecting for voxels enhancing ≥50% over baseline and one for voxels enhancing ≥100% over baseline.Pretreatment imaging parameters and parameter changes following cycle 1 of NAC were evaluated fortheir ability to discriminate patients with an eventual pathological complete response (pCR).Results: All 21 patients completed NAC followed by surgery, with 9 patients achieving a pCR. Nopretreatment imaging parameters were predictive of pCR. However, change after cycle 1 of NAC inpercentage of voxels demonstrating washout kinetics with a 100% enhancement filter discriminated
patients with an eventual pCR with an area under the receiver operating characteristic curve (AUC) of 0.77.Changes in other parameters, including lesion size, did not predict pCR.Conclusion: Semi-quantitative analysis of high temporal resolution DCE-MRI in patients with LABC candiscriminate patients with an eventual pCR after one cycle of NAC.© 2013 Elsevier Inc. All rights reserved.
1. Introduction
Neoadjuvant chemotherapy (NAC) is offered to selectedpatients with locally advanced breast cancer (LABC) to reducetumor burden before surgery and to allow for possible earliertreatment of occult micrometastatic disease [1]. Studies have
ical Center, Department ofve South, CCC-1121 MCN
.G. Abramson).
l rights reserved.
et al, Early assessmenlution D..., Magn Reso
,
t ofn Im
confirmed that patients undergoing NAC have a lower risk ofrequiring mastectomy (i.e., are more likely to qualify for breastconservation therapy) and have equivalent survival to patientsundergoing adjuvant chemotherapy [2,3].
With more breast cancer patients receiving NAC as a componentof therapeutic management, the need for noninvasive assessment oftreatment response has emerged as an important challenge forimaging. Because NAC is typically given in multiple cycles overseveral weeks, the ability to identify patients early in treatment whoare not responding to a particular chemotherapy would allow thetreating oncologist to discontinue an ineffective treatment (with
breast cancer response to neoadjuvant chemotherapy by semi-aging (2013), http://dx.doi.org/10.1016/j.mri.2013.07.002
2 R.G. Abramson et al. / Magnetic Resonance Imaging xxx (2013) xxx–xxx
potential short-term and long-term toxicities) and substitute analternative regimen. Additionally, since pathological response iscorrelated with disease-free and overall survival [4,5], earlynoninvasive response assessment may have similar prognosticsignificance [6].
Prospective comparisons of different noninvasive imaging mo-dalities have identified magnetic resonance imaging (MRI) as auseful technique in the setting of NAC for breast cancer [7,8]. Amongdifferent MRI approaches, dynamic contrast enhanced MRI (DCE-MRI) is considered especially promising due to its ability to assesschanges in tumor vascularity in addition to changes in gross tumorsize. To the extent that gross tumor shrinkage may lag behindchanges in tumor vascularity in the context of a biological treatmentresponse, DCE-MRI may be able to predict response earlier thantechniques oriented exclusively toward tumor size.
DCE-MRI is an umbrella term used to describe a spectrum of MRItechniques and analytic approaches including both quantitative andsemi-quantitativemethods applied to data acquired via high and lowtemporal resolution sampling [9]. The literature on DCE-MRI forassessment of breast cancer response to NAC has evolved along twomain avenues of investigation: fully quantitative approaches usingdifferent tracer pharmacokinetic models applied to high temporalresolution acquisitions [10–14], and a variety of alternative ap-proaches employing semi-quantitative analyses of low temporalresolution/high spatial resolution images [15–18]. Both approacheshave their strengths: theoretical considerations and empirical datasuggest that diagnostic performance of DCE-MRI may improve withincreasing temporal resolution [19], but semi-quantitative ap-proaches may offer greater reproducibility by virtue of theirsimplicity, especially when deployed across multiple sites in alarge-scale clinical trial [20].
Given the relative advantages of these two approaches, and out ofconsideration that a blended approach might offer enhancedreproducibility while retaining the ability to characterize changesin tumor vascularity with precision, we undertook this study toinvestigate whether a semi-quantitative analysis of high temporalresolution DCE-MRI data could provide useful early informationregarding breast cancer response to NAC. We employed a semi-quantitative approach for kinetic curve type categorization similar toone previously applied by other investigators for initial character-ization of lesions as benign or malignant [21]. While others havestudied changes in tumor washout kinetics during preoperativetherapy [15], this is the first attempt to our knowledge to evaluatewhether a semi-quantitative analysis of high temporal resolutionDCE-MRI data can be used to predict pathological response after onecycle of NAC.
2. Materials and methods
2.1. Patients and clinical protocol
Patients with pathologically proven LABC who were scheduledto receive NAC were eligible for this IRB-approved prospectivestudy. After providing informed consent, patients underwent DCE-MRI before and after one cycle of NAC. Human epidermal growthfactors 2 (HER2) positive patients received paclitaxel, carboplatin,and trastuzumab every three weeks for six cycles. Most patientswith HER2 negative tumors received doxorubicin and cyclophos-phamide administered every two weeks for four cycles followed bytwelve weekly cycles of paclitaxel, although a subset of patientswith “triple negative” disease (i.e., negative for estrogen receptor(ER), progesterone receptor (PR), and HER2 overexpression)received weekly cisplatin and paclitaxel combined with eithereverolimus or placebo for twelve weeks as part of a separate
Please cite this article as: Abramson RG, et al, Early assessment ofquantitative analysis of high-temporal resolution D..., Magn Reson Im
clinical trial. After NAC, patients underwent either mastectomy orbreast conservation therapy.
2.2. Pathological analysis
After surgery, specimens were evaluated for pathological treat-ment response. A patient was classified as having had a pathologicalcomplete response (pCR) to NAC if she had complete absence ofresidual disease at the primary tumor site and complete absence ofdisease in any resected lymph nodes. A patient was considered as nothaving achieved a pCR if she had any residual disease at the primarytumor site and/or residual lymph node disease.
2.3. MRI methods
Patients were screened prior to imaging to ensure adequate renalfunction before administration of intravenous gadolinium contrast.The study protocol specified a minimum estimated glomerularfiltration rate (eGFR) of 90 mL/min, with this value obtained within30 days of imaging.
MRI was performed on a Philips 3 T Achieva MR scanner (PhilipsHealthcare, Best, The Netherlands) using a 4-channel receive double-breast coil (Invivo Inc., Gainesville, FL). High temporal resolutionDCE-MRI data were acquired using an RF-spoiled 3D gradient echomulti-flip angle acquisition with TR = 7.9 ms, TE = 4.6 ms, a flipangle of 20°, one signal acquisition, and a sensitivity encoding (i.e.,SENSE) factor of 2 applied in the anterior–posterior direction.Twenty sagittal slices were acquired with a slice thickness of5 mm, in-plane field of view (FOV) of 22 cm2, acquisition matrixof 192 × 192, and no interslice spacing. Dynamic scanning wasperformed over 25 acquisitions with a temporal resolution of 16 sper acquisition, for a total scan time of 400 s. The first threeacquisitions were unenhanced baseline scans; after the thirdbaseline scan, 0.1 mmol/kg (9–15 mL) of gadopentetate dimeglu-mine (Gd-DTPA, Magnevist, Wayne, NJ) was administered throughan antecubital vein catheter via a power injector (Medrad, Inc.,Warrendale, PA) at 2 mL/s, followed by a saline flush. An investigatorwith over 10 years of experience in medical image registration (X.L.)monitored cine loops of the dynamic frames to ensure that imageswere not corrupted by patient motion.
2.4. Image analysis
Graphical user interface (GUI) software was constructed usingMatlab 2010a (MathWorks, Natick, MA) to display acquired imagesand to facilitate data extraction (Fig. 1). Using the GUI software, twoboard-certified radiologists (R.A. and T.H.), each with more than fiveyears of breast MRI experience, measured all lesions and drewregions of interest (ROIs) around lesion volumes on the pretreat-ment and post-cycle 1 image sets.
Data extracted for analysis included lesion size, perceivedenhancement, and semi-quantitative enhancement kinetics param-eters. For lesion size, tumor measurements were made in long-axisand short-axis using the slice on which the lesion appeared largest.Following the methodology described by Loo et al. [17], measure-ments were performed both during the initial phase of enhancement(before 120 s) and during the late phase of enhancement (at 400 s).
For perceived enhancement, each radiologist performed asubjective assessment of the percentage of lesion volumedemonstrating enhancement at each timepoint. Enhancementwas graded in quartiles as follows: less than 25% enhancement,25% to 50% enhancement, 50% to 75% enhancement, and greaterthan 75% enhancement.
For semi-quantitative analysis of enhancement kinetics, the GUIfirst filtered for voxels within each ROI demonstrating signal
breast cancer response to neoadjuvant chemotherapy by semi-aging (2013), http://dx.doi.org/10.1016/j.mri.2013.07.002

Fig. 1. Screen capture from the graphical user interface (GUI). The top row displays postcontrast MRI images from all three timepoints (baseline, after one cycle of NAC, and at completion of NAC). The graphs depict time–signal intensitycurves for single voxels, chosen by the user by placing cross-hairs within the images. The middle row displays subtraction images corresponding to the slices in the top row. The bottom row contains parametric color maps representing theshape of the enhancement curve for each voxel within the slice, with one map using a 50% enhancement filter and the other map using a 100% enhancement filter. Blue = progressive (type I) kinetics, yellow = plateau (type II) kinetics,red = washout (type III) kinetics.
3R.G
.Abram
sonet
al./Magnetic
ResonanceIm
agingxxx
(2013)xxx–xxx
Pleasecite
thisarticle
as:Abram
sonRG
,et
al,Early
assessment
ofbreast
cancerresponse
toneoadjuvant
chemotherapy
bysem
i-quantitative
analysisof
high-temporal
resolutionD...,M
agnReson
Imaging
(2013),http://dx.doi.org/10.1016/j.mri.2013.07.002

Table 1Patient and tumor characteristics.
Variable Value
Number of patients 21Patient age (years)Mean 45Range 28–60Baseline tumor diameter, clinical (cm)Mean 5.6Range 2–12ImmunostainingER+ and/or PR+ 7HER2+ (including ER+ and ER−) 7Triple negative 7Tumor gradeLow 3Intermediate 6High 12SurgeryMastectomy 10Breast conservation therapy 11
ER = estrogen receptor. HER2 = human epidermal growth factor receptor 2(ErbB2). PR = progesterone receptor. “Triple negative” = ER−/PR−/HER2−.
Table 2Patient tumor type, timing of “post-cycle 1” scan, and pathological response.
Patientnumber
Tumor type Timing of “post-cycle 1”scan (days afterbaseline scan)
Pathologicalresponse
01 HER2+ 21 pCR02 HER2+ 7 pCR03 ER+ and/or PR+ 14 non-pCR04 ER+ and/or PR+ 13 pCR05 Triple negative 17 non-pCR06 HER2+ 24 pCR07 ER+ and/or PR+ 14 non-pCR08 HER2+ 18 non-pCR09 ER+ and/or PR+ 17 non-pCR10 HER2+ 13 non-pCR11 Triple negative 15 pCR12 ER+ and/or PR+ 14 non-pCR13 HER2+ 25 non-pCR14 HER2+ 14 pCR15 Triple negative 16 pCR16 ER+ and/or PR+ 28 non-pCR17 Triple negative 7 non-pCR18 Triple negative 9 non-pCR19 ER+ and/or PR+ 13 pCR20 Triple negative 15 pCR21 Triple negative 9 non-pCR
ER = estrogen receptor. HER2 = human epidermal growth factor receptor 2(ErbB2). PR = progesterone receptor. “Triple negative” = ER−/PR−/HER2−.
4 R.G. Abramson et al. / Magnetic Resonance Imaging xxx (2013) xxx–xxx
intensity increases of either ≥50% or ≥100% over baseline followingcontrast administration, thus removing any nonenhancing voxels orvoxels with low-level enhancement. Then, using the ≥50% and≥100% enhancement filters, the GUI automatically calculated thepercentage of voxels within each ROI exhibiting progressive (Type I),plateau (Type II), or washout (Type III) enhancement kinetics [22].Enhancement type for each voxel was designated with reference toSIslope for that voxel, defined as
SI slope ¼ SI tail−SI peak
� �=SI peak
h i� 100%
where SIpeak was the peak signal intensity during the first 120 sfollowing contrast injection and SItailwas the average signal intensityover the final two dynamic acquisitions. Voxels were designated ashaving progressive (Type I) enhancement kinetics if SIslope was+10% or greater, plateau (Type II) if SIslope was between −10% and+10%, and washout (Type III) if SIslope was −10% or less. In order tominimize anomalies from spurious signal intensity fluctuations overthe course of a dynamic contrast run, the entire time–signal intensitycurve for each voxel was smoothed by a moving average filter oflength three before entering into the enhancement kinetics analysis.
2.5. Statistical analysis
A non-parametric Spearman rank correlation analysis was usedto estimate the correlation between the two radiologists withrespect to observed imaging parameters. Logistic regression analysiswas then performed in two steps. First, as a preliminary step to selectcovariates, a Mann–Whitney U test was employed to examine themedian difference of continuous variables (e.g., size measurements)between pathological responders and non-responders, and a Fisher'sexact test was used to determine the association between categoricalvariables (e.g., perceived enhancement) and pathological responseor non-response. For variables found to discriminate patients with apCR at a p-value of less than or equal to 0.05, receiver operatingcharacteristic (ROC) analysis was then performed using a logisticregression model. 95% confidence intervals for the area under thecurve (AUC) were generated based on 2000 bootstrap samples. Alldata were analyzed using publicly available R version 2.11.0statistical software.
3. Results
3.1. Patient characteristics and pathological response
A total of 21 patients completed the study. Table 1 presents anoverview of patient and tumor characteristics. Patients underwentpost-cycle 1 scanning at a median of 14 days following baselineimaging (range: 7–28 days). At pathological analysis, 9 patientswere classified as having achieved a pCR. Table 2 provides asummary of tumor type, scan timing, and pathological response forall patients.
3.2. Interobserver variability
The non-parametric Spearman rank correlation analysis demon-strated statistically significant correlation between both radiologistsfor all continuous variable measurements with exception of short-axis lesion diameter during initial phase of enhancement (ρ forshort-axis lesion diameter during initial phase of enhancement =0.33, p = 0.14; mean ρ for all other measurements = 0.77,median = 0.75, p = 0.00–0.02). The correlation between the tworadiologists was deemed sufficient to allow observations from bothradiologists to be averaged together for all subsequent analyses.
Please cite this article as: Abramson RG, et al, Early assessment of breast cancer response to neoadjuvant chemotherapy by semi-quantitative analysis of high-temporal resolution D..., Magn Reson Imaging (2013), http://dx.doi.org/10.1016/j.mri.2013.07.002
3.3. Imaging parameter measurements and predictive ability
3.3.1. Pretreatment parametersNo pretreatment imaging parameters were able to discriminate
patients with an eventual pCR (p = 0.22–1.00) (Table 3).
3.3.2. Percentage change in parameters after first cycleof chemotherapy
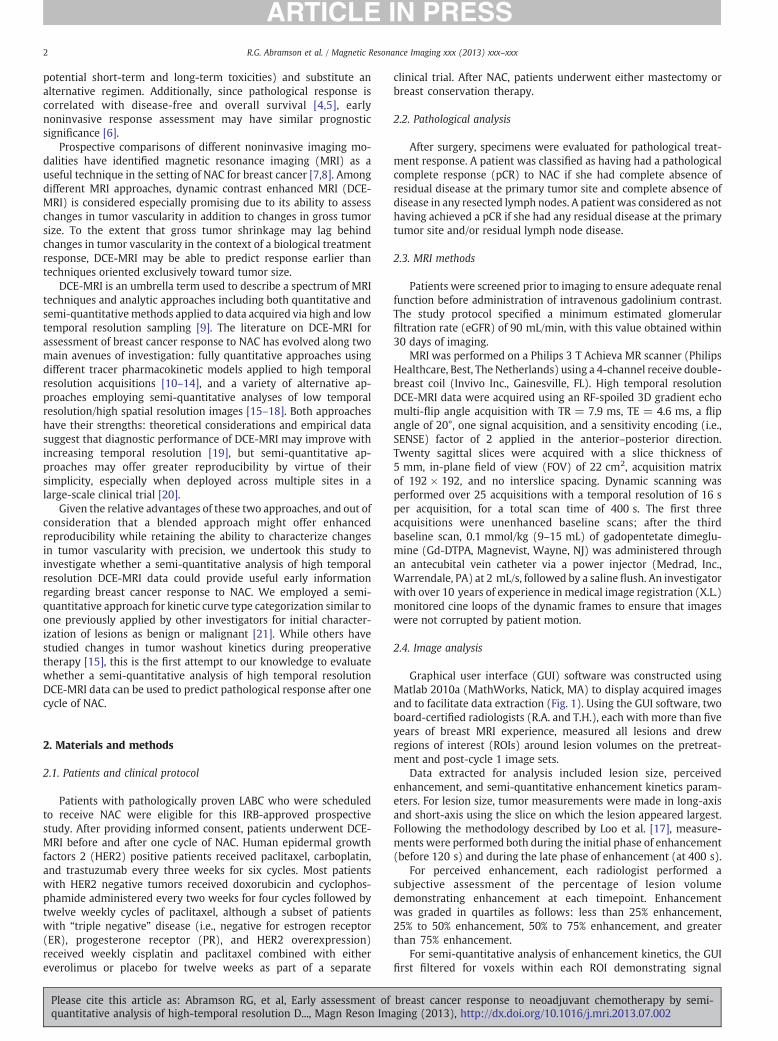
Change in percentage of voxels demonstrating washout kineticswith a ≥100% enhancement threshold filter discriminated patientswith an eventual pCR (p = 0.04) (Table 4). ROC analysis for thisvariable yielded an AUC of 0.77 (95% confidence interval, [0.53,0.96]) (Fig. 2). Accuracy was maximized at a cutoff of 64% decreasefrom baseline in percentage of voxels demonstrating washoutkinetics; at this value, sensitivity was 100% and specificity was66.67% for predicting pCR.
No other parameter change demonstrated statistically significant
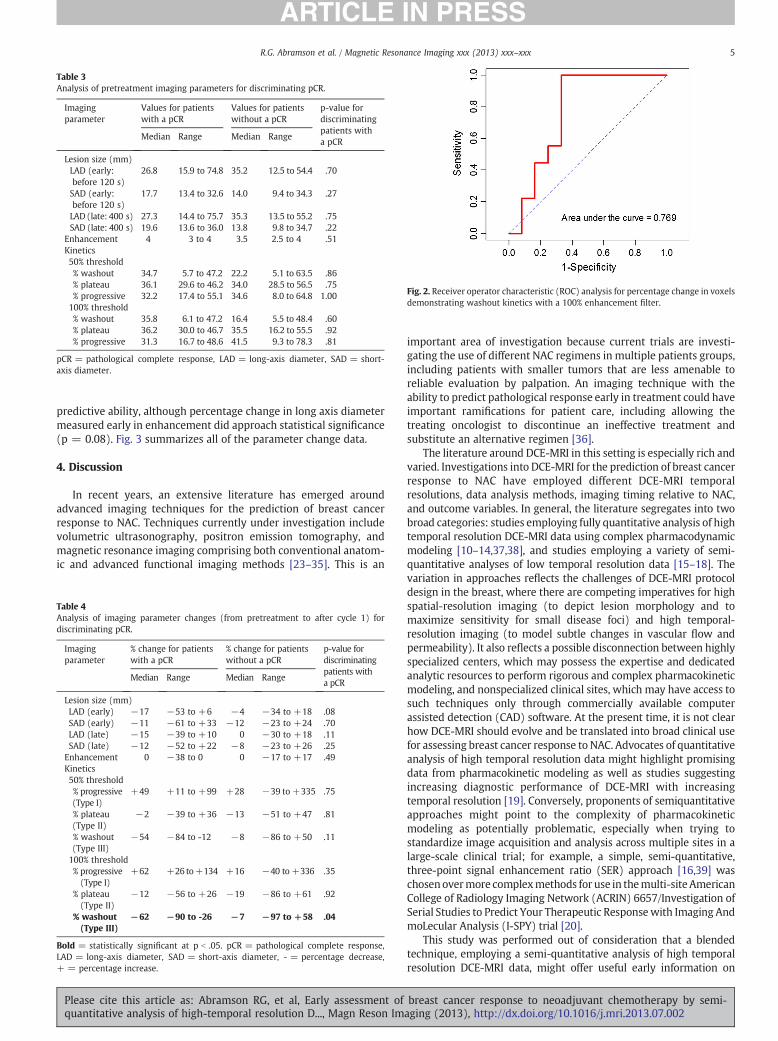
Table 4Analysis of imaging parameter changes (from pretreatment to after cycle 1) fodiscriminating pCR.
Imagingparameter
% change for patientswith a pCR
% change for patientswithout a pCR
p-value fordiscriminatingpatients witha pCR
Median Range Median Range
Lesion size (mm)LAD (early) −17 −53 to +6 −4 −34 to +18 .08SAD (early) −11 −61 to +33 −12 −23 to +24 .70LAD (late) −15 −39 to +10 0 −30 to +18 .11SAD (late) −12 −52 to +22 −8 −23 to +26 .25
Enhancement 0 −38 to 0 0 −17 to +17 .49Kinetics50% threshold% progressive(Type I)
+49 +11 to +99 +28 −39 to +335 .75
% plateau(Type II)
−2 −39 to +36 −13 −51 to +47 .81
% washout(Type III)
−54 −84 to -12 −8 −86 to +50 .11
100% threshold% progressive(Type I)
+62 +26 to+134 +16 −40 to +336 .35
% plateau(Type II)
−12 −56 to +26 −19 −86 to +61 .92
% washout(Type III)
−62 −90 to -26 −7 −97 to +58 .04
Bold = statistically significant at p b .05. pCR = pathological complete responseLAD = long-axis diameter, SAD = short-axis diameter, - = percentage decrease+ = percentage increase.
Fig. 2. Receiver operator characteristic (ROC) analysis for percentage change in voxelsdemonstrating washout kinetics with a 100% enhancement filter.
Table 3Analysis of pretreatment imaging parameters for discriminating pCR.
Imagingparameter
Values for patientswith a pCR
Values for patientswithout a pCR
p-value fordiscriminatingpatients witha pCR
Median Range Median Range
Lesion size (mm)LAD (early:before 120 s)
26.8 15.9 to 74.8 35.2 12.5 to 54.4 .70
SAD (early:before 120 s)
17.7 13.4 to 32.6 14.0 9.4 to 34.3 .27
LAD (late: 400 s) 27.3 14.4 to 75.7 35.3 13.5 to 55.2 .75SAD (late: 400 s) 19.6 13.6 to 36.0 13.8 9.8 to 34.7 .22
Enhancement 4 3 to 4 3.5 2.5 to 4 .51Kinetics50% threshold% washout 34.7 5.7 to 47.2 22.2 5.1 to 63.5 .86% plateau 36.1 29.6 to 46.2 34.0 28.5 to 56.5 .75% progressive 32.2 17.4 to 55.1 34.6 8.0 to 64.8 1.00100% threshold% washout 35.8 6.1 to 47.2 16.4 5.5 to 48.4 .60% plateau 36.2 30.0 to 46.7 35.5 16.2 to 55.5 .92% progressive 31.3 16.7 to 48.6 41.5 9.3 to 78.3 .81
pCR = pathological complete response, LAD = long-axis diameter, SAD = shortaxis diameter.
5R.G. Abramson et al. / Magnetic Resonance Imaging xxx (2013) xxx–xxx
Please cite this article as: Abramson RG, et al, Early assessmenquantitative analysis of high-temporal resolution D..., Magn Reso
-
predictive ability, although percentage change in long axis diametermeasured early in enhancement did approach statistical significance(p = 0.08). Fig. 3 summarizes all of the parameter change data.
4. Discussion
In recent years, an extensive literature has emerged aroundadvanced imaging techniques for the prediction of breast cancerresponse to NAC. Techniques currently under investigation includevolumetric ultrasonography, positron emission tomography, andmagnetic resonance imaging comprising both conventional anatom-ic and advanced functional imaging methods [23–35]. This is an
r
,,
t of breast cancer response to neoadjuvant chemotherapy by semi-n Imaging (2013), http://dx.doi.org/10.1016/j.mri.2013.07.002
important area of investigation because current trials are investi-gating the use of different NAC regimens in multiple patients groups,including patients with smaller tumors that are less amenable toreliable evaluation by palpation. An imaging technique with theability to predict pathological response early in treatment could haveimportant ramifications for patient care, including allowing thetreating oncologist to discontinue an ineffective treatment andsubstitute an alternative regimen [36].
The literature around DCE-MRI in this setting is especially rich andvaried. Investigations into DCE-MRI for the prediction of breast cancerresponse to NAC have employed different DCE-MRI temporalresolutions, data analysis methods, imaging timing relative to NAC,and outcome variables. In general, the literature segregates into twobroad categories: studies employing fully quantitative analysis of hightemporal resolution DCE-MRI data using complex pharmacodynamicmodeling [10–14,37,38], and studies employing a variety of semi-quantitative analyses of low temporal resolution data [15–18]. Thevariation in approaches reflects the challenges of DCE-MRI protocoldesign in the breast, where there are competing imperatives for highspatial-resolution imaging (to depict lesion morphology and tomaximize sensitivity for small disease foci) and high temporal-resolution imaging (to model subtle changes in vascular flow andpermeability). It also reflects a possible disconnection between highlyspecialized centers, which may possess the expertise and dedicatedanalytic resources to perform rigorous and complex pharmacokineticmodeling, and nonspecialized clinical sites, which may have access tosuch techniques only through commercially available computerassisted detection (CAD) software. At the present time, it is not clearhow DCE-MRI should evolve and be translated into broad clinical usefor assessing breast cancer response to NAC. Advocates of quantitativeanalysis of high temporal resolution data might highlight promisingdata from pharmacokinetic modeling as well as studies suggestingincreasing diagnostic performance of DCE-MRI with increasingtemporal resolution [19]. Conversely, proponents of semiquantitativeapproaches might point to the complexity of pharmacokineticmodeling as potentially problematic, especially when trying tostandardize image acquisition and analysis across multiple sites in alarge-scale clinical trial; for example, a simple, semi-quantitative,three-point signal enhancement ratio (SER) approach [16,39] waschosenovermore complexmethods for use in themulti-siteAmericanCollege of Radiology Imaging Network (ACRIN) 6657/Investigation ofSerial Studies to Predict Your Therapeutic Responsewith Imaging AndmoLecular Analysis (I-SPY) trial [20].
This study was performed out of consideration that a blendedtechnique, employing a semi-quantitative analysis of high temporalresolution DCE-MRI data, might offer useful early information on

Fig 3. Box plots illustrating percentage changes from baseline to post-cycle 1 for all imaging parameters, stratified by pathological response. (A) Lesion size, long axis, early inenhancement. (B) Lesion size, short axis, early in enhancement. (C) Lesion size, long axis, late in enhancement. (D) Lesions size, short axis, late in enhancement. (E) Radiologists'subjective assessment of lesion enhancement, graded in quartiles (see text). (F) Percentage of voxels exhibiting progressive (Type I) enhancement kinetics with a ≥50%enhancement filter. (G) Percentage of voxels exhibiting plateau (Type II) kinetics with a≥50% enhancement filter. (H) Percentage of voxels exhibiting washout (Type III) kineticswith a ≥50% enhancement filter. (I) Percentage of voxels exhibiting progressive (Type I) kinetics with a ≥100% enhancement filter. (J) Percentage of voxels exhibiting plateau(Type II) kinetics with a ≥100% enhancement filter. (K) Percentage of voxels exhibiting washout (Type III) kinetics with a ≥100% enhancement filter. pCR = pathologicalcomplete response.
6 R.G. Abramson et al. / Magnetic Resonance Imaging xxx (2013) xxx–xxx
breast cancer response to NAC.We adapted a straightforwardmethodused previously by other investigators [21] to categorize individualvoxels as having progressive (Type I), plateau (Type II), or washout(Type III) enhancement kinetic curves, andwe found that after a singlecycle of NAC, a reduction in the percentage of voxels demonstratingwashout (Type III) kinetics with a ≥100% enhancement filter wassignificantly associated with pCR. Our AUC of 0.77 for this singlepredictor variable compares favorably with the AUC of 0.73 found inthe ACRIN/I-SPY trial for a four-predictor variable model [20]. Otherimaging parameters in our study, including lesion size measurement
Please cite this article as: Abramson RG, et al, Early assessment ofquantitative analysis of high-temporal resolution D..., Magn Reson Im
and subjective assessment of lesion enhancement, did not discrimi-nate between pathological responders and non-responders.
Fig. 1 illustrates imaging results for a patient who achieved a pCR. Inthis example, there was a subjectively appreciable decrease after onecycle ofNAC in theproportionof intralesional voxels exhibitingwashoutkinetics (coded red), although the lesion itself had not changedsignificantly in size. At the completion of NAC, however, the lesionhad disappeared. The findings suggest that in this patient, a biologicaltreatment response manifested as a change in tumor vascularity thatwas detectable earlier than a change in gross tumor size.
breast cancer response to neoadjuvant chemotherapy by semi-aging (2013), http://dx.doi.org/10.1016/j.mri.2013.07.002
7R.G. Abramson et al. / Magnetic Resonance Imaging xxx (2013) xxx–xxx
There are a number of potential advantages to our approach. First,the technique is simple and requires significantly less effort,resources, and expertise than a formal quantitative analysis.Traditional quantitative DCE-MRI analysis typically requires a pre-contrast T1 map, accurate estimation of the arterial input function(i.e., the time rate of change of the concentration of contrast agent ina feeding artery), and pharmacokinetic modeling; none of those dataor analyses was employed to arrive at the results presented here.Second, by virtue of its simplicity, this method may be more robustto variations in scanner settings, platforms, and imaging protocols,especially when deployed across multiple sites in a large-scaleclinical trial, although this would have to be proved systematically.Third, a voxelwise analysis may offer the advantage of improveddepiction of tumoral heterogeneity when compared to some othersemiquantitative approaches that average parameter values acrossan entire lesion ROI.
We emphasize that this is a preliminary study with severallimitations owing to our small sample size. First, our studypopulation was heterogeneous, including patients with differentbreast tumor subtypes and different treatment regimens that alsoaffected scan timing; our sample size was not large enough toperform subanalyses on response prediction performance withinthese subgroups. Second, our study was not powered to allow forcomparison of our semi-quantitative technique against a fullyquantitative pharmacodynamic modeling analysis, and we thereforemake no claim that one technique is superior to the other. Third,although reduction in the percentage of voxels demonstratingwashout kinetics was able to discriminate patients with pCR frompatients without pCR, there remained some overlap between thetwo groups; indeed, we note that the greatest percentage decrease inintralesional washout voxels was observed in a patient who did notachieve a pCR (Fig. 3), a finding that will require an explanationbefore this approach can be considered ready for clinical translation.We anticipate the results of the present study being most useful formotivating other investigators to conduct retrospective analysis ofsimilar datasets and for guiding future studies.
In conclusion, we have shown that semi-quantitative analysis ofenhancement kinetics data from a high temporal resolution DCE-MRI acquisition can predict pathological response of LABC after onecycle of NAC. Our results demonstrate the feasibility of incorporatinga relatively simple semi-quantitative DCE-MRI analysis for earlyresponse assessment in settings that lack the expertise and resourcesfor dedicated, formal quantitative analysis. These results suggest thatimportant early treatment response information can be obtainedfrom high temporal resolution DCE-MRI without the use of rigorouspharmacokinetic modeling.
Acknowledgments
We thank John Huff, M.D., and Yu Shyr, Ph.D., for their invaluableinsights and guidance. We also thank Donna Butler, Leslie McIntosh,and Sandeep Bhave for their expert technical assistance. This projectwas supported by the following research grants from the NationalInstitutes of Health (NIH): NCI 1R01CA129961, NCI 1P50 098131,NIH P30 CA68485, and NCI 1U01CA142565. We thank the KlebergFoundation for generous support of the molecular imaging programat our Institution.
References
[1] Kaufmann M, von Minckwitz G, Bear HD, et al. Recommendations from aninternational expert panel on the use of neoadjuvant (primary) systemictreatment of operable breast cancer: new perspectives 2006. Ann Oncol2007;18:1927–34.
[2] Mauri D, Pavlidis N, Ioannidis JP. Neoadjuvant versus adjuvant systemictreatment in breast cancer: a meta-analysis. J Natl Cancer Inst 2005;97:188–94.
Please cite this article as: Abramson RG, et al, Early assessment ofquantitative analysis of high-temporal resolution D..., Magn Reson Im
[3] Fisher B, Bryant J, Wolmark N, et al. Effect of preoperative chemotherapy on theoutcome of women with operable breast cancer. J Clin Oncol 1998;16:2672–85.
[4] Chollet P, Amat S, Cure H, et al. Prognostic significance of a complete pathologicalresponse after induction chemotherapy in operable breast cancer. Br J Cancer2002;86:1041–6.
[5] Wolff AC, Berry D, Carey LA, et al. Research issues affecting preoperative systemictherapy for operable breast cancer. J Clin Oncol 2008;26:806–13.
[6] Li SP, Makris A, Beresford MJ, et al. Use of dynamic contrast-enhanced MRimaging to predict survival in patients with primary breast cancer undergoingneoadjuvant chemotherapy. Radiology 2011;260:68–78.
[7] Londero V, Bazzocchi M, Del Frate C, et al. Locally advanced breast cancer:comparison of mammography, sonography and MR imaging in evaluation ofresidual disease in women receiving neoadjuvant chemotherapy. Eur Radiol2004;14:1371–9.
[8] Yeh E, Slanetz P, Kopans DB, et al. Prospective comparison of mammography,sonography, and MRI in patients undergoing neoadjuvant chemotherapy forpalpable breast cancer. AJR Am J Roentgenol 2005;184:868–77.
[9] Yankeelov TE, Gore JC. Dynamic contrast enhanced magnetic resonance imagingin oncology: theory, data acquisition, analysis, and examples. Curr Med ImagingRev 2009;3:91–107.
[10] Ah-See ML, Makris A, Taylor NJ, et al. Early changes in functional dynamicmagnetic resonance imaging predict for pathologic response to neoadjuvantchemotherapy in primary breast cancer. Clin Cancer Res 2008;14:6580–9.
[11] Manton DJ, Chaturvedi A, Hubbard A, et al. Neoadjuvant chemotherapy in breastcancer: early response prediction with quantitative MR imaging and spectros-copy. Br J Cancer 2006;94:427–35.
[12] Padhani AR, Hayes C, Assersohn L, et al. Prediction of clinicopathologic responseof breast cancer to primary chemotherapy at contrast-enhanced MR imaging:initial clinical results. Radiology 2006;239:361–74.
[13] Pickles MD, Lowry M, Manton DJ, Gibbs P, Turnbull LW. Role of dynamic contrastenhanced MRI in monitoring early response of locally advanced breast cancer toneoadjuvant chemotherapy. Breast Cancer Res Treat 2005;91:1–10.
[14] Wasser K, Klein SK, Fink C, et al. Evaluation of neoadjuvant chemotherapeuticresponse of breast cancer using dynamic MRI with high temporal resolution. EurRadiol 2003;13:80–7.
[15] El Khoury C, Servois V, Thibault F, et al. MR quantification of the washoutchanges in breast tumors under preoperative chemotherapy: feasibility andpreliminary results. AJR Am J Roentgenol 2005;184:1499–504.
[16] Hylton N. Dynamic contrast-enhanced magnetic resonance imaging as animaging biomarker. J Clin Oncol 2006;24:3293–8.
[17] Loo CE, Teertstra HJ, Rodenhuis S, et al. Dynamic contrast-enhanced MRI forprediction of breast cancer response to neoadjuvant chemotherapy: initialresults. AJR Am J Roentgenol 2008;191:1331–8.
[18] Martincich L, Montemurro F, De Rosa G, et al. Monitoring response to primarychemotherapy in breast cancer using dynamic contrast-enhanced magneticresonance imaging. Breast Cancer Res Treat 2004;83:67–76.
[19] El Khouli RH,MacuraKJ, Barker PB,HabbaMR, JacobsMA,BluemkeDA. Relationshipof temporal resolution to diagnostic performance for dynamic contrast enhancedMRI of the breast. J Magn Reson Imaging: JMRI 2009;30:999–1004.
[20] Hylton NM, Blume JD, Bernreuter WK, et al. Locally advanced breast cancer: MRimaging for prediction of response to neoadjuvant chemotherapy—results fromACRIN 6657/I-SPY Trial. Radiology 2012;263:663–72.
[21] El Khouli RH, Macura KJ, Jacobs MA, et al. Dynamic contrast-enhanced MRI of thebreast: quantitative method for kinetic curve type assessment. AJR Am JRoentgenol 2009;193:W295–300.
[22] Macura KJ, Ouwerkerk R, Jacobs MA, Bluemke DA. Patterns of enhancement onbreast MR images: interpretation and imaging pitfalls. Radiographics 2006;26:1719–34.
[23] Baek HM, Chen JH, Nie K, et al. Predicting pathologic response to neoadjuvantchemotherapy in breast cancer by using MR imaging and quantitative 1H MRspectroscopy. Radiology 2009;251:653–62.
[24] Chen X, Moore MO, Lehman CD, et al. Combined use of MRI and PET to monitorresponse and assess residual disease for locally advanced breast cancer treatedwith neoadjuvant chemotherapy. Acad Radiol 2004;11:1115–24.
[25] Gounaris I, Provenzano E, Vallier AL, et al. Accuracy of unidimensional andvolumetric ultrasound measurements in predicting good pathological responseto neoadjuvant chemotherapy in breast cancer patients. Breast Cancer Res Treat2011;127:459–69.
[26] Jacobs MA, Ouwerkerk R, Wolff AC, et al. Monitoring of neoadjuvantchemotherapy using multiparametric, (2)(3)Na sodium MR, and multimodality(PET/CT/MRI) imaging in locally advanced breast cancer. Breast Cancer Res Treat2011;128:119–26.
[27] Jacobs MA, Stearns V, Wolff AC, et al. Multiparametric magnetic resonanceimaging, spectroscopy and multinuclear ((2)(3)Na) imaging monitoring ofpreoperative chemotherapy for locally advanced breast cancer. Acad Radiol2010;17:1477–85.
[28] Keam B, Im SA, Koh Y, et al. Early metabolic response using FDG PET/CT andmolecular phenotypes of breast cancer treated with neoadjuvant chemotherapy.BMC Cancer 2011;11:452.
[29] Kolesnikov-Gauthier H, Vanlemmens L, Baranzelli MC, et al. Predictive value ofneoadjuvant chemotherapy failure in breast cancer using FDG-PET after the firstcourse. Breast Cancer Res Treat 2012;131:517–25.
[30] Meisamy S, Bolan PJ, Baker EH, et al. Neoadjuvant chemotherapy of locallyadvanced breast cancer: predicting response with in vivo (1)H MR spectroscopy—a pilot study at 4 T. Radiology 2004;233:424–31.
breast cancer response to neoadjuvant chemotherapy by semi-aging (2013), http://dx.doi.org/10.1016/j.mri.2013.07.002

8 R.G. Abramson et al. / Magnetic Resonance Imaging xxx (2013) xxx–xxx
[31] Park SH, Moon WK, Cho N, et al. Diffusion-weighted MR imaging: pretreatmentprediction of response to neoadjuvant chemotherapy in patients with breastcancer. Radiology 2010;257:56–63.
[32] Partridge SC, Gibbs JE, Lu Y, Esserman LJ, Sudilovsky D, Hylton NM. Accuracyof MR imaging for revealing residual breast cancer in patients who haveundergone neoadjuvant chemotherapy. AJR Am J Roentgenol 2002;179:1193–9.
[33] Partridge SC, Gibbs JE, Lu Y, et al. MRI measurements of breast tumor volumepredict response to neoadjuvant chemotherapy and recurrence-free survival.AJR Am J Roentgenol 2005;184:1774–81.
[34] Sharma U, Danishad KK, Seenu V, Jagannathan NR. Longitudinal study of theassessment by MRI and diffusion-weighted imaging of tumor response inpatients with locally advanced breast cancer undergoing neoadjuvant chemo-therapy. NMR Biomed 2009;22:104–13.
[35] Tateishi U, Miyake M, Nagaoka T, et al. Neoadjuvant chemotherapy in breastcancer: prediction of pathologic response with PET/CT and dynamic
Please cite this article as: Abramson RG, et al, Early assessment ofquantitative analysis of high-temporal resolution D..., Magn Reson Im
contrast-enhanced MR imaging—prospective assessment. Radiology 2012;263:53–63.
[36] Abramson RG, Arlinghaus LR, Weis JA, et al. Current and emerging quantitativemagnetic resonance imaging methods for assessing and predicting the responseof breast cancer to neoadjuvant therapy. Breast cancer: targets and therapy2012;2012:139–54.
[37] Yu HJ, Chen JH, Mehta RS, Nalcioglu O, Su MY. MRI measurements of tumor sizeand pharmacokinetic parameters as early predictors of response in breast cancerpatients undergoing neoadjuvant anthracycline chemotherapy. J Magn ResonImaging 2007;26:615–23.
[38] Yu Y, Jiang Q, Miao Y, et al. Quantitative analysis of clinical dynamic contrast-enhanced MR imaging for evaluating treatment response in human breastcancer. Radiology 2010;257:47–55.
[39] Li KL, Partridge SC, Joe BN, et al. Invasive breast cancer: predicting diseaserecurrence by using high-spatial-resolution signal enhancement ratio imaging.Radiology 2008;248:79–87.
breast cancer response to neoadjuvant chemotherapy by semi-aging (2013), http://dx.doi.org/10.1016/j.mri.2013.07.002