MAERSK - THE NEW DIRECTION
80
MAERSK - THE NEW DIRECTION A.P. Moller - Maersk Capital Markets Day, 13 December 2016
Transcript of MAERSK - THE NEW DIRECTION

MAERSK - THE NEW DIRECTION A.P. Moller - Maersk Capital Markets Day, 13 December 2016

THE NEW DIRECTION
Søren Skou Chief Executive Officer
page 2

On 22nd September we announced the future Maersk: a strong container shipping, logistics and ports company
Transport & Logistics
The Maersk Line brand includes Safmarine, Seago Line, SeaLand, Mercosul Line and MCC Transport
Energy
• Managed and operated as individual business units
• More focused and structurally agile strategies to optimise value
• Intent to separate out of A.P. Møller - Mærsk A/S, creating value for shareholders in the process
• Managed and operated as an integrated company
• A one company structure with multiple brands
• Growing topline, earnings for our owners, and opportunities for our people
page 3

Two weeks ago we took the first step in realising this ambition
Hamburg Süd is a rare opportunity: A quality company with a willing seller
• In line with communicated consolidation ambition for Maersk Transport and Logistics
• Cement Maersk Line’s global leadership position and deliver growth to APM Terminals
• Build a strongly competitive platform in Latin America with dual branding similar to our position in Africa
• Create an unmatched product with a unique customer value proposition in Latin America, Oceania and Reefer segment
• Significant cost synergies by combining networks
Disclaimer: The proposed acquisition of Hamburg Süd is subject to regulatory approvals and due diligence
page 4

Energy is 25% of Group revenues – we plan to replace with organic and inorganic growth in Transport & Logistics
Maersk Group revenue and invested capital split (2015 FY)
33%
75% Revenue
25% Revenue
Invested capital
67% Invested capital
Energy Transport & Logistics
Hamburg Süd revenue
+15%
Note: Hamburg Süd revenue is 15% of the whole (i.e. 15pp on top of the 75% Transport and Logistics revenue). Disclaimer: The proposed acquisition of Hamburg Süd is subject to regulatory approvals and due diligence
page 5

Transport & Logistics
Our unique position in Transport & Logistics gives us a solid starting point to build on
Revenue, (USDbn) 23.7 4.2 2.7 0.7 0.7 32.1
Invested Capital, (USDbn) 20.1 6.0 0.2 1.1 0.4 27.8
Employees, (FTE) 29,500 22,000 10,800 4,000 5,300 71,600
Offices/countries, (#) 382/130 212/69 224/100+ 53/40+ 5/3 898/131 Key assets, (#) 620 vessels 72 terminals n/a 430 tugs 3 factories n/a
Note: Financial figures are for 2015. Total revenue is not adjusted for inter-company eliminations
The world’s biggest carrier, active in both global and intra-regional trades
Second to none refrigeration technology
Outstanding capabilities in Supply Chain Management and solid freight forwarding experience
Excellent port services
The world’s 4th largest container terminal operator with strong Africa, Latin America and East-West hub presence
page 6

Profitability is volatile with an average of 7% over the cycle, but we lack revenue growth
Revenue, (USDbn) ROIC, (%)
Note: Excludes inter-company eliminations and non-allocated overhead costs
ROIC Average
0%
4%
8%
12%
16%
2010 2011 2012 2013 2014 2015 2016Q1-Q3
33 35 36 35 36 32
21
0
5
10
15
20
25
30
35
40
2010 2011 2012 2013 2014 2015 2016Q1-Q3
page 7

Integrating also unlocks more immediate synergies across our brands - raising returns
Improved inland services
Optimised hub operations
Joint production planning
Cross-selling Increased terminal utilisation
Maersk Line
APM Terminals
Damco
Maersk Line
APM Terminals
Maersk Line
Maersk Container Industry
Maersk Line
APM Terminals
Damco
Svitzer
Maersk Line
APM Terminals
page 8

Maersk: The global integrator of container logistics…
Global integrator of container logistics - connecting and simplifying the global
supply chain
page 9

…providing global supply chain solutions with a great customer experience
Providing simple solutions to our
customers’ complex supply chain needs
Elevating the customer experience through
digital innovation
Offering the industry’s most competitive
container transport network to every market
in the world
page 10

01 02 03 04 Market is big and growing
Liner industry is changing and we will benefit
Low CAPEX need going forward
Industry is digitising – we are well positioned
impact the industries we operate in
FOUR FUNDAMENTALS
page 11

The transportation and logistics markets are big and growing
100
50
60
190
100
180
245
40
+900 Total
2PL Warehousing
Container Shipping
Air Cargo
Containerized intermodal
Container terminal and coastal storage
Contract logistics
4PL and supply chain services
Traditional Freight Forwarding
Revenue (USDbn, 2014)
Expected industry growth (’14 - ’20)
Note: Total industry growth is weighted average by revenue Source: Transport Intelligence; Armstrong & Associates; Clarksons; World Bank ; IBIS World; IPC Research; Statista
3/4PL
Growth above global GDP growth Growth in line with global GDP growth Growth below global GDP growth
01 Market is big and growing | page 12

The liner industry is consolidating and top 5 share is growing
Consolidation wave is rolling again – 8 top 20 players disappeared in last 2 years
Wave 1
Wave 2
96 98 00 02 04 06 08 10 12 14 16 18 Wave 3
31% 27% 36% 43% 45% 57%
Announced, not closed top-5 market share
Disclaimer: The proposed acquisition of Hamburg Süd is subject to regulatory approvals and due diligenceNote: Long haul trades defined as non-intra-regional trades. Source: Alphaline
02 Changing industry |
53% 66% top-5 market share longhaul trades
page 13

Industry capacity (TEUm)
Note: 1) Assuming that all vessels of 25+ years of age are scrapped by 2025 2) Assumes constant utilisation and 3% p.a. headhaul demand growth Source: Maersk Line, Alphaliner
Current capacity is sufficient to satisfy industry demand in the foreseeable future
03 Low CAPEX need |
19
2
3
24
1
23 22
0
5
10
15
20
25
Deployed capacity Idle Orderbook Nominal capacityincluding orderbook
Scrapping 2022availablecapacity
2022requiredcapacity
1
2
page 14

Also in the terminal industry overcapacity is emerging
8.5%
4.4% 3.9% 5.1%
1.0% 1.8% 2.5%
7.9%
5.0%
2.4%
5.5%
0.9%
4.2%
3.4%
0%
2%
4%
6%
8%
10%
2011 2012 2013 2014 2015 2016E 2017E
Global terminal demand Global terminal capacity
Note: (1) Measured as total port throughput and capacity in TEU incl. empties and transshipments Source: Drewry
Growth, (y/y, %)1
page 15

Digital is changing the industry to the benefit of customers – and we are ready for it
Digitisation is changing the industry… …and we are embarking on the digital journey from a strong position
Customer experience will change
Lower cost to serve
Digital will drive asset productivity
Demarcation lines between industry participants will
change
We have customers, volumes, and brands
We have already invested heavily in digitising our foundation
We are investing in new digital products
We own the data generators – the foundation for digitisation
04 Digitisation | page 16

All of our Transport & Logistics businesses share four strategic “blades” that propel us forward
Growth • Organic • Inorganic • Cross-selling • New products
Great customer experience • Leverage insights across
our businesses • Superior products • Digital interfaces
Cost leadership • In everything we do • In all our businesses • “Lowest cost, lower every
year” culture • Exploit synergies
Competitive pricing • Providing value to our
customers • Enabled by cost leadership
and low cost to serve
page 17

We have set a strong management team to deliver on the strategy
Chief Executive Officer Søren Skou
Chief Executive Officer APM Terminals
(Chairman of Svitzer) Morten Engelstoft
Chief Commercial Officer Maersk Line
(Chairman of Damco) Vincent Clerc
Chief Operating Officer Maersk Line
(Chairman of Maersk Container Industry)
Søren Toft
Chief Human Resource Officer Ulf Hahnemann
General Counsel and Head of Corporate Affairs
Caroline Pontoppidan
Chief Financial, Strategy & Transformation Officer
Jakob Stausholm
page 18

Maersk: The global integrator of container logistics
Providing simple solutions to our customers’ complex supply chain needs
Elevating the customer experience through digital innovation Global integrator of container logistics
- connecting and simplifying the global supply chain
Extending the industry’s most effective and efficient delivery network to every
market in the world
page 19

CUSTOMER EXPERIENCE & GROWTH
Vincent Clerc Chief Commercial Officer Maersk Line
page 20

Unlock growth from better
CUSTOMER EXPERIENCE
In recent years, price has dominated the customer decision…
…digitisation and integrated solutions are game-changers to bring quality back into the equation…
…Maersk is uniquely positioned to increase the quality of the customer experience – a central element to unlock growth
page 21

The customer experience is central to our strategy
Growth
Great customer experience
Cost leadership
Competitive pricing
page 22

We are in a strong position to meet customer needs with digitisation and Transport & Logistics solutions
• Reliability
• Network coverage
• Financial stability
• Documentation
• Visibility
• Accessibility
• Integrated offerings
• New logistics services
• Digital services
All customers
Flow of goods Flow of information Extended solutions
Some customers
Traditionally served by carriers
Traditionally served by freight forwarders
To be served by Maersk
Will be transformed by digitisation
page 23

With our portfolio of digital initiatives, we continue to take the customer experience to new levels
Online documentation
Instant quotes and booking confirmation
New digital services
Track and trace
Documentation Visibility Accessibility Digital services
page 24
With Transport & Logistics we are able to vastly improve the customer offering
Innovation Expand product exposure
Coordinated chain of delivery
Tailor-made solutions
Reliability New logistics services Integrated offerings
page 25

Integrated offerings combine Damco’s product range and Maersk Line’s large customer base
We will improve customer retention from capabilities in tailoring solutions and building strategic partnerships
We will achieve higher share of wallet from attracting more of customers’ total logistics spend e.g., via Damco’s supply chain solutions
12% of Maersk Line volume is today sold with inland service on top
Customs House Brokerage
Cargo Insurance
Supply Chain solutions
Inland transport
page 26

Damco is building on positive traction
…and continues to strengthen the position through a number of focus areas
Damco has stabilised after a difficult time…
• Stronger and expanded Supply Chain Solutions core business within selected verticals
• Innovation of product offerings
• Development of e-commerce solutions
• Cross-selling synergies with Maersk Line
• Automation of processes
01002003004005006007008009001,000
-160
-120
-80
-40
0
40
20
12
Q1
20
12
Q2
20
12
Q3
20
12
Q4
20
13
Q1
20
13
Q2
20
13
Q3
20
13
Q4
20
14
Q1
20
14
Q2
20
14
Q3
20
14
Q4
20
15
Q1
20
15
Q2
20
15
Q3
20
15
Q4
20
16
Q1
20
16
Q2
20
16
Q3
Underlying result Revenue
Revenue (USDm) Underlying result1 (USDm)
Note: (1) The 2012 figures are excluding tax effect on one-offs Source: Maersk
page 27

To translate better customer experience into growth, we continue to build a strong commercial foundation…
Strengthen sales capabilities
More focused frontline organisation
Deepen customer understanding
Improved sales coverage
page 28

…which has enabled us to pick up Maersk Line’s organic volume growth – and we will take it further
…and we continue to expand our commercial agenda
0%
4%
8%
12%
16%
2010 2011 2012 2013 2014 2015 2016 YTD
Maersk Line volume growth (Y/Y)(%)
Industry volume growth (Y/Y)(%)
We have managed to grow volume beyond industry growth while maintaining our EBIT-margin gap…
4pp 5pp 4pp 8pp 9pp 6pp 9pp
Maersk Line EBIT-margin gap to peers (%-points)
Better customer retention
Take prices online
Note: Peer group includes CMA CGM, APL, Hapag Lloyd, Hanjin, ZIM, Hyundai MM, K Line, CSAV, OOCL, NYK, MOL, COSCO, CSCL Source: Maersk Line, company reports
page 29

Our acquisition of Hamburg Süd will drive growth and bring several benefits to our customers
The acquisition will drive growth…
Revenue (2015, USDbn)
Source: Maersk Line, Alphaliner, company reports Note: (1) Maersk Line Q3 2016 interim report, Hamburg Süd 2015 key figures (container ships). Disclaimer: The proposed acquisition of Hamburg Süd is subject to regulatory approvals and due diligence
Capacity1
(TEUm)
…and benefit customers in different ways
• Access to world’s largest network with more direct services
• Better prices for customers from efficiencies
• Strong customer proposition from dual brands
• Unique reefer offering by combining two of the largest players
Maersk Line
Hamburg Süd
~3
~0.6
~24
~6
page 30

We can only achieve our full growth potential when we continuously meet the customer needs
…while we actively grow the foundation of our business – the container volume
Digitisation
Transport & Logistics
Commercial foundation
Acquisitions
Taking growth to new levels depends on our ability to meet customer needs…
page 31

OPTIMISED NETWORK
Søren Toft Chief Operating Officer Maersk Line
Morten Engelstoft Chief Executive Officer APM Terminals
page 32

Enables price competiveness
Enables organic, profitable growth
Makes inorganic growth value creating
is the foundation for growing our business…
COST LEADERSHIP
page 33

…and Maersk Line continues significant cost reductions
Maersk Line unit cost, (USD/FFE) The cost toolbox
Network rationalisation
Speed equalisation & Slow steaming
Improve utilisation
SG&A 2M Improve procurement
Inland optimisation
Deployment of larger vessels
Retrofits 1,600
1,800
2,000
2,200
2,400
2,600
2,800
3,000
3,200
3,400
12
Q1
12
Q2
12
Q3
12
Q4
13
Q1
13
Q2
13
Q3
13
Q4
14
Q1
14
Q2
14
Q3
14
Q4
15
Q1
15
Q2
15
Q3
15
Q4
16
Q1
16
Q2
16
Q3
CAGR: -9%
CAGR: -5% LTM: -11%
At fixed bunker price (200 USD/mt) At floating bunker price
page 34

Asset utilisation in Maersk Line has improved
Vessel utilization, (%) Container turn, (ratio)
88%
93%
66% 70%
91%
71%
50%
60%
70%
80%
90%
100%
jan
-14
mar
-14
maj
-14
jul-
14
sep
-14
no
v-1
4
jan
-15
mar
-15
maj
-15
jul-
15
sep
-15
no
v-1
5
jan
-16
mar
-16
maj
-16
jul-
16
sep
-16
4.5 4.7
3.8 4.0
4.6
3.9
3.2
3.6
4.0
4.4
4.8
5.2
14
Q1
14
Q2
14
Q3
14
Q4
15
Q1
15
Q2
15
Q3
15
Q4
16
Q1
16
Q2
16
Q3
Headhaul bottleneck Roundtrip Yearly averages Dry Reefer Yearly averages
Volume: +8% (y/y)
Note: Container turn is average number of times a container is shipped full per year (quarterly data annualised), volume, deployed capacity, invested capital are 16Q3 vs. 15Q3
Deployed capacity: +4% (y/y) Invested capital: -2% (y/y)
page 35

Maersk Line’s large proportion of short duration charter contracts enables capacity flexibility
Industry capacity split by owner type (%) Charter contract durations (TEUm)
4.9 4.9
1.3
0
1
2
3
4
5
6
7
> 12 monthcontract
< 12 monthcontract
Source: Alphaliner, Internal estimates
45% Operator owned
(carrier)
55% Non-operator owned (charter company)
0.8 0.6 0
1
2
3
4
5
6
7
< 12 monthcontract
> 12 monthcontract
Industry Maersk Line
Idle Chartered
page 36

Scale
To lead and remain competitive requires new levers across Maersk
Hub operations Digital assets Joint planning
Connected vessel Intelligent containers
Hamburg Süd Maersk Container Industry
APM Terminals
Disclaimer: The proposed acquisition of Hamburg Süd is subject to regulatory approvals and due diligence
page 37

Digital is changing the way we operate our assets
Data collection
Flow meter Control and alarm systems
Time stamps
Benefit: Better
network design
Sensors
Analytics engine
Data reports
Benefit: Improved fuel efficiency
Benefit: Reduced port stay
“pit stop”
page 38

Hamburg Süd is a great match for network and terminals
Note: Illustrative network. Disclaimer: The proposed acquisition of Hamburg Süd is subject to regulatory approvals and due diligence
Terminal volumes Network synergies Procurement synergies
page 39
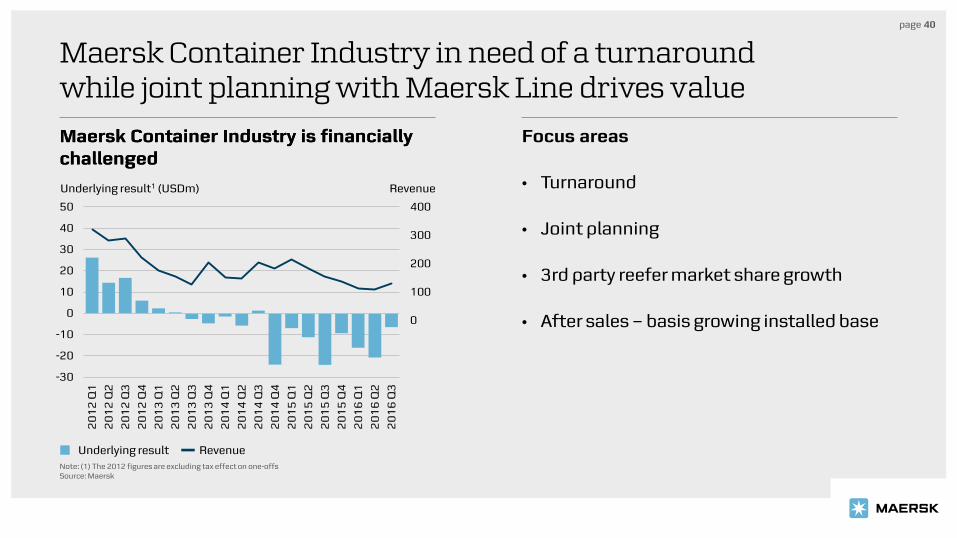
Maersk Container Industry in need of a turnaround while joint planning with Maersk Line drives value
Maersk Container Industry is financially challenged
Focus areas
• Turnaround
• Joint planning
• 3rd party reefer market share growth
• After sales – basis growing installed base
Maersk Container Industry is financially challenged
-200
-100
0
100
200
300
400
-30
-20
-10
0
10
20
30
40
50
20
12
Q1
20
12
Q2
20
12
Q3
20
12
Q4
20
13
Q1
20
13
Q2
20
13
Q3
20
13
Q4
20
14
Q1
20
14
Q2
20
14
Q3
20
14
Q4
20
15
Q1
20
15
Q2
20
15
Q3
20
15
Q4
20
16
Q1
20
16
Q2
20
16
Q3
Revenue Underlying result1 (USDm)
Note: (1) The 2012 figures are excluding tax effect on one-offs Source: Maersk
Underlying result Revenue
page 40

APM Terminals to benefit from Maersk Line’s growth and VSA partnerships
• Grow APM Terminals’ share of Maersk Line’s volume
• Maersk Line’s vessel sharing agreements supporting APM Terminals volume growth
• Impact from Hamburg Süd (from 2018)
32% of Maersk Line’s moves are with APM Terminals
Disclaimer: The proposed acquisition of Hamburg Süd is subject to regulatory approvals and due diligence
page 41

Hub terminals are essential to operating a reliable and cost effective network
Share of global Maersk Line volume that pass through key hubs 2016Q1-Q3 (%)
33%
21%
16%
13%
12%
11%
32%
9%
5%
0% 10% 20% 30% 40%
Tanjung Pelepas
Singapore
Algeciras
Salalah
Rotterdam
Tangier
Port Said
Jebel Ali
Balboa
48% of Maersk Line’s transhipment moves are with APM Terminals
Note: Total moves include empty and full container moves. Pass through includes loadings, discharges and containers that stay on the vessel during the port stay. Pass through numbers are not additive as a container can pass through several hubs on same journey
43% of Maersk Line’s moves are transhipment moves
APM Terminals 3rd party
page 42

Time is money – terminal performance as a source of strategic advantage
19 (76%)
6 (24%)
25 (100%)
0%
25%
50%
75%
100%
Crane operations Anchorage, piloting,morrring,
waiting time
Total
190 147
115 113
0
50
100
150
200
Hub 1 Hub 2 Hub 3 Hub 4
300,000 Hours of non-crane time per year
Average port stay, (hours)
Crane productivity in key transhipment hubs for EEE vessels, (moves/hr)
page 43

APM Terminals is adapting to new reality
A shift in focus and approach is required :
Capex led growth
Cost leadership
Asset utilisation
From
To
page 44

Cost leadership is required to win
We are under pressure… …and taking action
29 31
22
0
5
10
15
20
25
30
35
100
120
140
160
180
200
2014 2015 2016 YTD
Stardardisation Limit capex growth
Improve utilisation
SG&A
Digitisation
Improve procurement
Reduce Operating cost base
Decrease Cycle Times
Decrease Non-Productive Moves
Revenue/TEU (USD) EBIT*/TEU (USD)
Revenue/TEU EBIT*/TEU
* Consolidated terminals, excluding gains
page 45

APM Terminals has started the cost reduction journey
Cost per move Cost break down1 (FY 2015)
140
150
160
170
180
190
200
14Q1 14Q2 14Q3 14Q4 15Q1 15Q2 15Q3 15Q4 16Q1 16Q2 16Q3
CAGR: -2%
LTM: -7%
USD/move
50%
14%
14%
10%
8% 5%
Concession fee
Corporate costs
Labor costs
Service & admin costs
Variable operational costs
Depreciation
Note: (1) Cost breakdown for controlled terminal entities only
page 46

Integrated planning with Svitzer will deliver synergies for Maersk Line and APM Terminals
…and is a vital part of the port call value chain
• Direct supplier to shipping lines and terminals
• Value from bringing Svitzer into existing APM Terminals facilities
• Unique opportunity to collaborate on new projects
• An important part of our customers overall port experience
Svitzer is a stable business…
0
50
100
150
200
250
300
0
5
10
15
20
25
30
35
40
45
50
20
12
Q1
20
12
Q2
20
12
Q3
20
12
Q4
20
13
Q1
20
13
Q2
20
13
Q3
20
13
Q4
20
14
Q1
20
14
Q2
20
14
Q3
20
14
Q4
20
15
Q1
20
15
Q2
20
15
Q3
20
15
Q4
20
16
Q1
20
16
Q2
20
16
Q3
Revenue Underlying result1 (USDm)
Note: (1) The 2012 figures are excluding tax effect on one-offs Source: Maersk
Underlying result Revenue
page 47

APM Terminals is adapting to new reality
A shift in focus and approach is required :
Capex led growth
Cost leadership
Asset utilisation
From
To
page 48

Our key challenge is asset utilisation
Invested capital has outpaced topline … …but we have opportunities to improve
Disclaimer: The proposed acquisition of Hamburg Süd is subject to regulatory approvals and due diligence
0
0.1
0.2
0.3
0.4
0.5
0.6
0.7
0.8
0.9
0
1,000
2,000
3,000
4,000
5,000
6,000
7,000
8,000
9,000
Q1
'13
Q2
'13
Q3
'13
Q4
'13
Q1
'14
Q2
'14
Q3
'14
Q4
'14
Q1
'15
Q2
'15
Q3
'15
Q4
'15
Q1
'16
Q2
'16
Q3
'16
Invested capital (USDm) Asset turn (revenue/invested capital)
Invested capital Asset turn
Maersk Line and Hamburg Süd
Other shipping line customers
Land side customers
page 49

Strategic partnerships with shipping line customers remain vital for APM Terminals
• Increased focus on customer experience – investments in technology and efficiency
• Ambition to grow market share through increased utilisation
• Partnering for value and joint growth
• Commercial independence with equal focus on growing business with all shipping line customers
page 50

Creating and sharing value for our land side customers through new products and services
Marine Quayside Yard Gate Inland Services
Cargo Managers
Land side customers
Cargo Owners
Truck & Rail Operators
Equipment owners
Regulators
Shipping Lines
Truck visit Efficiency
Container Weighing
Storage options
Fast Track options
Inland Service depots
Container lifecycle services
Predictable, reliable & efficient service
Digital platform
Data based insights
page 51

Achieving growth through disciplined approach to invested capital
From period of heavy investments in new capacity…
…to maximise what we have
• No new greenfield investments
• No increase in invested capital beyond what already is committed (approx. USD 2bn)
• Non-strategic divestments to invest for increased T&L value
• Derive value from portfolio management
#terminals
0
10
20
30
40
50
60
70
80
20
01
20
02
20
03
20
04
20
05
20
06
20
07
20
08
20
09
20
10
20
11
20
12
20
13
20
14
20
15
20
16
Legal entity
Fully separated from Maersk Line
Global port acquisition
TCB acquisition
Source: Maersk, Drewry
page 52

Integrated operations in West Med has shown 15% throughput increase with low CAPEX
Large improvements in Algeciras and Tangier…
0
20
40
60
80
100
120
140
160
180
0
10
20
30
40
50
60
70
80
2013 2014 2015 2016YTD
Weekly moves, (‘000) Cost/move, (USD)
Change: +15%
Change: -20%
• Collaboration project initiated in 2013
• Operates at 109% of design capacity achieved by integrating operational processes
• Port productivity up 14% ytd achieved through joint planning of berth windows and stowage
• Improvements achieved with limited capex
…driven by joint Maersk Line and APM Terminals operations
Moves Cost/move (right scale)
page 53

APM Terminals is taking action to best manage cost and growth
A shift in focus and approach :
Capex led growth
Cost leadership
Asset utilisation
From
To
page 54

Jakob Stausholm Chief Financial, Strategy & Transformation Officer
DIGITISATION Screenshot to be updated
Thursday afternoon
page 55

Transforming a 100+ year old company is not easy – requires a fit for purpose IT setup
IT center in Maidenhead, UK
Annual IT spend USD ~800m
IT Foundation
~1,900 people employed in IT
Accessing the right competences by establishing an IT centre in Maidenhead, UK (Thames Valley) in 2013
Transport & Logistics IT organisation
5 key IT centres in UK, Denmark, US, Netherlands and India
page 56

32% 50%
0%
20%
40%
60%
80%
100%
2012 2016E
Maersk Line has already invested significantly in improving the IT foundation
Reduced IT run budget to free up money for building
Fixing and re-implementing back bone software
Moving infrastructure to public/private hybrid cloud
Implementing major IT and process transformation program Build
Split of IT budget*
Run
Note: * Maersk Line only
Cost leadership
Capability building
Started a number of key projects
IT Foundation
Replacing legacy systems
page 57

Radically changing the customer experience – making my.maerskline.com one of the largest B2B transaction sites
Easier to do business online with Maersk Line…
Note: * May take longer due to local procedures and legislation
Examples of improvements: 2014 Today 2018 Easier to become customer: from 2-3 days 2 hours* 2-3 minutes
Faster to book: from +2 hours 22 minutes 5 seconds
Faster to amend: from +1 hour 25 minutes seconds
1% Manual
58% Website
24% EDI
…drives online transactions
Booking channel, 2016 YTD
17% 3rd party portals
IT Foundation
Manual transactions reduced by a factor of 30x over last 4 years
page 58

Improving the IT foundation is just the first step
IT foundation Digital transformation
DIGITAL ASSETS
ANALYTICS NEW DIGITAL
BUSINESSES
IT SETUP FIXING BACKBONE
ONLINE CUSTOMER
EXPERIENCE
page 59

We are building the required capabilities within digital technology and changing the way we work
Capabilities & people
Organisation
Culture
Infrastructure
Mixing a new breed of talent with our world class shipping people – hired numerous PhDs and Post docs in fields such as Machine Learning, Applied Mathematics, and Operational Research
Separate IT and Digital organisations working directly with business product owners to unlock value
Training and using Scrum methodology; created Design Centre for facilitating agile working methods
All digital product development will take place on one common platform
Digital Transformation
page 60

Advanced analytics opens up a whole new playground of opportunities supporting our strategy Examples
Predictive maintenance – vessels and containers
Operational optimisation
Commercial decision-making
Selling services
Real time network optimisation for bunker savings
Which customers to target – how to reach
How to optimise cargo mix within restrictions
Generate lead pipeline
Logistics chain advisory
Container repairs and empty moves
Aggregating and selling trade data
Weather data from vessels
Intelligent pricing engine
Automated stowage
Analytics
page 61

Accurate forecasting for empty container repositioning will save millions of dollars
USD 2.1bn spend per year on repositioning empty containers*
Difficult to forecast need for containers per location due to high fluctuation in demand
Accuracy of existing model was poor – business lost trust
Improving existing model through advanced analytics
x15 increase in accuracy
Note: * Maersk Line only
Example
Analytics
page 62

We are building a portfolio of digital products through various innovation methods and rapid prototyping
Innovation/ Idea generation
Prototyping Industrialisation
Various methods:
• Partnerships
• Internal innovation
• Start-up incubation
• External events
Outcomes:
• Add to existing business
• New revenue streams
~15 prototypes at the moment
New Digital Business
page 63

Example
100+ trucking companies on-boarded since August
Promising results in short time, potential for exponential growth
Note: * Currently being piloted in North America for trucking only
New Digital Business
Online reverse auction place for inland transport*. Increases ability to sell inland products to our end-customers
Transparent prices, simple process and improved planning
First step in making end-to-end shipping a seamless experience
Prototyping
Spotlanes.com creating opportunities in inland transport
page 64

Our intent: Create a digital world of logistics page 65

Vincent Clerc Chief Commercial Officer Maersk Line
Morten Engelstoft Chief Executive Officer APM Terminals
Jakob Stausholm Chief Finance, Strategy & Transfor-mation Officer
TRANSPORT & LOGISTICS PERFORMANCE
page 66

0%
2%
4%
6%
8%
10%
12%
14%
16%
20
10
20
11
20
12
20
13
20
14
20
15
20
16
YT
D
Historical returns for combined companies have been reasonable
Note: Figures are excluding allocations and eliminations. Source: Maersk
7% Average annual ROIC 2010-2016YTD
USD 1.8bn
Average annual NOPAT 2010-2016YTD
Aggregate of main businesses in Transport & Logistics excluding residual activities and overheads
page 67

Unlocking of integration synergies will happen gradually over the coming three years
Synergies from integration
Revenue growth
Cost savings and other benefits
~2pp ROIC
Note: Timing and size of each synergy are illustrative only, as the exact timing and size of each synergy will differ. The overall synergy level of 2pp ROIC is, however, of high certainty.
Phasing of synergies
2017 2018 2019 Total
~2pp
Commercial synergies
Overhead savings
Operational efficiencies
page 68

We have generated free cash flow and we are implementing strict capital discipline
Transport & Logistics has generated FCF of USD 5.5bn over the last four years
Note: Excluding the acquisition of Hamburg Süd
Lower future CAPEX in Transport & Logistics
2.8
3.4 3.3
2.2
~3.3
3.5-4.0
1.5-2.0
0.0
1.0
2.0
3.0
4.0
5.0
20
13
20
14
20
15
YT
D2
01
6
20
16
E
20
17
E
20
18
E -
20
20
E
USDm Yearly gross CAPEX (USDbn)
Operating cash flow FCF Investing flow
-2,000
-1,500
-1,000
-500
0
500
1,000
1,500
2,000
Q3
12
Q4
12
Q1
13
Q2
13
Q3
13
Q4
13
Q1
14
Q2
14
Q3
14
Q4
14
Q1
15
Q2
15
Q3
15
Q4
15
Q1
16
Q2
16
Q3
16
Main CAPEX items for 2017 11 x 19K TEU vessels 9 x 14K TEU vessels
Average gross CAPEX
3.2
2.5
Source: Maersk
page 69

Key financials
Jan-Sep 2016 Jan-Sep 2015 Segment variance Segment result ROIC Segment result ROIC
Maersk Line -230 -2% 1,485 10% -1,715
APM Terminals 351 6% 526 12% -175
Damco 27 17% 18 8% 9
Svitzer 73 8% 91 11% -18
MCI -44 -14% -42 -15% -2
Transport & Logistics total 117 2,078 -1,901
To be covered in the
following sections
Note: Figures are excluding allocations and eliminations. Source: Maersk
page 70

Maersk Line
page 71

Freight rate has been under pressure from tough market conditions…
Growth (y/y %)
3.1% 3.5%
6.4% 6.2% 5.6%
6.5%
4.9% 4.3%
3.5%
1.4% 1.8% 0.3%
1.6% 2.1%
1.7%
5.5% 5.3% 5.9% 5.7% 5.5% 5.2% 5.4%
6.4% 7.3%
7.9% 8.7% 8.5%
7.2%
5.3%
3.0%
1.5%
1,400
1,600
1,800
2,000
2,200
2,400
2,600
2,800
3,000
0%
1%
2%
3%
4%
5%
6%
7%
8%
9%
10%
Q1 13 Q2 13 Q3 13 Q4 13 Q1 14 Q2 14 Q3 14 Q4 14 Q1 15 Q2 15 Q3 15 Q4 15 Q1 16 Q2 16 Q3 16 Q4 16E
Freight rate, (USD/FFE)
Head haul demand Maersk Line freight rate (rhs)
Source: Maersk Line, Alphaliner
Nominal supply
CAGR -2.2%
CAGR -17.8%
N/A
page 72

…which has driven down our profitability – relative still ahead of industry
Core EBIT-margin (%)
-25%
-20%
-15%
-10%
-5%
0%
5%
10%
15%
20%
25%
-25%
-20%
-15%
-10%
-5%
0%
5%
10%
15%
20%
25%
Q108
Q208
Q308
Q408
Q109
Q209
Q309
Q409
Q110
Q210
Q310
Q410
Q111
Q211
Q311
Q411
Q112
Q212
Q312
Q412
Q113
Q213
Q313
Q413
Q114
Q214
Q314
Q414
Q115
Q215
Q315
Q415
Q116
Q216
Q316
Industry slumps 6 quarters 5 quarters 5 quarters so far
Gap to peers (%-pts)
Note: Peer group includes CMA CGM, APL, Hapag Lloyd, Hanjin, ZIM, Hyundai MM, K Line, CSAV, OOCL, NYK, MOL, COSCO, CSCL. Peer average is TEU-weighted. EBIT margins are adjusted for gains/losses on sale of assets, restructuring charges, income/loss from associates. Maersk Line’ EBIT-margin is also adjusted for depreciations to match industry standards (25 years). OOCL and COSCO Q3 2016 EBIT-margin is estimated based on previous half years’ gap to Maersk Line as they do not publish quarterly results. Source: Maersk Line, company reports
Gap to peers (rhs) Peer group Maersk Line
page 73

36% Spot (<1 month)
20% Short term
(1-3 months)
45%
Long term (>3 months)
By contract type
0
200
400
600
800
1,000
1,200
1,400
1,600
0
500
1,000
1,500
2,000
2,500
3,000
3,500
Q1
-10
Q3
-10
Q1
-11
Q3
-11
Q1
-12
Q3
-12
Q1
-13
Q3
-13
Q1
-14
Q3
-14
Q1
-15
Q3
-15
Q1
-16
Q3
-16
Maersk Line (USD/FFE)
CCFI (Index) SCFI (Index) Note: 1. Oct 2009 = 1000 for SCFI, January 1998 =1000 for CCFI Source: Maersk
16Q3 vs. 16Q2: Maersk Line: +5.5% CCFI composite: +7.5% SCFI composite: +29.5%
Index1 USD/FFE
Maersk Line rates correlate with SCFI/CCFI but with lower volatility partly due to contracts
Average rate Volume split, Jan to Sep 2016
page 74

Freight rates out of China have bottomed out versus rest of the world in Q3
Freight rate Volume split, Jan to Sep 2016
49% North-South
15% Intra region
36% East-West
By trade
1,000
1,500
2,000
2,500
3,000
3,500
Q1
13
Q2
13
Q3
13
Q4
13
Q1
14
Q2
14
Q3
14
Q4
14
Q1
15
Q2
15
Q3
15
Q4
15
Q1
16
Q2
16
Q3
16
Rest of world China export
USD/FFE
page 75

APM Terminals
page 76

Revenue under pressure
Total revenue
Source: APM Terminals
APM Terminals revenue model
31% Yard & Gate
2% Marine
Services
51% Quay incl. hub
revenue
Revenue split
16% Other services (incl. trucking and container sales)
(USDm)
850
900
950
1,000
1,050
1,100
1,150
Q1
12
Q2
12
Q3
12
Q4
12
Q1
13
Q2
13
Q3
13
Q4
13
Q1
14
Q2
14
Q3
14
Q4
14
Q1
15
Q2
15
Q3
15
Q4
15
Q1
16
Q2
16
Q3
16
Revenue Revenue from TCB
page 77

Despite reduced segment result, existing terminals deliver 8-10% ROIC
Profits have declined with new industry fundamentals…
…operating terminals continue to deliver well but burdened by projects
Segment result, (USDm) ROIC, (2016 Q3 YTD, %)
-150-100
-500
50100150200250300350
Q1
12
Q2
12
Q3
12
Q4
12
Q1
13
Q2
13
Q3
13
Q4
13
Q1
14
Q2
14
Q3
14
Q4
14
Q1
15
Q2
15
Q3
15
Q4
15
Q1
16
Q2
16
Q3
16
8.4% 9.9%
-1.7%
6.2%
-2%
0%
2%
4%
6%
8%
10%
12%
Total Implementations incl TCB
Consolidated businesses
Q3 2016 invested capital (USDbn)
7.9 2.2 2.0 3.7
JV & Associates
Underlying result Gain/loss and impairment
8.9%
Source: APM Terminals
page 78

APM Terminals’ implementation projects
Project Opening Details Investment (100% share)
Lázaro Cárdenas, Mexico 2017 • Signed 32-year concession agreement for new deep-water • Will add 1.2m TEU in annual throughput
USD 0.9bn
Ningbo, China 2016 • Major gateway port • 67%/33% (Ningbo Port Group/APM Terminals) share of investment and operation
USD 0.7bn
Izmir, Turkey 2016 • New 1.5m TEU deep-water container and general cargo terminal USD 0.4bn
Moin, Costa Rica 2018 • Signed 33-year concession for new deep-water terminal USD 1.0bn
Savona-Vado, Italy 2017 • Signed 50-year concession agreement for new deep-sea gateway terminal USD 0.4bn
Abidjan, Ivory Coast 2018 • Is expected to be the second most busy container terminal in West Africa USD 0.6bn
Tema, Ghana TBD • Will add 3.5m TEU of annual throughput • JV project with Bolloré (42.3%) and Ghana Ports & Harbours Authority (15.4%)
USD 0.8bn
TM2, Tangier 2019 • Signed 30-year concession agreement • Will add 5m TEU
USD 0.9bn
Note: TEU and investment numbers are 100% of the projects
page 79

Thank you