
Madison Covered Call and Equity Income Fund Investment Strategy...
4
INVESTMENTS ® September 30, 2016 Lessons from the King Arnold Palmer, iconic golfer and human being, recently passed away at age 87. During an era when golf was considered a stuffy, country club affair, Mr. Palmer injected style and personality at a time when a broader audience was just beginning to watch the game on TV. His swashbuckling, aggressive style on the course was balanced by his genuine, principled character off the course. While watching the many tributes of his life, I am amazed at how positively he impacted so many people’s lives who may have only just briefly touched his orbit. There is a reason that so many people of different generations call themselves members of Arnie’s Army. While his accomplishments on the golf course were among the greatest of all time, it is how he interacted with people off the course that truly measured the greatness of the man. So, I raise a glass of iced tea and lemonade - the traditional Arnold Palmer - to pay tribute to the man himself and hope that in this self-absorbed world of Twitter and Facebook we don’t forget to instill personal kindness, charity and genuine caring of others into our daily lives. Be like Arnie. And now back to your regularly scheduled newsletter... While Mr. Palmer’s story may not immediately correspond to investing, we can always take lessons from greatness of any sort. Being a swashbuckling investor can achieve success for a time, but will ultimately lead to sorrow when the tide turns. Think of all of those risk takers in 1999 who believed that fundamentals didn’t matter, only to be destroyed when the bubble burst. Similarly, too much caution can be just as detrimental to investors who fail to participate in long bull markets for fear of the next bubble. Although every investor has their own risk tolerance and investment objectives, like Mr. Palmer, a balance of styles can be the approach that leads to a fulfilling and successful investment lifetime. Covered call writing as an investment strategy has these attributes, in our view. The strategy participates in the upward potential of equities while offering a level of protection and stability that comes from the call option overlay. Third Quarter Review The quarter had some excitement at the beginning and a little at the end, but the middle was like watching paint dry. During the first ten days of July, the market was in full-on Brexit recovery mode. The fear that accompanied the UK vote to leave the European Union in late June quickly evolved into a massive shoulder shrug as U.S. stocks rebounded sharply, rising over 3% by July 15th. Then, as if Rowdy Roddy Piper (WWF reference for all of you wrestling fans) put the market in a sleeper hold, volatility disappeared and the market traded sideways madisonfunds.com | madisonadv.com 888.971.7135 The writer of a covered call option forgoes, during the option’s life, the opportunity to profit from increases in the market value of the security covering the call option above the sum of the premium and the strike price of the call, but has retained the risk of loss should the price of the underlying security decline. Past performance does not predict future results. Please refer to the final two pages of this piece which contain current performance information for the fund, the risks of investing in the fund and a complete list of the fund’s individual portfolio holdings as of quarter end. Individual portfolio holdings are identified to illustrate our approach to investing the fund’s portfolio and are not intended to represent a recommendation to buy or sell any such security. Madison Covered Call and Equity Income Fund Investment Strategy Letter Ray Di Bernardo, CFA Portfolio Manager Industry since 1987 Walter Dewey, CFA Portfolio Manager Industry since 1986
-
Upload
nguyenhanh -
Category
Documents
-
view
214 -
download
0
Transcript of Madison Covered Call and Equity Income Fund Investment Strategy...
INVESTMENTS®
September 30, 2016
Lessons from the KingArnold Palmer, iconic golfer and human being, recently passed away at age 87. During an era when golf was considered a stuffy, country club affair, Mr. Palmer injected style and personality at a time when a broader audience was just beginning to watch the game on TV. His swashbuckling, aggressive style on the course was balanced by his genuine, principled character off the course. While watching the many tributes of his life, I am amazed at how positively he impacted so many people’s lives who may have only just briefly touched his orbit. There is a reason that so many people of different generations call themselves members of Arnie’s Army. While his accomplishments on the golf course were among the greatest of all time, it is how he interacted with people off the course that truly measured the greatness of the man. So, I raise a glass of iced tea and lemonade - the traditional Arnold Palmer - to pay tribute to the man himself and hope that in this self-absorbed world of Twitter and Facebook we don’t forget to instill personal kindness, charity and genuine caring of others into our daily lives. Be like Arnie.
And now back to your regularly scheduled newsletter...
While Mr. Palmer’s story may not immediately correspond to investing, we can always take lessons from greatness of any sort. Being a swashbuckling investor can achieve success for a time, but will ultimately lead to sorrow when the tide turns. Think of all of those risk takers in 1999 who believed that fundamentals didn’t matter, only to be destroyed when the bubble burst. Similarly, too much caution can be just as detrimental to investors who fail to participate in long bull markets for fear of the next bubble. Although every investor has their own risk tolerance and investment objectives, like Mr. Palmer, a balance of styles can be the approach that leads to a fulfilling and successful investment lifetime. Covered call writing as an investment strategy has these attributes, in our view. The strategy participates in the upward potential of equities while offering a level of protection and stability that comes from the call option overlay.
Third Quarter ReviewThe quarter had some excitement at the beginning and a little at the end, but the middle was like watching paint dry. During the first ten days of July, the market was in full-on Brexit recovery mode. The fear that accompanied the UK vote to leave the European Union in late June quickly evolved into a massive shoulder shrug as U.S. stocks rebounded sharply, rising over 3% by July 15th. Then, as if Rowdy Roddy Piper (WWF reference for all of you wrestling fans) put the market in a sleeper hold, volatility disappeared and the market traded sideways
madisonfunds.com | madisonadv.com888.971.7135
The writer of a covered call option forgoes, during the option’s life, the opportunity to profit from increases in the market value of the security covering the call option above the sum of the premium and the strike price of the call, but has retained the risk of loss should the price of the underlying security decline.
Past performance does not predict future results. Please refer to the final two pages of this piece which contain current performance information for the fund, the risks of investing in the fund and a complete list of the fund’s individual portfolio holdings as of quarter end. Individual portfolio holdings are identified to illustrate our approach to investing the fund’s portfolio and are not intended to represent a recommendation to buy or sell any such security.
Madison Covered Call and Equity Income Fund Investment Strategy Letter
Ray Di Bernardo, CFAPortfolio ManagerIndustry since 1987
Walter Dewey, CFAPortfolio ManagerIndustry since 1986

until mid-September. In fact, there were no 1% or greater moves in the market in either direction from July 8 through September 9, the longest such period since 2014. Just as we were all getting comfy in our complacency, those darn central bankers started chirping again. This time it was European Central Bank president Draghi suggesting that there were limits to future central bank market support. Then, a handful of U.S. Federal Reserve (Fed) types suggested that it was time to start raising U.S. interest rates. Say it ain’t so! You can’t take the punch bowl away from the party. Stocks reacted accordingly and fell until the Fed kept the punch flowing by not raising rates in their late September meeting. Apparently, the best way to avoid a hangover is to just keep drinking. That’s not going to end well.
The S&P 500® maintained its early lead and ended the quarter up 3.85%. The S&P 500 Buy-Write Index, which did not participate in the early rally due to its hedged nature, rose only 1.83%. The fund (Class Y) mostly kept pace with the market advance despite being conservatively positioned, gaining 3.08%.
Within the fund, stock selection was a significant positive contributor to the strong performance. A number of holdings that underperformed earlier in the year were among the third quarter’s best performers. Nordstrom rebounded very strongly following disappointing results in the second quarter. The stock price overreacted to the downside and normalized as the summer moved forward. Similarly, Biogen recovered from poor drug trial results earlier in the year as investors refocused on other high potential areas, such as a possible Alzheimer’s treatment. Energy stocks generally performed well, with Apache moving meaningfully higher after announcing a major new oil discovery in West Texas. The primary area of weakness was related to companies associated with the drug supply chain. With political pressure on excessive drug pricing taking center stage with the Mylan/Epipen Congressional hearing, companies such as Express Scripts, McKesson and CVS underperformed as investors shied away from the unloved sector.
From a sector allocation perspective, the fund was evenly affected by being underrepresented in the poor performing Utilities and Consumer Staples sectors and by being slightly overrepresented in the poor performing Health Care sector. Cash, which had been drawn down after the Brexit market decline, moved higher as the quarter progressed and the market continued to hover near all-time highs. As the quarter began, approximately 85% of the equity holdings value was covered by call options. The fund became increasingly defensive as the market moved higher and ended the quarter with about 94% option coverage.
OutlookThe fear that central banks will become less accommodative in the future is not going away any time soon. In a face saving move, the Fed may be forced to raise the Fed Funds rate in December as it did last year, but the fear of further action will be with us for the foreseeable future. Other significant concerns, such as the lack of strong economic growth, shaky earning fundamentals and, oh yeah, a crazy election cycle, will continue to weigh on stock prices. All of this comes just as we enter the seasonally weakest part of the year for stocks. The fund has been positioned in a very defensive posture entering the final quarter of the year. We believe this to be prudent given our concerns above, as well as a market that is increasingly expensive relative to the underlying growth potential of its components.
So, for now, keep drinking from the punch bowl, but have a bottle of Tylenol handy just in case.
madisonfunds.com | madisonadv.com888.971.7135
Ray Di Bernardo Walter Dewey
Although the information in this report has been obtained from sources that the firm believes to be reliable, we do not guarantee its accuracy, and any such information may be incomplete or condensed. All opinions included in the report constitute the authors’ judgment as of the date of this report and are subject to change without notice. This report is for informational purposes only and is not intended as an offer or solicitation with respect to the purchase or sale of any security.
Madison Funds are distributed by MFD Distributor, LLC. Madison Asset Management, LLC.©October 6, 2016.
Madison Covered Call andEquity Income Fund
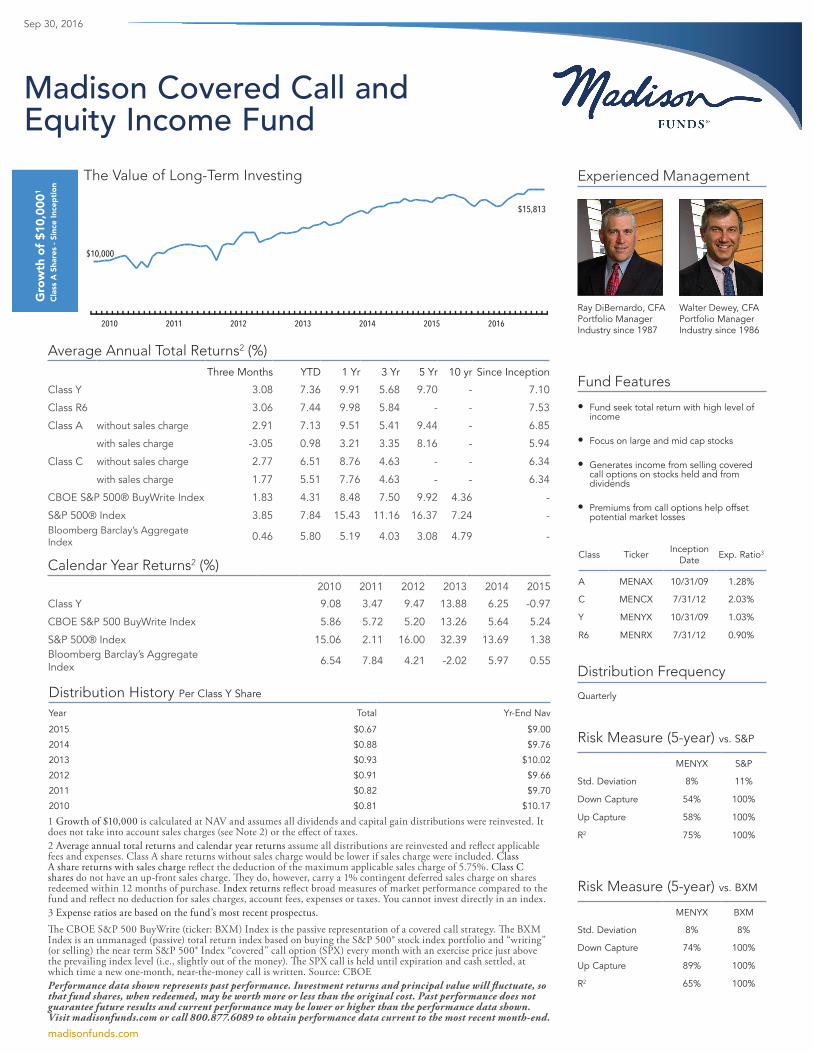
1 Growth of $10,000 is calculated at NAV and assumes all dividends and capital gain distributions were reinvested. It does not take into account sales charges (see Note 2) or the effect of taxes.2 Average annual total returns and calendar year returns assume all distributions are reinvested and reflect applicable fees and expenses. Class A share returns without sales charge would be lower if sales charge were included. Class A share returns with sales charge reflect the deduction of the maximum applicable sales charge of 5.75%. Class C shares do not have an up-front sales charge. They do, however, carry a 1% contingent deferred sales charge on shares redeemed within 12 months of purchase. Index returns reflect broad measures of market performance compared to the fund and reflect no deduction for sales charges, account fees, expenses or taxes. You cannot invest directly in an index.3 Expense ratios are based on the fund’s most recent prospectus.The CBOE S&P 500 BuyWrite (ticker: BXM) Index is the passive representation of a covered call strategy. The BXM Index is an unmanaged (passive) total return index based on buying the S&P 500® stock index portfolio and “writing” (or selling) the near term S&P 500® Index “covered” call option (SPX) every month with an exercise price just above the prevailing index level (i.e., slightly out of the money). The SPX call is held until expiration and cash settled, at which time a new one-month, near-the-money call is written. Source: CBOEPerformance data shown represents past performance. Investment returns and principal value will fluctuate, so that fund shares, when redeemed, may be worth more or less than the original cost. Past performance does not guarantee future results and current performance may be lower or higher than the performance data shown. Visit madisonfunds.com or call 800.877.6089 to obtain performance data current to the most recent month-end.
2016201520142013201220112010
$15,813
$10,000
The Value of Long-Term Investing
Sep 30, 2016
Gro
wth
of $
10,0
001
Clas
s A
Sha
res
- Sin
ce In
cept
ion
Ray DiBernardo, CFA Portfolio Manager Industry since 1987
Walter Dewey, CFA Portfolio Manager Industry since 1986
Experienced Management
Fund Features
• Fund seek total return with high level of income
• Focus on large and mid cap stocks
• Generates income from selling covered call options on stocks held and from dividends
• Premiums from call options help offset potential market losses
Average Annual Total Returns2 (%)Three Months YTD 1 Yr 3 Yr 5 Yr 10 yr Since Inception
Class Y 3.08 7.36 9.91 5.68 9.70 - 7.10
Class R6 3.06 7.44 9.98 5.84 - - 7.53
Class A without sales charge 2.91 7.13 9.51 5.41 9.44 - 6.85
with sales charge -3.05 0.98 3.21 3.35 8.16 - 5.94
Class C without sales charge 2.77 6.51 8.76 4.63 - - 6.34
with sales charge 1.77 5.51 7.76 4.63 - - 6.34
CBOE S&P 500® BuyWrite Index 1.83 4.31 8.48 7.50 9.92 4.36 -
S&P 500® Index 3.85 7.84 15.43 11.16 16.37 7.24 -Bloomberg Barclay’s Aggregate Index 0.46 5.80 5.19 4.03 3.08 4.79 -
Calendar Year Returns2 (%)2010 2011 2012 2013 2014 2015
Class Y 9.08 3.47 9.47 13.88 6.25 -0.97
CBOE S&P 500 BuyWrite Index 5.86 5.72 5.20 13.26 5.64 5.24
S&P 500® Index 15.06 2.11 16.00 32.39 13.69 1.38Bloomberg Barclay’s Aggregate Index 6.54 7.84 4.21 -2.02 5.97 0.55
madisonfunds.com
Distribution History Per Class Y Share
Year Total Yr-End Nav
2015 $0.67 $9.00
2014 $0.88 $9.76
2013 $0.93 $10.02
2012 $0.91 $9.66
2011 $0.82 $9.70
2010 $0.81 $10.17
Class Ticker Inception Date Exp. Ratio3
A MENAX 10/31/09 1.28%
C MENCX 7/31/12 2.03%
Y MENYX 10/31/09 1.03%
R6 MENRX 7/31/12 0.90%
Distribution Frequency
Quarterly
Risk Measure (5-year) vs. S&P
MENYX S&P
Std. Deviation 8% 11%
Down Capture 54% 100%
Up Capture 58% 100%
R2 75% 100%
Risk Measure (5-year) vs. BXM
MENYX BXM
Std. Deviation 8% 8%
Down Capture 74% 100%
Up Capture 89% 100%
R2 65% 100%

Standard Deviation measures dispersion from an average, which, for a mutual fund, depicts how widely the returns varied over a certain period of time. Higher deviation represents higher volatility. Downside Capture Ratio measures a fund’s performance in down markets relative to its benchmark. It is calculated by taking the security’s downside capture return and dividing it by the benchmark’s downside capture return over the time period. Upside Capture Ratio measures a fund’s performance in up markets relative to its benchmark. It is calculated by taking the security’s upside capture return and dividing it by the benchmark’s upside capture return over the time pe-riod. R2 represents the percentage of the fund’s movements relative to the index. An r-squared of 100 means all movements of the fund’s holdings are completely explained by the movements in the index. TTM P/E (Price-to-Earnings Ratio) measures how expensive a stock is. It is calculated by the weighted average of a stock’s current price divided by the company’s trailing 12-month (TTM) earnings per share of the stocks in a fund’s portfolio. P/B (Price-to-Book Ratio) measures a company’s stock price in relation to its book value (the total amount a company would be worth if it liquidated its assets and paid back all its liabilities). Growth Rate is the annual rate at which a company’s earnings are expected to grow. ROE (Return on Equity) is a profitability ratio that measures the amount of net income returned as a percentage of sharehold-ers equity. Dividend Yield: the portfolio’s weighted average of the underlying fund holdings (as of 12/31/2014) and not the yield of the fund. Active Share is defined as the percentage of a portfolio that differs from its benchmark index. Active Share can range from 0% for an index fund that perfectly mirrors its benchmark to 100% for a portfolio with no overlap with an index. Wtd. Avg. Market Cap measures the size of the companies in which the fund invests. Market capitalization is calculated by multiplying the number of a company’s shares outstanding by its price per share. An investment in the fund is subject to risk and there can be no assurance that the fund will achieve its investment objective. The risks associated with an investment in the fund can increase during times of significant market volatility. The principal risks of investing in the fund include: equity risk, mid-cap company risk, option risk, tax risk, concentration risk and foreign security and emerging market risk. More detailed information regarding these risks can be found in the fund’s prospectus.As a writer of a covered call option, the fund forgoes, during the option’s life, the opportunity to profit from increases in the market value of the security covering the call option above the sum of the premium and the strike price of the call, but has retained the risk of loss should the price of the underlying security decline.For more complete information about Madison Funds®, including charges and expenses, obtain a prospectus from your financial adviser, by calling 800.877.6089 or by visiting madisonfunds.com and clicking on prospectus and reports to view or download a copy. Before investing in the funds, consider the investment objectives, risks, charges and expenses. The prospectus contains this and other information about funds and should be read carefully before investing.Madison Funds are distributed by MFD Distributor, LLC and may be purchased directly from the fund or through your investment professional. Portfolio data is as of the date of this piece unless otherwise noted and holdings are subject to change.Not FDIC Insured | No Financial Institution Guarantee | May Lose Value MSM160375
MF-MENAX-101216
Sector allocation is rounded to the nearest 0.1%.
0
5
10
15
20
25
S&P 500® Index
3.8
15.012.5
9.9 10.5
7.38.7
12.8
15.4 14.7
5.3
9.7
13.3
21.2
2.9 2.3 2.6 3.3
Covered Call/Equity IncomeFund
ETFs/OtherTelecom UtilitiesMaterialsInformation Technology
IndustrialsHealth CareFinancialsEnergyConsumer Staples
Consumer Discretionary
Real Estate
3.1
6.7
Security Description %APPLE INC 3.0
SPDR S+P500 ETF TRUST 2.6
CBS CORP CLASS B NON VOTING 2.5
APACHE CORP 2.4
CERNER CORP 2.3
EXPRESS SCRIPTS HOLDING CO 2.2
QUALCOMM INC 2.2
T MOBILE US INC 2.2
BIOGEN INC 2.1
DOLLAR GENERAL CORP 2.1
Sector Allocation (%)
Top Ten Holdings
madisonfunds.com
CharacteristicsTTM P/E 18.7x
P/B 3.1x
LT EPS Growth 11.1%
ROE 17.3%
Dividend Yield 1.8%
Active Share 84.1%
Equities covered by call options 94.9%
Average days to expiration 40.1
Total Net Assets
$102.5 Million
Wtd. Average Market Cap
$89.1 Billion
Number of Equity Holdings
43
Shareholder Services Madison Funds Post Office Box 8390 Boston, MA 02266-8390 800.877.6089
Consultant and Advisor Services550 Science DriveMadison, WI 53711 888.971.7135