MADE-IN-COUNTRY-INDEX (MICI) 2017 - Amazon … Index (MICI) 2017 The “Made in” label was...
14
MADE-IN-COUNTRY-INDEX (MICI) 2017 Country Brands im weltweiten Vergleich Excerpt
-
Upload
vuongthuan -
Category
Documents
-
view
213 -
download
0
Transcript of MADE-IN-COUNTRY-INDEX (MICI) 2017 - Amazon … Index (MICI) 2017 The “Made in” label was...

MADE-IN-COUNTRY-INDEX (MICI) 2017 Country Brands im weltweiten Vergleich
Excerpt

1: http://www.spiegel.de/einestages/made-in-germany-vom-stigma-zum-qualitaetssiegel-a-947688.html 2: http://unctadstat.unctad.org/EN/Index.htmlt
Made-In-Country Index (MICI) 2017
The “Made in” label was originally introduced by the Britons at the end of the 19th century to mark goods and protect their market from cheap imports and brazen product copies from Germany.1 It is no secret that this perception of the label changed rather quickly and “Made in Germany” became a seal of quality – also due to the German economic miracle of the 1950s.
Today – never was the volume of international goods transport higher than during this decade2 – the meaning of the label is more important than ever, and it represents a bundle of perceived product attributes, ranging from fair production to excellent design to great value for money.
For this reason, Statista has developed the Made-In-Country Index. This global survey allows for a reliable definition of standard value for brand strength in different countries and a transparent evaluation of the value of labels.
In cooperation with Dalia Research, we surveyed 43,034 consumers worldwide. The countries included in this sample represent 90 percent of the global population.
The data we retrieved confirms numerous clichés: Swiss luxury products are internationally regarded as status symbols – more than any other. Products from China convey an image of great value for money in combination with state-of-the-art technology.
Preface
However, there were also a lot of surprises: it is becoming apparent that the history of the “Made in Germany” label repeats itself with the “Made in EU” label, which was introduced in 2003 by the European Commission, and many insinuate that it is used by countries with a less than perfect image to boost their products on the international markets. In fact, “Made in EU” comes in third in our global ranking. Made in EU does not come across as a forced upgrade, but rather represents short transportation routes, fair working conditions, and, last but not least, high quality.
It is also quite obvious that political and social upheavals have an effect on the image of producing countries: image values of Turkey, the United States and Greece paint a clear picture.
This data and more can be found in full detail in our comprehensive report on the study. I hope you enjoy reading it and wish you many exciting insights.
Nicolas Loose Head of Market Research | Strategic Market Insights
2

Survey conducted by:
3
Methodology
› The Made-In Country Index is an index for the reputation of products from various countries all over the world. It was conducted in 2017 for 49 countries and the European Union.
› On behalf of Statista, Dalia Research surveyed 43,034 people from 52 countries on their perception of products from the various countries of origin.
› Each respondent assessed three different countries. Each country was assessed by at least 2,500 people. In total, we retrieved 129,102 individual assessments.
› Additionally, the study includes perceived changes of the image of the various countries over the last 12 months as well as product attributes associated with products from these countries.
› The data was collected between December 2016 and January 2017 in a global online survey. You can find the complete study on www.statista.com.
The Made-In-Country Index 2017: Representative of 90% of the global population
On many products you can find a label stating where the product was made. How do you feel about products
labeled “Made in Israel“?
How has your perception of Israel changed over the last 12 months?
Which attributes do you associate with products made in Israel?
4
Overall Ranking – Top 15 (2017)
Germany tops Made-In-Country Index ranking – Switzerland and the EU are runners-up
Rank Country Index
1 Germany 100
2 Switzerland 98
3 European Union 92
4 United Kingdom 91
5 Sweden 90
6 Canada 85
7 Italy 84
8 Japan 81
8 France 81
8 USA 81
11 Finland 77
11 Norway 77
13 Netherlands 76
14 Australia 75
15 New Zealand 73
15 Denmark 73
20 Spain 64
30 Argentina 42
42 India 36
49 China 28
› The global ranking of the Made-In-Country Index shows how positively products “Made in…” are perceived respectively.
› The index is calculated using the average weighted share of positive assessments reached by each country. An index score of 100 equals the first place in the ranking.
…
…
…
…
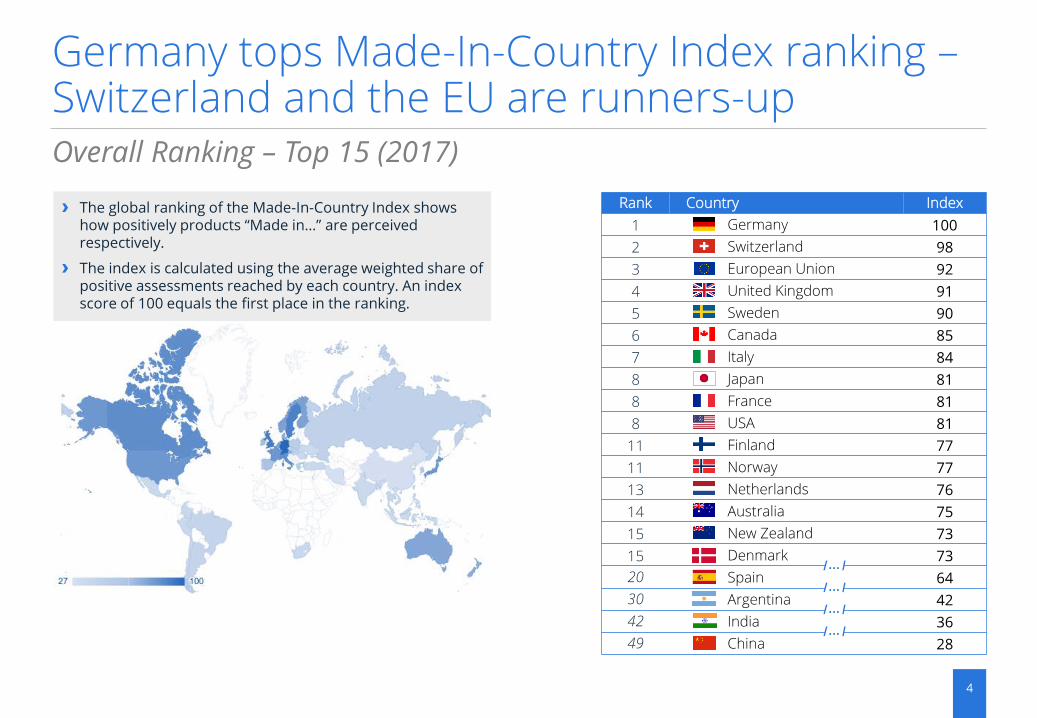
5 1: India and USA share first place in India, therefore the sum of number-one rankings is 53.
Highest-Ranking Country by Respondents’ Countries of Origin
Germany’s image as a country of manufacture ranks No. 1 in 13 out of 52 countries
› The map shows which country was ranked first (flags) by each of the 52 countries that were covered during the fieldwork (position on the map).
Country
Total number of received
number-one rankings
worldwide (out of 521)
Germany 13
USA 8
Japan 7
France 2
Sweden 2
United Kingdom 2
Australia, Austria, Canada, China, Denmark, EU, Greece, India, Indonesia, Ireland, Israel, Italy, Mexico, Netherlands, Norway, Poland, Portugal, Switzerland, Taiwan
1 each

6 The chart depicts the highest scores achieved for each answer category of the question “Which attributes do you associate with producs from …?” by country.
Perceived Product Attributes
German Products stand for Quality, Japanese Products for Advanced Technology
49%
32%
36%
22%
37%
53%
21%
21%
20%
22%
0%
20%
40%
60%
High quality
High security
standards
Very good value for
money
Uniqueness
Excellent design
Advanced
technology
Authenticity
Sustainability
Fair production
Status symbol
Average Max
Germany
Germany
› Products from Germany are most often associated with the attributes of high quality (49%) and high security standards (32%) in the global comparison.
› Products from China are most often associated with a very good price-performance ratio (36%)
› Products from Italy get top marks for uniqueness and excellent design
› Products from Japan are associated with the attribute of advanced technology by 53% of respondents. This is the highest score for any country in the survey.
› Products from Switzerland are top of the list when it comes to authenticity (21%) and being a status symbol (22%).
› Products from Canada are leading the pack in terms of sustainability (21%) and fair production (20%).
Reading support: This chart shows that 49% of all respondents who were asked to judge Germany associate high quality with products from Germany.
China
Italy
Switzerland
Canada
Canada
Switzerland
Japan
› Which attributes do you associate with products from ..?
Italy
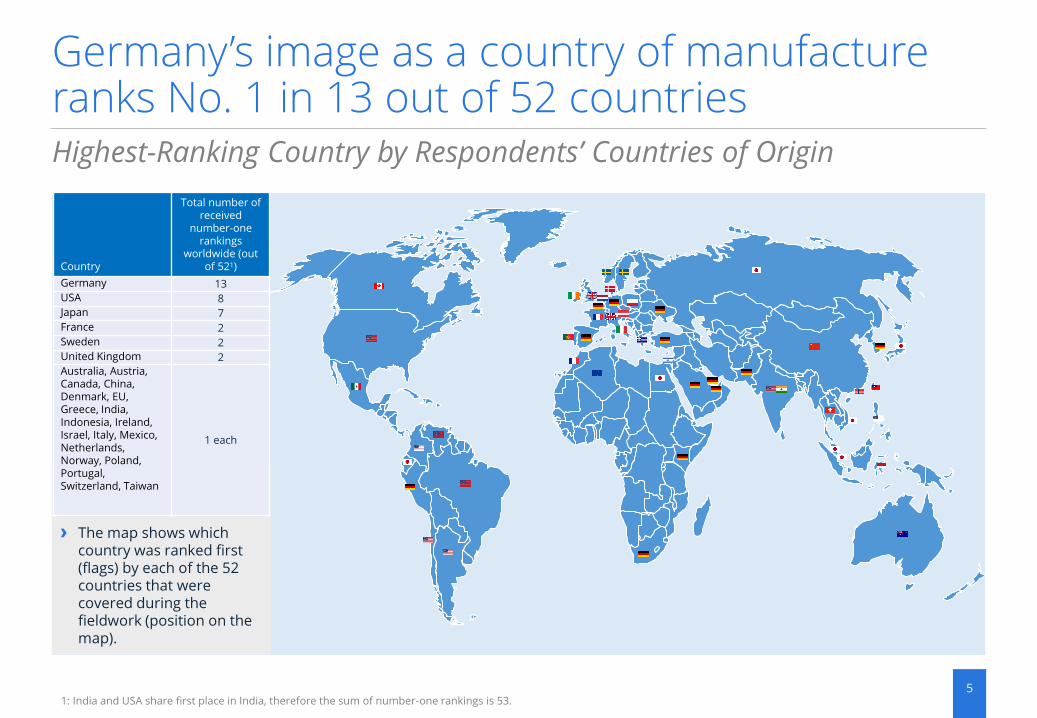
7 The chart depicts respondents’ answers to the following question: “How has your perception of the following countries or regions, respectively, changed over the last 12 months?". Respondents answered using a five-step scale from “has strongly improved” to “has worsened considerably” for their answers. Source: MADE-IN-COUNTRY INDEX (MICI) 2017, https://statista.com/page/Made-In-Country-Index
Change in country image perception – Top 10
Canada, Japan and Australia experience the most significant positive change in their images
Kanada
Schweiz
Österreich
Irland
China
Großbritannien
Argentinien
Frankreich
Thailand
Europäische Union
Peru
Griechenland
Türkei
Spalte2
› Canada (45%), Japan (45%), and Australia (43%) lead the global ranking with regard to the net share of positive image perception changes.
› Germany (41%) ranks fourth.
› Five out of the ten countries with the most significant positive image perception changes globally are EU member countries.
Reading support: The net value of +45% is the result of subtracting the share of respondents whose image of Canada has suffered somewhat/much over the past 12 months from the share of respondents whose image of Canada has somewhat/much improved. Canada therefore ranks first out of 50 and leads the ranking of the countries with the greatest number of positive changes.
The chart shows respondents’ answers to the following question: “How has your perception of the following countries or regions, respectively, changed over the last 12 months?".
The value and ranking are based on the net share of positive assessments (top 2 minus bottom 2, five-step scale). 45%
45%
43%
41%
41%
40%
38%
36%
36%
36%
Canada
Japan
Australia
Germany
Switzerland
Sweden
Norway
Netherlands
Austria
Finland
Change in country image perception over the past 12 months (net values in percent) (positive changes minus negative changes)

8 The chart shows respondents’ answers to the following question: “How has your perception of the following countries or regions, respectively, changed over the last 12 months?”. Respondents answered using a five-step scale from “has strongly improved” to “has worsened considerably” for their answers. Source: MADE-IN-COUNTRY INDEX (MICI) 2017, https://statista.com/page/Made-In-Country-Index
Change in country image perception – Bottom 10
Turkey, Israel, and Iran experience the most significant negative change in their images
Russland
Banglade…
Südafrika
Griechenl…
USA
Mexico
Ukraine
Türkei
Israel
Iran
Spalte2
› Iran (-3%) and Israel (-3%) experience the least positive (i.e. negative) change.
› The two superpowers USA and Russia are also among the ten countries that showed the least positive development of image perception.
Reading support: The net value of +18% is the result of subtracting the share of respondents whose image of Russia has suffered somewhat/much over the past 12 months from the share of respondents whose image of Russia has somewhat/much improved. Russia therefore ranks 41st out of 50 and is among the ten countries with the smallest number of positive net changes.
The chart shows respondents’ answers to the following question: “How has your perception of the following countries or regions, respectively, changed over the last 12 months?".
The value and ranking are based on the net share of positive assessments (top 2 minus bottom 2, five-step scale). 18%
17%
16%
16%
16%
16%
8%
4%
-3%
-3%
Russia
Bangladesh
South Africa
Greece
USA
Mexico
Ukraine
Turkey
Israel
Iran
Change in country image perception over the past 12 months (net values in percent) (positive changes minus negative changes)
0%
20%
40%
60%
High quality
High security
standards
Very good value
for money
Uniqueness
Excellent design
Advanced
technology
Authenticity
Sustainability
Fair production
Status symbol
Score – European Union Average Max
European Union 92
Index
9 Source: MADE-IN-COUNTRY INDEX (MICI) 2017, https://www.statista.com/page/Made-In-Country-Index
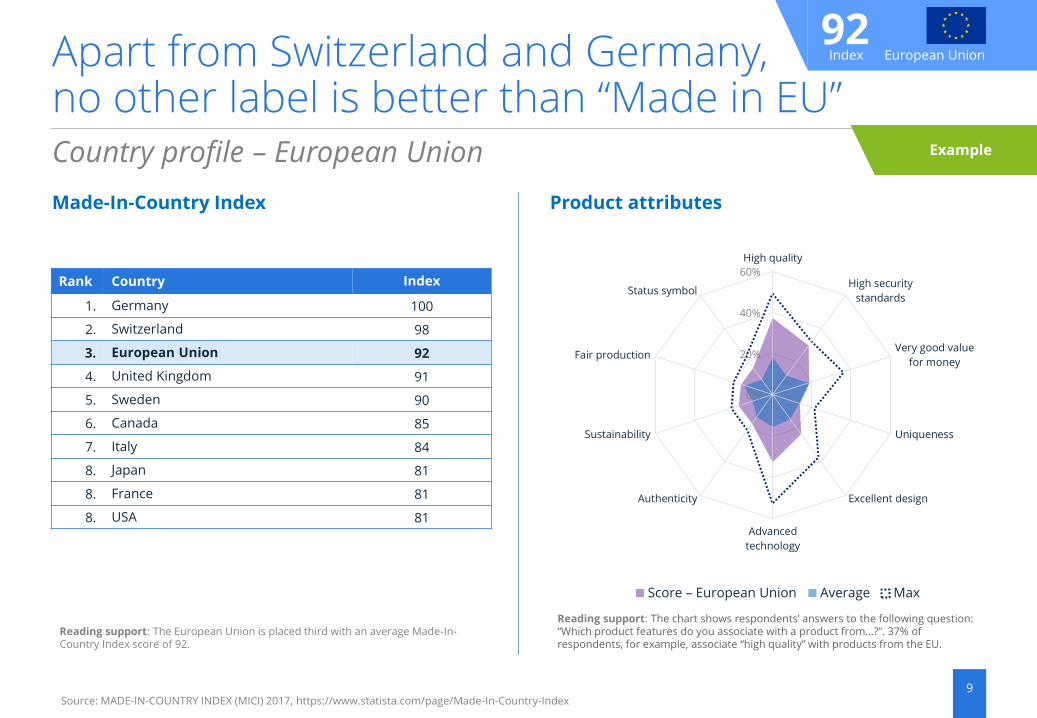
Country profile – European Union
Made-In-Country Index
Apart from Switzerland and Germany, no other label is better than “Made in EU”
Product attributes
Reading support: The European Union is placed third with an average Made-In-Country Index score of 92.
Reading support: The chart shows respondents’ answers to the following question: “Which product features do you associate with a product from…?”. 37% of respondents, for example, associate “high quality” with products from the EU.
Rank Country Index
1. Germany 100
2. Switzerland 98
3. European Union 92
4. United Kingdom 91
5. Sweden 90
6. Canada 85
7. Italy 84
8. Japan 81
8. France 81
8. USA 81
Example

10 Source: MADE-IN-COUNTRY INDEX (MICI) 2017, https://www.statista.com/page/Made-In-Country-Index
Country profile – European Union
Not just in South America: European products have a very good reputation worldwide
Top 10: “Made in European Union“ is strongest in these countries
Reading support: The European Union is given the highest rank by Algeria (rank: 1). The lowest rank given to the European Union was in Hong Kong (rank: 25).
Summary › “Made in EU” or “Made in the EU” has an
index score of 92 putting it at place three worldwide.
› European products enjoy an above-average reputation with regard to all product attributes. Quality, technology and high safety standards are especially well-rated.
› “Made in EU” products are highly regarded outside the European Union in particular (e.g. in South America).
› The European Union was ranked lowest by Canada (rank: 23) and Hong Kong (rank: 25).
European Union 92
Index
Country Rank
Algeria 1
Sweden 2
United Kingdom
2
Argentina 3
Columbia 3
Ireland 3
Spain 3
Venezuela 3
Austria 4
Bahrain 4
Example

0%
20%
40%
60%
High quality
High security
standards
Very good value
for money
Uniqueness
Excellent design
Advanced
technology
Authenticity
Sustainability
Fair production
Status symbol
Score – Japan Average Max
Japan 81
Index
11 Source: MADE-IN-COUNTRY INDEX (MICI) 2017, https://www.statista.com/page/Made-In-Country-Index
Country profile – Japan
Made-In-Country Index
Big in Japan: land of the rising sun stands in 8th place
Product attributes
Reading support: Japan takes 8th place with a Made-In-Country Index score of 81.
Reading support: This chart depicts respondents' answers to the question “Which attributes do you associate with products from …?”. For instance, 39% of respondents associate “high quality” with products from Japan.
Rank Country Index
1. Germany 100
2. Switzerland 98
3. European Union 92
4. United Kingdom 91
5. Sweden 90
6. Canada 85
7. Italy 84
8. Japan 81
8. France 81
8. USA 81
Average
Example

12 Source: MADE-IN-COUNTRY INDEX (MICI) 2017, https://www.statista.com/page/Made-In-Country-Index
Country profile – Japan
Japanese products stand for highest quality and technological innovation
Top 10: “Made in Japan” is strongest in these countries
Reading support: Japan is ranked highest by Ecuador, five other countries, and Japan itself (rank: 1 in each country). Its lowest ranking comes from China (rank: 40).
Summary › Altogether, “Made in Japan” is placed
8th in the world with an index score of 81, sharing the position with “Made in France” and “Made in USA“
› Not only Japan likes Japanese products best: Overall, products “Made in Japan“ are ranked first, second, or third in 17 more countries
› Products from Japan stand for very high quality, the most advanced technology, and a good price-performance ratio
› Japan receives high scores on these attributes from all over the world
› China is the great exception here, though, as it ranks Japanese products fairly low.
Japan 81
Index
Country Rank
Ecuador 1
Egypt 1
Japan 1
Malaysia 1
Russia 1
Singapore 1
Vietnam 1
Indonesia 2
Pakistan 2
Philippines 2
Example

All Statista features › More than 1 million statistics on 80,000 topics from 18,000
sources › All 41 industry reports worth €490 each if purchased
separately › Approx. 3,000 Statista dossiers worth €250 each if purchased
separately › Study database including some 20,000 third-party studies and
sources database Exclusive content for Corporate Account customers › Digital Market Outlook: revenue figures and forecasts for 9
digital markets covering 94 sub-segments and 50 countries › Consumer Market Outlook: relevant KPIs and forecasts for 16
consumer markets covering 150 product categories and 29 countries worldwide
13
Made-In-Country Index 2017 features
The Corporate Account includes all features and exclusive content
The MICI Report 2017 is a free feature of our Corporate and Enterprise Accounts
Overall ranking › The overall ranking based on the Made-In-Country Index › 49 countries plus European Union Change in country image perception › Change in country image perception over the last 12 months › – Top 10 plus the overall ranking Perceived product attributes › Quality, security standards, value for money, uniqueness,
design, advanced technology, authenticity, sustainability, fair production, status symbol
› Top 10 plus the overall ranking for each product attribute Country profiles › Detailed profile on each country
Sample › 43,034 respondents from 52 countries › Each country was assessed by at least 2,500 people
Lodovica Biagi Manager of Customer Relations [email protected]
Your Contact
Purchase now

Released:
Author, imprint & disclaimer
Imprint Statista ▪ Johannes-Brahms-Platz 1 ▪ 20355 Hamburg ▪ +49 40 413 49 89 0 ▪ www.statista.com Disclaimer This study is based on survey and research data of the previously mentioned sources. The forecasts and market analysis presented were researched and prepared by Statista with great care. For the presented survey data, estimations and forecasts; Statista cannot assume any warranty of any kind. Surveys and forecasts contain information that does not naturally represent a reliable basis for decisions in individual cases and may be in need of further interpretation. Therefore Statista is not liable for any damage arising from the use of statistics and data provided in this report.
As Statista’s Head of Market Research in the Strategic Market Insights unit, Nicolas drives the creation of exclusive data and insights for the Statista platform
Nicolas Loose
Head of Market Research | Strategic Market Insights
March 2017