Made In China China’s Growing Appetite for...
43
Made In China China’s Growing Appetite for Minerals by David Menzie and Pui-Kwan Tse
Transcript of Made In China China’s Growing Appetite for...
Made In China
China’s Growing Appetite for Minerals
by David Menzie and Pui-Kwan Tse
China in 2007
Rapid economic growth since 1990
Growth “spreading” to other countries
Economic growth leads to increased minerals use
Has affected global markets
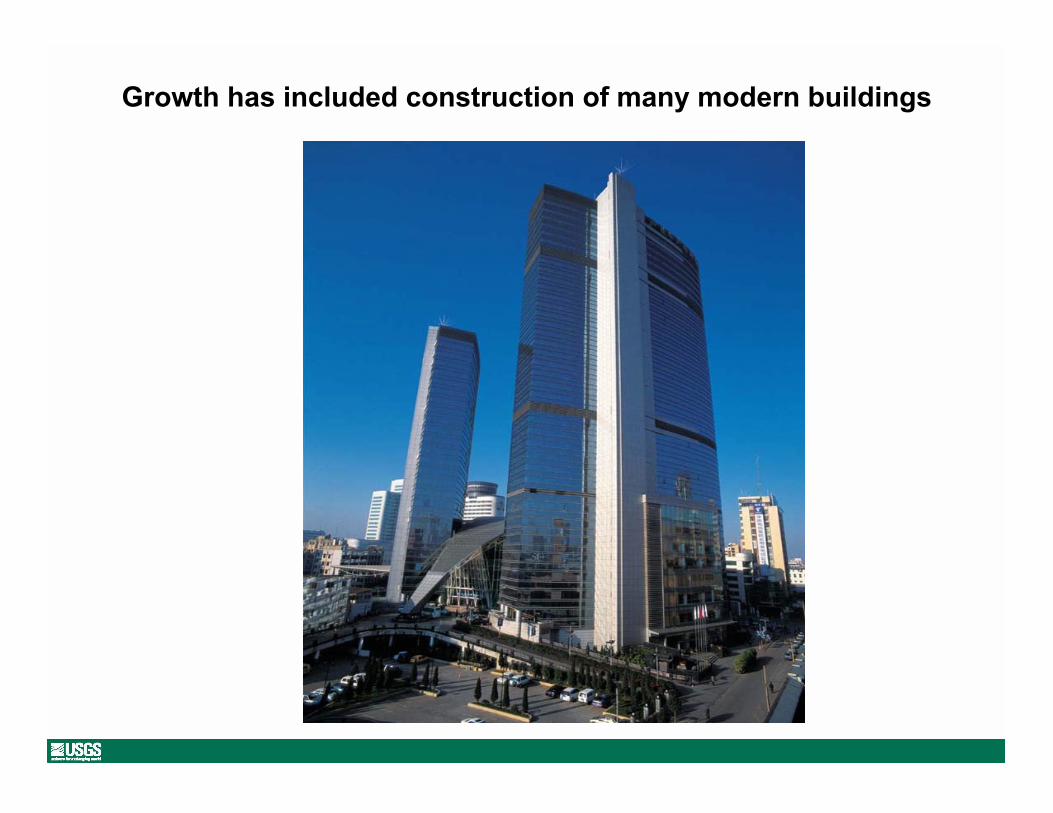
Growth has included construction of many modern buildings
Copper Consumption per Capita
Post-World War II Japan
-
2.00
4.00
6.00
8.00
10.00
12.00
14.0019
5019
5319
5619
5919
6219
6519
6819
7119
7419
7719
8019
8319
8619
8919
9219
9519
9820
01
Year
Kilo
gra
ms p
er
Cap
ita
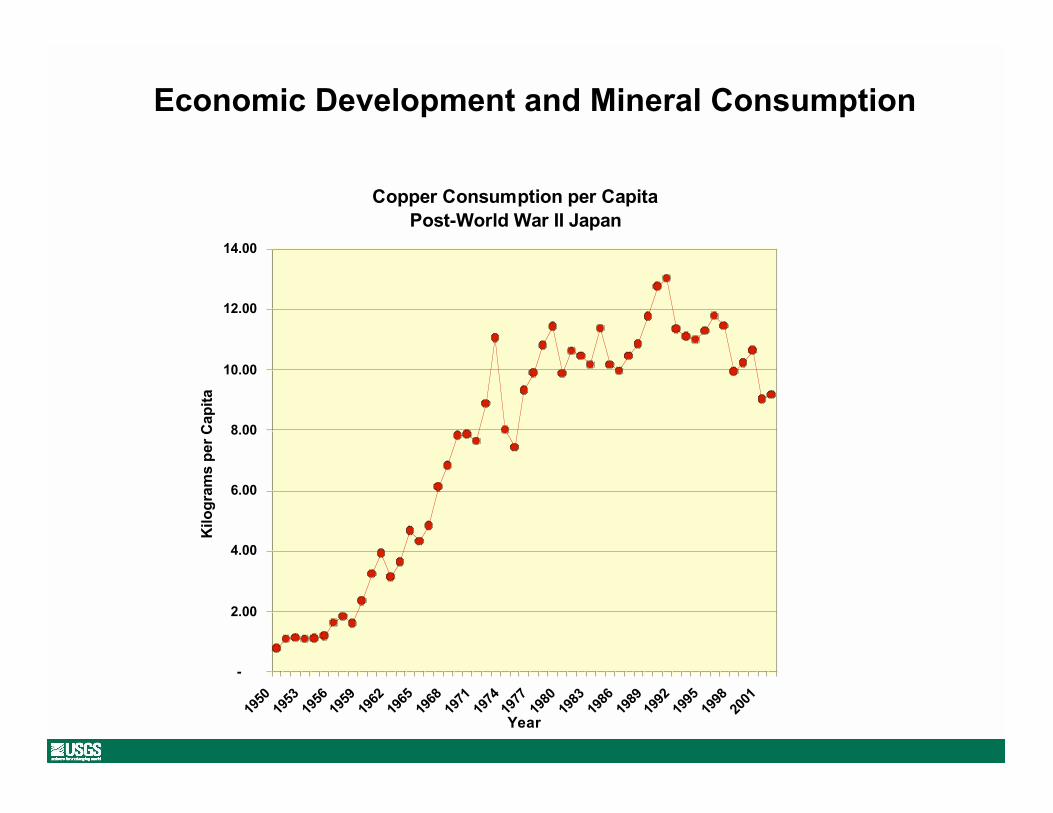
Economic Development and Mineral Consumption

Economic Development and Mineral Consumption
Copper consumption was very low (< 1kg/person) atthe beginning of the post-World War II period.Consumption increased very rapidly from 1954 to1973. After 1973, copper consumption has beenabout 10 kg/person.
At low income (GDP/person) levels, mineralconsumption is low. When a country industrializes,income rises and mineral consumption rises. Once acountry has industrialized, mineral consumptionstabilizes at a higher level.
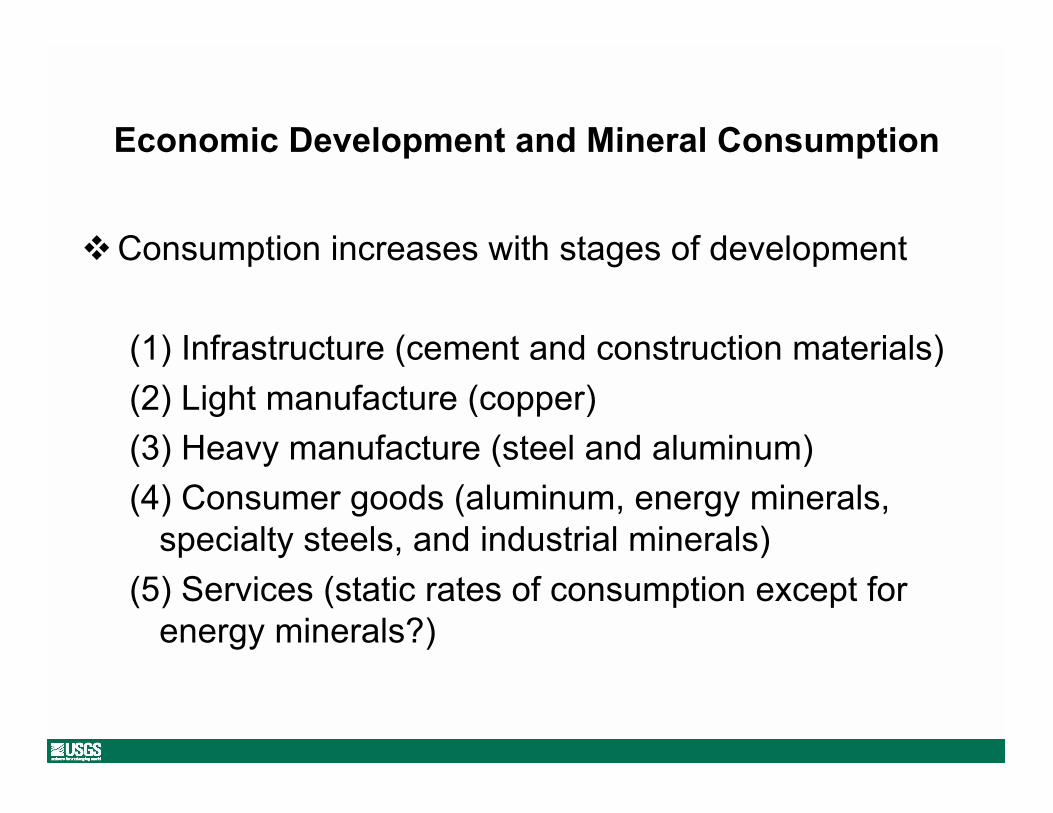
Economic Development and Mineral Consumption
Consumption increases with stages of development
(1) Infrastructure (cement and construction materials)
(2) Light manufacture (copper)
(3) Heavy manufacture (steel and aluminum)
(4) Consumer goods (aluminum, energy minerals,
specialty steels, and industrial minerals)
(5) Services (static rates of consumption except for
energy minerals?)
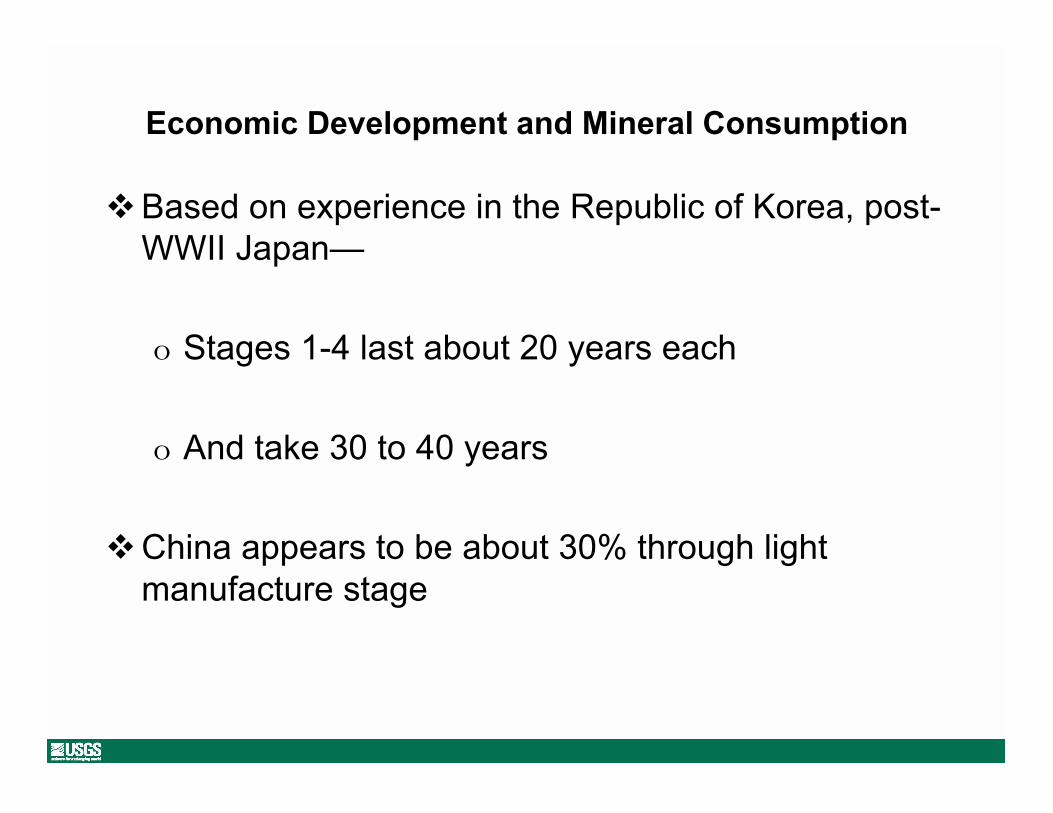
Based on experience in the Republic of Korea, post-
WWII Japan—
o Stages 1-4 last about 20 years each
o And take 30 to 40 years
China appears to be about 30% through light
manufacture stage
Economic Development and Mineral Consumption
Economic Development and Mineral Consumption
This presentation measures mineral consumption of minerals byindustries, as material that is used to manufacture goods rather thanmaterial that is in consumer goods.
Consumption of a mineral commodity can be measured at severalpoints in the production and use of the commodity including ores,concentrates (physically concentrated ore), refined product, orfabricated products.
The presentation refers to refined products unless otherwiseindicated.
China Today

China and the United States in 2005
4%10%Economic growth rate
$41,400$7,200GDP/capita
$12.27 trillion$9.41 trillionGross Domestic Product(GDP)
0.3 billion1.30 billionPopulation
9,629,091 km29,596,960 km2Area
United StatesChina
(1) GDP and GDP per capita are expressed in purchasing power equivalent.
(2) China’s economy doubles every 8 to 10 years, depending upon the growth rate, which averages
7 to 9 percent.

China’s Share of World Mineral Production in 2005
1 26Zinc
1 87Tungsten
1 35Tin
1 31Steel, crude
3 12Silver
3 22Molybdenum
1 75Magnesium
1 32Lead
4 9Gold
2 16Copper
1 86Antimony
1 24Aluminum
Metals:
1 96Rare earths
1 51Fluorspar
1 45Cement
Industrial minerals:
Rank PercentageCommodity
As China’s economy grows, domestic consumption will take a larger share of theproduction of these minerals.

Infrastructure
Cement
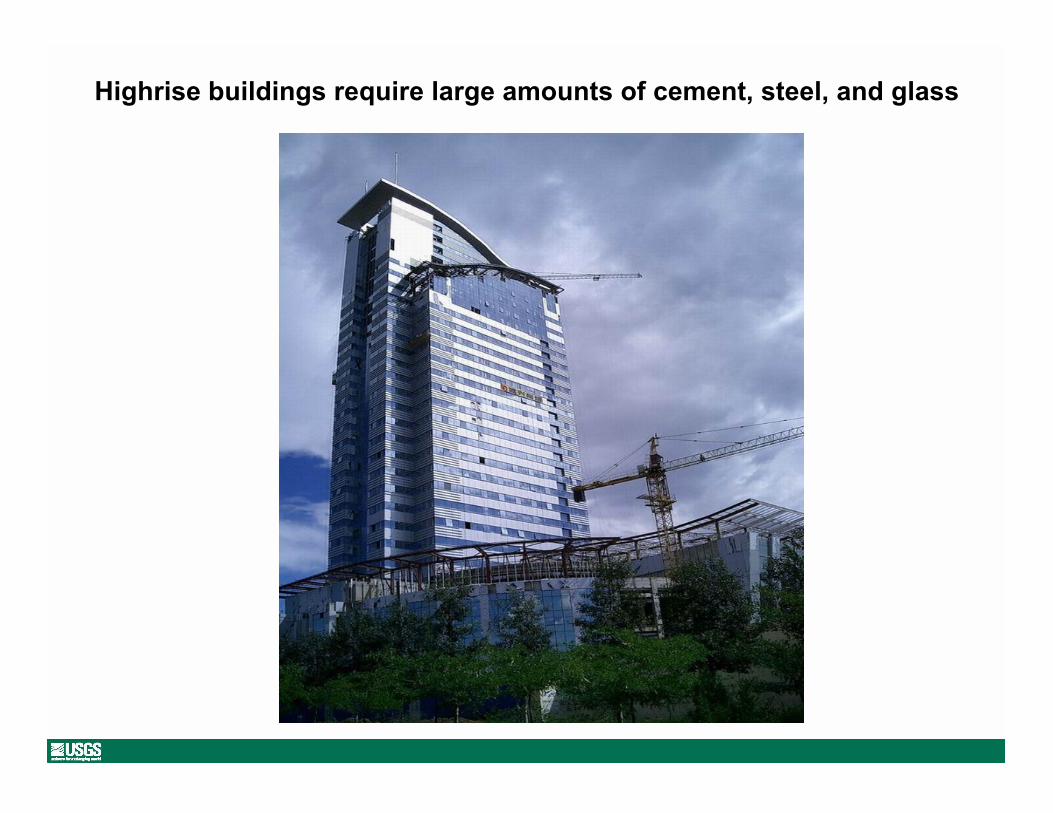
Highrise buildings require large amounts of cement, steel, and glass
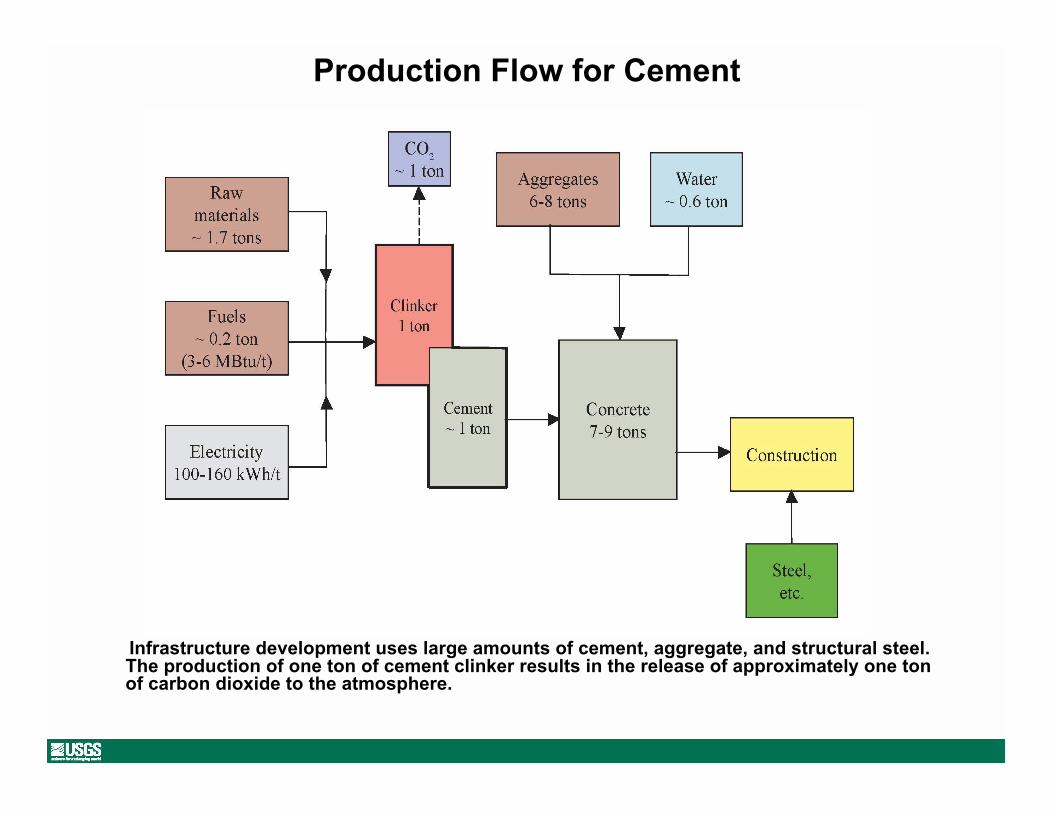
Production Flow for Cement
Infrastructure development uses large amounts of cement, aggregate, and structural steel.The production of one ton of cement clinker results in the release of approximately one tonof carbon dioxide to the atmosphere.
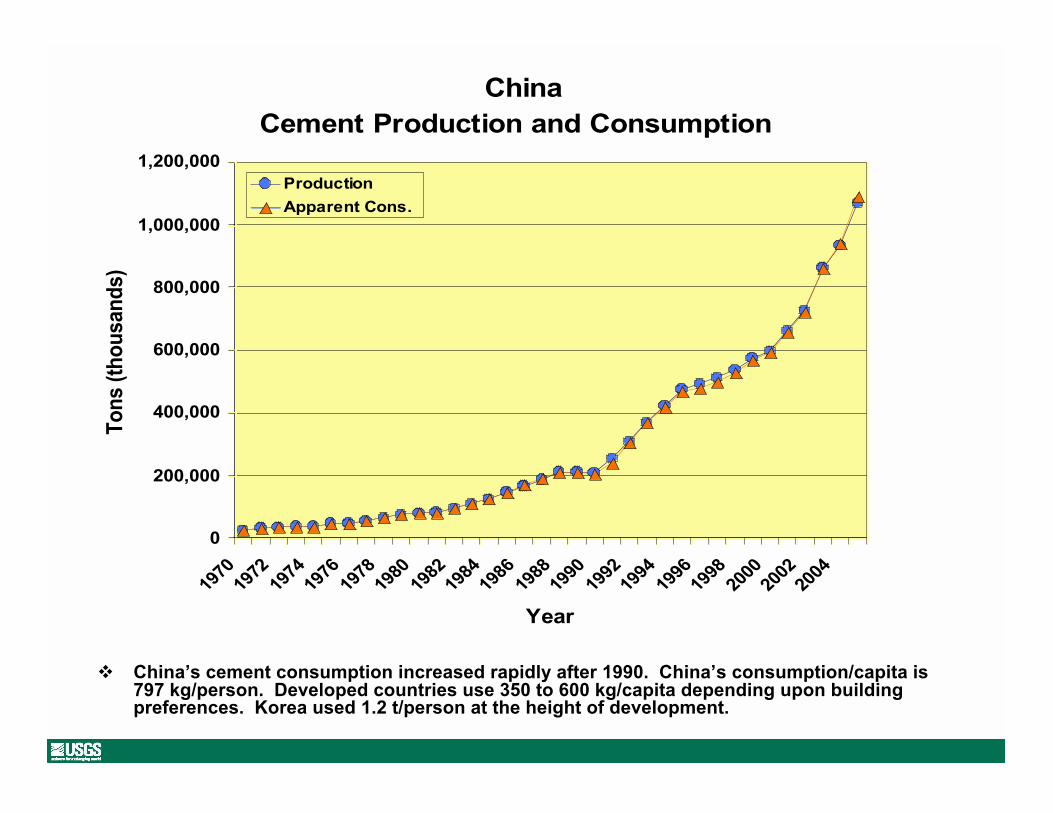
China’s cement consumption increased rapidly after 1990. China’s consumption/capita is797 kg/person. Developed countries use 350 to 600 kg/capita depending upon buildingpreferences. Korea used 1.2 t/person at the height of development.
China
Cement Production and Consumption
0
200,000
400,000
600,000
800,000
1,000,000
1,200,000
1970
1972
1974
1976
1978
1980
1982
1984
1986
1988
1990
1992
1994
1996
1998
2000
2002
2004
Year
To
ns (
tho
usan
ds)
Production
Apparent Cons.
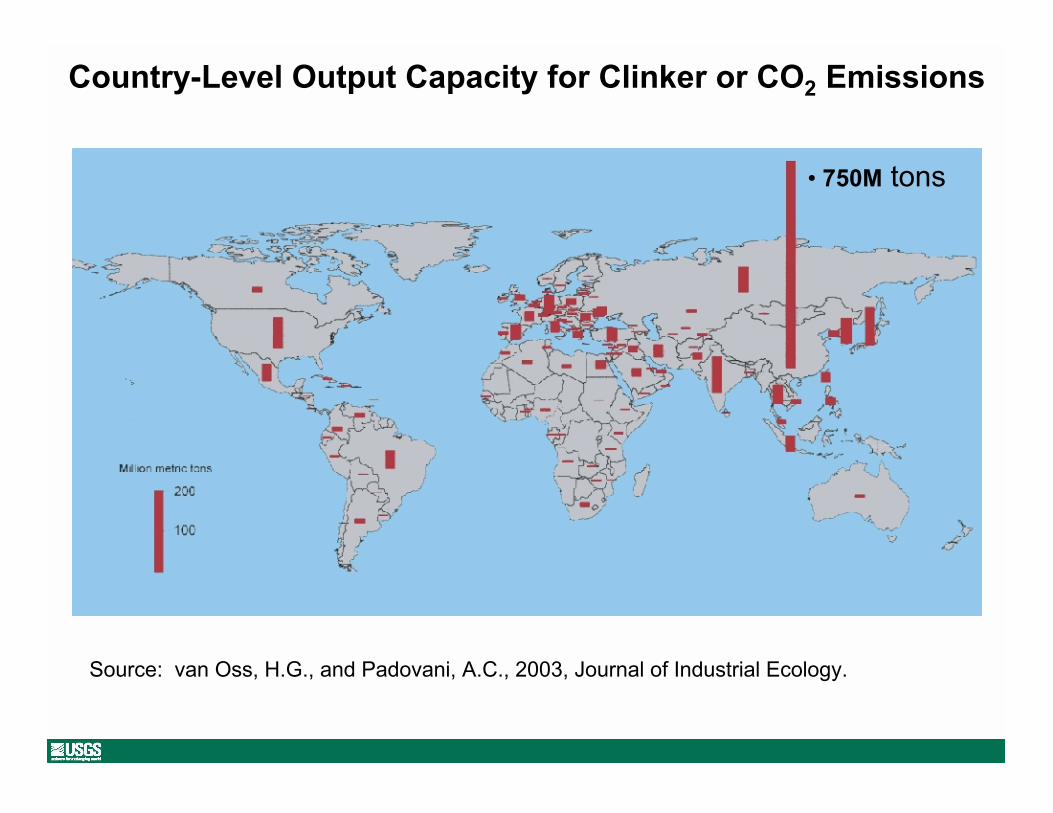
Country-Level Output Capacity for Clinker or CO2 Emissions
Source: van Oss, H.G., and Padovani, A.C., 2003, Journal of Industrial Ecology.
• 750M tons
Light Manufacture
Copper
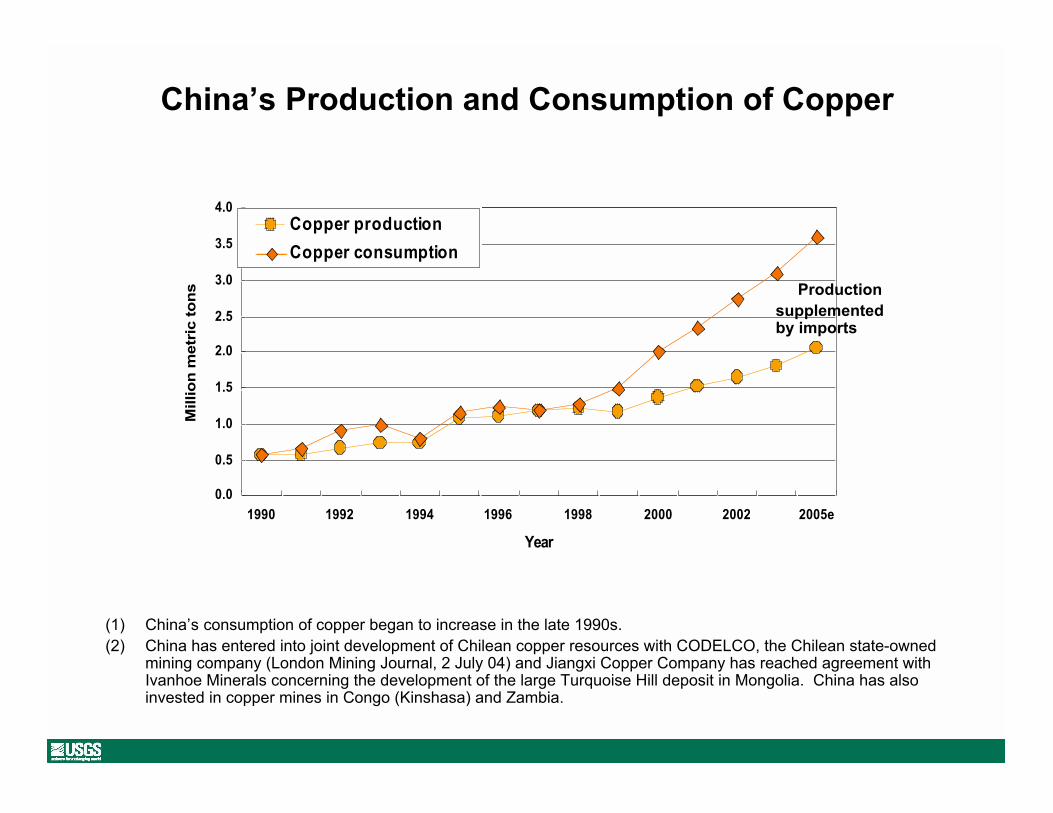
China’s Production and Consumption of Copper
0.0
0.5
1.0
1.5
2.0
2.5
3.0
3.5
4.0
1990 1992 1994 1996 1998 2000 2002 2005e
Year
Millio
n m
etr
ic t
on
s
Copper production
Copper consumption
(1) China’s consumption of copper began to increase in the late 1990s.
(2) China has entered into joint development of Chilean copper resources with CODELCO, the Chilean state-ownedmining company (London Mining Journal, 2 July 04) and Jiangxi Copper Company has reached agreement withIvanhoe Minerals concerning the development of the large Turquoise Hill deposit in Mongolia. China has alsoinvested in copper mines in Congo (Kinshasa) and Zambia.
Production
supplementedby imports
China has replaced the United States as the leading
copper consumer
China is the second leading producer of copper metal
China does not have large reserves of copper ores
China imports both copper concentrates and refined
copper.
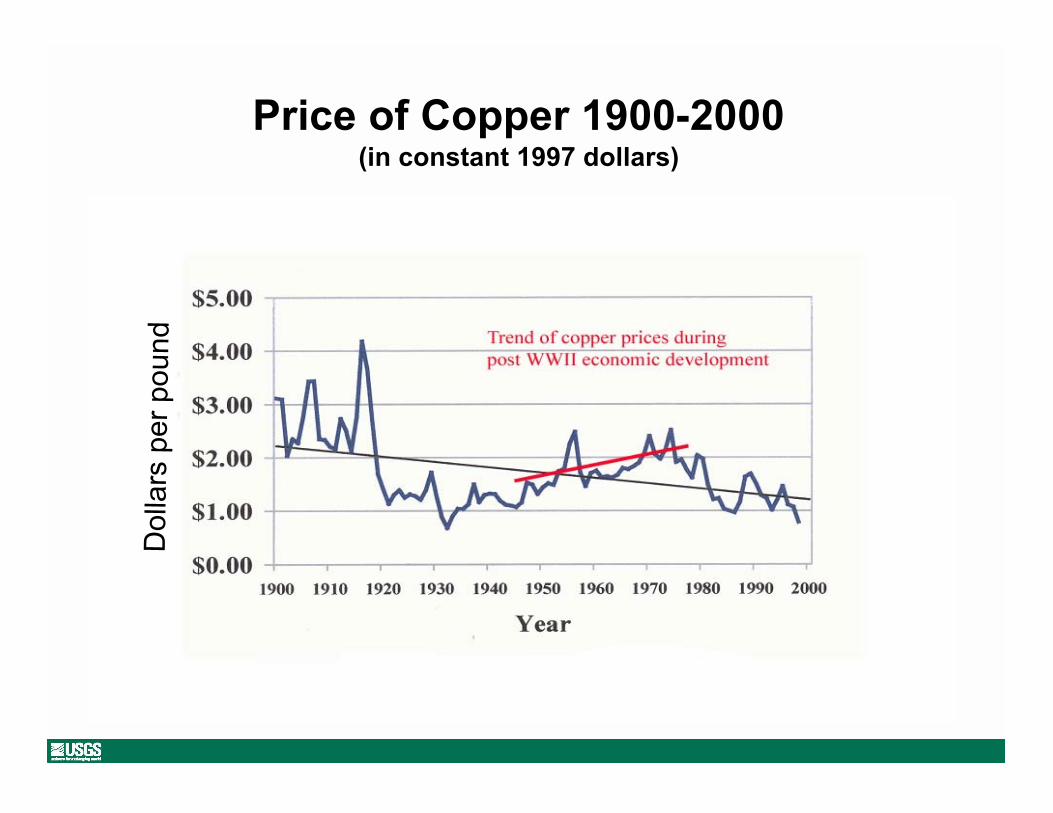
Price of Copper 1900-2000(in constant 1997 dollars)
Dolla
rs p
er
pound
There has been a great deal of debate about whether recentprice movements are just related to current position in thebusiness cycle, or whether this represents the beginning of alonger term rise in metal prices.
Since 2003 copper prices have risen, including a very rapid risein the 2nd quarter of 2006. Prices declined during the secondhalf of 2006, perhaps due to releases of materials from Chinesestockpiles and to weakness in the U.S. housing market.Currently, prices are still more than twice the highest pricerealized during previous business cycles.


There are environmental costs to the copper that we use in our autos, computers, air conditioners, etc.
Heavy Manufacture
Aluminum, Iron Ore, and Steel
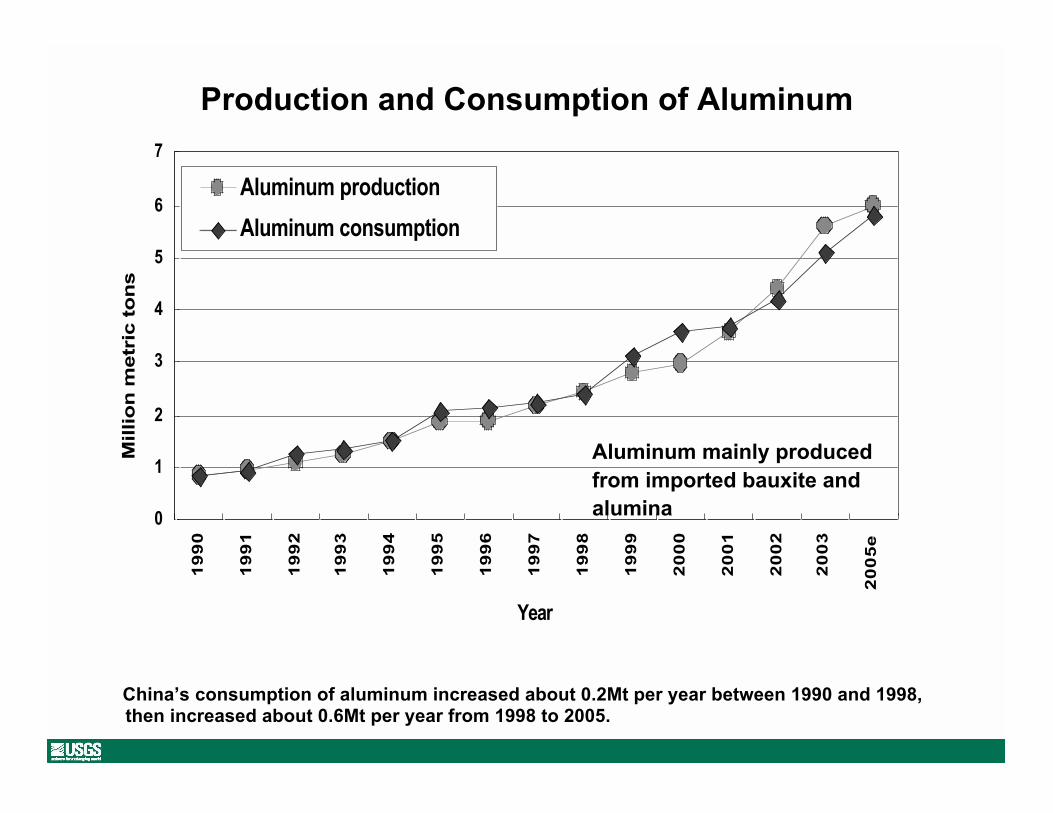
Production and Consumption of Aluminum
0
1
2
3
4
5
6
7
19
90
19
91
19
92
19
93
19
94
19
95
19
96
19
97
19
98
19
99
20
00
20
01
20
02
20
03
20
05
e
Year
Millio
n m
etr
ic t
on
s
Aluminum production
Aluminum consumption
China’s consumption of aluminum increased about 0.2Mt per year between 1990 and 1998,then increased about 0.6Mt per year from 1998 to 2005.
Aluminum mainly produced
from imported bauxite and
alumina
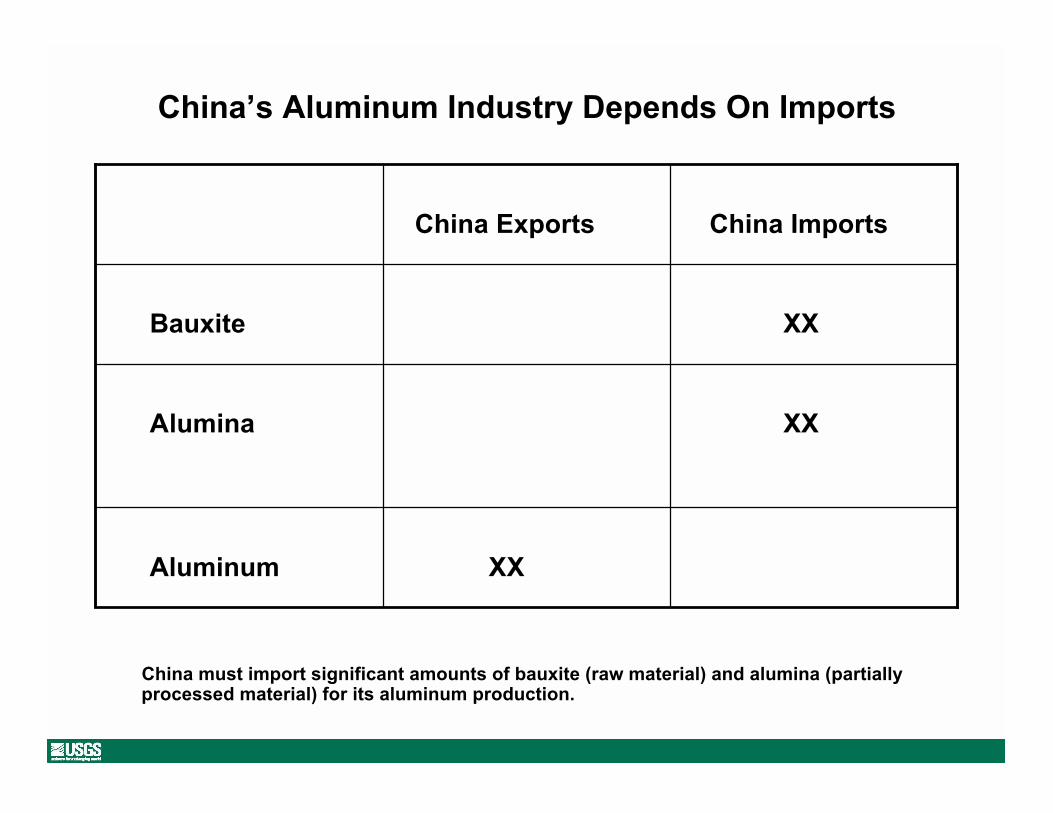
China’s Aluminum Industry Depends On Imports
XX Aluminum
XX Alumina
XX Bauxite
China Imports China Exports
China must import significant amounts of bauxite (raw material) and alumina (partiallyprocessed material) for its aluminum production.
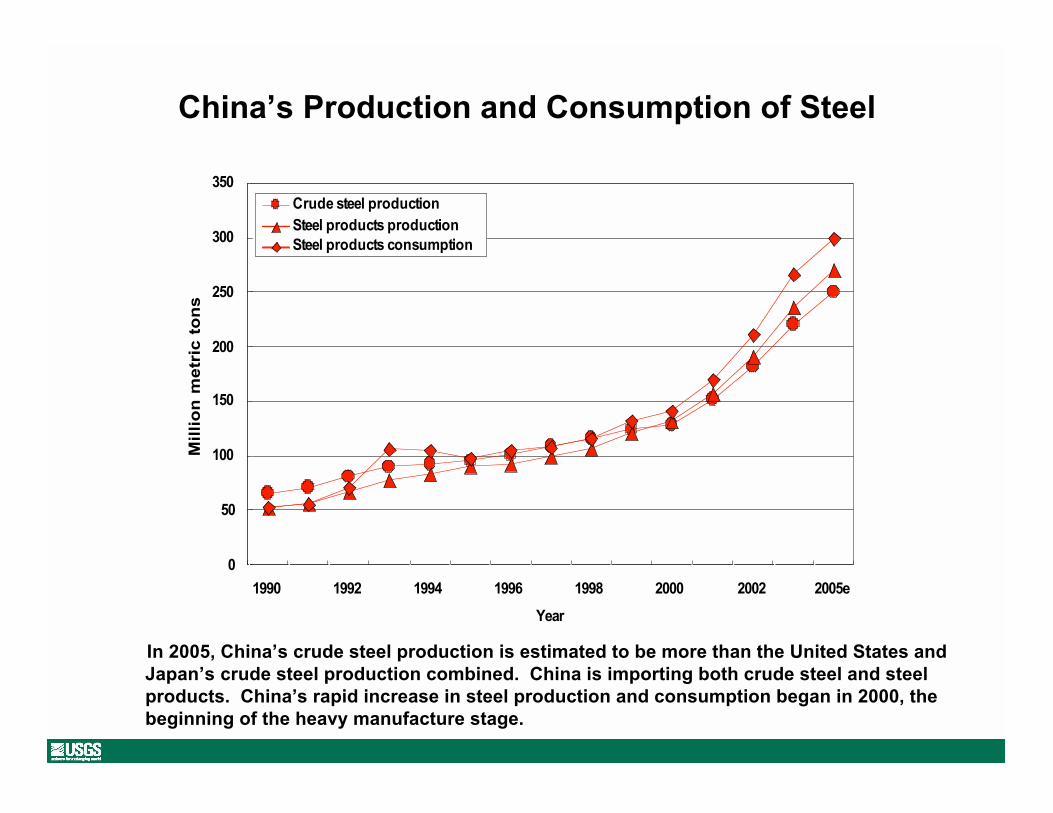
China’s Production and Consumption of Steel
0
50
100
150
200
250
300
350
1990 1992 1994 1996 1998 2000 2002 2005e
Year
Mil
lio
n m
etr
ic t
on
sCrude steel production
Steel products production
Steel products consumption
In 2005, China’s crude steel production is estimated to be more than the United States andJapan’s crude steel production combined. China is importing both crude steel and steelproducts. China’s rapid increase in steel production and consumption began in 2000, thebeginning of the heavy manufacture stage.
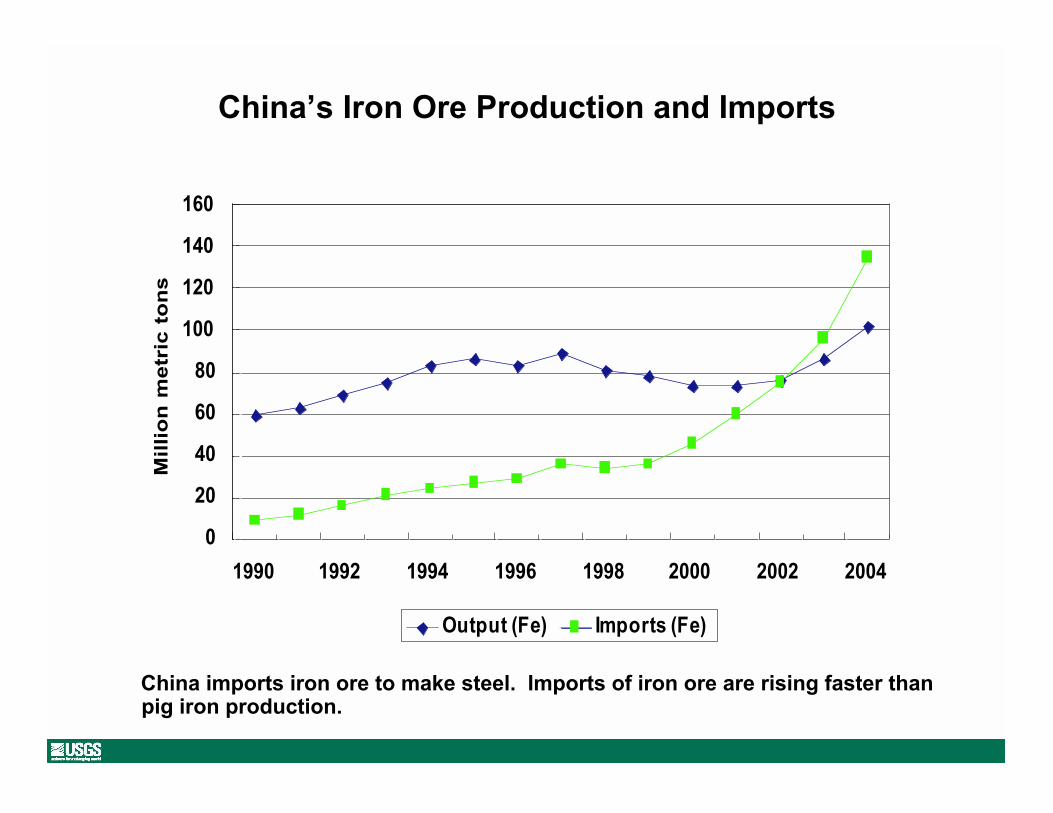
China’s Iron Ore Production and Imports
0
20
40
60
80
100
120
140
160
1990 1992 1994 1996 1998 2000 2002 2004
Mil
lio
n m
etr
ic t
on
s
Output (Fe) Imports (Fe)
China imports iron ore to make steel. Imports of iron ore are rising faster thanpig iron production.
Iron Ore in China
Consumption almost 700 Mt of crude ore in 2005
Low-grade domestic ores (average 32% Fe content)
Imports more than one-half of Fe as iron ore
Major import sources—Australia and Brazil
Plan to increase ownership in overseas joint-venture mines
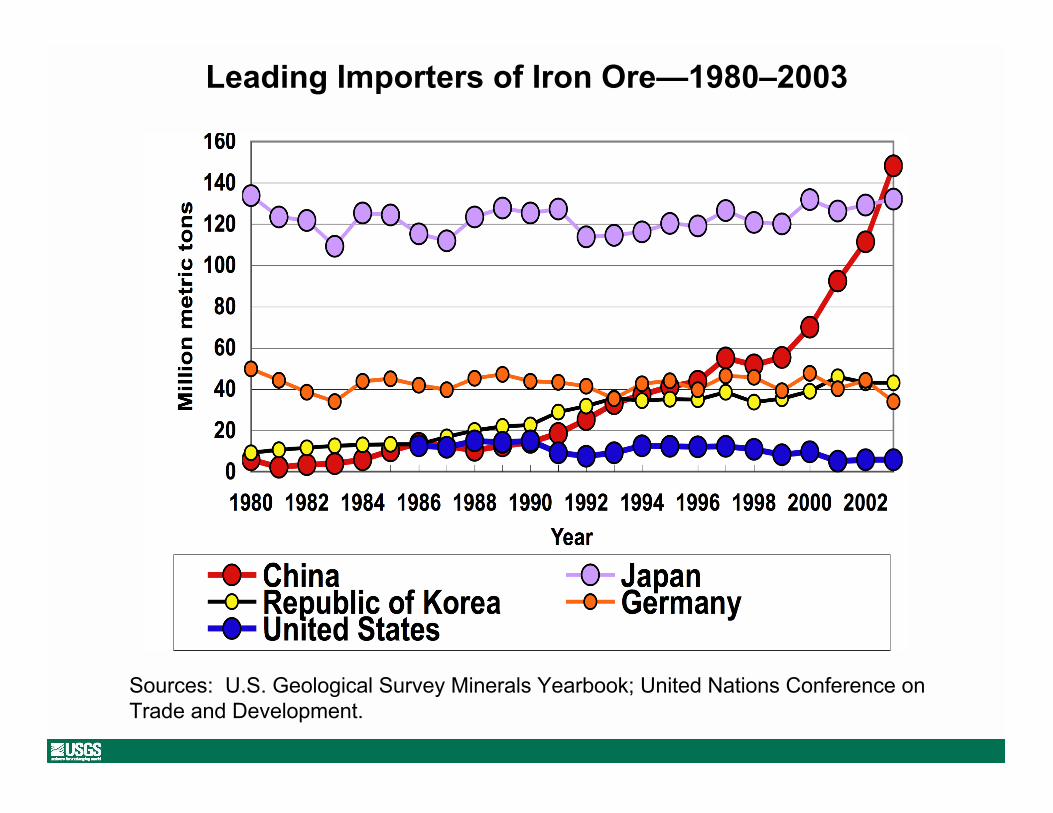
Leading Importers of Iron Ore—1980–2003
Sources: U.S. Geological Survey Minerals Yearbook; United Nations Conference on
Trade and Development.
China’s Affect on Iron Ore Market
Three companies account for about 70% of seaborne trade of
iron ore.
Iron ore prices rose 70% in 2005 and 18% in 2006.
In 2006, Chinese firms led price negotiations, but were unable
to prevent a significant price increase.
U.S. iron ore industry isolated from effects of China’s growth,
however, China purchased 30% of one U.S. iron ore mine.

Consumer Goods
TVs, Autos, and Electricity(aluminum, energy minerals, specialty
steels, and industrial minerals)
Purchases of consumer goods will have anincreasingly important role in China’smineral consumption in the future.
This is a look at China’s future.
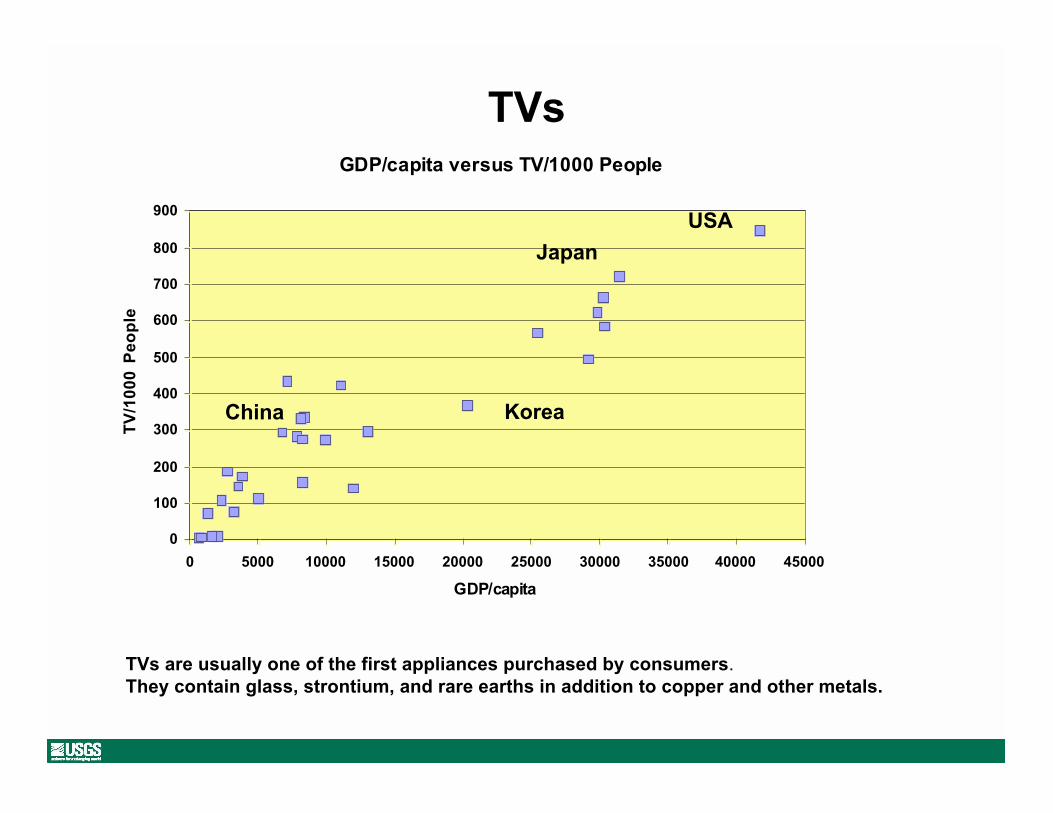
TVsGDP/capita versus TV/1000 People
0
100
200
300
400
500
600
700
800
900
0 5000 10000 15000 20000 25000 30000 35000 40000 45000
GDP/capita
TV
/10
00
Pe
op
le
TVs are usually one of the first appliances purchased by consumers. They contain glass, strontium, and rare earths in addition to copper and other metals.
Japan
KoreaChina
USA
Vehicles
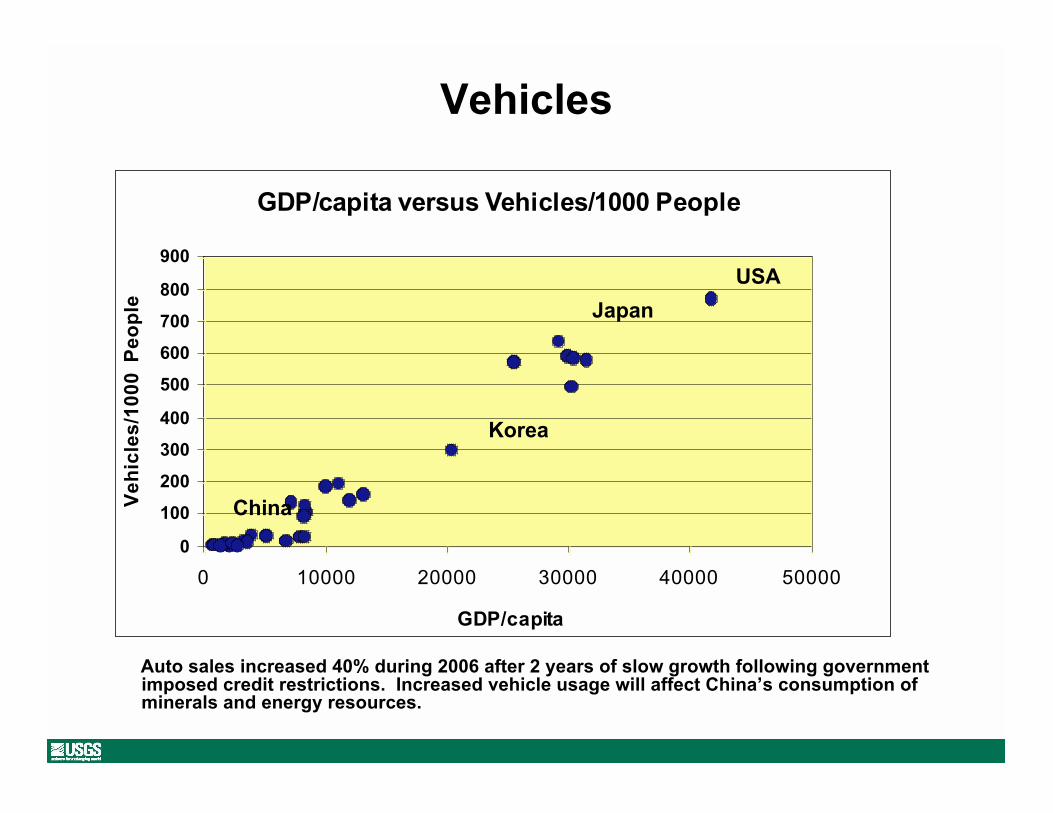
GDP/capita versus Vehicles/1000 People
0
100
200
300
400
500
600
700
800
900
0 10000 20000 30000 40000 50000
GDP/capita
Ve
hic
les
/10
00
P
eo
ple
Auto sales increased 40% during 2006 after 2 years of slow growth following governmentimposed credit restrictions. Increased vehicle usage will affect China’s consumption ofminerals and energy resources.
China
Korea
Japan
USA

Metals in Autos

Electric Power
China’s rapidly urbanizing population is using more electricity

Consumption of Electricity and GDP/Capita
0
2,000
4,000
6,000
8,000
10,000
12,000
14,000
0 5,000 10,000 15,000 20,000 25,000 30,000 35,000 40,000 45,000
GDP/Capita
Kil
ow
att
ho
urs
of
Ele
ctr
icit
y
USA
JapanKorea
China
China will require major expansion of its electric power system as it develops.This will require large amounts of steel, copper, and aluminum.

Implications
Environmental
Economic growth will dramatically increase consumption of
minerals
This will create large environmental residuals
And will require new strategies to increase recycling,
remanufacturing, and reuse

Strategic and Political
China is aggressively seeking minerals in Africa and Latin
America
And increasing foreign investment in these regions
Increased competition for mineral supplies
Possible increase in trade disputes
Global Markets
High mineral prices could continue
Greatly increased investment will be required for minerals
development
China’s imports of minerals are rising and her exports of
minerals are declining (rare-earth elements, tin, and tungsten)

For additional USGS information on China’s mineral
industries visit http://minerals.usgs.gov/minerals
Then click on “countries” followed by clicking on Asia in
the world map, and
Then click on “China” on the map of Asia