
Made in America
9
Member FINRA/SIPC Page 1 of 5 LPL FINANCIAL RESEARCH Weekly Economic Commentary August 20, 2012 John Canally, CFA Economist LPL Financial Made in the USA The United States has run a trade deficit (importing more goods and services from other countries than it exports to other countries) since the mid-1970s. Although the trade deficit narrows during recessions — imports typically fall faster than exports during a recession — the trade gap has increased over time, and currently stands at around 4% of Gross Domestic Product (GDP) [Figure 1] . This large and persistent trade deficit acts as a drag on overall GDP growth, as exports boost GDP growth and imports detract from growth. In addition, the trade deficit has put downward pressure on the US dollar and has contributed to foreigners owning more than 50% of our Treasury debt. Along with our massive budget deficit, the trade deficit is one of the major economic challenges facing the United States. The trade deficit in particular has fostered the conventional wisdom repeated often by many market observers and members of the financial media: “we don’t make anything in this country anymore,” or “everything I buy or own is made in China.” In this week’s Weekly Economic Commentary, we examine the drivers of our trade deficit and focus on the details of what we import and export. Inside Look at U.S. Trade Deficit The trade deficit is computed by adding up the value of all the goods and services made in the United States and shipped to other countries, and subtracting the value of all the goods and services that were imported from other countries. Our large deficit on the goods side (around $740 billion in 2011) more than offsets the trade surplus (around $180 billion in 2011) we have on the service side of the ledger. Combined, our goods and services trade deficit was $560 billion in 2011. The composition of the deficit on the goods side (what we import) contributes to the notion that “we don’t make anything in the U.S. anymore,” while the “hidden” surplus on the service side gets little attention. (See Figure 3 for the top-10 categories of exported and imported goods and services). In 2011, the last full year of data available, the United States exported nearly $1.5 trillion worth of goods overseas, but imported $2.2 trillion worth of goods.* The result was a goods trade deficit of more than $700 billion. We exported over $600 billion of services, while importing around $425 billion on the service side, for a trade surplus on services of nearly $180 billion. Please see the LPL Financial Research Weekly Calendar on page 3 1 The United States Has Run a Trade Deficit Every Year Since the Mid-1970s Source: Haver Analytics 08/17/12 (Shaded areas indicate recession) 05 10 95 00 90 85 75 80 70 65 60 Trade Deficit (Goods and Services) % of GDP 2 0 -2 -4 -6 Highlights Most of us are aware of the large U.S. trade deficit. It is easy to fall into the mindset that nothing is made here anymore. We export more than we import in many areas. These exports tend to be service categories, or what we might call “American know-how.” Our top service export is business and professional and technical services ($134 billion in 2011). *Import and export data on both goods and service are available monthly, but for ease of comparison we will limit our discussion to the annual data for 2011.
-
Upload
scott-perry -
Category
Documents
-
view
220 -
download
0
description
Weekly market commentary
Transcript of Made in America
Member FINRA/SIPCPage 1 of 5
LPL F INANCIAL RESEARCH
Weekly Economic CommentaryAugust 20, 2012
John Canally, CFAEconomist LPL Financial
Made in the USA
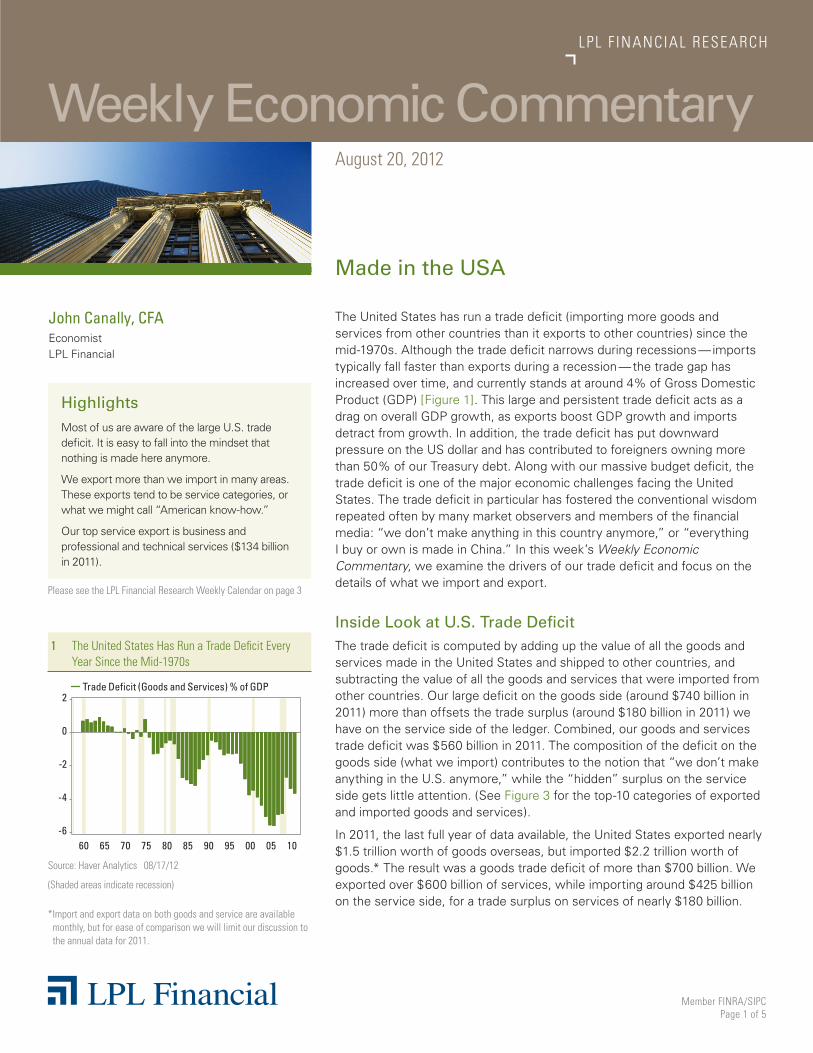
The United States has run a trade deficit (importing more goods and services from other countries than it exports to other countries) since the mid-1970s. Although the trade deficit narrows during recessions — imports typically fall faster than exports during a recession — the trade gap has increased over time, and currently stands at around 4% of Gross Domestic Product (GDP) [Figure 1]. This large and persistent trade deficit acts as a drag on overall GDP growth, as exports boost GDP growth and imports detract from growth. In addition, the trade deficit has put downward pressure on the US dollar and has contributed to foreigners owning more than 50% of our Treasury debt. Along with our massive budget deficit, the trade deficit is one of the major economic challenges facing the United States. The trade deficit in particular has fostered the conventional wisdom repeated often by many market observers and members of the financial media: “we don’t make anything in this country anymore,” or “everything I buy or own is made in China.” In this week’s Weekly Economic Commentary, we examine the drivers of our trade deficit and focus on the details of what we import and export.
Inside Look at U.S. Trade DeficitThe trade deficit is computed by adding up the value of all the goods and services made in the United States and shipped to other countries, and subtracting the value of all the goods and services that were imported from other countries. Our large deficit on the goods side (around $740 billion in 2011) more than offsets the trade surplus (around $180 billion in 2011) we have on the service side of the ledger. Combined, our goods and services trade deficit was $560 billion in 2011. The composition of the deficit on the goods side (what we import) contributes to the notion that “we don’t make anything in the U.S. anymore,” while the “hidden” surplus on the service side gets little attention. (See Figure 3 for the top-10 categories of exported and imported goods and services).
In 2011, the last full year of data available, the United States exported nearly $1.5 trillion worth of goods overseas, but imported $2.2 trillion worth of goods.* The result was a goods trade deficit of more than $700 billion. We exported over $600 billion of services, while importing around $425 billion on the service side, for a trade surplus on services of nearly $180 billion.
Please see the LPL Financial Research Weekly Calendar on page 3
1 The United States Has Run a Trade Deficit Every Year Since the Mid-1970s
Source: Haver Analytics 08/17/12
(Shaded areas indicate recession)
05 1095 00908575 80706560
Trade Deficit (Goods and Services) % of GDP2
0
-2
-4
-6
HighlightsMost of us are aware of the large U.S. trade deficit. It is easy to fall into the mindset that nothing is made here anymore.
We export more than we import in many areas. These exports tend to be service categories, or what we might call “American know-how.”
Our top service export is business and professional and technical services ($134 billion in 2011).
* Import and export data on both goods and service are available monthly, but for ease of comparison we will limit our discussion to the annual data for 2011.

LPL Financial Member FINRA/SIPC Page 2 of 5
WEEKLY ECONOMIC COMMENTARY
Transportation Equipment Tops U.S. Goods ExportsA few items stand out on the two top-10 lists of goods exports and imports. On the export side, transportation equipment (cars, trucks, aircraft, and parts for those categories) is our largest goods export, but we still import more ($267 billion) than we export ($200 billion) thanks to the close proximity of the vehicle production facilities in Canada and Mexico and our appetite for foreign vehicles. Exports of petroleum and coal as well as our exports of agricultural products help to support hundreds of thousands, if not millions of jobs in these sectors of the economy. One interesting category on the export side is scrap and waste. Our exports tend to be high-end, high-value exports. Apparently, our exports are so high-end that we send $39.1 billion worth of waste and scrap overseas from our manufacturing processes. Of course, some of the scrap and waste is consumer-generated recycled materials.
Consumer and Consumer-Related Items Dominate U.S. Goods ImportsThe list of our top-10 imported items is full of consumer and consumer-related items like apparel, computers and electronic equipment, transportation equipment, oil and gas, petroleum and coal, and the somewhat deceiving “miscellaneous manufactured goods” category. This category of imported goods — which includes everyday household items like jewelry, sporting goods, toys and games, office supplies, etc., — is commonplace in the grocery stores and big box discount stores we shop in every day. We imported $104 billion of these goods in 2011 and exported just $43 billion. Although this category is not the main driver of our overall trade deficit, it is certainly one of the most visible manifestations of it, and contributes to the overall perception that “we don’t make anything here anymore.”
U.S. Service Exports Are Growing Rapidly What is not as visible to most Americans (and to most pundits and media outlets) is that the United States is a net exporter of services, and that our service exports are growing rapidly, as consumers and businesses around the world demand America’s intellectual property and expertise — and culture too. Service exports were at an all-time high in 2011, and have more than doubled in the past 10 years. Eighty percent of U.S. jobs are service-related, and although much is made of the maligned “hamburger flipper” service job, many U.S. service-related jobs require advanced degrees and advanced skills, and help to make possible our booming business in service exports.
Good Old American Know-How in Demand Our top service export, at $134 billion in 2011, business and professional and technical services, is a fancy name for good old American know-how. When looking at goods and service exports together, this would be our fifth-largest export. It includes fields ranging from education, oil field services,
Our exports are so high-end that we send $39.1 billion worth of waste
and scrap overseas.
Although much is made of the maligned “hamburger flipper”
service job, many U.S. service-related jobs require advanced degrees and
advanced skills, and help to make possible our booming business.

LPL Financial Member FINRA/SIPC Page 3 of 5
WEEKLY ECONOMIC COMMENTARY
and entertainment, to advertising, computer and data processing services, database and other information services, as well as research, development, and testing services*.
This category of exports is basically invisible to average Americans unless they (or someone they know) work in these fields. Around 18 million Americans (16% of overall employment in the United States) are employed in this category of service exports, and unlike most other measures of employment, this category has completely recovered from the Great Recession. Of course, not all of those 18 million jobs are tied to exports, but a sizable portion is.
Exporting Hollywood Another service export category that stands out is royalties, license fees, copyrights, and broadcast rights, where we exported $77 billion in 2011. This includes fees earned by U.S. television networks and movie studios selling licenses to foreign media outlets for overseas broadcasts of TV shows like CSI, Family Guy, Jersey Shore, and the Super Bowl, and movies like The Avengers and Spiderman. It also includes U.S. firms like Microsoft, Apple, Oracle, and Cisco licensing their software for use overseas. Similarly, U.S. companies garner $44 billion in fees by selling their patented manufacturing processes to overseas firms. Financial services (investment banking, advisory fees, trading, trust, custody, etc.) provided by Wall Street
2 Professional and Business Services Jobs Are at an All-Time High, Driven by Booming Exports of These Services
Source: Bureau of Labor Statistics, Haver Analytics 08/17/12
(Shaded areas indicate recession)
11 1209 10080705 0604030201009998
All Employees: Professional & Business ServicesSeasonally Adjusted, Millions
18.75
18.00
17.25
16.50
15.75
15.00
14.25
2012
20 Aug
21 Aug Lockhart *
22 Aug � Existing Home Sales (Jul) � FOMC Minutes � China: HSBC Flash PMI (Aug) � Germany: Bond Auction
23 Aug � Initial Claims (8/18) � New Home Sales (Jul)
� Eurozone: Consumer Confidence (Aug) � Eurozone: PMI (Aug) � Germany: PMI (Aug) � France: PMI (Aug) � Germany: GDP (Q2)
24 Aug � Durable Goods Orders (Jul) � U.K.: GDP (Q2) � Europe: Merkel meets Greek PM � Spain: Spanish Cabinet Meets To Discuss
Bank Bailout
Fed Global Notables
LPL Financial Research Weekly Calendar
U.S. Data
Hawks: Fed officials who favor the low inflation side of the Fed’s dual mandate of low inflation and full employment
Doves: Fed officials who favor the full employment side of the Fed’s dual mandate
* Voting members of the Federal Open Market Committee (FOMC)
These services also include management consulting and public relations, legal, construction, engineering, architectural, mining, industrial services, installation, maintenance, equipment repair, and other services (including medical services).

LPL Financial Member FINRA/SIPC Page 4 of 5
WEEKLY ECONOMIC COMMENTARY
Exports
Category Billions
Goo
ds
Transportation equipment $200.7
Chemicals $187.7
Machinery (excluding electrical) $143.0
Computers and electronic products $123.5
Petroleum and coal $100.3
Agricultural products $69.5
Primary metals $65.3
Scrap and waste $39.1
Fabricated metals $36.7
Electrical equipment, appliances and components $34.1
Total Manufactured Goods Exports $1095.0
All Goods Exports $1480.6
Serv
ices
Business and professional and technical services $134
Travel (what foreign visitors spend in the United States) $116
Royalties, license fees, and other fees associated with copyrights, trademarks, franchises, rights to broadcast live events, software licensing
$77
Financial services $74
Industrial processes $44
Freight and port services $43
Passenger fares $37
Education $23
Insurance $15
Telecom $13
Imports
Category Billions
Goo
ds
Computers and electronic products $342.6
Oil and gas $279.8
Transportation equipment $267.9
Chemicals $216.0
Machinery except electrical $133.8
Petroleum and coal $141.2
Misc. manufactured goods $104.2
Primary metals $103.0
Apparel and accessories $82.1
Fabricated metals $53.5
Total Manufactured Goods Imports $1,767.6
All Goods Imports $2,187.0
Serv
ices
Business and professional and technical services $105
Travel (what US visitors spend when travelling abroad) $79
Insurance $57
Freight and port services $55
Passenger fares $31
Industrial processes $23
Financial services $16
Royalties, license fees, and other fees associated with copyrights, trademarks, franchises, rights to broadcast live events, software licensing
$14
Telecom $8
Education $6
Source: Bureau of Economic Analysis 08/17/12
3 2011 Top Ten — Exports & Imports
investment banks and other large commercial banks netted $74 billion in fees. Education exports — basically foreign students coming to the United States to study — generated $23 billion in 2011. Foreigners who visited the United States in 2011 spent a whopping $116 billion on hotels, rental cars, and other goods and services while they were here. Looking at combined goods and services export categories, travel would rank sixth.
With the exception of insurance services and freight and port services, the United States enjoys a trade surplus in every major category of services. Most major service export categories have experienced near 10% growth per year over the past 10 years, driven higher by fast-growing emerging market economies eager to consume good old American know-how, along with American culture (TV, movies, Times Square, Hollywood, and Disney World), and expertise ranging from accounting to software and, of course, our world-renowned colleges and universities. In short, the United States
Our fastest-growing exports (services) aren’t always as visible as some of the
items we import and consume every day.

WEEKLY ECONOMIC COMMENTARY
Member FINRA/SIPCPage 5 of 5
RES 3853 0812Tracking #1-093663 (Exp. 08/13)
Not FDIC/NCUA Insured | Not Bank/Credit Union Guaranteed | May Lose Value | Not Guaranteed by any Government Agency | Not a Bank/Credit Union Deposit
This research material has been prepared by LPL Financial.
To the extent you are receiving investment advice from a separately registered independent investment advisor, please note that LPL Financial is not an affiliate of and makes no representation with respect to such entity.
IMPORTANT DISCLOSURES The opinions voiced in this material are for general information only and are not intended to provide specific advice or recommendations for any individual. To determine which investment(s) may be appropriate for you, consult your financial advisor prior to investing. All performance reference is historical and is no guarantee of future results. All indices are unmanaged and cannot be invested into directly.
* Gross Domestic Product (GDP) is the monetary value of all the finished goods and services produced within a country's borders in a specific time period, though GDP is usually calculated on an annual basis. It includes all of private and public consumption, government outlays, investments and exports less imports that occur within a defined territory.
^ Federal Funds Rate is the interest rate at which depository institutions actively trade balances held at the Federal Reserve, called federal funds, with each other, usually overnight, on an uncollateralized basis.
† Private Sector – the total nonfarm payroll accounts for approximately 80% of the workers who produce the entire gross domestic product of the United States. The nonfarm payroll statistic is reported monthly, on the first Friday of the month, and is used to assist government policy makers and economists determine the current state of the economy and predict future levels of economic activity. It doesn’t include: - general government employees - private household employees - employees of nonprofit organizations that provide assistance to individuals - farm employees
The economic forecasts set forth in the presentation may not develop as predicted and there can be no guarantee that strategies promoted will be successful.
International investing involves special risks, such as currency fluctuation and political instability, and may not be suitable for all investors.
Purchasing Managers Index (PMI) is an indicator of the economic health of the manufacturing sector. The PMI index is based on five major indicators: new orders, inventory levels, production, supplier deliveries and the employment environment.
LPL Financial is not affiliated with any company noted herein. These mentions are for informational purposes only, and in no way reflect our view or endorsement of their products or services. This article is not an offer to buy or sell their products or services.
LPL Financial Research 2012 Forecasts � GDP 2%*
� Federal Funds Rate 0%^
� Private Payrolls +200K/mo.†
Please see our 2012 Outlook for more details on LPL Financial Research forecasts.
is still one of the world’s largest exporters of goods and services, and our fastest-growing exports (services) aren’t always as visible as some of the items we import and consume every day. �

Member FINRA/SIPCPage 1 of 4
Jeffrey Kleintop, CFAChief Market Strategist LPL Financial
LPL F INANCIAL RESEARCH
Weekly Market CommentaryAugust 20, 2012
Fall Forward
HighlightsThe past two years indicate that major policy actions must take place in the coming weeks in the United States and Europe to emerge from the soft spot and push the economy forward in the fall.
The coming weeks hold the potential for policy events that echo those of 2010 and 2011.
However, this year, the stock and bond markets are leading the policy actions — the rebound in stocks relative to bonds on the announcement of a third round of quantitative easing (QE3) and European policy actions have largely already happened.
Several weeks ago, we noted that the stock market was turning up while bonds were beginning to sell off and that meant the global economic surprise index was likely on the cusp of turning up or the rally would be short. Fortunately, the economic surprise index has started to move higher, supporting the stock market over bonds [Figure 1].
The G10 economic surprise index measures whether data reports come in better or worse than economists’ estimates for the world’s largest 10 economies. There are two stages to a rebound in the economic surprise index. At first, when the economic surprise index turns up, this is because economists’ expectations finally got too low after being too optimistic for some time. Then, after partially rebounding, a further rise is driven by the data not just being better than feared, but actually showing strength. So far, we are experiencing the early, rather than the later, stage of the rise in the surprise index. The economic data may no longer be worse than feared, but it remains weak in most areas including job growth and manufacturing activity.
Back in March, we published our Spring Slide indicators that forecast an economic soft spot would soon emerge along with a stock market slide as spring got underway, similar to what happened in 2010 and 2011. Now that the economy is fully entrenched in this year’s soft spot, it may be helpful once again to look at 2010 and 2011, to see what drivers emerged in the fall of those years to push the economy forward again.
The past two years indicate that major policy actions must take place in the coming weeks in the United States and Europe for the economy to fully emerge from the soft spot in the fall:
� In 2010, the Federal Reserve (Fed) pre-announced the second round of unconventional stimulus called quantitative easing (QE2) at their annual conference in Jackson Hole, WY on August 27. This followed the July passage of a trillion dollar bailout package in Europe.
� In 2011, the Fed announced the current stimulus program, Operation Twist, on September 21. This was followed swiftly by the German parliament ratifying the expansion of the European Financial Stability Facility (EFSF) on September 30.
In each year, the stock market turned sharply higher following these policy catalysts and economic data subsequently began to improve.
1 Economic Surprises Turn Positive Supporting Stocks Over Bonds
Source: LPL Financial, Bloomberg data 08/20/12
Citigroup Economic Surprise Index (CESI) measures the variation in the gap between the expectations and the real economic data.
The S&P 500 is an unmanaged index, which cannot be invested into directly. Past performance is no guarantee of future results.
20112010200920082007 2012
100
50
0
-50
-100
-150
40%
20%
0%
-20%
-40%
-60%
Citigroup Economic Surprise Index G10, Left Scale3-Month Return of S&P 500 Less Total Return of Barclays 10-Year Treasury, Right Scale

WEEKLY MARKET COMMENTARY
LPL Financial Member FINRA/SIPC Page 2 of 4
Here in 2012, the coming weeks are full of the potential for policy events that echo those of 2010 and 2011:
� The Fed may preannounce QE3 at the Jackson Hole, WY conference at the end of this month or at their upcoming September 13 meeting.
� The German constitutional court may rule favorably on the European Stability Mechanism (ESM) on September 12, with bond purchases by the European Central Bank (ECB) then conditional on a formal request from Spain or Italy.
� The next Troika, so-called because it is made up of the European Commission, International Monetary Fund, and ECB, review of Greece is on September 14. If favorable, Greece will obtain the next tranche of bailout funds.
Major policy actions are likely. In fact, just last week German Chancellor Merkel made some comments supporting the ECB’s communication on buying bonds, and rumors were circulating in Europe that Spain was preparing a request for a bailout. So there are plenty of policy drivers likely in the coming weeks to help the economy in the fall. But, unlike 2010 and 2011, this year the stock and bond markets are leading the policy actions. This sets up for a departure from the pattern of the past two years, since the rebound in stocks relative to bonds on the announcement of QE3 and European policy actions appears to have already largely taken place.
In addition, investors have reversed their preference and started to favor more aggressive, cyclical stocks over defensive, yield-oriented stocks in the past few weeks, as you can see in Figure 2.
We are likely to get the policy actions the markets are now expecting. The market has quietly drifted back to this year’s high on very low trading volume and volatility. In fact, the average absolute daily percent changes in the S&P 500 Index over the past 10 trading days have only been this small one other time since 1996. However, it is likely to get louder in the coming weeks. With market participants having bought the rumor surrounding policy actions this year, they are unlikely to buy again on the news when the policy actions emerge. We do not expect a major pullback, but instead the return of volatility — especially with the U.S. elections and pending fiscal cliff adding uncertainty not present in the fall of 2010 or 2011. �
S&P 500 Sector Performance Rank
June 1 to July 30 July 30 to August 15
1) Energy 1) Info Tech
2) Telecom Services 2) Materials
3) Financials 3) Consumer Discretionary
4) Health Care 4) Financials
5) Consumer Staples 5) Industrials
6) Utilities 6) Energy
7) Industrials 7) Health Care
8) Info Tech 8) Telecom Services
9) Materials 9) Consumer Staples
10) Consumer Discretionary 10) Utilities
Source: LPL Financial, Bloomberg data 08/20/12
Because of their narrow focus, sector investing will be subject to greater volatility than investing more broadly across many sectors and companies.
For additional information on the indexes that make up these sectors, please see pages 3 – 4.
2 This Summer’s Top Performers Rankings Have Reversed In August
IMPORTANT DISCLOSURES
The opinions voiced in this material are for general information only and are not intended to provide specific advice or recommendations for any individual. To determine which investment(s) may be appropriate for you, consult your financial advisor prior to investing. All performance reference is historical and is no guarantee of future results. All indices are unmanaged and cannot be invested into directly.
The economic forecasts set forth in the presentation may not develop as predicted and there can be no guarantee that strategies promoted will be successful.
Citigroup Economic Surprise Index (CESI) measures the variation in the gap between the expectations and the real economic data.

WEEKLY MARKET COMMENTARY
LPL Financial Member FINRA/SIPC Page 3 of 4
The Standard & Poor’s 500 Index is a capitalization-weighted index of 500 stocks designed to measure performance of the broad domestic economy through changes in the aggregate market value of 500 stocks representing all major industries.
Quantitative Easing is a government monetary policy occasionally used to increase the money supply by buying government securities or other securities from the market. Quantitative easing increases the money supply by flooding financial institutions with capital in an effort to promote increased lending and liquidity.
Operation Twist is the name given to a Federal Reserve monetary policy operation that involves the purchase and sale of bonds. “Operation Twist” describes a monetary process where the Fed buys and sells short-term and long-term bonds depending on their objective.
Consumer Discretionary: Companies that tend to be the most sensitive to economic cycles. Its manufacturing segment includes automotive, household durable goods, textiles and apparel, and leisure equipment. The service segment includes hotels, restaurants and other leisure facilities, media production and services, consumer retailing and services and education services.
Consumer Staples: Companies whose businesses are less sensitive to economic cycles. It includes manufacturers and distributors of food, beverages and tobacco, and producers of non-durable household goods and personal products. It also includes food and drug retailing companies.
Energy: Companies whose businesses are dominated by either of the following activities: The construction or provision of oil rigs, drilling equipment and other energy-related service and equipment, including seismic data collection. The exploration, production, marketing, refining and/or transportation of oil and gas products, coal and consumable fuels.
Financials Sector: Companies involved in activities such as banking, consumer finance, investment banking and brokerage, asset management, insurance and investment, and real estate, including REITs.
Healthcare Sector: Companies are in two main industry groups — healthcare equipment and supplies or companies that provide healthcare-related services, including distributors of healthcare products, providers of basic healthcare services, and owners and operators of healthcare facilities and organizations. Companies primarily involved in the research, development, production, and marketing of pharmaceuticals and biotechnology products.
Industrials: Companies whose businesses manufacture and distribute capital goods, including aerospace and defense, construction, engineering and building products, electrical equipment and industrial machinery. Also, companies that provide commercial services and supplies, including printing, employment, environmental and office services, or provide transportation services, including airlines, couriers, marine, road and rail, and transportation infrastructure.
Manufacturing Sector: Companies engaged in chemical, mechanical, or physical transformation of materials, substances, or components into consumer or industrial goods.
Materials: Companies that are engaged in a wide range of commodity-related manufacturing. Included in this sector are companies that manufacture chemicals, construction materials, glass, paper, forest products and related packaging products, metals, minerals and mining companies, including producers of steel.
Technology Software & Services: Includes companies that primarily develop software in various fields such as the internet, applications, systems and/or database management and companies that provide information technology consulting and services; technology hardware & Equipment, including manufacturers and distributors of communications equipment, computers and peripherals, electronic equipment and related instruments, and semiconductor equipment and products.
Telecommunications Services: Companies that provide communications services primarily through a fixed line, cellular, wireless, high bandwidth and/or fiber-optic cable network.
Utilities Sector: Companies considered electric, gas or water utilities, or companies that operate as independent producers and/or distributors of power.
The S&P Consumer Discretionary Index is comprised of companies that tend to be the most sensitive to economic cycles. Its manufacturing segment includes automotive, household durable goods, textiles and apparel, and leisure equipment. The service segment includes hotels, restaurants and other leisure facilities, media production and services, consumer retailing and services and education services.
The S&P Consumer Staples index is comprised of companies whose businesses are less sensitive to economic cycles. It includes manufacturers and distributors of food, beverages and tobacco, and producers of non-durable household goods and personal products. It also includes food and drug retailing companies.
WEEKLY MARKET COMMENTARY
Member FINRA/SIPCPage 4 of 4
RES 3852 0812Tracking #1-093499 (Exp. 08/13)
Not FDIC or NCUA/NCUSIF Insured | No Bank or Credit Union Guarantee | May Lose Value | Not Guaranteed by any Government Agency | Not a Bank/Credit Union Deposit
This research material has been prepared by LPL Financial.
To the extent you are receiving investment advice from a separately registered independent investment advisor, please note that LPL Financial is not an affiliate of and makes no representation with respect to such entity.
The S&P Energy Index is comprised of energy companies that primarily develop and produce crude oil and natural gas, and provide drilling and other energy related services.
The S&P Financials Index is comprised of a wide array of diversified financial service firms are featured in this sector with business lines ranging from investment management to commercial and investment banking.
The S&P Health Care Index is comprised of companies in this sector primarily include healthcare equipment and supplies, healthcare providers and services, biotechnology, and pharmaceuticals industries.
The S&P Industrials index is comprised of companies whose businesses: Manufacture and distribute capital goods, including aerospace and defense, construction, engineering and building products, electrical equipment and industrial machinery. Provide commercial services and supplies, including printing, employment, environmental and office services. Provide transportation services, including airlines, couriers, marine, road and rail, and transportation infrastructure.
The S&P Information Technology Index is comprised of stocks primarily covering products developed by internet software and service companies, IT consulting services, semiconductor equipment and products, computers and peripherals, diversified telecommunication services and wireless telecommunication services are included in this Index.
The S&P Materials Index is comprised of companies that engage in a wide range of commodity-related manufacturing. Included in this sector are companies that manufacture chemicals, construction materials, glass, paper, forest products and related packaging products, metals, minerals and mining companies, including producers of steel.
The S&P Telecommunications Index is comprised of companies that provide communications services primarily through a fixed line, cellular, wireless, high bandwidth and/or fiber-optic cable network.
The S&P Utilities Index is comprised primarily of companies involved in water and electrical power and natural gas distribution industries.