
Macroprudential policy in the EU from banking to beyond ... · Macroprudential policy in the EU –...
57
Macroprudential policy in the EU – from banking to beyond banking Tuomas Peltonen* Deputy Head of the ESRB Secretariat Norges Bank conference 22 November 2016 *Disclaimer and acknowledgements: the views are of my own and do not necessarily represent the views of the ESRB or its member institutions. Input from Antonio Sanchez, Neill Killeen and Frank Dierick is gratefully acknowledged.
-
Upload
nguyenkhue -
Category
Documents
-
view
219 -
download
2
Transcript of Macroprudential policy in the EU from banking to beyond ... · Macroprudential policy in the EU –...
Macroprudential policy in the EU
– from banking to beyond banking
Tuomas Peltonen*
Deputy Head of the ESRB Secretariat
Norges Bank conference
22 November 2016
*Disclaimer and acknowledgements: the views are of my own and do not necessarily represent the views of the ESRB or its
member institutions. Input from Antonio Sanchez, Neill Killeen and Frank Dierick is gratefully acknowledged.
Presentation outline
1. The ESRB
2. Current challenges in the European banking sector
3. Macroprudential policy implementation in Europe
4. Macroprudential policy beyond banking
5. Assessing shadow banking: non-bank financial intermediation in Europe
6. Conclusions
2
1. THE ESRB
3
ESRB homepage:
http://www.esrb.europa.eu
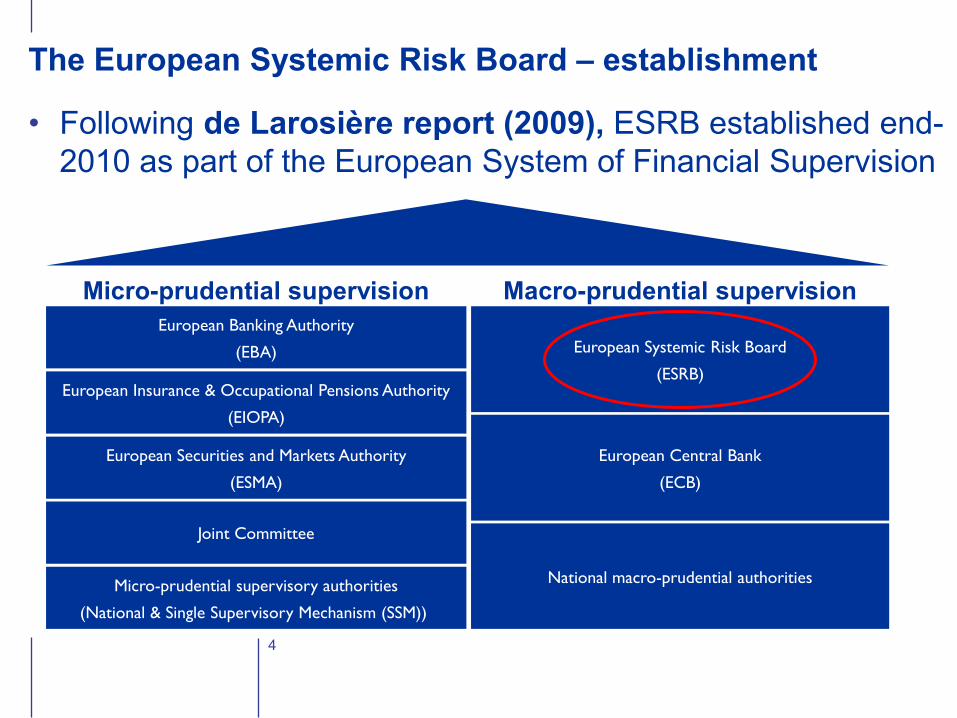
• Following de Larosière report (2009), ESRB established end-
2010 as part of the European System of Financial Supervision
4
The European Systemic Risk Board – establishment
European Systemic Risk Board
(ESRB)
European Banking Authority
(EBA)
European Insurance & Occupational Pensions Authority
(EIOPA)
European Securities and Markets Authority
(ESMA)
Joint Committee
Micro-prudential supervisory authorities
(National & Single Supervisory Mechanism (SSM))
European Central Bank
(ECB)
National macro-prudential authorities
Micro-prudential supervision Macro-prudential supervision
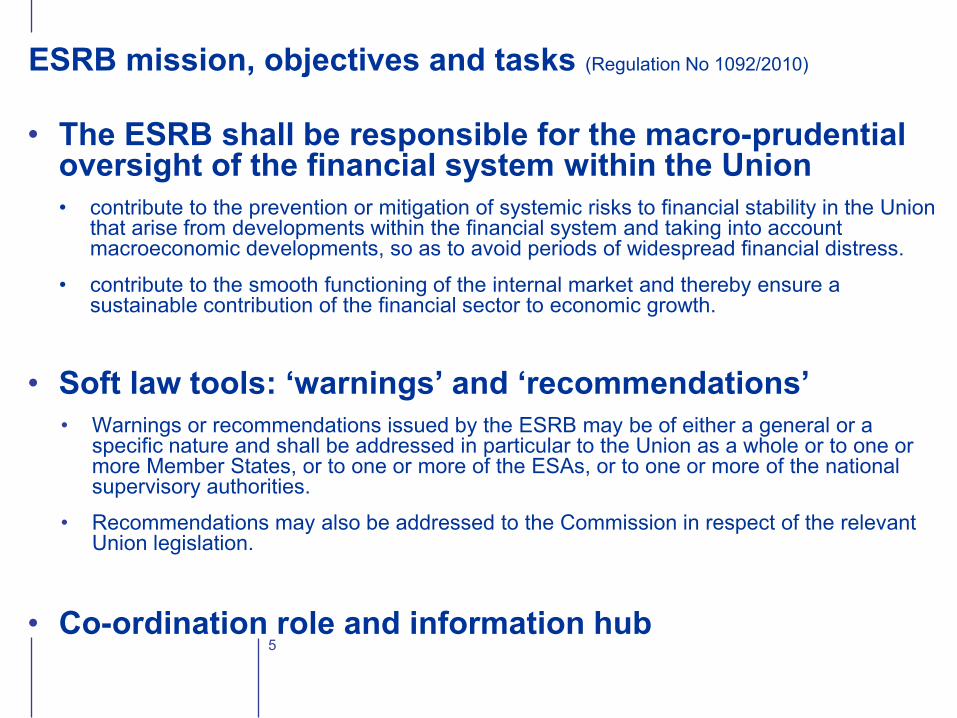
• The ESRB shall be responsible for the macro-prudential oversight of the financial system within the Union
• contribute to the prevention or mitigation of systemic risks to financial stability in the Union that arise from developments within the financial system and taking into account macroeconomic developments, so as to avoid periods of widespread financial distress.
• contribute to the smooth functioning of the internal market and thereby ensure a sustainable contribution of the financial sector to economic growth.
• Soft law tools: ‘warnings’ and ‘recommendations’
• Warnings or recommendations issued by the ESRB may be of either a general or a specific nature and shall be addressed in particular to the Union as a whole or to one or more Member States, or to one or more of the ESAs, or to one or more of the national supervisory authorities.
• Recommendations may also be addressed to the Commission in respect of the relevant Union legislation.
• Co-ordination role and information hub 5
ESRB mission, objectives and tasks (Regulation No 1092/2010)
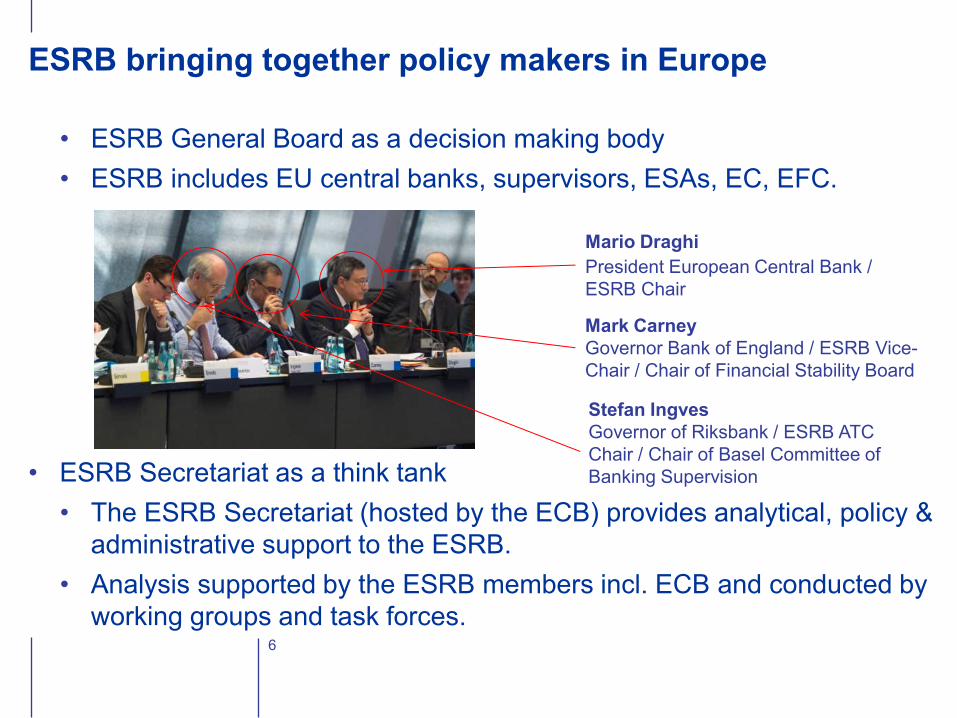
• ESRB General Board as a decision making body
• ESRB includes EU central banks, supervisors, ESAs, EC, EFC.
• ESRB Secretariat as a think tank
• The ESRB Secretariat (hosted by the ECB) provides analytical, policy &
administrative support to the ESRB.
• Analysis supported by the ESRB members incl. ECB and conducted by
working groups and task forces.
ESRB bringing together policy makers in Europe
Stefan Ingves
Governor of Riksbank / ESRB ATC
Chair / Chair of Basel Committee of
Banking Supervision
Mark Carney
Governor Bank of England / ESRB Vice-
Chair / Chair of Financial Stability Board
Mario Draghi
President European Central Bank /
ESRB Chair
6
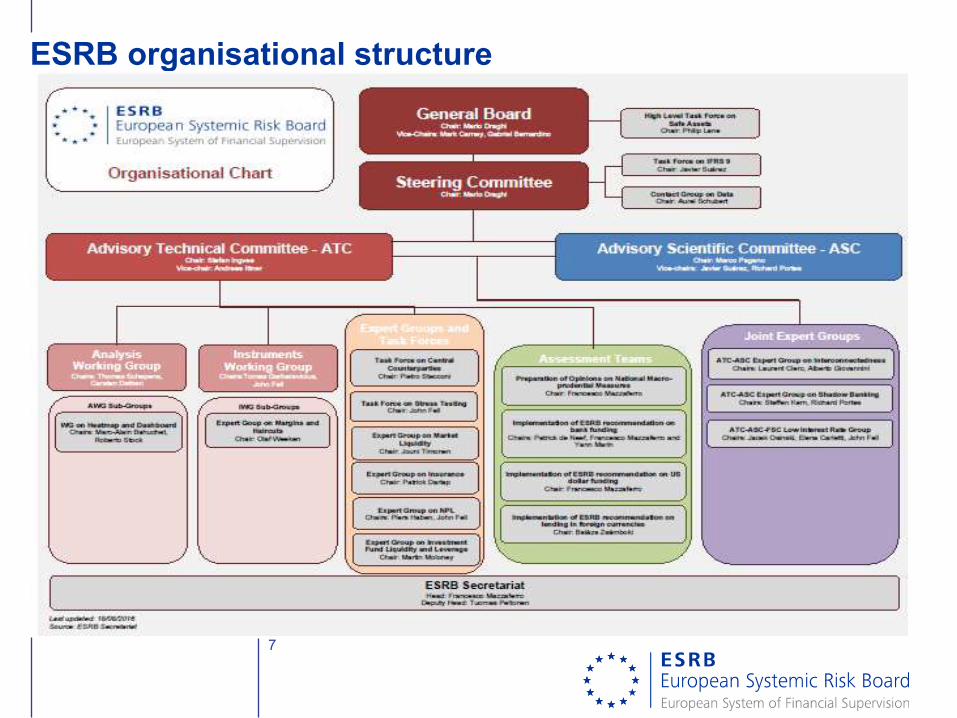
ESRB organisational structure
7
8
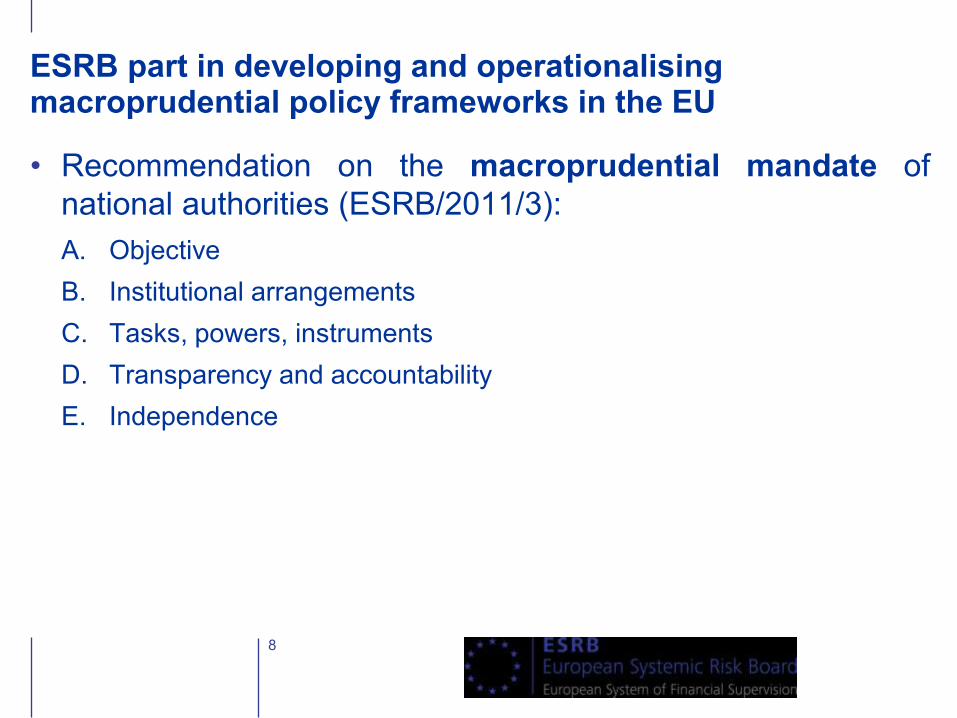
ESRB part in developing and operationalising macroprudential policy frameworks in the EU
• Recommendation on the macroprudential mandate of
national authorities (ESRB/2011/3):
A. Objective
B. Institutional arrangements
C. Tasks, powers, instruments
D. Transparency and accountability
E. Independence
9
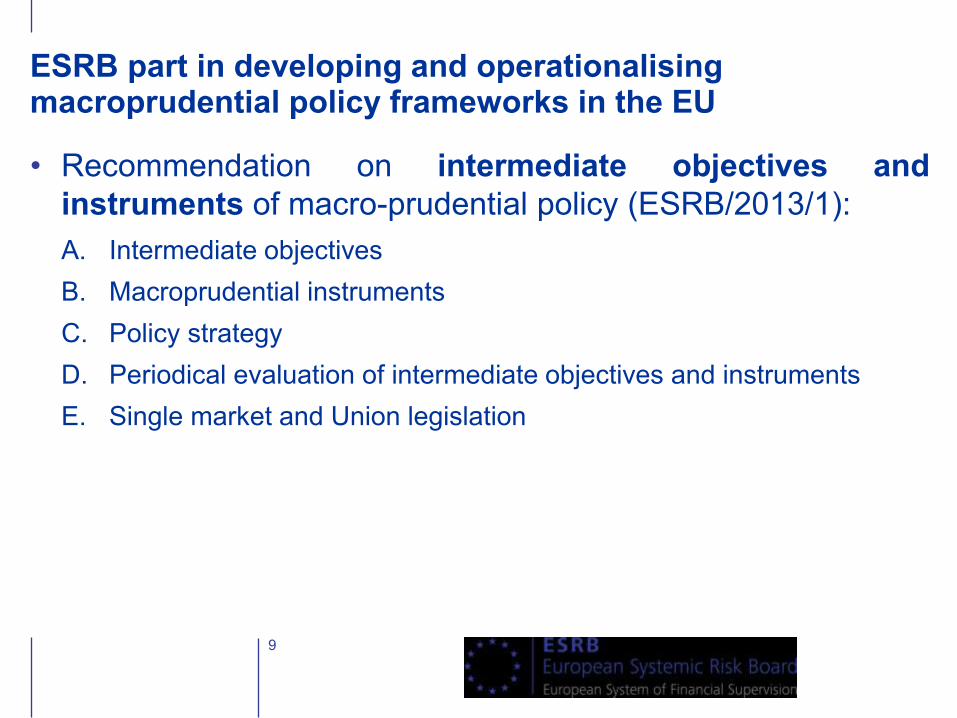
• Recommendation on intermediate objectives and
instruments of macro-prudential policy (ESRB/2013/1):
A. Intermediate objectives
B. Macroprudential instruments
C. Policy strategy
D. Periodical evaluation of intermediate objectives and instruments
E. Single market and Union legislation
ESRB part in developing and operationalising macroprudential policy frameworks in the EU
10
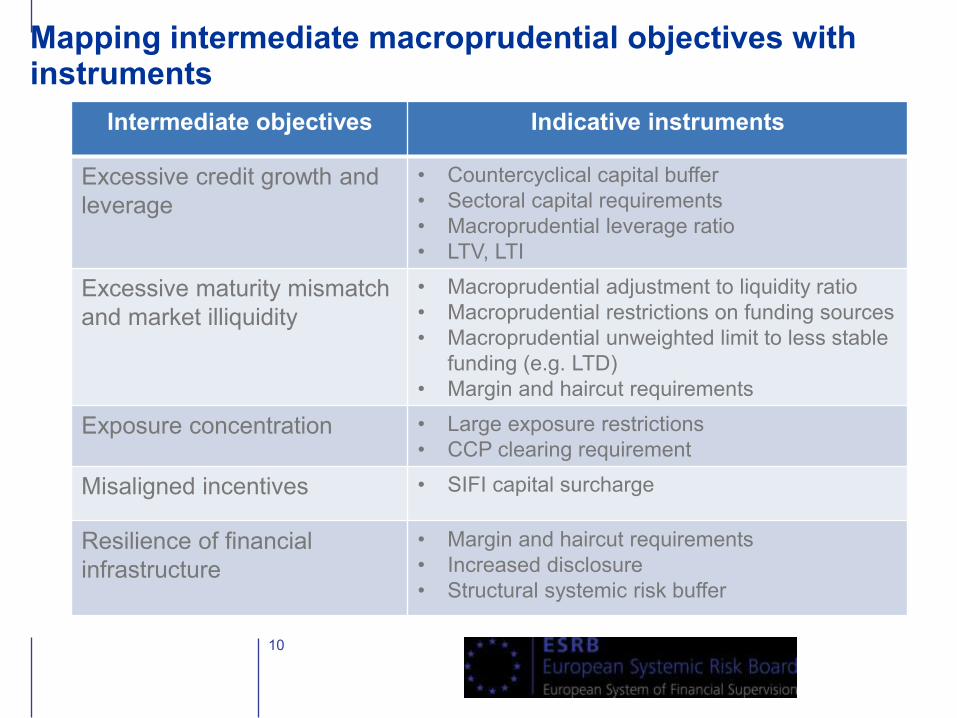
Intermediate objectives Indicative instruments
Excessive credit growth and
leverage
• Countercyclical capital buffer
• Sectoral capital requirements
• Macroprudential leverage ratio
• LTV, LTI
Excessive maturity mismatch
and market illiquidity
• Macroprudential adjustment to liquidity ratio
• Macroprudential restrictions on funding sources
• Macroprudential unweighted limit to less stable
funding (e.g. LTD)
• Margin and haircut requirements
Exposure concentration • Large exposure restrictions
• CCP clearing requirement
Misaligned incentives • SIFI capital surcharge
Resilience of financial
infrastructure
• Margin and haircut requirements
• Increased disclosure
• Structural systemic risk buffer
Mapping intermediate macroprudential objectives with instruments
11
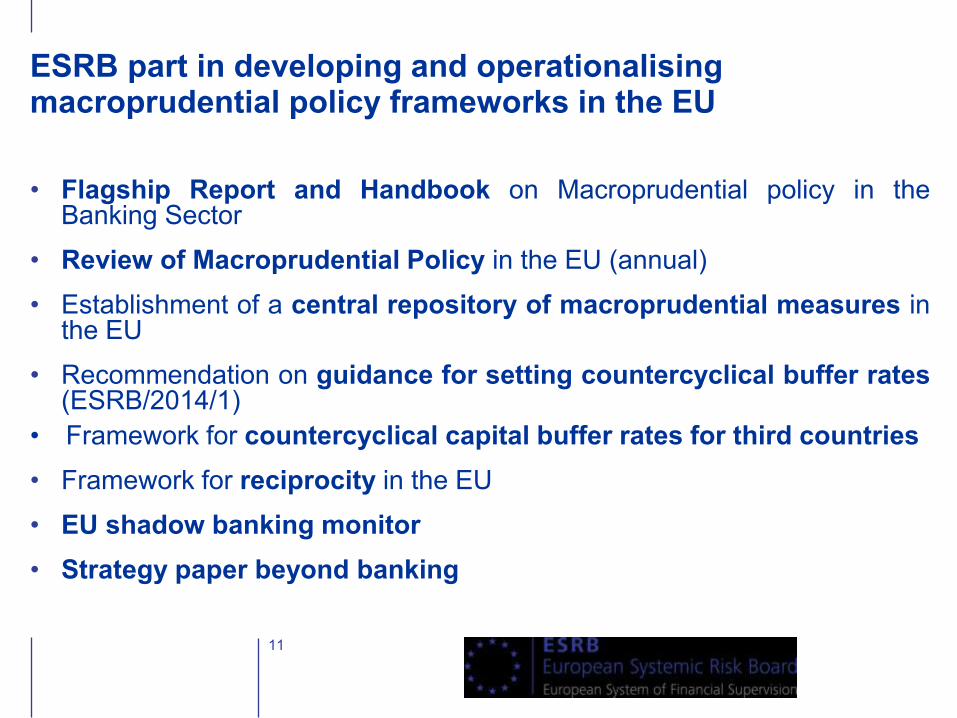
• Flagship Report and Handbook on Macroprudential policy in the Banking Sector
• Review of Macroprudential Policy in the EU (annual)
• Establishment of a central repository of macroprudential measures in the EU
• Recommendation on guidance for setting countercyclical buffer rates (ESRB/2014/1)
• Framework for countercyclical capital buffer rates for third countries
• Framework for reciprocity in the EU
• EU shadow banking monitor
• Strategy paper beyond banking
ESRB part in developing and operationalising macroprudential policy frameworks in the EU
2. CURRENT CHALLENGES IN THE EUROPEAN BANKING SECTOR
12
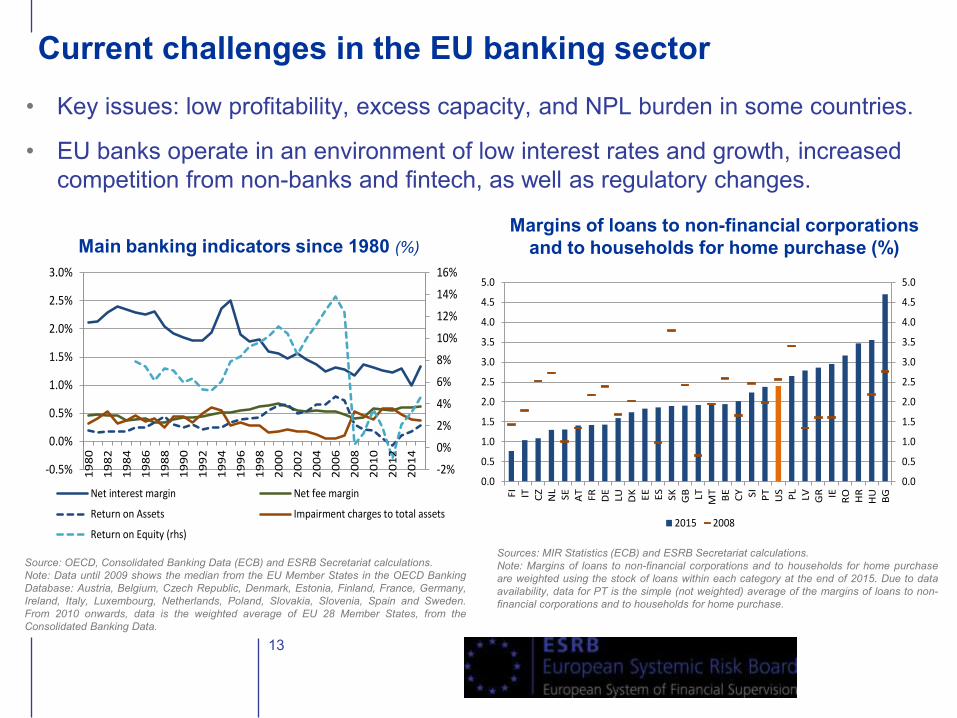
Current challenges in the EU banking sector
• Key issues: low profitability, excess capacity, and NPL burden in some countries.
• EU banks operate in an environment of low interest rates and growth, increased
competition from non-banks and fintech, as well as regulatory changes.
13
Source: OECD, Consolidated Banking Data (ECB) and ESRB Secretariat calculations.
Note: Data until 2009 shows the median from the EU Member States in the OECD Banking
Database: Austria, Belgium, Czech Republic, Denmark, Estonia, Finland, France, Germany,
Ireland, Italy, Luxembourg, Netherlands, Poland, Slovakia, Slovenia, Spain and Sweden.
From 2010 onwards, data is the weighted average of EU 28 Member States, from the
Consolidated Banking Data.
Main banking indicators since 1980 (%)
-2%
0%
2%
4%
6%
8%
10%
12%
14%
16%
-0.5%
0.0%
0.5%
1.0%
1.5%
2.0%
2.5%
3.0%
19
80
19
82
19
84
19
86
19
88
19
90
19
92
19
94
19
96
19
98
20
00
20
02
20
04
20
06
20
08
20
10
20
12
20
14
Net interest margin Net fee margin
Return on Assets Impairment charges to total assets
Return on Equity (rhs)
Sources: MIR Statistics (ECB) and ESRB Secretariat calculations.
Note: Margins of loans to non-financial corporations and to households for home purchase
are weighted using the stock of loans within each category at the end of 2015. Due to data
availability, data for PT is the simple (not weighted) average of the margins of loans to non-
financial corporations and to households for home purchase.
Margins of loans to non-financial corporations
and to households for home purchase (%)
0.0
0.5
1.0
1.5
2.0
2.5
3.0
3.5
4.0
4.5
5.0
0.0
0.5
1.0
1.5
2.0
2.5
3.0
3.5
4.0
4.5
5.0
FI IT CZ
NL
SE AT
FR DE
LU DK EE
ES
SK GB LT MT
BE
CY SI PT
US
PL
LV GR IE
RO
HR
HU
BG
2015 2008
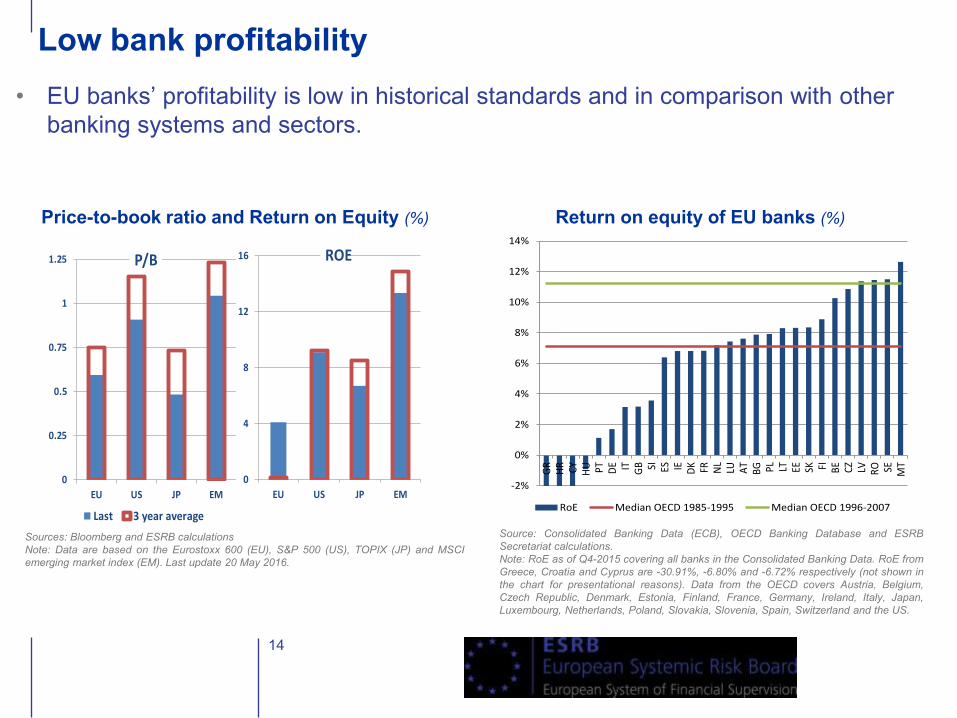
Low bank profitability
• EU banks’ profitability is low in historical standards and in comparison with other
banking systems and sectors.
14
Price-to-book ratio and Return on Equity (%)
Sources: Bloomberg and ESRB calculations
Note: Data are based on the Eurostoxx 600 (EU), S&P 500 (US), TOPIX (JP) and MSCI
emerging market index (EM). Last update 20 May 2016.
0
0.25
0.5
0.75
1
1.25
EU US JP EM
Last 3 year average
0
4
8
12
16
EU US JP EM
ROEP/B
Return on equity of EU banks (%)
Source: Consolidated Banking Data (ECB), OECD Banking Database and ESRB
Secretariat calculations.
Note: RoE as of Q4-2015 covering all banks in the Consolidated Banking Data. RoE from
Greece, Croatia and Cyprus are -30.91%, -6.80% and -6.72% respectively (not shown in
the chart for presentational reasons). Data from the OECD covers Austria, Belgium,
Czech Republic, Denmark, Estonia, Finland, France, Germany, Ireland, Italy, Japan,
Luxembourg, Netherlands, Poland, Slovakia, Slovenia, Spain, Switzerland and the US.
-2%
0%
2%
4%
6%
8%
10%
12%
14%
GR
HR CY HU PT DE IT GB SI ES IE DK FR NL
LU AT
BG PL LT EE SK FI BE CZ LV RO SE MT
RoE Median OECD 1985-1995 Median OECD 1996-2007
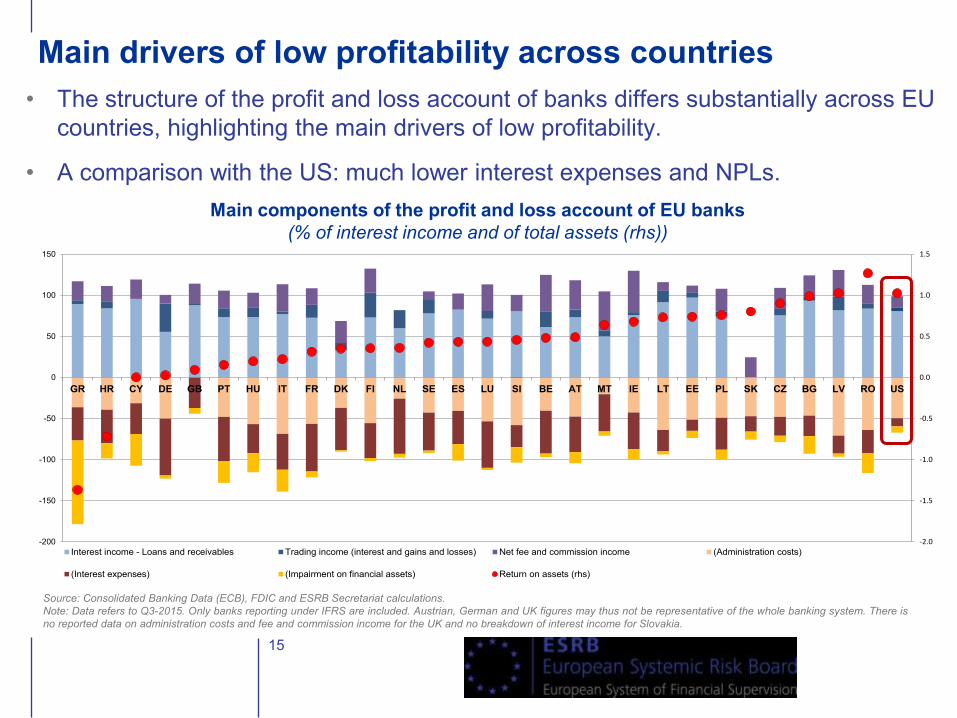
Main drivers of low profitability across countries
• The structure of the profit and loss account of banks differs substantially across EU
countries, highlighting the main drivers of low profitability.
• A comparison with the US: much lower interest expenses and NPLs.
15
Main components of the profit and loss account of EU banks
(% of interest income and of total assets (rhs))
Source: Consolidated Banking Data (ECB), FDIC and ESRB Secretariat calculations.
Note: Data refers to Q3-2015. Only banks reporting under IFRS are included. Austrian, German and UK figures may thus not be representative of the whole banking system. There is
no reported data on administration costs and fee and commission income for the UK and no breakdown of interest income for Slovakia.
-2.0
-1.5
-1.0
-0.5
0.0
0.5
1.0
1.5
-200
-150
-100
-50
0
50
100
150
GR HR CY DE GB PT HU IT FR DK FI NL SE ES LU SI BE AT MT IE LT EE PL SK CZ BG LV RO US
Interest income - Loans and receivables Trading income (interest and gains and losses) Net fee and commission income (Administration costs)
(Interest expenses) (Impairment on financial assets) Return on assets (rhs)
-1.5
-1.0
-0.5
0.0
0.5
1.0
1.5
2.0
2.5
AT BE BG CY CZ DE DK EE ES FI FR GR HR HU IE IT LT LU LV MT NL PL PT RO SE SI SK
RoA Q4-2015 Impact of cost-to-income ratio at 50%
Impact of net fee income to 28% of interest income Impact of decrease of 30% in NPLs
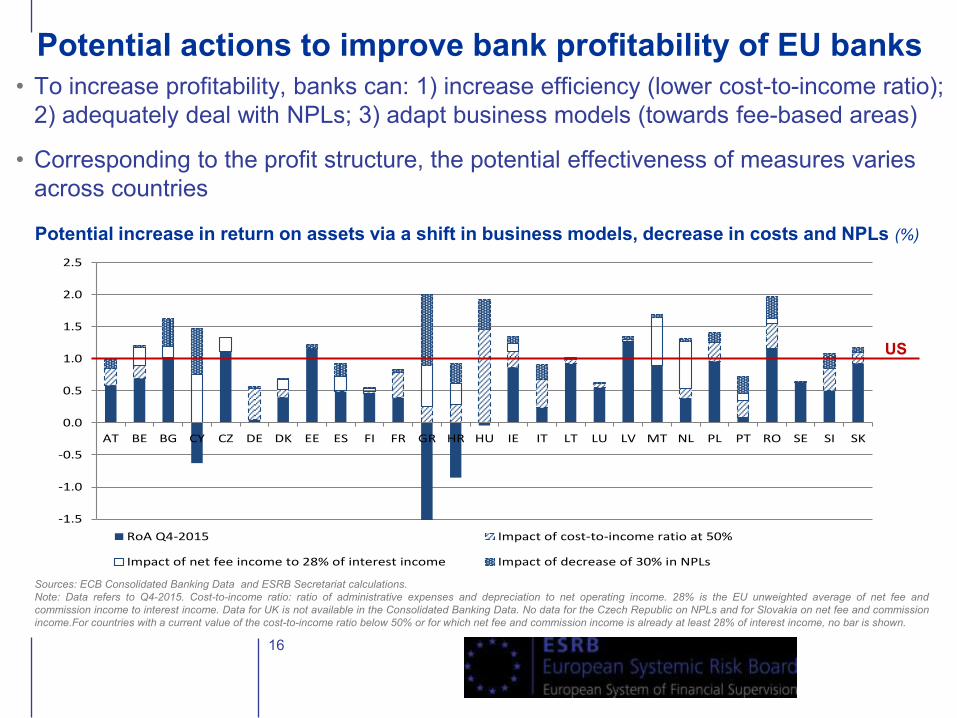
Potential actions to improve bank profitability of EU banks
• To increase profitability, banks can: 1) increase efficiency (lower cost-to-income ratio);
2) adequately deal with NPLs; 3) adapt business models (towards fee-based areas)
• Corresponding to the profit structure, the potential effectiveness of measures varies
across countries
16
Potential increase in return on assets via a shift in business models, decrease in costs and NPLs (%)
Sources: ECB Consolidated Banking Data and ESRB Secretariat calculations.
Note: Data refers to Q4-2015. Cost-to-income ratio: ratio of administrative expenses and depreciation to net operating income. 28% is the EU unweighted average of net fee and
commission income to interest income. Data for UK is not available in the Consolidated Banking Data. No data for the Czech Republic on NPLs and for Slovakia on net fee and commission
income.For countries with a current value of the cost-to-income ratio below 50% or for which net fee and commission income is already at least 28% of interest income, no bar is shown.
US
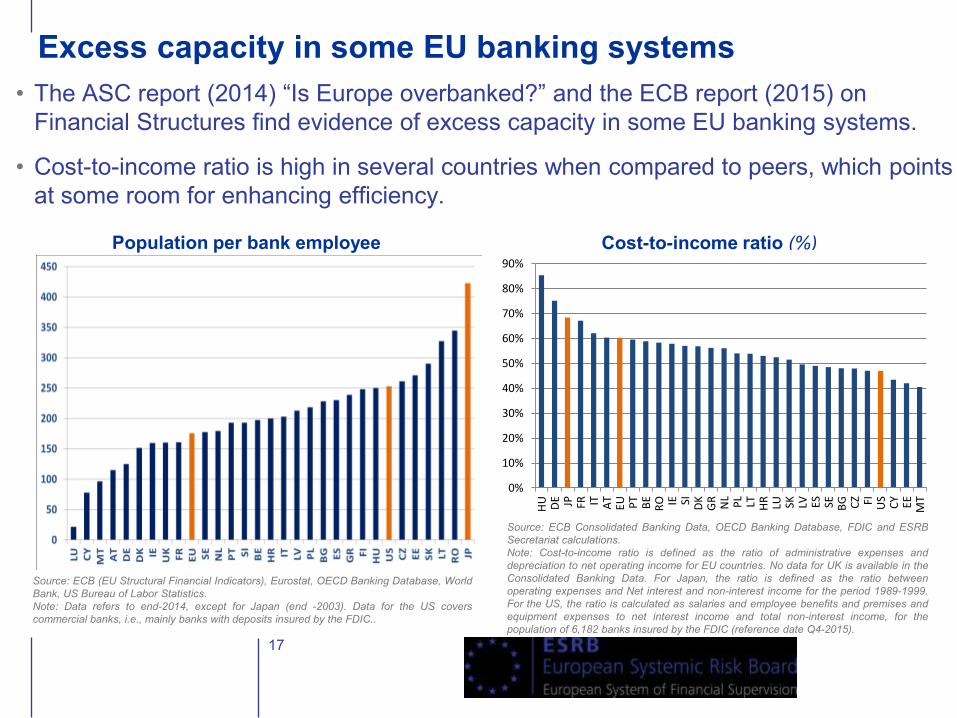
Excess capacity in some EU banking systems
• The ASC report (2014) “Is Europe overbanked?” and the ECB report (2015) on
Financial Structures find evidence of excess capacity in some EU banking systems.
• Cost-to-income ratio is high in several countries when compared to peers, which points
at some room for enhancing efficiency.
17
Cost-to-income ratio (%)
Source: ECB Consolidated Banking Data, OECD Banking Database, FDIC and ESRB
Secretariat calculations.
Note: Cost-to-income ratio is defined as the ratio of administrative expenses and
depreciation to net operating income for EU countries. No data for UK is available in the
Consolidated Banking Data. For Japan, the ratio is defined as the ratio between
operating expenses and Net interest and non-interest income for the period 1989-1999.
For the US, the ratio is calculated as salaries and employee benefits and premises and
equipment expenses to net interest income and total non-interest income, for the
population of 6,182 banks insured by the FDIC (reference date Q4-2015).
0%
10%
20%
30%
40%
50%
60%
70%
80%
90%
HU DE JP FR IT AT
EU PT
BE
RO IE SI DK
GR
NL
PL LT HR
LU SK LV ES
SE BG CZ FI US
CY EE
MT
Population per bank employee
Source: ECB (EU Structural Financial Indicators), Eurostat, OECD Banking Database, World
Bank, US Bureau of Labor Statistics.
Note: Data refers to end-2014, except for Japan (end -2003). Data for the US covers
commercial banks, i.e., mainly banks with deposits insured by the FDIC..
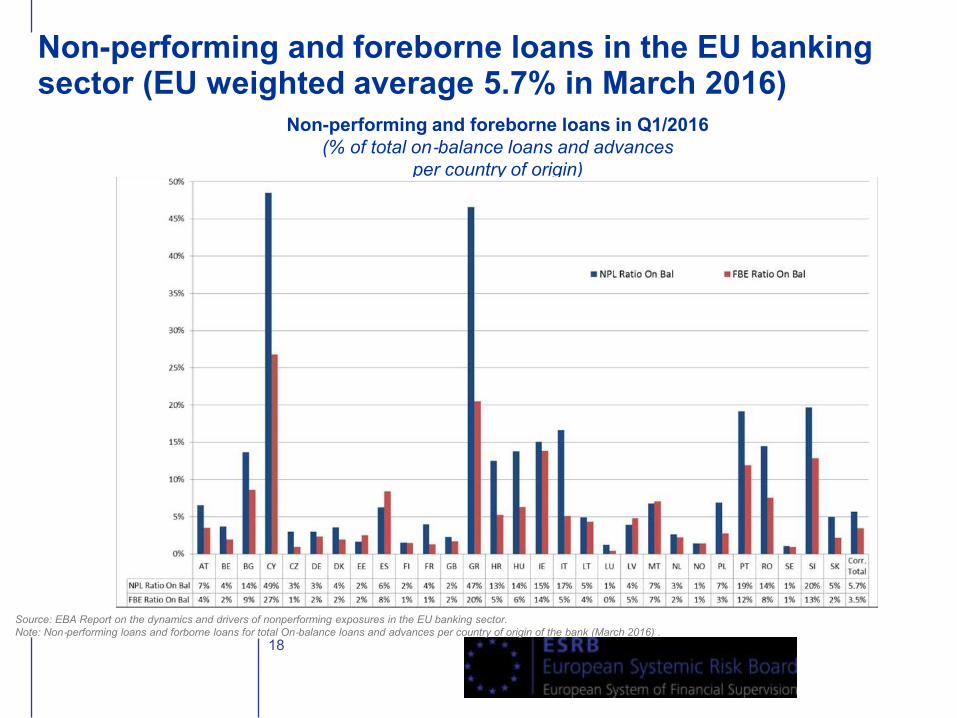
Non-performing and foreborne loans in the EU banking sector (EU weighted average 5.7% in March 2016)
18
Non-performing and foreborne loans in Q1/2016
(% of total on‐balance loans and advances
per country of origin)
Source: EBA Report on the dynamics and drivers of nonperforming exposures in the EU banking sector.
Note: Non‐performing loans and forborne loans for total On‐balance loans and advances per country of origin of the bank (March 2016) .
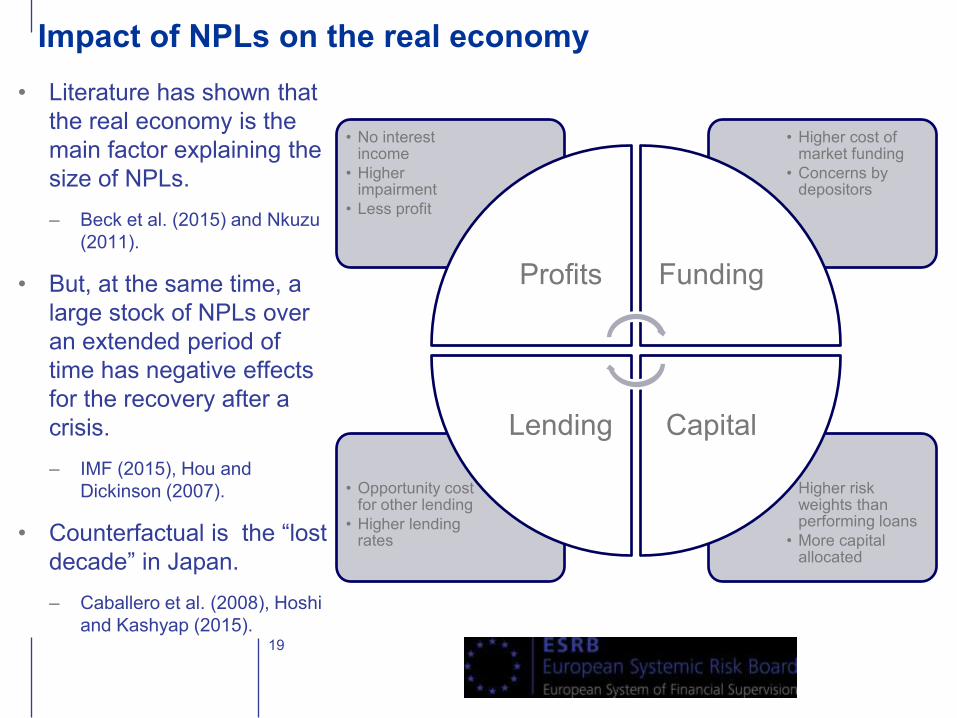
Impact of NPLs on the real economy
• Literature has shown that
the real economy is the
main factor explaining the
size of NPLs.
– Beck et al. (2015) and Nkuzu
(2011).
• But, at the same time, a
large stock of NPLs over
an extended period of
time has negative effects
for the recovery after a
crisis.
– IMF (2015), Hou and
Dickinson (2007).
• Counterfactual is the “lost
decade” in Japan.
– Caballero et al. (2008), Hoshi
and Kashyap (2015). 19
• Higher risk weights than performing loans
• More capital allocated
• Opportunity cost for other lending
• Higher lending rates
• Higher cost of market funding
• Concerns by depositors
• No interest income
• Higher impairment
• Less profit
Profits Funding
Capital Lending
3. MACROPRUDENTIAL POLICY IMPLEMENTATION IN EUROPE
20
Overview of national macroprudential policy measures:
https://www.esrb.europa.eu/national_policy/html/index.en.html
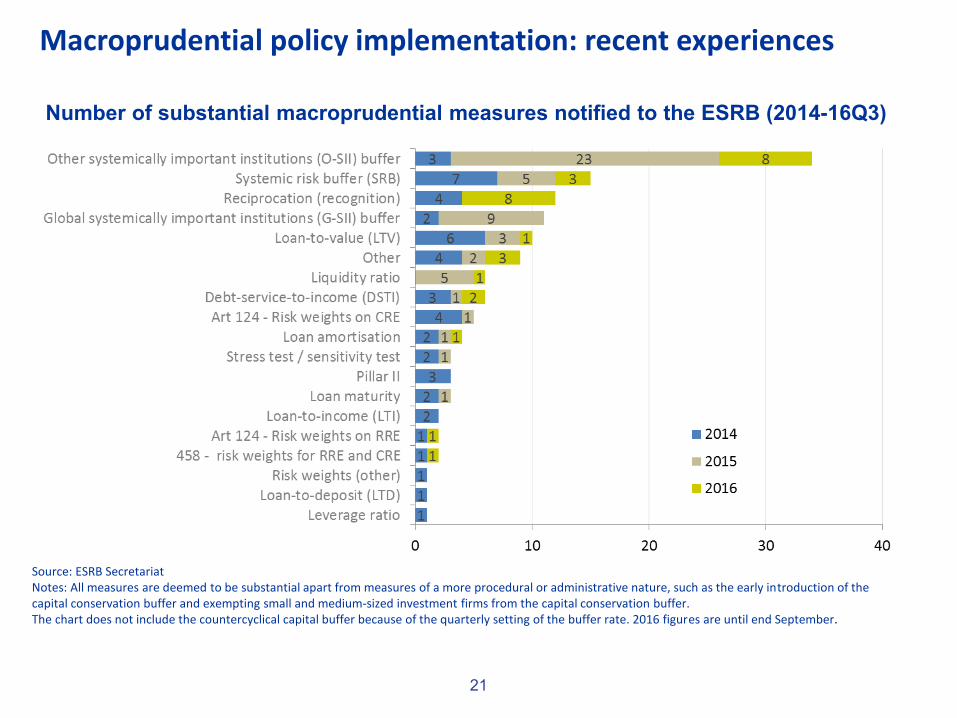
21
Source: ESRB Secretariat Notes: All measures are deemed to be substantial apart from measures of a more procedural or administrative nature, such as the early introduction of the capital conservation buffer and exempting small and medium-sized investment firms from the capital conservation buffer. The chart does not include the countercyclical capital buffer because of the quarterly setting of the buffer rate. 2016 figures are until end September.
59 substantial measures have been
notified in 2015, in addition
50 substantial measures in 2014
Macroprudential policy implementation: recent experiences
Number of substantial macroprudential measures notified to the ESRB (2014-16Q3)
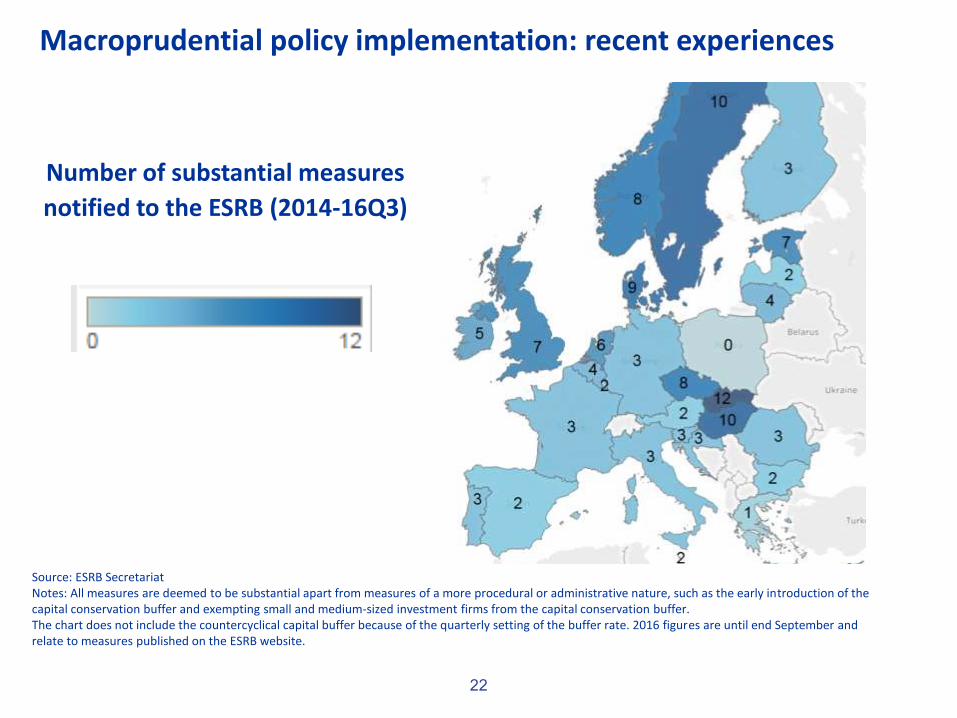
22
Number of substantial measures
notified to the ESRB (2014-16Q3)
Source: ESRB Secretariat
Source: ESRB Secretariat Notes: All measures are deemed to be substantial apart from measures of a more procedural or administrative nature, such as the early introduction of the capital conservation buffer and exempting small and medium-sized investment firms from the capital conservation buffer. The chart does not include the countercyclical capital buffer because of the quarterly setting of the buffer rate. 2016 figures are until end September and relate to measures published on the ESRB website.
Macroprudential policy implementation: recent experiences
23
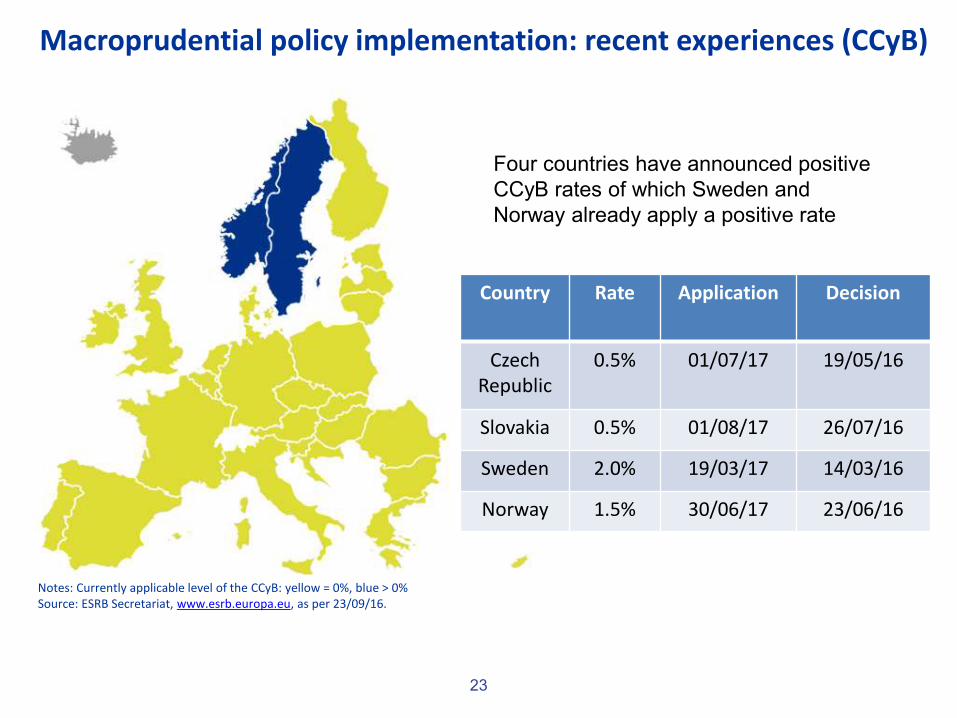
Notes: Currently applicable level of the CCyB: yellow = 0%, blue > 0% Source: ESRB Secretariat, www.esrb.europa.eu, as per 23/09/16.
Four countries have announced positive
CCyB rates of which Sweden and
Norway already apply a positive rate
Country Rate Application Decision
Czech Republic
0.5% 01/07/17 19/05/16
Slovakia 0.5% 01/08/17 26/07/16
Sweden 2.0% 19/03/17 14/03/16
Norway 1.5% 30/06/17 23/06/16
Macroprudential policy implementation: recent experiences (CCyB)
24
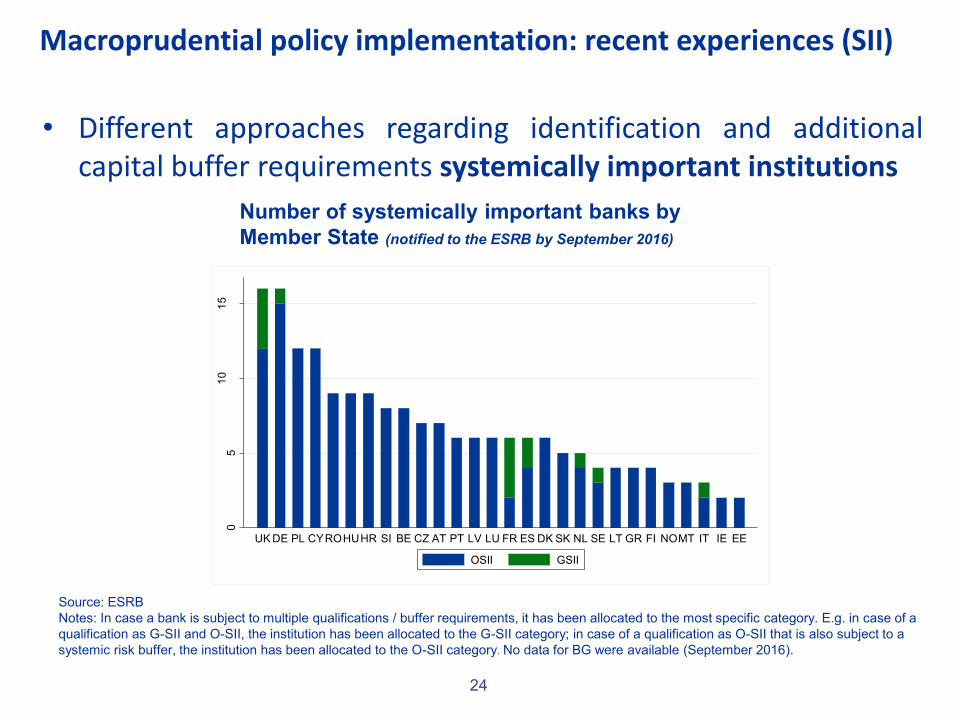
• Different approaches regarding identification and additional capital buffer requirements systemically important institutions
Number of systemically important banks by
Member State (notified to the ESRB by September 2016)
Source: ESRB
Notes: In case a bank is subject to multiple qualifications / buffer requirements, it has been allocated to the most specific category. E.g. in case of a
qualification as G-SII and O-SII, the institution has been allocated to the G-SII category; in case of a qualification as O-SII that is also subject to a
systemic risk buffer, the institution has been allocated to the O-SII category. No data for BG were available (September 2016).
05
10
15
UKDE PL CYROHUHR SI BE CZ AT PT LV LU FR ES DK SK NL SE LT GR FI NOMT IT IE EE
OSII GSII
Macroprudential policy implementation: recent experiences (SII)
25
Source: ESRB
Notes: The coloured area indicates the period when the buffer
requirement is phased in (no distinction is made between the different
levels of the buffer requirement or the type of the SII buffer required).
No data for BG were available (September 2016).
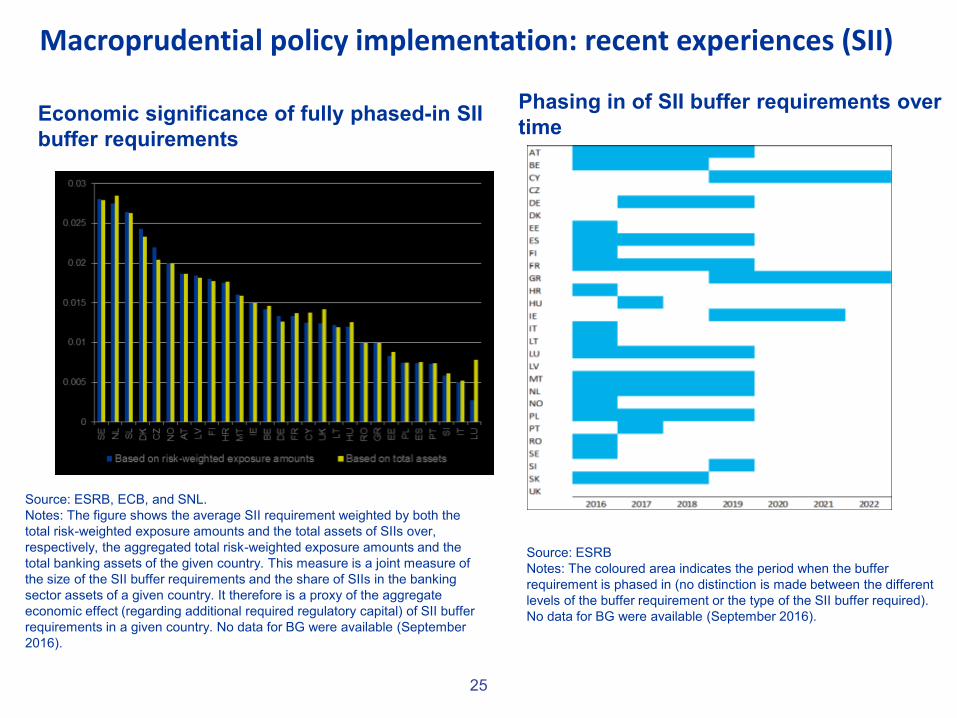
Source: ESRB, ECB, and SNL.
Notes: The figure shows the average SII requirement weighted by both the
total risk-weighted exposure amounts and the total assets of SIIs over,
respectively, the aggregated total risk-weighted exposure amounts and the
total banking assets of the given country. This measure is a joint measure of
the size of the SII buffer requirements and the share of SIIs in the banking
sector assets of a given country. It therefore is a proxy of the aggregate
economic effect (regarding additional required regulatory capital) of SII buffer
requirements in a given country. No data for BG were available (September
2016).
Economic significance of fully phased-in SII
buffer requirements
Phasing in of SII buffer requirements over
time
Macroprudential policy implementation: recent experiences (SII)
4. MACROPRUDENTIAL POLICY BEYOND BANKING
26
Macroprudential policy beyond banking:
https://www.esrb.europa.eu/pub/pdf/reports/20160718_strategy_paper_beyond
_banking.en.pdf
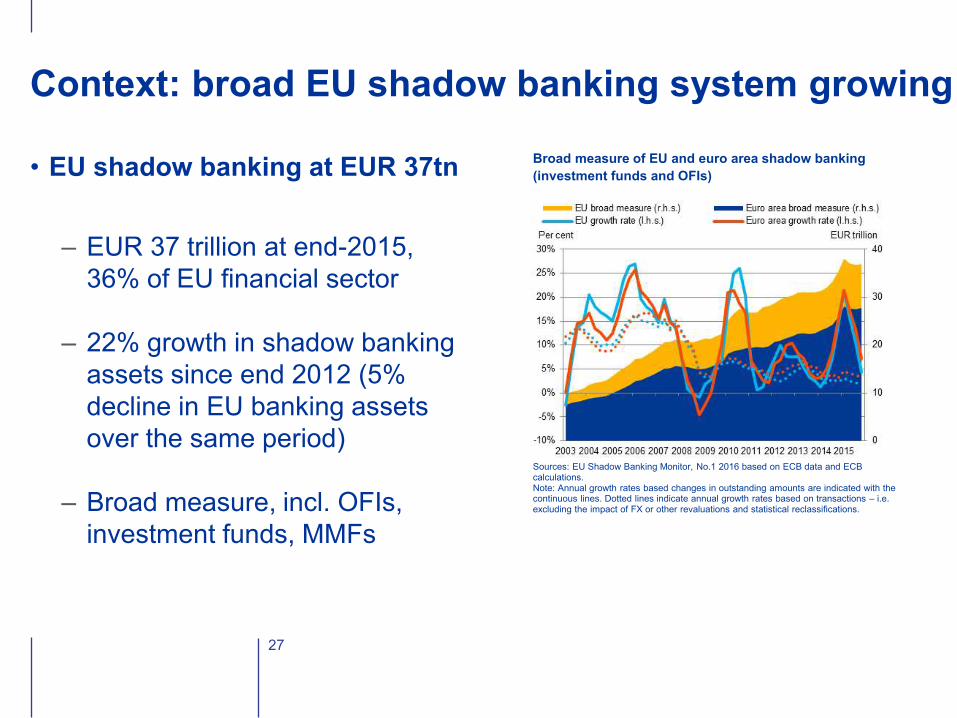
• EU shadow banking at EUR 37tn
– EUR 37 trillion at end-2015,
36% of EU financial sector
– 22% growth in shadow banking
assets since end 2012 (5%
decline in EU banking assets
over the same period)
– Broad measure, incl. OFIs,
investment funds, MMFs
Context: broad EU shadow banking system growing
27
Broad measure of EU and euro area shadow banking
(investment funds and OFIs)
(EUR trillion and annual growth rates; last observation Q4 2015)
Sources: EU Shadow Banking Monitor, No.1 2016 based on ECB data and ECB calculations. Note: Annual growth rates based changes in outstanding amounts are indicated with the continuous lines. Dotted lines indicate annual growth rates based on transactions – i.e. excluding the impact of FX or other revaluations and statistical reclassifications.
• While macroprudential policy for the banking sector is already
operational, the policy strategy, regulatory data and instruments required
to address risks beyond the banking sector need further enhancement.
• ESRB strategy paper (published in July 2016) analyses the current legal
and institutional framework governing macroprudential policies beyond
banking and proposes a comprehensive policy strategy to address
financial stability risks.
• ESRB strategy paper presents short-term policy options and a long-term
agenda for macroprudential policy beyond banking.
ESRB strategy paper on macroprudential policy beyond banking
28
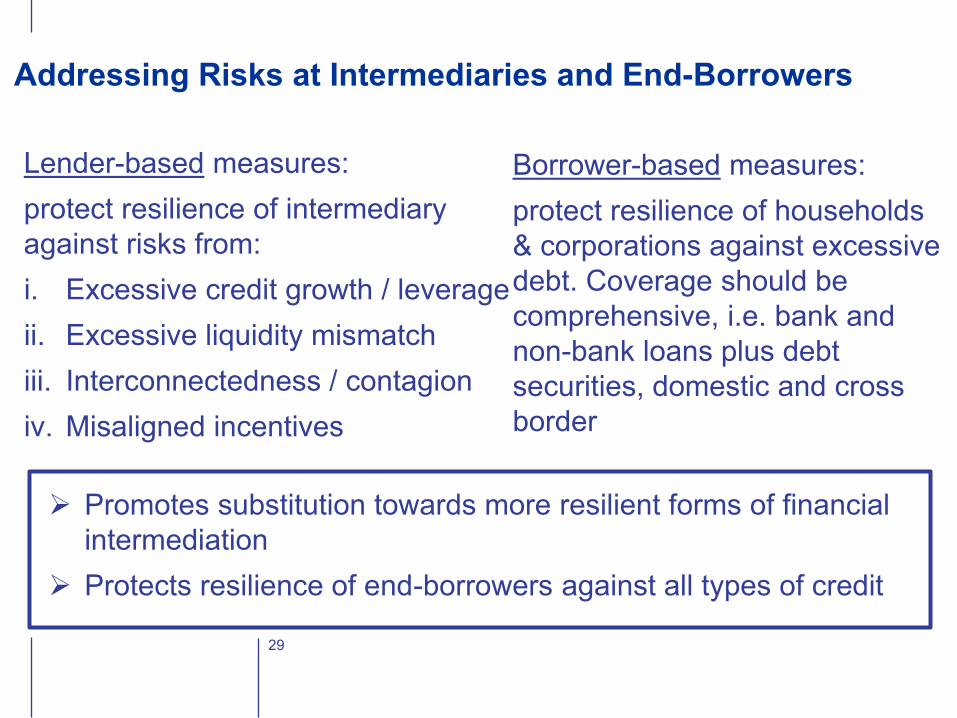
Lender-based measures:
protect resilience of intermediary
against risks from:
i. Excessive credit growth / leverage
ii. Excessive liquidity mismatch
iii. Interconnectedness / contagion
iv. Misaligned incentives
29
Borrower-based measures:
protect resilience of households
& corporations against excessive
debt. Coverage should be
comprehensive, i.e. bank and
non-bank loans plus debt
securities, domestic and cross
border
Addressing Risks at Intermediaries and End-Borrowers
Promotes substitution towards more resilient forms of financial
intermediation
Protects resilience of end-borrowers against all types of credit
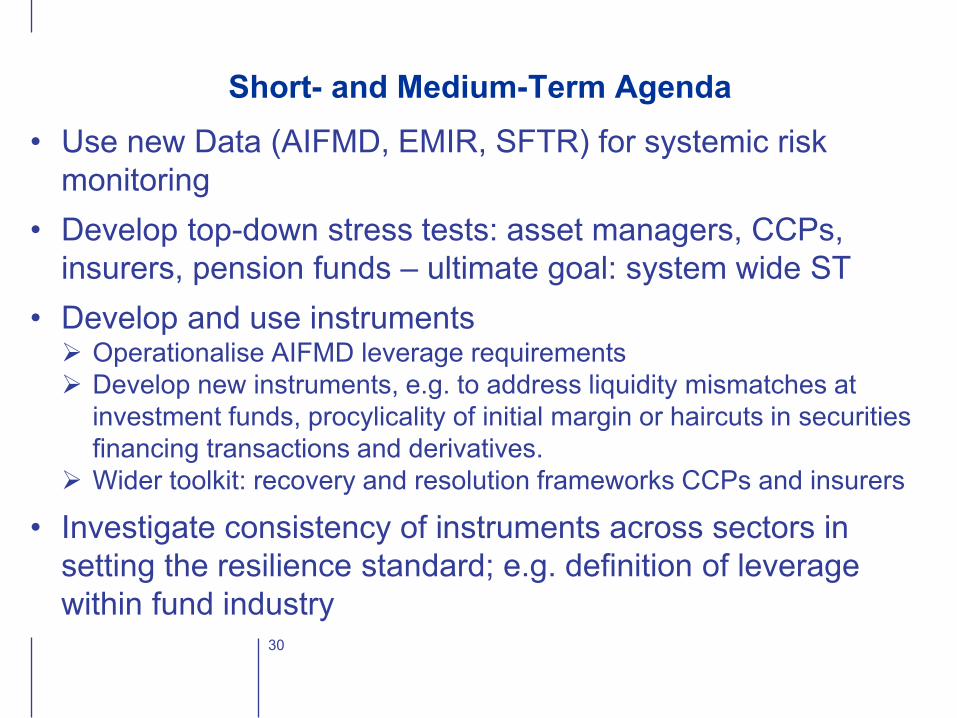
Short- and Medium-Term Agenda
• Use new Data (AIFMD, EMIR, SFTR) for systemic risk
monitoring
• Develop top-down stress tests: asset managers, CCPs,
insurers, pension funds – ultimate goal: system wide ST
• Develop and use instruments Operationalise AIFMD leverage requirements
Develop new instruments, e.g. to address liquidity mismatches at
investment funds, procylicality of initial margin or haircuts in securities
financing transactions and derivatives.
Wider toolkit: recovery and resolution frameworks CCPs and insurers
• Investigate consistency of instruments across sectors in
setting the resilience standard; e.g. definition of leverage
within fund industry
30
5. ASSESSING SHADOW BANKING: NON-BANK FINANCIAL INTERMEDIATION IN EUROPE
31
EU Shadow Banking Monitor:
https://www.esrb.europa.eu/pub/pdf/reports/20160727_shado
w_banking_report.en.pdf
32
ESRB Joint ATC-ASC Expert Group on Shadow Banking
• Mandate covers risk assessment, research and policy
• Developing a framework for monitoring structural changes and risks
stemming from the shadow banking system in the EU
• Conducting a more in-depth analysis of specific topics identified as
relevant from an EU macro-prudential perspective
• Building a European network to discuss shadow banking related
issues
ESRB Annual Shadow Banking Workshop (last time held on 26 September 2016 in Frankfurt)
33
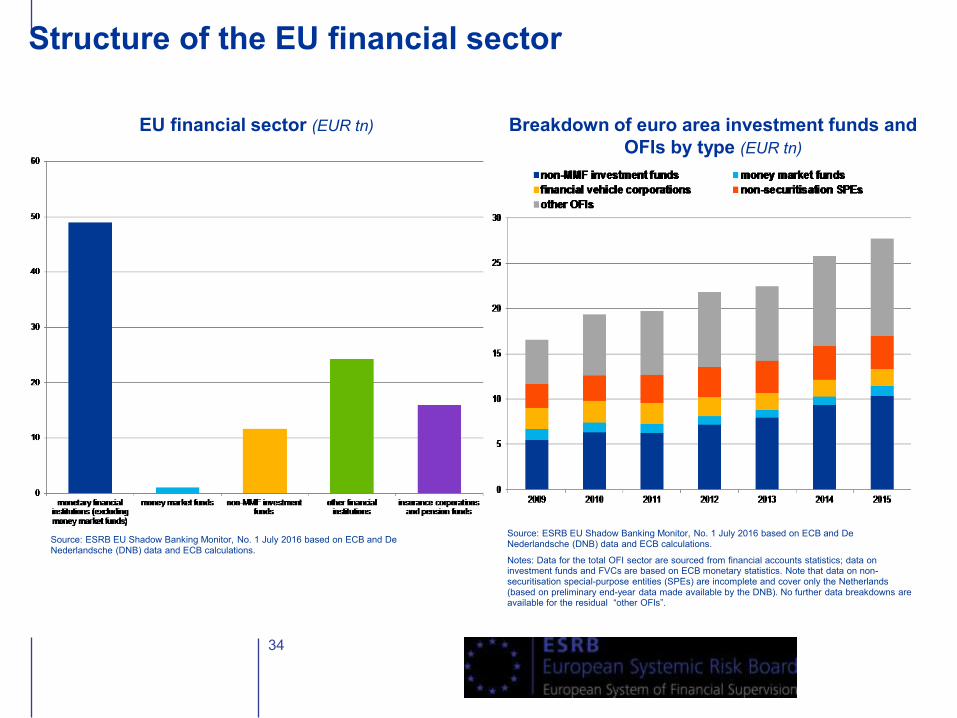
Structure of the EU financial sector
34
Breakdown of euro area investment funds and
OFIs by type (EUR tn)
EU financial sector (EUR tn)
Source: ESRB EU Shadow Banking Monitor, No. 1 July 2016 based on ECB and De Nederlandsche (DNB) data and ECB calculations.
Notes: Data for the total OFI sector are sourced from financial accounts statistics; data on investment funds and FVCs are based on ECB monetary statistics. Note that data on non-securitisation special-purpose entities (SPEs) are incomplete and cover only the Netherlands (based on preliminary end-year data made available by the DNB). No further data breakdowns are available for the residual “other OFIs”.
Source: ESRB EU Shadow Banking Monitor, No. 1 July 2016 based on ECB and De Nederlandsche (DNB) data and ECB calculations.
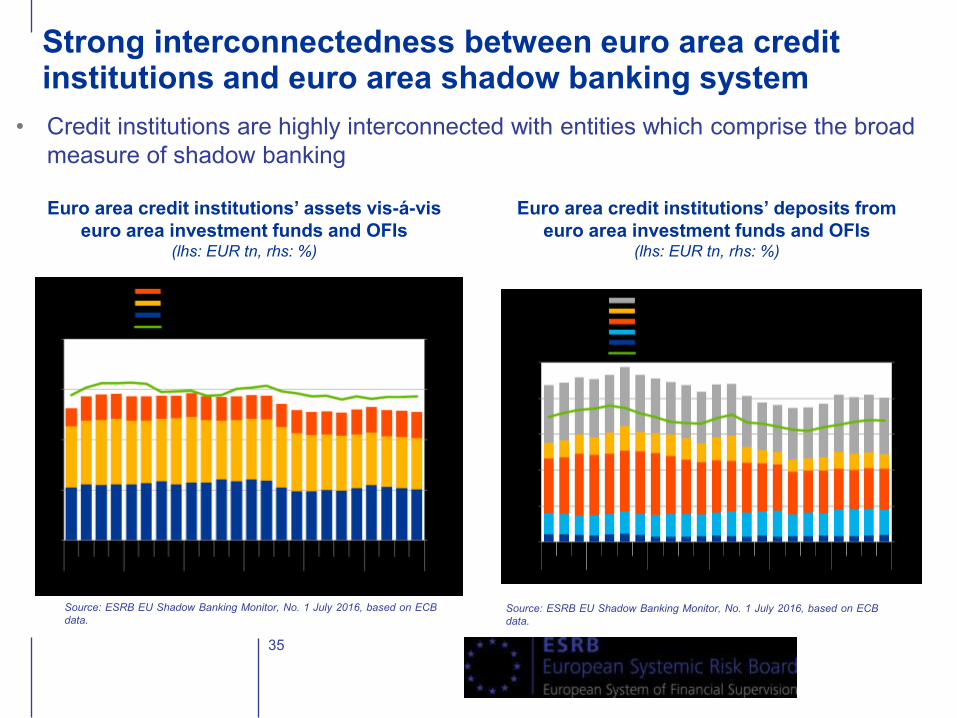
Strong interconnectedness between euro area credit institutions and euro area shadow banking system
35
Euro area credit institutions’ assets vis-á-vis
euro area investment funds and OFIs (lhs: EUR tn, rhs: %)
• Credit institutions are highly interconnected with entities which comprise the broad
measure of shadow banking
Source: ESRB EU Shadow Banking Monitor, No. 1 July 2016, based on ECB
data.
Euro area credit institutions’ deposits from
euro area investment funds and OFIs (lhs: EUR tn, rhs: %)
Source: ESRB EU Shadow Banking Monitor, No. 1 July 2016, based on ECB
data.
ESRB methodology for designing a monitoring framework for shadow banking in Europe
36
• Focus: Analysis on examining liquidity and maturity transformation,
leverage, interconnectedness with regular banking system and credit
intermediation
• Risk-based approach: Applies entity-based and activity-based
approaches, mapping broad shadow banking system in EU
• Entity-based mapping: Approach examines investment funds (incl.
MMFs), financial vehicle corporations (FVCs), Other OFIs (non-
securitisation special purpose entities (SPEs), security and derivative
dealers (SDDs) and financial companies engaged in lending (FCLs)),
and assesses their level of shadow banking engagement
• Activity-based mapping: Approach focuses on horizontal shadow
banking risks from financial markets which cut across entities
(securities financing transactions (SFTs), derivatives))
37
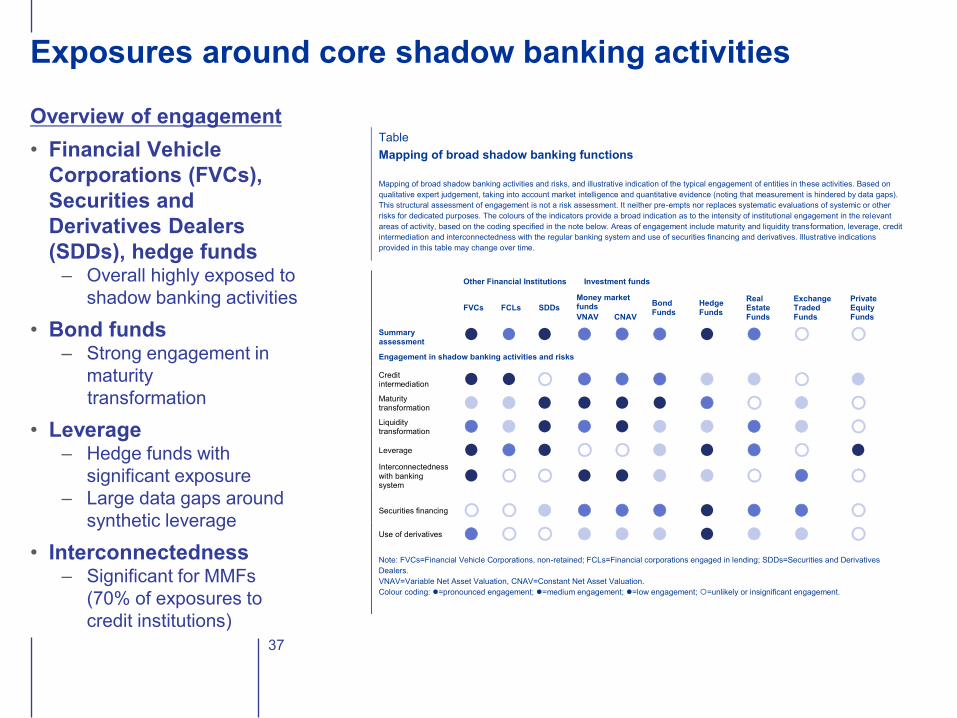
Exposures around core shadow banking activities
Overview of engagement
• Financial Vehicle
Corporations (FVCs),
Securities and
Derivatives Dealers
(SDDs), hedge funds – Overall highly exposed to
shadow banking activities
• Bond funds – Strong engagement in
maturity
transformation
• Leverage – Hedge funds with
significant exposure
– Large data gaps around
synthetic leverage
• Interconnectedness – Significant for MMFs
(70% of exposures to
credit institutions)
Table
Mapping of broad shadow banking functions
Mapping of broad shadow banking activities and risks, and illustrative indication of the typical engagement of entities in these activities. Based on
qualitative expert judgement, taking into account market intelligence and quantitative evidence (noting that measurement is hindered by data gaps).
This structural assessment of engagement is not a risk assessment. It neither pre-empts nor replaces systematic evaluations of systemic or other
risks for dedicated purposes. The colours of the indicators provide a broad indication as to the intensity of institutional engagement in the relevant
areas of activity, based on the coding specified in the note below. Areas of engagement include maturity and liquidity transformation, leverage, credit
intermediation and interconnectedness with the regular banking system and use of securities financing and derivatives. Illustrative indications
provided in this table may change over time.
Other Financial Institutions Investment funds
Summary assessment
FVCs FCLs SDDs
Money market funds Bond
Funds Hedge Funds
Real Estate Funds
Exchange Traded Funds
Private Equity Funds VNAV CNAV
Engagement in shadow banking activities and risks
Credit intermediation Maturity transformation Liquidity transformation Leverage Interconnectedness with banking system
Securities financing Use of derivatives
Note: FVCs=Financial Vehicle Corporations, non-retained; FCLs=Financial corporations engaged in lending; SDDs=Securities and Derivatives
Dealers.
VNAV=Variable Net Asset Valuation, CNAV=Constant Net Asset Valuation.
Colour coding: =pronounced engagement; =medium engagement; =low engagement; =unlikely or insignificant engagement.
Work towards transparency in the EU derivatives markets: EMIR and ESRB analysis
• EMIR (European Market and Infrastructure Regulation) requires all
EU counterparties entering a derivative (OTC and ETD) contract to
report details on the contract to trade depositories. This EU wide
data is available to ESMA and ESRB.
• ESRB has worked extensively on EMIR data with the following
objectives:
1. Developing a data infrastructure,
2. Contributing to improvements in data quality,
3. Conducting policy-relevant analyses.
ESRB Occasional Paper: Shedding light on dark markets
https://www.esrb.europa.eu/pub/pdf/occasional/20160922_occasional_paper_11.en.pdf
Focus on three types of derivatives: IR, credit and FX
Several key takeaways, including:
1. EMIR data can already provide useful insights
2. High level of intra-financial exposures (especially intra-dealer
exposures)
3. The network of trades and exposures reflects key regulatory and
other changes (central clearing obligations, compression, etc.)

6. CONCLUSIONS
40
• EU banking sector faces both cyclical and structural
challenges related to low profitability, overcapacity and
asset quality in certain countries.
• Macroprudential policy making active in Europe.
• Rapidly growing EU non-financial sector requires adequate
framework to monitor and address potential emerging
sources of systemic risk.
• Given the financial system wide focus, the ESRB continues
to contribute to macroprudential policy making and
development in the EU.
Conclusions
41

42
Thank you for your attention !
www.esrb.europa.eu
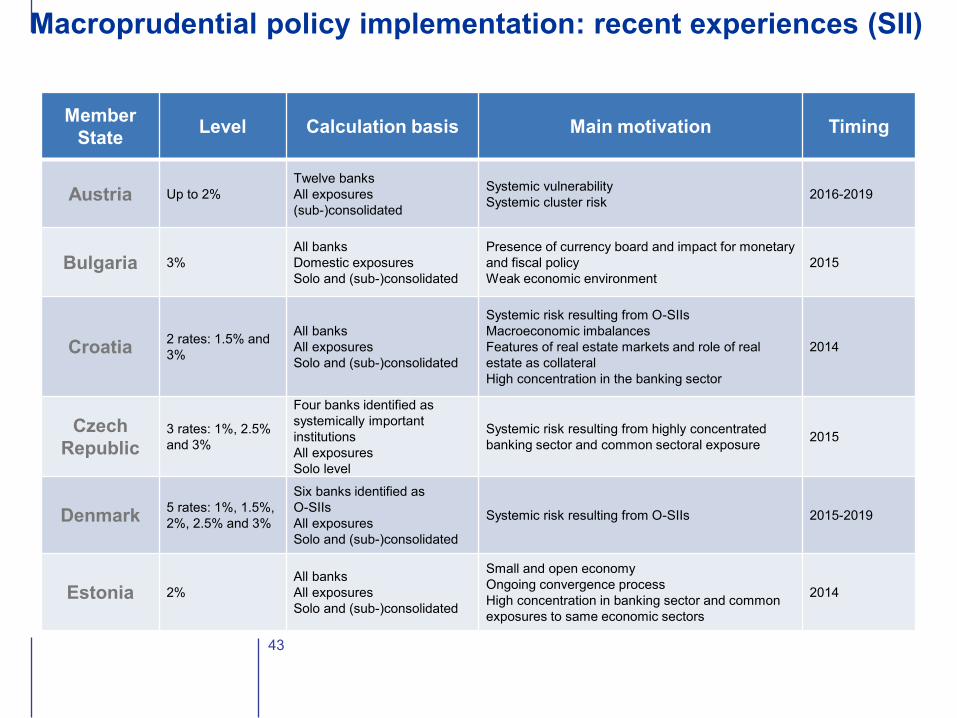
43
Member
State Level Calculation basis Main motivation
Timing
Austria Up to 2%
Twelve banks
All exposures
(sub-)consolidated
Systemic vulnerability
Systemic cluster risk 2016-2019
Bulgaria 3%
All banks
Domestic exposures
Solo and (sub-)consolidated
Presence of currency board and impact for monetary
and fiscal policy
Weak economic environment
2015
Croatia 2 rates: 1.5% and
3%
All banks
All exposures
Solo and (sub-)consolidated
Systemic risk resulting from O-SIIs
Macroeconomic imbalances
Features of real estate markets and role of real
estate as collateral
High concentration in the banking sector
2014
Czech
Republic 3 rates: 1%, 2.5%
and 3%
Four banks identified as
systemically important
institutions
All exposures
Solo level
Systemic risk resulting from highly concentrated
banking sector and common sectoral exposure 2015
Denmark 5 rates: 1%, 1.5%,
2%, 2.5% and 3%
Six banks identified as
O-SIIs
All exposures
Solo and (sub-)consolidated
Systemic risk resulting from O-SIIs 2015-2019
Estonia 2%
All banks
All exposures
Solo and (sub-)consolidated
Small and open economy
Ongoing convergence process
High concentration in banking sector and common
exposures to same economic sectors
2014
Macroprudential policy implementation: recent experiences (SII)
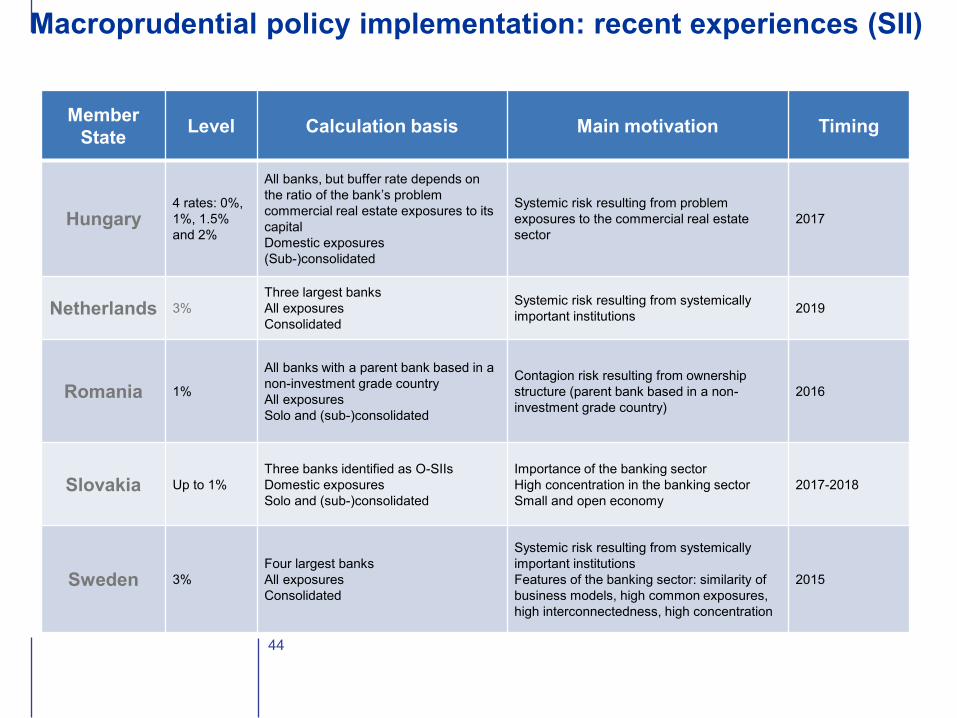
44
Member
State Level Calculation basis Main motivation
Timing
Hungary 4 rates: 0%,
1%, 1.5%
and 2%
All banks, but buffer rate depends on
the ratio of the bank’s problem
commercial real estate exposures to its
capital
Domestic exposures
(Sub-)consolidated
Systemic risk resulting from problem
exposures to the commercial real estate
sector
2017
Netherlands 3%
Three largest banks
All exposures
Consolidated
Systemic risk resulting from systemically
important institutions 2019
Romania 1%
All banks with a parent bank based in a
non-investment grade country
All exposures
Solo and (sub-)consolidated
Contagion risk resulting from ownership
structure (parent bank based in a non-
investment grade country)
2016
Slovakia Up to 1%
Three banks identified as O-SIIs
Domestic exposures
Solo and (sub-)consolidated
Importance of the banking sector
High concentration in the banking sector
Small and open economy
2017-2018
Sweden 3%
Four largest banks
All exposures
Consolidated
Systemic risk resulting from systemically
important institutions
Features of the banking sector: similarity of
business models, high common exposures,
high interconnectedness, high concentration
2015
Macroprudential policy implementation: recent experiences (SII)
5.1. ENTITY-BASED MAPPING OF SHADOW BANKING
45
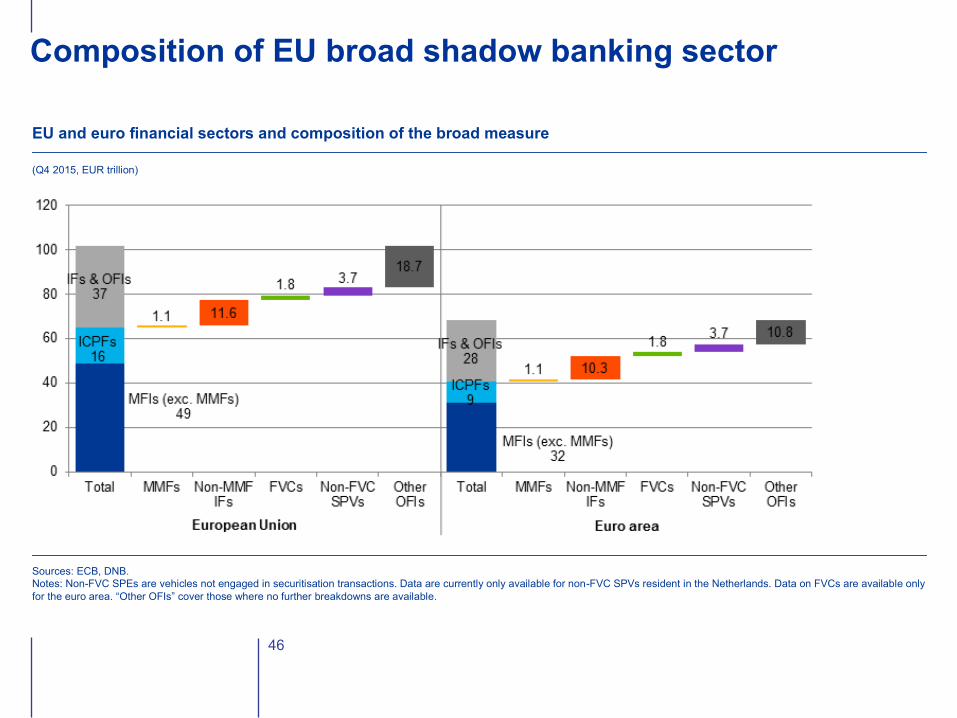
46
EU and euro financial sectors and composition of the broad measure
(Q4 2015, EUR trillion)
Sources: ECB, DNB.
Notes: Non-FVC SPEs are vehicles not engaged in securitisation transactions. Data are currently only available for non-FVC SPVs resident in the Netherlands. Data on FVCs are available only
for the euro area. “Other OFIs” cover those where no further breakdowns are available.
Composition of EU broad shadow banking sector
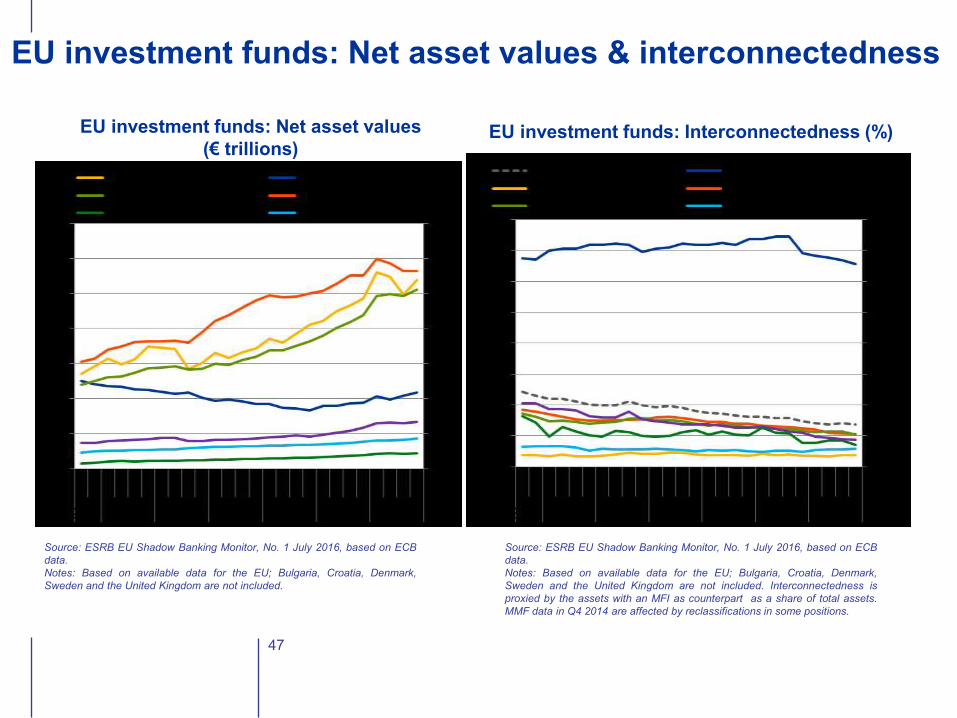
EU investment funds: Net asset values & interconnectedness
47
EU investment funds: Net asset values
(€ trillions)
Source: ESRB EU Shadow Banking Monitor, No. 1 July 2016, based on ECB
data.
Notes: Based on available data for the EU; Bulgaria, Croatia, Denmark,
Sweden and the United Kingdom are not included.
EU investment funds: Interconnectedness (%)
Source: ESRB EU Shadow Banking Monitor, No. 1 July 2016, based on ECB
data.
Notes: Based on available data for the EU; Bulgaria, Croatia, Denmark,
Sweden and the United Kingdom are not included. Interconnectedness is
proxied by the assets with an MFI as counterpart as a share of total assets.
MMF data in Q4 2014 are affected by reclassifications in some positions.
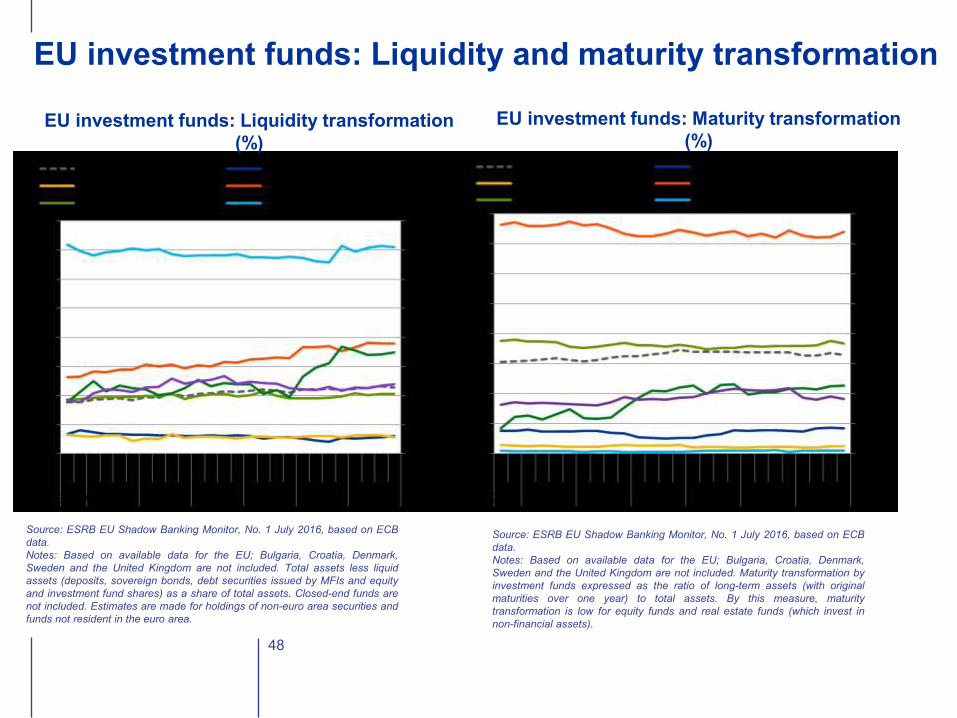
EU investment funds: Liquidity and maturity transformation
48
Source: ESRB EU Shadow Banking Monitor, No. 1 July 2016, based on ECB
data.
Notes: Based on available data for the EU; Bulgaria, Croatia, Denmark,
Sweden and the United Kingdom are not included. Total assets less liquid
assets (deposits, sovereign bonds, debt securities issued by MFIs and equity
and investment fund shares) as a share of total assets. Closed-end funds are
not included. Estimates are made for holdings of non-euro area securities and
funds not resident in the euro area.
EU investment funds: Liquidity transformation
(%)
EU investment funds: Maturity transformation
(%)
Source: ESRB EU Shadow Banking Monitor, No. 1 July 2016, based on ECB
data.
Notes: Based on available data for the EU; Bulgaria, Croatia, Denmark,
Sweden and the United Kingdom are not included. Maturity transformation by
investment funds expressed as the ratio of long-term assets (with original
maturities over one year) to total assets. By this measure, maturity
transformation is low for equity funds and real estate funds (which invest in
non-financial assets).
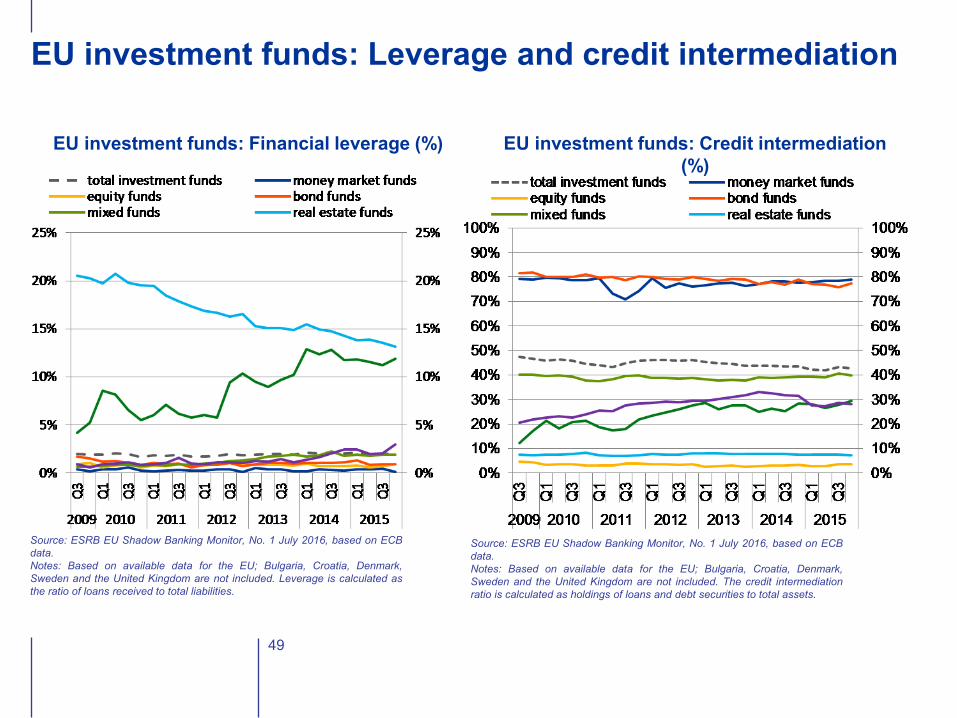
EU investment funds: Leverage and credit intermediation
49
EU investment funds: Financial leverage (%) EU investment funds: Credit intermediation
(%)
Source: ESRB EU Shadow Banking Monitor, No. 1 July 2016, based on ECB
data.
Notes: Based on available data for the EU; Bulgaria, Croatia, Denmark,
Sweden and the United Kingdom are not included. Leverage is calculated as
the ratio of loans received to total liabilities.
Source: ESRB EU Shadow Banking Monitor, No. 1 July 2016, based on ECB
data.
Notes: Based on available data for the EU; Bulgaria, Croatia, Denmark,
Sweden and the United Kingdom are not included. The credit intermediation
ratio is calculated as holdings of loans and debt securities to total assets.
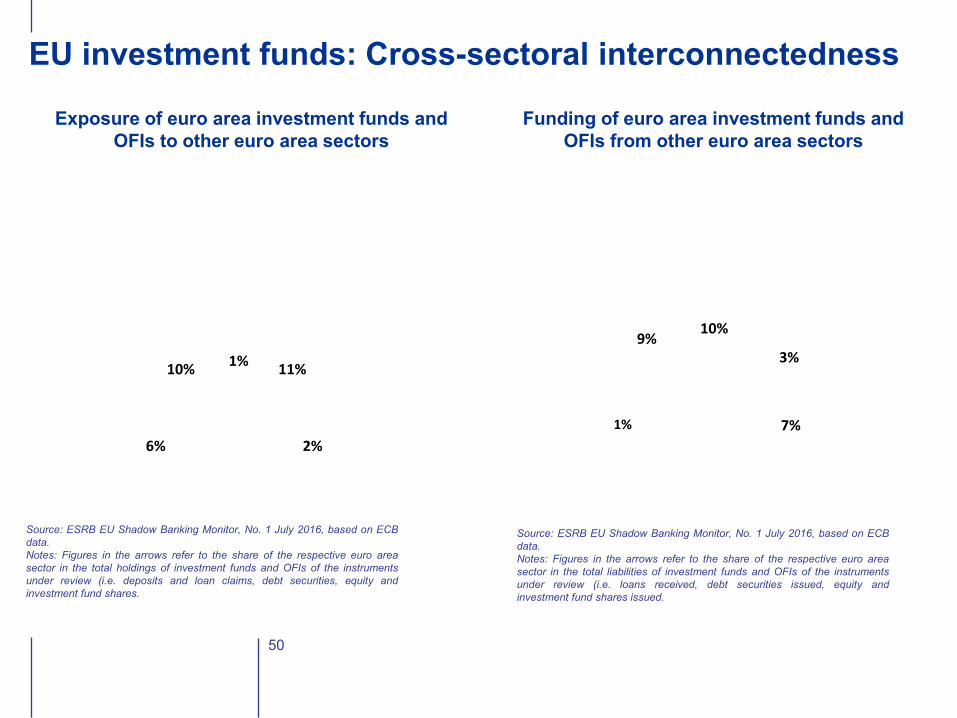
EU investment funds: Cross-sectoral interconnectedness
50
10%
6% 2%
1% 11%
Exposure of euro area investment funds and
OFIs to other euro area sectors
9%
Funding of euro area investment funds and
OFIs from other euro area sectors
1%
10%
3%
7%
Source: ESRB EU Shadow Banking Monitor, No. 1 July 2016, based on ECB
data.
Notes: Figures in the arrows refer to the share of the respective euro area
sector in the total holdings of investment funds and OFIs of the instruments
under review (i.e. deposits and loan claims, debt securities, equity and
investment fund shares.
Source: ESRB EU Shadow Banking Monitor, No. 1 July 2016, based on ECB
data.
Notes: Figures in the arrows refer to the share of the respective euro area
sector in the total liabilities of investment funds and OFIs of the instruments
under review (i.e. loans received, debt securities issued, equity and
investment fund shares issued.
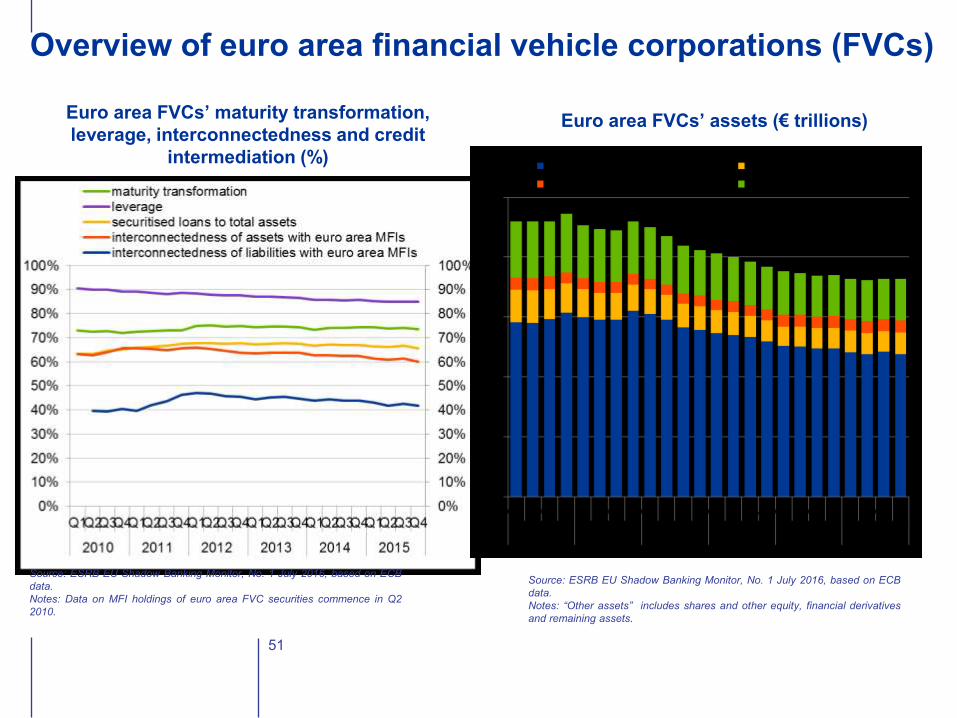
Overview of euro area financial vehicle corporations (FVCs)
51
Euro area FVCs’ maturity transformation,
leverage, interconnectedness and credit
intermediation (%)
Euro area FVCs’ assets (€ trillions)
Source: ESRB EU Shadow Banking Monitor, No. 1 July 2016, based on ECB
data.
Notes: Data on MFI holdings of euro area FVC securities commence in Q2
2010.
Source: ESRB EU Shadow Banking Monitor, No. 1 July 2016, based on ECB
data.
Notes: “Other assets” includes shares and other equity, financial derivatives
and remaining assets.
5.2. ACTIVITY-BASED MAPPING OF SHADOW BANKING
52
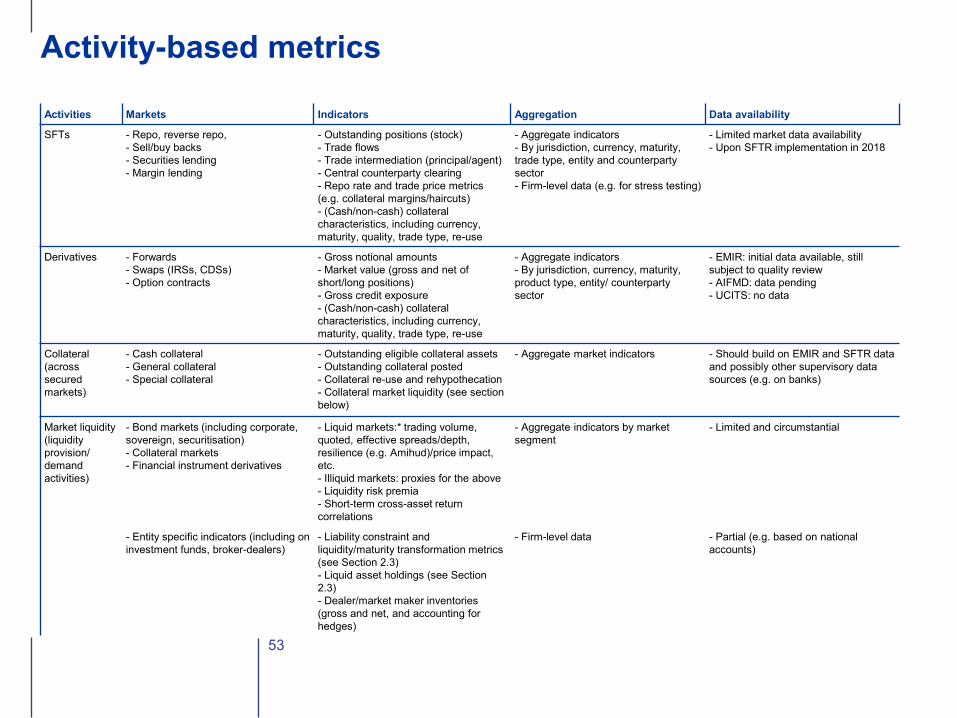
Activity-based metrics
53
Activities Markets Indicators Aggregation Data availability
SFTs - Repo, reverse repo,
- Sell/buy backs
- Securities lending
- Margin lending
- Outstanding positions (stock)
- Trade flows
- Trade intermediation (principal/agent)
- Central counterparty clearing
- Repo rate and trade price metrics
(e.g. collateral margins/haircuts)
- (Cash/non-cash) collateral
characteristics, including currency,
maturity, quality, trade type, re-use
- Aggregate indicators
- By jurisdiction, currency, maturity,
trade type, entity and counterparty
sector
- Firm-level data (e.g. for stress testing)
- Limited market data availability
- Upon SFTR implementation in 2018
Derivatives - Forwards
- Swaps (IRSs, CDSs)
- Option contracts
- Gross notional amounts
- Market value (gross and net of
short/long positions)
- Gross credit exposure
- (Cash/non-cash) collateral
characteristics, including currency,
maturity, quality, trade type, re-use
- Aggregate indicators
- By jurisdiction, currency, maturity,
product type, entity/ counterparty
sector
- EMIR: initial data available, still
subject to quality review
- AIFMD: data pending
- UCITS: no data
Collateral
(across
secured
markets)
- Cash collateral
- General collateral
- Special collateral
- Outstanding eligible collateral assets
- Outstanding collateral posted
- Collateral re-use and rehypothecation
- Collateral market liquidity (see section
below)
- Aggregate market indicators - Should build on EMIR and SFTR data
and possibly other supervisory data
sources (e.g. on banks)
Market liquidity
(liquidity
provision/
demand
activities)
- Bond markets (including corporate,
sovereign, securitisation)
- Collateral markets
- Financial instrument derivatives
- Liquid markets:* trading volume,
quoted, effective spreads/depth,
resilience (e.g. Amihud)/price impact,
etc.
- Illiquid markets: proxies for the above
- Liquidity risk premia
- Short-term cross-asset return
correlations
- Aggregate indicators by market
segment
- Limited and circumstantial
- Entity specific indicators (including on
investment funds, broker-dealers)
- Liability constraint and
liquidity/maturity transformation metrics
(see Section 2.3)
- Liquid asset holdings (see Section
2.3)
- Dealer/market maker inventories
(gross and net, and accounting for
hedges)
- Firm-level data - Partial (e.g. based on national
accounts)
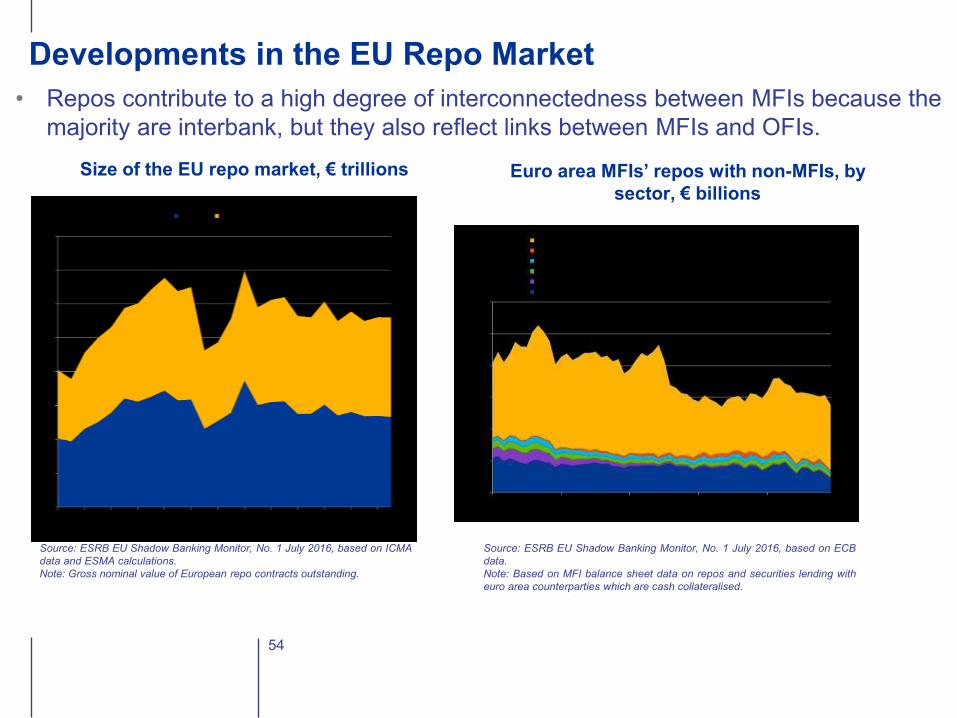
Developments in the EU Repo Market
54
Size of the EU repo market, € trillions
Source: ESRB EU Shadow Banking Monitor, No. 1 July 2016, based on ICMA
data and ESMA calculations.
Note: Gross nominal value of European repo contracts outstanding.
Euro area MFIs’ repos with non-MFIs, by
sector, € billions
• Repos contribute to a high degree of interconnectedness between MFIs because the
majority are interbank, but they also reflect links between MFIs and OFIs.
Source: ESRB EU Shadow Banking Monitor, No. 1 July 2016, based on ECB
data.
Note: Based on MFI balance sheet data on repos and securities lending with
euro area counterparties which are cash collateralised.
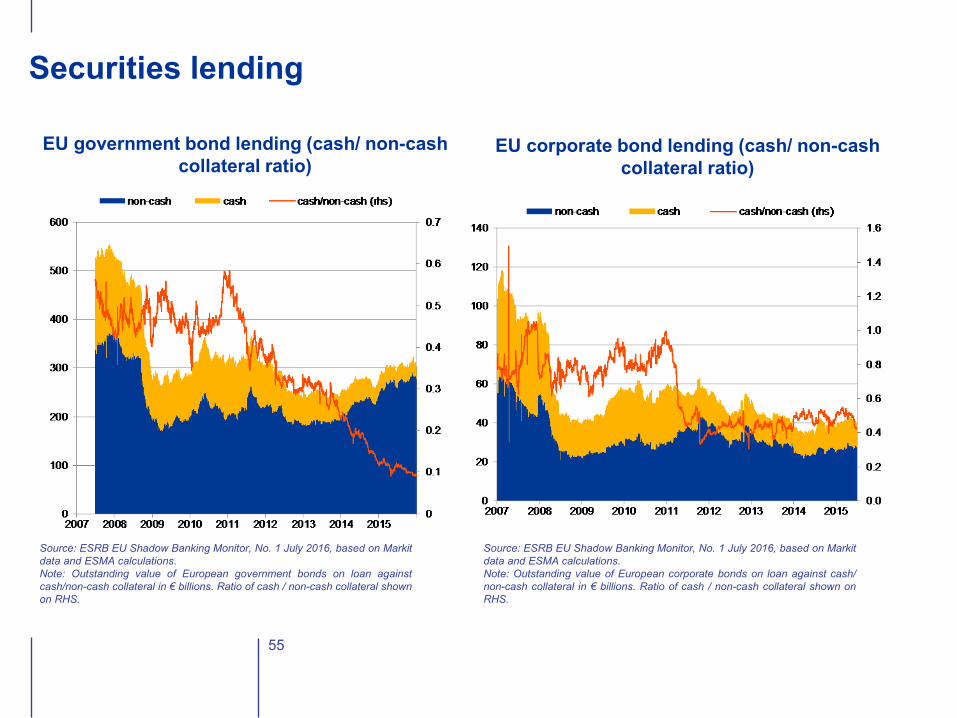
Securities lending
55
EU government bond lending (cash/ non-cash
collateral ratio)
Source: ESRB EU Shadow Banking Monitor, No. 1 July 2016, based on Markit
data and ESMA calculations.
Note: Outstanding value of European government bonds on loan against
cash/non-cash collateral in € billions. Ratio of cash / non-cash collateral shown
on RHS.
EU corporate bond lending (cash/ non-cash
collateral ratio)
Source: ESRB EU Shadow Banking Monitor, No. 1 July 2016, based on Markit
data and ESMA calculations.
Note: Outstanding value of European corporate bonds on loan against cash/
non-cash collateral in € billions. Ratio of cash / non-cash collateral shown on
RHS.
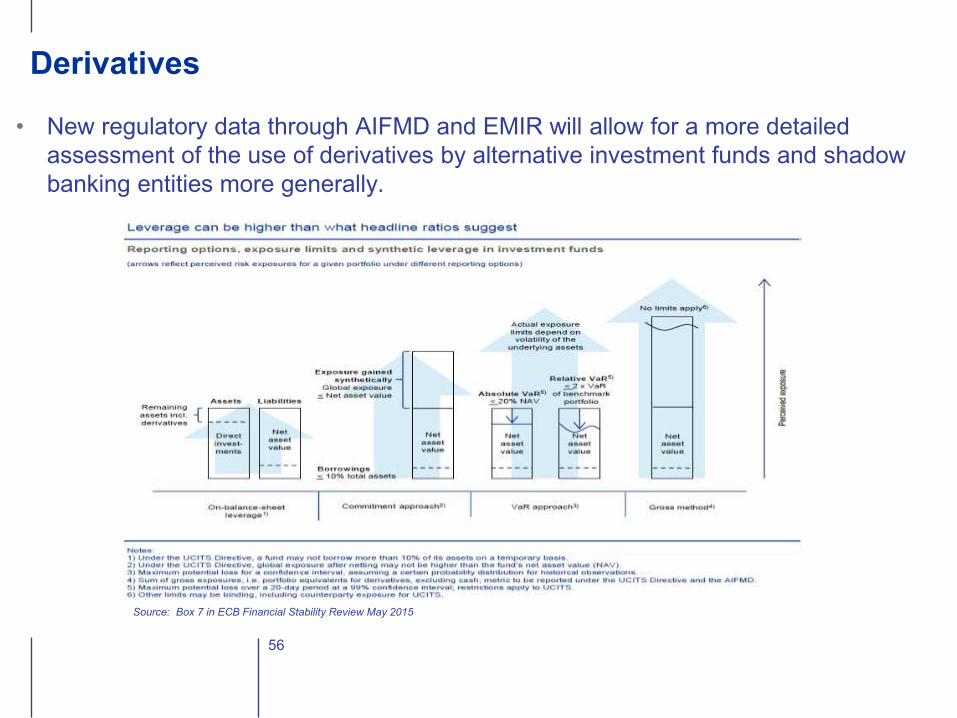
Derivatives
56
• New regulatory data through AIFMD and EMIR will allow for a more detailed
assessment of the use of derivatives by alternative investment funds and shadow
banking entities more generally.
Source: Box 7 in ECB Financial Stability Review May 2015
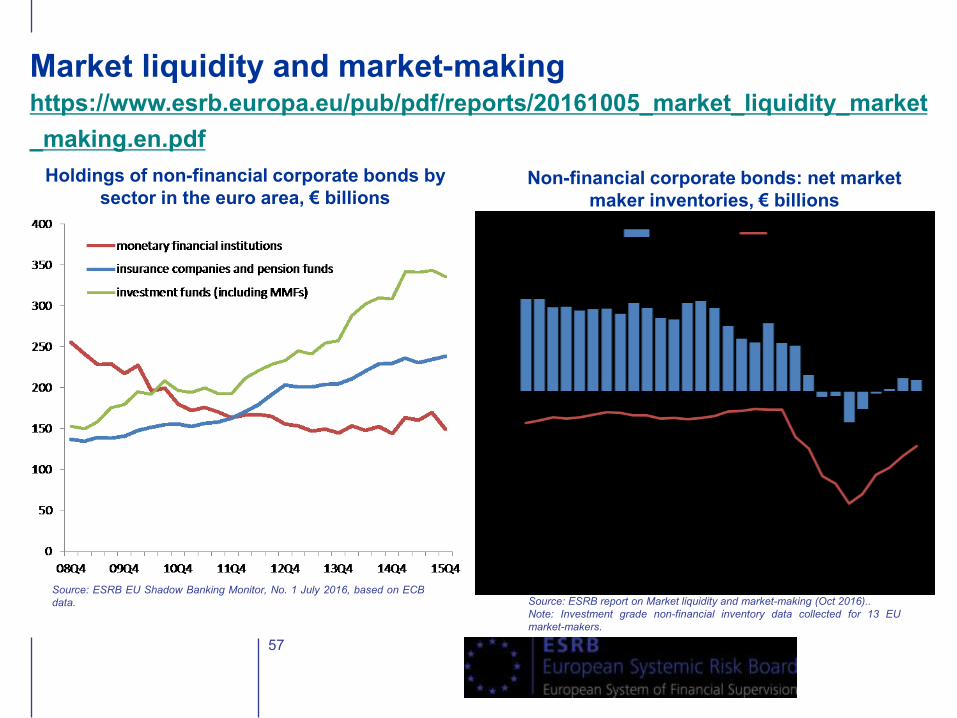
Market liquidity and market-making https://www.esrb.europa.eu/pub/pdf/reports/20161005_market_liquidity_market
_making.en.pdf
57
Holdings of non-financial corporate bonds by
sector in the euro area, € billions
Source: ESRB EU Shadow Banking Monitor, No. 1 July 2016, based on ECB
data.
Non-financial corporate bonds: net market
maker inventories, € billions
Source: ESRB report on Market liquidity and market-making (Oct 2016)..
Note: Investment grade non-financial inventory data collected for 13 EU
market-makers.


