Macrofinancial Risk: Fundamental Concepts and the Current International Context Dale Gray Monetary...
31
Macrofinancial Risk: Fundamental Concepts and the Current International Context Dale Gray Monetary and Capital Markets Department International Monetary Fund [email protected] The views expressed in this presentation are those of the author and should not be attributed to the International Monetary Fund, its Executive Board, or its management.
-
Upload
barnaby-campbell -
Category
Documents
-
view
229 -
download
2
Transcript of Macrofinancial Risk: Fundamental Concepts and the Current International Context Dale Gray Monetary...

Macrofinancial Risk: Fundamental Concepts and the Current International
Context
Dale Gray
Monetary and Capital Markets Department
International Monetary Fund
[email protected] The views expressed in this presentation are those of the author and
should not be attributed to the International Monetary Fund, its Executive Board, or its management.

2
Macrofinancial Risk Analysis
Framework integrates risk-adjusted balance sheets using Contingent Claims Analysis (CCA) with macroeconomic and monetary policy models
CCA models of financial institutions, corporates, and sovereigns are integrated together and with macroeconomic models

3
Outline
Contingent Claims Analysis (CCA)
– CCA Models of Financial Institutions (Moody’sKMV)
– Credit Turmoil and Financial Stability Risks
Venezuelan Bank Sector Risk (MKMV)
Global Spillovers to EM Corporates and Banks
Based on papers by Dale Gray, Robert C. Merton and Zvi Bodie in: (i) JOIM 2007, (ii) NBER 2007; (iii) papers with Samuel Malone and new book on Macrofinance (2008); IMF GFSR 2008.

4
Core Concept: Merton Model/CCA for Firms and Banks
Assets = Equity + Risky Debt
= Equity + Default-Free Debt – Expected Loss
= Implicit Call Option + Default-Free Debt – Implicit Put Option
Assets
Equity or Jr Claims
Risky Debt
• Value of liabilities derived from value of assets.• Liabilities have different seniority.• Randomness in asset value.

5
CCA Credit Risk Measures
Asset Value
Exp. asset Distribution of Asset Valuevalue path
Distress Barrier or promised payments
V0
Time
Probability of Default
T
Distance toDistress: standard
deviations asset value is from debt distress
barrier

6
Summary of CCA and Credit Risk Indicators
Value of Risky Debt, D (A= asset, σ=asset volatility B=distress barrier, P=implicit put option)
Default Probability
Risk Neutral DP
Estimated Actual DP
2 0 1( ( ) ( ))rt rt
Risky Debt Default free value Put Option
Be Be N d A N d
20
2
ln2
Af
A
Ar t
Bd
t
1 2 Ad d t
2( )N d *
2 2( ) ( )N d N d t
1ln 1 *Risk Neutral Risk NeutralEICDS LGD EDF
T

7
Calibrating Implied Assets and Asset VolatilityImplied asset value and implied asset volatility calibrated from contingent claims analysis.
Merton Model
Moody’s-KMV for firms and financial institutions
Merton-type CCA or hybrid models have been applied to corporates and financial institutions. Moody’sKMV, Kamakura and others have applied these models for credit risk analysis to tens of thousands of firms and banks in over 50 countries around the world.
Sovereign CCA uses local currency liabilities and debt structure to imply sovereign assets and asset volatility, used to then get risk indicators such as spreads on foreign and local currency sovereign debt, default probabilities (MfRisk has been applied to 22 countries).

8
Calibrate (Unobservable) Market Value of Asset and Implied Asset Volatility
INPUTS
Value and Volatility of Market Capitalization, E
Debt Distress Barrier B (from Book Value)
Time Horizon
USING TWO EQUATIONS WITH TWO UNKNOWNS
Gives:
Implied Asset
Value A and
Asset Volatility A
Default Probabilities
Spreads, Risk Indicators
)()( 21 dNBedNAE rt
)( 1dNAE AE
KMV maps risk indicators to actual default probabilities (EDFs) using historical default data

9
Using CCA MKMV Models to Analyze the Global Crisis
Overview of subrime and related losses
Sharp increases in spreads of banks with and without subprime exposure
Drivers of increased default probabilites for banks in US and Europe
How changes in global risk appetite contribute to higher credit spreads for banks worldwide

10
Broad credit deteriorationBroad credit deterioration, a weaker U.S. , a weaker U.S. economy,economy, and and financial deleveraging have financial deleveraging have boosted potential lossesboosted potential losses......
Estimates of Potential Write-downs to Holders of U.S-Issued Securitized and Unsecuritized Debt
Leveraged loans
Corporate credit
Consumer credit
Commercial real estate
Prime residential real estate
Non-prime residential real estate
25%
56%
4%
8% 4%
2%
(March 08, $945 billions)
Source: IMF GFSR 2008

11
CDS for Banks and Investment BanksCDS for Banks and Investment Banks
0
50
100
150
200
250
300
Jul Sep Nov Jan Mar
Citigroup
JP Morgan
Barclays
Deutsche Bank
UBS
Credit Suisse
0
100
200
300
400
500
600
700
800
Jul Sep Nov Jan Mar
Bear Stearns
Merrill Lynch
Lehman
Goldman Sachs
Morgan Stanley
Banks(5-year CDS spreads in basis points)
Investment Banks(5-year CDS spreads in basis points)

12
MKMV EDF Implied CDS Spreads (EICDS) and Market CDS Spreads for Groups of Banks
Banks with Subprime Exposure/Losses
Banks without Subprime Exposure/Losses
Banks with subprime exposure have higher spreads
0
20
40
60
80
100
120
140
160
180
200
1/3/
06
4/3/
06
7/3/
06
10/3
/06
1/3/
07
4/3/
07
7/3/
07
10/3
/07
1/3/
08
4/3/
08
EICDS
Market CDS
0
20
40
60
80
100
120
140
160
180
200
1/3/
06
4/3/
06
7/3/
06
10/3
/06
1/3/
07
4/3/
07
7/3/
07
10/3
/07
1/3/
08
4/3/
08
EICDS
Market CDS

13
Key Drivers of EDF and EICDS (EDF implied CDS)
1ln 1 *Risk Neutral Risk NeutralEICDS LGD EDF
T
1,( )Risk Neutral A MktEDF N N EDF SR T
( , , )Mkt Leverage AssetEDF f L otherEDF Key Drivers are Market Leverage and Asset Volatility
Key Drivers of credit spreads, EICDS, are (EDF, Market Sharpe Ratio (SR), correlation ρ of bank assets with
market) and Loss Given Default

14
Trends in Banks’ Market Leverage and Asset Volatility
Banks with Subprime Exposure/Losses:
Market Leverage and Asset Volatility Both Increasing
Banks without Subprime Exposure/Losses:
Market Leverage Increasing but Asset Volatility Decreasing
This analysis was done by Andrea Maechler
2
2.2
2.4
2.6
2.8
3
3.2
3.4
3.6
3.8
4
1/3
1/2
00
5
4/3
0/2
00
5
7/3
1/2
00
5
10
/31
/20
05
1/3
1/2
00
6
4/3
0/2
00
6
7/3
1/2
00
6
10
/31
/20
06
1/3
1/2
00
7
4/3
0/2
00
7
7/3
1/2
00
7
10
/31
/20
07
1/3
1/2
00
8
50
55
60
65
70
75
80
Asset volatility(% left scale)
Market Leverage(% rightscale)
2
2.2
2.4
2.6
2.8
3
3.2
3.4
1/3
1/2
00
5
4/3
0/2
00
5
7/3
1/2
00
5
10
/31
/20
05
1/3
1/2
00
6
4/3
0/2
00
6
7/3
1/2
00
6
10
/31
/20
06
1/3
1/2
00
7
4/3
0/2
00
7
7/3
1/2
00
7
10
/31
/20
07
1/3
1/2
00
8
50
55
60
65
70
75
80
85
Asset volatility(% left scale)
Market Leverage(% rightscale)

15
Significantly Higher Market Sharpe Ratio since July 2007 to Peak in March 2008, still high Now
Market Sharpe Ratio and other indicators show decreased global risk appetite

16
Changes in Bank CDS due to Leverage, Volatility and Impact of Increase in Market Price of Risk as of March 20, 2008
(Lower Risk Appetite, Higher Correlation)
With Subprime Exposure/Loss
Without Subprime Loss
CDS January 2007
18 20
Increased Market Leverage
+52 +45
Change in Volatility
+41 +10
Market Price of Risk Increase (SR*ρ)
+75 +70
CDS March 2008
190 bps 145 bps

17
US Banks: Economic Capital Ratios with Low and High Market Price of Risk
0
50
100
150
200
250
300
0 0.1 0.2 0.3 0.4
Capital Ratio (Equity/Mkt Value of Assets)
Cre
dit
Sp
read
(B
asis
poi
nts
)
Lower Market Priceof Risk
Higher Market Priceof Risk

18
Interbank spreads have widened since July 2007, in three different “spikes”

19
Application of CCA MKMV Model to Venzuelan Banks
Default probailities, market leverage, and asset volatility for banking sector in Venzuela
Comparison to USA and Europe
Scenarios
– Lower global risk appetite
– Shock with lower equity, higer volatility

20
Venezuelan banks default probabilities (EDF, 1 yr) 2003-2008
0,01
0,1
1
10
25% EDF(%)
50% EDF(%)
75% EDF(%)
Median for all banks; 75% Quartile; and 25% Quartile
Source: MKMV

21
0
2
4
6
8
10
12
14
25% ASSETVOLATILITY(%)
50% ASSETVOLATILITY(%)
75% ASSETVOLATILITY(%)
Venezuelan banks asset volatility 2003-2008
Median for all banks; 75% Quartile; and 25% Quartile
Source: MKMV

22
40
50
60
70
80
90
100
25% MKT LEVERAGE(%)
50% MKT LEVERAGE(%)
75% MKT LEVERAGE(%)
Venezuelan banks market leverage (debt divided by assets) 2003-2008
Median for all banks; 75% Quartile; and 25% Quartile
Source: MKMV

23
Median EDF for Venezuelan Banks slightly higher than US banks which are slightly higher than EU banks

24
Highest one-fourth of banks in Venezuela and US have similar default probabilities (EDF), EU slightly lower
25
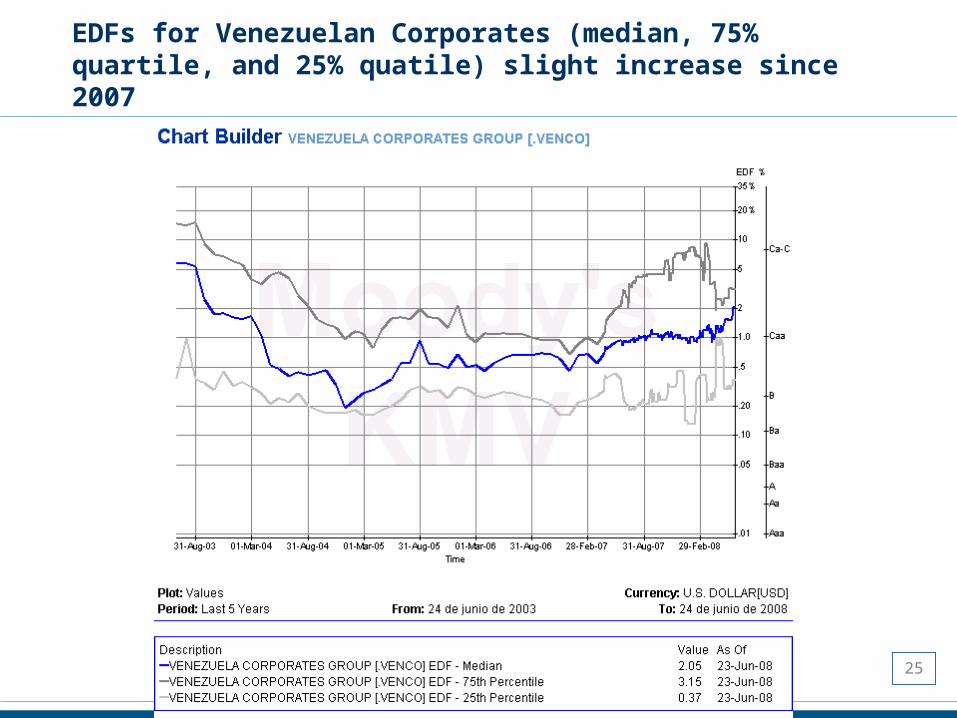
EDFs for Venezuelan Corporates (median, 75% quartile, and 25% quatile) slight increase since 2007

26
Spillovers to Emerging Markets (EM) Banks and Corporates
EM banks’ spreads up somewhat, lower global risk appetite is a contributing factor
Certain EM banks, dependent on foreign financing, under strain (e.g. Iceland)
Sharp dropoff in EM corporate bond issuance
EM corporate spreads up, global risk appetite is a factor
Is the credit turmoil leading to reductions in credit to EM corporate and rise in borrowing cost that will have long term effects?

27
Emerging Market Bank External Bond Issuance is Down
0
5
10
15
20
25
30
35
40
Q105 Q205 Q305 Q405 Q106 Q206 Q306 Q406 Q107 Q207 Q307 Q407 Q108
LatamEMEAAsia
Emerging Market Bank External Bond Issuance (US$ bn)

28
EM Bank Spreads
EM Bank CDS (bps)
0
200
400
600
800
1000
1200
Kazakhstan Banks Icelandic Banks
EM Sovereign CDS
Asian Banks
Russian Banks

29
EM Corporate Bond Issuance Down and EM Corporate Bond Issuance Down and EM Corporate Spreads UpEM Corporate Spreads Up
0
5
10
15
20
25
30
35
Q106 Q206 Q306 Q406 Q107 Q207 Q307 Q407 Q108
Asia
EMEA
Latam
100
150
200
250
300
350
400
450
Jan-07 Apr-07 Jul-07 Oct-07 Jan-08
Asia
EMEA
Latin
EM Private Sector Bond Issuance(In billions of U.S. dollars)
EM Corporate Spreads (In basis points)

30
Rough Estimates of Drivers of Emerging Market (EM) Banks and (EM) Corporate Credit Spreads
EM Banks EM Corporates
Credit Spreads January 2007
100 170
Increased Market Leverage
+10 +20-50?
Change in Volatility
+10 + 20-50?
Mkt Price of Risk Increase*
+55 +40-80?
Credit Spreads January 2008
175 bps 320 bps

31
Thank you, More information see:
Papers by D. Gray, Robert C. Merton, Zvi Bodie:
NBER 12637 (2006)
NBER 13607 (2007)
Sovereign Credit Risk, JOIM v. 5, no. 4, Dec 2007
IMF Global Financial Stability Report (GFSR)
IMF Working Papers: WP 05/155, 04/121, 07/233, Indonesia SIP (2006), Gray and Walsh (WP 08/89), Gray, Lim, Loukoianova, Malone (WP/08), IMF Staff Papers Gapen et. al v 55 #1 2008; Framework for Integrating Macroeconomics and Financial Sector Analysis by Gray, Karam, Malone, N’Diaye (forthcoming)
Macrofinancial Risk Analysis, Gray and Malone (Wiley Finance book Foreword by Robert Merton)