Macroeconomics ICMR Workbook
447
WORKBOOK Macroeconomics The Icfai University Press # 52, Nagarjuna Hills, Hyderabad – 500 082 © 2004 The Icfai University Press.All rights reserved.ISBN : 81-314-0227-4 Ref. No. MACWB 04200404
-
Upload
sarthak-gupta -
Category
Documents
-
view
1.810 -
download
74
description
Macroeconomics ICMR Workbook
Transcript of Macroeconomics ICMR Workbook

WORKBOOK
Macroeconomics
The Icfai University Press# 52, Nagarjuna Hills, Hyderabad – 500 082
© 2004
The Ic
fai U
nivers
ity P
ress.A
ll righ
ts res
erved
.ISBN : 8
1-314
-0227
-4 Ref.
No.
MACWB 04
2004
04
© 2004 The Icfai University Press. All rights reserved. No part of this
publication may be
reproduced, stored in a
retrieval system, used in
a spreadsheet, or
transmitted in any form
or by any means –
electronic, mechanical,
photocopying or
otherwise – without prior
permission in writing
from The Icfai University
Press.
ISBN : 81-314-0227-4 Ref. No. MACWB 04200404 For any clarification regarding this book, the students
may please write to us giving the above reference
number of this book specifying chapter and page
number.
While every possible care has been taken in type-
setting and printing this book, we welcome
suggestions from students for improvement in future
editions.
© 2004
The Ic
fai U
nivers
ity P
ress.A
ll righ
ts res
erved
.ISBN : 8
1-314
-0227
-4 Ref.
No.
MACWB 04
2004
04
Preface
The ICFAI University has been upgrading the study material so that it is amenable for self study by the Distance Learning Students. We are delighted to publish a Workbook for the benefit of the students preparing for the examinations. The workbook is divided into three different parts. Brief Summaries of Chapters A brief summary of all the chapters in the textbook are given here for easy recollection of the topics studied. Part I: Questions on Basic Concepts and Answers (with Explanatory Notes) Students are advised to go through the relevant textbook carefully and understand the subject thoroughly before attempting Part I. Under no circumstances the students should attempt Part I without fully grasping the subject material provided in the textbook. Part II: Problems and Solutions The students should attempt Part II only after carefully going through all the solved examples in the textbook. A few repetitive problems are provided for the students to have sufficient practice. Part III: Model Question Papers (with Suggested Answers) The Model Question Papers are included in Part III of this workbook. The students should attempt all model question papers under simulated examination environment. They should self score their answers by comparing them with the model answers. Effective from April, 2003, the examinations for all the subjects of DBF/CFA (Level-I) consist of only multiple-choice questions. Each paper consists of Part I and Part II. Part I is intended to test the conceptual understanding of the students. It contains 40 questions carrying one point each. Part II contains problems with an aggregate weightage of 60 points. Please remember that the ICFAI University examinations follow high standards that demand rigorous preparation. Students have to prepare well to meet these standards. There are no short-cuts to success. We hope that the students will find this workbook useful in preparing for the ICFAI University examinations. Work Hard. Work Smart. Work Regularly. You have every chance to succeed. All the best.
© 2004
The Ic
fai U
nivers
ity P
ress.A
ll righ
ts res
erved
.ISBN : 8
1-314
-0227
-4 Ref.
No.
MACWB 04
2004
04
Contents
Brief Summaries of Chapters 1
Part I : Questions on Basic Concepts and Answers (with Explanatory Notes) 10
Part II : Problems and Solutions 98
Part III : Model Question Papers (with Suggested Answers) 317
© 2004
The Ic
fai U
nivers
ity P
ress.A
ll righ
ts res
erved
.ISBN : 8
1-314
-0227
-4 Ref.
No.
MACWB 04
2004
04
Detailed Curriculum Overview of Macroeconomics: Microeconomics vs. Macroeconomics, Fundamental Concerns of Macroeconomic Policy, Objectives and Instruments of Macroeconomics, Aggregate Supply and Aggregate Demand.
The National Income and Product Accounts: Gross Domestic Product, Two Measures of National Product: Goods-Flow and Earnings-Flow, Business Accounts and GDP, The Problem of "Double Counting", Details of the National Accounts.
Consumption and Investment: Consumption and Saving, The Consumption Function, The Savings Function, Investment: Determinants of Investment, The Investment Demand Curve, Shifts in the Investment Demand Curve.
Aggregate Demand and the Multiplier: The Downward-Sloping Aggregate Demand Curve, Shifts in Aggregate Demand, Relative Importance of Factors Influencing Demand. Output Determination with Saving and Investment, The Meaning of Equilibrium, Output Determination by Consumption and Investment, The Multiplier, The Multiplier in the AS-AD Framework, The Paradox of Thrift.
Government, International Trade, and Output: Impact of Fiscal Policy on Output, Fiscal Policy Multipliers, Impact of International Trade on GDP.
Money and Banking: Money Supply and Interest Rates: Components of Money Supply, Interest Rates: Real vs. Nominal Interest Rates, The Demand for Money, Money's Functions, The Process of Deposit Creation, Balance Sheet of the Central Bank. Credit Control by the Central Bank. The Effects of Money on Output and Prices: The Monetary Transmission Mechanism, The Money Market, Supply of and Demand for Money, The Monetary Mechanism, Monetary Policy in an Open Economy, Monetary Policy in the AD-AS Framework, Monetary Effects in the Long Run.
Economic Growth and Aggregate Supply: The Four Elements in Development: Human Resources, Natural Resources, Capital Formation, Technological Change and Innovation. Theories of Economic Growth, Determinants of Aggregate Supply, Aggregate Supply in the Short run and Long run.
Business Cycles and Unemployment: Features of the Business Cycle, Business Cycle Theories, Unemployment: Okun's Law, Impact of Unemployment, Economic Interpretation of Unemployment.
Price Stability: Inflation: Definition of Inflation, Price Indexes, The Economic Impacts of Inflation, Modern Inflation Theory: Prices in the AS-AD Framework, The Phillips Curve, Anti-inflation Policy.
Classical, Keynesian and Post-Keynesian Macroeconomics: The Classical Tradition: Say's Law of Markets, Policy Consequences, The Keynesian Revolution, Retreat from Keynes. The Monetarist Approach: The Quantity Theory of Prices. Modern Monetarism, New Classical Macroeconomics: Rational Expectations, Implications for Macroeconomics, Ultra-Classicism: Supply-Side Economics: Macroeconomic Policies.
Economic Consequences of Debt: Budgets and Fiscal Policy, Definitions, Government Budget Policy, Discretionary Fiscal Policy, Automatic Stabilizers, Fiscal Deficits: Concepts and Trends, Applications of Cyclical and Structural Budgets. The Burden of Deficits and Debts, The Crowding-Out Controversy, Crowding-Out and the Money Market, Impact of Structural Deficits, Government Debt and Economic Growth, External vs. Internal Debt.
Policies for Growth and Stability: The Interaction of Monetary and Fiscal Policies.
The Open Economy: International vs. Domestic Trade. Economic Basis for International Trade, The Principle of Comparative Advantage, The Economic Gains from Trade, Protectionism : Supply-and-Demand Analysis of Trade and Tariffs, The Determination of Foreign Exchange Rates, Floating Exchange Rate and Fixed Exchange Rates. The Balance of Payments.
Strategies of Economic Development: The Backwardness Hypothesis, Industrialization vs. Agriculture, State vs. Market, Growth and Openness.
International Financial Institutions: The International Monetary Fund (IMF), The World Bank, Asian Development Bank, International Financial Corporation, Bank for International Settlements.
Macroeconomic Policies in India: An Overview of Monetary Policy, Fiscal Policy, Industrial Policy, Trade Policy in India.
Current Developments.
© 2004
The Ic
fai U
nivers
ity P
ress.A
ll righ
ts res
erved
.ISBN : 8
1-314
-0227
-4 Ref.
No.
MACWB 04
2004
04
Brief Summaries of Chapters Macroeconomic Analysis: An Overview • Macroeconomics is the study of economy as a whole. As a field of study it analyzes the
causes of major problems such as high unemployment, rampant inflation, low wages, low economic growth, and mounting trade deficits. It deals with both the short-term fluctuations in output, employment and prices that called the business cycle and the long-term trends in output and standards of living called economic growth. It is, therefore, important to know about the forces that act behind growth and cycles for understanding the science of macroeconomics. Macroeconomic analysis attempts to explain why problems arise in an economy and how these problems can be dealt with. It is, therefore, indispensable for formulating and conducting macroeconomic policy. Macroeconomic policy operates within a framework of goals and constraints. The core objectives of a macroeconomic policy include high output level, full employment, stable prices, trade balance, rapid economic growth, etc. Generally, economists measure the macroeconomic performance by examining some of the key variables – Gross Domestic Product (GDP), the unemployment rate, and inflation. Thus, macroeconomic analysis involves study and analysis of these key variables.
Measurement of Macroeconomic Aggregates • The concepts like national income and national product are most significant in
macroeconomic accounting. As the accounting statement of a firm provides information on the flow of revenues and expenses fully to show the firm’s performance, the national income accounts supply similar information for the economy as a whole. They provide comprehensive overview of how the economy is doing. Among the various aspects that shape the economy is the nation’s capacity to produce goods and services and keep various factors of production employed. The GNP growth rate, the most important indicator of the nation’s economy, shows whether the nation’s income is expanding or contracting, and thus, it is the broadest statistical aggregate of our economic output and growth. The estimates of GNP and national income provide the policy makers and business community with the most useful tool for analyzing an economy’s economic performance. In simple terms, GNP is the sum of all final goods and services produced during a specified time period, usually a year, with each class of goods and services measured at its market value, i.e. at price usually paid. In addition to GNP, there are some other aggregates of national product such as GDP, NDP, and NNP that measure a nation’s production of goods and services. GDP is the value – at current market prices or factor prices – of the total final goods and services produced inside an economy or country during a given time. By contrast, GNP is the value – at current market prices or factor prices – of the total final goods and services produced during a year by the factors owned by an economy or country. The difference between gross and net products is depreciation. In words, depreciation is deducted from gross products to get net products. When measuring GNP, or any other aggregate of national product, only the final value of goods and services is to be considered. In other words, only the value added at each stage of production process is considered while measuring GNP.
• It is important to distinguish between real and nominal values of macroeconomic aggregates. When comparing data at different points in time, economists often use terms such as real wages, real income or real GNP. The ‘real’ refers to the fact that the data have been adjusted for changes in the level of prices. Thus real GNP in current rupees is estimated by deflating the nominal GNP. This is done using GNP deflator. GNP deflator is a price index constructed to a price index to reveal the cost of purchasing the items included in GNP during the period relative to the cost of purchasing the same items in base year. Price indices are measures of inflation. Apart from GNP or GDP deflator, there are two important price indices – the Consumer Price Index (CPI) and the Wholesale Price Index (WPI). Consumer Price Index (CPI) is a price index that is used to measure the cost of a fixed basket of consumer goods in which the weight assigned to each good is the proportionate of expenditures on that good by consumers in the base year. The principles of construction of WPI are quite analogous to those behind CPI. WPI considers producer goods and wholesale prices in contrast to CPI. Weights are based on the value of transaction in various items in the base year.
1
© 2004
The Ic
fai U
nivers
ity P
ress.A
ll righ
ts res
erved
.ISBN : 8
1-314
-0227
-4 Ref.
No.
MACWB 04
2004
04
Measurement of National Income • There are three methods of calculating national income, and they are all conceptually
equivalent to each other. They are (a) output method, (b) the expenditure method, and (c) the income method. The output method is followed either by valuing all the final goods and services produced during a year or by aggregating the values imparted to the intermediate products at each stage of production by the industries and productive enterprises in the economy. The sum of these values added gives the gross domestic product at factor cost, which after a similar adjustment to include net factor income from abroad gives gross national product at factor cost. The expenditure method aggregates all money spent by private citizens, firms and the government within the year, to obtain total domestic expenditure at market prices. It aggregates only the value of final purchases and excludes all expenditures on intermediate goods. However, since final expenditure at market prices include both the effects of taxes and subsidies and our expenditures on imports while excluding the value of our exports, all these transactions have to be taken into account before we obtain gross national product by this method. The income approach to measuring national income does not simply aggregates all incomes. It aggregates only incomes of residents of the nation, corporate and individual, that obtain income directly from the current production of goods and services. It aggregates the money payments made to the different factors of production, i.e. factors income and excludes all incomes which cannot be considered as payment for current services to production.
The Simple Keynesian Model of Income Determination • The principal tool of analysis in the Simple Keynesian Model of Income Determination
model is the ‘aggregate demand’. The focus of this model is only the goods market and the influence of the money market on the goods market. The model is build assuming that prices do not change at all and that firms are willing to sell any amount of output at the given level of prices (the aggregate supply curve is perfectly elastic). Aggregate demand is the total amount of goods demanded in the economy and is equal to the sum of consumption spending (C), investment spending (I), government purchases (G), and net exports (NX). AD = C + I + G + NX
• Equilibrium level of output is that level of output at which the total desired spending on goods and services (desired aggregate demand) is equal to the actual level of output (Y).
• The concept of multiplier is a very useful one. The multiplier tells what the increase in the level of equilibrium income would be for a unit increase in autonomous spending. Multiplier is given by the ratio of increase in equilibrium income to increase in autonomous spending. The value of the multiplier is the reciprocal of the marginal propensity to save, assuming all other components of aggregate demand I, G and NX are constant and independent of the level of income. The larger the marginal propensity to consume, the lower is the marginal propensity to save, and thus larger is the value of the multiplier. Multiplier, ∝ = 1/MPS
• Taxes play an important role in determination of disposable income. When tax is considered, the value of the multiplier is equal to 1/[1 – b (1 – t)], where, b is the marginal propensity to consume and t is the rate of tax. Thus, a cut in the tax rate would, therefore, increase the value of multiplier.
• The value of multiplier in the above case is determined assuming that the other components of aggregate demand, I, G and NX are constant and independent of the level of income. But, in real scenario, the imports are dependent of the level of the income. Mathematically, imports (M) = M(Y) = mY, where m is the marginal propensity to import = ∂M/∂Y. Thus, the value of multiplier is equal to 1/[1 – b (1 – t) + m]
Income Determination Model including Money and Interest • In the simple Keynesian model of income determination, we have determined the level of
income assuming that the investment being autonomous. And therefore we completely avoided the role of interest rates (and money supply) in determining the level of income. But, we know that interest rates and money supply have a major role to play in the economy.
2
© 2004
The Ic
fai U
nivers
ity P
ress.A
ll righ
ts res
erved
.ISBN : 8
1-314
-0227
-4 Ref.
No.
MACWB 04
2004
04
• IS-LM model is constructed by introducing interest rate as an additional determinant of aggregate demand. This model illustrates how goods market (IS curve) and assets market (LM curve) interact and determine income jointly.
• The IS curve shows the combinations of interest rates and level of output such that planned spending equals income. As interest rates and planned investment spending are inversely related, the IS curve slopes downward. At equilibrium, (in goods market) Y = AD. But, investment is a component of aggregate demand. Thus, the equilibrium output decreases (increases) as interest rate rises (decreases), due to inverse relationship between interest rates and planned investment expenditure. If the interest rate increases, ceteris paribus, interest sensitive private investors reduce their investment spending, known as crowding out.
• Asset market is a market in which money, bonds, stocks, houses and other forms of wealth are traded. The demand for money is influenced by the level of real income and the interest rate. It depends on the level of real income because individuals hold money to pay for their consumptions, which in turn, depend on income. The demand for money depends also on the cost of holding money. The cost of holding money is the interest that is forgone by holding money rather than other assets. LM curve shows the combinations of income and interest rate that produce equilibrium in the money market. The LM curve slopes upward. Because, if there is an increase in income, the demand for money rises and this excess demand push the market interest rates up. The real money supply is held constant along the LM curve, and therefore, a change in the real money supply should shift the LM curve that an increase in real money supply shift the LM curve down and to the right whereas a decrease in the real money supply shift the LM curve up and to the right.
• Points on the IS curve indicate equilibrium in the goods market and points on the LM curve indicate equilibrium in the money market. For simultaneous equilibrium in both the goods market and the money market, point indicating such equilibrium will have to lie on both the IS and the LM curves. Such a point exists only at the intersection of the IS and LM curves.
• Crowding out happens due to increase in interest rates, and therefore, can be reduced by increasing the money supply.
• Money is one of the most crucial elements of economic science. It acts as a medium of exchange, unit of account, a standard of deferred payment and a store of value. Classical economists viewed that money is demanded only for spending purposes. However, latter Keynes recognized that money was held for other reasons too. In this view money would be held as an asset, a non-interest-paying asset, whereby velocity is affected and tends to change. According to him, the three motives for holding money are transactions, precaution and liquidity or speculation.
Fundamentals of Aggregate Demand and Aggregate Supply • The aggregate demand-supply model is the basic macroeconomic model for studying output
and price level determination. In short run, the interaction between aggregate demand and aggregate supply determines the level of the output, employment, and capacity utilization as well as the price level (the source of inflation). In the long run, a decade or more say, aggregate supply is considered as the major factor behind economic development and well-being of a nation.
• The aggregate demand schedule (or curve) shows the combinations of the price level and the level of output at which the goods and money markets are simultaneously in equilibrium. The aggregate demand schedule (or curve) slopes downward owing to inverse relationship between price level and the level of output demanded. In addition to price level, there are other factors such as income levels, rate of interest, government policy, exchange rate, expected rate of inflation and business expectations influence the aggregate demand in an economy. When these factors or variables change, the aggregate demand curve will shift.
• In short run, the aggregate supply curve slopes upward from left to right for part of its range because at any point in time there is a limit on the output of goods and services. This limit increases as with increased production, the availability of idle resources decreases and ‘limit’ is reached when the production reaches full employment level of output. When the resources available are fully employed the short run aggregate supply curve becomes vertical. At this
3
© 2004
The Ic
fai U
nivers
ity P
ress.A
ll righ
ts res
erved
.ISBN : 8
1-314
-0227
-4 Ref.
No.
MACWB 04
2004
04
point, further increases in price level will have no effect on output. In short, the aggregate supply curve, in short run, slopes upward from left to right for a part of its range and straightens at the end.
• In the short run, the discrepancy between actual and expected price level causes changes in output and employment. But in the long run, if all other things remain constant, the higher price level will come to be accurately expected by firms, narrowing down the difference between expected and actual price levels. This is important because in the long run, the costs incurred by business firms rise as economic agents reach to higher prices.
• The higher level of output in the short run was possible only because the unanticipated rise in the price level led to higher profits to business firms. As soon as the costs increase in line with final prices, the incentive to produce higher levels of output disappears and the production reverts to its original level. In this situation, the level of output will be at its natural rate and deviations from this state are possible only when actual price level differs from the expected price level in the short run. Thus, in the long run, the natural rate of output is the equilibrium rate of output for the economy.
• In the long run, the natural rate of output is the level of output to which the economy will tend to adjust in the long run. This indicates that in the long run the average price level has no effect on the level of output (Y). Any unanticipated price rise in the short run will be offset in the long run by an increase in costs as contracts with the suppliers of inputs are renegotiated. Therefore, in the long run the output of an economy does not depend on the price level, but on factors such as, labor import costs, capital stock, technological progress, etc. These factors are not influenced by changes in the average price level and so is the case with aggregate supply in the long run. Therefore, in the long run, the aggregate supply of an economy is vertical at the natural rate of output.
• Most of the factors that affect the position of the aggregate supply curve in short run also affect the position of the aggregate supply curve in the long run, with few exceptions. Some of the important factors affect aggregate supply curve are change in costs of production, supply shocks, investment spending and technological changes, availability of raw materials, supply of labor, human capital and incentives.
Money Supply and Banking System • Money is anything that serves as a commonly accepted medium of exchange. Money also
acts as a unit of value and a store of value. In past, commodities such as salt and oxen were used as money but they failed to serve the purpose well. Latter, they were replaced by precious metals such as gold, silver, etc. However, they too did not serve the purpose well. All these were replaced by paper money as it has the basic features of good money, i.e. portability, divisibility, durability, uniformity and storability.
• Determining what should be included in the money supply is not as easy as it appears. Money is sometimes defined as anything generally acceptable as a medium of exchange. Four definitions of money are commonly used – M1 to M4. M1 (known as narrow money) is made up of currency with the public plus demand deposits with the banking system plus other deposits with the RBI. M2 holds M1 plus post office savings bank deposits. M3 (known as broad money) includes M1 plus time deposits with the banking system. And finally M4 includes M3 + total post office deposits (excluding national savings certificates).
• The Reserve Bank of India (RBI) issues money in the form of two rupee notes and above. The central government also issues money in the form of one-rupee notes, coins and small coins. The RBI currency plus the Government money constitutes the monetary base, which is known as High Powered Money. The RBI currency together with the Government money with the commercial banks is treated as Vault Cash. The deposits of the commercial banks comprise of the balances maintained by the banks with the RBI. This is to ensure that the commercial banks can meet all demands for withdrawals on the part of their depositors. The banks may also choose to hold reserves over and above the statutory minimum, known as the ‘excess reserves’. The commercial banks are required to maintain with the RBI a minimum of Cash Reserve Ratio (CRR) as specified by the RBI on a fortnightly basis.
4
© 2004
The Ic
fai U
nivers
ity P
ress.A
ll righ
ts res
erved
.ISBN : 8
1-314
-0227
-4 Ref.
No.
MACWB 04
2004
04
• Commercial banks have the ability to multiple the money supply. The money supply multiplier depends on the Cash Reserve Ratio (CRR) specified by the RBI and deposit ratio. CRR specifies the percentage of deposits that every commercial bank must keep on deposit with the Reserve Bank of India. In its simplest form, the money multiplier approach is based on Ms = m. H equation, where m is the money multiplier and Ms is the broad money (M3) and H is the high-powered money. However, m is equal to c + 1/c + r where c is the currency deposit ratio and r is the reserve ratio. Currency deposit ratio depends on the attitude of the people. But, reserve requirement is at the control of the RBI. Thus, RBI changes the reserve ratio in order to manipulate the money supply in the economy.
• The money supply in an economy is determined by the behavior of public in depositing their income with the bank, the lending behavior of commercial banks, reserve ratio specified by the RBI and some other factors.
• The supply of and demand for money combinely determine the equilibrium of money markets. The money markets will be in equilibrium when the quantity of real balances demanded equals the quantity supplied.
• A well-developed financial system is very essential for the smooth functioning of any economy. One set of important statistical indicators that is used to look at the financial development of a country is financial development ratios. These ratios are (i) Finance ratio, (ii) Financial interrelations ratio, (iii) New issue ratio, and (iv) Intermediation ratio. Finance ratio is the ratio of total financial claims issued during the year to national income of that year. Financial interrelation ratio is the ratio of financial claims issued to net physical capital formation. New issue ratio is the ratio of primary (new) issues by the non-financial sector to the net physical capital formation. And intermediation ratio is the ratio of secondary issues to primary issues.
Aggregate Supply, Price Level and Employment: Macroeconomic Equilibrium in the Classical Model • The aggregate supply curve describes the combinations of output and the price level, to
supply the given quantity of output. The amount of output that business firms are willing to supply depends on the prices they receive for their goods and the amount they have to pay for labor and other factors of production. Accordingly, the aggregate supply curve shows conditions in the factor markets, especially, the labor market, as well as the good market. From a historical standpoint it is very important to compare and contrast the views expressed by the classical economists and J M Keynes. The main reasons are that the analysis has different implications regarding a market economy’s tendency to adjust to full employment and the relative effectiveness of monetary and fiscal measures.
• According to classicals, the economy will always be at its full employment level of output. At the full employment level of output, any employment, which might exist, is voluntary and is referred to as the ‘natural’ rate of unemployment, because output cannot be raised above its current level even if the price level rises. There is no more labor available to produce any extra output. Thus, the aggregate supply curve will be vertical (i.e. perfectly price inelastic aggregate supply curve) at a level of output corresponding to full employment of the labor force.
• This classical approach to analyzing economic behavior came under severe criticism due to its unrealistic assumptions of wage price flexibility and the existence of voluntary unemployment. In real world, all unemployment is certainly not voluntary. There are many who wish to work but cannot find work implying the existence of involuntary unemployment. J M Keynes and Keynesian economists disputed the classical assumptions and pointed out that a perfectly efficient ‘wage price’ flexibility is far from real world. Keynesian aggregate supply curve is based on the assumption that the wage does not change much or change at all when there is unemployment, and thus the unemployment can continue for sometime.
5
© 2004
The Ic
fai U
nivers
ity P
ress.A
ll righ
ts res
erved
.ISBN : 8
1-314
-0227
-4 Ref.
No.
MACWB 04
2004
04
Aggregate Supply, Price Level and Employment Macroeconomic Equilibrium in the Keynesian Model • Mainstream economic thought before Keynes emphasized the importance of supply-side
aspects of macroeconomic system. The classical economists did not concern themselves with demand issues. They had faith in Say’s Law of Markets. According to this law, a general overproduction of goods relative to total demand is impossible since supply or production creates its own demand. Say’s law is based on the view that people do not work just for the sake of working, but they work to obtain the income required to purchase the desired goods and services. The capacity to purchase the desired products is generated by the production process in the form of wages and salaries, rent, interest and profits. Classical economists believed that is possible to produce too much of same type of goods (implying full employment) and not enough of other type (implying no overproduction). In case of any discrepancies between demand and supply, the mechanism of wage-price flexibility would come into play automatically.
• The Great Depression and its adverse impact on world economy undermined the classical view and provided the foundation for the Keynesian analysis of the Great Depression, which was completely a demand side approach. Keynes rejected the classical view and offered a completely new concept of output determination. He believed that spending induced business firms to supply goods and services. From this he argued that if total spending fell due to pessimistic or unfavorable expectations about future, then business firms would respond by cutting production which in turn led to less spending and less output and employment. The classical economists were also aware of this possibility, but they believed the labor surplus would drive down wages, reducing costs and lowering prices until the surplus was eliminated and the economy was directed to full employment within reasonable time. Keynes and his followers rejected this view, arguing that wage-price flexibility is an impossible proposition, particularly in a downward direction in modern economies characterized by large corporate sectors and powerful trade unions. Keynes also introduced a completely different concept of equilibrium. In the Keynesian framework equilibrium takes place at a less than full employment level of output. The Keynesian view of less than full employment or less than full capacity output could be explained as aggregate expenditure or aggregate demand leads to current level of output and employment. The business sector will produce only the quantity of goods and services it believes households (i.e. domestic consumers and investing community), government and foreigners will plan to buy. If this aggregate expenditure – consumption, investment, government spending and net exports – is less than the economy’s full capacity output, output will fall short of its potential capacity, which is the full employment level of output. When aggregate expenditure is deficient, there are no automatic forces, as believed by classical economists, capable of assuring full employment. The result is that the actual output will be less than capacity output which in turn results in prolonged unemployment and decline in output. This was how Keynes explained the Great Depression highlighting the drawbacks of self-regulating private enterprise economies.
Post-Keynesian Macroeconomics – Monetarism, Rational Expectations and Supply-side Economics • Keynesians suffered a major blow as their postulates failed to explain the happenings during
the post-1968 period when the rate of growth of output declined, the rate of inflation increased coupled with rising unemployment. This paradox of stagflation is inconsistent with the tenets of Keynesian economics that cyclical movements in prices and outputs relative to trend are positively correlated. This led to reconsideration of theories underlying policymaking and rival schools of thought such as Monetarist School, Rational Expectations and Supply-side Economics (popularly known as Reaganomics). Supply-side economics represent a return to orthodox classical economics and its recent more formal statement the New Classical Macroeconomics.
• The school of Monetarism argues that disturbances within the monetary sector are the principal causes of instability in the economy. According to them, the money supply is the principal determinant of the levels of output and employment in the short run and the price level in the long run.
6
© 2004
The Ic
fai U
nivers
ity P
ress.A
ll righ
ts res
erved
.ISBN : 8
1-314
-0227
-4 Ref.
No.
MACWB 04
2004
04
• Rational Expectations School argues that expectations on the future values of economic variables play an important role in macroeconomic analysis and economic analysis in general. The hypothesis of rational expectations has three important implications for macroeconomic analysis and policy.
a. The advocates of rational expectations school contend that their usefulness is limited, because the parameters of the model will change when new policies are given prominence over the others. Since estimates of the effects of the new policies are based on the original set of parameters, the actual implications may be quite different. As a result, economic models are considered not so helpful in selecting an appropriate policy option.
b. A W Phillips showed an inverse relationship between the ratio of change of money wage rates and unemployment rate, it was argued that lower unemployment could be obtained at the expense of higher inflation rates through more rapid increases in affective demand. However, some economists argued that a trade-off existed in the short run, but not in the long run. According to rational expectations, no trade-offs exist even in the short run. It is because, if workers and business firms realize that any disturbance leads to higher inflation, wages and prices (which are assumed to be flexible in rational expectations model) will adjust automatically. Assuming full employment in the economy, money wages and prices increase proportionately, leaving the real wage and unemployment unaffected. Thus, according to rational expectations, even though inflation has increased, the unemployment rate remains the same, implies no trade-off between money wage rate and unemployment rate.
c. Discretionary monetary and fiscal policy cannot be used to stabilize the economy. • Supply side economics is a view emphasizing policy measures to affect aggregate supply or
potential output. This approach holds that high marginal tax rates on labor and capital incomes reduce work effort and saving.
Economic Fluctuations and Unemployment • A business cycle is a swing in total national output, income and employment marked by
widespread expansion or contraction in many sectors of the economy. Typically, a business cycle is divided into four phases: (i) the recovery or revival of economic activity (ii) the prosperity or expansion of the activity (iii) the recession or downturn in economic activity, and (iv) the depression or contraction in the economic activity.
• A number of theories are proposed to explain the cyclical behavior of business cycles, which includes supply shock theory, multiplier-acceleration and Keynes. But, no theory answered all problems.
• The rate of unemployment is one of the key indicators of the conditions prevailing in an economy. Fluctuations in the rate of employment lead to partial changes in the economy and therefore considered as a barometer which points out the condition of an economy. The rate of unemployment gradually decreases during recovery and rapidly decreases during boom or prosperity. By contrast, unemployment rate rises sharply during depression and gradually moves upward during recession. Unemployment rate and phases of business cycles are closely knitted.
Price Stability • An increase in the general level of prices in an economy that is sustained over a period of
time is called inflation. Inflation plays a major role in an economy. Inflation is a major concern of the governments world over. The effect of inflation on the economy is widespread in its reach, ranging from redistribution of income and wealth among different sections of the society to the worsening of balance of payments position.
• The inflation may be demand-pull or cost-push. A demand-pull inflation refers to increase in price level due to increased or excess demand. Cost-push inflation refers to rise in general level of prices due to increased cost of production.
• The Phillips curve shows the relationship between inflation and unemployment. When tracing the link between rate of change in wages and unemployment over nearly a century for the United Kingdom, Phillips discovered an inverse relationship.
7
© 2004
The Ic
fai U
nivers
ity P
ress.A
ll righ
ts res
erved
.ISBN : 8
1-314
-0227
-4 Ref.
No.
MACWB 04
2004
04
The Open Economy and Balance of Payments: India’s Balance of Payments • All countries have economic transactions with other countries. These consist of import and
export of goods and services, official and private gifts and donations, lending and borrowing abroad and investment abroad in financial and physical assets. The Balance of Payments (BoP) is a record of all transactions that a country has with the rest of the world during a period.
• The BoP is a regular double entry accounting record with transactions that increase the availability of foreign exchange recorded as credits and those that use up foreign exchange recorded as debits. Thus, exports are a credit item. The BoP is divided into a current account consisting of transactions involving imports, exports, remittances and gifts and a capital account, which consists of all transactions that affect the country’s foreign exchange assets or liabilities.
• The BoP data helps in analyzing whether a particular course of action is likely to be helpful or not in eliminating or reducing a current account deficit. At the same time, BoP data cannot be considered in isolation for predicting a movement in the exchange rates.
Modern Macroeconomics: Fiscal Policy, Budget Deficits and the Government Debt • Governments in modern economies play a very important role in the economic process. They
collect taxes, provide a variety of services and often undertake production and distribution of goods using inputs purchased from the rest of the economy. They borrow on the capital market and from financial institutions and are engaged in capital formation.
• The levels in composition of taxes, the volume and composition of government expenditures and the level of public debt all have significant microeconomic and macroeconomic effects. Fiscal policy, narrowly interpreted, refers to actions governing and volumes of government expenditure (and hence the resulting deficits or surpluses) and government borrowing. In a broader sense it refers also to the structure of taxation, composition of expenditure, methods of financing deficits and composition of public debt. Fiscal policy is normally the responsibility of the finance ministry or the treasury.
Modern Macroeconomics: Monetary Policy and Interest Rate Structure • A glance at the development or evolution of monetary policy will reveal that its objectives
and emphasis have been undergoing significant changes. The monetary policy of any country refers to the regulatory policy, whereby the monetary authority maintains its control over the supply of money for the realization of general economic objectives such as stable prices, full employment, etc. However, in the context of developing economies like India, monetary policy acquires a still wider role and it has to be designed to meet the particular requirements of the economy. Monetary policy as an instrument of economic policy has certain advantages when compared to fiscal policy. The lag between the time when action is needed and when action is actually taken is shorter in the case of monetary policy than fiscal policy. The important tools of monetary policy are
– Minimum reserve requirements – Discount or bank rate – Open Market Operations (OMO). • As per minimum reserve requirements, the commercial banks are required to maintain a
minimum amount of balance with the Central Bank. This may be maintained either in the form of chest cash or in the form of deposits. A certain proportion of the total deposit liabilities, fixed by the Central Bank, is maintained by the commercial banks as ‘statutory reserves’. The Central Bank’s power to set the reserve requirements provides it with great powers over the lending behavior of the commercial banks. By changing the reserve requirement from time to time, it can directly influence the lending capacity of the banking system.
8
© 2004
The Ic
fai U
nivers
ity P
ress.A
ll righ
ts res
erved
.ISBN : 8
1-314
-0227
-4 Ref.
No.
MACWB 04
2004
04

• Bank rate or discount rate refers to rate at which commercial banks can rediscount their bills with the Central Bank. By changing the bank rate, the Central Bank changes the cost of money supply with the commercial banks and therewith influences the incentive of the banks to borrow reserves.
• Open market operations involve purchase and sale of securities (generally government securities) by the Central Bank, to regulate the credit creating capacity of the commercial banks. When the Central Bank purchases securities it makes cheque payment to the sellers. The sellers deposit the cheques with the commercial banks, which automatically raise their reserve base. An increase in the reserve base of the banks provides a basis to multiple expansions of credit and deposits. Similarly, when the Central Bank performs open market sale of securities, it results in decrease in the bank reserves. So it can be said that, an open market purchase is expansionary in its effect and an open market sale is contractionary in its effect from the point of view of credit creation.
9
© 2004
The Ic
fai U
nivers
ity P
ress.A
ll righ
ts res
erved
.ISBN : 8
1-314
-0227
-4 Ref.
No.
MACWB 04
2004
04

Part I: Questions on Basic Concepts Macroeconomic Analysis: An Overview 1. Which of the following variable(s) will come under stock variable(s)? a. Consumer price index. b. Gross domestic product. c. Money supply. d. Exports. e. Both (a) and (c) above. 2. The relationship between aggregate consumption expenditure and aggregate income of
household sector is known as ________ function. a. Consumption b. Saving c. Expenditure d. Income e. None of the above. 3. Gross domestic savings is the difference between a. Gross Domestic Product and Gross National Product b. Gross Domestic Product and GDCF (Gross Domestic Capital Formation) c. National Disposable Income and Gross Domestic Product d. GDP and Aggregate Consumption e. National Disposable Income and Gross National Product. 4. Which of the following variable(s) will come under flow variable(s)? a. Unemployment. b. Foreign exchange reserves. c. Consumption. d. Money supply. e. Both (a) and (b) above. 5. The act of replacing worn out assets and creating new assets is capital formation. Then Gross
Domestic Capital Formation (GDCF) consists of a. Making good the depreciation on existing fixed assets b. Adding to the stock of fixed assets c. Adding to inventories d. Both (a) and (b) above e. All of (a), (b) and (c) above. 6. Which of the following relationships is not correct? a. Net national savings = National Disposable Income (NDI) – Private consumption
expenditure – Government expenditure on current goods and services. b. Net domestic saving = Net national saving + Retained earnings of foreign companies. c. Gross domestic saving = Net domestic saving + Depreciation provision. d. Gross domestic investment = Gross fixed investment + Change in inventories. e. Gross domestic product = Consumption + Gross investment + Government expenditure
+ Exports.
10
© 2004
The Ic
fai U
nivers
ity P
ress.A
ll righ
ts res
erved
.ISBN : 8
1-314
-0227
-4 Ref.
No.
MACWB 04
2004
04
Part I
7. If GDP is growing at g% per annum and population at p% per annum, the per capita GDP must be growing at __________ %.
a. 1+g 11+ p⎡ ⎤
−⎢ ⎥⎣ ⎦
b. (g + p)/2
c. (g – p)/2
d. (p – g)
e. None of the above.
8. The circular flow model of a free enterprise economy shows
a. How competition achieves economic efficiency under laissez faire
b. How the prices of resources, goods and assets are determined
c. How resources are distributed
d. How production and household sectors interact through markets
e. Both (b) and (d) above.
9. Which of the following statements is not true with respect to stock and flow variables?
a. Both variables have time dimension.
b. Flow variables are always determined by stock variables.
c. Stock variables are usually affected by flow variables.
d. All flow variables need not have stock variable counterparts.
e. Flow variables are partly determined by stock variables.
10. Which of the following is a “leakage” from the circular flow of income?
a. Mr. Ramesh bought an Indian made color television for Rs.15,000.
b. Mr. Babu bought a second hand refrigerator from his friend Rajesh.
c. Mr. Harsha imported a brand new Ferrari car from Germany for Rs.10 lakh.
d. Mr. Sujit paid Rs.10,000 to his personal secretary towards salary.
e. Both (a) and (c) above.
11. Which is the best indicator of economic development of a developing country like India?
a. National income deflator.
b. GNP at current prices.
c. Real national income.
d. Per capita real national income.
e. GDP deflator.
Measurement of Macroeconomic Aggregates 12. If GNP deflator is raised by 40% then which of the following statements is correct?
a. Nominal GNP will increase at least by 40%.
b. Real GNP will increase at least by 40%.
c. Both nominal GNP and real GNP will increase by 40%.
d. Nominal GNP will increase by 40% but real GNP will decrease by 40%.
e. Real GNP will increase by 40% but nominal GNP will decrease by 40%.
11
© 2004
The Ic
fai U
nivers
ity P
ress.A
ll righ
ts res
erved
.ISBN : 8
1-314
-0227
-4 Ref.
No.
MACWB 04
2004
04
Macroeconomics
13. Which of the following will certainly increase real and nominal GNP?
a. Production of more goods and services and decrease in prices.
b. Production of more goods and services and rise in prices.
c. Production of less goods and services and rise in prices.
d. Production of less goods and services and decrease in prices.
e. Production of less goods and services and rise in inflation.
14. In an economy narrow money is equal to the sum of ________.
i. RBI currency notes in circulation.
ii. Rupee coins and notes in circulation.
iii. Small coins.
iv. Demand deposits with banks and other deposits with RBI.
a. Both (i) and (ii) above
b. Both (ii) and (iii) above
c. Both (i) and (iii) above
d. Only (i), (ii) and (iv) above
e. All of (i), (ii), (iii) and (iv) above.
15. In an economy “aggregate monetary resources” are equal to the sum of ________.
i. RBI currency notes in circulation.
ii. Rupee coins and notes and small coins in circulation.
iii. Time deposits with banks.
iv. Demand deposits with banks and other deposits with RBI.
a. Both (i) and (ii) above
b. Only (ii), (iii) and (iv) above
c. Only (i), (ii) and (iii) above
d. Only (i), (ii) and (iv) above
e. All of (i), (ii), (iii) and (iv) above. 16. In country ‘X’, if NNP at market price remained constant and depreciation increased
compared to the previous year then GNP at market prices will _____. a. Increase b. Decrease c. Increase by an amount equal to rise in depreciation d. Decrease by an amount equal to rise in depreciation e. Not change. 17. Which of the following method values the final goods and services produced during a year,
by aggregating the values imparted to the intermediate products at each stage of production by the industries and productive enterprises in an economy?
a. Expenditure method. b. Income method. c. Input method. d. Output method. e. Saving method.
12
© 2004
The Ic
fai U
nivers
ity P
ress.A
ll righ
ts res
erved
.ISBN : 8
1-314
-0227
-4 Ref.
No.
MACWB 04
2004
04
Part I
18. The ________ measurement method of national income aggregates all the money spent by private citizens, firms and the government within the year.
a. Expenditure b. Income c. Input d. Output e. Saving. 19. Which of the following ratios best describes the GNP deflator? a. Nominal GNP to real GNP. b. Real GNP to nominal GNP. c. Nominal GNP to real GDP. d. Real GNP to nominal GDP. e. Nominal GDP to real GDP. 20. GDP at market price exceeds GDP at factor cost by the amount of revenue raised through
_______. a. Direct taxes b. Indirect taxes c. Income tax d. Tax on rents e. Both (b) and (c) above. 21. Which of the following is not true in representing the GDP at market price and GDP at factor
price? a. In GDP at factor price, indirect taxes are not considered. b. In GDP at factor price, subsidies are not considered. c. In GDP at market price, exports are considered. d. In GDP at market price, exports are not considered. e. In GDP at factor price, exports are considered. 22. Macroeconomics is the study of a. Inflation b. Unemployment c. Growth d. Both (a) and (b) above e. All of (a), (b) and (c) above. 23. If the average rate of inflation in the USA and Japan between the years 1960-1973 is 3.2%
and 6.1% respectively, then the growth rate of ______. a. USA will be more b. Japan will be more c. USA will be twice that of Japan d. Japan will be twice that of USA e. No definite conclusion can be made. 24. In a closed economy savings are equal to __________ at the equilibrium level of income. a. Investments b. Wages c. Income-Investments d. Wages-Consumption e. None of the above.
13
© 2004
The Ic
fai U
nivers
ity P
ress.A
ll righ
ts res
erved
.ISBN : 8
1-314
-0227
-4 Ref.
No.
MACWB 04
2004
04
Macroeconomics
25. Which of the following methods is/are used for measuring national income?
a. Output method.
b. Expenditure method.
c. Income method.
d. Both (a) and (b) above.
e. All of (a), (b) and (c) above.
26. Net factor income from abroad is equal to
a. NNP at market prices – NDP at market prices
b. NDP at market prices – Indirect taxes + Subsidies
c. NDP at factor cost + Depreciation
d. NDP at factor cost – Depreciation
e. NNP at market prices + Depreciation.
27. Balance of trade is
a. The difference between current and capital account
b. The difference between merchandize export and imports
c. Same as the balance of current account
d. Same as the balance of capital account
e. Same as the overall balance of payments.
28. Personal disposable income is equal to _______
a. Wages and salaries – Personal income tax
b. Wages and salaries + Dividends paid at home – Personal income tax
c. Wages and salaries + Dividends paid at home + Factor income received from abroad – Personal income tax
d. Wages and salaries + Dividends paid at home + Factor income received from abroad + Transfers from government – Personal income tax
e. Wages and salaries + Dividends paid at home + Factor income received from abroad – Transfers from government – Personal income tax.
29. Personal income equals personal disposable income (Yd) plus
a. Personal savings
b. Transfers from government
c. Personal income taxes
d. Dividend payments
e. Both (b) and (c) above.
30. The Net Domestic Savings of an economy is defined as
a. Net national savings less retained earnings of foreign companies
b. Net national savings plus retained earnings of foreign companies
c. National disposable income less consumption of household and government sectors
d. Gross national savings less depreciation provisions
e. National disposable income plus consumption of household and government sectors.
14
© 2004
The Ic
fai U
nivers
ity P
ress.A
ll righ
ts res
erved
.ISBN : 8
1-314
-0227
-4 Ref.
No.
MACWB 04
2004
04
Part I
31. GDP at market prices is the sum of Consumption, Investment, Government spending and Net Exports.
‘Net’ exports is a. Gross exports minus depreciation b. Exports minus imports c. Gross exports earnings minus capital inflow d. Export minus imports of merchandize e. Imports and depreciation. 32. GDP at factor cost and GDP at market prices are both measures of output in the economy.
The item(s) that give(s) rise to the difference(s) in the two measures is/are a. Direct taxes and subsidies b. Direct taxes net of subsidies c. Indirect taxes and subsidies d. Direct taxes and depreciation e. Indirect taxes and depreciation. 33. Which of the following is/are not included in the computation of GNP? a. Spending for National Defense. b. Rs.10,000 spent by a local government to fight crime. c. The price paid for a stolen car. d. Purchase of groceries by a family. e. Services of a teacher. 34. Macroeconomics is concerned with a. The level of output of goods and services b. The general level of prices c. The growth of real output d. All of the above e. None of the above. 35. Real GNP increases a. When there is an increase in the price level b. When there is an increase in the output of goods and services c. When there is an increase in the price level and/or the output of goods and services d. All of the above e. None of the above. 36. The circular flow of income for a private sector model shows a. The flow of income between the household and business sectors b. The flow of income between the government and business sectors c. The flow of income between the household, business and government sectors d. The flow of income to the household and government sectors e. All of the above. 37. In a model in which there is no government, net investment, capital replacement or
international trade, the market value of final output equals a. Aggregate consumption b. The sum of the receipts of economic resources c. The sum of wages, rent, interest and profit d. All of the above e. None of the above.
15
© 2004
The Ic
fai U
nivers
ity P
ress.A
ll righ
ts res
erved
.ISBN : 8
1-314
-0227
-4 Ref.
No.
MACWB 04
2004
04
Macroeconomics
38. Which of the following is not included in gross investment?
a. Business and residential construction.
b. Expenditures on consumer goods.
c. Additions to business inventory.
d. Expenditures on machinery.
e. None of the above.
39. In a model in which there is a household, business, government and foreign sector, GNP is the sum of
a. Consumption, gross investment, government spending for goods and services, and net exports
b. Consumption, net investment, government spending for goods and services, and net exports
c. Consumption, gross investment, government spending for goods and services, and gross exports
d. Wages, rent, interest, profit and depreciation
e. All of the above.
40. In a three-sector model,
a. Household saving always equals net investment
b. Household saving always equals gross investment
c. Household saving plus depreciation always equals gross investment plus government spending
d. Household saving plus taxes equals net investment plus government spending
e. None of the above.
41. Which of the following is not correct?
a. NNP – Direct taxes equals national income.
b. NNP + Capital consumption allowances equals GNP.
c. Gross investment equals net investment plus depreciation.
d. Personal income equals disposable personal income plus direct taxes.
e. None of the above.
42. Personal income includes all of the following except a. Transfer payments b. Undistributed corporate profits c. Personal income taxes d. Dividend payments
e. Personal savings.
43. Nominal GDP is
a. The total value of goods and services net of exports
b. The total value of goods and services at prices corrected for inflation
c. The total value of goods and services produced during periods of low unemployment
d. The total value of goods and services measured at current prices
e. The total value of goods and services produced at full employment.
16
© 2004
The Ic
fai U
nivers
ity P
ress.A
ll righ
ts res
erved
.ISBN : 8
1-314
-0227
-4 Ref.
No.
MACWB 04
2004
04
Part I
44. GDP at factor cost exceeds GDP at market price
a. When the factor income from abroad is negative
b. When the factor income from abroad is positive
c. When depreciation on fixed capital exceeds income in investment
d. When direct tax exceeds indirect tax
e. When subsidies exceed indirect taxes.
45. The difference between Gross National Product (GNP) and Gross Domestic Product (GDP) is
a. Excess of subsidies over indirect taxes
b. Depreciation
c. Net foreign income from abroad
d. Excess of indirect taxes over subsidies
e. Personal disposable income.
46. NDP does not include
a. Payments made for income taxes
b. Depreciation allowances
c. Undistributed profits
d. Net exports
e. The value added from intermediate goods.
47. Which of the following is not correct?
a. NNP + Indirect taxes = National Income.
b. GNP = NNP + Depreciation.
c. Saving + Taxes = Investment + Government Spending.
d. Personal Income = Disposable Income + Direct Taxes.
e. Gross Investment = Net Investment + Depreciation.
48. National income is
a. NDP at market prices
b. NNP at market prices
c. NDP at factor cost
d. NNP at factor cost
e. GNP at market prices.
49. Which of the following statements is/are true?
i. Every increase in real GDP will necessarily improve the welfare of the people.
ii. Foodgrains retained by the farmers are excluded from the computation of GDP.
iii. GNP at market prices is also known as National Income.
iv. Transfer payments are not taken into account while computing national income.
a. Both (i) and (ii) above.
b. Both (ii) and (iii) above.
c. Both (iii) and (iv) above.
d. Only (ii) above.
e. Only (iv) above.
17
© 2004
The Ic
fai U
nivers
ity P
ress.A
ll righ
ts res
erved
.ISBN : 8
1-314
-0227
-4 Ref.
No.
MACWB 04
2004
04
Macroeconomics
50. Which of the following is not included in GDP of India? a. Depreciation written off by Reliance Industries Ltd. b. Profits before tax earned by Ford Motors Ltd. in India. c. Salaries paid by Satyam Infoway to an American consultant at its Chennai office. d. Salaries paid by Microsoft USA to Indian programmers employed at New York. e. Dividends earned by a Foreign Institutional Investor in India. 51. GDP is not a very good measure of economic prosperity because a. The expenditure and production methods to GDP yield different results because of
conceptual problems b. It does not include non-monetized transactions/activities c. It is purely a monetary measure d. It does not include environmental degradation e. Both (b) and (d) above. 52. Which of the following statements is not true? a. GDP deflator is also known as implicit price deflator. b. GDP deflator reflects the change in overall price level of the economy. c. GDP deflator is the most comprehensive index of prices. d. GDP deflator reflects on the purchasing power of the people. e. GDP deflator measures economic growth. 53. The difference between personal disposable income and personal income is
a. Residential investment b. Indirect taxes c. Subsidies d. Transfer payments
e. Personal taxes. 54. When the addition to capital goods in an economy is more than the capital consumption
allowance, the economy experiences a. Negative net investment b. Zero net investment c. Positive net investment d. Negative gross investment e. Zero gross investment. 55. Which of the following ratios best describes the GNP deflator? a. Nominal GNP to real GNP. b. Real GNP to nominal GNP. c. Nominal GNP to real GDP. d. Real GNP to nominal GDP. e. None of the above. 56. Which of the following is an example of a government transfer payment? a. Salary paid to a soldier. b. Purchase of a new car for the Ministry of Finance. c. Funding of a clinic to provide free vaccinations. d. Free food coupons issued to persons in an anti-poverty program . e. Funding of a new bridge in an urban area.
18
© 2004
The Ic
fai U
nivers
ity P
ress.A
ll righ
ts res
erved
.ISBN : 8
1-314
-0227
-4 Ref.
No.
MACWB 04
2004
04
Part I
57. Which of the following price indices is/are most widely used for determining of inflation in India?
a. Wholesale Price Index (WPI). b. GDP deflator. c. Consumer Price Index (CPI). d. Both (a) and (b) above. e. Both (b) and (c) above. 58. Which of the following is considered as an investment? a. Arun deposits Rs.10,000 with a nationalized bank in a term deposit for a period of 5
years. b. Barucha invests Rs.5,000 in equity shares of a company. c. Charlie and Co. accumulates unsold inventory worth Rs.1,000 . d. Delta Corp. buys ten used vehicles to strengthen its transportation fleet. e. None of the above. 59. The net factor income earned within the domestic territory of a country must be equal to
a. Net Domestic Product at factor cost b. Net Domestic Product at market price
c. Net National product at factor cost d. Net National Product at market price e. Personal income. 60. Both dividends and corporate taxes are part of i Corporate profits. ii. National income. i. Personal income. iv. Personal disposable income. a. Both (i) and (ii) above b. Both (ii) and (iii) above c. Both (i) and (iii) above d. (i), (ii) and (iii) above e. (i), (ii) and (iv) above. 61. Which of the following indices necessarily gives higher weights to services like doctor fees,
railway and bus fares? a. Consumer Price Index (CPI). b. Wholesale Price Index (WPI). c. Index of Industrial Production. d. GNP deflator. e. GDP deflator. 62. Which of the following would not be included in GDP? a. Bobby purchases a new suit to wear at work. b. Amok purchases a new Ford car. c. Community Bank purchases new computers for its loan office. d. Margaret grows tomatoes in her home garden e. Ford India produces but could not sell 100 cars.
19
© 2004
The Ic
fai U
nivers
ity P
ress.A
ll righ
ts res
erved
.ISBN : 8
1-314
-0227
-4 Ref.
No.
MACWB 04
2004
04
Macroeconomics
The Simple Keynesian Model of Income Determination 63. The ratio of the change in equilibrium output to the change in autonomous spending that
causes change in output is called a. Marginal propensity to consume b. Marginal propensity to save c. Average propensity to save d. Multiplier e. Average propensity to consume. 64. In an economy consumption function is equal to 12 + 0.6Y [then which of the following
statements are true? i. Marginal propensity to consume is 0.6. ii. Marginal propensity to save is 0.4. iii. Marginal propensity to consume is 0.4. iv. Marginal propensity to save is 0.6. v. Autonomous consumption demand is 12. a. Both (iii) and (v) above. b. Both (iv) and (v) above. c. Only (iii), (iv) and (v) above. d. Only (i), (ii) and (v) above. e. Only (ii), (iii) and (v) above. 65. The “rachet effect” is the situation where households find a. It difficult to adjust to rising incomes than falling income b. It easier to adjust to rising incomes than falling income c. Supply of goods not sufficient, due to low production d. That inflation is the only reason for high cost consumption e. It is difficult to save, due to low income. 66. Changes in subjective and objective factors of households a. May cause upward or downward shifts of the consumption function b. May cause upward shifts of the consumption function c. May cause downward shifts of the consumption function d. Never effect consumption function e. May cause upward shift of saving function. 67. The slope of the consumption function represents _______. a. Average Propensity to Save (APS) b. Marginal Propensity to Save (MPS) c. Marginal Propensity to Consume (MPC) d. Average Propensity to Consume e. Level of Consumption in the Economy. 68. The balanced budget multiplier is not affected by a. Marginal propensity to save b. Marginal propensity to import c. Investment function of the economy d. Proportional income tax rate levied by the government e. Both (a) and (b) above.
20
© 2004
The Ic
fai U
nivers
ity P
ress.A
ll righ
ts res
erved
.ISBN : 8
1-314
-0227
-4 Ref.
No.
MACWB 04
2004
04
Part I
69. Which of the following is false? a. The ‘naive consumption function’ assumes a constant marginal propensity to consume. b. The ‘naive consumption function’ assumes that the ‘autonomous’ component of
consumption is constant. c. The average propensity to consume can never exceed unity. d. As income increases, the average propensity to consume decreases. e. Both (c) and (d) above.
70. In the equation C = C + cY, C is
a. The autonomous part of consumption, independent of the level of income, Y b. A parameter whose value depends upon the level of disposable income c. A behavioral coefficient d. A dependent variable e. None of the above. 71. Which of the following statements is correct? a. A variable is endogenous when its value is determined by forces outside the model. b. A change in an exogeneous variable is classified as an autonomous change. c. A variable is exogenous when its value is determined by forces within the model. d. A variable is autonomous when its value is determined by forces within the model. e. All of the above. 72. In stating that C = f(Yd, W) a. It is hypothesized that Yd is a more important determinant of C than W b. It is hypothesized that W is a more important determinant of C than Yd
c. W and Yd are dependent variables explaining C d. Yd and W are independent variables explaining C e. Both (c) and (d) above. 73. Equilibrium occurs in a two-sector model when a. Saving equals investment b. Consumption plus investment equals the value of output c. Planned saving equals planned investment d. Aggregate spending equals the revenues of the business sector e. All of the above. 74. When planned saving is greater than planned investment, a. Output should increase b. Output should decrease c. Output should not change d. Any of the above can happen e. None of the above. 75. When the value of output exceeds planned spending a. There is unsold output, and the level of income will fall b. There is unsold output, and the level of income will rise c. There is no unsold output, and the level of income does not change d. Any of the above can happen e. None of the above.
21
© 2004
The Ic
fai U
nivers
ity P
ress.A
ll righ
ts res
erved
.ISBN : 8
1-314
-0227
-4 Ref.
No.
MACWB 04
2004
04
Macroeconomics
76. By definition, the marginal propensity to consume a. Equals ΔC/ΔYd
b. Is the behavioral coefficient c in the equation C = a + cYd
c. Is the slope of the consumption function d. All of the above e. None of the above. 77. The value of the expenditure multiplier relates a. The change in income to the change in autonomous spending b. The change in autonomous spending to the change in income c. The change in consumption to the change in income d. The change in income to the change in consumption e. All of the above. 78. A change in autonomous spending is represented by a. A movement along a spending line b. A shift of a spending line c. A change in a behavioral coefficient d. Both (a) and (c) above e. None of the above. 79. When Ct = f(Yd, t – 1) a. There is an imperfect relationship between consumption and disposable income b. There is no relationship between consumption and disposable income c. Consumption spending lags the receipt of disposable income by one period d. The receipt of disposable income lags consumption spending by one period e. Both (a) and (c) above. 80. Dynamic multipliers occur when a. The assumption of ceteris paribus is dropped b. The economy is not in equilibrium c. Consumption is unrelated to disposable income d. There is a lagged response between consumption and disposable income e. None of the above. 81. A current account deficit implies that a. There is net debit balance in the merchandize account b. There is net credit balance in the merchandize account c. Foreign exchange outflows on account of imports of goods and services and gifts made
exceed inflows on account of exports of goods and services received d. Decrease in Foreign Exchange Reserves e. Increase in Foreign Exchange Reserves. 82. Which of the following will not result in an increase in the level of income? a. An increase in autonomous spending. b. A decrease in autonomous taxes. c. An increase in autonomous transfers. d. An increase in net tax revenues. e. Both (a) and (d) above. 83. Ceteris paribus, an income tax
22
© 2004
The Ic
fai U
nivers
ity P
ress.A
ll righ
ts res
erved
.ISBN : 8
1-314
-0227
-4 Ref.
No.
MACWB 04
2004
04
Part I
a. Increases the value of the expenditure and net tax revenue multiplier b. Increases the value of the expenditure multipier and decreases the value of the net tax
revenue multiplier c. Decreases the value of the expenditure and net tax revenue multiplier d. Decreases the value of the expenditure multiplier and increases the value of the net tax
revenue multiplier e. None of the above. 84. If the net export balance is zero, an increase in autonomous investment spending will a. Increase the net export balance and the income level b. Increase the income level but make the net export balance negative c. Increase the income level and have no effect upon the net export balance d. Have no effect upon the income level but cause the net export balance to become
negative e. None of the above. 85. An increase in the marginal propensity to import a. Has the same effect upon the multipliers as an increase in the MPC b. Has no effect upon the multipliers c. Increases the value of the multipliers d. Decreases the value of the multipliers e. None of the above. 86. When an investment spending is negatively related to the rate of interest, equilibrium income
in the goods market a. Is unrelated to the rate of interest b. Is inversely related to the rate of interest c. Is positively related to the rate of interest d. Falls as the rate of interest decreases
e. None of the above.
87. Given the consumption function C = 256 + 0.85Y, we may infer that, as Y increases
a. Average propensity to consume remains constant
b. The marginal propensity to consume and average propensity to consume will be decreasing
c. The average propensity to consume is constant but marginal propensity to consume will be decreasing
d. The average propensity to consume will be decreasing but marginal propensity to consume will be constant
e. Both the average and marginal propensity to consume will be constant. 88. Which of the following will not increase the value of multiplier? a. Increase in marginal propensity to consume. b. Increase in marginal propensity to save. c. Decrease in tax rate. d. Decrease in marginal propensity to import. e. None of the above.
89. When the balanced budget multiplier is equal to one, increase in government expenditure and
23
© 2004
The Ic
fai U
nivers
ity P
ress.A
ll righ
ts res
erved
.ISBN : 8
1-314
-0227
-4 Ref.
No.
MACWB 04
2004
04
Macroeconomics
the tax revenue by 100 will
a. Not change the equilibrium income
b. Increase the equilibrium income by 100
c. Increase the equilibrium income by less than 100
d. Decrease the equilibrium income by 100
e. Decrease the equilibrium income by more than 100.
90. Which of the following statements is true?
a. The value of Marginal Propensity to Consume (MPC) lies between zero and infinity.
b. The value of multiplier lies between 0 and 1.
c. The value of multiplier lies between 1 and infinity.
d. The value of multiplier is the inverse of MPC.
e. In the linear consumption function average propensity to consume is constant.
91. Which of the following statements is true?
a. Relative Income Hypothesis asserts that people can quickly and easily adjust their living standards downwards but upward adjustment is very difficult.
b. Permanent Income Hypothesis states that the transitory component of income significantly influences the consumption behavior.
c. Relative income hypothesis assumes that marginal propensity to consume and hence multiplier are constant.
d. Life Cycle Hypothesis states that the saving behavior of the individuals during their working life is motivated by their desire to maintain consumption levels after retirement.
e. Relative Income Hypothesis states that marginal propensity to consume is lower for increase in income than for decrease in income.
92. On the basis of the Keynesian model of output determination, a multiplier of 3 implies that
a. An increase in consumption by Rs.3 will result in an increase in investment by Re.1
b. An increase in investment by Re.1 will result in an increase in consumption by Rs.3
c. An increase in investment by Re.1 will result in an increase in consumption by Rs.2 d. An increase in investment by Re.1 will result in an increase in consumption by Rs.1 e. An increase in income by Re.1 will result in an increase in investment by Rs.2. 93. Which of the following is true if the RBI increases Cash Reserve Ratio (CRR)? a. Monetary liabilities of the RBI increases. b. High-powered money in the economy decreases. c. The value of money multiplier decreases. d. Aggregate demand in the economy increases. e. Price level in the economy increases. 94. Consumption demand does not depend upon the level of a. Income b. Propensity to consume c. Propensity to save d. Consumer spending. e. Marginal efficiency of investment. 95. The slope of the consumption curve connotes
24
© 2004
The Ic
fai U
nivers
ity P
ress.A
ll righ
ts res
erved
.ISBN : 8
1-314
-0227
-4 Ref.
No.
MACWB 04
2004
04
Part I
a. Average propensity to save b. Average propensity to consume c. Marginal propensity to consume d. Marginal propensity to save e. Level of consumption in the economy. 96. Given that the marginal propensity to consume is larger, which of the following statements
are true. i. Marginal propensity to save will be larger. ii. Multiplier value will be larger. iii. Average propensity to consume will be larger. iv. Autonomous consumption will be higher. a. Both (i) and (ii) above b. Both (ii) and (iii) above c. (ii), (iii) and (iv) above d. (i), (ii) and (iii) above e. Both (iii) and (iv) above.
Income Determination Model Including Money and Interest 97. The curve explains the combination of interest rates and levels of output at which planned
spending equals income. a. IS b. LM c. MPC d. MPS e. AD. 98. Which of the following statements is/are incorrect? a. The IS curve shifts to the left if the tax rate increases. b. The IS curve shifts to the right if tax rate and government expenditure increases. c. The IS schedule shifts to the right if the interest rate falls. d. The IS schedule shifts to the right if the interest rate rises. e. Both (c) and (d) above. 99. Which of the following statements is/are true regarding IS curve? a. Larger the multiplier, steeper the IS curve. b. Larger the multiplier, flatter the IS curve. c. As the taxes increase, the IS curve becomes steeper. d. As the taxes decrease, the IS curve becomes steeper. e. Both (b) and (c) above. 100. An autonomous increase in investment a. Does not affect the IS curve b. Shifts the LM curve to the left c. Shifts the IS curve to the left d. Shifts the IS curve to the right e. Makes the IS curve flat. 101. The LM schedule shifts
25
© 2004
The Ic
fai U
nivers
ity P
ress.A
ll righ
ts res
erved
.ISBN : 8
1-314
-0227
-4 Ref.
No.
MACWB 04
2004
04
Macroeconomics
a. To the right, if the supply of money increases b. To the right, if the demand for money increases c. To the left, if the supply of money increases d. To the left, if the demand for money decreases e. Both (c) and (d) above. 102. At interest rate ‘r’ there is a simultaneous equilibrium in goods and money markets. If
interest rate increases from r to r1 then a. Equilibrium in goods market will be at a point higher than the existing income b. Equilibrium in money market will be at a point higher than the existing income c. Equilibrium in goods market does not change but equilibrium in money market will be
at a point higher than the existing income d. Equilibrium in money market does not change but equilibrium in goods markets will be
at a point higher than the existing income e. Both (a) and (b) above. 103. Which of the following is true? a. The LM curve is vertical if there is no speculative demand for money. b. The LM curve is horizontal if there is no speculative demand for money. c. The changes in money supply will have no effect on the LM curve, if the LM curve is
positively sloped. d. The changes in money supply will have no effects on the LM curve, if the LM curve is
negatively sloped. e. Both (b) and (d) above. 104. The basic difference between IS and LM curve is that a. IS curve explains money market and LM curve explains goods market b. IS curve explains goods market and LM curve explains money market c. IS curve explains money in circulation and LM curve explains goods in demand d. IS curve explains monetary policy and LM curve explains fiscal policy e. IS curve slopes from right to left and LM from left to right. 105. The LM schedule is a a. Schedule of goods market equilibrium where the supply of goods equals the demand for
goods b. Schedule of monetary equilibrium where the supply of money equals the demand for
money c. Schedule of goods market equilibrium where the supply of goods equals the goods
produced d. Schedule of goods market equilibrium where the supply of goods equals the external
demand for goods e. Both (a) and (d) above. 106. When IS curve shifts rightwards a. Income will fall but interest rates will rise b. Income will rise but interest rates will fall c. Both income and interest rates will fall d. Both income and interest rates will rise e. Income will decrease but interest rate will remain unchanged. 107. A shift in the IS curve would occur if there is a change in
26
© 2004
The Ic
fai U
nivers
ity P
ress.A
ll righ
ts res
erved
.ISBN : 8
1-314
-0227
-4 Ref.
No.
MACWB 04
2004
04
Part I
a. Autonomous government expenditure on goods and services b. Transfer payments made by the government c. Marginal propensity to import d. Both (a) and (b) above e. All of (a), (b) and (c) above. 108. The slope of the LM curve is dependent upon the a. Money supply in the economy b. Price level in the economy c. Transactions demand function for money of the economy d. Money supply and price level in the economy e. Money supply, price level and transactions demand function for money of the economy. 109. If investment demand is infinitely interest elastic a. LM curve becomes vertical b. LM curve becomes horizontal c. IS curve becomes vertical d. IS curve becomes horizontal e. Both (b) and (c) above. 110. An expansionary monetary and fiscal policy shifts a. Aggregate demand to the right b. Aggregate demand to the left c. Aggregate supply to the right d. Aggregate supply to the left e. None of the above. 111. The demand for money is a. Positively related to the income level and the rate of interest b. Negatively related to the income level and the rate of interest c. Negatively related to the income level and positively related to the rate of interest d. Positively related to the income level and negatively related to the rate of interest e. None of the above. 112. Suppose the money supply and price level are constant, and the demand for money is a
function of income and the rate of interest. When the income level increases, there is a. An increase in the quantity of money demanded and an increase in the rate of interest b. An increase in the quantity of money demanded and a decrease in the rate of interest c. A decrease in the quantity of money demanded and a decrease in the rate of interest d. A decrease in the quantity of money demanded and an increase in the rate of interest e. None of the above. 113. Simultaneous equilibrium in the money (LM) and goods (IS) markets exists a. At an unlimited number of income levels and rates of interest b. At only one income level and rate of interest c. At an unlimited number of income levels and only one rate of interest d. At only one income level and an unlimited number of rates of interest e. None of the above. 114. A liquidity effect occurs when
27
© 2004
The Ic
fai U
nivers
ity P
ress.A
ll righ
ts res
erved
.ISBN : 8
1-314
-0227
-4 Ref.
No.
MACWB 04
2004
04
Macroeconomics
a. A reduction in government spending lowers the rate of interest b. A money supply increase lowers the rate of interest c. An increase in government spending increases the rate of interest d. A money supply increase raises the rate of interest e. None of the above. 115. A liquidity effect will normally result in an income effect because a. Lower interest rates will increase the portfolio demand for money b. Lower interest rates will cause less crowding out c. Lower interest rates will increase interest sensitive spending d. Lower interest rates will cause more crowding out e. None of the above. 116. A change in the money supply has a greater effect upon equilibrium income if a. The private sector spending is more interest-sensitive b. The private sector spending is less interest-sensitive c. The expenditure multiplier is smaller than anticipated d. The interest-sensitive money holding to the rate of interest is more e. None of the above. 117. In which of the following situations will an increase in the money supply have no effect upon
equilibrium income? a. LM is steeply sloped and IS is relatively flat. b. LM is vertical and IS is steeply sloped. c. LM is steeply sloped and IS is vertical. d. LM is relatively flat as is IS.
e. None of the above.
118. Crowding out is more likely to occur when
a. The demand for money is interest-sensitive, and private sector spending is largely interest-insensitive
b. The demand for money is interest-sensitive, and private sector spending is interest-sensitive
c. The demand for money is interest-insensitive, and private sector spending is interest-insensitive
d. The demand for money is interest-insensitive, and private sector spending is interest-sensitive
e. None of the above.
119. Crowding out will occur when
a. A decrease in the money supply raises interest rates which crowd out interest-sensitive private sector spending
b. An increase in taxes of the private sector reduces private sector disposable income and spending
c. A reduction in income taxes causes higher interest rates, which crowd out interest-sensitive private sector spending
d. A reduction in government spending causes induced consumption spending to fall
e. None of the above.
120. Which of the following statements is not true?
28
© 2004
The Ic
fai U
nivers
ity P
ress.A
ll righ
ts res
erved
.ISBN : 8
1-314
-0227
-4 Ref.
No.
MACWB 04
2004
04
Part I
a. When the relative increase in the price level is greater than the relative increase in the nominal money supply, the real money supply decreases.
b. When the relative increase in the nominal money supply is greater than the relative increase in the price level, the real money supply increases.
c. When the price level decreases, ceteris paribus, the real money supply decreases.
d. When the price level increases, ceteris paribus, the real money supply decreases.
e. None of the above.
121. An increase in the price level
a. Reduces the real money supply and shifts the LM schedule to the right
b. Reduces the real money supply and shifts the LM schedule to the left
c. Increases the real money supply and shifts the LM schedule to the right
d. Increases the real money supply and shifts the LM schedule to the left
e. None of the above.
122. If real and nominal interest rates fall, then
a. Investment spending should fall, as well
b. Investment spending should rise
c. Consumption expenditure should fall as people save more
d. The marginal propensity to save should rise, shifting the entire consumption schedule
e. Investment spending should rise primarily to take up the slack left by lower consumption expenditure.
123. Given, growth rate of real output = Gy, income elasticity of demand is (alpha), acceptable rate of inflation is Gp, the money stock growth target (Gm) is given by (all in percentage terms)
a. Gm = Gp – a. Gy
b. Gm = a.Gy – Gp
c. Gm = a.Gp – Gy
d. Gm = Gy + a. Gp
e. Gm = a.Gy + Gp.
124. When economists are concerned about the liquidity preference function, they are interested in
a. The relationship of the demand for money and the rate of interest
b. The proportion of liquid (cash) reserves maintained by commercial banks
c. The preference for a currency backed by gold
d. A bank’s desire for accounts receivables as collateral
e. The amount of money in circulation.
125. Transmission mechanism shows
a. The interrelationship between the money market and the goods market
b. Low increase in government expenditure increases income
c. The relationship between income and consumption
d. The relationship between income and saving
e. None of the above.
126. Which of the following statements is/are true?
29
© 2004
The Ic
fai U
nivers
ity P
ress.A
ll righ
ts res
erved
.ISBN : 8
1-314
-0227
-4 Ref.
No.
MACWB 04
2004
04

Macroeconomics
i. The elasticity of demand is the same at all points on a linear demand curve. ii. Interest rates are inversely related to investment expenditure. iii. An increase in money supply tends to increase interest rates. a. (i) only.
b. (ii) only.
c. (iii) only.
d. (i) and (ii) only.
e. (ii) and (iii) only.
127. A ‘supply shock’ such as failure of monsoon or increase in the price of oil
a. Causes a rightward shift of the aggregate supply curve and thus results in higher equilibrium output and lower prices
b. Causes a rightward shift of the aggregate supply curve and thus results in higher equilibrium output and higher prices
c. Causes a leftward shift of the aggregate supply curve and thus results in lower equilibrium output and higher prices
d. Causes a leftward shift of the aggregate supply curve and thus results in lower equilibrium output and lower prices
e. Causes a rightward shift of the aggregate supply curve and thus results in lower output and higher prices.
128. If transfer payments are increased, which of the following is true of I-S curve?
a. I-S curve will shift to the left.
b. Slope of the I-S curve will increase.
c. I-S curve will shift to the right.
d. Slope of the I-S curve will decrease.
e. I-S curve will not be affected.
129. If the demand for money is infinitely interest elastic, which of the following is true?
a. Changes in money stock are totally ineffective in influencing equilibrium output and interest rate.
b. Changes in autonomous expenditure are totally ineffective in influencing equilibrium output and interest rate.
c. Changes in money stock lead to changes in equilibrium rate of interest only while equilibrium output remains unaffected.
d. Changes in autonomous expenditure affects only the equilibrium output while equilibrium rate of interest remains unchanged.
e. Changes in money stock lead to changes in both equilibrium output and rate of interest while changes in autonomous expenditure affect only the interest rate.
130. Which of the following is not true with respect to IS curve?
a. It shows the equilibrium in the goods market.
b. It is positively sloped.
c. If autonomous exports increase, it will shift to the right.
d. If government expenditure decreases, it shifts to the left.
e. It is vertical if the consumption and investment expenditures are not responsive to the rate of interest.
131. The term ‘crowding out’ refers to the process by which
30
© 2004
The Ic
fai U
nivers
ity P
ress.A
ll righ
ts res
erved
.ISBN : 8
1-314
-0227
-4 Ref.
No.
MACWB 04
2004
04
Part I
a. Excessive investment is undertaken in the economy b. A rise in base money leads to a very tight monetary policy c. Increase in government deficit, due to a tax cut or an increase in government spending
reduces the funds available to investment spending d. Funds available for investment spending will be protected by all means e. Both (a) and (c) above. 132. Transaction demand for money a. Varies positively with income and rate of interest b. Varies positively with income and inversely with rate of interest c. Varies inversely with income and positively with rate of interest d. Varies inversely with income and rate of interest e. Does not depend on income and rate of interest. 133. In an IS curve, as interest rate ‘i’ increases a. Both consumption and investment decline b. Both consumption and investment increase c. Consumption increases, investment declines d. Consumption declines, investment increases e. Consumption and investment are unaffected. 134. Which of the following statements is correct? a. GDP deflator = Real GDP/Nominal GDP. b. Real rate of interest = Nominal rate of interest + Rate of inflation. c. An increase in government expenditure is likely to cause a reduction in private
investment. d. If the interest elasticity of demand for money is zero, the IS curve becomes vertical. e. When the rate of interest increases, the IS curve shifts to the left. 135. In the IS-LM framework, an increase in autonomous government expenditure a. Will result in an increase in income and decrease in interest rate b. Will result in a decrease in income and increase in interest rate c. Will result in an increase in both income and interest rates d. Will result in a decrease in both income and interest rates e. Will affect neither the income nor the interest rate. 136. If interest elasticity of demand for investment and consumption is zero a. Equilibrium income depends solely on the position of L-M curve b. Equilibrium income is determined solely in the goods market c. Equilibrium income is determined by the positions of both the I-S and L-M curves d. Equilibrium income is unaffected by the positions of both the I-S and L-M curves e. Fiscal policy is totally ineffective in changing any of the real variables. 137. Japanese economy is facing the problem of liquidity trap. Which of the following statements
is not true about liquidity trap? a. Public is willing to hold whatever money is supplied at the current interest rate. b. LM curve is horizontal. c. Fiscal policy is more effective in increasing income. d. Monetary policy is ineffective in affecting interest rate. e. LM curve is vertical. 138. Which of the following better explains the inverse relationship between the interest rate and
31
© 2004
The Ic
fai U
nivers
ity P
ress.A
ll righ
ts res
erved
.ISBN : 8
1-314
-0227
-4 Ref.
No.
MACWB 04
2004
04
Macroeconomics
the demand for money?
a. The transaction demand for money.
b. The speculative demand for money.
c. The precautionary demand for money.
d. The inflationary expectations.
e. None of the above. The relationship between the interest rate and the demand for money is direct, not inverse.
139. Which of the following statements is not true about IS-LM Model?
a. IS function represents the goods market equilibrium.
b. LM function represents the money market equilibrium.
c. Interest rate is a variable in both IS and LM functions.
d. Goods and money markets interact to determine the equilibrium national income.
e. IS curve is positively sloped.
140. In the standard IS-LM model, which of the following is true if the government raises tax rate and the Reserve Bank of India decides to hold the money supply constant?
a. Disposable income remains constant.
b. IS curve shifts to the right.
c. LM curve shifts to the left.
d. Interest rate falls.
e. Interest rate increases.
141. The LM curve shows
a. A positive relationship between rate of interest and level of income
b. A negative relationship between rate of interest and level of income
c. A negative relationship between rate of interest and level of investment
d. A positive relationship between rate of interest and level of investment
e. A positive relationship between level of investment and level of income.
142. An increase in government expenditure will
a. Shift both IS and LM curves to the right
b. Shift both IS and LM curves to the left
c. Not affect the position of LM curve but shift IS curve to the left
d. Not affect the position of IS curve but shift LM curve to the right
e. Not affect the position of LM curve but shift IS curve to the right.
143. The demand for money is a demand for real money balances for a given interest rate. If there is an increase in the level of income because of increase in real money supply, which of the following statements holds true?
a. IS curve shifts to the left.
b. LM curve shifts to the left.
c. IS curve shifts to the right.
d. LM curve shifts to the right.
e. Both IS and LM curves shifts to the right.
32
© 2004
The Ic
fai U
nivers
ity P
ress.A
ll righ
ts res
erved
.ISBN : 8
1-314
-0227
-4 Ref.
No.
MACWB 04
2004
04
Part I
Fundamentals of Aggregate Demand and Aggregate Supply 144. Due to an increase in the real stock of money ___. a. The LM curve and AD curve shift towards right b. The LM curve shifts towards left and AD curve towards right c. The AD curve and LM curve shift towards left d. The AD curve shifts towards left and LM curve shifts towards right e. Increase in the real stock of money will not have any effect on LM curve but shifts AD
curve towards right. 145. Due to fiscal expansion __________. a. IS and AD curves shift towards right b. IS and AD curves shift towards left c. LM and AD curves shift towards right d. LM and AD curves shift towards left e. Fiscal expansion will not have any effect on LM, IS and AD curves. 146. The real stock of money in the economy increases due to a. Increase in prices b. Decrease in prices c. Increase in interest rates d. Decrease in interest rates e. Both (b) and (d) above. 147. When price level increases a. LM curve shifts towards right b. IS curve shifts towards left c. Aggregate supply curve shifts towards right d. IS curve shifts towards right e. LM curve shifts towards left. 148. If all the resources available are fully employed then aggregate supply curve in the long run
will become a. Horizontal b. Vertical c. Parabola d. Straight line with a positive slope of 45 degrees e. Straight line with a negative slope of 45 degrees. 149. Which of the following factor/s is/are responsible for a change in aggregate demand? a. Rate of interest. b. Exchange rate. c. Government policy. d. Both (b) and (c) above. e. All of (a), (b) and (c) above. 150. Which of the following factors is/are responsible for a change in aggregate supply? a. Change in cost of production. b. Supply shock. c. Human capital. d. Both (a) and (b) above. e. All of (a), (b) and (c) above.
33
© 2004
The Ic
fai U
nivers
ity P
ress.A
ll righ
ts res
erved
.ISBN : 8
1-314
-0227
-4 Ref.
No.
MACWB 04
2004
04
Macroeconomics
151. An increase in the real wage will increase the quantity of labor supplied, but will reduce the quantity of
a. Goods supplied b. Labor demanded c. Goods demanded d. Goods manufactured e. Both (a) and (c) above.
152. In the demand function for money, we include
a. Nominal income and nominal interest rate
b. Real income and real interest rate
c. Real income and nominal interest rate
d. Nominal income and real interest rate
e. High-powered money and interest rate.
153. Business firms will produce at maximum efficiency because
a. Of the market forces of both supply and demand
b. Of government regulatory role
c. They assess the basic questions of how the society allocates scarce resources
d. Of possible change in prices of goods and services
e. Both (b) and (d) above.
154. A rightward shift of aggregate demand, with no change in the aggregate supply schedule, results in an increase in
a. Real output and no change in the price level when aggregate supply is upward sloping
b. Real output and no change in the price level when aggregate supply is horizontal
c. The price level and no change in real output when aggregate supply is upward sloping
d. The price level and no change in real output when aggregate supply is horizontal
e. None of the above.
155. Aggregate demand is
a. Negatively related to the price level because a decline in the price level has a negative effect on the demand for output
b. Negatively related to the price level because a decline in the price level has a positive effect on the demand for output
c. Positively related to the price level because a decline in the price level has a negative effect on the demand for output
d. Positively related to the price level because a decline in the price level has a positive effect on the demand for output
e. None of the above.
156. The slope of aggregate demand becomes flatter
a. The more sensitive the investment spending is to the rate of interest
b. The more sensitive the demand for money is to the rate of interest
c. The smaller the value of the expenditure multiplier
d. The large the nominal money supply
e. None of the above.
34
© 2004
The Ic
fai U
nivers
ity P
ress.A
ll righ
ts res
erved
.ISBN : 8
1-314
-0227
-4 Ref.
No.
MACWB 04
2004
04
Part I
157. A neoclassical aggregate supply schedule exists a. At an output rate greater than the natural rate of unemployment b. At an output level determined by the supply of and demand for labor c. When the demand for labor and supply of labor schedules adjust immediately to a
change in the price level d. When equilibrium in the labor markets is unaffected by shifts in the supply of labor
schedule e. None of the above. 158. Suppose there is full employment and aggregate supply is vertical. A decrease in taxes a. Increases the price level and real output b. Increases the price level but has no effect on real output c. Increases real output but has no effect on the price level d. Has no effect on the price level or real output e. None of the above. 159. Suppose there is full employment and a vertical aggregate supply schedule. An increase in
the nominal money supply a. Causes the real money supply to increase, which changes the composition of output b. Has no effect on the real money supply or the composition of output c. Causes a proportional increase in real output d. Reduces the rate of interest and changes the composition of output e. None of the above. 160. When aggregate supply is positively sloped and there is an increase in the real per unit cost of
materials, aggregate supply shifts to the a. Right, the price level falls, and real output increases b. Left, the price level falls, and real output increases c. Right, the price level increases, and real output decreases d. Left, the price level increases, and real output decreases e. None of the above. 161. When aggregate supply is positively sloped and there is a decrease in the mark-up on variable
cost, aggregate supply shifts to the a. Left, the price level falls, and real output increases b. Right, the price level falls, and real output increases c. Left, the price level increases, the real output decreases d. Right, the price level increases, and real output decreases e. None of the above. 162. The economy is in inflationary equilibrium. A reduction in a. Government spending permanently lowers the economy’s rate of inflation b. Nominal money supply growth lowers the inflation rate with no effect on output in the
short run c. Nominal money supply growth lowers the inflation rate and the level of output in the
short run d. Government spending lowers the rate of inflation with no effect on output in the short
run e. None of the above.
35
© 2004
The Ic
fai U
nivers
ity P
ress.A
ll righ
ts res
erved
.ISBN : 8
1-314
-0227
-4 Ref.
No.
MACWB 04
2004
04
Macroeconomics
163. With an upward sloping aggregate supply curve in the short run, an increase in aggregate demand can be expected to cause
a. Price level to increase b. Price level to fall c. Output to increase d. Price level and output to increase e. Price level to fall even as output increases. 164. An economy’s capital stock must decline if a. Consumption exceeds investment b. Net investment is zero c. Depreciation is greater than net investment d. Depreciation is greater than gross investment e. Government expenditures on goods and services are greater than tax collections. 165. Suppose the price elasticity of demand coefficients are given as 1.50, 0.50, 2.00 and 0.75 for
demand schedules D1, D2, D3 and D4 respectively. A one percent increase in the price leads to an increase in total revenue for
a. D1 and D4 only b. D1, D2 and D4 only c. D4 only d. D2 only e. D2 and D4 only. 166. Internal balance refers to a. Equilibrium in balance of payments b. Balanced budget of government c. Domestic savings being equal to domestic investment d. Full employment level of output e. Aggregate demand being equal to aggregate supply. 167. With respect to Aggregate Supply (AS), which of the following is true? a. AS in the short run is positively sloped and in the long run it is vertical. b. AS is positively sloped both in the short run and in the long run. c. AS is positively sloped in the short run and negatively sloped in the long run. d. AS is vertical both in the short run and in the long run. e. Costs have greater impact on AS in short run than in the long run. 168. Aggregate demand in an economy increases with the a. Decrease in income of foreigners b. Increase in the private transfers from abroad c. Decrease in government spending d. Increase in interest rates e. Increase in tax rates. 169. Which of the following is likely to happen, when realized output exceeds spending? a. Lower demand increases the unemployment. b. Higher inflation further reduces the aggregate demand. c. Economy attains full employment level. d. Inventory level in the economy increases. e. Both (a) and (d) above.
36
© 2004
The Ic
fai U
nivers
ity P
ress.A
ll righ
ts res
erved
.ISBN : 8
1-314
-0227
-4 Ref.
No.
MACWB 04
2004
04
Part I
170. Which of the following statements is not true in the long run?
a. Output converges towards natural rate of output.
b. Output becomes insensitive to changes in aggregate demand.
c. Input costs play a greater role in the determination of equilibrium output.
d. Aggregate supply curve is vertical.
e. Unanticipated price changes would have adverse impact on output.
171. Aggregate supply curve becomes vertical even in short run, if
a. The economy is facing deficit demand
b. There are idle resources
c. All available resources are fully employed
d. The economy is yet to reach full employment
e. All firms are earnings normal profits.
Money Supply and Banking System 172. In an economy M1 is equal to currency with public + Demand deposits with banks + Demand
portion of savings deposits with Banks + Other Deposits with RBI, where currency with public is equal to
a. Currency in circulation less currency with commercial banks
b. Notes and coins in circulation and cash with banks
c. Notes and coins in circulation and demand deposits with banks
d. Demand deposits with banks, other deposits and small coins in circulation
e. Notes and coins in circulation and saving deposits.
173. In an economy currency deposit ratio (Cu) and high-powered money (h) are constant. The increase in the reserve ratio will ___________.
a. Increase the money supply
b. Decrease the money supply
c. Not change the money supply
d. Decrease money supply in proportion to the increase in reserve ratio
e. Decrease money supply lesser in proportion to the increase in reserve ratio.
174. The basic difference between money stock measure M3 and M4 is that
a. M3 is more than M4
b. M2 is part of M3 whereas M2 is not part of M4
c. M3 is part of M1 and M4 is not part of M1
d. M4 includes all post office deposits, where as in M3 these are not included
e. M1 is part of M4 where as M1 is not part of M3.
175. Time deposits with banks are included in __________ measure of money stock.
a. M1
b. M2
c. M3
d. M4
e. Both (c) and (d) above.
37
© 2004
The Ic
fai U
nivers
ity P
ress.A
ll righ
ts res
erved
.ISBN : 8
1-314
-0227
-4 Ref.
No.
MACWB 04
2004
04
Macroeconomics
176. “Bank rate” is a. The rate at which Central Bank discounts the government bills b. The rate at which Central Bank discounts the eligible bills of commercial banks c. The rate at which commercial banks give loans to the other commercial banks d. The rate at which commercial banks lend to the public e. The rate at which Central Bank discounts the foreign bills. 177. The RBI can increase the demand deposit component of the money supply by i. Lowering reserve requirements. ii. Increasing the volume of reserves. iii. Decreasing the volume of reserves. iv. Increasing reserve requirements. a. Only (iii) above b. Only (iv) above c. Both (i) and (ii) above d. Both (i) and (iii) above e. Both (ii) and (iv) above. 178. The quantity of notes and coins in private circulation plus the quantity of cash held by the
banking system is called a. Monetary base b. Stock of high-powered money c. M1
d. M3
e. Both (a) and (b) above. 179. If you withdraw Rs.100 from your checking account, this transaction a. Increases the supply of money b. Decreases the supply of money c. Does not change the supply of money d. Increases the supply of money by more than 100 e. Decreases the supply of money by less than 100. 180. Read the following statements and choose the best alternatives. i. When you deposit currency in a commercial bank cash goes out of circulation and the
money supply declines. ii. If the RBI creates more money, Indians would achieve a higher standard of living. a. (i) and (ii) are true b. (i) and (ii) are false c. (i) is true and (ii) is false d. (i) is false and (ii) is true e. (i) is always true and (ii) is sometimes true. 181. In an economy Cu is equal to currency deposit ratio and r is equal to reserve ratio, then the
money multiplier in the economy is equal to a. (1 + Cu)/(r – Cu) b. (1 + Cu)/r c. (1 + Cu)/(1 – r + Cu) d. (1 + Cu)/(r + Cu) e. (1 – Cu)/(r + Cu).
38
© 2004
The Ic
fai U
nivers
ity P
ress.A
ll righ
ts res
erved
.ISBN : 8
1-314
-0227
-4 Ref.
No.
MACWB 04
2004
04
Part I
182. In an economy high-powered money is equal to a. Monetary liabilities of Central Bank + Government money b. Monetary liabilities of Central Bank – Government money c. Financial assets + Non-monetary liabilities d. Monetary liabilities of Central Bank + Foreign exchange assets e. Both (a) and (d) above. 183. If reserve ratio is constant and currency deposit ratio increases then money multiplier a. Increases b. Decreases c. Does not change d. Decreases more than proportionately to the increase of currency deposit ratio e. Decreases less than proportionately to the increase of currency deposit ratio. 184. Financial interrelation ratio is equal to a. Total issues/National income b. Primary issues/Net capital formation c. Total issues/Net capital formation d. d. Total stock of financial assets/Stock of fiscal assets e. Secondary issues/Net capital formation. 185. Which of the following statements is true? a. M1 is high-powered money. b. M2 is high-powered money. c. M3 is high-powered money when time deposits with bank are not taken. d. M4 is high-powered money when total postal deposits are not taken. e. None of the above. 186. Which of the following statement/s is/are true? i. M1 = Currency with public + Demand portion of savings deposits with banks +
Demand deposits with banks + Other deposits with RBI. ii. M2 = M1 + Post office savings deposits. iii. M3 = M1 + Time deposits with banks. iv. M4 = M3 + All post office deposits. a. Only (i) above. b. Both (i) and (ii) above. c. Both (ii) and (iii) above.
d. Both (i) and (iv) above.
e. All of (i), (ii), (iii) and (iv) above.
187. If currency deposit ratio is constant and reserve ratio increases then money multiplier
a. Increases
b. Decreases
c. Does not change
d. Decreases more than proportionately to the increase of reserve ratio
e. Decreases less than proportionately to the increase of reserve ratio.
39
© 2004
The Ic
fai U
nivers
ity P
ress.A
ll righ
ts res
erved
.ISBN : 8
1-314
-0227
-4 Ref.
No.
MACWB 04
2004
04
Macroeconomics
188. Saving deposits are not a part of money stock measure (M1) because
a. They are not recognized as legal tender by the RBI
b. They are negligible compared to demand deposits
c. They are not a medium of exchange
d. They will not generate money supply
e. Both (a) and (c) above.
189. An increase in volume of investment will not occur if interest rates
a. Remain constant while the government announces new tax concessions on capital additions
b. Are lowered by increasing M3
c. Remain constant while corporate income tax is increased
d. Remain constant, while corporate sector exports increase as result of a decrease in personal income tax
e. None of the above.
190. Financial Interrelations ratio is
a. The ratio of total financial claims issued during a year to the national income for the year
b. The ratio of primary issues by the non-financial sector to total physical asset formation
c. The ratio of volume of financial instruments issued by financial intermediaries during a period to the volume of primary issues by the non-financial sector
d. The ratio of the total stock of financial assets at a point of time to the stock of physical assets
e. Ratio of total financial claims to total physical asset formation.
191. The link between changes in the money supply and changes in real macroeconomic variables is best described by
a. A change in interest rates that induces a change in spending, a change in aggregate demand, and thus a potential change in real GDP
b. A change in interest rates that induces a change in spending, a change in aggregate demand, and thus an immediate and unavoidable change in real GDP
c. A change in spending caused directly by the Central Bank’s adjusting its own investment portfolio and which translates into a change in aggregate demand and finally a change in nominal GDP
d. A change in bankers’ interest rates by direct intervention that may or may not alter real GDP by altering spending
e. None of the above.
192. New issues ratio is defined as
a. Stock of financial assets/stock of physical assets
b. Primary issues by non-financial sector/total physical asset formation
c. Volume of financial instruments issued by financial intermediaries/volume of primary issues by non-financial sectors
d. Total financial claims issued during a year/National income for the year
e. None of the above.
40
© 2004
The Ic
fai U
nivers
ity P
ress.A
ll righ
ts res
erved
.ISBN : 8
1-314
-0227
-4 Ref.
No.
MACWB 04
2004
04
Part I
193. Commercial banks create money through credit creation. Which of the following statements is true with regard to credit creation?
a. Credit creation by commercial banks is limited by CRR .
b. Commercial banks can create as much credit as they want.
c. RBI has no control over the credit created by Commercial banks.
d. CRR has no impact on credit creation.
e. None of the above
194. Which of the following does not affect the balance sheet of Reserve Bank of India?
a. Central government’s borrowings from RBI.
b. Loan taken by one commercial bank from the other.
c. Refinancing of NABARD loans.
d. Increase in reserves of commercial banks.
e. Increase in net foreign exchange assets.
195. Which of the following ratios is not an indicator of financial development of a country?
a. Finance Ratio.
b. Financial Interrelations Ratio.
c. New Issue Ratio.
d. Intermediation Ratio.
e. Cost Benefit Ratio.
196. Which of the following is true if the RBI increases Cash Reserve Ratio (CRR)?
a. Monetary liabilities of the RBI increases .
b. High-powered money in the economy decreases.
c. The value of money multiplier decreases .
d. Aggregate demand in the economy increases.
e. Price level in the economy increases.
197. The difference between M3 and M1 is
a. Demand deposits
b. Post office savings deposits
c. Savings deposits
d. Time deposits
e. M2.
198. Other things being equal, an increase in the supply of money
a. Lowers both nominal interest rate and aggregate demand
b. Raises both nominal interest rate and aggregate demand
c. Raises nominal interest rate and lowers aggregate demand
d. Lowers nominal interest rate and raises aggregate demand
e. Does not change either nominal interest rate or aggregate demand.
41
© 2004
The Ic
fai U
nivers
ity P
ress.A
ll righ
ts res
erved
.ISBN : 8
1-314
-0227
-4 Ref.
No.
MACWB 04
2004
04
Macroeconomics
Aggregate Supply, Price Level and Employment: Macroeconomic Equilibrium in the Classical Model 199. In the classical model, if production function is represented by Y = f(N), where the capital
stock is assumed to be constant, then output in the short run depends only on a. Raw material available b. Labor input c. Demand for goods d. Production capacity e. Wages. 200. The demand for labor is derived from the a. Quantity of goods produced by labor b. Price of goods produced by labor c. Incremental cost and incremental revenue generated by the employment of labor d. Incremental cost generated by the employment of labor e. Incremental revenue generated by the employment of labor. 201. Under pure competition a profit maximizing firm hires workers until the real wage is equal to
the a. General price level b. General price level multiplied by marginal product of labor c. General price level divided by marginal product of labor d. Marginal product of labor divided by general price level e. Marginal product of labor. 202. An increase in real wages will a. Shift the demand for labor schedule to the right b. Shift the demand for labor schedule to the left c. Increase the quantity of labor demanded d. Decrease the quantity of labor demanded e. Both (b) and (c) above. 203. Marginal product of labor is the a. Change in supply per unit change in the labor employed b. Change in demand per unit change in the labor employed c. Change in labor cost per unit change in the labor employed d. Change in income per unit change in the labor employed e. Change in output per unit change in the labor employed. 204. Which of the following is not a postulate of Say’s law? a. Disequilibrium in the economy can exist for a while. b. There might be temporary mismatch between aggregate demand and supply. c. In the short run there can be excess production and unemployment. d. Prices and wages are sticky downwards. e. Interest rate fluctuations bring about saving and investment equilibrium. 205. In the classical model, the long run effect of an increase in government spending is a. An increase in the price level b. An upward shift of the aggregate demand curve c. An increase in the level of output d. Both (a) and (b) above e. (a), (b) and (c) above.
42
© 2004
The Ic
fai U
nivers
ity P
ress.A
ll righ
ts res
erved
.ISBN : 8
1-314
-0227
-4 Ref.
No.
MACWB 04
2004
04
Part I
Aggregate Supply, Price Level and Employment: Macroeconomic Equilibrium in the Keynesian Model 206. In the Keynesian model, workers a. Accept a decrease in money wages as long as these cuts bring about full employment b. Accept cuts in money wages as long as real wages do not fall c. Resist any decrease in their real wages d. Resist any decrease in their money wages e. Both (b) and (c) above. 207. The basic difference between Classical model and the Keynesian model lies in the assumption of a. Rigid money wages b. Rigid money supply c. Demand for money d. Labor supply e. Real interest rate. 208. In the Keynesian model, an economy consists of a. Labor market, money market b. Labor market, goods market c. Money market, goods market d. Labor market, international trade e. Labor market, money market, goods market. 209. Say’s law of market emphasizes that a. Demand for goods creates its own supply b. Demand for goods depends on supply of money c. Supply of goods creates its own demand d. Supply of goods depends on supply of money e. Both (a) and (d) above. 210. In the Keynesian model, macroeconomic equilibrium can take place at a. Full employment b. Less than full employment c. Less than full capacity output d. Both (a) and (c) above e. Both (b) and (c) above. 211. If price level falls, then real wages a. Decrease in proportion to decrease in prices b. Decrease but not in proportion to decrease in prices c. Increase d. Decrease more than proportionately to decrease in price e. None of the above. 212. If real wages increase, then unemployment a. Decreases in proportion of labor demand b. Decreases in proportion to supply of labor c. Decreases more than the proportion of labor demand d. Increases e. Remain at the same level.
43
© 2004
The Ic
fai U
nivers
ity P
ress.A
ll righ
ts res
erved
.ISBN : 8
1-314
-0227
-4 Ref.
No.
MACWB 04
2004
04
Macroeconomics
213. Which of the following statements is/are true?
a. If prices increase then real wages increase.
b. If real wages increase then unemployment increases.
c. If prices increase then unemployment decreases, nominal wages remaining constant.
d. Both (a) and (b) above.
e. Both (b) and (c) above.
214. Keynesian model of macroeconomic equilibrium emphasizes that
a. Demand creates its own supply
b. Demand depends on supply of money
c. Supply creates its own demand
d. Supply depends on demand for money
e. Both (a) and (d) above.
215. Investors prefer holding money to bonds if they expect
a. Interest rates to increase
b. Interest rates to decrease
c. Capital loss from a bond
d. Reinvestment rate of return exceeds capital loss from a bond
e. Both (a) and (c) above.
216. According to the Keynesian Aggregate Supply Model
a. Aggregate supply varies positively with price level
b. Aggregate supply is independent of price level
c. Involuntary unemployment cannot exist
d. Nominal and real wage are perfectly flexible
e. Both (c) and (d) above.
217. Which of the following is/are true in case of an economy in equilibrium?
a. Aggregate demand is equal to aggregate supply.
b. Employment is not necessarily at full employment level.
c. Unintended investments are zero.
d. Both (a) and (b) above.
e. All of (a), (b) and (c) above.
218. The term speculative demand for money refers to money balances held in expectation of
a. Fall in the prices of goods
b. Fall in the prices of bonds
c. An increase in the interest rates
d. Both (a) and (b) above
e. Both (b) and (c) above.
44
© 2004
The Ic
fai U
nivers
ity P
ress.A
ll righ
ts res
erved
.ISBN : 8
1-314
-0227
-4 Ref.
No.
MACWB 04
2004
04
Part I
219. Which of the following is true? a. The classical model assumes a fixed nominal wage and Keynesian model assumes a
fixed real wage. b. The classical model assumes a fixed real wage and Keynesian model assumes a fixed
real wage. c. The classical model assumes instantaneous adjustment of real wage in response to
demand-supply balance in the labor market while the Keynesian model assumes fixed nominal wage.
d. The classical model assumes fixed nominal wage but Keynesian model assumes instantaneous adjustment of real wages in response to demand supply balance in labor market.
e. Both the classical and Keynesian models assume a fixed real wage. 220. Which of the following is not true? a. Classical model of income determination assumes wage flexibility. b. Keynesian model of income determination assumes wage rigidity. c. Classical economists consider only transaction demand for money. d. Keynes considers speculative demand for money also. e. Keynesian model of income determination results in a vertical aggregate supply curve at
the full employment level of output. 221. An increase in the autonomous government expenditure will result in a. Higher level of income and lower rate of interest b. Higher level of income and higher rate of interest c. Lower level of income and lower rate of interest d. Lower level of income and higher rate of interest e. None of the above. 222. According to Keynes, the actual expenditure in an economy can differ from the planned
expenditure. Which of the following is true if the actual expenditure is less than the planned expenditure in the economy?
a. There will be positive fixed investment in the economy. b. There will be negative fixed investment in the economy. c. There will be positive inventory investment in the economy. d. There will be negative inventory investment in the economy. e. There will be no change in inventory investment in the economy. 223. Which of the following is not one of the basic Postulates of the Keynesian Model? a. Full employment occurs only by coincidence is an economy. b. Effective demand determines the level of employment and output. c. Since full employment is not always possible, Government intervention is essential. d. Budget deficit is a tool to fight recession. e. Monetary policy is more effective than fiscal policy. 224. The unemployment in the Keynesian model is caused by a. Demand deficiency b. Supply deficiency c. Demand sufficiency d. Supply sufficiency e Both (a) and (b) above.
45
© 2004
The Ic
fai U
nivers
ity P
ress.A
ll righ
ts res
erved
.ISBN : 8
1-314
-0227
-4 Ref.
No.
MACWB 04
2004
04
Macroeconomics
Post-Keynesian Macroeconomics – Monetarism, Rational Expectations and Supply-side Economics 225. According to monetarism, demand for money depends on a. Interest rate on bonds b. Inflation rate c. Rate of return on all assets other than money d. Money supply e. Cost of living. 226. According to monetarism, in the short run, increase in money supply results in a. Decrease in output b. Increase in output c. Decrease in price level d. Increase in price level e. Both (b) and (d) above. 227. Which of the following is/are the implications of rational expectation hypothesis? i. Econometric models are not very useful in evaluating alternative economic policies. ii. There is no trade-off between inflation and unemployment. iii. Discretionary monetary and fiscal policies cannot be used to stabilize the economy. a. Only (i) above. b. Only (iii) above. c. Both (i) and (iii) above. d. Both (i) and (ii) above. e. All of (i), (ii) and (iii) above. 228. Basic assumption/s of rational expectation theory is/are a. Guesses about the future are on average correct b. Guesses about the future are always correct c. Information received will be always correct d. Both (a) and (c) above e. Both (b) and (c) above. 229. To improve market efficiency, which of the following is not recommended by Supply side
economics? a. Reduce government controls. b. Promote competition. c. Restrict the power of trade unions. d. Remove institutional barriers. e. Increase corporate tax rate. 230. According to the Laffer curve, as the tax rate increases, tax revenues a. Rise continuously b. Decrease continuously c. Initially decrease and then increase d. Initially increase and then decrease e. Remain constant.
46
© 2004
The Ic
fai U
nivers
ity P
ress.A
ll righ
ts res
erved
.ISBN : 8
1-314
-0227
-4 Ref.
No.
MACWB 04
2004
04
Part I
231. The Chief Economist to the Government told the Cabinet that the government can no longer fool the people by increasing its spending during election years, as people will anticipate this kind of behavior as previous governments used to do so. The economist is an advocate of
a. Classical economics b. Rational expectations c. Keynesian economics d. Supply-side economics e. Monetarism. 232. Monetarists prefer monetary policy over the fiscal policy because they feel that a. Statistically money demand function can be better determined than consumption or
investment demand b. Money is a substitute for financial assets c. Demand for money is determined by rate of interest
d. Fiscal policy is ineffective because of ‘crowding out’ effect
e. Both (a) and (d) above.
233. According to the school of rational expectations there is no trade off between inflation and unemployment because
a. People make biased forecasts about the future of the economy based on all the available information
b. People anticipate changes in money supply and accordingly adjust prices and wages
c. Wages are rigid downwards
d. Prices are rigid downwards
e. Both (c) and (d) above. 234. The curve that depicts the relationship between the rate of change in prices and the rate of
unemployment is a. Laffer curve b. Phillips curve c. Aggregate supply curve d. LM curve e. IS curve.
Economic Fluctuations, Unemployment and Inflation 235. The bank reserves fall rapidly in _________ stage of business cycle. a. Recovery b. Boom c. Recession d. Depression e. Both (c) and (d) above. 236. If the available workers are unaware of the jobs being offered and the employers are not
aware of the available workers, such type of unemployment is called a. Frictional unemployment b. Structural unemployment c. Cyclical unemployment d. Disguised unemployment e. Demand pull unemployment.
47
© 2004
The Ic
fai U
nivers
ity P
ress.A
ll righ
ts res
erved
.ISBN : 8
1-314
-0227
-4 Ref.
No.
MACWB 04
2004
04
Macroeconomics
237. Unemployment that arises when there is a general downturn in business activity is known as a. Frictional unemployment b. Structural unemployment c. Cyclical unemployment d. Disguised unemployment e. Demand pull unemployment. 238. Full employment is the level at which there is a. Zero unemployment b. Normal rate of unemployment c. Least demand for labor d. Least supply of labor e. Demand for goods is less than supply. 239. Natural rate of unemployment increases due to a. General downturn in business activity b. Changes in labor market c. Increase in inflation d. Structural changes in economy e. Frequent changes of jobs by labor. 240. If the actual rate of unemployment exceeds the natural rate of unemployment then a. Actual output of the economy will fall below its potential b. Production will increase more than potential c. Disguised unemployment increases d. Consumption of goods decreases e. Both (a) and (d) above. 241. Unemployment that arises due to regional occupational pattern of job vacancies, which does
not match the pattern of workers availability and suitability, is known as a. Frictional unemployment b. Structural unemployment c. Cyclical unemployment d. Disguised unemployment e. Demand pull unemployment. 242. The inventory stock will be high in _________ stage of a business cycle. a. Recovery b. Boom c. Recession d. Depression e. Both (a) and (c) above. 243. Disguised unemployment means a. Unemployment in agriculture b. Unemployment due to recession c. Unemployment by choice d. Unemployment due to downturn in business activity e. Marginal Productivity of Labor (MPL) is zero.
48
© 2004
The Ic
fai U
nivers
ity P
ress.A
ll righ
ts res
erved
.ISBN : 8
1-314
-0227
-4 Ref.
No.
MACWB 04
2004
04
Part I
244. In which sector of Indian economy will we find a high rate of disguised unemployment? a. Service sector. b. Transport sector. c. Agriculture sector. d. Manufacture sector. e. Mining sector. 245. Stagflation is a period of a. High inflation b. Low inflation c. High unemployment d. Low unemployment e. Both (a) and (c) above. 246. The real rate of interest a. Equals the nominal rate plus the rate of inflation b. Equals the rate of inflation minus the nominal rate c. Equals the nominal rate minus the rate of inflation d. Tends to increase when inflation rises e. Is more relevant to investors than consumers. 247. Unemployment that is caused by a mismatch between the composition of the labor force (in
terms of skills, occupation, industries, or geographic location) and the make-up of the demand for labor is called
a. Real wage unemployment b. Deficient-demand unemployment c. Frictional unemployment d. Structural unemployment e. Search unemployment. 248. During the recessionary phase of a business cycle a. The purchasing power of money is likely to decline rapidly b. The natural rate of unemployment will increase dramatically c. Potential national income will exceed actual national income d. Actual national income will exceed potential national income e. The real rate of interest will exceed the nominal rate of interest. 249. Monetary theorists believe in the use of a. A stable growth rate for the money supply b. Stable interest rates to stabilize the money supply c. Fiscal policy as the main stabilization tool d. A “stop-and-go” monetary policy for fine tuning the economy e. Input-output planning as the main stabilization tool. 250. The Philips curve shows that a. High unemployment rates are associated with low increases in money wage rates b. Low unemployment rates are associated with low rates of inflation c. High unemployment rates are associated with low rates of inflation d. High inflation rates are associated with higher level of money wage rates e. High inflation rates are associated with small increases in money wage rates.
49
© 2004
The Ic
fai U
nivers
ity P
ress.A
ll righ
ts res
erved
.ISBN : 8
1-314
-0227
-4 Ref.
No.
MACWB 04
2004
04
Macroeconomics
251. ‘Bottlenecks’ in the context of macroeconomics refers to a. Inadequate spending in a sector of the economy b. A shortage of materials in a full employment economy c. Inadequate supply of labor in a full employment economy d. Inadequate supply of specific resources in an economy below full employment e. Both (b) and (c) of the above. 252. Which of the following is most likely to happen during a recession? a. Decrease in inventory . b. Producers will be cautiously optimistic. c. Capacity under utilization . d. Expansion in bank credit. e. Increasing income levels. 253. Which of the following statements is/are true about the impact of inflation in the economy? a. Unanticipated inflation hurts the fixed income earners most. b. Higher than expected inflation hurts creditors but benefits debtors. c. Inflation creates inefficiency in the economy because it forces people to search for
prices when they could be doing something else. d. Inflation can lead to a misallocation of resources because people tend to make mistakes
when there is inflation in the economy. e. All of the above. 254. Suppose an economy is experiencing inflation. And at the same time, there is a slowing down
of economic activities. This is a case of a. Deflation b. Hyper inflation c. Recession d. Depression e. Stagflation. 255. Phases of business cycles in an economy are designated primarily based on the
a. Unemployment rate b. Price levels c. Real GDP d. Inventory levels e. Gross investment. 256. Stagflation is a period of i. High inflation. ii. High growth of real GDP. iii. High unemployment. iv. High aggregate demand. a. Both (i) and (iii) above b. Both (iii) and (iv) above c. (i), (ii) and (iii) above d. (ii), (iii) and (iv) above e. All (i), (ii), (iii) and (iv) above. 257. Full employment exists when there is a. Zero unemployment b. Natural rate of unemployment c. Least demand for labor d. Least supply of labor e. Both (c) and (d) above.
50
© 2004
The Ic
fai U
nivers
ity P
ress.A
ll righ
ts res
erved
.ISBN : 8
1-314
-0227
-4 Ref.
No.
MACWB 04
2004
04
Part I
258. When a person is employed in a sector where his/her employment does not make any difference to the output, it signifies the presence of
a. Frictional unemployment b. Cyclical unemployment c. Disguised unemployment d. Structural unemployment e. Sectoral unemployment. 259. Cost push inflation occurs when a. Wages are decreased b. Productivity of labor increases c. Cost of raw material increases d. Aggregate supply curve shifts to the right e. New raw material reserves are found. 260. Recessionary GDP gap signifies a. Higher potential real GDP compared to realized real GDP b. Hyper inflationary situation c. Deflationary situation with high unemployment d. Existence of natural rate of unemployment e. Both (b) and (d) above.
The Open Economy and Balance of Payments: India’s Balance of Payments 261. Balance of trade is a. The difference between balance on current account and capital account b. Same as the balance of merchandize trade c. Same as the balance of current account d. Same as the balance of capital account e. Overall BoP balance. 262. All entries in the balance of payments should collectively sum to a. GDP of that country b. GNP of that country c. Gold reserves of that country d. Zero e. Exports of that country. 263. In the BoP statement, current account includes i. Merchandize, invisible items ii. Government loans from abroad iii. Foreign direct investment. a. (i) only b. Both (i) and (ii) above c. Both (i) and (iii) above d. Both (ii) and (iii) above e. All of (i), (ii) and (iii) above. 264. The changes in foreign exchange reserves and reserves of monetary gold held by the
monetary authority will be recorded in __________ account of the BoP statement. a. Current b. Capital c. Errors and omissions d. Official reserve e. None of the above.
51
© 2004
The Ic
fai U
nivers
ity P
ress.A
ll righ
ts res
erved
.ISBN : 8
1-314
-0227
-4 Ref.
No.
MACWB 04
2004
04
Macroeconomics
265. The deficit on current account implies a. Exports of merchandize goods, invisibles is less than imports of merchandize goods,
invisibles b. Foreign direct investment in the country is more than exports c. Domestic industries are financed more by the international financial institutes than local
financial institutions d. Exports of merchandize goods are less than merchandize imports e. Both (a) and (b) above. 266. Dumping in international trade means a. The sale of goods by foreign supplier in anothery country at price above than the price
at which the supplier sells in domestic market b. The sale of goods by foreign supplier in another country at price below than the price at
which the supplier sells in domestic market c. The sale of goods by domestic supplier in another country at price above than the price
at which the supplier sells in domestic market d. Distributing the goods in international markets without any consideration e. Giving consumer goods freely to the poor nations. 267. The investment income from abroad appears under _________ head of BoP statement. a. Current account b. Capital account c. Official reserve account d. Errors and omissions e. Unilateral transfer account. 268. International transfers from abroad means transferring of a. Goods made by the developed countries to undeveloped countries without consideration b. Goods from one country to another due to bilateral agreement c. Transfer of assets from one country to another country without consideration d. Both (a) and (c) above e. All of (a), (b) and (c) above. 269. If the balance on current and capital accounts of Balance of Payments (BoP) taken together is
negative, then a. It is a case of BoP surplus b. It is a case of BoP where the official reserve account is in surplus c. It is a case of BoP deficit d. It is a case of BoP disequilibrium e. None of the above. 270. A current account deficit unmatched or exceeded by a capital account surplus will a. Cause contraction of money supply b. Cause domestic interest rate to raise c. Lead to a fall in government budget deficit d. Lead to an increase in the propensity to import e. Cause expansion of money supply.
52
© 2004
The Ic
fai U
nivers
ity P
ress.A
ll righ
ts res
erved
.ISBN : 8
1-314
-0227
-4 Ref.
No.
MACWB 04
2004
04
Part I
271. ‘Transfer Payments’ are a. Payments made to a factor of production b. Payments transferred from one sector to another c. Payments made for no return service d. Payments made by government of one country to another e. Both (b) and (c) above. 272. A decline in the foreign exchange reserves of a country, other things remaining the same will a. Cause a capital inflow into the country b. Cause a contraction of money supply in the country c. Force the country to borrow from foreign countries d. Increase the prices of imported goods e. None of the above. 273. Which of the following transactions is included in the current account balance of the balance
of payments statement? a. Foreign direct investments. b. Portfolio investments. c. External commercial borrowings. d. Dividends earned on portfolio investments. e. External assistance. 274. All entries in the balance of payments statement should collectively sum to a. GDP of the country b. GNP of the country c. Foreign exchange reserves of the country d. Zero e. Exports of the country. 275. Which of the following transactions is included in the current account balance of the Balance
of payments statement? a. Foreign direct investments. b. Portfolio investments. c. External commercial borrowings. d. Dividends earned on portfolio investments. e. External assistance.
Modern Macroeconomics: Fiscal Policy, Budget Deficits and the Government Debt 276. Customs duty is an instrument of a. Fiscal policy b. Monetary policy c. Trade policy d. Revenue policy e. None of the above. 277. Increase in net RBI credit to the Central Government is reflected in ________ deficit. a. Budget b. Revenue c. Monetized d. Gross primary e. Gross fiscal.
53
© 2004
The Ic
fai U
nivers
ity P
ress.A
ll righ
ts res
erved
.ISBN : 8
1-314
-0227
-4 Ref.
No.
MACWB 04
2004
04
Macroeconomics
278. Which of the following items is/are the major components of non-plan expenditure? a. Interest payments. b. Defense expenditure. c. Subsidies. d. Both (a) and (b) above. e. All of (a), (b) and (c) above. 279. Gross fiscal deficit – interest payments of government is equal to a. Revenue deficit b. Capital deficit c. Budget deficit d. Primary deficit e. Monetized deficit. 280. Profits from public sector undertakings come under a. Revenue receipts b. Capital receipts c. Monetized receipts d. Both (a) and (c) above e. Both (b) and (c) above. 281. Large fiscal deficit will have implications on a. Money supply b. Inflation c. Private investments d. Both (a) and (b) above e. All of (a), (b) and (c) above. 282. An increase in Statutory Liquidity Ratio (SLR) will result in a. An increase in fiscal deficit b. A decrease in fiscal deficit c. No change in fiscal deficit d. An increase in fiscal deficit proportion with an increase in SLR e. A decrease in fiscal deficit proportion with an increase in SLR. 283. Monetized deficit is a deficit caused due to a. Increase in net RBI credit to states b. Increase in net government credit to states c. Increase in net RBI credit to commercial banks d. Increase in net government borrowings from market e. Increase in net RBI credit to the Central Government. 284. Which of the following are the examples of external debt? i. Short-term loan from IMF. ii. Bonds issued by Indian company in overseas market. iii. Bonds issued by Central Government in international market. iv. Investment by Non-Resident Indians in Indian companies debentures on repatriation
basis. a. Both (i) and (ii) above. b. Both (i) and (iii) above. c. Both (ii) and (iii) above. d. Only (i), (ii), and (iii) above. e. All of (i), (ii), (iii) and (iv) above.
54
© 2004
The Ic
fai U
nivers
ity P
ress.A
ll righ
ts res
erved
.ISBN : 8
1-314
-0227
-4 Ref.
No.
MACWB 04
2004
04
Part I
285. Budgetary deficit + Government borrowing and other liabilities is known as a. Revenue deficit b. Capital deficit c. Budget deficit d. Primary deficit e. Fiscal deficit. 286. If modern economies wish to maintain both full employment and price stability as their
policy objectives, then they should a. Control prices permanently b. Institute mandatory wage-price guidelines c. Institute voluntary wage-price guidelines d. Both (a) and (b) above e. All of (a), (b) and (c) above. 287. Primary deficit is given by a. Revenue Deficit – Interest Payment b. Budget Deficit – Interest Payment c. Fiscal Deficit – Interest Payment d. Total Receipts – Total Expenditure e. Revenue Receipts – Revenue Expenditure. 288. Which of the following statements is true? a. An equal increase in government expenditure and taxation can result in an increase in
GDP, other things being equal. b. Fiscal policy, if properly administered, would eliminate the need for monetary policy. c. The existence of the progressive personal income tax system increases the size of the
government spending multiplier. d. A downward shift in the investment schedule has a greater multiplier effect on GDP
than an equivalent downward shift in the government-expenditures schedule. e. Autonomous investment is the part of investment that increases with national income. 289. Which of the following statements is false?
a. Increase in output can cause increase in investment.
b. Increase in saving can cause increase in current output.
c. Increase in investment can cause increase in output.
d. Decrease in taxes can cause increase in output.
e. Decrease in government spending can cause decrease in output.
290. Which of the following statements is true?
a. Installing a progressive income tax would have no effect on the Keynesian multiplier.
b. The open economy investment multiplier is lower than the closed economy multiplier even when net exports are not sensitive to changes in GDP.
c. When full employment is reached, increases in money GDP are extremely difficult to achieve.
d. To fulfill all of the characteristics of equilibrium, the C + I + G + X schedule must have a slope steeper than the slope of the 45-degree line.
e. Taxes collected by the government can lower the economy’s national output, while government expenditures will tend to raise national output.
55
© 2004
The Ic
fai U
nivers
ity P
ress.A
ll righ
ts res
erved
.ISBN : 8
1-314
-0227
-4 Ref.
No.
MACWB 04
2004
04
Macroeconomics
291. If the government increases its expenditure and simultaneously adjusts the tax rate such that the budget deficit remains at the original level, then which of the following is true?
a. The equilibrium income remains unchanged.
b. The equilibrium income increases by the amount of increase in government expenditure.
c. The equilibrium income will increase by the amount of increase in government expenditure if marginal propensity to consume is greater than the investment- income ratio in the investment function.
d. The equilibrium income will increase by the amount of increase in government expenditure if marginal propensity to import is equal to the investment-income ratio in the investment function.
e. The equilibrium income will increase by the amount of increase in government expenditure if marginal propensity to consume is equal to the investment-income ratio in the investment function.
292. Given the supply of money, if the government reduces the tax rate which of the following is true?
a. Equilibrium income and interest rate will increase.
b. Equilibrium income and interest rate will decrease.
c. Equilibrium income will decrease but interest rate will increase.
d. Equilibrium income will increase but interest rate will remain unchanged.
e. Equilibrium income will remain unchanged but interest rate will increase.
293. Government borrowing to finance large deficits increases the demand for loanable funds and
a. Increases the supply of loanable funds
b. Exerts downward pressure on interest rates
c. Has no impact on interest rates
d. Puts upward pressure on interest rates
e. Makes it easier for businesses to borrow money.
294. If Mr. X buys a National Small Savings Certificate, which of the following is likely to happen?
a. Increase in Government market borrowings.
b. Increase in the other liabilities of the Government .
c. Increase in forex reserves.
d. Increase in Government revenue.
e. Decrease in Government liability. 295. Automatic stabilizers refer to
a. Inherent mechanisms in the stock market that automatically cause stock market gains to be cancelled out by losses, which make expected long-run returns equal to zero
b. The invisible hand mechanisms which automatically bring the economy out of a recession
c. Government revenue and expenditure items that change automatically in response to changes in economic activity
d. Discretionary monetary policy maneuvers designed to keep inflation under control automatically
e. None of the above.
56
© 2004
The Ic
fai U
nivers
ity P
ress.A
ll righ
ts res
erved
.ISBN : 8
1-314
-0227
-4 Ref.
No.
MACWB 04
2004
04
Part I
296. Which of the following policy measures is/are fiscal policy measure(s)? a. The government cuts taxes or raises spending to get the economy out of a recession. b. The central bank changes the money supply to affect the price level, interest rates and
exchange rates. c. The government restricts imports and stimulates exports . d. Both (a) and (b) above. e. Both (a) and (c) above. 297. Which of the following is true if the Government monetizes part of its deficit? a. Money supply in the economy will increase. b. Interest rate will increase. c. Primary deficit will increase. d. Public debt will increase. e. Revenue deficit will decrease. 298. If a Government is running surplus in its budget, we can expect that public debt will be a. Rising b. Falling c. Constant d. Falling if there are tax cuts e. Falling if the government uses the surplus to repay its past debts. 299. Personal taxes in India best illustrates a a. Proportional tax system b. Progressive tax system c. Indirect tax system d. Value added tax system e. Regressive tax system. 300. Monetized deficit refers to a. Fiscal deficit minus interest payments b. Borrowings and other liabilities of the Central Government c. Increase in the net RBI credit to the Central Government d. Fiscal deficit minus Primary deficit e. RBI’s credit to the commercial banks. 301. In the Union Budget, profits from public sector undertakings are taken under a. Revenue receipts b. Capital receipts c. Monetized receipts d. Planned expenditure e. Fiscal deficit. 302. Under which of the following tax system, more tax is imposed on the lower income groups? a. Progressive. b. Regressive. c. Proportional. d. Customs. e. Value Added Tax.
57
© 2004
The Ic
fai U
nivers
ity P
ress.A
ll righ
ts res
erved
.ISBN : 8
1-314
-0227
-4 Ref.
No.
MACWB 04
2004
04
Macroeconomics
303. The variables that changes the government spending and revenue as the economy fluctuates, without any deliberate effort of the government are called
a. Automatic Stabilizers
b. Lagging indicators
c. National income aggregates
d. Real factors
e. Growth variables.
Modern Macroeconomics: Monetary Policy and Interest Rate Structure 304. Which of the following is true if the Central Bank reduces the Reserve Ratio?
a. Money supply and loans given by commercial banks will decrease.
b. Money supply will decrease while loans given by commercial banks will increase.
c. Money supply and loans given by commercial banks will increase.
d. Money supply will increase while loans given by commercial banks will decrease.
e. Money supply will remain unaffected while the loans given by the commercial banks will decrease.
305. A reduction in commercial bank reserves due to weekly increases in currency in circulation is
a. Reserve requirements
b. Open-market operations
c. Terms of consumer credit
d. Margins on security loans
e. Moral suasion.
306. “Loose” monetary policy coupled with a contraction of aggregate supply should a. Cause government spending to fall automatically b. Cause aggregate demand to fall c. Cause many commercial banks to close their doors d. Cause interest rates to fall in the short run e. Cause a dramatic upturn in both public and private investment. 307. Open-market purchases of government bonds by Reserve Bank of India will have the
tendency to a. Increase interest rates, the money supply, and national income b. Increase interest rates and the money supply, but decrease national income c. Increase interest rates, but decrease the money supply and national income d. Decrease interest rates, but increase the money supply and national income e. Decrease interest rates, the money supply, and national income. 308. In an inflationary period, the appropriate policy for the RBI would be to a. Sell government securities in the open market b. Encourage commercial banks to increase their loans c. Reduce Cash Reserve Ratio d. Reduce bank rate e. Extend credit to government.
58
© 2004
The Ic
fai U
nivers
ity P
ress.A
ll righ
ts res
erved
.ISBN : 8
1-314
-0227
-4 Ref.
No.
MACWB 04
2004
04
Part I
309. Which of the following is not a contractionary policy? a. Increasing the bank rate. b. Increasing the CRR. c. Increasing the refinance limits. d. Buying of government securities in the open market. e. None of the above. 310. If RBI wants to ‘sterilize’ an inflow of foreign exchange, it should a. Lower the bank rate b. Lower the CRR c. Sell government securities in the open market d. Increase the repo rate e. Buy government securities in the open market. 311. If gross domestic capital formation is 3500 and gross domestic savings are 3300, there is a. An inflow of foreign savings of 200 b. An outflow of domestic savings of 200 c. A current account surplus of 200 d. A current account deficit of 200 e. Both (a) and (d) above. Trade and Exchange Rate Policies 312. Which of the following policies consists of trade policy? i. Export policy. ii. Import policy. iii. Technological policy. iv. Industrial policy. v. Licensing policy. a. Both (i) and (ii) above. b. Only (i), (ii) and (iii) above. c. Only (i), (ii) and (iv) above. d. Only (i), (ii) and (v) above. e. Only (i), (ii), (iii) and (iv) above. 313. Which of the following categories is not permitted to trade in the forex market? a. Commercial banks. b. Recognized exporter. c. Development financial institution. d. Both (b) and (c) above. e. All the three categories mentioned in (a), (b) and (c) are permitted in the forex markets. 314. In the last few months the forex reserves in India have been increasing. Which of the
following sterilization policies would the Reserve Bank of India should adopt? a. Increase CRR. b. Decrease CRR. c. Decrease discount rate. d. Buy government securities . e. None of the above.
59
© 2004
The Ic
fai U
nivers
ity P
ress.A
ll righ
ts res
erved
.ISBN : 8
1-314
-0227
-4 Ref.
No.
MACWB 04
2004
04
Macroeconomics
315. An expansionary fiscal policy combined with a liberal monetary policy results in i. A lower level of output. ii. A higher level of output. iii. A lower interest rate. iv. A higher interest rate. v. A lower or higher interest rate depending on the relative magnitude of fiscal and
monetary policies. a. (i) and (iii) above b. (i) and (iv) above c. (ii) and (iii) above d. (ii) and (v) above e. (I) and (v) above. 316. Which of the following is true if the central bank does not impose any reserve ratio? a. The banking system can no longer affect the supply of money in the economy. b. The banking sector can create unlimited money supply. c. The lending capacity of banks would narrow down to zero . d. A rupee deposited in a bank reduces the money supply in the economy by one rupee. e. Money supply in the economy will be equivalent to the high-powered money. 317. Which of the following policy instruments has the least ‘outside lag’? a. Cash reserve ratio (CRR). b. Bank rate. c. Repo rate. d. Taxes. e. Open market operations (OMO). 318. Which of the following happens when the central bank increases open market purchases? a. Aggregate supply decreases. b. Rate of inflation increases. c. Interest rates will increase. d. Aggregate demand decreases. e. Total output falls. 319. The time between the interest rate changes and the corresponding changes in the spending
decisions of the public forms a part of a. Recognition lag b. Administrative lag c. Outside lag d. Inside lag e. Intermediate lag. 320. Bank rate means a. The rate of interest on inter-bank loans b. The rate of interest charged by banks on borrowers c. The rate of interest paid by banks to depositors d. The rate of interest charged by banks for loans given to the central bank of the country e. The rate of interest charged by the central bank of a country on its loans to other
commercial banks.
60
© 2004
The Ic
fai U
nivers
ity P
ress.A
ll righ
ts res
erved
.ISBN : 8
1-314
-0227
-4 Ref.
No.
MACWB 04
2004
04
Part I
321. What would be the sequence of events when RBI increases money supply by reducing CRR? i. Interest rates fall. ii. Increase in investment expenditure. iii. Portfolio disequilibrium. iv. Increase in price of financial assets. a. (i), (ii), (iii), (iv). b. (iii), (iv), (i), (ii). c. (ii), (iii), (iv), (i). d. (iv), (iii), (ii), (i). e. (iii), (iv), (ii), (i). 322. If an economy is already under inflation, and there is increasing inflow of foreign exchange,
the central bank can sterilize the impact by a. Decreasing discount rate b. Buying government securities from banks c. Increasing cash reserve ratio d. Increasing tax rates e. Increasing government spending.
Economic Growth, Development & Planning 323. Which of the following can lead to decrease in Incremental Capital Output Ratio (ICOR)? a. Low managerial efficiency. b. Complicated production procedures. c. Existing capital is less productive. d. Inadequate delegation of powers. e. Improvement in productivity of labor.
61
© 2004
The Ic
fai U
nivers
ity P
ress.A
ll righ
ts res
erved
.ISBN : 8
1-314
-0227
-4 Ref.
No.
MACWB 04
2004
04
Part I: Answers (with Explanatory Notes) Macroeconomic Analysis: An Overview 1. (e) The variable that is measured over as period of time is a flow variable and the variable
which is measured at a point of time is a stock variable. While GDP and exports are measured over a period, usually one year, CPI and money supply are measured at a specific point of time. Hence, CPI and money supply fall under stock variables.
2. (a) While the consumption function explains how the income is spent on consumption, the saving function describes what part of income is saved.
3. (d) In a two sector model, it is assumed that the whole income is spent on consumption and savings. Symbolically, this can be represented by Y = C + S. Hence, savings can be known by consumption expenditure from income (i.e. S = Y – C).
4. (c) The variable which is computed over as period of time is a flow variable and the variable which is measured at a point of time is a stock variable. Unemployment, foreign exchange reserves and money supply are measured at a particular point of time, and hence are stock variables. Consumption is measured over a period of time, so is a flow variable.
5. (e) Gross domestic capital formation consists of addition to the inventories, addition to fixed assets, and depreciation.
6. (e) GDP = GNP – Net factor income = [Consumption + Investment + Government Expenditure + Net exports] – Net factor income .
7. (a) Per capita growth = [(1 + g)/(1 + p)] –1 where g is the growth rate of GDP per annum and p is the growth rate of population per annum.
8. (e) The operation of forces in an economy can be expressed in the form of a circular flow of incomes and spending between the households and firms. It shows how the prices of resources, goods and assets are determined and how production and household sectors interact through the markets.
9. (b) Stocks and flows variables are very essential in studying macroeconomics. (a) Is not the answer because a stock variable is measured at a specified point of time where
as a flow variable is measured for a specified period of time. Both the stock and flow variables have time dimensions. This is a true statement.
(b) Is the answer because flow variables are not always determined by stock variables. Although a stock can change only as a result of flows, the flows themselves may be determined in part by changes in stocks.
(c) Is not the answer because, stocks variables are usually affected by flow variables. (d) Is not the answer because some macroeconomic variables have a direct counter-part
stock macroeconomic variables. Flow variables like, exports, wages, taxes, etc. May not have direct counterparts, and they could indirectly affect other stocks.
(e) Is not the answer because flow variables are partly determined by stock variables. 10. (c) Circular flow of income refers to money flow from households in return for goods and
services produced by firms and money passes from firms to households in return for factor services provided by households. If any part of the income is not spent with in the flow and hence it represents leakages from the flow.
a. Since Mr. Ramesh is spending his money on consumption of goods, which would lead to flow of income from households to the firms and hence no leakage from the system.
b. In the process of buying second hand refrigerator income is transferred from Mr. Babu to Mr. Rajesh which represents consumption expenditure and hence income remains in the system.
c. As Mr. Harsha imported a new Ferrari car, part of the income has gone out the flow in order to pay for commodity which is not produced within the country. Money spent on Ferrari becomes part of circular flow of exporting country and a leakage for the importing country. Hence the answer is option c.
d. Salary paid represents flow of income from Mr. Sujit to his personal secretary. e. Since (a) is not true, therefore e cannot be the answer.
62
© 2004
The Ic
fai U
nivers
ity P
ress.A
ll righ
ts res
erved
.ISBN : 8
1-314
-0227
-4 Ref.
No.
MACWB 04
2004
04
Part I
11. (d) Economic developement is defined as a process of economic transition involving the Structural transformation of an economy through industrialization. Economic development leads to improvement in Standard of living of the people.
a. National Income deflator is the ratio of current price of National Income to constant price of National Income. It is only a price index, cannot be used to measure economic development.
b. GNP at current prices measures the money value of final value of goods and services produced by the residents of a country. The value of goods are measured by taking the price goods existing in the current year. A increase in GDP at current prices need not necessarily lead to economic development.
c. Real National Income measures the final value of goods and services produced by the residents of a country. The value of goods are measured by taking the prices existing in the base year. An increase in real national income need not lead to economic development if the population is increasing at a faster rate than that of real national income. Hence, cannot be used as an indicator of economic development.
d. Per Capita real national income is the best indicator, because an increase in per capita real national income would mean that more goods are available per head, which would mean the standard of living has increased.
e. GDP deflator is an indicator of price index, on the basis of reason (a), it is not an indicator of economic development.
Measurement of Macroeconomic Aggregates 12. (a) GNP deflator is the ratio of nominal GDP to real GNP. Hence, if GNP deflator increases by
40%, the numerator should at least increase by 40%. If GNP deflator rises, it does not affect Real GNP as Real GNP is adjusted with inflation.
13. (b) Since real GNP is measured in terms of goods and services, production of more goods and services increases real GNP. Nominal GNP is the value of goods and services in terms of current market prices, thus nominal GDP increases with the increase in price level.
14. (e) Currency with the public including small coins + Demand deposits with the bank and other deposits with RBI is called narrow money (is denoted by M1).
15. (e) Broad money (M3) is also known as aggregate monetary resources and is equivalent to M1 + time deposits with the banking system, where M1 is currency with the public + demand deposits with the banking system.
16. (c) NNP at market prices + Depreciation = GNP at market prices. Thus, if NNP at market prices remains constant, GNP at market prices increases by an amount equal to rise in depreciation.
17. (d) The output method is followed either by valuing all the final goods and services produced during a year or by aggregating the values imparted to the intermediate products at each stage of production by the industries and productive enterprises in the economy. The sum of these values added gives the gross domestic product at factor cost, which after a similar adjustment to include net factor income from abroad gives gross national product at factor cost.
18. (a) Under expenditure method we aggregate all money spent by private citizens, firms and the government within the year to estimate the economy’s national income.
19. (a) GNP deflator is a price index constructed to reveal the cost of purchasing the items included in the GNP during the period relative to the cost of purchasing. It is the ratio of nominal GNP to real GNP.
20. (b) GDPMP = GDPFC + [Indirect Taxes – Subsidies]. Where, Net Indirect Taxes = Indirect Taxes – Subsidies. This shows that GDP at market price exceeds GDP at factor cost by the amount of revenue
raised through indirect taxes, assuming that subsidies are not given.
63
© 2004
The Ic
fai U
nivers
ity P
ress.A
ll righ
ts res
erved
.ISBN : 8
1-314
-0227
-4 Ref.
No.
MACWB 04
2004
04
Macroeconomics
21. (d) GDP at market price = GDP at factor price + Indirect Taxes – Subsidies (or) GDP at factor price = GDP at market price – Indirect Taxes + Subsidies. We consider exports while computing GDP at market price and factor price.
22. (e) Macroeconomics is concerned with the overall performance of the economy. It deals with overall employment, inflation and growth of the economy as a whole.
23. (e) No conclusion can be drawn regarding the growth rate of a country based on the rate of inflation in the country.
24. (a) In a closed economy, savings are equal to investments at the equilibrium level of income. 25. (e) There are three most popular methods to calculate national income, all the three methods
are conceptually equivalent to each other. They are: (a) the output method, (b) the expenditure method and (c) the income method.
26. (a) NNPMP = NDPMP + Net factor income from abroad. Thus, net factor income from abroad = NNPMP – NDPMP.
27. (b) Balance of trade = Total merchandize exports – Total merchandize imports. 28. (d) National income + Transfer payments + Net interest and dividend = Personal income Personal income – Personal taxes = Disposable personal income. 29. (c) Personal income = Personal disposable income (Yd) + Personal income taxes Where, Yd = Total income – Taxes. 30. (b) Net national savings + Retained earnings of foreign companies = Net domestic savings. 31. (b) Net exports = Total exports – Total imports. 32. (c) GDP at market prices = GDP at factor cost + Indirect taxes – Subsidies. 33. (c) The price paid for a stolen car is not a market transaction, as it is illegal. Thus, while
computing GNP price paid for a stolen car is not included. 34. (d) Macroeconomics is concerned with the overall performance of the economy. It deals with
overall employment, price stability and growth of the economy. 35. (b) Real GNP is expressed in terms of goods and services. So real GNP increases only when
there is an increase in the output of goods and services. 36. (a) The operation of forces in an economy can be expressed in the form of a circular flow of
incomes and spending between the households and firms. 37. (d) In a model where there is no government, investment, net investment, capital replacement
or international trade, the market value of final output is equal to the aggregate consumption by the household sector or the sum of returns to all factors of production.
38. (b) Expenditures on consumer goods are not included in gross investment. 39. (a) In a model where there is household, business, government and foreign sector, the GNP is
given by the sum of the consumption (C), gross investment (I), government expenditure (G), and net exports (E – M).
GNP = C + I + G + E – M. 40. (d) In a three-sector model, Y = C + I + G = C + S + T. 41. (a) NNP at factor cost = National income = NNP at market prices – Indirect taxes + Subsidies 42. (b) Personal income is the total income received by individuals that is available for
consumptions, saving and payment of personal taxes. Personal income does not include undistributed corporate profits, as it remains with the enterprise and not distributed to employees or shareholders.
43. (d) Nominal GDP is the measure of total value of goods and services produced during the year at current market prices.
64
© 2004
The Ic
fai U
nivers
ity P
ress.A
ll righ
ts res
erved
.ISBN : 8
1-314
-0227
-4 Ref.
No.
MACWB 04
2004
04
Part I
44. (e) GDP at market prices = GDP at factor cost + Indirect taxes – Subsidies Thus, when subsidies are more than indirect taxes, GDP at factor cost exceeds GDP at market
price. 45. (c) GNP = GDP + Net factor income from abroad Hence, net factor income from abroad = GNP – GDP. 46. (b) NDP does not include depreciation [Hint: GDP – Depreciation = NDP] 47. (a) NNP at factor cost = NDP at market price + Subsidies – Indirect Taxes 48. (d) NNP at factor cost is also known as National Income. 49. (e) Transfer payments are not taken into account while computing national income. National
income is computed by summing up payments to all factors of production. 50. (d) Salaries paid by Microsoft USA to Indian programmers employed at New York is a part
of Indian GNP but not GDP, as the income is earned outside the boundaries of the country. 51. (e) National product fails to account the household production because it neither a market
transaction nor involve money. It also makes no adjustment for harmful side effects that some times arise from several productive activities and the events of nature (e.g. pollution, noise, etc).
52. (e) GDP Deflator is a price index, which is used to measure the average level of the prices of all goods and services that make up GDP.
(a) Is not the answer because it is a true statement that GDP deflator is otherwise known as implicit price deflator.
(b) Is not the answer because GDP deflator reflects the change in overall price level in the economy.
(c) Is not the answer because GDP deflator is the most comprehensive index of price. (d) Is not the answer because GDP deflator is used to measure real GNP i.e. GNP in rupees
of constant purchasing power. If prices are rising, the nominal GNP during the latter period to account for the effects of inflation.
(e) Is the answer because GDP deflator does not measure economic growth. 53. (e) Personal disposable income = Personal income – Personal taxes. (a) Is not the answer because the difference between personal disposable income and
personal income is not residential investment. (b) Is not the answer because the difference between personal disposable income and
personal income is not indirect taxes. (c) Is not the answer because the difference between personal disposable income and
personal income is not subsidies. (d) Is not the answer because the difference between personal disposable income and
personal income is not transfer payments. (e) Is the answer because the difference between personal disposable income and personal
income is personal taxes. 54. (c) Investment is the flow of expenditures devoted to increasing or maintaining the real
capital stock. When the addition to capital goods is more than the capital consumption allowance, it will result in a positive net investment.
(a) Is not the answer because when the addition to capital goods is less than the capital consumption allowance, it will result in negative net investment.
(b) Is not the answer because when the addition to capital goods is more than the capital consumption allowance, it will not result in zero net investment.
(c) Is the answer because when the addition to capital goods is more than the capital consumption allowance, it will result in positive net investment.
(d) Is not the answer because when the addition to capital goods is more than the capital consumption allowance, it will not result in negative gross investment. Because gross investment is the total investment that occurs in the economy within any specific time period.
(e) Is not the answer because when the addition to capital goods is more than the capital consumption allowance, it will not result in zero gross investment.
65
© 2004
The Ic
fai U
nivers
ity P
ress.A
ll righ
ts res
erved
.ISBN : 8
1-314
-0227
-4 Ref.
No.
MACWB 04
2004
04
Macroeconomics
55. (a) GNP deflator is a price index, which is used to reveal the cost of purchasing the items included in GNP during the period relative to the cost of purchasing those items during a base year. GNP deflator is used to measure real GNP i.e. in rupees of constant purchasing power. If there is a rise in prices, the nominal GNP is deflated during the latter period to account for the effects of inflation.
(a) Is the answer because GNP deflator is the ratio of Nominal GNP to Real GNP.
(b) Is not the answer because GNP deflator is not the ratio of Real GNP to Nominal GNP.
(c) Is not the answer because GNP deflator is not the ratio of Nominal GNP to Real GDP.
(d) Is not the answer because GNP deflator is not the ratio of Real GNP to Nominal GDP.
56. (d) Transfer payments are not considered as payment for current services or production. These items are not entered in national income.
(a) Is not the answer because salary paid to a soldier is the payment for current services and hence it is not an examples of government transfer payments.
(b) Is not the answer because purchasing of a new car for the Ministry of Finance is not an examples of government transfer payments.
(c) Is not the answer because funding of a clinic to provide free vaccinations is not an examples of government transfer payments.
(d) Is the answer because free food coupons issued to a persons in an antipoverty program is not the payment for current services or production and hence it is an examples of government transfer payments.
(e) Is not the answer because funding of a new bridge in an urban area is the payment for current services and hence it is not an examples of government transfer payments.
57. (a) In India, Whole Sale Price Index (WPI) is widely used for determine of inflation. Because the office of the economic advisor to the government of India publishes wholesale price indices for individual commodities, commodity groups and the overall WPI monthly. They are reported in a number of other publications also.
(a) Is the answer because Whole Sale Price Index (WPI) is widely used for determine of inflation in India.
(b) Is not the answer because GDP deflator is not used for determining inflation in India. GDP deflator is used to reveal the cost of purchasing the items included in GNP during the period relative to the cost of purchasing those items during a base year. And it is difficult to bet the data for the two years for comparisons.
(c) Is not the answer because in practice it is difficult to include each and every item for construction of Consumer Price Index. (CPI)
(d) Is not the answer because both Whole Sale Price Index (WPI) and GDP deflator are not used in measuring inflation.
(e) Is not the answer because both GDP deflator and Consumer Price Index. (CPI) are not used in measuring inflation.
58. (c) Investment includes expenditure on the plant and machinery produced during the year, expenditure incurred on construction activities (both residential and non-residential) during the year and change in inventories.
(a) and (b) are not the answer as both are financial transactions, which do not form part of investment.
(c) is the answer as change inventories is considered to be an investment.
(d) is not the answer as purchase of used vehicles amounts only to transfer of ownership and not an investment.
66
© 2004
The Ic
fai U
nivers
ity P
ress.A
ll righ
ts res
erved
.ISBN : 8
1-314
-0227
-4 Ref.
No.
MACWB 04
2004
04
Part I
59. (a) Since the value added within the domestic territory will belong to the domestic factor inputs, NDP at factor cost must be equal to domestic factor income.
Hence answer is (a). (b) Is not the answer because the net factor income earned within the domestic territory of a
country is not equal to Net Domestic Product at market price. (c) Is not the answer because the net factor income earned within the domestic territory of a
country is not equal to Net National Product at factor cost. (d) Is not the answer because the net factor income earned within the domestic territory of a
country is not equal to Net National Product at market price. (b) Is not the answer because the net factor income earned within the domestic territory of a
country is not equal to Personal Income. 60. (a) By definition dividends and corporate taxes are part of corporate profits. National Income refers to the factor income earned by the residents of a country and it
includes profits earned by entrepreneurs. Profit includes dividends and corporate tax. Hence dividends and corporate tax are part of national income.
Hence dividends and corporate taxes are part of corporate profits and national income. On the basis of the above reason, dividends and corporate taxes are part of corporate profits
(i) and National Income (ii). Hence this is true option. Dividends and corporate taxes are not part of personal income, hence not the correct option. On the basis of above reason, the option is not correct. d.e. As given in the reason, dividends and corporate taxes are not part of personal income and
personal disposable income. Hence not correct option. 61. (a) All the options that are given measure price indices. Each of which is constructed with a
particular objective. a. CPI represents the changes in the price of a basket of goods with respect to the prices
existing in the base year. The basket of goods that are considered are those that are used commonly by consumers and they are grouped together as food items, housing, fuel and light etc. Doctor fees, railway and bus fares are the items of expenditure of the consumer, hence in the calculation of consumer price index they are given greater weightage. Hence the option is correct.
b. Whole sale price index can be interpreted as an index of prices paid by producers for their inputs. It gives more importance to items used in production process. Hence the option is not correct.
c. Index of industrial production is a quantity index which covers mining, manufacturing and electricity generation. Hence the items referred to in the question are not included. Hence the option is not correct.
d. GNP deflator is a measure of real GNP i.e. GNP in rupees of constant purchasing power. While calculating it no weights are assigned, hence the option is not correct.
e. Same reason as given in option (d). 62. (d) GDP refers to money value of final goods and services produced within the domestic
territory of a country including depreciation. There are certain goods which are produced but will not be included in GDP. For example services of house wives.
Bobby purchase of a new suit is nothing but the consumption expenditure of bobby, which is part of GDP.
Purchase of new Ford car also refers to consumption expenditure and hence part of GDP New computer purchased by Community Bank for its loan office refers to purchase of capital
goods. Hence it is part of capital expenditure and hence part of GDP. Tomatoes grown in home garden by Market are not taken as part of GDP Even though goods
are produced, they are not taken as part of GDP as it refers to production for self consumption. If she sells them in the market then it becomes part of GDP.
Ford India could not sell 100 cars, hence they are part of inventories and hence part of capital expenditure. Hence included in GDP as part of capital goods expenditure.
67
© 2004
The Ic
fai U
nivers
ity P
ress.A
ll righ
ts res
erved
.ISBN : 8
1-314
-0227
-4 Ref.
No.
MACWB 04
2004
04
Macroeconomics
The Simple Keynesian Model of Income Determination 63. (d) The multiplier is used more generally in Economics to mean the effect on some
endogenous variable of a unit change in an exogenous variable. The expenditure multiplier relates the change in income to the change in autonomous spending.
64. (d) In the equation, consumption, C = 12 + 0.6 Y, ‘12’ represents the autonomous investment expenditure and 0.6 shows the marginal propensity to consume (MPC). If the marginal propensity to consume (MPC) is 0.6, then the marginal propensity to save (MPS) is equal to (1 – 0.6) = 0.4.
65. (b) The “rachet effect” is the situation where households find it easier to adjust to rising incomes than falling incomes.
66. (a) Amounts of consumption and saving not only depend upon the level of disposable income, but on many factors. Changes in these factors cause shift in the consumption function. This can lead to more or less consumption at the same level of income. Some of these factors are:
• The stock of wealth
• Expectations regarding movement of prices and income
• Taxation policy
• Age composition, etc.
67. (c) The slope of the consumption function represents the Marginal Propensity to Consume (MPC).
68. (c) The Average propensity to consume can never exceed unity.
69. (d) An automatic stabilizer is any mechanism in the economy that reduces the amount by which output changes in response to a change in autonomous demand. The proportional income tax levied by the government is an automatic stabilizer. Hence it does not affect the balanced budget.
70. (a) In the equation C C cY, C= + and c represent autonomous consumption and marginal propensity to consume respectively. Autonomous consumption expenditure is the consumption expenditure, which is independent to income level, Y. In other words, it is the consumption expenditure when the income level is 0.
71. (b) A change in an exogenous variable is categorized as an autonomous change because it is determined by forces outside the economic model.
72. (d) C = f(Yd, W) here Yd and W are independent variables explaining C.
73. (c) In a two-sector economy, planned savings are equal to planned investments at the equilibrium level of income.
74. (b) When planned savings are not invested fully, part of the money saved would become ideal and therefore, the output decreases.
75. (a) When the value of output exceeds planned spending, there is unsold output, which leads to drop in the level of income.
76. (d) Marginal propensity to consume refers to change in consumption as a result of change in income, that is ΔC/ΔY. ΔC/ΔY is nothing but slope of the consumption function.
77. (a) The multiplier is used more generally in Economics to mean the effect on some endogenous variable due to change in exogenous variable. The expenditure multiplier relates the change in income to the change in autonomous spending.
78. (b) As autonomous spending for a particular consumption line is taken as constant while constructing spending curve, any change in autonomous spending cause shift in the spending line.
79. (c) When consumption spending lags the receipt of disposable income by one period it is given by Ct = f(Yd,t-1).
68
© 2004
The Ic
fai U
nivers
ity P
ress.A
ll righ
ts res
erved
.ISBN : 8
1-314
-0227
-4 Ref.
No.
MACWB 04
2004
04
Part I
80. (d) A single shock in autonomous demand produces a slow or distributed lag effect on output. Dynamic multiplier shows how a given change in autonomous investment affects the level of output overtime.
81. (c) Current account describes the trade in goods and services of a country with the outside world. If current account balance shows a deficit, it represents that foreign exchange outflows on goods and services, gifts and unilateral transfers are more than inflows.
82. (d) An increase in autonomous investment spending, transfers or a decrease in taxes cause an increase in the level of income, but increase in net tax revenues does not cause an increase in income.
83. (c) Ceteris paribus, introduction of taxes reduces the disposable income. This in turn decreases the value of the expenditure and net tax revenue multiplier.
84. (b) Y = C+ I + G + E – M An increase in autonomous investment spending increases the income level in the country
that in turn increases imports. Consequently, the net exports become negative. 85. (d) Multiplier = 1/[1 – b + MPI), where MPI is marginal propensity to import. This shows
inverse relationship between multiplier and marginal propensity to import. Thus, an increase in the marginal propensity to import decreases the value of the multiplier.
86. (b) If an investment spending is negatively related to the rate of interest, equilibrium income also relates inversely with interest rate, as investment spending is a component of equilibrium income.
87. (d) In the consumption function, C = 256 + 0.85 Y, MPC = 0.85l and it remains constant, whereas average propensity to consume will be changing with the income.
88. (b) Multiplier = 1/MPS where MPS is the marginal propensity to save; thus an increase in marginal propensity to save decreases the value of multiplier.
89. (b) When the multiplier is one (or unity), it implies that output expands precisely by the amount of the increased government purchases without any induced consumption spending. So when the government expenditure increases by 100, the equilibrium income also increases by 100.
90. (c) The term ‘multiplier’ is used more generally in economics to mean the effect on some endogenous variable of a unit due to change in an exogenous variable. The multiplier is necessarily be greater than one in a simple model of income determination.
91. (d) Life Cycle Hypothesis states that the saving behavior of the individuals during their working life is motivated by their desire to maintain consumption levels after retirement. The permanent income theory argues that people gear their consumption behavior to their permanent or long-term opportunities but not to their current level of income. The relative income hypothesis argues that current consumption depends not only on current income but also on the past behavior of the income.
92. (c) The term ‘multiplier’ in macroeconomics refers to the change in an induced variable per unit change in an external variable. Keynes multiplier denotes the number by which the change in investment results in change in total output (or income). Thus, a multiplier of 3 implies that when investment increases by Re.1, income or output increases by Rs.3. But, income Y = C + I + G + NE. Thus, if autonomous investment increases by Re.1, the income increases by Rs.3. Out of that Rs.3; autonomous investment increases by Re.1 (given) and consumption by Rs.2 (i.e. 3 – 1), assuming that government expenditure and net exports are autonomous and do not influenced by the autonomous investment. (Note: Assume that there are no imports).
93. (e) The demand for precautionary balances represents money that is held as a precaution against
some unforeseen events such as medical emergency, accident etc. This precautionary demand for money is inversely related to rate of interest and frequency
with which income is received. Lower the rate of interest and frequency with which income is received, higher is the precautionary demand for money and vice versa.
(a) Is not the answer because precautionary demand for money varies directly with the level of income.
(b) Precautionary demand for money is inversely related to rate of interest.
69
© 2004
The Ic
fai U
nivers
ity P
ress.A
ll righ
ts res
erved
.ISBN : 8
1-314
-0227
-4 Ref.
No.
MACWB 04
2004
04
Macroeconomics
(c) Is not the answer because precautionary demand for money varies directly with the wealth a person held.
(d) Precautionary demand for money is inversely related to frequency with which income is received.
(e) Is the answer because precautionary demand for money is inversely related to rate of interest and frequency with which income is received.
94. (e) (a) Consumption depends on the income and as income increase consumption also increase.
Propensity to consume refers to the changes in consumption as a result of change in income. Hence propensity to consume effects consumption.
Propensity to save refers to changes in savings as a results of changes in income. The level of savings affects the level of consumption. Hence changes in savings does affect consumption
d. Consumption demand does not depend upon the level of consumer spending. e. Consumption demand does not depend upon the level of marginal efficiency of
investment. 95. (c) Consumption curve depicts the relationship between consumption and income. APS is given by the ratio between saving and Income. Whereas the slope of the curve is
given by the ratio between change in consumption and income. Hence not correct APC refers to the ratio between consumption and Income, hence not the slope of the
consumption curve which as said above is given by changes in consumption as a result of change in income.
By definition, MPC refers to increase in consumption per unit increase in income. Which is nothing but the slope of the consumption curve. Hence the option is true.
MPS refers to change in savings as results of change in income and slope of consumption curve gives the changes in consumption as a result of change in income. Hence not true.
Level of consumption cannot be used to calculate slope of the consumption curve as slope refers to ratio between changes in consumption and changes in income.
96. (b) Marginal propensity to consume refers to the change in consumption as a result of increase in income. Part of the changed income is saved. Hence MPC is equal to 1-MPS. Multiplier is the reciprocal of 1-MPC or MPS. Hence larger MPC means smaller MPS and hence larger will be the value of the multiplier.
Statement (i) is false because as MPC is larger, MPS will be smaller as it is nothing but 1-MPC.
Statement (ii) is true because multiplier is reciprocal of MPS and MPS is smaller as said above.
Statement (iii) is true. Average propensity to consume will depend on level of consumption and income. Since the MPC is larger, consumption will also be larger and hence average propensity to consume will also be larger.
Statement (iv) is false, as autonomous consumption is independent of MPC and hence it is not possible to say anything about autonomous consumption on the basis of MPC.
Since both (ii) and (iii) are true, the option (c) is the answer.
Income Determination Model Including Money and Interest 97. (a) The IS curve explains the combination of interest rates and levels of output at which
planned spending equals income. 98. (e) The IS curve explains the combination of interest rates and levels of output at which
planned spending equals income. Thus, any factor other than interest rates shifts the IS upwards or downwards. An increase or decrease in interest rates at an income level is only a movement along the IS curve.
70
© 2004
The Ic
fai U
nivers
ity P
ress.A
ll righ
ts res
erved
.ISBN : 8
1-314
-0227
-4 Ref.
No.
MACWB 04
2004
04
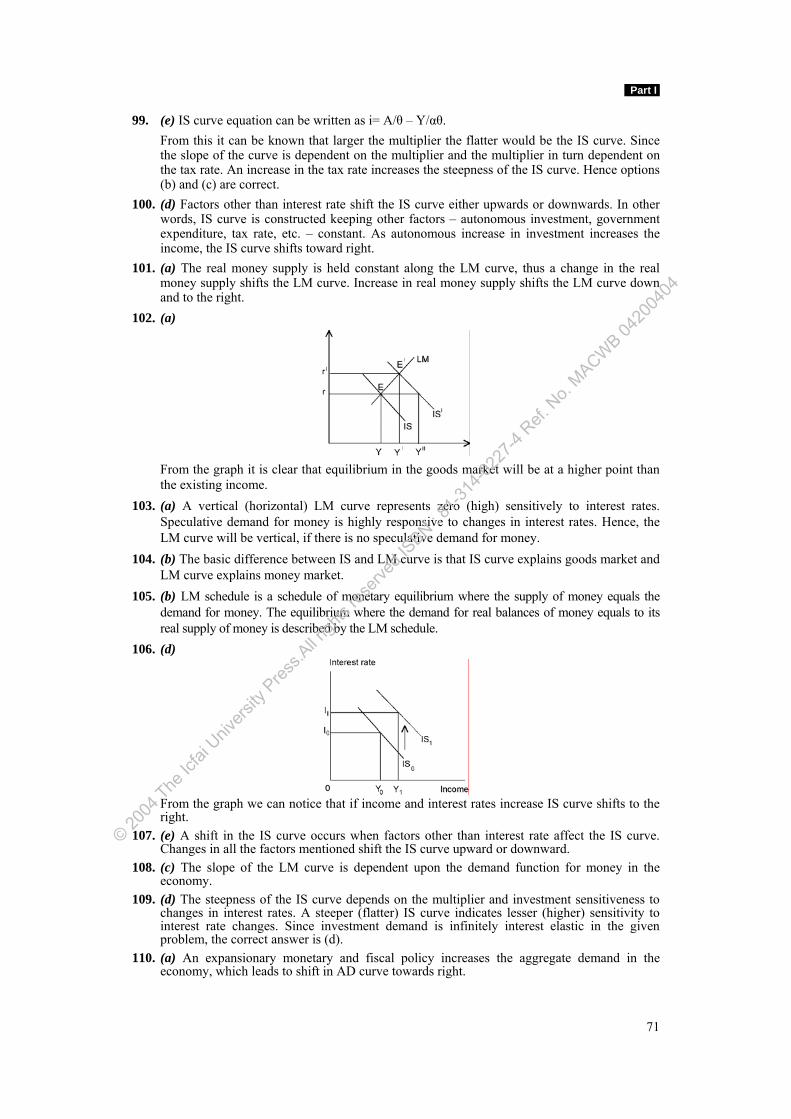
Part I
99. (e) IS curve equation can be written as i= A/θ – Y/αθ. From this it can be known that larger the multiplier the flatter would be the IS curve. Since the slope of the curve is dependent on the multiplier and the multiplier in turn dependent on the tax rate. An increase in the tax rate increases the steepness of the IS curve. Hence options (b) and (c) are correct.
100. (d) Factors other than interest rate shift the IS curve either upwards or downwards. In other words, IS curve is constructed keeping other factors – autonomous investment, government expenditure, tax rate, etc. – constant. As autonomous increase in investment increases the income, the IS curve shifts toward right.
101. (a) The real money supply is held constant along the LM curve, thus a change in the real money supply shifts the LM curve. Increase in real money supply shifts the LM curve down and to the right.
102. (a)
From the graph it is clear that equilibrium in the goods market will be at a higher point than
the existing income. 103. (a) A vertical (horizontal) LM curve represents zero (high) sensitively to interest rates.
Speculative demand for money is highly responsive to changes in interest rates. Hence, the LM curve will be vertical, if there is no speculative demand for money.
104. (b) The basic difference between IS and LM curve is that IS curve explains goods market and LM curve explains money market.
105. (b) LM schedule is a schedule of monetary equilibrium where the supply of money equals the demand for money. The equilibrium where the demand for real balances of money equals to its real supply of money is described by the LM schedule.
106. (d)
From the graph we can notice that if income and interest rates increase IS curve shifts to the
right. 107. (e) A shift in the IS curve occurs when factors other than interest rate affect the IS curve.
Changes in all the factors mentioned shift the IS curve upward or downward. 108. (c) The slope of the LM curve is dependent upon the demand function for money in the
economy. 109. (d) The steepness of the IS curve depends on the multiplier and investment sensitiveness to
changes in interest rates. A steeper (flatter) IS curve indicates lesser (higher) sensitivity to interest rate changes. Since investment demand is infinitely interest elastic in the given problem, the correct answer is (d).
110. (a) An expansionary monetary and fiscal policy increases the aggregate demand in the economy, which leads to shift in AD curve towards right.
71
© 2004
The Ic
fai U
nivers
ity P
ress.A
ll righ
ts res
erved
.ISBN : 8
1-314
-0227
-4 Ref.
No.
MACWB 04
2004
04
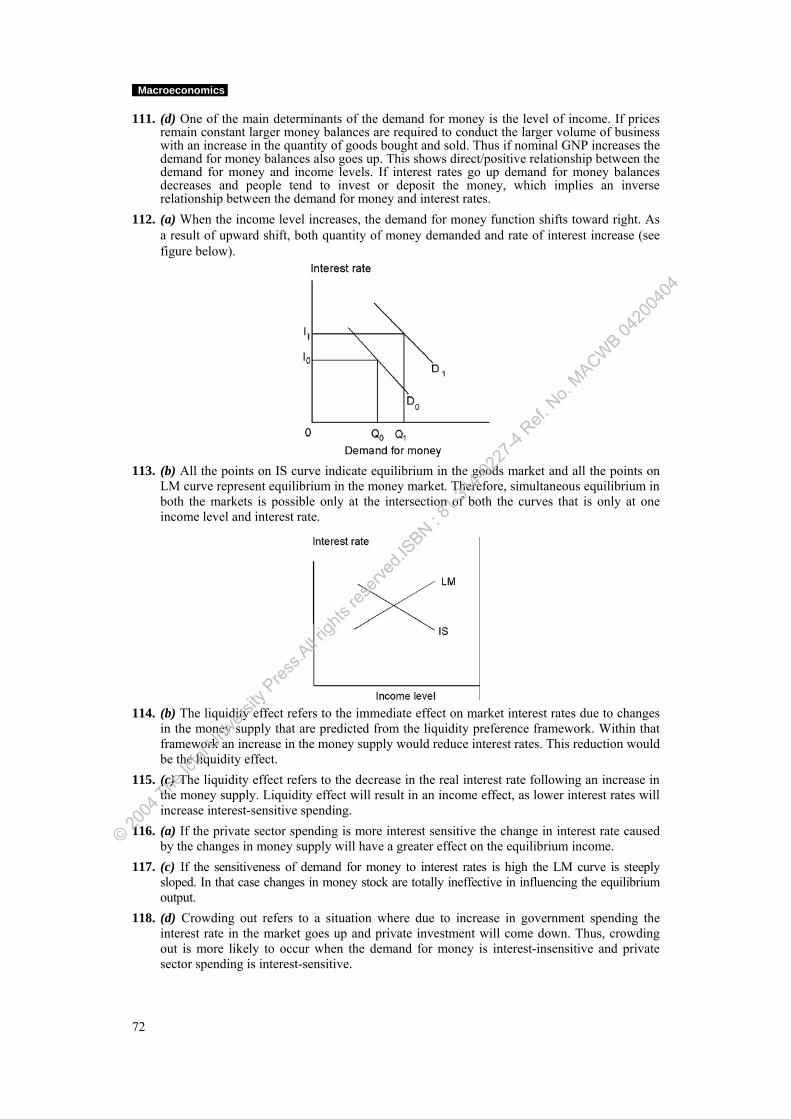
Macroeconomics
111. (d) One of the main determinants of the demand for money is the level of income. If prices remain constant larger money balances are required to conduct the larger volume of business with an increase in the quantity of goods bought and sold. Thus if nominal GNP increases the demand for money balances also goes up. This shows direct/positive relationship between the demand for money and income levels. If interest rates go up demand for money balances decreases and people tend to invest or deposit the money, which implies an inverse relationship between the demand for money and interest rates.
112. (a) When the income level increases, the demand for money function shifts toward right. As a result of upward shift, both quantity of money demanded and rate of interest increase (see figure below).
113. (b) All the points on IS curve indicate equilibrium in the goods market and all the points on
LM curve represent equilibrium in the money market. Therefore, simultaneous equilibrium in both the markets is possible only at the intersection of both the curves that is only at one income level and interest rate.
114. (b) The liquidity effect refers to the immediate effect on market interest rates due to changes
in the money supply that are predicted from the liquidity preference framework. Within that framework an increase in the money supply would reduce interest rates. This reduction would be the liquidity effect.
115. (c) The liquidity effect refers to the decrease in the real interest rate following an increase in the money supply. Liquidity effect will result in an income effect, as lower interest rates will increase interest-sensitive spending.
116. (a) If the private sector spending is more interest sensitive the change in interest rate caused by the changes in money supply will have a greater effect on the equilibrium income.
117. (c) If the sensitiveness of demand for money to interest rates is high the LM curve is steeply sloped. In that case changes in money stock are totally ineffective in influencing the equilibrium output.
118. (d) Crowding out refers to a situation where due to increase in government spending the interest rate in the market goes up and private investment will come down. Thus, crowding out is more likely to occur when the demand for money is interest-insensitive and private sector spending is interest-sensitive.
72
© 2004
The Ic
fai U
nivers
ity P
ress.A
ll righ
ts res
erved
.ISBN : 8
1-314
-0227
-4 Ref.
No.
MACWB 04
2004
04
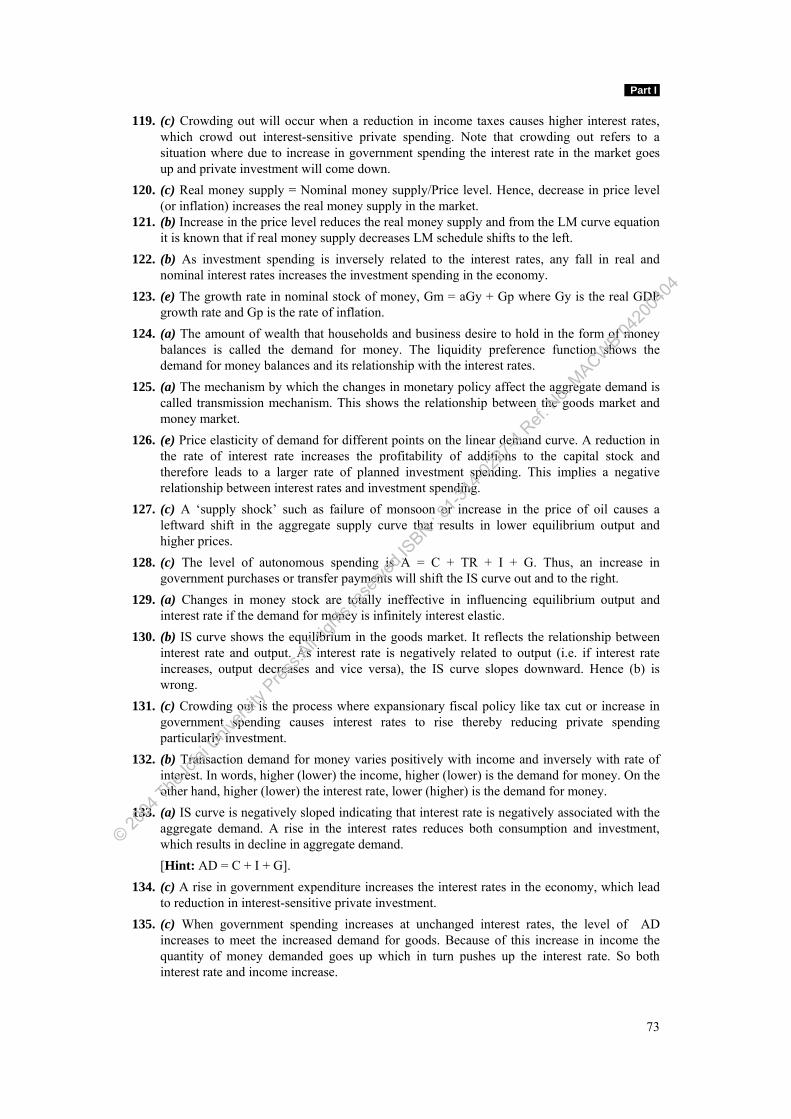
Part I
119. (c) Crowding out will occur when a reduction in income taxes causes higher interest rates, which crowd out interest-sensitive private spending. Note that crowding out refers to a situation where due to increase in government spending the interest rate in the market goes up and private investment will come down.
120. (c) Real money supply = Nominal money supply/Price level. Hence, decrease in price level (or inflation) increases the real money supply in the market.
121. (b) Increase in the price level reduces the real money supply and from the LM curve equation it is known that if real money supply decreases LM schedule shifts to the left.
122. (b) As investment spending is inversely related to the interest rates, any fall in real and nominal interest rates increases the investment spending in the economy.
123. (e) The growth rate in nominal stock of money, Gm = aGy + Gp where Gy is the real GDP growth rate and Gp is the rate of inflation.
124. (a) The amount of wealth that households and business desire to hold in the form of money balances is called the demand for money. The liquidity preference function shows the demand for money balances and its relationship with the interest rates.
125. (a) The mechanism by which the changes in monetary policy affect the aggregate demand is called transmission mechanism. This shows the relationship between the goods market and money market.
126. (e) Price elasticity of demand for different points on the linear demand curve. A reduction in the rate of interest rate increases the profitability of additions to the capital stock and therefore leads to a larger rate of planned investment spending. This implies a negative relationship between interest rates and investment spending.
127. (c) A ‘supply shock’ such as failure of monsoon or increase in the price of oil causes a leftward shift in the aggregate supply curve that results in lower equilibrium output and higher prices.
128. (c) The level of autonomous spending is A = C + TR + I + G. Thus, an increase in government purchases or transfer payments will shift the IS curve out and to the right.
129. (a) Changes in money stock are totally ineffective in influencing equilibrium output and interest rate if the demand for money is infinitely interest elastic.
130. (b) IS curve shows the equilibrium in the goods market. It reflects the relationship between interest rate and output. As interest rate is negatively related to output (i.e. if interest rate increases, output decreases and vice versa), the IS curve slopes downward. Hence (b) is wrong.
131. (c) Crowding out is the process where expansionary fiscal policy like tax cut or increase in government spending causes interest rates to rise thereby reducing private spending particularly investment.
132. (b) Transaction demand for money varies positively with income and inversely with rate of interest. In words, higher (lower) the income, higher (lower) is the demand for money. On the other hand, higher (lower) the interest rate, lower (higher) is the demand for money.
133. (a) IS curve is negatively sloped indicating that interest rate is negatively associated with the aggregate demand. A rise in the interest rates reduces both consumption and investment, which results in decline in aggregate demand.
[Hint: AD = C + I + G]. 134. (c) A rise in government expenditure increases the interest rates in the economy, which lead
to reduction in interest-sensitive private investment. 135. (c) When government spending increases at unchanged interest rates, the level of AD
increases to meet the increased demand for goods. Because of this increase in income the quantity of money demanded goes up which in turn pushes up the interest rate. So both interest rate and income increase.
73
© 2004
The Ic
fai U
nivers
ity P
ress.A
ll righ
ts res
erved
.ISBN : 8
1-314
-0227
-4 Ref.
No.
MACWB 04
2004
04
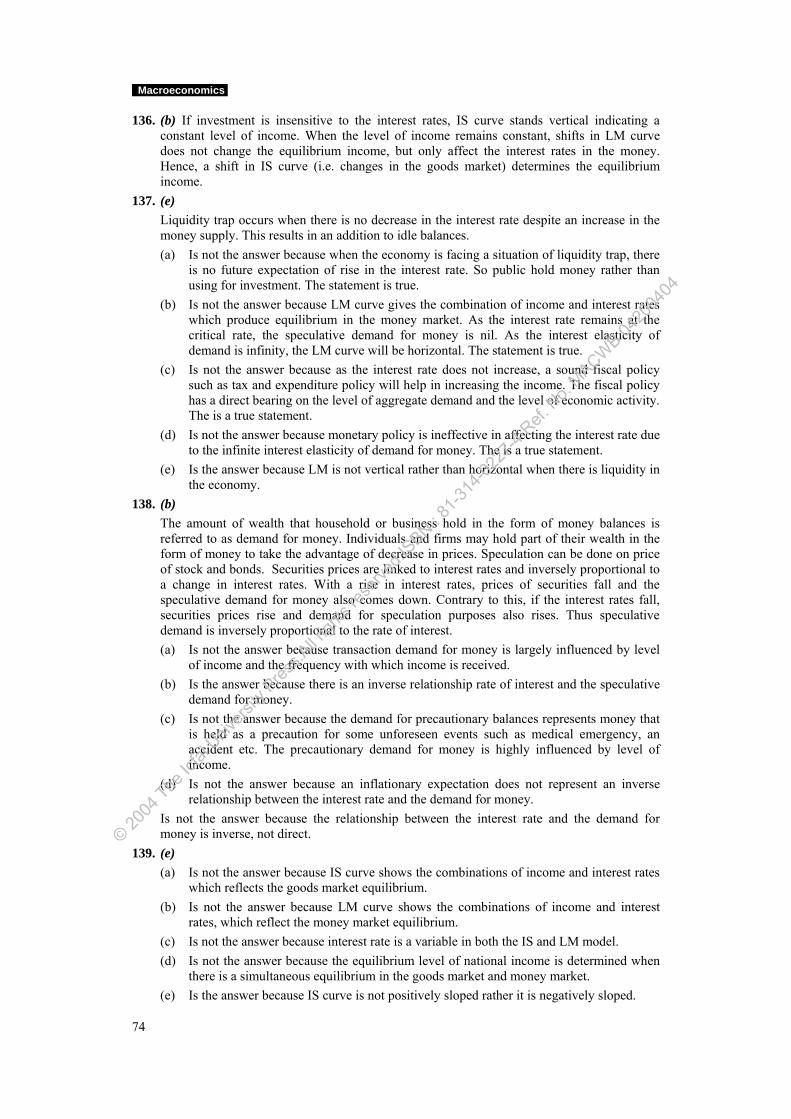
Macroeconomics
136. (b) If investment is insensitive to the interest rates, IS curve stands vertical indicating a constant level of income. When the level of income remains constant, shifts in LM curve does not change the equilibrium income, but only affect the interest rates in the money. Hence, a shift in IS curve (i.e. changes in the goods market) determines the equilibrium income.
137. (e) Liquidity trap occurs when there is no decrease in the interest rate despite an increase in the
money supply. This results in an addition to idle balances. (a) Is not the answer because when the economy is facing a situation of liquidity trap, there
is no future expectation of rise in the interest rate. So public hold money rather than using for investment. The statement is true.
(b) Is not the answer because LM curve gives the combination of income and interest rates which produce equilibrium in the money market. As the interest rate remains at the critical rate, the speculative demand for money is nil. As the interest elasticity of demand is infinity, the LM curve will be horizontal. The statement is true.
(c) Is not the answer because as the interest rate does not increase, a sound fiscal policy such as tax and expenditure policy will help in increasing the income. The fiscal policy has a direct bearing on the level of aggregate demand and the level of economic activity. The is a true statement.
(d) Is not the answer because monetary policy is ineffective in affecting the interest rate due to the infinite interest elasticity of demand for money. The is a true statement.
(e) Is the answer because LM is not vertical rather than horizontal when there is liquidity in the economy.
138. (b) The amount of wealth that household or business hold in the form of money balances is
referred to as demand for money. Individuals and firms may hold part of their wealth in the form of money to take the advantage of decrease in prices. Speculation can be done on price of stock and bonds. Securities prices are linked to interest rates and inversely proportional to a change in interest rates. With a rise in interest rates, prices of securities fall and the speculative demand for money also comes down. Contrary to this, if the interest rates fall, securities prices rise and demand for speculation purposes also rises. Thus speculative demand is inversely proportional to the rate of interest.
(a) Is not the answer because transaction demand for money is largely influenced by level of income and the frequency with which income is received.
(b) Is the answer because there is an inverse relationship rate of interest and the speculative demand for money.
(c) Is not the answer because the demand for precautionary balances represents money that is held as a precaution for some unforeseen events such as medical emergency, an accident etc. The precautionary demand for money is highly influenced by level of income.
(d) Is not the answer because an inflationary expectation does not represent an inverse relationship between the interest rate and the demand for money.
Is not the answer because the relationship between the interest rate and the demand for money is inverse, not direct.
139. (e) (a) Is not the answer because IS curve shows the combinations of income and interest rates
which reflects the goods market equilibrium. (b) Is not the answer because LM curve shows the combinations of income and interest
rates, which reflect the money market equilibrium. (c) Is not the answer because interest rate is a variable in both the IS and LM model. (d) Is not the answer because the equilibrium level of national income is determined when
there is a simultaneous equilibrium in the goods market and money market. (e) Is the answer because IS curve is not positively sloped rather it is negatively sloped.
74
© 2004
The Ic
fai U
nivers
ity P
ress.A
ll righ
ts res
erved
.ISBN : 8
1-314
-0227
-4 Ref.
No.
MACWB 04
2004
04
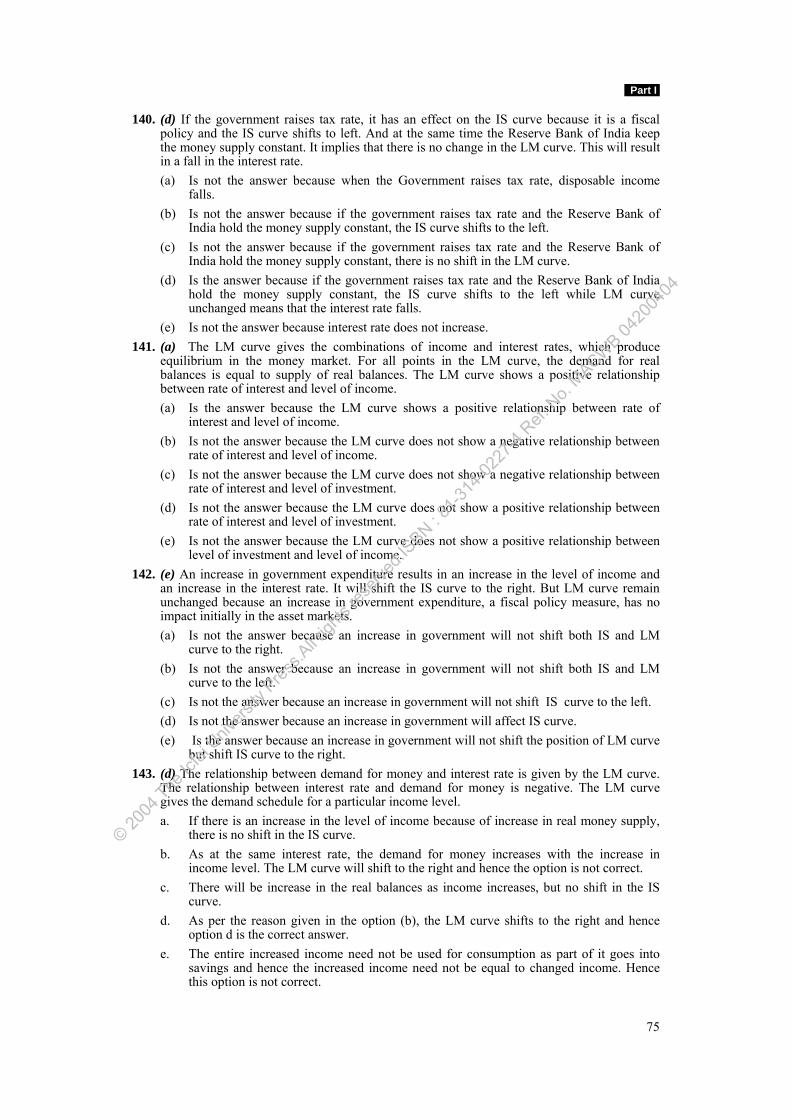
Part I
140. (d) If the government raises tax rate, it has an effect on the IS curve because it is a fiscal policy and the IS curve shifts to left. And at the same time the Reserve Bank of India keep the money supply constant. It implies that there is no change in the LM curve. This will result in a fall in the interest rate.
(a) Is not the answer because when the Government raises tax rate, disposable income falls.
(b) Is not the answer because if the government raises tax rate and the Reserve Bank of India hold the money supply constant, the IS curve shifts to the left.
(c) Is not the answer because if the government raises tax rate and the Reserve Bank of India hold the money supply constant, there is no shift in the LM curve.
(d) Is the answer because if the government raises tax rate and the Reserve Bank of India hold the money supply constant, the IS curve shifts to the left while LM curve unchanged means that the interest rate falls.
(e) Is not the answer because interest rate does not increase. 141. (a) The LM curve gives the combinations of income and interest rates, which produce
equilibrium in the money market. For all points in the LM curve, the demand for real balances is equal to supply of real balances. The LM curve shows a positive relationship between rate of interest and level of income.
(a) Is the answer because the LM curve shows a positive relationship between rate of interest and level of income.
(b) Is not the answer because the LM curve does not show a negative relationship between rate of interest and level of income.
(c) Is not the answer because the LM curve does not show a negative relationship between rate of interest and level of investment.
(d) Is not the answer because the LM curve does not show a positive relationship between rate of interest and level of investment.
(e) Is not the answer because the LM curve does not show a positive relationship between level of investment and level of income.
142. (e) An increase in government expenditure results in an increase in the level of income and an increase in the interest rate. It will shift the IS curve to the right. But LM curve remain unchanged because an increase in government expenditure, a fiscal policy measure, has no impact initially in the asset markets.
(a) Is not the answer because an increase in government will not shift both IS and LM curve to the right.
(b) Is not the answer because an increase in government will not shift both IS and LM curve to the left.
(c) Is not the answer because an increase in government will not shift IS curve to the left. (d) Is not the answer because an increase in government will affect IS curve. (e) Is the answer because an increase in government will not shift the position of LM curve
but shift IS curve to the right. 143. (d) The relationship between demand for money and interest rate is given by the LM curve.
The relationship between interest rate and demand for money is negative. The LM curve gives the demand schedule for a particular income level.
a. If there is an increase in the level of income because of increase in real money supply, there is no shift in the IS curve.
b. As at the same interest rate, the demand for money increases with the increase in income level. The LM curve will shift to the right and hence the option is not correct.
c. There will be increase in the real balances as income increases, but no shift in the IS curve.
d. As per the reason given in the option (b), the LM curve shifts to the right and hence option d is the correct answer.
e. The entire increased income need not be used for consumption as part of it goes into savings and hence the increased income need not be equal to changed income. Hence this option is not correct.
75
© 2004
The Ic
fai U
nivers
ity P
ress.A
ll righ
ts res
erved
.ISBN : 8
1-314
-0227
-4 Ref.
No.
MACWB 04
2004
04
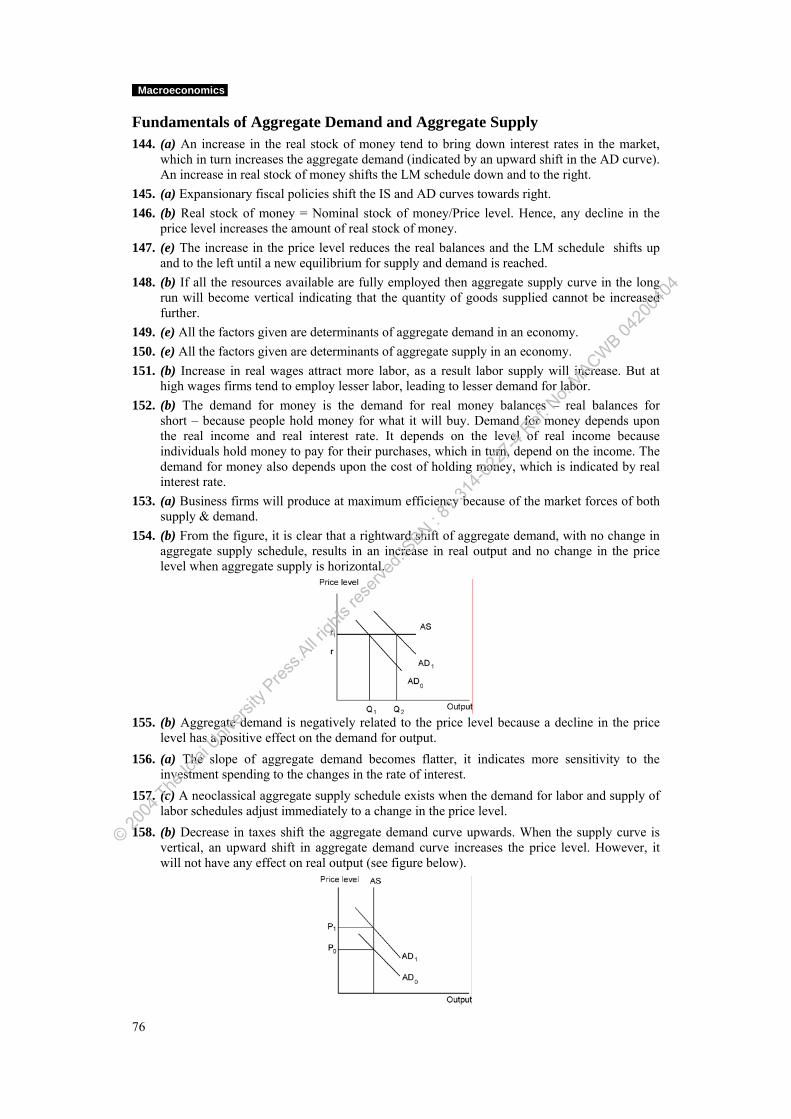
Macroeconomics
Fundamentals of Aggregate Demand and Aggregate Supply 144. (a) An increase in the real stock of money tend to bring down interest rates in the market,
which in turn increases the aggregate demand (indicated by an upward shift in the AD curve). An increase in real stock of money shifts the LM schedule down and to the right.
145. (a) Expansionary fiscal policies shift the IS and AD curves towards right. 146. (b) Real stock of money = Nominal stock of money/Price level. Hence, any decline in the
price level increases the amount of real stock of money. 147. (e) The increase in the price level reduces the real balances and the LM schedule shifts up
and to the left until a new equilibrium for supply and demand is reached. 148. (b) If all the resources available are fully employed then aggregate supply curve in the long
run will become vertical indicating that the quantity of goods supplied cannot be increased further.
149. (e) All the factors given are determinants of aggregate demand in an economy. 150. (e) All the factors given are determinants of aggregate supply in an economy. 151. (b) Increase in real wages attract more labor, as a result labor supply will increase. But at
high wages firms tend to employ lesser labor, leading to lesser demand for labor. 152. (b) The demand for money is the demand for real money balances – real balances for
short – because people hold money for what it will buy. Demand for money depends upon the real income and real interest rate. It depends on the level of real income because individuals hold money to pay for their purchases, which in turn, depend on the income. The demand for money also depends upon the cost of holding money, which is indicated by real interest rate.
153. (a) Business firms will produce at maximum efficiency because of the market forces of both supply & demand.
154. (b) From the figure, it is clear that a rightward shift of aggregate demand, with no change in aggregate supply schedule, results in an increase in real output and no change in the price level when aggregate supply is horizontal.
155. (b) Aggregate demand is negatively related to the price level because a decline in the price
level has a positive effect on the demand for output. 156. (a) The slope of aggregate demand becomes flatter, it indicates more sensitivity to the
investment spending to the changes in the rate of interest. 157. (c) A neoclassical aggregate supply schedule exists when the demand for labor and supply of
labor schedules adjust immediately to a change in the price level. 158. (b) Decrease in taxes shift the aggregate demand curve upwards. When the supply curve is
vertical, an upward shift in aggregate demand curve increases the price level. However, it will not have any effect on real output (see figure below).
76
© 2004
The Ic
fai U
nivers
ity P
ress.A
ll righ
ts res
erved
.ISBN : 8
1-314
-0227
-4 Ref.
No.
MACWB 04
2004
04
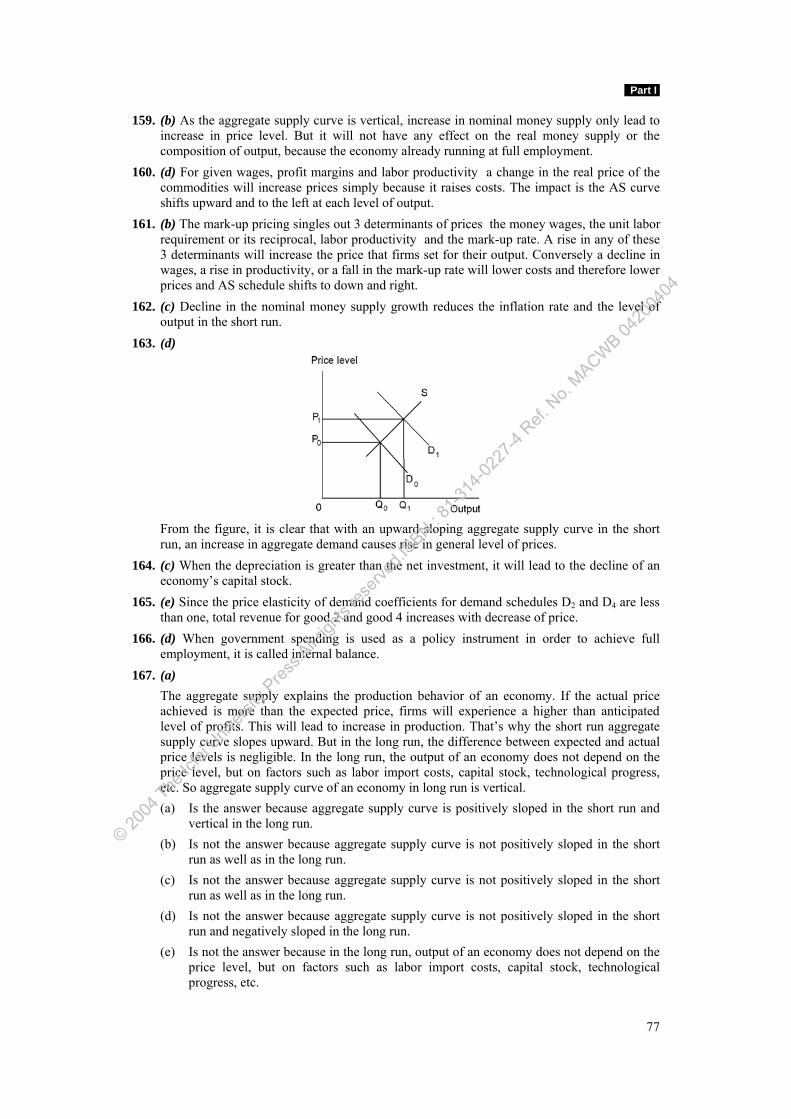
Part I
159. (b) As the aggregate supply curve is vertical, increase in nominal money supply only lead to increase in price level. But it will not have any effect on the real money supply or the composition of output, because the economy already running at full employment.
160. (d) For given wages, profit margins and labor productivity a change in the real price of the commodities will increase prices simply because it raises costs. The impact is the AS curve shifts upward and to the left at each level of output.
161. (b) The mark-up pricing singles out 3 determinants of prices the money wages, the unit labor requirement or its reciprocal, labor productivity and the mark-up rate. A rise in any of these 3 determinants will increase the price that firms set for their output. Conversely a decline in wages, a rise in productivity, or a fall in the mark-up rate will lower costs and therefore lower prices and AS schedule shifts to down and right.
162. (c) Decline in the nominal money supply growth reduces the inflation rate and the level of output in the short run.
163. (d)
From the figure, it is clear that with an upward sloping aggregate supply curve in the short
run, an increase in aggregate demand causes rise in general level of prices. 164. (c) When the depreciation is greater than the net investment, it will lead to the decline of an
economy’s capital stock. 165. (e) Since the price elasticity of demand coefficients for demand schedules D2 and D4 are less
than one, total revenue for good 2 and good 4 increases with decrease of price. 166. (d) When government spending is used as a policy instrument in order to achieve full
employment, it is called internal balance. 167. (a) The aggregate supply explains the production behavior of an economy. If the actual price
achieved is more than the expected price, firms will experience a higher than anticipated level of profits. This will lead to increase in production. That’s why the short run aggregate supply curve slopes upward. But in the long run, the difference between expected and actual price levels is negligible. In the long run, the output of an economy does not depend on the price level, but on factors such as labor import costs, capital stock, technological progress, etc. So aggregate supply curve of an economy in long run is vertical.
(a) Is the answer because aggregate supply curve is positively sloped in the short run and vertical in the long run.
(b) Is not the answer because aggregate supply curve is not positively sloped in the short run as well as in the long run.
(c) Is not the answer because aggregate supply curve is not positively sloped in the short run as well as in the long run.
(d) Is not the answer because aggregate supply curve is not positively sloped in the short run and negatively sloped in the long run.
(e) Is not the answer because in the long run, output of an economy does not depend on the price level, but on factors such as labor import costs, capital stock, technological progress, etc.
77
© 2004
The Ic
fai U
nivers
ity P
ress.A
ll righ
ts res
erved
.ISBN : 8
1-314
-0227
-4 Ref.
No.
MACWB 04
2004
04
Macroeconomics
168. (b) AD curve gives the relation between quantity of goods and services demanded and price level. Apart from price, AD is also affected by
i. A change in income ii. Rate of interest iii. Government policy iv. A change in exchange rate and v. Transfer payments a. A decrease in income of foreigners will have its impact only on the aggregate demand
of the country to which they belong to and not on the domestic economy. Hence, there is no impact on the aggregate demand.
b. Transfer payments refer to incomes such as pensions, gifts etc. ‘which are unilateral payments. They add to the income of the receiver. Hence private transfers from abroad will add to the income and leads to increase in aggregate demand.
c. A decline in government expenditure leads to decrease in aggregate demand as less money is available for various government activities and hence demands fewer goods.
d. Increase in interest rates makes loans demanded for investment and consumption purposes costlier. The people would prefer to wait until the interest rates come down and hence the aggregate demand will less.
e. An increase in tax rates will lead to decrease in disposable income in case of direct taxes and investment demand in case of corporate taxes. The net impact is that aggregate demand will decrease.
169. (e) Realized output refers to aggregate supply and spending refers to aggregate demand. If aggregate supply is greater than aggregate demand, it results in fall in price, output and employment.
a. Since aggregate demand is falling short of aggregate supply, demand is lower and hence there is not new investments which would mean there will be increase in unemployment.
b. Since there is lower demand, prices will decline. c. Since there is excess supply, there is no possibility of providing new employment. At
full employment aggregate supply is equal to aggregate demand. d. There is excess supply in the economy i.e. there is unsold stock which leads to increase
in inventories. Hence true. 170. (e) In long run the economy will tend towards output which is referred to as natural rate of
output. a. True, because long equilibrium is characterized by tendency towards natural rate of
output b. In long run output of an economy does not depend on the price level, but on labor,
import cost, capital stock, technological progress etc., hence true. c. True, input costs play a greater role in the determination of equilibrium output. d. At natural rate the aggregate supply is vertical as it is insensitive to price hence true. e. Since price does not have any impact of output in long run, unanticipated price also has
no role. Hence this option is not true. 171. (c) Aggregate supply curve gives the relationship between net national product that would be
supplied at each general price level. Deficit demand refers to a situation where aggregate demand is falling short of aggregate
supply, hence price decrease. This results us decrease in supply. Hence the supply curve will be positive sloped.
In case there are idle resources, as the prices increase firms can increase supply by utilization of idle resources. Hence the relationship between supply and prices is positive.
78
© 2004
The Ic
fai U
nivers
ity P
ress.A
ll righ
ts res
erved
.ISBN : 8
1-314
-0227
-4 Ref.
No.
MACWB 04
2004
04
Part I
In a situation where all the resources are fully employed, the firms will not be in a position to increase the supply even if prices are increased. Hence the supply curve will be vertical. Hence the correct option.
Aggregate supply curve is vertical in short run as the resources are fully employed. Labor is a variable factor in short run, hence the available labour force is fully employed.
Vertical supply curve only means that all the available resources are fully employed, it is not necessary that all firms must earn normal profits.
Money Supply and Banking System 172. (c) The currency with the public is equal to the notes and coins in circulation and demand
deposits with banks. 173. (e) Money supply = [(1 + Cu)/(Cu + r)] x H As both Cu and H are constant, an increase in reserve ratio decreases money supply, but at a
lesser proportion. 174. (d) M3 = M1 + Time deposits with the banking system. M4 = M3 + Total post office deposits. 175. (e) M3 = M1 + Time deposits with the banking system and M4 = M3 + Total post office
deposits. Thus, both M3 and M4 include time deposits with the banking system. 176. (b) Bank rate is the rate at which the central bank is prepared to discount or rediscount the
commercial bills brought to it by commercial banks. 177. (c) Lowering the reserve requirements and increasing the volume of reserves rises the money
supply in the market. [Hint: Money supply = {(1 + c)/(c + r)} H] Reserves (R) = (DD + TD) r Or, r = Reserve ratio = R/(DD + TD) Ceteris paribus, a reduction in reserve ratio therefore increases the DD component in the
money supply. 178. (e) The RBI money together with government money constitutes the monetary base which is
known as high powered money. High powered money = Currency with the public + Reserves + Other deposits with RBI.
179. (c) This transaction does not make any change in money supply because it is already in circulation.
180. (b) Both the statements are wrong, so the answer is ‘b’. 181. (d) Money supply, Ms = (1 + Cu)/(Cu + r) x H. 182. (a) The RBI money together with government money constitutes the monetary base which is
known as high powered money. 183. (e) Money multiplier = (1 + Cu)/(Cu + r). Thus, if currency deposit increases the multiplier
decreases less than proportionately to the increase. 184. (c) Financial Intermedian Ratio (FIR) is the ratio of financial claims issued to the net physical
capital formation. FIR shows the relation between financial development and the growth of physical investment.
185. (e) The RBI money together with government money constitutes the monetary base which is known as high powered money. High powered money, H = M3/m, where m is the money multiplier.
186. (d) M3 = M1 + Time deposits with banks M2 = M1 + Post office savings deposits. 187. (e) Money Multiplier = [(1 + Cu)/(Cu + r)] Therefore, if reserve ratio, r is constant and currency deposit ratio, Cu increases then money
multiplier decreases less than proportionately to the increase of currency deposit ratio.
79
© 2004
The Ic
fai U
nivers
ity P
ress.A
ll righ
ts res
erved
.ISBN : 8
1-314
-0227
-4 Ref.
No.
MACWB 04
2004
04
Macroeconomics
188. (c) Savings deposits are not a part of money stock measure (M1) because they are not recognized as legal tender by the RBI and are not readily convertible to cash.
189. (c) Increase in corporate income tax at constant interest rates will discourage the investment. Hence, the volume of investment will not increase.
190 (d) Financial Intermedian Ratio (FIR) is the ratio of financial claims issued to the net physical capital formation. FIR shows the relation between financial development and the growth of physical investment.
191. (a) Change in money supply induces change in interest rates, which affects the investment spending that in turn affects the aggregate demand and output.
192. (b) New issue ratio = Primary issues by non-financial sector/total physical asset formation. 193. (a) Creation of credit is a major function of a commercial bank. When a bank creates credit
or advances loans, there tends to be a multiple expansion of credit in the banking systems. (a) Is the answer because credit creation by the commercial bank is limited by the Cash
Reserve Ratio(CRR), i.e. every commercial bank must keep on deposit with the Reserve Bank certain amounts of funds equal to a specified percentage of it is own deposit liabilities.
(b) Is not the answer because commercial banks cannot create as much credit as they want. Is not the answer because RBI has control over the credit created by commercial banks. (d) Is not the answer because CRR has an impact on credit creation 194. (b) The balance sheet of Reserve Bank of India contains particulars of bank’s current assets
and liabilities. (a) Is not the answer because central government’s borrowings from RBI constitutes assets
of RBI. It will affect the balance sheet. (b) Is the answer because loan taken by one commercial bank from the other is a inter bank
loan. It will not affect the balance sheet of the Reserve Bank of India. It is neither a liability nor an asset to the RBI.
(c) Is not the answer because refinancing of NABARD loans constitutes assets of RBI. (d) Is not the answer because increase in reserves of commercial banks increases the
liabilities of RBI. (e) Is not the answer because increase in net foreign exchange assets increases the assets of
RBI. 195. (e) A well-developed financial system is vital for the smooth functioning of an economy. The
financial development ratios such as Finance Ratio, Financial Interrelation Ratio, New Issues Ratio and Intermediation Ratio are indicators of financial development of a country.
(a) Is not the answer because Finance Ratio is an indicator of financial development of a country.
(b) Is not the answer because Financial Interrelation Ratio is an indicator of financial development of a country.
(c) Is not the answer because New Issues Ratio is an indicator of financial development of a country.
(d) Is not the answer because Intermediation Ratio is an indicator of financial development of a country.
(e) Is the answer because Cost Benefit Ratio is not an indicator of financial development of a country.
196. (c) Money supply = H × (1+ Cu / Cu + r) Where, H = Monetary Liabilities of Central Bank + Government Money. Cu = Currency-deposit ratio r = Cash reserve ratio. (a) Is not the answer because when the RBI increases cash reserve ratio (CRR), monetary
liabilities of the RBI decreases.
80
© 2004
The Ic
fai U
nivers
ity P
ress.A
ll righ
ts res
erved
.ISBN : 8
1-314
-0227
-4 Ref.
No.
MACWB 04
2004
04
Part I
(b) Is not the answer because when the RBI increases Cash Reserve Ratio (CRR), high powered money in the economy increases.
(c) Is the answer because when the RBI increases Cash Reserve Ratio (CRR), the value of money multiplier decreases.
(d) Is not the answer because when the RBI increases Cash Reserve Ratio (CRR), aggregate demand in the economy decreases.
(e) Is not the answer because when the RBI increases Cash Reserve Ratio (CRR), price level in the economy decreases.
197. (d) M1 = Currency with the public + Demand deposits with the banking system + other deposit with the bank.
M3 = M1+ Time deposits with the banking systems. (a) Is not the answer because the difference between M3 and M1 is not the demand deposits. (b) Is not the answer because the difference between M3 and M1 is not the post office
savings deposits. (c) Is not the answer because the difference between M3 and M1 is not the savings deposits. (d) Is the answer because the difference between M3 and M1 is the time deposits. (e) Is not the answer because the difference between M3 and M1 is not M2. 198. (d) Given the demand for money, an increase in money supply lowers the nominal rate of
interest. Decrease in rate of interest increase interest sensitive expenditure like consumption and investment, thereby increasing AD.
a. Is not the answer because other things being equal, an increase in the supply of money does not lowers both nominal interest rate and aggregate demand.
b. Is not the answer because other things being equal, an increase in the supply of money does not raises both nominal interest rate and aggregate demand.
c. Is not the answer because other things being equal, an increase in the supply of money does not raise nominal interest rate and lowers aggregate demand.
d. Is the answer because other things being equal, an increase in the supply of money lowers nominal interest rate and raises aggregate demand.
e. Is not the answer because other things being equal, an increase in the supply of money do change nominal interest rate or aggregate demand.
Aggregate Supply, Price Level and Employment: Macroeconomic Equilibrium in the Classical Model 199. (b) Since the theory of income distribution is a short run theory both the capital stock and
technology are assumed to be constant. Thus, output in the short run depends only on quantity of labor input, i.e. Y = f (N), where N represents quantity of labor input.
200. (c) The firms demand the labor so long as the cost of hiring additional worker is less than the revenue gained (i.e. w = P. MPL).
201. (e) Under pure competition a profit maximizing firm hires workers until the money wage ‘w’ is equal to the general price level P multiplied by Marginal Product of Labor (MPL). Symbolically, w = P.MPL or w/P = MPL, where w/P represents real wage rate.
202. (d) The amount of labor demanded is negatively related to real wage rate. That is, an increase (decrease) in real wages will increase (decrease) the quantity of labor demanded.
203. (e) Marginal Product of Labor (MPL) represents the change in output per unit change in labor employed. If the change in input is ΔY and change in labor ΔN, then MPL = ΔY/ΔN.
204. (d) According to Says Law of Markets ‘supply creates its own demand’. Over production and unemployment are not possible in long run as price and wages adjust to remove both of them. Only in short run disequilibrium can exist.
a. True, as in short run over production and unemployment are possible. b. Disequilibrium occurs because of mismatch between demand and supply, hence true. c. True, in the short run there can be excess production and unemployment. d. False, in long run price, wages adjust freely and bring about equilibrium. e. True flexible hence price and wages are not rigid.
81
© 2004
The Ic
fai U
nivers
ity P
ress.A
ll righ
ts res
erved
.ISBN : 8
1-314
-0227
-4 Ref.
No.
MACWB 04
2004
04
Macroeconomics
205. (b) The long run effect of an increase in government spending in the classical model is to increase the price level as the long-run aggregate supply curve is considered to be vertical. Therefore any increase in demand is simply inflationary.
(a) Is not the answer because in the classical model, the long run effect of an increase in government spending is not an increase in the price level.
(b) Is the answer because in the classical model, the long run effect of an increase in government spending is an upward shift of the aggregate demand curve.
(c) Is not the answer because in the classical model, the long run effect of an increase in government spending is not an increase in the level of output.
(d) Is not the answer because both (a) and (b) above cannot be the answer. (e) Is not the answer because (a), (b) and (c) above cannot be the answer.
Aggregate Supply, Price Level and Employment: Macroeconomic Equilibrium in the Keynesian Model 206. (d) Contrast to classical model, where wage rate is flexible, in the Keynesian model, workers
oppose to any decrease in their money wages.
207. (a) The real difference between the classical model and the Keynesian model lies in the assumption of rigid money wages. Contrast to classical mode, where wage rate is flexible, in the Keynesian model, nominal wages are flexible upward but rigid downward.
208. (e) As in the classical system Keynesian system also consists of 3 basic markets – the labor market, the money market and the goods market.
209. (c) Says law states that supply of goods creates its own demand.
210. (e) In Keynesian system, equilibrium takes place at a less than full employment level of output.
211. (c) Real wage = w/P where w is money wage and P is the price level. Thus, if the price level falls, real wages increase, given the money wage.
212. (b) At a higher real wage business firms will not wish to hire many workers. But the higher real wage brings forth more labor, which results in unemployment.
213. (e) Increase in prices at a constant nominal money wages decreases real wages and increases employment. At a higher real wage business firms will not wish to hire more workers, resulting in increase in unemployment.
214. (e) As against classical theory, Keynesian analysis was completely a demand side approach. It says that demand induces firms to produce or supply goods and services. Keynes also advocated that demand for money determines the supply of money in the market.
215. (e) Investors prefer holding money in bonds when they expect an increase in interest rate and capital loss from a bond.
216. (b) Since nominal wages are assumed flexible upwards the aggregate supply curve will be perfectly price inelastic at the full employment level.
217. (e) All the three statements given are true in case of an economy in equilibrium. 218. (e) Individuals and firms may want to maintain part of their wealth in the form of money to
take advantage of price reduction. This is because, if price reduces, the value of money increases.
219. (c) Classical model assumes that real wages adjusts automatically to bring about equality of demand for and supply of labor; on the other hand, the Keynesian model assumes that nominal wages (w) is rigid downward.
220. (e) The statements a, b, c and d are true with regard to Keynesian model of income determination. Statement ‘c’ is not true.
221. (b) Increase in autonomous government expenditure has direct impact on aggregate demand, which causes production of more goods and services thereby increasing the level of income. This increase in quantity of money demanded will in turn lead to an increase in interest rates.
82
© 2004
The Ic
fai U
nivers
ity P
ress.A
ll righ
ts res
erved
.ISBN : 8
1-314
-0227
-4 Ref.
No.
MACWB 04
2004
04
Part I
222. (c)
In the Keynesian model, actual expenditure and planned expenditure is same at the equilibrium level of output. When the actual expenditure is less than the planned expenditure in the economy, there will be a positive inventory investment in the economy.
(a) Is not the answer because there will not be a positive fixed investment in the economy.
(b) Is not the answer because there will not be a negative fixed investment in the economy.
(c) Is the answer because there will be positive inventory investment in the economy.
(d) Is not the answer because there will not be negative inventory investment in the economy.
(e) Is not the answer because there will be change in the inventory investment in the economy.
223. (e)
(a) Is not the answer because Keynes considered the existence of full employment as a special case. The Keynesian underemployment equilibrium is reflecting real life situations.
(b) Is not the answer because aggregate demand or effective demand indicates the total quantity of goods and services that people want to buy. According to Keynes, effective aggregate demand determines the level of employment and output.
(c) Is not the answer because Keynes argues that State intervention is essential as full employment is not possible in an economy.
(d) Is not the answer because Keynes argues that an economy facing recession, budget deficit is an important tool to overcome recession.
(e) Is the answer because in the Keynesian model, monetary policy is not effective as compared to fiscal policy. Rather it is the fiscal policy, which is very effective and powerful. Keynes argues that government should maintain an active stance with a combination of tax and expenditure policies to maintain the desired levels of output and employment through manipulation of effective demand.
224. (a)
In the Keynesian model, unemployment could be reduced if the aggregate demand increases. Therefore, unemployment is caused by demand deficiency. The Keynesian theory of unemployment suggests that governments can play an active role in the economy by adjusting the aggregate demand through its fiscal and monetary instruments.
(a) Is the answer because unemployment in the Keynesian model is caused by demand deficiency.
(b) Is not the answer because unemployment in the Keynesian model is not caused by supply deficiency.
(c) Is not the answer because unemployment in the Keynesian model is not caused by demand sufficiency.
(d) Is not the answer because unemployment in the Keynesian model is not caused by supply sufficiency.
(e) Is not the answer because unemployment in the Keynesian model is not caused by both demand deficiency and supply deficiency.
83
© 2004
The Ic
fai U
nivers
ity P
ress.A
ll righ
ts res
erved
.ISBN : 8
1-314
-0227
-4 Ref.
No.
MACWB 04
2004
04
Macroeconomics
Post-Keynesian Macroeconomics – Monetarism, Rational Expectations and Supply-side Economics 225. (c) According to monetarists, the money supply is the principal determinant of the levels of
output and employment in the short run and the price level in the long run. It is based upon the monetarist formulations of the demand for money function and the transmission mechanism. Monetarists argue that the demand for money is no longer a function solely of the interest rate and income, but that the rate of return on a much wider spectrum of physical and financial assets will influence an individual’s demand for money.
226. (e) The monetarism theory conclusion is that an increase in money supply leads to a significant increase in AD, which in turn leads to increase in price level.
227. (e) The hypothesis of rational expectations has three important implications for macroeconomic analysis and policy.
i. Econometric models are not very useful in evaluating alternative economic policies. ii. There is no trade-off between inflation and unemployment. 228. (a) Discretionary monetary and fiscal policy cannot be used to stabilize the economy. The rational expectations theory suggests that individuals do not make systematic forecasting
errors and that their guesses about future are on an average correct. 229. (e) Supply side economics advocates to reduce government controls, to promote competition, to
restrict the power of trade unions and to remove institutional barriers. Supply side economics does not recommend to increasing corporate tax rate.
(a) Is not the answer because supply side economics recommend reducing government controls to improve market efficiency.
(b) Is not the answer because supply side economics recommend promoting competition to improve market efficiency.
(c) Is not the answer because supply side economics recommend restricting the power of trade unions to improve market efficiency.
(d) Is not the answer because supply side economics recommend removing institutional barriers to improve market efficiency.
(e) Is the answer because supply side economics does not recommend increasing corporate tax rate to improve market efficiency.
230. (d) The Laffer curve depicts the relationship between tax revenues and tax rates. The shape of
the Laffer curve is backward bending indicating that tax revenues initially increase and then decrease as the tax rate increases.
(a) Is not the answer because according to Laffer curve, tax revenues do not rise continuously as the tax rate increases.
(b) Is not the answer because tax revenues do not decrease continuously as the tax rate increases.
(c) Is not the answer because tax revenues do not decrease initially and then increase as the tax rate increases.
(d) Is the answer because tax revenues increase initially and then decrease as the tax rate increases.
(e) Is not the answer because tax revenues do not remain constant as the tax rate increases. 231. (b) According to rational expectations school, discretionary monetary and fiscal policy cannot be
used to stabilize the economy. Proponents of rational expectation argue that consumers and business firms anticipate the implications of rise in government spending. Moneywage rate and prices will rise, but output and employment will remain the same. So government can no longer fool the people by increasing its spending during elections years. So the answer is (b).
84
© 2004
The Ic
fai U
nivers
ity P
ress.A
ll righ
ts res
erved
.ISBN : 8
1-314
-0227
-4 Ref.
No.
MACWB 04
2004
04
Part I
232. (e) Monetarist opines that demand function for money is better determined than consumption or investment function and hence they prefer monetary policy over fiscal policy. Fiscal policy is ineffective because increase in public expenditure leads to decrease private expenditure. (Crowding out)
a. Above reasons shows that option a is true. b. Not true, as this is also a Keynesian proposition . c. Not true, as it is Keynesian economics which says so and hence demand for money is
determined by interest rate. d. ‘Crowding out’ is one of the important reasons for ineffectiveness of fiscal policy and
hence true. e. Since, (a) and (d) are true, this is the correct option. 233. (b) a. School of rational expectation is based on the premise that people do not make
systematic forecasting errors. On an average their views about the future are correct and not biased as they behave rationality. Hence the option is wrong.
b. Whenever central bank increases the money supply, according to rational expectations theory, people realize that it is the cause of inflation. According workers and business firms adjust wages and prices in response to the changes in money supply. Hence any change in money supply only affects wages and prices. Hence this option is true as only wages and prices are affected and not employment.
c. Since the people are assumed to behave rationally, any attempt by the monetary authorities to increase employment will be anticipated by the firms. They accordingly changes prices and wages. Hence wages are flexible and not rigid. Hence the option is not true.
Business men anticipate the changes in money supply (which is the primary cause for inflation) and as they are rational, change prices accordingly. The price are flexible and not rigid. Hence the option is not true.
Since (c) and (d) are not correct options, (e) cannot be the answer. 234. (b) a. The Laffer curve gives the relationship between tax revenues and tax rates. Hence not
correct option. b. Philips curve depicts the relationship between the rate of change in price and the rate of
unemployment. c. Aggregate supply curve gives the relationship between net national product that would
be supplied at general price level given constant expectations. d. The LM curve signifies the money supply. So this option is not right e. The IS curve shows that combination of interest rates and levels of output such that
planned spending equals income. Hence not true option. Economic Fluctuations, Unemployment and Inflation 235. (d) Bank reserves increase rapidly in boom period; suffer a set back in recession and fall
rapidly during depression. 236. (a) Frictional unemployment is the unemployment caused by constant changes in the labor
market. 237. (c) Unemployment that arises when there is general downturn in business activity is known
as cyclical unemployment. 238. (d) Full employment is defined as the level of employment that results when the rate of
unemployment is normal. 239. (e) Natural rate of unemployment is influenced by the structure of workforce and by the
changes in public policy. The natural rate of unemployment increases when youthful workers comprise a large proportion of the workforce because they change jobs and move in and out of the employment often.
85
© 2004
The Ic
fai U
nivers
ity P
ress.A
ll righ
ts res
erved
.ISBN : 8
1-314
-0227
-4 Ref.
No.
MACWB 04
2004
04
Macroeconomics
240. (e) When the actual rate of unemployment exceeds the natural rate of unemployment the actual output of the economy will fall below its potential and consumption of goods decreases.
241. (b) Unemployment that arises due to structural changes in the economy is called structural unemployment. This arises when the regional or occupational pattern of job vacancies does not match the pattern of workers availability and suitability.
242. (d) Inventory stocks will be very little in boom period whereas the stock levels will be very high during depression. The reason is that during boom (recession) the consumption will be high (low).
243. (d) Disguised unemployment refers to a situation where more than the required number of people are visibly occupied in some work contributing nothing to the output.
244. (c) In developing countries like India there is wide spread disguised unemployment in agricultural sector.
245. (e) Stagflation is a period characterized by high inflation and high unemployment levels. 246. (c) Real interest rate is the nominal rate of interest ‘minus’ the expected rate of inflation. 247. (d) Unemployment that arises due to structural changes in the economy is called structural
unemployment. This arises when the regional or occupational pattern of job vacancies does not match the pattern of workers availability and suitability.
248. (b) During recessionary phase of business cycle the rate of unemployment increases rapidly due to increasing reduction in consumption.
249. (a) Monetarists believe in the use of a stable growth rate for the money supply for the economic development.
250. (c) Philips curve shows the relationship between inflation rate and unemployment rate. Philips curve indicates an inverse relationship between the rate of inflation and unemployment.
251. (e) Bottlenecks refer to the obstacles in reaching full employment in the economy. Both (b) and (c) act against achieving full employment.
252. (c) In the business cycles theory, after a business peak or boom, the economy enters contraction
stage. The sales of most businesses fall and real GNP of an economy grows at a slow pace. There is a large number of unemployment in the labor market. This phase is otherwise known as recession.
(a) Is not the answer because the inventory stock increases gradually in recession. (b) Is not the answer because business expectation will be pessimistic with cautious
decision-making. (c) Is the answer because there is an underutilization of existing capacity in the economy. (d) Is not the answer because bank credit starts falling in the recession phase of business
cycle. (e) Is not the answer because there is a decline in the income levels of the people. 253. (e) Inflation is a serious problem on the part of the government worldwide. The effect of
inflation is ranging from redistribution of income and wealth of the society to the worsening the balance of payments position of the country.
(a) It is true statement that unanticipated inflation hurts the fixed income earners most. Though their monetary income is constant, real income is reduced because of inflation.
(b) It is true statement that higher than expected inflation hurts creditors but benefits debtors. Debtors repay the amount, which is fixed in nominal terms. The real values of repayments in the future will decrease with an increase in inflation, leads to an increase in the wealth of the debtors. On the other hand, the wealth of the creditors will decrease with an increase in the rate of inflation.
(c) It is a true statement that inflation creates inefficiency in the economy because people spent lot of time to find a reasonable price.
86
© 2004
The Ic
fai U
nivers
ity P
ress.A
ll righ
ts res
erved
.ISBN : 8
1-314
-0227
-4 Ref.
No.
MACWB 04
2004
04
Part I
(d) It is a true statement that inflation can lead to a misallocation of resources because inflation misleads people to invest logically.
(e) Is the answer because all the above statements are correct.
254. (e) In case of stagflation, there is stagnation as well as inflation exists in the economy. There is a slowing down of economic activities occurs.
(a) Is not the answer because deflation refers to a situation in which there is a decrease in general level of prices in an economy that is sustained over a period of time
(b) Is not the answer because in the case of hyperinflation, price rise is very large and accelerating.
(c) Is not the answer because recession is characterized by the downturn in economic activities in an economy.
(d) Is not the answer because there is a contraction of economic activities in the depression period.
(e) Is the answer because there is a stagnation combined with inflation prevails in the economy in the period of stagflation.
255. (c) The periodic upswings and down swings in the level of economic activity which forms a regular pattern with an expansion of activity followed by a contraction ,succeded by further expansion are referred to as business cycles. Each of the phases is characterized by certain features.
a. Mere existence of unemployment cannot be taken as an indicator of recession or depression, as in a country like India, even though the economy is growing these is unemployment. Hence not true.
b. Price levels are only an indicator of purchasing power, which in turn is dependent on income levels of the people also. Hence cannot be taken as primarily indicator of the different phases of business cycles.
c. By definition, a business cycle is a swing in total national output, income and employment market by contraction or expansion in many sectors of the economy changes in real GNP brings changes in prices, employment. Hence only the basis of changes in real GDP different phases are classified. Hence real GDP is the correct option.
d. Changes in inventory level do give an indication about the different phases, but the changes inventory level are as a result of changes in real GDP.
e. Gross investment is dependent on future growth rate, which again based on estimation of real GDP in future. Hence gross investment cannot be primarily indicator.
256. (a) Stagflation refers to a situation where there is high unemployment and high inflation occurs simultaneously.
Statement (i) is true as stagflation refers to coexistence of stagnant output and high inflation.
Statement (ii) is false because during stagflation, there is no increase in output and hence the output is stagnant. Therefore real GDP is not growing.
Statement (iii) is true because during stagflation, the output is stagnant, new employment opportunities are not created and hence unemployment level is high.
Statement (iv) is false as the price are high and there is unemployment, the aggregate demand tends to be low.
So the answer is (a).
257. (b) a. Zero unemployment refers to situation where there is no unemployment
87
© 2004
The Ic
fai U
nivers
ity P
ress.A
ll righ
ts res
erved
.ISBN : 8
1-314
-0227
-4 Ref.
No.
MACWB 04
2004
04
Macroeconomics
b. Natural rate of unemployment is the long run average of unemployment caused due to frictional and structural changes in labour market. Full employment means that there is certain amount of unemployment which is refered to as natural rate of unemployment.
Hence the correct option. c. During full employment, there still exists certain amount of unemployment and hence
cannot say that demand for labor is at the lowest . Hence not correct option. d. Supply of labor depends on population and has no relation with full employment. Hence
the option is not correct. e. Since (c) and (d) are not correct options, this is not true option. 258. (c) a. Frictional unemployment occurs when constant changes in the labour market lead to
unemployment. It occurs on account of imperfect information. Hence not correct option. b. Unemployment that arises due to general down turn in business activity is refered to as
cyclical unemployment. Hence not related to the output, not the correct option. c. Disguised unemployment occurs due to excess labour force depending on agriculture
sector. Some laborers are employed, but their contribution to production is zero. Hence the correct option.
d. Structural unemployment occurs due to structural changes in the economy, and such people are not employed and hence there is no question of contribution to production. Not correct option.
e. Sectoral unemployment refers to unemployment that exists in any particular sector, for example agricultural sector. Hence not correct option.
259. (c) Cost-push inflation refers to increase in price as a result of the causes originating from the supply side. The left ward shift of the supply curve occurs as a result of increase in the wage level unmatched by the increase in the labour productivity, increase in the profit margins by those who can exercise the market power and supply shocks.
a. Decrease in wages leads to decrease in cost of production and hence prices will reduce if the producer passes on to the consumer.
b. When the productivity of labour increase it leads to lowering the cost of production per unit and hence the prices will decrease.
c. As the cost of raw material increases it leads to increase in cost of production which results in increases in prices. Hence this option is correct.
d. Right ward shift in the supply curve occurs when there is a decrease in prices and hence not the correct option.
e. Finding of new raw material would lead to lower cost of raw material as the supply of raw material has increased and hence lowers the prices.
260. (a) a. Recessionary GDP gap signifies higher potential real GDP compared to realized real
GDP. b. Hyper inflationary situation refers to price rise is very large and accelerating. This
occurs when aggregate demand is more than aggregate supply. In case of recessionary GDP gap, prices are falling. Hence not correct option.
c. When these is necessionary GDP gap, it leads to realized GDP falling short of potential GDP. Hence during prices will be falling and unemployment rate would increase. But there will be high unemployment, which occurs only during depression.
d. Natural rate of unemployment occurs when potential GDP is equal to realized GDP. Which is not the case when there is recessionary GDP gap. Hence not the correct option.
e. Since (b) and (d) are not correct, this is not correct option.
88
© 2004
The Ic
fai U
nivers
ity P
ress.A
ll righ
ts res
erved
.ISBN : 8
1-314
-0227
-4 Ref.
No.
MACWB 04
2004
04
Part I
The Open Economy and Balance of Payments: India’s Balance of Payments 261. (b) The trade balance is the difference between merchandize exports and imports. 262. (d) The balance of payments always balances, therefore all entries in the BoP should sum to
zero. 263. (a) The current account records all transactions in merchandize and invisibles of the country
with the rest of the world. 264. (d) Inventories of foreign countries and gold that could be sold for dollars are held under the
official reserves account by central bank that they would sell in the market when there is an excess demand for dollars. Conversely when there is excess supply of dollars they would buy up the dollars.
265. (a) The current account records all transactions in merchandize and invisible with the rest of the world. If the BoP on current account is deficit, it implies that imports of goods and services are more than that of exports.
266. (b) If a foreign supplier sells the goods in the domestic market at a price less than that of the goods supplied by the domestic supplier, it is called dumping.
267. (a) The items included under the invisibles of the current account are investment income, travel, transportation, insurance, and other miscellaneous items.
268. (d) Transfer of assets or goods to a country without any consideration or return are called international transfers.
269. (c) BoP is in deficit when both current account and capital account balances are in deficit. 270. (a) When current account balance is not balanced by the capital account surplus the foreign
exchange reserves will decline and it causes a contraction in the money supply. 271. (c) Receipts in cash or kind without a quid pro quo are called transfer of payments, i.e. they
are made for no return service, i.e. unilateral. 272. (b) The foreign exchange reserves of a country apart from serving to balance the BoP
statement of an economy have a strong impact on the monetary policy pursued by the central bank in the domestic sector. When foreign exchange reserves contracts, the money supply in the economy decreases.
273. (d) Dividends earned on portfolio investments come under the head of invisibles in current account, whereas the other options given come under the capital account of the BoP.
274. (d) Preparation of BoP statement is based on double-entry system of book keeping. Hence, all debt items should equal credit items, and the balance is zero.
a. Is not the answer because all entries in the balance of payments statement is not collectively sum to GDP of the country.
b. Is not the answer because all entries in the balance of payments statement is not collectively sum to GNP of the country
c. Is not the answer because all entries in the balance of payments statement is not collectively sum to Foreign exchange reserves of the country
d. Is the answer because all entries in the balance of payments statement is collectively sum to zero.
e Is not the answer because all entries in the balance of payments statement is not collectively sum to Exports of the country.
275. (d) All the transactions which effect the asset or liability position of a country are put under Capital account of the Balance of Payments statement. Other transactions are put under the Current account.
a. Is not the answer. Foreign Direct Investment increase the liability of a country, hence falls under Capital Account.
b. Is not the answer. Portfolio Investments increase the liability of a country, hence falls under Capital Account.
89
© 2004
The Ic
fai U
nivers
ity P
ress.A
ll righ
ts res
erved
.ISBN : 8
1-314
-0227
-4 Ref.
No.
MACWB 04
2004
04
Macroeconomics
c. Is not the answer. External Commercial Borrowings increase the liability of a country, hence falls under Capital Account.
d. Is the answer. Dividends on portfolio investments are an income earned by a factor of production (capital). This is included in Income under Invisibles in Current Account.
e Is not the answer. External Assistance increases the liability of a country, hence falls under Capital Account.
Modern Macroeconomics: Fiscal Policy, Budget Deficits and the Government Debt 276. (a) The tax and expenditure policies together constitute the fiscal policy of the government.
Customs duty is an instrument of fiscal policy. 277. (c) The increase in net RBI credit to the central government, comprising the net increase in
the holdings of treasury bills of the RBI and its contribution to the market borrowings of the government is called monetized deficit.
278. (e) The major components of non-plan expenditure are: a. interest payments b. defense expenditure c. subsidies. 279. (d) Primary deficit is calculated by deducting interest payments of the government from the
gross fiscal deficit. 280. (a) Apart from the tax revenue the other important areas of resource mobilization for the
government are non-tax revenues which include profits from PSUs. 281. (e) Large fiscal deficits will have implications upon money supply, growth, inflation and for
the access to resources for private investment. 282. (c) SLR refers to the minimum percentage of the total liquid assets that banks have to
maintain with themselves. Fiscal deficit is obtained when total receipts excluding government borrowings are subtracted from total expenditure. So change in SLR has no effect on fiscal deficit.
283. (e) Monetized deficit is the increase in net RBI credit to the Central Government, comprising the net increase in the holdings of Treasury Bills of the RBI and the contribution to the market borrowings of the Government.
284. (e) Self-explanatory. 285. (e) Gross fiscal deficit is computed by deducting total receipts excluding government
borrowings from the total expenditure. 286. (b) Mandatory wage price guidelines maintain the full employment and keep the inflation
under control. 287. (c) Primary deficit = Fiscal deficit – Interest payment. 288. (a) Y = C + I + G + X Y = a + b(Yd) + I + G + X Where Yd = Y – T and T = tY Thus, an increase in taxes decreases the income. But an equal increase in government
expenditure increases the income greatly because of multiplier effect. So GDP increases. 289. (b) An increase in savings will not make any changes in current output. 290. (a) Installing a progressive income tax would have no effect on the Keynesian multiplier. 291. (e) Equilibrium income will increase by the amount of increase in government expenditure if
the multiplier is one. So MPC is equal to the investment income ratio. 292. (a) When the government spending increases and/or the tax rate decreases, an increase in the
aggregate demand (AD) takes place, which in turn leads to increase in the equilibrium real GDP.
90
© 2004
The Ic
fai U
nivers
ity P
ress.A
ll righ
ts res
erved
.ISBN : 8
1-314
-0227
-4 Ref.
No.
MACWB 04
2004
04
Part I
293. (d) Government borrowing to finance large deficits increases the demand for loanable funds, which puts an upward pressure on interest rates in the market.
294. (b) If somebody buys National Small Saving Certificate, it increases in the other liabilities of the
government. (a) Is not the answer because if Mr.X buys a National Small Saving Certificate, it will not
increase government borrowings. (b) Is the answer because if Mr.X buys a National Small Saving Certificate, it will increase
in the other liabilities of the government. (c) Is not the answer because if Mr.X buys a National Small Saving Certificate, it will not
increase in forex reserves. (d) Is not the answer because if Mr.X buys a National Small Saving Certificate, it will not
increase government revenue. (e) Is not the answer because if Mr.X buys a National Small Saving Certificate, it will not
decrease government liability. 295. (c) Every economy goes through cyclical fluctuations in output, employment and prices. This
will have an automatic impact on certain government expenditures and revenues. The changes in the government spending and revenues that results automatically as the economy fluctuates are called non-discretionary fiscal policy. Automatic stabilizers are features of the government budget that automatically adjust net taxes to stabilize aggregate demand as the economy expands or contracts.
(a) Is not the answer because an automatic stabilizer is not a mechanism in the stock market that automatically cause stock market gains to be cancelled out by losses.
(b) Is not the answer because automatic stabilizer is not the invisible hand mechanisms, which automatically bring the economy out of a recession.
(c) Is the answer because automatic stabilizer refers to government revenues and expenditures that change automatically in response to changes in economic activity. When the economy is in a contraction phase, these stabilizers increase transfer payments and reduce tax collections in order to stimulate aggregate demand. On the other hand, when the economy begins to expand, the automatic stabilizers increase tax collections and reduce transfer payments in order to restrain growth in the aggregate demand.
(d) Is not the answer because automatic stabilizer is a discretionary fiscal policy. 296. (a) Fiscal policy refers to policies dealing with taxes and government expenditure including
transfer payments. (a) Is the answer because when the government reduces taxes or raises spending to get the
economy out of a recession, is a case of fiscal policy measure. (b) Is not the answer because when the central bank changes the money supply to affect the
price level, interest rates and exchange rate , it is a monetary policy. (c) Is not the answer because when the government restricts imports and stimulates exports;
it is a case of EXIM (Export-Import) policy. (d) Is not the answer because both (a) and (b) cannot be the answer. (e) Is not the answer because both (a) and (c) cannot be the answer.
91
© 2004
The Ic
fai U
nivers
ity P
ress.A
ll righ
ts res
erved
.ISBN : 8
1-314
-0227
-4 Ref.
No.
MACWB 04
2004
04
Macroeconomics
297. (a) When the government monetizes part of its deficit, it is an increase in net RBI credit to the
government, comprising the net increase in the holdings of treasury bills of the RBI and its contribution to the market borrowings of the government. To meet the needs of the government, the RBI prints more money. This will lead to excess money supply in the economy.
(a) Is the answer because money supply in the economy increases when the government monetizes part of its deficit.
(b) Is not the answer because when there is an excess money supply, interest rate will decline.
(c) Is not the answer because when the government monetizes part of its deficit, primary deficit will decrease. Primary deficit is calculated by deducting the interest payments of the government from the gross fiscal deficit.
(d) Is not the answer because when the government monetizes part of its deficit, public debt will decrease.
(e) Is not the answer because when the government monetizes part of its deficit, revenue deficit will increase. Revenue deficit is the difference between government’s revenue expenditure and revenue receipts.
298. (e) If a government has a surplus budget, and the government repays its past debts using its
surplus budget, public debt will be falling. (a) Is not the answer because if a government is running surplus in its budget, public debt
may not be rising. (b) Is not the answer because if a government is running surplus in its budget, public debt
may not be falling. (c) Is not the answer because if a government is running surplus in its budget, public debt
may not be constant. (d) Is not the answer because if a government is running surplus in its budget, public debt
may not be falling if there are tax cuts. (e) Is the answer because if a government is running surplus in its budget, public debt will
be falling if the government uses the surplus to repay its past debts. 299. (b) In India, personal taxes is an example of progressive tax system. Progressive tax system
implies that higher the level of income, higher will be the volume of tax burden, represented as a percentage of the total income.
(a) Is not the answer because personal tax is not a proportional tax system. In proportional tax systems, the tax imposed is of a particular percent of income irrespective of his income level.
(b) Is the answer because personal taxes is an example of progressive tax system. (c) Is not the answer because personal tax is not a direct tax system. (d) Is not the answer because personal tax is not a value added tax system. In value added
tax system, the tax is on the value added at each stage. (e) Is not the answer because personal tax is not a regressive tax system. In regressive tax
system, people with lower levels of income are imposed with higher taxes as a proportion of their income.
300. (c) Monetized deficit refers to increase in net RBI credit to the Central Government, comprising the net increase in the holdings of T-bills of the RBI and its contribution to the market borrowings of the government. Fiscal deficit = Borrowings and liabilities of the Central Government and primary deficit = Fiscal deficit – interest payments.
a. Is not the answer because monetized deficit does not refer fiscal deficit minus interest payments.
92
© 2004
The Ic
fai U
nivers
ity P
ress.A
ll righ
ts res
erved
.ISBN : 8
1-314
-0227
-4 Ref.
No.
MACWB 04
2004
04
Part I
b. Is not the answer because monetized deficit does not refer borrowings and other liabilities of the Central Government.
c. Is the answer because monetized deficit refers Increase in the net RBI credit to the Central Government.
d. Is not the answer because monetized deficit does not refer fiscal deficit minus Primary deficit.
e. Is not the answer because monetized deficit does not refer RBI’s credit to the commercial banks.
301. (a) Government gets its revenue from two sources, i.e. tax revenue and non-tax revenue. Non-tax revenue includes profits from public sector units, interest earned on loans etc.
a. Current year receipts of the government are classified under revenue receipts. Profits from public sector units re the returns on investments by the government. Hence it represents current income and hence part of revenue receipts of the government.
b. Capital receipts refer to recovery of loans, borrowing and other liabilities. It does not include current earnings of the government from public sector units. Hence profits are not included.
c. Monetized receipts. d. Planned expenditure refers to the outflow from the government, as the government is
spending money. Whereas in case of profits from public sector units they are inflows, hence cannot be part of planned expenditure.
e. Fiscal deficit measures the overall borrowings required to finance government expenditure. Hence profits are taken as part of fiscal deficit.
302. (b) a. Progressive tax system refers to imposing more tax on people with greater income. As
income increases, tax rate also increases. Hence more tax is imposed on higher income people. This option is not true
b. When more tax is imposed on lower income groups it is called regressive tax. d. When tax imposed is of a particular percent of income irrespective of his income slab, is
known as proportional tax. Hence a poor person pays less tax as his income is less. Hence not correct option.
d, e Customs and value added tax are indirect taxes, where as what is referred to under the is with respect to the direct tax i.e. income tax. Hence cannot be correct answer.
303. (a) Automatic stabilizers are features of the government budget that automatically adjust net taxes to stabilize aggregate demand as the economy expands or contracts.
a. By definition this option is true. b. Lagging indicators refer to the time gap between the monetary policy changes and their
impact on the economy. They are not related to the fiscal policy of the government. c. National Income aggregates are only indicators of the performance of the economy. d , e. Real factors and growth variables are not related to fiscal policy.
Modern Macroeconomics: Monetary Policy and Interest Rate Structure 304. (c) A reduction in the reserve ratio by the Central Bank enables the commercial banks to lend
more money, which lead to an increase in money supply in the economy. 305. (b) To regulate the credit creating capacity of the commercial banks, the central bank
undertakes open market operations. An open market purchase (sale) is expansionary (contractionary) in its effect from the point of view of credit creation.
306. (d) Loose monetary policy increases the money supply. Due to increased money supply in the market, the interest rates will come down in the short run.
307. (d) Open market purchase causes more money to come into the circulation and thereby increases the money supply. This in turn bring downs interest rates in the market.
93
© 2004
The Ic
fai U
nivers
ity P
ress.A
ll righ
ts res
erved
.ISBN : 8
1-314
-0227
-4 Ref.
No.
MACWB 04
2004
04
Macroeconomics
308. (a) Sale of government securities in the open market reduces the money supply, which in turn brings down inflation in the economy.
309. (c) Contractionary policies are aimed at reducing money supply in the economy. Increasing the refinance limits is an expansionary policy, as it increases money supply in the market.
310. (c) The acts of Central Bank aimed at correcting the imbalances created by changes in foreign exchange reserves is referred to as ‘sterilization’. If RBI wants to sterilize the inflow of foreign exchange, it would conduct an open market sale of securities, which helps in reducing the increased money supply in the economy.
311. (e) The excess of Gross Domestic Capital formation over Gross Domestic Savings is financed by borrowing from the rest of the world. This shows a current account deficit in the balance of payments. Thus
GDCF = GDS + Deficit on Current a/c Current a/c deficit = 3,500 – 3,000 = 200 Alternatively, GDCF = GDS + Foreign savings (in the form of foreign investment).
Therefore, foreign savings inflow is equal to 200. Trade and Exchange Rate Policies 312. (a) Trade policy of any country which has trade relations with other countries constitutes
both import policy and export policy. While the former tries to reduce the expenditure on imports, the latter aims at increasing the export earnings.
313. (d) Only commercial banks will be authorized to trade in foreign currencies. Permitted commercial banks act as foreign currency dealers and are regulated by FEDAI.
314. (a) In an economy, the high-powered money is the aggregate of monetary liabilities of the central bank and government money. The foreign exchange reserves are the asset of the central bank. When the foreign exchange reserves increases, the monetary liabilities also increase. This in turn increases the high-powered money in the economy and thereby the money supply. If the economy is already affected by inflation, the central bank must step in to curb this expansion of money supply by either contracting its lending its lending to the banking systems (by increasing the discount rate) or by open market operations (sale of government securities) or by increasing the cash reserve ratios of the commercial bank.
(a) Is the answer because the Reserve Bank of India increase CRR to correct the imbalances created by changes in foreign exchange reserve.
(b) Is not the answer because RBI would not decrease CRR. It will not help in correcting the imbalances created by changes in foreign exchange reserve.
(c) Is not the answer because due to increase in foreign exchange reserves, RBI increases the discount rate.
(d) Is not the answer because RBI checks the expansion of money supply by open market operations, i.e. sale of government securities.
315. (d) An expansionary fiscal policy shifts the IS curve to the right. And a liberal monetary plicy
shifts the LM curve to the right. It will result in a higher level of output, but the level of interest rate is dependent on the relative magnitude of fiscal and monetary policies
a. Is not the answer, because an expansionary fiscal policy combined with a liberal monetary policy does not result in a lower level of output and a lower interest rate.
b. Is not the answer because an expansionary fiscal policy combined with a liberal monetary policy does not result in a lower level of output and a higher interest rate.
c. Is not the answer because an expansionary fiscal policy combined with a liberal monetary policy results in a higher level of output but not a lower interest rate.
d. Is not the answer because an expansionary fiscal policy combined with a liberal monetary policy results in a higher level of output but we cannot say that it results in a higher interest rate.
e. Is the answer because an expansionary fiscal policy combined with a liberal monetary policy result in higher level of output, but the level of output, but the level of interest rate is dependent on the relative magnitude of fiscal and monetary policies.
94
© 2004
The Ic
fai U
nivers
ity P
ress.A
ll righ
ts res
erved
.ISBN : 8
1-314
-0227
-4 Ref.
No.
MACWB 04
2004
04
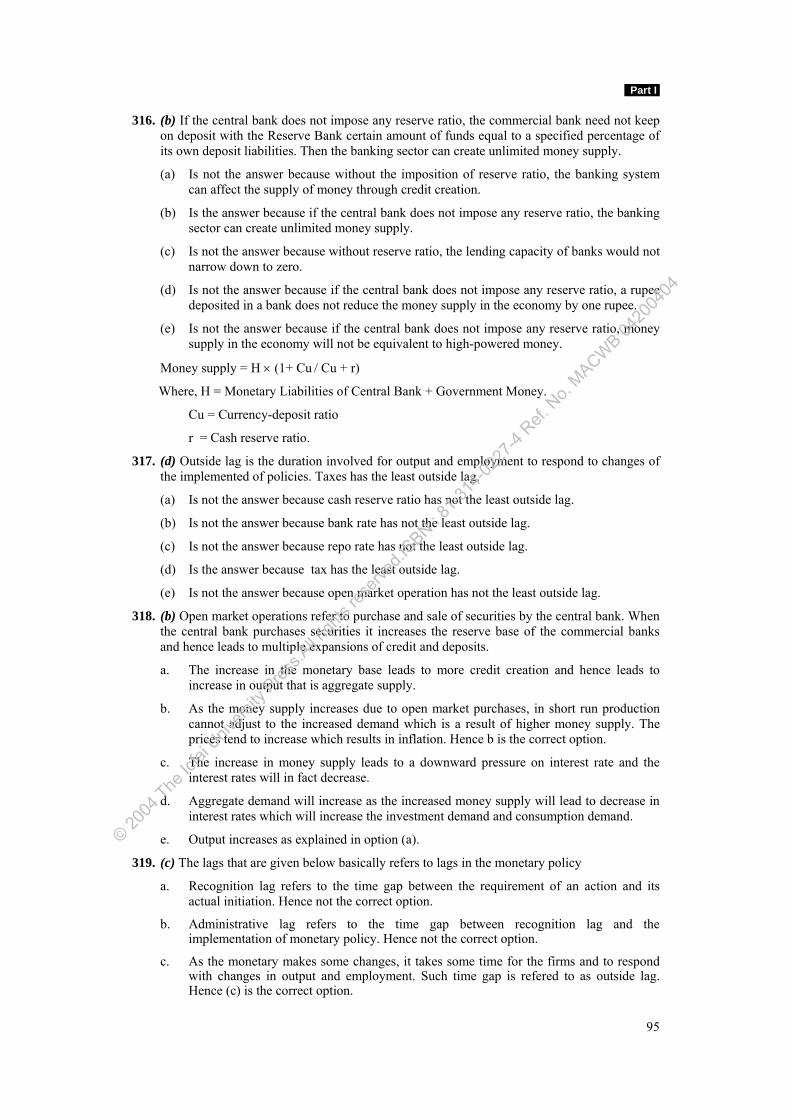
Part I
316. (b) If the central bank does not impose any reserve ratio, the commercial bank need not keep on deposit with the Reserve Bank certain amount of funds equal to a specified percentage of its own deposit liabilities. Then the banking sector can create unlimited money supply.
(a) Is not the answer because without the imposition of reserve ratio, the banking system can affect the supply of money through credit creation.
(b) Is the answer because if the central bank does not impose any reserve ratio, the banking sector can create unlimited money supply.
(c) Is not the answer because without reserve ratio, the lending capacity of banks would not narrow down to zero.
(d) Is not the answer because if the central bank does not impose any reserve ratio, a rupee deposited in a bank does not reduce the money supply in the economy by one rupee.
(e) Is not the answer because if the central bank does not impose any reserve ratio, money supply in the economy will not be equivalent to high-powered money.
Money supply = H × (1+ Cu / Cu + r)
Where, H = Monetary Liabilities of Central Bank + Government Money.
Cu = Currency-deposit ratio
r = Cash reserve ratio.
317. (d) Outside lag is the duration involved for output and employment to respond to changes of the implemented of policies. Taxes has the least outside lag.
(a) Is not the answer because cash reserve ratio has not the least outside lag.
(b) Is not the answer because bank rate has not the least outside lag.
(c) Is not the answer because repo rate has not the least outside lag.
(d) Is the answer because tax has the least outside lag.
(e) Is not the answer because open market operation has not the least outside lag.
318. (b) Open market operations refer to purchase and sale of securities by the central bank. When the central bank purchases securities it increases the reserve base of the commercial banks and hence leads to multiple expansions of credit and deposits.
a. The increase in the monetary base leads to more credit creation and hence leads to increase in output that is aggregate supply.
b. As the money supply increases due to open market purchases, in short run production cannot adjust to the increased demand which is a result of higher money supply. The prices tend to increase which results in inflation. Hence b is the correct option.
c. The increase in money supply leads to a downward pressure on interest rate and the interest rates will in fact decrease.
d. Aggregate demand will increase as the increased money supply will lead to decrease in interest rates which will increase the investment demand and consumption demand.
e. Output increases as explained in option (a).
319. (c) The lags that are given below basically refers to lags in the monetary policy
a. Recognition lag refers to the time gap between the requirement of an action and its actual initiation. Hence not the correct option.
b. Administrative lag refers to the time gap between recognition lag and the implementation of monetary policy. Hence not the correct option.
c. As the monetary makes some changes, it takes some time for the firms and to respond with changes in output and employment. Such time gap is refered to as outside lag. Hence (c) is the correct option.
95
© 2004
The Ic
fai U
nivers
ity P
ress.A
ll righ
ts res
erved
.ISBN : 8
1-314
-0227
-4 Ref.
No.
MACWB 04
2004
04
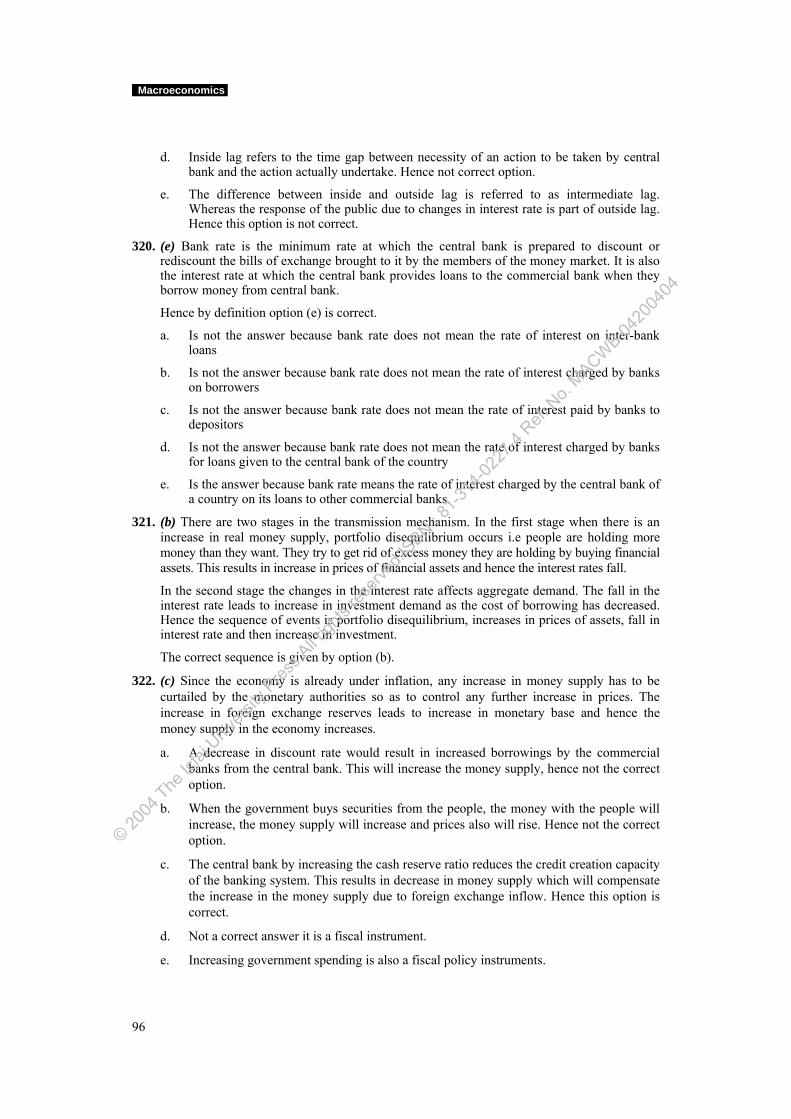
Macroeconomics
d. Inside lag refers to the time gap between necessity of an action to be taken by central
bank and the action actually undertake. Hence not correct option.
e. The difference between inside and outside lag is referred to as intermediate lag. Whereas the response of the public due to changes in interest rate is part of outside lag. Hence this option is not correct.
320. (e) Bank rate is the minimum rate at which the central bank is prepared to discount or rediscount the bills of exchange brought to it by the members of the money market. It is also the interest rate at which the central bank provides loans to the commercial bank when they borrow money from central bank.
Hence by definition option (e) is correct.
a. Is not the answer because bank rate does not mean the rate of interest on inter-bank loans
b. Is not the answer because bank rate does not mean the rate of interest charged by banks on borrowers
c. Is not the answer because bank rate does not mean the rate of interest paid by banks to depositors
d. Is not the answer because bank rate does not mean the rate of interest charged by banks for loans given to the central bank of the country
e. Is the answer because bank rate means the rate of interest charged by the central bank of a country on its loans to other commercial banks.
321. (b) There are two stages in the transmission mechanism. In the first stage when there is an increase in real money supply, portfolio disequilibrium occurs i.e people are holding more money than they want. They try to get rid of excess money they are holding by buying financial assets. This results in increase in prices of financial assets and hence the interest rates fall.
In the second stage the changes in the interest rate affects aggregate demand. The fall in the interest rate leads to increase in investment demand as the cost of borrowing has decreased. Hence the sequence of events is portfolio disequilibrium, increases in prices of assets, fall in interest rate and then increase in investment.
The correct sequence is given by option (b).
322. (c) Since the economy is already under inflation, any increase in money supply has to be curtailed by the monetary authorities so as to control any further increase in prices. The increase in foreign exchange reserves leads to increase in monetary base and hence the money supply in the economy increases.
a. A decrease in discount rate would result in increased borrowings by the commercial banks from the central bank. This will increase the money supply, hence not the correct option.
b. When the government buys securities from the people, the money with the people will increase, the money supply will increase and prices also will rise. Hence not the correct option.
c. The central bank by increasing the cash reserve ratio reduces the credit creation capacity of the banking system. This results in decrease in money supply which will compensate the increase in the money supply due to foreign exchange inflow. Hence this option is correct.
d. Not a correct answer it is a fiscal instrument.
e. Increasing government spending is also a fiscal policy instruments.
96
© 2004
The Ic
fai U
nivers
ity P
ress.A
ll righ
ts res
erved
.ISBN : 8
1-314
-0227
-4 Ref.
No.
MACWB 04
2004
04
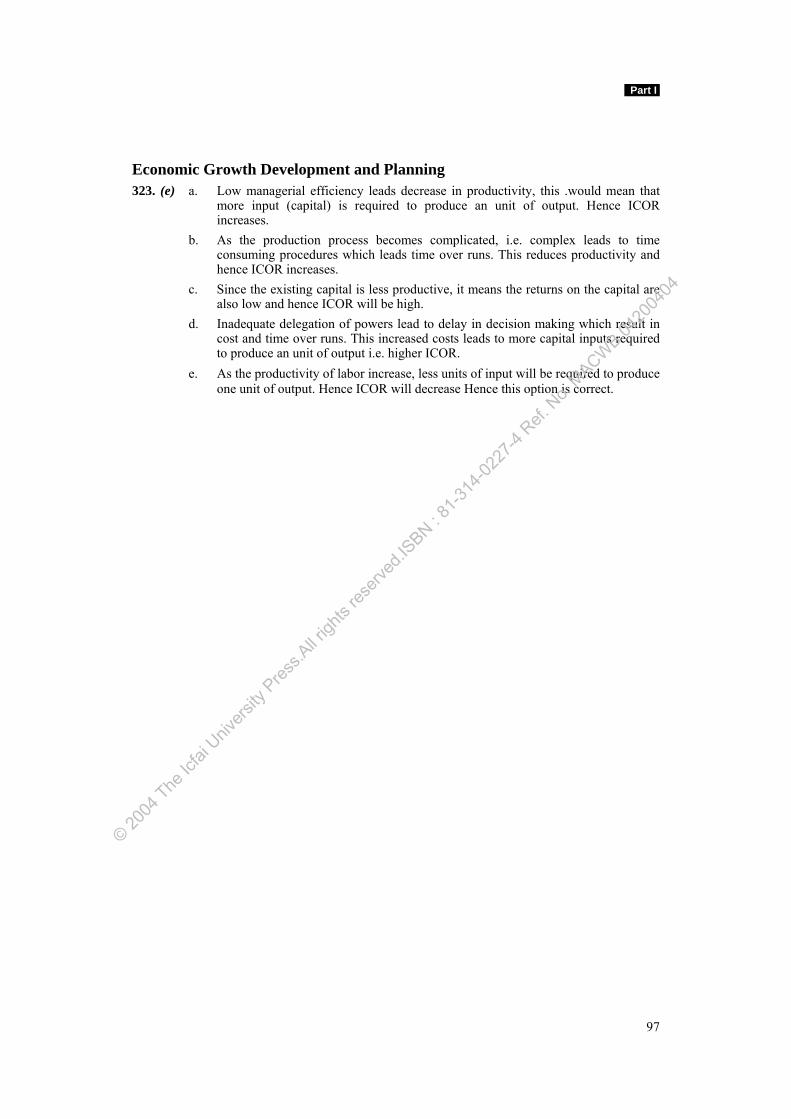
Part I
Economic Growth Development and Planning 323. (e) a. Low managerial efficiency leads decrease in productivity, this .would mean that
more input (capital) is required to produce an unit of output. Hence ICOR increases.
b. As the production process becomes complicated, i.e. complex leads to time consuming procedures which leads time over runs. This reduces productivity and hence ICOR increases.
c. Since the existing capital is less productive, it means the returns on the capital are also low and hence ICOR will be high.
d. Inadequate delegation of powers lead to delay in decision making which result in cost and time over runs. This increased costs leads to more capital inputs required to produce an unit of output i.e. higher ICOR.
e. As the productivity of labor increase, less units of input will be required to produce one unit of output. Hence ICOR will decrease Hence this option is correct.
97
© 2004
The Ic
fai U
nivers
ity P
ress.A
ll righ
ts res
erved
.ISBN : 8
1-314
-0227
-4 Ref.
No.
MACWB 04
2004
04
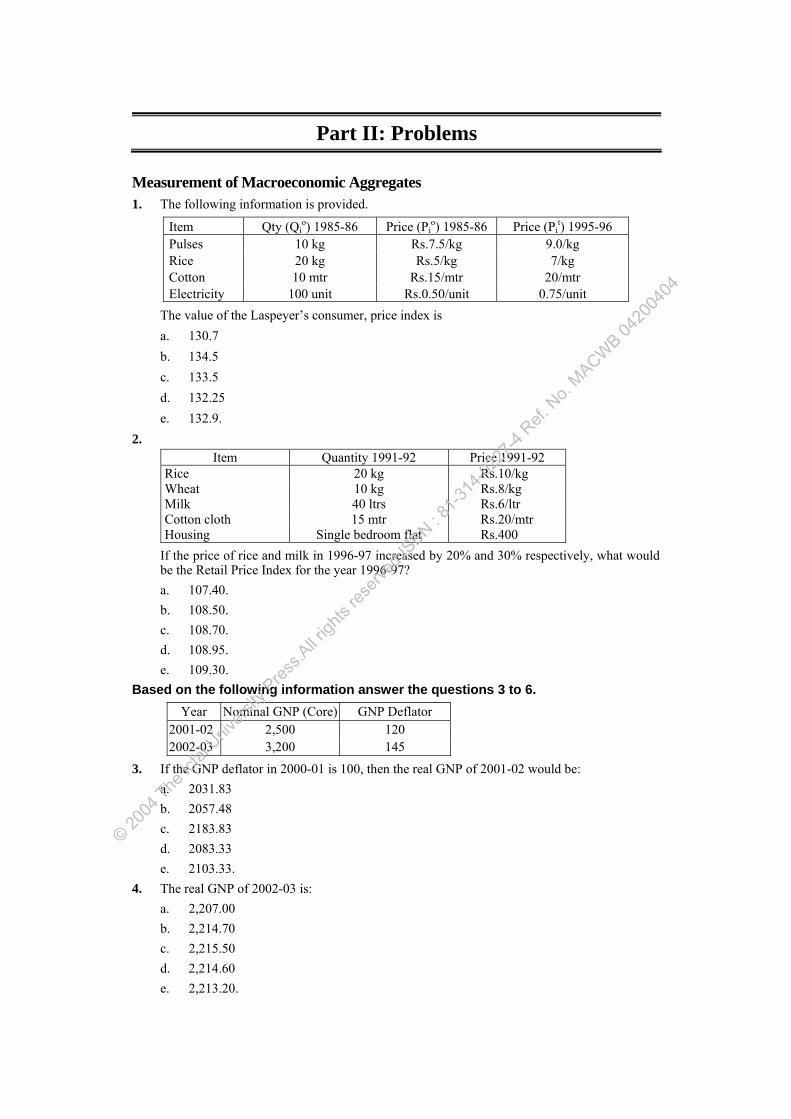
Part II: Problems
Measurement of Macroeconomic Aggregates 1. The following information is provided.
Item Qty (Qio) 1985-86 Price (Pi
o) 1985-86 Price (Pit) 1995-96
Pulses 10 kg Rs.7.5/kg 9.0/kg Rice 20 kg Rs.5/kg 7/kg Cotton 10 mtr Rs.15/mtr 20/mtr Electricity 100 unit Rs.0.50/unit 0.75/unit
The value of the Laspeyer’s consumer, price index is a. 130.7 b. 134.5 c. 133.5 d. 132.25 e. 132.9.
2. Item Quantity 1991-92 Price 1991-92
Rice 20 kg Rs.10/kg Wheat 10 kg Rs.8/kg Milk 40 ltrs Rs.6/ltr Cotton cloth 15 mtr Rs.20/mtr Housing Single bedroom flat Rs.400
If the price of rice and milk in 1996-97 increased by 20% and 30% respectively, what would be the Retail Price Index for the year 1996-97? a. 107.40. b. 108.50. c. 108.70. d. 108.95. e. 109.30.
Based on the following information answer the questions 3 to 6. Year Nominal GNP (Core) GNP Deflator
2001-02 2,500 120 2002-03 3,200 145
3. If the GNP deflator in 2000-01 is 100, then the real GNP of 2001-02 would be: a. 2031.83 b. 2057.48 c. 2183.83 d. 2083.33 e. 2103.33.
4. The real GNP of 2002-03 is: a. 2,207.00 b. 2,214.70 c. 2,215.50 d. 2,214.60 e. 2,213.20.
© 2004
The Ic
fai U
nivers
ity P
ress.A
ll righ
ts res
erved
.ISBN : 8
1-314
-0227
-4 Ref.
No.
MACWB 04
2004
04
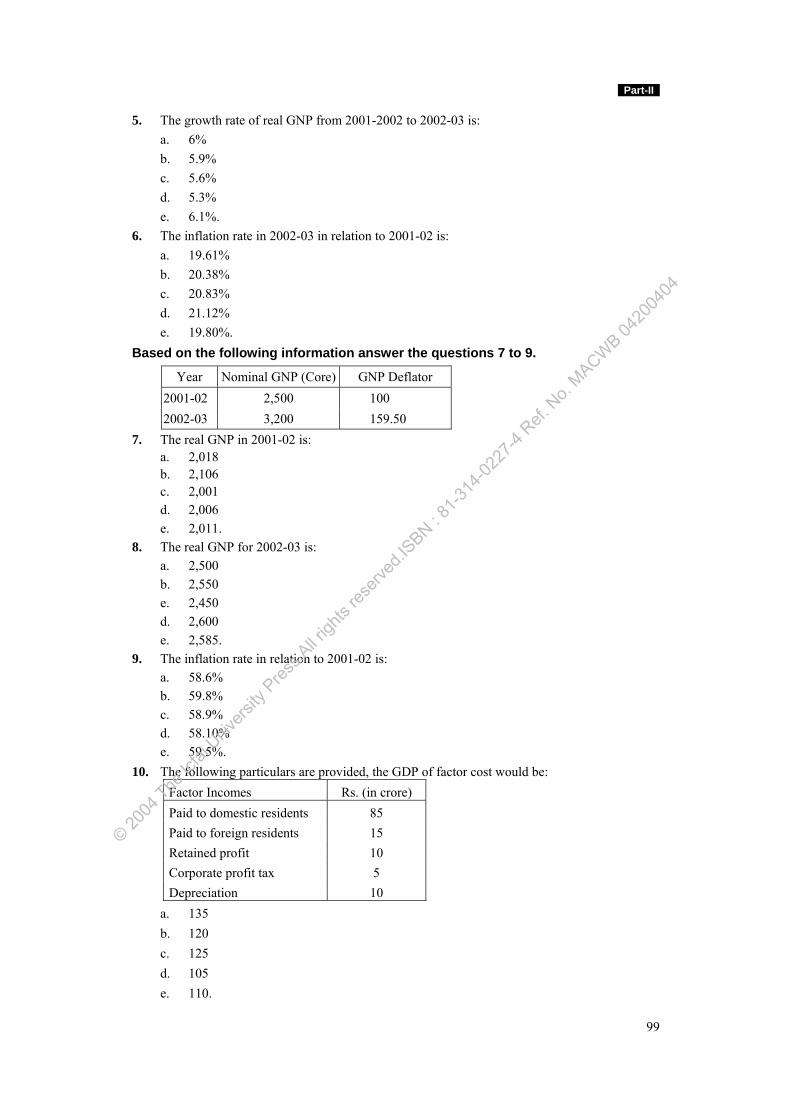
Part-II
99
5. The growth rate of real GNP from 2001-2002 to 2002-03 is: a. 6% b. 5.9% c. 5.6% d. 5.3% e. 6.1%.
6. The inflation rate in 2002-03 in relation to 2001-02 is: a. 19.61% b. 20.38% c. 20.83% d. 21.12% e. 19.80%. Based on the following information answer the questions 7 to 9.
Year Nominal GNP (Core) GNP Deflator 2001-02 2,500 100 2002-03 3,200 159.50
7. The real GNP in 2001-02 is: a. 2,018 b. 2,106 c. 2,001 d. 2,006 e. 2,011. 8. The real GNP for 2002-03 is: a. 2,500 b. 2,550 e. 2,450 d. 2,600 e. 2,585. 9. The inflation rate in relation to 2001-02 is: a. 58.6% b. 59.8% c. 58.9% d. 58.10% e. 59.5%. 10. The following particulars are provided, the GDP of factor cost would be:
Factor Incomes Rs. (in crore) Paid to domestic residents 85 Paid to foreign residents 15 Retained profit 10 Corporate profit tax 5 Depreciation 10
a. 135 b. 120 c. 125 d. 105 e. 110.
© 2004
The Ic
fai U
nivers
ity P
ress.A
ll righ
ts res
erved
.ISBN : 8
1-314
-0227
-4 Ref.
No.
MACWB 04
2004
04
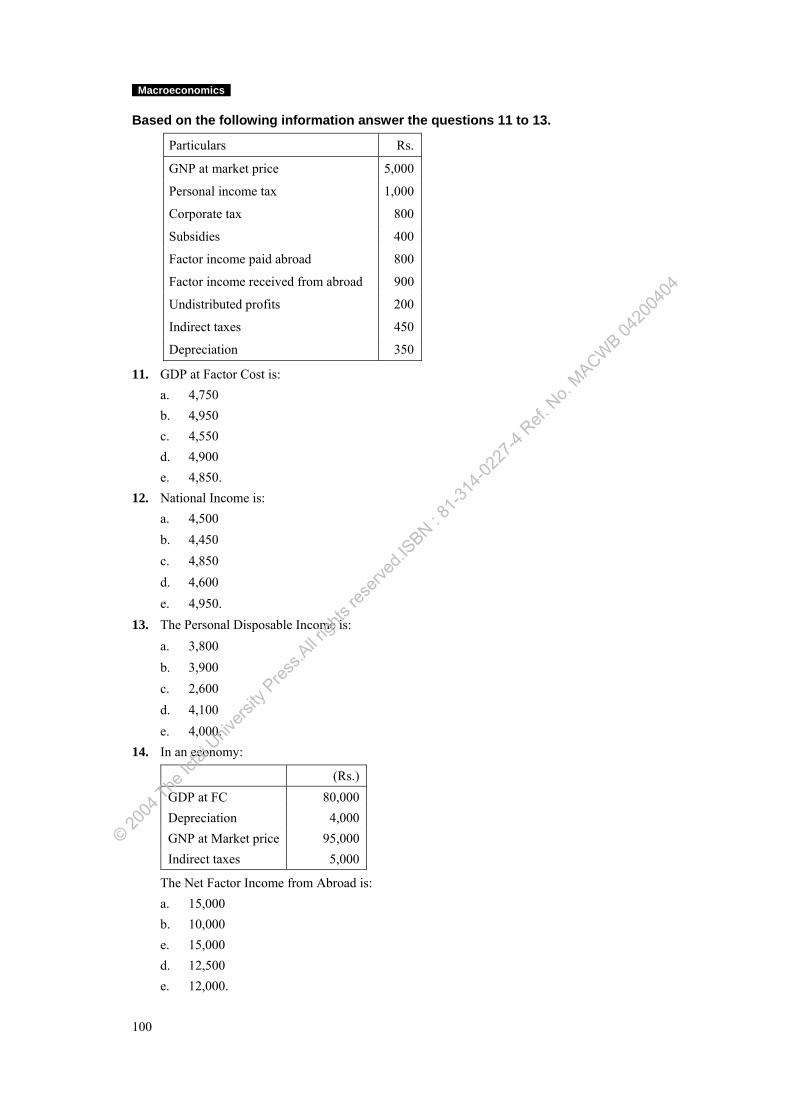
Macroeconomics
100
Based on the following information answer the questions 11 to 13.
Particulars Rs.
GNP at market price 5,000
Personal income tax 1,000
Corporate tax 800
Subsidies 400
Factor income paid abroad 800
Factor income received from abroad 900
Undistributed profits 200
Indirect taxes 450
Depreciation 350
11. GDP at Factor Cost is: a. 4,750 b. 4,950 c. 4,550 d. 4,900 e. 4,850. 12. National Income is: a. 4,500 b. 4,450 c. 4,850 d. 4,600 e. 4,950. 13. The Personal Disposable Income is: a. 3,800 b. 3,900 c. 2,600 d. 4,100 e. 4,000. 14. In an economy:
(Rs.) GDP at FC 80,000 Depreciation 4,000 GNP at Market price 95,000 Indirect taxes 5,000
The Net Factor Income from Abroad is: a. 15,000 b. 10,000 e. 15,000 d. 12,500 e. 12,000.
© 2004
The Ic
fai U
nivers
ity P
ress.A
ll righ
ts res
erved
.ISBN : 8
1-314
-0227
-4 Ref.
No.
MACWB 04
2004
04
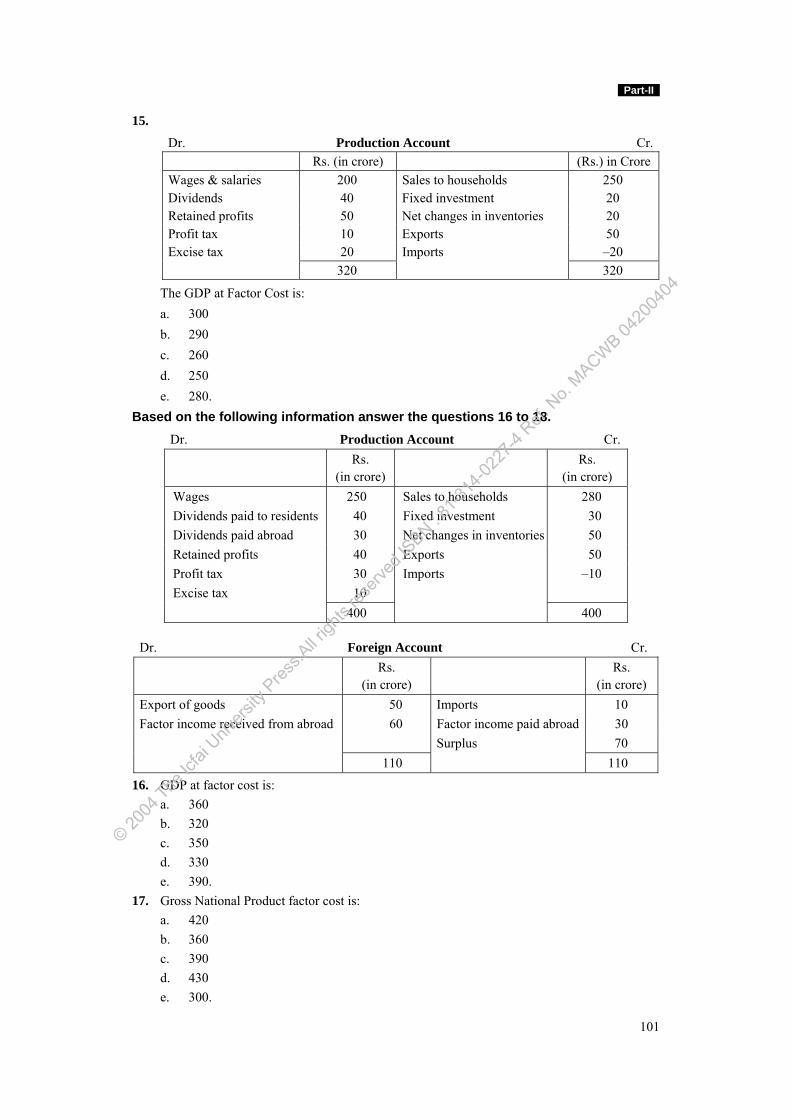
Part-II
101
15.
Dr. Production Account Cr. Rs. (in crore) (Rs.) in Crore Wages & salaries 200 Sales to households 250 Dividends 40 Fixed investment 20 Retained profits 50 Net changes in inventories 20 Profit tax 10 Exports 50 Excise tax 20 Imports –20 320 320
The GDP at Factor Cost is: a. 300 b. 290 c. 260 d. 250 e. 280. Based on the following information answer the questions 16 to 18.
Dr. Production Account Cr. Rs.
(in crore) Rs.
(in crore) Wages 250 Sales to households 280 Dividends paid to residents 40 Fixed investment 30 Dividends paid abroad 30 Net changes in inventories 50 Retained profits 40 Exports 50 Profit tax 30 Imports –10 Excise tax 10
400 400
Dr. Foreign Account Cr. Rs.
(in crore) Rs.
(in crore) Export of goods 50 Imports 10 Factor income received from abroad 60 Factor income paid abroad 30 Surplus 70 110 110
16. GDP at factor cost is: a. 360 b. 320 c. 350 d. 330 e. 390. 17. Gross National Product factor cost is: a. 420 b. 360 c. 390 d. 430 e. 300.
© 2004
The Ic
fai U
nivers
ity P
ress.A
ll righ
ts res
erved
.ISBN : 8
1-314
-0227
-4 Ref.
No.
MACWB 04
2004
04
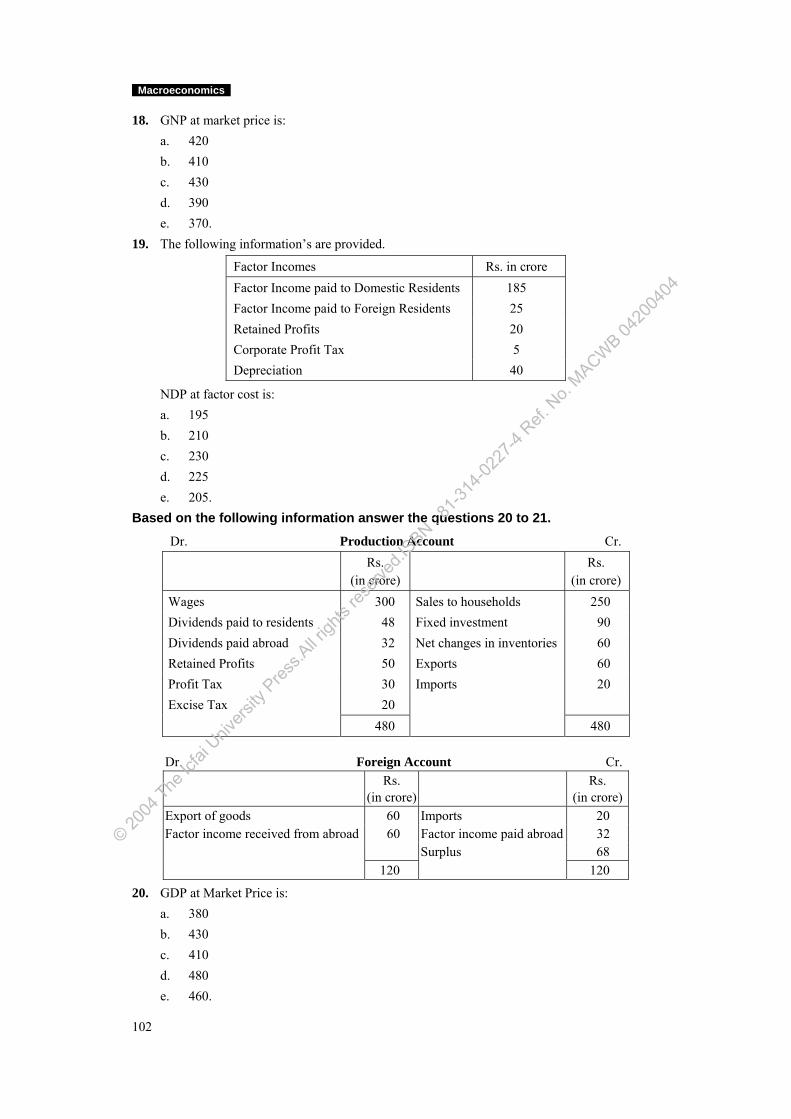
Macroeconomics
102
18. GNP at market price is: a. 420 b. 410 c. 430 d. 390 e. 370. 19. The following information’s are provided.
Factor Incomes Rs. in crore Factor Income paid to Domestic Residents 185 Factor Income paid to Foreign Residents 25 Retained Profits 20 Corporate Profit Tax 5 Depreciation 40
NDP at factor cost is: a. 195 b. 210 c. 230 d. 225 e. 205.
Based on the following information answer the questions 20 to 21.
Dr. Production Account Cr. Rs.
(in crore) Rs.
(in crore) Wages 300 Sales to households 250 Dividends paid to residents 48 Fixed investment 90 Dividends paid abroad 32 Net changes in inventories 60 Retained Profits 50 Exports 60 Profit Tax 30 Imports 20 Excise Tax 20 480 480
Dr. Foreign Account Cr. Rs.
(in crore) Rs.
(in crore) Export of goods 60 Imports 20 Factor income received from abroad 60 Factor income paid abroad 32 Surplus 68 120 120
20. GDP at Market Price is: a. 380 b. 430 c. 410 d. 480 e. 460.
© 2004
The Ic
fai U
nivers
ity P
ress.A
ll righ
ts res
erved
.ISBN : 8
1-314
-0227
-4 Ref.
No.
MACWB 04
2004
04
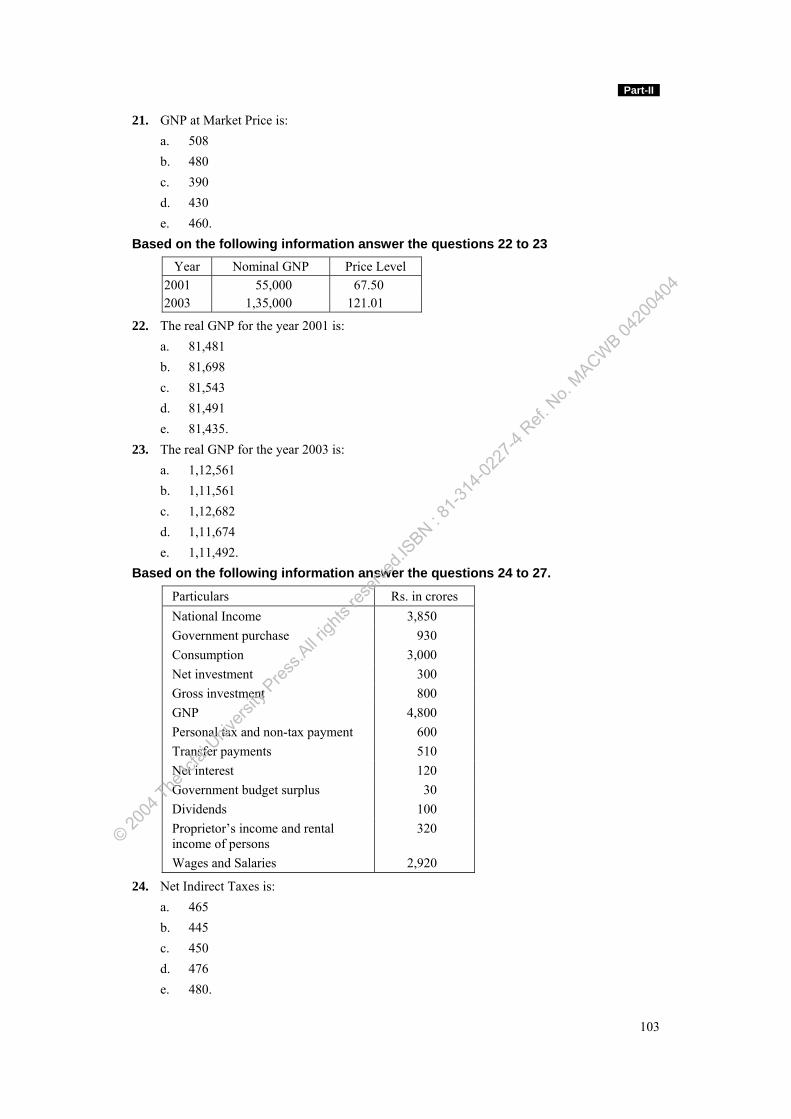
Part-II
103
21. GNP at Market Price is: a. 508 b. 480 c. 390 d. 430 e. 460.
Based on the following information answer the questions 22 to 23 Year Nominal GNP Price Level
2001 55,000 67.50 2003 1,35,000 121.01
22. The real GNP for the year 2001 is: a. 81,481 b. 81,698 c. 81,543 d. 81,491 e. 81,435.
23. The real GNP for the year 2003 is: a. 1,12,561 b. 1,11,561 c. 1,12,682 d. 1,11,674 e. 1,11,492.
Based on the following information answer the questions 24 to 27.
Particulars Rs. in crores National Income 3,850 Government purchase 930 Consumption 3,000 Net investment 300 Gross investment 800 GNP 4,800 Personal tax and non-tax payment 600 Transfer payments 510 Net interest 120 Government budget surplus 30 Dividends 100 Proprietor’s income and rental income of persons
320
Wages and Salaries 2,920
24. Net Indirect Taxes is: a. 465 b. 445 c. 450 d. 476 e. 480.
© 2004
The Ic
fai U
nivers
ity P
ress.A
ll righ
ts res
erved
.ISBN : 8
1-314
-0227
-4 Ref.
No.
MACWB 04
2004
04
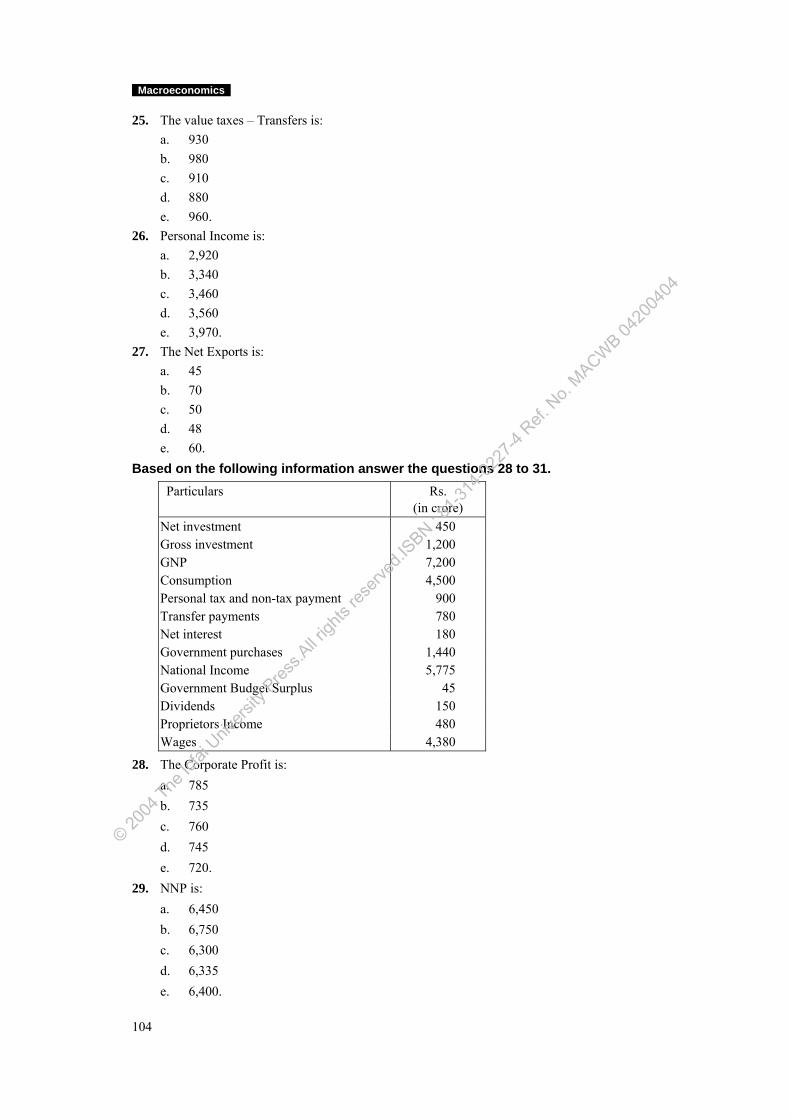
Macroeconomics
104
25. The value taxes – Transfers is: a. 930 b. 980 c. 910 d. 880 e. 960.
26. Personal Income is: a. 2,920 b. 3,340 c. 3,460 d. 3,560 e. 3,970.
27. The Net Exports is: a. 45 b. 70 c. 50 d. 48 e. 60.
Based on the following information answer the questions 28 to 31. Particulars Rs.
(in crore) Net investment 450 Gross investment 1,200 GNP 7,200 Consumption 4,500 Personal tax and non-tax payment 900 Transfer payments 780 Net interest 180 Government purchases 1,440 National Income 5,775 Government Budget Surplus 45 Dividends 150 Proprietors Income 480 Wages 4,380
28. The Corporate Profit is: a. 785 b. 735 c. 760 d. 745 e. 720.
29. NNP is: a. 6,450 b. 6,750 c. 6,300 d. 6,335 e. 6,400.
© 2004
The Ic
fai U
nivers
ity P
ress.A
ll righ
ts res
erved
.ISBN : 8
1-314
-0227
-4 Ref.
No.
MACWB 04
2004
04
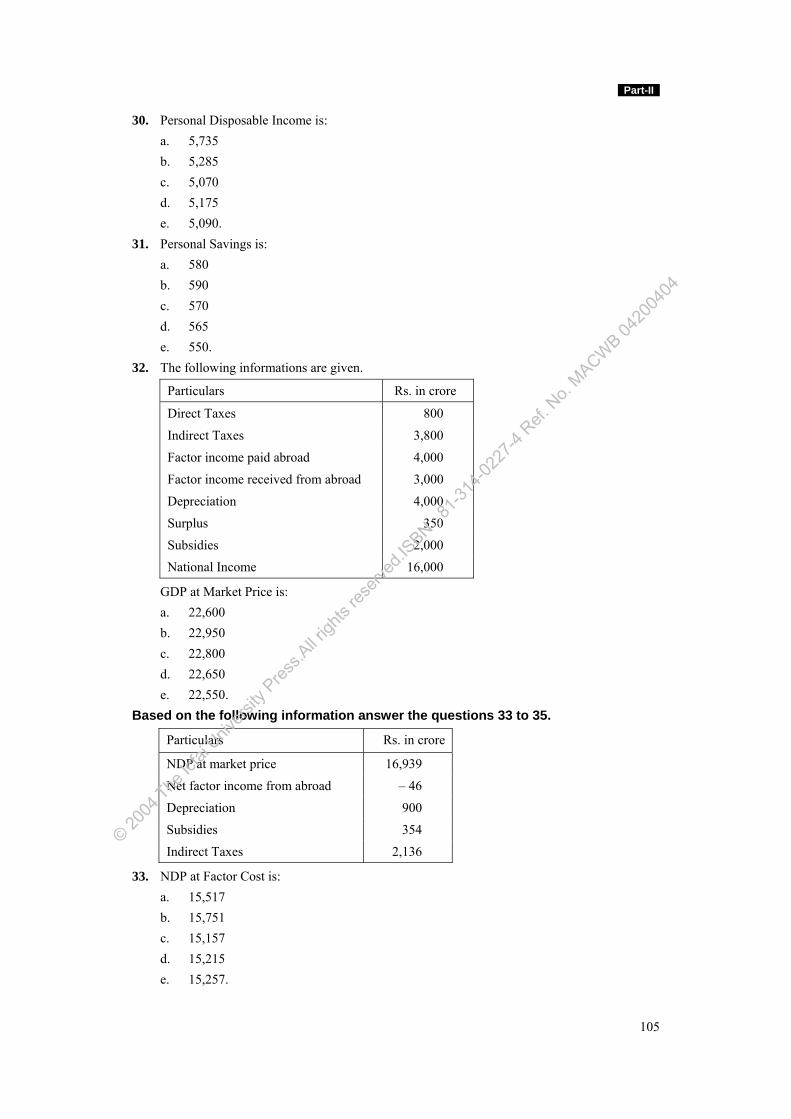
Part-II
105
30. Personal Disposable Income is: a. 5,735 b. 5,285 c. 5,070 d. 5,175 e. 5,090. 31. Personal Savings is: a. 580 b. 590 c. 570 d. 565 e. 550. 32. The following informations are given.
Particulars Rs. in crore
Direct Taxes 800
Indirect Taxes 3,800
Factor income paid abroad 4,000
Factor income received from abroad 3,000
Depreciation 4,000
Surplus 350
Subsidies 2,000
National Income 16,000
GDP at Market Price is: a. 22,600 b. 22,950 c. 22,800 d. 22,650 e. 22,550. Based on the following information answer the questions 33 to 35.
Particulars Rs. in crore
NDP at market price 16,939
Net factor income from abroad – 46
Depreciation 900
Subsidies 354
Indirect Taxes 2,136
33. NDP at Factor Cost is: a. 15,517 b. 15,751 c. 15,157 d. 15,215 e. 15,257.
© 2004
The Ic
fai U
nivers
ity P
ress.A
ll righ
ts res
erved
.ISBN : 8
1-314
-0227
-4 Ref.
No.
MACWB 04
2004
04
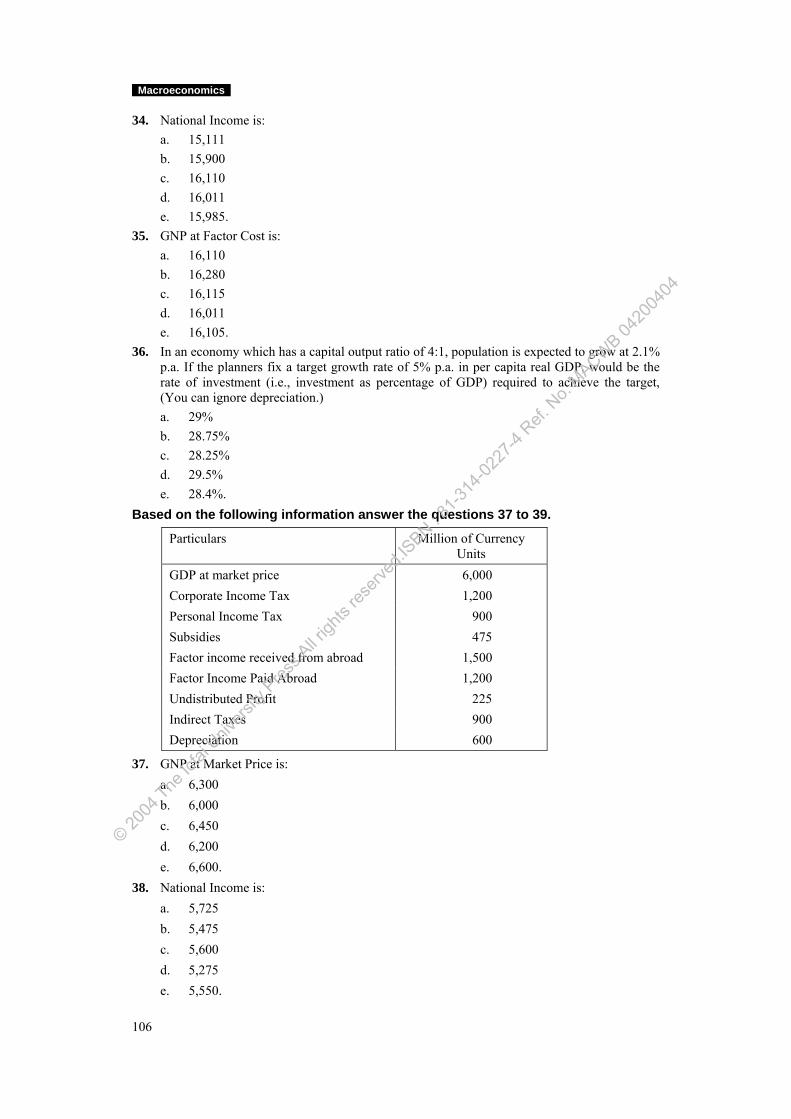
Macroeconomics
106
34. National Income is: a. 15,111 b. 15,900 c. 16,110 d. 16,011 e. 15,985. 35. GNP at Factor Cost is: a. 16,110 b. 16,280 c. 16,115 d. 16,011 e. 16,105. 36. In an economy which has a capital output ratio of 4:1, population is expected to grow at 2.1%
p.a. If the planners fix a target growth rate of 5% p.a. in per capita real GDP, would be the rate of investment (i.e., investment as percentage of GDP) required to achieve the target, (You can ignore depreciation.)
a. 29% b. 28.75% c. 28.25% d. 29.5% e. 28.4%. Based on the following information answer the questions 37 to 39.
Particulars Million of Currency Units
GDP at market price 6,000 Corporate Income Tax 1,200 Personal Income Tax 900 Subsidies 475 Factor income received from abroad 1,500 Factor Income Paid Abroad 1,200 Undistributed Profit 225 Indirect Taxes 900 Depreciation 600
37. GNP at Market Price is: a. 6,300 b. 6,000 c. 6,450 d. 6,200 e. 6,600. 38. National Income is: a. 5,725 b. 5,475 c. 5,600 d. 5,275 e. 5,550.
© 2004
The Ic
fai U
nivers
ity P
ress.A
ll righ
ts res
erved
.ISBN : 8
1-314
-0227
-4 Ref.
No.
MACWB 04
2004
04
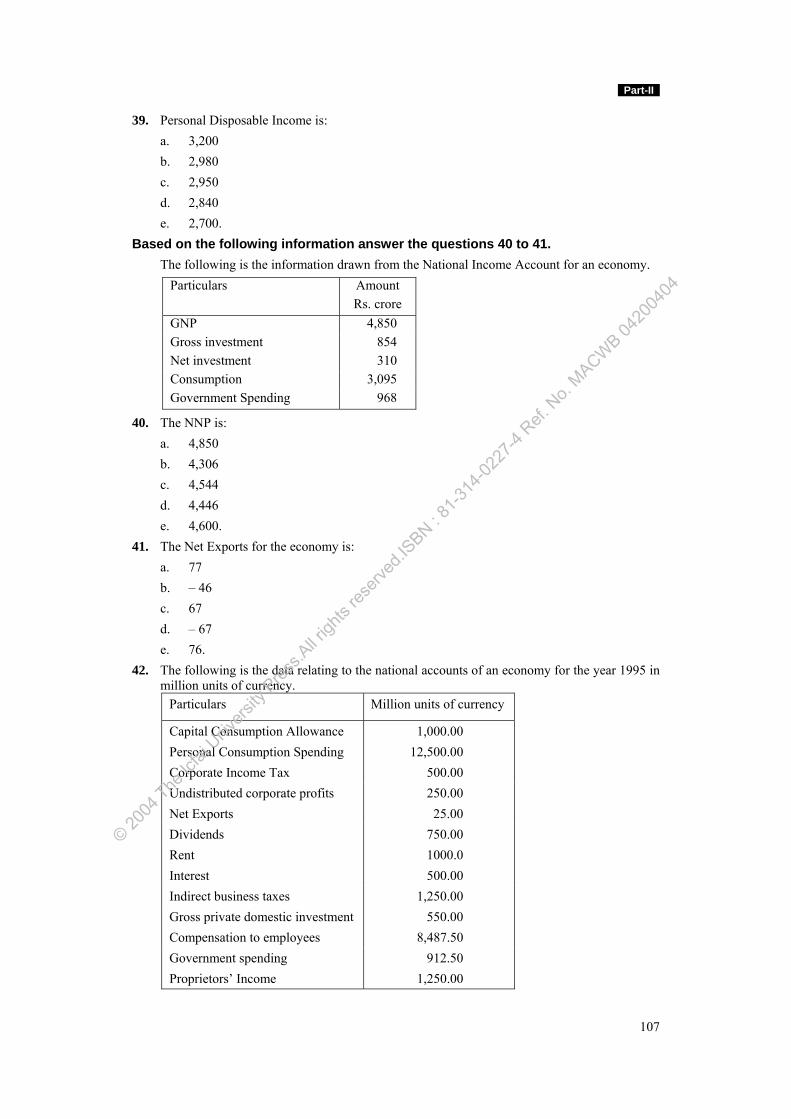
Part-II
107
39. Personal Disposable Income is: a. 3,200 b. 2,980 c. 2,950 d. 2,840 e. 2,700. Based on the following information answer the questions 40 to 41. The following is the information drawn from the National Income Account for an economy.
Particulars Amount Rs. crore
GNP 4,850 Gross investment 854 Net investment 310 Consumption 3,095 Government Spending 968
40. The NNP is: a. 4,850 b. 4,306 c. 4,544 d. 4,446 e. 4,600. 41. The Net Exports for the economy is: a. 77 b. – 46 c. 67 d. – 67 e. 76. 42. The following is the data relating to the national accounts of an economy for the year 1995 in
million units of currency. Particulars Million units of currency
Capital Consumption Allowance 1,000.00 Personal Consumption Spending 12,500.00 Corporate Income Tax 500.00 Undistributed corporate profits 250.00 Net Exports 25.00 Dividends 750.00 Rent 1000.0 Interest 500.00 Indirect business taxes 1,250.00 Gross private domestic investment 550.00 Compensation to employees 8,487.50 Government spending 912.50 Proprietors’ Income 1,250.00
© 2004
The Ic
fai U
nivers
ity P
ress.A
ll righ
ts res
erved
.ISBN : 8
1-314
-0227
-4 Ref.
No.
MACWB 04
2004
04
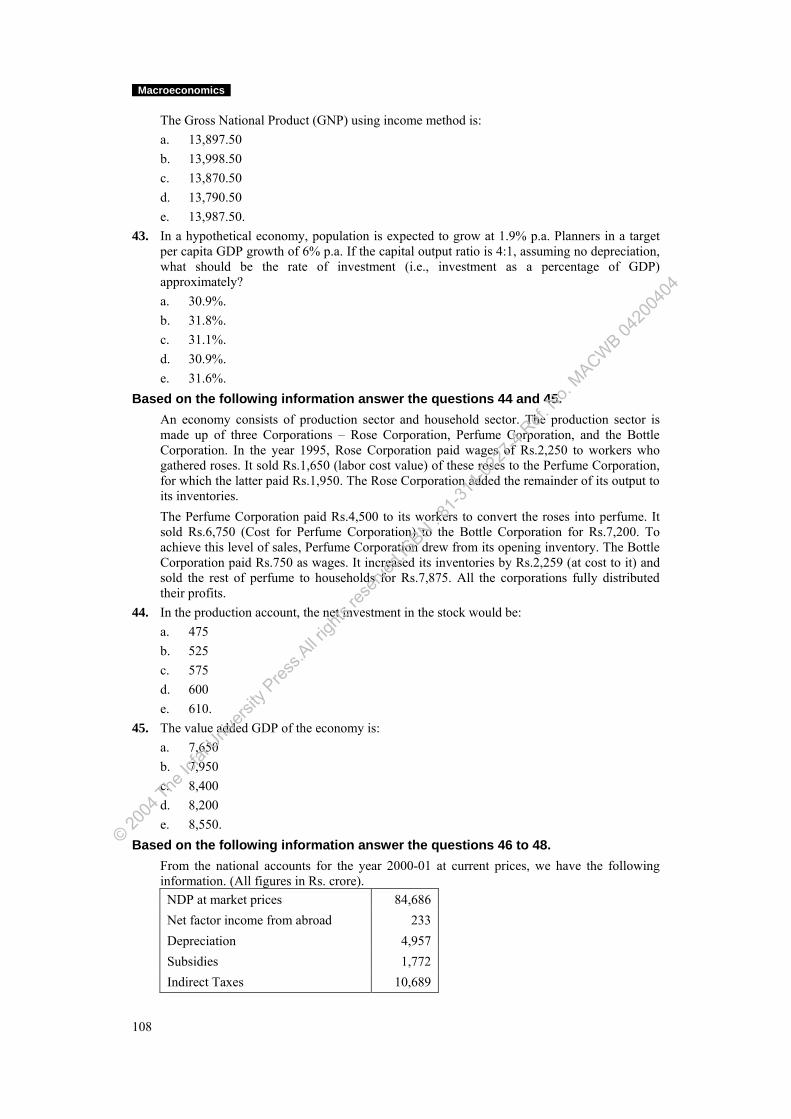
Macroeconomics
108
The Gross National Product (GNP) using income method is: a. 13,897.50 b. 13,998.50 c. 13,870.50 d. 13,790.50 e. 13,987.50. 43. In a hypothetical economy, population is expected to grow at 1.9% p.a. Planners in a target
per capita GDP growth of 6% p.a. If the capital output ratio is 4:1, assuming no depreciation, what should be the rate of investment (i.e., investment as a percentage of GDP) approximately?
a. 30.9%. b. 31.8%. c. 31.1%. d. 30.9%. e. 31.6%. Based on the following information answer the questions 44 and 45. An economy consists of production sector and household sector. The production sector is
made up of three Corporations – Rose Corporation, Perfume Corporation, and the Bottle Corporation. In the year 1995, Rose Corporation paid wages of Rs.2,250 to workers who gathered roses. It sold Rs.1,650 (labor cost value) of these roses to the Perfume Corporation, for which the latter paid Rs.1,950. The Rose Corporation added the remainder of its output to its inventories.
The Perfume Corporation paid Rs.4,500 to its workers to convert the roses into perfume. It sold Rs.6,750 (Cost for Perfume Corporation) to the Bottle Corporation for Rs.7,200. To achieve this level of sales, Perfume Corporation drew from its opening inventory. The Bottle Corporation paid Rs.750 as wages. It increased its inventories by Rs.2,259 (at cost to it) and sold the rest of perfume to households for Rs.7,875. All the corporations fully distributed their profits.
44. In the production account, the net investment in the stock would be: a. 475 b. 525 c. 575 d. 600 e. 610. 45. The value added GDP of the economy is: a. 7,650 b. 7,950 c. 8,400 d. 8,200 e. 8,550. Based on the following information answer the questions 46 to 48. From the national accounts for the year 2000-01 at current prices, we have the following
information. (All figures in Rs. crore). NDP at market prices 84,686 Net factor income from abroad 233 Depreciation 4,957 Subsidies 1,772 Indirect Taxes 10,689
© 2004
The Ic
fai U
nivers
ity P
ress.A
ll righ
ts res
erved
.ISBN : 8
1-314
-0227
-4 Ref.
No.
MACWB 04
2004
04
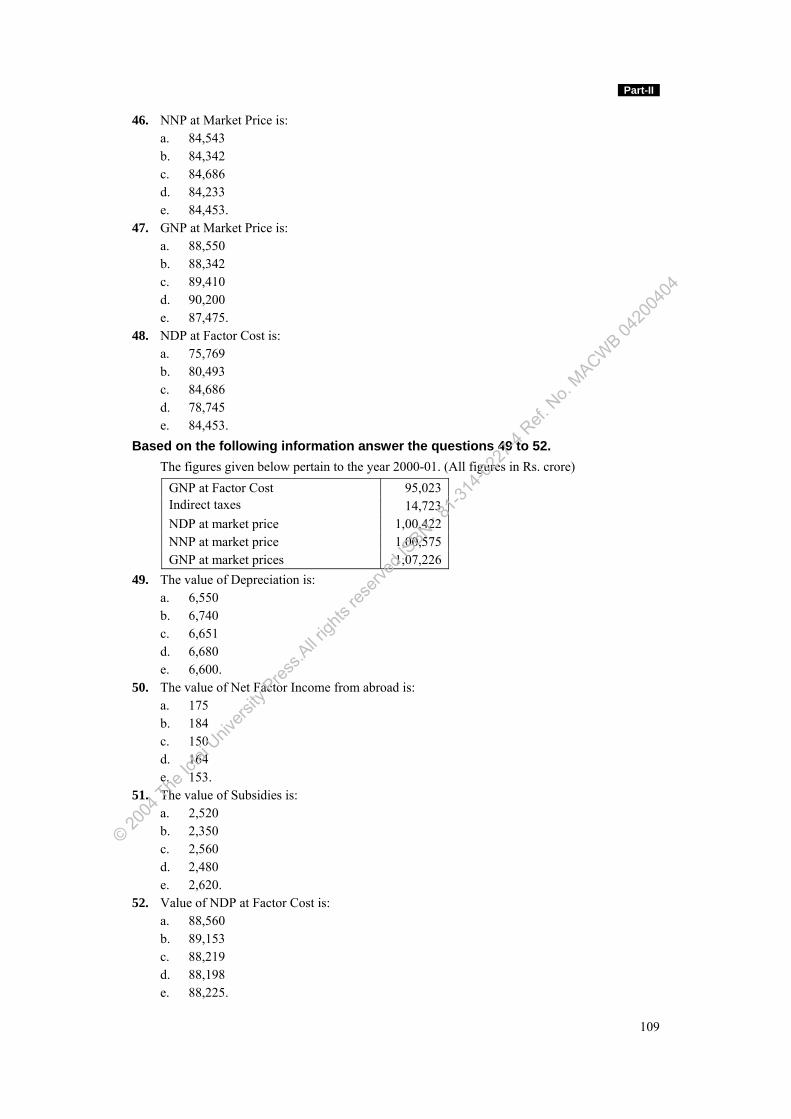
Part-II
109
46. NNP at Market Price is: a. 84,543 b. 84,342 c. 84,686 d. 84,233 e. 84,453. 47. GNP at Market Price is: a. 88,550 b. 88,342 c. 89,410 d. 90,200 e. 87,475. 48. NDP at Factor Cost is: a. 75,769 b. 80,493 c. 84,686 d. 78,745 e. 84,453. Based on the following information answer the questions 49 to 52. The figures given below pertain to the year 2000-01. (All figures in Rs. crore)
GNP at Factor Cost 95,023 Indirect taxes 14,723 NDP at market price 1,00,422 NNP at market price 1,00,575 GNP at market prices 1,07,226
49. The value of Depreciation is: a. 6,550 b. 6,740 c. 6,651 d. 6,680 e. 6,600. 50. The value of Net Factor Income from abroad is: a. 175 b. 184 c. 150 d. 164 e. 153. 51. The value of Subsidies is: a. 2,520 b. 2,350 c. 2,560 d. 2,480 e. 2,620. 52. Value of NDP at Factor Cost is: a. 88,560 b. 89,153 c. 88,219 d. 88,198 e. 88,225.
© 2004
The Ic
fai U
nivers
ity P
ress.A
ll righ
ts res
erved
.ISBN : 8
1-314
-0227
-4 Ref.
No.
MACWB 04
2004
04
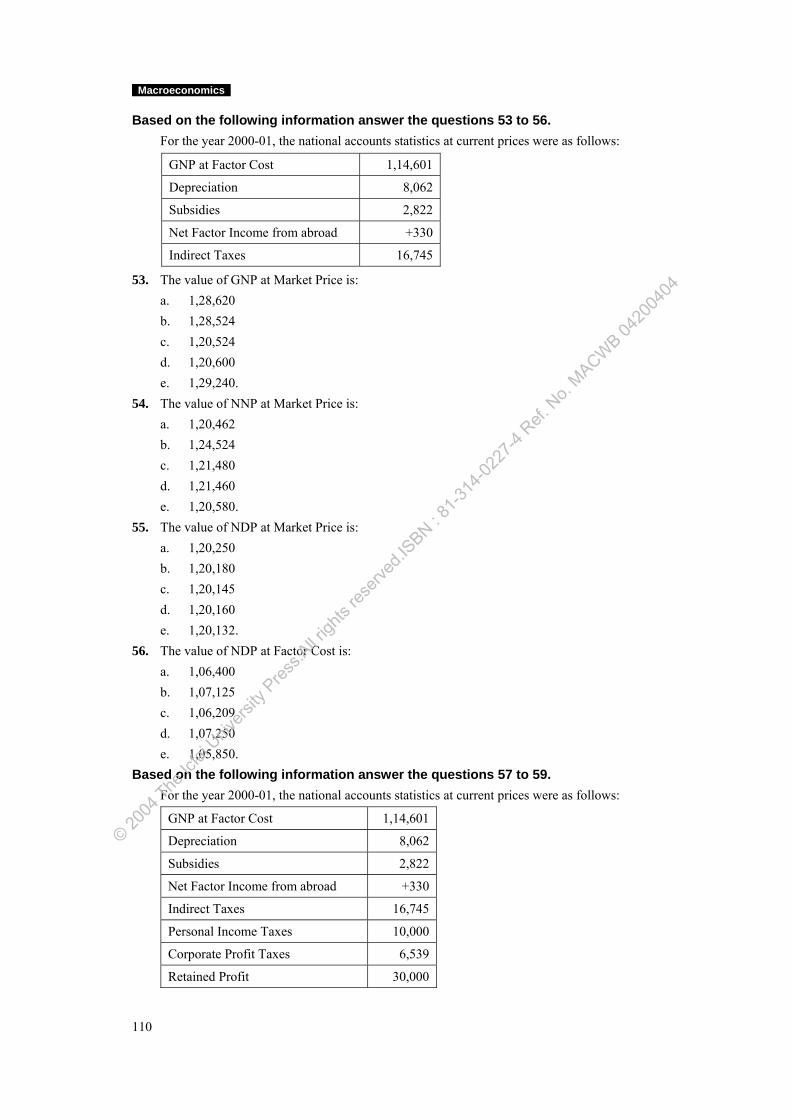
Macroeconomics
110
Based on the following information answer the questions 53 to 56. For the year 2000-01, the national accounts statistics at current prices were as follows:
GNP at Factor Cost 1,14,601
Depreciation 8,062
Subsidies 2,822
Net Factor Income from abroad +330
Indirect Taxes 16,745
53. The value of GNP at Market Price is: a. 1,28,620 b. 1,28,524 c. 1,20,524 d. 1,20,600 e. 1,29,240. 54. The value of NNP at Market Price is: a. 1,20,462 b. 1,24,524 c. 1,21,480 d. 1,21,460 e. 1,20,580. 55. The value of NDP at Market Price is: a. 1,20,250 b. 1,20,180 c. 1,20,145 d. 1,20,160 e. 1,20,132. 56. The value of NDP at Factor Cost is: a. 1,06,400 b. 1,07,125 c. 1,06,209 d. 1,07,250 e. 1,05,850. Based on the following information answer the questions 57 to 59. For the year 2000-01, the national accounts statistics at current prices were as follows:
GNP at Factor Cost 1,14,601
Depreciation 8,062
Subsidies 2,822
Net Factor Income from abroad +330
Indirect Taxes 16,745
Personal Income Taxes 10,000
Corporate Profit Taxes 6,539
Retained Profit 30,000
© 2004
The Ic
fai U
nivers
ity P
ress.A
ll righ
ts res
erved
.ISBN : 8
1-314
-0227
-4 Ref.
No.
MACWB 04
2004
04
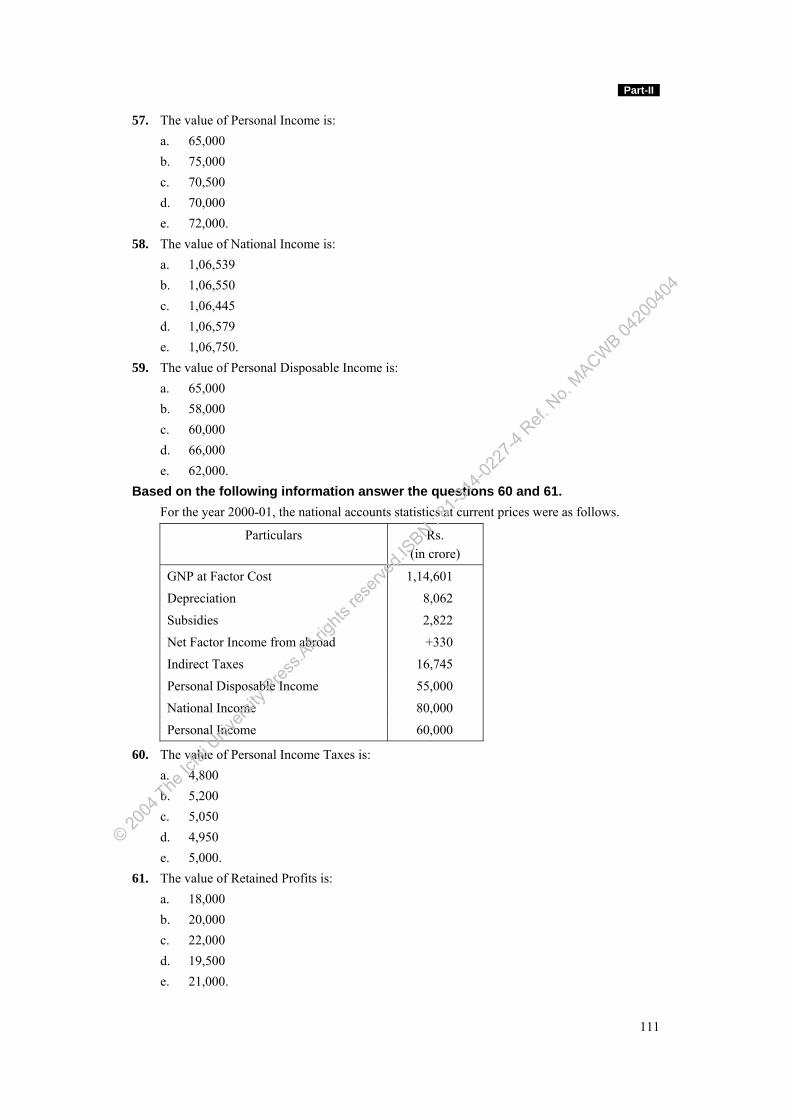
Part-II
111
57. The value of Personal Income is: a. 65,000 b. 75,000 c. 70,500 d. 70,000 e. 72,000. 58. The value of National Income is: a. 1,06,539 b. 1,06,550 c. 1,06,445 d. 1,06,579 e. 1,06,750. 59. The value of Personal Disposable Income is: a. 65,000 b. 58,000 c. 60,000 d. 66,000 e. 62,000. Based on the following information answer the questions 60 and 61. For the year 2000-01, the national accounts statistics at current prices were as follows.
Particulars Rs. (in crore)
GNP at Factor Cost 1,14,601
Depreciation 8,062
Subsidies 2,822
Net Factor Income from abroad +330
Indirect Taxes 16,745
Personal Disposable Income 55,000
National Income 80,000
Personal Income 60,000
60. The value of Personal Income Taxes is: a. 4,800 b. 5,200 c. 5,050 d. 4,950 e. 5,000. 61. The value of Retained Profits is: a. 18,000 b. 20,000 c. 22,000 d. 19,500 e. 21,000.
© 2004
The Ic
fai U
nivers
ity P
ress.A
ll righ
ts res
erved
.ISBN : 8
1-314
-0227
-4 Ref.
No.
MACWB 04
2004
04
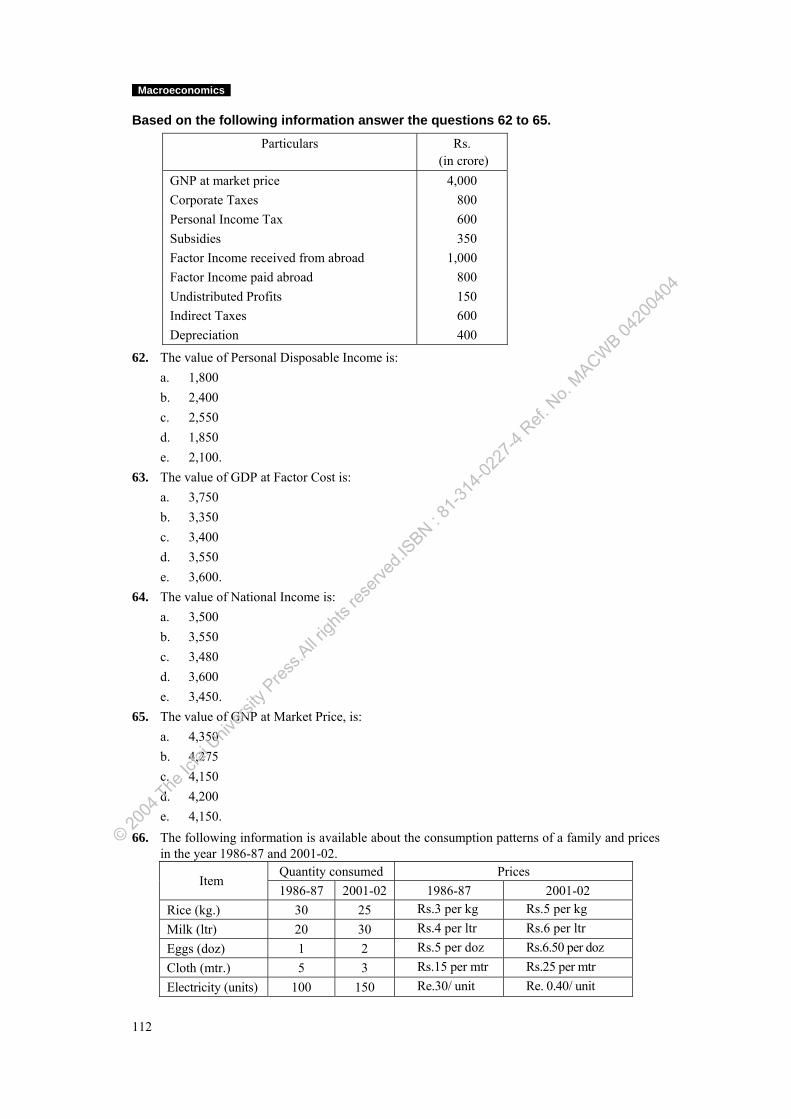
Macroeconomics
112
Based on the following information answer the questions 62 to 65.
Particulars Rs. (in crore)
GNP at market price 4,000 Corporate Taxes 800 Personal Income Tax 600 Subsidies 350 Factor Income received from abroad 1,000 Factor Income paid abroad 800 Undistributed Profits 150 Indirect Taxes 600 Depreciation 400
62. The value of Personal Disposable Income is: a. 1,800 b. 2,400 c. 2,550 d. 1,850 e. 2,100. 63. The value of GDP at Factor Cost is: a. 3,750 b. 3,350 c. 3,400 d. 3,550 e. 3,600. 64. The value of National Income is: a. 3,500 b. 3,550 c. 3,480 d. 3,600 e. 3,450. 65. The value of GNP at Market Price, is: a. 4,350 b. 4,275 c. 4,150 d. 4,200 e. 4,150. 66. The following information is available about the consumption patterns of a family and prices
in the year 1986-87 and 2001-02. Quantity consumed Prices
Item 1986-87 2001-02 1986-87 2001-02
Rice (kg.) 30 25 Rs.3 per kg Rs.5 per kg Milk (ltr) 20 30 Rs.4 per ltr Rs.6 per ltr Eggs (doz) 1 2 Rs.5 per doz Rs.6.50 per doz Cloth (mtr.) 5 3 Rs.15 per mtr Rs.25 per mtr Electricity (units) 100 150 Re.30/ unit Re. 0.40/ unit
© 2004
The Ic
fai U
nivers
ity P
ress.A
ll righ
ts res
erved
.ISBN : 8
1-314
-0227
-4 Ref.
No.
MACWB 04
2004
04
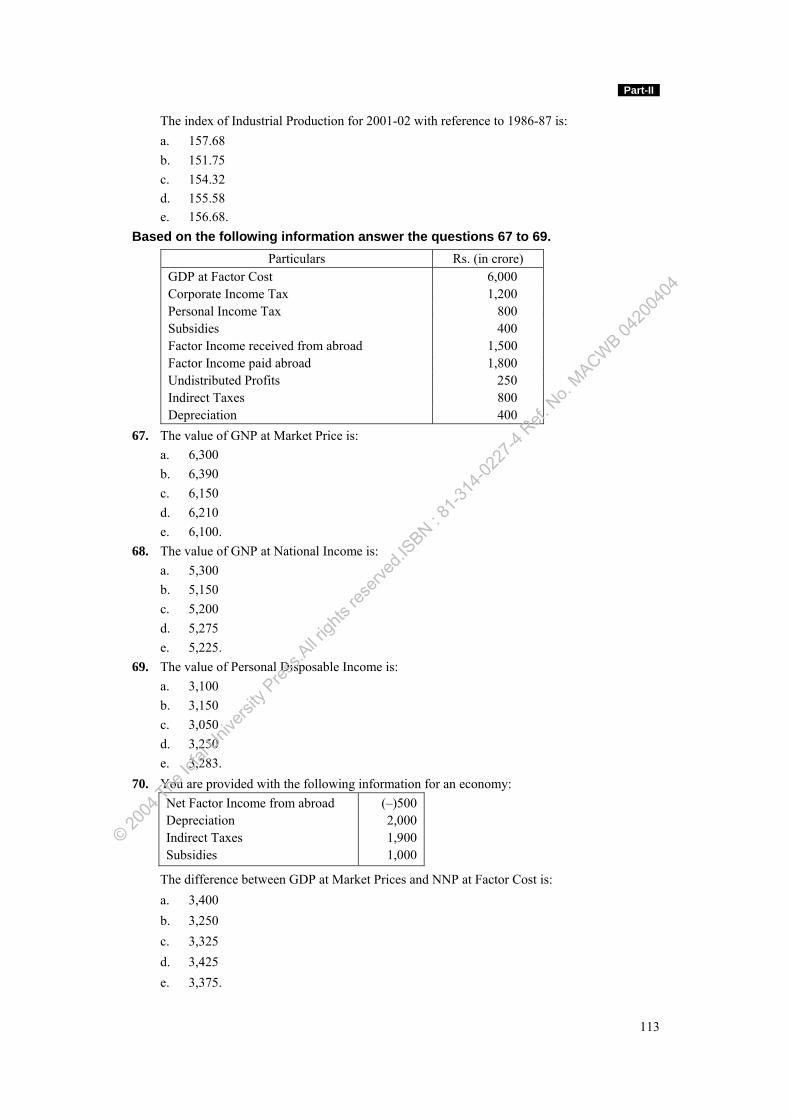
Part-II
113
The index of Industrial Production for 2001-02 with reference to 1986-87 is: a. 157.68 b. 151.75 c. 154.32 d. 155.58 e. 156.68. Based on the following information answer the questions 67 to 69.
Particulars Rs. (in crore) GDP at Factor Cost 6,000 Corporate Income Tax 1,200 Personal Income Tax 800 Subsidies 400 Factor Income received from abroad 1,500 Factor Income paid abroad 1,800 Undistributed Profits 250 Indirect Taxes 800 Depreciation 400
67. The value of GNP at Market Price is: a. 6,300 b. 6,390 c. 6,150 d. 6,210 e. 6,100. 68. The value of GNP at National Income is: a. 5,300 b. 5,150 c. 5,200 d. 5,275 e. 5,225. 69. The value of Personal Disposable Income is: a. 3,100 b. 3,150 c. 3,050 d. 3,250 e. 3,283. 70. You are provided with the following information for an economy:
Net Factor Income from abroad Depreciation Indirect Taxes Subsidies
(–)500 2,000 1,900 1,000
The difference between GDP at Market Prices and NNP at Factor Cost is: a. 3,400 b. 3,250 c. 3,325 d. 3,425 e. 3,375.
© 2004
The Ic
fai U
nivers
ity P
ress.A
ll righ
ts res
erved
.ISBN : 8
1-314
-0227
-4 Ref.
No.
MACWB 04
2004
04
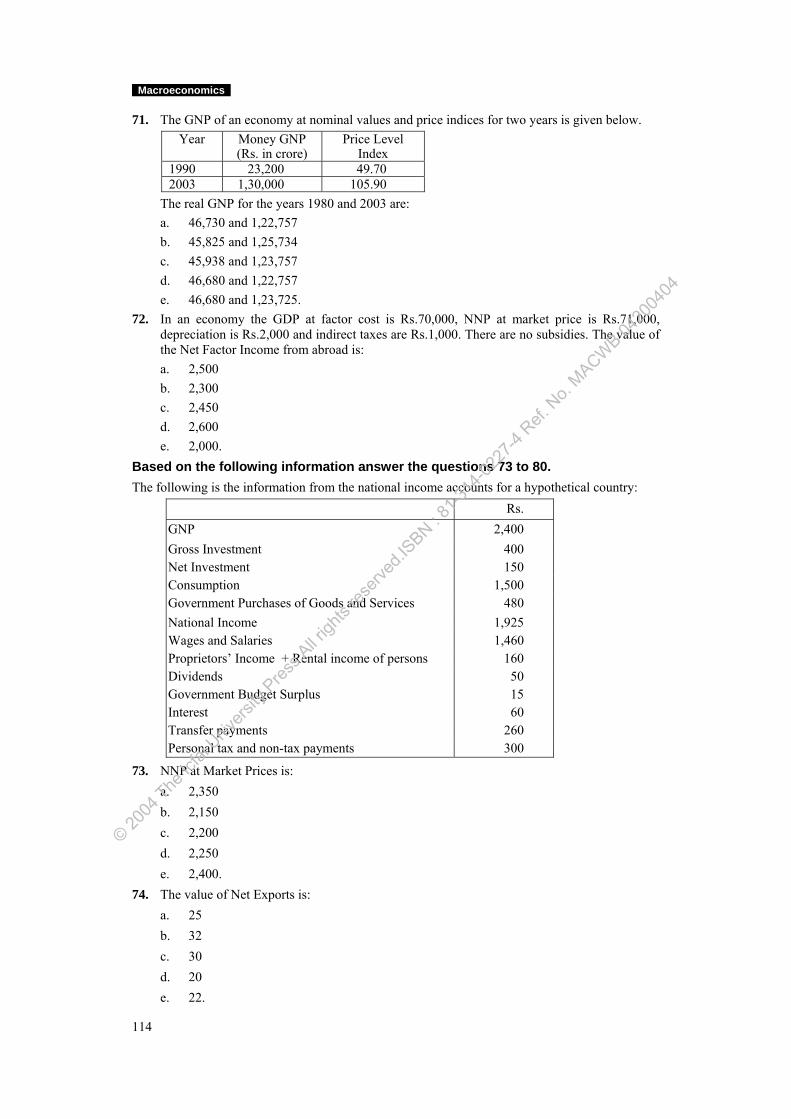
Macroeconomics
114
71. The GNP of an economy at nominal values and price indices for two years is given below. Year Money GNP
(Rs. in crore) Price Level
Index 1990 23,200 49.70 2003 1,30,000 105.90
The real GNP for the years 1980 and 2003 are: a. 46,730 and 1,22,757 b. 45,825 and 1,25,734 c. 45,938 and 1,23,757 d. 46,680 and 1,22,757 e. 46,680 and 1,23,725. 72. In an economy the GDP at factor cost is Rs.70,000, NNP at market price is Rs.71,000,
depreciation is Rs.2,000 and indirect taxes are Rs.1,000. There are no subsidies. The value of the Net Factor Income from abroad is:
a. 2,500 b. 2,300 c. 2,450 d. 2,600 e. 2,000. Based on the following information answer the questions 73 to 80. The following is the information from the national income accounts for a hypothetical country:
Rs. GNP 2,400 Gross Investment 400 Net Investment 150 Consumption 1,500 Government Purchases of Goods and Services 480 National Income 1,925 Wages and Salaries 1,460 Proprietors’ Income + Rental income of persons 160 Dividends 50 Government Budget Surplus 15 Interest 60 Transfer payments 260 Personal tax and non-tax payments 300
73. NNP at Market Prices is: a. 2,350 b. 2,150 c. 2,200 d. 2,250 e. 2,400. 74. The value of Net Exports is: a. 25 b. 32 c. 30 d. 20 e. 22.
© 2004
The Ic
fai U
nivers
ity P
ress.A
ll righ
ts res
erved
.ISBN : 8
1-314
-0227
-4 Ref.
No.
MACWB 04
2004
04
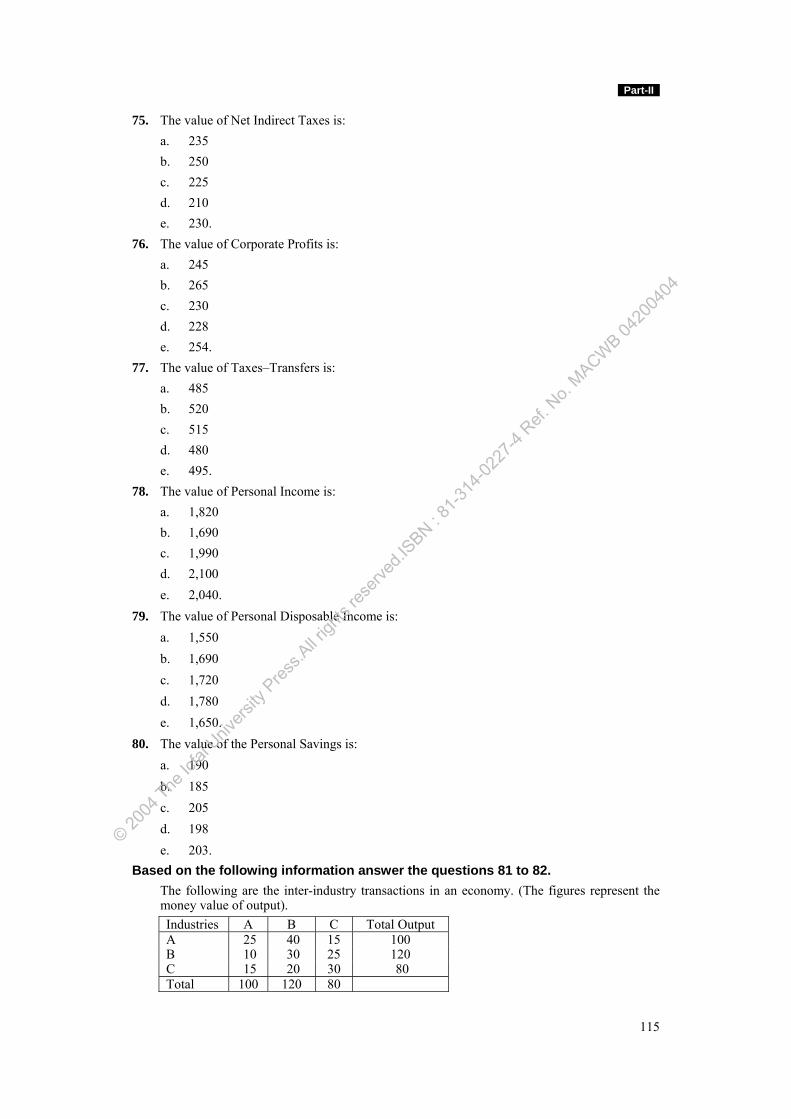
Part-II
115
75. The value of Net Indirect Taxes is: a. 235 b. 250 c. 225 d. 210 e. 230. 76. The value of Corporate Profits is: a. 245 b. 265 c. 230 d. 228 e. 254. 77. The value of Taxes–Transfers is: a. 485 b. 520 c. 515 d. 480 e. 495. 78. The value of Personal Income is: a. 1,820 b. 1,690 c. 1,990 d. 2,100 e. 2,040. 79. The value of Personal Disposable Income is: a. 1,550 b. 1,690 c. 1,720 d. 1,780 e. 1,650. 80. The value of the Personal Savings is: a. 190 b. 185 c. 205 d. 198 e. 203. Based on the following information answer the questions 81 to 82. The following are the inter-industry transactions in an economy. (The figures represent the
money value of output). Industries A B C Total Output A 25 40 15 100 B 10 30 25 120 C 15 20 30 80 Total 100 120 80
© 2004
The Ic
fai U
nivers
ity P
ress.A
ll righ
ts res
erved
.ISBN : 8
1-314
-0227
-4 Ref.
No.
MACWB 04
2004
04
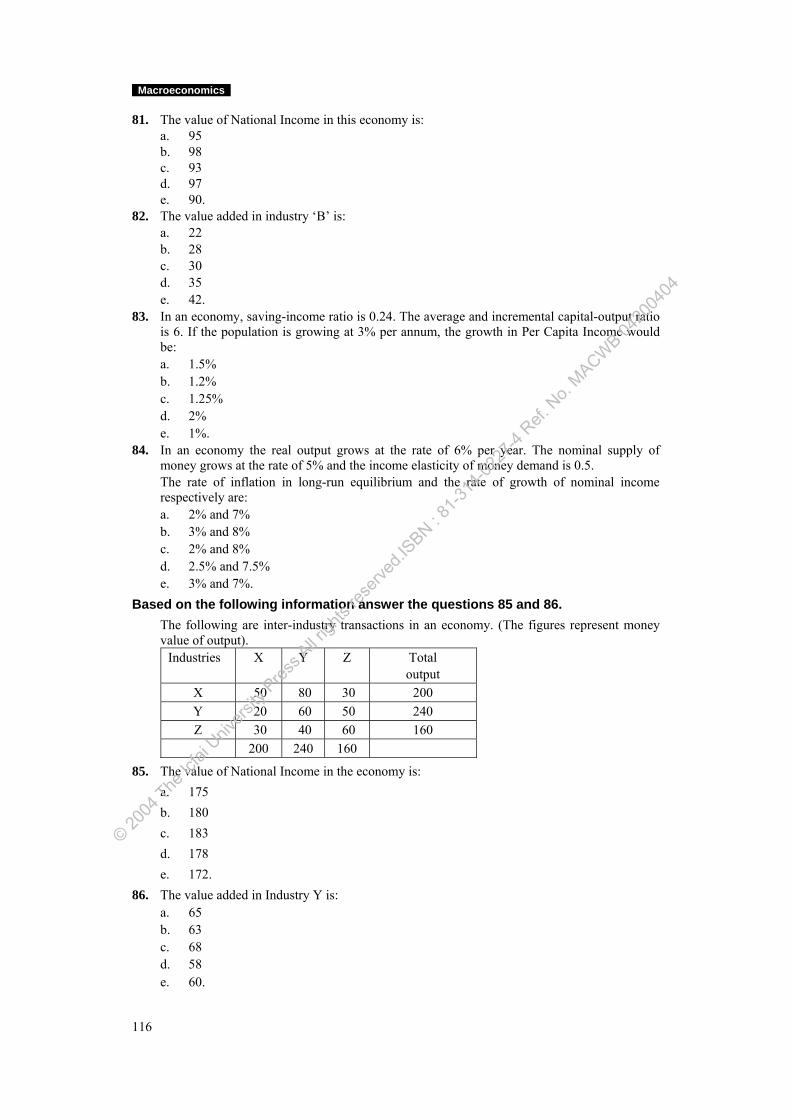
Macroeconomics
116
81. The value of National Income in this economy is: a. 95 b. 98 c. 93 d. 97 e. 90. 82. The value added in industry ‘B’ is: a. 22 b. 28 c. 30 d. 35 e. 42. 83. In an economy, saving-income ratio is 0.24. The average and incremental capital-output ratio
is 6. If the population is growing at 3% per annum, the growth in Per Capita Income would be:
a. 1.5% b. 1.2% c. 1.25% d. 2% e. 1%. 84. In an economy the real output grows at the rate of 6% per year. The nominal supply of
money grows at the rate of 5% and the income elasticity of money demand is 0.5. The rate of inflation in long-run equilibrium and the rate of growth of nominal income
respectively are: a. 2% and 7% b. 3% and 8% c. 2% and 8% d. 2.5% and 7.5% e. 3% and 7%. Based on the following information answer the questions 85 and 86. The following are inter-industry transactions in an economy. (The figures represent money
value of output). Industries X Y Z Total
output X 50 80 30 200 Y 20 60 50 240 Z 30 40 60 160
200 240 160
85. The value of National Income in the economy is: a. 175 b. 180 c. 183 d. 178 e. 172. 86. The value added in Industry Y is: a. 65 b. 63 c. 68 d. 58 e. 60.
© 2004
The Ic
fai U
nivers
ity P
ress.A
ll righ
ts res
erved
.ISBN : 8
1-314
-0227
-4 Ref.
No.
MACWB 04
2004
04
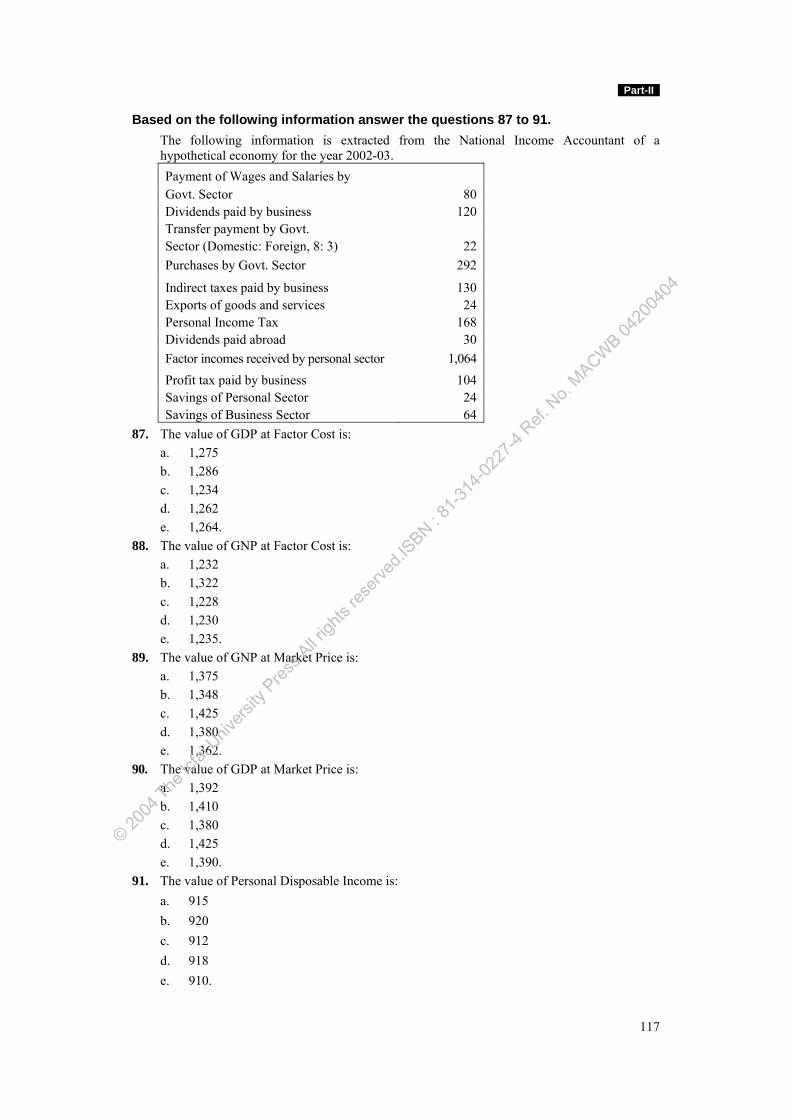
Part-II
117
Based on the following information answer the questions 87 to 91. The following information is extracted from the National Income Accountant of a
hypothetical economy for the year 2002-03. Payment of Wages and Salaries by Govt. Sector 80 Dividends paid by business 120 Transfer payment by Govt. Sector (Domestic: Foreign, 8: 3) 22 Purchases by Govt. Sector 292
Indirect taxes paid by business 130 Exports of goods and services 24 Personal Income Tax 168 Dividends paid abroad 30 Factor incomes received by personal sector 1,064 Profit tax paid by business 104 Savings of Personal Sector 24 Savings of Business Sector 64
87. The value of GDP at Factor Cost is: a. 1,275 b. 1,286 c. 1,234 d. 1,262 e. 1,264. 88. The value of GNP at Factor Cost is: a. 1,232 b. 1,322 c. 1,228 d. 1,230 e. 1,235. 89. The value of GNP at Market Price is: a. 1,375 b. 1,348 c. 1,425 d. 1,380 e. 1,362. 90. The value of GDP at Market Price is: a. 1,392 b. 1,410 c. 1,380 d. 1,425 e. 1,390. 91. The value of Personal Disposable Income is: a. 915 b. 920 c. 912 d. 918 e. 910.
© 2004
The Ic
fai U
nivers
ity P
ress.A
ll righ
ts res
erved
.ISBN : 8
1-314
-0227
-4 Ref.
No.
MACWB 04
2004
04
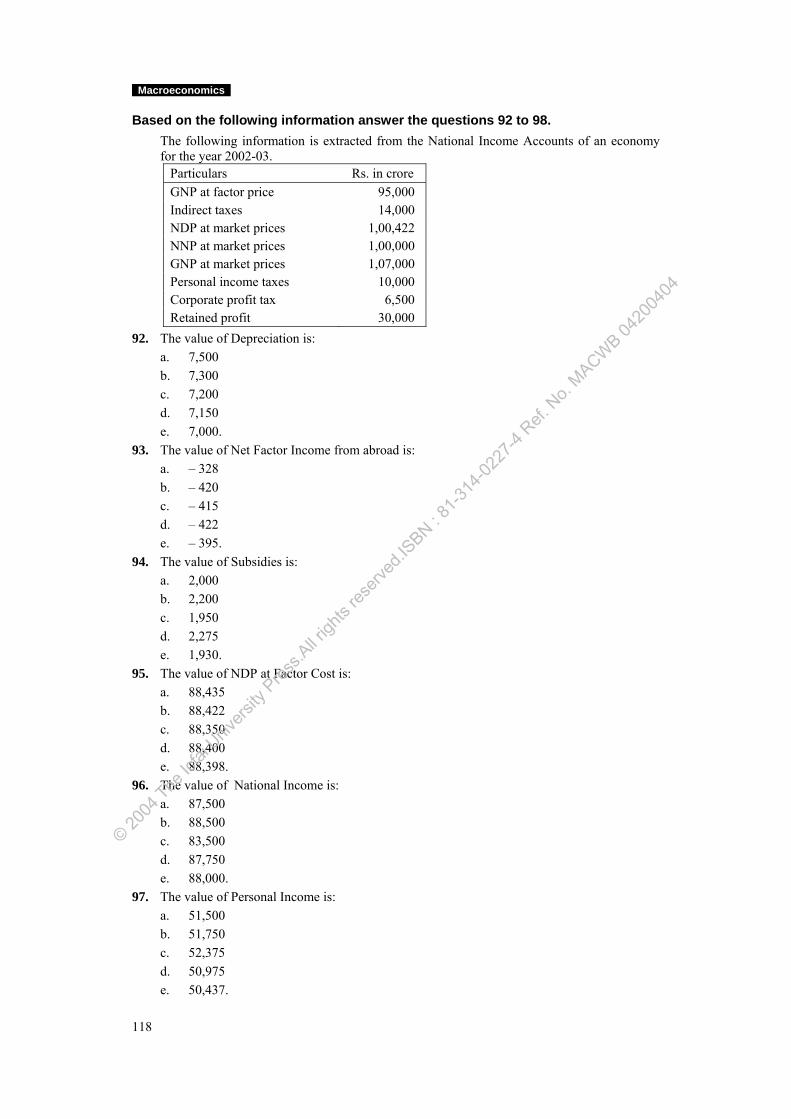
Macroeconomics
118
Based on the following information answer the questions 92 to 98. The following information is extracted from the National Income Accounts of an economy
for the year 2002-03. Particulars Rs. in crore GNP at factor price 95,000 Indirect taxes 14,000 NDP at market prices 1,00,422 NNP at market prices 1,00,000 GNP at market prices 1,07,000 Personal income taxes 10,000 Corporate profit tax 6,500 Retained profit 30,000
92. The value of Depreciation is: a. 7,500 b. 7,300 c. 7,200 d. 7,150 e. 7,000. 93. The value of Net Factor Income from abroad is: a. – 328 b. – 420 c. – 415 d. – 422 e. – 395. 94. The value of Subsidies is: a. 2,000 b. 2,200 c. 1,950 d. 2,275 e. 1,930. 95. The value of NDP at Factor Cost is: a. 88,435 b. 88,422 c. 88,350 d. 88,400 e. 88,398. 96. The value of National Income is: a. 87,500 b. 88,500 c. 83,500 d. 87,750 e. 88,000. 97. The value of Personal Income is: a. 51,500 b. 51,750 c. 52,375 d. 50,975 e. 50,437.
© 2004
The Ic
fai U
nivers
ity P
ress.A
ll righ
ts res
erved
.ISBN : 8
1-314
-0227
-4 Ref.
No.
MACWB 04
2004
04
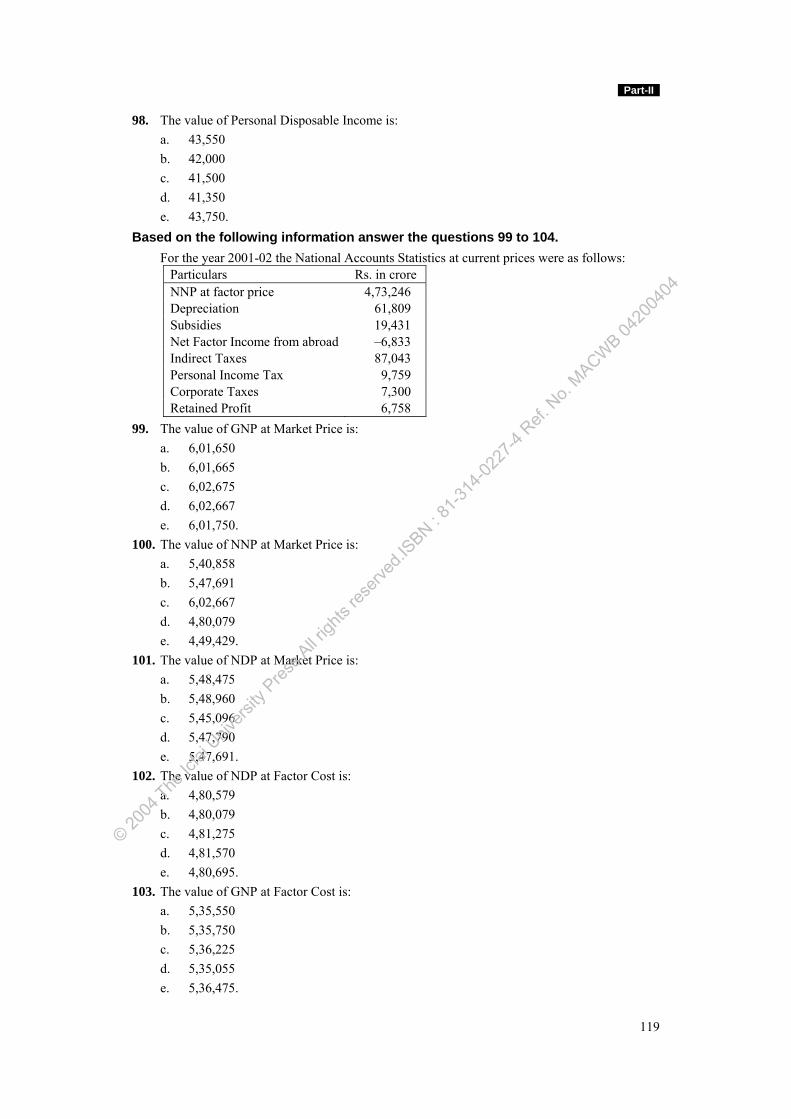
Part-II
119
98. The value of Personal Disposable Income is: a. 43,550 b. 42,000 c. 41,500 d. 41,350 e. 43,750. Based on the following information answer the questions 99 to 104. For the year 2001-02 the National Accounts Statistics at current prices were as follows:
Particulars Rs. in crore NNP at factor price 4,73,246 Depreciation 61,809 Subsidies 19,431 Net Factor Income from abroad –6,833 Indirect Taxes 87,043 Personal Income Tax 9,759 Corporate Taxes 7,300 Retained Profit 6,758
99. The value of GNP at Market Price is: a. 6,01,650 b. 6,01,665 c. 6,02,675 d. 6,02,667 e. 6,01,750. 100. The value of NNP at Market Price is: a. 5,40,858 b. 5,47,691 c. 6,02,667 d. 4,80,079 e. 4,49,429. 101. The value of NDP at Market Price is: a. 5,48,475 b. 5,48,960 c. 5,45,096 d. 5,47,790 e. 5,47,691. 102. The value of NDP at Factor Cost is: a. 4,80,579 b. 4,80,079 c. 4,81,275 d. 4,81,570 e. 4,80,695. 103. The value of GNP at Factor Cost is: a. 5,35,550 b. 5,35,750 c. 5,36,225 d. 5,35,055 e. 5,36,475.
© 2004
The Ic
fai U
nivers
ity P
ress.A
ll righ
ts res
erved
.ISBN : 8
1-314
-0227
-4 Ref.
No.
MACWB 04
2004
04
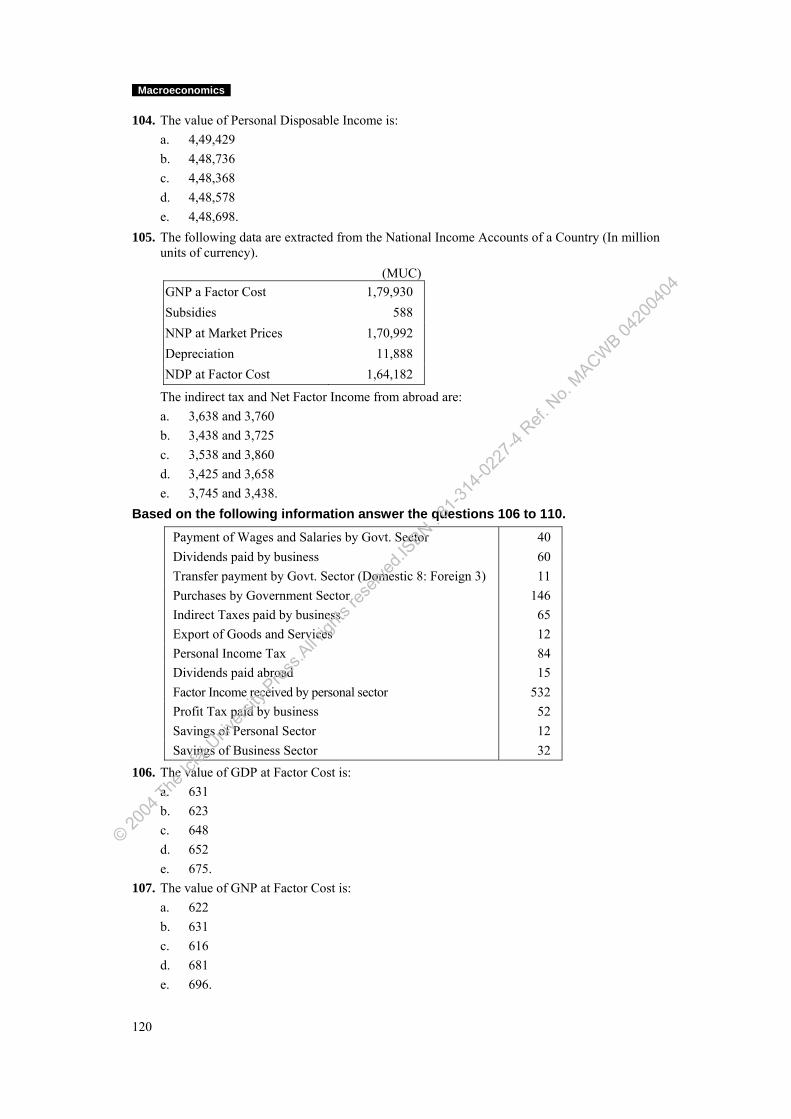
Macroeconomics
120
104. The value of Personal Disposable Income is: a. 4,49,429 b. 4,48,736 c. 4,48,368 d. 4,48,578 e. 4,48,698. 105. The following data are extracted from the National Income Accounts of a Country (In million
units of currency). (MUC)
GNP a Factor Cost 1,79,930 Subsidies 588 NNP at Market Prices 1,70,992 Depreciation 11,888 NDP at Factor Cost 1,64,182
The indirect tax and Net Factor Income from abroad are: a. 3,638 and 3,760 b. 3,438 and 3,725 c. 3,538 and 3,860 d. 3,425 and 3,658 e. 3,745 and 3,438. Based on the following information answer the questions 106 to 110.
Payment of Wages and Salaries by Govt. Sector 40 Dividends paid by business 60 Transfer payment by Govt. Sector (Domestic 8: Foreign 3) 11 Purchases by Government Sector 146 Indirect Taxes paid by business 65 Export of Goods and Services 12 Personal Income Tax 84 Dividends paid abroad 15 Factor Income received by personal sector 532 Profit Tax paid by business 52 Savings of Personal Sector 12 Savings of Business Sector 32
106. The value of GDP at Factor Cost is: a. 631 b. 623 c. 648 d. 652 e. 675. 107. The value of GNP at Factor Cost is: a. 622 b. 631 c. 616 d. 681 e. 696.
© 2004
The Ic
fai U
nivers
ity P
ress.A
ll righ
ts res
erved
.ISBN : 8
1-314
-0227
-4 Ref.
No.
MACWB 04
2004
04
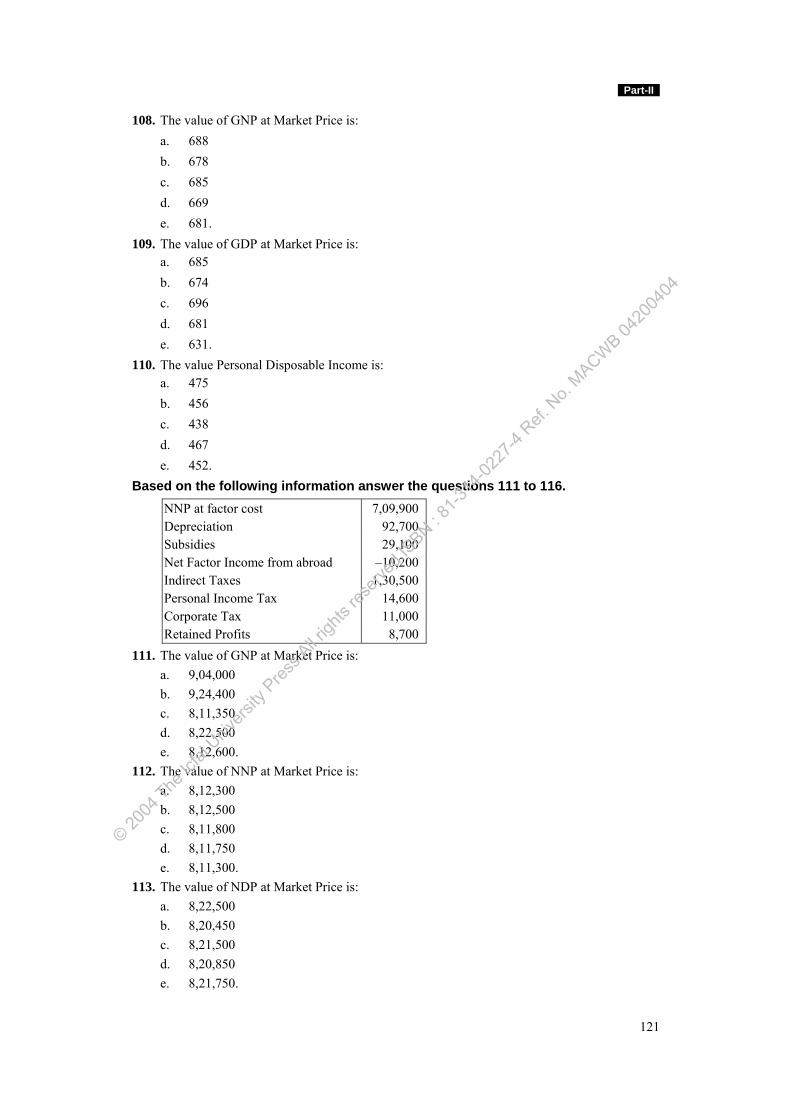
Part-II
121
108. The value of GNP at Market Price is: a. 688 b. 678 c. 685 d. 669 e. 681. 109. The value of GDP at Market Price is: a. 685 b. 674 c. 696 d. 681 e. 631. 110. The value Personal Disposable Income is: a. 475 b. 456 c. 438 d. 467 e. 452. Based on the following information answer the questions 111 to 116.
NNP at factor cost 7,09,900 Depreciation 92,700 Subsidies 29,100 Net Factor Income from abroad –10,200 Indirect Taxes 1,30,500 Personal Income Tax 14,600 Corporate Tax 11,000 Retained Profits 8,700
111. The value of GNP at Market Price is: a. 9,04,000 b. 9,24,400 c. 8,11,350 d. 8,22,500 e. 8,12,600. 112. The value of NNP at Market Price is: a. 8,12,300 b. 8,12,500 c. 8,11,800 d. 8,11,750 e. 8,11,300. 113. The value of NDP at Market Price is: a. 8,22,500 b. 8,20,450 c. 8,21,500 d. 8,20,850 e. 8,21,750.
© 2004
The Ic
fai U
nivers
ity P
ress.A
ll righ
ts res
erved
.ISBN : 8
1-314
-0227
-4 Ref.
No.
MACWB 04
2004
04
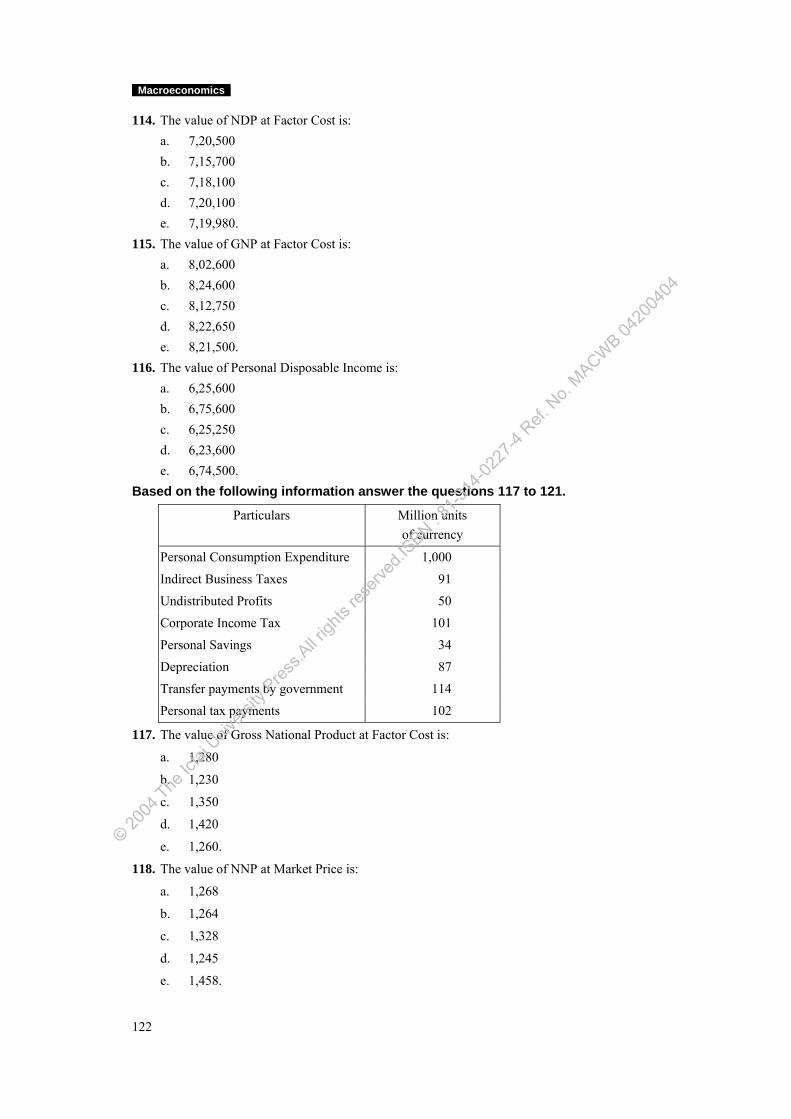
Macroeconomics
122
114. The value of NDP at Factor Cost is: a. 7,20,500 b. 7,15,700 c. 7,18,100 d. 7,20,100 e. 7,19,980. 115. The value of GNP at Factor Cost is: a. 8,02,600 b. 8,24,600 c. 8,12,750 d. 8,22,650 e. 8,21,500. 116. The value of Personal Disposable Income is: a. 6,25,600 b. 6,75,600 c. 6,25,250 d. 6,23,600 e. 6,74,500. Based on the following information answer the questions 117 to 121.
Particulars Million units of currency
Personal Consumption Expenditure 1,000
Indirect Business Taxes 91
Undistributed Profits 50
Corporate Income Tax 101
Personal Savings 34
Depreciation 87
Transfer payments by government 114
Personal tax payments 102
117. The value of Gross National Product at Factor Cost is:
a. 1,280
b. 1,230
c. 1,350
d. 1,420
e. 1,260.
118. The value of NNP at Market Price is:
a. 1,268
b. 1,264
c. 1,328
d. 1,245
e. 1,458.
© 2004
The Ic
fai U
nivers
ity P
ress.A
ll righ
ts res
erved
.ISBN : 8
1-314
-0227
-4 Ref.
No.
MACWB 04
2004
04
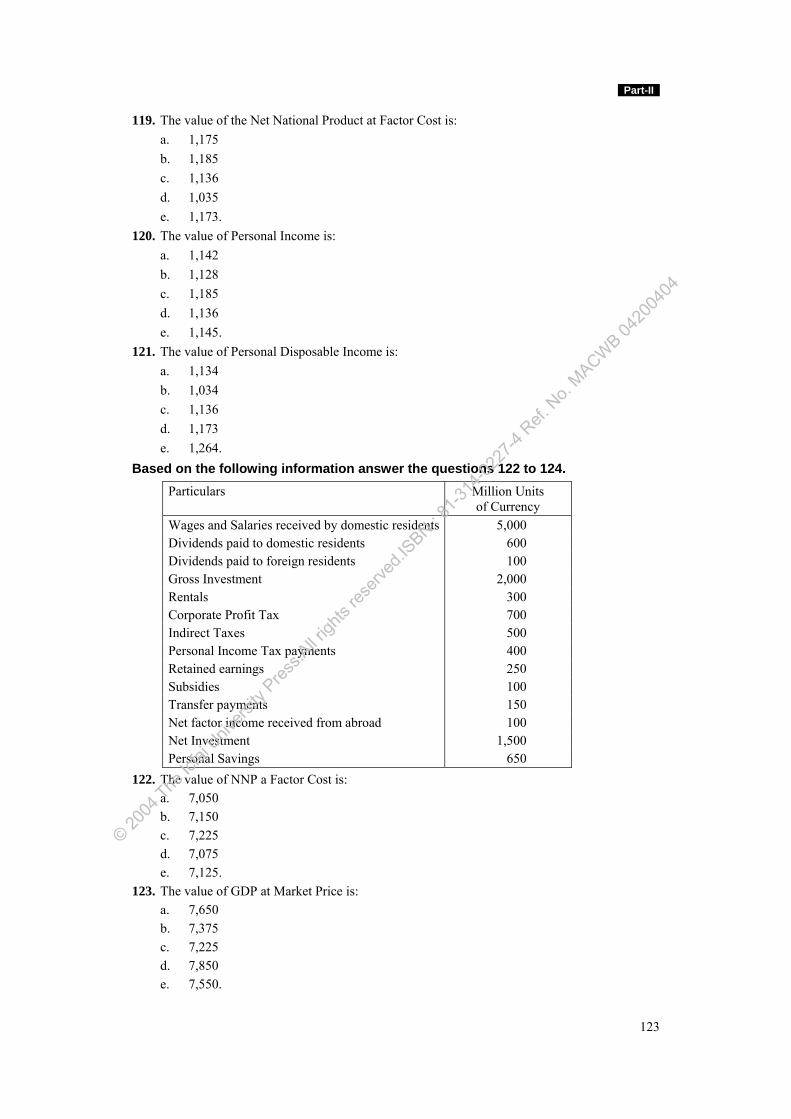
Part-II
123
119. The value of the Net National Product at Factor Cost is: a. 1,175 b. 1,185 c. 1,136 d. 1,035 e. 1,173. 120. The value of Personal Income is: a. 1,142 b. 1,128 c. 1,185 d. 1,136 e. 1,145. 121. The value of Personal Disposable Income is: a. 1,134 b. 1,034 c. 1,136 d. 1,173 e. 1,264. Based on the following information answer the questions 122 to 124.
Particulars Million Units of Currency
Wages and Salaries received by domestic residents 5,000 Dividends paid to domestic residents 600 Dividends paid to foreign residents 100 Gross Investment 2,000 Rentals 300 Corporate Profit Tax 700 Indirect Taxes 500 Personal Income Tax payments 400 Retained earnings 250 Subsidies 100 Transfer payments 150 Net factor income received from abroad 100 Net Investment 1,500 Personal Savings 650
122. The value of NNP a Factor Cost is: a. 7,050 b. 7,150 c. 7,225 d. 7,075 e. 7,125. 123. The value of GDP at Market Price is: a. 7,650 b. 7,375 c. 7,225 d. 7,850 e. 7,550.
© 2004
The Ic
fai U
nivers
ity P
ress.A
ll righ
ts res
erved
.ISBN : 8
1-314
-0227
-4 Ref.
No.
MACWB 04
2004
04
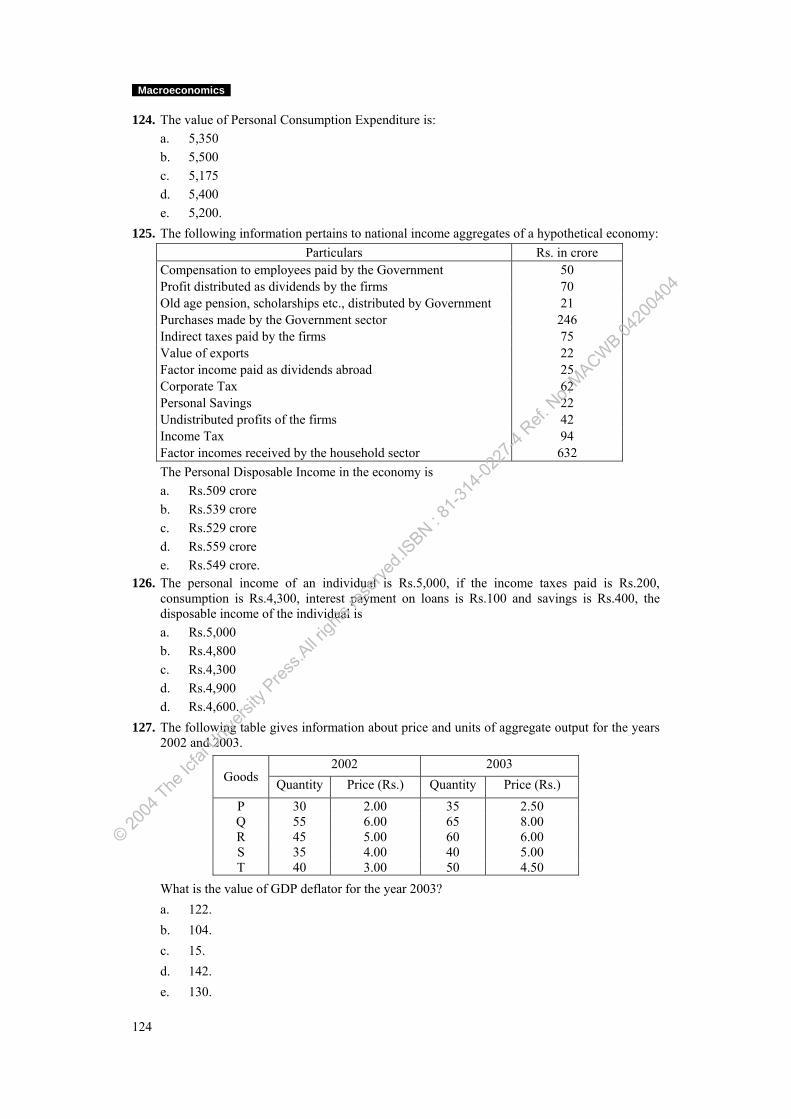
Macroeconomics
124
124. The value of Personal Consumption Expenditure is: a. 5,350 b. 5,500 c. 5,175 d. 5,400 e. 5,200. 125. The following information pertains to national income aggregates of a hypothetical economy:
Particulars Rs. in crore Compensation to employees paid by the Government 50 Profit distributed as dividends by the firms 70 Old age pension, scholarships etc., distributed by Government 21 Purchases made by the Government sector 246 Indirect taxes paid by the firms 75 Value of exports 22 Factor income paid as dividends abroad 25 Corporate Tax 62 Personal Savings 22 Undistributed profits of the firms 42 Income Tax 94 Factor incomes received by the household sector 632
The Personal Disposable Income in the economy is a. Rs.509 crore b. Rs.539 crore c. Rs.529 crore d. Rs.559 crore e. Rs.549 crore. 126. The personal income of an individual is Rs.5,000, if the income taxes paid is Rs.200,
consumption is Rs.4,300, interest payment on loans is Rs.100 and savings is Rs.400, the disposable income of the individual is a. Rs.5,000 b. Rs.4,800 c. Rs.4,300 d. Rs.4,900 d. Rs.4,600.
127. The following table gives information about price and units of aggregate output for the years 2002 and 2003.
2002 2003 Goods Quantity Price (Rs.) Quantity Price (Rs.)
P 30 2.00 35 2.50 Q 55 6.00 65 8.00 R 45 5.00 60 6.00 S 35 4.00 40 5.00 T 40 3.00 50 4.50
What is the value of GDP deflator for the year 2003? a. 122. b. 104. c. 15. d. 142. e. 130.
© 2004
The Ic
fai U
nivers
ity P
ress.A
ll righ
ts res
erved
.ISBN : 8
1-314
-0227
-4 Ref.
No.
MACWB 04
2004
04
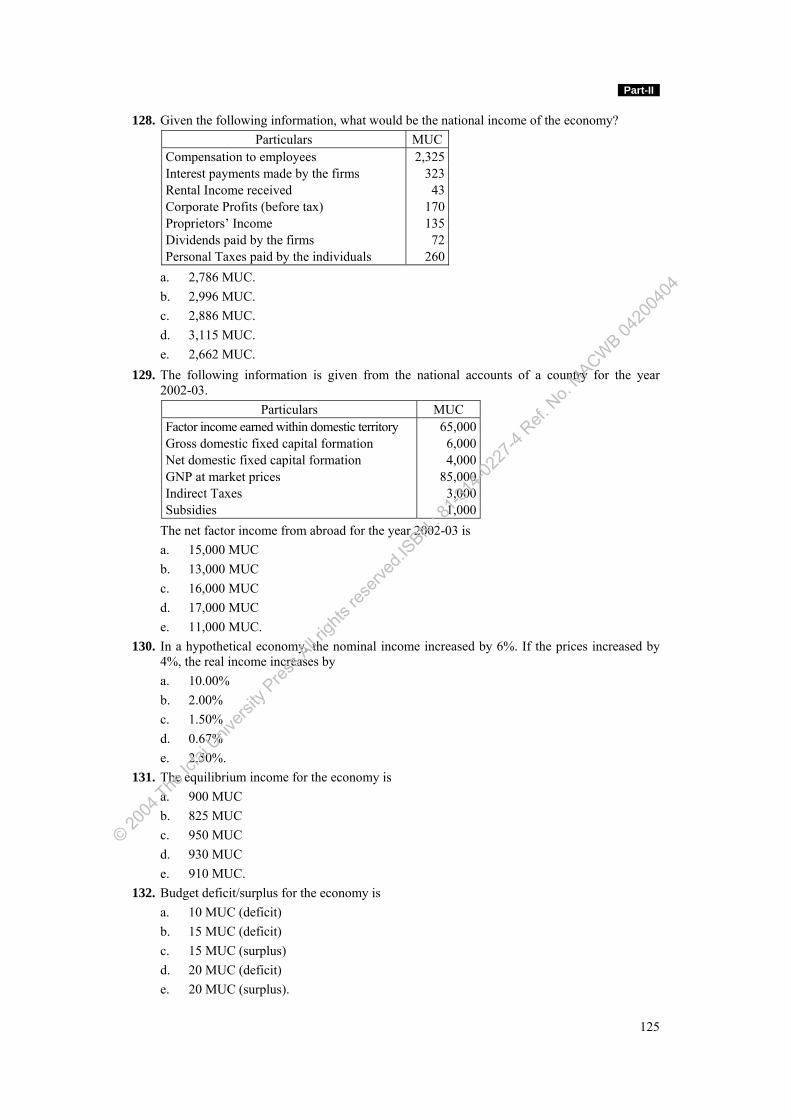
Part-II
125
128. Given the following information, what would be the national income of the economy? Particulars MUC
Compensation to employees 2,325Interest payments made by the firms 323Rental Income received 43Corporate Profits (before tax) 170Proprietors’ Income 135Dividends paid by the firms 72Personal Taxes paid by the individuals 260
a. 2,786 MUC. b. 2,996 MUC. c. 2,886 MUC. d. 3,115 MUC. e. 2,662 MUC. 129. The following information is given from the national accounts of a country for the year
2002-03. Particulars MUC
Factor income earned within domestic territory 65,000Gross domestic fixed capital formation 6,000Net domestic fixed capital formation 4,000GNP at market prices 85,000Indirect Taxes 3,000Subsidies 1,000
The net factor income from abroad for the year 2002-03 is a. 15,000 MUC b. 13,000 MUC c. 16,000 MUC d. 17,000 MUC e. 11,000 MUC. 130. In a hypothetical economy, the nominal income increased by 6%. If the prices increased by
4%, the real income increases by a. 10.00% b. 2.00% c. 1.50% d. 0.67% e. 2.50%. 131. The equilibrium income for the economy is a. 900 MUC b. 825 MUC c. 950 MUC d. 930 MUC e. 910 MUC. 132. Budget deficit/surplus for the economy is a. 10 MUC (deficit) b. 15 MUC (deficit) c. 15 MUC (surplus) d. 20 MUC (deficit) e. 20 MUC (surplus).
© 2004
The Ic
fai U
nivers
ity P
ress.A
ll righ
ts res
erved
.ISBN : 8
1-314
-0227
-4 Ref.
No.
MACWB 04
2004
04
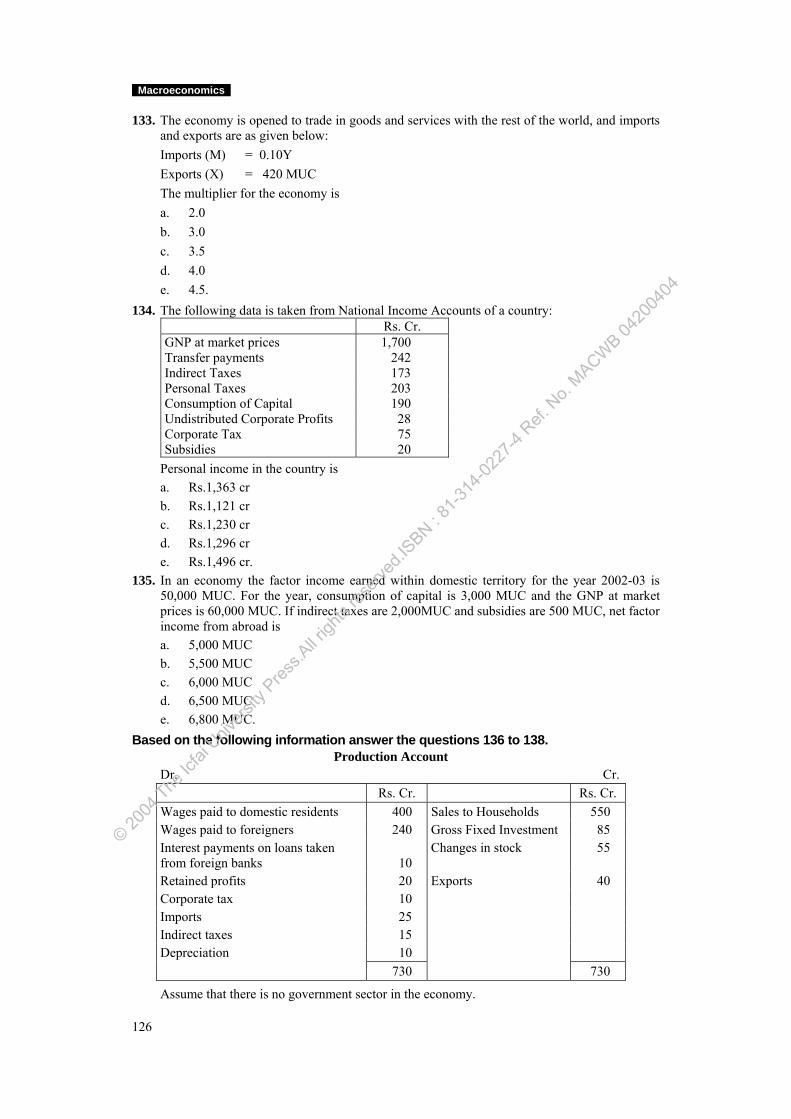
Macroeconomics
126
133. The economy is opened to trade in goods and services with the rest of the world, and imports and exports are as given below:
Imports (M) = 0.10Y Exports (X) = 420 MUC The multiplier for the economy is a. 2.0 b. 3.0 c. 3.5 d. 4.0 e. 4.5. 134. The following data is taken from National Income Accounts of a country:
Rs. Cr. GNP at market prices 1,700 Transfer payments 242 Indirect Taxes 173 Personal Taxes 203 Consumption of Capital 190 Undistributed Corporate Profits 28 Corporate Tax 75 Subsidies 20
Personal income in the country is a. Rs.1,363 cr b. Rs.1,121 cr c. Rs.1,230 cr d. Rs.1,296 cr e. Rs.1,496 cr. 135. In an economy the factor income earned within domestic territory for the year 2002-03 is
50,000 MUC. For the year, consumption of capital is 3,000 MUC and the GNP at market prices is 60,000 MUC. If indirect taxes are 2,000MUC and subsidies are 500 MUC, net factor income from abroad is
a. 5,000 MUC b. 5,500 MUC c. 6,000 MUC d. 6,500 MUC e. 6,800 MUC. Based on the following information answer the questions 136 to 138.
Production Account Dr. Cr. Rs. Cr. Rs. Cr. Wages paid to domestic residents 400 Sales to Households 550 Wages paid to foreigners 240 Gross Fixed Investment 85 Interest payments on loans taken from foreign banks 10
Changes in stock 55
Retained profits 20 Exports 40 Corporate tax 10 Imports 25 Indirect taxes 15 Depreciation 10 730 730
Assume that there is no government sector in the economy.
© 2004
The Ic
fai U
nivers
ity P
ress.A
ll righ
ts res
erved
.ISBN : 8
1-314
-0227
-4 Ref.
No.
MACWB 04
2004
04
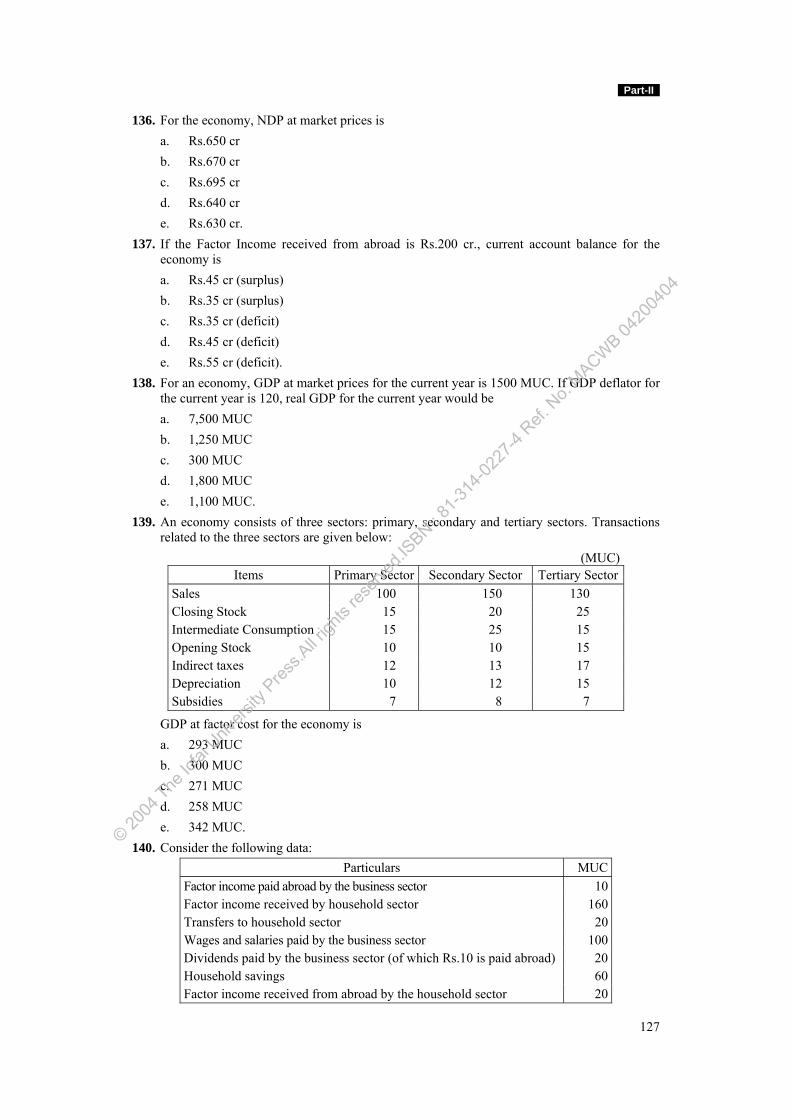
Part-II
127
136. For the economy, NDP at market prices is a. Rs.650 cr b. Rs.670 cr c. Rs.695 cr d. Rs.640 cr e. Rs.630 cr. 137. If the Factor Income received from abroad is Rs.200 cr., current account balance for the
economy is a. Rs.45 cr (surplus) b. Rs.35 cr (surplus) c. Rs.35 cr (deficit) d. Rs.45 cr (deficit) e. Rs.55 cr (deficit). 138. For an economy, GDP at market prices for the current year is 1500 MUC. If GDP deflator for
the current year is 120, real GDP for the current year would be a. 7,500 MUC b. 1,250 MUC c. 300 MUC d. 1,800 MUC e. 1,100 MUC. 139. An economy consists of three sectors: primary, secondary and tertiary sectors. Transactions
related to the three sectors are given below: (MUC)
Items Primary Sector Secondary Sector Tertiary Sector Sales 100 150 130 Closing Stock 15 20 25 Intermediate Consumption 15 25 15 Opening Stock 10 10 15 Indirect taxes 12 13 17 Depreciation 10 12 15 Subsidies 7 8 7
GDP at factor cost for the economy is a. 293 MUC b. 300 MUC c. 271 MUC d. 258 MUC e. 342 MUC. 140. Consider the following data:
Particulars MUC Factor income paid abroad by the business sector 10 Factor income received by household sector 160 Transfers to household sector 20 Wages and salaries paid by the business sector 100 Dividends paid by the business sector (of which Rs.10 is paid abroad) 20 Household savings 60 Factor income received from abroad by the household sector 20
© 2004
The Ic
fai U
nivers
ity P
ress.A
ll righ
ts res
erved
.ISBN : 8
1-314
-0227
-4 Ref.
No.
MACWB 04
2004
04
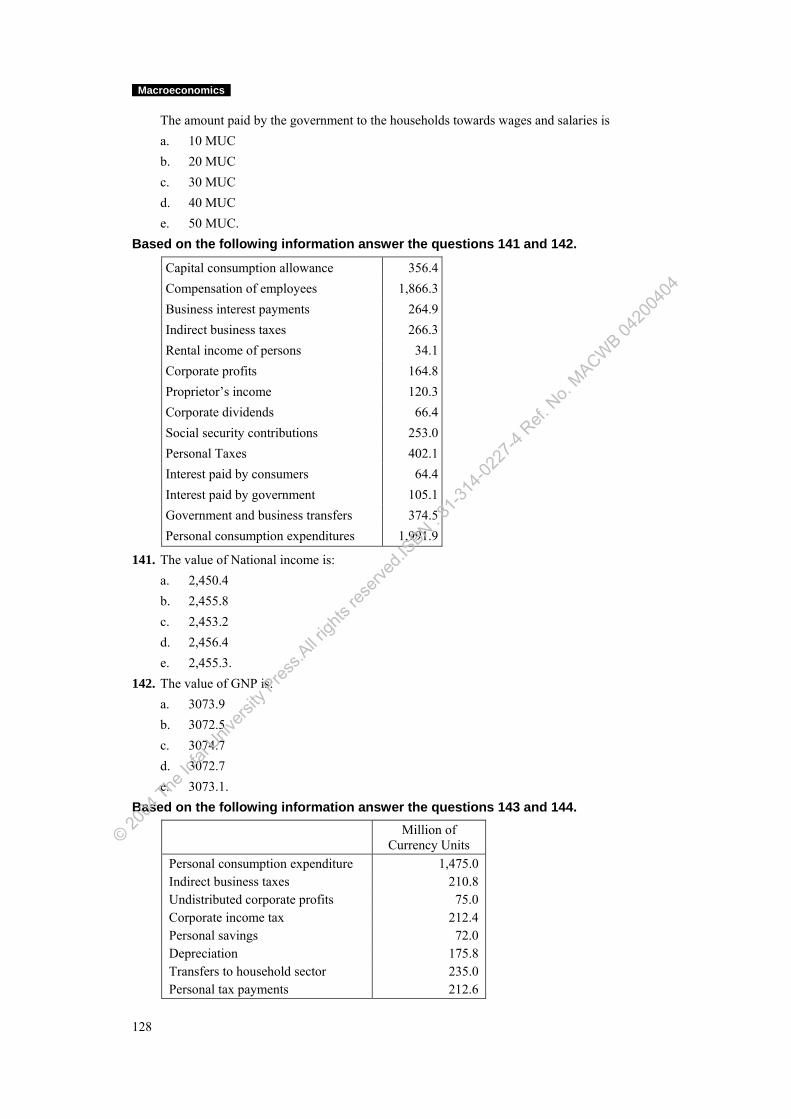
Macroeconomics
128
The amount paid by the government to the households towards wages and salaries is a. 10 MUC b. 20 MUC c. 30 MUC d. 40 MUC e. 50 MUC. Based on the following information answer the questions 141 and 142.
Capital consumption allowance 356.4Compensation of employees 1,866.3Business interest payments 264.9Indirect business taxes 266.3Rental income of persons 34.1Corporate profits 164.8Proprietor’s income 120.3Corporate dividends 66.4Social security contributions 253.0Personal Taxes 402.1Interest paid by consumers 64.4Interest paid by government 105.1Government and business transfers 374.5Personal consumption expenditures 1,991.9
141. The value of National income is: a. 2,450.4 b. 2,455.8 c. 2,453.2 d. 2,456.4 e. 2,455.3. 142. The value of GNP is: a. 3073.9 b. 3072.5 c. 3074.7 d. 3072.7 e. 3073.1. Based on the following information answer the questions 143 and 144.
Million of Currency Units
Personal consumption expenditure 1,475.0 Indirect business taxes 210.8 Undistributed corporate profits 75.0 Corporate income tax 212.4 Personal savings 72.0 Depreciation 175.8 Transfers to household sector 235.0 Personal tax payments 212.6
© 2004
The Ic
fai U
nivers
ity P
ress.A
ll righ
ts res
erved
.ISBN : 8
1-314
-0227
-4 Ref.
No.
MACWB 04
2004
04
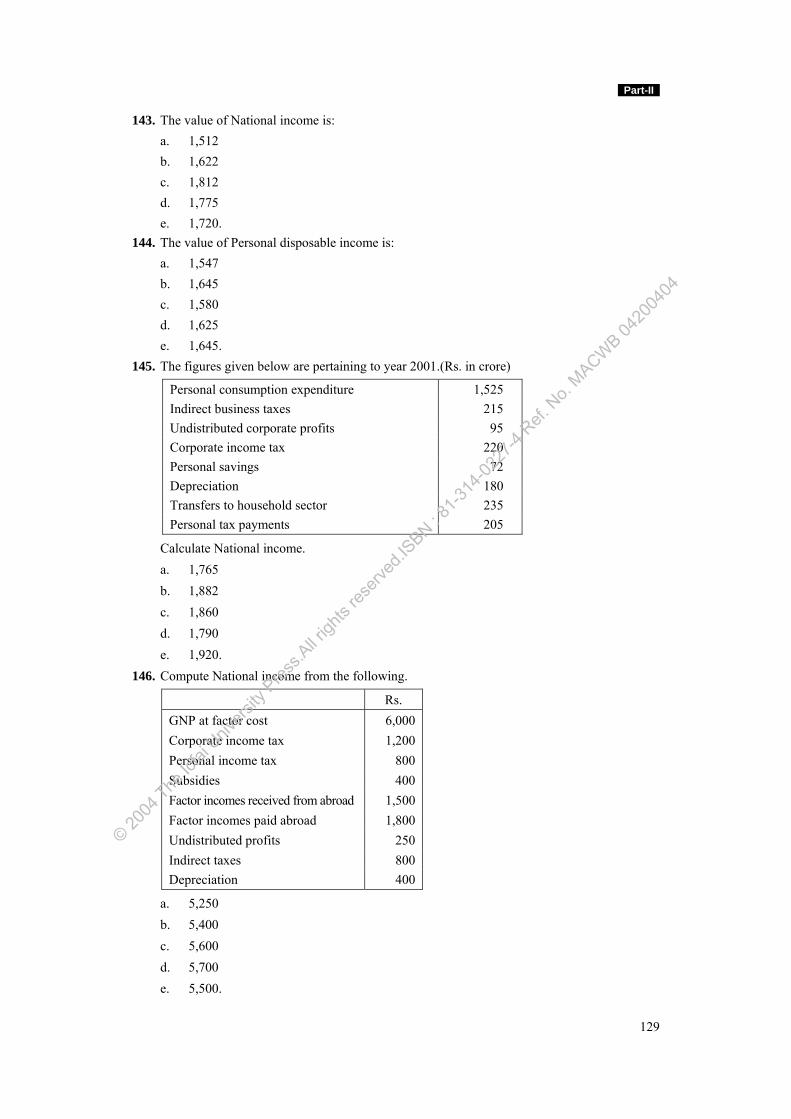
Part-II
129
143. The value of National income is: a. 1,512 b. 1,622 c. 1,812 d. 1,775 e. 1,720. 144. The value of Personal disposable income is: a. 1,547 b. 1,645 c. 1,580 d. 1,625 e. 1,645. 145. The figures given below are pertaining to year 2001. (Rs. in crore)
Personal consumption expenditure 1,525 Indirect business taxes 215 Undistributed corporate profits 95 Corporate income tax 220 Personal savings 72 Depreciation 180 Transfers to household sector 235 Personal tax payments 205
Calculate National income. a. 1,765 b. 1,882 c. 1,860 d. 1,790 e. 1,920. 146. Compute National income from the following.
Rs. GNP at factor cost 6,000 Corporate income tax 1,200 Personal income tax 800 Subsidies 400 Factor incomes received from abroad 1,500 Factor incomes paid abroad 1,800 Undistributed profits 250 Indirect taxes 800 Depreciation 400
a. 5,250 b. 5,400 c. 5,600 d. 5,700 e. 5,500.
© 2004
The Ic
fai U
nivers
ity P
ress.A
ll righ
ts res
erved
.ISBN : 8
1-314
-0227
-4 Ref.
No.
MACWB 04
2004
04
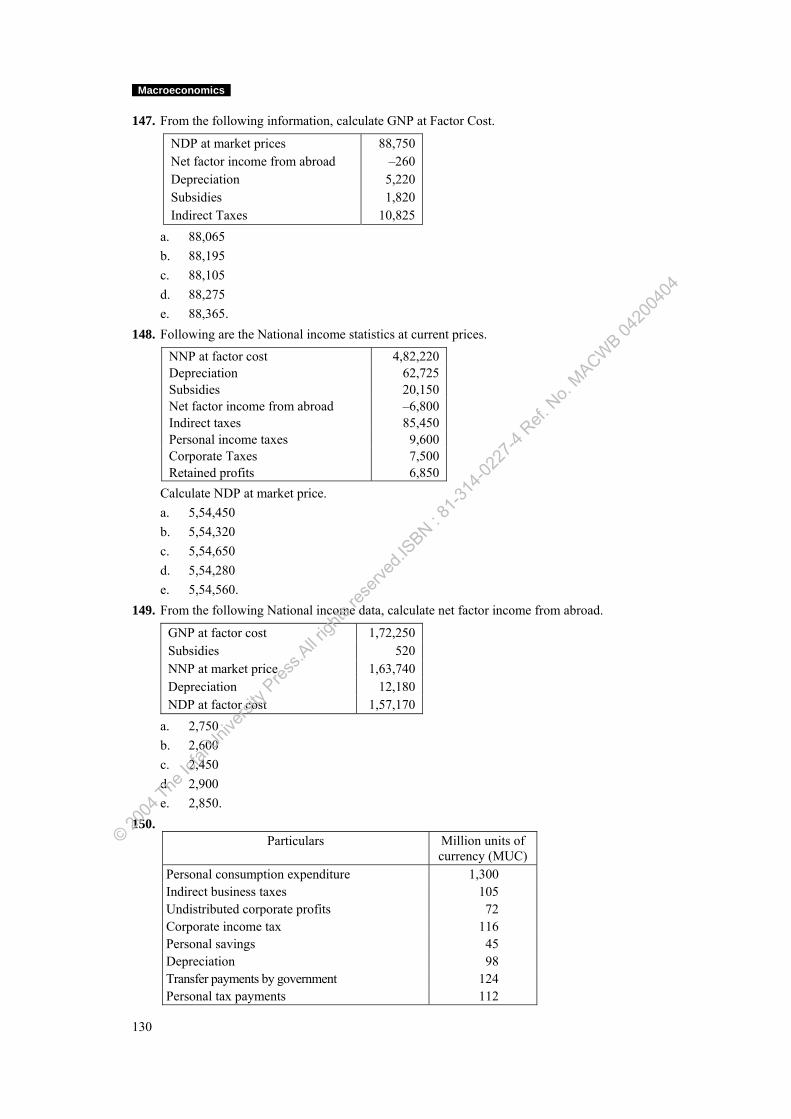
Macroeconomics
130
147. From the following information, calculate GNP at Factor Cost.
NDP at market prices 88,750 Net factor income from abroad –260 Depreciation 5,220 Subsidies 1,820 Indirect Taxes 10,825
a. 88,065 b. 88,195 c. 88,105 d. 88,275 e. 88,365. 148. Following are the National income statistics at current prices.
NNP at factor cost 4,82,220 Depreciation 62,725 Subsidies 20,150 Net factor income from abroad –6,800 Indirect taxes 85,450 Personal income taxes 9,600 Corporate Taxes 7,500 Retained profits 6,850
Calculate NDP at market price. a. 5,54,450 b. 5,54,320 c. 5,54,650 d. 5,54,280 e. 5,54,560. 149. From the following National income data, calculate net factor income from abroad.
GNP at factor cost 1,72,250 Subsidies 520 NNP at market price 1,63,740 Depreciation 12,180 NDP at factor cost 1,57,170
a. 2,750 b. 2,600 c. 2,450 d. 2,900 e. 2,850. 150.
Particulars Million units of currency (MUC)
Personal consumption expenditure 1,300 Indirect business taxes 105 Undistributed corporate profits 72 Corporate income tax 116 Personal savings 45 Depreciation 98 Transfer payments by government 124 Personal tax payments 112
© 2004
The Ic
fai U
nivers
ity P
ress.A
ll righ
ts res
erved
.ISBN : 8
1-314
-0227
-4 Ref.
No.
MACWB 04
2004
04
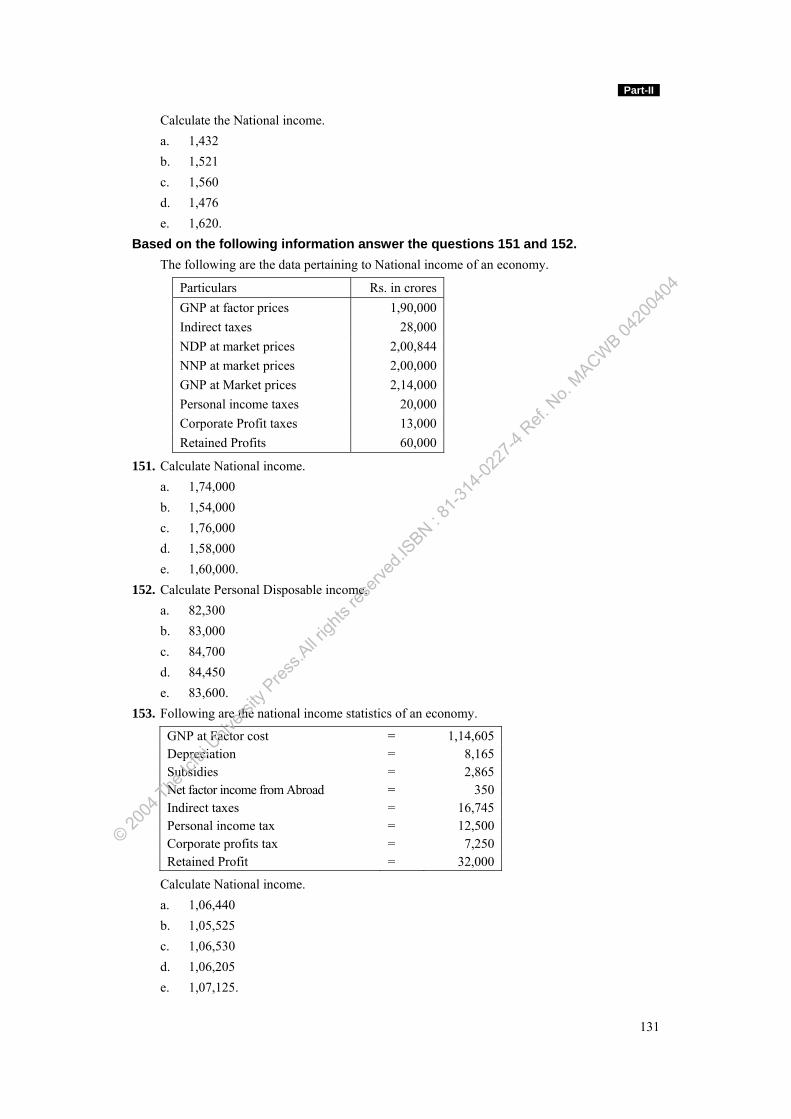
Part-II
131
Calculate the National income. a. 1,432 b. 1,521 c. 1,560 d. 1,476 e. 1,620. Based on the following information answer the questions 151 and 152. The following are the data pertaining to National income of an economy.
Particulars Rs. in crores GNP at factor prices 1,90,000 Indirect taxes 28,000 NDP at market prices 2,00,844 NNP at market prices 2,00,000 GNP at Market prices 2,14,000 Personal income taxes 20,000 Corporate Profit taxes 13,000 Retained Profits 60,000
151. Calculate National income. a. 1,74,000 b. 1,54,000 c. 1,76,000 d. 1,58,000 e. 1,60,000. 152. Calculate Personal Disposable income. a. 82,300 b. 83,000 c. 84,700 d. 84,450 e. 83,600. 153. Following are the national income statistics of an economy.
GNP at Factor cost = 1,14,605 Depreciation = 8,165 Subsidies = 2,865 Net factor income from Abroad = 350 Indirect taxes = 16,745 Personal income tax = 12,500 Corporate profits tax = 7,250 Retained Profit = 32,000
Calculate National income. a. 1,06,440 b. 1,05,525 c. 1,06,530 d. 1,06,205 e. 1,07,125.
© 2004
The Ic
fai U
nivers
ity P
ress.A
ll righ
ts res
erved
.ISBN : 8
1-314
-0227
-4 Ref.
No.
MACWB 04
2004
04
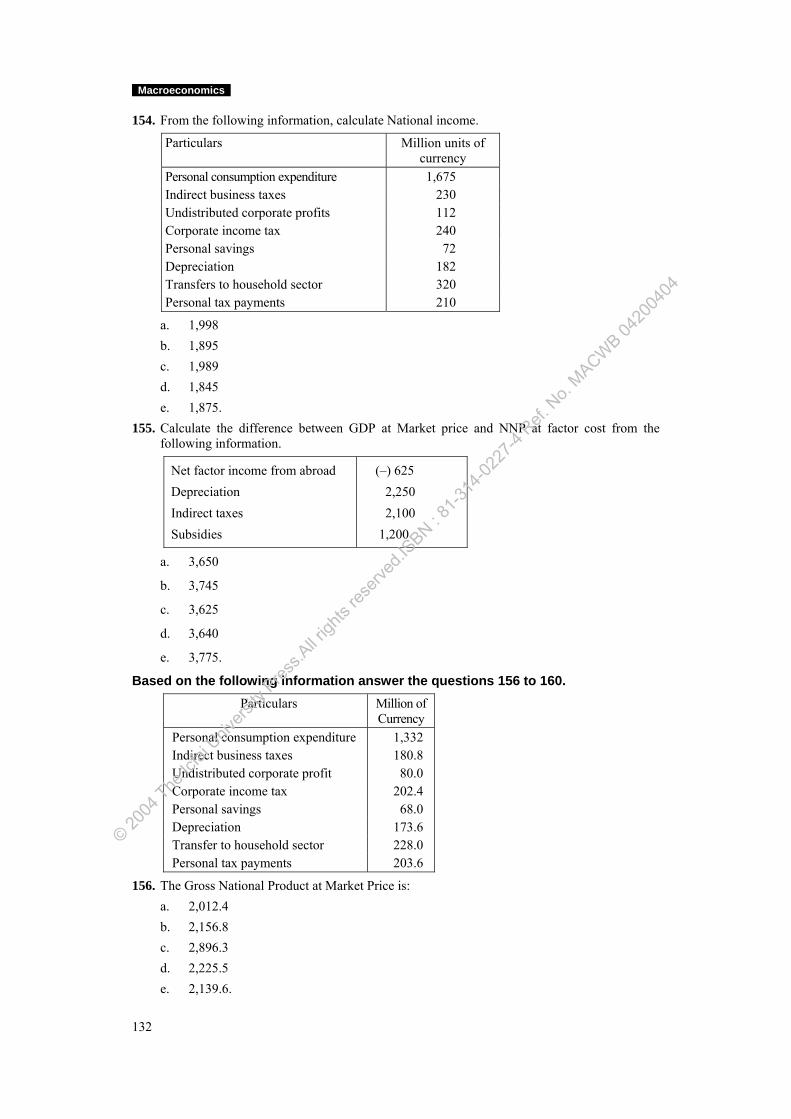
Macroeconomics
132
154. From the following information, calculate National income.
Particulars Million units of currency
Personal consumption expenditure 1,675 Indirect business taxes 230 Undistributed corporate profits 112 Corporate income tax 240 Personal savings 72 Depreciation 182 Transfers to household sector 320 Personal tax payments 210
a. 1,998 b. 1,895 c. 1,989 d. 1,845 e. 1,875. 155. Calculate the difference between GDP at Market price and NNP at factor cost from the
following information.
Net factor income from abroad Depreciation Indirect taxes Subsidies
(–) 625 2,250 2,100
1,200
a. 3,650
b. 3,745
c. 3,625
d. 3,640
e. 3,775.
Based on the following information answer the questions 156 to 160. Particulars Million of
Currency Personal consumption expenditure 1,332 Indirect business taxes 180.8 Undistributed corporate profit 80.0 Corporate income tax 202.4 Personal savings 68.0 Depreciation 173.6 Transfer to household sector 228.0 Personal tax payments 203.6
156. The Gross National Product at Market Price is: a. 2,012.4 b. 2,156.8 c. 2,896.3 d. 2,225.5 e. 2,139.6.
© 2004
The Ic
fai U
nivers
ity P
ress.A
ll righ
ts res
erved
.ISBN : 8
1-314
-0227
-4 Ref.
No.
MACWB 04
2004
04
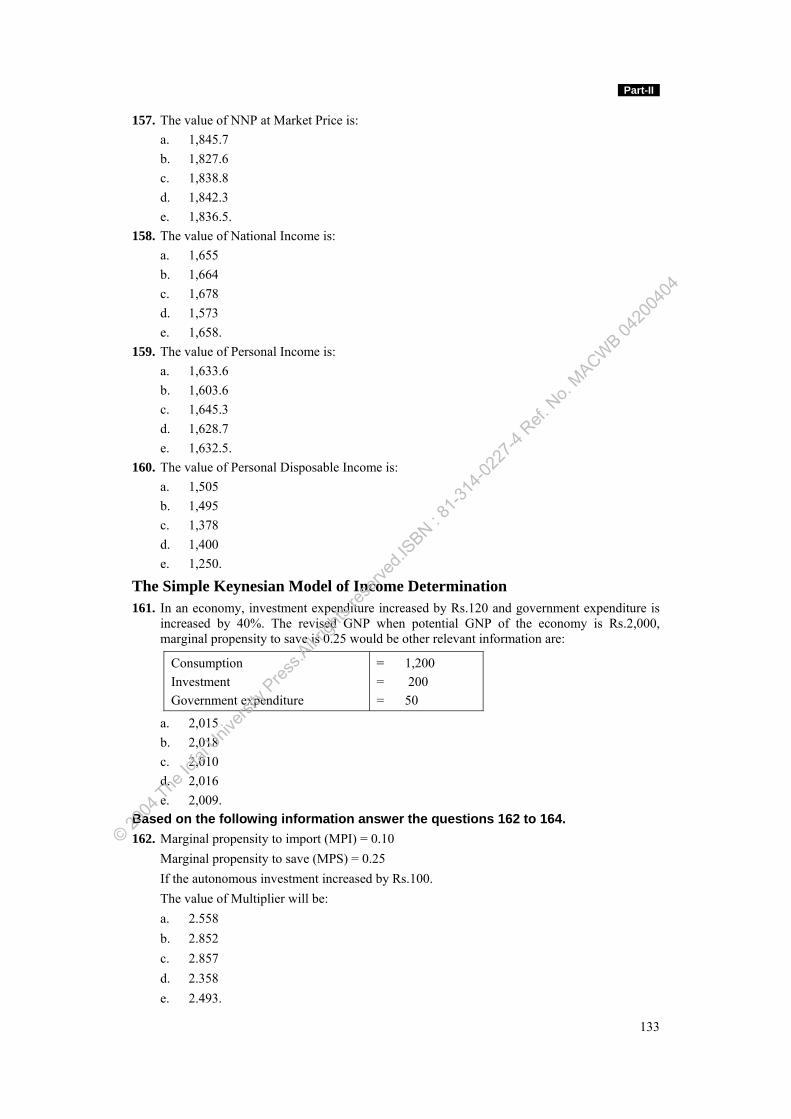
Part-II
133
157. The value of NNP at Market Price is: a. 1,845.7 b. 1,827.6 c. 1,838.8 d. 1,842.3 e. 1,836.5. 158. The value of National Income is: a. 1,655 b. 1,664 c. 1,678 d. 1,573 e. 1,658. 159. The value of Personal Income is: a. 1,633.6 b. 1,603.6 c. 1,645.3 d. 1,628.7 e. 1,632.5. 160. The value of Personal Disposable Income is: a. 1,505 b. 1,495 c. 1,378 d. 1,400 e. 1,250.
The Simple Keynesian Model of Income Determination 161. In an economy, investment expenditure increased by Rs.120 and government expenditure is
increased by 40%. The revised GNP when potential GNP of the economy is Rs.2,000, marginal propensity to save is 0.25 would be other relevant information are:
Consumption Investment Government expenditure
= 1,200 = 200 = 50
a. 2,015 b. 2,018 c. 2,010 d. 2,016 e. 2,009. Based on the following information answer the questions 162 to 164. 162. Marginal propensity to import (MPI) = 0.10 Marginal propensity to save (MPS) = 0.25
If the autonomous investment increased by Rs.100. The value of Multiplier will be: a. 2.558 b. 2.852 c. 2.857 d. 2.358 e. 2.493.
© 2004
The Ic
fai U
nivers
ity P
ress.A
ll righ
ts res
erved
.ISBN : 8
1-314
-0227
-4 Ref.
No.
MACWB 04
2004
04
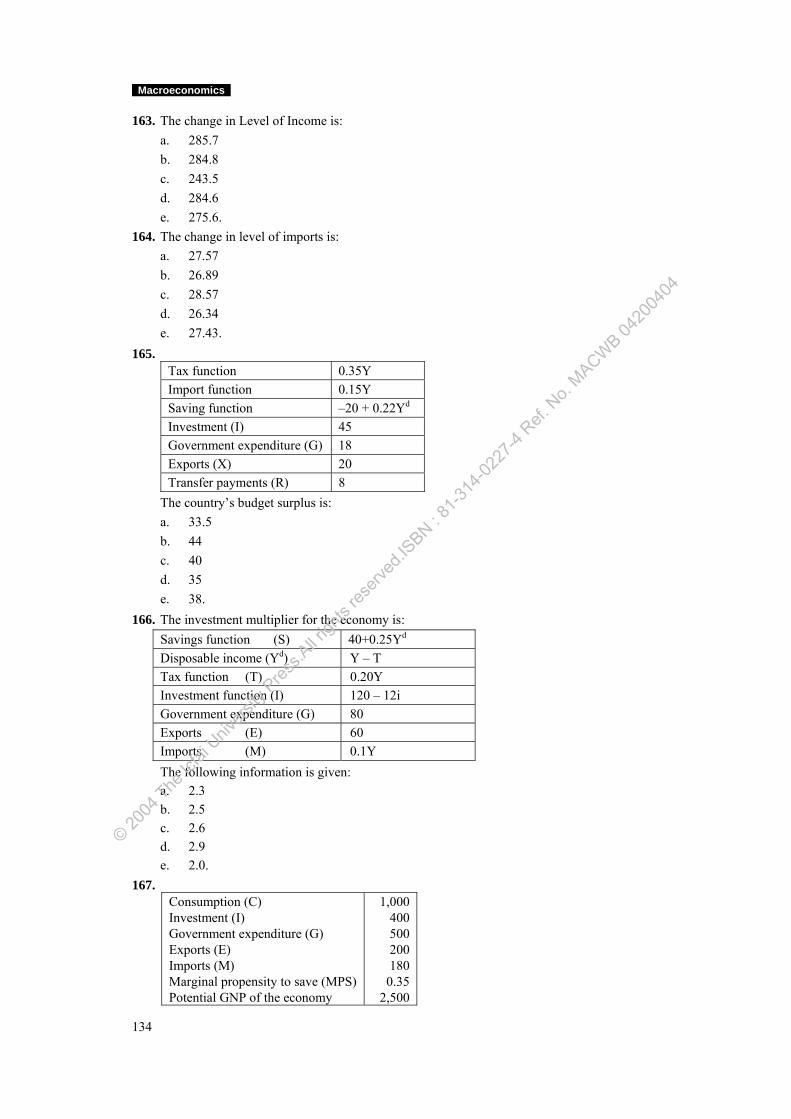
Macroeconomics
134
163. The change in Level of Income is: a. 285.7 b. 284.8 c. 243.5 d. 284.6 e. 275.6. 164. The change in level of imports is: a. 27.57 b. 26.89 c. 28.57 d. 26.34 e. 27.43. 165.
Tax function 0.35Y Import function 0.15Y Saving function –20 + 0.22Yd Investment (I) 45 Government expenditure (G) 18 Exports (X) 20 Transfer payments (R) 8
The country’s budget surplus is: a. 33.5 b. 44 c. 40 d. 35 e. 38. 166. The investment multiplier for the economy is:
Savings function (S) 40+0.25Yd Disposable income (Yd) Y – T Tax function (T) 0.20Y Investment function (I) 120 – 12i Government expenditure (G) 80 Exports (E) 60 Imports (M) 0.1Y
The following information is given: a. 2.3 b. 2.5 c. 2.6 d. 2.9 e. 2.0. 167.
Consumption (C) Investment (I) Government expenditure (G) Exports (E) Imports (M) Marginal propensity to save (MPS) Potential GNP of the economy
1,000 400 500 200 180
0.35 2,500
© 2004
The Ic
fai U
nivers
ity P
ress.A
ll righ
ts res
erved
.ISBN : 8
1-314
-0227
-4 Ref.
No.
MACWB 04
2004
04
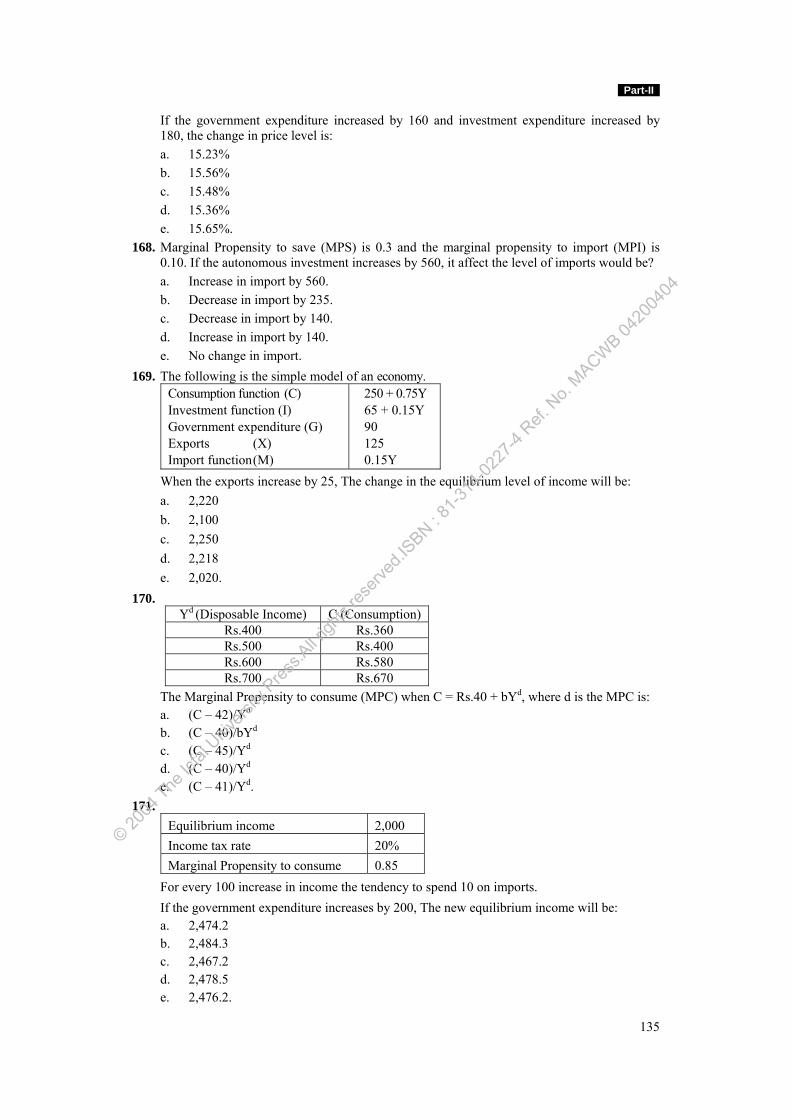
Part-II
135
If the government expenditure increased by 160 and investment expenditure increased by 180, the change in price level is:
a. 15.23% b. 15.56% c. 15.48% d. 15.36% e. 15.65%. 168. Marginal Propensity to save (MPS) is 0.3 and the marginal propensity to import (MPI) is
0.10. If the autonomous investment increases by 560, it affect the level of imports would be? a. Increase in import by 560. b. Decrease in import by 235. c. Decrease in import by 140. d. Increase in import by 140. e. No change in import. 169. The following is the simple model of an economy.
Consumption function (C) Investment function (I) Government expenditure (G) Exports (X) Import function (M)
250 + 0.75Y 65 + 0.15Y 90 125 0.15Y
When the exports increase by 25, The change in the equilibrium level of income will be: a. 2,220 b. 2,100 c. 2,250 d. 2,218 e. 2,020. 170.
Yd (Disposable Income) C (Consumption)
Rs.400 Rs.360 Rs.500 Rs.400 Rs.600 Rs.580 Rs.700 Rs.670
The Marginal Propensity to consume (MPC) when C = Rs.40 + bYd, where d is the MPC is: a. (C – 42)/Yd b. (C – 40)/bYd c. (C – 45)/Yd d. (C – 40)/Yd e. (C – 41)/Yd. 171.
Equilibrium income 2,000 Income tax rate 20% Marginal Propensity to consume 0.85
For every 100 increase in income the tendency to spend 10 on imports. If the government expenditure increases by 200, The new equilibrium income will be: a. 2,474.2 b. 2,484.3 c. 2,467.2 d. 2,478.5 e. 2,476.2.
© 2004
The Ic
fai U
nivers
ity P
ress.A
ll righ
ts res
erved
.ISBN : 8
1-314
-0227
-4 Ref.
No.
MACWB 04
2004
04
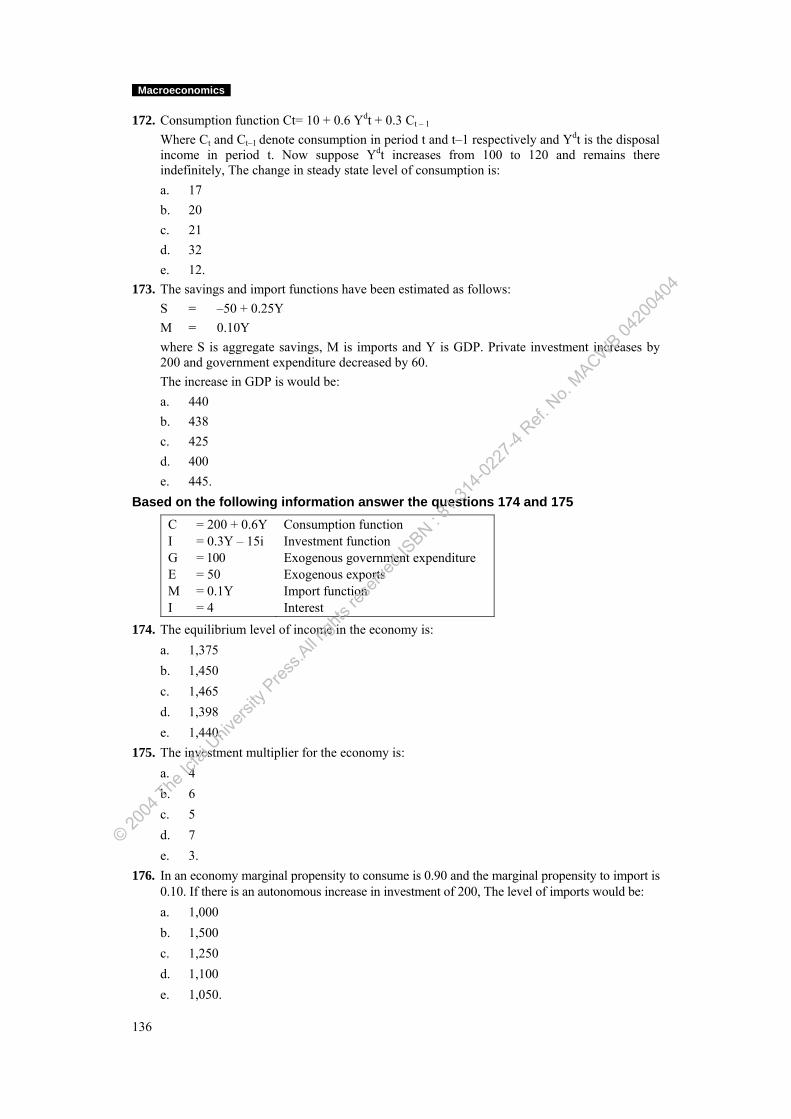
Macroeconomics
136
172. Consumption function Ct = 10 + 0.6 Ydt + 0.3 Ct – 1 Where Ct and Ct–1 denote consumption in period t and t–1 respectively and Ydt is the disposal
income in period t. Now suppose Ydt increases from 100 to 120 and remains there indefinitely, The change in steady state level of consumption is:
a. 17 b. 20 c. 21 d. 32 e. 12. 173. The savings and import functions have been estimated as follows: S = –50 + 0.25Y M = 0.10Y where S is aggregate savings, M is imports and Y is GDP. Private investment increases by
200 and government expenditure decreased by 60. The increase in GDP is would be: a. 440 b. 438 c. 425 d. 400 e. 445. Based on the following information answer the questions 174 and 175
C = 200 + 0.6Y I = 0.3Y – 15i G = 100 E = 50 M = 0.1Y I = 4
Consumption function Investment function Exogenous government expenditure Exogenous exports Import function Interest
174. The equilibrium level of income in the economy is: a. 1,375 b. 1,450 c. 1,465 d. 1,398 e. 1,440. 175. The investment multiplier for the economy is: a. 4 b. 6 c. 5 d. 7 e. 3. 176. In an economy marginal propensity to consume is 0.90 and the marginal propensity to import is
0.10. If there is an autonomous increase in investment of 200, The level of imports would be: a. 1,000 b. 1,500 c. 1,250 d. 1,100 e. 1,050.
© 2004
The Ic
fai U
nivers
ity P
ress.A
ll righ
ts res
erved
.ISBN : 8
1-314
-0227
-4 Ref.
No.
MACWB 04
2004
04
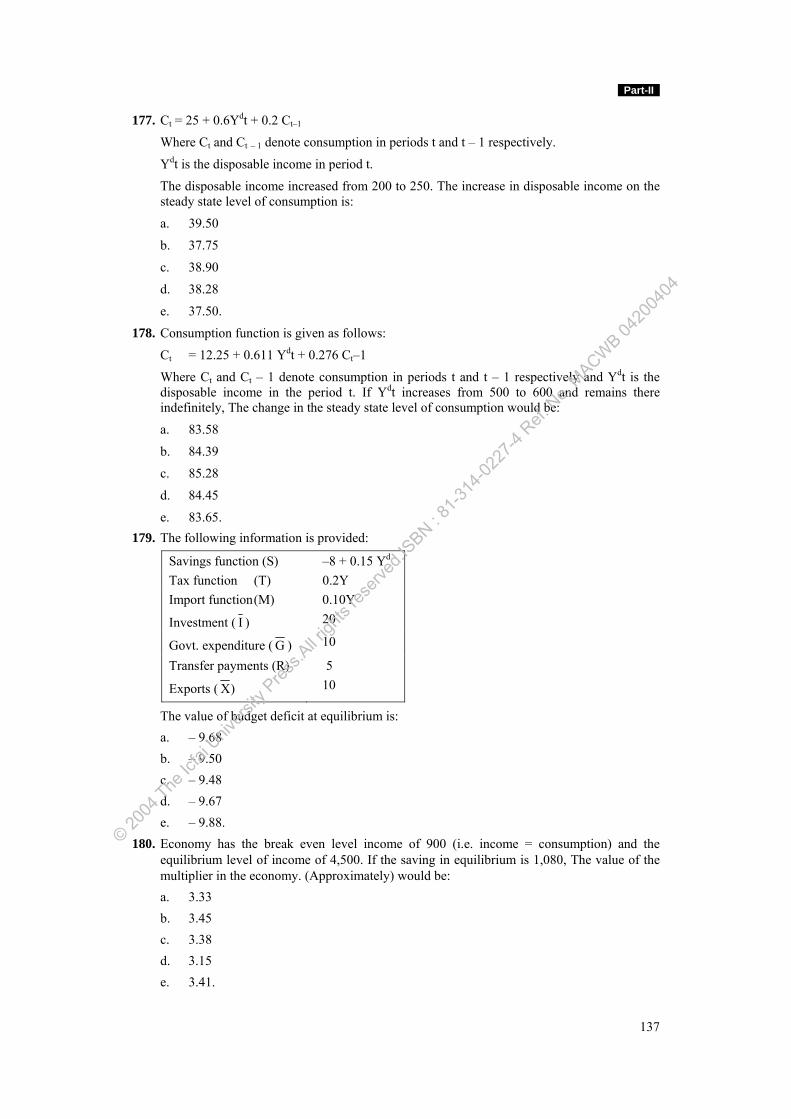
Part-II
137
177. Ct = 25 + 0.6Ydt + 0.2 Ct–1
Where Ct and Ct – 1 denote consumption in periods t and t – 1 respectively.
Ydt is the disposable income in period t.
The disposable income increased from 200 to 250. The increase in disposable income on the steady state level of consumption is:
a. 39.50
b. 37.75
c. 38.90
d. 38.28
e. 37.50.
178. Consumption function is given as follows:
Ct = 12.25 + 0.611 Ydt + 0.276 Ct–1
Where Ct and Ct – 1 denote consumption in periods t and t – 1 respectively and Ydt is the disposable income in the period t. If Ydt increases from 500 to 600 and remains there indefinitely, The change in the steady state level of consumption would be:
a. 83.58
b. 84.39
c. 85.28
d. 84.45
e. 83.65. 179. The following information is provided:
Savings function (S) –8 + 0.15 Yd Tax function (T) 0.2Y Import function (M) 0.10Y Investment ( I ) 20
Govt. expenditure ( G ) 10
Transfer payments (R) 5
Exports ( X) 10
The value of budget deficit at equilibrium is: a. – 9.68 b. – 9.50 c. – 9.48 d. – 9.67 e. – 9.88. 180. Economy has the break even level income of 900 (i.e. income = consumption) and the
equilibrium level of income of 4,500. If the saving in equilibrium is 1,080, The value of the multiplier in the economy. (Approximately) would be:
a. 3.33 b. 3.45 c. 3.38 d. 3.15 e. 3.41.
© 2004
The Ic
fai U
nivers
ity P
ress.A
ll righ
ts res
erved
.ISBN : 8
1-314
-0227
-4 Ref.
No.
MACWB 04
2004
04
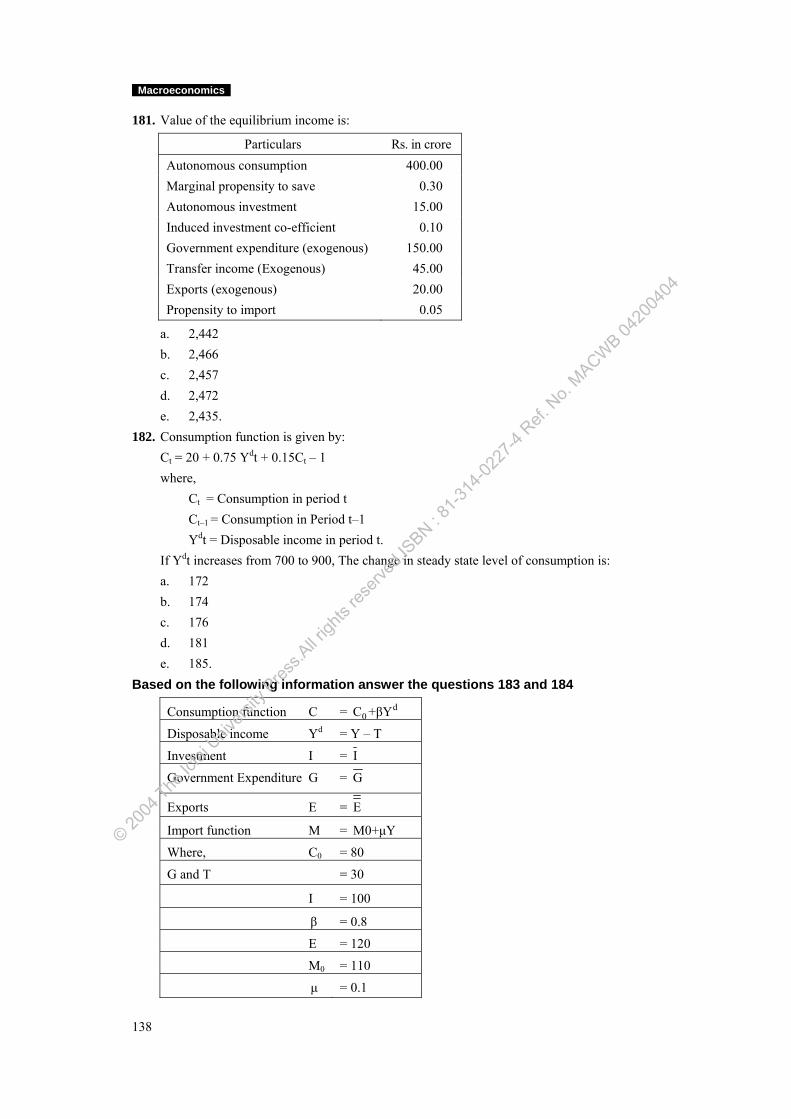
Macroeconomics
138
181. Value of the equilibrium income is:
Particulars Rs. in crore Autonomous consumption 400.00 Marginal propensity to save 0.30 Autonomous investment 15.00 Induced investment co-efficient 0.10 Government expenditure (exogenous) 150.00 Transfer income (Exogenous) 45.00 Exports (exogenous) 20.00 Propensity to import 0.05
a. 2,442 b. 2,466 c. 2,457 d. 2,472 e. 2,435. 182. Consumption function is given by: Ct = 20 + 0.75 Ydt + 0.15Ct – 1 where, Ct = Consumption in period t Ct–1 = Consumption in Period t–1 Ydt = Disposable income in period t. If Ydt increases from 700 to 900, The change in steady state level of consumption is: a. 172 b. 174 c. 176 d. 181 e. 185. Based on the following information answer the questions 183 and 184
Consumption function C = d0C +βY
Disposable income Yd = Y – T
Investment I = I
Government Expenditure G = G
Exports E = E
Import function M = M0+μY
Where, C0 = 80
G and T = 30
I = 100
β = 0.8
E = 120
M0 = 110
μ = 0.1
© 2004
The Ic
fai U
nivers
ity P
ress.A
ll righ
ts res
erved
.ISBN : 8
1-314
-0227
-4 Ref.
No.
MACWB 04
2004
04
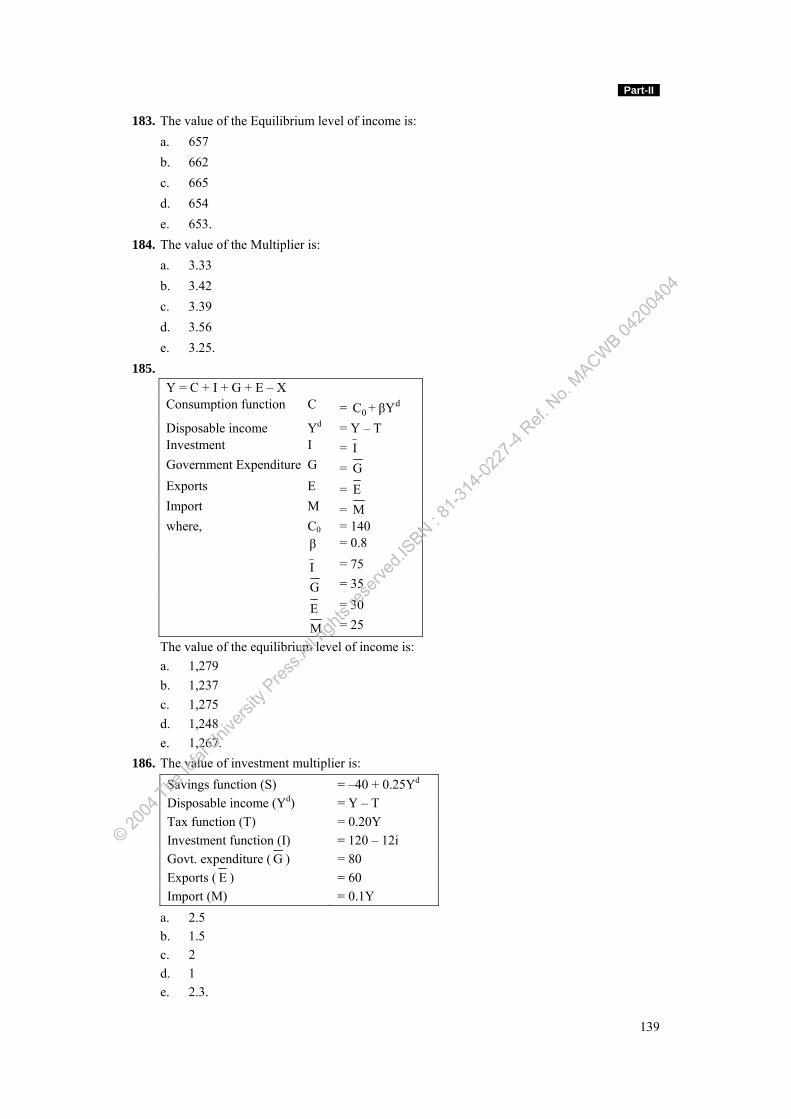
Part-II
139
183. The value of the Equilibrium level of income is: a. 657 b. 662 c. 665 d. 654 e. 653. 184. The value of the Multiplier is: a. 3.33 b. 3.42 c. 3.39 d. 3.56 e. 3.25. 185.
Y = C + I + G + E – X Consumption function C = d
0C + βY Disposable income Yd = Y – T Investment I = I Government Expenditure G = G Exports E = E Import M = M where, C0 = 140 β = 0.8
I = 75
G = 35
E = 30
M = 25
The value of the equilibrium level of income is: a. 1,279 b. 1,237 c. 1,275 d. 1,248 e. 1,267. 186. The value of investment multiplier is:
Savings function (S) = –40 + 0.25Yd Disposable income (Yd) = Y – T Tax function (T) = 0.20Y Investment function (I) = 120 – 12i Govt. expenditure ( G ) = 80 Exports ( E ) = 60 Import (M) = 0.1Y
a. 2.5 b. 1.5 c. 2 d. 1 e. 2.3.
© 2004
The Ic
fai U
nivers
ity P
ress.A
ll righ
ts res
erved
.ISBN : 8
1-314
-0227
-4 Ref.
No.
MACWB 04
2004
04
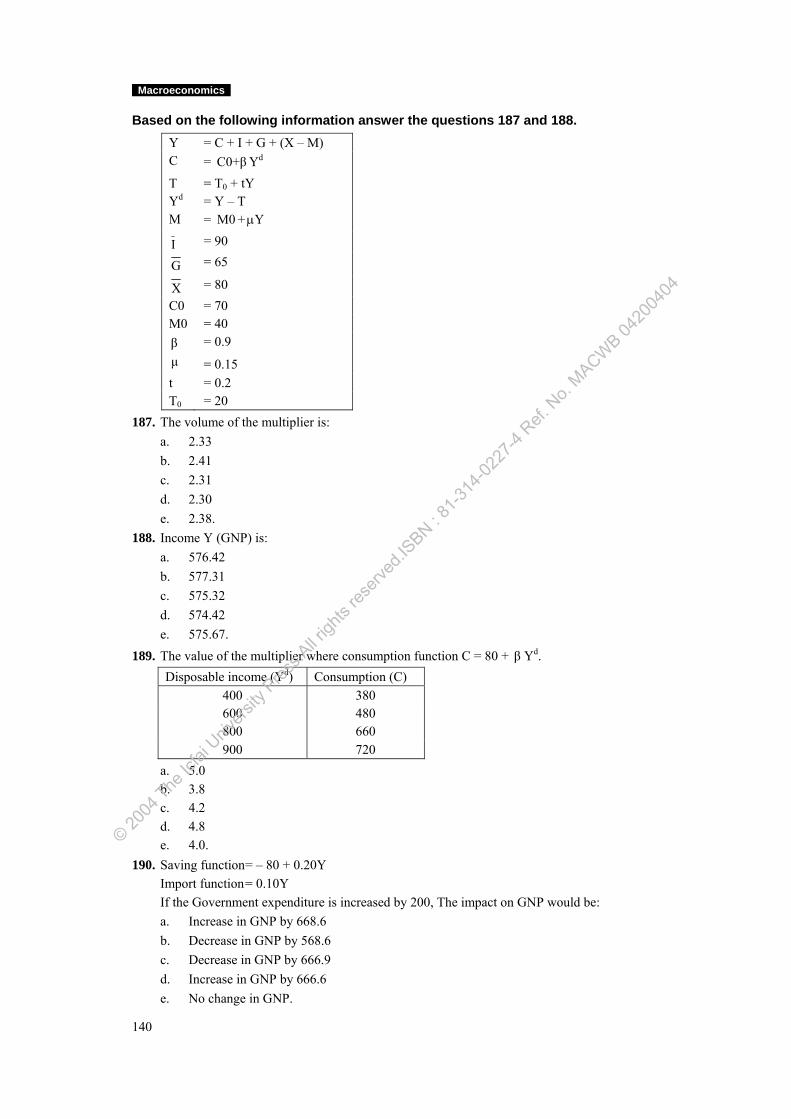
Macroeconomics
140
Based on the following information answer the questions 187 and 188. Y = C + I + G + (X – M) C = C0+βYd T = T0 + tY Yd = Y – T M = M0 + Yμ
I = 90
G = 65
X = 80 C0 = 70 M0 = 40 β = 0.9 μ = 0.15 t = 0.2 T0 = 20
187. The volume of the multiplier is: a. 2.33 b. 2.41 c. 2.31 d. 2.30 e. 2.38. 188. Income Y (GNP) is: a. 576.42 b. 577.31 c. 575.32 d. 574.42 e. 575.67. 189. The value of the multiplier where consumption function C = 80 + β Yd.
Disposable income (Yd) Consumption (C) 400 380 600 480 800 660 900 720
a. 5.0 b. 3.8 c. 4.2 d. 4.8 e. 4.0. 190. Saving function = – 80 + 0.20Y Import function = 0.10Y If the Government expenditure is increased by 200, The impact on GNP would be: a. Increase in GNP by 668.6 b. Decrease in GNP by 568.6 c. Decrease in GNP by 666.9 d. Increase in GNP by 666.6 e. No change in GNP.
© 2004
The Ic
fai U
nivers
ity P
ress.A
ll righ
ts res
erved
.ISBN : 8
1-314
-0227
-4 Ref.
No.
MACWB 04
2004
04
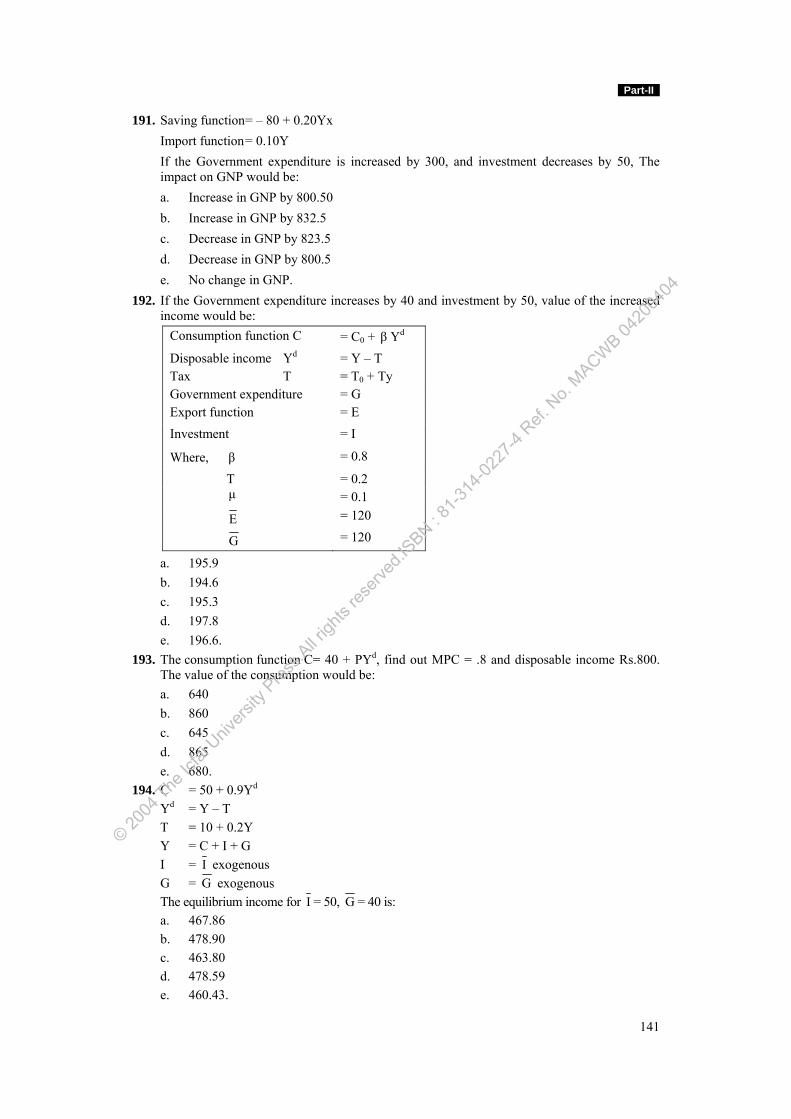
Part-II
141
191. Saving function = – 80 + 0.20Yx Import function = 0.10Y If the Government expenditure is increased by 300, and investment decreases by 50, The
impact on GNP would be: a. Increase in GNP by 800.50 b. Increase in GNP by 832.5 c. Decrease in GNP by 823.5 d. Decrease in GNP by 800.5 e. No change in GNP. 192. If the Government expenditure increases by 40 and investment by 50, value of the increased
income would be: Consumption function C = C0 + β Yd Disposable income Yd = Y – T Tax T = T0 + Ty Government expenditure = G Export function = E Investment = I
Where, β = 0.8
T = 0.2 μ = 0.1
E = 120
G = 120
a. 195.9 b. 194.6 c. 195.3 d. 197.8 e. 196.6. 193. The consumption function C= 40 + PYd, find out MPC = .8 and disposable income Rs.800.
The value of the consumption would be: a. 640 b. 860 c. 645 d. 865 e. 680. 194. C = 50 + 0.9Yd Yd = Y – T T = 10 + 0.2Y Y = C + I + G I = I exogenous G = G exogenous The equilibrium income for I = 50, G = 40 is: a. 467.86 b. 478.90 c. 463.80 d. 478.59 e. 460.43.
© 2004
The Ic
fai U
nivers
ity P
ress.A
ll righ
ts res
erved
.ISBN : 8
1-314
-0227
-4 Ref.
No.
MACWB 04
2004
04
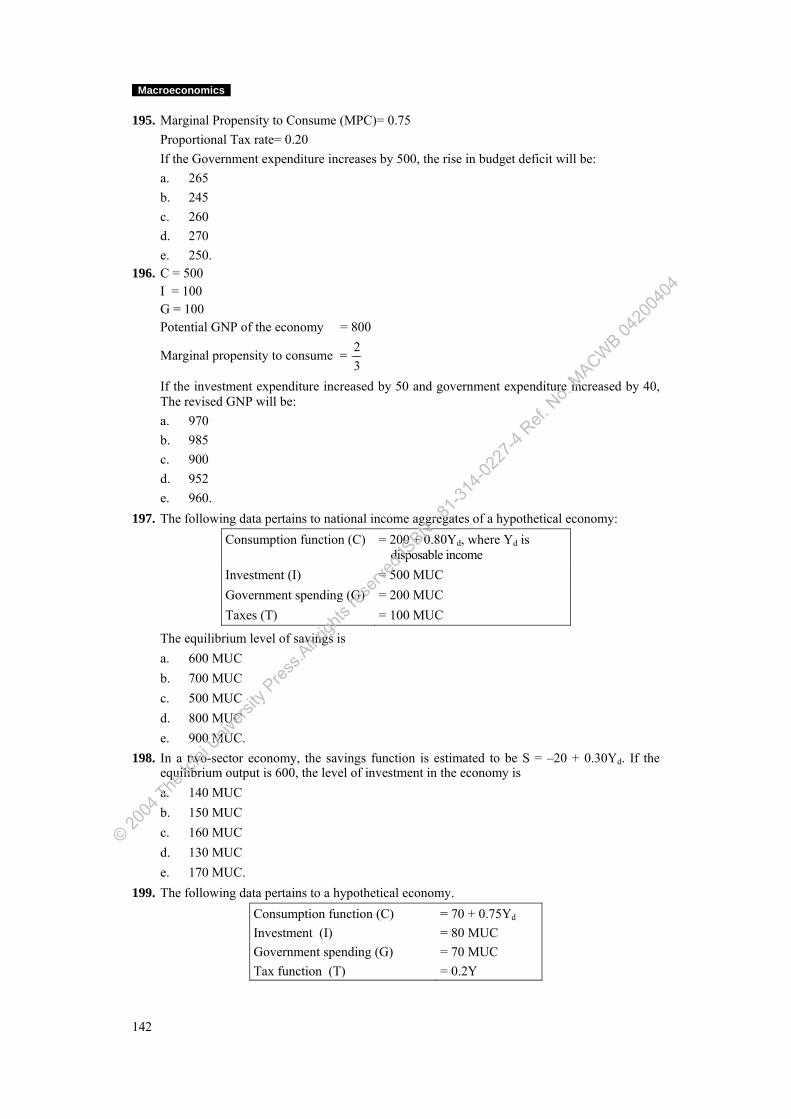
Macroeconomics
142
195. Marginal Propensity to Consume (MPC)= 0.75 Proportional Tax rate= 0.20 If the Government expenditure increases by 500, the rise in budget deficit will be: a. 265 b. 245 c. 260 d. 270 e. 250. 196. C = 500 I = 100 G = 100 Potential GNP of the economy = 800
Marginal propensity to consume = 23
If the investment expenditure increased by 50 and government expenditure increased by 40, The revised GNP will be:
a. 970 b. 985 c. 900 d. 952 e. 960. 197. The following data pertains to national income aggregates of a hypothetical economy:
Consumption function (C) = 200 + 0.80Yd, where Yd is disposable income
Investment (I) = 500 MUC Government spending (G) = 200 MUC Taxes (T) = 100 MUC
The equilibrium level of savings is a. 600 MUC b. 700 MUC c. 500 MUC d. 800 MUC e. 900 MUC. 198. In a two-sector economy, the savings function is estimated to be S = –20 + 0.30Yd. If the
equilibrium output is 600, the level of investment in the economy is a. 140 MUC b. 150 MUC c. 160 MUC d. 130 MUC e. 170 MUC. 199. The following data pertains to a hypothetical economy.
Consumption function (C) = 70 + 0.75Yd
Investment (I) = 80 MUC Government spending (G) = 70 MUC Tax function (T) = 0.2Y
© 2004
The Ic
fai U
nivers
ity P
ress.A
ll righ
ts res
erved
.ISBN : 8
1-314
-0227
-4 Ref.
No.
MACWB 04
2004
04
Part-II
143
At equilibrium, the budget surplus (deficit) in the economy is a. (30) MUC b. 30 MUC c. 40 MUC d. 50 MUC e. (40) MUC. 200. In an economy the savings function and investment functions are given by S = – 50 + 0.3Y
and I = 150 – 5i respectively. If the equilibrium income level,Y = 500, the rate of interest is a. 20.0% b. 15.0% c. 10.0% d. 5.0% e. 12.5%. 201. For a hypothetical economy the following is the estimated steady state consumption function. Ct = 10 + 0.5Yd t + 0.4C t–1 Where Ct and Ct-1 denote consumption in periods t and t-1. If the Ydt increased from
400MUC to 500 MUC, what is the amount of change in steady state consumption? a. 53.33 MUC. b. 65.33 MUC. c. 83.33 MUC. d. 75.33 MUC. e. 61.33 MUC. 202. The savings function for an economy is given by S = –50 + 0.25Y and the import function,
M= 0.15Y. If the government intends to increase the GNP by 500 MUC, what should be the increase in government expenditure?
a. 100 MUC. b. 50 MUC. c. 200 MUC. d. 250 MUC. e. 300 MUC. 203. The full employment output for an economy is estimated to be 700. The current level of
output is 600. MPS for the economy is estimated to be 0.2.What should be the change in government spending if the government is committed to bring full-employment level of output?
a. 50 MUC. b. 75 MUC. c. 20 MUC. d. 125 MUC. e. 150 MUC. 204. In a two-sector economy the marginal propensity to save is constant at 0.25 and the break-
even income is 12,000 MUC. If the current level of income is 16,000 MUC, the amount of savings in the economy is
a. 6,000 MUC b. 1,000 MUC c. 5,000 MUC d. 7,000 MUC e. 2,000 MUC.
© 2004
The Ic
fai U
nivers
ity P
ress.A
ll righ
ts res
erved
.ISBN : 8
1-314
-0227
-4 Ref.
No.
MACWB 04
2004
04
Macroeconomics
144
205. Domestic savings for a year is 1,500 MUC. If the government budget deficit is 500 MUC, private savings for the year is
a. 500 MUC
b. 1,000 MUC
c. 1,500 MUC
d. 2,000 MUC
e. 2,500 MUC.
206. Acceleration coefficient in an economy is 2. Investment in a period is equal to 75% of the difference between the desired capital stock and the existing capital stock. If income in period ‘t’ is expected to increase by 200 MUC, investment during the period ‘t’ will be
a. 200 MUC
b. 300 MUC
c. 400 MUC
d. 500 MUC
e. 600 MUC.
207. In a hypothetical economy, if the marginal propensity to consume is 0.75; marginal propensity to import is 0.10; and the tax rate is 20%, then the value of multiplier will be
a. 2
b. 3
c. 4
d. 5
e. 6.
208. Consumption function for an economy is estimated to be C = 400+0.75Yd, where C and Yd are measured in Rs. cr. The level of consumption at which the savings will be zero is
a. Rs.1,400 cr
b. Rs.1,500 cr
c. Rs.1,600 cr
d. Rs.1,700 cr
e. Rs.1,300 cr.
209. The break-even income of Mr. Ravi is Rs.5,000 and his Marginal Propensity to Consume is 3/4. If his current income is Rs.2,500, how much would Mr. Ravi borrow?
a. Rs.125.
b. Rs.525.
c. Rs.625.
d. Rs.425.
e. Rs.325.
210. In a two sector economy the savings function is S = –60 + 0.25 Yd. If the investment in the economy is 100 Million Units of Currency (MUC), equilibrium income will be
a. 620 MUC
b. 640 MUC
c. 660 MUC
d. 650 MUC
e. 630 MUC.
© 2004
The Ic
fai U
nivers
ity P
ress.A
ll righ
ts res
erved
.ISBN : 8
1-314
-0227
-4 Ref.
No.
MACWB 04
2004
04
Part-II
145
211. The following information pertains to an economy:
(MUC)
Private consumption expenditure 750
Investment in fixed capital 250
Increase in stock 150
Government expenditure 100
Merchandise exports 50
Imports 150
Money supply 230
The velocity of money in the economy is
a. 4 b. 5 c. 3 d. 2 e. 1. 212. The following are the data related to an economy.
C = 1000 I = 200 G = 200 Potential GNP of the economy is 1600 MPC = 2/3 If the expenditure increased by 100 and government expenditure increased by 80, the
increase in GNP would be: a. 340 b. 360 c. 375 d. 325 e. 310. 213. Consider the following economic functions. S = –380 + 0.2Y M= 0.15Y Where I is aggregate saving, M is import and Y is national product. If the private gross
domestic investment (I) increases by 280 units and the government spending decreases by 72 units what will be the increase in national product?
a. 590.50.
b. 588.24.
c. 594.28.
d. 578.75.
e. 560.43.
© 2004
The Ic
fai U
nivers
ity P
ress.A
ll righ
ts res
erved
.ISBN : 8
1-314
-0227
-4 Ref.
No.
MACWB 04
2004
04
Macroeconomics
146
214. From the following economic relationships calculate Multiplier.
Y = C + I + G + (X) C = C0 + βYd T = T0 + tY Yd = Y – T M (Imports) = M0 + μY I = 90 G = 65 X = 80 C0 = 70
M0 = 40 β = 0.9
μ = 0.15
T = 0.2
T0 = 20
a. 2.33 b. 2.35 c. 2.45 d. 2.28 e. 2.50. 215. Saving function = –80 + 0.20Y Import function = 0.10Y If in the economy, government expenditure is increased by 300 and investment decreased by
50, what will be the increase in GNP? a. 831.5. b. 832.5. c. 833.9. d. 831.2. e. 833.7. 216.
Consumption function C = C0 + βYd Disposable income Yd = Y – T Tax T = T0 + tY
Government expenditure = G
Import function = M + μY Export function = E Investment = I Where, β = 0.8 t = 0.2
μ = 0.1
E = 120
G = 120
© 2004
The Ic
fai U
nivers
ity P
ress.A
ll righ
ts res
erved
.ISBN : 8
1-314
-0227
-4 Ref.
No.
MACWB 04
2004
04
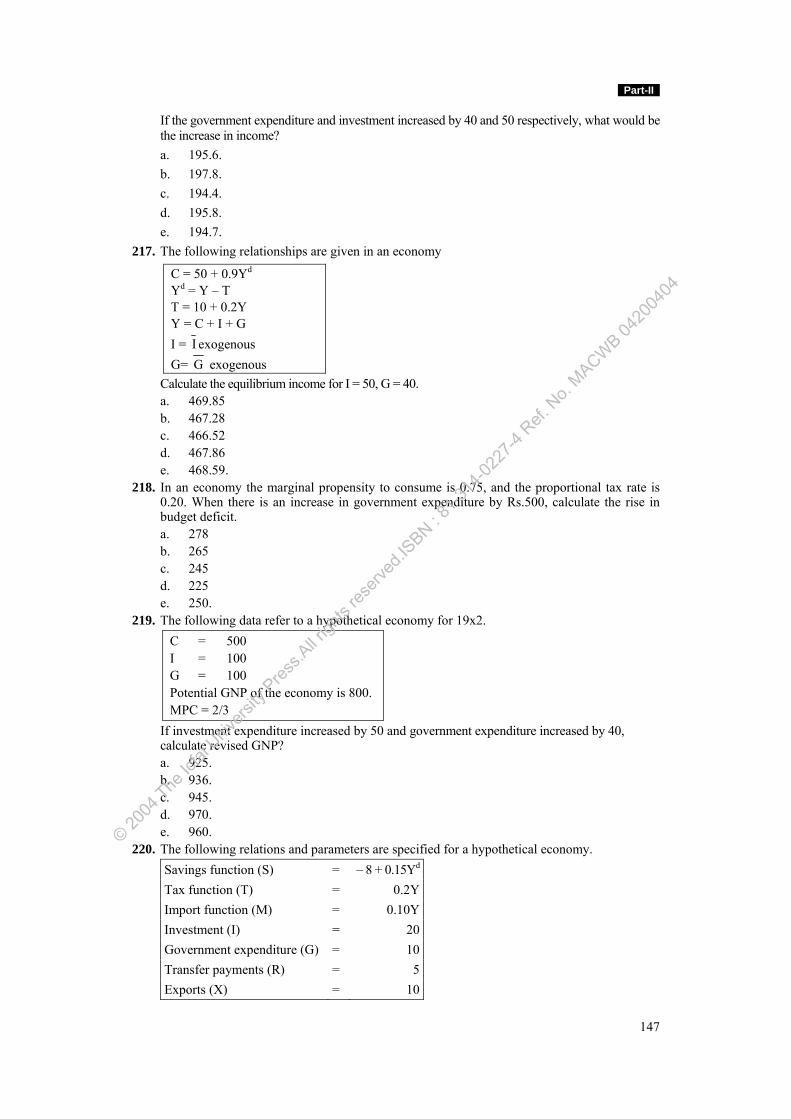
Part-II
147
If the government expenditure and investment increased by 40 and 50 respectively, what would be the increase in income?
a. 195.6. b. 197.8. c. 194.4. d. 195.8. e. 194.7. 217. The following relationships are given in an economy
C = 50 + 0.9Yd Yd = Y – T T = 10 + 0.2Y Y = C + I + G I = I exogenous G= G exogenous
Calculate the equilibrium income for I = 50, G = 40. a. 469.85 b. 467.28 c. 466.52 d. 467.86 e. 468.59. 218. In an economy the marginal propensity to consume is 0.75, and the proportional tax rate is
0.20. When there is an increase in government expenditure by Rs.500, calculate the rise in budget deficit.
a. 278 b. 265 c. 245 d. 225 e. 250. 219. The following data refer to a hypothetical economy for 19x2.
C = 500 I = 100 G = 100 Potential GNP of the economy is 800. MPC = 2/3
If investment expenditure increased by 50 and government expenditure increased by 40, calculate revised GNP?
a. 925. b. 936. c. 945. d. 970. e. 960. 220. The following relations and parameters are specified for a hypothetical economy.
Savings function (S) = – 8 + 0.15Yd
Tax function (T) = 0.2YImport function (M) = 0.10YInvestment (I) = 20Government expenditure (G) = 10Transfer payments (R) = 5Exports (X) = 10
© 2004
The Ic
fai U
nivers
ity P
ress.A
ll righ
ts res
erved
.ISBN : 8
1-314
-0227
-4 Ref.
No.
MACWB 04
2004
04
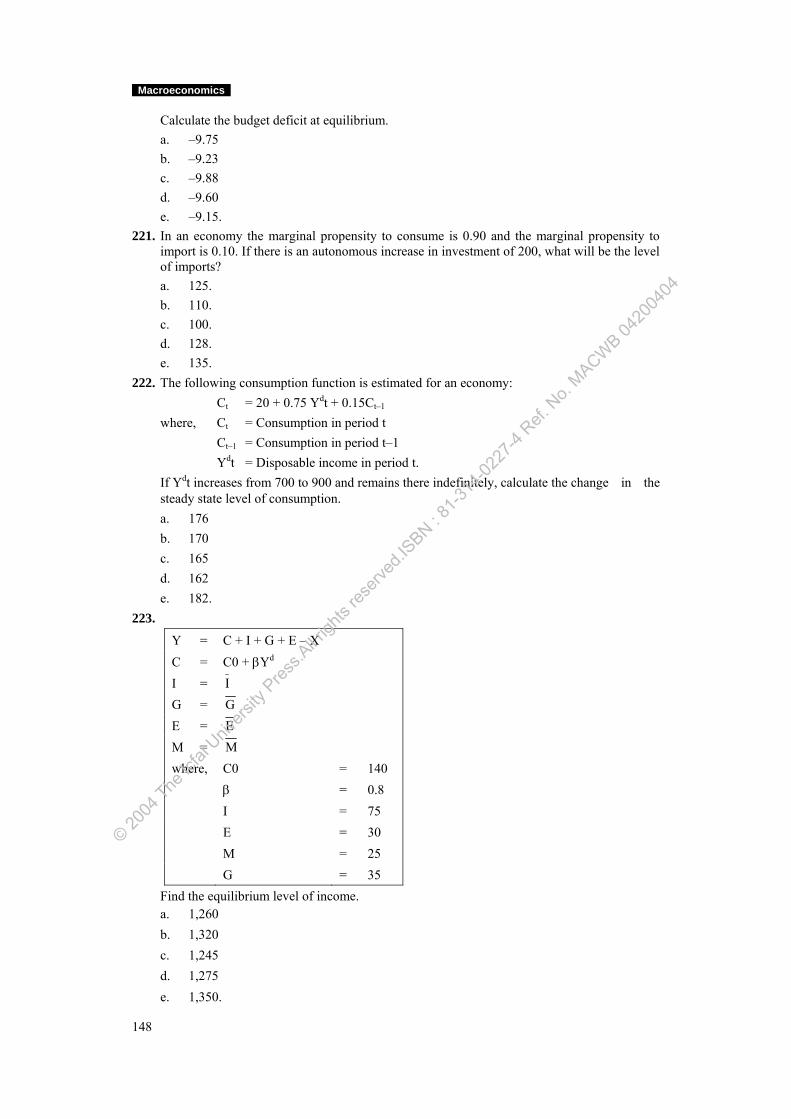
Macroeconomics
148
Calculate the budget deficit at equilibrium. a. –9.75 b. –9.23 c. –9.88 d. –9.60 e. –9.15. 221. In an economy the marginal propensity to consume is 0.90 and the marginal propensity to
import is 0.10. If there is an autonomous increase in investment of 200, what will be the level of imports?
a. 125. b. 110. c. 100. d. 128. e. 135. 222. The following consumption function is estimated for an economy: Ct = 20 + 0.75 Ydt + 0.15Ct–1 where, Ct = Consumption in period t Ct–1 = Consumption in period t–1 Ydt = Disposable income in period t. If Ydt increases from 700 to 900 and remains there indefinitely, calculate the change in the
steady state level of consumption. a. 176 b. 170 c. 165 d. 162 e. 182. 223.
Y = C + I + G + E – X C = C0 + βYd I = I G = G E = E M = M where, C0 = 140 β = 0.8
I = 75
E = 30 M = 25 G = 35
Find the equilibrium level of income. a. 1,260 b. 1,320 c. 1,245 d. 1,275 e. 1,350.
© 2004
The Ic
fai U
nivers
ity P
ress.A
ll righ
ts res
erved
.ISBN : 8
1-314
-0227
-4 Ref.
No.
MACWB 04
2004
04
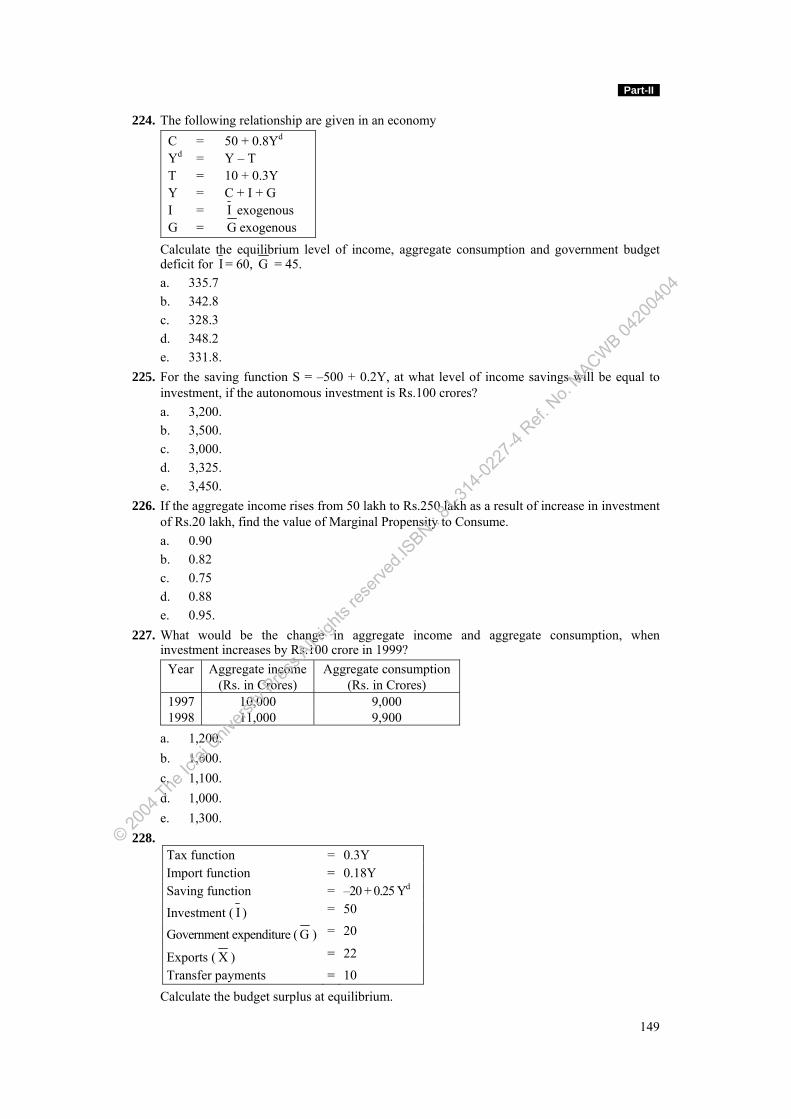
Part-II
149
224. The following relationship are given in an economy C = 50 + 0.8Yd Yd = Y – T T = 10 + 0.3Y Y = C + I + G I = I exogenous G = G exogenous
Calculate the equilibrium level of income, aggregate consumption and government budget deficit for I = 60, G = 45.
a. 335.7 b. 342.8 c. 328.3 d. 348.2 e. 331.8. 225. For the saving function S = –500 + 0.2Y, at what level of income savings will be equal to
investment, if the autonomous investment is Rs.100 crores? a. 3,200. b. 3,500. c. 3,000. d. 3,325. e. 3,450. 226. If the aggregate income rises from 50 lakh to Rs.250 lakh as a result of increase in investment
of Rs.20 lakh, find the value of Marginal Propensity to Consume. a. 0.90 b. 0.82 c. 0.75 d. 0.88 e. 0.95. 227. What would be the change in aggregate income and aggregate consumption, when
investment increases by Rs.100 crore in 1999? Year Aggregate income
(Rs. in Crores) Aggregate consumption
(Rs. in Crores) 1997 10,000 9,000 1998 11,000 9,900
a. 1,200. b. 1,600. c. 1,100. d. 1,000. e. 1,300. 228.
Tax function = 0.3Y Import function = 0.18Y Saving function = –20 + 0.25 Yd
Investment ( I ) = 50
Government expenditure ( G ) = 20
Exports ( X ) = 22
Transfer payments = 10 Calculate the budget surplus at equilibrium.
© 2004
The Ic
fai U
nivers
ity P
ress.A
ll righ
ts res
erved
.ISBN : 8
1-314
-0227
-4 Ref.
No.
MACWB 04
2004
04
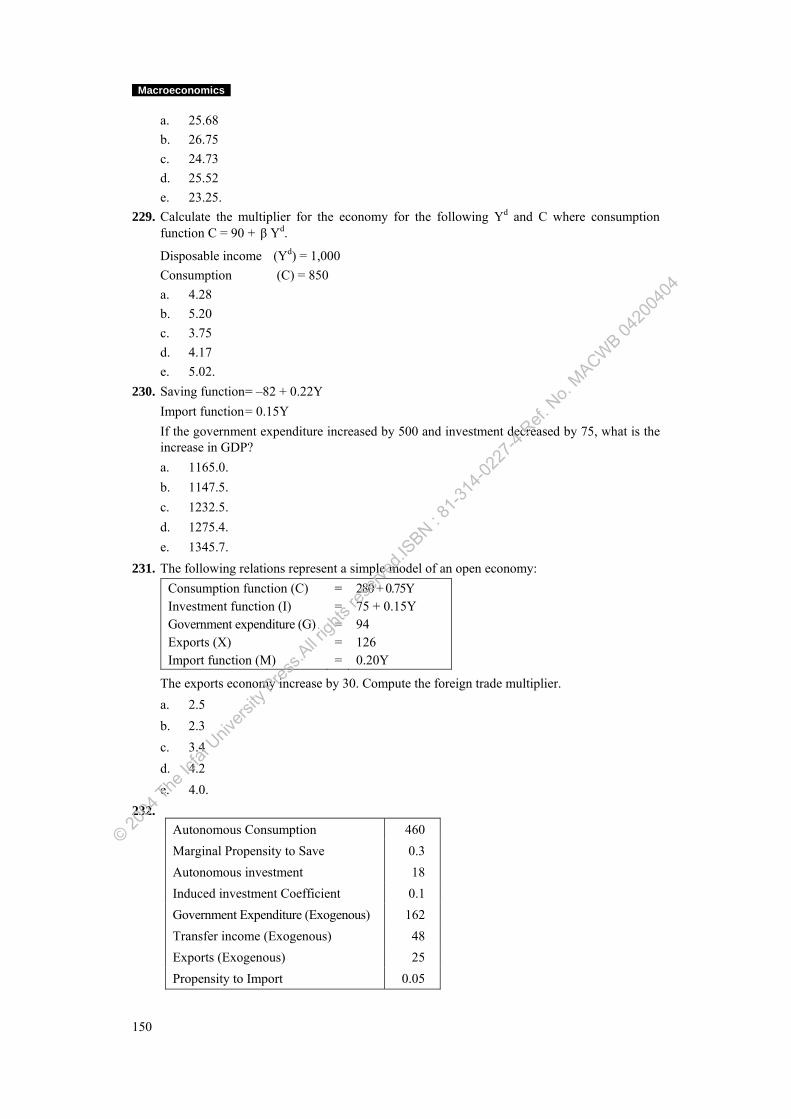
Macroeconomics
150
a. 25.68 b. 26.75 c. 24.73 d. 25.52 e. 23.25. 229. Calculate the multiplier for the economy for the following Yd and C where consumption
function C = 90 + β Yd.
Disposable income (Yd) = 1,000 Consumption (C) = 850 a. 4.28 b. 5.20 c. 3.75 d. 4.17 e. 5.02. 230. Saving function = –82 + 0.22Y Import function = 0.15Y If the government expenditure increased by 500 and investment decreased by 75, what is the
increase in GDP? a. 1165.0. b. 1147.5. c. 1232.5. d. 1275.4. e. 1345.7. 231. The following relations represent a simple model of an open economy:
Consumption function (C) = 280 + 0.75Y Investment function (I) = 75 + 0.15Y Government expenditure (G) = 94 Exports (X) = 126 Import function (M) = 0.20Y
The exports economy increase by 30. Compute the foreign trade multiplier. a. 2.5 b. 2.3 c. 3.4 d. 4.2 e. 4.0. 232.
Autonomous Consumption 460 Marginal Propensity to Save 0.3 Autonomous investment 18 Induced investment Coefficient 0.1 Government Expenditure (Exogenous) 162 Transfer income (Exogenous) 48 Exports (Exogenous) 25 Propensity to Import 0.05
© 2004
The Ic
fai U
nivers
ity P
ress.A
ll righ
ts res
erved
.ISBN : 8
1-314
-0227
-4 Ref.
No.
MACWB 04
2004
04
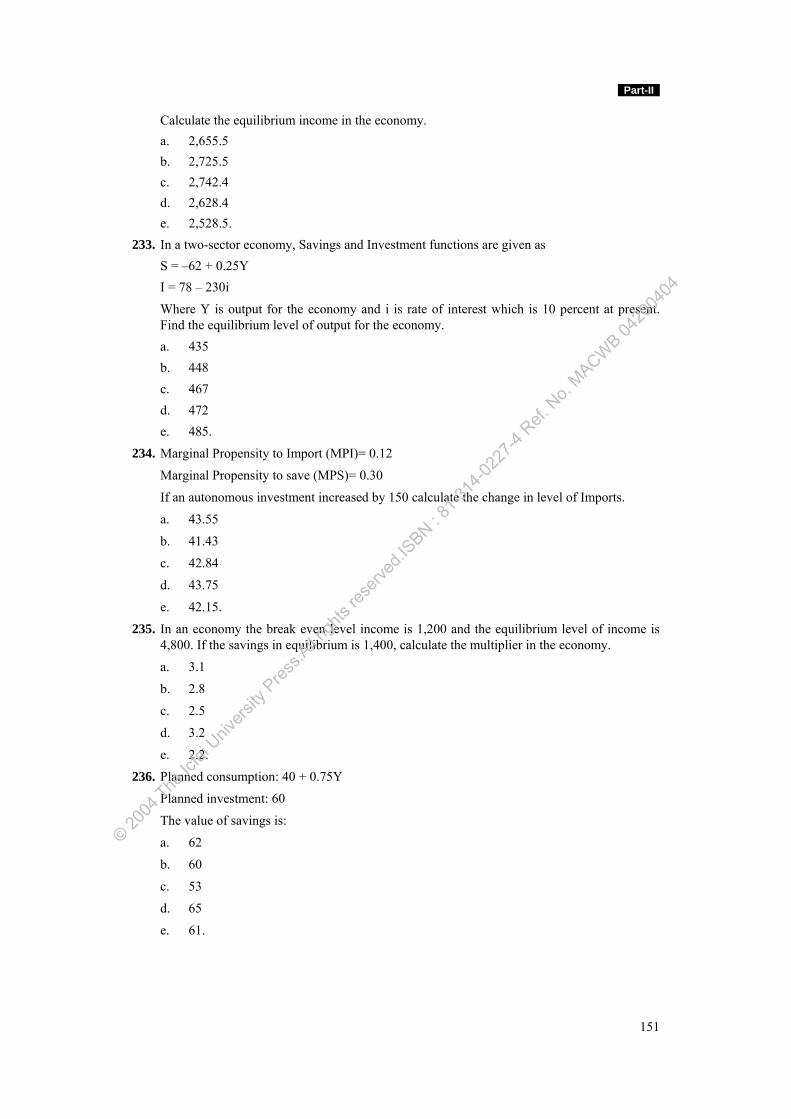
Part-II
151
Calculate the equilibrium income in the economy. a. 2,655.5 b. 2,725.5 c. 2,742.4 d. 2,628.4 e. 2,528.5. 233. In a two-sector economy, Savings and Investment functions are given as S = –62 + 0.25Y I = 78 – 230i
Where Y is output for the economy and i is rate of interest which is 10 percent at present. Find the equilibrium level of output for the economy.
a. 435 b. 448 c. 467 d. 472 e. 485.
234. Marginal Propensity to Import (MPI) = 0.12
Marginal Propensity to save (MPS) = 0.30
If an autonomous investment increased by 150 calculate the change in level of Imports.
a. 43.55
b. 41.43
c. 42.84
d. 43.75
e. 42.15.
235. In an economy the break even level income is 1,200 and the equilibrium level of income is 4,800. If the savings in equilibrium is 1,400, calculate the multiplier in the economy.
a. 3.1
b. 2.8
c. 2.5
d. 3.2
e. 2.2.
236. Planned consumption: 40 + 0.75Y
Planned investment: 60
The value of savings is:
a. 62
b. 60
c. 53
d. 65
e. 61.
© 2004
The Ic
fai U
nivers
ity P
ress.A
ll righ
ts res
erved
.ISBN : 8
1-314
-0227
-4 Ref.
No.
MACWB 04
2004
04
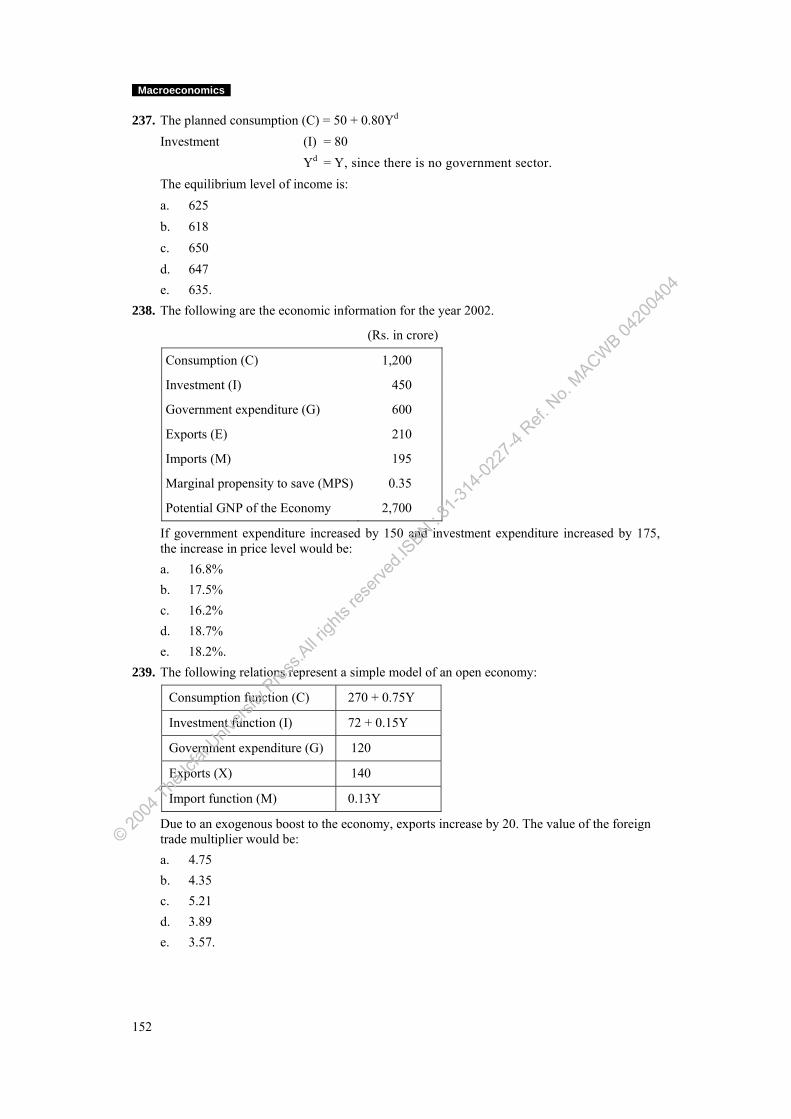
Macroeconomics
152
237. The planned consumption (C) = 50 + 0.80Yd Investment (I) = 80 Yd = Y, since there is no government sector. The equilibrium level of income is: a. 625 b. 618 c. 650 d. 647 e. 635. 238. The following are the economic information for the year 2002.
(Rs. in crore)
Consumption (C) 1,200
Investment (I) 450
Government expenditure (G) 600
Exports (E) 210
Imports (M) 195
Marginal propensity to save (MPS) 0.35
Potential GNP of the Economy 2,700
If government expenditure increased by 150 and investment expenditure increased by 175, the increase in price level would be:
a. 16.8% b. 17.5% c. 16.2% d. 18.7% e. 18.2%. 239. The following relations represent a simple model of an open economy:
Consumption function (C) 270 + 0.75Y
Investment function (I) 72 + 0.15Y
Government expenditure (G) 120
Exports (X) 140
Import function (M) 0.13Y
Due to an exogenous boost to the economy, exports increase by 20. The value of the foreign trade multiplier would be:
a. 4.75 b. 4.35 c. 5.21 d. 3.89 e. 3.57.
© 2004
The Ic
fai U
nivers
ity P
ress.A
ll righ
ts res
erved
.ISBN : 8
1-314
-0227
-4 Ref.
No.
MACWB 04
2004
04
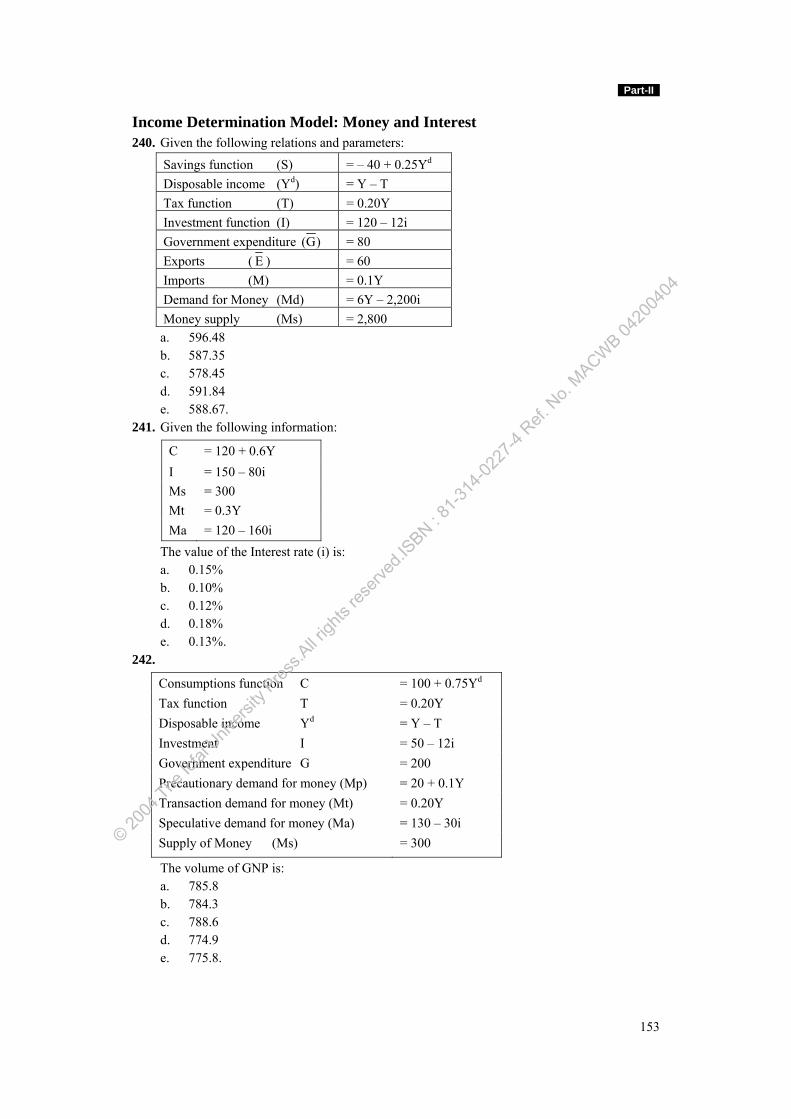
Part-II
153
Income Determination Model: Money and Interest 240. Given the following relations and parameters:
Savings function (S) = – 40 + 0.25Yd Disposable income (Yd) = Y – T Tax function (T) = 0.20Y Investment function (I) = 120 – 12i Government expenditure (G) = 80 Exports ( E ) = 60 Imports (M) = 0.1Y Demand for Money (Md) = 6Y – 2,200i Money supply (Ms) = 2,800
a. 596.48 b. 587.35 c. 578.45 d. 591.84 e. 588.67. 241. Given the following information:
C = 120 + 0.6Y I = 150 – 80i Ms = 300 Mt = 0.3Y Ma = 120 – 160i
The value of the Interest rate (i) is: a. 0.15% b. 0.10% c. 0.12% d. 0.18% e. 0.13%. 242.
Consumptions function C = 100 + 0.75Yd Tax function T = 0.20Y Disposable income Yd = Y – T Investment I = 50 – 12i Government expenditure G = 200 Precautionary demand for money (Mp) = 20 + 0.1Y Transaction demand for money (Mt) = 0.20Y Speculative demand for money (Ma) = 130 – 30i Supply of Money (Ms) = 300
The volume of GNP is: a. 785.8 b. 784.3 c. 788.6 d. 774.9 e. 775.8.
© 2004
The Ic
fai U
nivers
ity P
ress.A
ll righ
ts res
erved
.ISBN : 8
1-314
-0227
-4 Ref.
No.
MACWB 04
2004
04
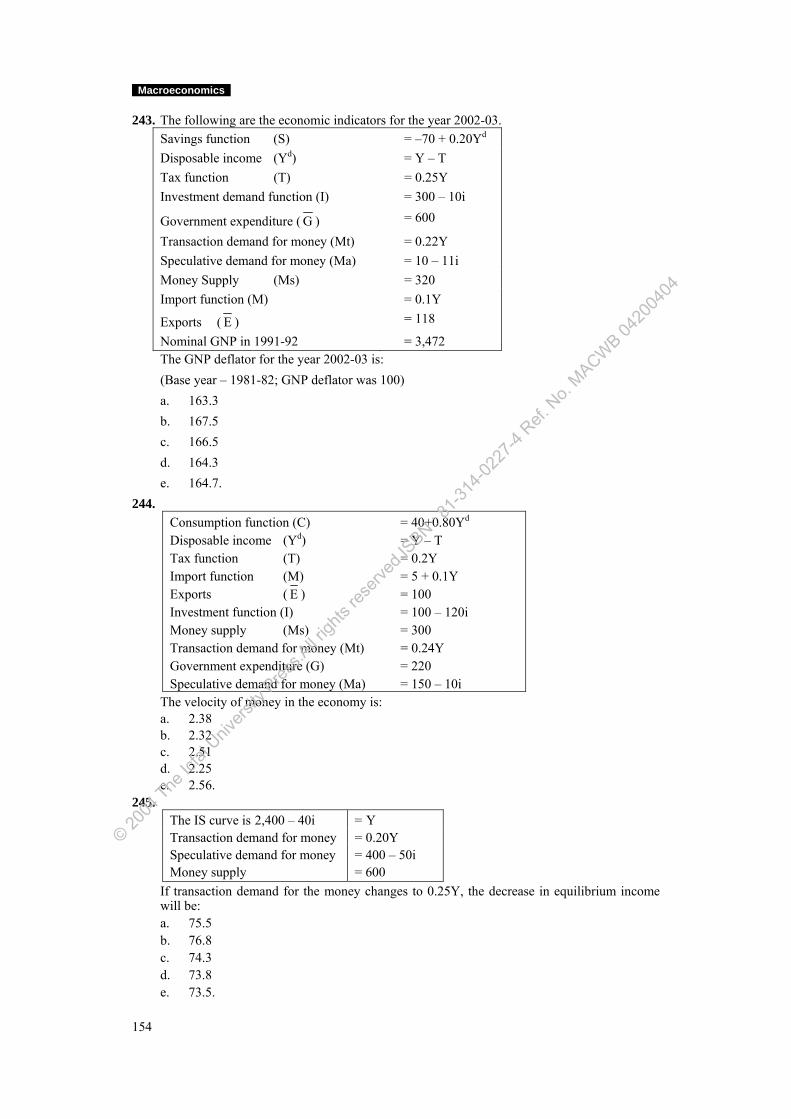
Macroeconomics
154
243. The following are the economic indicators for the year 2002-03. Savings function (S) = –70 + 0.20Yd Disposable income (Yd) = Y – T Tax function (T) = 0.25Y Investment demand function (I) = 300 – 10i
Government expenditure ( G ) = 600
Transaction demand for money (Mt) = 0.22Y Speculative demand for money (Ma) = 10 – 11i Money Supply (Ms) = 320 Import function (M) = 0.1Y
Exports ( E ) = 118
Nominal GNP in 1991-92 = 3,472 The GNP deflator for the year 2002-03 is: (Base year – 1981-82; GNP deflator was 100) a. 163.3 b. 167.5 c. 166.5 d. 164.3 e. 164.7. 244.
Consumption function (C) = 40+0.80Yd Disposable income (Yd) = Y – T Tax function (T) = 0.2Y Import function (M) = 5 + 0.1Y Exports ( E ) = 100 Investment function (I) = 100 – 120i Money supply (Ms) = 300 Transaction demand for money (Mt) = 0.24Y Government expenditure (G) = 220 Speculative demand for money (Ma) = 150 – 10i
The velocity of money in the economy is: a. 2.38 b. 2.32 c. 2.51 d. 2.25 e. 2.56. 245.
The IS curve is 2,400 – 40i = Y Transaction demand for money = 0.20Y Speculative demand for money = 400 – 50i Money supply = 600
If transaction demand for the money changes to 0.25Y, the decrease in equilibrium income will be: a. 75.5 b. 76.8 c. 74.3 d. 73.8 e. 73.5.
© 2004
The Ic
fai U
nivers
ity P
ress.A
ll righ
ts res
erved
.ISBN : 8
1-314
-0227
-4 Ref.
No.
MACWB 04
2004
04
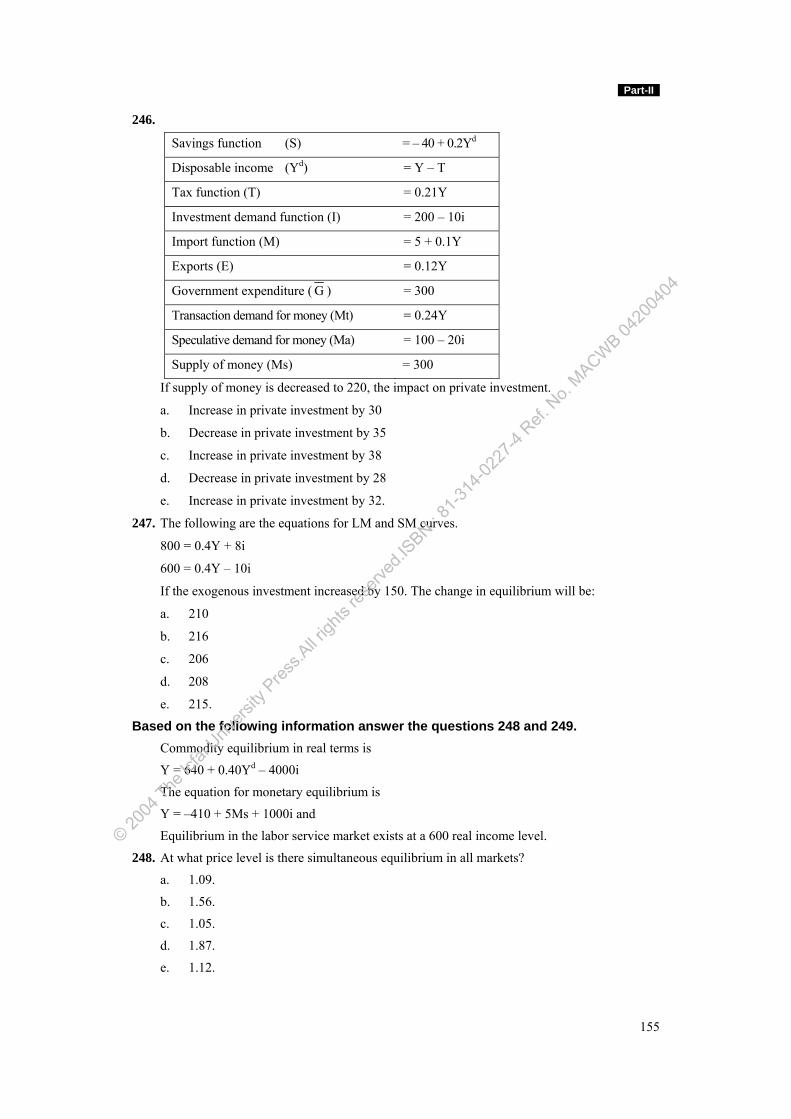
Part-II
155
246.
Savings function (S) = – 40 + 0.2Yd
Disposable income (Yd) = Y – T
Tax function (T) = 0.21Y
Investment demand function (I) = 200 – 10i
Import function (M) = 5 + 0.1Y
Exports (E) = 0.12Y
Government expenditure ( G ) = 300
Transaction demand for money (Mt) = 0.24Y
Speculative demand for money (Ma) = 100 – 20i
Supply of money (Ms) = 300
If supply of money is decreased to 220, the impact on private investment.
a. Increase in private investment by 30
b. Decrease in private investment by 35
c. Increase in private investment by 38
d. Decrease in private investment by 28
e. Increase in private investment by 32.
247. The following are the equations for LM and SM curves.
800 = 0.4Y + 8i
600 = 0.4Y – 10i
If the exogenous investment increased by 150. The change in equilibrium will be:
a. 210
b. 216
c. 206
d. 208
e. 215.
Based on the following information answer the questions 248 and 249. Commodity equilibrium in real terms is
Y = 640 + 0.40Yd – 4000i
The equation for monetary equilibrium is
Y = –410 + 5Ms + 1000i and
Equilibrium in the labor service market exists at a 600 real income level.
248. At what price level is there simultaneous equilibrium in all markets?
a. 1.09.
b. 1.56.
c. 1.05.
d. 1.87.
e. 1.12.
© 2004
The Ic
fai U
nivers
ity P
ress.A
ll righ
ts res
erved
.ISBN : 8
1-314
-0227
-4 Ref.
No.
MACWB 04
2004
04
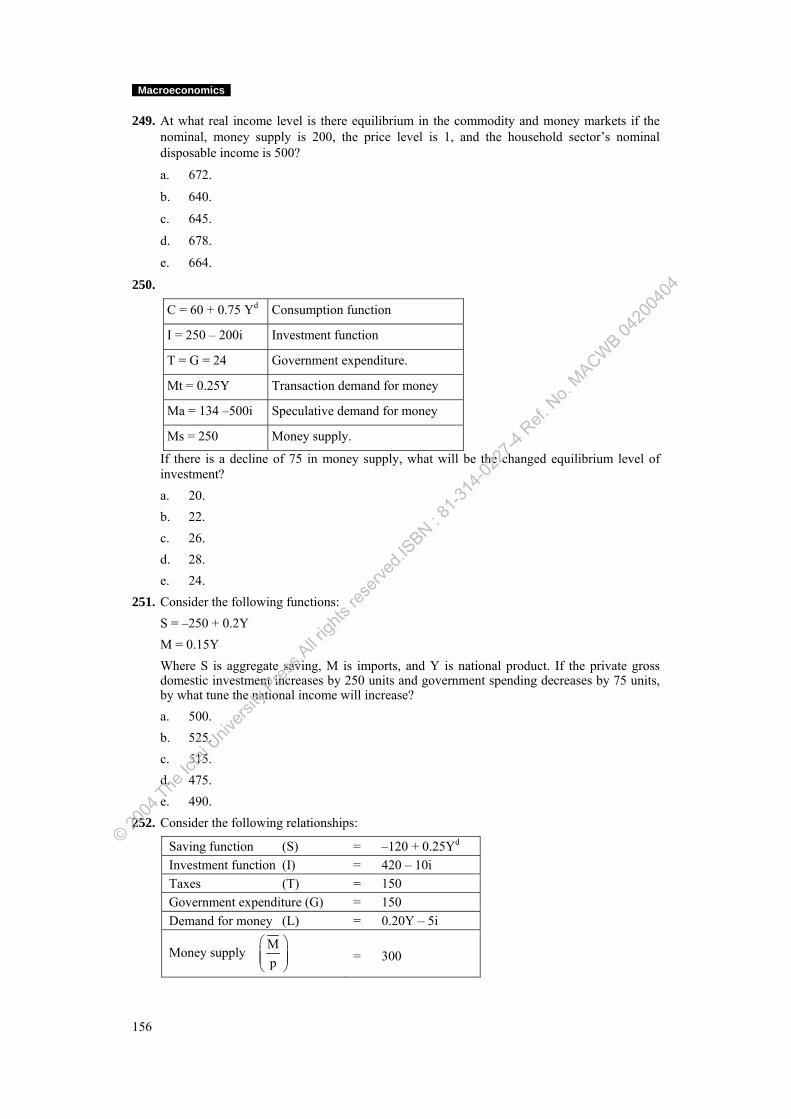
Macroeconomics
156
249. At what real income level is there equilibrium in the commodity and money markets if the nominal, money supply is 200, the price level is 1, and the household sector’s nominal disposable income is 500?
a. 672.
b. 640.
c. 645.
d. 678.
e. 664.
250.
C = 60 + 0.75 Yd Consumption function
I = 250 – 200i Investment function
T = G = 24 Government expenditure.
Mt = 0.25Y Transaction demand for money
Ma = 134 –500i Speculative demand for money
Ms = 250 Money supply.
If there is a decline of 75 in money supply, what will be the changed equilibrium level of investment?
a. 20. b. 22. c. 26. d. 28. e. 24. 251. Consider the following functions: S = –250 + 0.2Y M = 0.15Y Where S is aggregate saving, M is imports, and Y is national product. If the private gross
domestic investment increases by 250 units and government spending decreases by 75 units, by what tune the national income will increase?
a. 500. b. 525. c. 515. d. 475. e. 490. 252. Consider the following relationships:
Saving function (S) = –120 + 0.25Yd Investment function (I) = 420 – 10i Taxes (T) = 150 Government expenditure (G) = 150 Demand for money (L) = 0.20Y – 5i
Money supply Mp
⎛ ⎞⎜ ⎟⎜ ⎟⎝ ⎠
= 300
© 2004
The Ic
fai U
nivers
ity P
ress.A
ll righ
ts res
erved
.ISBN : 8
1-314
-0227
-4 Ref.
No.
MACWB 04
2004
04
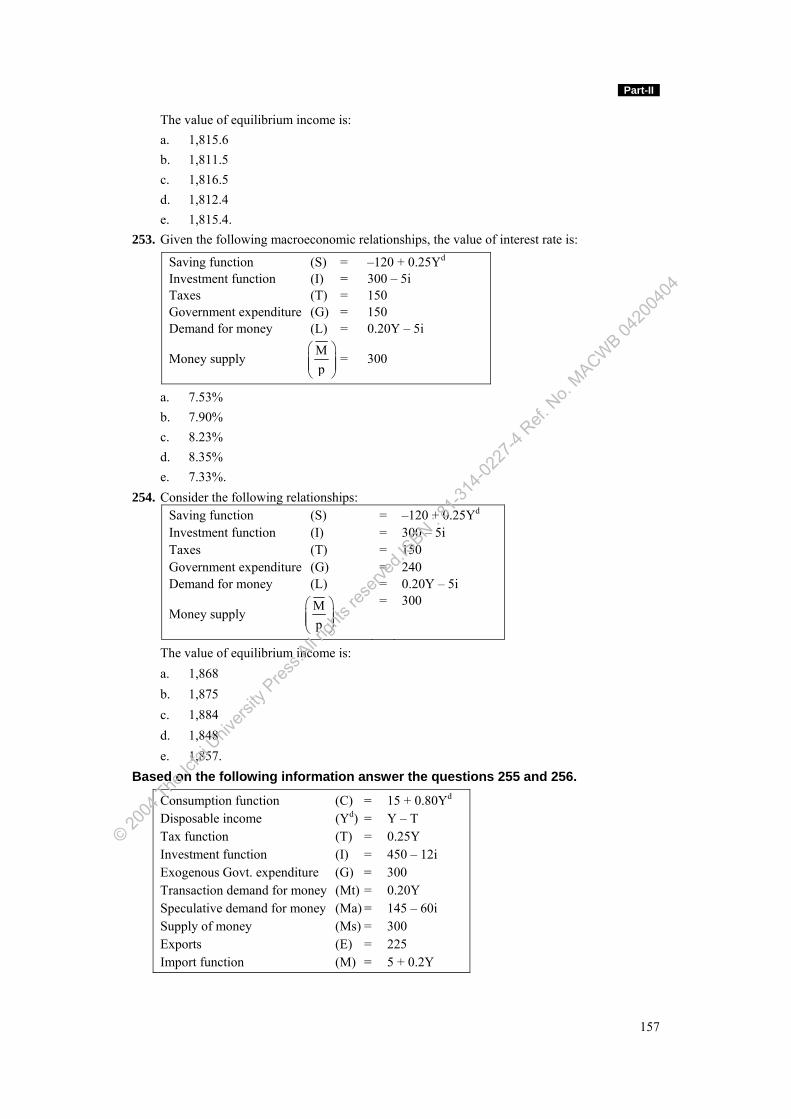
Part-II
157
The value of equilibrium income is: a. 1,815.6 b. 1,811.5 c. 1,816.5 d. 1,812.4 e. 1,815.4. 253. Given the following macroeconomic relationships, the value of interest rate is:
Saving function (S) = –120 + 0.25Yd Investment function (I) = 300 – 5i Taxes (T) = 150 Government expenditure (G) = 150 Demand for money (L) = 0.20Y – 5i
Money supply Mp
⎛ ⎞⎜ ⎟⎜ ⎟⎝ ⎠
= 300
a. 7.53% b. 7.90% c. 8.23% d. 8.35% e. 7.33%. 254. Consider the following relationships:
Saving function (S) Investment function (I) Taxes (T) Government expenditure (G) Demand for money (L)
Money supply Mp
⎛ ⎞⎜ ⎟⎜ ⎟⎝ ⎠
= = = = = =
–120 + 0.25Yd 300 – 5i 150 240 0.20Y – 5i 300
The value of equilibrium income is: a. 1,868 b. 1,875 c. 1,884 d. 1,848 e. 1,857. Based on the following information answer the questions 255 and 256.
Consumption function (C) = 15 + 0.80Yd Disposable income (Yd) = Y – T Tax function (T) = 0.25Y Investment function (I) = 450 – 12i Exogenous Govt. expenditure (G) = 300 Transaction demand for money (Mt) = 0.20Y Speculative demand for money (Ma) = 145 – 60i Supply of money (Ms) = 300 Exports (E) = 225 Import function (M) = 5 + 0.2Y
© 2004
The Ic
fai U
nivers
ity P
ress.A
ll righ
ts res
erved
.ISBN : 8
1-314
-0227
-4 Ref.
No.
MACWB 04
2004
04
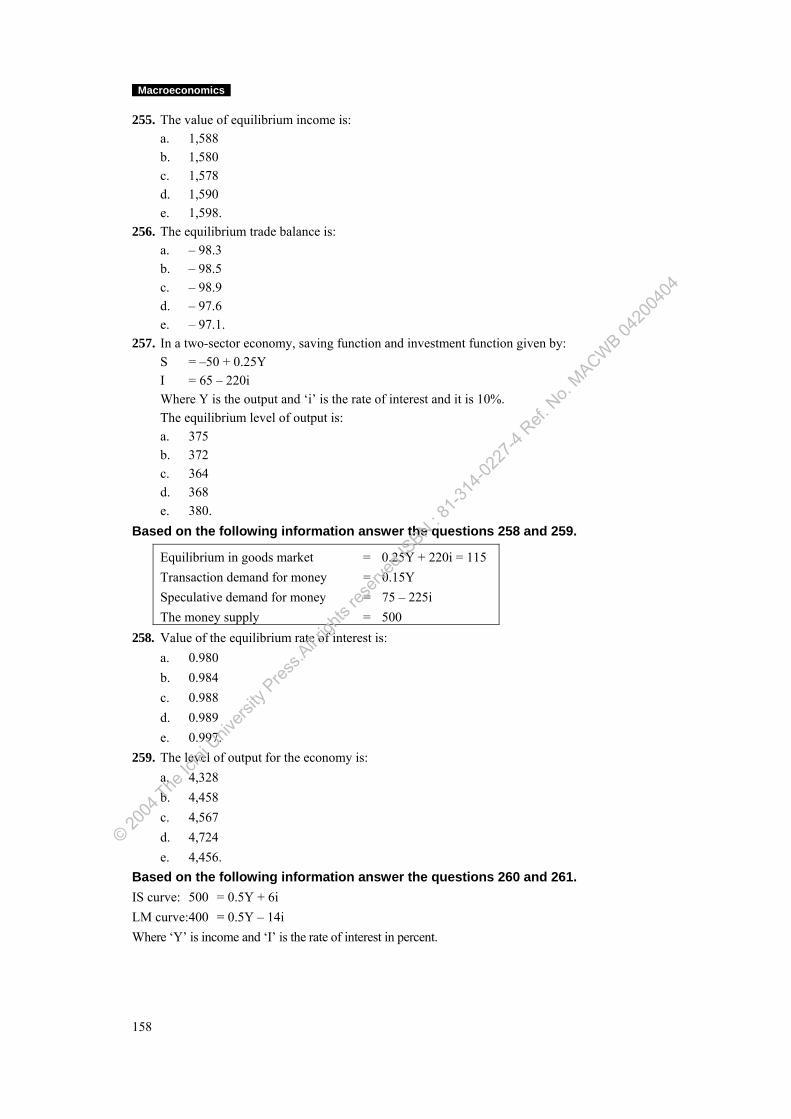
Macroeconomics
158
255. The value of equilibrium income is: a. 1,588 b. 1,580 c. 1,578 d. 1,590 e. 1,598. 256. The equilibrium trade balance is: a. – 98.3 b. – 98.5 c. – 98.9 d. – 97.6 e. – 97.1. 257. In a two-sector economy, saving function and investment function given by: S = –50 + 0.25Y I = 65 – 220i Where Y is the output and ‘i’ is the rate of interest and it is 10%. The equilibrium level of output is: a. 375 b. 372 c. 364 d. 368 e. 380. Based on the following information answer the questions 258 and 259.
Equilibrium in goods market = 0.25Y + 220i = 115 Transaction demand for money = 0.15Y Speculative demand for money = 75 – 225i The money supply = 500
258. Value of the equilibrium rate of interest is: a. 0.980 b. 0.984 c. 0.988 d. 0.989 e. 0.997. 259. The level of output for the economy is: a. 4,328 b. 4,458 c. 4,567 d. 4,724 e. 4,456. Based on the following information answer the questions 260 and 261. IS curve: 500 = 0.5Y + 6i LM curve: 400 = 0.5Y – 14i Where ‘Y’ is income and ‘I’ is the rate of interest in percent.
© 2004
The Ic
fai U
nivers
ity P
ress.A
ll righ
ts res
erved
.ISBN : 8
1-314
-0227
-4 Ref.
No.
MACWB 04
2004
04
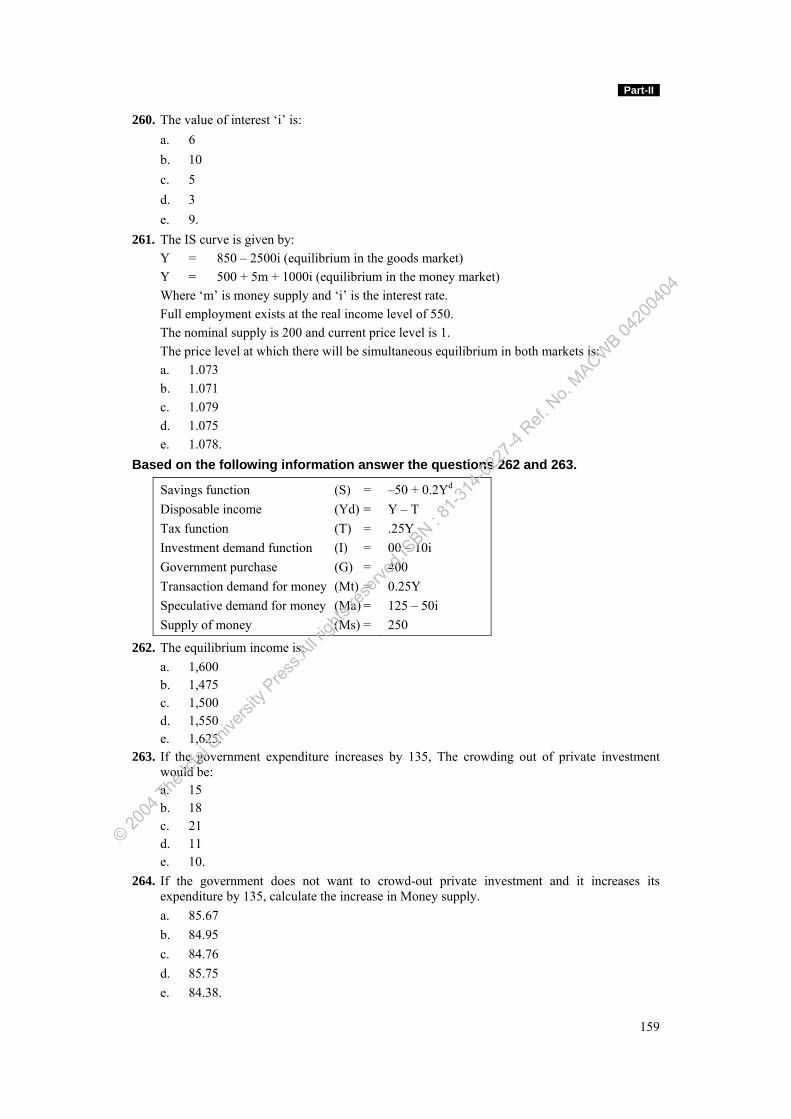
Part-II
159
260. The value of interest ‘i’ is: a. 6 b. 10 c. 5 d. 3 e. 9. 261. The IS curve is given by: Y = 850 – 2500i (equilibrium in the goods market) Y = 500 + 5m + 1000i (equilibrium in the money market) Where ‘m’ is money supply and ‘i’ is the interest rate. Full employment exists at the real income level of 550. The nominal supply is 200 and current price level is 1. The price level at which there will be simultaneous equilibrium in both markets is: a. 1.073 b. 1.071 c. 1.079 d. 1.075 e. 1.078. Based on the following information answer the questions 262 and 263.
Savings function (S) = Disposable income (Yd) = Tax function (T) = Investment demand function (I) = Government purchase (G) = Transaction demand for money (Mt) = Speculative demand for money (Ma) = Supply of money (Ms) =
–50 + 0.2Yd Y – T .25Y 00 – 10i 400 0.25Y 125 – 50i 250
262. The equilibrium income is: a. 1,600 b. 1,475 c. 1,500 d. 1,550 e. 1,625. 263. If the government expenditure increases by 135, The crowding out of private investment
would be: a. 15 b. 18 c. 21 d. 11 e. 10. 264. If the government does not want to crowd-out private investment and it increases its
expenditure by 135, calculate the increase in Money supply. a. 85.67 b. 84.95 c. 84.76 d. 85.75 e. 84.38.
© 2004
The Ic
fai U
nivers
ity P
ress.A
ll righ
ts res
erved
.ISBN : 8
1-314
-0227
-4 Ref.
No.
MACWB 04
2004
04
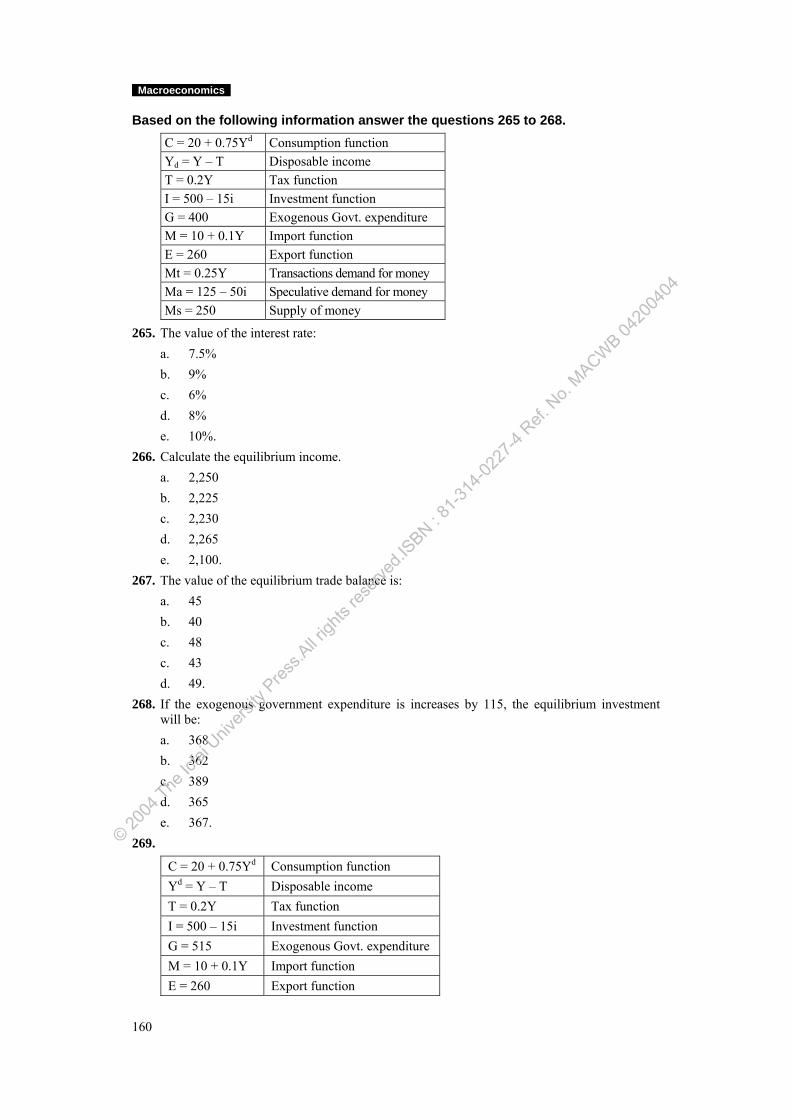
Macroeconomics
160
Based on the following information answer the questions 265 to 268. C = 20 + 0.75Yd Consumption function Yd = Y – T Disposable income T = 0.2Y Tax function I = 500 – 15i Investment function G = 400 Exogenous Govt. expenditure M = 10 + 0.1Y Import function E = 260 Export function Mt = 0.25Y Transactions demand for money Ma = 125 – 50i Speculative demand for money Ms = 250 Supply of money
265. The value of the interest rate: a. 7.5% b. 9% c. 6% d. 8% e. 10%. 266. Calculate the equilibrium income. a. 2,250 b. 2,225 c. 2,230 d. 2,265 e. 2,100. 267. The value of the equilibrium trade balance is: a. 45 b. 40 c. 48 c. 43 d. 49. 268. If the exogenous government expenditure is increases by 115, the equilibrium investment
will be: a. 368 b. 362 c. 389 d. 365 e. 367. 269.
C = 20 + 0.75Yd Consumption function Yd = Y – T Disposable income T = 0.2Y Tax function I = 500 – 15i Investment function G = 515 Exogenous Govt. expenditure M = 10 + 0.1Y Import function E = 260 Export function
© 2004
The Ic
fai U
nivers
ity P
ress.A
ll righ
ts res
erved
.ISBN : 8
1-314
-0227
-4 Ref.
No.
MACWB 04
2004
04
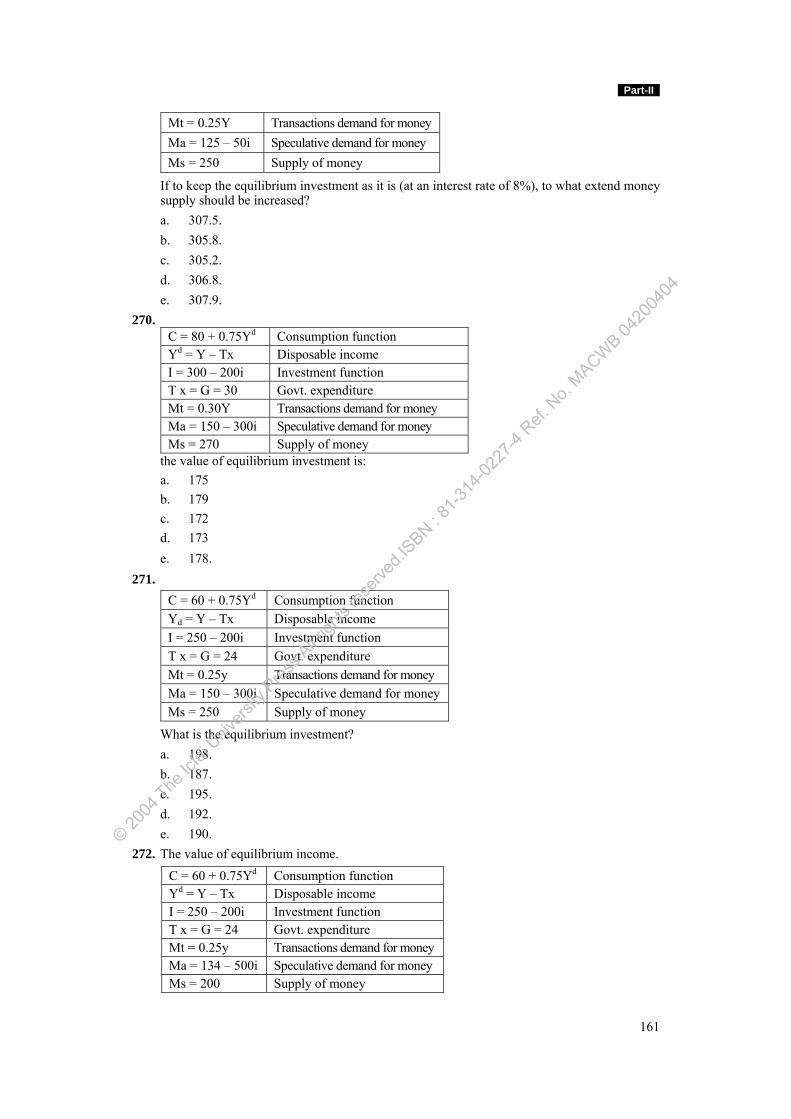
Part-II
161
Mt = 0.25Y Transactions demand for money Ma = 125 – 50i Speculative demand for money Ms = 250 Supply of money
If to keep the equilibrium investment as it is (at an interest rate of 8%), to what extend money supply should be increased?
a. 307.5. b. 305.8. c. 305.2. d. 306.8. e. 307.9. 270.
C = 80 + 0.75Yd Consumption function Yd = Y – Tx Disposable income I = 300 – 200i Investment function T x = G = 30 Govt. expenditure Mt = 0.30Y Transactions demand for money Ma = 150 – 300i Speculative demand for money Ms = 270 Supply of money
the value of equilibrium investment is: a. 175 b. 179 c. 172 d. 173 e. 178. 271.
C = 60 + 0.75Yd Consumption function Yd = Y – Tx Disposable income I = 250 – 200i Investment function T x = G = 24 Govt. expenditure Mt = 0.25y Transactions demand for money Ma = 150 – 300i Speculative demand for money Ms = 250 Supply of money
What is the equilibrium investment? a. 198. b. 187. c. 195. d. 192. e. 190. 272. The value of equilibrium income.
C = 60 + 0.75Yd Consumption function Yd = Y – Tx Disposable income I = 250 – 200i Investment function T x = G = 24 Govt. expenditure Mt = 0.25y Transactions demand for money Ma = 134 – 500i Speculative demand for money Ms = 200 Supply of money
© 2004
The Ic
fai U
nivers
ity P
ress.A
ll righ
ts res
erved
.ISBN : 8
1-314
-0227
-4 Ref.
No.
MACWB 04
2004
04
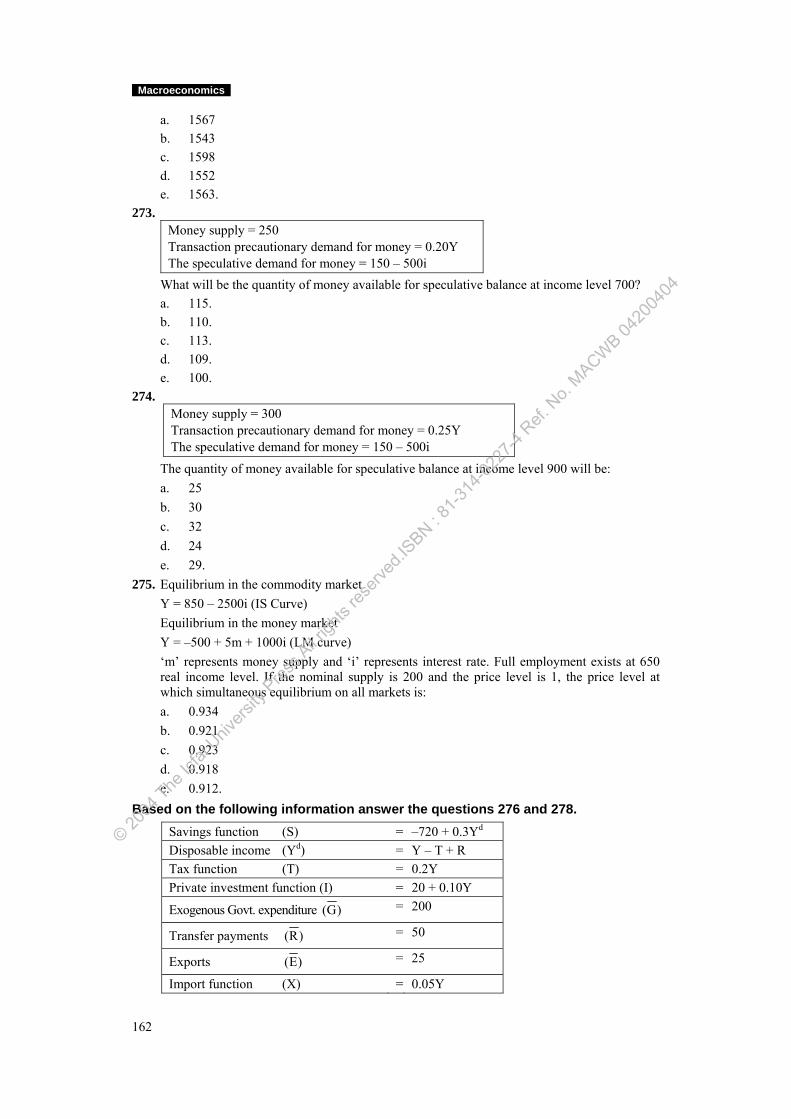
Macroeconomics
162
a. 1567 b. 1543 c. 1598 d. 1552 e. 1563. 273.
Money supply = 250 Transaction precautionary demand for money = 0.20Y The speculative demand for money = 150 – 500i
What will be the quantity of money available for speculative balance at income level 700? a. 115. b. 110. c. 113. d. 109. e. 100. 274.
Money supply = 300 Transaction precautionary demand for money = 0.25Y The speculative demand for money = 150 – 500i
The quantity of money available for speculative balance at income level 900 will be: a. 25 b. 30 c. 32 d. 24 e. 29. 275. Equilibrium in the commodity market Y = 850 – 2500i (IS Curve) Equilibrium in the money market Y = –500 + 5m + 1000i (LM curve) ‘m’ represents money supply and ‘i’ represents interest rate. Full employment exists at 650
real income level. If the nominal supply is 200 and the price level is 1, the price level at which simultaneous equilibrium on all markets is:
a. 0.934 b. 0.921 c. 0.923 d. 0.918 e. 0.912. Based on the following information answer the questions 276 and 278.
Savings function (S) = –720 + 0.3Yd Disposable income (Yd) = Y – T + R Tax function (T) = 0.2Y Private investment function (I) = 20 + 0.10Y
Exogenous Govt. expenditure (G) = 200
Transfer payments (R) = 50
Exports (E) = 25
Import function (X) = 0.05Y
© 2004
The Ic
fai U
nivers
ity P
ress.A
ll righ
ts res
erved
.ISBN : 8
1-314
-0227
-4 Ref.
No.
MACWB 04
2004
04
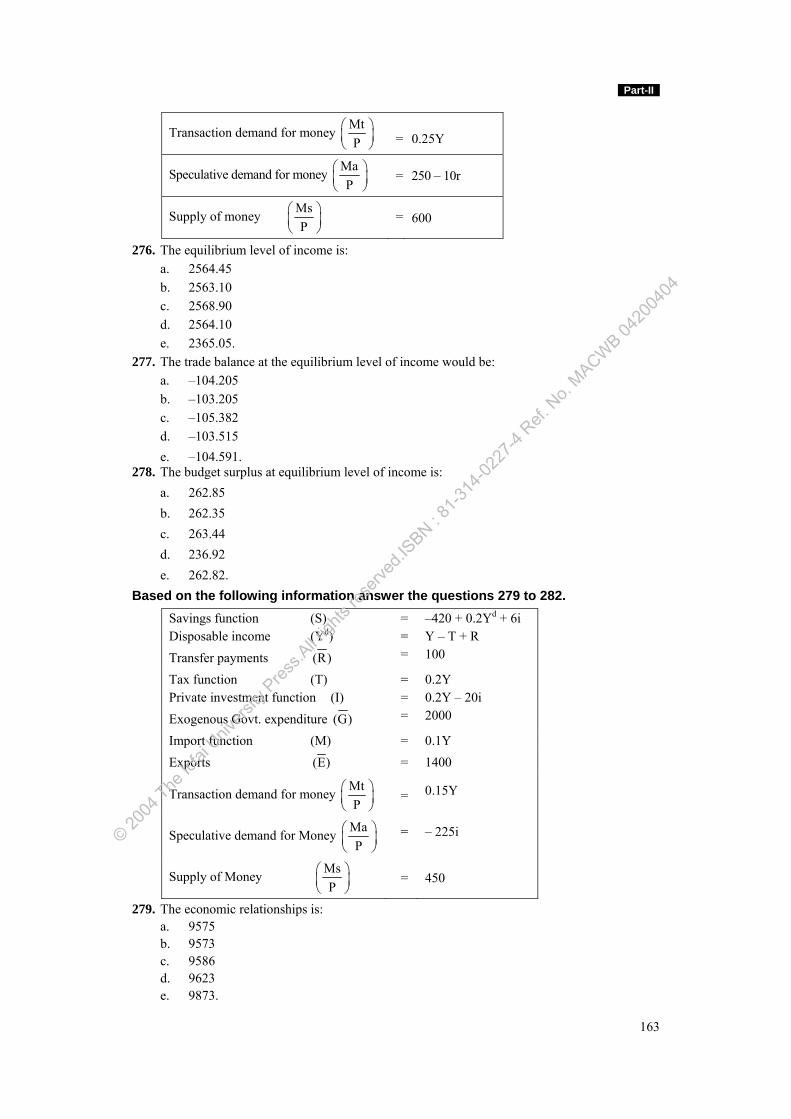
Part-II
163
Transaction demand for money MtP
⎛ ⎞⎜ ⎟⎝ ⎠
=
0.25Y
Speculative demand for money MaP
⎛ ⎞⎜ ⎟⎝ ⎠
= 250 – 10r
Supply of money MsP
⎛ ⎞⎜ ⎟⎝ ⎠
=
600
276. The equilibrium level of income is: a. 2564.45 b. 2563.10 c. 2568.90 d. 2564.10 e. 2365.05. 277. The trade balance at the equilibrium level of income would be: a. –104.205 b. –103.205 c. –105.382 d. –103.515 e. –104.591. 278. The budget surplus at equilibrium level of income is: a. 262.85 b. 262.35 c. 263.44 d. 236.92 e. 262.82. Based on the following information answer the questions 279 to 282.
Savings function (S) = –420 + 0.2Yd + 6i Disposable income (Yd) = Y – T + R Transfer payments (R) = 100
Tax function (T) = 0.2Y Private investment function (I) = 0.2Y – 20i Exogenous Govt. expenditure (G) = 2000
Import function (M) = 0.1Y Exports (E) = 1400
Transaction demand for money MtP
⎛ ⎞⎜ ⎟⎝ ⎠
= 0.15Y
Speculative demand for Money MaP
⎛ ⎞⎜ ⎟⎝ ⎠
=
– 225i
Supply of Money MsP
⎛ ⎞⎜ ⎟⎝ ⎠
= 450
279. The economic relationships is: a. 9575 b. 9573 c. 9586 d. 9623 e. 9873.
© 2004
The Ic
fai U
nivers
ity P
ress.A
ll righ
ts res
erved
.ISBN : 8
1-314
-0227
-4 Ref.
No.
MACWB 04
2004
04
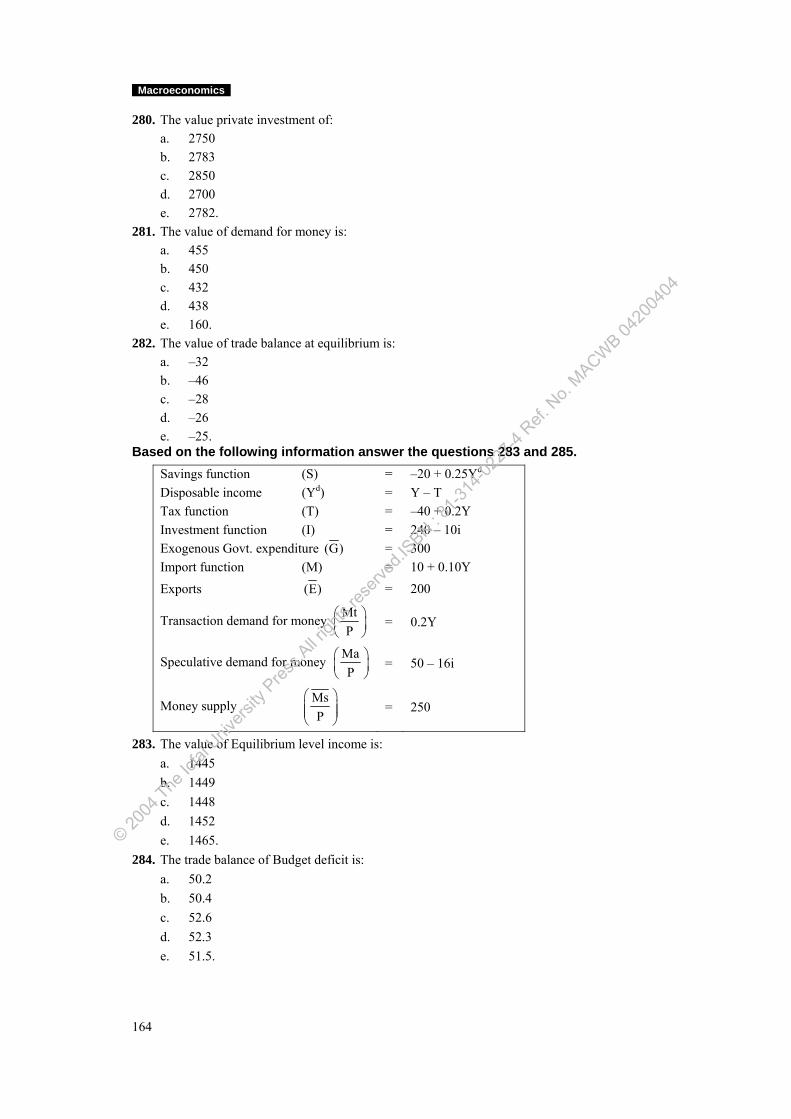
Macroeconomics
164
280. The value private investment of: a. 2750 b. 2783 c. 2850 d. 2700 e. 2782. 281. The value of demand for money is: a. 455 b. 450 c. 432 d. 438 e. 160. 282. The value of trade balance at equilibrium is: a. –32 b. –46 c. –28 d. –26 e. –25. Based on the following information answer the questions 283 and 285.
Savings function (S) = –20 + 0.25Yd Disposable income (Yd) = Y – T Tax function (T) = –40 + 0.2Y Investment function (I) = 240 – 10i Exogenous Govt. expenditure (G) = 300 Import function (M) = 10 + 0.10Y
Exports (E) = 200
Transaction demand for money MtP
⎛ ⎞⎜ ⎟⎝ ⎠
= 0.2Y
Speculative demand for money MaP
⎛ ⎞⎜ ⎟⎝ ⎠
= 50 – 16i
Money supply MsP
⎛ ⎞⎜ ⎟⎜ ⎟⎝ ⎠
= 250
283. The value of Equilibrium level income is: a. 1445 b. 1449 c. 1448 d. 1452 e. 1465. 284. The trade balance of Budget deficit is: a. 50.2 b. 50.4 c. 52.6 d. 52.3 e. 51.5.
© 2004
The Ic
fai U
nivers
ity P
ress.A
ll righ
ts res
erved
.ISBN : 8
1-314
-0227
-4 Ref.
No.
MACWB 04
2004
04
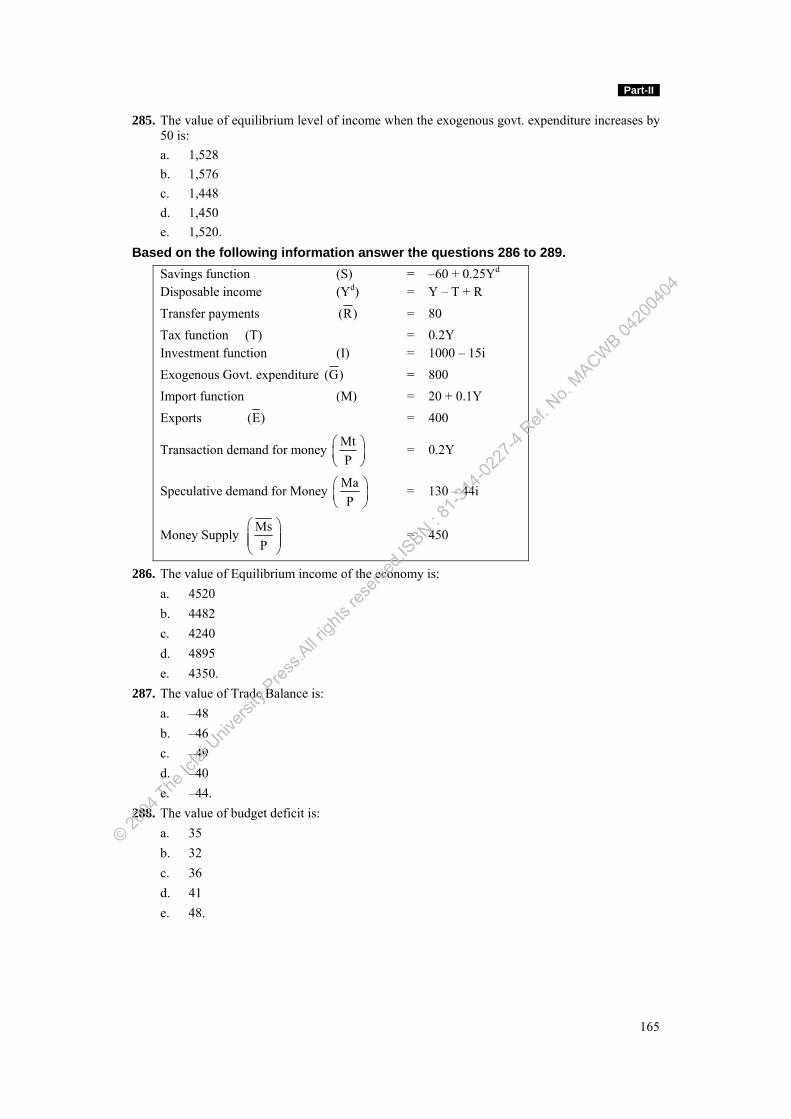
Part-II
165
285. The value of equilibrium level of income when the exogenous govt. expenditure increases by 50 is:
a. 1,528 b. 1,576 c. 1,448 d. 1,450 e. 1,520. Based on the following information answer the questions 286 to 289.
Savings function (S) = –60 + 0.25Yd Disposable income (Yd) = Y – T + R Transfer payments (R) = 80 Tax function (T) = 0.2Y Investment function (I) = 1000 – 15i Exogenous Govt. expenditure (G) = 800 Import function (M) = 20 + 0.1Y Exports (E) = 400
Transaction demand for money MtP
⎛ ⎞⎜ ⎟⎝ ⎠
= 0.2Y
Speculative demand for Money MaP
⎛ ⎞⎜ ⎟⎝ ⎠
= 130 – 44i
Money Supply MsP
⎛ ⎞⎜ ⎟⎜ ⎟⎝ ⎠
= 450
286. The value of Equilibrium income of the economy is: a. 4520 b. 4482 c. 4240 d. 4895 e. 4350. 287. The value of Trade Balance is: a. –48 b. –46 c. –49 d. –40 e. –44. 288. The value of budget deficit is: a. 35 b. 32 c. 36 d. 41 e. 48.
© 2004
The Ic
fai U
nivers
ity P
ress.A
ll righ
ts res
erved
.ISBN : 8
1-314
-0227
-4 Ref.
No.
MACWB 04
2004
04
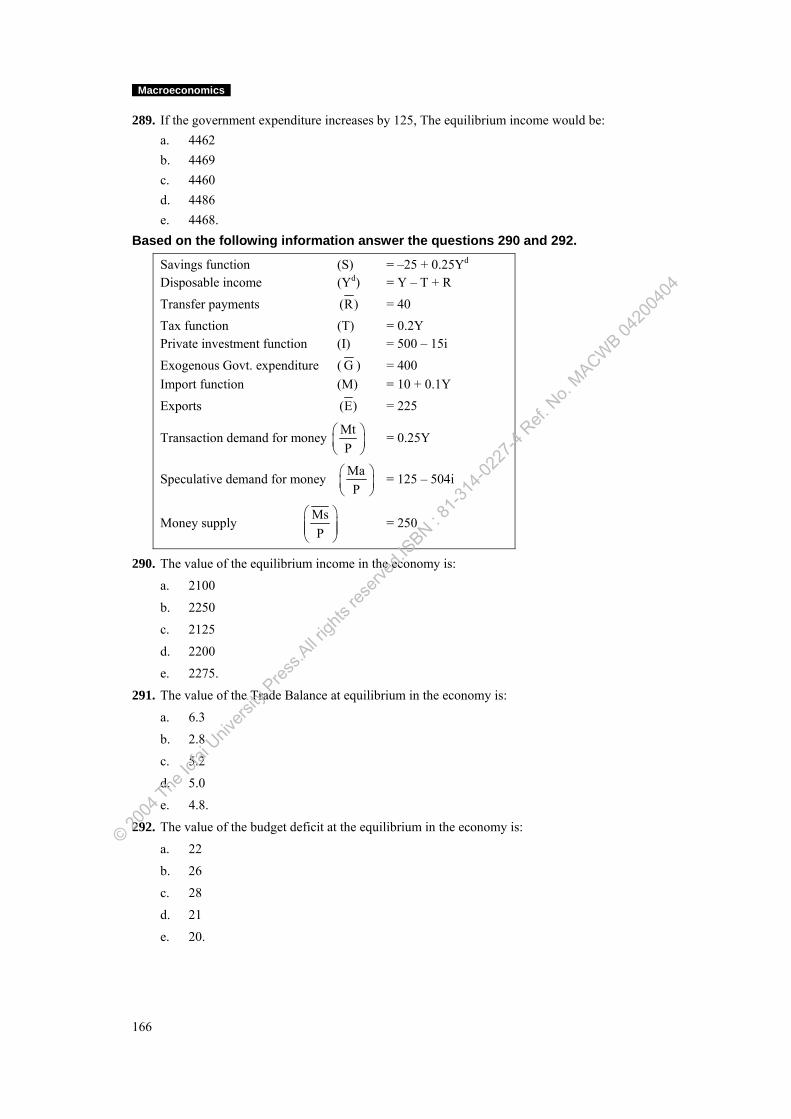
Macroeconomics
166
289. If the government expenditure increases by 125, The equilibrium income would be: a. 4462 b. 4469 c. 4460 d. 4486 e. 4468. Based on the following information answer the questions 290 and 292.
Savings function (S) = –25 + 0.25Yd Disposable income (Yd) = Y – T + R Transfer payments (R) = 40 Tax function (T) = 0.2Y Private investment function (I) = 500 – 15i Exogenous Govt. expenditure ( G ) = 400 Import function (M) = 10 + 0.1Y Exports (E) = 225
Transaction demand for money MtP
⎛ ⎞⎜ ⎟⎝ ⎠
= 0.25Y
Speculative demand for money MaP
⎛ ⎞⎜ ⎟⎝ ⎠
= 125 – 504i
Money supply MsP
⎛ ⎞⎜ ⎟⎜ ⎟⎝ ⎠
= 250
290. The value of the equilibrium income in the economy is:
a. 2100
b. 2250
c. 2125
d. 2200
e. 2275.
291. The value of the Trade Balance at equilibrium in the economy is:
a. 6.3
b. 2.8
c. 5.2
d. 5.0
e. 4.8.
292. The value of the budget deficit at the equilibrium in the economy is:
a. 22
b. 26
c. 28
d. 21
e. 20.
© 2004
The Ic
fai U
nivers
ity P
ress.A
ll righ
ts res
erved
.ISBN : 8
1-314
-0227
-4 Ref.
No.
MACWB 04
2004
04
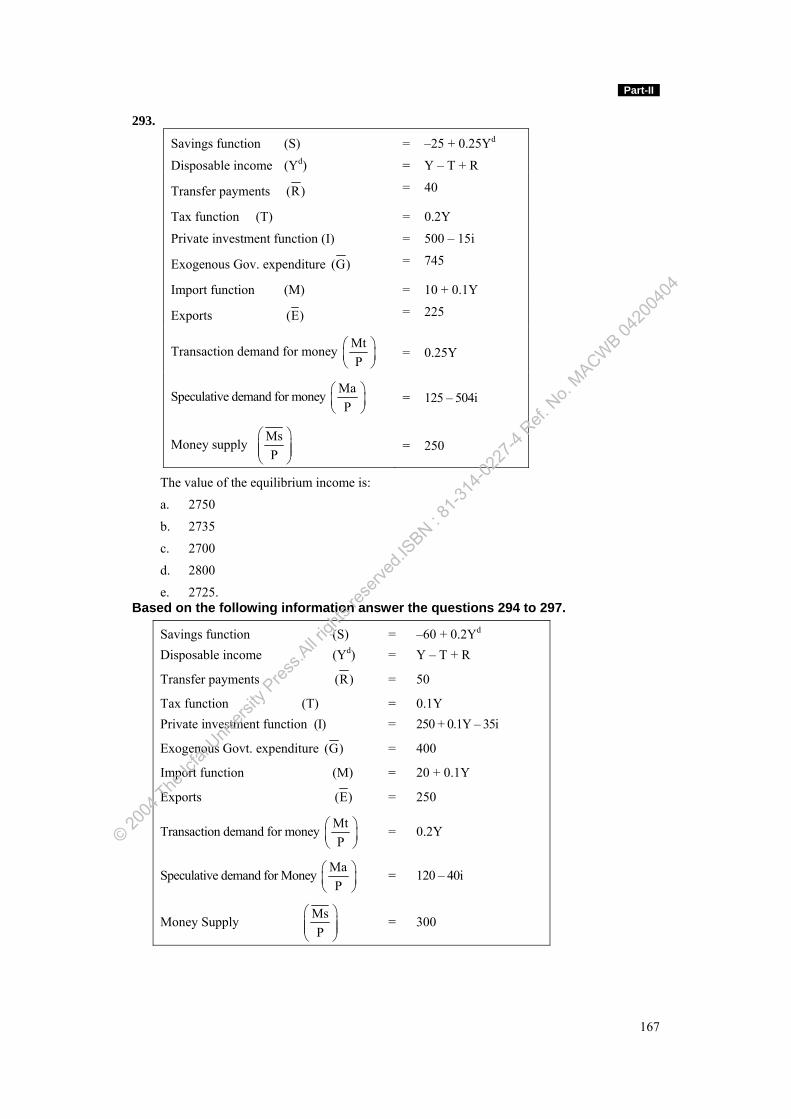
Part-II
167
293.
Savings function (S) = –25 + 0.25Yd
Disposable income (Yd) = Y – T + R
Transfer payments (R) = 40
Tax function (T) = 0.2Y
Private investment function (I) = 500 – 15i
Exogenous Gov. expenditure (G) = 745
Import function (M) = 10 + 0.1Y
Exports (E) = 225
Transaction demand for money MtP
⎛ ⎞⎜ ⎟⎝ ⎠
= 0.25Y
Speculative demand for money MaP
⎛ ⎞⎜ ⎟⎝ ⎠
= 125 – 504i
Money supply MsP
⎛ ⎞⎜ ⎟⎜ ⎟⎝ ⎠
= 250
The value of the equilibrium income is:
a. 2750
b. 2735
c. 2700
d. 2800
e. 2725. Based on the following information answer the questions 294 to 297.
Savings function (S) = –60 + 0.2Yd Disposable income (Yd) = Y – T + R
Transfer payments (R) = 50
Tax function (T) = 0.1Y Private investment function (I) = 250 + 0.1Y – 35i
Exogenous Govt. expenditure (G) = 400
Import function (M) = 20 + 0.1Y
Exports (E) = 250
Transaction demand for money MtP
⎛ ⎞⎜ ⎟⎝ ⎠
= 0.2Y
Speculative demand for Money MaP
⎛ ⎞⎜ ⎟⎝ ⎠
= 120 – 40i
Money Supply MsP
⎛ ⎞⎜ ⎟⎜ ⎟⎝ ⎠
= 300
© 2004
The Ic
fai U
nivers
ity P
ress.A
ll righ
ts res
erved
.ISBN : 8
1-314
-0227
-4 Ref.
No.
MACWB 04
2004
04
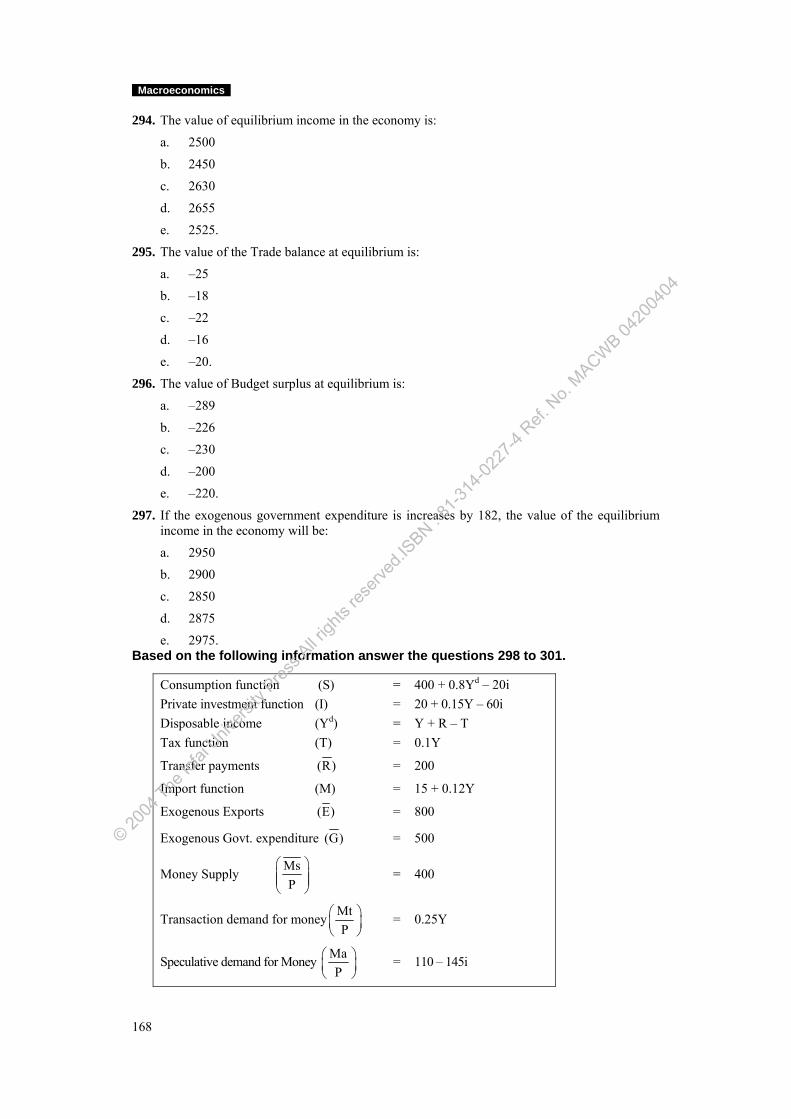
Macroeconomics
168
294. The value of equilibrium income in the economy is:
a. 2500
b. 2450
c. 2630
d. 2655
e. 2525.
295. The value of the Trade balance at equilibrium is:
a. –25
b. –18
c. –22
d. –16
e. –20.
296. The value of Budget surplus at equilibrium is:
a. –289
b. –226
c. –230
d. –200
e. –220.
297. If the exogenous government expenditure is increases by 182, the value of the equilibrium income in the economy will be:
a. 2950
b. 2900
c. 2850
d. 2875
e. 2975. Based on the following information answer the questions 298 to 301.
Consumption function (S) = 400 + 0.8Yd – 20i Private investment function (I) = 20 + 0.15Y – 60i Disposable income (Yd) = Y + R – T Tax function (T) = 0.1Y
Transfer payments (R) = 200
Import function (M) = 15 + 0.12Y
Exogenous Exports (E) = 800
Exogenous Govt. expenditure (G) = 500
Money Supply MsP
⎛ ⎞⎜ ⎟⎜ ⎟⎝ ⎠
= 400
Transaction demand for money MtP
⎛ ⎞⎜ ⎟⎝ ⎠
= 0.25Y
Speculative demand for Money MaP
⎛ ⎞⎜ ⎟⎝ ⎠
= 110 – 145i
© 2004
The Ic
fai U
nivers
ity P
ress.A
ll righ
ts res
erved
.ISBN : 8
1-314
-0227
-4 Ref.
No.
MACWB 04
2004
04
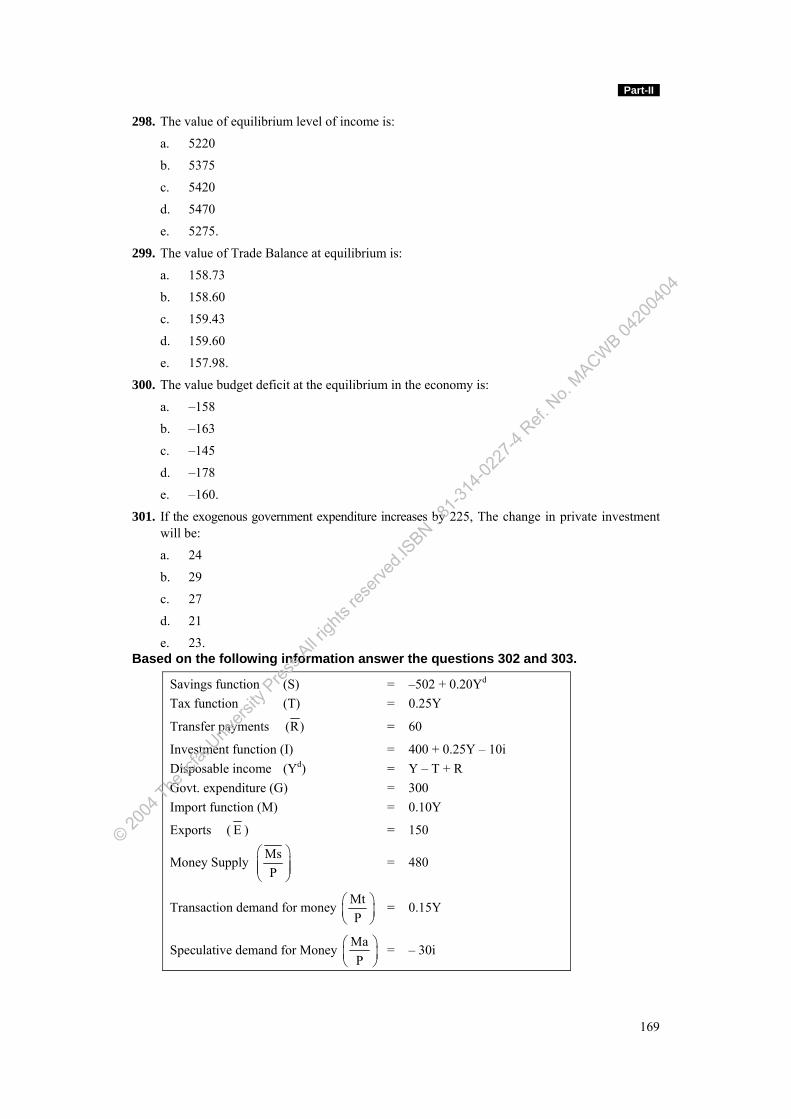
Part-II
169
298. The value of equilibrium level of income is:
a. 5220
b. 5375
c. 5420
d. 5470
e. 5275.
299. The value of Trade Balance at equilibrium is:
a. 158.73
b. 158.60
c. 159.43
d. 159.60
e. 157.98.
300. The value budget deficit at the equilibrium in the economy is:
a. –158
b. –163
c. –145
d. –178
e. –160.
301. If the exogenous government expenditure increases by 225, The change in private investment will be:
a. 24
b. 29
c. 27
d. 21
e. 23. Based on the following information answer the questions 302 and 303.
Savings function (S) = –502 + 0.20Yd Tax function (T) = 0.25Y
Transfer payments (R) = 60
Investment function (I) = 400 + 0.25Y – 10i Disposable income (Yd) = Y – T + R Govt. expenditure (G) = 300 Import function (M) = 0.10Y
Exports ( E ) = 150
Money Supply MsP
⎛ ⎞⎜ ⎟⎜ ⎟⎝ ⎠
= 480
Transaction demand for money MtP
⎛ ⎞⎜ ⎟⎝ ⎠
= 0.15Y
Speculative demand for Money MaP
⎛ ⎞⎜ ⎟⎝ ⎠
= – 30i
© 2004
The Ic
fai U
nivers
ity P
ress.A
ll righ
ts res
erved
.ISBN : 8
1-314
-0227
-4 Ref.
No.
MACWB 04
2004
04
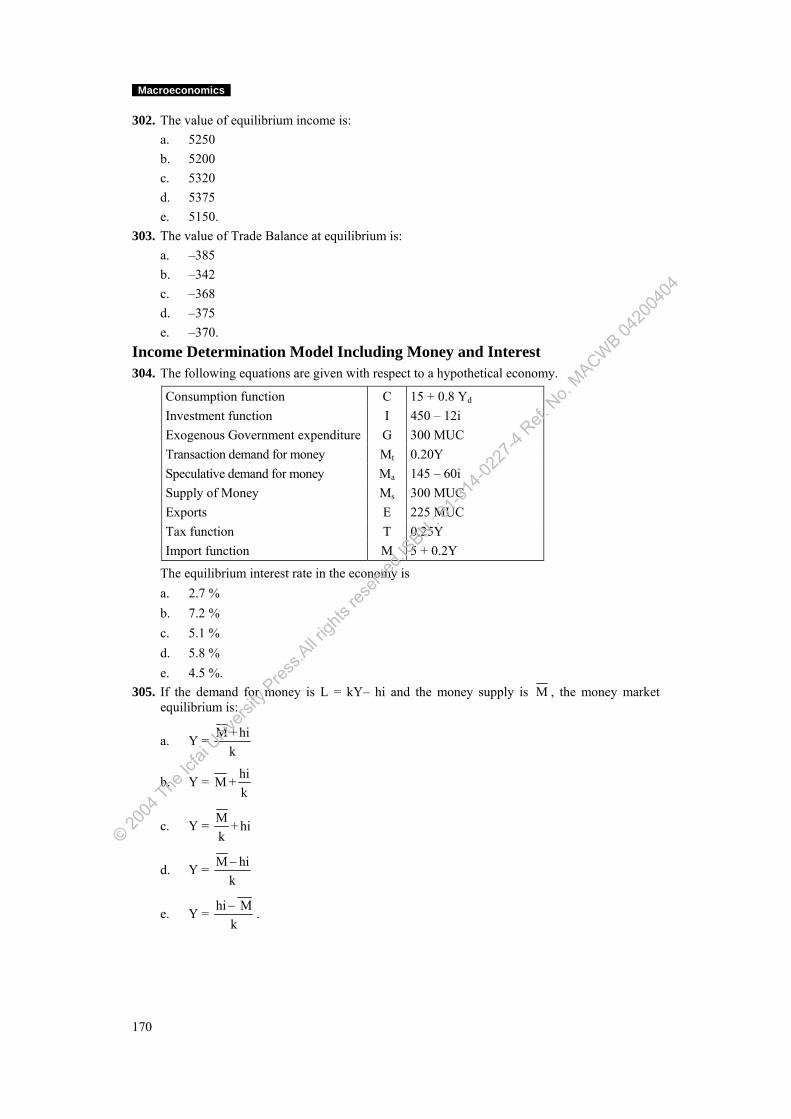
Macroeconomics
170
302. The value of equilibrium income is: a. 5250 b. 5200 c. 5320 d. 5375 e. 5150. 303. The value of Trade Balance at equilibrium is: a. –385 b. –342 c. –368 d. –375 e. –370. Income Determination Model Including Money and Interest 304. The following equations are given with respect to a hypothetical economy.
Consumption function C 15 + 0.8 Yd
Investment function I 450 – 12i Exogenous Government expenditure G 300 MUC Transaction demand for money Mt 0.20Y Speculative demand for money Ma 145 – 60i Supply of Money Ms 300 MUC Exports E 225 MUC Tax function T 0.25Y Import function M 5 + 0.2Y
The equilibrium interest rate in the economy is a. 2.7 % b. 7.2 % c. 5.1 % d. 5.8 % e. 4.5 %. 305. If the demand for money is L = kY– hi and the money supply is M , the money market
equilibrium is:
a. Y = M + hik
b. Y = hiM +k
c. Y = M + hik
d. Y = M hik−
e. Y = hi Mk− .
© 2004
The Ic
fai U
nivers
ity P
ress.A
ll righ
ts res
erved
.ISBN : 8
1-314
-0227
-4 Ref.
No.
MACWB 04
2004
04
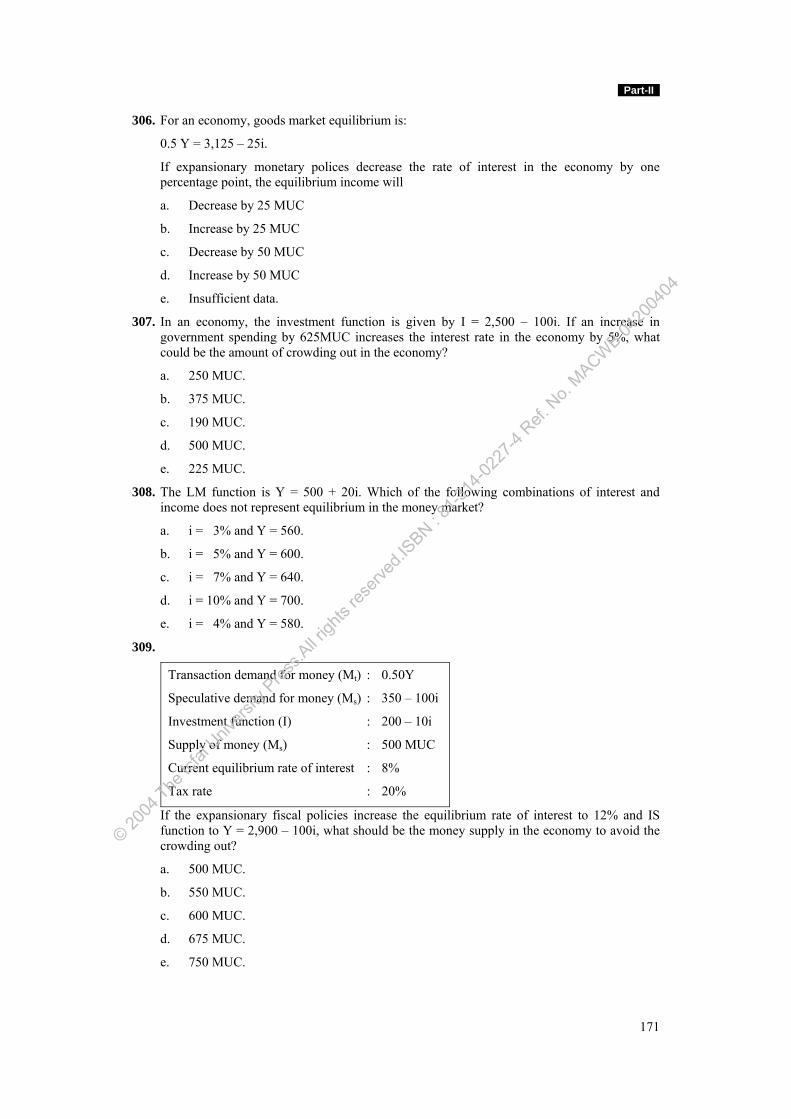
Part-II
171
306. For an economy, goods market equilibrium is:
0.5 Y = 3,125 – 25i.
If expansionary monetary polices decrease the rate of interest in the economy by one percentage point, the equilibrium income will
a. Decrease by 25 MUC
b. Increase by 25 MUC
c. Decrease by 50 MUC
d. Increase by 50 MUC
e. Insufficient data.
307. In an economy, the investment function is given by I = 2,500 – 100i. If an increase in government spending by 625MUC increases the interest rate in the economy by 5%, what could be the amount of crowding out in the economy?
a. 250 MUC.
b. 375 MUC.
c. 190 MUC.
d. 500 MUC.
e. 225 MUC.
308. The LM function is Y = 500 + 20i. Which of the following combinations of interest and income does not represent equilibrium in the money market?
a. i = 3% and Y = 560.
b. i = 5% and Y = 600.
c. i = 7% and Y = 640.
d. i = 10% and Y = 700.
e. i = 4% and Y = 580.
309.
Transaction demand for money (Mt) : 0.50Y
Speculative demand for money (Ms) : 350 – 100i
Investment function (I) : 200 – 10i
Supply of money (Ms) : 500 MUC
Current equilibrium rate of interest : 8%
Tax rate : 20%
If the expansionary fiscal policies increase the equilibrium rate of interest to 12% and IS function to Y = 2,900 – 100i, what should be the money supply in the economy to avoid the crowding out?
a. 500 MUC.
b. 550 MUC.
c. 600 MUC.
d. 675 MUC.
e. 750 MUC.
© 2004
The Ic
fai U
nivers
ity P
ress.A
ll righ
ts res
erved
.ISBN : 8
1-314
-0227
-4 Ref.
No.
MACWB 04
2004
04
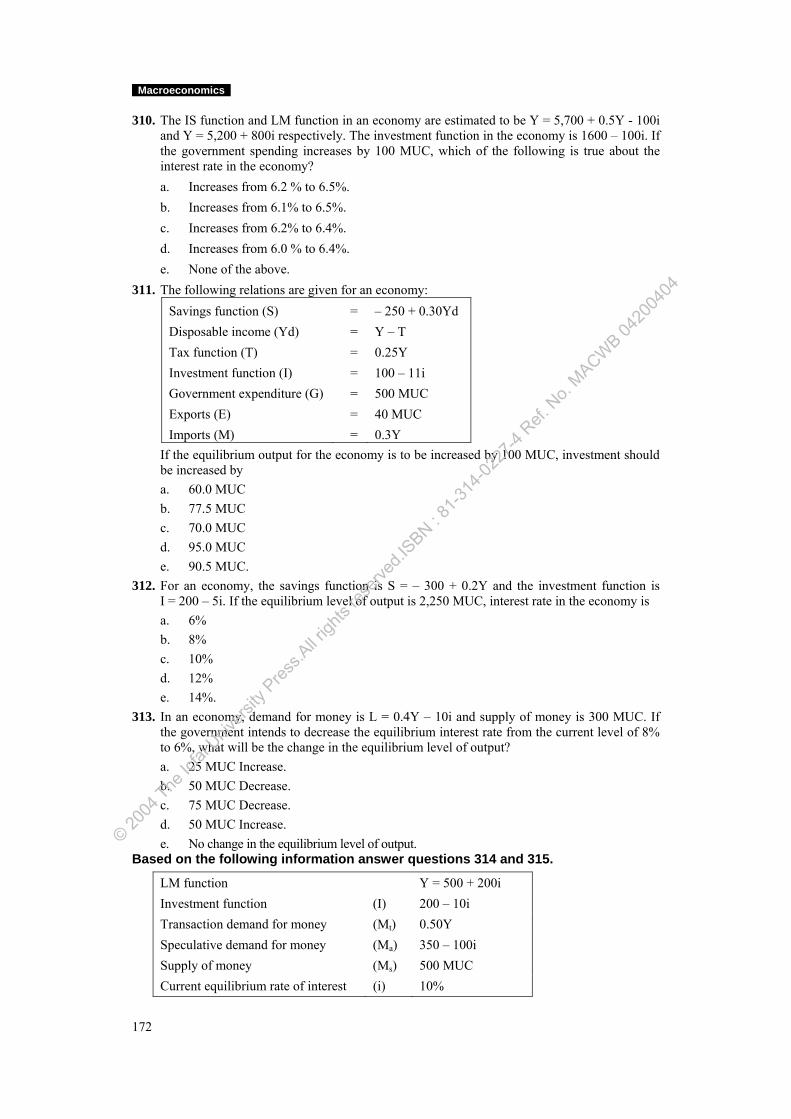
Macroeconomics
172
310. The IS function and LM function in an economy are estimated to be Y = 5,700 + 0.5Y - 100i and Y = 5,200 + 800i respectively. The investment function in the economy is 1600 – 100i. If the government spending increases by 100 MUC, which of the following is true about the interest rate in the economy?
a. Increases from 6.2 % to 6.5%. b. Increases from 6.1% to 6.5%. c. Increases from 6.2% to 6.4%. d. Increases from 6.0 % to 6.4%. e. None of the above. 311. The following relations are given for an economy:
Savings function (S) Disposable income (Yd) Tax function (T) Investment function (I) Government expenditure (G) Exports (E) Imports (M)
= = = = = = =
– 250 + 0.30Yd Y – T 0.25Y 100 – 11i 500 MUC 40 MUC 0.3Y
If the equilibrium output for the economy is to be increased by 100 MUC, investment should be increased by
a. 60.0 MUC b. 77.5 MUC c. 70.0 MUC d. 95.0 MUC e. 90.5 MUC. 312. For an economy, the savings function is S = – 300 + 0.2Y and the investment function is
I = 200 – 5i. If the equilibrium level of output is 2,250 MUC, interest rate in the economy is a. 6% b. 8% c. 10% d. 12% e. 14%. 313. In an economy, demand for money is L = 0.4Y – 10i and supply of money is 300 MUC. If
the government intends to decrease the equilibrium interest rate from the current level of 8% to 6%, what will be the change in the equilibrium level of output?
a. 25 MUC Increase. b. 50 MUC Decrease. c. 75 MUC Decrease. d. 50 MUC Increase. e. No change in the equilibrium level of output. Based on the following information answer questions 314 and 315.
LM function Y = 500 + 200i Investment function (I) 200 – 10i Transaction demand for money (Mt) 0.50Y Speculative demand for money (Ma) 350 – 100i Supply of money (Ms) 500 MUC Current equilibrium rate of interest (i) 10%
© 2004
The Ic
fai U
nivers
ity P
ress.A
ll righ
ts res
erved
.ISBN : 8
1-314
-0227
-4 Ref.
No.
MACWB 04
2004
04
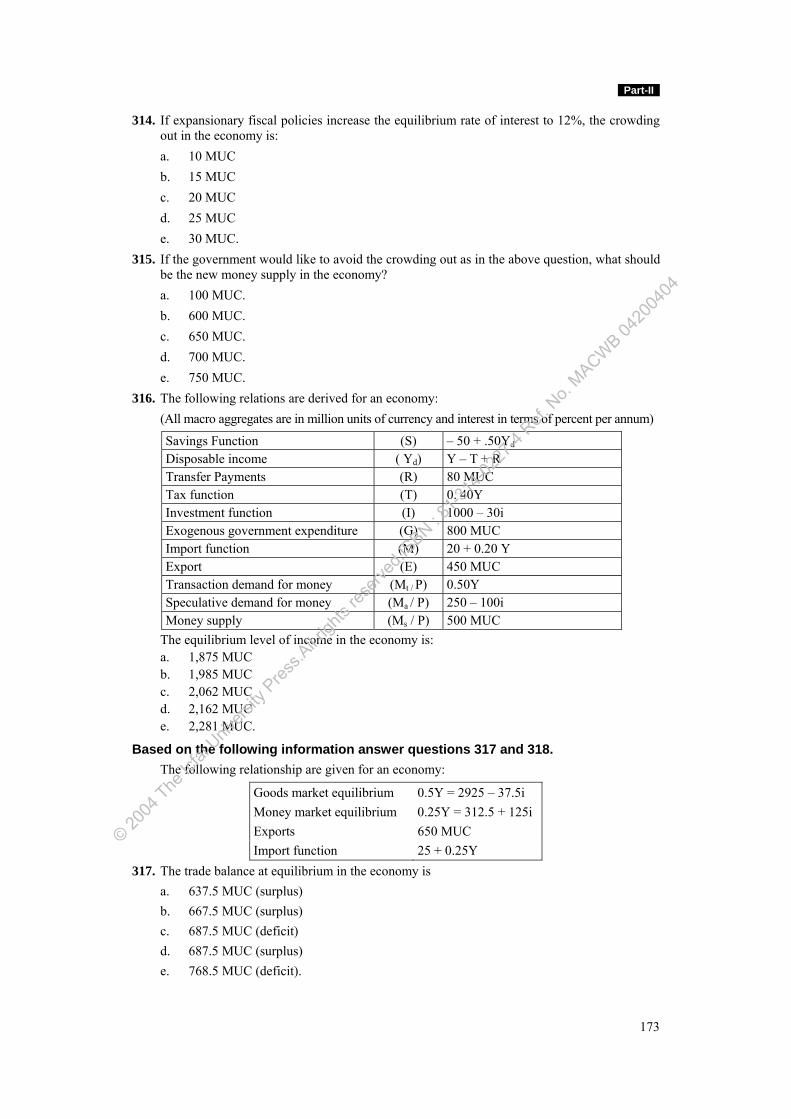
Part-II
173
314. If expansionary fiscal policies increase the equilibrium rate of interest to 12%, the crowding out in the economy is:
a. 10 MUC b. 15 MUC c. 20 MUC d. 25 MUC e. 30 MUC. 315. If the government would like to avoid the crowding out as in the above question, what should
be the new money supply in the economy? a. 100 MUC. b. 600 MUC. c. 650 MUC. d. 700 MUC. e. 750 MUC. 316. The following relations are derived for an economy: (All macro aggregates are in million units of currency and interest in terms of percent per annum)
Savings Function (S) – 50 + .50Yd Disposable income ( Yd) Y – T + R Transfer Payments (R) 80 MUC Tax function (T) 0. 40Y Investment function (I) 1000 – 30i Exogenous government expenditure (G) 800 MUC Import function (M) 20 + 0.20 Y Export (E) 450 MUC Transaction demand for money (Mt / P) 0.50Y Speculative demand for money (Ma / P) 250 – 100i Money supply (Ms / P) 500 MUC
The equilibrium level of income in the economy is: a. 1,875 MUC b. 1,985 MUC c. 2,062 MUC d. 2,162 MUC e. 2,281 MUC.
Based on the following information answer questions 317 and 318. The following relationship are given for an economy:
Goods market equilibrium 0.5Y = 2925 – 37.5i Money market equilibrium 0.25Y = 312.5 + 125i Exports 650 MUC Import function 25 + 0.25Y
317. The trade balance at equilibrium in the economy is a. 637.5 MUC (surplus) b. 667.5 MUC (surplus) c. 687.5 MUC (deficit) d. 687.5 MUC (surplus) e. 768.5 MUC (deficit).
© 2004
The Ic
fai U
nivers
ity P
ress.A
ll righ
ts res
erved
.ISBN : 8
1-314
-0227
-4 Ref.
No.
MACWB 04
2004
04
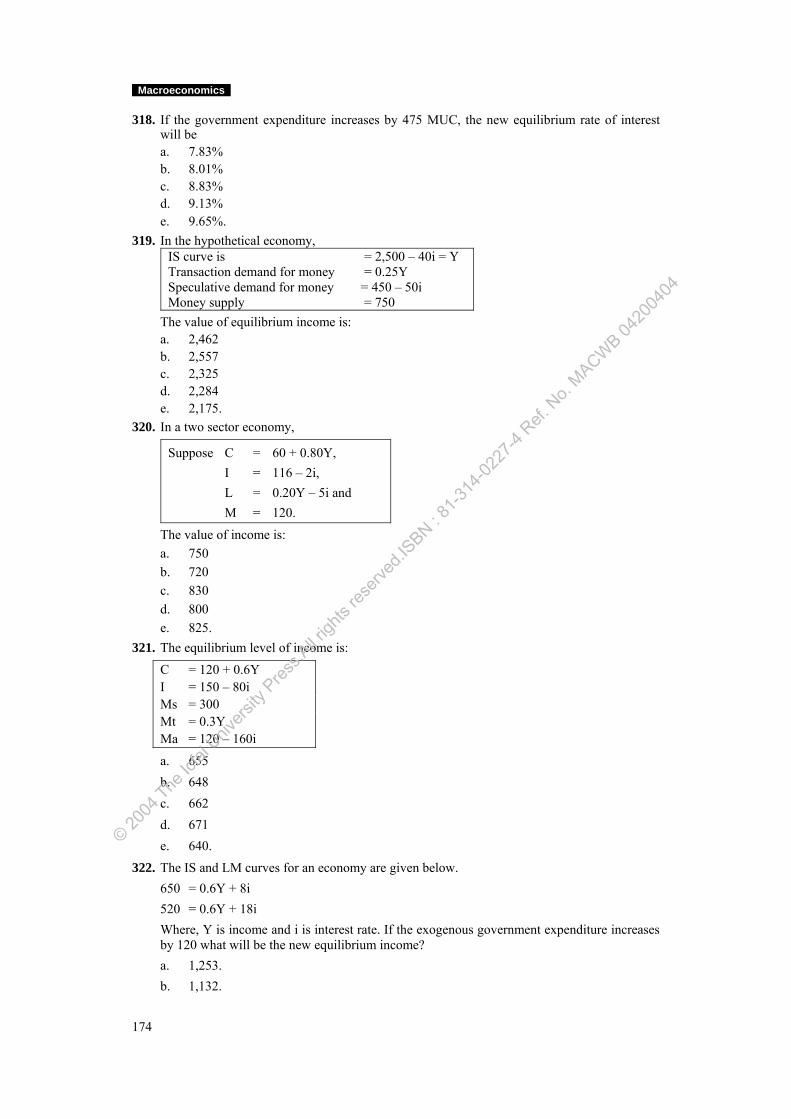
Macroeconomics
174
318. If the government expenditure increases by 475 MUC, the new equilibrium rate of interest will be
a. 7.83% b. 8.01% c. 8.83% d. 9.13% e. 9.65%. 319. In the hypothetical economy,
IS curve is = 2,500 – 40i = Y Transaction demand for money = 0.25Y Speculative demand for money = 450 – 50i Money supply = 750
The value of equilibrium income is: a. 2,462 b. 2,557 c. 2,325 d. 2,284 e. 2,175. 320. In a two sector economy,
Suppose C = 60 + 0.80Y, I = 116 – 2i, L = 0.20Y – 5i and M = 120.
The value of income is: a. 750 b. 720 c. 830 d. 800 e. 825. 321. The equilibrium level of income is:
C = 120 + 0.6Y I = 150 – 80i Ms = 300 Mt = 0.3Y Ma = 120 – 160i
a. 655 b. 648 c. 662 d. 671 e. 640.
322. The IS and LM curves for an economy are given below. 650 = 0.6Y + 8i 520 = 0.6Y + 18i Where, Y is income and i is interest rate. If the exogenous government expenditure increases
by 120 what will be the new equilibrium income? a. 1,253. b. 1,132.
© 2004
The Ic
fai U
nivers
ity P
ress.A
ll righ
ts res
erved
.ISBN : 8
1-314
-0227
-4 Ref.
No.
MACWB 04
2004
04
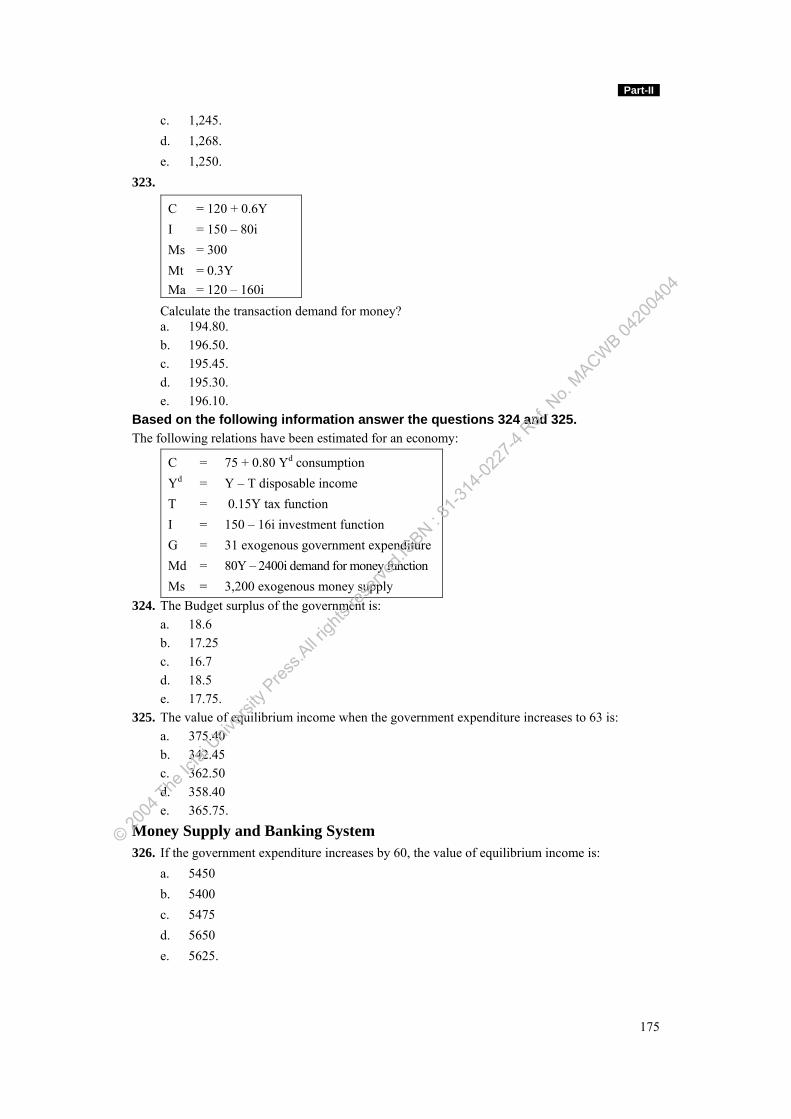
Part-II
175
c. 1,245. d. 1,268. e. 1,250. 323.
C = 120 + 0.6Y I = 150 – 80i Ms = 300 Mt = 0.3Y Ma = 120 – 160i
Calculate the transaction demand for money? a. 194.80. b. 196.50. c. 195.45. d. 195.30. e. 196.10. Based on the following information answer the questions 324 and 325. The following relations have been estimated for an economy:
C = 75 + 0.80 Yd consumption Yd = Y – T disposable income T = 0.15Y tax function I = 150 – 16i investment function G = 31 exogenous government expenditure Md = 80Y – 2400i demand for money function Ms = 3,200 exogenous money supply
324. The Budget surplus of the government is: a. 18.6 b. 17.25 c. 16.7 d. 18.5 e. 17.75. 325. The value of equilibrium income when the government expenditure increases to 63 is: a. 375.40 b. 342.45 c. 362.50 d. 358.40 e. 365.75. Money Supply and Banking System 326. If the government expenditure increases by 60, the value of equilibrium income is: a. 5450 b. 5400 c. 5475 d. 5650 e. 5625.
© 2004
The Ic
fai U
nivers
ity P
ress.A
ll righ
ts res
erved
.ISBN : 8
1-314
-0227
-4 Ref.
No.
MACWB 04
2004
04
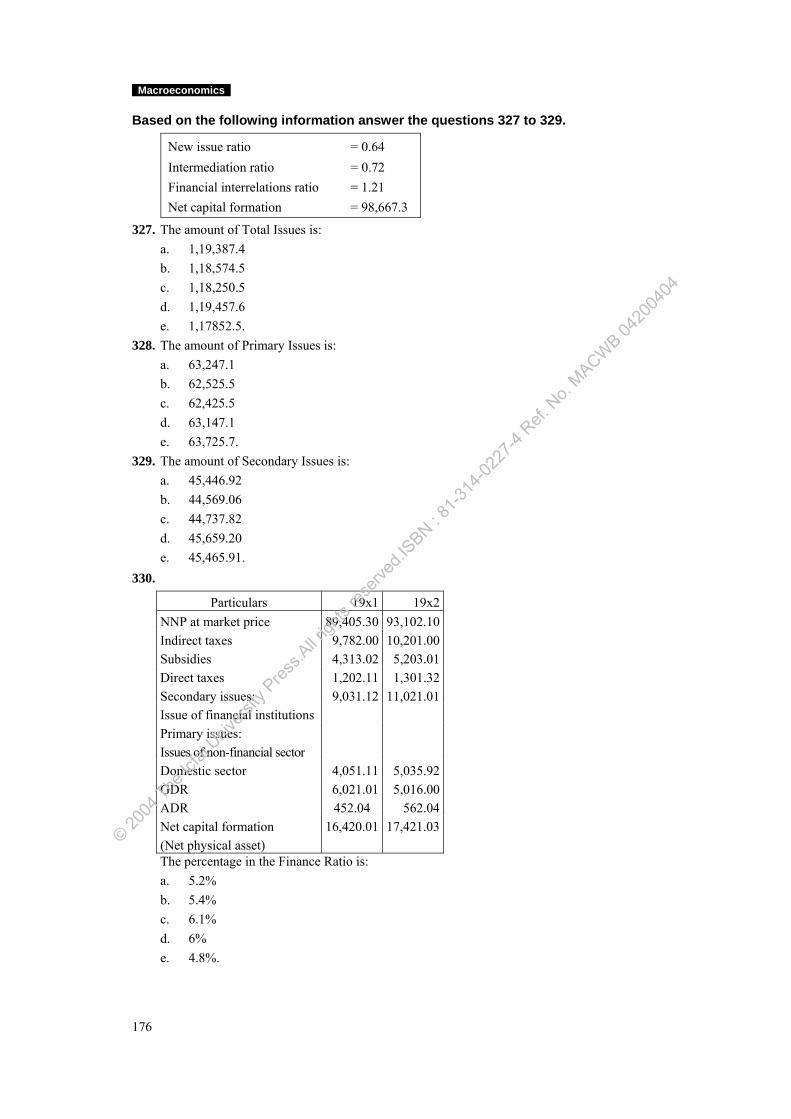
Macroeconomics
176
Based on the following information answer the questions 327 to 329.
New issue ratio = 0.64 Intermediation ratio = 0.72 Financial interrelations ratio = 1.21 Net capital formation = 98,667.3
327. The amount of Total Issues is: a. 1,19,387.4 b. 1,18,574.5 c. 1,18,250.5 d. 1,19,457.6 e. 1,17852.5. 328. The amount of Primary Issues is: a. 63,247.1 b. 62,525.5 c. 62,425.5 d. 63,147.1 e. 63,725.7. 329. The amount of Secondary Issues is: a. 45,446.92 b. 44,569.06 c. 44,737.82 d. 45,659.20 e. 45,465.91. 330.
Particulars 19x1 19x2NNP at market price 89,405.30 93,102.10Indirect taxes 9,782.00 10,201.00Subsidies 4,313.02 5,203.01Direct taxes 1,202.11 1,301.32Secondary issues: 9,031.12 11,021.01Issue of financial institutions Primary issues: Issues of non-financial sector Domestic sector 4,051.11 5,035.92GDR 6,021.01 5,016.00ADR 452.04 562.04Net capital formation (Net physical asset)
16,420.01 17,421.03
The percentage in the Finance Ratio is: a. 5.2% b. 5.4% c. 6.1% d. 6% e. 4.8%.
© 2004
The Ic
fai U
nivers
ity P
ress.A
ll righ
ts res
erved
.ISBN : 8
1-314
-0227
-4 Ref.
No.
MACWB 04
2004
04
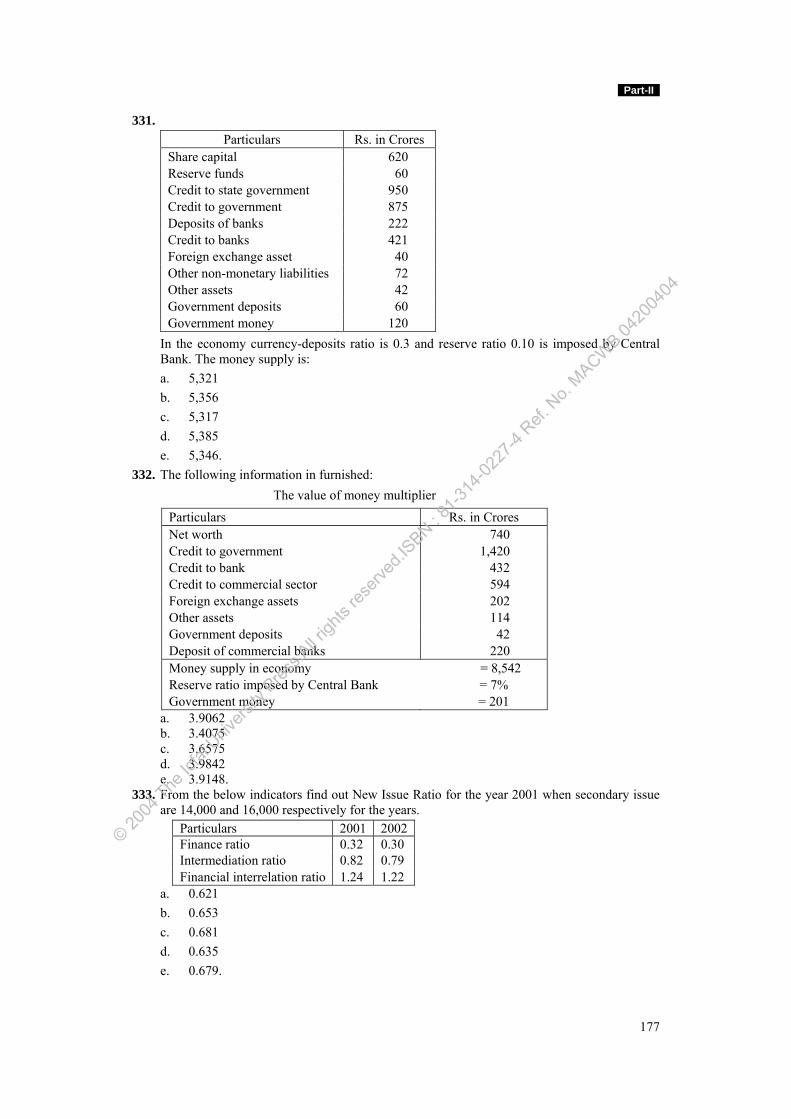
Part-II
177
331. Particulars Rs. in Crores
Share capital 620 Reserve funds 60 Credit to state government 950 Credit to government 875 Deposits of banks 222 Credit to banks 421 Foreign exchange asset 40 Other non-monetary liabilities 72 Other assets 42 Government deposits 60 Government money 120
In the economy currency-deposits ratio is 0.3 and reserve ratio 0.10 is imposed by Central Bank. The money supply is:
a. 5,321 b. 5,356 c. 5,317 d. 5,385 e. 5,346. 332. The following information in furnished: The value of money multiplier
Particulars Rs. in Crores Net worth 740 Credit to government 1,420 Credit to bank 432 Credit to commercial sector 594 Foreign exchange assets 202 Other assets 114 Government deposits 42 Deposit of commercial banks 220 Money supply in economy = 8,542 Reserve ratio imposed by Central Bank = 7% Government money = 201
a. 3.9062 b. 3.4075 c. 3.6575 d. 3.9842 e. 3.9148. 333. From the below indicators find out New Issue Ratio for the year 2001 when secondary issue
are 14,000 and 16,000 respectively for the years. Particulars 2001 2002 Finance ratio 0.32 0.30 Intermediation ratio 0.82 0.79 Financial interrelation ratio 1.24 1.22
a. 0.621 b. 0.653 c. 0.681 d. 0.635 e. 0.679.
© 2004
The Ic
fai U
nivers
ity P
ress.A
ll righ
ts res
erved
.ISBN : 8
1-314
-0227
-4 Ref.
No.
MACWB 04
2004
04
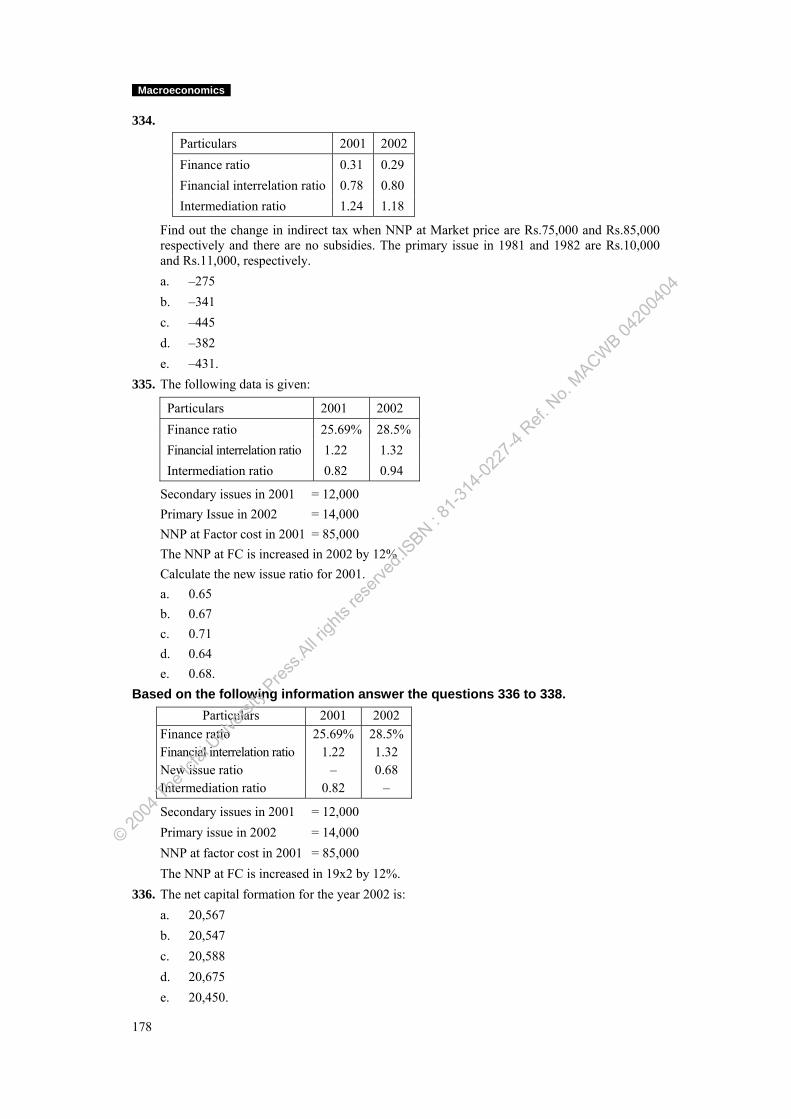
Macroeconomics
178
334.
Particulars 2001 2002 Finance ratio 0.31 0.29 Financial interrelation ratio 0.78 0.80 Intermediation ratio 1.24 1.18
Find out the change in indirect tax when NNP at Market price are Rs.75,000 and Rs.85,000 respectively and there are no subsidies. The primary issue in 1981 and 1982 are Rs.10,000 and Rs.11,000, respectively.
a. –275 b. –341 c. –445 d. –382 e. –431. 335. The following data is given:
Particulars 2001 2002 Finance ratio 25.69% 28.5% Financial interrelation ratio 1.22 1.32 Intermediation ratio 0.82 0.94
Secondary issues in 2001 = 12,000 Primary Issue in 2002 = 14,000 NNP at Factor cost in 2001 = 85,000 The NNP at FC is increased in 2002 by 12% Calculate the new issue ratio for 2001. a. 0.65 b. 0.67 c. 0.71 d. 0.64 e. 0.68. Based on the following information answer the questions 336 to 338.
Particulars 2001 2002 Finance ratio 25.69% 28.5% Financial interrelation ratio 1.22 1.32 New issue ratio – 0.68 Intermediation ratio 0.82 –
Secondary issues in 2001 = 12,000 Primary issue in 2002 = 14,000 NNP at factor cost in 2001 = 85,000 The NNP at FC is increased in 19x2 by 12%. 336. The net capital formation for the year 2002 is: a. 20,567 b. 20,547 c. 20,588 d. 20,675 e. 20,450.
© 2004
The Ic
fai U
nivers
ity P
ress.A
ll righ
ts res
erved
.ISBN : 8
1-314
-0227
-4 Ref.
No.
MACWB 04
2004
04
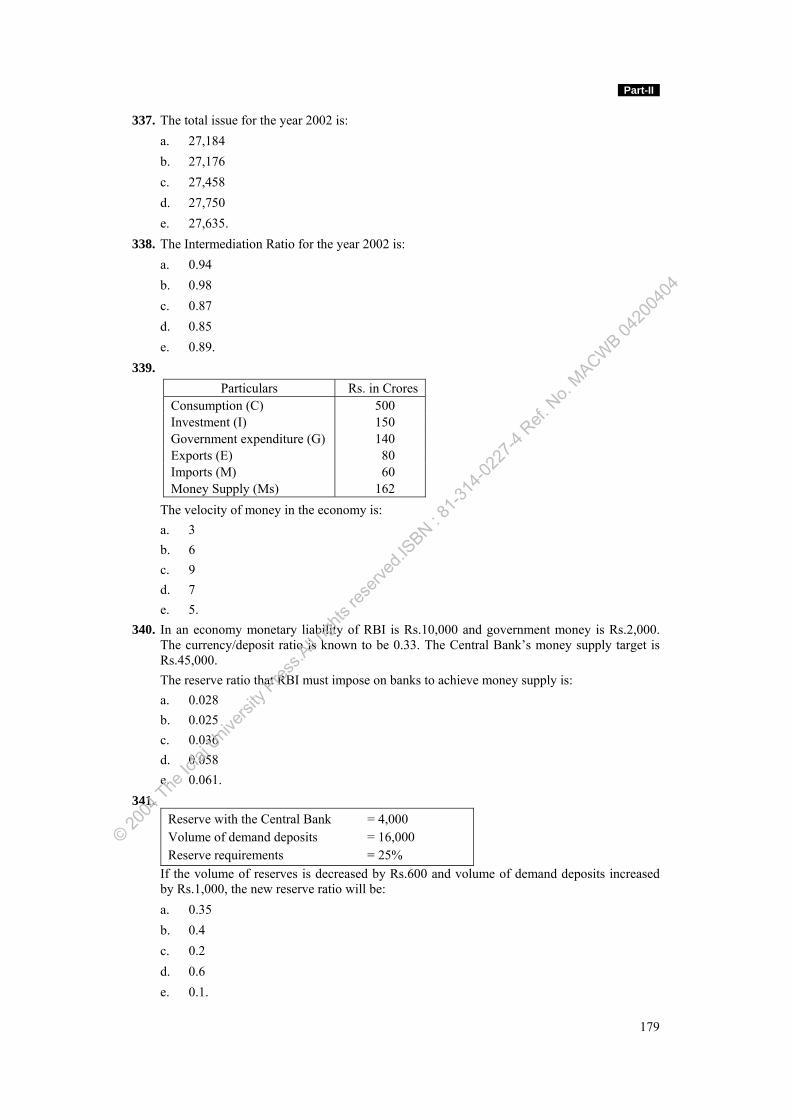
Part-II
179
337. The total issue for the year 2002 is: a. 27,184 b. 27,176 c. 27,458 d. 27,750 e. 27,635. 338. The Intermediation Ratio for the year 2002 is: a. 0.94 b. 0.98 c. 0.87 d. 0.85 e. 0.89. 339.
Particulars Rs. in Crores Consumption (C) 500 Investment (I) 150 Government expenditure (G) 140 Exports (E) 80 Imports (M) 60 Money Supply (Ms) 162
The velocity of money in the economy is: a. 3 b. 6 c. 9 d. 7 e. 5. 340. In an economy monetary liability of RBI is Rs.10,000 and government money is Rs.2,000.
The currency/deposit ratio is known to be 0.33. The Central Bank’s money supply target is Rs.45,000.
The reserve ratio that RBI must impose on banks to achieve money supply is: a. 0.028 b. 0.025 c. 0.036 d. 0.058 e. 0.061. 341.
Reserve with the Central Bank = 4,000 Volume of demand deposits = 16,000 Reserve requirements = 25%
If the volume of reserves is decreased by Rs.600 and volume of demand deposits increased by Rs.1,000, the new reserve ratio will be:
a. 0.35 b. 0.4 c. 0.2 d. 0.6 e. 0.1.
© 2004
The Ic
fai U
nivers
ity P
ress.A
ll righ
ts res
erved
.ISBN : 8
1-314
-0227
-4 Ref.
No.
MACWB 04
2004
04
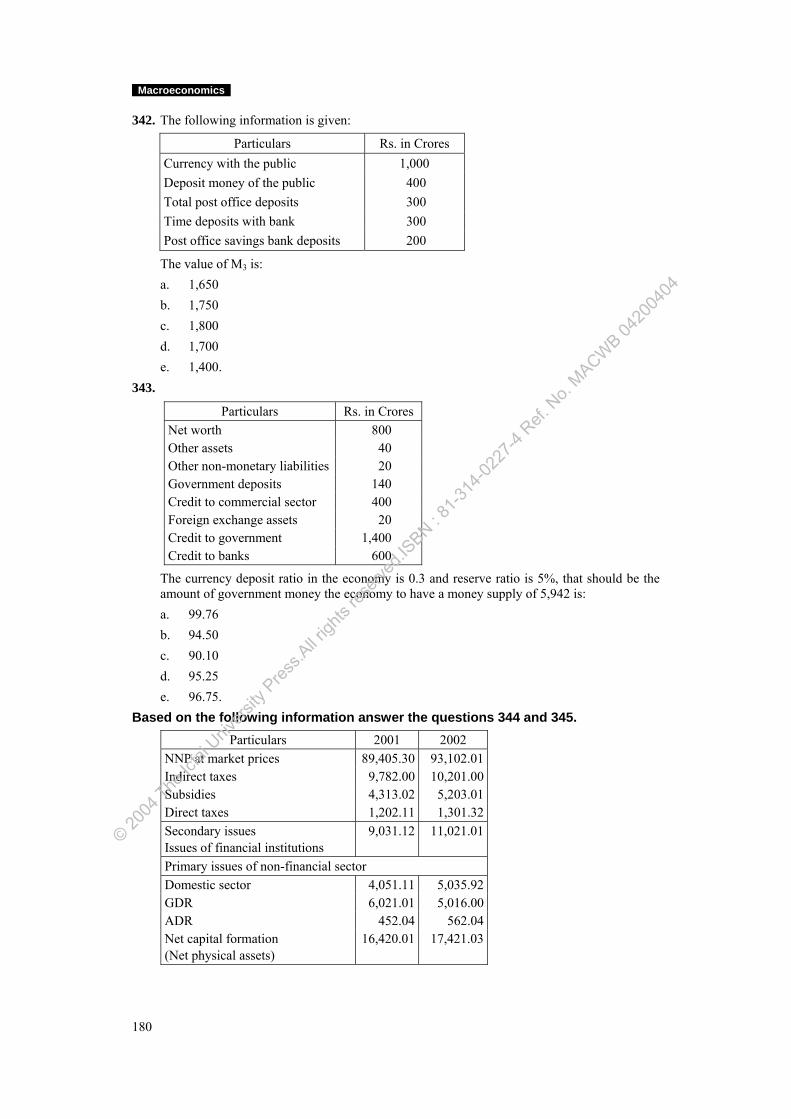
Macroeconomics
180
342. The following information is given:
Particulars Rs. in Crores Currency with the public 1,000 Deposit money of the public 400 Total post office deposits 300 Time deposits with bank 300 Post office savings bank deposits 200
The value of M3 is: a. 1,650 b. 1,750 c. 1,800 d. 1,700 e. 1,400. 343.
Particulars Rs. in Crores Net worth 800 Other assets 40 Other non-monetary liabilities 20 Government deposits 140 Credit to commercial sector 400 Foreign exchange assets 20 Credit to government 1,400 Credit to banks 600
The currency deposit ratio in the economy is 0.3 and reserve ratio is 5%, that should be the amount of government money the economy to have a money supply of 5,942 is:
a. 99.76 b. 94.50 c. 90.10 d. 95.25 e. 96.75. Based on the following information answer the questions 344 and 345.
Particulars 2001 2002 NNP at market prices 89,405.30 93,102.01Indirect taxes 9,782.00 10,201.00Subsidies 4,313.02 5,203.01Direct taxes 1,202.11 1,301.32Secondary issues Issues of financial institutions
9,031.12 11,021.01
Primary issues of non-financial sector Domestic sector 4,051.11 5,035.92GDR 6,021.01 5,016.00ADR 452.04 562.04Net capital formation (Net physical assets)
16,420.01 17,421.03
© 2004
The Ic
fai U
nivers
ity P
ress.A
ll righ
ts res
erved
.ISBN : 8
1-314
-0227
-4 Ref.
No.
MACWB 04
2004
04
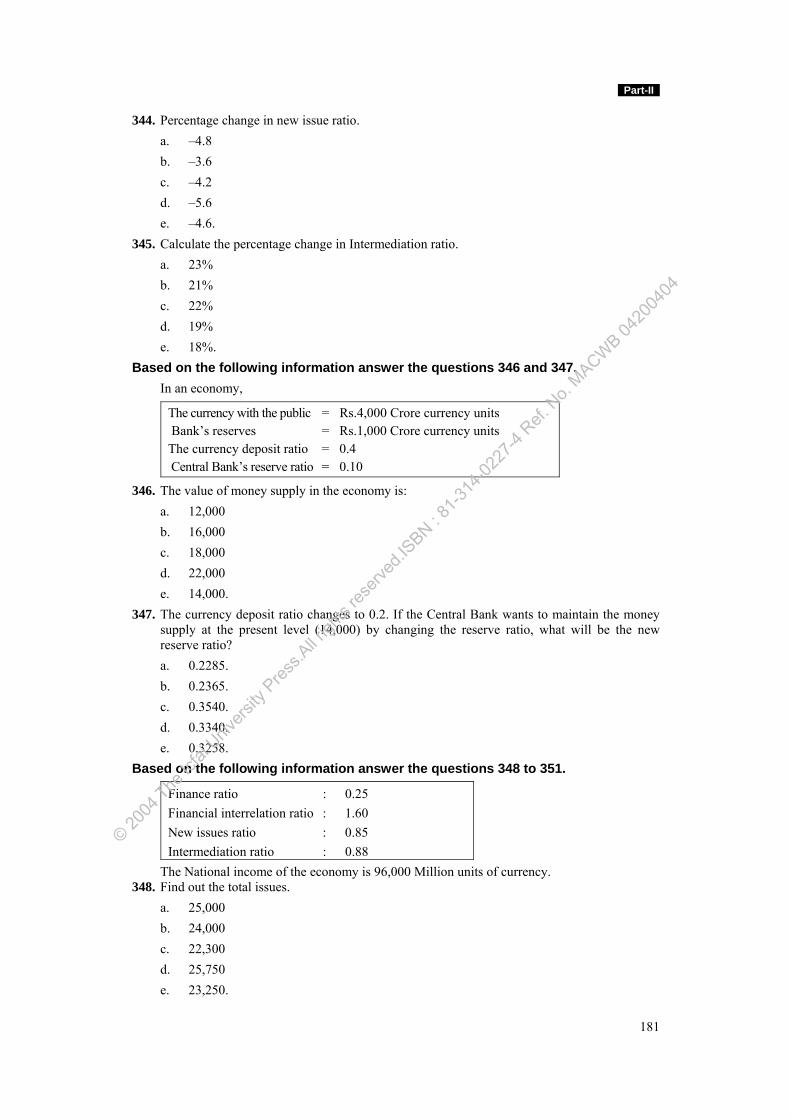
Part-II
181
344. Percentage change in new issue ratio. a. –4.8 b. –3.6 c. –4.2 d. –5.6 e. –4.6. 345. Calculate the percentage change in Intermediation ratio. a. 23% b. 21% c. 22% d. 19% e. 18%. Based on the following information answer the questions 346 and 347. In an economy,
The currency with the public = Rs.4,000 Crore currency units Bank’s reserves = Rs.1,000 Crore currency units The currency deposit ratio = 0.4 Central Bank’s reserve ratio = 0.10
346. The value of money supply in the economy is: a. 12,000 b. 16,000 c. 18,000 d. 22,000 e. 14,000. 347. The currency deposit ratio changes to 0.2. If the Central Bank wants to maintain the money
supply at the present level (14,000) by changing the reserve ratio, what will be the new reserve ratio?
a. 0.2285. b. 0.2365. c. 0.3540. d. 0.3340. e. 0.3258. Based on the following information answer the questions 348 to 351.
Finance ratio : 0.25 Financial interrelation ratio : 1.60 New issues ratio : 0.85 Intermediation ratio : 0.88
The National income of the economy is 96,000 Million units of currency. 348. Find out the total issues. a. 25,000 b. 24,000 c. 22,300 d. 25,750 e. 23,250.
© 2004
The Ic
fai U
nivers
ity P
ress.A
ll righ
ts res
erved
.ISBN : 8
1-314
-0227
-4 Ref.
No.
MACWB 04
2004
04
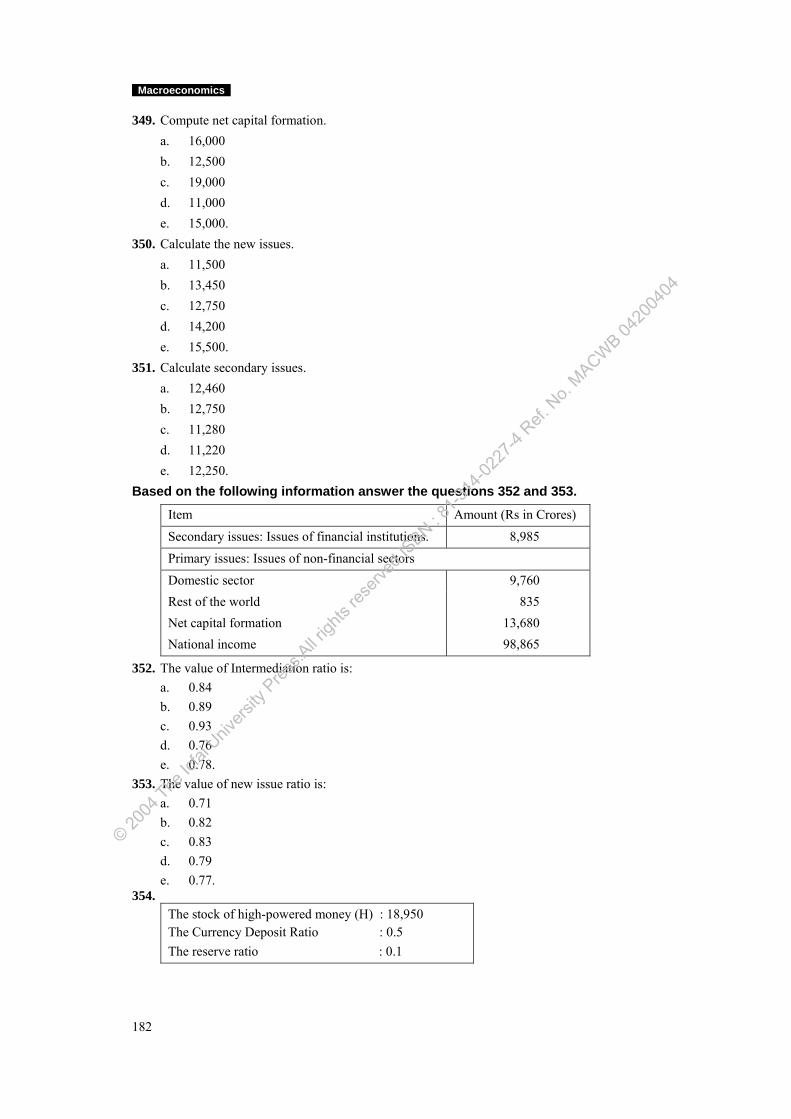
Macroeconomics
182
349. Compute net capital formation. a. 16,000 b. 12,500 c. 19,000 d. 11,000 e. 15,000. 350. Calculate the new issues. a. 11,500 b. 13,450 c. 12,750 d. 14,200 e. 15,500. 351. Calculate secondary issues. a. 12,460 b. 12,750 c. 11,280 d. 11,220 e. 12,250. Based on the following information answer the questions 352 and 353.
Item Amount (Rs in Crores)
Secondary issues: Issues of financial institutions. 8,985
Primary issues: Issues of non-financial sectors
Domestic sector 9,760 Rest of the world 835 Net capital formation 13,680 National income 98,865
352. The value of Intermediation ratio is: a. 0.84 b. 0.89 c. 0.93 d. 0.76 e. 0.78. 353. The value of new issue ratio is: a. 0.71 b. 0.82 c. 0.83 d. 0.79 e. 0.77. 354.
The stock of high-powered money (H) : 18,950 The Currency Deposit Ratio : 0.5 The reserve ratio : 0.1
© 2004
The Ic
fai U
nivers
ity P
ress.A
ll righ
ts res
erved
.ISBN : 8
1-314
-0227
-4 Ref.
No.
MACWB 04
2004
04
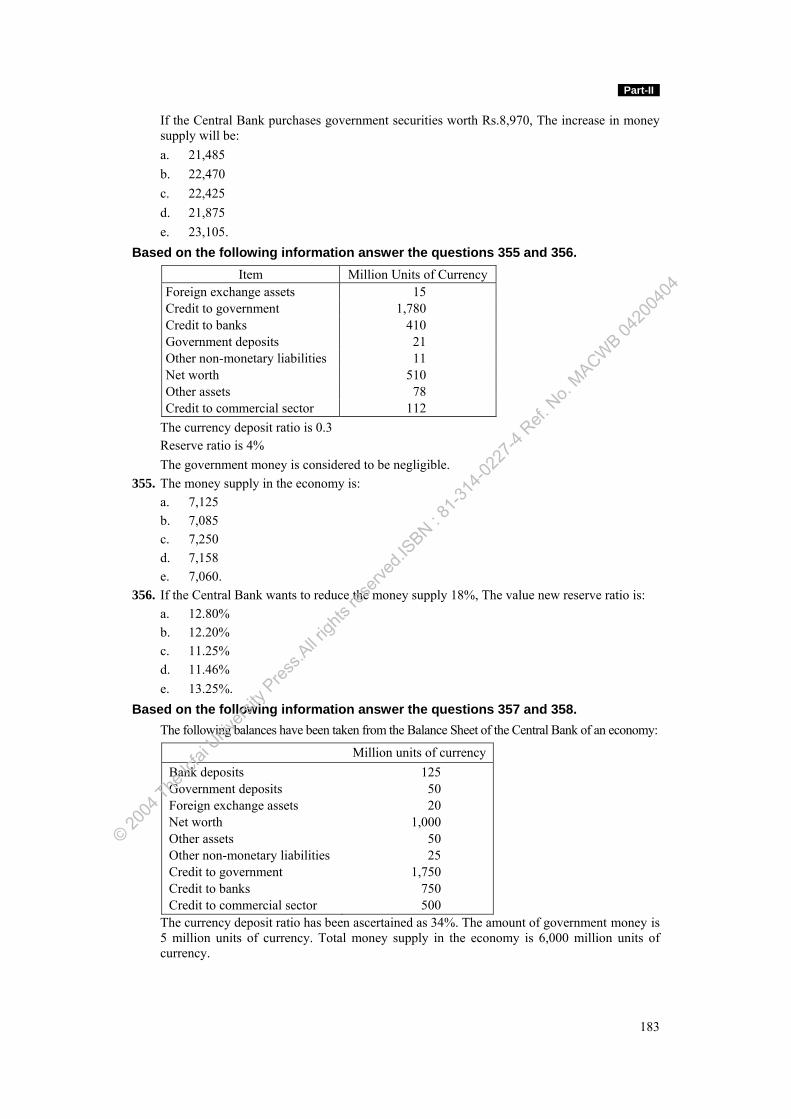
Part-II
183
If the Central Bank purchases government securities worth Rs.8,970, The increase in money supply will be:
a. 21,485 b. 22,470 c. 22,425 d. 21,875 e. 23,105. Based on the following information answer the questions 355 and 356.
Item Million Units of Currency Foreign exchange assets 15 Credit to government 1,780 Credit to banks 410 Government deposits 21 Other non-monetary liabilities 11 Net worth 510 Other assets 78 Credit to commercial sector 112
The currency deposit ratio is 0.3 Reserve ratio is 4% The government money is considered to be negligible. 355. The money supply in the economy is: a. 7,125 b. 7,085 c. 7,250 d. 7,158 e. 7,060. 356. If the Central Bank wants to reduce the money supply 18%, The value new reserve ratio is: a. 12.80% b. 12.20% c. 11.25% d. 11.46% e. 13.25%. Based on the following information answer the questions 357 and 358. The following balances have been taken from the Balance Sheet of the Central Bank of an economy:
Million units of currency Bank deposits Government deposits Foreign exchange assets Net worth Other assets Other non-monetary liabilities Credit to government Credit to banks Credit to commercial sector
125 50 20
1,000 50 25
1,750 750 500
The currency deposit ratio has been ascertained as 34%. The amount of government money is 5 million units of currency. Total money supply in the economy is 6,000 million units of currency.
© 2004
The Ic
fai U
nivers
ity P
ress.A
ll righ
ts res
erved
.ISBN : 8
1-314
-0227
-4 Ref.
No.
MACWB 04
2004
04
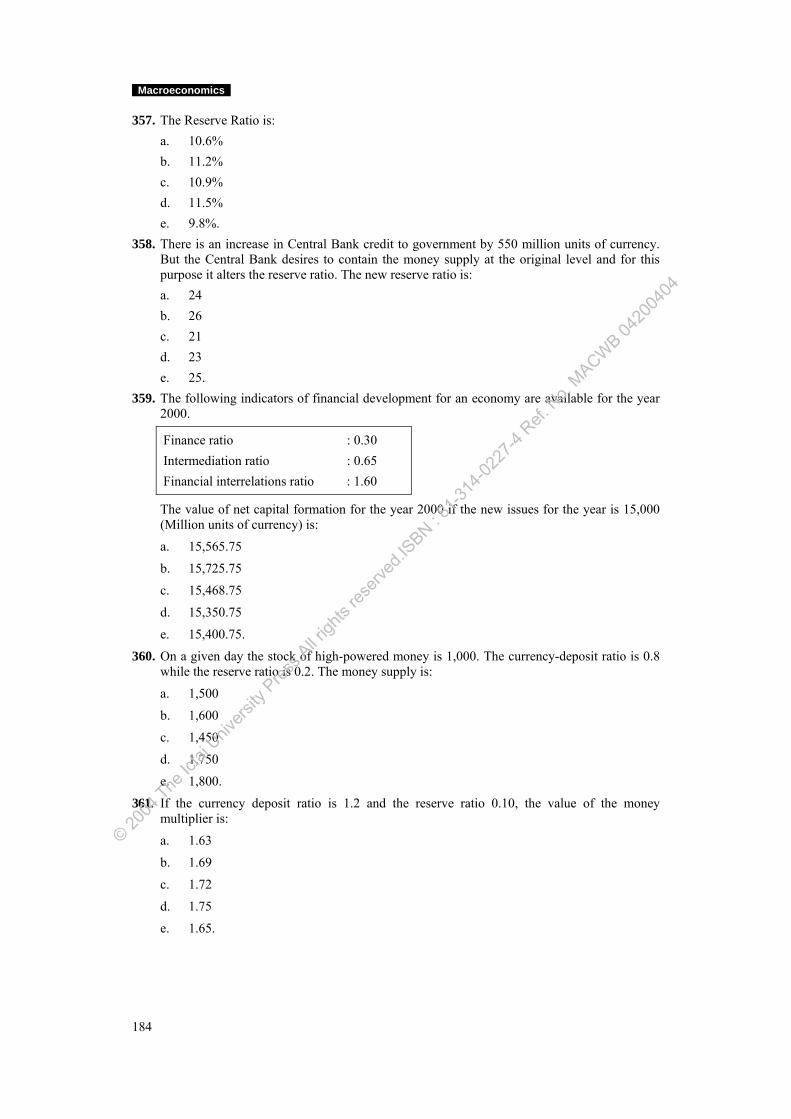
Macroeconomics
184
357. The Reserve Ratio is: a. 10.6% b. 11.2% c. 10.9% d. 11.5% e. 9.8%. 358. There is an increase in Central Bank credit to government by 550 million units of currency.
But the Central Bank desires to contain the money supply at the original level and for this purpose it alters the reserve ratio. The new reserve ratio is:
a. 24 b. 26 c. 21 d. 23 e. 25. 359. The following indicators of financial development for an economy are available for the year
2000.
Finance ratio : 0.30 Intermediation ratio : 0.65 Financial interrelations ratio : 1.60
The value of net capital formation for the year 2000 if the new issues for the year is 15,000 (Million units of currency) is:
a. 15,565.75
b. 15,725.75
c. 15,468.75
d. 15,350.75
e. 15,400.75.
360. On a given day the stock of high-powered money is 1,000. The currency-deposit ratio is 0.8 while the reserve ratio is 0.2. The money supply is:
a. 1,500
b. 1,600
c. 1,450
d. 1,750
e. 1,800.
361. If the currency deposit ratio is 1.2 and the reserve ratio 0.10, the value of the money multiplier is:
a. 1.63
b. 1.69
c. 1.72
d. 1.75
e. 1.65.
© 2004
The Ic
fai U
nivers
ity P
ress.A
ll righ
ts res
erved
.ISBN : 8
1-314
-0227
-4 Ref.
No.
MACWB 04
2004
04
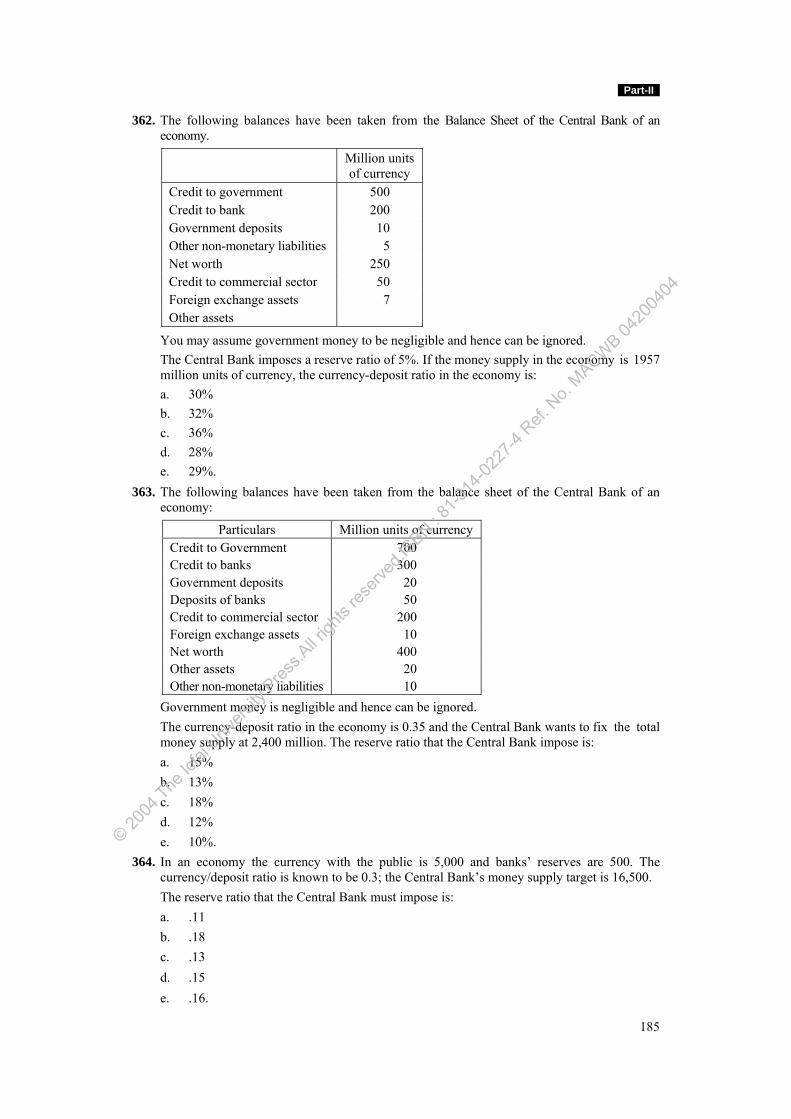
Part-II
185
362. The following balances have been taken from the Balance Sheet of the Central Bank of an economy.
Million units of currency
Credit to government 500 Credit to bank 200 Government deposits 10 Other non-monetary liabilities 5 Net worth 250 Credit to commercial sector 50 Foreign exchange assets 7 Other assets
You may assume government money to be negligible and hence can be ignored. The Central Bank imposes a reserve ratio of 5%. If the money supply in the economy is 1957
million units of currency, the currency-deposit ratio in the economy is: a. 30% b. 32% c. 36% d. 28% e. 29%. 363. The following balances have been taken from the balance sheet of the Central Bank of an
economy:
Particulars Million units of currency Credit to Government 700 Credit to banks 300 Government deposits 20 Deposits of banks 50 Credit to commercial sector 200 Foreign exchange assets 10 Net worth 400 Other assets 20 Other non-monetary liabilities 10
Government money is negligible and hence can be ignored. The currency-deposit ratio in the economy is 0.35 and the Central Bank wants to fix the total
money supply at 2,400 million. The reserve ratio that the Central Bank impose is: a. 15% b. 13% c. 18% d. 12% e. 10%. 364. In an economy the currency with the public is 5,000 and banks’ reserves are 500. The
currency/deposit ratio is known to be 0.3; the Central Bank’s money supply target is 16,500. The reserve ratio that the Central Bank must impose is: a. .11 b. .18 c. .13 d. .15 e. .16.
© 2004
The Ic
fai U
nivers
ity P
ress.A
ll righ
ts res
erved
.ISBN : 8
1-314
-0227
-4 Ref.
No.
MACWB 04
2004
04
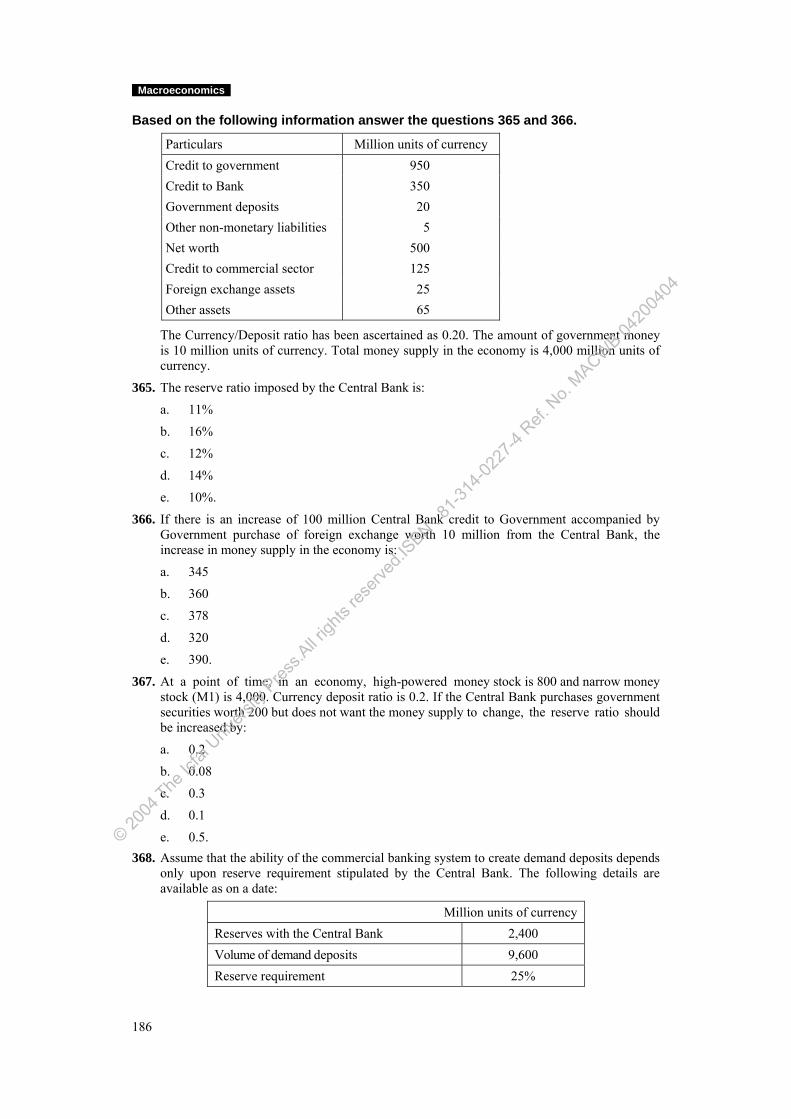
Macroeconomics
186
Based on the following information answer the questions 365 and 366.
Particulars Million units of currency Credit to government 950 Credit to Bank 350 Government deposits 20 Other non-monetary liabilities 5 Net worth 500 Credit to commercial sector 125 Foreign exchange assets 25 Other assets 65
The Currency/Deposit ratio has been ascertained as 0.20. The amount of government money is 10 million units of currency. Total money supply in the economy is 4,000 million units of currency.
365. The reserve ratio imposed by the Central Bank is:
a. 11%
b. 16%
c. 12%
d. 14%
e. 10%.
366. If there is an increase of 100 million Central Bank credit to Government accompanied by Government purchase of foreign exchange worth 10 million from the Central Bank, the increase in money supply in the economy is:
a. 345
b. 360
c. 378
d. 320
e. 390.
367. At a point of time, in an economy, high-powered money stock is 800 and narrow money stock (M1) is 4,000. Currency deposit ratio is 0.2. If the Central Bank purchases government securities worth 200 but does not want the money supply to change, the reserve ratio should be increased by:
a. 0.2
b. 0.08
c. 0.3
d. 0.1
e. 0.5. 368. Assume that the ability of the commercial banking system to create demand deposits depends
only upon reserve requirement stipulated by the Central Bank. The following details are available as on a date:
Million units of currency Reserves with the Central Bank 2,400 Volume of demand deposits 9,600 Reserve requirement 25%
© 2004
The Ic
fai U
nivers
ity P
ress.A
ll righ
ts res
erved
.ISBN : 8
1-314
-0227
-4 Ref.
No.
MACWB 04
2004
04
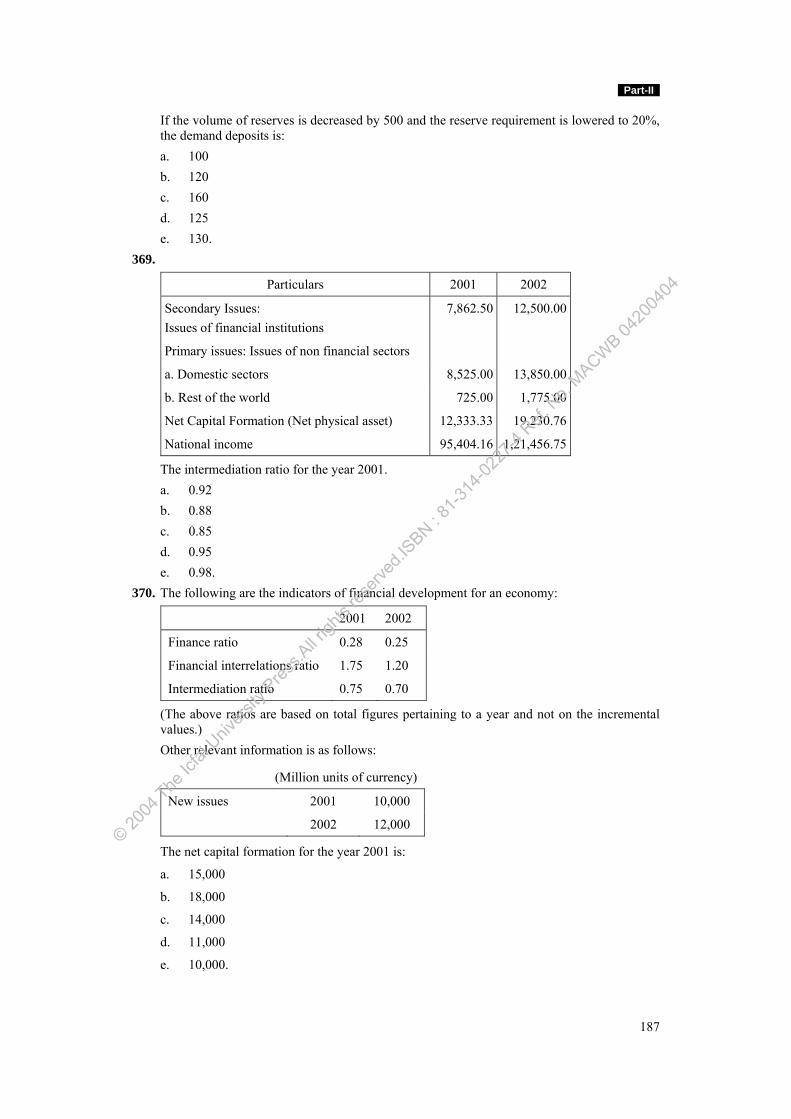
Part-II
187
If the volume of reserves is decreased by 500 and the reserve requirement is lowered to 20%, the demand deposits is:
a. 100 b. 120 c. 160 d. 125 e. 130. 369.
Particulars 2001 2002
Secondary Issues: Issues of financial institutions
7,862.50 12,500.00
Primary issues: Issues of non financial sectors
a. Domestic sectors 8,525.00 13,850.00
b. Rest of the world 725.00 1,775.00
Net Capital Formation (Net physical asset) 12,333.33 19,230.76
National income 95,404.16 1,21,456.75
The intermediation ratio for the year 2001. a. 0.92 b. 0.88 c. 0.85 d. 0.95 e. 0.98. 370. The following are the indicators of financial development for an economy:
2001 2002
Finance ratio 0.28 0.25
Financial interrelations ratio 1.75 1.20
Intermediation ratio 0.75 0.70
(The above ratios are based on total figures pertaining to a year and not on the incremental values.)
Other relevant information is as follows:
(Million units of currency)
New issues 2001 10,000
2002 12,000
The net capital formation for the year 2001 is:
a. 15,000
b. 18,000
c. 14,000
d. 11,000
e. 10,000.
© 2004
The Ic
fai U
nivers
ity P
ress.A
ll righ
ts res
erved
.ISBN : 8
1-314
-0227
-4 Ref.
No.
MACWB 04
2004
04
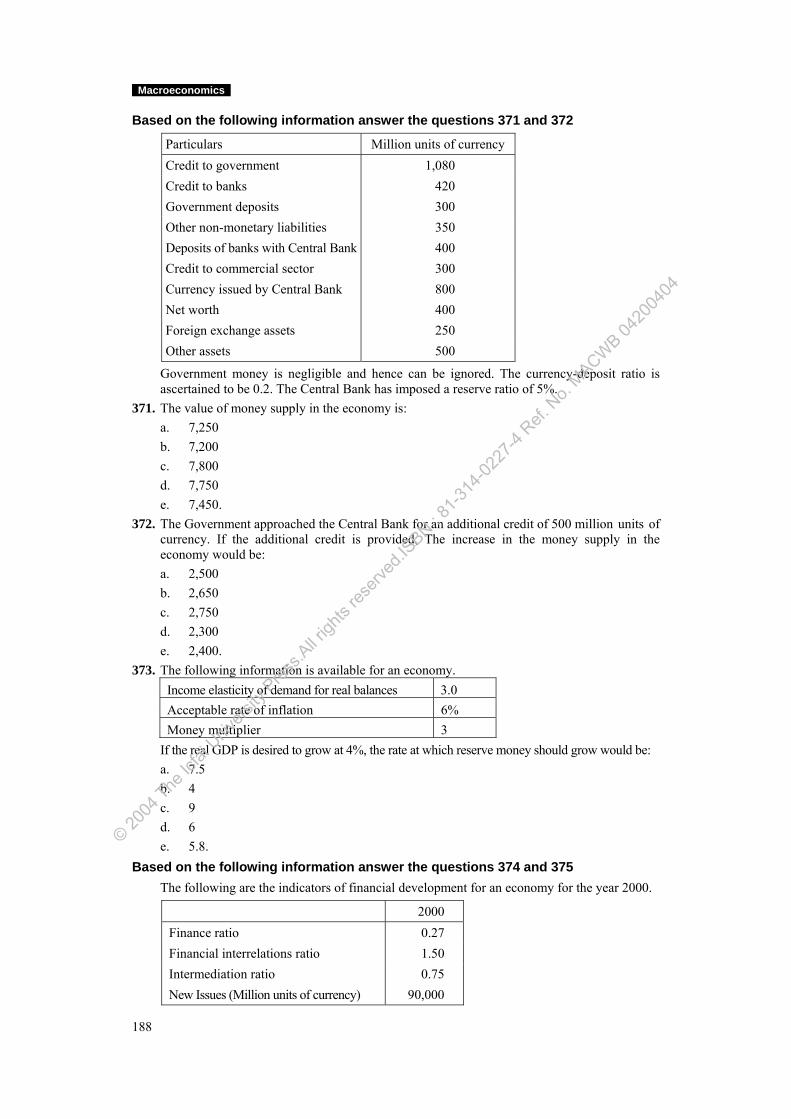
Macroeconomics
188
Based on the following information answer the questions 371 and 372
Particulars Million units of currency Credit to government 1,080 Credit to banks 420 Government deposits 300 Other non-monetary liabilities 350 Deposits of banks with Central Bank 400 Credit to commercial sector 300 Currency issued by Central Bank 800 Net worth 400 Foreign exchange assets 250 Other assets 500
Government money is negligible and hence can be ignored. The currency-deposit ratio is ascertained to be 0.2. The Central Bank has imposed a reserve ratio of 5%.
371. The value of money supply in the economy is: a. 7,250 b. 7,200 c. 7,800 d. 7,750 e. 7,450. 372. The Government approached the Central Bank for an additional credit of 500 million units of
currency. If the additional credit is provided, The increase in the money supply in the economy would be:
a. 2,500 b. 2,650 c. 2,750 d. 2,300 e. 2,400. 373. The following information is available for an economy.
Income elasticity of demand for real balances 3.0 Acceptable rate of inflation 6% Money multiplier 3
If the real GDP is desired to grow at 4%, the rate at which reserve money should grow would be: a. 7.5 b. 4 c. 9 d. 6 e. 5.8. Based on the following information answer the questions 374 and 375 The following are the indicators of financial development for an economy for the year 2000.
2000 Finance ratio 0.27 Financial interrelations ratio 1.50 Intermediation ratio 0.75 New Issues (Million units of currency) 90,000
© 2004
The Ic
fai U
nivers
ity P
ress.A
ll righ
ts res
erved
.ISBN : 8
1-314
-0227
-4 Ref.
No.
MACWB 04
2004
04
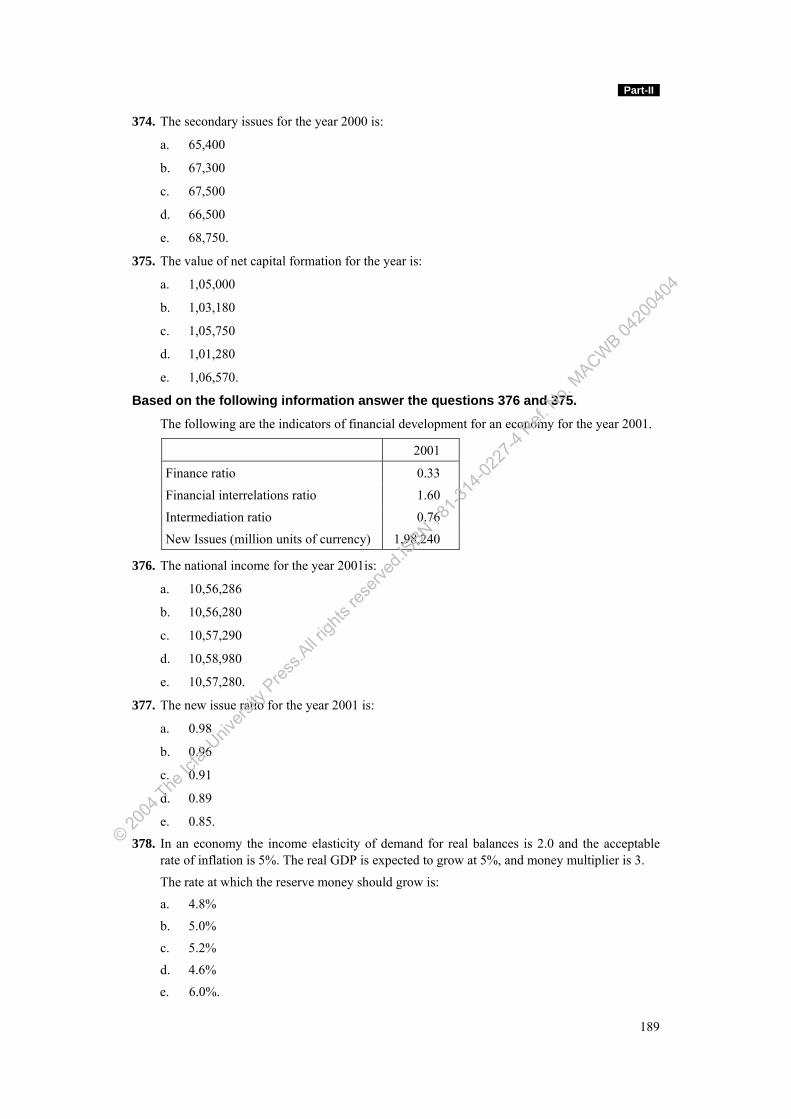
Part-II
189
374. The secondary issues for the year 2000 is:
a. 65,400
b. 67,300
c. 67,500
d. 66,500
e. 68,750.
375. The value of net capital formation for the year is:
a. 1,05,000
b. 1,03,180
c. 1,05,750
d. 1,01,280
e. 1,06,570.
Based on the following information answer the questions 376 and 375.
The following are the indicators of financial development for an economy for the year 2001.
2001
Finance ratio 0.33
Financial interrelations ratio 1.60
Intermediation ratio 0.76
New Issues (million units of currency) 1,98,240
376. The national income for the year 2001is:
a. 10,56,286
b. 10,56,280
c. 10,57,290
d. 10,58,980
e. 10,57,280.
377. The new issue ratio for the year 2001 is:
a. 0.98
b. 0.96
c. 0.91
d. 0.89
e. 0.85.
378. In an economy the income elasticity of demand for real balances is 2.0 and the acceptable rate of inflation is 5%. The real GDP is expected to grow at 5%, and money multiplier is 3.
The rate at which the reserve money should grow is:
a. 4.8%
b. 5.0%
c. 5.2%
d. 4.6%
e. 6.0%.
© 2004
The Ic
fai U
nivers
ity P
ress.A
ll righ
ts res
erved
.ISBN : 8
1-314
-0227
-4 Ref.
No.
MACWB 04
2004
04
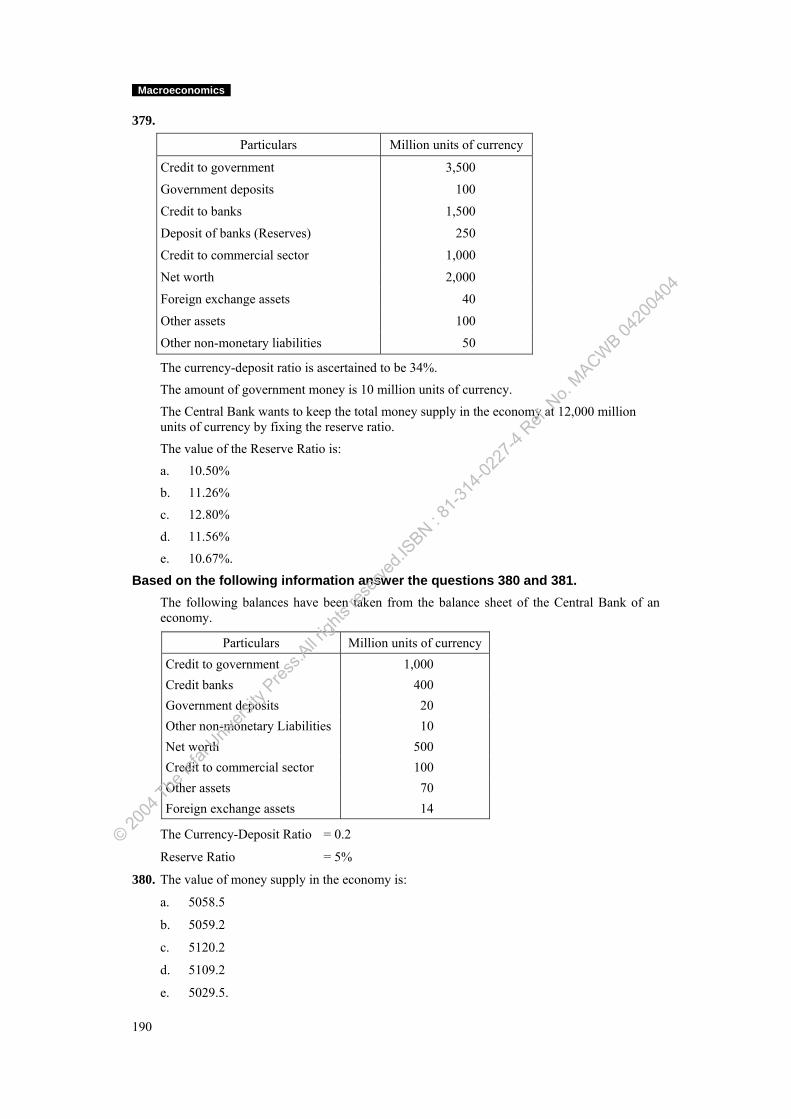
Macroeconomics
190
379.
Particulars Million units of currency
Credit to government 3,500
Government deposits 100
Credit to banks 1,500
Deposit of banks (Reserves) 250
Credit to commercial sector 1,000
Net worth 2,000
Foreign exchange assets 40
Other assets 100
Other non-monetary liabilities 50
The currency-deposit ratio is ascertained to be 34%.
The amount of government money is 10 million units of currency.
The Central Bank wants to keep the total money supply in the economy at 12,000 million units of currency by fixing the reserve ratio.
The value of the Reserve Ratio is:
a. 10.50%
b. 11.26%
c. 12.80%
d. 11.56%
e. 10.67%.
Based on the following information answer the questions 380 and 381. The following balances have been taken from the balance sheet of the Central Bank of an
economy.
Particulars Million units of currency Credit to government 1,000 Credit banks 400 Government deposits 20 Other non-monetary Liabilities 10 Net worth 500 Credit to commercial sector 100 Other assets 70 Foreign exchange assets 14
The Currency-Deposit Ratio = 0.2
Reserve Ratio = 5%
380. The value of money supply in the economy is:
a. 5058.5
b. 5059.2
c. 5120.2
d. 5109.2
e. 5029.5.
© 2004
The Ic
fai U
nivers
ity P
ress.A
ll righ
ts res
erved
.ISBN : 8
1-314
-0227
-4 Ref.
No.
MACWB 04
2004
04
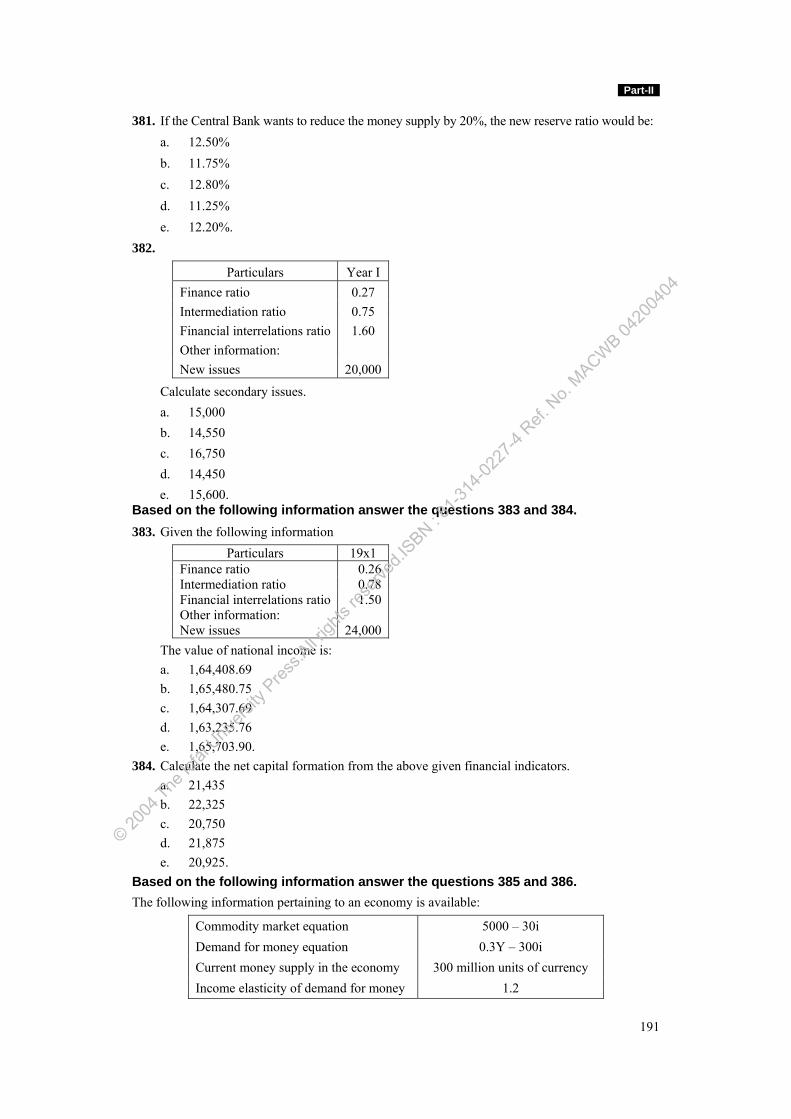
Part-II
191
381. If the Central Bank wants to reduce the money supply by 20%, the new reserve ratio would be: a. 12.50% b. 11.75% c. 12.80% d. 11.25% e. 12.20%. 382.
Particulars Year I Finance ratio 0.27 Intermediation ratio 0.75 Financial interrelations ratio 1.60 Other information: New issues 20,000
Calculate secondary issues. a. 15,000 b. 14,550 c. 16,750 d. 14,450
e. 15,600. Based on the following information answer the questions 383 and 384. 383. Given the following information
Particulars 19x1 Finance ratio 0.26 Intermediation ratio 0.78 Financial interrelations ratio 1.50 Other information: New issues 24,000
The value of national income is: a. 1,64,408.69 b. 1,65,480.75 c. 1,64,307.69 d. 1,63,235.76 e. 1,65,703.90. 384. Calculate the net capital formation from the above given financial indicators. a. 21,435 b. 22,325 c. 20,750 d. 21,875 e. 20,925. Based on the following information answer the questions 385 and 386. The following information pertaining to an economy is available:
Commodity market equation 5000 – 30i Demand for money equation 0.3Y – 300i Current money supply in the economy 300 million units of currency Income elasticity of demand for money 1.2
© 2004
The Ic
fai U
nivers
ity P
ress.A
ll righ
ts res
erved
.ISBN : 8
1-314
-0227
-4 Ref.
No.
MACWB 04
2004
04
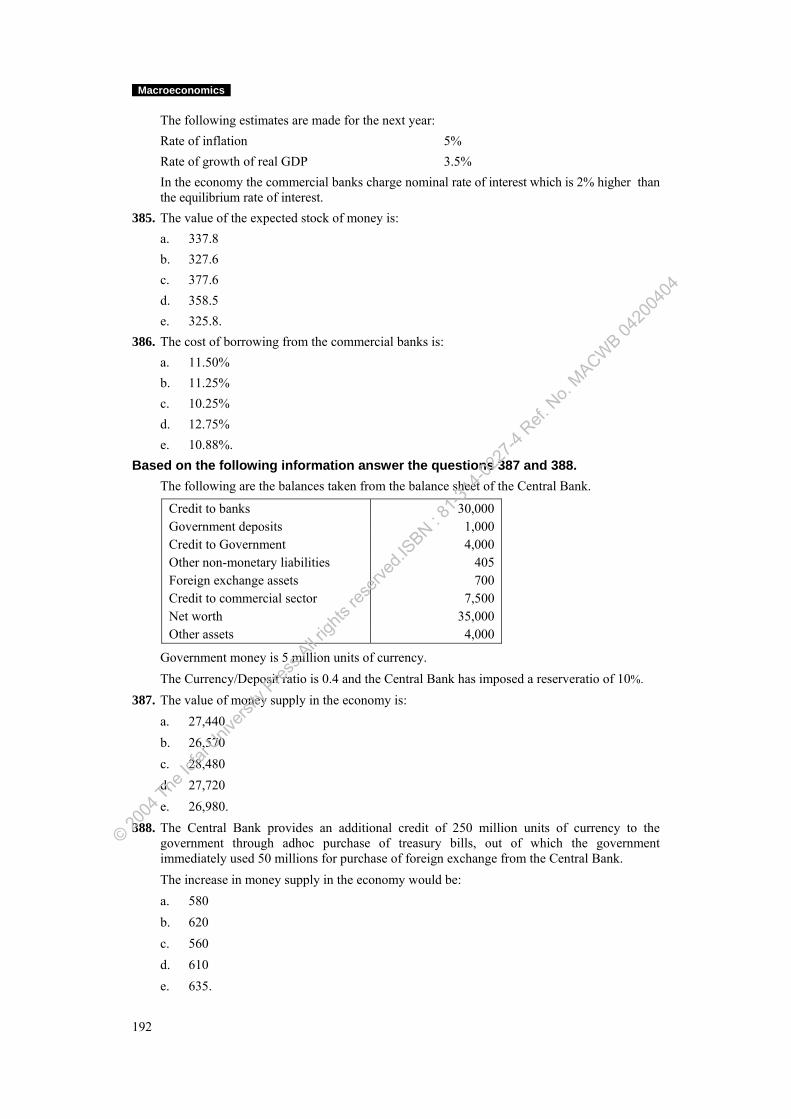
Macroeconomics
192
The following estimates are made for the next year: Rate of inflation 5% Rate of growth of real GDP 3.5% In the economy the commercial banks charge nominal rate of interest which is 2% higher than the equilibrium rate of interest.
385. The value of the expected stock of money is: a. 337.8 b. 327.6 c. 377.6 d. 358.5 e. 325.8. 386. The cost of borrowing from the commercial banks is: a. 11.50% b. 11.25% c. 10.25% d. 12.75% e. 10.88%. Based on the following information answer the questions 387 and 388. The following are the balances taken from the balance sheet of the Central Bank.
Credit to banks 30,000 Government deposits 1,000 Credit to Government 4,000 Other non-monetary liabilities 405 Foreign exchange assets 700 Credit to commercial sector 7,500 Net worth 35,000 Other assets 4,000
Government money is 5 million units of currency. The Currency/Deposit ratio is 0.4 and the Central Bank has imposed a reserve ratio of 10%. 387. The value of money supply in the economy is: a. 27,440 b. 26,570 c. 28,480 d. 27,720 e. 26,980. 388. The Central Bank provides an additional credit of 250 million units of currency to the
government through adhoc purchase of treasury bills, out of which the government immediately used 50 millions for purchase of foreign exchange from the Central Bank.
The increase in money supply in the economy would be: a. 580 b. 620 c. 560 d. 610 e. 635.
© 2004
The Ic
fai U
nivers
ity P
ress.A
ll righ
ts res
erved
.ISBN : 8
1-314
-0227
-4 Ref.
No.
MACWB 04
2004
04
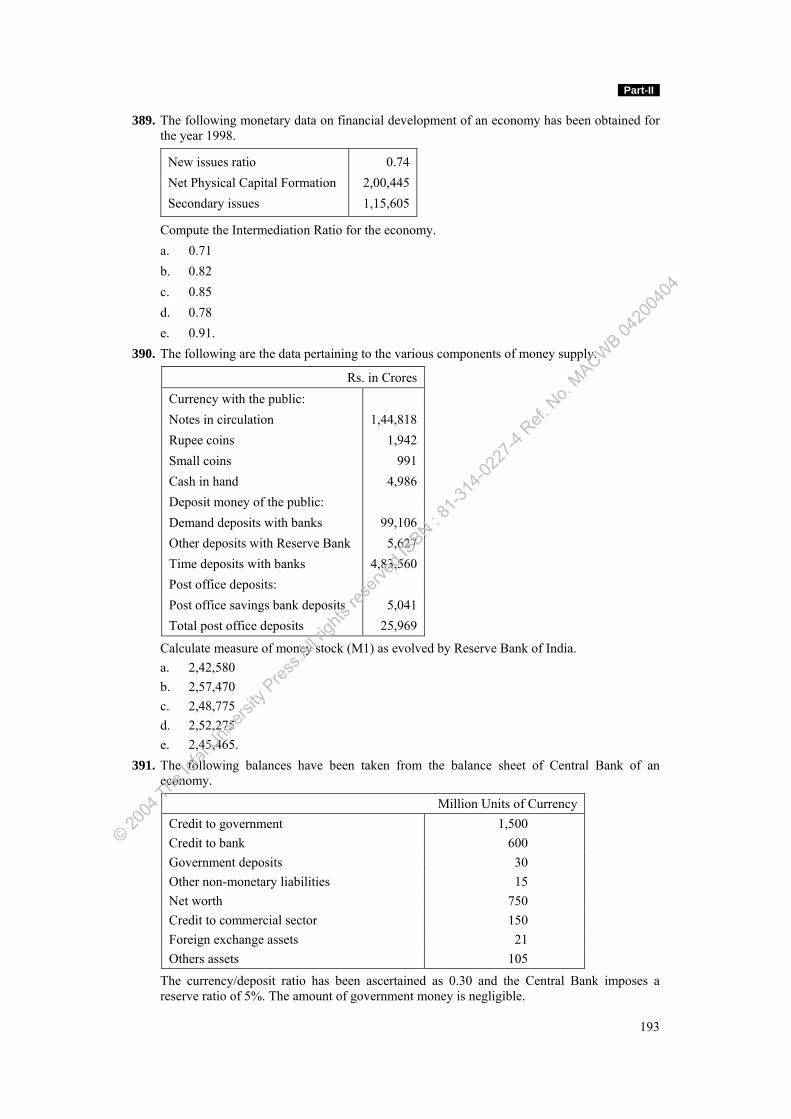
Part-II
193
389. The following monetary data on financial development of an economy has been obtained for the year 1998.
New issues ratio Net Physical Capital Formation Secondary issues
0.74 2,00,445 1,15,605
Compute the Intermediation Ratio for the economy. a. 0.71 b. 0.82 c. 0.85 d. 0.78 e. 0.91. 390. The following are the data pertaining to the various components of money supply.
Rs. in Crores Currency with the public: Notes in circulation 1,44,818 Rupee coins 1,942 Small coins 991 Cash in hand 4,986 Deposit money of the public: Demand deposits with banks 99,106 Other deposits with Reserve Bank 5,627 Time deposits with banks 4,83,560 Post office deposits: Post office savings bank deposits 5,041 Total post office deposits 25,969
Calculate measure of money stock (M1) as evolved by Reserve Bank of India. a. 2,42,580 b. 2,57,470 c. 2,48,775 d. 2,52,275 e. 2,45,465. 391. The following balances have been taken from the balance sheet of Central Bank of an
economy.
Million Units of Currency Credit to government 1,500 Credit to bank 600 Government deposits 30 Other non-monetary liabilities 15 Net worth 750 Credit to commercial sector 150 Foreign exchange assets 21 Others assets 105
The currency/deposit ratio has been ascertained as 0.30 and the Central Bank imposes a reserve ratio of 5%. The amount of government money is negligible.
© 2004
The Ic
fai U
nivers
ity P
ress.A
ll righ
ts res
erved
.ISBN : 8
1-314
-0227
-4 Ref.
No.
MACWB 04
2004
04
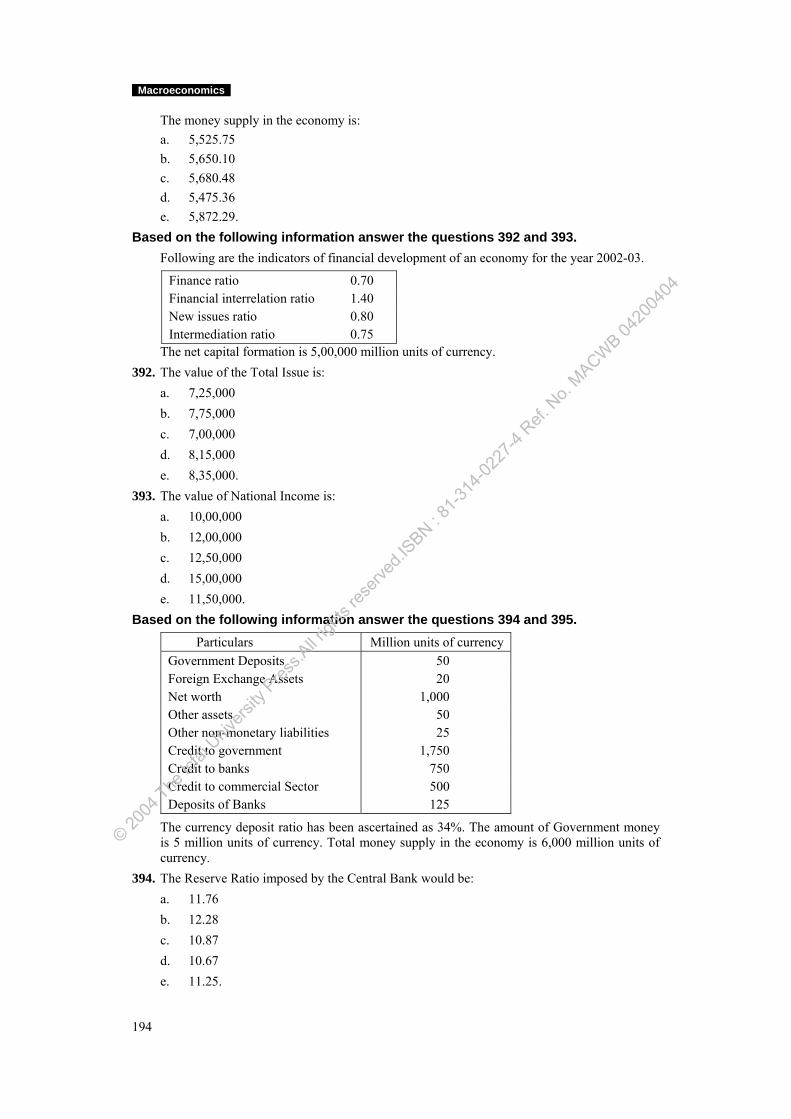
Macroeconomics
194
The money supply in the economy is: a. 5,525.75 b. 5,650.10 c. 5,680.48 d. 5,475.36 e. 5,872.29. Based on the following information answer the questions 392 and 393. Following are the indicators of financial development of an economy for the year 2002-03.
Finance ratio 0.70 Financial interrelation ratio 1.40 New issues ratio 0.80 Intermediation ratio 0.75
The net capital formation is 5,00,000 million units of currency. 392. The value of the Total Issue is: a. 7,25,000 b. 7,75,000 c. 7,00,000 d. 8,15,000 e. 8,35,000. 393. The value of National Income is: a. 10,00,000 b. 12,00,000 c. 12,50,000 d. 15,00,000 e. 11,50,000. Based on the following information answer the questions 394 and 395.
Particulars Million units of currency Government Deposits 50 Foreign Exchange Assets 20 Net worth 1,000 Other assets 50 Other non-monetary liabilities 25 Credit to government 1,750 Credit to banks 750 Credit to commercial Sector 500 Deposits of Banks 125
The currency deposit ratio has been ascertained as 34%. The amount of Government money is 5 million units of currency. Total money supply in the economy is 6,000 million units of currency.
394. The Reserve Ratio imposed by the Central Bank would be: a. 11.76 b. 12.28 c. 10.87 d. 10.67 e. 11.25.
© 2004
The Ic
fai U
nivers
ity P
ress.A
ll righ
ts res
erved
.ISBN : 8
1-314
-0227
-4 Ref.
No.
MACWB 04
2004
04
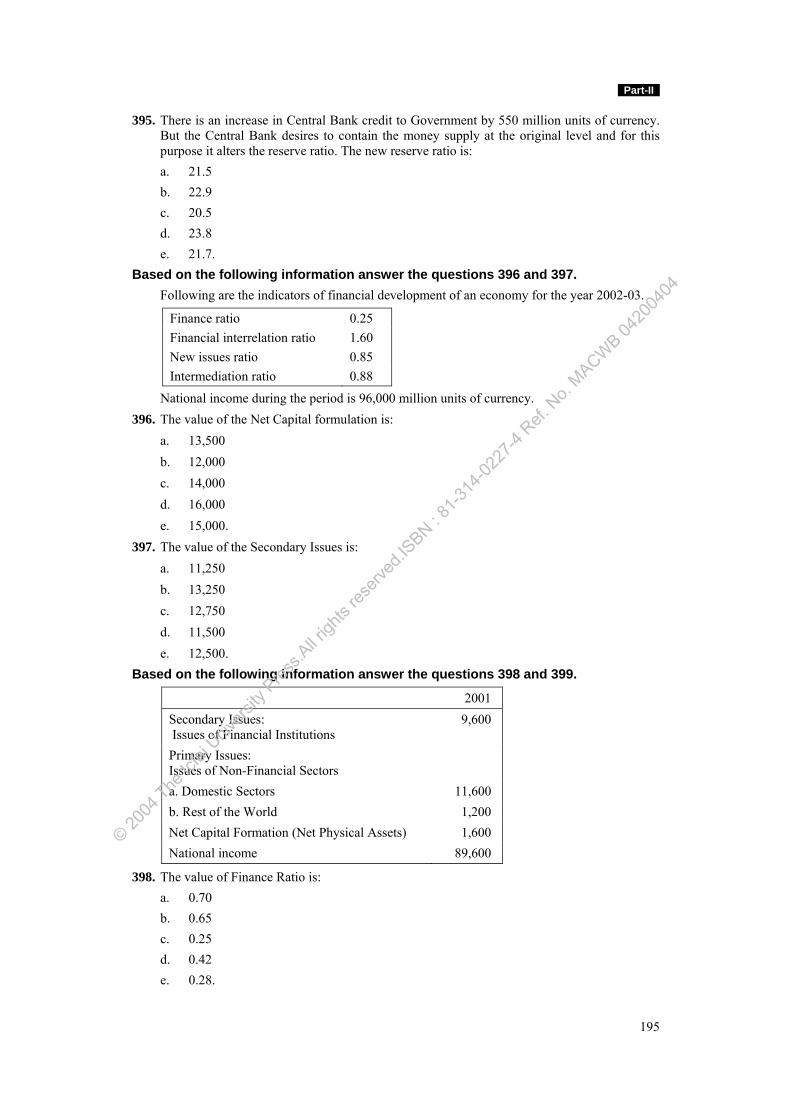
Part-II
195
395. There is an increase in Central Bank credit to Government by 550 million units of currency. But the Central Bank desires to contain the money supply at the original level and for this purpose it alters the reserve ratio. The new reserve ratio is:
a. 21.5 b. 22.9 c. 20.5 d. 23.8 e. 21.7. Based on the following information answer the questions 396 and 397. Following are the indicators of financial development of an economy for the year 2002-03.
Finance ratio 0.25 Financial interrelation ratio 1.60 New issues ratio 0.85 Intermediation ratio 0.88
National income during the period is 96,000 million units of currency. 396. The value of the Net Capital formulation is: a. 13,500 b. 12,000 c. 14,000 d. 16,000 e. 15,000. 397. The value of the Secondary Issues is: a. 11,250 b. 13,250 c. 12,750 d. 11,500 e. 12,500. Based on the following information answer the questions 398 and 399.
2001 Secondary Issues: Issues of Financial Institutions
9,600
Primary Issues: Issues of Non-Financial Sectors
a. Domestic Sectors 11,600 b. Rest of the World 1,200 Net Capital Formation (Net Physical Assets) 1,600 National income 89,600
398. The value of Finance Ratio is: a. 0.70 b. 0.65 c. 0.25 d. 0.42 e. 0.28.
© 2004
The Ic
fai U
nivers
ity P
ress.A
ll righ
ts res
erved
.ISBN : 8
1-314
-0227
-4 Ref.
No.
MACWB 04
2004
04
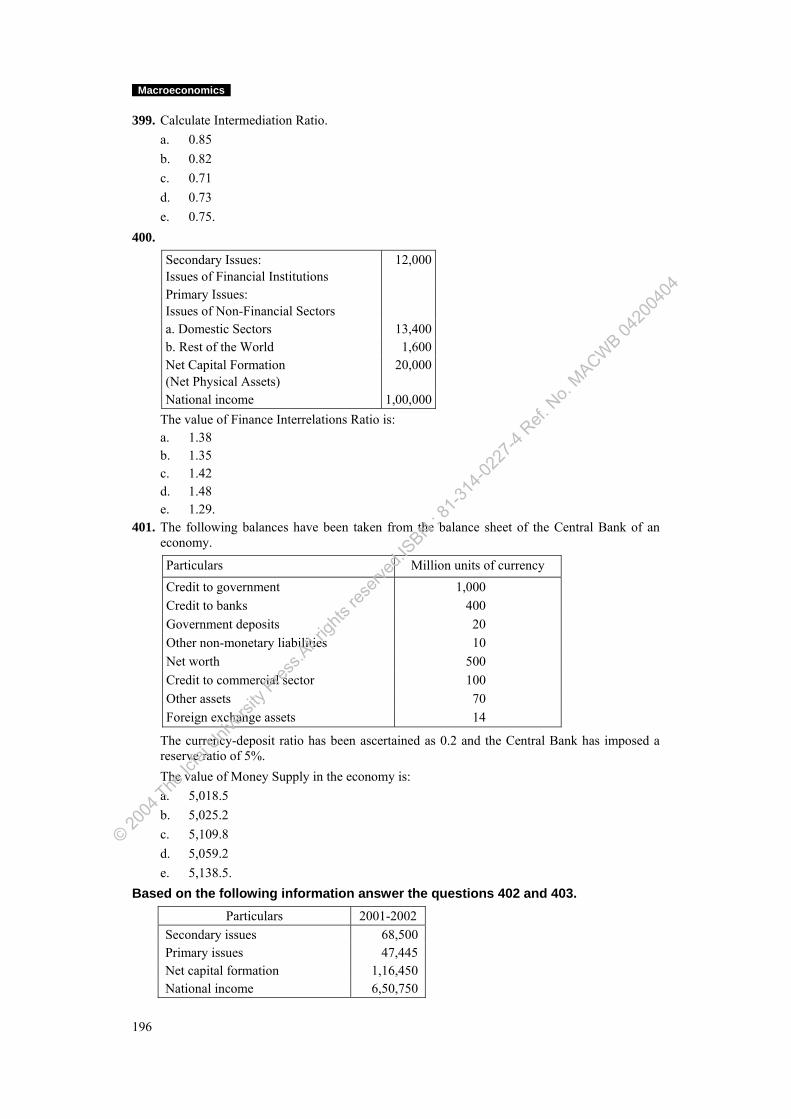
Macroeconomics
196
399. Calculate Intermediation Ratio. a. 0.85 b. 0.82 c. 0.71 d. 0.73 e. 0.75. 400.
Secondary Issues: Issues of Financial Institutions
12,000
Primary Issues: Issues of Non-Financial Sectors a. Domestic Sectors 13,400b. Rest of the World 1,600Net Capital Formation (Net Physical Assets)
20,000
National income 1,00,000 The value of Finance Interrelations Ratio is: a. 1.38 b. 1.35 c. 1.42 d. 1.48 e. 1.29. 401. The following balances have been taken from the balance sheet of the Central Bank of an
economy.
Particulars Million units of currency Credit to government 1,000 Credit to banks 400 Government deposits 20 Other non-monetary liabilities 10 Net worth 500 Credit to commercial sector 100 Other assets 70 Foreign exchange assets 14
The currency-deposit ratio has been ascertained as 0.2 and the Central Bank has imposed a reserve ratio of 5%.
The value of Money Supply in the economy is: a. 5,018.5 b. 5,025.2 c. 5,109.8 d. 5,059.2 e. 5,138.5. Based on the following information answer the questions 402 and 403.
Particulars 2001-2002 Secondary issues 68,500 Primary issues 47,445 Net capital formation 1,16,450 National income 6,50,750
© 2004
The Ic
fai U
nivers
ity P
ress.A
ll righ
ts res
erved
.ISBN : 8
1-314
-0227
-4 Ref.
No.
MACWB 04
2004
04
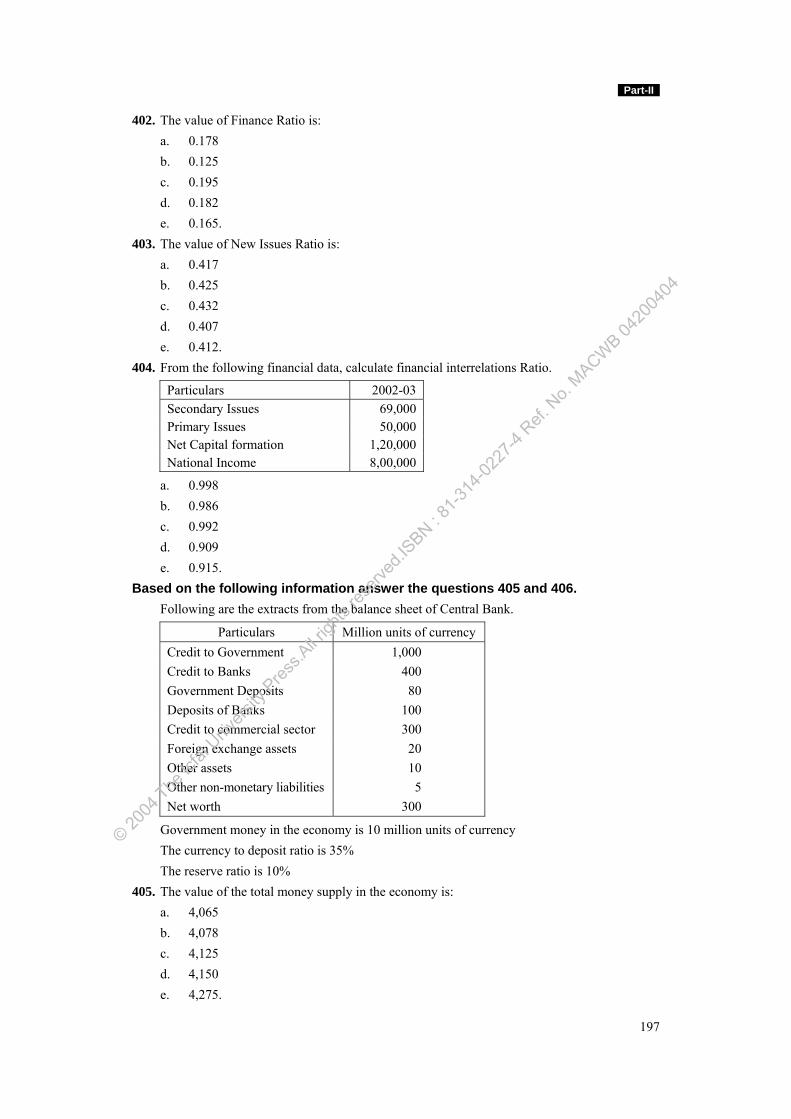
Part-II
197
402. The value of Finance Ratio is: a. 0.178 b. 0.125 c. 0.195 d. 0.182 e. 0.165. 403. The value of New Issues Ratio is: a. 0.417 b. 0.425 c. 0.432 d. 0.407 e. 0.412. 404. From the following financial data, calculate financial interrelations Ratio.
Particulars 2002-03 Secondary Issues 69,000 Primary Issues 50,000 Net Capital formation 1,20,000 National Income 8,00,000
a. 0.998 b. 0.986 c. 0.992 d. 0.909 e. 0.915. Based on the following information answer the questions 405 and 406. Following are the extracts from the balance sheet of Central Bank.
Particulars Million units of currency Credit to Government 1,000 Credit to Banks 400 Government Deposits 80 Deposits of Banks 100 Credit to commercial sector 300 Foreign exchange assets 20 Other assets 10 Other non-monetary liabilities 5 Net worth 300
Government money in the economy is 10 million units of currency The currency to deposit ratio is 35% The reserve ratio is 10%
405. The value of the total money supply in the economy is: a. 4,065 b. 4,078 c. 4,125 d. 4,150 e. 4,275.
© 2004
The Ic
fai U
nivers
ity P
ress.A
ll righ
ts res
erved
.ISBN : 8
1-314
-0227
-4 Ref.
No.
MACWB 04
2004
04
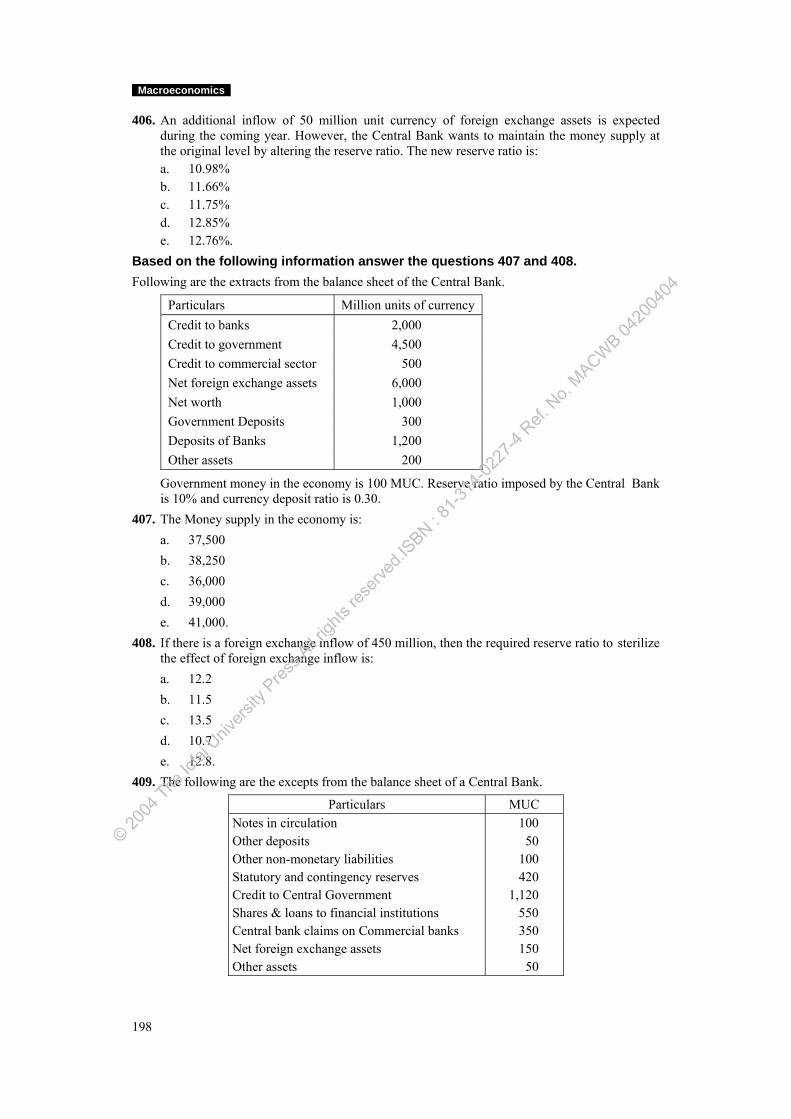
Macroeconomics
198
406. An additional inflow of 50 million unit currency of foreign exchange assets is expected during the coming year. However, the Central Bank wants to maintain the money supply at the original level by altering the reserve ratio. The new reserve ratio is:
a. 10.98% b. 11.66% c. 11.75% d. 12.85% e. 12.76%. Based on the following information answer the questions 407 and 408. Following are the extracts from the balance sheet of the Central Bank.
Particulars Million units of currency Credit to banks 2,000 Credit to government 4,500 Credit to commercial sector 500 Net foreign exchange assets 6,000 Net worth 1,000 Government Deposits 300 Deposits of Banks 1,200 Other assets 200
Government money in the economy is 100 MUC. Reserve ratio imposed by the Central Bank is 10% and currency deposit ratio is 0.30.
407. The Money supply in the economy is: a. 37,500 b. 38,250 c. 36,000 d. 39,000 e. 41,000. 408. If there is a foreign exchange inflow of 450 million, then the required reserve ratio to sterilize
the effect of foreign exchange inflow is: a. 12.2 b. 11.5 c. 13.5 d. 10.7 e. 12.8. 409. The following are the excepts from the balance sheet of a Central Bank.
Particulars MUC Notes in circulation 100 Other deposits 50 Other non-monetary liabilities 100 Statutory and contingency reserves 420 Credit to Central Government 1,120 Shares & loans to financial institutions 550 Central bank claims on Commercial banks 350 Net foreign exchange assets 150 Other assets 50
© 2004
The Ic
fai U
nivers
ity P
ress.A
ll righ
ts res
erved
.ISBN : 8
1-314
-0227
-4 Ref.
No.
MACWB 04
2004
04
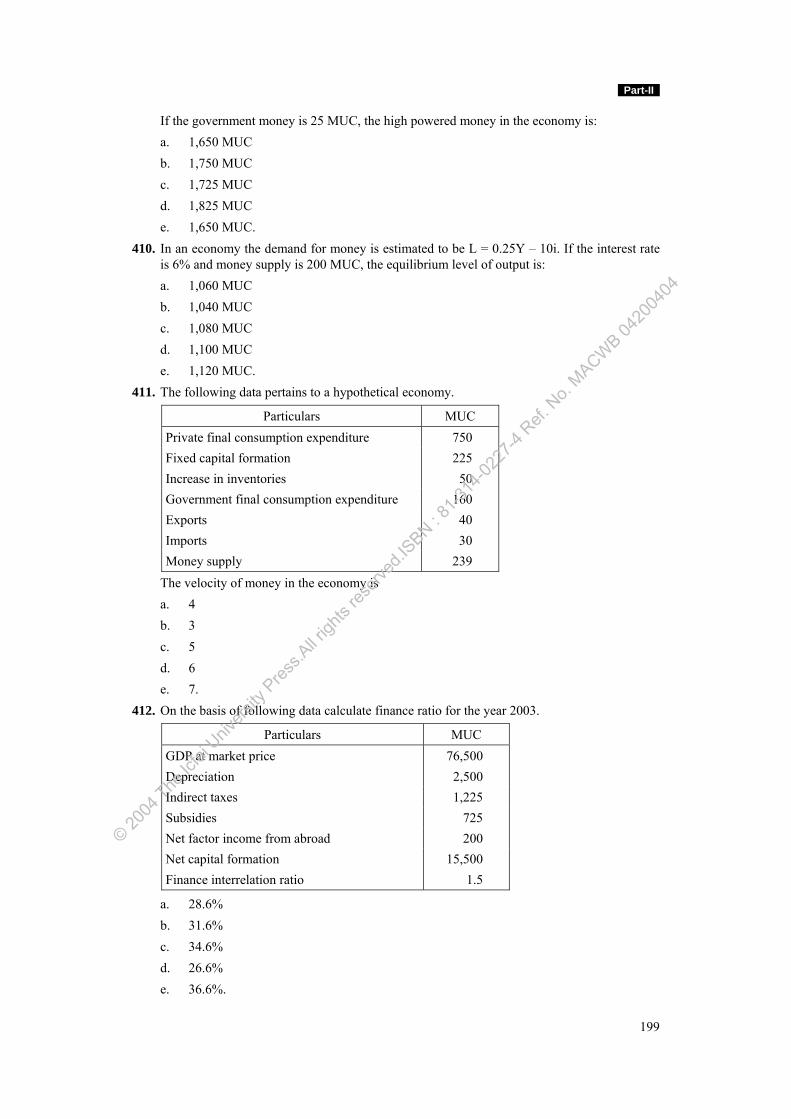
Part-II
199
If the government money is 25 MUC, the high powered money in the economy is: a. 1,650 MUC b. 1,750 MUC c. 1,725 MUC d. 1,825 MUC e. 1,650 MUC. 410. In an economy the demand for money is estimated to be L = 0.25Y – 10i. If the interest rate
is 6% and money supply is 200 MUC, the equilibrium level of output is: a. 1,060 MUC b. 1,040 MUC c. 1,080 MUC d. 1,100 MUC e. 1,120 MUC. 411. The following data pertains to a hypothetical economy.
Particulars MUC Private final consumption expenditure 750 Fixed capital formation 225 Increase in inventories 50 Government final consumption expenditure 160 Exports 40 Imports 30 Money supply 239
The velocity of money in the economy is a. 4 b. 3 c. 5 d. 6 e. 7. 412. On the basis of following data calculate finance ratio for the year 2003.
Particulars MUC GDP at market price 76,500 Depreciation 2,500 Indirect taxes 1,225 Subsidies 725 Net factor income from abroad 200 Net capital formation 15,500 Finance interrelation ratio 1.5
a. 28.6% b. 31.6% c. 34.6% d. 26.6% e. 36.6%.
© 2004
The Ic
fai U
nivers
ity P
ress.A
ll righ
ts res
erved
.ISBN : 8
1-314
-0227
-4 Ref.
No.
MACWB 04
2004
04
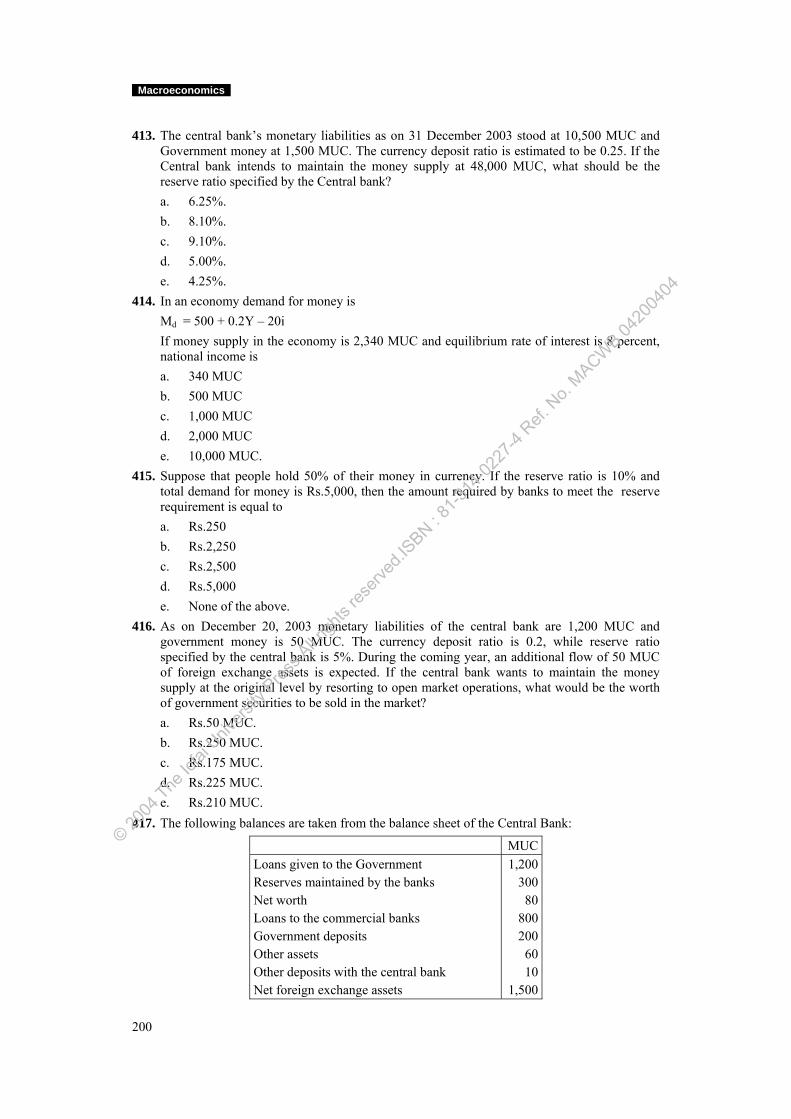
Macroeconomics
200
413. The central bank’s monetary liabilities as on 31 December 2003 stood at 10,500 MUC and
Government money at 1,500 MUC. The currency deposit ratio is estimated to be 0.25. If the Central bank intends to maintain the money supply at 48,000 MUC, what should be the reserve ratio specified by the Central bank?
a. 6.25%. b. 8.10%. c. 9.10%. d. 5.00%. e. 4.25%. 414. In an economy demand for money is Md = 500 + 0.2Y – 20i If money supply in the economy is 2,340 MUC and equilibrium rate of interest is 8 percent,
national income is a. 340 MUC b. 500 MUC c. 1,000 MUC d. 2,000 MUC e. 10,000 MUC. 415. Suppose that people hold 50% of their money in currency. If the reserve ratio is 10% and
total demand for money is Rs.5,000, then the amount required by banks to meet the reserve requirement is equal to
a. Rs.250 b. Rs.2,250 c. Rs.2,500 d. Rs.5,000 e. None of the above. 416. As on December 20, 2003 monetary liabilities of the central bank are 1,200 MUC and
government money is 50 MUC. The currency deposit ratio is 0.2, while reserve ratio specified by the central bank is 5%. During the coming year, an additional flow of 50 MUC of foreign exchange assets is expected. If the central bank wants to maintain the money supply at the original level by resorting to open market operations, what would be the worth of government securities to be sold in the market?
a. Rs.50 MUC. b. Rs.250 MUC. c. Rs.175 MUC. d. Rs.225 MUC. e. Rs.210 MUC. 417. The following balances are taken from the balance sheet of the Central Bank:
MUCLoans given to the Government 1,200Reserves maintained by the banks 300Net worth 80Loans to the commercial banks 800Government deposits 200Other assets 60Other deposits with the central bank 10Net foreign exchange assets 1,500
© 2004
The Ic
fai U
nivers
ity P
ress.A
ll righ
ts res
erved
.ISBN : 8
1-314
-0227
-4 Ref.
No.
MACWB 04
2004
04
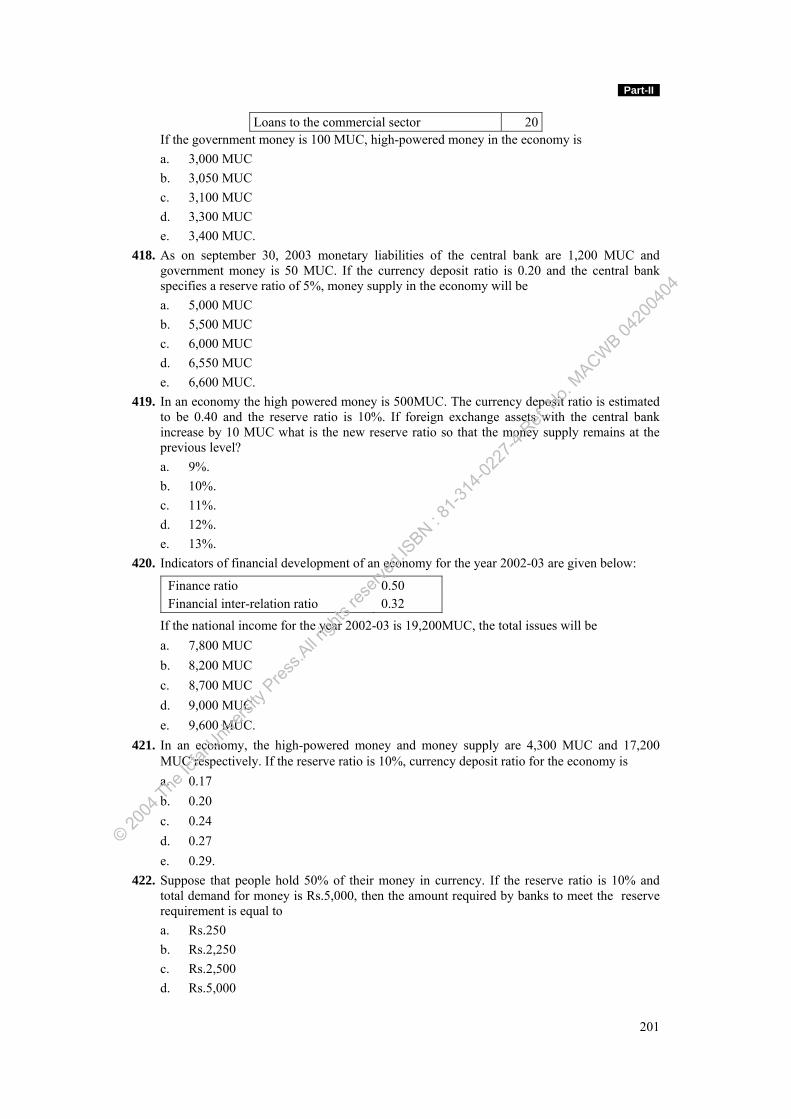
Part-II
201
Loans to the commercial sector 20 If the government money is 100 MUC, high-powered money in the economy is a. 3,000 MUC b. 3,050 MUC c. 3,100 MUC d. 3,300 MUC e. 3,400 MUC. 418. As on september 30, 2003 monetary liabilities of the central bank are 1,200 MUC and
government money is 50 MUC. If the currency deposit ratio is 0.20 and the central bank specifies a reserve ratio of 5%, money supply in the economy will be
a. 5,000 MUC b. 5,500 MUC c. 6,000 MUC d. 6,550 MUC e. 6,600 MUC. 419. In an economy the high powered money is 500MUC. The currency deposit ratio is estimated
to be 0.40 and the reserve ratio is 10%. If foreign exchange assets with the central bank increase by 10 MUC what is the new reserve ratio so that the money supply remains at the previous level?
a. 9%. b. 10%. c. 11%. d. 12%. e. 13%. 420. Indicators of financial development of an economy for the year 2002-03 are given below:
Finance ratio 0.50 Financial inter-relation ratio 0.32
If the national income for the year 2002-03 is 19,200MUC, the total issues will be a. 7,800 MUC b. 8,200 MUC c. 8,700 MUC d. 9,000 MUC e. 9,600 MUC. 421. In an economy, the high-powered money and money supply are 4,300 MUC and 17,200
MUC respectively. If the reserve ratio is 10%, currency deposit ratio for the economy is a. 0.17 b. 0.20 c. 0.24 d. 0.27 e. 0.29. 422. Suppose that people hold 50% of their money in currency. If the reserve ratio is 10% and
total demand for money is Rs.5,000, then the amount required by banks to meet the reserve requirement is equal to
a. Rs.250 b. Rs.2,250 c. Rs.2,500 d. Rs.5,000
© 2004
The Ic
fai U
nivers
ity P
ress.A
ll righ
ts res
erved
.ISBN : 8
1-314
-0227
-4 Ref.
No.
MACWB 04
2004
04
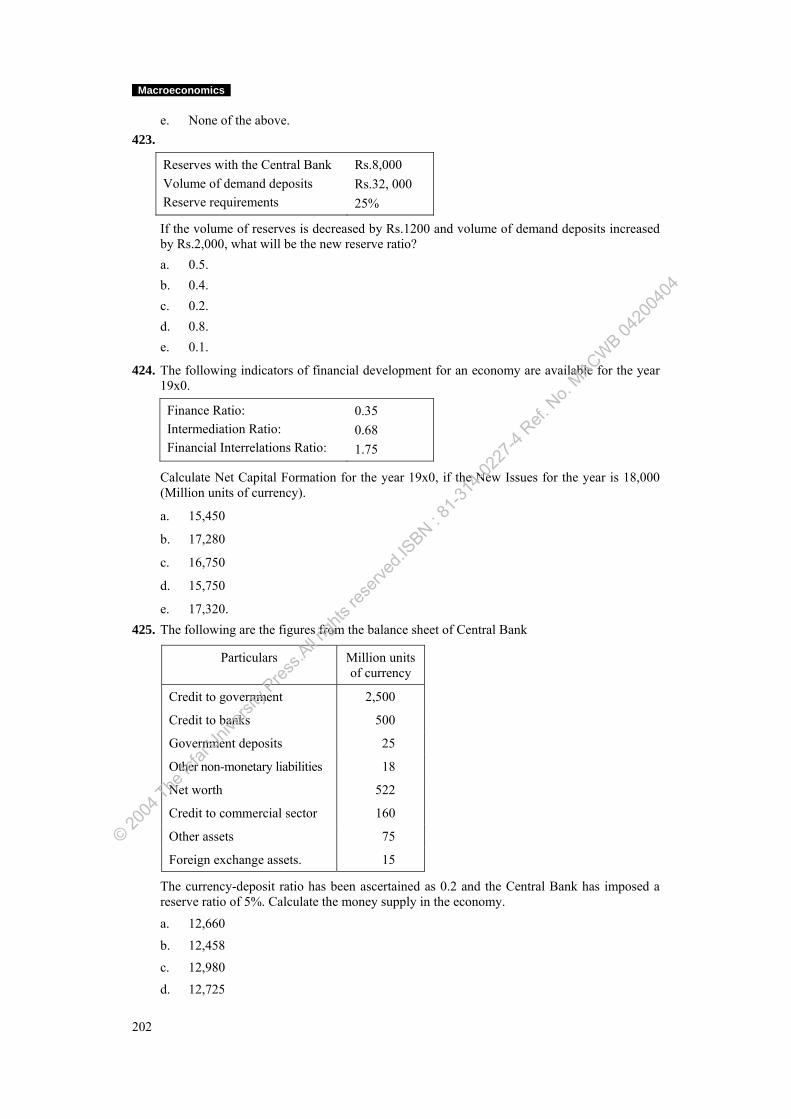
Macroeconomics
202
e. None of the above. 423.
Reserves with the Central Bank Volume of demand deposits Reserve requirements
Rs.8,000 Rs.32, 000 25%
If the volume of reserves is decreased by Rs.1200 and volume of demand deposits increased by Rs.2,000, what will be the new reserve ratio?
a. 0.5. b. 0.4. c. 0.2. d. 0.8. e. 0.1.
424. The following indicators of financial development for an economy are available for the year 19x0.
Finance Ratio: Intermediation Ratio: Financial Interrelations Ratio:
0.35 0.68 1.75
Calculate Net Capital Formation for the year 19x0, if the New Issues for the year is 18,000 (Million units of currency).
a. 15,450
b. 17,280
c. 16,750
d. 15,750
e. 17,320. 425. The following are the figures from the balance sheet of Central Bank
Particulars Million units of currency
Credit to government 2,500
Credit to banks 500
Government deposits 25
Other non-monetary liabilities 18
Net worth 522
Credit to commercial sector 160
Other assets 75
Foreign exchange assets. 15
The currency-deposit ratio has been ascertained as 0.2 and the Central Bank has imposed a reserve ratio of 5%. Calculate the money supply in the economy.
a. 12,660
b. 12,458
c. 12,980
d. 12,725
© 2004
The Ic
fai U
nivers
ity P
ress.A
ll righ
ts res
erved
.ISBN : 8
1-314
-0227
-4 Ref.
No.
MACWB 04
2004
04
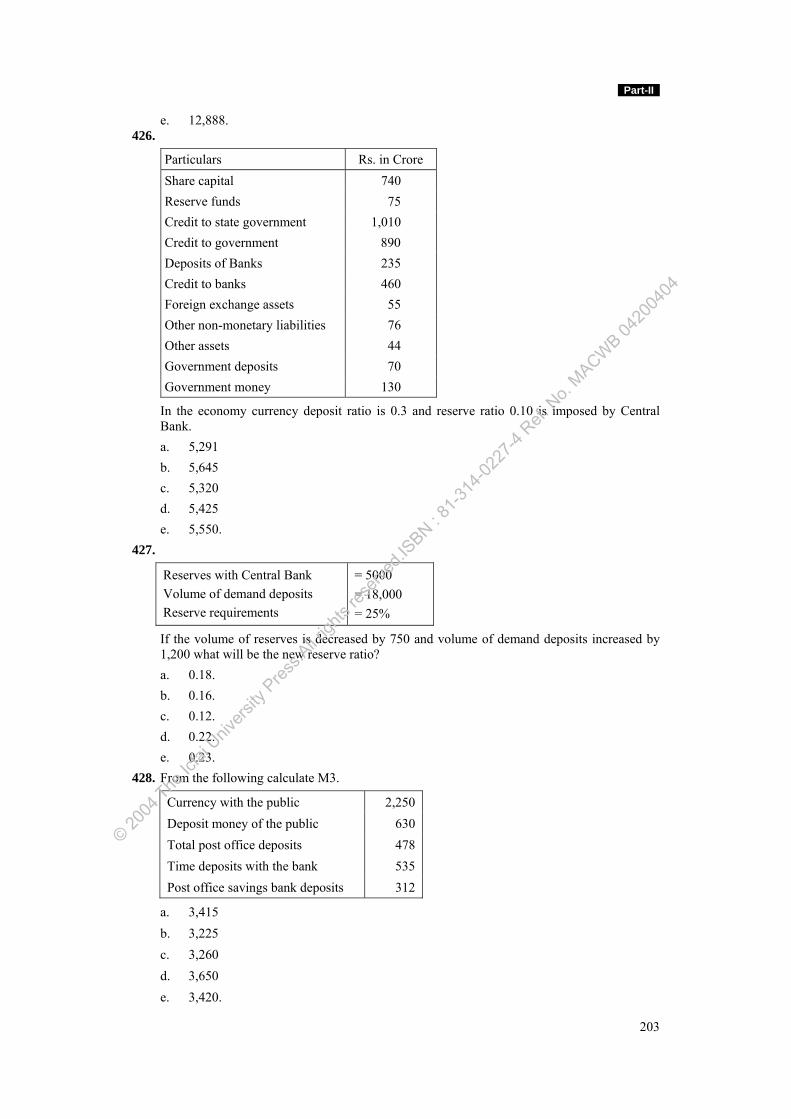
Part-II
203
e. 12,888. 426.
Particulars Rs. in Crore Share capital 740 Reserve funds 75 Credit to state government 1,010 Credit to government 890 Deposits of Banks 235 Credit to banks 460 Foreign exchange assets 55 Other non-monetary liabilities 76 Other assets 44 Government deposits 70 Government money 130
In the economy currency deposit ratio is 0.3 and reserve ratio 0.10 is imposed by Central Bank.
a. 5,291 b. 5,645 c. 5,320 d. 5,425 e. 5,550. 427.
Reserves with Central Bank Volume of demand deposits Reserve requirements
= 5000 = 18,000 = 25%
If the volume of reserves is decreased by 750 and volume of demand deposits increased by 1,200 what will be the new reserve ratio?
a. 0.18. b. 0.16. c. 0.12. d. 0.22. e. 0.23. 428. From the following calculate M3.
Currency with the public 2,250 Deposit money of the public 630 Total post office deposits 478 Time deposits with the bank 535 Post office savings bank deposits 312
a. 3,415 b. 3,225 c. 3,260 d. 3,650 e. 3,420.
© 2004
The Ic
fai U
nivers
ity P
ress.A
ll righ
ts res
erved
.ISBN : 8
1-314
-0227
-4 Ref.
No.
MACWB 04
2004
04
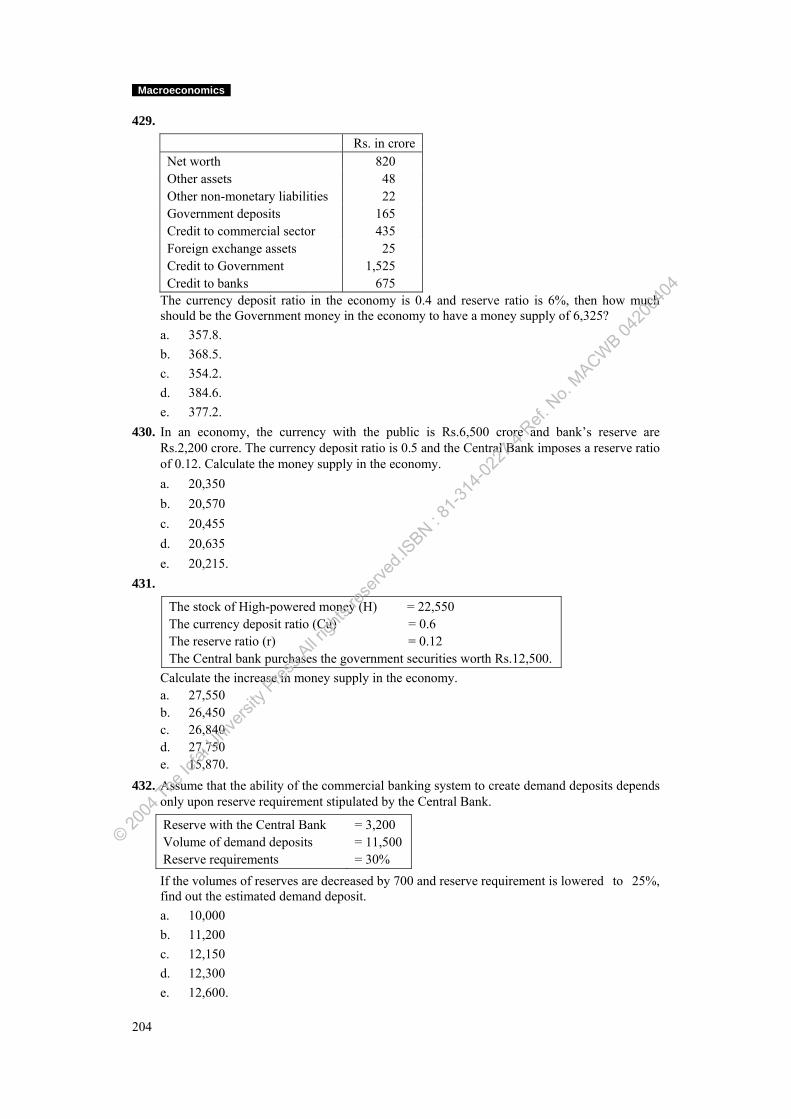
Macroeconomics
204
429.
Rs. in crore Net worth 820 Other assets 48 Other non-monetary liabilities 22 Government deposits 165 Credit to commercial sector 435 Foreign exchange assets 25 Credit to Government 1,525 Credit to banks 675
The currency deposit ratio in the economy is 0.4 and reserve ratio is 6%, then how much should be the Government money in the economy to have a money supply of 6,325?
a. 357.8. b. 368.5. c. 354.2. d. 384.6. e. 377.2. 430. In an economy, the currency with the public is Rs.6,500 crore and bank’s reserve are
Rs.2,200 crore. The currency deposit ratio is 0.5 and the Central Bank imposes a reserve ratio of 0.12. Calculate the money supply in the economy.
a. 20,350 b. 20,570 c. 20,455 d. 20,635 e. 20,215. 431.
The stock of High-powered money (H) = 22,550 The currency deposit ratio (Cu) = 0.6 The reserve ratio (r) = 0.12 The Central bank purchases the government securities worth Rs.12,500.
Calculate the increase in money supply in the economy. a. 27,550 b. 26,450 c. 26,840 d. 27,750 e. 15,870. 432. Assume that the ability of the commercial banking system to create demand deposits depends
only upon reserve requirement stipulated by the Central Bank.
Reserve with the Central Bank Volume of demand deposits Reserve requirements
= 3,200 = 11,500 = 30%
If the volumes of reserves are decreased by 700 and reserve requirement is lowered to 25%, find out the estimated demand deposit.
a. 10,000 b. 11,200 c. 12,150 d. 12,300 e. 12,600.
© 2004
The Ic
fai U
nivers
ity P
ress.A
ll righ
ts res
erved
.ISBN : 8
1-314
-0227
-4 Ref.
No.
MACWB 04
2004
04
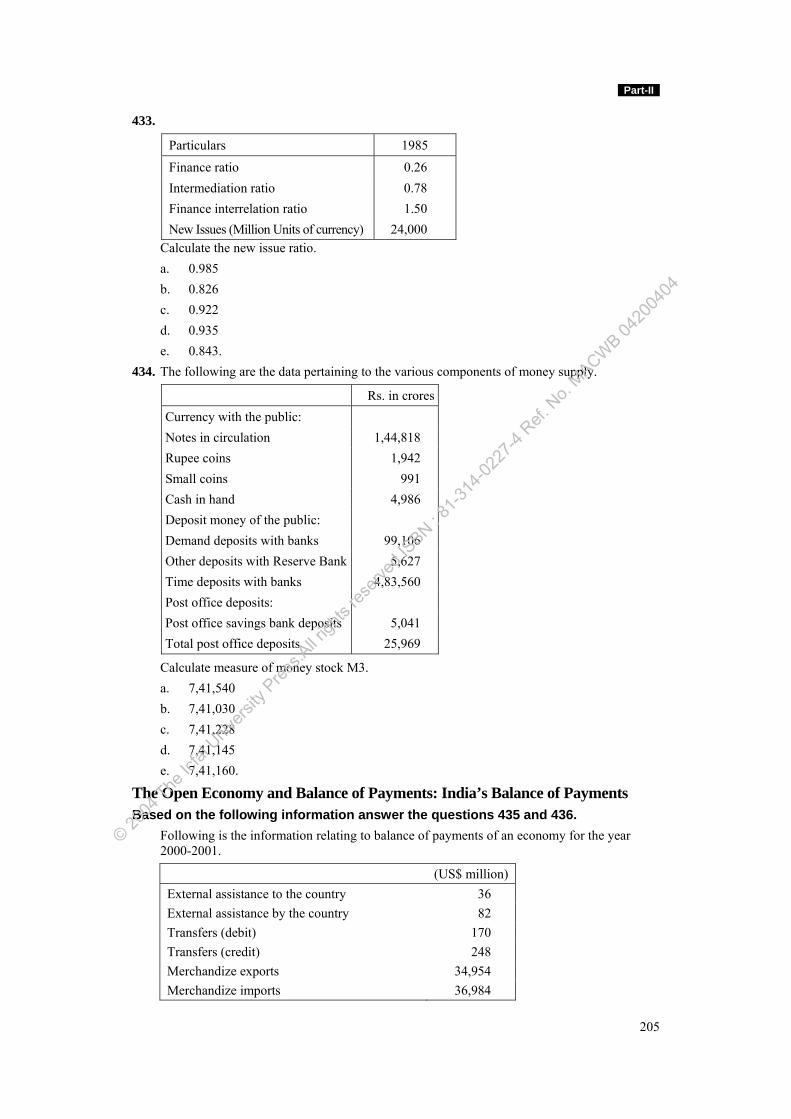
Part-II
205
433.
Particulars 1985
Finance ratio 0.26 Intermediation ratio 0.78 Finance interrelation ratio 1.50 New Issues (Million Units of currency) 24,000
Calculate the new issue ratio. a. 0.985 b. 0.826 c. 0.922 d. 0.935 e. 0.843. 434. The following are the data pertaining to the various components of money supply.
Rs. in croresCurrency with the public: Notes in circulation 1,44,818 Rupee coins 1,942 Small coins 991 Cash in hand 4,986 Deposit money of the public: Demand deposits with banks 99,106 Other deposits with Reserve Bank 5,627 Time deposits with banks 4,83,560 Post office deposits: Post office savings bank deposits 5,041 Total post office deposits 25,969
Calculate measure of money stock M3. a. 7,41,540 b. 7,41,030 c. 7,41,228 d. 7,41,145 e. 7,41,160.
The Open Economy and Balance of Payments: India’s Balance of Payments Based on the following information answer the questions 435 and 436. Following is the information relating to balance of payments of an economy for the year
2000-2001.
(US$ million) External assistance to the country 36 External assistance by the country 82 Transfers (debit) 170 Transfers (credit) 248 Merchandize exports 34,954 Merchandize imports 36,984
© 2004
The Ic
fai U
nivers
ity P
ress.A
ll righ
ts res
erved
.ISBN : 8
1-314
-0227
-4 Ref.
No.
MACWB 04
2004
04
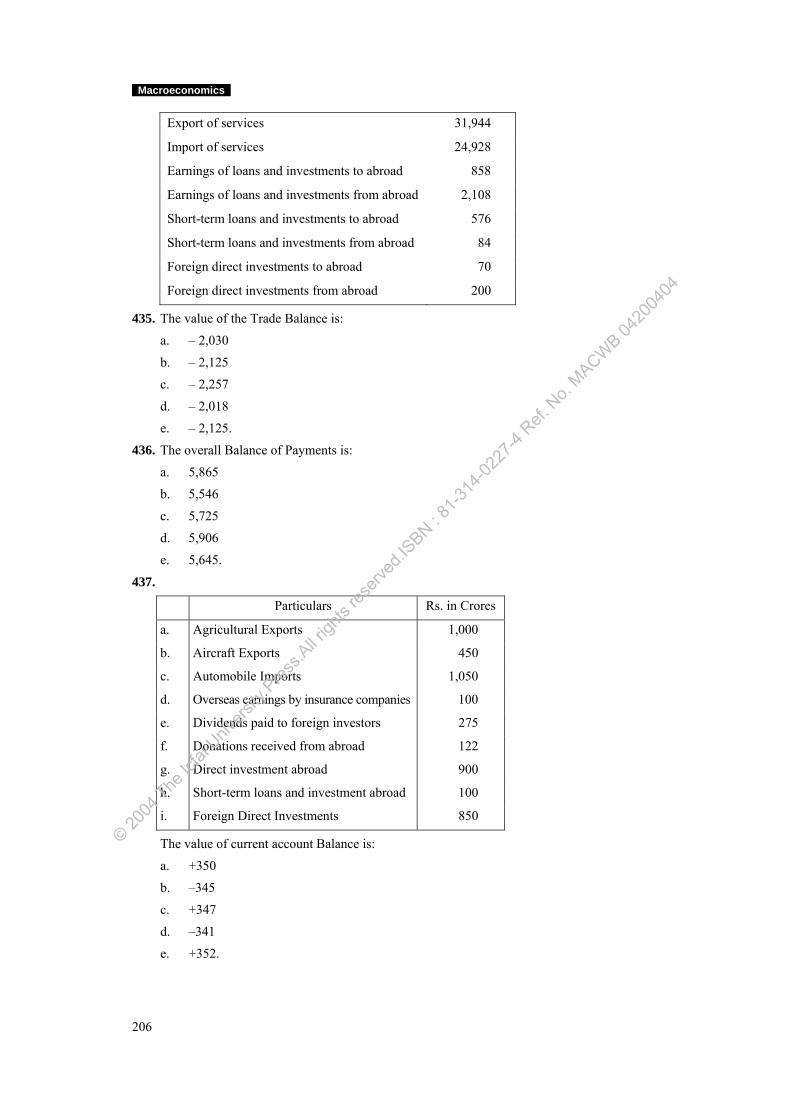
Macroeconomics
206
Export of services 31,944
Import of services 24,928
Earnings of loans and investments to abroad 858
Earnings of loans and investments from abroad 2,108
Short-term loans and investments to abroad 576
Short-term loans and investments from abroad 84
Foreign direct investments to abroad 70
Foreign direct investments from abroad 200
435. The value of the Trade Balance is:
a. – 2,030
b. – 2,125
c. – 2,257
d. – 2,018
e. – 2,125.
436. The overall Balance of Payments is:
a. 5,865
b. 5,546
c. 5,725
d. 5,906
e. 5,645.
437.
Particulars Rs. in Crores
a. Agricultural Exports 1,000
b. Aircraft Exports 450
c. Automobile Imports 1,050
d. Overseas earnings by insurance companies 100
e. Dividends paid to foreign investors 275
f. Donations received from abroad 122
g. Direct investment abroad 900
h. Short-term loans and investment abroad 100
i. Foreign Direct Investments 850
The value of current account Balance is:
a. +350
b. –345
c. +347
d. –341
e. +352.
© 2004
The Ic
fai U
nivers
ity P
ress.A
ll righ
ts res
erved
.ISBN : 8
1-314
-0227
-4 Ref.
No.
MACWB 04
2004
04
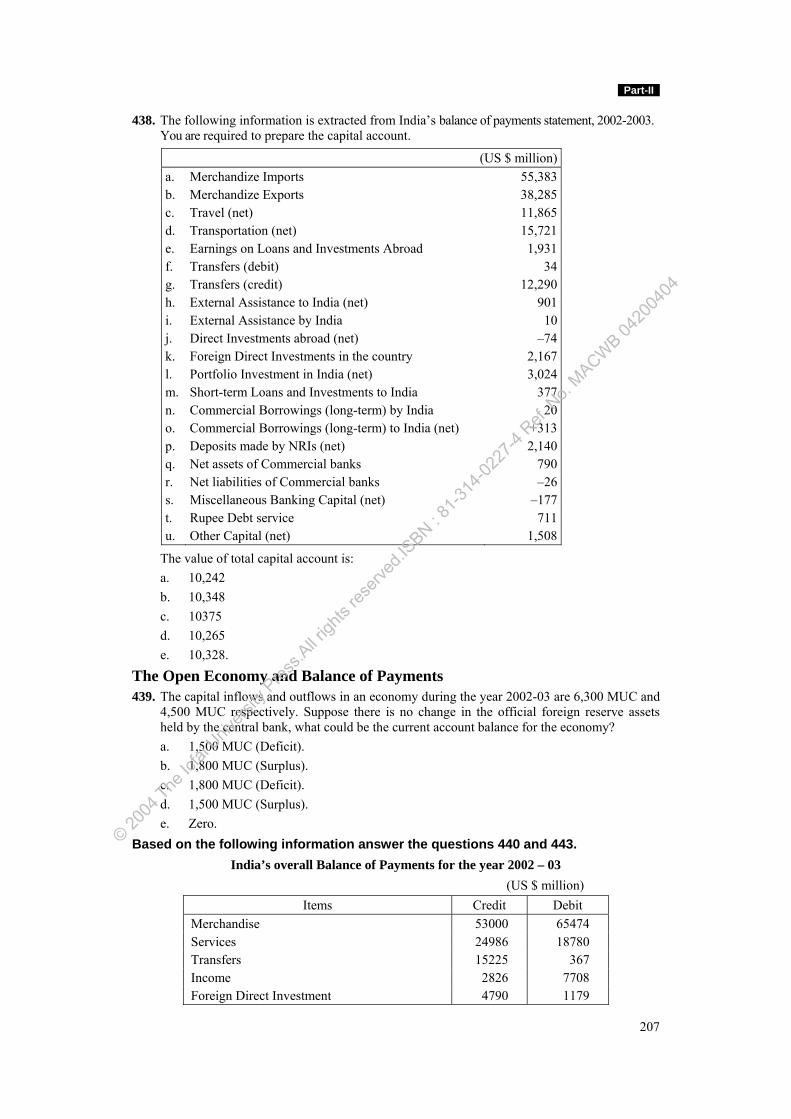
Part-II
207
438. The following information is extracted from India’s balance of payments statement, 2002-2003. You are required to prepare the capital account.
(US $ million)a. Merchandize Imports 55,383b. Merchandize Exports 38,285c. Travel (net) 11,865d. Transportation (net) 15,721e. Earnings on Loans and Investments Abroad 1,931f. Transfers (debit) 34g. Transfers (credit) 12,290h. External Assistance to India (net) 901i. External Assistance by India 10j. Direct Investments abroad (net) –74k. Foreign Direct Investments in the country 2,167l. Portfolio Investment in India (net) 3,024m. Short-term Loans and Investments to India 377n. Commercial Borrowings (long-term) by India 20o. Commercial Borrowings (long-term) to India (net) +313p. Deposits made by NRIs (net) 2,140q. Net assets of Commercial banks 790r. Net liabilities of Commercial banks –26s. Miscellaneous Banking Capital (net) –177t. Rupee Debt service 711u. Other Capital (net) 1,508
The value of total capital account is: a. 10,242 b. 10,348 c. 10375 d. 10,265 e. 10,328.
The Open Economy and Balance of Payments 439. The capital inflows and outflows in an economy during the year 2002-03 are 6,300 MUC and
4,500 MUC respectively. Suppose there is no change in the official foreign reserve assets held by the central bank, what could be the current account balance for the economy?
a. 1,500 MUC (Deficit). b. 1,800 MUC (Surplus). c. 1,800 MUC (Deficit). d. 1,500 MUC (Surplus). e. Zero. Based on the following information answer the questions 440 and 443.
India’s overall Balance of Payments for the year 2002 – 03 (US $ million)
Items Credit Debit Merchandise 53000 65474 Services 24986 18780 Transfers 15225 367 Income 2826 7708 Foreign Direct Investment 4790 1179
© 2004
The Ic
fai U
nivers
ity P
ress.A
ll righ
ts res
erved
.ISBN : 8
1-314
-0227
-4 Ref.
No.
MACWB 04
2004
04
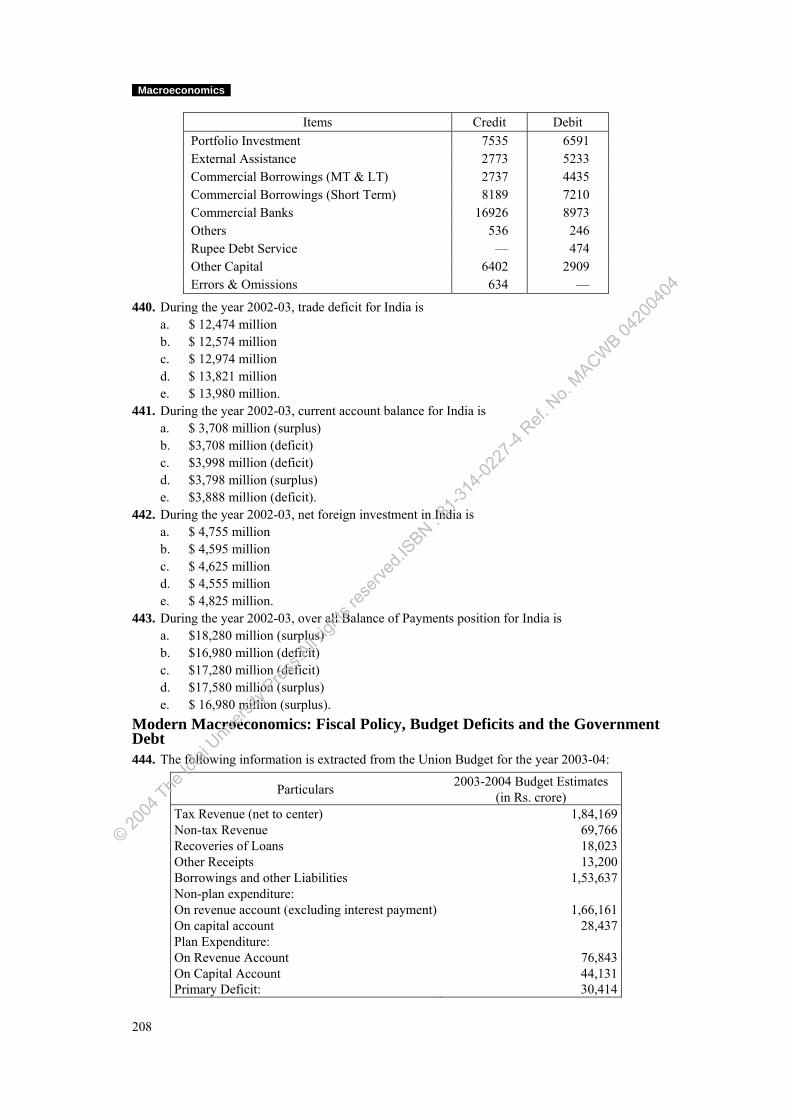
Macroeconomics
208
Items Credit Debit Portfolio Investment 7535 6591 External Assistance 2773 5233 Commercial Borrowings (MT & LT) 2737 4435 Commercial Borrowings (Short Term) 8189 7210 Commercial Banks 16926 8973 Others 536 246 Rupee Debt Service — 474 Other Capital 6402 2909 Errors & Omissions 634 —
440. During the year 2002-03, trade deficit for India is a. $ 12,474 million b. $ 12,574 million c. $ 12,974 million d. $ 13,821 million e. $ 13,980 million. 441. During the year 2002-03, current account balance for India is a. $ 3,708 million (surplus) b. $3,708 million (deficit) c. $3,998 million (deficit) d. $3,798 million (surplus) e. $3,888 million (deficit). 442. During the year 2002-03, net foreign investment in India is a. $ 4,755 million b. $ 4,595 million c. $ 4,625 million d. $ 4,555 million e. $ 4,825 million. 443. During the year 2002-03, over all Balance of Payments position for India is a. $18,280 million (surplus) b. $16,980 million (deficit) c. $17,280 million (deficit) d. $17,580 million (surplus) e. $ 16,980 million (surplus). Modern Macroeconomics: Fiscal Policy, Budget Deficits and the Government Debt 444. The following information is extracted from the Union Budget for the year 2003-04:
Particulars 2003-2004 Budget Estimates (in Rs. crore)
Tax Revenue (net to center) 1,84,169 Non-tax Revenue 69,766 Recoveries of Loans 18,023 Other Receipts 13,200 Borrowings and other Liabilities 1,53,637 Non-plan expenditure: On revenue account (excluding interest payment) 1,66,161 On capital account 28,437 Plan Expenditure: On Revenue Account 76,843 On Capital Account 44,131 Primary Deficit: 30,414
© 2004
The Ic
fai U
nivers
ity P
ress.A
ll righ
ts res
erved
.ISBN : 8
1-314
-0227
-4 Ref.
No.
MACWB 04
2004
04
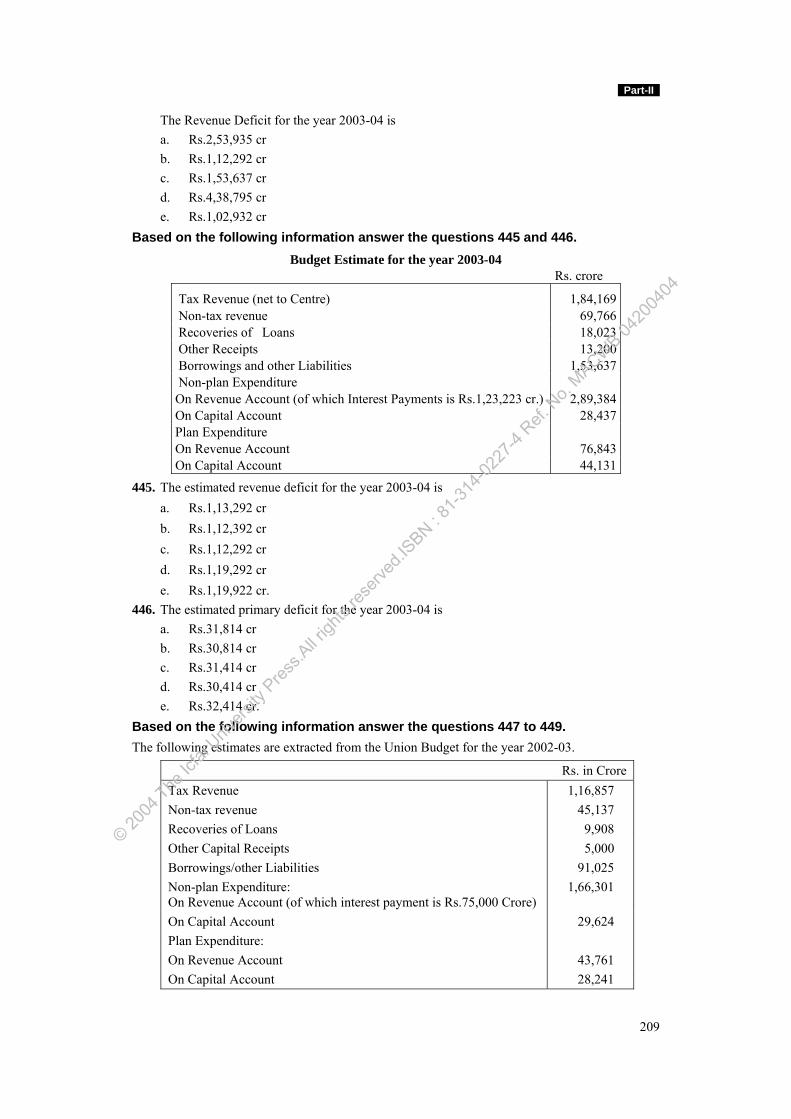
Part-II
209
The Revenue Deficit for the year 2003-04 is a. Rs.2,53,935 cr b. Rs.1,12,292 cr c. Rs.1,53,637 cr d. Rs.4,38,795 cr e. Rs.1,02,932 cr Based on the following information answer the questions 445 and 446.
Budget Estimate for the year 2003-04 Rs. crore
Tax Revenue (net to Centre) 1,84,169 Non-tax revenue 69,766 Recoveries of Loans 18,023 Other Receipts 13,200 Borrowings and other Liabilities 1,53,637 Non-plan Expenditure On Revenue Account (of which Interest Payments is Rs.1,23,223 cr.) 2,89,384 On Capital Account 28,437 Plan Expenditure On Revenue Account 76,843 On Capital Account 44,131
445. The estimated revenue deficit for the year 2003-04 is a. Rs.1,13,292 cr b. Rs.1,12,392 cr c. Rs.1,12,292 cr d. Rs.1,19,292 cr e. Rs.1,19,922 cr. 446. The estimated primary deficit for the year 2003-04 is a. Rs.31,814 cr b. Rs.30,814 cr c. Rs.31,414 cr d. Rs.30,414 cr e. Rs.32,414 cr. Based on the following information answer the questions 447 to 449. The following estimates are extracted from the Union Budget for the year 2002-03.
Rs. in Crore Tax Revenue 1,16,857 Non-tax revenue 45,137 Recoveries of Loans 9,908 Other Capital Receipts 5,000 Borrowings/other Liabilities 91,025 Non-plan Expenditure: On Revenue Account (of which interest payment is Rs.75,000 Crore)
1,66,301
On Capital Account 29,624 Plan Expenditure: On Revenue Account 43,761 On Capital Account 28,241
© 2004
The Ic
fai U
nivers
ity P
ress.A
ll righ
ts res
erved
.ISBN : 8
1-314
-0227
-4 Ref.
No.
MACWB 04
2004
04
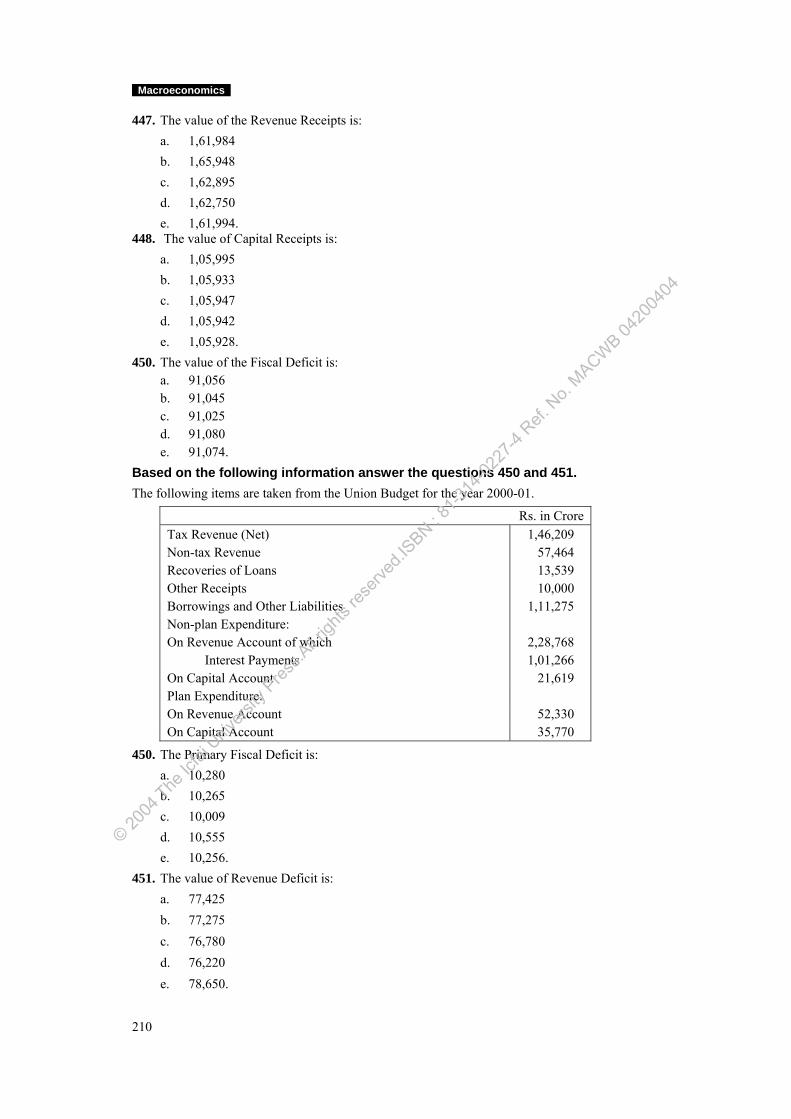
Macroeconomics
210
447. The value of the Revenue Receipts is: a. 1,61,984 b. 1,65,948 c. 1,62,895 d. 1,62,750 e. 1,61,994. 448. The value of Capital Receipts is: a. 1,05,995 b. 1,05,933 c. 1,05,947 d. 1,05,942 e. 1,05,928. 450. The value of the Fiscal Deficit is: a. 91,056 b. 91,045 c. 91,025 d. 91,080 e. 91,074. Based on the following information answer the questions 450 and 451. The following items are taken from the Union Budget for the year 2000-01.
Rs. in Crore Tax Revenue (Net) 1,46,209 Non-tax Revenue 57,464 Recoveries of Loans 13,539 Other Receipts 10,000 Borrowings and Other Liabilities 1,11,275 Non-plan Expenditure: On Revenue Account of which 2,28,768 Interest Payments 1,01,266 On Capital Account 21,619 Plan Expenditure: On Revenue Account 52,330 On Capital Account 35,770
450. The Primary Fiscal Deficit is: a. 10,280 b. 10,265 c. 10,009 d. 10,555 e. 10,256. 451. The value of Revenue Deficit is: a. 77,425 b. 77,275 c. 76,780 d. 76,220 e. 78,650.
© 2004
The Ic
fai U
nivers
ity P
ress.A
ll righ
ts res
erved
.ISBN : 8
1-314
-0227
-4 Ref.
No.
MACWB 04
2004
04
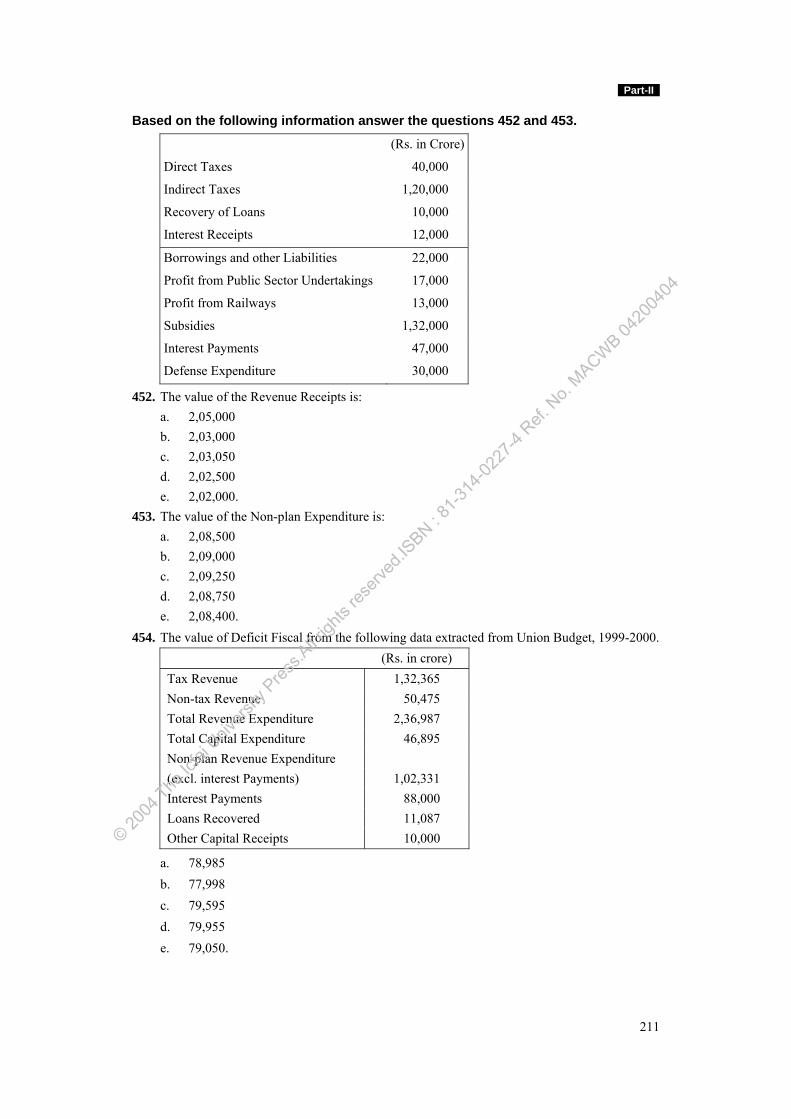
Part-II
211
Based on the following information answer the questions 452 and 453.
(Rs. in Crore)
Direct Taxes 40,000
Indirect Taxes 1,20,000
Recovery of Loans 10,000
Interest Receipts 12,000
Borrowings and other Liabilities 22,000
Profit from Public Sector Undertakings 17,000
Profit from Railways 13,000
Subsidies 1,32,000
Interest Payments 47,000
Defense Expenditure 30,000
452. The value of the Revenue Receipts is: a. 2,05,000 b. 2,03,000 c. 2,03,050 d. 2,02,500 e. 2,02,000. 453. The value of the Non-plan Expenditure is: a. 2,08,500 b. 2,09,000 c. 2,09,250 d. 2,08,750 e. 2,08,400. 454. The value of Deficit Fiscal from the following data extracted from Union Budget, 1999-2000.
(Rs. in crore) Tax Revenue 1,32,365 Non-tax Revenue 50,475 Total Revenue Expenditure 2,36,987 Total Capital Expenditure 46,895 Non-plan Revenue Expenditure (excl. interest Payments) 1,02,331 Interest Payments 88,000 Loans Recovered 11,087 Other Capital Receipts 10,000
a. 78,985 b. 77,998 c. 79,595 d. 79,955 e. 79,050.
© 2004
The Ic
fai U
nivers
ity P
ress.A
ll righ
ts res
erved
.ISBN : 8
1-314
-0227
-4 Ref.
No.
MACWB 04
2004
04
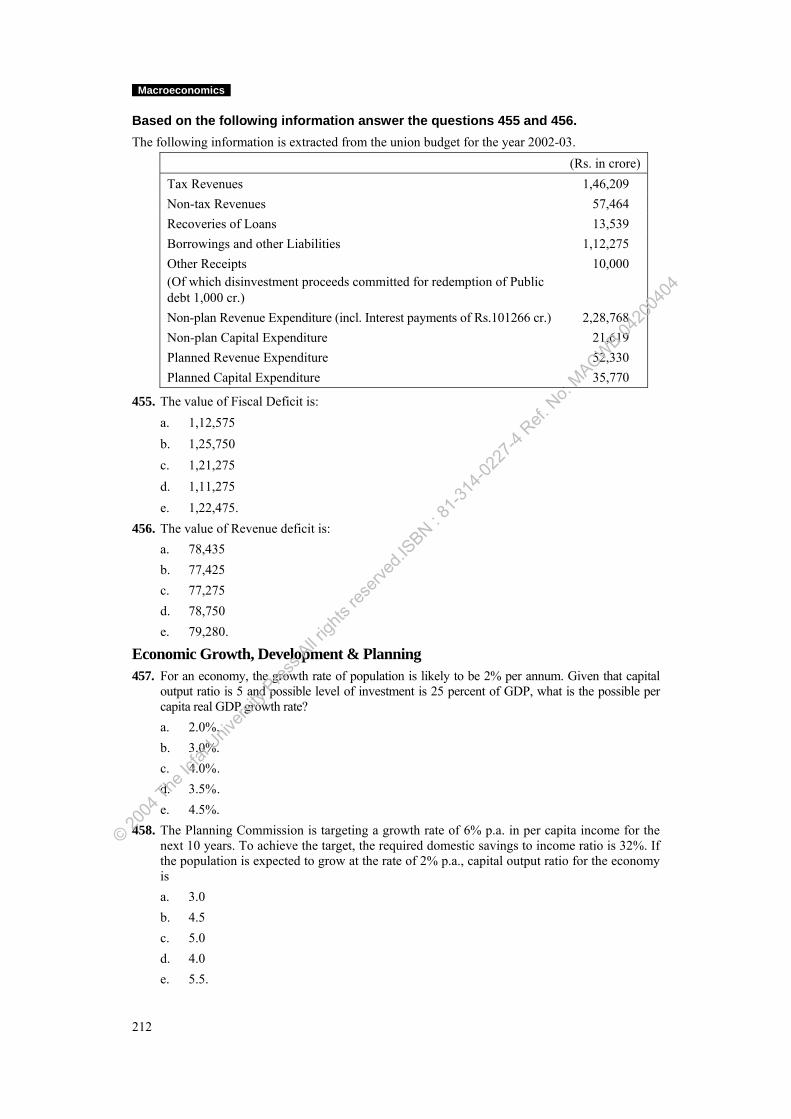
Macroeconomics
212
Based on the following information answer the questions 455 and 456. The following information is extracted from the union budget for the year 2002-03.
(Rs. in crore) Tax Revenues 1,46,209 Non-tax Revenues 57,464 Recoveries of Loans 13,539 Borrowings and other Liabilities 1,12,275 Other Receipts (Of which disinvestment proceeds committed for redemption of Public debt 1,000 cr.)
10,000
Non-plan Revenue Expenditure (incl. Interest payments of Rs.101266 cr.) 2,28,768 Non-plan Capital Expenditure 21,619 Planned Revenue Expenditure 52,330 Planned Capital Expenditure 35,770
455. The value of Fiscal Deficit is: a. 1,12,575 b. 1,25,750 c. 1,21,275 d. 1,11,275 e. 1,22,475. 456. The value of Revenue deficit is: a. 78,435 b. 77,425 c. 77,275 d. 78,750 e. 79,280.
Economic Growth, Development & Planning 457. For an economy, the growth rate of population is likely to be 2% per annum. Given that capital
output ratio is 5 and possible level of investment is 25 percent of GDP, what is the possible per capita real GDP growth rate?
a. 2.0%. b. 3.0%. c. 4.0% . d. 3.5% . e. 4.5%. 458. The Planning Commission is targeting a growth rate of 6% p.a. in per capita income for the
next 10 years. To achieve the target, the required domestic savings to income ratio is 32%. If the population is expected to grow at the rate of 2% p.a., capital output ratio for the economy is
a. 3.0 b. 4.5 c. 5.0 d. 4.0 e. 5.5.
© 2004
The Ic
fai U
nivers
ity P
ress.A
ll righ
ts res
erved
.ISBN : 8
1-314
-0227
-4 Ref.
No.
MACWB 04
2004
04
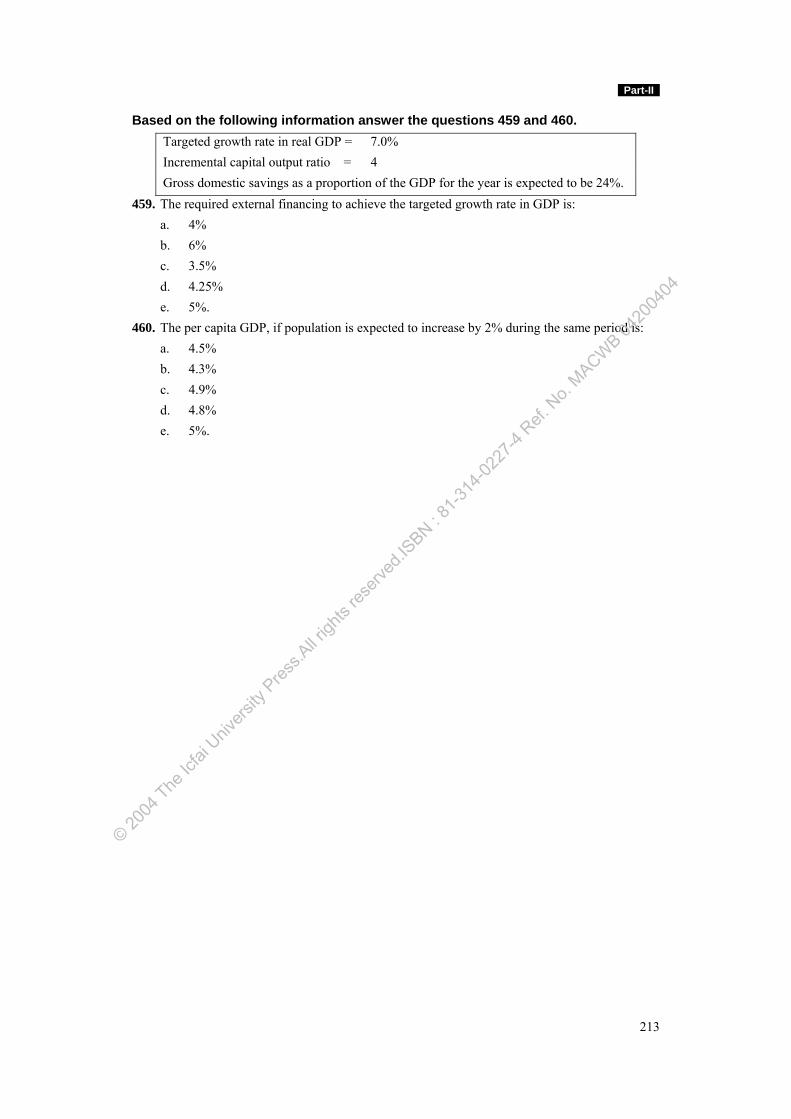
Part-II
213
Based on the following information answer the questions 459 and 460. Targeted growth rate in real GDP = 7.0% Incremental capital output ratio = 4 Gross domestic savings as a proportion of the GDP for the year is expected to be 24%.
459. The required external financing to achieve the targeted growth rate in GDP is: a. 4% b. 6% c. 3.5% d. 4.25% e. 5%. 460. The per capita GDP, if population is expected to increase by 2% during the same period is: a. 4.5% b. 4.3% c. 4.9% d. 4.8% e. 5%.
© 2004
The Ic
fai U
nivers
ity P
ress.A
ll righ
ts res
erved
.ISBN : 8
1-314
-0227
-4 Ref.
No.
MACWB 04
2004
04
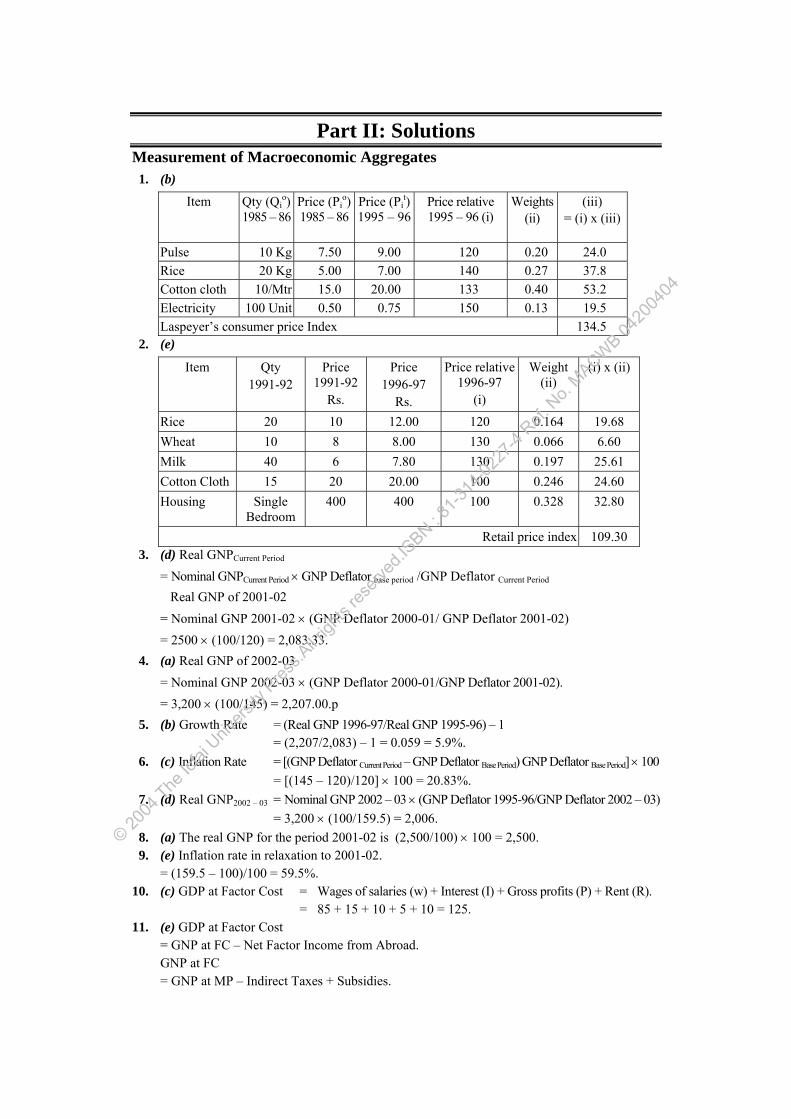
214
Part II: Solutions Measurement of Macroeconomic Aggregates 1. (b)
Item Qty (Qio)
1985 – 86
Price (Pio)
1985 – 86Price (Pi
t) 1995 – 96
Price relative 1995 – 96 (i)
Weights(ii)
(iii) = (i) x (iii)
Pulse 10 Kg 7.50 9.00 120 0.20 24.0 Rice 20 Kg 5.00 7.00 140 0.27 37.8 Cotton cloth 10/Mtr 15.0 20.00 133 0.40 53.2 Electricity 100 Unit 0.50 0.75 150 0.13 19.5 Laspeyer’s consumer price Index 134.5
2. (e)
Item Qty 1991-92
Price 1991-92
Rs.
Price 1996-97
Rs.
Price relative 1996-97
(i)
Weight (ii)
(i) x (ii)
Rice 20 10 12.00 120 0.164 19.68 Wheat 10 8 8.00 130 0.066 6.60 Milk 40 6 7.80 130 0.197 25.61 Cotton Cloth 15 20 20.00 100 0.246 24.60 Housing Single
Bedroom 400 400 100 0.328 32.80
Retail price index 109.30 3. (d) Real GNPCurrent Period = Nominal GNPCurrent Period × GNP Deflator base period /GNP Deflator Current Period Real GNP of 2001-02 = Nominal GNP 2001-02 × (GNP Deflator 2000-01/ GNP Deflator 2001-02) = 2500 × (100/120) = 2,083.33. 4. (a) Real GNP of 2002-03 = Nominal GNP 2002-03 × (GNP Deflator 2000-01/GNP Deflator 2001-02). = 3,200 × (100/145) = 2,207.00.p 5. (b) Growth Rate = (Real GNP 1996-97/Real GNP 1995-96) – 1 = (2,207/2,083) – 1 = 0.059 = 5.9%. 6. (c) Inflation Rate = [(GNP Deflator Current Period – GNP Deflator Base Period) GNP Deflator Base Period] × 100 = [(145 – 120)/120] × 100 = 20.83%. 7. (d) Real GNP2002 – 03 = Nominal GNP 2002 – 03 × (GNP Deflator 1995-96/GNP Deflator 2002 – 03) = 3,200 × (100/159.5) = 2,006. 8. (a) The real GNP for the period 2001-02 is (2,500/100) × 100 = 2,500. 9. (e) Inflation rate in relaxation to 2001-02. = (159.5 – 100)/100 = 59.5%. 10. (c) GDP at Factor Cost = Wages of salaries (w) + Interest (I) + Gross profits (P) + Rent (R). = 85 + 15 + 10 + 5 + 10 = 125. 11. (e) GDP at Factor Cost = GNP at FC – Net Factor Income from Abroad. GNP at FC = GNP at MP – Indirect Taxes + Subsidies.
© 2004
The Ic
fai U
nivers
ity P
ress.A
ll righ
ts res
erved
.ISBN : 8
1-314
-0227
-4 Ref.
No.
MACWB 04
2004
04
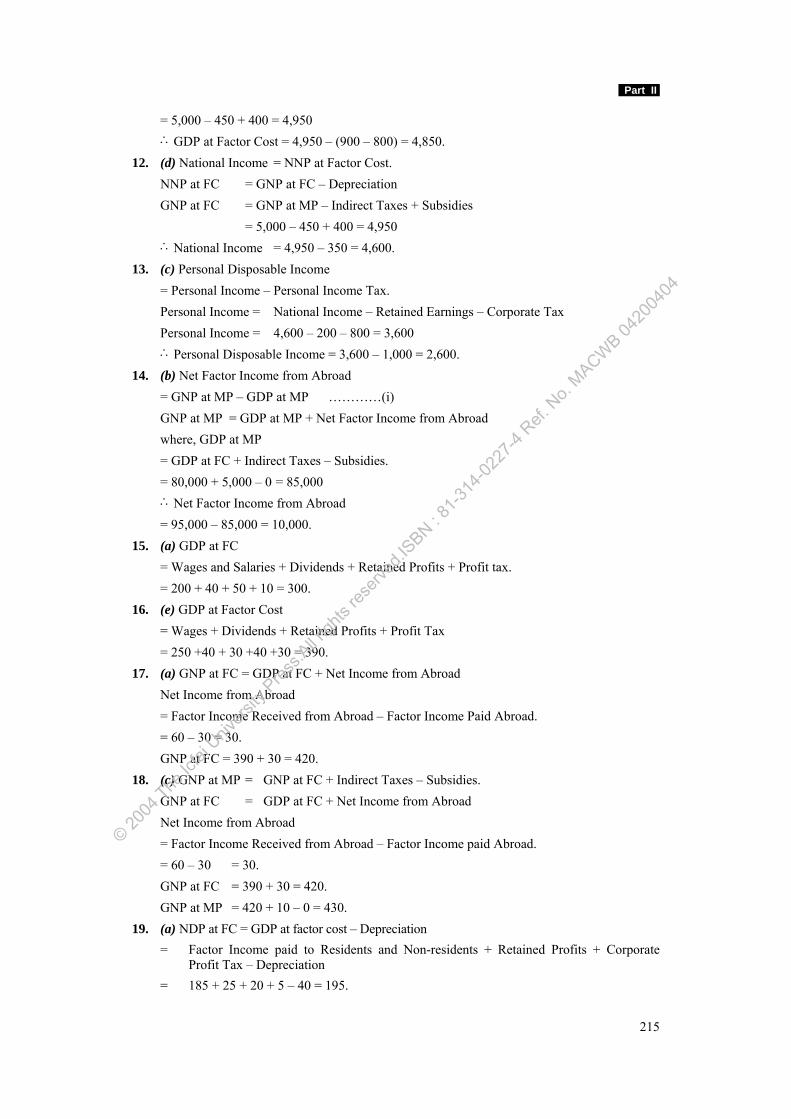
Part II
215
= 5,000 – 450 + 400 = 4,950 ∴GDP at Factor Cost = 4,950 – (900 – 800) = 4,850. 12. (d) National Income = NNP at Factor Cost. NNP at FC = GNP at FC – Depreciation GNP at FC = GNP at MP – Indirect Taxes + Subsidies = 5,000 – 450 + 400 = 4,950 ∴National Income = 4,950 – 350 = 4,600. 13. (c) Personal Disposable Income = Personal Income – Personal Income Tax. Personal Income = National Income – Retained Earnings – Corporate Tax Personal Income = 4,600 – 200 – 800 = 3,600 ∴Personal Disposable Income = 3,600 – 1,000 = 2,600. 14. (b) Net Factor Income from Abroad = GNP at MP – GDP at MP …………(i) GNP at MP = GDP at MP + Net Factor Income from Abroad where, GDP at MP = GDP at FC + Indirect Taxes – Subsidies. = 80,000 + 5,000 – 0 = 85,000 ∴Net Factor Income from Abroad = 95,000 – 85,000 = 10,000. 15. (a) GDP at FC = Wages and Salaries + Dividends + Retained Profits + Profit tax. = 200 + 40 + 50 + 10 = 300. 16. (e) GDP at Factor Cost = Wages + Dividends + Retained Profits + Profit Tax = 250 +40 + 30 +40 +30 = 390. 17. (a) GNP at FC = GDP at FC + Net Income from Abroad Net Income from Abroad = Factor Income Received from Abroad – Factor Income Paid Abroad. = 60 – 30 = 30. GNP at FC = 390 + 30 = 420. 18. (c) GNP at MP = GNP at FC + Indirect Taxes – Subsidies. GNP at FC = GDP at FC + Net Income from Abroad Net Income from Abroad = Factor Income Received from Abroad – Factor Income paid Abroad. = 60 – 30 = 30. GNP at FC = 390 + 30 = 420. GNP at MP = 420 + 10 – 0 = 430. 19. (a) NDP at FC = GDP at factor cost – Depreciation = Factor Income paid to Residents and Non-residents + Retained Profits + Corporate
Profit Tax – Depreciation = 185 + 25 + 20 + 5 – 40 = 195.
© 2004
The Ic
fai U
nivers
ity P
ress.A
ll righ
ts res
erved
.ISBN : 8
1-314
-0227
-4 Ref.
No.
MACWB 04
2004
04
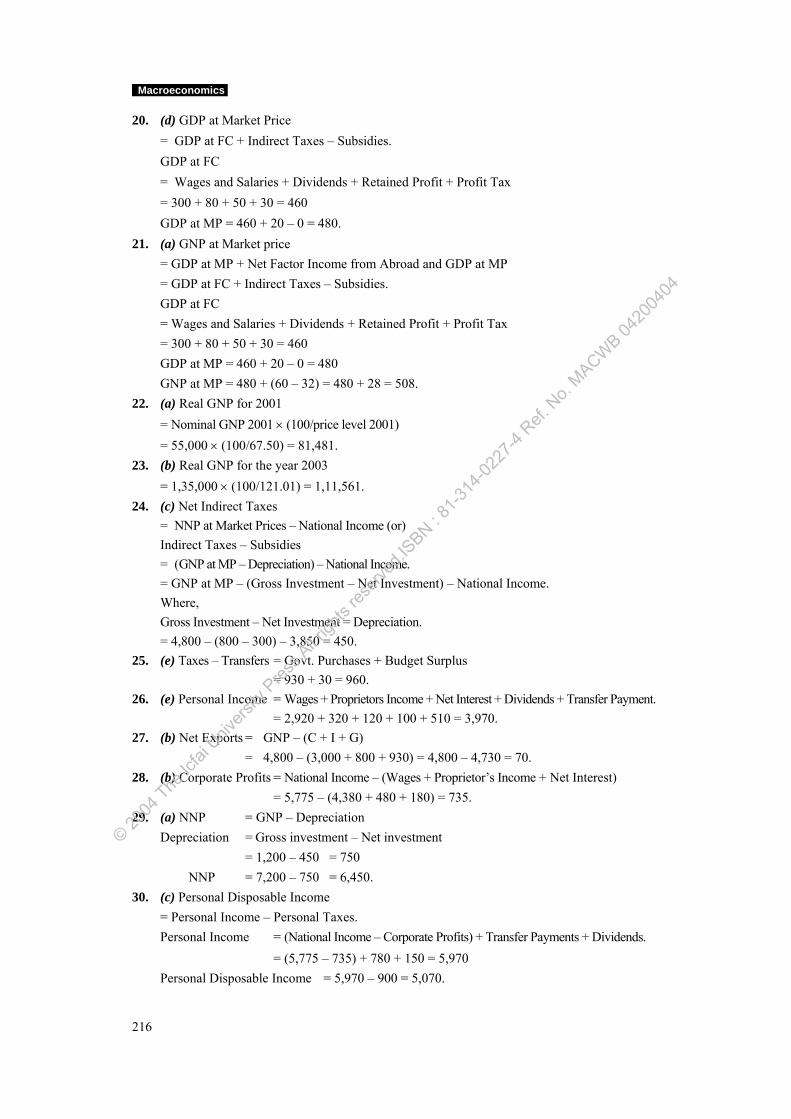
Macroeconomics
216
20. (d) GDP at Market Price = GDP at FC + Indirect Taxes – Subsidies. GDP at FC = Wages and Salaries + Dividends + Retained Profit + Profit Tax = 300 + 80 + 50 + 30 = 460 GDP at MP = 460 + 20 – 0 = 480. 21. (a) GNP at Market price = GDP at MP + Net Factor Income from Abroad and GDP at MP = GDP at FC + Indirect Taxes – Subsidies. GDP at FC = Wages and Salaries + Dividends + Retained Profit + Profit Tax = 300 + 80 + 50 + 30 = 460 GDP at MP = 460 + 20 – 0 = 480 GNP at MP = 480 + (60 – 32) = 480 + 28 = 508. 22. (a) Real GNP for 2001 = Nominal GNP 2001 × (100/price level 2001) = 55,000 × (100/67.50) = 81,481. 23. (b) Real GNP for the year 2003 = 1,35,000 × (100/121.01) = 1,11,561. 24. (c) Net Indirect Taxes = NNP at Market Prices – National Income (or) Indirect Taxes – Subsidies = (GNP at MP – Depreciation) – National Income.
= GNP at MP – (Gross Investment – Net Investment) – National Income. Where, Gross Investment – Net Investment = Depreciation. = 4,800 – (800 – 300) – 3,850 = 450. 25. (e) Taxes – Transfers = Govt. Purchases + Budget Surplus = 930 + 30 = 960. 26. (e) Personal Income = Wages + Proprietors Income + Net Interest + Dividends + Transfer Payment. = 2,920 + 320 + 120 + 100 + 510 = 3,970. 27. (b) Net Exports = GNP – (C + I + G) = 4,800 – (3,000 + 800 + 930) = 4,800 – 4,730 = 70. 28. (b) Corporate Profits = National Income – (Wages + Proprietor’s Income + Net Interest) = 5,775 – (4,380 + 480 + 180) = 735. 29. (a) NNP = GNP – Depreciation Depreciation = Gross investment – Net investment = 1,200 – 450 = 750 NNP = 7,200 – 750 = 6,450. 30. (c) Personal Disposable Income = Personal Income – Personal Taxes. Personal Income = (National Income – Corporate Profits) + Transfer Payments + Dividends. = (5,775 – 735) + 780 + 150 = 5,970 Personal Disposable Income = 5,970 – 900 = 5,070.
© 2004
The Ic
fai U
nivers
ity P
ress.A
ll righ
ts res
erved
.ISBN : 8
1-314
-0227
-4 Ref.
No.
MACWB 04
2004
04
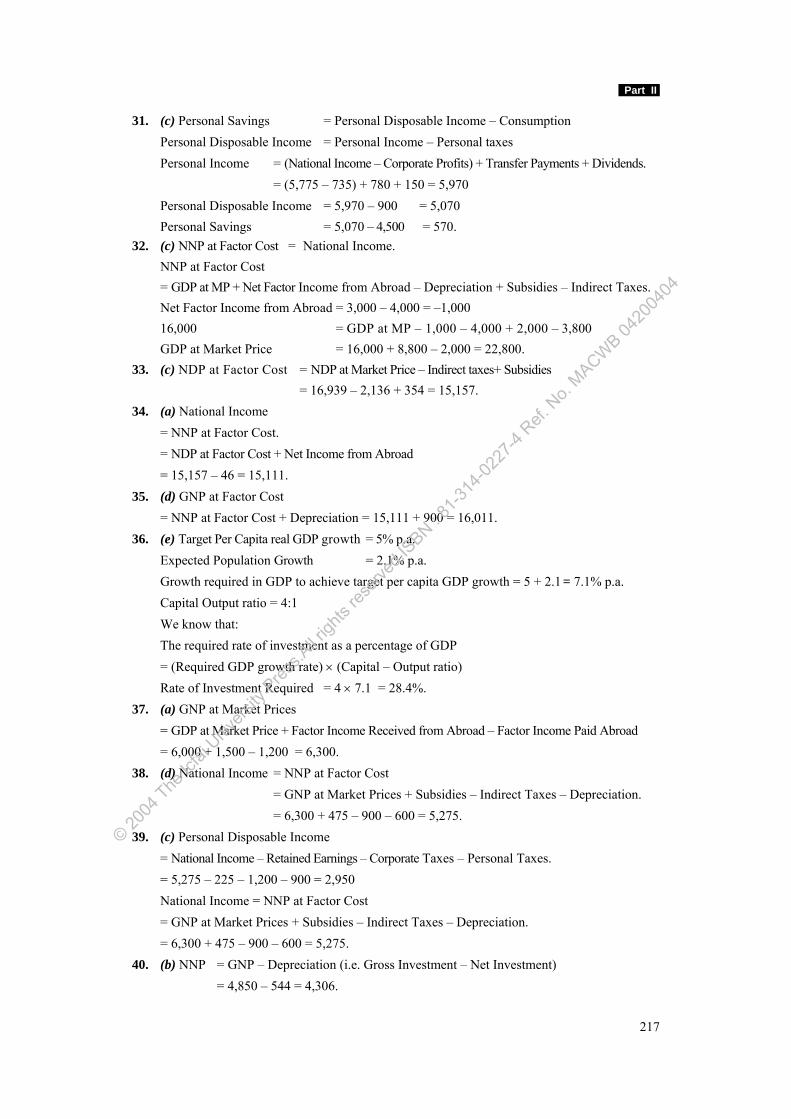
Part II
217
31. (c) Personal Savings = Personal Disposable Income – Consumption Personal Disposable Income = Personal Income – Personal taxes Personal Income = (National Income – Corporate Profits) + Transfer Payments + Dividends. = (5,775 – 735) + 780 + 150 = 5,970 Personal Disposable Income = 5,970 – 900 = 5,070 Personal Savings = 5,070 – 4,500 = 570. 32. (c) NNP at Factor Cost = National Income. NNP at Factor Cost = GDP at MP + Net Factor Income from Abroad – Depreciation + Subsidies – Indirect Taxes. Net Factor Income from Abroad = 3,000 – 4,000 = –1,000 16,000 = GDP at MP – 1,000 – 4,000 + 2,000 – 3,800 GDP at Market Price = 16,000 + 8,800 – 2,000 = 22,800. 33. (c) NDP at Factor Cost = NDP at Market Price – Indirect taxes+ Subsidies = 16,939 – 2,136 + 354 = 15,157. 34. (a) National Income = NNP at Factor Cost. = NDP at Factor Cost + Net Income from Abroad = 15,157 – 46 = 15,111. 35. (d) GNP at Factor Cost = NNP at Factor Cost + Depreciation = 15,111 + 900 = 16,011. 36. (e) Target Per Capita real GDP growth = 5% p.a. Expected Population Growth = 2.1% p.a. Growth required in GDP to achieve target per capita GDP growth = 5 + 2.1 = 7.1% p.a. Capital Output ratio = 4:1 We know that: The required rate of investment as a percentage of GDP = (Required GDP growth rate) × (Capital – Output ratio) Rate of Investment Required = 4 × 7.1 = 28.4%. 37. (a) GNP at Market Prices = GDP at Market Price + Factor Income Received from Abroad – Factor Income Paid Abroad = 6,000 + 1,500 – 1,200 = 6,300. 38. (d) National Income = NNP at Factor Cost = GNP at Market Prices + Subsidies – Indirect Taxes – Depreciation. = 6,300 + 475 – 900 – 600 = 5,275. 39. (c) Personal Disposable Income = National Income – Retained Earnings – Corporate Taxes – Personal Taxes. = 5,275 – 225 – 1,200 – 900 = 2,950 National Income = NNP at Factor Cost = GNP at Market Prices + Subsidies – Indirect Taxes – Depreciation. = 6,300 + 475 – 900 – 600 = 5,275. 40. (b) NNP = GNP – Depreciation (i.e. Gross Investment – Net Investment) = 4,850 – 544 = 4,306.
© 2004
The Ic
fai U
nivers
ity P
ress.A
ll righ
ts res
erved
.ISBN : 8
1-314
-0227
-4 Ref.
No.
MACWB 04
2004
04
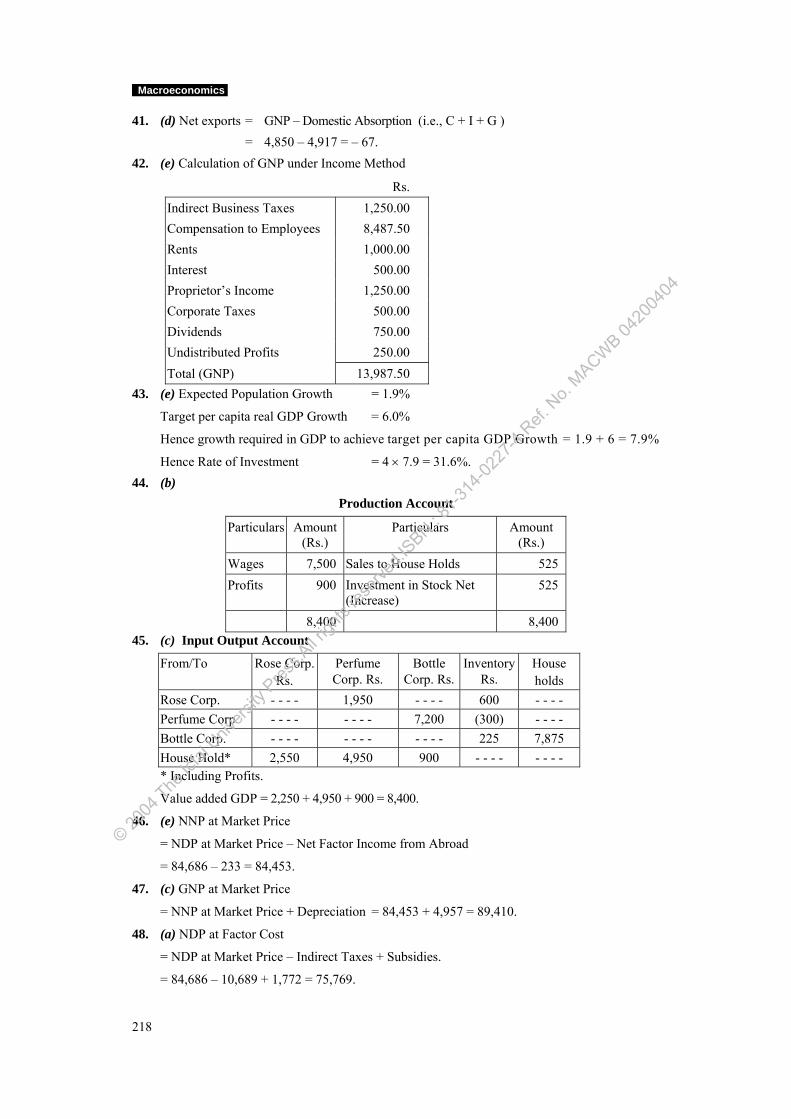
Macroeconomics
218
41. (d) Net exports = GNP – Domestic Absorption (i.e., C + I + G ) = 4,850 – 4,917 = – 67. 42. (e) Calculation of GNP under Income Method
Rs. Indirect Business Taxes 1,250.00 Compensation to Employees 8,487.50 Rents 1,000.00 Interest 500.00 Proprietor’s Income 1,250.00 Corporate Taxes 500.00 Dividends 750.00 Undistributed Profits 250.00 Total (GNP) 13,987.50
43. (e) Expected Population Growth = 1.9%
Target per capita real GDP Growth = 6.0%
Hence growth required in GDP to achieve target per capita GDP Growth = 1.9 + 6 = 7.9%
Hence Rate of Investment = 4 × 7.9 = 31.6%. 44. (b)
Production Account
Particulars Amount (Rs.)
Particulars Amount (Rs.)
Wages 7,500 Sales to House Holds 525 Profits 900 Investment in Stock Net
(Increase) 525
8,400 8,400 45. (c) Input Output Account
From/To Rose Corp. Rs.
Perfume Corp. Rs.
Bottle Corp. Rs.
Inventory Rs.
House holds
Rose Corp. - - - - 1,950 - - - - 600 - - - - Perfume Corp - - - - - - - - 7,200 (300) - - - - Bottle Corp. - - - - - - - - - - - - 225 7,875 House Hold* 2,550 4,950 900 - - - - - - - -
* Including Profits.
Value added GDP = 2,250 + 4,950 + 900 = 8,400.
46. (e) NNP at Market Price
= NDP at Market Price – Net Factor Income from Abroad
= 84,686 – 233 = 84,453.
47. (c) GNP at Market Price
= NNP at Market Price + Depreciation = 84,453 + 4,957 = 89,410.
48. (a) NDP at Factor Cost
= NDP at Market Price – Indirect Taxes + Subsidies.
= 84,686 – 10,689 + 1,772 = 75,769.
© 2004
The Ic
fai U
nivers
ity P
ress.A
ll righ
ts res
erved
.ISBN : 8
1-314
-0227
-4 Ref.
No.
MACWB 04
2004
04
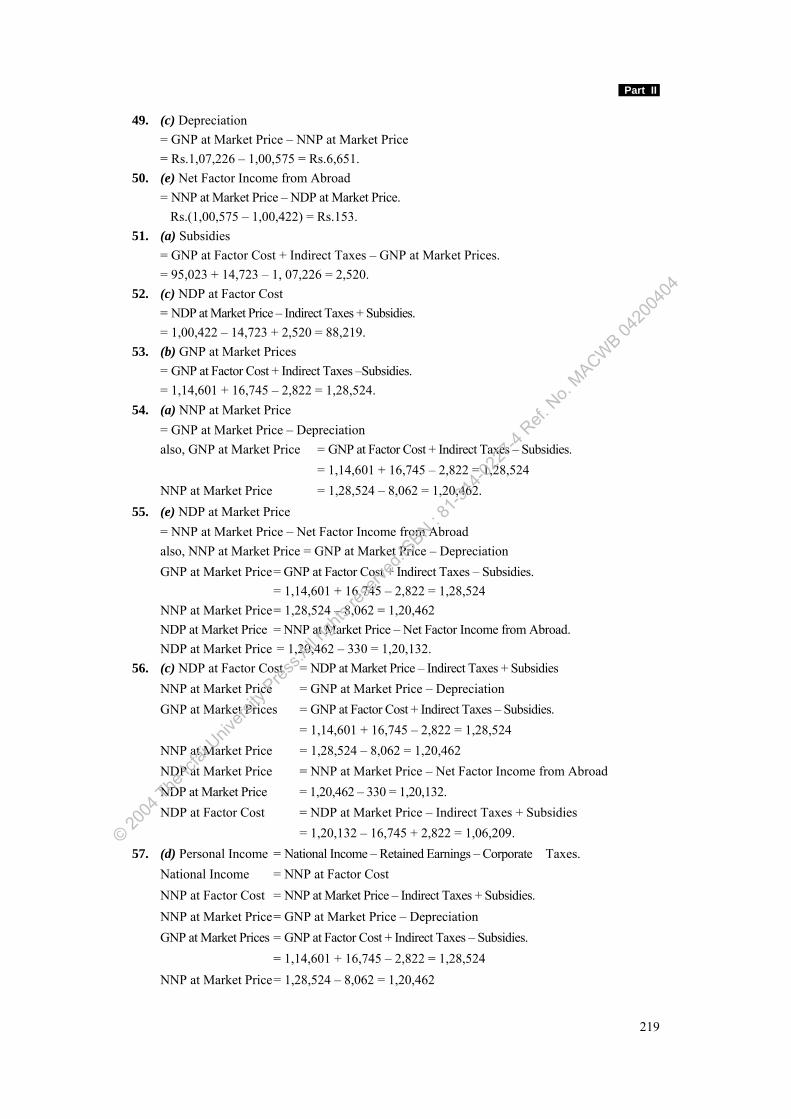
Part II
219
49. (c) Depreciation = GNP at Market Price – NNP at Market Price = Rs.1,07,226 – 1,00,575 = Rs.6,651. 50. (e) Net Factor Income from Abroad = NNP at Market Price – NDP at Market Price. Rs.(1,00,575 – 1,00,422) = Rs.153. 51. (a) Subsidies = GNP at Factor Cost + Indirect Taxes – GNP at Market Prices. = 95,023 + 14,723 – 1, 07,226 = 2,520. 52. (c) NDP at Factor Cost = NDP at Market Price – Indirect Taxes + Subsidies. = 1,00,422 – 14,723 + 2,520 = 88,219. 53. (b) GNP at Market Prices = GNP at Factor Cost + Indirect Taxes –Subsidies. = 1,14,601 + 16,745 – 2,822 = 1,28,524. 54. (a) NNP at Market Price = GNP at Market Price – Depreciation also, GNP at Market Price = GNP at Factor Cost + Indirect Taxes – Subsidies. = 1,14,601 + 16,745 – 2,822 = 1,28,524 NNP at Market Price = 1,28,524 – 8,062 = 1,20,462. 55. (e) NDP at Market Price = NNP at Market Price – Net Factor Income from Abroad also, NNP at Market Price = GNP at Market Price – Depreciation GNP at Market Price = GNP at Factor Cost + Indirect Taxes – Subsidies. = 1,14,601 + 16,745 – 2,822 = 1,28,524 NNP at Market Price = 1,28,524 – 8,062 = 1,20,462 NDP at Market Price = NNP at Market Price – Net Factor Income from Abroad. NDP at Market Price = 1,20,462 – 330 = 1,20,132. 56. (c) NDP at Factor Cost = NDP at Market Price – Indirect Taxes + Subsidies NNP at Market Price = GNP at Market Price – Depreciation GNP at Market Prices = GNP at Factor Cost + Indirect Taxes – Subsidies. = 1,14,601 + 16,745 – 2,822 = 1,28,524 NNP at Market Price = 1,28,524 – 8,062 = 1,20,462 NDP at Market Price = NNP at Market Price – Net Factor Income from Abroad NDP at Market Price = 1,20,462 – 330 = 1,20,132. NDP at Factor Cost = NDP at Market Price – Indirect Taxes + Subsidies = 1,20,132 – 16,745 + 2,822 = 1,06,209. 57. (d) Personal Income = National Income – Retained Earnings – Corporate Taxes. National Income = NNP at Factor Cost NNP at Factor Cost = NNP at Market Price – Indirect Taxes + Subsidies. NNP at Market Price = GNP at Market Price – Depreciation GNP at Market Prices = GNP at Factor Cost + Indirect Taxes – Subsidies. = 1,14,601 + 16,745 – 2,822 = 1,28,524 NNP at Market Price = 1,28,524 – 8,062 = 1,20,462
© 2004
The Ic
fai U
nivers
ity P
ress.A
ll righ
ts res
erved
.ISBN : 8
1-314
-0227
-4 Ref.
No.
MACWB 04
2004
04
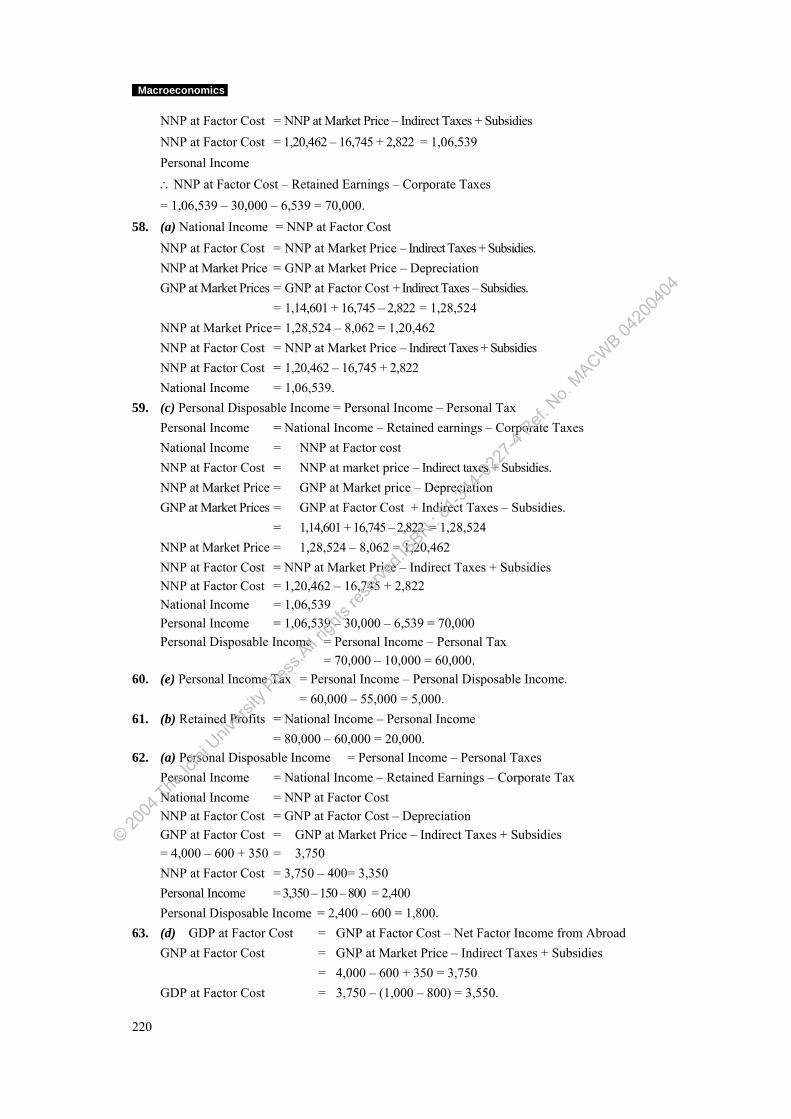
Macroeconomics
220
NNP at Factor Cost = NNP at Market Price – Indirect Taxes + Subsidies NNP at Factor Cost = 1,20,462 – 16,745 + 2,822 = 1,06,539 Personal Income ∴NNP at Factor Cost – Retained Earnings – Corporate Taxes = 1,06,539 – 30,000 – 6,539 = 70,000. 58. (a) National Income = NNP at Factor Cost NNP at Factor Cost = NNP at Market Price – Indirect Taxes + Subsidies. NNP at Market Price = GNP at Market Price – Depreciation GNP at Market Prices = GNP at Factor Cost + Indirect Taxes – Subsidies. = 1,14,601 + 16,745 – 2,822 = 1,28,524 NNP at Market Price = 1,28,524 – 8,062 = 1,20,462 NNP at Factor Cost = NNP at Market Price – Indirect Taxes + Subsidies NNP at Factor Cost = 1,20,462 – 16,745 + 2,822 National Income = 1,06,539. 59. (c) Personal Disposable Income = Personal Income – Personal Tax Personal Income = National Income – Retained earnings – Corporate Taxes National Income = NNP at Factor cost NNP at Factor Cost = NNP at market price – Indirect taxes + Subsidies. NNP at Market Price = GNP at Market price – Depreciation GNP at Market Prices = GNP at Factor Cost + Indirect Taxes – Subsidies. = 1,14,601 + 16,745 – 2,822 = 1,28,524 NNP at Market Price = 1,28,524 – 8,062 = 1,20,462 NNP at Factor Cost = NNP at Market Price – Indirect Taxes + Subsidies NNP at Factor Cost = 1,20,462 – 16,745 + 2,822 National Income = 1,06,539 Personal Income = 1,06,539 – 30,000 – 6,539 = 70,000 Personal Disposable Income = Personal Income – Personal Tax = 70,000 – 10,000 = 60,000. 60. (e) Personal Income Tax = Personal Income – Personal Disposable Income. = 60,000 – 55,000 = 5,000. 61. (b) Retained Profits = National Income – Personal Income = 80,000 – 60,000 = 20,000. 62. (a) Personal Disposable Income = Personal Income – Personal Taxes Personal Income = National Income – Retained Earnings – Corporate Tax National Income = NNP at Factor Cost NNP at Factor Cost = GNP at Factor Cost – Depreciation GNP at Factor Cost = GNP at Market Price – Indirect Taxes + Subsidies = 4,000 – 600 + 350 = 3,750 NNP at Factor Cost = 3,750 – 400 = 3,350 Personal Income = 3,350 – 150 – 800 = 2,400 Personal Disposable Income = 2,400 – 600 = 1,800. 63. (d) GDP at Factor Cost = GNP at Factor Cost – Net Factor Income from Abroad GNP at Factor Cost = GNP at Market Price – Indirect Taxes + Subsidies = 4,000 – 600 + 350 = 3,750 GDP at Factor Cost = 3,750 – (1,000 – 800) = 3,550.
© 2004
The Ic
fai U
nivers
ity P
ress.A
ll righ
ts res
erved
.ISBN : 8
1-314
-0227
-4 Ref.
No.
MACWB 04
2004
04
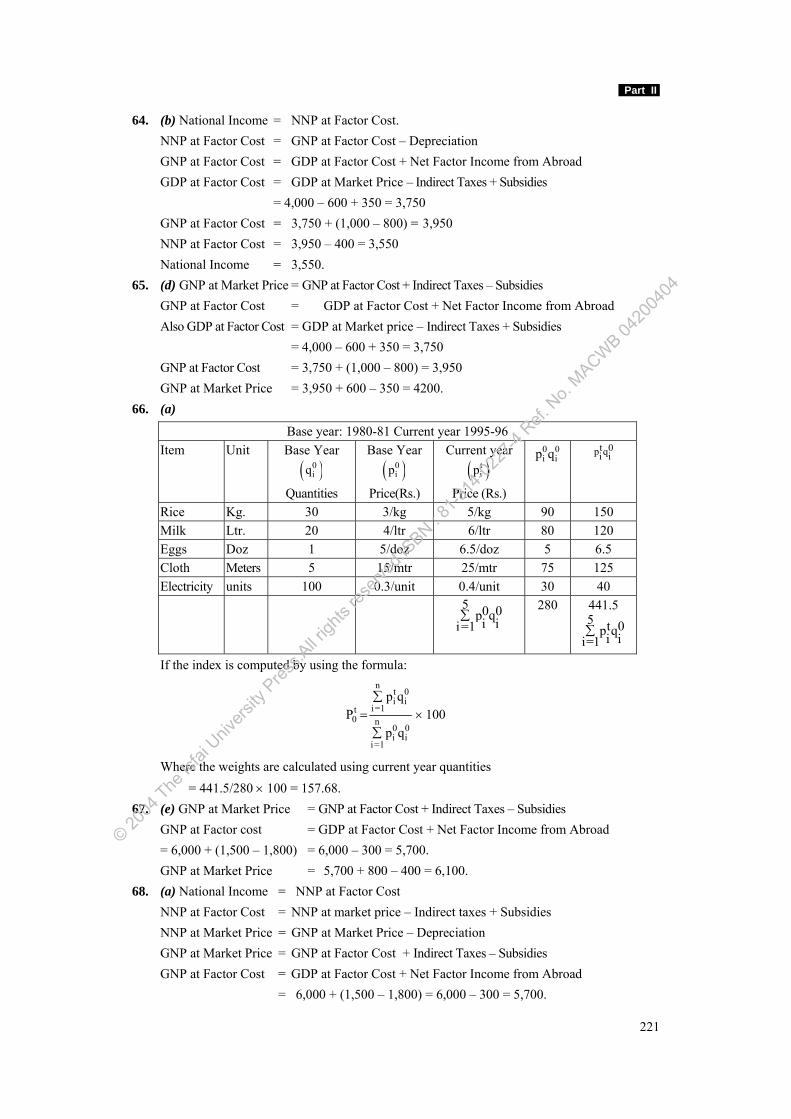
Part II
221
64. (b) National Income = NNP at Factor Cost. NNP at Factor Cost = GNP at Factor Cost – Depreciation GNP at Factor Cost = GDP at Factor Cost + Net Factor Income from Abroad GDP at Factor Cost = GDP at Market Price – Indirect Taxes + Subsidies = 4,000 – 600 + 350 = 3,750 GNP at Factor Cost = 3,750 + (1,000 – 800) = 3,950 NNP at Factor Cost = 3,950 – 400 = 3,550 National Income = 3,550. 65. (d) GNP at Market Price = GNP at Factor Cost + Indirect Taxes – Subsidies GNP at Factor Cost = GDP at Factor Cost + Net Factor Income from Abroad Also GDP at Factor Cost = GDP at Market price – Indirect Taxes + Subsidies = 4,000 – 600 + 350 = 3,750 GNP at Factor Cost = 3,750 + (1,000 – 800) = 3,950 GNP at Market Price = 3,950 + 600 – 350 = 4200. 66. (a)
Base year: 1980-81 Current year 1995-96 Item Unit Base Year
( )0iq
Quantities
Base Year ( )0
ip
Price(Rs.)
Current year ( )t
ip
Price (Rs.)
0 0i ip q t 0p qi i
Rice Kg. 30 3/kg 5/kg 90 150 Milk Ltr. 20 4/ltr 6/ltr 80 120 Eggs Doz 1 5/doz 6.5/doz 5 6.5 Cloth Meters 5 15/mtr 25/mtr 75 125 Electricity units 100 0.3/unit 0.4/unit 30 40 5 0 0p qi ii=1
∑ 280 441.5
5 t 0p qi ii=1∑
If the index is computed by using the formula: n
t 0i i
i=1t0 n
0 0i i
i=1
p qP 100
p q
∑= ×
∑
Where the weights are calculated using current year quantities = 441.5/280 × 100 = 157.68. 67. (e) GNP at Market Price = GNP at Factor Cost + Indirect Taxes – Subsidies GNP at Factor cost = GDP at Factor Cost + Net Factor Income from Abroad = 6,000 + (1,500 – 1,800) = 6,000 – 300 = 5,700. GNP at Market Price = 5,700 + 800 – 400 = 6,100. 68. (a) National Income = NNP at Factor Cost NNP at Factor Cost = NNP at market price – Indirect taxes + Subsidies NNP at Market Price = GNP at Market Price – Depreciation GNP at Market Price = GNP at Factor Cost + Indirect Taxes – Subsidies GNP at Factor Cost = GDP at Factor Cost + Net Factor Income from Abroad = 6,000 + (1,500 – 1,800) = 6,000 – 300 = 5,700.
© 2004
The Ic
fai U
nivers
ity P
ress.A
ll righ
ts res
erved
.ISBN : 8
1-314
-0227
-4 Ref.
No.
MACWB 04
2004
04
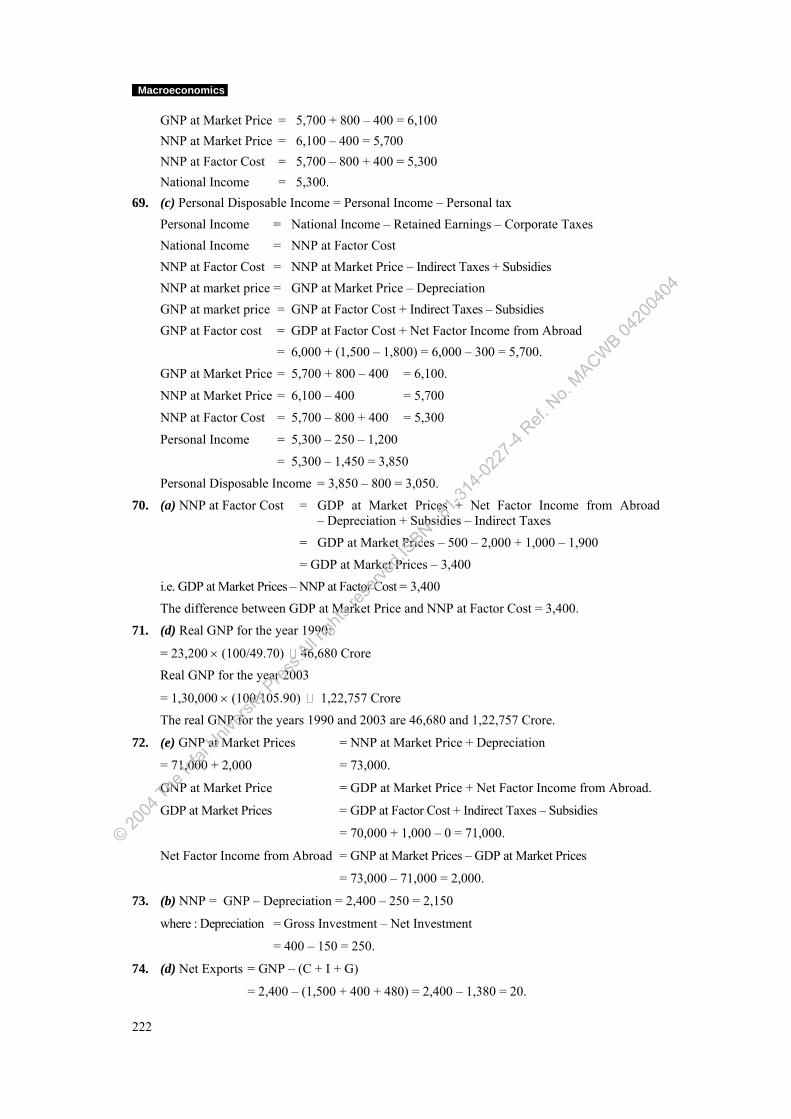
Macroeconomics
222
GNP at Market Price = 5,700 + 800 – 400 = 6,100 NNP at Market Price = 6,100 – 400 = 5,700 NNP at Factor Cost = 5,700 – 800 + 400 = 5,300 National Income = 5,300. 69. (c) Personal Disposable Income = Personal Income – Personal tax Personal Income = National Income – Retained Earnings – Corporate Taxes National Income = NNP at Factor Cost NNP at Factor Cost = NNP at Market Price – Indirect Taxes + Subsidies NNP at market price = GNP at Market Price – Depreciation GNP at market price = GNP at Factor Cost + Indirect Taxes – Subsidies GNP at Factor cost = GDP at Factor Cost + Net Factor Income from Abroad = 6,000 + (1,500 – 1,800) = 6,000 – 300 = 5,700. GNP at Market Price = 5,700 + 800 – 400 = 6,100.
NNP at Market Price = 6,100 – 400 = 5,700
NNP at Factor Cost = 5,700 – 800 + 400 = 5,300
Personal Income = 5,300 – 250 – 1,200
= 5,300 – 1,450 = 3,850
Personal Disposable Income = 3,850 – 800 = 3,050.
70. (a) NNP at Factor Cost = GDP at Market Prices + Net Factor Income from Abroad – Depreciation + Subsidies – Indirect Taxes
= GDP at Market Prices – 500 – 2,000 + 1,000 – 1,900
= GDP at Market Prices – 3,400
i.e. GDP at Market Prices – NNP at Factor Cost = 3,400
The difference between GDP at Market Price and NNP at Factor Cost = 3,400.
71. (d) Real GNP for the year 1990:
= 23,200 × (100/49.70) 46,680 Crore
Real GNP for the year 2003
= 1,30,000 × (100/105.90) 1,22,757 Crore
The real GNP for the years 1990 and 2003 are 46,680 and 1,22,757 Crore.
72. (e) GNP at Market Prices = NNP at Market Price + Depreciation
= 71,000 + 2,000 = 73,000.
GNP at Market Price = GDP at Market Price + Net Factor Income from Abroad.
GDP at Market Prices = GDP at Factor Cost + Indirect Taxes – Subsidies
= 70,000 + 1,000 – 0 = 71,000.
Net Factor Income from Abroad = GNP at Market Prices – GDP at Market Prices
= 73,000 – 71,000 = 2,000.
73. (b) NNP = GNP – Depreciation = 2,400 – 250 = 2,150
where : Depreciation = Gross Investment – Net Investment
= 400 – 150 = 250.
74. (d) Net Exports = GNP – (C + I + G)
= 2,400 – (1,500 + 400 + 480) = 2,400 – 1,380 = 20.
© 2004
The Ic
fai U
nivers
ity P
ress.A
ll righ
ts res
erved
.ISBN : 8
1-314
-0227
-4 Ref.
No.
MACWB 04
2004
04
Part II
223
75. (c) Net Indirect Taxes = NNP – National Income. NNP = GNP – Depreciation = 2,400 – 250 = 2,150 Depreciation = Gross investment – Net investment = 400 – 150 = 250 Net Indirect Taxes = 2,150 – 1,925 = 225. 76. (a) Corporate Profits = National Income – (Wages and Salaries + Proprietor’s Income + Rental Income + Net Interest) = 1,925 – (1,460 + 160 + 60) = 1,925 – 1,680 = 245. 77. (e) Taxes – Transfers = Gross Purchases + Budget Surplus = 480 + 15 = 495. 78. (c) Personal Income = National Income – Corporate Profits + Transfer Payments + Dividends = (1,925 – 245) + 260 + 50 = 1,990 Corporate Profits = National Income – (Wages and Salaries + Proprietor’s Income +
Rental Income + Net Interest) = 1,925 – (1,460 + 160 + 60) = 1,925 – 1,680 = 245. 79. (b) Personal Disposable Income = Personal Income – Personal Taxes and Non-Tax Payments. Personal Income = National Income – Corporate Profits + Transfer Payments + Dividends. = (1,925 – 245) + 260 + 50 = 1,990 Personal Disposable Income = 1,990 – 300 = 1,690. 80. (a) Personal Saving = Personal Disposable Income – Consumption. Personal Disposable Income = Personal Income – Personal taxes and Non-tax Payments. Personal Income = National Income – Corporate Profits + Transfer
Payments + Dividends. = (1,925 – 245) + 260 + 50 = 1,990 Personal Disposable Income = 1,990 – 300 = 1,690 Personal Savings = 1,690 – 1,500 = 190. 81. (e) Since National Income is the total of Final Sales, inter-industry transactions would be
ignored. Final sales of A = 100 – (25 + 40 + 15) = 20 Final sales of B = 100 – (10 + 30 + 25) = 55 Final sales of C = 80 – (15 + 20 + 30) = 15 Total = 90
82. (c) The Total Output of B = 120. Output from A and C and Captive Consumption = 40 + 30 + 20 = 90. Value added = 120 – 90 = 30. 83. (e) Given saving – Income Ratio = 0.24 = 24% Incremental Capital – Output Ratio = 6% ∴Rate of growth of national income = Saving – Income Ratio/Incremental Capital – Output Ratio = 24% / 6% = 4% Rate of growth of Per Capita Income = Rate of growth of National Income – Rate of Growth of Population. = 4 – 3 =1%. 84. (c) Growth rate of real output = 6% Elasticity of money demand = 0.5 Growth in money stock needed in the economy to reach long run equilibrium = 6 × 0.5 = 3%
© 2004
The Ic
fai U
nivers
ity P
ress.A
ll righ
ts res
erved
.ISBN : 8
1-314
-0227
-4 Ref.
No.
MACWB 04
2004
04
Macroeconomics
224
Actual growth rate in nominal supply of money = 5% Rate of inflation in long run equilibrium = 5% – 3% = 2% Rate of growth of Nominal Income = Real Growth in Output + Rate of Inflation = 6% + 2% = 8%. 85. (b) The National Income in the economy = Total Final Output in the economy = Sales to Household Sector. The Sales to Household Sector by X, Y, and Z industries are as follows: X = 200 – (50 + 80 + 30) = 40 Y = 240 – (20 + 60 + 50) = 110 Z = 160 – (30 + 40 + 60) = 30 National Income = 40 + 110 + 30 = 180. 86. (e) Value added in Industry Y = Output of Y – Input from the other industries. = 240 – (80 + 60 + 40) = 240 – 180 = 60. 87. (d) GDP at factor cost = Factor Income received by personal sector from business sector and Government Sector
+ Savings of Business Sector + Profit Tax Paid by Business + Dividends paid Abroad. = 1,064 + 64 + 104 +30 = 1,262. 88. (a) GNP at Factor Cost = GDP at Factor Cost + Net Factor Income from Abroad GDP at Factor Cost = Factor Income Received by Personal Sector from Business Sector and Government Sector
+ Savings of Business Sector + Profit Tax Paid by Business + Dividends paid Abroad. = 1,064 + 64 + 104 +30 = 1,262 GNP at Factor Cost = 1,262 + (– 30) = 1,232 GNP at Factor Cost. 89. (e) GNP at Market Price = GNP at FC + Indirect Taxes – Subsidies GNP at Factor Cost = GDP at Factor Cost + Net Factor Income from Abroad GDP at Factor Cost = Factor Income Received by Personal Sector from Business Sector and Government Sector
+ Savings of Business Sector + Profit Tax Paid by Business + Dividends paid Abroad. = 1,064 + 64 + 104 + 30 = 1,262 GNP at Factor Cost = 1,262 + (– 30) = 1,232 GNP at Market Price = 1,232 + 130 – 0 = 1,362. 90. (a) GDP at Market Price = GDP at FC + Indirect Taxes – Subsidies. GDP at Factor Cost = Factor Income Received by Personal Sector from Business
Sector and Government Sector + Savings of Business Sector + Profit Tax paid by Business + Dividends paid Abroad.
= 1,064 + 64 + 104 +30 = 1,262 GDP at Market Price = 1,262 + 130 – 0 = 1,392. 91. (c) Personal Disposable Income = Personal Income – Personal Taxes + Transfer Payments
– Personal Taxes = 1,064 – 168 + 16 = 912. 92. (e) Depreciation = GNP at Market Price – NNP at Market Prices = 1,07,000 – 1,00,000 = 7,000. 93. (d) Net Factor Income from Abroad = NNP at Market Price – NDP at MP = 1,00,000 – 1,00,422 = – 422.
© 2004
The Ic
fai U
nivers
ity P
ress.A
ll righ
ts res
erved
.ISBN : 8
1-314
-0227
-4 Ref.
No.
MACWB 04
2004
04
Part II
225
94. (a) Subsidies = GNP at FC + Indirect Taxes – GNP at Market Prices = 95,000 + 14,000 – 1,07,000 = 2,000. 95. (b) NDP at Factor Cost = NDP at Market Price – Indirect Taxes + Subsidies. Subsidies = GNP at FC + Indirect Taxes – GNP at Market Prices. = 95,000 + 14,000 – 1,07,000 = 2,000 NDP at FC = 1, 00,422 – 14,000 + 2,000 = 88,422. 96. (e) National Income = NNP at Factor Cost. NNP at Factor Cost = NNP at Market Price – Indirect Taxes + Subsidies. Subsidies = GNP at FC + Indirect Taxes – GNP at Market Prices = 95,000 + 14,000 – 1,07,000 = 2,000. = 1,00,000 – 14,000 + 2,000 National Income = 88,000. 97. (a) Personal Income = National Income – Corporate Profit Tax – Retained Profit. National Income = NNP at Factor Cost. NNP at Factor Cost = NNP at Market Price – Indirect Taxes + Subsidies. Subsidies = GNP at FC + Indirect Taxes – GNP at Market Prices. = 95,000 + 14,000 – 1,07,000 = 2,000 = 1,00,000 – 14,000 + 2,000 National Income = 88,000 Personal Income = 88,000 – 6,500 – 30,000 = 51,500. 98. (c) Personal Disposable Income = Personal Income – Personal Income Tax. Personal Income = National Income – Corporate Profit Tax – Retained Profit National income = NNP at Factor Cost. NNP at Factor Cost = NNP at Market Price – Indirect taxes + Subsidies. Subsidies = GNP at FC + Indirect Taxes – GNP at Market Prices. = 95,000 + 14,000 – 1,07,000 = 2,000 = 1,00,000 – 14,000 + 2,000 National Income = 88,000 Personal Income = 88,000 – 6,500 – 30,000 = 51,500 Personal Disposable Income = 51,500 – 10,000 = 41,500. 99. (d) GNP at Market Price = NNP at Factor Cost + Depreciation – Subsidies + Indirect Taxes. = 4,73,246 +61,809 – 19,431 + 87,043 = 6,02,667. 100. (a) NNP at Market Price = GNP at MP – Depreciation. GNP at Market Price = NNP at Factor Cost + Depreciation – Subsidies + Indirect taxes. = 4,73,246 + 61,809 – 19,431 + 87,043 = 6,02,667 NNP at Market Price = 6,02,667 – 61,809 = 5,40,858. 101. (e) NDP at Market Price
= NNP at MP – Net Factor Income from Abroad
NNP at Market Price = GNP at MP – Depreciation.
GNP at Market Price = NNP at Factor Cost + Depreciation – Subsidies + Indirect taxes.
= 4,73,246 +61,809 – 19,431 + 87,043 = 6,02,667.
NNP at Market Price = 6,02,667 – 61,809 = 5,40,858.
NDP at Market Price = 5,40,858 – (– 6,833) = 5,47,691.
© 2004
The Ic
fai U
nivers
ity P
ress.A
ll righ
ts res
erved
.ISBN : 8
1-314
-0227
-4 Ref.
No.
MACWB 04
2004
04
Macroeconomics
226
102. (b) NDP at Factor Cost = NNP at FC – Net Factor Income from Abroad. = 4,73,246 – (– 6,833) = 4,80,079. 103. (d) GNP at Factor Cost = NNP at FC + Depreciation. = 4,73,246 + 61,809 = 5,35,055. 104. (a) Personal Disposable Income = Personal Income – Personal Income Tax. Personal Income = 4,73,246 – 7,300 – 6,758 = 4,59,188 Personal Disposable Income = 4,59,188 – 9,759 = 4,49,429. 105. (c) GNP at MP = GNP at FC + Indirect Taxes – Subsidies. (OR) GNP at MP = NNP at MP + Depreciation = 1,70,992 + 11,888 = 1,82,880 Thus, GNP at MP = 1,79,930 + X – 588 1,82,880 = 1,79,930 + X – 588 X = 3,538 Thus the Indirect Taxes = 3,538 GDP at FC = NDP at FC + Depreciation = 1,64,182 + 11,888 = 1,76,070 GNP at FC = GDP at FC + Net Factor Income from Abroad 1,79,930 = 1,76,070 + X X = 3,860. Hence Net Factor Income from Abroad = 3,860. 106. (a) GDP at FC
= Wages and Salaries from Business + Dividends + Wages and Salaries from Govt. Sector + Profit Tax + Retained Profit.
= 447 + 60 + 40 + 52 + 32 = 631. 107. (c) GNP at Factor Cost = GDP at FC + Net Factor Income from Abroad. GDP at FC = Wages and Salaries from Business + Dividends + Wages and Salaries from
Govt. Sector + Profit Tax + Retained Profit. = 447 + 60 + 40 + 52 + 32 = 631 GNP at FC = 631 + (– 15) = 616.
108. (e) GNP at Market Price
= GNP at FC + Indirect Taxes – Subsidies
GNP at FC = GDP at FC + Net Factor Income from Abroad
GDP at FC = Wages and Salaries from Business + Dividends + Wages and Salaries from Govt. Sector + Profit Tax + Retained Profit.
= 447 + 60 + 40 + 52 + 32 = 631
GNP at FC = 631 + (– 15) = 616
GNP at MP = 616 + 65 – 0 = 681.
109. (c) GDP at MP = GDP at Factor Cost +Indirect Taxes – Subsidies.
GDP at FC = Wages and Salaries from Business + Dividends + Wages and Salaries from Govt. Sector + Profit Tax + Retained Profit.
= 447 + 60 + 40 + 52 + 32 = 631
GDP at MP = 631 + 65 – 0 = 696
© 2004
The Ic
fai U
nivers
ity P
ress.A
ll righ
ts res
erved
.ISBN : 8
1-314
-0227
-4 Ref.
No.
MACWB 04
2004
04
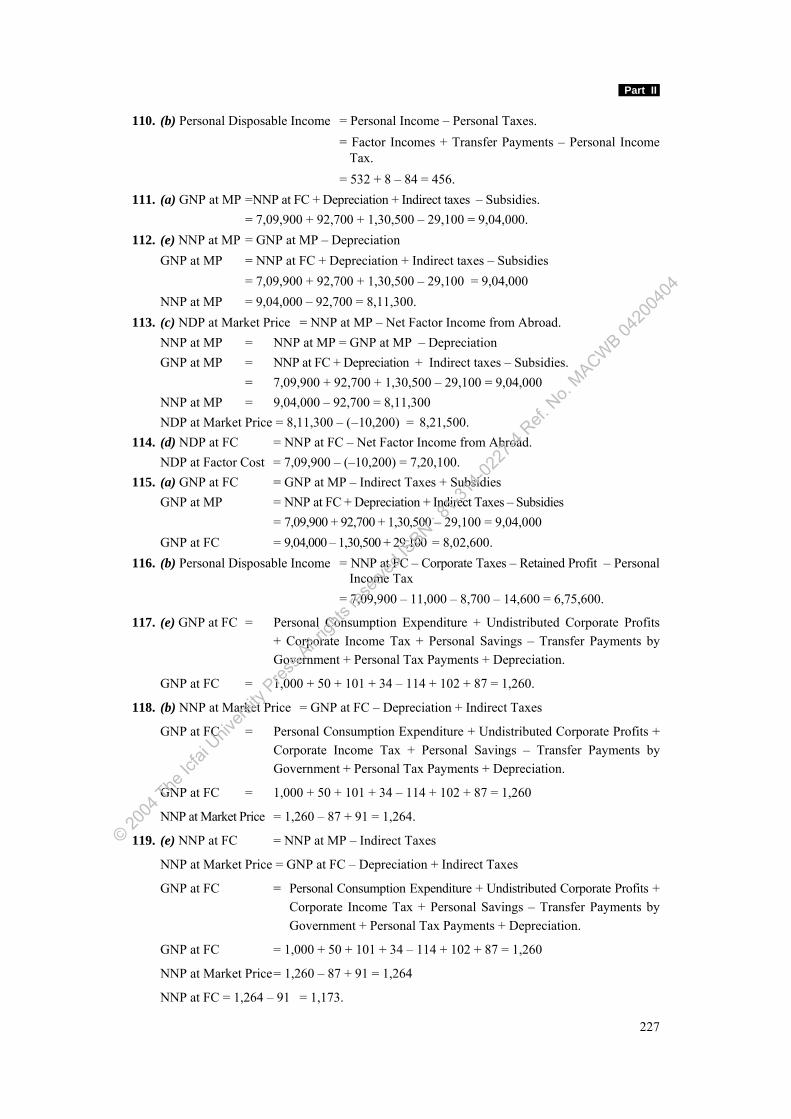
Part II
227
110. (b) Personal Disposable Income = Personal Income – Personal Taxes. = Factor Incomes + Transfer Payments – Personal Income
Tax. = 532 + 8 – 84 = 456. 111. (a) GNP at MP =NNP at FC + Depreciation + Indirect taxes – Subsidies. = 7,09,900 + 92,700 + 1,30,500 – 29,100 = 9,04,000. 112. (e) NNP at MP = GNP at MP – Depreciation GNP at MP = NNP at FC + Depreciation + Indirect taxes – Subsidies = 7,09,900 + 92,700 + 1,30,500 – 29,100 = 9,04,000 NNP at MP = 9,04,000 – 92,700 = 8,11,300. 113. (c) NDP at Market Price = NNP at MP – Net Factor Income from Abroad. NNP at MP = NNP at MP = GNP at MP – Depreciation GNP at MP = NNP at FC + Depreciation + Indirect taxes – Subsidies. = 7,09,900 + 92,700 + 1,30,500 – 29,100 = 9,04,000 NNP at MP = 9,04,000 – 92,700 = 8,11,300 NDP at Market Price = 8,11,300 – (–10,200) = 8,21,500. 114. (d) NDP at FC = NNP at FC – Net Factor Income from Abroad. NDP at Factor Cost = 7,09,900 – (–10,200) = 7,20,100. 115. (a) GNP at FC = GNP at MP – Indirect Taxes + Subsidies GNP at MP = NNP at FC + Depreciation + Indirect Taxes – Subsidies = 7,09,900 + 92,700 + 1,30,500 – 29,100 = 9,04,000 GNP at FC = 9,04,000 – 1,30,500 + 29,100 = 8,02,600. 116. (b) Personal Disposable Income = NNP at FC – Corporate Taxes – Retained Profit – Personal
Income Tax = 7,09,900 – 11,000 – 8,700 – 14,600 = 6,75,600.
117. (e) GNP at FC = Personal Consumption Expenditure + Undistributed Corporate Profits + Corporate Income Tax + Personal Savings – Transfer Payments by Government + Personal Tax Payments + Depreciation.
GNP at FC = 1,000 + 50 + 101 + 34 – 114 + 102 + 87 = 1,260.
118. (b) NNP at Market Price = GNP at FC – Depreciation + Indirect Taxes
GNP at FC = Personal Consumption Expenditure + Undistributed Corporate Profits + Corporate Income Tax + Personal Savings – Transfer Payments by Government + Personal Tax Payments + Depreciation.
GNP at FC = 1,000 + 50 + 101 + 34 – 114 + 102 + 87 = 1,260
NNP at Market Price = 1,260 – 87 + 91 = 1,264.
119. (e) NNP at FC = NNP at MP – Indirect Taxes
NNP at Market Price = GNP at FC – Depreciation + Indirect Taxes
GNP at FC = Personal Consumption Expenditure + Undistributed Corporate Profits + Corporate Income Tax + Personal Savings – Transfer Payments by Government + Personal Tax Payments + Depreciation.
GNP at FC = 1,000 + 50 + 101 + 34 – 114 + 102 + 87 = 1,260
NNP at Market Price = 1,260 – 87 + 91 = 1,264
NNP at FC = 1,264 – 91 = 1,173.
© 2004
The Ic
fai U
nivers
ity P
ress.A
ll righ
ts res
erved
.ISBN : 8
1-314
-0227
-4 Ref.
No.
MACWB 04
2004
04
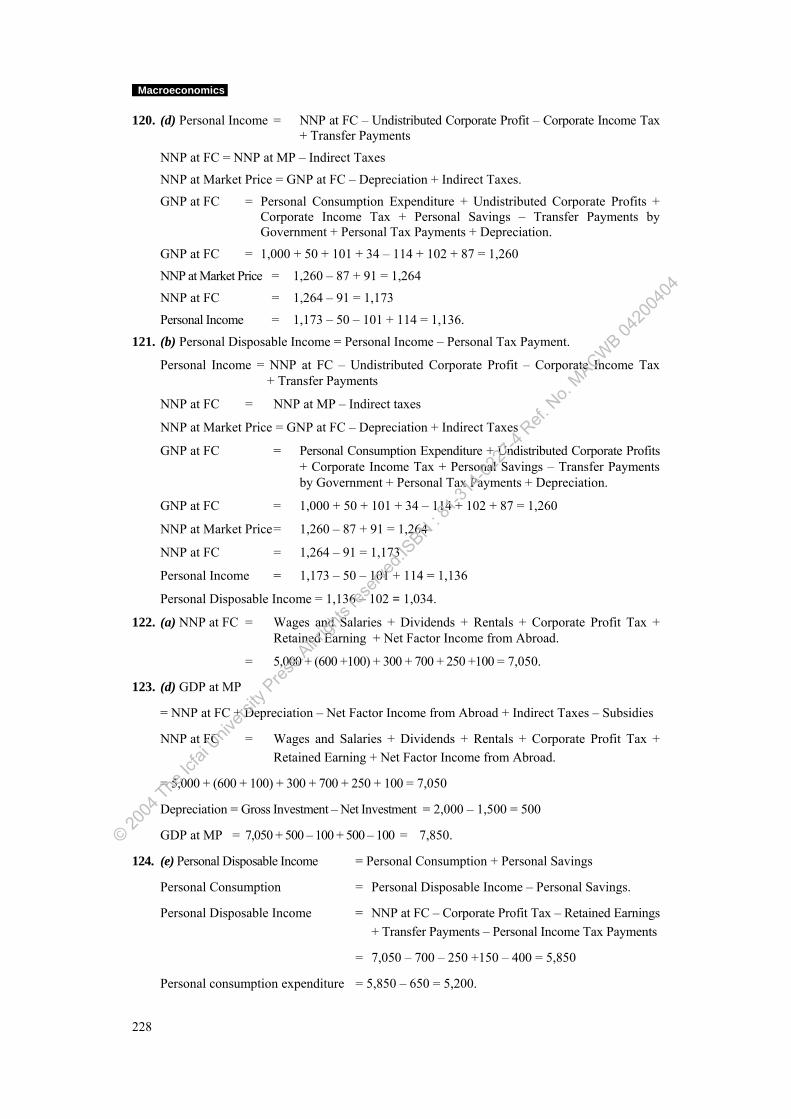
Macroeconomics
228
120. (d) Personal Income = NNP at FC – Undistributed Corporate Profit – Corporate Income Tax + Transfer Payments
NNP at FC = NNP at MP – Indirect Taxes
NNP at Market Price = GNP at FC – Depreciation + Indirect Taxes.
GNP at FC = Personal Consumption Expenditure + Undistributed Corporate Profits + Corporate Income Tax + Personal Savings – Transfer Payments by Government + Personal Tax Payments + Depreciation.
GNP at FC = 1,000 + 50 + 101 + 34 – 114 + 102 + 87 = 1,260
NNP at Market Price = 1,260 – 87 + 91 = 1,264
NNP at FC = 1,264 – 91 = 1,173
Personal Income = 1,173 – 50 – 101 + 114 = 1,136.
121. (b) Personal Disposable Income = Personal Income – Personal Tax Payment.
Personal Income = NNP at FC – Undistributed Corporate Profit – Corporate Income Tax + Transfer Payments
NNP at FC = NNP at MP – Indirect taxes
NNP at Market Price = GNP at FC – Depreciation + Indirect Taxes
GNP at FC = Personal Consumption Expenditure + Undistributed Corporate Profits + Corporate Income Tax + Personal Savings – Transfer Payments by Government + Personal Tax Payments + Depreciation.
GNP at FC = 1,000 + 50 + 101 + 34 – 114 + 102 + 87 = 1,260
NNP at Market Price = 1,260 – 87 + 91 = 1,264
NNP at FC = 1,264 – 91 = 1,173
Personal Income = 1,173 – 50 – 101 + 114 = 1,136
Personal Disposable Income = 1,136 – 102 = 1,034.
122. (a) NNP at FC = Wages and Salaries + Dividends + Rentals + Corporate Profit Tax + Retained Earning + Net Factor Income from Abroad.
= 5,000 + (600 +100) + 300 + 700 + 250 +100 = 7,050.
123. (d) GDP at MP
= NNP at FC + Depreciation – Net Factor Income from Abroad + Indirect Taxes – Subsidies
NNP at FC = Wages and Salaries + Dividends + Rentals + Corporate Profit Tax + Retained Earning + Net Factor Income from Abroad.
= 5,000 + (600 + 100) + 300 + 700 + 250 + 100 = 7,050
Depreciation = Gross Investment – Net Investment = 2,000 – 1,500 = 500
GDP at MP = 7,050 + 500 – 100 + 500 – 100 = 7,850.
124. (e) Personal Disposable Income = Personal Consumption + Personal Savings
Personal Consumption = Personal Disposable Income – Personal Savings.
Personal Disposable Income = NNP at FC – Corporate Profit Tax – Retained Earnings + Transfer Payments – Personal Income Tax Payments
= 7,050 – 700 – 250 +150 – 400 = 5,850
Personal consumption expenditure = 5,850 – 650 = 5,200.
© 2004
The Ic
fai U
nivers
ity P
ress.A
ll righ
ts res
erved
.ISBN : 8
1-314
-0227
-4 Ref.
No.
MACWB 04
2004
04
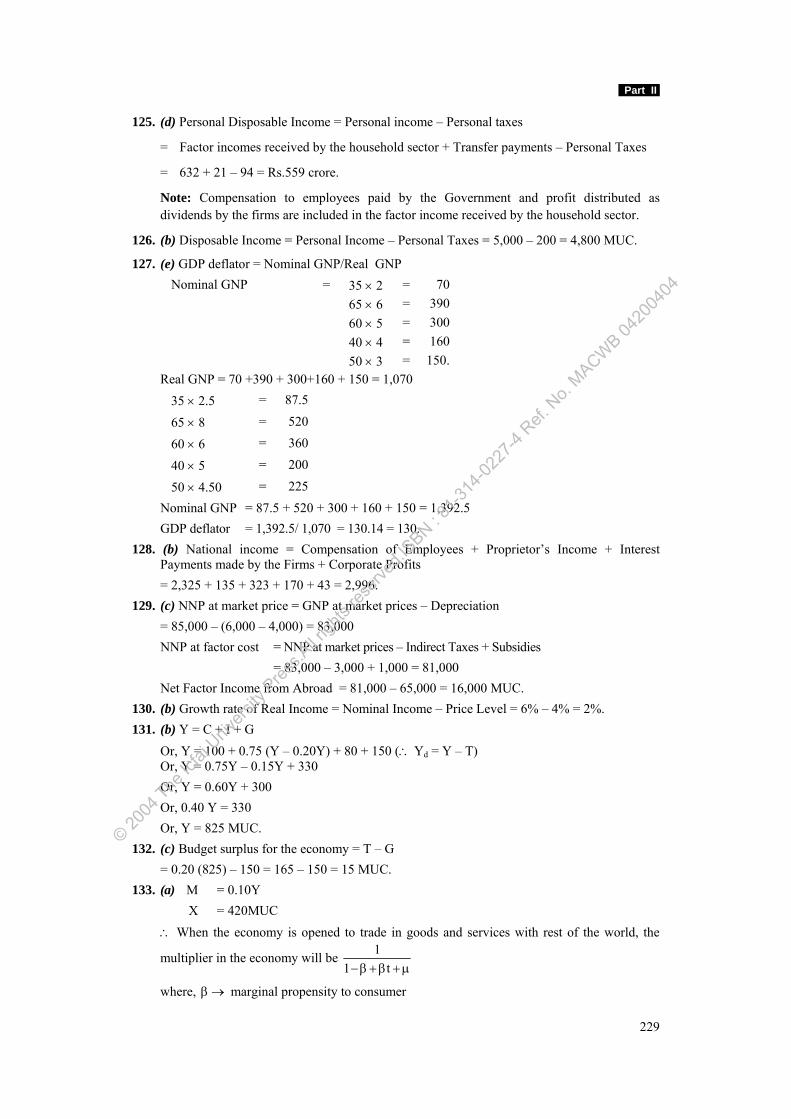
Part II
229
125. (d) Personal Disposable Income = Personal income – Personal taxes
= Factor incomes received by the household sector + Transfer payments – Personal Taxes
= 632 + 21 – 94 = Rs.559 crore.
Note: Compensation to employees paid by the Government and profit distributed as dividends by the firms are included in the factor income received by the household sector.
126. (b) Disposable Income = Personal Income – Personal Taxes = 5,000 – 200 = 4,800 MUC.
127. (e) GDP deflator = Nominal GNP/Real GNP Nominal GNP = 35 × 2 = 70 65 × 6 = 390 60 × 5 = 300 40 × 4 = 160 50 × 3 = 150.
Real GNP = 70 +390 + 300+160 + 150 = 1,070 35 × 2.5 = 87.5
65 × 8 = 520
60 × 6 = 360
40 × 5 = 200
50 × 4.50 = 225 Nominal GNP = 87.5 + 520 + 300 + 160 + 150 = 1,392.5 GDP deflator = 1,392.5/ 1,070 = 130.14 = 130. 128. (b) National income = Compensation of Employees + Proprietor’s Income + Interest
Payments made by the Firms + Corporate Profits = 2,325 + 135 + 323 + 170 + 43 = 2,996. 129. (c) NNP at market price = GNP at market prices – Depreciation = 85,000 – (6,000 – 4,000) = 83,000 NNP at factor cost = NNP at market prices – Indirect Taxes + Subsidies = 83,000 – 3,000 + 1,000 = 81,000 Net Factor Income from Abroad = 81,000 – 65,000 = 16,000 MUC. 130. (b) Growth rate of Real Income = Nominal Income – Price Level = 6% – 4% = 2%. 131. (b) Y = C + I + G Or, Y = 100 + 0.75 (Y – 0.20Y) + 80 + 150 (∴ Yd = Y – T) Or, Y = 0.75Y – 0.15Y + 330 Or, Y = 0.60Y + 300 Or, 0.40 Y = 330 Or, Y = 825 MUC. 132. (c) Budget surplus for the economy = T – G = 0.20 (825) – 150 = 165 – 150 = 15 MUC. 133. (a) M = 0.10Y X = 420MUC ∴ When the economy is opened to trade in goods and services with rest of the world, the
multiplier in the economy will be 11 t− β + β + μ
where, β → marginal propensity to consumer
© 2004
The Ic
fai U
nivers
ity P
ress.A
ll righ
ts res
erved
.ISBN : 8
1-314
-0227
-4 Ref.
No.
MACWB 04
2004
04
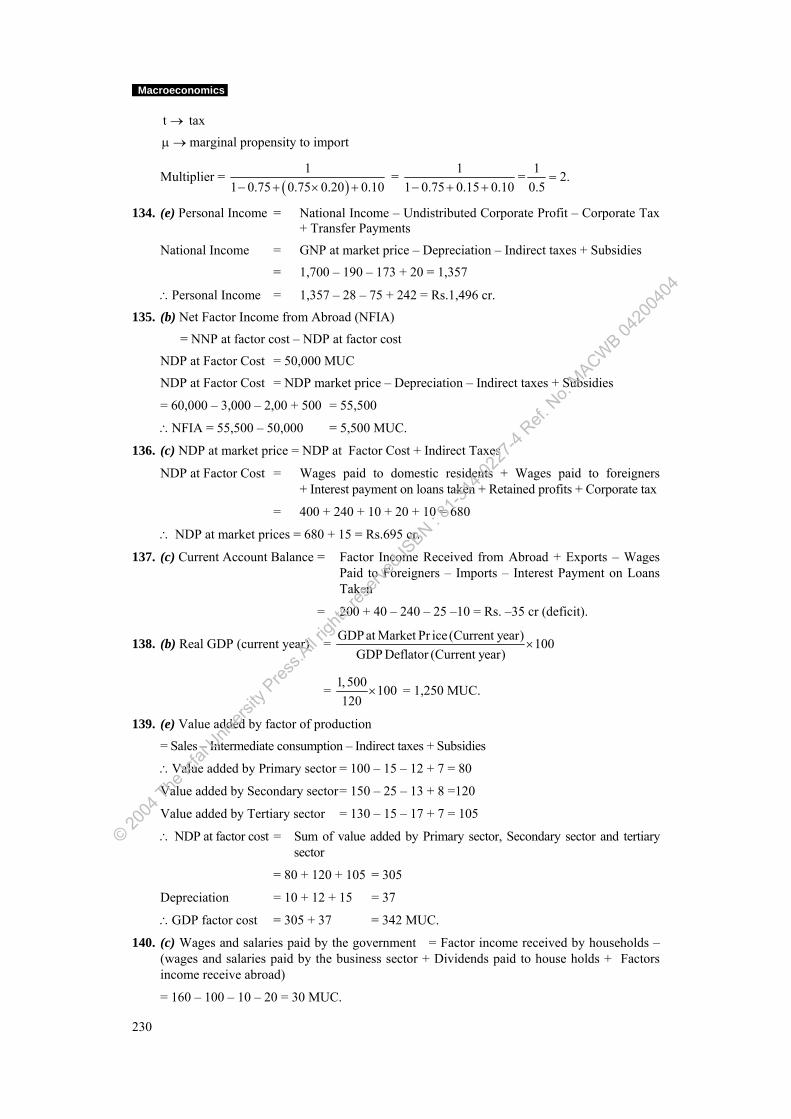
Macroeconomics
230
t → tax μ → marginal propensity to import
Multiplier = ( )
11 0.75 0.75 0.20 0.10− + × +
= 11 0.75 0.15 0.10− + +
= 1 2.0.5
=
134. (e) Personal Income = National Income – Undistributed Corporate Profit – Corporate Tax + Transfer Payments
National Income = GNP at market price – Depreciation – Indirect taxes + Subsidies
= 1,700 – 190 – 173 + 20 = 1,357
∴Personal Income = 1,357 – 28 – 75 + 242 = Rs.1,496 cr.
135. (b) Net Factor Income from Abroad (NFIA)
= NNP at factor cost – NDP at factor cost
NDP at Factor Cost = 50,000 MUC
NDP at Factor Cost = NDP market price – Depreciation – Indirect taxes + Subsidies
= 60,000 – 3,000 – 2,00 + 500 = 55,500
∴NFIA = 55,500 – 50,000 = 5,500 MUC.
136. (c) NDP at market price = NDP at Factor Cost + Indirect Taxes
NDP at Factor Cost = Wages paid to domestic residents + Wages paid to foreigners + Interest payment on loans taken + Retained profits + Corporate tax
= 400 + 240 + 10 + 20 + 10 = 680
∴ NDP at market prices = 680 + 15 = Rs.695 cr.
137. (c) Current Account Balance = Factor Income Received from Abroad + Exports – Wages Paid to Foreigners – Imports – Interest Payment on Loans Taken
= 200 + 40 – 240 – 25 –10 = Rs. –35 cr (deficit).
138. (b) Real GDP (current year) = GDP at Market Pr ice (Current year) 100GDP Deflator (Current year)
×
= 1, 500 100120
× = 1,250 MUC.
139. (e) Value added by factor of production
= Sales – Intermediate consumption – Indirect taxes + Subsidies
∴Value added by Primary sector = 100 – 15 – 12 + 7 = 80
Value added by Secondary sector = 150 – 25 – 13 + 8 =120
Value added by Tertiary sector = 130 – 15 – 17 + 7 = 105
∴ NDP at factor cost = Sum of value added by Primary sector, Secondary sector and tertiary sector
= 80 + 120 + 105 = 305
Depreciation = 10 + 12 + 15 = 37
∴GDP factor cost = 305 + 37 = 342 MUC.
140. (c) Wages and salaries paid by the government = Factor income received by households – (wages and salaries paid by the business sector + Dividends paid to house holds + Factors income receive abroad)
= 160 – 100 – 10 – 20 = 30 MUC.
© 2004
The Ic
fai U
nivers
ity P
ress.A
ll righ
ts res
erved
.ISBN : 8
1-314
-0227
-4 Ref.
No.
MACWB 04
2004
04
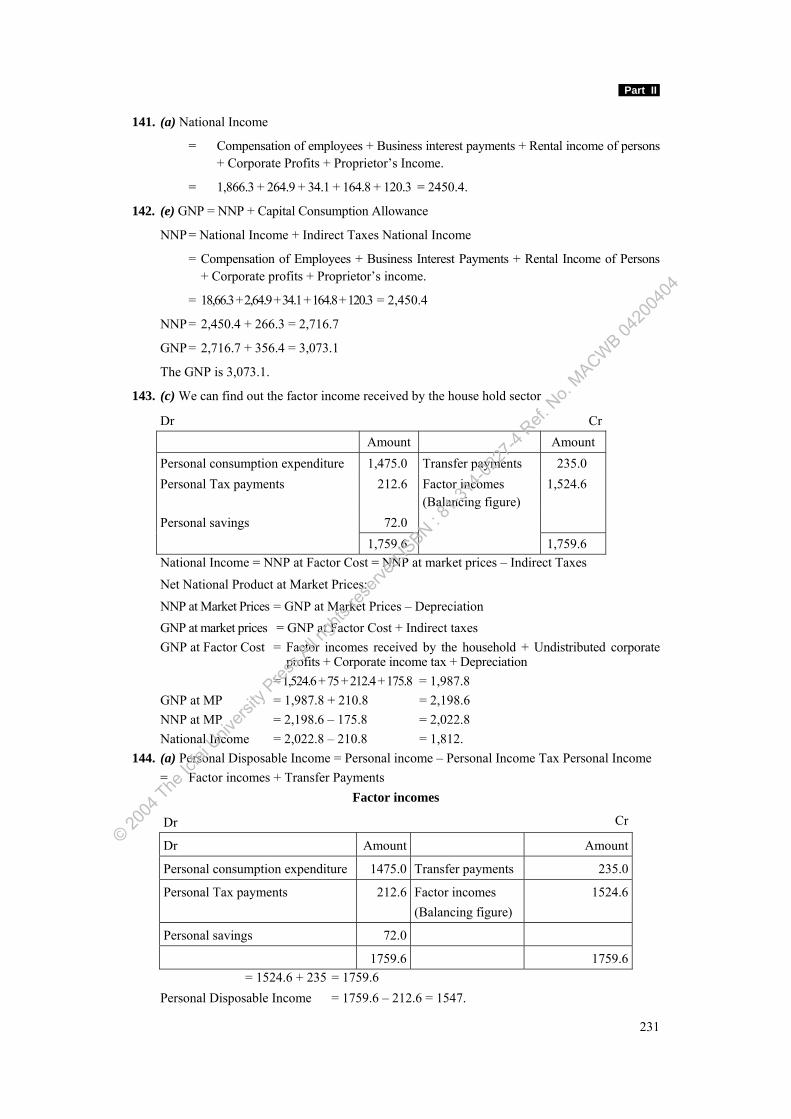
Part II
231
141. (a) National Income
= Compensation of employees + Business interest payments + Rental income of persons + Corporate Profits + Proprietor’s Income.
= 1,866.3 + 264.9 + 34.1 + 164.8 + 120.3 = 2450.4.
142. (e) GNP = NNP + Capital Consumption Allowance
NNP = National Income + Indirect Taxes National Income
= Compensation of Employees + Business Interest Payments + Rental Income of Persons + Corporate profits + Proprietor’s income.
= 18,66.3 + 2,64.9 + 34.1 + 164.8 + 120.3 = 2,450.4
NNP = 2,450.4 + 266.3 = 2,716.7
GNP = 2,716.7 + 356.4 = 3,073.1
The GNP is 3,073.1.
143. (c) We can find out the factor income received by the house hold sector
Dr Cr Amount Amount Personal consumption expenditure 1,475.0 Transfer payments 235.0 Personal Tax payments 212.6 Factor incomes
(Balancing figure) 1,524.6
Personal savings 72.0 1,759.6 1,759.6
National Income = NNP at Factor Cost = NNP at market prices – Indirect Taxes
Net National Product at Market Prices:
NNP at Market Prices = GNP at Market Prices – Depreciation GNP at market prices = GNP at Factor Cost + Indirect taxes GNP at Factor Cost = Factor incomes received by the household + Undistributed corporate
profits + Corporate income tax + Depreciation = 1,524.6 + 75 + 212.4 + 175.8 = 1,987.8 GNP at MP = 1,987.8 + 210.8 = 2,198.6 NNP at MP = 2,198.6 – 175.8 = 2,022.8 National Income = 2,022.8 – 210.8 = 1,812. 144. (a) Personal Disposable Income = Personal income – Personal Income Tax Personal Income = Factor incomes + Transfer Payments
Factor incomes
Dr Cr
Dr Amount Amount
Personal consumption expenditure 1475.0 Transfer payments 235.0
Personal Tax payments 212.6 Factor incomes (Balancing figure)
1524.6
Personal savings 72.0
1759.6 1759.6 = 1524.6 + 235 = 1759.6 Personal Disposable Income = 1759.6 – 212.6 = 1547.
© 2004
The Ic
fai U
nivers
ity P
ress.A
ll righ
ts res
erved
.ISBN : 8
1-314
-0227
-4 Ref.
No.
MACWB 04
2004
04
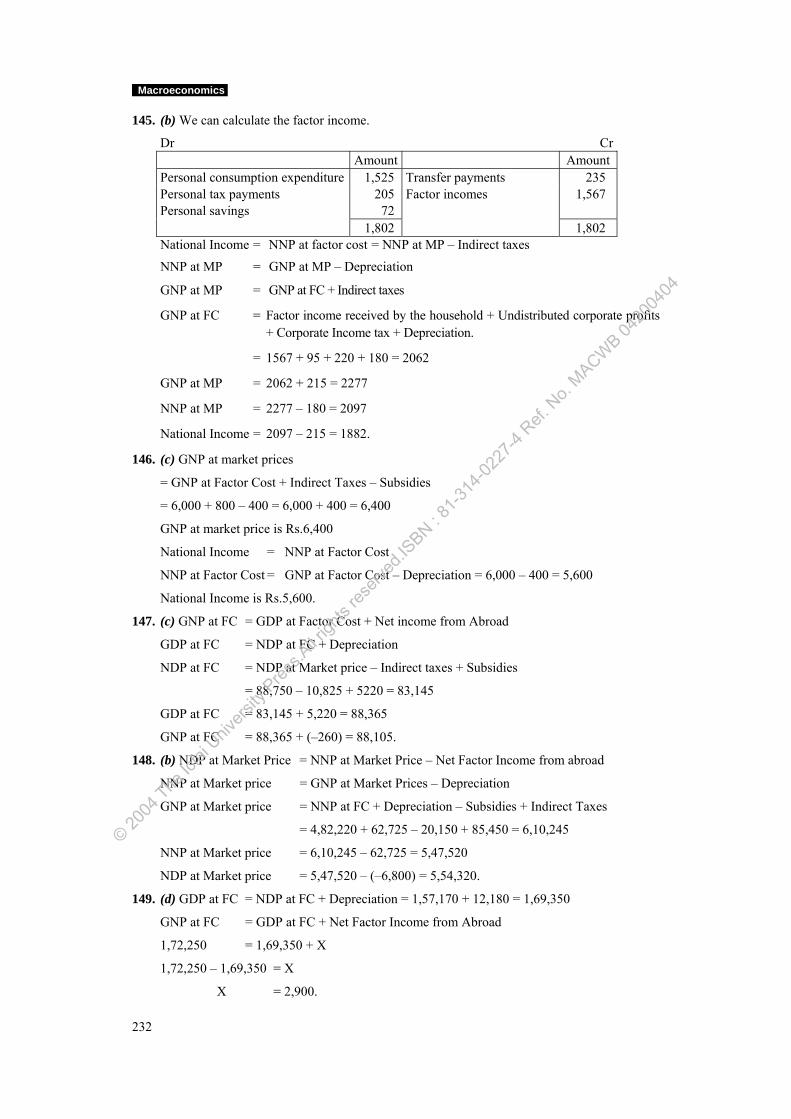
Macroeconomics
232
145. (b) We can calculate the factor income.
Dr Cr Amount Amount Personal consumption expenditure 1,525 Transfer payments 235 Personal tax payments 205 Factor incomes 1,567 Personal savings 72 1,802 1,802
National Income = NNP at factor cost = NNP at MP – Indirect taxes
NNP at MP = GNP at MP – Depreciation
GNP at MP = GNP at FC + Indirect taxes
GNP at FC = Factor income received by the household + Undistributed corporate profits + Corporate Income tax + Depreciation.
= 1567 + 95 + 220 + 180 = 2062
GNP at MP = 2062 + 215 = 2277
NNP at MP = 2277 – 180 = 2097
National Income = 2097 – 215 = 1882.
146. (c) GNP at market prices
= GNP at Factor Cost + Indirect Taxes – Subsidies
= 6,000 + 800 – 400 = 6,000 + 400 = 6,400
GNP at market price is Rs.6,400
National Income = NNP at Factor Cost
NNP at Factor Cost = GNP at Factor Cost – Depreciation = 6,000 – 400 = 5,600
National Income is Rs.5,600.
147. (c) GNP at FC = GDP at Factor Cost + Net income from Abroad
GDP at FC = NDP at FC + Depreciation
NDP at FC = NDP at Market price – Indirect taxes + Subsidies
= 88,750 – 10,825 + 5220 = 83,145
GDP at FC = 83,145 + 5,220 = 88,365
GNP at FC = 88,365 + (–260) = 88,105.
148. (b) NDP at Market Price = NNP at Market Price – Net Factor Income from abroad
NNP at Market price = GNP at Market Prices – Depreciation
GNP at Market price = NNP at FC + Depreciation – Subsidies + Indirect Taxes
= 4,82,220 + 62,725 – 20,150 + 85,450 = 6,10,245
NNP at Market price = 6,10,245 – 62,725 = 5,47,520
NDP at Market price = 5,47,520 – (–6,800) = 5,54,320.
149. (d) GDP at FC = NDP at FC + Depreciation = 1,57,170 + 12,180 = 1,69,350
GNP at FC = GDP at FC + Net Factor Income from Abroad
1,72,250 = 1,69,350 + X
1,72,250 – 1,69,350 = X
X = 2,900.
© 2004
The Ic
fai U
nivers
ity P
ress.A
ll righ
ts res
erved
.ISBN : 8
1-314
-0227
-4 Ref.
No.
MACWB 04
2004
04
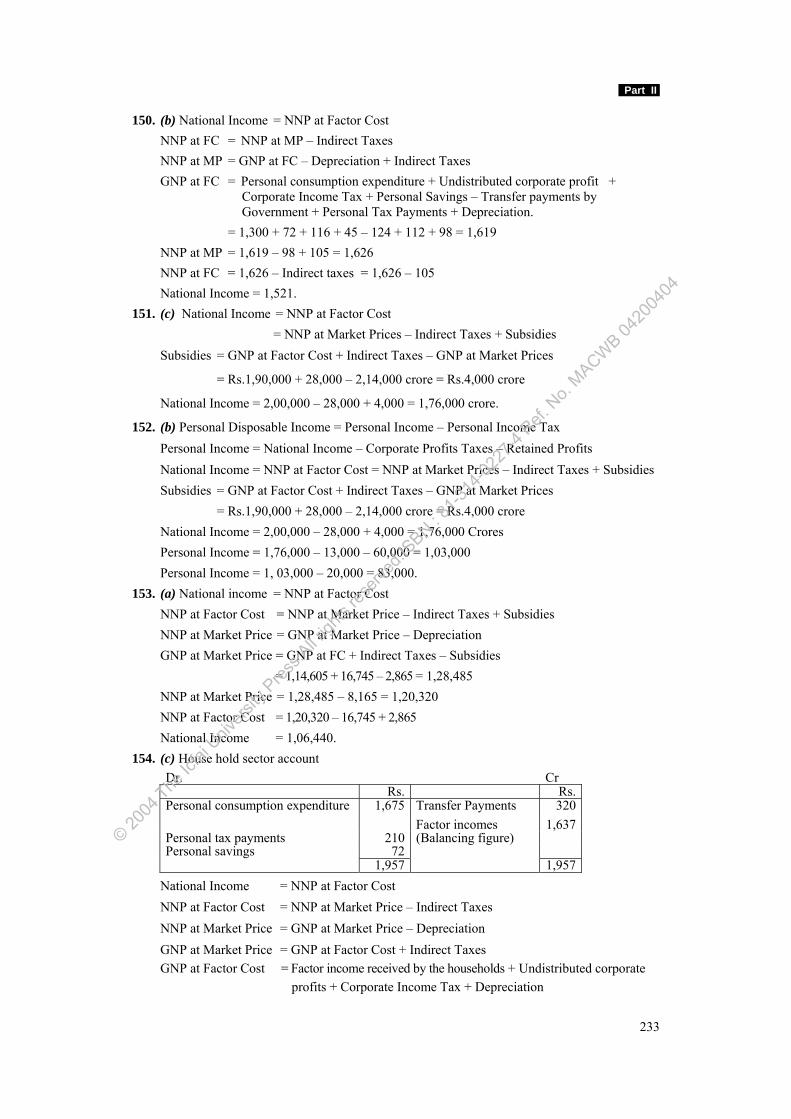
Part II
233
150. (b) National Income = NNP at Factor Cost NNP at FC = NNP at MP – Indirect Taxes NNP at MP = GNP at FC – Depreciation + Indirect Taxes GNP at FC = Personal consumption expenditure + Undistributed corporate profit +
Corporate Income Tax + Personal Savings – Transfer payments by Government + Personal Tax Payments + Depreciation.
= 1,300 + 72 + 116 + 45 – 124 + 112 + 98 = 1,619 NNP at MP = 1,619 – 98 + 105 = 1,626 NNP at FC = 1,626 – Indirect taxes = 1,626 – 105 National Income = 1,521. 151. (c) National Income = NNP at Factor Cost = NNP at Market Prices – Indirect Taxes + Subsidies Subsidies = GNP at Factor Cost + Indirect Taxes – GNP at Market Prices
= Rs.1,90,000 + 28,000 – 2,14,000 crore = Rs.4,000 crore
National Income = 2,00,000 – 28,000 + 4,000 = 1,76,000 crore.
152. (b) Personal Disposable Income = Personal Income – Personal Income Tax Personal Income = National Income – Corporate Profits Taxes – Retained Profits National Income = NNP at Factor Cost = NNP at Market Prices – Indirect Taxes + Subsidies Subsidies = GNP at Factor Cost + Indirect Taxes – GNP at Market Prices = Rs.1,90,000 + 28,000 – 2,14,000 crore = Rs.4,000 crore National Income = 2,00,000 – 28,000 + 4,000 = 1,76,000 Crores Personal Income = 1,76,000 – 13,000 – 60,000 = 1,03,000 Personal Income = 1, 03,000 – 20,000 = 83,000. 153. (a) National income = NNP at Factor Cost NNP at Factor Cost = NNP at Market Price – Indirect Taxes + Subsidies NNP at Market Price = GNP at Market Price – Depreciation GNP at Market Price = GNP at FC + Indirect Taxes – Subsidies = 1,14,605 + 16,745 – 2,865 = 1,28,485 NNP at Market Price = 1,28,485 – 8,165 = 1,20,320 NNP at Factor Cost = 1,20,320 – 16,745 + 2,865 National Income = 1,06,440. 154. (c) House hold sector account
Dr. Cr Rs. Rs. Personal consumption expenditure 1,675 Transfer Payments 320 Factor incomes 1,637 Personal tax payments 210 (Balancing figure) Personal savings 72 1,957 1,957
National Income = NNP at Factor Cost NNP at Factor Cost = NNP at Market Price – Indirect Taxes NNP at Market Price = GNP at Market Price – Depreciation GNP at Market Price = GNP at Factor Cost + Indirect Taxes GNP at Factor Cost = Factor income received by the households + Undistributed corporate profits + Corporate Income Tax + Depreciation
© 2004
The Ic
fai U
nivers
ity P
ress.A
ll righ
ts res
erved
.ISBN : 8
1-314
-0227
-4 Ref.
No.
MACWB 04
2004
04
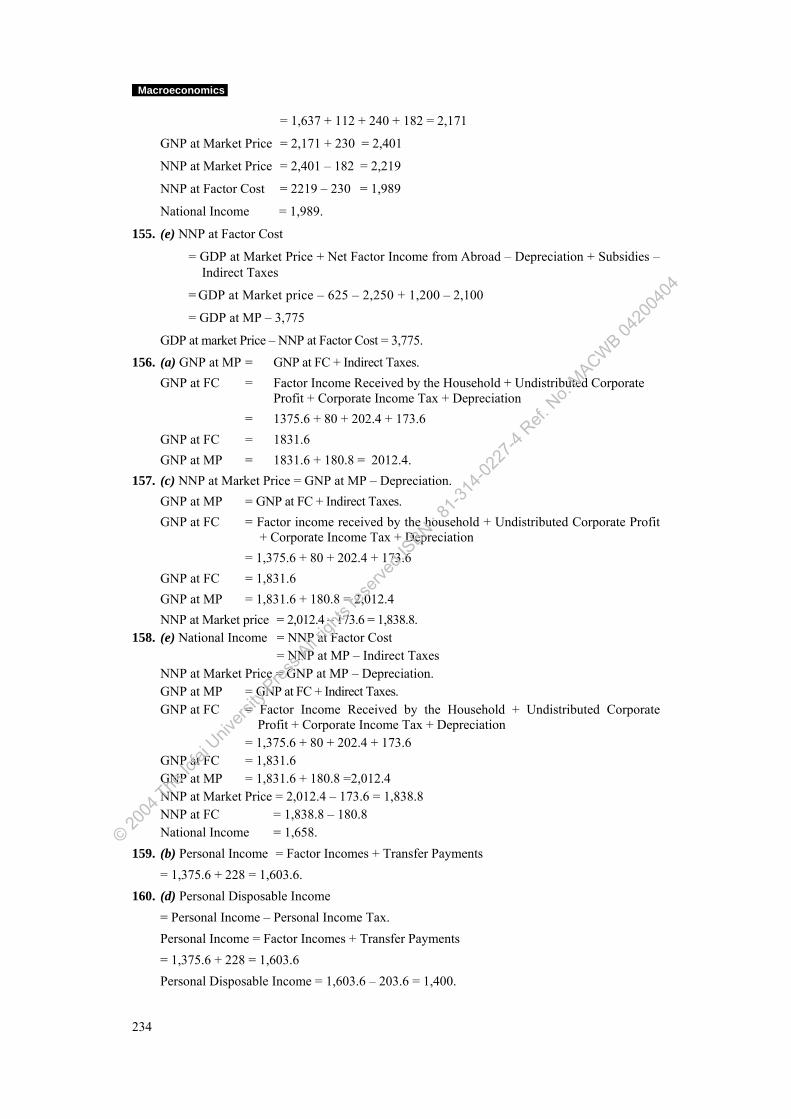
Macroeconomics
234
= 1,637 + 112 + 240 + 182 = 2,171
GNP at Market Price = 2,171 + 230 = 2,401
NNP at Market Price = 2,401 – 182 = 2,219
NNP at Factor Cost = 2219 – 230 = 1,989
National Income = 1,989.
155. (e) NNP at Factor Cost
= GDP at Market Price + Net Factor Income from Abroad – Depreciation + Subsidies – Indirect Taxes
= GDP at Market price – 625 – 2,250 + 1,200 – 2,100
= GDP at MP – 3,775
GDP at market Price – NNP at Factor Cost = 3,775.
156. (a) GNP at MP = GNP at FC + Indirect Taxes. GNP at FC = Factor Income Received by the Household + Undistributed Corporate
Profit + Corporate Income Tax + Depreciation = 1375.6 + 80 + 202.4 + 173.6 GNP at FC = 1831.6 GNP at MP = 1831.6 + 180.8 = 2012.4. 157. (c) NNP at Market Price = GNP at MP – Depreciation. GNP at MP = GNP at FC + Indirect Taxes. GNP at FC = Factor income received by the household + Undistributed Corporate Profit
+ Corporate Income Tax + Depreciation = 1,375.6 + 80 + 202.4 + 173.6 GNP at FC = 1,831.6 GNP at MP = 1,831.6 + 180.8 = 2,012.4 NNP at Market price = 2,012.4 – 173.6 = 1,838.8. 158. (e) National Income = NNP at Factor Cost = NNP at MP – Indirect Taxes NNP at Market Price = GNP at MP – Depreciation. GNP at MP = GNP at FC + Indirect Taxes. GNP at FC = Factor Income Received by the Household + Undistributed Corporate
Profit + Corporate Income Tax + Depreciation = 1,375.6 + 80 + 202.4 + 173.6 GNP at FC = 1,831.6 GNP at MP = 1,831.6 + 180.8 =2,012.4 NNP at Market Price = 2,012.4 – 173.6 = 1,838.8 NNP at FC = 1,838.8 – 180.8 National Income = 1,658. 159. (b) Personal Income = Factor Incomes + Transfer Payments = 1,375.6 + 228 = 1,603.6. 160. (d) Personal Disposable Income = Personal Income – Personal Income Tax. Personal Income = Factor Incomes + Transfer Payments = 1,375.6 + 228 = 1,603.6 Personal Disposable Income = 1,603.6 – 203.6 = 1,400.
© 2004
The Ic
fai U
nivers
ity P
ress.A
ll righ
ts res
erved
.ISBN : 8
1-314
-0227
-4 Ref.
No.
MACWB 04
2004
04
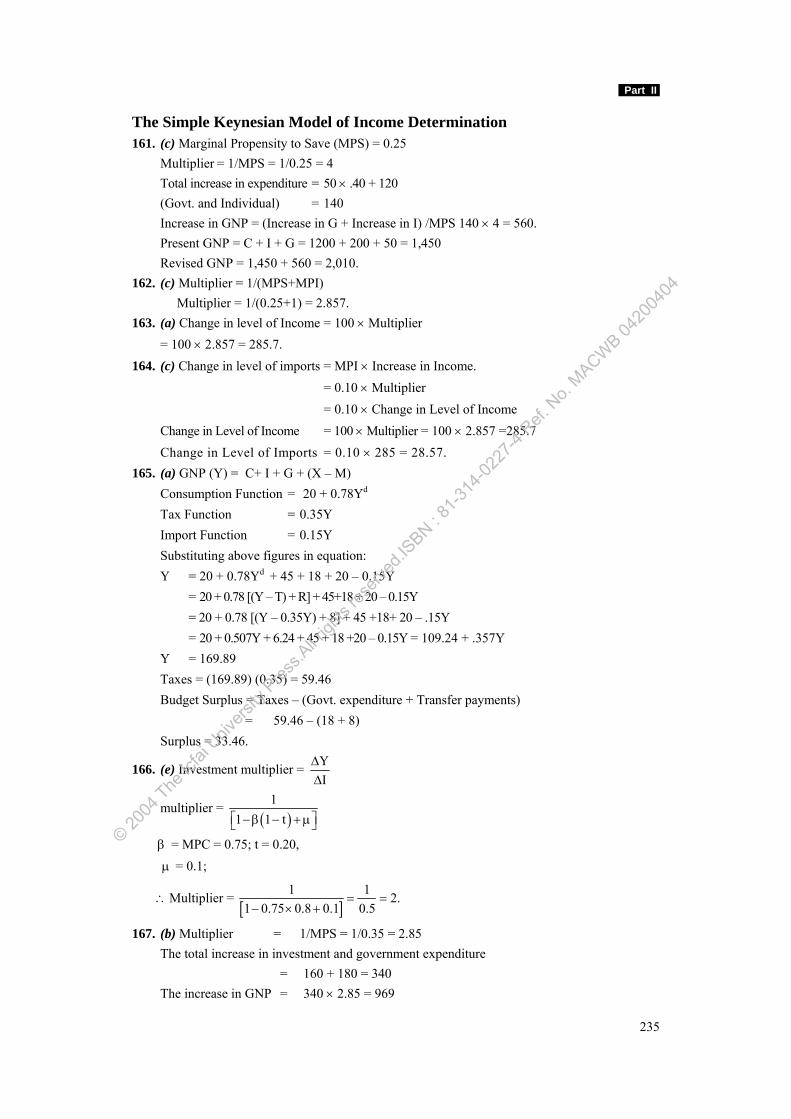
Part II
235
The Simple Keynesian Model of Income Determination 161. (c) Marginal Propensity to Save (MPS) = 0.25 Multiplier = 1/MPS = 1/0.25 = 4 Total increase in expenditure = 50 × .40 + 120 (Govt. and Individual) = 140 Increase in GNP = (Increase in G + Increase in I) /MPS 140 × 4 = 560. Present GNP = C + I + G = 1200 + 200 + 50 = 1,450 Revised GNP = 1,450 + 560 = 2,010. 162. (c) Multiplier = 1/(MPS+MPI) Multiplier = 1/(0.25+1) = 2.857. 163. (a) Change in level of Income = 100 × Multiplier = 100 × 2.857 = 285.7. 164. (c) Change in level of imports = MPI × Increase in Income. = 0.10 × Multiplier = 0.10 × Change in Level of Income Change in Level of Income = 100 × Multiplier = 100 × 2.857 =285.7 Change in Level of Imports = 0.10 × 285 = 28.57. 165. (a) GNP (Y) = C+ I + G + (X – M) Consumption Function = 20 + 0.78Yd
Tax Function = 0.35Y Import Function = 0.15Y Substituting above figures in equation: Y = 20 + 0.78Yd
+ 45 + 18 + 20 – 0.15Y = 20 + 0.78 [(Y – T) + R] + 45+18 + 20 – 0.15Y = 20 + 0.78 [(Y – 0.35Y) + 8] + 45 +18+ 20 – .15Y = 20 + 0.507Y + 6.24 + 45 + 18 +20 – 0.15Y = 109.24 + .357Y Y = 169.89 Taxes = (169.89) (0.35) = 59.46 Budget Surplus = Taxes – (Govt. expenditure + Transfer payments) = 59.46 – (18 + 8) Surplus = 33.46.
166. (e) Investment multiplier = YI
ΔΔ
multiplier = ( )
11 1 t⎡ ⎤− β − + μ⎣ ⎦
β = MPC = 0.75; t = 0.20, μ = 0.1;
∴Multiplier = [ ]
1 1 2.1 0.75 0.8 0.1 0.5
= =− × +
167. (b) Multiplier = 1/MPS = 1/0.35 = 2.85 The total increase in investment and government expenditure = 160 + 180 = 340 The increase in GNP = 340 × 2.85 = 969
© 2004
The Ic
fai U
nivers
ity P
ress.A
ll righ
ts res
erved
.ISBN : 8
1-314
-0227
-4 Ref.
No.
MACWB 04
2004
04
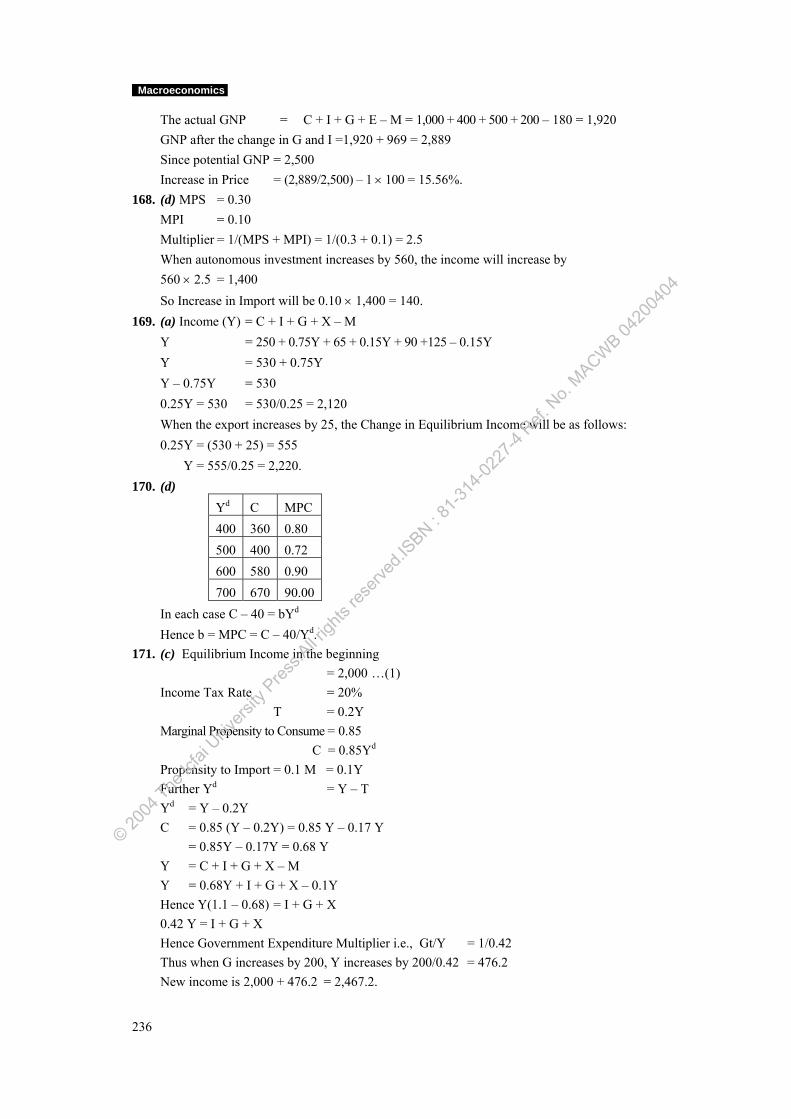
Macroeconomics
236
The actual GNP = C + I + G + E – M = 1,000 + 400 + 500 + 200 – 180 = 1,920 GNP after the change in G and I =1,920 + 969 = 2,889 Since potential GNP = 2,500 Increase in Price = (2,889/2,500) – 1 × 100 = 15.56%. 168. (d) MPS = 0.30 MPI = 0.10 Multiplier = 1/(MPS + MPI) = 1/(0.3 + 0.1) = 2.5 When autonomous investment increases by 560, the income will increase by 560 × 2.5 = 1,400 So Increase in Import will be 0.10 × 1,400 = 140. 169. (a) Income (Y) = C + I + G + X – M Y = 250 + 0.75Y + 65 + 0.15Y + 90 +125 – 0.15Y Y = 530 + 0.75Y Y – 0.75Y = 530 0.25Y = 530 = 530/0.25 = 2,120 When the export increases by 25, the Change in Equilibrium Income will be as follows: 0.25Y = (530 + 25) = 555 Y = 555/0.25 = 2,220. 170. (d)
Yd C MPC 400 360 0.80 500 400 0.72 600 580 0.90 700 670 90.00
In each case C – 40 = bYd Hence b = MPC = C – 40/Yd. 171. (c) Equilibrium Income in the beginning = 2,000 …(1) Income Tax Rate = 20% T = 0.2Y Marginal Propensity to Consume = 0.85 C = 0.85Yd Propensity to Import = 0.1 M = 0.1Y Further Yd = Y – T Yd = Y – 0.2Y C = 0.85 (Y – 0.2Y) = 0.85 Y – 0.17 Y = 0.85Y – 0.17Y = 0.68 Y Y = C + I + G + X – M Y = 0.68Y + I + G + X – 0.1Y Hence Y(1.1 – 0.68) = I + G + X 0.42 Y = I + G + X Hence Government Expenditure Multiplier i.e., Gt/Y = 1/0.42 Thus when G increases by 200, Y increases by 200/0.42 = 476.2 New income is 2,000 + 476.2 = 2,467.2.
© 2004
The Ic
fai U
nivers
ity P
ress.A
ll righ
ts res
erved
.ISBN : 8
1-314
-0227
-4 Ref.
No.
MACWB 04
2004
04
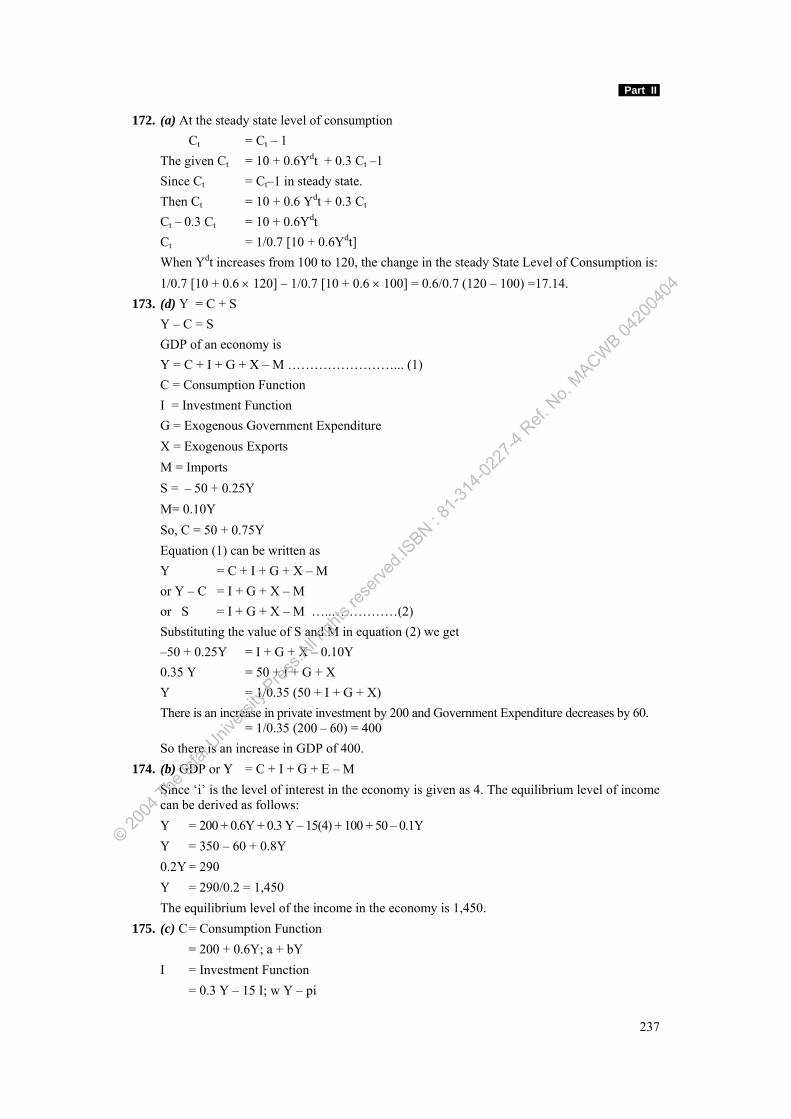
Part II
237
172. (a) At the steady state level of consumption Ct = Ct – 1 The given Ct = 10 + 0.6Ydt + 0.3 Ct –1 Since Ct = Ct–1 in steady state. Then Ct = 10 + 0.6 Ydt + 0.3 Ct Ct – 0.3 Ct = 10 + 0.6Ydt Ct = 1/0.7 [10 + 0.6Ydt] When Ydt increases from 100 to 120, the change in the steady State Level of Consumption is: 1/0.7 [10 + 0.6 × 120] – 1/0.7 [10 + 0.6 × 100] = 0.6/0.7 (120 – 100) =17.14. 173. (d) Y = C + S Y – C = S GDP of an economy is Y = C + I + G + X – M ……………………... (1) C = Consumption Function I = Investment Function G = Exogenous Government Expenditure X = Exogenous Exports M = Imports S = – 50 + 0.25Y M= 0.10Y So, C = 50 + 0.75Y Equation (1) can be written as Y = C + I + G + X – M or Y – C = I + G + X – M or S = I + G + X – M …..……………(2) Substituting the value of S and M in equation (2) we get –50 + 0.25Y = I + G + X – 0.10Y 0.35 Y = 50 + I + G + X Y = 1/0.35 (50 + I + G + X) There is an increase in private investment by 200 and Government Expenditure decreases by 60.
= 1/0.35 (200 – 60) = 400 So there is an increase in GDP of 400. 174. (b) GDP or Y = C + I + G + E – M Since ‘i’ is the level of interest in the economy is given as 4. The equilibrium level of income
can be derived as follows: Y = 200 + 0.6Y + 0.3 Y – 15(4) + 100 + 50 – 0.1Y Y = 350 – 60 + 0.8Y 0.2Y = 290 Y = 290/0.2 = 1,450 The equilibrium level of the income in the economy is 1,450. 175. (c) C = Consumption Function = 200 + 0.6Y; a + bY I = Investment Function = 0.3 Y – 15 I; w Y – pi
© 2004
The Ic
fai U
nivers
ity P
ress.A
ll righ
ts res
erved
.ISBN : 8
1-314
-0227
-4 Ref.
No.
MACWB 04
2004
04
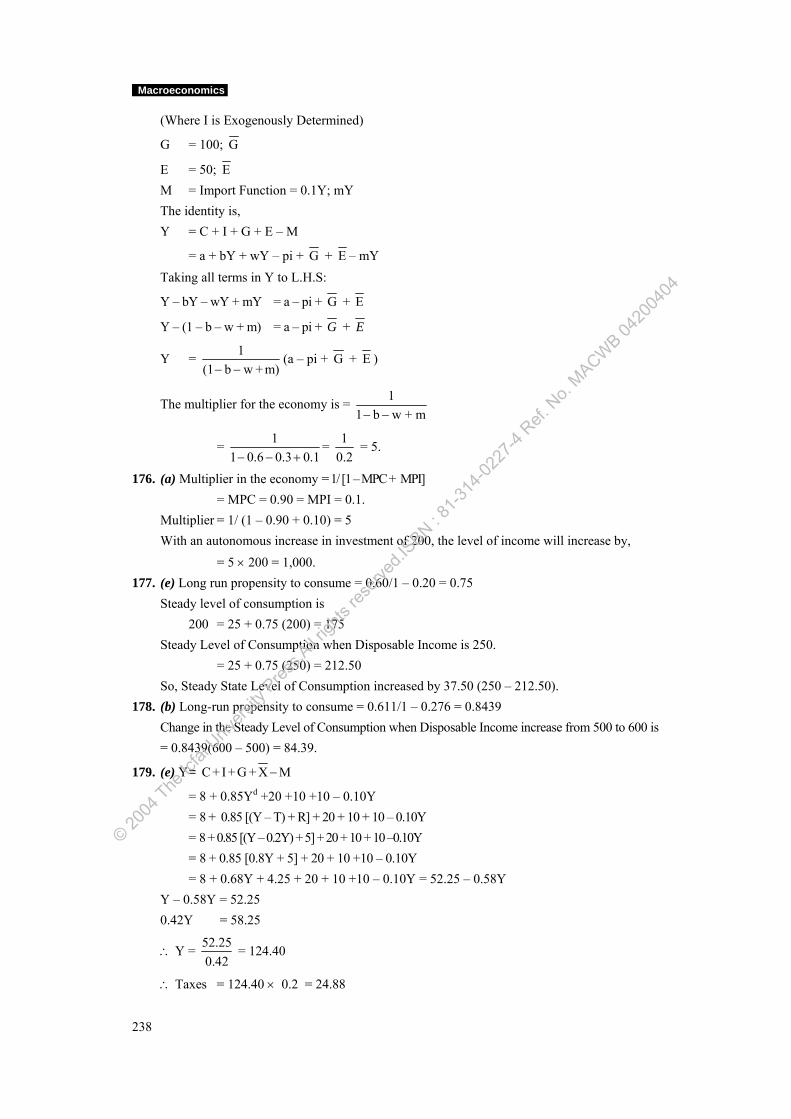
Macroeconomics
238
(Where I is Exogenously Determined)
G = 100; G
E = 50; E M = Import Function = 0.1Y; mY The identity is, Y = C + I + G + E – M
= a + bY + wY – pi + G + E – mY Taking all terms in Y to L.H.S:
Y – bY – wY + mY = a – pi + G + E
Y – (1 – b – w + m) = a – pi + G + E
Y = 1(1 b w + m)− −
(a – pi + G + E )
The multiplier for the economy is = 11 b w + m− −
= 11 0.6 0.3 0.1− − +
= 10.2
= 5.
176. (a) Multiplier in the economy = 1/ [1 – MPC + MPI] = MPC = 0.90 = MPI = 0.1. Multiplier = 1/ (1 – 0.90 + 0.10) = 5 With an autonomous increase in investment of 200, the level of income will increase by, = 5 × 200 = 1,000. 177. (e) Long run propensity to consume = 0.60/1 – 0.20 = 0.75 Steady level of consumption is 200 = 25 + 0.75 (200) = 175 Steady Level of Consumption when Disposable Income is 250. = 25 + 0.75 (250) = 212.50 So, Steady State Level of Consumption increased by 37.50 (250 – 212.50). 178. (b) Long-run propensity to consume = 0.611/1 – 0.276 = 0.8439 Change in the Steady Level of Consumption when Disposable Income increase from 500 to 600 is = 0.8439(600 – 500) = 84.39.
179. (e) Y = C + I + G + X M−
= 8 + 0.85Yd +20 +10 +10 – 0.10Y = 8 + 0.85 [(Y – T) + R] + 20 + 10 + 10 – 0.10Y = 8 + 0.85 [(Y – 0.2Y) + 5] + 20 + 10 + 10 –0.10Y = 8 + 0.85 [0.8Y + 5] + 20 + 10 +10 – 0.10Y = 8 + 0.68Y + 4.25 + 20 + 10 +10 – 0.10Y = 52.25 – 0.58Y Y – 0.58Y = 52.25 0.42Y = 58.25
∴ Y = 52.250.42
= 124.40
∴ Taxes = 124.40 × 0.2 = 24.88
© 2004
The Ic
fai U
nivers
ity P
ress.A
ll righ
ts res
erved
.ISBN : 8
1-314
-0227
-4 Ref.
No.
MACWB 04
2004
04
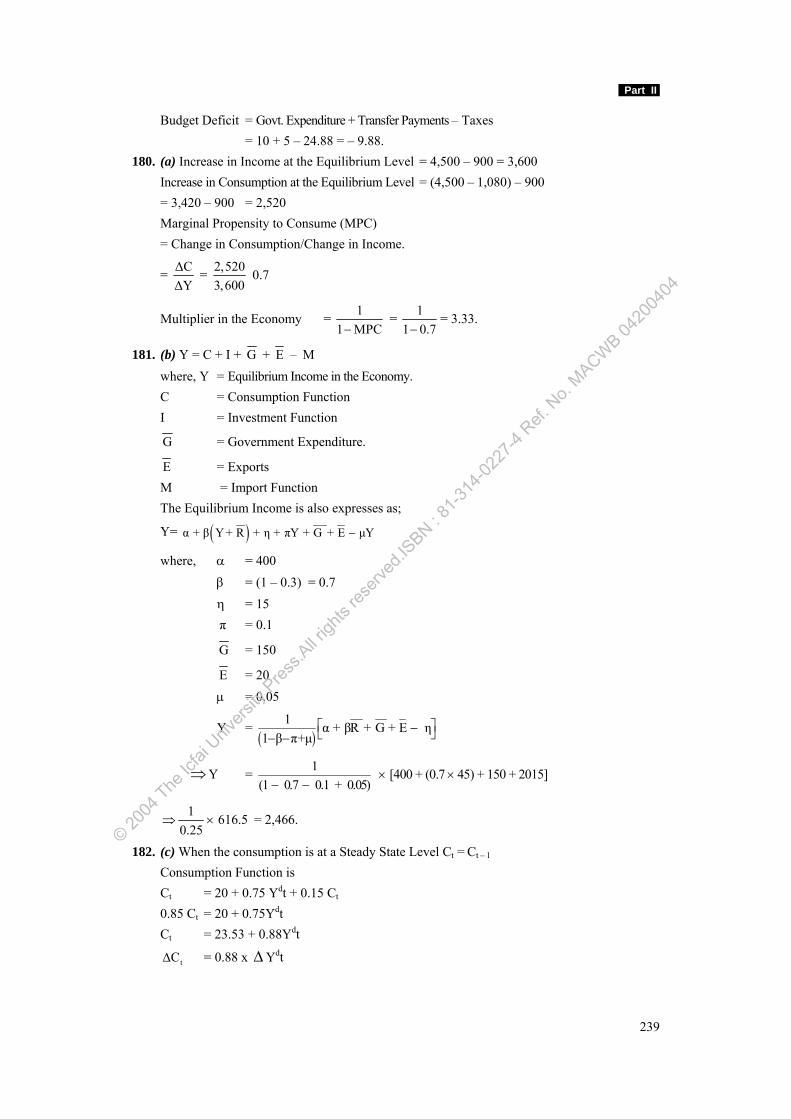
Part II
239
Budget Deficit = Govt. Expenditure + Transfer Payments – Taxes = 10 + 5 – 24.88 = – 9.88. 180. (a) Increase in Income at the Equilibrium Level = 4,500 – 900 = 3,600 Increase in Consumption at the Equilibrium Level = (4,500 – 1,080) – 900 = 3,420 – 900 = 2,520 Marginal Propensity to Consume (MPC) = Change in Consumption/Change in Income.
= ΔCΔY
= 2,5203,600
0.7
Multiplier in the Economy = 11 MPC−
= 11 0.7−
= 3.33.
181. (b) Y = C + I + G + E – M where, Y = Equilibrium Income in the Economy. C = Consumption Function I = Investment Function
G = Government Expenditure.
E = Exports M = Import Function The Equilibrium Income is also expresses as;
Y= ( )α + β Y + R + η + πY + G + E μY−
where, α = 400 β = (1 – 0.3) = 0.7 η = 15 π = 0.1
G = 150
E = 20 μ = 0.05
Y = ( )
1 α + βR + G + E η1 β π+μ
⎡ ⎤−⎣ ⎦− −
⇒ Y = 1(1 0.7 0.1 + 0.05)− −
× [400 + (0.7 × 45) + 150 + 2015]
1 616.50.25
⇒ × = 2,466.
182. (c) When the consumption is at a Steady State Level Ct = Ct – 1 Consumption Function is Ct = 20 + 0.75 Ydt + 0.15 Ct 0.85 Ct = 20 + 0.75Ydt Ct = 23.53 + 0.88Ydt
tCΔ = 0.88 x Δ Ydt
© 2004
The Ic
fai U
nivers
ity P
ress.A
ll righ
ts res
erved
.ISBN : 8
1-314
-0227
-4 Ref.
No.
MACWB 04
2004
04
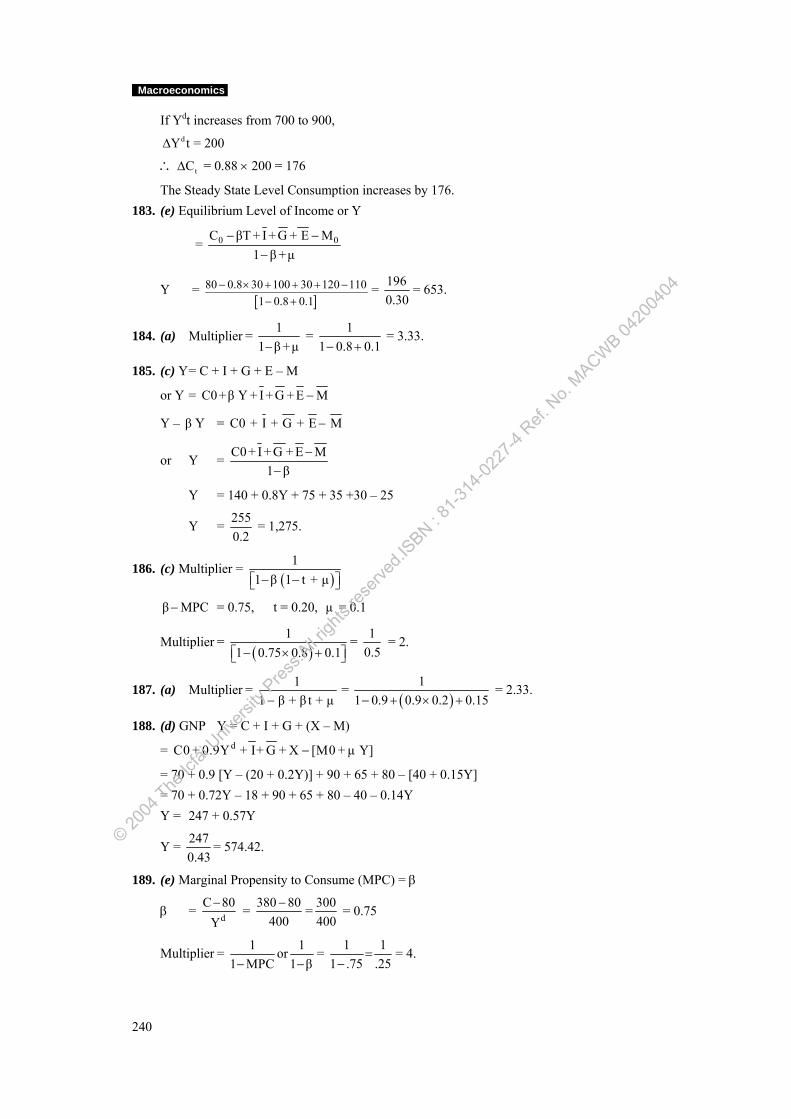
Macroeconomics
240
If Ydt increases from 700 to 900,
dY tΔ = 200
∴ tCΔ = 0.88 × 200 = 176
The Steady State Level Consumption increases by 176. 183. (e) Equilibrium Level of Income or Y
= 0 0C βT + I + G + E M1 β+μ
− −−
Y = [ ]
80 0.8 30 100 30 120 1101 0.8 0.1
− × + + + −− +
= 1960.30
= 653.
184. (a) Multiplier = 11 β+μ−
= 11 0.8 0.1− +
= 3.33.
185. (c) Y = C + I + G + E – M
or Y = C0 +β Y + I + G + E M−
Y – β Y = C0 + I + G + E M−
or Y = C0+ I + G + E M1 β
−−
Y = 140 + 0.8Y + 75 + 35 +30 – 25
Y = 2550.2
= 1,275.
186. (c) Multiplier = ( )
11 β 1 t + μ− −⎡ ⎤⎣ ⎦
β MPC− = 0.75, t = 0.20, μ = 0.1
Multiplier = ( )
11 0.75 0.8 0.1− × +⎡ ⎤⎣ ⎦
= 10.5
= 2.
187. (a) Multiplier = 11 β + β t + μ−
= ( )
11 0.9 0.9 0.2 0.15− + × +
= 2.33.
188. (d) GNP Y = C + I + G + (X – M)
= dC0 + 0.9Y + I+ G + X [M0 +μ− Y]
= 70 + 0.9 [Y – (20 + 0.2Y)] + 90 + 65 + 80 – [40 + 0.15Y] = 70 + 0.72Y – 18 + 90 + 65 + 80 – 40 – 0.14Y Y = 247 + 0.57Y
Y = 2470.43
= 574.42.
189. (e) Marginal Propensity to Consume (MPC) = β
β = dC 80
Y− = 380 80
400− = 300
400 = 0.75
Multiplier = 1 1or1 MPC 1 β− −
= 1 11 .75 .25
=−
= 4.
© 2004
The Ic
fai U
nivers
ity P
ress.A
ll righ
ts res
erved
.ISBN : 8
1-314
-0227
-4 Ref.
No.
MACWB 04
2004
04
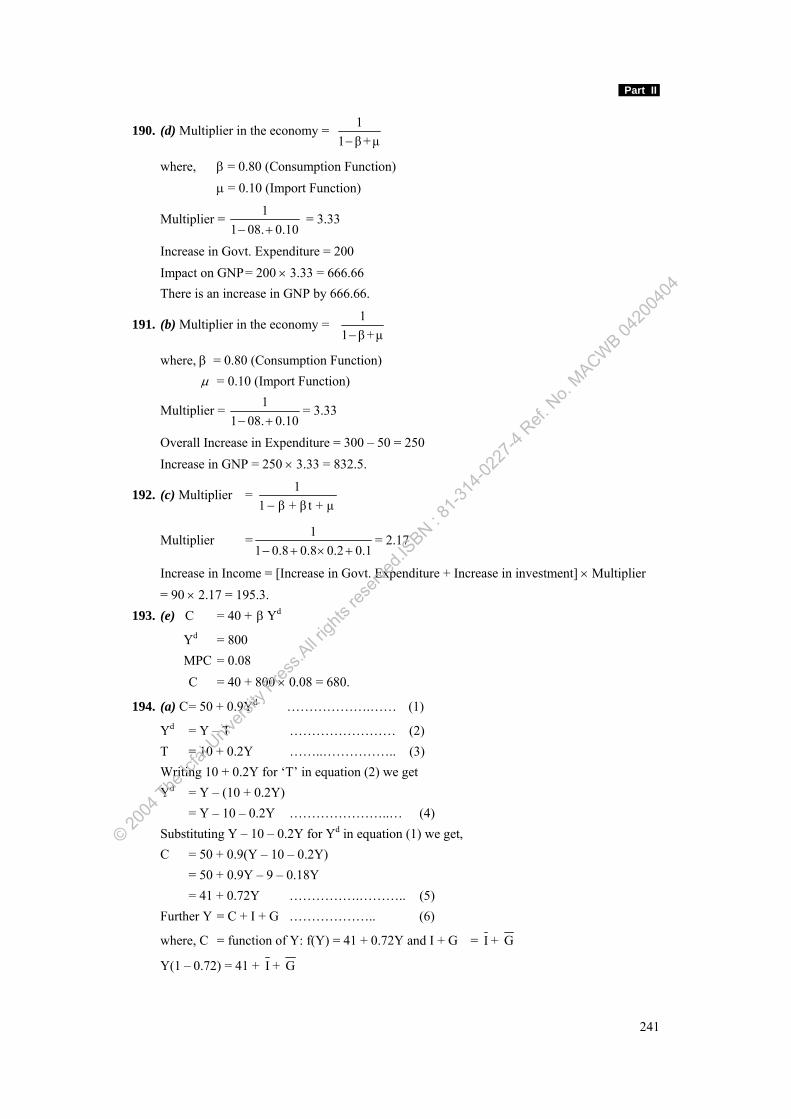
Part II
241
190. (d) Multiplier in the economy = 11 β+μ−
where, β = 0.80 (Consumption Function) μ = 0.10 (Import Function)
Multiplier = 11 08. 0.10− +
= 3.33
Increase in Govt. Expenditure = 200 Impact on GNP = 200 × 3.33 = 666.66 There is an increase in GNP by 666.66.
191. (b) Multiplier in the economy = 11 β+μ−
where, β = 0.80 (Consumption Function) μ = 0.10 (Import Function)
Multiplier = 11 08. 0.10− +
= 3.33
Overall Increase in Expenditure = 300 – 50 = 250 Increase in GNP = 250 × 3.33 = 832.5.
192. (c) Multiplier = 11 β + β t + μ−
Multiplier = 11 0.8 0.8 0.2 0.1− + × +
= 2.17
Increase in Income = [Increase in Govt. Expenditure + Increase in investment] × Multiplier = 90 × 2.17 = 195.3. 193. (e) C = 40 + β Yd
Yd = 800 MPC = 0.08 C = 40 + 800 × 0.08 = 680.
194. (a) C = 50 + 0.9Yd ……………….…… (1)
Yd = Y – T …………………… (2) T = 10 + 0.2Y ……..…………….. (3) Writing 10 + 0.2Y for ‘T’ in equation (2) we get Yd = Y – (10 + 0.2Y) = Y – 10 – 0.2Y …………………..… (4) Substituting Y – 10 – 0.2Y for Yd in equation (1) we get, C = 50 + 0.9(Y – 10 – 0.2Y) = 50 + 0.9Y – 9 – 0.18Y = 41 + 0.72Y …………….……….. (5) Further Y = C + I + G ……………….. (6)
where, C = function of Y: f(Y) = 41 + 0.72Y and I + G = I + G
Y(1 – 0.72) = 41 + I + G
© 2004
The Ic
fai U
nivers
ity P
ress.A
ll righ
ts res
erved
.ISBN : 8
1-314
-0227
-4 Ref.
No.
MACWB 04
2004
04
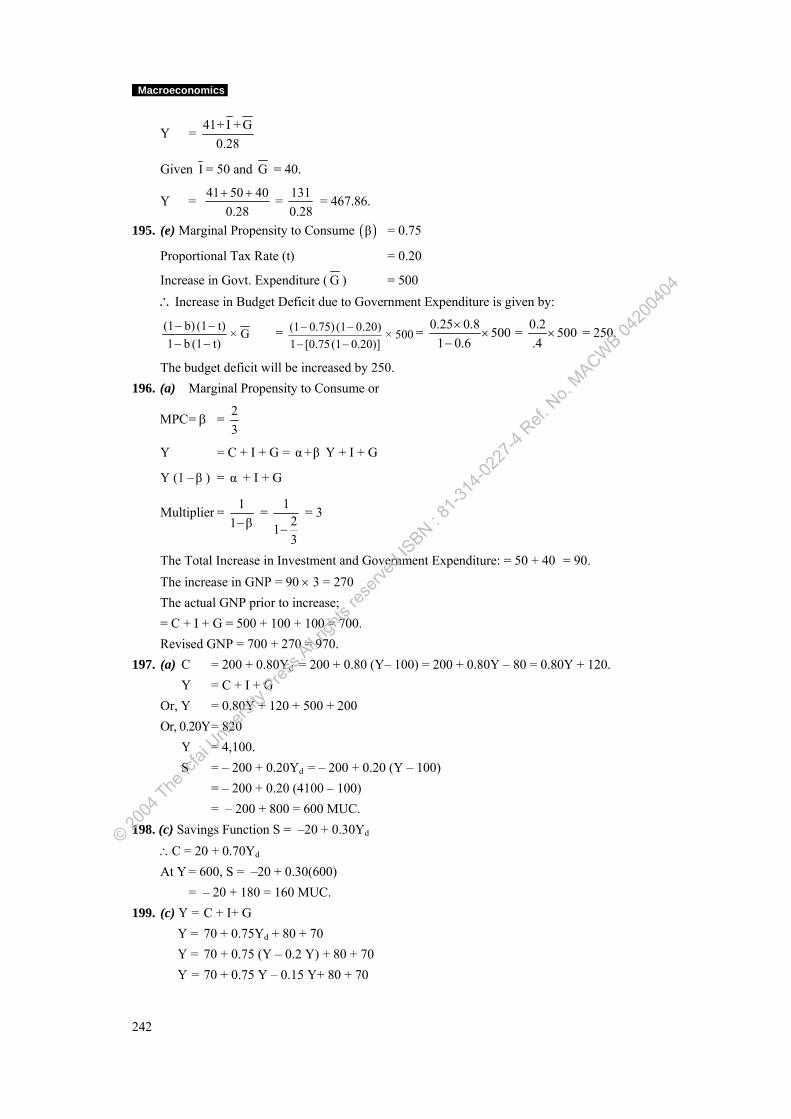
Macroeconomics
242
Y = 41+ I + G0.28
Given I = 50 and G = 40.
Y = 41 50 400.28
+ + = 1310.28
= 467.86.
195. (e) Marginal Propensity to Consume ( )β = 0.75
Proportional Tax Rate (t) = 0.20
Increase in Govt. Expenditure ( G ) = 500 ∴Increase in Budget Deficit due to Government Expenditure is given by:
(1 b) (1 t) × G1 b (1 t)
− −− −
= (1 0.75) (1 0.20) × 5001 [0.75(1 0.20)]
− −− −
= 0.25 0.8 5001 0.6
××
− = 0.2 500
.4× = 250.
The budget deficit will be increased by 250. 196. (a) Marginal Propensity to Consume or
MPC = β = 23
Y = C + I + G = α+β Y + I + G
Y (1 –β ) = α + I + G
Multiplier = 11 β−
= 1213
− = 3
The Total Increase in Investment and Government Expenditure: = 50 + 40 = 90. The increase in GNP = 90 × 3 = 270 The actual GNP prior to increase; = C + I + G = 500 + 100 + 100 = 700. Revised GNP = 700 + 270 = 970. 197. (a) C = 200 + 0.80Yd = 200 + 0.80 (Y– 100) = 200 + 0.80Y – 80 = 0.80Y + 120. Y = C + I + G Or, Y = 0.80Y + 120 + 500 + 200 Or, 0.20Y = 820 Y = 4,100. S = – 200 + 0.20Yd = – 200 + 0.20 (Y – 100)
= – 200 + 0.20 (4100 – 100) = – 200 + 800 = 600 MUC. 198. (c) Savings Function S = –20 + 0.30Yd ∴C = 20 + 0.70Yd At Y = 600, S = –20 + 0.30(600) = – 20 + 180 = 160 MUC. 199. (c) Y = C + I+ G Y = 70 + 0.75Yd + 80 + 70 Y = 70 + 0.75 (Y – 0.2 Y) + 80 + 70 Y = 70 + 0.75 Y – 0.15 Y+ 80 + 70
© 2004
The Ic
fai U
nivers
ity P
ress.A
ll righ
ts res
erved
.ISBN : 8
1-314
-0227
-4 Ref.
No.
MACWB 04
2004
04
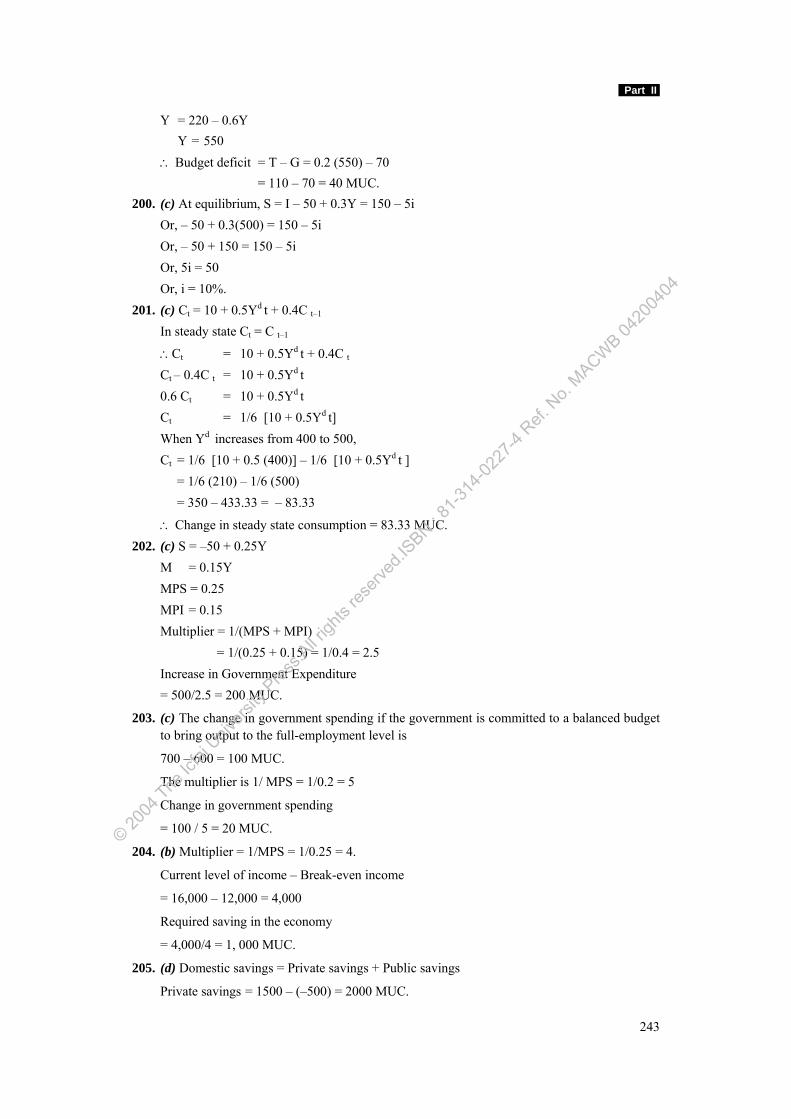
Part II
243
Y = 220 – 0.6Y Y = 550 ∴ Budget deficit = T – G = 0.2 (550) – 70 = 110 – 70 = 40 MUC. 200. (c) At equilibrium, S = I – 50 + 0.3Y = 150 – 5i Or, – 50 + 0.3(500) = 150 – 5i Or, – 50 + 150 = 150 – 5i Or, 5i = 50 Or, i = 10%. 201. (c) Ct = 10 + 0.5Yd t + 0.4C t–1 In steady state Ct = C t–1
∴Ct = 10 + 0.5Yd t + 0.4C t Ct – 0.4C t = 10 + 0.5Yd t 0.6 Ct = 10 + 0.5Yd t Ct = 1/6 [10 + 0.5Yd t] When Yd increases from 400 to 500, Ct = 1/6 [10 + 0.5 (400)] – 1/6 [10 + 0.5Yd t ] = 1/6 (210) – 1/6 (500) = 350 – 433.33 = – 83.33
∴ Change in steady state consumption = 83.33 MUC. 202. (c) S = –50 + 0.25Y M = 0.15Y MPS = 0.25 MPI = 0.15 Multiplier = 1/(MPS + MPI) = 1/(0.25 + 0.15) = 1/0.4 = 2.5 Increase in Government Expenditure = 500/2.5 = 200 MUC.
203. (c) The change in government spending if the government is committed to a balanced budget to bring output to the full-employment level is
700 – 600 = 100 MUC.
The multiplier is 1/ MPS = 1/0.2 = 5
Change in government spending
= 100 / 5 = 20 MUC.
204. (b) Multiplier = 1/MPS = 1/0.25 = 4.
Current level of income – Break-even income
= 16,000 – 12,000 = 4,000
Required saving in the economy
= 4,000/4 = 1, 000 MUC.
205. (d) Domestic savings = Private savings + Public savings
Private savings = 1500 – (–500) = 2000 MUC.
© 2004
The Ic
fai U
nivers
ity P
ress.A
ll righ
ts res
erved
.ISBN : 8
1-314
-0227
-4 Ref.
No.
MACWB 04
2004
04
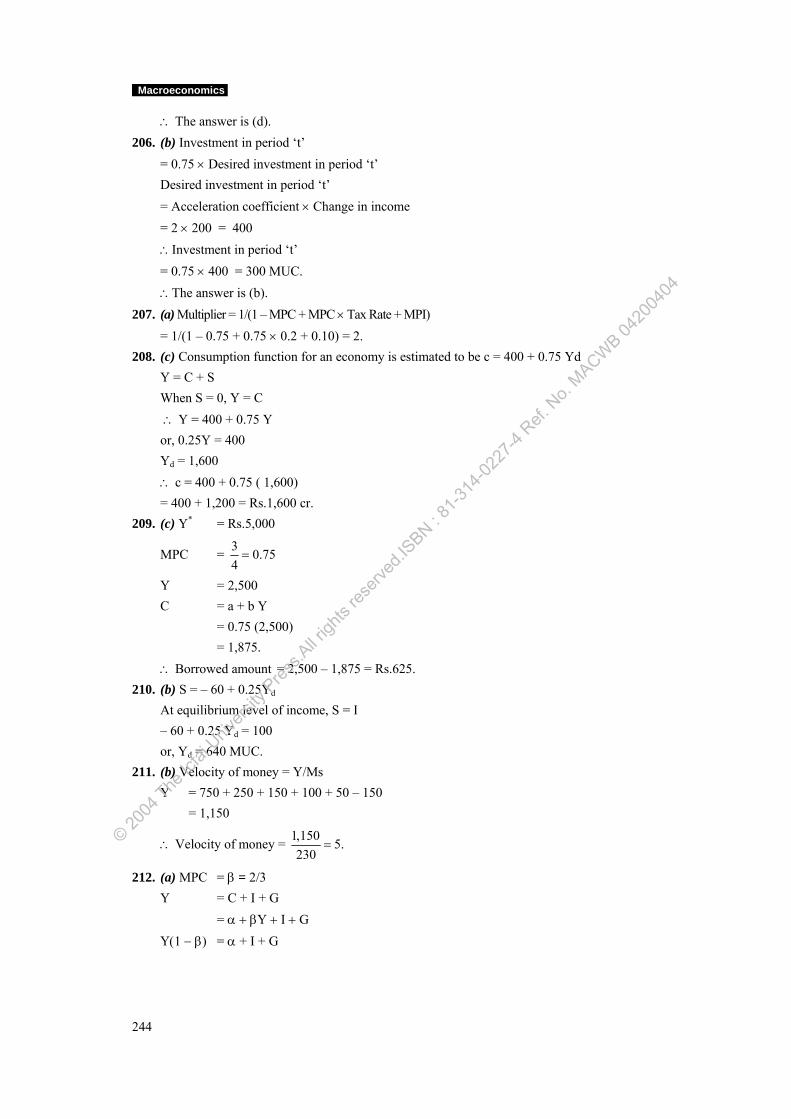
Macroeconomics
244
∴ The answer is (d). 206. (b) Investment in period ‘t’ = 0.75 × Desired investment in period ‘t’ Desired investment in period ‘t’ = Acceleration coefficient × Change in income = 2 × 200 = 400 ∴Investment in period ‘t’ = 0.75 × 400 = 300 MUC. ∴The answer is (b). 207. (a) Multiplier = 1/(1 – MPC + MPC × Tax Rate + MPI) = 1/(1 – 0.75 + 0.75 × 0.2 + 0.10) = 2. 208. (c) Consumption function for an economy is estimated to be c = 400 + 0.75 Yd Y = C + S When S = 0, Y = C ∴ Y = 400 + 0.75 Y or, 0.25Y = 400 Yd = 1,600 ∴ c = 400 + 0.75 ( 1,600) = 400 + 1,200 = Rs.1,600 cr.
209. (c) Y* = Rs.5,000
MPC = 3 0.754
=
Y = 2,500 C = a + b Y = 0.75 (2,500) = 1,875. ∴ Borrowed amount = 2,500 – 1,875 = Rs.625. 210. (b) S = – 60 + 0.25Yd At equilibrium level of income, S = I – 60 + 0.25 Yd = 100 or, Yd = 640 MUC. 211. (b) Velocity of money = Y/Ms Y = 750 + 250 + 150 + 100 + 50 – 150 = 1,150
∴ Velocity of money = 1,150 5.230
=
212. (a) MPC = β = 2/3 Y = C + I + G = α + βY + I + G Y(1 − β) = α + I + G
© 2004
The Ic
fai U
nivers
ity P
ress.A
ll righ
ts res
erved
.ISBN : 8
1-314
-0227
-4 Ref.
No.
MACWB 04
2004
04
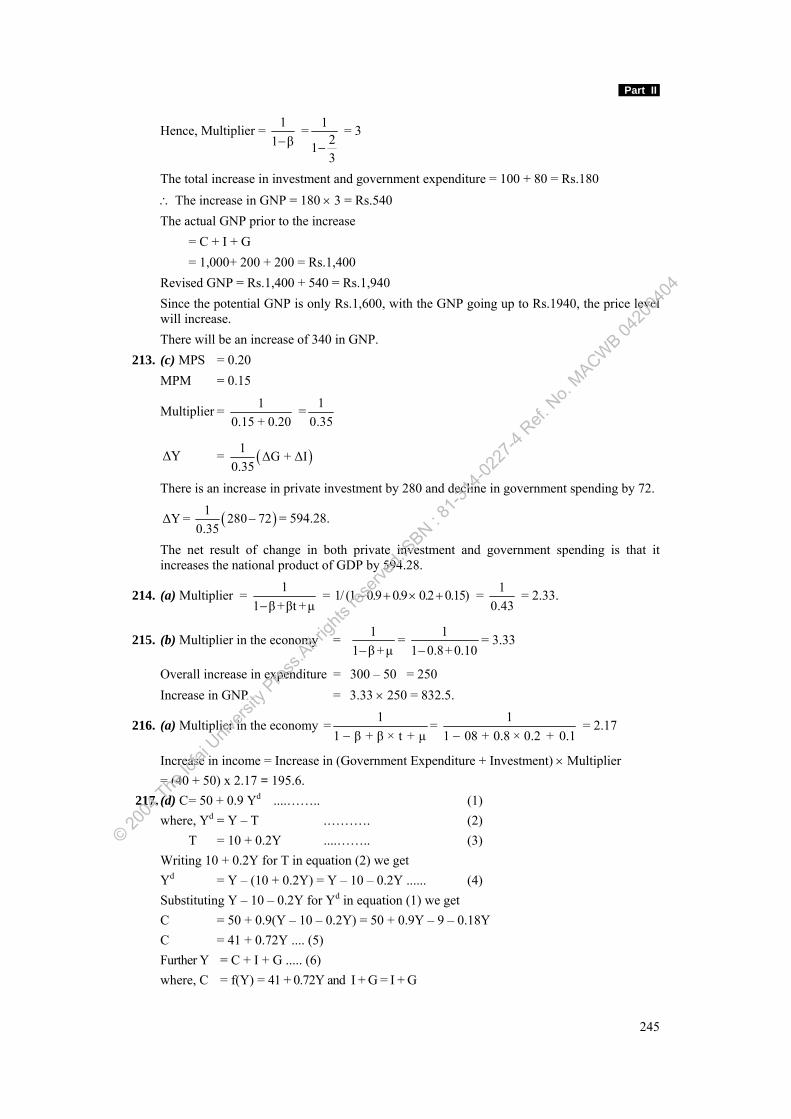
Part II
245
Hence, Multiplier = 11 β−
= 1213
− = 3
The total increase in investment and government expenditure = 100 + 80 = Rs.180 ∴ The increase in GNP = 180 × 3 = Rs.540 The actual GNP prior to the increase = C + I + G = 1,000+ 200 + 200 = Rs.1,400 Revised GNP = Rs.1,400 + 540 = Rs.1,940 Since the potential GNP is only Rs.1,600, with the GNP going up to Rs.1940, the price level
will increase. There will be an increase of 340 in GNP. 213. (c) MPS = 0.20 MPM = 0.15
Multiplier = 10.15 + 0.20
= 10.35
ΔY = ( )1 ΔG + ΔI0.35
There is an increase in private investment by 280 and decline in government spending by 72.
( )1ΔY = 280 720.35
− = 594.28.
The net result of change in both private investment and government spending is that it increases the national product of GDP by 594.28.
214. (a) Multiplier = 11 β+βt +μ−
= 1/ (1 − 0.9 + 0.9 × 0.2 + 0.15) = 10.43
= 2.33.
215. (b) Multiplier in the economy = 11 β+μ−
= 11 0.8+0.10−
= 3.33
Overall increase in expenditure = 300 – 50 = 250 Increase in GNP = 3.33 × 250 = 832.5.
216. (a) Multiplier in the economy = 11 β + β × t + μ−
= 11 08 + 0.8 × 0.2 + 0.1−
= 2.17
Increase in income = Increase in (Government Expenditure + Investment) × Multiplier = (40 + 50) x 2.17 = 195.6. 217. (d) C = 50 + 0.9 Yd ....…….. (1) where, Yd = Y – T .………. (2) T = 10 + 0.2Y ....…….. (3) Writing 10 + 0.2Y for T in equation (2) we get Yd = Y – (10 + 0.2Y) = Y – 10 – 0.2Y ...... (4) Substituting Y – 10 – 0.2Y for Yd in equation (1) we get C = 50 + 0.9(Y – 10 – 0.2Y) = 50 + 0.9Y – 9 – 0.18Y C = 41 + 0.72Y .... (5) Further Y = C + I + G ..... (6) where, C = f(Y) = 41 + 0.72Y and I + G = I + G
© 2004
The Ic
fai U
nivers
ity P
ress.A
ll righ
ts res
erved
.ISBN : 8
1-314
-0227
-4 Ref.
No.
MACWB 04
2004
04
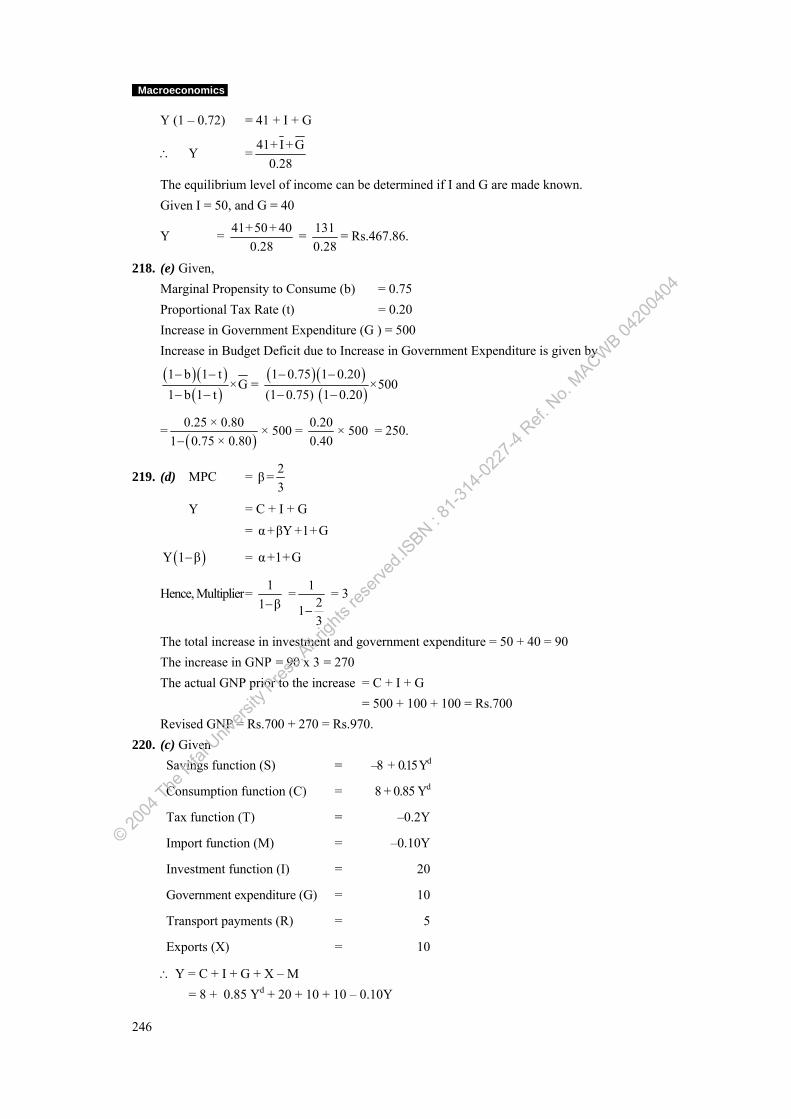
Macroeconomics
246
Y (1 – 0.72) = 41 + I + G
∴ Y = 41+ I +G0.28
The equilibrium level of income can be determined if I and G are made known. Given I = 50, and G = 40
Y = 41+50 + 400.28
= 1310.28
= Rs.467.86.
218. (e) Given, Marginal Propensity to Consume (b) = 0.75 Proportional Tax Rate (t) = 0.20 Increase in Government Expenditure (G ) = 500 Increase in Budget Deficit due to Increase in Government Expenditure is given by
( )( )
( )1 b 1 t
×G1 b 1 t
− −
− −=
( )( )( )
1 0.75 1 0.20×500
(1 0.75) 1 0.20− −
− −
=( )0.25 × 0.80 × 500
1 0.75 × 0.80−= 0.20 × 500
0.40 = 250.
219. (d) MPC = 2β=3
Y = C + I + G = α+βY +1+ G
( )Y 1 β− = α+1+G
Hence, Multiplier = 11 β−
= 1213
− = 3
The total increase in investment and government expenditure = 50 + 40 = 90 The increase in GNP = 90 x 3 = 270 The actual GNP prior to the increase = C + I + G = 500 + 100 + 100 = Rs.700 Revised GNP = Rs.700 + 270 = Rs.970. 220. (c) Given
Savings function (S) = –8 + 0.15 Yd
Consumption function (C) = 8 + 0.85 Yd
Tax function (T) = –0.2Y
Import function (M) = –0.10Y
Investment function (I) = 20
Government expenditure (G) = 10
Transport payments (R) = 5
Exports (X) = 10
∴ Y = C + I + G + X – M = 8 + 0.85 Yd + 20 + 10 + 10 – 0.10Y
© 2004
The Ic
fai U
nivers
ity P
ress.A
ll righ
ts res
erved
.ISBN : 8
1-314
-0227
-4 Ref.
No.
MACWB 04
2004
04
Part II
247
= 8 + 0.85 [(Y – T) + R] + 20 + 10 + 10 – 0.10Y = 8 + 0.85 [(Y – 0.2Y) + 5] + 20 + 10 + 10 – 0.10Y = 8 + 0.85 [0.8Y + 5] + 20 + 10 + 10 – 0.10Y = 8 + 0.68Y + 4.25 + 20 + 10 + 10 – 0.10Y = 52.25 – 0.58Y Y – 0.58Y = 52.25 0.42Y = 52.25
∴ Y = 52.250.42
= 124.40
∴ Taxes = 124.40 x 0.2 = 24.88 ∴ Budget deficit = Govt. expenditure + Transfer payments – Taxes = 10 + 5 – 24.88 = –9.88.
221. (c) Multiplier in the economy = 11 MPC + MPI−
MPC = 0.90 MPI = 0.10
Multiplier = 11 0.90 + 0.10−
= 5
With an autonomous increase in investment of 200, the level of income will increase by, 5 × 200 = 1,000 The increase in imports will be 0.1 x 1,000 = 100. 222. (a) When the consumption is at a steady state level Ct = Ct–1 ∴ Consumption function is Ct = 20 + 0.75Ydt + 0.15Ct 0.85Ct = 20 + 0.75Ydt Ct = 23.53 + 0.88Ydt ΔCt = 0.88 × ΔYdt If Ydt increases from 700 to 900 ΔYdt = 200 ∴ ΔCt = 0.88 × 200 = 176. The steady state level consumption increases by 176. 223. (d) Y = C + I + G + E – M Y = C0 + βY+ I + G + E – M
Y – βY = C0 + I + G + E – M = Co + I + G + E M
1 β
⎡ ⎤−⎣ ⎦−
Y = 140 + 0.8Y + 75 + 35 + 30 – 25
Y = 2250.2
= 1,275.
224. (e) C = 50 + 0.8Yd …………….. (1) where Yd = Y – T …………….. (2) T = 10 + 0.3Y …………….. (3) Writing 10 + 0.3Y in equation (2) we get, Yd = Y – (10 + 0.3Y) = Y – 10 – 0.3Y …………….. (4)
© 2004
The Ic
fai U
nivers
ity P
ress.A
ll righ
ts res
erved
.ISBN : 8
1-314
-0227
-4 Ref.
No.
MACWB 04
2004
04
Macroeconomics
248
Substituting Y – 10 – 0.3Y for Yd in equation (1) we get, C = 50 + 0.8(Y – 10 – 0.3Y) = 50 + 0.8(Y – 9 – 0.24Y) C = 41 + 0.56Y …………….. (5) Further Y = C + I + G …………….. (6) where C = f(Y) = 41 + 0.56Y and
I + G = I + G
Y(1 – 0.56) = 41 + I + G
Y = 41+ I +G0.44
The equilibrium level of income can be determined if I and G are known.
Substitute the given values of I and G .
Y = 41+ 60 + 450.44
= 1460.44
Y = 331.8. 225. (c) Savings is equal to investment at equilibrium. Therefore, S = –500 + 0.2Y = I = 100 ⇒ 0.2 Y = 600 Y = 3,000. 226. (a) Change in income (ΔY ) = 200 lakh Change in Investment (ΔI ) = 20 lakh
Multiplier (K) = ΔY 200=ΔI 20
= 10
K = 1 =10MPS
MPS = 1/10 = 0.10 MPC = 1 – MPS = 1 – 0.10 = 0.90.
227. (d) MPC = ΔCΔY
ΔC is the change in consumption and ΔY is the change in Income = 900 = 0.901,000
Multiplier (K) = 1 1=1 MPC 1 0.9− −
= 10
When investment increases by Rs.100 crore, change or increase in aggregate income (ΔY) and aggregate consumption is
ΔY = K Δ I ΔYK=ΔI
⎛ ⎞∴⎜ ⎟⎝ ⎠
= 10 × 100 = 1,000 crore.
228. (c) GNP (Y) = C + I + G + (X – M) Consumption function = 20 + 0.75 Yd Tax function = 0.3 Y Import function = 0.18 Y Substituting above figures in equation
© 2004
The Ic
fai U
nivers
ity P
ress.A
ll righ
ts res
erved
.ISBN : 8
1-314
-0227
-4 Ref.
No.
MACWB 04
2004
04
Part II
249
Y = 20 + 0.75 Yd + 50 + 20+ 22 – 0.18Y = 20 + 0.75 [(Y – T) + R] + 50 + 20 + 22 – 0.18Y = 20 + 0.75 [(Y – 0.30 Y) + 10] + 40 + 20 + 22 – 0.18Y = 20 + 0.525Y + 7.5 + 50 + 20+ 22 – 0.18Y Y = 119.5 + 0.345Y Y = 182.44 Taxes = 0.30 × 182.44 = 54.73 Budget deficit/surplus = Taxes – (Government expenditure + Transfer payments) = 54.73 – 20 + 10 Surplus = 24.73. 229. (d) MPC = β
β = C − 90/Yd = 850 − 90/1000 = 0.76
Multiplier = 11 MPC−
= 11 .76−
Multiplier = 4.17.
230. (b) Multiplier in the economy = 11 β+μ−
where β = 0.78 (Consumption function)
μ = 0.15 (import function)
= 11 0.78+ 0.15−
= 2.70
Overall increase in expenditure = (500 – 75) = 425 Increase in GNP = 425 x 2.70 = 1147.5. 231. (e) We know that Y = C + I + G + X – M Y = 280 + 0.75Y + 75 + 0.15Y + 94 + 126 – 0.20Y Y = 575 + 0.75Y 0.25Y = 575 Y =2,300 When there is an exogenous increase in exports to the extent of 30, the change in equilibrium
income will be as follows: 0.25Y = (575 + 30) = 605 Y = 2,420 Increase in equilibrium income is 120 (i.e., 2,420 – 2,300) Foreign trade multiplier: = ΔY/ΔX = 120 /30 Foreign Trade multiplier = 4. 232. (c) Y = C + I + G + E – M where, Y = Equilibrium income in the economy C = Consumption function I = Investment function
© 2004
The Ic
fai U
nivers
ity P
ress.A
ll righ
ts res
erved
.ISBN : 8
1-314
-0227
-4 Ref.
No.
MACWB 04
2004
04
Macroeconomics
250
G = Government expenditure
E = Exports M = Import function The equilibrium income is also expressed as
Y = α + β (Y + R ) + η + πY + G + E − μY
where, α = 460 β = (1 – 0.3) = 0.7 η = 18 π = 0.1
G = 162
R = 48
E = 25 μ = 0.05
Y = ( )
1 α + βR + G + E η1 β π + μ
⎡ ⎤−⎣ ⎦− −
( )
[ ]1Y = 460 + (48×0.7) + 162 + 48 181 0.7 0.1 + 0.05
⇒ −− −
= 1
0.25 × 685.6 = 2,742.4.
233. (d) I = 78 – 230i ........ (1) S = – 62 + 0.25Y ...…. (2) Under equilibrium conditions (1) = (2) ∴ 78 – 230i = –62 + 0.25 Y 0.25Y = 140 – 220 i
Y = 140 220 i0.25 0.25
− = 560 – 880i
At I = 10%; Y = 560 – 88 = 472.
234. (c) Multiplier = 1MPS + MPI
∴ Multiplier = 10.30 + 0.12
= 2.38
Change in level of income = 150 × 2.38 = 357 Change in level of imports = MPI × Increase in income = 0.12 × 357 = 42.84. 235. (c) Increase in income at the equilibrium level = 4,800 – 1,200 = 3,600 Increase in consumption at equilibrium = (4,800 – 1,400) – 1,200 = 2,200 Marginal Propensity to consume (MPC) = Change in consumption/Change in income
© 2004
The Ic
fai U
nivers
ity P
ress.A
ll righ
ts res
erved
.ISBN : 8
1-314
-0227
-4 Ref.
No.
MACWB 04
2004
04
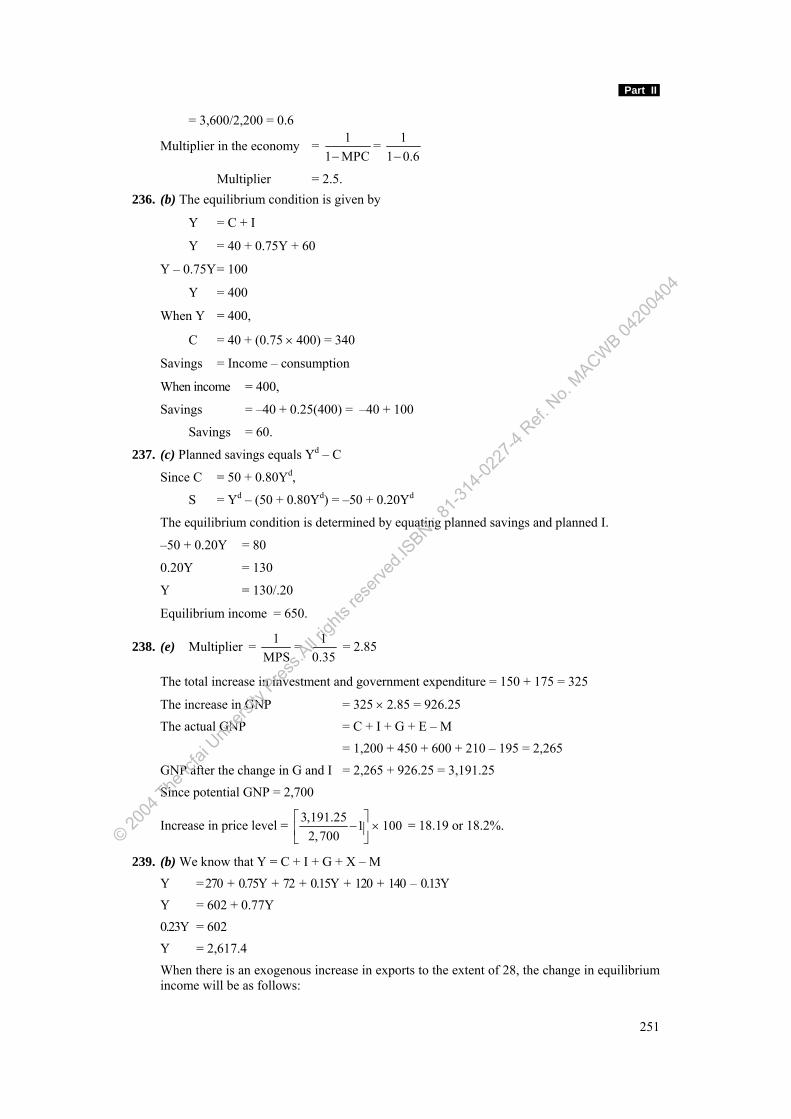
Part II
251
= 3,600/2,200 = 0.6
Multiplier in the economy = 11 MPC−
= 11 0.6−
Multiplier = 2.5. 236. (b) The equilibrium condition is given by
Y = C + I
Y = 40 + 0.75Y + 60
Y – 0.75Y = 100
Y = 400
When Y = 400,
C = 40 + (0.75 × 400) = 340
Savings = Income – consumption
When income = 400,
Savings = –40 + 0.25(400) = –40 + 100
Savings = 60.
237. (c) Planned savings equals Yd – C
Since C = 50 + 0.80Yd,
S = Yd – (50 + 0.80Yd) = –50 + 0.20Yd
The equilibrium condition is determined by equating planned savings and planned I.
–50 + 0.20Y = 80
0.20Y = 130
Y = 130/.20
Equilibrium income = 650.
238. (e) Multiplier = 1MPS
= 10.35
= 2.85
The total increase in investment and government expenditure = 150 + 175 = 325
The increase in GNP = 325 × 2.85 = 926.25 The actual GNP = C + I + G + E – M
= 1,200 + 450 + 600 + 210 – 195 = 2,265
GNP after the change in G and I = 2,265 + 926.25 = 3,191.25
Since potential GNP = 2,700
Increase in price level = 3,191.25 1 1002,700
⎡ ⎤− ×⎢ ⎥
⎣ ⎦ = 18.19 or 18.2%.
239. (b) We know that Y = C + I + G + X – M Y = 270 + 0.75Y + 72 + 0.15Y + 120 + 140 – 0.13Y Y = 602 + 0.77Y 0.23Y = 602 Y = 2,617.4 When there is an exogenous increase in exports to the extent of 28, the change in equilibrium
income will be as follows:
© 2004
The Ic
fai U
nivers
ity P
ress.A
ll righ
ts res
erved
.ISBN : 8
1-314
-0227
-4 Ref.
No.
MACWB 04
2004
04
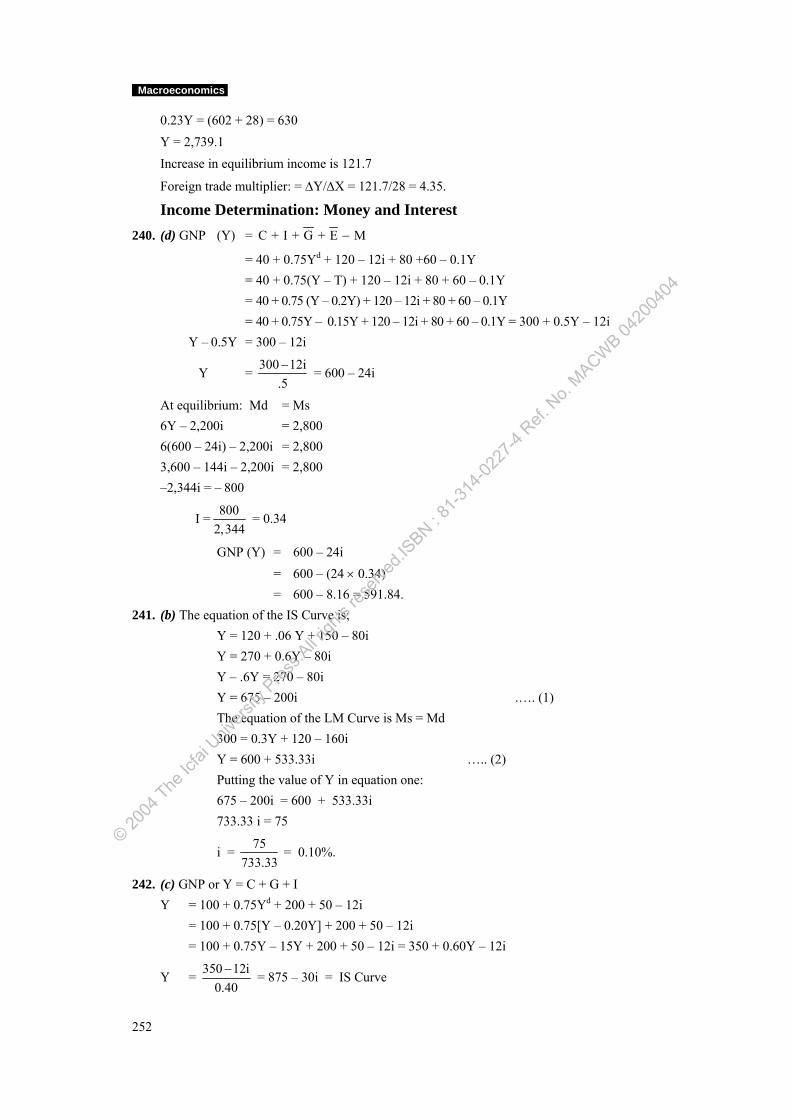
Macroeconomics
252
0.23Y = (602 + 28) = 630 Y = 2,739.1 Increase in equilibrium income is 121.7
Foreign trade multiplier: = ΔY/ΔX = 121.7/28 = 4.35.
Income Determination: Money and Interest 240. (d) GNP (Y) = C + I + G + E M−
= 40 + 0.75Yd + 120 – 12i + 80 +60 – 0.1Y = 40 + 0.75(Y – T) + 120 – 12i + 80 + 60 – 0.1Y = 40 + 0.75 (Y – 0.2Y) + 120 – 12i + 80 + 60 – 0.1Y = 40 + 0.75Y – 0.15Y + 120 – 12i + 80 + 60 – 0.1Y = 300 + 0.5Y – 12i
Y – 0.5Y = 300 – 12i
Y = 300 12i.5− = 600 – 24i
At equilibrium: Md = Ms 6Y – 2,200i = 2,800 6(600 – 24i) – 2,200i = 2,800 3,600 – 144i – 2,200i = 2,800 –2,344i = – 800
I = 8002,344
= 0.34
GNP (Y) = 600 – 24i = 600 – (24 × 0.34) = 600 – 8.16 = 591.84.
241. (b) The equation of the IS Curve is; Y = 120 + .06 Y + 150 – 80i Y = 270 + 0.6Y – 80i Y – .6Y = 270 – 80i Y = 675 – 200i .…. (1) The equation of the LM Curve is Ms = Md 300 = 0.3Y + 120 – 160i Y = 600 + 533.33i ….. (2) Putting the value of Y in equation one: 675 – 200i = 600 + 533.33i 733.33 i = 75
i = 75733.33
= 0.10%.
242. (c) GNP or Y = C + G + I Y = 100 + 0.75Yd + 200 + 50 – 12i
= 100 + 0.75[Y – 0.20Y] + 200 + 50 – 12i = 100 + 0.75Y – 15Y + 200 + 50 – 12i = 350 + 0.60Y – 12i
Y = 350 12i0.40
− = 875 – 30i = IS Curve
© 2004
The Ic
fai U
nivers
ity P
ress.A
ll righ
ts res
erved
.ISBN : 8
1-314
-0227
-4 Ref.
No.
MACWB 04
2004
04
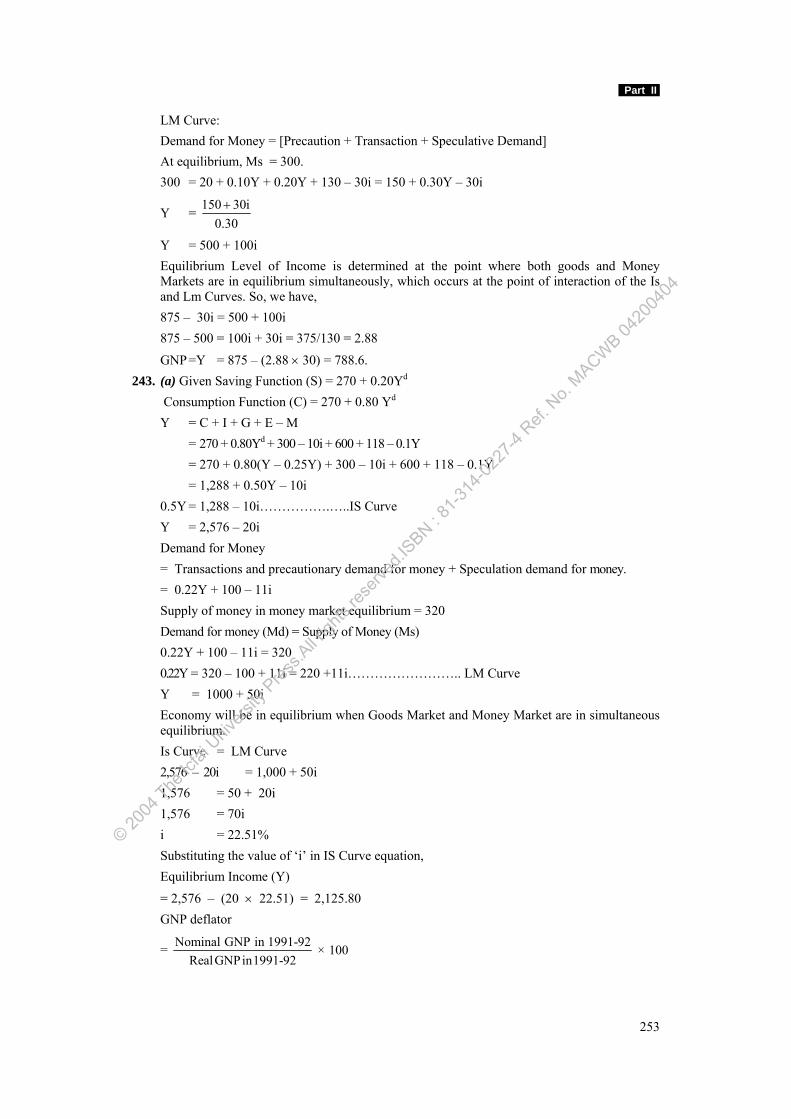
Part II
253
LM Curve: Demand for Money = [Precaution + Transaction + Speculative Demand] At equilibrium, Ms = 300. 300 = 20 + 0.10Y + 0.20Y + 130 – 30i = 150 + 0.30Y – 30i
Y = 150 30i0.30
+
Y = 500 + 100i Equilibrium Level of Income is determined at the point where both goods and Money
Markets are in equilibrium simultaneously, which occurs at the point of interaction of the Is and Lm Curves. So, we have,
875 – 30i = 500 + 100i 875 – 500 = 100i + 30i = 375/130 = 2.88
GNP =Y = 875 – (2.88 × 30) = 788.6. 243. (a) Given Saving Function (S) = 270 + 0.20Yd Consumption Function (C) = 270 + 0.80 Yd Y = C + I + G + E – M = 270 + 0.80Yd + 300 – 10i + 600 + 118 – 0.1Y = 270 + 0.80(Y – 0.25Y) + 300 – 10i + 600 + 118 – 0.1Y = 1,288 + 0.50Y – 10i 0.5Y = 1,288 – 10i…………….…..IS Curve Y = 2,576 – 20i Demand for Money = Transactions and precautionary demand for money + Speculation demand for money. = 0.22Y + 100 – 11i Supply of money in money market equilibrium = 320 Demand for money (Md) = Supply of Money (Ms) 0.22Y + 100 – 11i = 320 0.22Y = 320 – 100 + 11i = 220 +11i…………………….. LM Curve Y = 1000 + 50i Economy will be in equilibrium when Goods Market and Money Market are in simultaneous
equilibrium. Is Curve = LM Curve 2,576 – 20i = 1,000 + 50i 1,576 = 50 + 20i 1,576 = 70i i = 22.51% Substituting the value of ‘i’ in IS Curve equation, Equilibrium Income (Y)
= 2,576 – (20 × 22.51) = 2,125.80 GNP deflator
= Nominal GNP in 1991-92 × 100RealGNPin1991-92
© 2004
The Ic
fai U
nivers
ity P
ress.A
ll righ
ts res
erved
.ISBN : 8
1-314
-0227
-4 Ref.
No.
MACWB 04
2004
04
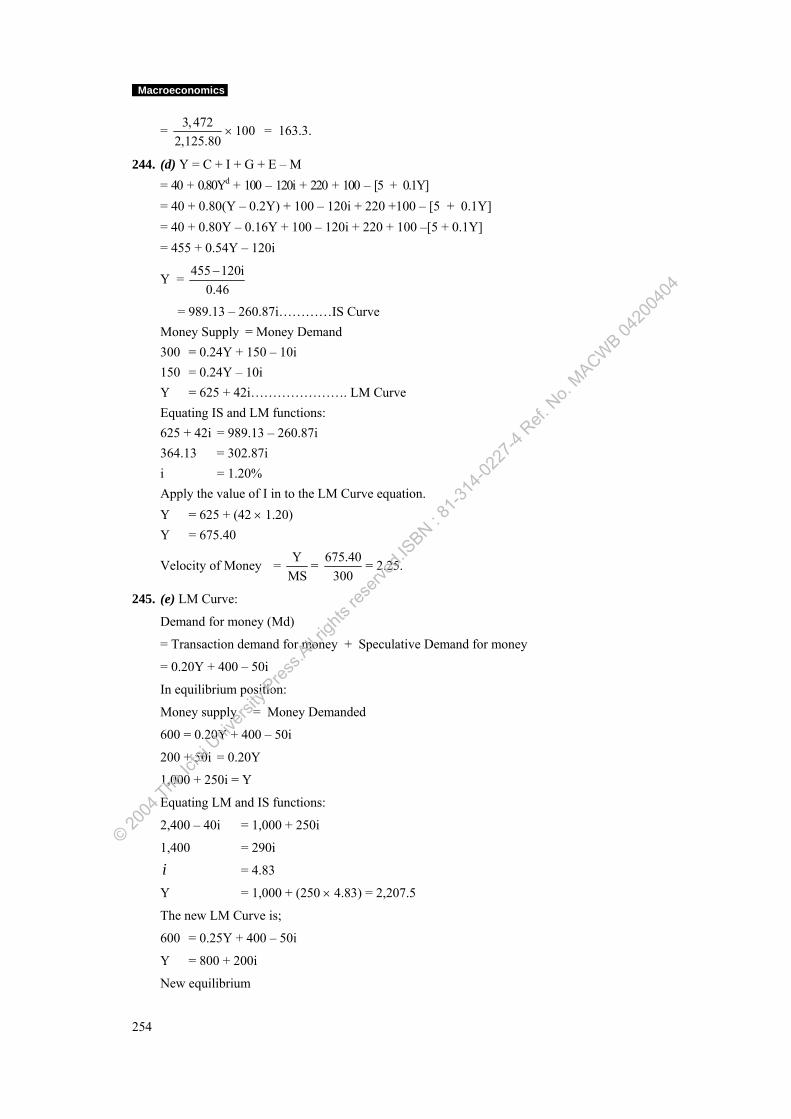
Macroeconomics
254
= 3, 472 1002,125.80
× = 163.3.
244. (d) Y = C + I + G + E – M = 40 + 0.80Yd + 100 – 120i + 220 + 100 – [5 + 0.1Y] = 40 + 0.80(Y – 0.2Y) + 100 – 120i + 220 +100 – [5 + 0.1Y] = 40 + 0.80Y – 0.16Y + 100 – 120i + 220 + 100 –[5 + 0.1Y] = 455 + 0.54Y – 120i
Y = 455 120i0.46
−
= 989.13 – 260.87i…………IS Curve Money Supply = Money Demand 300 = 0.24Y + 150 – 10i 150 = 0.24Y – 10i Y = 625 + 42i…………………. LM Curve Equating IS and LM functions: 625 + 42i = 989.13 – 260.87i 364.13 = 302.87i i = 1.20% Apply the value of I in to the LM Curve equation. Y = 625 + (42 × 1.20) Y = 675.40
Velocity of Money = YMS
= 675.40300
= 2.25.
245. (e) LM Curve:
Demand for money (Md)
= Transaction demand for money + Speculative Demand for money
= 0.20Y + 400 – 50i
In equilibrium position:
Money supply = Money Demanded
600 = 0.20Y + 400 – 50i
200 + 50i = 0.20Y
1,000 + 250i = Y
Equating LM and IS functions:
2,400 – 40i = 1,000 + 250i
1,400 = 290i
i = 4.83
Y = 1,000 + (250 × 4.83) = 2,207.5
The new LM Curve is;
600 = 0.25Y + 400 – 50i
Y = 800 + 200i
New equilibrium
© 2004
The Ic
fai U
nivers
ity P
ress.A
ll righ
ts res
erved
.ISBN : 8
1-314
-0227
-4 Ref.
No.
MACWB 04
2004
04
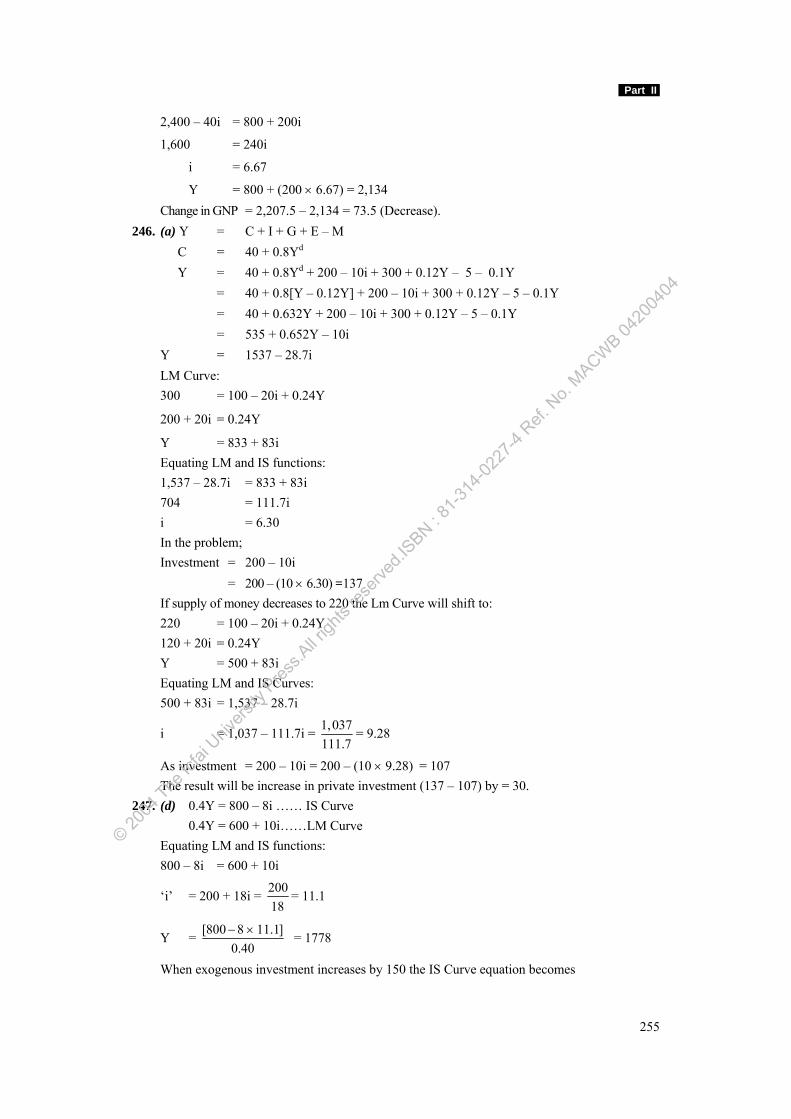
Part II
255
2,400 – 40i = 800 + 200i
1,600 = 240i
i = 6.67
Y = 800 + (200 × 6.67) = 2,134 Change in GNP = 2,207.5 – 2,134 = 73.5 (Decrease). 246. (a) Y = C + I + G + E – M C = 40 + 0.8Yd Y = 40 + 0.8Yd + 200 – 10i + 300 + 0.12Y – 5 – 0.1Y = 40 + 0.8[Y – 0.12Y] + 200 – 10i + 300 + 0.12Y – 5 – 0.1Y = 40 + 0.632Y + 200 – 10i + 300 + 0.12Y – 5 – 0.1Y = 535 + 0.652Y – 10i Y = 1537 – 28.7i LM Curve: 300 = 100 – 20i + 0.24Y
200 + 20i = 0.24Y
Y = 833 + 83i Equating LM and IS functions: 1,537 – 28.7i = 833 + 83i 704 = 111.7i i = 6.30 In the problem; Investment = 200 – 10i = 200 – (10 × 6.30) =137 If supply of money decreases to 220 the Lm Curve will shift to: 220 = 100 – 20i + 0.24Y 120 + 20i = 0.24Y Y = 500 + 83i Equating LM and IS Curves: 500 + 83i = 1,537 – 28.7i
i = 1,037 – 111.7i = 1,037111.7
= 9.28
As investment = 200 – 10i = 200 – (10 × 9.28) = 107 The result will be increase in private investment (137 – 107) by = 30. 247. (d) 0.4Y = 800 – 8i …… IS Curve 0.4Y = 600 + 10i……LM Curve Equating LM and IS functions: 800 – 8i = 600 + 10i
‘i’ = 200 + 18i = 20018
= 11.1
Y = [800 8 11.1]0.40− × = 1778
When exogenous investment increases by 150 the IS Curve equation becomes
© 2004
The Ic
fai U
nivers
ity P
ress.A
ll righ
ts res
erved
.ISBN : 8
1-314
-0227
-4 Ref.
No.
MACWB 04
2004
04
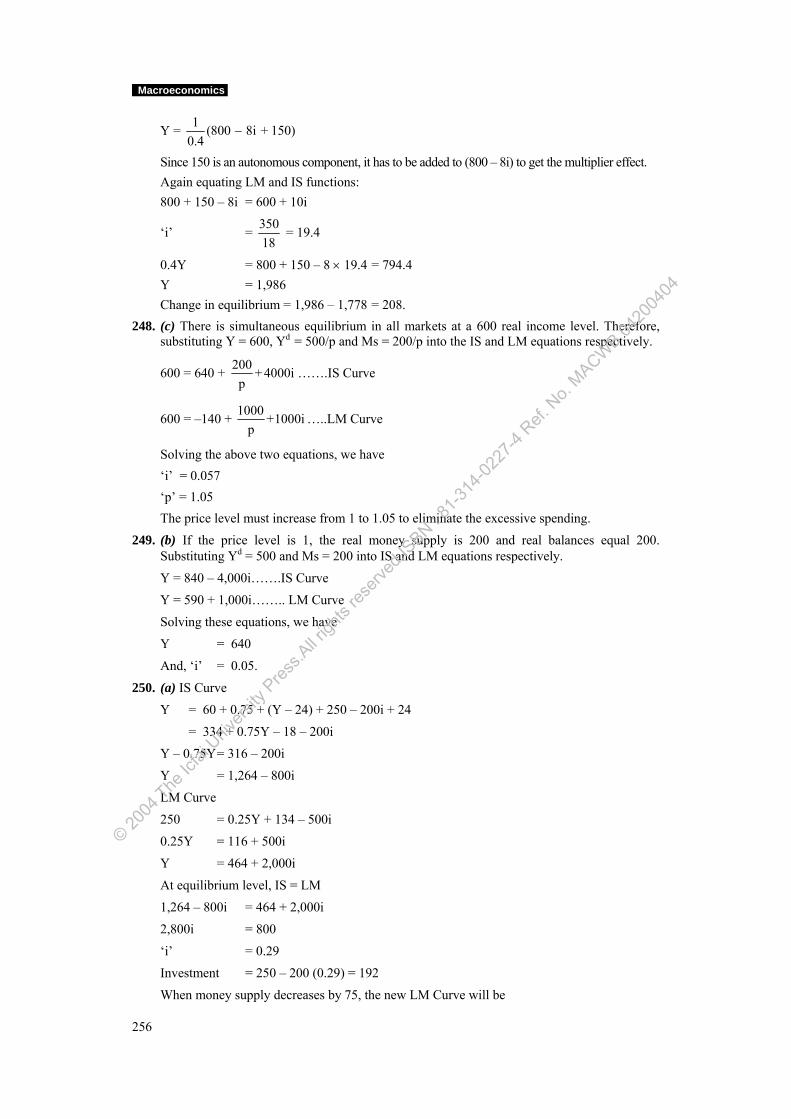
Macroeconomics
256
Y = 1 (800 8i + 150)0.4
−
Since 150 is an autonomous component, it has to be added to (800 – 8i) to get the multiplier effect. Again equating LM and IS functions: 800 + 150 – 8i = 600 + 10i
‘i’ = 35018
= 19.4
0.4Y = 800 + 150 – 8 × 19.4 = 794.4 Y = 1,986 Change in equilibrium = 1,986 – 1,778 = 208. 248. (c) There is simultaneous equilibrium in all markets at a 600 real income level. Therefore,
substituting Y = 600, Yd = 500/p and Ms = 200/p into the IS and LM equations respectively.
600 = 640 + 200 + 4000ip
…….IS Curve
600 = –140 + 1000 +1000ip
…..LM Curve
Solving the above two equations, we have ‘i’ = 0.057 ‘p’ = 1.05 The price level must increase from 1 to 1.05 to eliminate the excessive spending. 249. (b) If the price level is 1, the real money supply is 200 and real balances equal 200.
Substituting Yd = 500 and Ms = 200 into IS and LM equations respectively.
Y = 840 – 4,000i…….IS Curve
Y = 590 + 1,000i…….. LM Curve
Solving these equations, we have
Y = 640
And, ‘i’ = 0.05.
250. (a) IS Curve
Y = 60 + 0.75 + (Y – 24) + 250 – 200i + 24
= 334 + 0.75Y – 18 – 200i
Y – 0.75Y = 316 – 200i
Y = 1,264 – 800i
LM Curve
250 = 0.25Y + 134 – 500i
0.25Y = 116 + 500i
Y = 464 + 2,000i
At equilibrium level, IS = LM
1,264 – 800i = 464 + 2,000i
2,800i = 800
‘i’ = 0.29
Investment = 250 – 200 (0.29) = 192
When money supply decreases by 75, the new LM Curve will be
© 2004
The Ic
fai U
nivers
ity P
ress.A
ll righ
ts res
erved
.ISBN : 8
1-314
-0227
-4 Ref.
No.
MACWB 04
2004
04
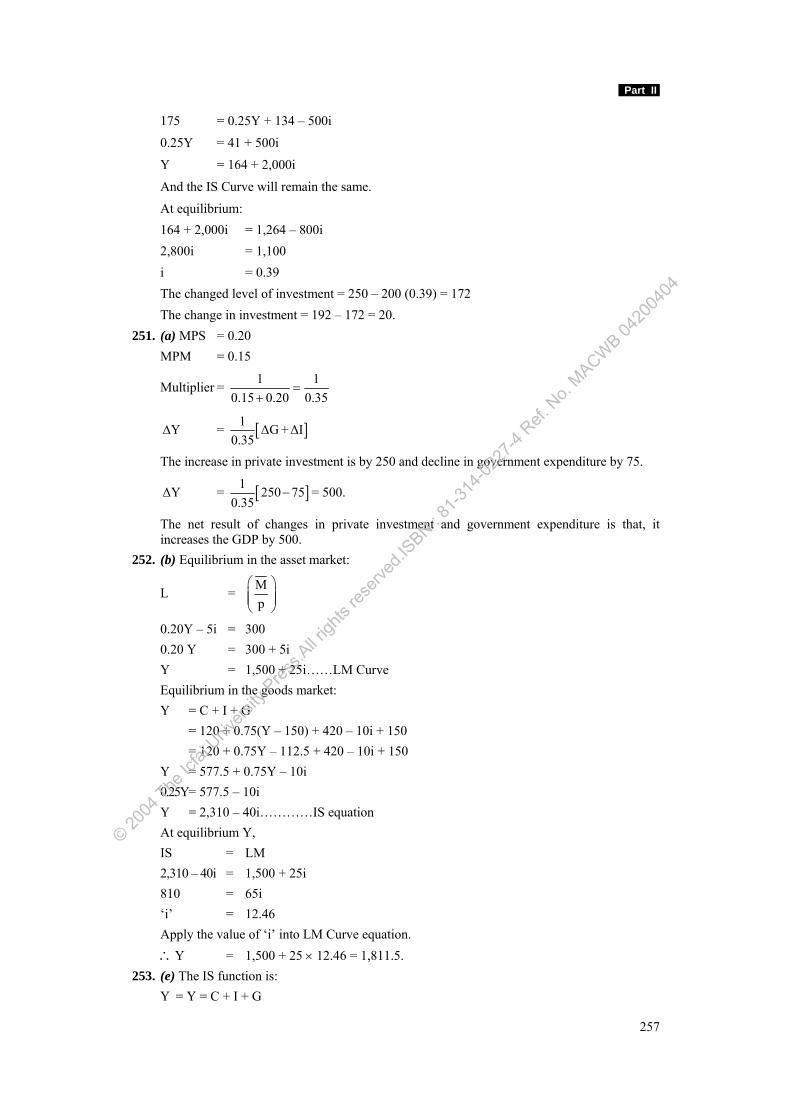
Part II
257
175 = 0.25Y + 134 – 500i
0.25Y = 41 + 500i
Y = 164 + 2,000i
And the IS Curve will remain the same.
At equilibrium: 164 + 2,000i = 1,264 – 800i 2,800i = 1,100 i = 0.39 The changed level of investment = 250 – 200 (0.39) = 172 The change in investment = 192 – 172 = 20. 251. (a) MPS = 0.20 MPM = 0.15
Multiplier = 1 10.15 0.20 0.35
=+
YΔ = [ ]1 ΔG +ΔI0.35
The increase in private investment is by 250 and decline in government expenditure by 75.
ΔY = [ ]1 250 750.35
− = 500.
The net result of changes in private investment and government expenditure is that, it increases the GDP by 500.
252. (b) Equilibrium in the asset market:
L = Mp
⎛ ⎞⎜ ⎟⎜ ⎟⎝ ⎠
0.20Y – 5i = 300 0.20 Y = 300 + 5i Y = 1,500 + 25i……LM Curve Equilibrium in the goods market: Y = C + I + G = 120 + 0.75(Y – 150) + 420 – 10i + 150 = 120 + 0.75Y – 112.5 + 420 – 10i + 150 Y = 577.5 + 0.75Y – 10i 0.25Y = 577.5 – 10i Y = 2,310 – 40i…………IS equation At equilibrium Y, IS = LM 2,310 – 40i = 1,500 + 25i 810 = 65i ‘i’ = 12.46 Apply the value of ‘i’ into LM Curve equation. ∴Y = 1,500 + 25 × 12.46 = 1,811.5. 253. (e) The IS function is: Y = Y = C + I + G
© 2004
The Ic
fai U
nivers
ity P
ress.A
ll righ
ts res
erved
.ISBN : 8
1-314
-0227
-4 Ref.
No.
MACWB 04
2004
04
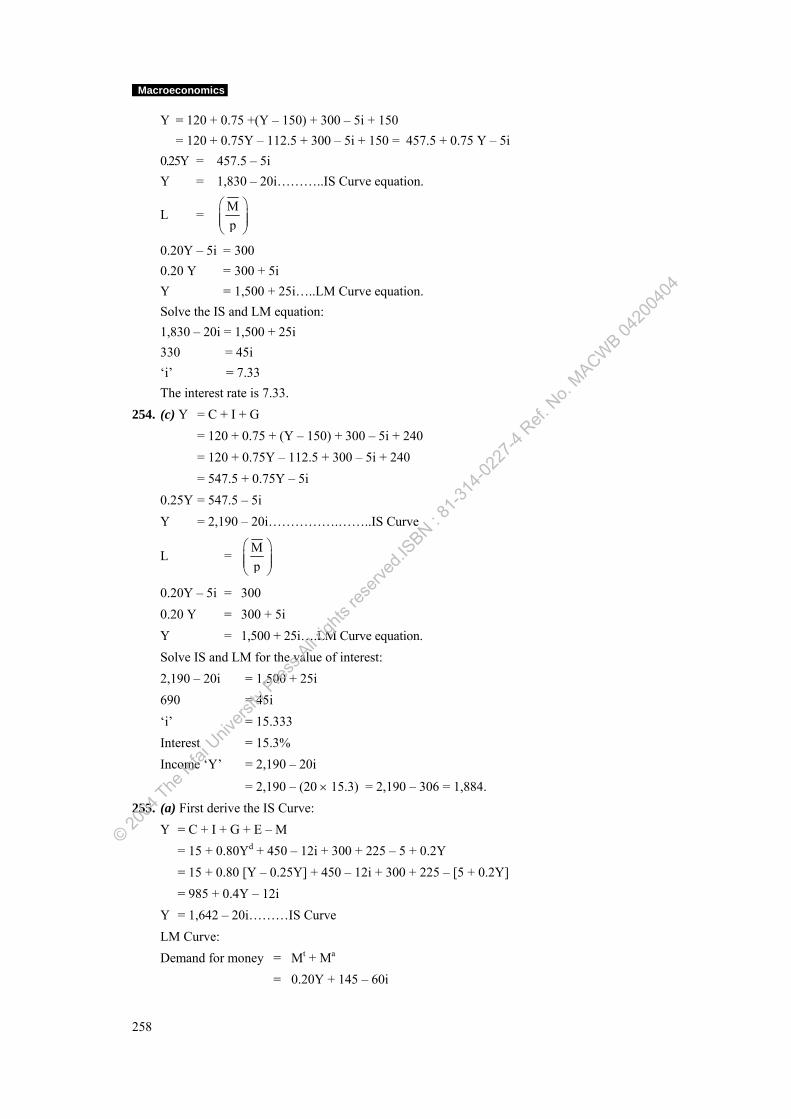
Macroeconomics
258
Y = 120 + 0.75 +(Y – 150) + 300 – 5i + 150 = 120 + 0.75Y – 112.5 + 300 – 5i + 150 = 457.5 + 0.75 Y – 5i 0.25Y = 457.5 – 5i Y = 1,830 – 20i………..IS Curve equation.
L = Mp
⎛ ⎞⎜ ⎟⎜ ⎟⎝ ⎠
0.20Y – 5i = 300 0.20 Y = 300 + 5i Y = 1,500 + 25i…..LM Curve equation. Solve the IS and LM equation: 1,830 – 20i = 1,500 + 25i 330 = 45i ‘i’ = 7.33 The interest rate is 7.33. 254. (c) Y = C + I + G = 120 + 0.75 + (Y – 150) + 300 – 5i + 240 = 120 + 0.75Y – 112.5 + 300 – 5i + 240 = 547.5 + 0.75Y – 5i 0.25Y = 547.5 – 5i Y = 2,190 – 20i…………….……..IS Curve
L = Mp
⎛ ⎞⎜ ⎟⎜ ⎟⎝ ⎠
0.20Y – 5i = 300 0.20 Y = 300 + 5i Y = 1,500 + 25i….LM Curve equation. Solve IS and LM for the value of interest: 2,190 – 20i = 1,500 + 25i 690 = 45i ‘i’ = 15.333 Interest = 15.3% Income ‘Y’ = 2,190 – 20i
= 2,190 – (20 × 15.3) = 2,190 – 306 = 1,884. 255. (a) First derive the IS Curve: Y = C + I + G + E – M = 15 + 0.80Yd + 450 – 12i + 300 + 225 – 5 + 0.2Y = 15 + 0.80 [Y – 0.25Y] + 450 – 12i + 300 + 225 – [5 + 0.2Y] = 985 + 0.4Y – 12i Y = 1,642 – 20i………IS Curve LM Curve: Demand for money = Mt + Ma = 0.20Y + 145 – 60i
© 2004
The Ic
fai U
nivers
ity P
ress.A
ll righ
ts res
erved
.ISBN : 8
1-314
-0227
-4 Ref.
No.
MACWB 04
2004
04
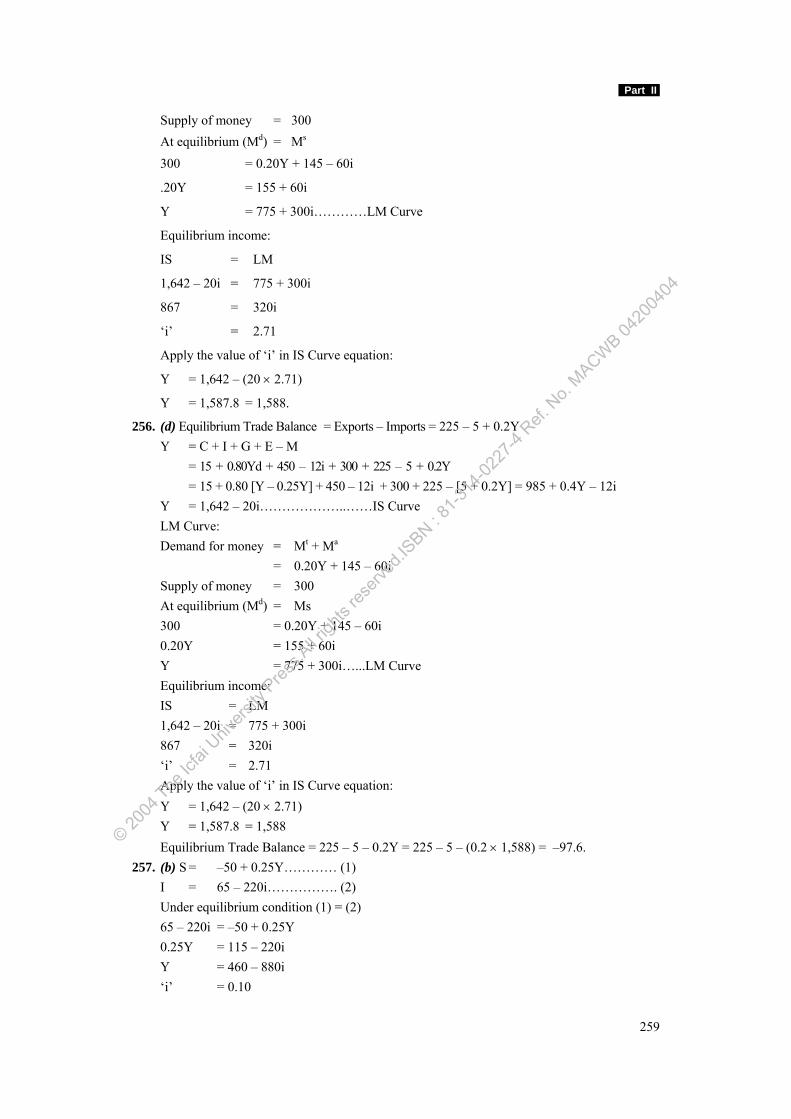
Part II
259
Supply of money = 300 At equilibrium (Md) = Ms 300 = 0.20Y + 145 – 60i
.20Y = 155 + 60i
Y = 775 + 300i…………LM Curve
Equilibrium income:
IS = LM
1,642 – 20i = 775 + 300i
867 = 320i
‘i’ = 2.71
Apply the value of ‘i’ in IS Curve equation:
Y = 1,642 – (20 × 2.71)
Y = 1,587.8 = 1,588.
256. (d) Equilibrium Trade Balance = Exports – Imports = 225 – 5 + 0.2Y Y = C + I + G + E – M = 15 + 0.80Yd + 450 – 12i + 300 + 225 – 5 + 0.2Y = 15 + 0.80 [Y – 0.25Y] + 450 – 12i + 300 + 225 – [5 + 0.2Y] = 985 + 0.4Y – 12i Y = 1,642 – 20i………………..……IS Curve LM Curve: Demand for money = Mt + Ma = 0.20Y + 145 – 60i Supply of money = 300 At equilibrium (Md) = Ms 300 = 0.20Y + 145 – 60i 0.20Y = 155 + 60i Y = 775 + 300i…...LM Curve Equilibrium income: IS = LM 1,642 – 20i = 775 + 300i 867 = 320i ‘i’ = 2.71 Apply the value of ‘i’ in IS Curve equation: Y = 1,642 – (20 × 2.71) Y = 1,587.8 = 1,588 Equilibrium Trade Balance = 225 – 5 – 0.2Y = 225 – 5 – (0.2 × 1,588) = –97.6. 257. (b) S = –50 + 0.25Y………… (1) I = 65 – 220i……………. (2) Under equilibrium condition (1) = (2) 65 – 220i = –50 + 0.25Y 0.25Y = 115 – 220i Y = 460 – 880i ‘i’ = 0.10
© 2004
The Ic
fai U
nivers
ity P
ress.A
ll righ
ts res
erved
.ISBN : 8
1-314
-0227
-4 Ref.
No.
MACWB 04
2004
04
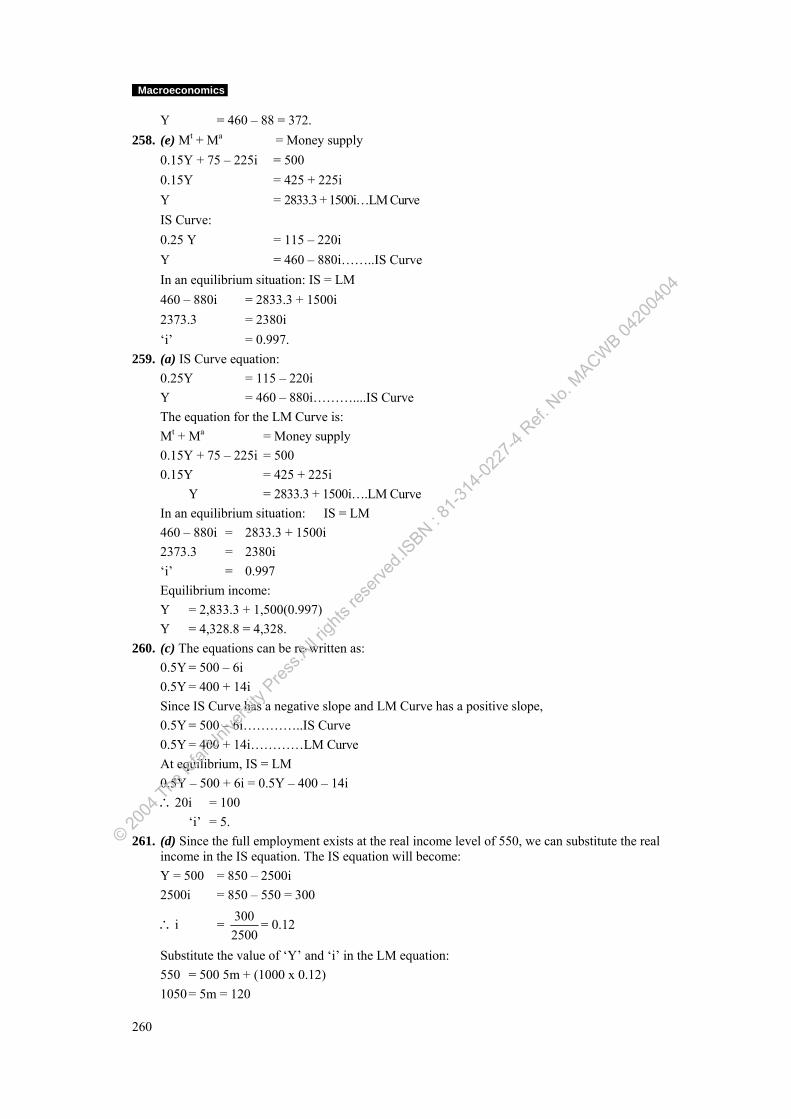
Macroeconomics
260
Y = 460 – 88 = 372. 258. (e) Mt + Ma = Money supply 0.15Y + 75 – 225i = 500 0.15Y = 425 + 225i Y = 2833.3 + 1500i…LM Curve IS Curve: 0.25 Y = 115 – 220i Y = 460 – 880i……..IS Curve In an equilibrium situation: IS = LM 460 – 880i = 2833.3 + 1500i 2373.3 = 2380i ‘i’ = 0.997. 259. (a) IS Curve equation: 0.25Y = 115 – 220i Y = 460 – 880i………....IS Curve The equation for the LM Curve is: Mt + Ma = Money supply 0.15Y + 75 – 225i = 500 0.15Y = 425 + 225i Y = 2833.3 + 1500i….LM Curve In an equilibrium situation: IS = LM 460 – 880i = 2833.3 + 1500i 2373.3 = 2380i ‘i’ = 0.997 Equilibrium income: Y = 2,833.3 + 1,500(0.997) Y = 4,328.8 = 4,328. 260. (c) The equations can be re-written as: 0.5Y = 500 – 6i 0.5Y = 400 + 14i Since IS Curve has a negative slope and LM Curve has a positive slope, 0.5Y = 500 – 6i…………..IS Curve 0.5Y = 400 + 14i…………LM Curve At equilibrium, IS = LM 0.5Y – 500 + 6i = 0.5Y – 400 – 14i ∴20i = 100 ‘i’ = 5. 261. (d) Since the full employment exists at the real income level of 550, we can substitute the real
income in the IS equation. The IS equation will become: Y = 500 = 850 – 2500i 2500i = 850 – 550 = 300
∴i = 3002500
= 0.12
Substitute the value of ‘Y’ and ‘i’ in the LM equation: 550 = 500 5m + (1000 x 0.12) 1050 = 5m = 120
© 2004
The Ic
fai U
nivers
ity P
ress.A
ll righ
ts res
erved
.ISBN : 8
1-314
-0227
-4 Ref.
No.
MACWB 04
2004
04
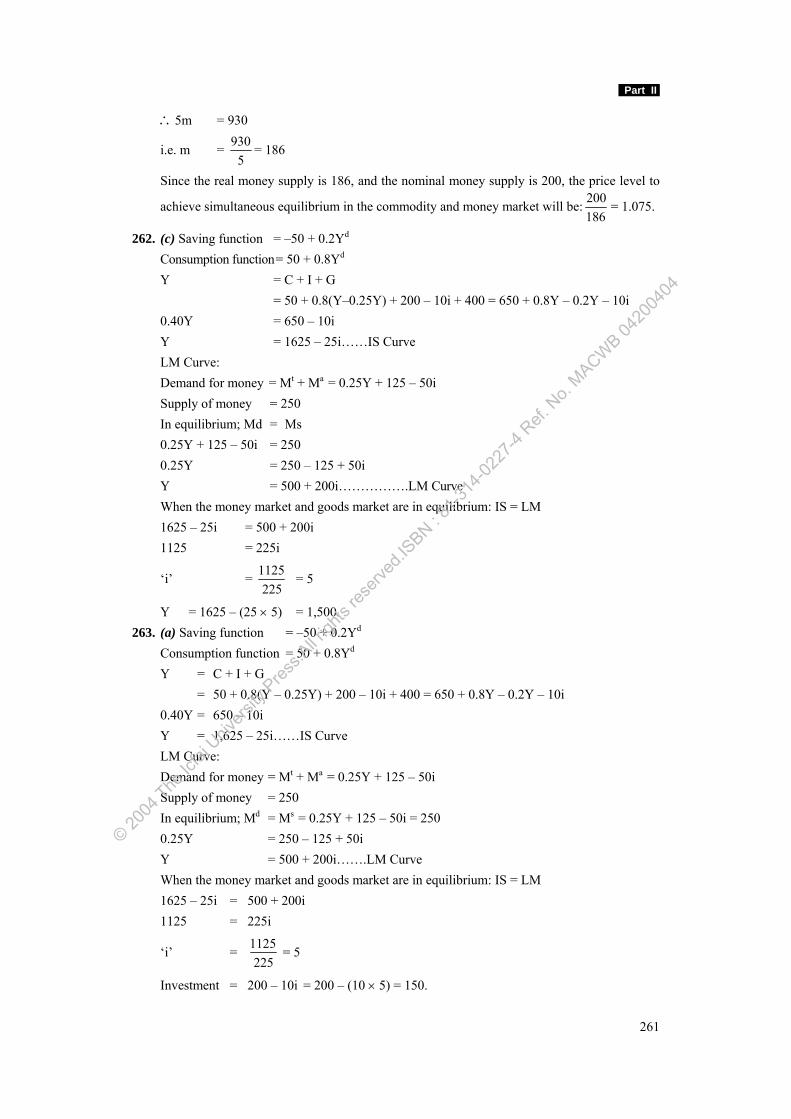
Part II
261
∴5m = 930
i.e. m = 9305
= 186
Since the real money supply is 186, and the nominal money supply is 200, the price level to
achieve simultaneous equilibrium in the commodity and money market will be: 200186
= 1.075.
262. (c) Saving function = –50 + 0.2Yd Consumption function = 50 + 0.8Yd Y = C + I + G = 50 + 0.8(Y–0.25Y) + 200 – 10i + 400 = 650 + 0.8Y – 0.2Y – 10i 0.40Y = 650 – 10i Y = 1625 – 25i……IS Curve LM Curve: Demand for money = Mt + Ma = 0.25Y + 125 – 50i Supply of money = 250 In equilibrium; Md = Ms 0.25Y + 125 – 50i = 250 0.25Y = 250 – 125 + 50i Y = 500 + 200i…………….LM Curve When the money market and goods market are in equilibrium: IS = LM 1625 – 25i = 500 + 200i 1125 = 225i
‘i’ = 1125225
= 5
Y = 1625 – (25 × 5) = 1,500. 263. (a) Saving function = –50 + 0.2Yd Consumption function = 50 + 0.8Yd Y = C + I + G = 50 + 0.8(Y – 0.25Y) + 200 – 10i + 400 = 650 + 0.8Y – 0.2Y – 10i 0.40Y = 650 – 10i Y = 1,625 – 25i……IS Curve LM Curve: Demand for money = Mt + Ma = 0.25Y + 125 – 50i Supply of money = 250 In equilibrium; Md = Ms = 0.25Y + 125 – 50i = 250 0.25Y = 250 – 125 + 50i Y = 500 + 200i…….LM Curve When the money market and goods market are in equilibrium: IS = LM 1625 – 25i = 500 + 200i 1125 = 225i
‘i’ = 1125225
= 5
Investment = 200 – 10i = 200 – (10 × 5) = 150.
© 2004
The Ic
fai U
nivers
ity P
ress.A
ll righ
ts res
erved
.ISBN : 8
1-314
-0227
-4 Ref.
No.
MACWB 04
2004
04
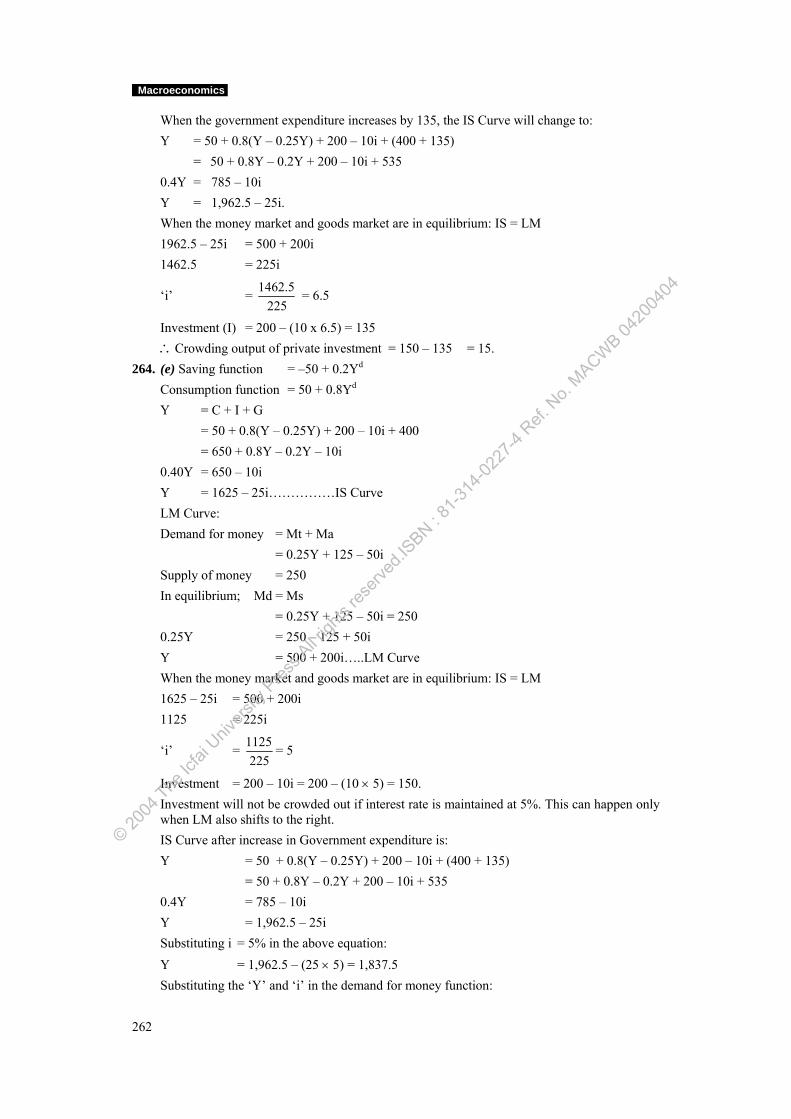
Macroeconomics
262
When the government expenditure increases by 135, the IS Curve will change to: Y = 50 + 0.8(Y – 0.25Y) + 200 – 10i + (400 + 135) = 50 + 0.8Y – 0.2Y + 200 – 10i + 535 0.4Y = 785 – 10i Y = 1,962.5 – 25i. When the money market and goods market are in equilibrium: IS = LM 1962.5 – 25i = 500 + 200i 1462.5 = 225i
‘i’ = 1462.5225
= 6.5
Investment (I) = 200 – (10 x 6.5) = 135 ∴Crowding output of private investment = 150 – 135 = 15. 264. (e) Saving function = –50 + 0.2Yd Consumption function = 50 + 0.8Yd Y = C + I + G = 50 + 0.8(Y – 0.25Y) + 200 – 10i + 400 = 650 + 0.8Y – 0.2Y – 10i 0.40Y = 650 – 10i Y = 1625 – 25i……………IS Curve LM Curve: Demand for money = Mt + Ma = 0.25Y + 125 – 50i Supply of money = 250 In equilibrium; Md = Ms = 0.25Y + 125 – 50i = 250 0.25Y = 250 – 125 + 50i Y = 500 + 200i…..LM Curve When the money market and goods market are in equilibrium: IS = LM 1625 – 25i = 500 + 200i 1125 = 225i
‘i’ = 1125225
= 5
Investment = 200 – 10i = 200 – (10 × 5) = 150. Investment will not be crowded out if interest rate is maintained at 5%. This can happen only
when LM also shifts to the right. IS Curve after increase in Government expenditure is: Y = 50 + 0.8(Y – 0.25Y) + 200 – 10i + (400 + 135) = 50 + 0.8Y – 0.2Y + 200 – 10i + 535 0.4Y = 785 – 10i Y = 1,962.5 – 25i Substituting i = 5% in the above equation: Y = 1,962.5 – (25 × 5) = 1,837.5 Substituting the ‘Y’ and ‘i’ in the demand for money function:
© 2004
The Ic
fai U
nivers
ity P
ress.A
ll righ
ts res
erved
.ISBN : 8
1-314
-0227
-4 Ref.
No.
MACWB 04
2004
04
Part II
263
Md(Mt + Ma) = 0.25 Y +125 – 50i = (0.25 × 1837.5) +125 – (50 × 5) = 459.38 + 125 – 250 Md = 334.38. Since money supply should cover demand for money, money supply should be increased
to 334.38. So increase in Money supply = 334.38 – 250 = 84.38. 265. (d) IS Curve: Y = C + I + G + E – M = 20 + 0.75Yd +500 – 15i + 400 +260 – 10 + 0.1Y = 20 + 0.75(Y – 0.2Y) + 500 – 15i + 400 + 260 – 10 – 0.1Y = 1,170 + 0.5Y – 15i = 0.5Y = 1,170 – 15i……….is Curve Y = 2,340 – 30i LM Curve: Demand for money (Md) = Ms 0.25Y + 125 – 50i = 250 0.25Y = 250 – 125 + 50i Supply of money (Ms) in equilibrium: Md = Ms 0.25Y + 125 – 50i =250 0.25Y = 250 – 125 + 50i Y = 500 + 200i………LM Curve Equilibrium Income At equilibrium, IS = LM 2,340 – 30i = 500 + 200i 1,840 = 230i
i = 1,840230
= 8%.
266. (e) IS Curve: Y = C + I + G + E – M = 20 + 0.75Yd +500 – 15i + 400 +260 – 10 + 0.1Y = 20 + 0.75(Y – 0.2Y) + 500 – 15i + 400 + 260 – 10 – 0.1Y = 1,170 + 0.5Y – 15i = 0.5Y = 1,170 – 15i……….is Curve Y = 2,340 – 30i LM Curve Demand for money (Md) = Ms 0.25Y + 125 – 50i = 250 0.25Y = 250 – 125 + 50i Supply of money (Ms) in equilibrium: Md = Ms 0.25Y + 125 – 50i = 250 0.25Y = 250 – 125 +50i Y = 500 + 200i…LM Curve Equilibrium Income:
© 2004
The Ic
fai U
nivers
ity P
ress.A
ll righ
ts res
erved
.ISBN : 8
1-314
-0227
-4 Ref.
No.
MACWB 04
2004
04
Macroeconomics
264
At equilibrium: IS = LM 2,340 – 30i = 500 + 200i 1,840 = 230i
i = 1,840230
= 8%
Apply the value of interest in IS Curve equation. Y = 2340 – (30 x 8) = 2,100. 267. (b) Equilibrium Trade Balance = E – M = 260 – 10 + 0.1Y IS Curve:
Y = C + I + G + E – M
= 20 + 0.75Yd +500 – 15i + 400 +260 – 10 + 0.1Y
= 20 + 0.75(Y – 0.2Y) + 500 – 15i + 400 + 260 – 10 – 0.1Y
= 1,170 + 0.5Y – 15i = 0.5Y = 1,170 – 15i……….is Curve Y = 2,340 – 30i LM Curve: Demand for money (Md) = Ms 0.25Y + 125 – 50i = 250 0.25Y = 250 – 125 + 50i Supply of money (Ms) in equilibrium: Md = Ms
0.25Y + 125 – 50i = 250
0.25Y = 250 – 125 +50i
Y = 500 + 200i…..LM Curve
Equilibrium Income:
At equilibrium, IS = LM 2,340 – 30i = 500 + 200i 1,840 = 230i
i = 1,840230
= 8%
Apply the value of interest in IS Curve equation.
Y = 2340 – (30 × 8) = 2,100
E – M = 260 – [10 + (0.1 × 2,100)] = 260 – 220 = 40. 268. (d) IS Curve Y = C + I + G + E – M When the exogenous government expenditure increases by 115 the IS Curve will change to:
Y = 20 + 0.75Yd + 500 – 15i + (400 + 115) + 260 – 10 + 0.1Y
= 20 + 0.75(Y – 0.2Y) + 500 – 15i + 515 + 260 – 10 – 0.1Y
= 1,285 + 0.5Y – 15i
= 2570 – 30i…………………….IS Curve
Demand for money (Md) = Ms
© 2004
The Ic
fai U
nivers
ity P
ress.A
ll righ
ts res
erved
.ISBN : 8
1-314
-0227
-4 Ref.
No.
MACWB 04
2004
04
Part II
265
0.25Y + 125 – 50i = 250
0.25Y = 250 – 125 +50i
Supply of money (Ms) in equilibrium: Md = Ms
0.25Y + 125 – 50i = 250
0.25Y = 250 – 125 +50i
Y = 500 + 200i………LM Curve
At equilibrium:
2,570 – 30i = 500 + 200i
230i = 2,070
i = 2070230
= 9%
Thus, an increase in Govt. expenditure will increase the equilibrium rate of interest to 9%. The equilibrium Investment will be = 500 – (15 × 9) = 500 – 135 = 365. 269. (a) To retain the same level of investment after the increase in govt. expenditure, the interest
rate should be maintained in the same rate and money supply should be increased. IS Curve Y = C + I + G + E – M When the exogenous government expenditure increases by 115 the IS Curve will change to: Y = 20 + 0.75Yd +500 – 15i + (400 + 115) + 260 – 10 + 0.1Y = 20 + 0.75(Y – 0.2Y) + 500 – 15i + 515 + 260 – 10 – 0.1Y = 1,285 + 0.5Y – 15i = 2570 – 30i…………………IS Curve The new IS Curve will be: Y = 2,570 – 30i = 2,570 – (30 × 8) = 2,330 In the money market, the demand for money will be = 0.25Y + 125 – 50i = (0.25 × 2,330) + 125 – (50 × 8) = 582.5 + 125 – 400 = 307.5 The money supply should be increased from 250 to 307.5. 270. (c) The IS Curve: Y = C + I + G = 80 + 0.75Yd + 300 – 200i + 30 = 80 + 0.75(Y – 30) + 300 – 200i +30 0.25 Y = 387.5 – 200i Y = 1550 – 800i……………IS Curve LM Curve: Ms = Mt + Ma 270 = 0.30Y + 150 – 300i 0.30Y = 270 – 150 + 300i 0.30Y = 120 + 300i
© 2004
The Ic
fai U
nivers
ity P
ress.A
ll righ
ts res
erved
.ISBN : 8
1-314
-0227
-4 Ref.
No.
MACWB 04
2004
04
Macroeconomics
266
Y = 400 + 1000i Equating IS and LM: 1550 – 800i = 400 + 1000i 1800i = 1150
i = 11501800
Investment (I) = 300 – 200i
= 300 – 200 × 11501800
= 300 – 128 = 172.
271. (d) IS Curve: Y = 60 + 0.75 (Y – 24) + 250 – 200i + 24 Y = 334 + 0.75Y – 18 – 200i 0.25Y = 316 – 200i Y = 1264 + 800i LM Curve: = 0.25Y + 134 – 500i 0.25Y = 116 + 500i Y = 446 + 2000i At equilibrium: 1,264 – 800i = 464 + 2000i
i = 8002800
= 0.285 = 0.29
Investment = 250 – 200 x (0.29) = 192. 272. (d) IS Curve: Y = 60 + 0.75(Y – 24) + 250 – 200i +24 Y = 334 + 0.75Y – 18 – 200i 0.25Y = 316 – 200i Y = 1264 + 800i LM Curve: 200 = 0.25Y + 134 – 500i 0.25Y = 66 + 500i Y = 264 + 2000i At equilibrium: 1264 – 800i = 264 + 2000i 2800i = 1000 i = 1000/2800 = 0.36 The equilibrium income is: Y = 1264 + 800i = 1264 + [800 x (0.36)] = 1552. 273. (b) Quantity of money available for speculative balance: = Money Supply – Transaction Demand for Money at Income Level of 700. Transaction demand for money = 700 × 0.20 = 140. Money available for speculative balances = 250 – 140 = 110
© 2004
The Ic
fai U
nivers
ity P
ress.A
ll righ
ts res
erved
.ISBN : 8
1-314
-0227
-4 Ref.
No.
MACWB 04
2004
04
Part II
267
So at the income level of 700 the money available for speculative balance is 110. 274. (a) Quantity of money available for speculative balance: = Money Supply – Transaction Demand for Money at Income Level of 700 Transaction demand for money = 900 × 0.25 = 225 Money available for speculative balances = 250 – 225 = 25 So at the income level of 900 the money available for speculative balance is 25. 275. (a) Since full employment exists at 650 real income level, we can substitute the real income
in the IS equation. Y = 850 – 2500i 650 = 850 – 2500i 2500i = 200 i = 200/2500 = 0.08. We can now substitute Y = 650 and i = 0.08 in the LM equation which will determine
whether simultaneous equilibrium is there in the market. Y = –500 + 5m + 1000i 650 = –500 + 5m + (1000 × 0.8) 650 = –500 + 5m + 80 5m = 1070 m = 1070/5 = 214 Since the nominal money supply is 200 while the real money supply is 214, all markets will
be in equilibrium when the price level is 200/214 = 0.934. 276. (d) Savings function (S) = 720 + 0.3Yd Consumption function (C) = 720 + 0.7Yd
Y = C + I + G + E – X = 720 + 0.7Yd + 20 + 0.10Y + 200 + 25 – 0.05Y = 720 + 0.7(Y – 0.2Y + 50) + 20 + 0.10Y + 200 + 25 – 0.05Y = 720 + 0.56Y + 35 + 20 + 0.10Y + 200 + 25 – 0.05Y = 1000 + 0.61Y 0.39Y = 1000 …………IS Curve Y = 2564.10 Note that consumption function is given as interest inelastic. So IS Curve will be a horizontal
line in the r-Y plane. This means equilibrium output will be determined solely in the goods market and the position of LM Curve does not matter for the determination of equilibrium output.
Hence, equilibrium level of income = 2564.10. 277. (b) Trade Balance = Exports – Imports. = 25 – 0.05Y Y = equilibrium income Savings function (S) = 720 + 0.3Yd Consumption function (C) = 720 + 0.7Yd
Y = C + I + G + E – X = 720 + 0.7Yd + 20 + 0.10Y + 200 + 25 – 0.05Y = 720 + 0.7(Y – 0.2Y + 50) + 20 + 0.10Y + 200 + 25 – 0.05Y = 720 + 0.56Y + 35 + 20 + 0.10Y + 200 + 25 – 0.05Y = 1000 + 0.61Y 0.39Y = 1000 …………IS Curve
© 2004
The Ic
fai U
nivers
ity P
ress.A
ll righ
ts res
erved
.ISBN : 8
1-314
-0227
-4 Ref.
No.
MACWB 04
2004
04
Macroeconomics
268
Y = 2564.10 Trade Balance = 25 – (2564.10 × 0.05) = –103.205. 278. (e) Budget surplus = T – ( G + R )
= 0.2Y – (200 + 50)
Y = C + I + G + E – X = 720 + 0.7Yd + 20 + 0.10Y + 200 + 25 – 0.05Y = 720 + 0.7(Y – 0.2Y + 50) + 20 + 0.10Y + 200 + 25 – 0.05Y = 720 + 0.56Y + 35 + 20 + 0.10Y + 200 + 25 – 0.05Y = 1000 + 0.61Y 0.39Y = 1000 …………IS Curve Y = 2564.10 Budget surplus = (0.2 × 2564.10) – (200 + 50) = 512.82 – 250 = 262.82. 279. (a) Given the saving function (S) = – 420 + 0.2Yd + 6i Consumption function (C) = 420 + 0.8Yd – 6i Thus the IS Curve will be: Y = C + I + G + (E – M) = 420 + 0.8Yd – 6i + 0.2Y + 2000 + (1400 – 0.1Y) = 420 + 0.8(Y – 0.2Y + 100) – 6i + 0.2Y – 20i + 2000 +1400 – 0.1Y = 420 + 0.64Y + 80 – 6i + 0.2Y – 20i + 2000 + 1400 – 0.1Y = 3900 + 0.74Y – 26i 0.26Y = 3900 – 26i Y = (3900/0.26) – (26i/0.26) Y = 15000 – 100i ………………IS Curve LM Curve equation: 450 = 0.15Y – 225i 0.15Y = 450 + 225i Y = (450/0.15) + (225i/0.15) Y = 3000 + 1500i …………. LM Curve Economy will be in equilibrium position when goods market and Money market are in
simultaneous equilibrium. Thus at equilibrium: IS = LM 15000 – 100i = 3000 + 1500i 1600i = 12000 i = 12000/1600 = 7.5 Substituting the value of i in IS Curve: Y = 15000 – (100 × 7.5) = 14,250 Consumption at equilibrium =420 + 0.8Yd – 6i = 420 + 0.8[14250 – (0.2 × 14250) + 100 )] – (6 × 7.5) = 420 + 0.80(14250 – 2850 + 100) – (6 × 7.5) = 420 + 9200 – 45 = 9575. 280. (d) Private investment at equilibrium = 0.2Y – 20i
© 2004
The Ic
fai U
nivers
ity P
ress.A
ll righ
ts res
erved
.ISBN : 8
1-314
-0227
-4 Ref.
No.
MACWB 04
2004
04
Part II
269
Consumption function (C) = 420 + 0.8Yd – 6i Thus the IS Curve will be: Y = C + I + G + (E – M) = 420 + 0.8Yd – 6i + 0.2Y + 2000 + (1400 – 0.1Y) = 420 + 0.8(Y – 0.2Y + 100) – 6i + 0.2Y – 20i + 2000 +1400 – 0.1Y = 420 + 0.64Y + 80 – 6i + 0.2Y – 20i + 2000 + 1400 – 0.1Y = 3900 + 0.74Y – 26i 0.26Y = 3900 – 26i Y = (3900/0.26) – (26i/0.26) Y = 15000 – 100i………………IS Curve LM Curve equation: 451 = 0.15Y – 225i 0.15Y = 450 + 225i Y = (450/0.15) + (225i/0.15) Y = 3000 + 1500i………………LM Curve Thus at equilibrium: IS = LM 15000 – 100i = 3000 + 1500i 1600i = 12000 i = 12000/1600 = 7.5 Substituting the value of ‘i’ in IS Curve: Y = 15000 – (100 × 7.5) = 14,250 Private investment at equilibrium = (0.2 × 14,250) – (20 × 7.5) = 2850 – 150 = 2700.
281. (b) Demand for money = 0.15Y – (– 225i)
Y = C + I + G + (E – M)
= 420 + 0.8Yd – 6i + 0.2Y + 2000 + (1400 – 0.1Y)
= 420 + 0.8(Y – 0.2Y + 100) – 6i + 0.2Y – 20i + 2000 +1400 – 0.1Y
= 420 + 0.64Y + 80 – 6i + 0.2Y – 20i + 2000 + 1400 – 0.1Y
= 3900 + 0.74Y – 26i
0.26Y = 3900 – 26i
Y = (3900/0.26) – (26i/0.26)
Y = 15000 – 100i………………IS Curve
LM Curve equation:
452 = 0.15Y – 225i
0.15Y = 450 + 225i
Y = (450/0.15) + (225i/0.15)
Y = 3000 + 1500i………….LM Curve
Thus at equilibrium: IS = LM
15000 – 100i = 3000 + 1500i
1600i = 12000
i = 12000/1600 = 7.5
© 2004
The Ic
fai U
nivers
ity P
ress.A
ll righ
ts res
erved
.ISBN : 8
1-314
-0227
-4 Ref.
No.
MACWB 04
2004
04
Macroeconomics
270
Substituting the value of ‘i’ in IS Curve,
Y = 15000 – (100 × 7.5) = 14,250
Demand for money = (0.15 × 14250) – (225 × 7.5)
= 2137.5 – 1687.5 = 450. 282. (e) Trade balance at equilibrium = Exports – Imports = 1400 – 0.1Y Y = C + I + G + (E – M) = 420 + 0.8Yd – 6i + 0.2Y + 2000 + (1400 – 0.1Y) = 420 + 0.8(Y – 0.2Y + 100) – 6i + 0.2Y – 20i + 2000 +1400 – 0.1Y = 420 + 0.64Y + 80 – 6i + 0.2Y – 20i + 2000 + 1400 – 0.1Y = 3900 + 0.74Y – 26i 0.26Y = 3900 – 26i Y = (3900/0.26) – (26i/0.26) Y = 15000 – 100i………………IS Curve LM Curve equation: 453 = 0.15Y – 225i 0.15Y = 450 + 225i Y = (450/0.15) + (225i/0.15) Y = 3000 + 1500i………….LM Curve Thus at equilibrium: IS = LM 15000 – 100i = 3000 + 1500i 1600i = 12000 i = 12000/1600 = 7.5 Substituting the value of ‘i’ in IS Curve, Y = 15000 – (100 × 7.5) = 14,250 Trade Balance at equilibrium: = 1400 – (0.1 x 14250) = –25. 283. (c) Given the saving function (S) = –20 + 0.25Yd
Consumption function (C) = 20 + 0.75Yd
Thus the IS curve will be:
Y = C + I + G + ( E – M)
Y = 20 + .75[Y – (–40 + 0.2Y)] + 240 – 10i + 300 +200 – 10 – 0.10Y
= 20 + 0.75 (Y + 40 – 0.2Y) + 240 – 10i + 300 + 200 – 10 – 0.10Y
= 20 + 0.75Y + 30 – 0.15Y + 240 – 10i + 300 + 200 – 10 – 0.10Y
Y = 780 + 0.5 – 10i
0.5Y = 780 – 10i……………………..IS curve
The money market will be in equilibrium when, supply of money (Ms) is equal to Transaction demand for money + speculation demand for money.
250 = 0.2Y + 50 – 16i
0.2Y = 200 + 16i……….…………..LM curve
Y = 1000 + 80i
When equilibrium is there, IS = LM
1560 – 20i = 1000 + 80i
© 2004
The Ic
fai U
nivers
ity P
ress.A
ll righ
ts res
erved
.ISBN : 8
1-314
-0227
-4 Ref.
No.
MACWB 04
2004
04
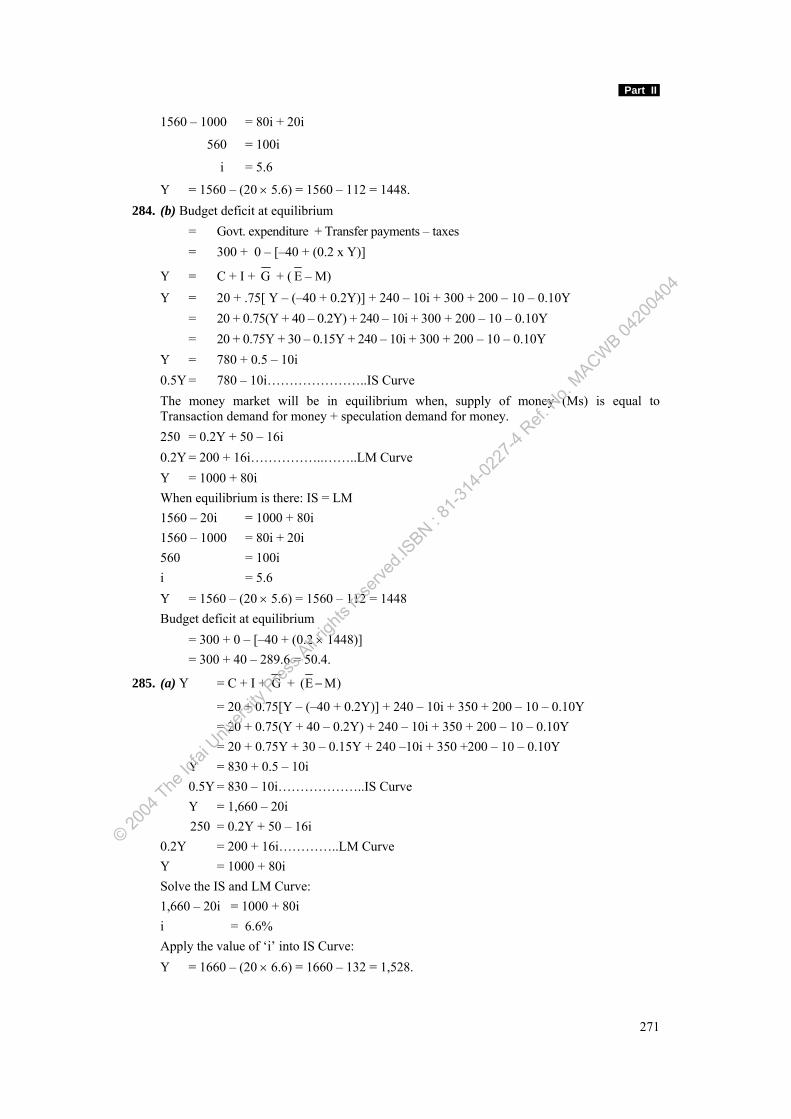
Part II
271
1560 – 1000 = 80i + 20i
560 = 100i
i = 5.6
Y = 1560 – (20 × 5.6) = 1560 – 112 = 1448. 284. (b) Budget deficit at equilibrium = Govt. expenditure + Transfer payments – taxes = 300 + 0 – [–40 + (0.2 x Y)]
Y = C + I + G + ( E – M) Y = 20 + .75[ Y – (–40 + 0.2Y)] + 240 – 10i + 300 + 200 – 10 – 0.10Y = 20 + 0.75(Y + 40 – 0.2Y) + 240 – 10i + 300 + 200 – 10 – 0.10Y = 20 + 0.75Y + 30 – 0.15Y + 240 – 10i + 300 + 200 – 10 – 0.10Y Y = 780 + 0.5 – 10i 0.5Y = 780 – 10i…………………..IS Curve The money market will be in equilibrium when, supply of money (Ms) is equal to
Transaction demand for money + speculation demand for money. 250 = 0.2Y + 50 – 16i 0.2Y = 200 + 16i……………..……..LM Curve Y = 1000 + 80i When equilibrium is there: IS = LM 1560 – 20i = 1000 + 80i 1560 – 1000 = 80i + 20i 560 = 100i i = 5.6 Y = 1560 – (20 × 5.6) = 1560 – 112 = 1448 Budget deficit at equilibrium = 300 + 0 – [–40 + (0.2 × 1448)] = 300 + 40 – 289.6 = 50.4.
285. (a) Y = C + I + G + (E M)−
= 20 + 0.75[Y – (–40 + 0.2Y)] + 240 – 10i + 350 + 200 – 10 – 0.10Y = 20 + 0.75(Y + 40 – 0.2Y) + 240 – 10i + 350 + 200 – 10 – 0.10Y = 20 + 0.75Y + 30 – 0.15Y + 240 –10i + 350 +200 – 10 – 0.10Y Y = 830 + 0.5 – 10i 0.5Y = 830 – 10i………………..IS Curve Y = 1,660 – 20i 250 = 0.2Y + 50 – 16i 0.2Y = 200 + 16i…………..LM Curve Y = 1000 + 80i Solve the IS and LM Curve: 1,660 – 20i = 1000 + 80i i = 6.6% Apply the value of ‘i’ into IS Curve: Y = 1660 – (20 × 6.6) = 1660 – 132 = 1,528.
© 2004
The Ic
fai U
nivers
ity P
ress.A
ll righ
ts res
erved
.ISBN : 8
1-314
-0227
-4 Ref.
No.
MACWB 04
2004
04
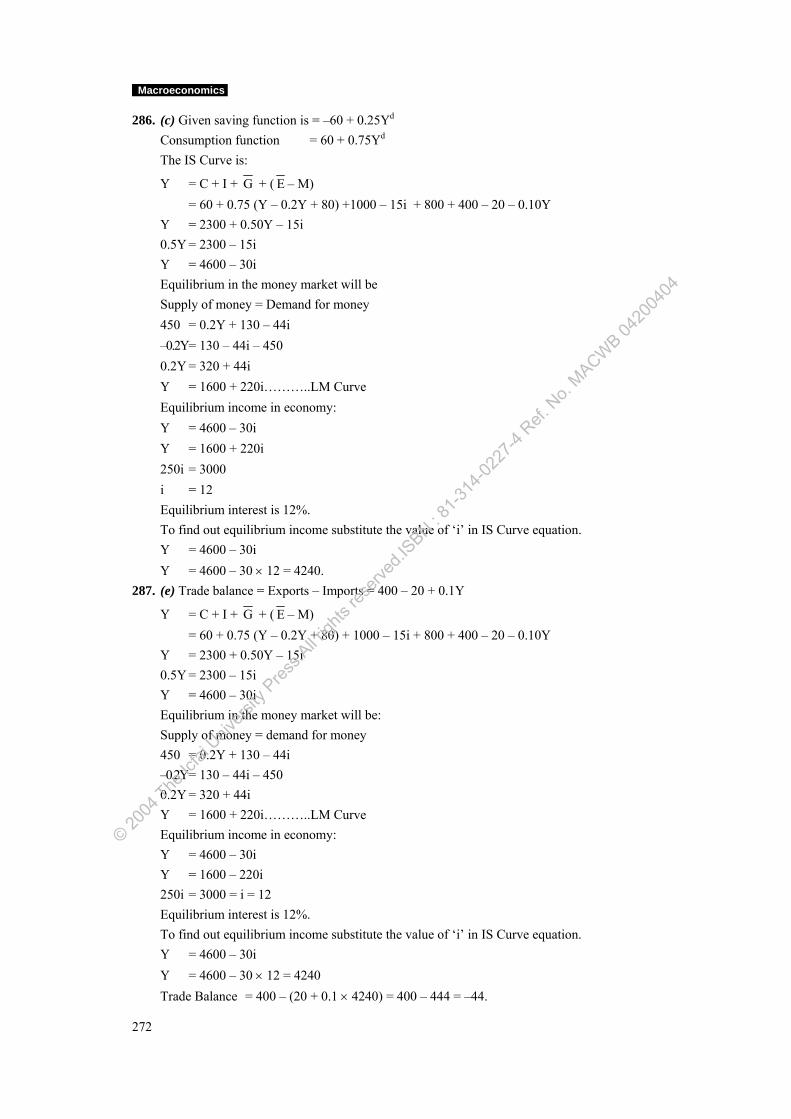
Macroeconomics
272
286. (c) Given saving function is = –60 + 0.25Yd Consumption function = 60 + 0.75Yd The IS Curve is:
Y = C + I + G + ( E – M) = 60 + 0.75 (Y – 0.2Y + 80) +1000 – 15i + 800 + 400 – 20 – 0.10Y Y = 2300 + 0.50Y – 15i 0.5Y = 2300 – 15i Y = 4600 – 30i Equilibrium in the money market will be Supply of money = Demand for money 450 = 0.2Y + 130 – 44i –0.2Y = 130 – 44i – 450 0.2Y = 320 + 44i Y = 1600 + 220i………..LM Curve Equilibrium income in economy: Y = 4600 – 30i Y = 1600 + 220i 250i = 3000 i = 12 Equilibrium interest is 12%. To find out equilibrium income substitute the value of ‘i’ in IS Curve equation. Y = 4600 – 30i Y = 4600 – 30 × 12 = 4240. 287. (e) Trade balance = Exports – Imports = 400 – 20 + 0.1Y
Y = C + I + G + ( E – M) = 60 + 0.75 (Y – 0.2Y + 80) + 1000 – 15i + 800 + 400 – 20 – 0.10Y Y = 2300 + 0.50Y – 15i 0.5Y = 2300 – 15i Y = 4600 – 30i Equilibrium in the money market will be: Supply of money = demand for money 450 = 0.2Y + 130 – 44i –0.2Y = 130 – 44i – 450 0.2Y = 320 + 44i Y = 1600 + 220i………..LM Curve Equilibrium income in economy: Y = 4600 – 30i Y = 1600 – 220i 250i = 3000 = i = 12 Equilibrium interest is 12%. To find out equilibrium income substitute the value of ‘i’ in IS Curve equation. Y = 4600 – 30i Y = 4600 – 30 × 12 = 4240 Trade Balance = 400 – (20 + 0.1 × 4240) = 400 – 444 = –44.
© 2004
The Ic
fai U
nivers
ity P
ress.A
ll righ
ts res
erved
.ISBN : 8
1-314
-0227
-4 Ref.
No.
MACWB 04
2004
04
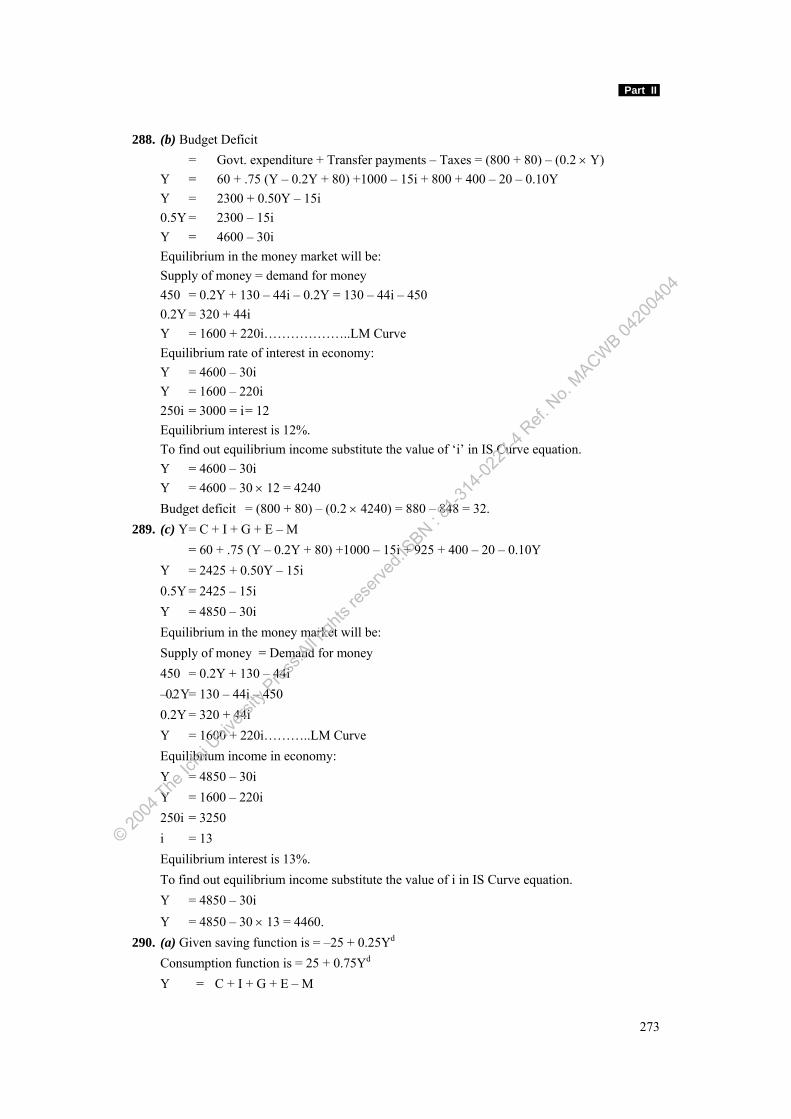
Part II
273
288. (b) Budget Deficit = Govt. expenditure + Transfer payments – Taxes = (800 + 80) – (0.2 × Y) Y = 60 + .75 (Y – 0.2Y + 80) +1000 – 15i + 800 + 400 – 20 – 0.10Y Y = 2300 + 0.50Y – 15i 0.5Y = 2300 – 15i Y = 4600 – 30i Equilibrium in the money market will be: Supply of money = demand for money 450 = 0.2Y + 130 – 44i – 0.2Y = 130 – 44i – 450 0.2Y = 320 + 44i Y = 1600 + 220i………………..LM Curve Equilibrium rate of interest in economy: Y = 4600 – 30i Y = 1600 – 220i 250i = 3000 = i = 12 Equilibrium interest is 12%. To find out equilibrium income substitute the value of ‘i’ in IS Curve equation. Y = 4600 – 30i Y = 4600 – 30 × 12 = 4240 Budget deficit = (800 + 80) – (0.2 × 4240) = 880 – 848 = 32. 289. (c) Y = C + I + G + E – M = 60 + .75 (Y – 0.2Y + 80) +1000 – 15i + 925 + 400 – 20 – 0.10Y Y = 2425 + 0.50Y – 15i 0.5Y = 2425 – 15i Y = 4850 – 30i Equilibrium in the money market will be: Supply of money = Demand for money 450 = 0.2Y + 130 – 44i –0.2 Y = 130 – 44i – 450 0.2Y = 320 + 44i Y = 1600 + 220i………..LM Curve Equilibrium income in economy: Y = 4850 – 30i Y = 1600 – 220i 250i = 3250 i = 13 Equilibrium interest is 13%. To find out equilibrium income substitute the value of i in IS Curve equation. Y = 4850 – 30i Y = 4850 – 30 × 13 = 4460. 290. (a) Given saving function is = –25 + 0.25Yd Consumption function is = 25 + 0.75Yd Y = C + I + G + E – M
© 2004
The Ic
fai U
nivers
ity P
ress.A
ll righ
ts res
erved
.ISBN : 8
1-314
-0227
-4 Ref.
No.
MACWB 04
2004
04
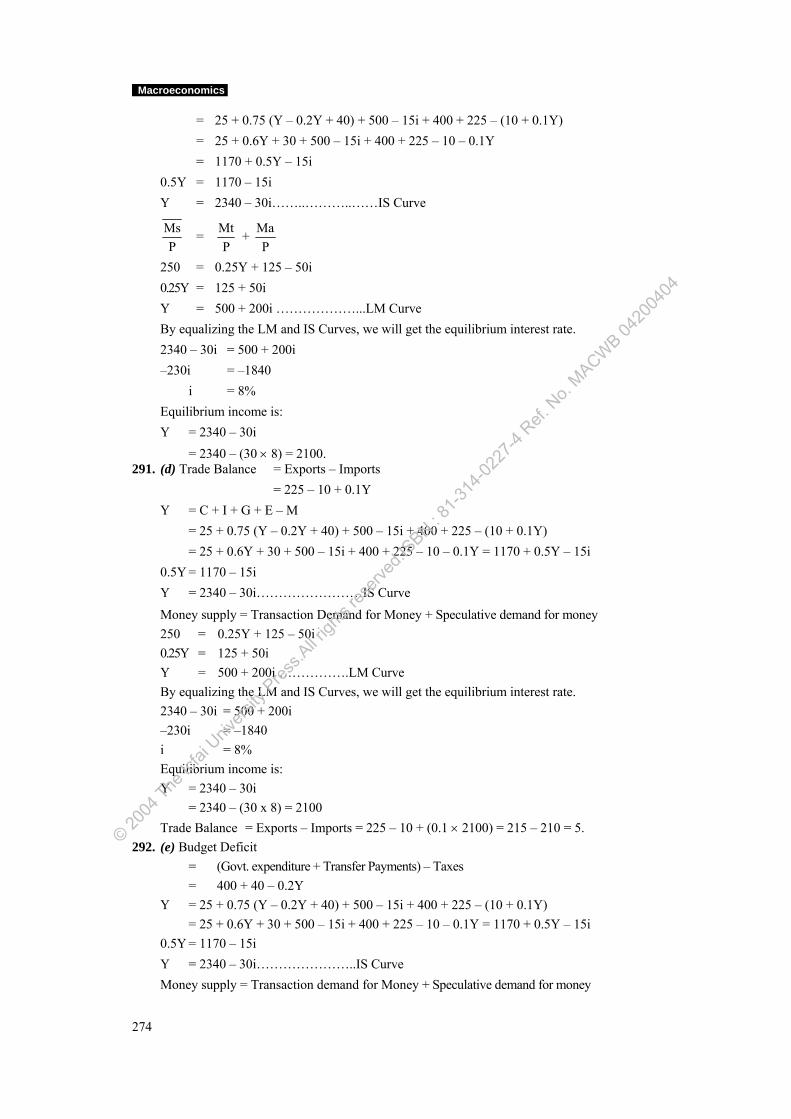
Macroeconomics
274
= 25 + 0.75 (Y – 0.2Y + 40) + 500 – 15i + 400 + 225 – (10 + 0.1Y) = 25 + 0.6Y + 30 + 500 – 15i + 400 + 225 – 10 – 0.1Y = 1170 + 0.5Y – 15i 0.5Y = 1170 – 15i Y = 2340 – 30i……..………..……IS Curve
MsP
= MtP
+ MaP
250 = 0.25Y + 125 – 50i 0.25Y = 125 + 50i Y = 500 + 200i ………………...LM Curve By equalizing the LM and IS Curves, we will get the equilibrium interest rate. 2340 – 30i = 500 + 200i –230i = –1840 i = 8% Equilibrium income is: Y = 2340 – 30i = 2340 – (30 × 8) = 2100. 291. (d) Trade Balance = Exports – Imports = 225 – 10 + 0.1Y Y = C + I + G + E – M = 25 + 0.75 (Y – 0.2Y + 40) + 500 – 15i + 400 + 225 – (10 + 0.1Y) = 25 + 0.6Y + 30 + 500 – 15i + 400 + 225 – 10 – 0.1Y = 1170 + 0.5Y – 15i 0.5Y = 1170 – 15i Y = 2340 – 30i……………………IS Curve
Money supply = Transaction Demand for Money + Speculative demand for money 250 = 0.25Y + 125 – 50i 0.25Y = 125 + 50i Y = 500 + 200i …………….LM Curve By equalizing the LM and IS Curves, we will get the equilibrium interest rate. 2340 – 30i = 500 + 200i –230i = –1840 i = 8% Equilibrium income is: Y = 2340 – 30i = 2340 – (30 x 8) = 2100 Trade Balance = Exports – Imports = 225 – 10 + (0.1 × 2100) = 215 – 210 = 5. 292. (e) Budget Deficit = (Govt. expenditure + Transfer Payments) – Taxes = 400 + 40 – 0.2Y Y = 25 + 0.75 (Y – 0.2Y + 40) + 500 – 15i + 400 + 225 – (10 + 0.1Y) = 25 + 0.6Y + 30 + 500 – 15i + 400 + 225 – 10 – 0.1Y = 1170 + 0.5Y – 15i 0.5Y = 1170 – 15i Y = 2340 – 30i…………………..IS Curve Money supply = Transaction demand for Money + Speculative demand for money
© 2004
The Ic
fai U
nivers
ity P
ress.A
ll righ
ts res
erved
.ISBN : 8
1-314
-0227
-4 Ref.
No.
MACWB 04
2004
04
Part II
275
250 = 0.25Y + 125 – 50i 0.25Y = 125 + 50i Y = 500 + 200i ………………..LM Curve By equalizing the LM and IS Curves, we will get the equilibrium interest rate. 2340 – 30i = 500 + 200i –230i = –1840 i = 8% Equilibrium income is: Y = 2340 – 30i = 2340 – (30 × 8) = 2100 Budget Deficit = 400 + 40 – 0.2Y = 440 – (2100 × 0.2) = 20. 293. (c) Y = 25 + 0.75 (Y – 0.2Y + 40) + 500 – 15i + 745 + 225 – (10 + 0.1Y) = 25 + 0.6Y + 30 + 500 – 15i + 745 + 225 – 10 – 0.1Y = 1170 + 0.5Y – 15i 0.5Y = 1515 – 15i Y = 2030 – 30i………………..…IS Curve Money supply = Transaction Demand for Money + Speculative demand for money 250 = 0.25Y + 125 – 50i 0.25Y = 125 + 50i Y = 500 + 200i ………………..LM Curve By equalizing the LM and IS Curves, we will get the equilibrium interest rate. 3030 – 30i = 500 + 200i –230i = –2530 i = 11% Equilibrium income is:
Y = 3030 – 30i = 3030 – (30 × 11) = 2700. 294. (a) Consumption function = 60 + 0.8Yd Y = C + I + G + E – M = 60 + 0.8 [Y – 0.1Y + 50] + 250 + 0.1Y – 35i + 400 + 250 – [20 + 0.1Y] = 60 + 0.72Y + 40 + 250 + 0.1Y – 35i + 400 + 250 – 20 – 0.1Y = 980 + 0.72Y – 35i 0.28Y = 980 – 35i …………….…………..IS Y = 3500 – 125i Equilibrium in the money market: Ms = Md 300 = 0.2Y + 120 – 40i 0.2y = 180 + 40i…………………….…LM Y = 900 + 200i Economy will be in equilibrium when IS = LM: 3500 – 125i = 900 + 200i 2600 = 325i i = 8% The equilibrium income is:
© 2004
The Ic
fai U
nivers
ity P
ress.A
ll righ
ts res
erved
.ISBN : 8
1-314
-0227
-4 Ref.
No.
MACWB 04
2004
04
Macroeconomics
276
Y = 3500 – 125i = 3500 – 1000 = 2500. 295. (e) Trade Balance = Exports – Imports = 250 – 20 + 0.1Y Y = 60 + 0.8[Y – 0.1Y + 50] + 250 + 0.1Y – 35i + 400 + 250 – [20 + 0.1Y] = 60 + 0.72Y + 40 + 250 + 0.1Y – 35i + 400 + 250 – 20 – 0.1Y = 980 + 0.72Y – 35i 0.28Y = 980 – 35i …………………………..IS Y = 3500 – 125i The LM Curve equation: Ms = Md 300 = 0.2Y + 120 – 40i 0.2y = 180 + 40i…………………………LM Y = 900 + 200i Economy will be in equilibrium when IS = LM: 3500 – 125i = 900 + 200i 2600 = 325i i = 8% The equilibrium income is: Y = 3500 – 125i = 3500 – 1000 = 2500 Trade Balance = 250 – 20 + 0.1 × 2500 = 230 – 250 = –20. 296. (d) Budget Surplus = T – (G + R) = 0.1Y – (400 + 50) Y = 60 + 0.8[Y – 0.1Y + 50] + 250 + 0.1Y – 35i + 400 + 250 – [20 + 0.1Y] = 60 + 0.72Y + 40 + 250 + 0.1Y – 35i+ 400 + 250 – 20 – 0.1Y = 980 + 0.72Y – 35i 0.28Y = 980 – 35i …………..IS Y = 3500 – 125i The LM Curve Equation; Ms = Md 302 = 0.2Y + 120 – 40i 0.2y = 180 + 40i…………………….……LM Y = 900 + 200i Economy will be in equilibrium when IS = LM: 3500 – 125i = 900 + 200i 2600 = 325i i = 8% The equilibrium income is: Y = 3500 – 125i = 3500 – 1000 = 2500 Budget Surplus = 0.1Y – (400 + 50) = (0.1 × 2500) – 450 = 250 – 450 = –200. 297. (b) Y = 60 + 0.8[Y – 0.1Y + 50] + 250 + 0.1Y – 35i + 582 + 250 – [20 + 0.1Y] = 60 + 0.72Y + 40 + 250 + 0.1Y – 35i + 582 + 250 – 20 – 0.1Y = 1162 + 0.72Y – 35i 0.28Y = 1162 – 35i ………………….…..IS Y = 4150 – 125i
© 2004
The Ic
fai U
nivers
ity P
ress.A
ll righ
ts res
erved
.ISBN : 8
1-314
-0227
-4 Ref.
No.
MACWB 04
2004
04
Part II
277
The LM Curve equation: Ms = Md 303 = 0.2Y + 120 – 40i 0.2y = 180 + 40i……………………….…LM Y = 900 + 200i Economy will be in equilibrium when IS = LM: 4150 – 125i = 900 + 200i 3250 = 325i i = 10% The equilibrium income is: Y = 4150 – 125 × 10 = 4150 – 1250 = 2900. 298. (a) IS Curve: C = 400 + 0.8Yd – 20i Yd = Y + R + T = Y + 200 – 0.1Y = 0.9Y + 200 C = 400 + 0.80[0.9Y + 200] – 20i = 560 + 0.72Y – 20i Equilibrium Income: Y = C + I + G + E – M = 560 + 0.72Y – 20i + 20 + 0.15Y – 60i + 500 + 800 – 15 – 0.12y Y = 1865 + .75Y – 80i 0.25Y = 1865 – 80i Y = 7460 – 320i………….………IS Curve LM Curve: Md = Mt + Ma 400 = 0.25Y + 110 – 145i Y = 1160 + 580i……..……….…LM Curve We can find out the equilibrium interest by equating the IS and LM: 7460 – 320i = 1160 + 580i 6300 = 900i i = 7% Y = 7460 – 320i = 7460 – (320 × 7) = 5220. 299. (b) Trade Balance = Export – Imports = 800 – 15 + 0.12Y IS Curve: C = 400 + 0.8Yd – 20i Yd = Y + R + T = Y + 200 – 0.1Y = 0.9Y + 200 C = 400 + 0.80[0.9Y + 200] – 20i = 560 + 0.72Y – 20i Equilibrium Income: Y = C + I + G + E – M = 560 + 0.72Y – 20i + 20 +0.15Y – 60i + 500 + 800 – 15 – 0.12y Y = 1865 + 0.75Y – 80i 0.25Y = 1865 – 80i Y = 7460 – 320i…………IS Curve
© 2004
The Ic
fai U
nivers
ity P
ress.A
ll righ
ts res
erved
.ISBN : 8
1-314
-0227
-4 Ref.
No.
MACWB 04
2004
04
Macroeconomics
278
LM Curve: Md = Mt + Ma 400 = 0.25Y + 110 – 145i Y = 1160 + 580i………LM Curve We can find out the equilibrium interest by equating the IS and LM: 7460 – 320i = 1160 + 580i 6300 = 900i i = 7% Y = 7460 – 320i = 7460 – (320 × 7) = 5220 Trade Balance = Export – Imports = 800 – (15 + 0.12 × 5220) Trade Balance = 158.60. 300. (d) Budget Deficit = T – (G + R) = 0.1Y – (500 + 200) Y = C + I + G + E – M = 560 + 0.72Y – 20i + 20 + 0.15Y – 60i + 500 + 800 – 15 – 0.12y Y = 1865 + 0.75Y – 80i 0.25Y = 1865 – 80i Y = 7460 – 320i………………….IS Curve LM Curve: Md = Mt + Ma 400 = 0.25Y + 110 – 145i Y = 1160 + 580i……………...…LM Curve We can find out the equilibrium interest by equating the IS and LM: 7460 – 320i = 1160 + 580i 6300 = 900i i = 7% Y = 7460 – 320i = 7460 – (320 x 7) = 5220 Budget Deficit = (0.1 × 5220) – (500 + 200) = 522 – 700 = –178. 301. (c) IS Curve: C = 400 + 0.8Yd – 20i Yd = Y + R + T = Y + 200 – 0.1Y = 0.9Y + 200 C = 400 + 0.80[0.9Y + 200] – 20i = 560 + 0.72Y – 20i Equilibrium Income: Y = C + I + G + E – M = 560 + 0.72Y – 20i + 20 + 0.15Y – 60i + 500 + 800 – 15 – 0.12y Y = 1865 + 0.75Y – 80i 0.25Y = 1865 – 80i
© 2004
The Ic
fai U
nivers
ity P
ress.A
ll righ
ts res
erved
.ISBN : 8
1-314
-0227
-4 Ref.
No.
MACWB 04
2004
04
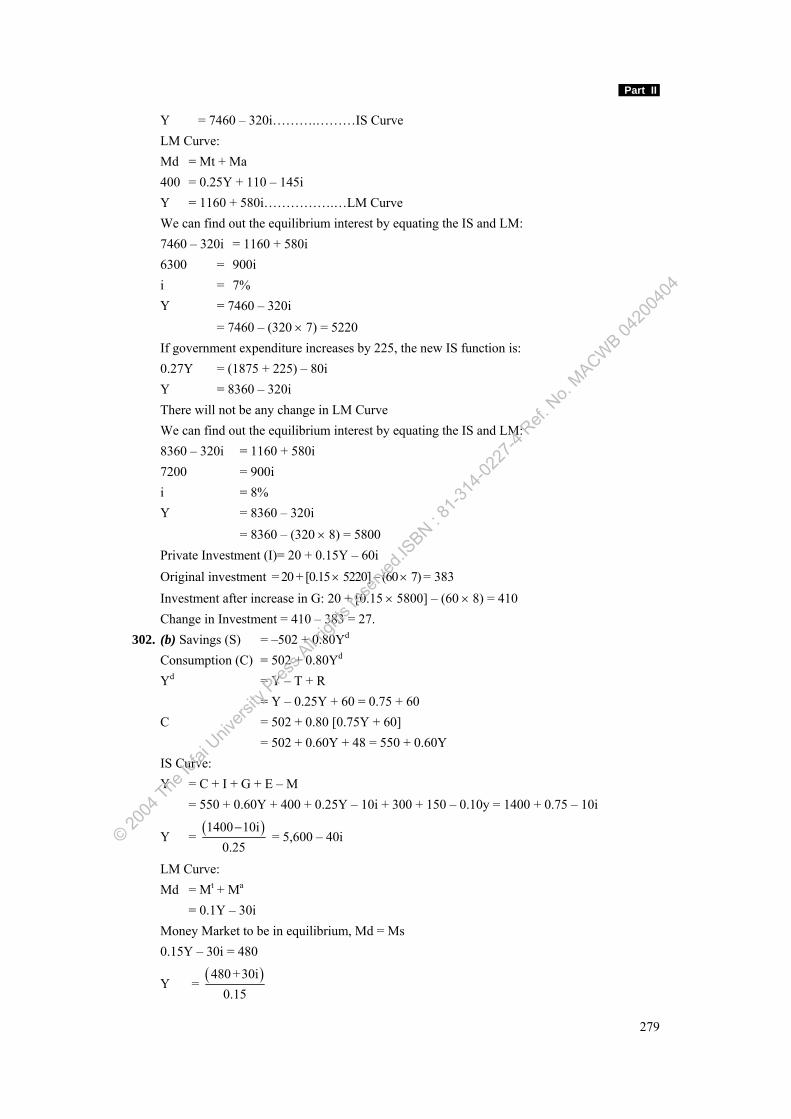
Part II
279
Y = 7460 – 320i……….………IS Curve LM Curve: Md = Mt + Ma 400 = 0.25Y + 110 – 145i Y = 1160 + 580i…………….…LM Curve We can find out the equilibrium interest by equating the IS and LM: 7460 – 320i = 1160 + 580i 6300 = 900i i = 7% Y = 7460 – 320i = 7460 – (320 × 7) = 5220 If government expenditure increases by 225, the new IS function is: 0.27Y = (1875 + 225) – 80i Y = 8360 – 320i There will not be any change in LM Curve We can find out the equilibrium interest by equating the IS and LM: 8360 – 320i = 1160 + 580i 7200 = 900i i = 8% Y = 8360 – 320i = 8360 – (320 × 8) = 5800 Private Investment (I)= 20 + 0.15Y – 60i Original investment = 20 + [0.15 × 5220] – (60 × 7) = 383 Investment after increase in G: 20 + [0.15 × 5800] – (60 × 8) = 410 Change in Investment = 410 – 383 = 27. 302. (b) Savings (S) = –502 + 0.80Yd
Consumption (C) = 502 + 0.80Yd Yd = Y – T + R = Y – 0.25Y + 60 = 0.75 + 60 C = 502 + 0.80 [0.75Y + 60] = 502 + 0.60Y + 48 = 550 + 0.60Y IS Curve: Y = C + I + G + E – M = 550 + 0.60Y + 400 + 0.25Y – 10i + 300 + 150 – 0.10y = 1400 + 0.75 – 10i
Y = ( )1400 10i
0.25−
= 5,600 – 40i
LM Curve: Md = Mt + Ma = 0.1Y – 30i Money Market to be in equilibrium, Md = Ms 0.15Y – 30i = 480
Y = ( )480 +30i
0.15
© 2004
The Ic
fai U
nivers
ity P
ress.A
ll righ
ts res
erved
.ISBN : 8
1-314
-0227
-4 Ref.
No.
MACWB 04
2004
04
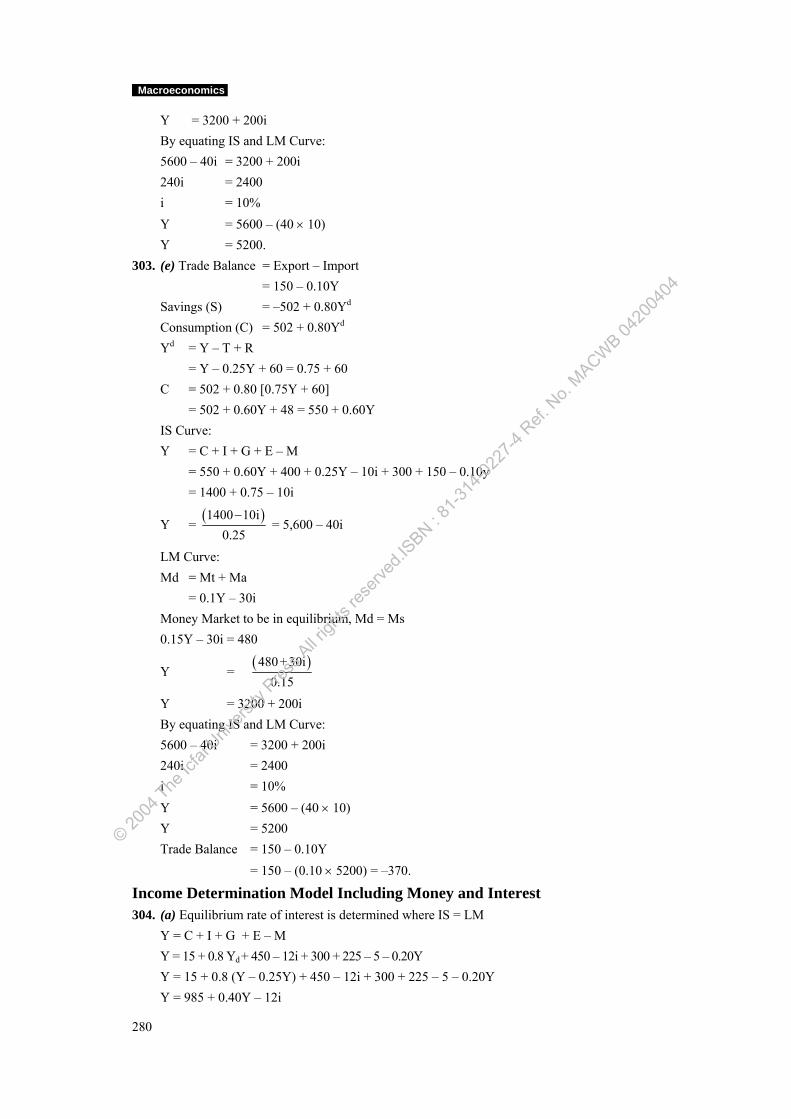
Macroeconomics
280
Y = 3200 + 200i By equating IS and LM Curve: 5600 – 40i = 3200 + 200i 240i = 2400 i = 10% Y = 5600 – (40 × 10) Y = 5200. 303. (e) Trade Balance = Export – Import = 150 – 0.10Y Savings (S) = –502 + 0.80Yd
Consumption (C) = 502 + 0.80Yd Yd = Y – T + R = Y – 0.25Y + 60 = 0.75 + 60 C = 502 + 0.80 [0.75Y + 60] = 502 + 0.60Y + 48 = 550 + 0.60Y IS Curve: Y = C + I + G + E – M = 550 + 0.60Y + 400 + 0.25Y – 10i + 300 + 150 – 0.10y = 1400 + 0.75 – 10i
Y = ( )1400 10i
0.25−
= 5,600 – 40i
LM Curve: Md = Mt + Ma = 0.1Y – 30i Money Market to be in equilibrium, Md = Ms 0.15Y – 30i = 480
Y = ( )480+30i
0.15
Y = 3200 + 200i By equating IS and LM Curve: 5600 – 40i = 3200 + 200i 240i = 2400 i = 10% Y = 5600 – (40 × 10) Y = 5200 Trade Balance = 150 – 0.10Y = 150 – (0.10 × 5200) = –370.
Income Determination Model Including Money and Interest 304. (a) Equilibrium rate of interest is determined where IS = LM Y = C + I + G + E – M Y = 15 + 0.8 Yd + 450 – 12i + 300 + 225 – 5 – 0.20Y Y = 15 + 0.8 (Y – 0.25Y) + 450 – 12i + 300 + 225 – 5 – 0.20Y Y = 985 + 0.40Y – 12i
© 2004
The Ic
fai U
nivers
ity P
ress.A
ll righ
ts res
erved
.ISBN : 8
1-314
-0227
-4 Ref.
No.
MACWB 04
2004
04
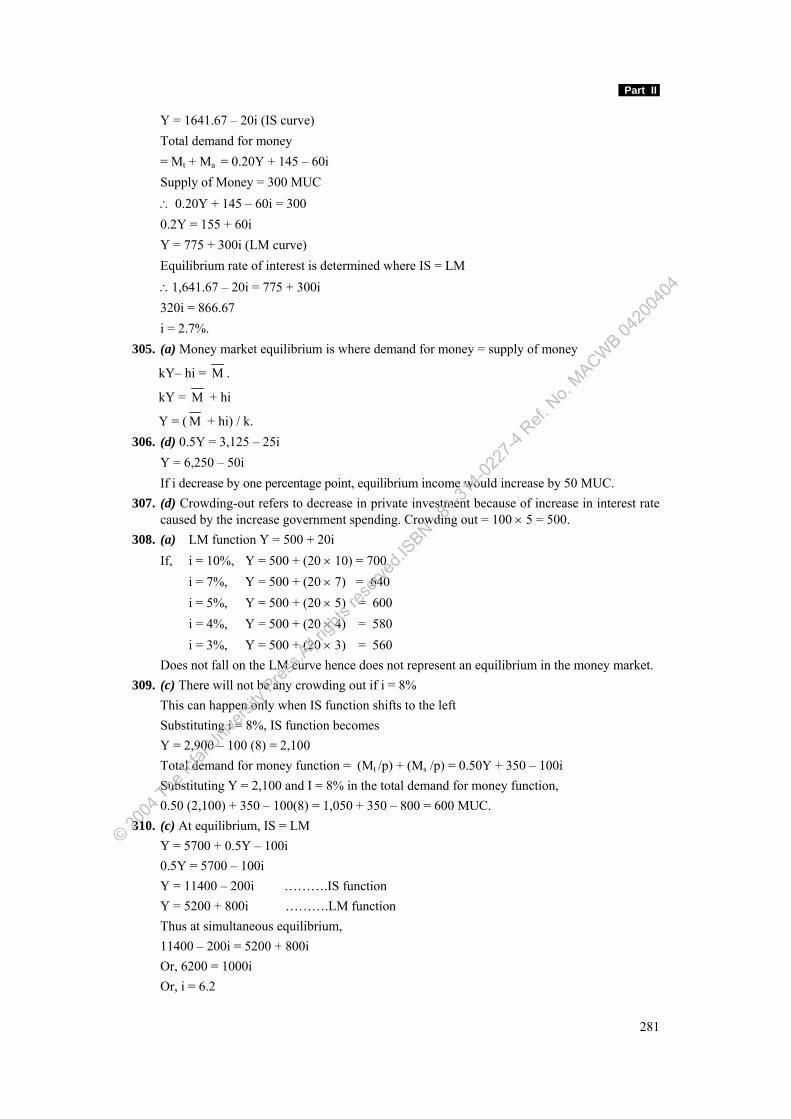
Part II
281
Y = 1641.67 – 20i (IS curve) Total demand for money = Mt + Ma = 0.20Y + 145 – 60i Supply of Money = 300 MUC ∴ 0.20Y + 145 – 60i = 300 0.2Y = 155 + 60i Y = 775 + 300i (LM curve) Equilibrium rate of interest is determined where IS = LM ∴1,641.67 – 20i = 775 + 300i 320i = 866.67 i = 2.7%. 305. (a) Money market equilibrium is where demand for money = supply of money
kY– hi = M .
kY = M + hi
Y = ( M + hi) / k.
306. (d) 0.5Y = 3,125 – 25i Y = 6,250 – 50i If i decrease by one percentage point, equilibrium income would increase by 50 MUC. 307. (d) Crowding-out refers to decrease in private investment because of increase in interest rate
caused by the increase government spending. Crowding out = 100 × 5 = 500. 308. (a) LM function Y = 500 + 20i If, i = 10%, Y = 500 + (20 × 10) = 700 i = 7%, Y = 500 + (20 × 7) = 640 i = 5%, Y = 500 + (20 × 5) = 600 i = 4%, Y = 500 + (20 × 4) = 580 i = 3%, Y = 500 + (20 × 3) = 560 Does not fall on the LM curve hence does not represent an equilibrium in the money market. 309. (c) There will not be any crowding out if i = 8% This can happen only when IS function shifts to the left Substituting i = 8%, IS function becomes Y = 2,900 – 100 (8) = 2,100 Total demand for money function = (Mt /p) + (Ms /p) = 0.50Y + 350 – 100i Substituting Y = 2,100 and I = 8% in the total demand for money function, 0.50 (2,100) + 350 – 100(8) = 1,050 + 350 – 800 = 600 MUC. 310. (c) At equilibrium, IS = LM Y = 5700 + 0.5Y – 100i 0.5Y = 5700 – 100i Y = 11400 – 200i ……….IS function Y = 5200 + 800i ……….LM function Thus at simultaneous equilibrium, 11400 – 200i = 5200 + 800i Or, 6200 = 1000i Or, i = 6.2
© 2004
The Ic
fai U
nivers
ity P
ress.A
ll righ
ts res
erved
.ISBN : 8
1-314
-0227
-4 Ref.
No.
MACWB 04
2004
04
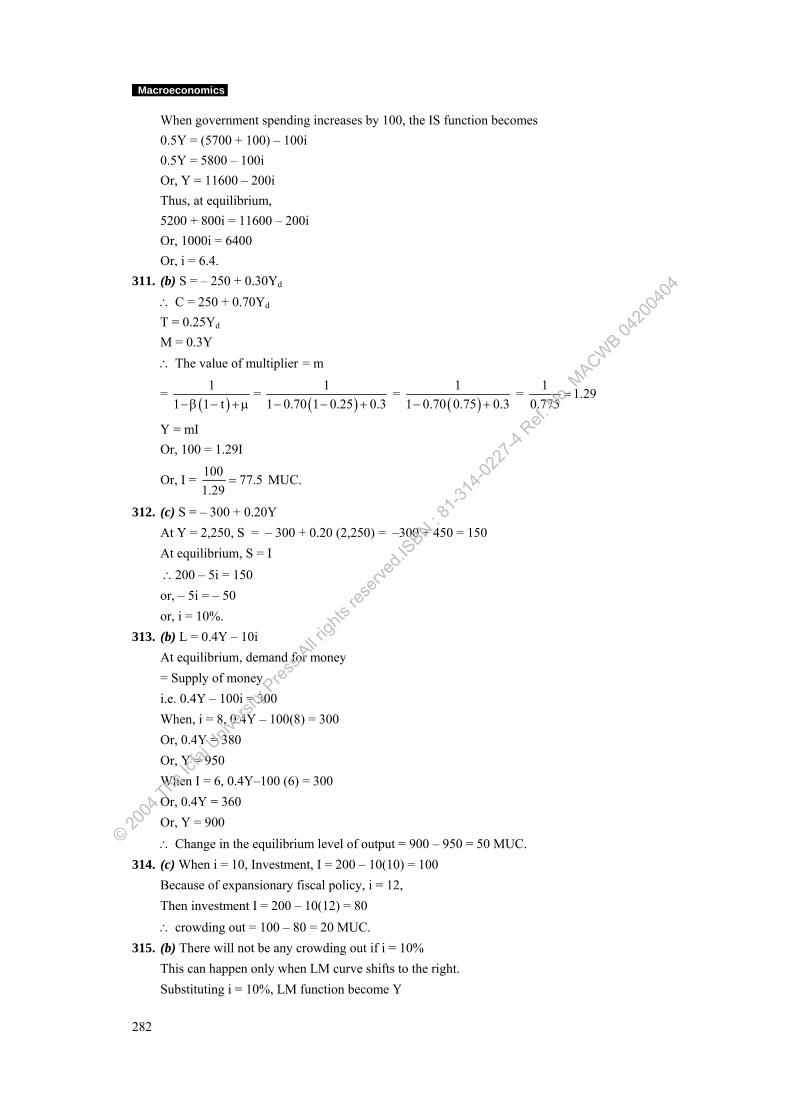
Macroeconomics
282
When government spending increases by 100, the IS function becomes 0.5Y = (5700 + 100) – 100i 0.5Y = 5800 – 100i Or, Y = 11600 – 200i Thus, at equilibrium, 5200 + 800i = 11600 – 200i Or, 1000i = 6400 Or, i = 6.4. 311. (b) S = – 250 + 0.30Yd ∴ C = 250 + 0.70Yd T = 0.25Yd M = 0.3Y ∴ The value of multiplier = m
= ( )
11 1 t− β − + μ
= ( )
11 0.70 1 0.25 0.3− − +
= ( )
11 0.70 0.75 0.3− +
= 1 1.290.775
=
Y = mI Or, 100 = 1.29I
Or, I = 100 77.51.29
= MUC.
312. (c) S = – 300 + 0.20Y At Y = 2,250, S = – 300 + 0.20 (2,250) = –300 + 450 = 150 At equilibrium, S = I ∴200 – 5i = 150 or, – 5i = – 50 or, i = 10%.
313. (b) L = 0.4Y – 10i At equilibrium, demand for money = Supply of money i.e. 0.4Y – 100i = 300 When, i = 8, 0.4Y – 100(8) = 300 Or, 0.4Y = 380 Or, Y = 950 When I = 6, 0.4Y–100 (6) = 300 Or, 0.4Y = 360 Or, Y = 900 ∴ Change in the equilibrium level of output = 900 – 950 = 50 MUC. 314. (c) When i = 10, Investment, I = 200 – 10(10) = 100 Because of expansionary fiscal policy, i = 12, Then investment I = 200 – 10(12) = 80 ∴ crowding out = 100 – 80 = 20 MUC. 315. (b) There will not be any crowding out if i = 10% This can happen only when LM curve shifts to the right. Substituting i = 10%, LM function become Y
© 2004
The Ic
fai U
nivers
ity P
ress.A
ll righ
ts res
erved
.ISBN : 8
1-314
-0227
-4 Ref.
No.
MACWB 04
2004
04
Part II
283
= 500 + 200(10) = 2,500 Total demand for money function
= t aM Mp p
⎛ ⎞ ⎛ ⎞+⎜ ⎟ ⎜ ⎟⎝ ⎠ ⎝ ⎠
= 0.50Y + 250 – 100
Substituting Y = 2,500 and i = 10 in the total demand for money function, we get, 0.50 (2,500) + 250 – 100(10) = 1,250 + 350 – 1,000 = 600 MUC Since money supply is equal to demand for money, the new money supply will be 600 MUC. 316. (e) Saving function = – 50 + 0.50 Yd Hence, consumption function = 50 + 0.50 Yd Y = C + I + G + E – M Or, Y = 50 + 0.50 (Y– 0.40Y + 80) + 1,000 – 30i + 800 + 450 – (20 + 0.20Y) Or, Y = 50 + 0.50Y – 0.2Y + 40 +1,000 – 30i + 800 + 450 – 20 – 0.20Y Or, Y = 2,320 + 0.1Y – 30i Or, 0.90Y = 2,320 – 30i Or, Y = 2,577.78 – 33.33i……………..IS Curve
sMp = t aM M
p p⎛ ⎞ ⎛ ⎞+⎜ ⎟ ⎜ ⎟⎝ ⎠ ⎝ ⎠
or, 500 = 0.5Y + 250 – 100i or, 0.50Y = 250 + 100i or, Y = 500 + 200i ………………….LM Curve By equating the IS and LM function, we can get the equilibrium rate of interest. ∴500 + 200i = 2,577.78 – 33.33 or, 233.33i = 2,077.78 or, i = 8.9% ∴ Y = 2,577.78 – 33.33 (8.9) = 2,577.78 – 296.64 = 2,281.14 = 2,281MUC (approximately). 317. (c) Goods market equilibrium: 0.5Y = 2,925 – 37.5; or, Y = 5,850 – 75i (IS Function) Money market equilibrium: 0.25Y = 312.5 + 125; or, Y = 1,250 + 500i (LM function) At simultaneous equilibrium of goods market and money market, IS = LM ∴ 5,850 – 75i = 1,250 + 500i or, 575i = 4,600 or, i = 8% ∴ Y = 5,850 – 75(8) = 5,850 – 600 = 5,250 ∴ Trade balance at equilibrium = E – M = 650 – (25 + 0.25Y) = 650 – 25 – .25 (5,250) = 650 – 25 – 1,312.50 = – 687.50 MUC (deficit). 318. (e) If Government expenditure increase by 475 MUC,
© 2004
The Ic
fai U
nivers
ity P
ress.A
ll righ
ts res
erved
.ISBN : 8
1-314
-0227
-4 Ref.
No.
MACWB 04
2004
04
Macroeconomics
284
IS function becomes 0.5Y = 2,925 + 475 – 37.5i or, 0.5Y = 3,400 – 37.5i or, Y = 6,800 – 75i At simultaneous equilibrium, IS = LM Or, 6,800 – 75i = 1,250 + 500i Or, 575i = 5,500 Or, i = 9.65%. 319. (d) LM Curve Demand for Money (Md) = Transaction demand for money + Speculative demand for money = 0.25Y + 450 – 50i In equilibrium position: Money Supply = Money Demanded 750 = 0.25Y + 450 – 50i 300 + 50i = 0.25Y 1,200 + 200 = Y Equating LM and IS functions: 2,500 – 40i = 1,200 + 200i 1,300 = 240i i = 5.42
Y = 1,200 + (200 × 5.42) = 2,284. 320. (d) The IS equation = Y = C + I Y = 60 + 0.80Y + 116 – 2i 0.2Y = 176 – 2i i = –0.10Y + 88 The LM equation = M = L = 0.20Y – 5i 5i = 0.20Y – 120 i = 0.04Y – 24 The simultaneous equilibrium for IS and LM is; – 0.10Y + 88 = 0.04Y – 24 So, Y = 800 and i = 8%. 321. (a) Y = 120 + 0.6Y + 150 – 80i Y = 270 + 0.6Y – 80i Y – 0.6Y = 270 – 80i Y = 675 – 200i .......(i) The equation of the LM Curve is Ms = Md 300 = 0.3Y + 120 – 160i Y = 600 + 533.33i ..... (ii)
© 2004
The Ic
fai U
nivers
ity P
ress.A
ll righ
ts res
erved
.ISBN : 8
1-314
-0227
-4 Ref.
No.
MACWB 04
2004
04
Part II
285
Putting the value of Y in equation (i), we have: 675 – 200i = 600 + 533.33i 733.33i = 75
i = 75733.33
i = 0.10%
Y = 675 – 200 × 0.10 = 655. 322. (b) The given equations can be rewritten as 0.6Y = 650 – 8i 0.6Y = 520 + 18i Since IS Curve has a negative slope and LM Curve has a positive slope,
0.6Y = 650 – 8i → IS Curve
0.6Y = 520 + 18i → LM Curve When government expenditure is increased by 100, the IS Curve equation becomes: 0.6Y = 650 + 100 – 8i And LM Curve will not change. At equilibrium: 0.6Y – 750 + 8i = 0.6Y – 520 – 18i
∴ 26i = 230 ∴ i = 8.85 Equilibrium income will be 0.6Y = 750 – (8 × 8.85) = 679.2 ∴ Y = 1,132. 323. (b) Transaction demand for money (Mt) = 0.3Y First we can calculate Y The equation of the IS Curve is: Y = 120 + 0.6Y + 150 – 80i Y = 270 + 0.6Y – 80i Y – 0.6Y = 270 – 80i or Y = 675 – 200i ....(i) The equation of the LM Curve is Ms = Md or 300 = 0.3Y + 120 – 160i or Y = 600 + 533.33i ... (ii) Putting the value of Y in equation (i), we have: 675 – 200i = 600 + 533.33i 733.33i = 75 i = 75/733.33 i = 0.10%
Y = 675 – 200 × 0.10 Y = 655
Transaction demand for money = 0.3Y = 0.3 × 655 = 196.50. 324. (e) We know that
© 2004
The Ic
fai U
nivers
ity P
ress.A
ll righ
ts res
erved
.ISBN : 8
1-314
-0227
-4 Ref.
No.
MACWB 04
2004
04
Macroeconomics
286
Y = C + I + G .......(1) Where, C = Consumption function I = Investment function G = Exogenous government expenditure and the estimated relations for an economy C = 75 + 0.80 Yd Yd = Y – T T = 0.15Y I = 150 – 16i G = 31 Md = 80Y – 2,400i Ms = 3,200 Substituting C, I and T values in equation (1) we get Y = 75 + 0.80(Y – 0.15Y) + 150 – 16i + 31 = 75 + 0.80Y – 0.12Y + 150 – 16i + 31 Y(1 – 0.68) = 256 – 16i 0.32Y = 256 – 16i Y = 800 – 50i ...... (2) At equilibrium: Md = Ms 80Y – 2,400i = 3,200 Substituting the value of Y in equation (2) 80 (800 – 50i) – 2,400i = 320 64,000 – 4,000i – 2,400i = 3,200 6,400i = 60,800 i = 9.5 By substituting the value of i in equation (2) we get the equilibrium level of income Y = 800 – 50(9.5) = 800 – 475 = 325 Once the equilibrium level of income is found out the other variables can be estimated: T = 0.15 Y = 15/100 × 325 = 48.75 Budget surplus of the government = T – G = 48.75 – 31 = 17.75 ∴Budget surplus of the government is 17.75. 325. (c) Y = C + I + G When the government expenditure increases to 63, Y = 75 + 0.80(Y – 0.15Y) + 150 – 16i + 63 Y = 75 + 0.80Y – 0.12Y + 150 + 16i + 63 0.32Y = 288 – 16i Y = 900 – 50i ...... (1) At equilibrium: Md = Ms 80 Y – 2,400i = 3,200
Substituting the value of Y i.e., equation (1), we get
80 (900 – 50i) – 2,400i = 3,200
72,000 – 4,000i – 2,400i = 3,200
© 2004
The Ic
fai U
nivers
ity P
ress.A
ll righ
ts res
erved
.ISBN : 8
1-314
-0227
-4 Ref.
No.
MACWB 04
2004
04
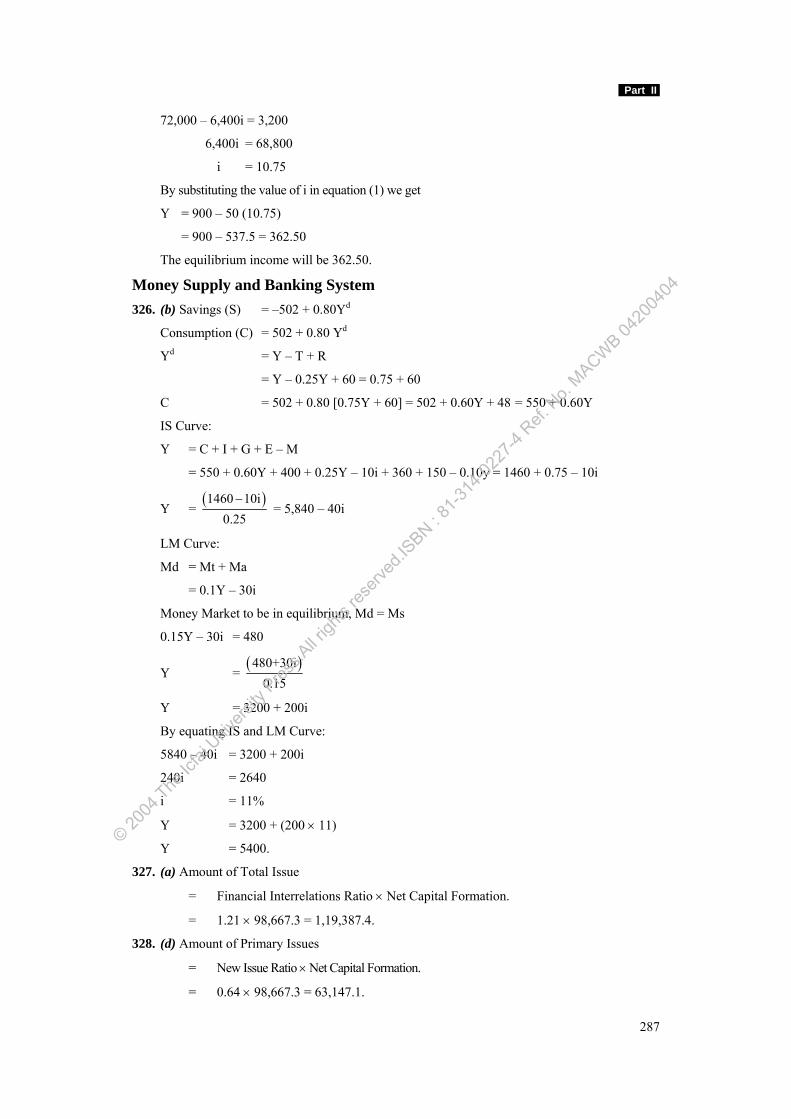
Part II
287
72,000 – 6,400i = 3,200
6,400i = 68,800
i = 10.75
By substituting the value of i in equation (1) we get
Y = 900 – 50 (10.75)
= 900 – 537.5 = 362.50
The equilibrium income will be 362.50.
Money Supply and Banking System
326. (b) Savings (S) = –502 + 0.80Yd
Consumption (C) = 502 + 0.80 Yd
Yd = Y – T + R
= Y – 0.25Y + 60 = 0.75 + 60
C = 502 + 0.80 [0.75Y + 60] = 502 + 0.60Y + 48 = 550 + 0.60Y
IS Curve:
Y = C + I + G + E – M
= 550 + 0.60Y + 400 + 0.25Y – 10i + 360 + 150 – 0.10y = 1460 + 0.75 – 10i
Y = ( )1460 10i
0.25−
= 5,840 – 40i
LM Curve:
Md = Mt + Ma
= 0.1Y – 30i
Money Market to be in equilibrium, Md = Ms
0.15Y – 30i = 480
Y = ( )480+30i
0.15
Y = 3200 + 200i
By equating IS and LM Curve:
5840 – 40i = 3200 + 200i
240i = 2640
i = 11%
Y = 3200 + (200 × 11)
Y = 5400.
327. (a) Amount of Total Issue
= Financial Interrelations Ratio × Net Capital Formation.
= 1.21 × 98,667.3 = 1,19,387.4.
328. (d) Amount of Primary Issues
= New Issue Ratio × Net Capital Formation.
= 0.64 × 98,667.3 = 63,147.1.
© 2004
The Ic
fai U
nivers
ity P
ress.A
ll righ
ts res
erved
.ISBN : 8
1-314
-0227
-4 Ref.
No.
MACWB 04
2004
04
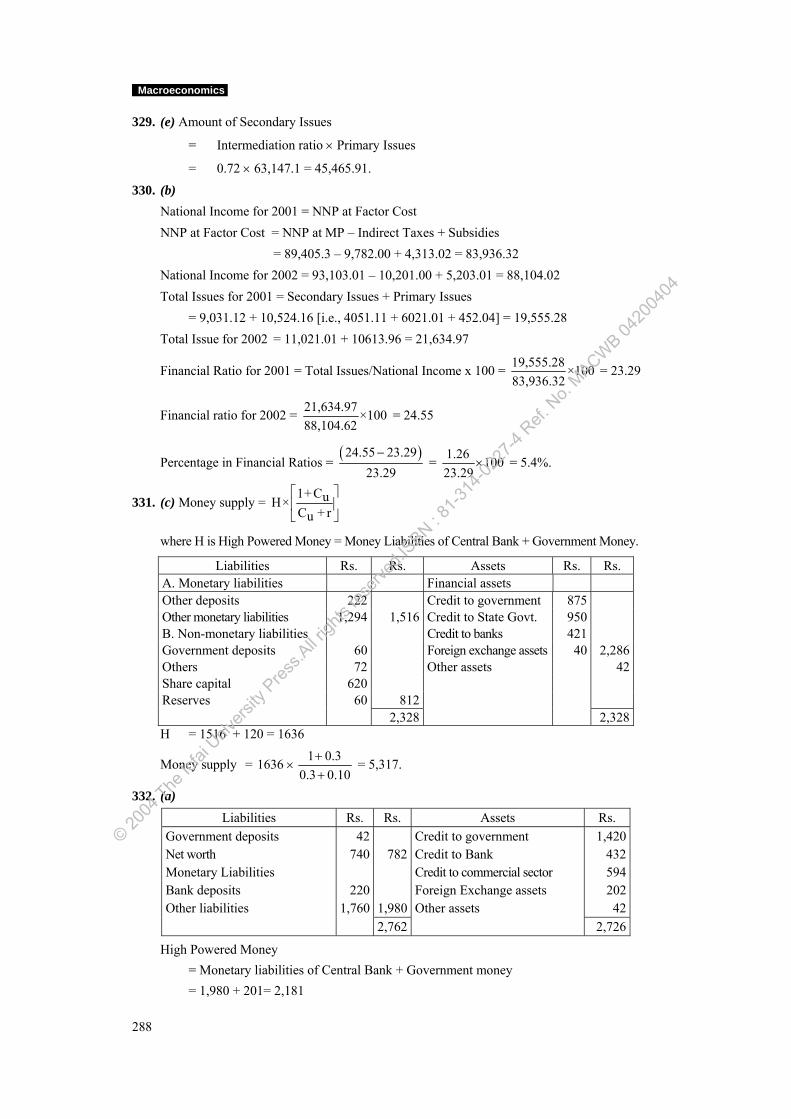
Macroeconomics
288
329. (e) Amount of Secondary Issues
= Intermediation ratio × Primary Issues
= 0.72 × 63,147.1 = 45,465.91. 330. (b) National Income for 2001 = NNP at Factor Cost NNP at Factor Cost = NNP at MP – Indirect Taxes + Subsidies = 89,405.3 – 9,782.00 + 4,313.02 = 83,936.32 National Income for 2002 = 93,103.01 – 10,201.00 + 5,203.01 = 88,104.02 Total Issues for 2001 = Secondary Issues + Primary Issues = 9,031.12 + 10,524.16 [i.e., 4051.11 + 6021.01 + 452.04] = 19,555.28 Total Issue for 2002 = 11,021.01 + 10613.96 = 21,634.97
Financial Ratio for 2001 = Total Issues/National Income x 100 = 19,555.28 ×10083,936.32
= 23.29
Financial ratio for 2002 = 21,634.97 ×10088,104.62
= 24.55
Percentage in Financial Ratios = ( )24.55 23.29
23.29−
= 1.26 10023.29
× = 5.4%.
331. (c) Money supply = 1+CuH×C + ru
⎡ ⎤⎢ ⎥⎣ ⎦
where H is High Powered Money = Money Liabilities of Central Bank + Government Money.
Liabilities Rs. Rs. Assets Rs. Rs. A. Monetary liabilities Financial assets Other deposits 222 Credit to government 875 Other monetary liabilities 1,294 1,516 Credit to State Govt. 950 B. Non-monetary liabilities Credit to banks 421 Government deposits 60 Foreign exchange assets 40 2,286 Others 72 Other assets 42 Share capital 620 Reserves 60 812 2,328 2,328
H = 1516 + 120 = 1636
Money supply = 1 0.316360.3 0.10
+×
+ = 5,317.
332. (a) Liabilities Rs. Rs. Assets Rs.
Government deposits 42 Credit to government 1,420 Net worth 740 782 Credit to Bank 432 Monetary Liabilities Credit to commercial sector 594 Bank deposits 220 Foreign Exchange assets 202 Other liabilities 1,760 1,980 Other assets 42 2,762 2,726
High Powered Money = Monetary liabilities of Central Bank + Government money = 1,980 + 201= 2,181
© 2004
The Ic
fai U
nivers
ity P
ress.A
ll righ
ts res
erved
.ISBN : 8
1-314
-0227
-4 Ref.
No.
MACWB 04
2004
04
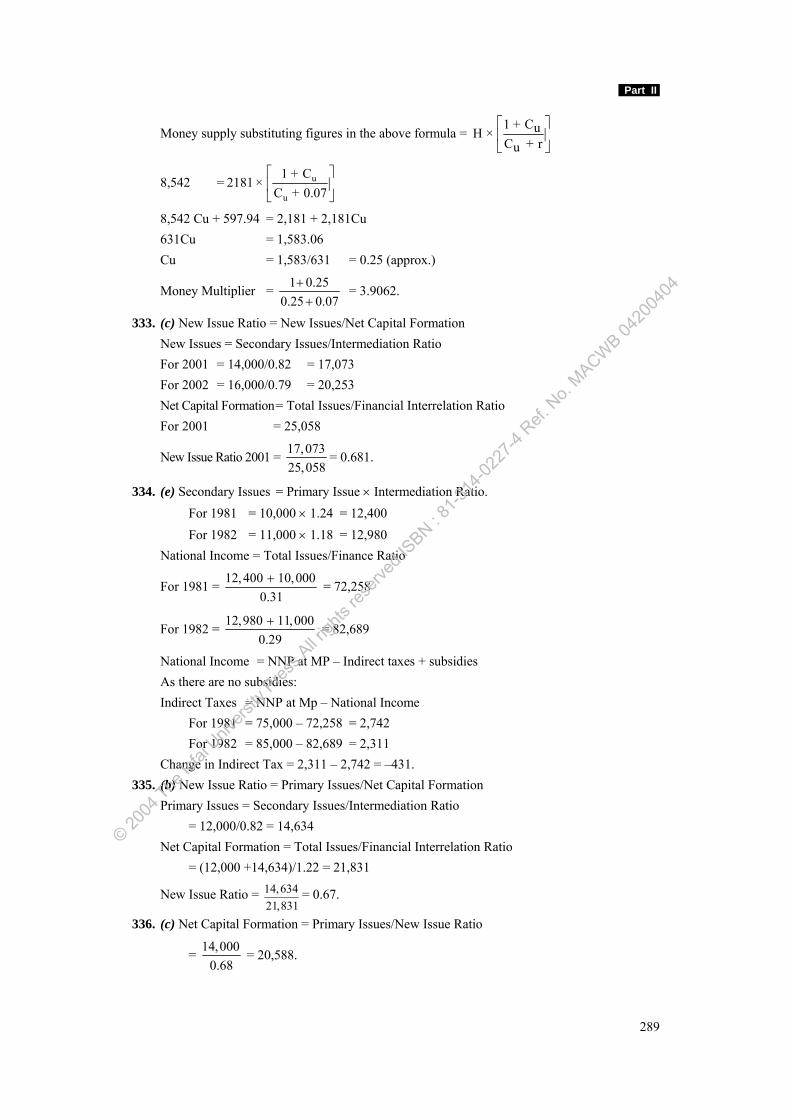
Part II
289
Money supply substituting figures in the above formula = 1 + CuH ×C + ru
⎡ ⎤⎢ ⎥⎣ ⎦
8,542 = u
u
1 + C2181 ×
C + 0.07⎡ ⎤⎢ ⎥⎣ ⎦
8,542 Cu + 597.94 = 2,181 + 2,181Cu 631Cu = 1,583.06 Cu = 1,583/631 = 0.25 (approx.)
Money Multiplier = 1 0.250.25 0.07
++
= 3.9062.
333. (c) New Issue Ratio = New Issues/Net Capital Formation New Issues = Secondary Issues/Intermediation Ratio For 2001 = 14,000/0.82 = 17,073 For 2002 = 16,000/0.79 = 20,253 Net Capital Formation = Total Issues/Financial Interrelation Ratio For 2001 = 25,058
New Issue Ratio 2001 = 17,07325,058
= 0.681.
334. (e) Secondary Issues = Primary Issue × Intermediation Ratio. For 1981 = 10,000 × 1.24 = 12,400 For 1982 = 11,000 × 1.18 = 12,980 National Income = Total Issues/Finance Ratio
For 1981 = 12, 400 10,0000.31
+ = 72,258
For 1982 = 12,980 11,0000.29
+ = 82,689
National Income = NNP at MP – Indirect taxes + subsidies As there are no subsidies: Indirect Taxes = NNP at Mp – National Income For 1981 = 75,000 – 72,258 = 2,742 For 1982 = 85,000 – 82,689 = 2,311 Change in Indirect Tax = 2,311 – 2,742 = –431. 335. (b) New Issue Ratio = Primary Issues/Net Capital Formation Primary Issues = Secondary Issues/Intermediation Ratio = 12,000/0.82 = 14,634 Net Capital Formation = Total Issues/Financial Interrelation Ratio = (12,000 +14,634)/1.22 = 21,831
New Issue Ratio = 14,63421,831
= 0.67.
336. (c) Net Capital Formation = Primary Issues/New Issue Ratio
= 14,0000.68
= 20,588.
© 2004
The Ic
fai U
nivers
ity P
ress.A
ll righ
ts res
erved
.ISBN : 8
1-314
-0227
-4 Ref.
No.
MACWB 04
2004
04
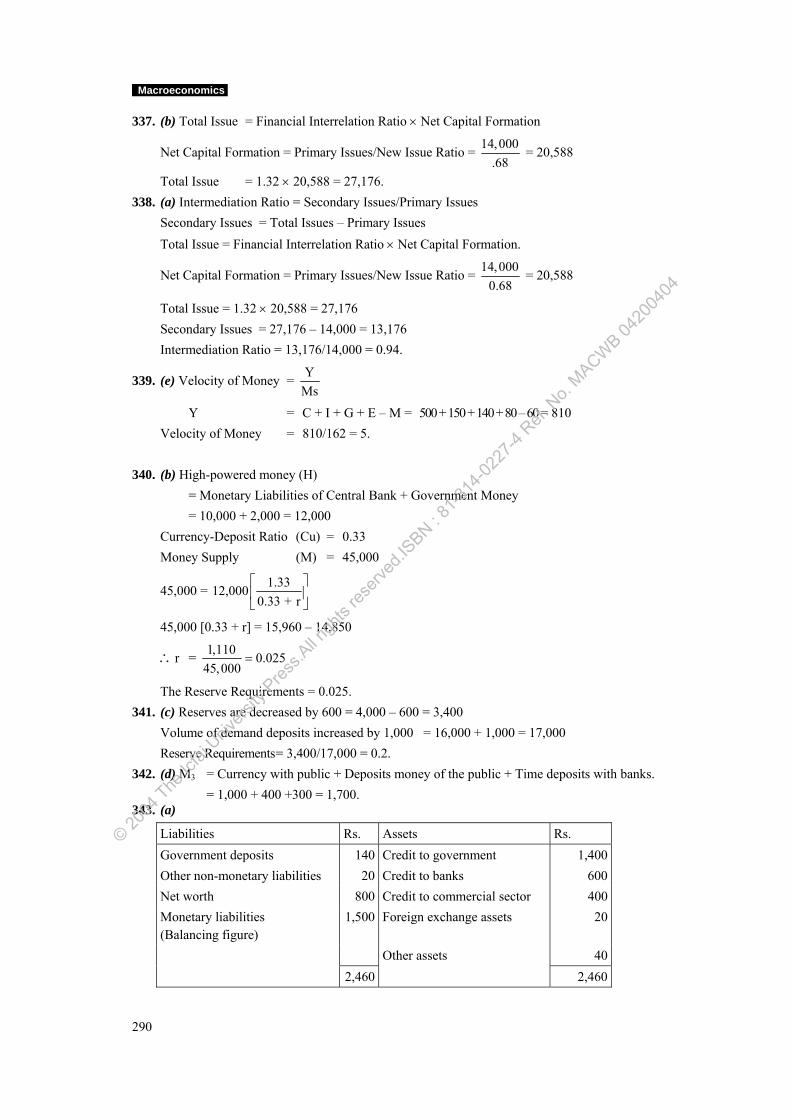
Macroeconomics
290
337. (b) Total Issue = Financial Interrelation Ratio × Net Capital Formation
Net Capital Formation = Primary Issues/New Issue Ratio = 14,000.68
= 20,588
Total Issue = 1.32 × 20,588 = 27,176. 338. (a) Intermediation Ratio = Secondary Issues/Primary Issues Secondary Issues = Total Issues – Primary Issues Total Issue = Financial Interrelation Ratio × Net Capital Formation.
Net Capital Formation = Primary Issues/New Issue Ratio = 14,0000.68
= 20,588
Total Issue = 1.32 × 20,588 = 27,176 Secondary Issues = 27,176 – 14,000 = 13,176 Intermediation Ratio = 13,176/14,000 = 0.94.
339. (e) Velocity of Money = YMs
Y = C + I + G + E – M = 500 + 150 + 140 + 80 – 60 = 810 Velocity of Money = 810/162 = 5. 340. (b) High-powered money (H) = Monetary Liabilities of Central Bank + Government Money = 10,000 + 2,000 = 12,000 Currency-Deposit Ratio (Cu) = 0.33 Money Supply (M) = 45,000
45,000 = 1.3312,0000.33 + r
⎡ ⎤⎢ ⎥⎣ ⎦
45,000 [0.33 + r] = 15,960 – 14,850
∴r = 1,110 0.02545,000
=
The Reserve Requirements = 0.025. 341. (c) Reserves are decreased by 600 = 4,000 – 600 = 3,400 Volume of demand deposits increased by 1,000 = 16,000 + 1,000 = 17,000 Reserve Requirements = 3,400/17,000 = 0.2. 342. (d) M3 = Currency with public + Deposits money of the public + Time deposits with banks. = 1,000 + 400 +300 = 1,700. 343. (a)
Liabilities Rs. Assets Rs. Government deposits 140 Credit to government 1,400 Other non-monetary liabilities 20 Credit to banks 600 Net worth 800 Credit to commercial sector 400 Monetary liabilities (Balancing figure)
1,500 Foreign exchange assets 20
Other assets 40 2,460 2,460
© 2004
The Ic
fai U
nivers
ity P
ress.A
ll righ
ts res
erved
.ISBN : 8
1-314
-0227
-4 Ref.
No.
MACWB 04
2004
04
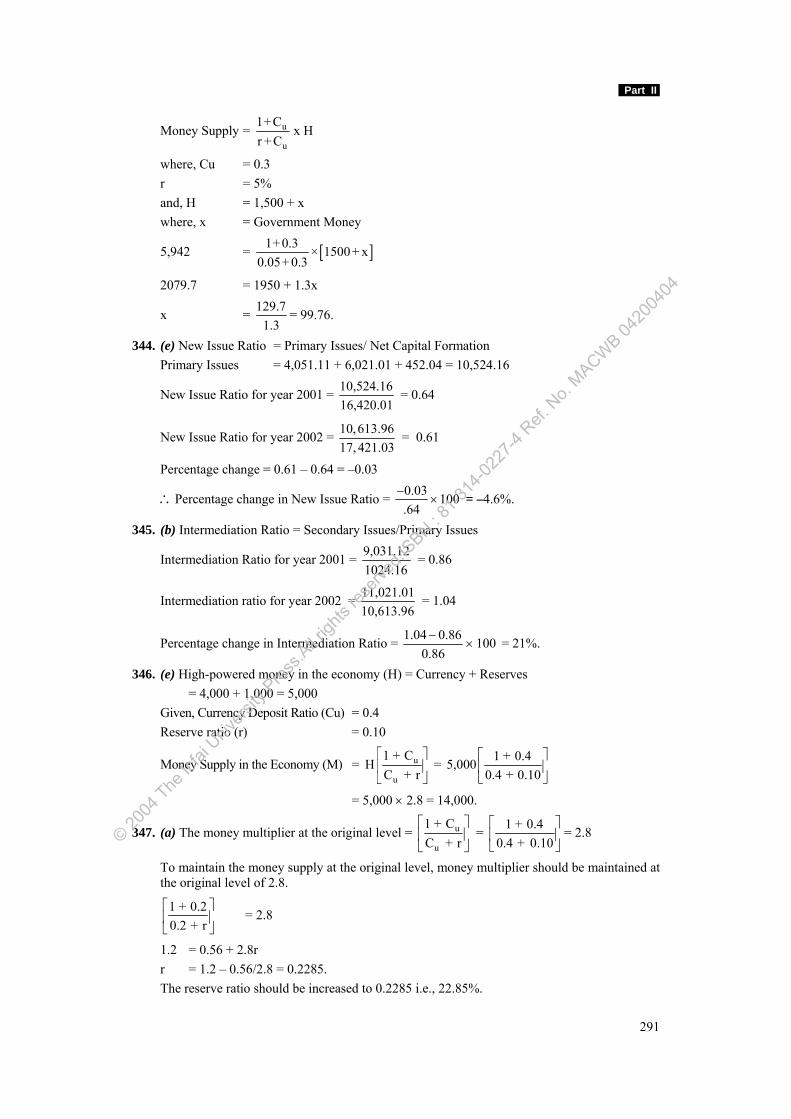
Part II
291
Money Supply = u
u
1+Cr +C
x H
where, Cu = 0.3 r = 5% and, H = 1,500 + x where, x = Government Money
5,942 = [ ]1+ 0.3 × 1500+ x0.05+ 0.3
2079.7 = 1950 + 1.3x
x = 129.71.3
= 99.76.
344. (e) New Issue Ratio = Primary Issues/ Net Capital Formation Primary Issues = 4,051.11 + 6,021.01 + 452.04 = 10,524.16
New Issue Ratio for year 2001 = 10,524.1616,420.01
= 0.64
New Issue Ratio for year 2002 = 10,613.9617, 421.03
= 0.61
Percentage change = 0.61 – 0.64 = –0.03
∴Percentage change in New Issue Ratio = 0.03 100.64
−× = –4.6%.
345. (b) Intermediation Ratio = Secondary Issues/Primary Issues
Intermediation Ratio for year 2001 = 9,031.121024.16
= 0.86
Intermediation ratio for year 2002 = 11,021.0110,613.96
= 1.04
Percentage change in Intermediation Ratio = 1.04 0.86 1000.86
−× = 21%.
346. (e) High-powered money in the economy (H) = Currency + Reserves = 4,000 + 1,000 = 5,000 Given, Currency Deposit Ratio (Cu) = 0.4 Reserve ratio (r) = 0.10
Money Supply in the Economy (M) = u
u
1 + CH
C + r⎡ ⎤⎢ ⎥⎣ ⎦
= 1 + 0.45,0000.4 + 0.10
⎡ ⎤⎢ ⎥⎣ ⎦
= 5,000 × 2.8 = 14,000.
347. (a) The money multiplier at the original level = u
u
1 + CC + r
⎡ ⎤⎢ ⎥⎣ ⎦
= 1 + 0.40.4 + 0.10
⎡ ⎤⎢ ⎥⎣ ⎦
= 2.8
To maintain the money supply at the original level, money multiplier should be maintained at the original level of 2.8.
1 + 0.20.2 + r
⎡ ⎤⎢ ⎥⎣ ⎦
= 2.8
1.2 = 0.56 + 2.8r r = 1.2 – 0.56/2.8 = 0.2285. The reserve ratio should be increased to 0.2285 i.e., 22.85%.
© 2004
The Ic
fai U
nivers
ity P
ress.A
ll righ
ts res
erved
.ISBN : 8
1-314
-0227
-4 Ref.
No.
MACWB 04
2004
04
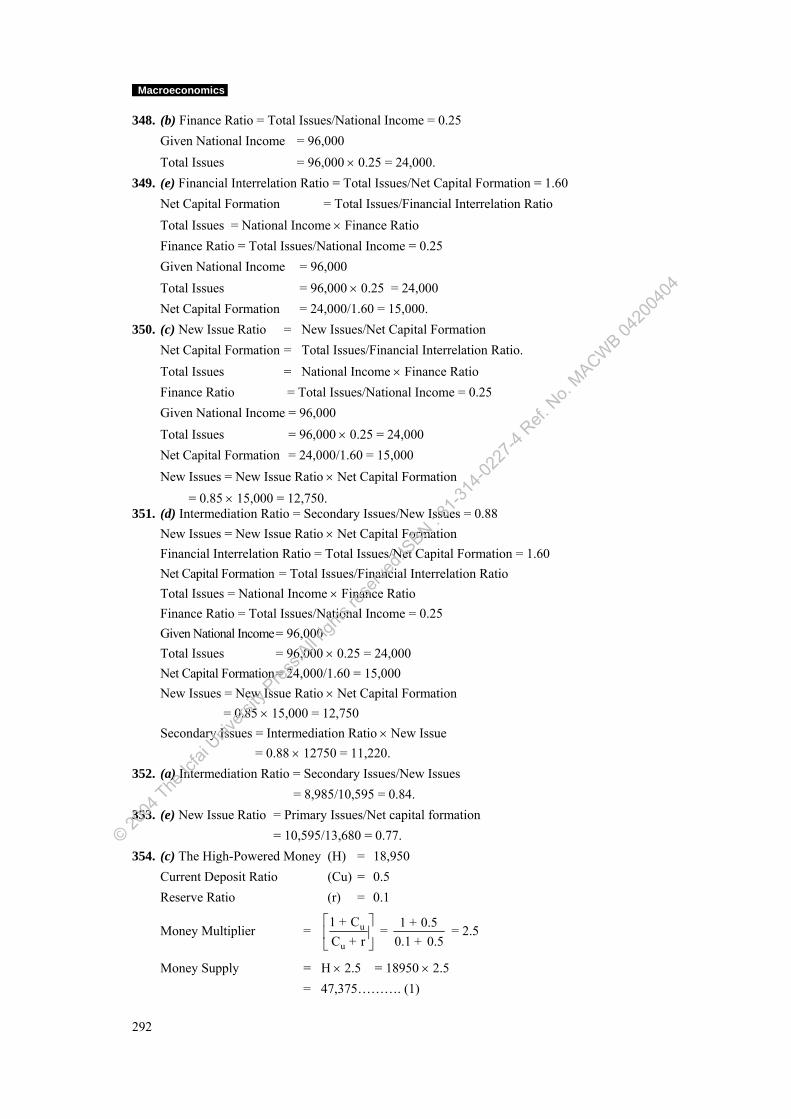
Macroeconomics
292
348. (b) Finance Ratio = Total Issues/National Income = 0.25 Given National Income = 96,000 Total Issues = 96,000 × 0.25 = 24,000. 349. (e) Financial Interrelation Ratio = Total Issues/Net Capital Formation = 1.60 Net Capital Formation = Total Issues/Financial Interrelation Ratio Total Issues = National Income × Finance Ratio Finance Ratio = Total Issues/National Income = 0.25 Given National Income = 96,000 Total Issues = 96,000 × 0.25 = 24,000 Net Capital Formation = 24,000/1.60 = 15,000. 350. (c) New Issue Ratio = New Issues/Net Capital Formation Net Capital Formation = Total Issues/Financial Interrelation Ratio. Total Issues = National Income × Finance Ratio Finance Ratio = Total Issues/National Income = 0.25 Given National Income = 96,000 Total Issues = 96,000 × 0.25 = 24,000 Net Capital Formation = 24,000/1.60 = 15,000 New Issues = New Issue Ratio × Net Capital Formation = 0.85 × 15,000 = 12,750. 351. (d) Intermediation Ratio = Secondary Issues/New Issues = 0.88 New Issues = New Issue Ratio × Net Capital Formation Financial Interrelation Ratio = Total Issues/Net Capital Formation = 1.60 Net Capital Formation = Total Issues/Financial Interrelation Ratio Total Issues = National Income × Finance Ratio Finance Ratio = Total Issues/National Income = 0.25 Given National Income = 96,000 Total Issues = 96,000 × 0.25 = 24,000 Net Capital Formation = 24,000/1.60 = 15,000 New Issues = New Issue Ratio × Net Capital Formation = 0.85 × 15,000 = 12,750 Secondary Issues = Intermediation Ratio × New Issue = 0.88 × 12750 = 11,220. 352. (a) Intermediation Ratio = Secondary Issues/New Issues = 8,985/10,595 = 0.84. 353. (e) New Issue Ratio = Primary Issues/Net capital formation = 10,595/13,680 = 0.77. 354. (c) The High-Powered Money (H) = 18,950 Current Deposit Ratio (Cu) = 0.5 Reserve Ratio (r) = 0.1
Money Multiplier = u
u
1 + CC + r
⎡ ⎤⎢ ⎥⎣ ⎦
= 1 + 0.50.1 + 0.5
= 2.5
Money Supply = H × 2.5 = 18950 × 2.5 = 47,375………. (1)
© 2004
The Ic
fai U
nivers
ity P
ress.A
ll righ
ts res
erved
.ISBN : 8
1-314
-0227
-4 Ref.
No.
MACWB 04
2004
04
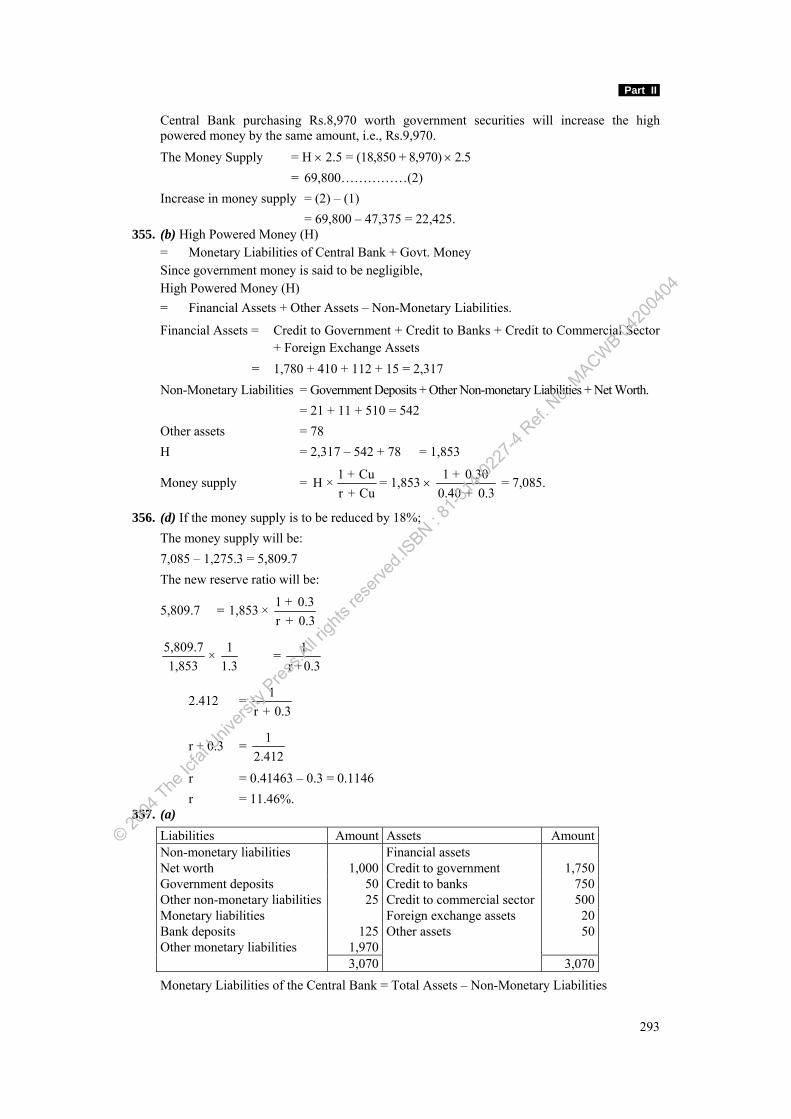
Part II
293
Central Bank purchasing Rs.8,970 worth government securities will increase the high powered money by the same amount, i.e., Rs.9,970.
The Money Supply = H × 2.5 = (18,850 + 8,970) × 2.5 = 69,800……………(2) Increase in money supply = (2) – (1) = 69,800 – 47,375 = 22,425. 355. (b) High Powered Money (H) = Monetary Liabilities of Central Bank + Govt. Money Since government money is said to be negligible, High Powered Money (H) = Financial Assets + Other Assets – Non-Monetary Liabilities.
Financial Assets = Credit to Government + Credit to Banks + Credit to Commercial Sector + Foreign Exchange Assets
= 1,780 + 410 + 112 + 15 = 2,317 Non-Monetary Liabilities = Government Deposits + Other Non-monetary Liabilities + Net Worth. = 21 + 11 + 510 = 542 Other assets = 78 H = 2,317 – 542 + 78 = 1,853
Money supply = 1 + CuH ×r + Cu
= 1,853 × 1 + 0.300.40 + 0.3
= 7,085.
356. (d) If the money supply is to be reduced by 18%; The money supply will be: 7,085 – 1,275.3 = 5,809.7 The new reserve ratio will be:
5,809.7 = 1 + 0.31,853 × r + 0.3
5,809.7 1× 1,853 1.3
= 1r +0.3
2.412 = 1r + 0.3
r + 0.3 = 12.412
r = 0.41463 – 0.3 = 0.1146 r = 11.46%. 357. (a)
Liabilities Amount Assets Amount Non-monetary liabilities Financial assets Net worth 1,000 Credit to government 1,750 Government deposits 50 Credit to banks 750 Other non-monetary liabilities 25 Credit to commercial sector 500 Monetary liabilities Foreign exchange assets 20 Bank deposits 125 Other assets 50 Other monetary liabilities 1,970 3,070 3,070
Monetary Liabilities of the Central Bank = Total Assets – Non-Monetary Liabilities
© 2004
The Ic
fai U
nivers
ity P
ress.A
ll righ
ts res
erved
.ISBN : 8
1-314
-0227
-4 Ref.
No.
MACWB 04
2004
04
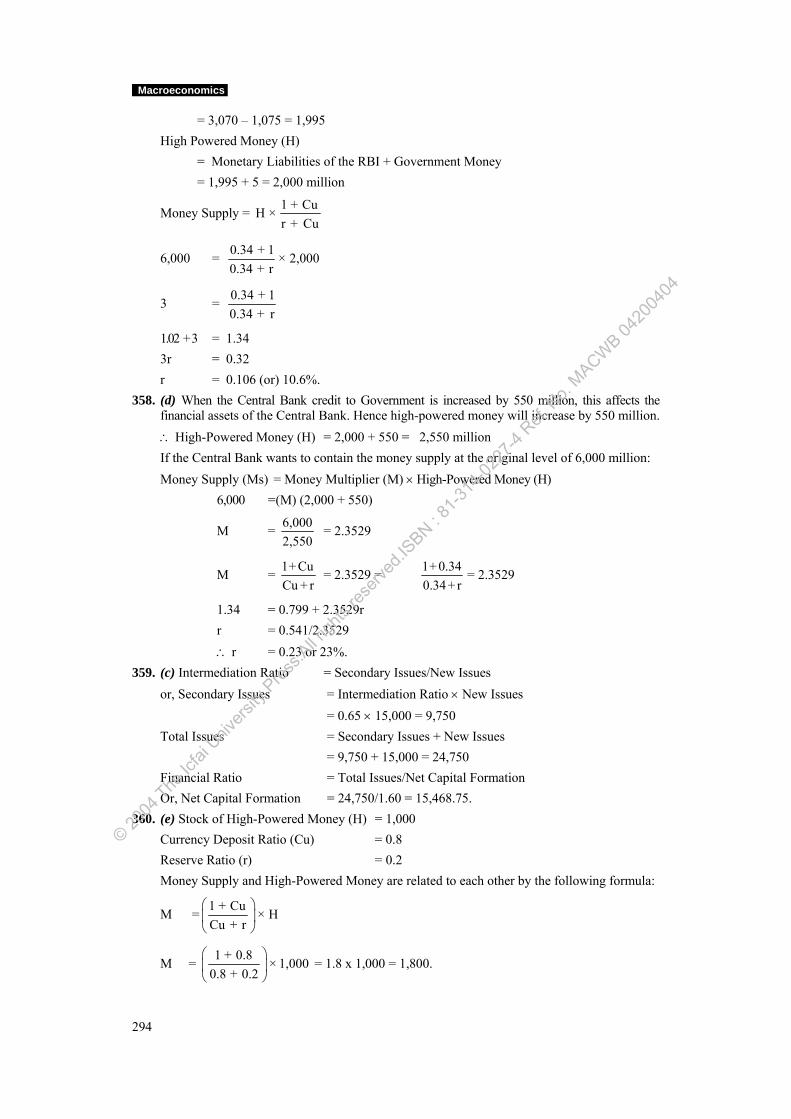
Macroeconomics
294
= 3,070 – 1,075 = 1,995 High Powered Money (H) = Monetary Liabilities of the RBI + Government Money = 1,995 + 5 = 2,000 million
Money Supply = 1 + CuH ×r + Cu
6,000 = 0.34 + 1 × 2,0000.34 + r
3 = 0.34 + 10.34 + r
1.02 + 3 = 1.34 3r = 0.32 r = 0.106 (or) 10.6%. 358. (d) When the Central Bank credit to Government is increased by 550 million, this affects the
financial assets of the Central Bank. Hence high-powered money will increase by 550 million. ∴ High-Powered Money (H) = 2,000 + 550 = 2,550 million If the Central Bank wants to contain the money supply at the original level of 6,000 million: Money Supply (Ms) = Money Multiplier (M) × High-Powered Money (H) 6,000 = (M) (2,000 + 550)
M = 6,0002,550
= 2.3529
M = 1+CuCu + r
= 2.3529 = 1+ 0.340.34+ r
= 2.3529
1.34 = 0.799 + 2.3529r r = 0.541/2.3529 ∴ r = 0.23 or 23%. 359. (c) Intermediation Ratio = Secondary Issues/New Issues or, Secondary Issues = Intermediation Ratio × New Issues = 0.65 × 15,000 = 9,750 Total Issues = Secondary Issues + New Issues = 9,750 + 15,000 = 24,750 Financial Ratio = Total Issues/Net Capital Formation Or, Net Capital Formation = 24,750/1.60 = 15,468.75. 360. (e) Stock of High-Powered Money (H) = 1,000 Currency Deposit Ratio (Cu) = 0.8 Reserve Ratio (r) = 0.2 Money Supply and High-Powered Money are related to each other by the following formula:
M = 1 + Cu × HCu + r
⎛ ⎞⎜ ⎟⎝ ⎠
M = 1 + 0.8 × 1,0000.8 + 0.2
⎛ ⎞⎜ ⎟⎝ ⎠
= 1.8 x 1,000 = 1,800.
© 2004
The Ic
fai U
nivers
ity P
ress.A
ll righ
ts res
erved
.ISBN : 8
1-314
-0227
-4 Ref.
No.
MACWB 04
2004
04
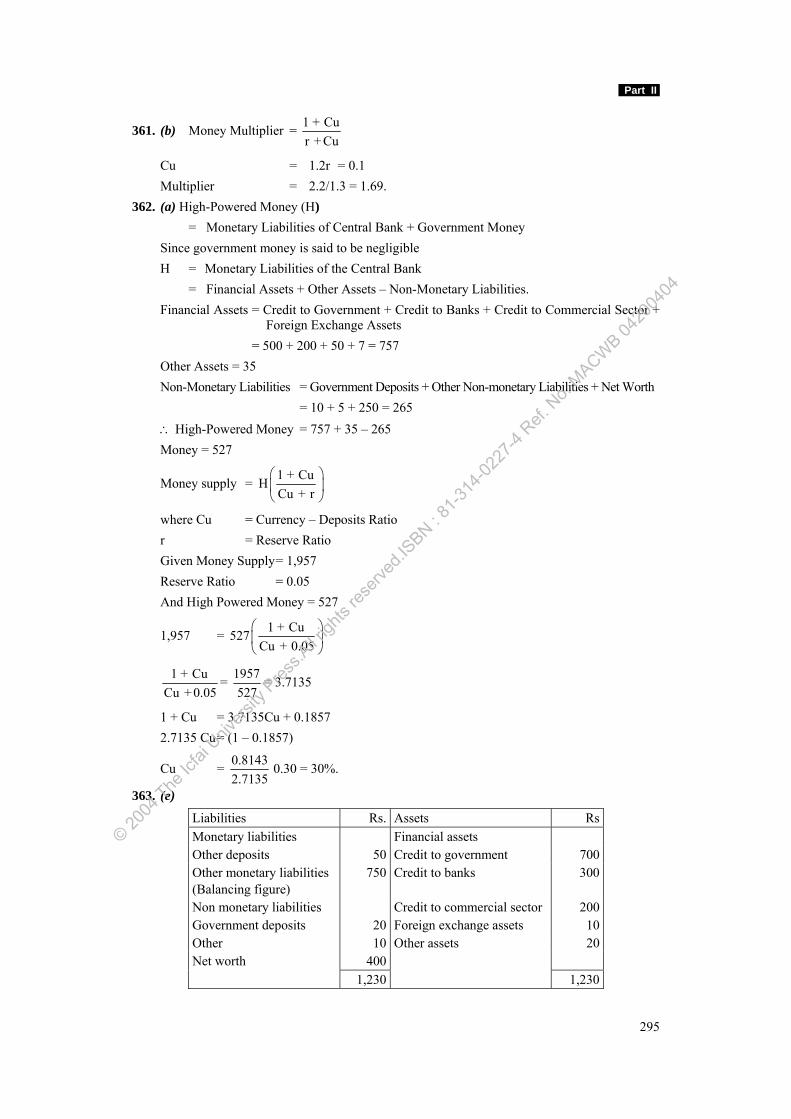
Part II
295
361. (b) Money Multiplier = 1 + Cur + Cu
Cu = 1.2r = 0.1 Multiplier = 2.2/1.3 = 1.69. 362. (a) High-Powered Money (H) = Monetary Liabilities of Central Bank + Government Money Since government money is said to be negligible H = Monetary Liabilities of the Central Bank = Financial Assets + Other Assets – Non-Monetary Liabilities. Financial Assets = Credit to Government + Credit to Banks + Credit to Commercial Sector +
Foreign Exchange Assets = 500 + 200 + 50 + 7 = 757 Other Assets = 35 Non-Monetary Liabilities = Government Deposits + Other Non-monetary Liabilities + Net Worth = 10 + 5 + 250 = 265 ∴ High-Powered Money = 757 + 35 – 265 Money = 527
Money supply = 1 + CuHCu + r
⎛ ⎞⎜ ⎟⎝ ⎠
where Cu = Currency – Deposits Ratio r = Reserve Ratio Given Money Supply = 1,957 Reserve Ratio = 0.05 And High Powered Money = 527
1,957 = 1 + Cu527Cu + 0.05
⎛ ⎞⎜ ⎟⎝ ⎠
1 + CuCu + 0.05
= 1957527
= 3.7135
1 + Cu = 3.7135Cu + 0.1857 2.7135 Cu = (1 – 0.1857)
Cu = 0.81432.7135
0.30 = 30%.
363. (e)
Liabilities Rs. Assets Rs Monetary liabilities Financial assets Other deposits 50 Credit to government 700 Other monetary liabilities (Balancing figure)
750 Credit to banks 300
Non monetary liabilities Credit to commercial sector 200 Government deposits 20 Foreign exchange assets 10 Other 10 Other assets 20 Net worth 400 1,230 1,230
© 2004
The Ic
fai U
nivers
ity P
ress.A
ll righ
ts res
erved
.ISBN : 8
1-314
-0227
-4 Ref.
No.
MACWB 04
2004
04
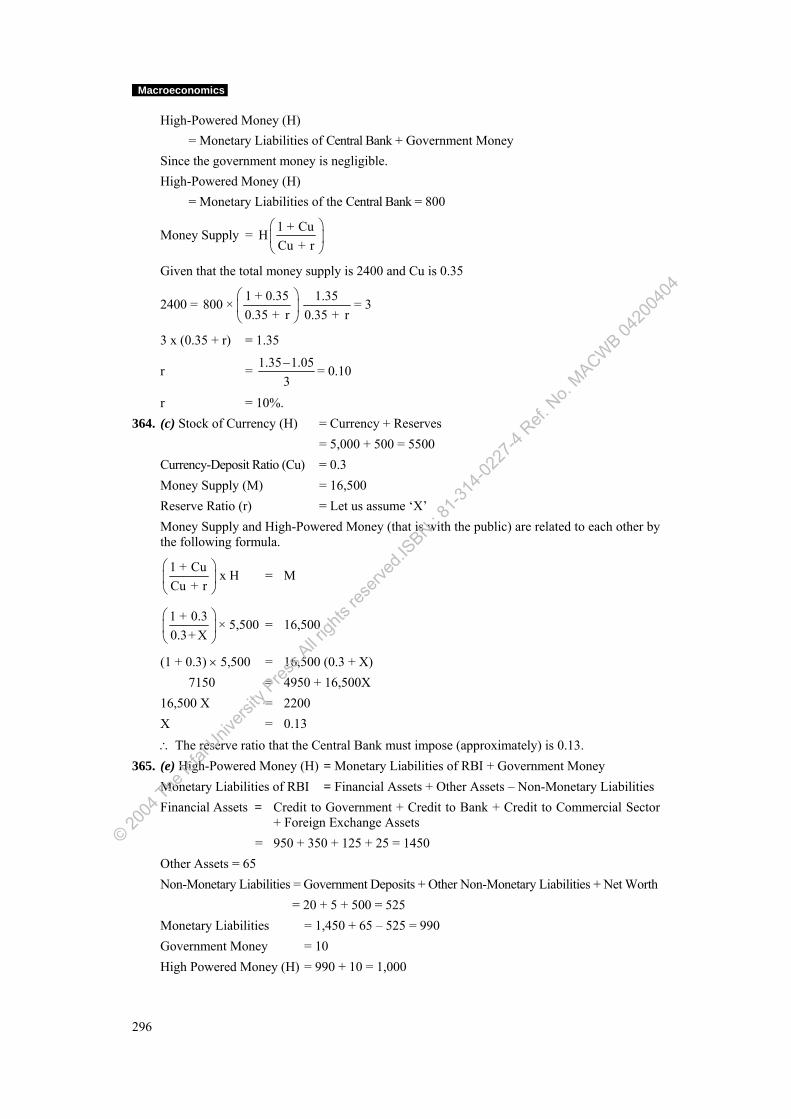
Macroeconomics
296
High-Powered Money (H) = Monetary Liabilities of Central Bank + Government Money Since the government money is negligible. High-Powered Money (H) = Monetary Liabilities of the Central Bank = 800
Money Supply = 1 + CuHCu + r
⎛ ⎞⎜ ⎟⎝ ⎠
Given that the total money supply is 2400 and Cu is 0.35
2400 = 1 + 0.35800 ×0.35 + r
⎛ ⎞⎜ ⎟⎝ ⎠
1.350.35 + r
= 3
3 x (0.35 + r) = 1.35
r = 1.35 1.053− = 0.10
r = 10%. 364. (c) Stock of Currency (H) = Currency + Reserves = 5,000 + 500 = 5500 Currency-Deposit Ratio (Cu) = 0.3 Money Supply (M) = 16,500 Reserve Ratio (r) = Let us assume ‘X’ Money Supply and High-Powered Money (that is with the public) are related to each other by
the following formula.
1 + Cu x HCu + r
⎛ ⎞⎜ ⎟⎝ ⎠
= M
1 + 0.3 × 5,5000.3+ X
⎛ ⎞⎜ ⎟⎝ ⎠
= 16,500
(1 + 0.3) × 5,500 = 16,500 (0.3 + X) 7150 = 4950 + 16,500X 16,500 X = 2200 X = 0.13 ∴ The reserve ratio that the Central Bank must impose (approximately) is 0.13. 365. (e) High-Powered Money (H) = Monetary Liabilities of RBI + Government Money Monetary Liabilities of RBI = Financial Assets + Other Assets – Non-Monetary Liabilities Financial Assets = Credit to Government + Credit to Bank + Credit to Commercial Sector
+ Foreign Exchange Assets = 950 + 350 + 125 + 25 = 1450 Other Assets = 65 Non-Monetary Liabilities = Government Deposits + Other Non-Monetary Liabilities + Net Worth = 20 + 5 + 500 = 525 Monetary Liabilities = 1,450 + 65 – 525 = 990 Government Money = 10 High Powered Money (H) = 990 + 10 = 1,000
© 2004
The Ic
fai U
nivers
ity P
ress.A
ll righ
ts res
erved
.ISBN : 8
1-314
-0227
-4 Ref.
No.
MACWB 04
2004
04
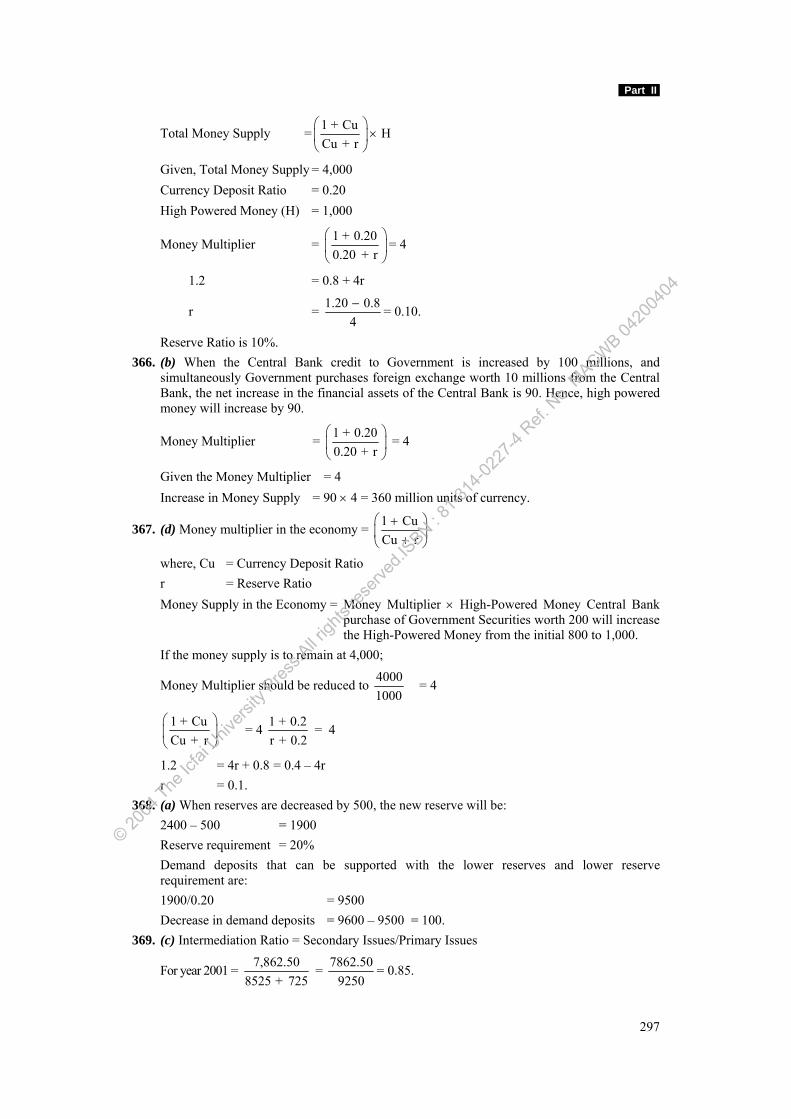
Part II
297
Total Money Supply = 1 + Cu HCu + r
⎛ ⎞×⎜ ⎟
⎝ ⎠
Given, Total Money Supply = 4,000 Currency Deposit Ratio = 0.20 High Powered Money (H) = 1,000
Money Multiplier = 1 + 0.200.20 + r
⎛ ⎞⎜ ⎟⎝ ⎠
= 4
1.2 = 0.8 + 4r
r = 1.20 0.84− = 0.10.
Reserve Ratio is 10%. 366. (b) When the Central Bank credit to Government is increased by 100 millions, and
simultaneously Government purchases foreign exchange worth 10 millions from the Central Bank, the net increase in the financial assets of the Central Bank is 90. Hence, high powered money will increase by 90.
Money Multiplier = 1 + 0.200.20 + r
⎛ ⎞⎜ ⎟⎝ ⎠
= 4
Given the Money Multiplier = 4 Increase in Money Supply = 90 × 4 = 360 million units of currency.
367. (d) Money multiplier in the economy = 1 CuCu r
⎛ ⎞+⎜ ⎟+⎝ ⎠
where, Cu = Currency Deposit Ratio r = Reserve Ratio Money Supply in the Economy = Money Multiplier × High-Powered Money Central Bank
purchase of Government Securities worth 200 will increase the High-Powered Money from the initial 800 to 1,000.
If the money supply is to remain at 4,000;
Money Multiplier should be reduced to 40001000
= 4
1 + CuCu + r
⎛ ⎞⎜ ⎟⎝ ⎠
= 4 1 + 0.2r + 0.2
= 4
1.2 = 4r + 0.8 = 0.4 – 4r r = 0.1. 368. (a) When reserves are decreased by 500, the new reserve will be: 2400 – 500 = 1900 Reserve requirement = 20% Demand deposits that can be supported with the lower reserves and lower reserve
requirement are: 1900/0.20 = 9500 Decrease in demand deposits = 9600 – 9500 = 100. 369. (c) Intermediation Ratio = Secondary Issues/Primary Issues
For year 2001 = 7,862.508525 + 725
= 7862.509250
= 0.85.
© 2004
The Ic
fai U
nivers
ity P
ress.A
ll righ
ts res
erved
.ISBN : 8
1-314
-0227
-4 Ref.
No.
MACWB 04
2004
04
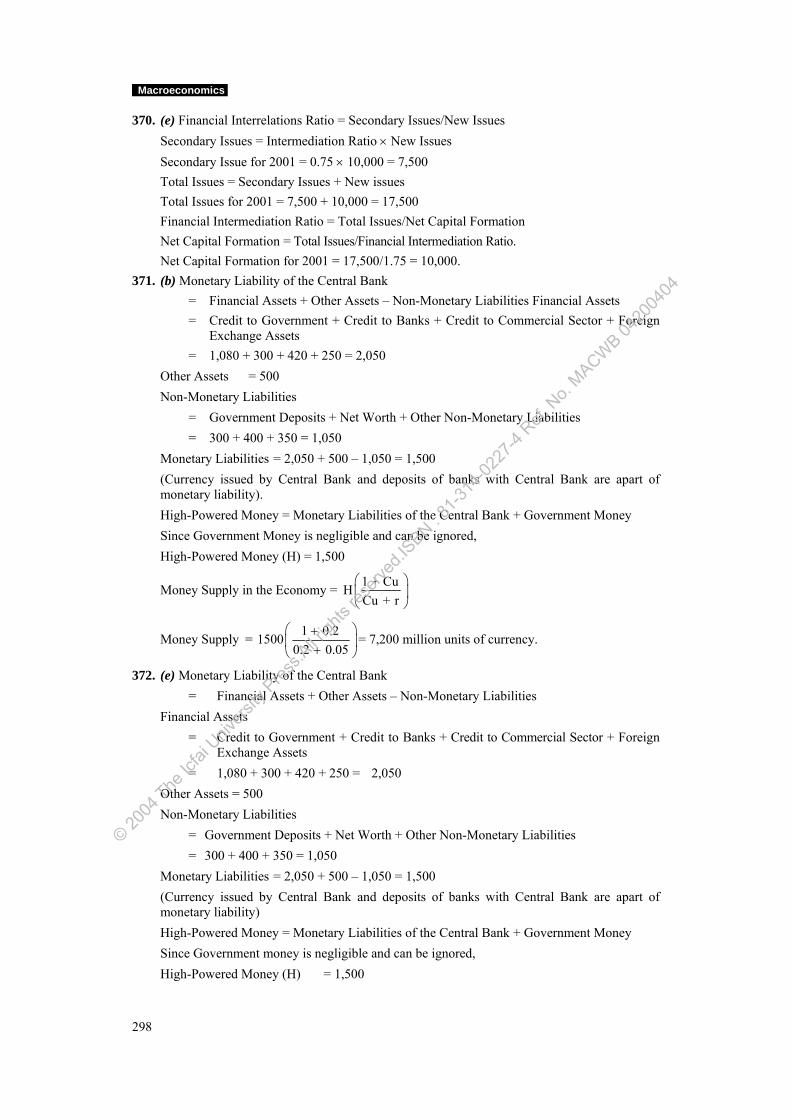
Macroeconomics
298
370. (e) Financial Interrelations Ratio = Secondary Issues/New Issues Secondary Issues = Intermediation Ratio × New Issues Secondary Issue for 2001 = 0.75 × 10,000 = 7,500 Total Issues = Secondary Issues + New issues Total Issues for 2001 = 7,500 + 10,000 = 17,500 Financial Intermediation Ratio = Total Issues/Net Capital Formation Net Capital Formation = Total Issues/Financial Intermediation Ratio. Net Capital Formation for 2001 = 17,500/1.75 = 10,000. 371. (b) Monetary Liability of the Central Bank = Financial Assets + Other Assets – Non-Monetary Liabilities Financial Assets = Credit to Government + Credit to Banks + Credit to Commercial Sector + Foreign
Exchange Assets = 1,080 + 300 + 420 + 250 = 2,050 Other Assets = 500 Non-Monetary Liabilities = Government Deposits + Net Worth + Other Non-Monetary Liabilities = 300 + 400 + 350 = 1,050 Monetary Liabilities = 2,050 + 500 – 1,050 = 1,500 (Currency issued by Central Bank and deposits of banks with Central Bank are apart of
monetary liability). High-Powered Money = Monetary Liabilities of the Central Bank + Government Money Since Government Money is negligible and can be ignored, High-Powered Money (H) = 1,500
Money Supply in the Economy = 1 + CuHCu + r
⎛ ⎞⎜ ⎟⎝ ⎠
Money Supply = 1 0.215000.2 0.05
⎛ ⎞+⎜ ⎟+⎝ ⎠
= 7,200 million units of currency.
372. (e) Monetary Liability of the Central Bank = Financial Assets + Other Assets – Non-Monetary Liabilities Financial Assets = Credit to Government + Credit to Banks + Credit to Commercial Sector + Foreign
Exchange Assets = 1,080 + 300 + 420 + 250 = 2,050 Other Assets = 500 Non-Monetary Liabilities = Government Deposits + Net Worth + Other Non-Monetary Liabilities = 300 + 400 + 350 = 1,050 Monetary Liabilities = 2,050 + 500 – 1,050 = 1,500 (Currency issued by Central Bank and deposits of banks with Central Bank are apart of
monetary liability) High-Powered Money = Monetary Liabilities of the Central Bank + Government Money Since Government money is negligible and can be ignored, High-Powered Money (H) = 1,500
© 2004
The Ic
fai U
nivers
ity P
ress.A
ll righ
ts res
erved
.ISBN : 8
1-314
-0227
-4 Ref.
No.
MACWB 04
2004
04
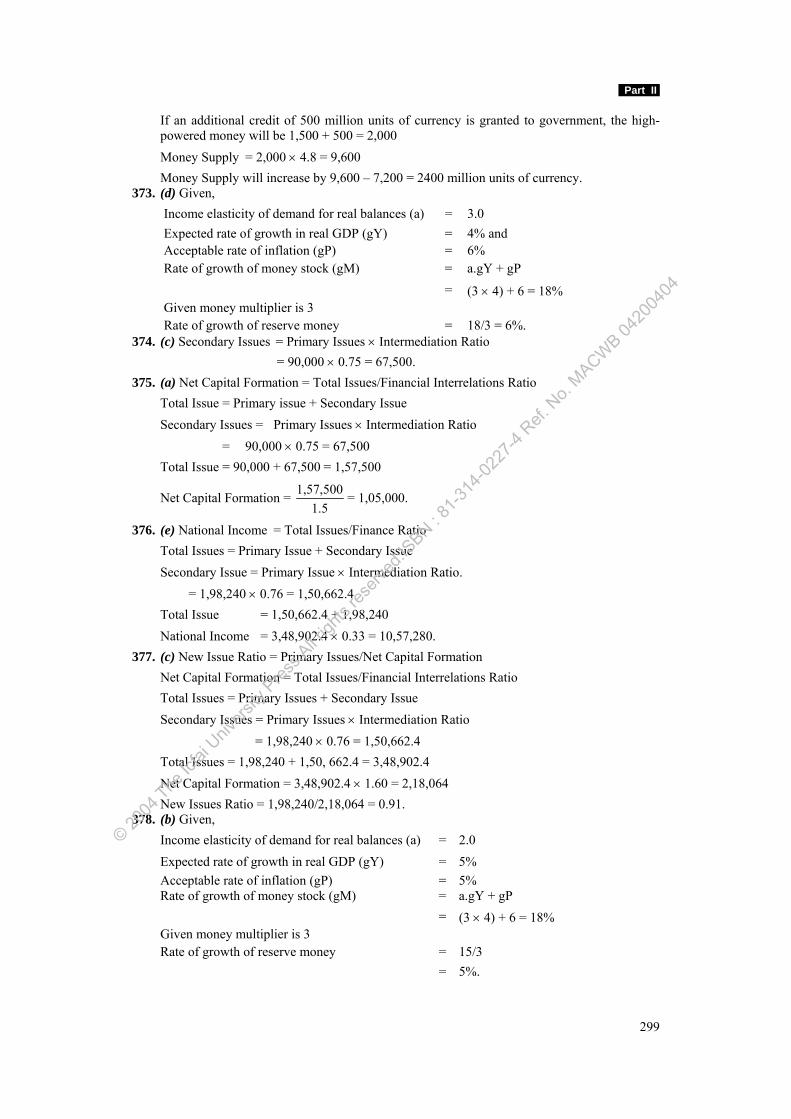
Part II
299
If an additional credit of 500 million units of currency is granted to government, the high-powered money will be 1,500 + 500 = 2,000
Money Supply = 2,000 × 4.8 = 9,600 Money Supply will increase by 9,600 – 7,200 = 2400 million units of currency. 373. (d) Given,
Income elasticity of demand for real balances (a) = 3.0 Expected rate of growth in real GDP (gY) = 4% and Acceptable rate of inflation (gP) = 6% Rate of growth of money stock (gM) = a.gY + gP = (3 × 4) + 6 = 18% Given money multiplier is 3 Rate of growth of reserve money = 18/3 = 6%.
374. (c) Secondary Issues = Primary Issues × Intermediation Ratio = 90,000 × 0.75 = 67,500. 375. (a) Net Capital Formation = Total Issues/Financial Interrelations Ratio Total Issue = Primary issue + Secondary Issue Secondary Issues = Primary Issues × Intermediation Ratio = 90,000 × 0.75 = 67,500 Total Issue = 90,000 + 67,500 = 1,57,500
Net Capital Formation = 1,57,5001.5
= 1,05,000.
376. (e) National Income = Total Issues/Finance Ratio Total Issues = Primary Issue + Secondary Issue Secondary Issue = Primary Issue × Intermediation Ratio. = 1,98,240 × 0.76 = 1,50,662.4 Total Issue = 1,50,662.4 + 1,98,240 National Income = 3,48,902.4 × 0.33 = 10,57,280. 377. (c) New Issue Ratio = Primary Issues/Net Capital Formation Net Capital Formation = Total Issues/Financial Interrelations Ratio Total Issues = Primary Issues + Secondary Issue Secondary Issues = Primary Issues × Intermediation Ratio = 1,98,240 × 0.76 = 1,50,662.4 Total Issues = 1,98,240 + 1,50, 662.4 = 3,48,902.4 Net Capital Formation = 3,48,902.4 × 1.60 = 2,18,064 New Issues Ratio = 1,98,240/2,18,064 = 0.91. 378. (b) Given,
Income elasticity of demand for real balances (a) = 2.0 Expected rate of growth in real GDP (gY) = 5% Acceptable rate of inflation (gP) = 5% Rate of growth of money stock (gM) = a.gY + gP = (3 × 4) + 6 = 18% Given money multiplier is 3 Rate of growth of reserve money = 15/3 = 5%.
© 2004
The Ic
fai U
nivers
ity P
ress.A
ll righ
ts res
erved
.ISBN : 8
1-314
-0227
-4 Ref.
No.
MACWB 04
2004
04
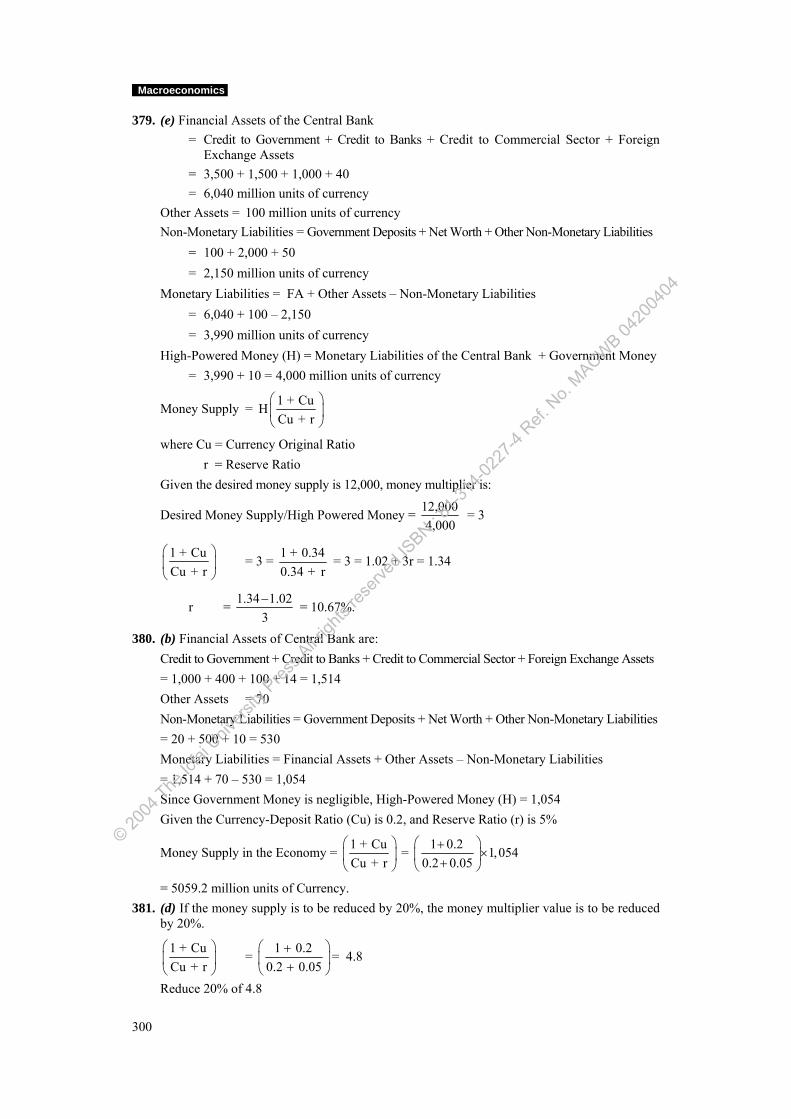
Macroeconomics
300
379. (e) Financial Assets of the Central Bank = Credit to Government + Credit to Banks + Credit to Commercial Sector + Foreign
Exchange Assets = 3,500 + 1,500 + 1,000 + 40 = 6,040 million units of currency Other Assets = 100 million units of currency Non-Monetary Liabilities = Government Deposits + Net Worth + Other Non-Monetary Liabilities = 100 + 2,000 + 50 = 2,150 million units of currency Monetary Liabilities = FA + Other Assets – Non-Monetary Liabilities = 6,040 + 100 – 2,150 = 3,990 million units of currency High-Powered Money (H) = Monetary Liabilities of the Central Bank + Government Money = 3,990 + 10 = 4,000 million units of currency
Money Supply = 1 + CuHCu + r
⎛ ⎞⎜ ⎟⎝ ⎠
where Cu = Currency Original Ratio r = Reserve Ratio Given the desired money supply is 12,000, money multiplier is:
Desired Money Supply/High Powered Money = 12,0004,000
= 3
1 + CuCu + r
⎛ ⎞⎜ ⎟⎝ ⎠
= 3 = 1 + 0.340.34 + r
= 3 = 1.02 + 3r = 1.34
r = 1.34 1.023− = 10.67%.
380. (b) Financial Assets of Central Bank are: Credit to Government + Credit to Banks + Credit to Commercial Sector + Foreign Exchange Assets = 1,000 + 400 + 100 + 14 = 1,514 Other Assets = 70 Non-Monetary Liabilities = Government Deposits + Net Worth + Other Non-Monetary Liabilities = 20 + 500 + 10 = 530 Monetary Liabilities = Financial Assets + Other Assets – Non-Monetary Liabilities = 1,514 + 70 – 530 = 1,054 Since Government Money is negligible, High-Powered Money (H) = 1,054 Given the Currency-Deposit Ratio (Cu) is 0.2, and Reserve Ratio (r) is 5%
Money Supply in the Economy = 1 + CuCu + r
⎛ ⎞⎜ ⎟⎝ ⎠
= 1 0.2 1,0540.2 0.05
⎛ ⎞+×⎜ ⎟+⎝ ⎠
= 5059.2 million units of Currency. 381. (d) If the money supply is to be reduced by 20%, the money multiplier value is to be reduced
by 20%.
1 + CuCu + r
⎛ ⎞⎜ ⎟⎝ ⎠
= 1 0.20.2 0.05
⎛ ⎞+⎜ ⎟+⎝ ⎠
= 4.8
Reduce 20% of 4.8
© 2004
The Ic
fai U
nivers
ity P
ress.A
ll righ
ts res
erved
.ISBN : 8
1-314
-0227
-4 Ref.
No.
MACWB 04
2004
04
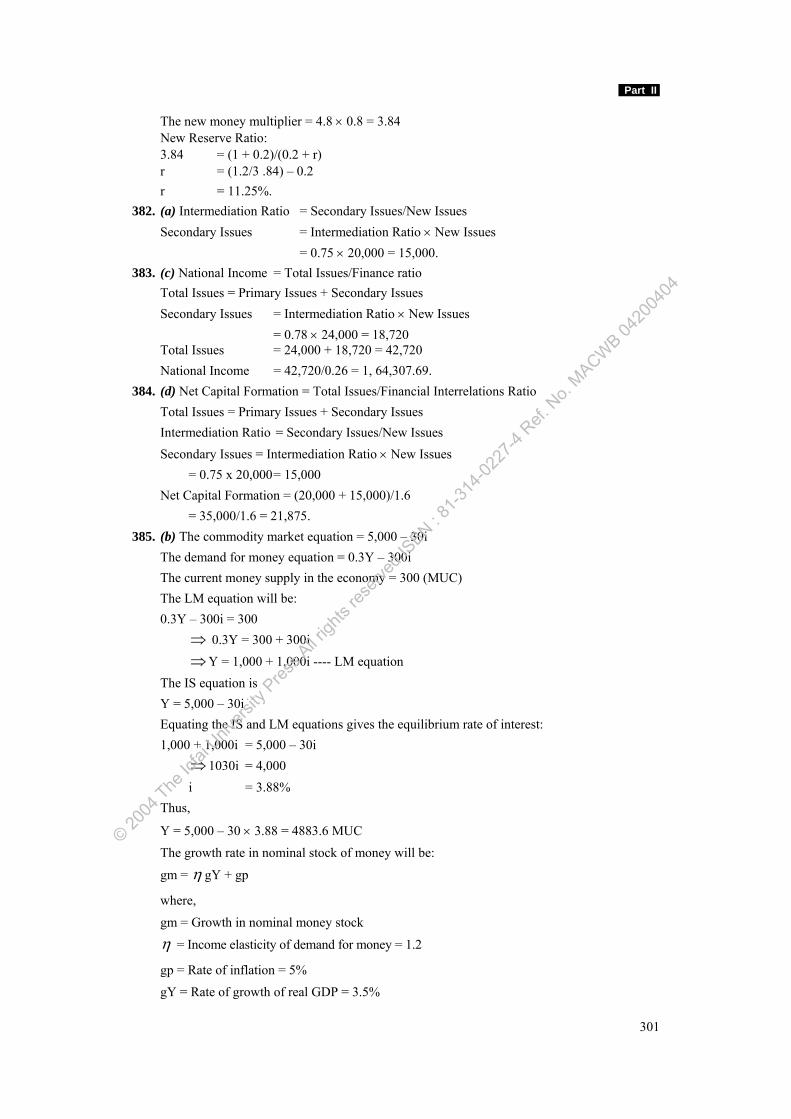
Part II
301
The new money multiplier = 4.8 × 0.8 = 3.84 New Reserve Ratio: 3.84 = (1 + 0.2)/(0.2 + r) r = (1.2/3 .84) – 0.2 r = 11.25%. 382. (a) Intermediation Ratio = Secondary Issues/New Issues Secondary Issues = Intermediation Ratio × New Issues = 0.75 × 20,000 = 15,000. 383. (c) National Income = Total Issues/Finance ratio Total Issues = Primary Issues + Secondary Issues Secondary Issues = Intermediation Ratio × New Issues = 0.78 × 24,000 = 18,720 Total Issues = 24,000 + 18,720 = 42,720 National Income = 42,720/0.26 = 1, 64,307.69. 384. (d) Net Capital Formation = Total Issues/Financial Interrelations Ratio Total Issues = Primary Issues + Secondary Issues Intermediation Ratio = Secondary Issues/New Issues Secondary Issues = Intermediation Ratio × New Issues = 0.75 x 20,000 = 15,000 Net Capital Formation = (20,000 + 15,000)/1.6 = 35,000/1.6 = 21,875. 385. (b) The commodity market equation = 5,000 – 30i The demand for money equation = 0.3Y – 300i
The current money supply in the economy = 300 (MUC) The LM equation will be: 0.3Y – 300i = 300 ⇒ 0.3Y = 300 + 300i ⇒ Y = 1,000 + 1,000i ---- LM equation The IS equation is Y = 5,000 – 30i
Equating the IS and LM equations gives the equilibrium rate of interest: 1,000 + 1,000i = 5,000 – 30i ⇒ 1030i = 4,000 i = 3.88% Thus,
Y = 5,000 – 30 × 3.88 = 4883.6 MUC The growth rate in nominal stock of money will be:
gm = η gY + gp
where,
gm = Growth in nominal money stock
η = Income elasticity of demand for money = 1.2
gp = Rate of inflation = 5%
gY = Rate of growth of real GDP = 3.5%
© 2004
The Ic
fai U
nivers
ity P
ress.A
ll righ
ts res
erved
.ISBN : 8
1-314
-0227
-4 Ref.
No.
MACWB 04
2004
04
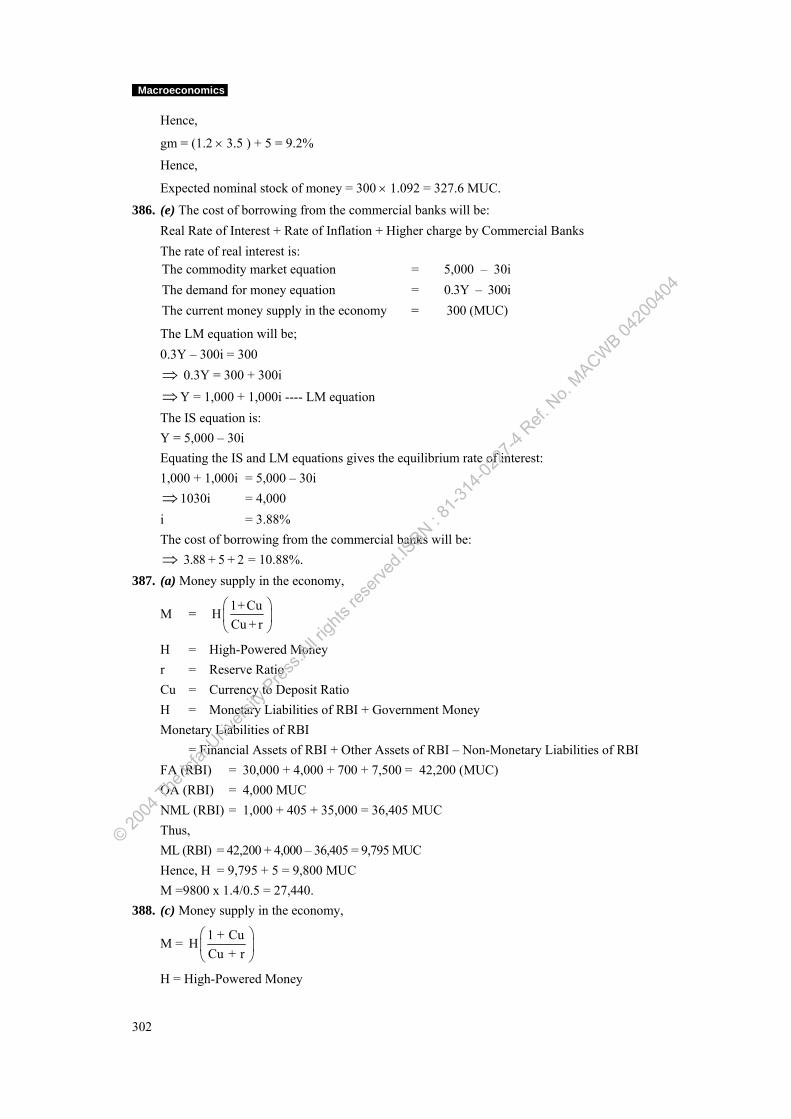
Macroeconomics
302
Hence,
gm = (1.2 × 3.5 ) + 5 = 9.2%
Hence,
Expected nominal stock of money = 300 × 1.092 = 327.6 MUC.
386. (e) The cost of borrowing from the commercial banks will be: Real Rate of Interest + Rate of Inflation + Higher charge by Commercial Banks The rate of real interest is:
The commodity market equation = 5,000 – 30i The demand for money equation = 0.3Y – 300i The current money supply in the economy = 300 (MUC)
The LM equation will be; 0.3Y – 300i = 300 ⇒ 0.3Y = 300 + 300i ⇒ Y = 1,000 + 1,000i ---- LM equation The IS equation is: Y = 5,000 – 30i Equating the IS and LM equations gives the equilibrium rate of interest: 1,000 + 1,000i = 5,000 – 30i ⇒ 1030i = 4,000 i = 3.88% The cost of borrowing from the commercial banks will be: ⇒ 3.88 + 5 + 2 = 10.88%. 387. (a) Money supply in the economy,
M = 1+ CuHCu + r
⎛ ⎞⎜ ⎟⎝ ⎠
H = High-Powered Money r = Reserve Ratio Cu = Currency to Deposit Ratio H = Monetary Liabilities of RBI + Government Money Monetary Liabilities of RBI = Financial Assets of RBI + Other Assets of RBI – Non-Monetary Liabilities of RBI FA (RBI) = 30,000 + 4,000 + 700 + 7,500 = 42,200 (MUC) OA (RBI) = 4,000 MUC NML (RBI) = 1,000 + 405 + 35,000 = 36,405 MUC Thus, ML (RBI) = 42,200 + 4,000 – 36,405 = 9,795 MUC Hence, H = 9,795 + 5 = 9,800 MUC M =9800 x 1.4/0.5 = 27,440. 388. (c) Money supply in the economy,
M = 1 + CuHCu + r
⎛ ⎞⎜ ⎟⎝ ⎠
H = High-Powered Money
© 2004
The Ic
fai U
nivers
ity P
ress.A
ll righ
ts res
erved
.ISBN : 8
1-314
-0227
-4 Ref.
No.
MACWB 04
2004
04
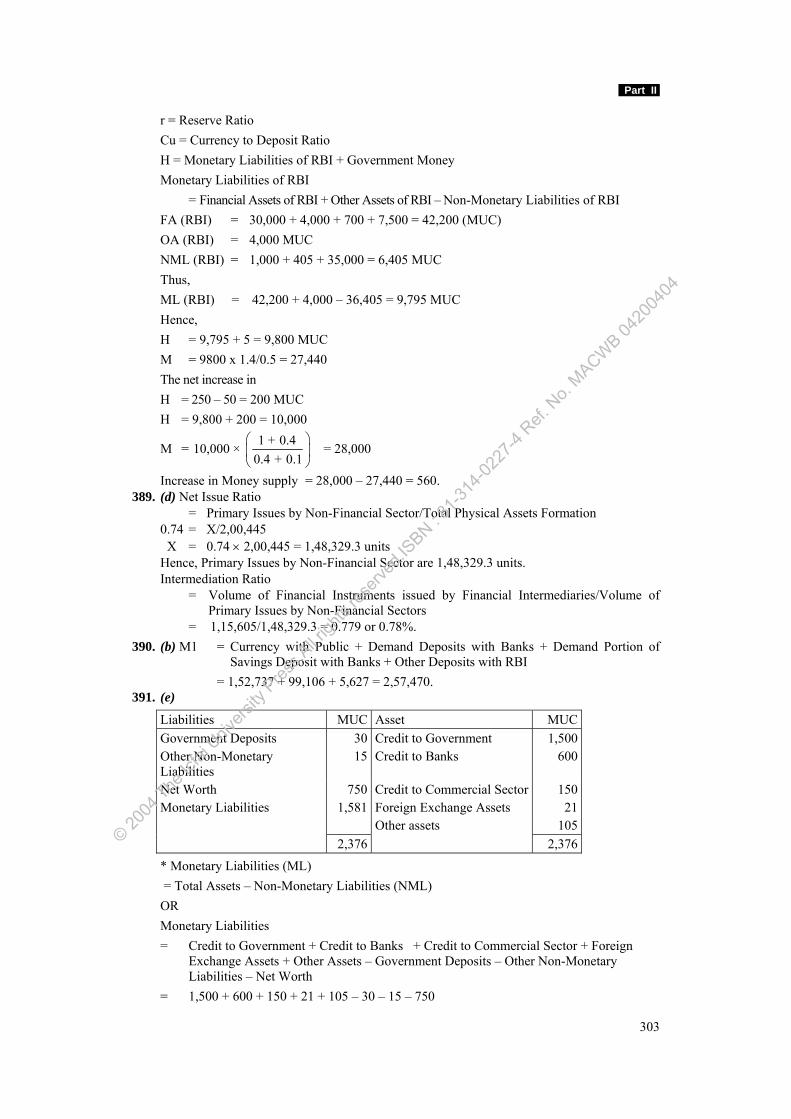
Part II
303
r = Reserve Ratio Cu = Currency to Deposit Ratio H = Monetary Liabilities of RBI + Government Money Monetary Liabilities of RBI = Financial Assets of RBI + Other Assets of RBI – Non-Monetary Liabilities of RBI FA (RBI) = 30,000 + 4,000 + 700 + 7,500 = 42,200 (MUC) OA (RBI) = 4,000 MUC NML (RBI) = 1,000 + 405 + 35,000 = 6,405 MUC Thus, ML (RBI) = 42,200 + 4,000 – 36,405 = 9,795 MUC Hence, H = 9,795 + 5 = 9,800 MUC M = 9800 x 1.4/0.5 = 27,440 The net increase in H = 250 – 50 = 200 MUC H = 9,800 + 200 = 10,000
M = 1 + 0.410,000 × 0.4 + 0.1
⎛ ⎞⎜ ⎟⎝ ⎠
= 28,000
Increase in Money supply = 28,000 – 27,440 = 560. 389. (d) Net Issue Ratio = Primary Issues by Non-Financial Sector/Total Physical Assets Formation 0.74 = X/2,00,445 X = 0.74 × 2,00,445 = 1,48,329.3 units Hence, Primary Issues by Non-Financial Sector are 1,48,329.3 units. Intermediation Ratio = Volume of Financial Instruments issued by Financial Intermediaries/Volume of
Primary Issues by Non-Financial Sectors = 1,15,605/1,48,329.3 = 0.779 or 0.78%. 390. (b) M1 = Currency with Public + Demand Deposits with Banks + Demand Portion of
Savings Deposit with Banks + Other Deposits with RBI = 1,52,737 + 99,106 + 5,627 = 2,57,470. 391. (e)
Liabilities MUC Asset MUC Government Deposits 30 Credit to Government 1,500 Other Non-Monetary Liabilities
15 Credit to Banks 600
Net Worth 750 Credit to Commercial Sector 150 Monetary Liabilities 1,581 Foreign Exchange Assets 21 Other assets 105 2,376 2,376
* Monetary Liabilities (ML) = Total Assets – Non-Monetary Liabilities (NML) OR Monetary Liabilities = Credit to Government + Credit to Banks + Credit to Commercial Sector + Foreign
Exchange Assets + Other Assets – Government Deposits – Other Non-Monetary Liabilities – Net Worth
= 1,500 + 600 + 150 + 21 + 105 – 30 – 15 – 750
© 2004
The Ic
fai U
nivers
ity P
ress.A
ll righ
ts res
erved
.ISBN : 8
1-314
-0227
-4 Ref.
No.
MACWB 04
2004
04
Macroeconomics
304
= 1,581 million Units of Currency Stock of High-Powered Money (H) = Monetary Liabilities of Central Bank + Government Money As the government money constitutes a negligible proportion of total money supply, 1,581
million units represents total stock of High-Powered Money (H). We have, High-Powered Money (H) = 1,581 million units of currency Currency-Deposits Ratio (Cu) = 0.30 Reserve Ratio (r) = 5%
Money Supply (M) = 1 + CuH × r + Cu
⎛ ⎞⎜ ⎟⎝ ⎠
= 1 + 0.301,581 × 0.05 + 0.30
⎛ ⎞⎜ ⎟⎝ ⎠
= 5,872.29 million units of Currency.
392. (c) Total Issues = Primary Issues + Secondary Issue New Issue Ratio = Primary Issues /Net Capital formation Primary Issues = 5,00,000 × 0.80 = 4,00,000 Intermediation Ratio = Secondary Issues/Primary Issues Secondary Issues = Intermediation Ratio x Primary Issue = 0.75 × 4,00,000 = 3,00,000 Total Issues = 4,00,000 + 3,00,000 = 7,00,000. 393. (a) Finance Ratio = Total Issues/National Income Total Issues = Primary Issues + Secondary Issues New Issue Ratio = Primary Issues/Net Capital Formation Primary Issues = 5,00,000 × 0.80 = 4,00,000 Intermediation Ratio = Secondary Issues/Primary Issues Secondary Issues = Intermediation Ratio x Primary Issue = 0.75 x 4,00,000 = 3,00,000 Total Issues = 4,00,000 + 3,00,000 = 7,00,000 National Income = 7,00,000/0.7 = 10,00,000. 394. (d) High-Powered Money (H) = Monetary Liabilities of the RBI + Government Money = C + R Monetary Liabilities of RBI = Financial Assets of RBI + Net Non-Monetary Liabilities of RBI Or ML (RBI) = FA (RBI) + OA (RBI) – NML (RBI) Hence, ML (RBI) = (1,750 + 500 + 750 + 20) + 50 – (1,000 + 25 + 50) = 3,020 + 50 – 1,075 = 1,995 High-Powered Money (H) = 1995 + 5 = 2,000
Ms = 1 + CuH ×r + Cu
⎛ ⎞⎜ ⎟⎝ ⎠
6,000 = 1 + 0.342,000 ×r + 0.34
⎛ ⎞⎜ ⎟⎝ ⎠
© 2004
The Ic
fai U
nivers
ity P
ress.A
ll righ
ts res
erved
.ISBN : 8
1-314
-0227
-4 Ref.
No.
MACWB 04
2004
04
Part II
305
⇒ 1.34 =30.34+ r
⇒ 1.02 + 3r = 1.34 3r = 0.32 r = 0.32/3 = 0.1067 = 10.67%. 395. (b) As per the given information, the high power money is: High-Powered Money (H) = Monetary Liabilities of the RBI + Government Money = C + R Monetary Liabilities of RBI = Financial Assets of RBI + Net Non-Monetary Liabilities of RBI Or ML (RBI) = FA (RBI) + OA (RBI) – NML (RBI) Hence, ML (RBI) = (1,750 + 500 + 750 + 20) + 50 – (1,000 + 25 + 50) = 3,020 + 50 – 1075 = 1,995 High-Powered Money (H) = 1,995 + 5 = 2,000 The Central Bank credit to Government increases by 550. Hence the financial assets of RBI
increase by 550. Thus, the High-powered money now becomes: H = 2,000 + 550 = 2,550 The new reserve ratio will be:
1 + 0.342,550 ×r + 0.34
⎛ ⎞⎜ ⎟⎝ ⎠
= 6,000
1.340.34 + r
= 2.35
0.80 + 2.35r = 1.34
r = 1.34 0.82.35
− = 0.542.35
= 0.229 or 22.9%.
396. (e) Financial Interrelation Ratio = Total Issues/Net Capital Formation Finance Ratio = Total Issue/National Income Total Issue = 0.25 × 96,000 = 24,000 Net Capital Formation = 24,000/1.6 = 15,000. 397. (a) Financial Interrelation Ratio = Total Issues/Net Capital Formation Finance Ratio = Total Issue/National Income Total Issue = 0.25 × 96,000 = 24,000 Net Capital Formation = 24,000/1.6 = 15,000 New Issue ratio = Primary Issues/Net Capital Formation Primary Issues = 15,000 × 0.85 = 12,750 Total Issue = Primary Issue + Secondary Issue 24,000 = 12,750 + Secondary Issue Secondary Issue = Total Issue – Primary Issue = 24,000 – 12,750 = 11,250. 398. (c) Finance Ratio = Total Issues/National Income Total Issues = Secondary Issues + Primary Issues = 9,600 + 12,800 = 22,400 Finance Ratio = 22,400/89,600 = 0.25. 399. (e) Intermediation Ratio = Secondary Issues/Primary Issues Secondary Issues = 9,600/12,800 = 0.75.
© 2004
The Ic
fai U
nivers
ity P
ress.A
ll righ
ts res
erved
.ISBN : 8
1-314
-0227
-4 Ref.
No.
MACWB 04
2004
04
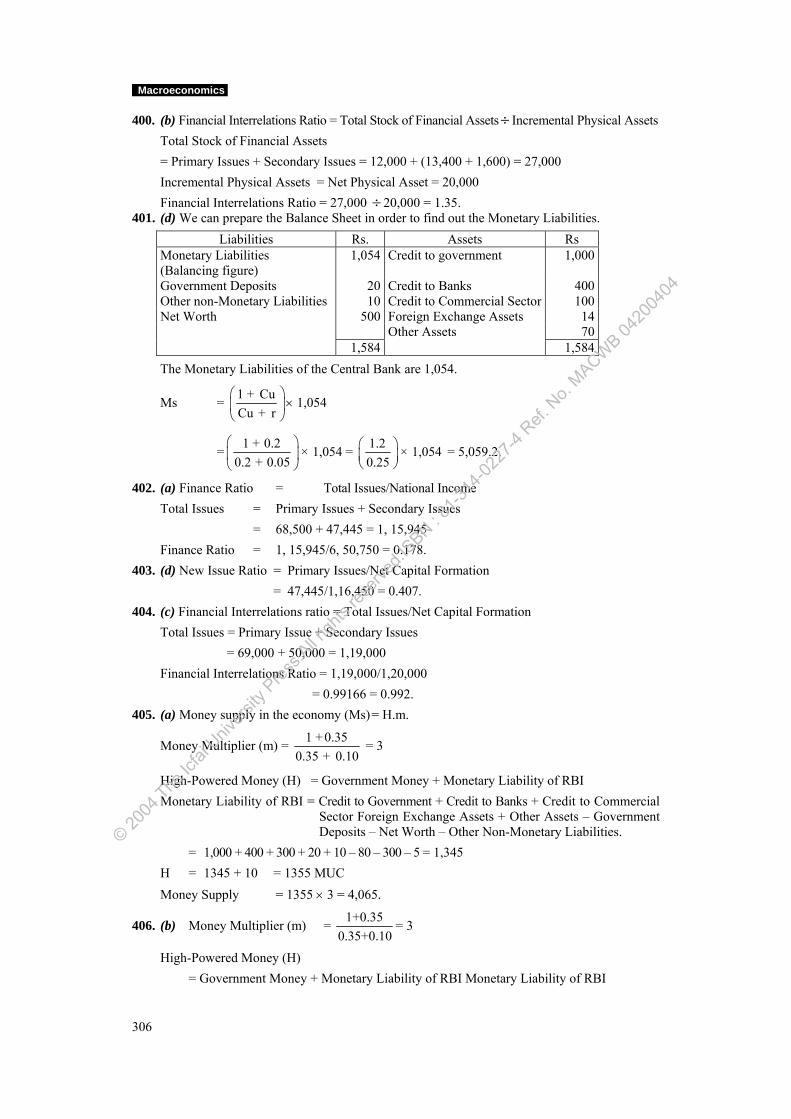
Macroeconomics
306
400. (b) Financial Interrelations Ratio = Total Stock of Financial Assets ÷ Incremental Physical Assets Total Stock of Financial Assets = Primary Issues + Secondary Issues = 12,000 + (13,400 + 1,600) = 27,000 Incremental Physical Assets = Net Physical Asset = 20,000 Financial Interrelations Ratio = 27,000 ÷ 20,000 = 1.35. 401. (d) We can prepare the Balance Sheet in order to find out the Monetary Liabilities.
Liabilities Rs. Assets Rs Monetary Liabilities (Balancing figure)
1,054 Credit to government 1,000
Government Deposits 20 Credit to Banks 400 Other non-Monetary Liabilities 10 Credit to Commercial Sector 100 Net Worth 500 Foreign Exchange Assets 14 Other Assets 70 1,584 1,584
The Monetary Liabilities of the Central Bank are 1,054.
Ms = 1 + CuCu + r
⎛ ⎞⎜ ⎟⎝ ⎠
× 1,054
= 1 + 0.2 × 1,0540.2 + 0.05
⎛ ⎞⎜ ⎟⎝ ⎠
= 1.2 × 1,0540.25
⎛ ⎞⎜ ⎟⎝ ⎠
= 5,059.2.
402. (a) Finance Ratio = Total Issues/National Income Total Issues = Primary Issues + Secondary Issues = 68,500 + 47,445 = 1, 15,945 Finance Ratio = 1, 15,945/6, 50,750 = 0.178. 403. (d) New Issue Ratio = Primary Issues/Net Capital Formation = 47,445/1,16,450 = 0.407. 404. (c) Financial Interrelations ratio = Total Issues/Net Capital Formation Total Issues = Primary Issue + Secondary Issues = 69,000 + 50,000 = 1,19,000 Financial Interrelations Ratio = 1,19,000/1,20,000 = 0.99166 = 0.992. 405. (a) Money supply in the economy (Ms) = H.m.
Money Multiplier (m) = 1 +0.350.35 + 0.10
= 3
High-Powered Money (H) = Government Money + Monetary Liability of RBI Monetary Liability of RBI = Credit to Government + Credit to Banks + Credit to Commercial
Sector Foreign Exchange Assets + Other Assets – Government Deposits – Net Worth – Other Non-Monetary Liabilities.
= 1,000 + 400 + 300 + 20 + 10 – 80 – 300 – 5 = 1,345 H = 1345 + 10 = 1355 MUC Money Supply = 1355 × 3 = 4,065.
406. (b) Money Multiplier (m) = 1+0.350.35+0.10
= 3
High-Powered Money (H) = Government Money + Monetary Liability of RBI Monetary Liability of RBI
© 2004
The Ic
fai U
nivers
ity P
ress.A
ll righ
ts res
erved
.ISBN : 8
1-314
-0227
-4 Ref.
No.
MACWB 04
2004
04
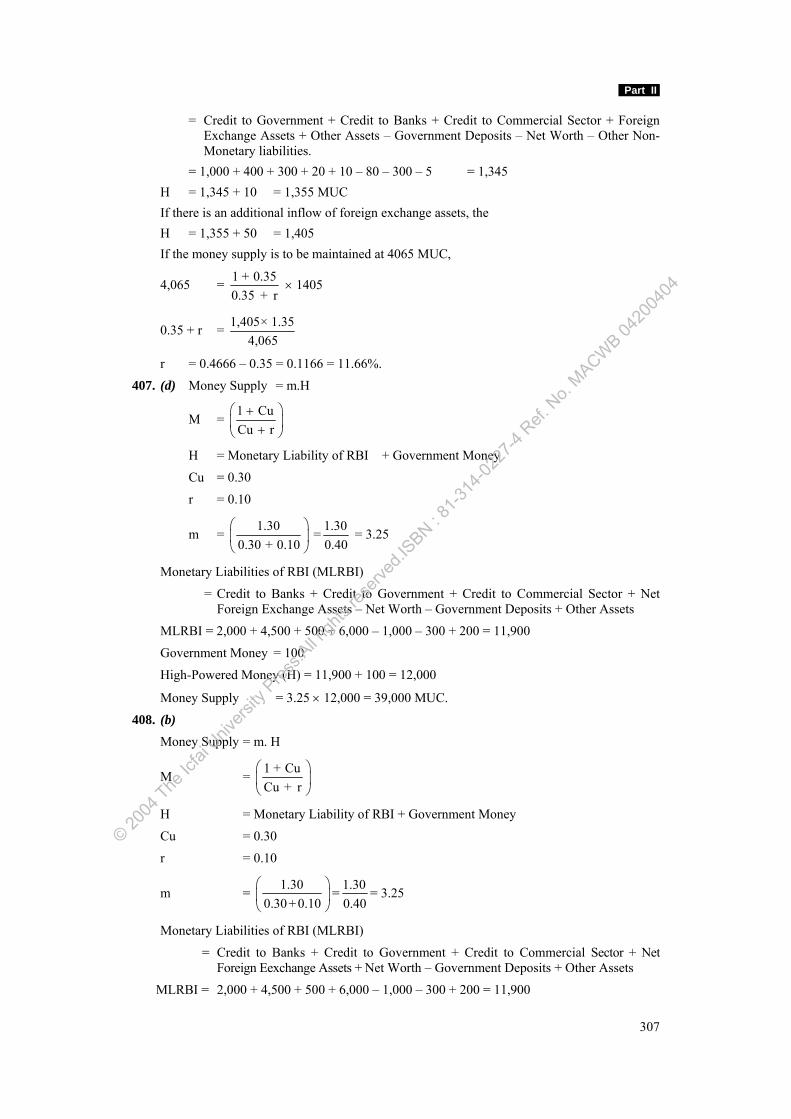
Part II
307
= Credit to Government + Credit to Banks + Credit to Commercial Sector + Foreign Exchange Assets + Other Assets – Government Deposits – Net Worth – Other Non-Monetary liabilities.
= 1,000 + 400 + 300 + 20 + 10 – 80 – 300 – 5 = 1,345 H = 1,345 + 10 = 1,355 MUC If there is an additional inflow of foreign exchange assets, the H = 1,355 + 50 = 1,405 If the money supply is to be maintained at 4065 MUC,
4,065 = 1 + 0.350.35 + r
× 1405
0.35 + r = 1,405× 1.354,065
r = 0.4666 – 0.35 = 0.1166 = 11.66%. 407. (d) Money Supply = m.H
M = 1 CuCu r
⎛ ⎞+⎜ ⎟+⎝ ⎠
H = Monetary Liability of RBI + Government Money
Cu = 0.30
r = 0.10
m = 1.300.30 + 0.10
⎛ ⎞⎜ ⎟⎝ ⎠
= 1.300.40
= 3.25
Monetary Liabilities of RBI (MLRBI)
= Credit to Banks + Credit to Government + Credit to Commercial Sector + Net Foreign Exchange Assets – Net Worth – Government Deposits + Other Assets
MLRBI = 2,000 + 4,500 + 500 + 6,000 – 1,000 – 300 + 200 = 11,900
Government Money = 100
High-Powered Money (H) = 11,900 + 100 = 12,000
Money Supply = 3.25 × 12,000 = 39,000 MUC.
408. (b) Money Supply = m. H
M = 1 + CuCu + r
⎛ ⎞⎜ ⎟⎝ ⎠
H = Monetary Liability of RBI + Government Money
Cu = 0.30
r = 0.10
m = 1.300.30+ 0.10
⎛ ⎞⎜ ⎟⎝ ⎠
= 1.300.40
= 3.25
Monetary Liabilities of RBI (MLRBI)
= Credit to Banks + Credit to Government + Credit to Commercial Sector + Net Foreign Eexchange Assets + Net Worth – Government Deposits + Other Assets
MLRBI = 2,000 + 4,500 + 500 + 6,000 – 1,000 – 300 + 200 = 11,900
© 2004
The Ic
fai U
nivers
ity P
ress.A
ll righ
ts res
erved
.ISBN : 8
1-314
-0227
-4 Ref.
No.
MACWB 04
2004
04
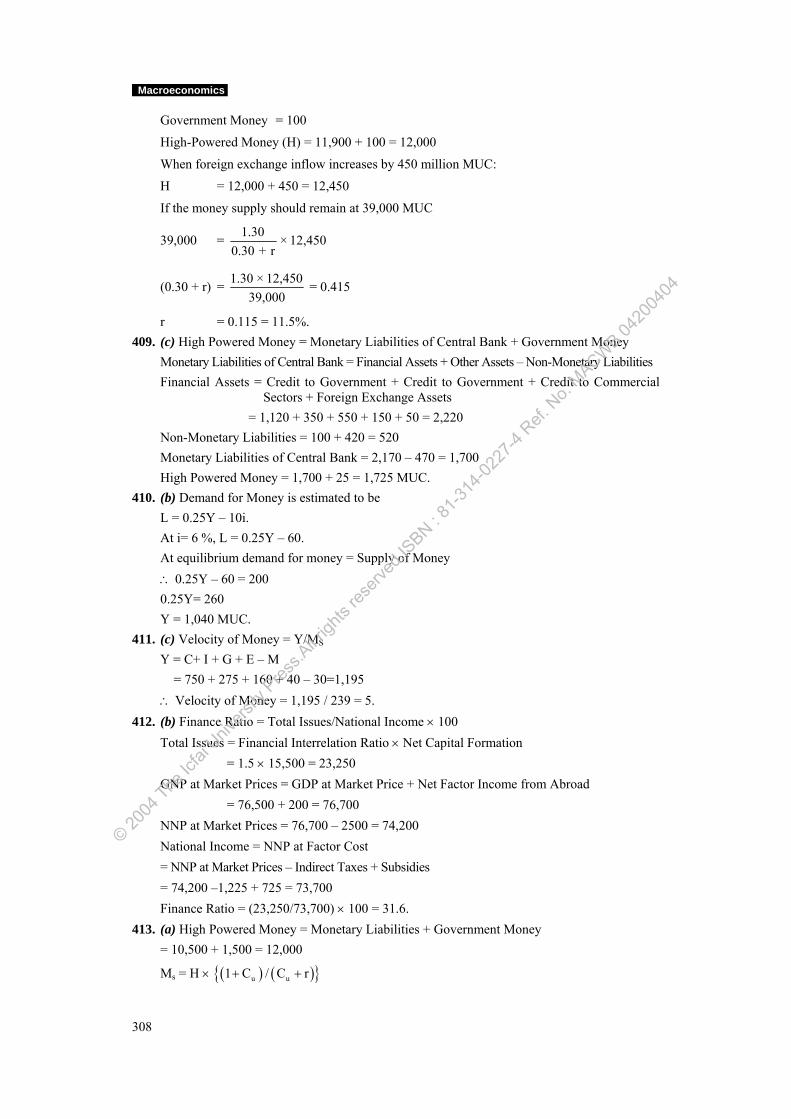
Macroeconomics
308
Government Money = 100
High-Powered Money (H) = 11,900 + 100 = 12,000
When foreign exchange inflow increases by 450 million MUC:
H = 12,000 + 450 = 12,450
If the money supply should remain at 39,000 MUC
39,000 = 1.30 × 12,4500.30 + r
(0.30 + r) = 1.30 × 12,45039,000
= 0.415
r = 0.115 = 11.5%. 409. (c) High Powered Money = Monetary Liabilities of Central Bank + Government Money Monetary Liabilities of Central Bank = Financial Assets + Other Assets – Non-Monetary Liabilities Financial Assets = Credit to Government + Credit to Government + Credit to Commercial
Sectors + Foreign Exchange Assets = 1,120 + 350 + 550 + 150 + 50 = 2,220 Non-Monetary Liabilities = 100 + 420 = 520 Monetary Liabilities of Central Bank = 2,170 – 470 = 1,700 High Powered Money = 1,700 + 25 = 1,725 MUC. 410. (b) Demand for Money is estimated to be L = 0.25Y – 10i. At i= 6 %, L = 0.25Y – 60. At equilibrium demand for money = Supply of Money ∴ 0.25Y – 60 = 200 0.25Y= 260 Y = 1,040 MUC. 411. (c) Velocity of Money = Y/MS
Y = C+ I + G + E – M = 750 + 275 + 160 + 40 – 30=1,195 ∴ Velocity of Money = 1,195 / 239 = 5. 412. (b) Finance Ratio = Total Issues/National Income × 100 Total Issues = Financial Interrelation Ratio × Net Capital Formation = 1.5 × 15,500 = 23,250 GNP at Market Prices = GDP at Market Price + Net Factor Income from Abroad = 76,500 + 200 = 76,700 NNP at Market Prices = 76,700 – 2500 = 74,200 National Income = NNP at Factor Cost = NNP at Market Prices – Indirect Taxes + Subsidies = 74,200 –1,225 + 725 = 73,700 Finance Ratio = (23,250/73,700) × 100 = 31.6. 413. (a) High Powered Money = Monetary Liabilities + Government Money = 10,500 + 1,500 = 12,000
Ms = H × ( ) ( ){ }u u1 C / C r+ +
© 2004
The Ic
fai U
nivers
ity P
ress.A
ll righ
ts res
erved
.ISBN : 8
1-314
-0227
-4 Ref.
No.
MACWB 04
2004
04
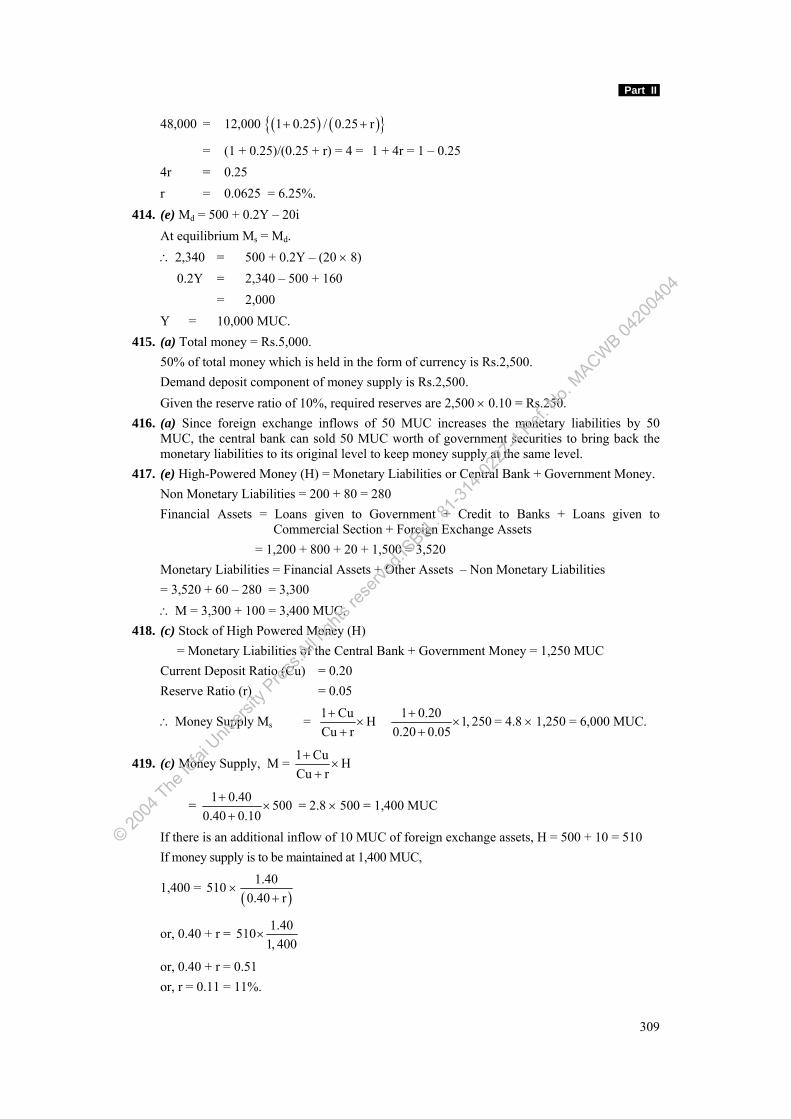
Part II
309
48,000 = 12,000 ( ) ( ){ }1 0.25 / 0.25 r+ +
= (1 + 0.25)/(0.25 + r) = 4 = 1 + 4r = 1 – 0.25 4r = 0.25 r = 0.0625 = 6.25%. 414. (e) Md = 500 + 0.2Y – 20i At equilibrium Ms = Md. ∴ 2,340 = 500 + 0.2Y – (20 × 8) 0.2Y = 2,340 – 500 + 160 = 2,000 Y = 10,000 MUC. 415. (a) Total money = Rs.5,000. 50% of total money which is held in the form of currency is Rs.2,500. Demand deposit component of money supply is Rs.2,500. Given the reserve ratio of 10%, required reserves are 2,500 × 0.10 = Rs.250. 416. (a) Since foreign exchange inflows of 50 MUC increases the monetary liabilities by 50
MUC, the central bank can sold 50 MUC worth of government securities to bring back the monetary liabilities to its original level to keep money supply at the same level.
417. (e) High-Powered Money (H) = Monetary Liabilities or Central Bank + Government Money. Non Monetary Liabilities = 200 + 80 = 280 Financial Assets = Loans given to Government + Credit to Banks + Loans given to
Commercial Section + Foreign Exchange Assets = 1,200 + 800 + 20 + 1,500 = 3,520 Monetary Liabilities = Financial Assets + Other Assets – Non Monetary Liabilities = 3,520 + 60 – 280 = 3,300 ∴ M = 3,300 + 100 = 3,400 MUC.
418. (c) Stock of High Powered Money (H) = Monetary Liabilities of the Central Bank + Government Money = 1,250 MUC Current Deposit Ratio (Cu) = 0.20 Reserve Ratio (r) = 0.05
∴ Money Supply Ms = 1 Cu HCu r
+×
+ 1 0.20 1, 250
0.20 0.05+
×+
= 4.8 × 1,250 = 6,000 MUC.
419. (c) Money Supply, M = 1 Cu HCu r
+×
+
= 1 0.40 5000.40 0.10
+×
+ = 2.8 × 500 = 1,400 MUC
If there is an additional inflow of 10 MUC of foreign exchange assets, H = 500 + 10 = 510 If money supply is to be maintained at 1,400 MUC,
1,400 = ( )
1.405100.40 r
×+
or, 0.40 + r = 1.405101, 400
×
or, 0.40 + r = 0.51 or, r = 0.11 = 11%.
© 2004
The Ic
fai U
nivers
ity P
ress.A
ll righ
ts res
erved
.ISBN : 8
1-314
-0227
-4 Ref.
No.
MACWB 04
2004
04
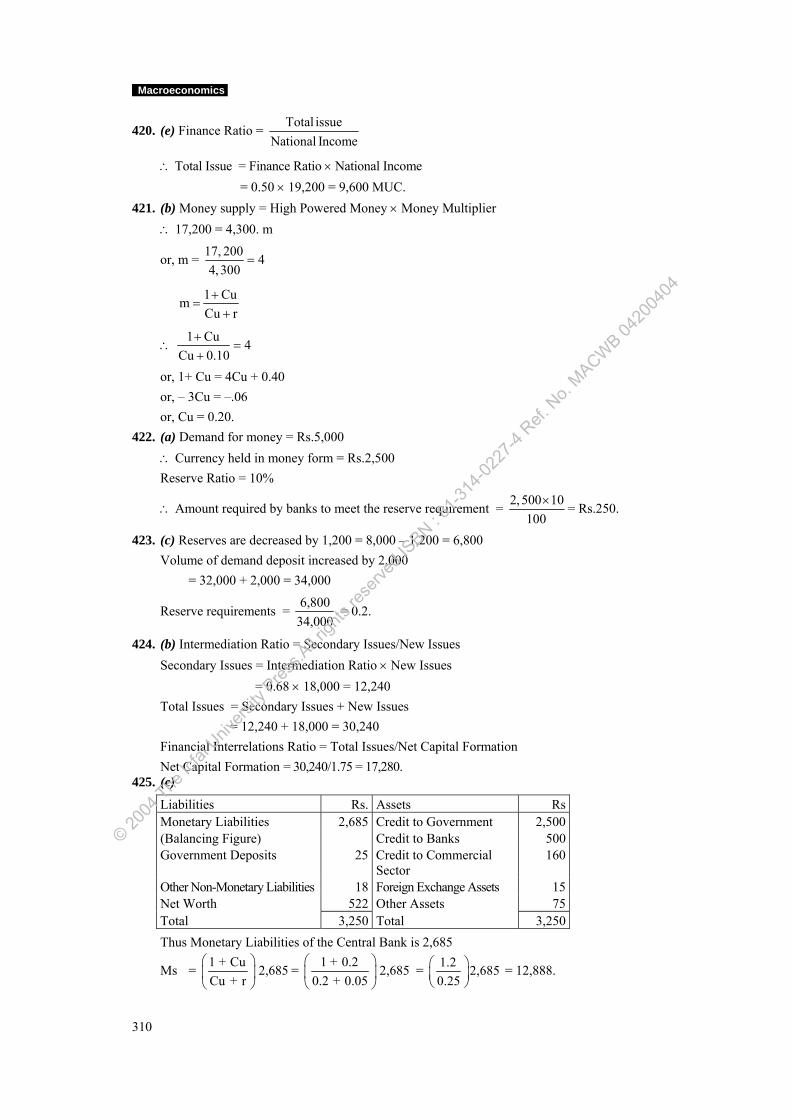
Macroeconomics
310
420. (e) Finance Ratio = Total issueNational Income
∴ Total Issue = Finance Ratio × National Income = 0.50 × 19,200 = 9,600 MUC.
421. (b) Money supply = High Powered Money × Money Multiplier ∴ 17,200 = 4,300. m
or, m = 17, 200 44, 300
=
1 CumCu r
+=
+
∴ 1 Cu 4Cu 0.10
+=
+
or, 1+ Cu = 4Cu + 0.40 or, – 3Cu = –.06 or, Cu = 0.20. 422. (a) Demand for money = Rs.5,000 ∴ Currency held in money form = Rs.2,500 Reserve Ratio = 10%
∴ Amount required by banks to meet the reserve requirement = 2, 500 10100
× = Rs.250.
423. (c) Reserves are decreased by 1,200 = 8,000 – 1,200 = 6,800 Volume of demand deposit increased by 2,000 = 32,000 + 2,000 = 34,000
Reserve requirements = 6,80034,000
= 0.2.
424. (b) Intermediation Ratio = Secondary Issues/New Issues Secondary Issues = Intermediation Ratio × New Issues = 0.68 × 18,000 = 12,240 Total Issues = Secondary Issues + New Issues = 12,240 + 18,000 = 30,240 Financial Interrelations Ratio = Total Issues/Net Capital Formation Net Capital Formation = 30,240/1.75 = 17,280. 425. (e)
Liabilities Rs. Assets Rs Monetary Liabilities 2,685 Credit to Government 2,500 (Balancing Figure) Credit to Banks 500 Government Deposits 25 Credit to Commercial
Sector 160
Other Non-Monetary Liabilities 18 Foreign Exchange Assets 15 Net Worth 522 Other Assets 75 Total 3,250 Total 3,250
Thus Monetary Liabilities of the Central Bank is 2,685
Ms = 1 + Cu 2,685Cu + r
⎛ ⎞⎜ ⎟⎝ ⎠
= 1 + 0.2 2,6850.2 + 0.05
⎛ ⎞⎜ ⎟⎝ ⎠
= 1.2 2,6850.25
⎛ ⎞⎜ ⎟⎝ ⎠
= 12,888.
© 2004
The Ic
fai U
nivers
ity P
ress.A
ll righ
ts res
erved
.ISBN : 8
1-314
-0227
-4 Ref.
No.
MACWB 04
2004
04
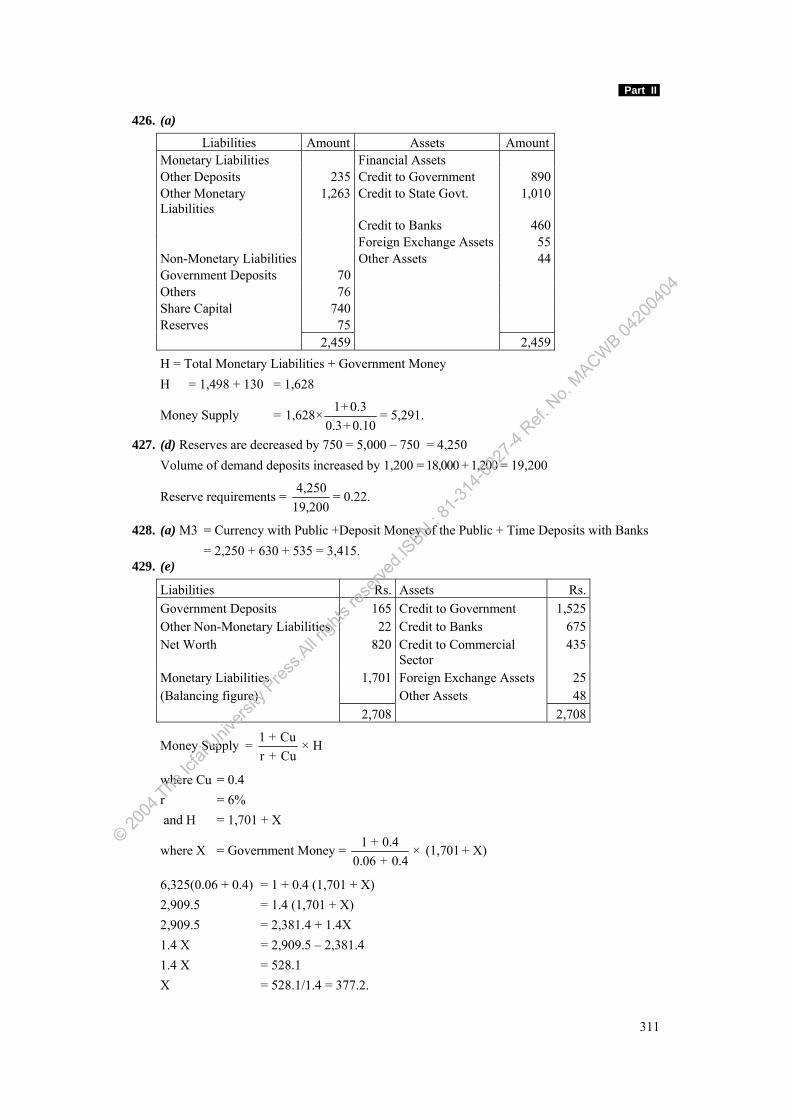
Part II
311
426. (a)
Liabilities Amount Assets AmountMonetary Liabilities Financial Assets Other Deposits 235 Credit to Government 890Other Monetary Liabilities
1,263 Credit to State Govt. 1,010
Credit to Banks 460 Foreign Exchange Assets 55Non-Monetary Liabilities Other Assets 44Government Deposits 70 Others 76 Share Capital 740 Reserves 75 2,459 2,459
H = Total Monetary Liabilities + Government Money H = 1,498 + 130 = 1,628
Money Supply = 1+ 0.31,628×0.3+0.10
= 5,291.
427. (d) Reserves are decreased by 750 = 5,000 – 750 = 4,250 Volume of demand deposits increased by 1,200 = 18,000 + 1,200 = 19,200
Reserve requirements = 4,25019,200
= 0.22.
428. (a) M3 = Currency with Public +Deposit Money of the Public + Time Deposits with Banks = 2,250 + 630 + 535 = 3,415. 429. (e)
Liabilities Rs. Assets Rs. Government Deposits 165 Credit to Government 1,525 Other Non-Monetary Liabilities 22 Credit to Banks 675 Net Worth 820 Credit to Commercial
Sector 435
Monetary Liabilities 1,701 Foreign Exchange Assets 25 (Balancing figure) Other Assets 48 2,708 2,708
Money Supply = 1 + Cu × Hr + Cu
where Cu = 0.4 r = 6% and H = 1,701 + X
where X = Government Money = 1 + 0.4 × (1,7010.06 + 0.4
+ X)
6,325(0.06 + 0.4) = 1 + 0.4 (1,701 + X) 2,909.5 = 1.4 (1,701 + X) 2,909.5 = 2,381.4 + 1.4X 1.4 X = 2,909.5 – 2,381.4 1.4 X = 528.1 X = 528.1/1.4 = 377.2.
© 2004
The Ic
fai U
nivers
ity P
ress.A
ll righ
ts res
erved
.ISBN : 8
1-314
-0227
-4 Ref.
No.
MACWB 04
2004
04
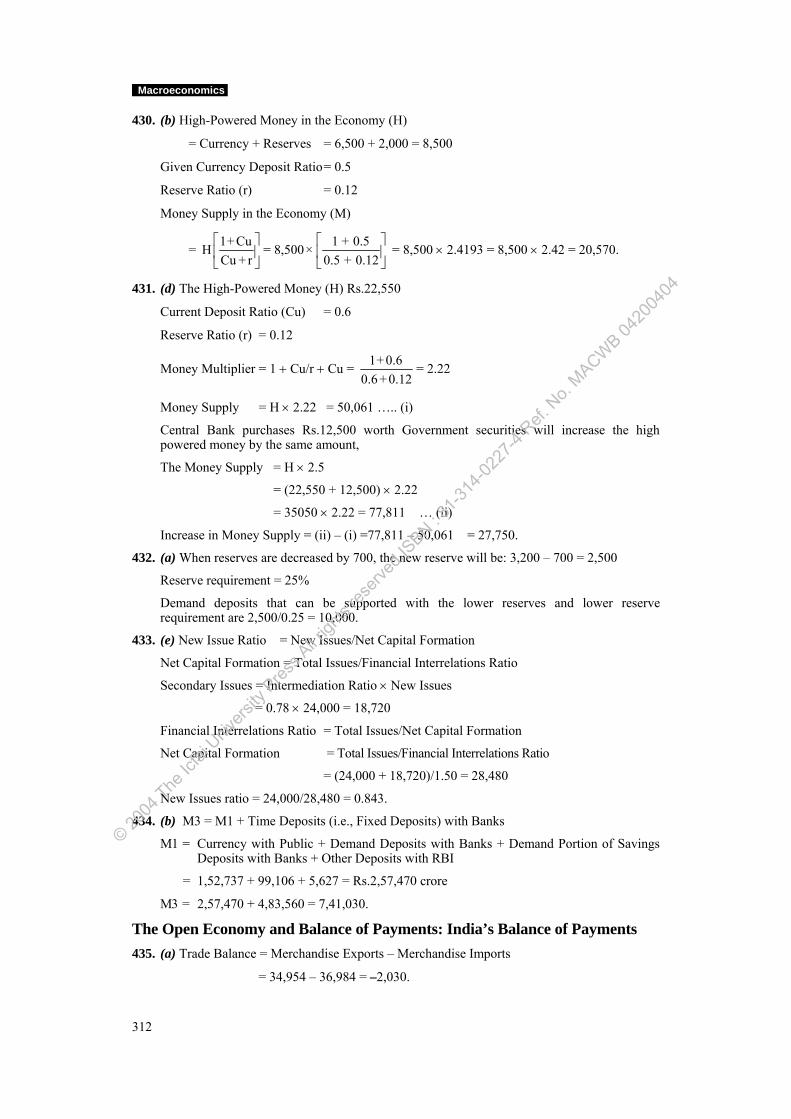
Macroeconomics
312
430. (b) High-Powered Money in the Economy (H)
= Currency + Reserves = 6,500 + 2,000 = 8,500
Given Currency Deposit Ratio = 0.5
Reserve Ratio (r) = 0.12
Money Supply in the Economy (M)
= 1+ CuHCu + r
⎡ ⎤⎢ ⎥⎣ ⎦
= 8,500 1 + 0.5×0.5 + 0.12
⎡ ⎤⎢ ⎥⎣ ⎦
= 8,500 × 2.4193 = 8,500 × 2.42 = 20,570.
431. (d) The High-Powered Money (H) Rs.22,550
Current Deposit Ratio (Cu) = 0.6
Reserve Ratio (r) = 0.12
Money Multiplier = 1 + Cu/r + Cu = 1+ 0.60.6 +0.12
= 2.22
Money Supply = H × 2.22 = 50,061 ….. (i)
Central Bank purchases Rs.12,500 worth Government securities will increase the high powered money by the same amount,
The Money Supply = H × 2.5
= (22,550 + 12,500) × 2.22
= 35050 × 2.22 = 77,811 … (ii)
Increase in Money Supply = (ii) – (i) =77,811 – 50,061 = 27,750.
432. (a) When reserves are decreased by 700, the new reserve will be: 3,200 – 700 = 2,500
Reserve requirement = 25%
Demand deposits that can be supported with the lower reserves and lower reserve requirement are 2,500/0.25 = 10,000.
433. (e) New Issue Ratio = New Issues/Net Capital Formation
Net Capital Formation = Total Issues/Financial Interrelations Ratio
Secondary Issues = Intermediation Ratio × New Issues
= 0.78 × 24,000 = 18,720
Financial Interrelations Ratio = Total Issues/Net Capital Formation
Net Capital Formation = Total Issues/Financial Interrelations Ratio
= (24,000 + 18,720)/1.50 = 28,480
New Issues ratio = 24,000/28,480 = 0.843.
434. (b) M3 = M1 + Time Deposits (i.e., Fixed Deposits) with Banks
M1 = Currency with Public + Demand Deposits with Banks + Demand Portion of Savings Deposits with Banks + Other Deposits with RBI
= 1,52,737 + 99,106 + 5,627 = Rs.2,57,470 crore
M3 = 2,57,470 + 4,83,560 = 7,41,030.
The Open Economy and Balance of Payments: India’s Balance of Payments 435. (a) Trade Balance = Merchandise Exports – Merchandise Imports
= 34,954 – 36,984 = –2,030.
© 2004
The Ic
fai U
nivers
ity P
ress.A
ll righ
ts res
erved
.ISBN : 8
1-314
-0227
-4 Ref.
No.
MACWB 04
2004
04
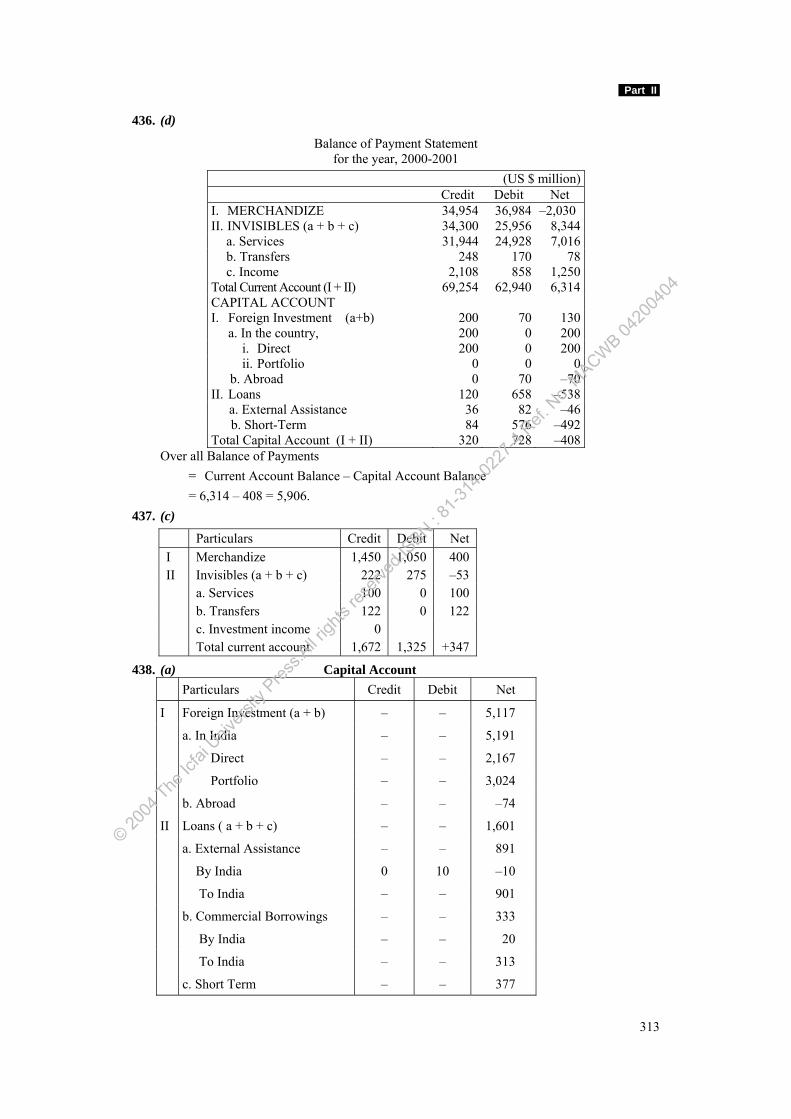
Part II
313
436. (d)
Balance of Payment Statement for the year, 2000-2001
(US $ million) Credit Debit Net I. MERCHANDIZE 34,954 36,984 –2,030 II. INVISIBLES (a + b + c) 34,300 25,956 8,344 a. Services 31,944 24,928 7,016 b. Transfers 248 170 78 c. Income 2,108 858 1,250 Total Current Account (I + II) 69,254 62,940 6,314 CAPITAL ACCOUNT I. Foreign Investment (a+b) 200 70 130 a. In the country, 200 0 200 i. Direct 200 0 200 ii. Portfolio 0 0 0 b. Abroad 0 70 –70 II. Loans 120 658 –538 a. External Assistance 36 82 –46 b. Short-Term 84 576 –492 Total Capital Account (I + II) 320 728 –408
Over all Balance of Payments = Current Account Balance – Capital Account Balance = 6,314 – 408 = 5,906. 437. (c)
Particulars Credit Debit Net I Merchandize 1,450 1,050 400 II Invisibles (a + b + c) 222 275 –53 a. Services 100 0 100 b. Transfers 122 0 122 c. Investment income 0 Total current account 1,672 1,325 +347
438. (a) Capital Account Particulars Credit Debit Net
I Foreign Investment (a + b) – – 5,117
a. In India – – 5,191
Direct – – 2,167
Portfolio – – 3,024
b. Abroad – – –74
II Loans ( a + b + c) – – 1,601
a. External Assistance – – 891
By India 0 10 –10
To India – – 901
b. Commercial Borrowings – – 333
By India – – 20
To India – – 313
c. Short Term – – 377
© 2004
The Ic
fai U
nivers
ity P
ress.A
ll righ
ts res
erved
.ISBN : 8
1-314
-0227
-4 Ref.
No.
MACWB 04
2004
04
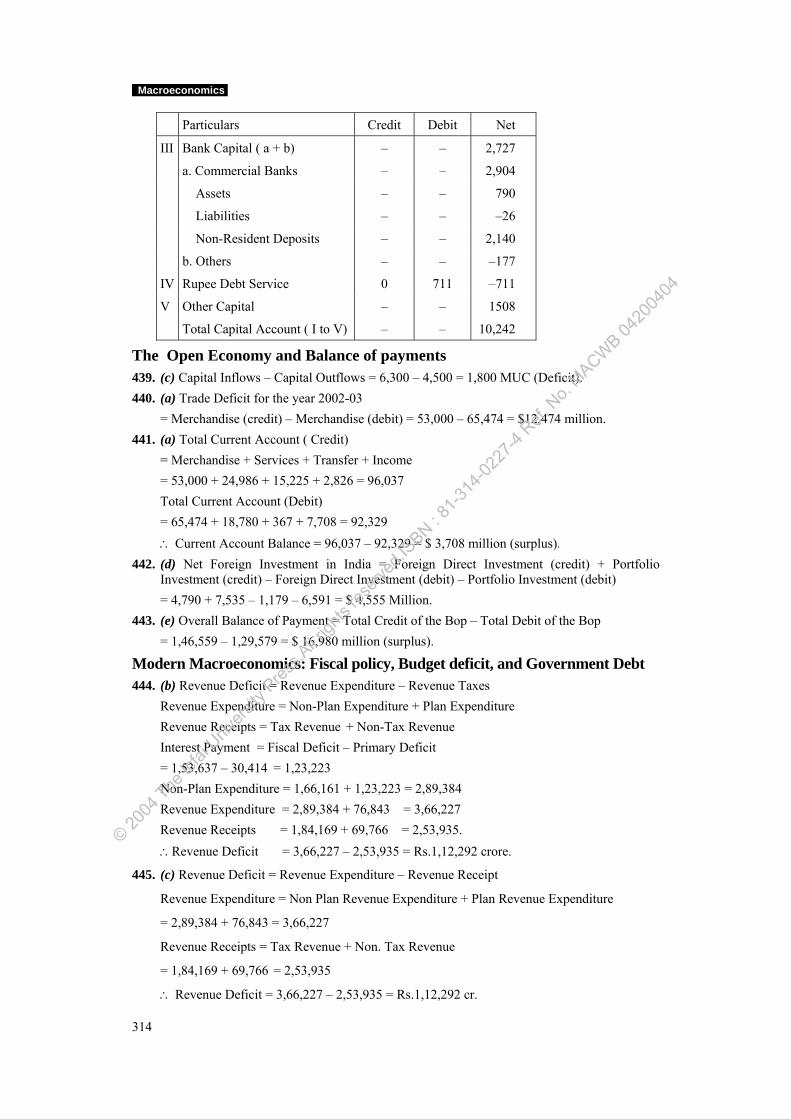
Macroeconomics
314
Particulars Credit Debit Net
III Bank Capital ( a + b) – – 2,727
a. Commercial Banks – – 2,904
Assets – – 790
Liabilities – – –26
Non-Resident Deposits – – 2,140
b. Others – – –177
IV Rupee Debt Service 0 711 –711
V Other Capital – – 1508
Total Capital Account ( I to V) – – 10,242
The Open Economy and Balance of payments 439. (c) Capital Inflows – Capital Outflows = 6,300 – 4,500 = 1,800 MUC (Deficit). 440. (a) Trade Deficit for the year 2002-03 = Merchandise (credit) – Merchandise (debit) = 53,000 – 65,474 = $12,474 million.
441. (a) Total Current Account ( Credit) = Merchandise + Services + Transfer + Income = 53,000 + 24,986 + 15,225 + 2,826 = 96,037 Total Current Account (Debit) = 65,474 + 18,780 + 367 + 7,708 = 92,329 ∴ Current Account Balance = 96,037 – 92,329 = $ 3,708 million (surplus).
442. (d) Net Foreign Investment in India = Foreign Direct Investment (credit) + Portfolio Investment (credit) – Foreign Direct Investment (debit) – Portfolio Investment (debit)
= 4,790 + 7,535 – 1,179 – 6,591 = $ 4,555 Million. 443. (e) Overall Balance of Payment = Total Credit of the Bop – Total Debit of the Bop = 1,46,559 – 1,29,579 = $ 16,980 million (surplus).
Modern Macroeconomics: Fiscal policy, Budget deficit, and Government Debt 444. (b) Revenue Deficit = Revenue Expenditure – Revenue Taxes Revenue Expenditure = Non-Plan Expenditure + Plan Expenditure Revenue Receipts = Tax Revenue + Non-Tax Revenue Interest Payment = Fiscal Deficit – Primary Deficit = 1,53,637 – 30,414 = 1,23,223 Non-Plan Expenditure = 1,66,161 + 1,23,223 = 2,89,384 Revenue Expenditure = 2,89,384 + 76,843 = 3,66,227 Revenue Receipts = 1,84,169 + 69,766 = 2,53,935. ∴Revenue Deficit = 3,66,227 – 2,53,935 = Rs.1,12,292 crore.
445. (c) Revenue Deficit = Revenue Expenditure – Revenue Receipt
Revenue Expenditure = Non Plan Revenue Expenditure + Plan Revenue Expenditure
= 2,89,384 + 76,843 = 3,66,227
Revenue Receipts = Tax Revenue + Non. Tax Revenue
= 1,84,169 + 69,766 = 2,53,935
∴ Revenue Deficit = 3,66,227 – 2,53,935 = Rs.1,12,292 cr.
© 2004
The Ic
fai U
nivers
ity P
ress.A
ll righ
ts res
erved
.ISBN : 8
1-314
-0227
-4 Ref.
No.
MACWB 04
2004
04
Part II
315
446. (d) Primary Deficit = Fiscal Deficit – Interest Payment
Fiscal Deficit = Borrowings and Other Liabilities
∴ Primary Deficit = 1,53,637 – 1,23,223 = Rs.30,414 cr.
447. (e) Revenue Receipts = Tax Revenue + Non-Tax Revenue
= 1,16,857 + 45,137 = 1,61,994.
448. (b) Capital Receipts = Recoveries of Loan + Other Capital Receipts + Borrowings and Other liabilities
= 9,908 + 5,000 + 91,025 = 1,05,933.
449. (c) Fiscal Deficit
= Total Expenditure – (Revenue Receipts + Recoveries of Loan + Other Capital Receipts)
Revenue Receipts = Tax Revenue + Non-Tax Revenue
= 1,16,857 + 45,137 = 1,61,994
Fiscal Deficit = 2,67,927 – (1,61,994 + 9,908 + 5,000) = 91,025.
450. (c) Primary Fiscal Deficit = Fiscal Deficit – Interest Payments
Fiscal Deficit = Borrowings and Other Liabilities = 1,11,275
Primary Fiscal Deficit = 1,11,275 – 1,01,266 = 10,009.
451. (a) Revenue Deficit = Revenue Expenditure – Revenue Receipts
Revenue Expenditure = Non-Plan Revenue Expenditure + Plan Revenue Expenditure
= 2,28,768 + 52,330 = 2,81,098
Revenue Receipts = Tax Revenue – Non-Tax Revenue
= 1,46,209 – 57,464 = 2,03,673
∴Revenue Deficit = 2,81,098 – 2,03,673 = 77,425 crore.
452. (e) Revenue Receipts = Direct Taxes + Indirect Taxes + Interest Receipts + Total Profits
= 40,000 + 120,000 + 12,000 + (17,000 + 13,000) = 2,02,000 cr.
453. (b) Non-Plan Expenditure = Interest Payments + Subsidies + Defense Expenditure
= 47,000 + 1,32,000 + 30,000 = 2,09,000.
454. (d) Fiscal Deficit = Borrowing and Other Liabilities (or)
= Total Expenditure – [Total Receipts – Borrowings]
= [2,83,882 – (2,03,927 + X – X)] = Rs.79,955.
Working notes:
Total Expenditure = Total Revenue Expenditure + Total Capital Expenditure
= 2,36,987 + 46,895 = Rs.2,83,882 crore.
Total Receipts = Total Revenue Receipts + Total Capital Receipts
= [Tax and Non-Tax Revenue Receipts]+ [Loans Recovered + Other Capital Receipts + Borrowings (not given)]
= [1,32,365 + 50,475] + [11,087 + 10,000 + X] = Rs.2,03,927cr + X.
455. (d) Fiscal Deficits = Total Borrowings – Any other receipts of which divestment proceeds committed for redemption of Public Debt
Total Borrowings = 1,12,275 – 1,000 = 1,11,275.
© 2004
The Ic
fai U
nivers
ity P
ress.A
ll righ
ts res
erved
.ISBN : 8
1-314
-0227
-4 Ref.
No.
MACWB 04
2004
04
Macroeconomics
316
456. (b) Revenue Deficit = Total Revenue Expenditure – Total Revenue Receipts Total Revenue Expenditure = Non-Plan Revenue Expenditure + Plan Expenditure = 2,28,768 + 52,330 = 2,81,098 Total Revenue Receipt = Tax Revenue + Non Tax Revenue = 1,46,209 + 57,464 = 2,03,673 Revenue Deficit = 2,81,098 – 2,03,673 = 77,425.
Economic Growth, Development & Planning 457. (b) Possible GDP growth = Possible level of investment/Capital – Output Ratio = 25/5 = 5 % Possible per capita GDP growth = 5 – 2 =3%. 458. (d) Target growth rate = 6% p.a. Required domestic savings to income = 32% Expected population growth = 2% ∴ Growth rate = 6 + 2 = 8%
∴ Capital – Output ratio = 32 4.8
=
459. (a) Required savings to achieve the targeted growth rate in GDP is = The incremental capital out put ratio × Targeted growth rate = 4 × 7 = 28% Required savings are 28% of GDP Domestic savings are 24% of GDP Required external savings are = 28 – 24 = 4% of GDP. 460. (c) Increase in per capita GDP = (1+growth rate in GDP)/(1+growth rate in Population) = (1.07/102) – 1 = 0.049 = 4.9%.
© 2004
The Ic
fai U
nivers
ity P
ress.A
ll righ
ts res
erved
.ISBN : 8
1-314
-0227
-4 Ref.
No.
MACWB 04
2004
04

Part III: Model Question Papers (with Suggested Answers) The model question paper consists of two parts – A and B. Part A is intended to test the conceptual understanding of the students. It contains around 40 multiple-choice questions carrying one point each. Part B contains problems with an aggregate weightage of 60 points. Students are requested to note that this is an indicative format of the question paper in general and that the ICFAI University reserves the right to change, at any time, the format and the pattern without any notice. Hence, the students are advised to use the model question papers for practice purposes only and not to develop any exam-related patterns out of these model question papers. The suggested answers given herein do not constitute the basis of evaluation of the students’ answers in the examination. These answers have been prepared by the faculty members of the ICFAI University with a view to assist the students in their studies. And, they may not be taken as the only answers for the questions given.
Model Question Paper I Time: 3 Hours Total Points: 100
Part A: Basic Concepts (40 Points)
Answer all the questions. Each question carries one point. 1. What is the fundamental difference between macroeconomics and microeconomics? a. Macroeconomics involves studying the economy as a whole, while microeconomics
involves studying the behavior of individual industries, firms and households. b. Macroeconomics concentrates on those parts of the economy involving very large
amounts of money, while microeconomics concentrates on those parts of the economy involving small sums of money.
c. Macroeconomics studies the behavior of large firms, while microeconomics studies the behavior of small firms.
d. There is no difference, basically macroeconomics and microeconomics are one and the same.
e. Microeconomics involves studying the economy as a whole, while macroeconomics involves studying the behavior of individual industries, firms and households.
2. Which of the following cannot be identified as a basic trend of economic development? a. Population has grown less rapidly than the growth of the capital stock. b. There has been a strong upward trend in real wage rates. c. The percentage of GDP used to finance investment in physical capital has been roughly
constant. d. The rate of profit has been gradually but steadily declining. e. Per capita income has increased by 4% during the last 5 years.
3. Personal income taxes are examples of a. Fiscal policy instruments b. Monetary policy instruments c. Trade policy instruments d. Income policy instruments e. Wage policy instruments.
© 2004
The Ic
fai U
nivers
ity P
ress.A
ll righ
ts res
erved
.ISBN : 8
1-314
-0227
-4 Ref.
No.
MACWB 04
2004
04
Macroeconomics
4. Positive price inflation necessarily means that a. All prices are increasing at the same time b. Prices are climbing but wages are not c. Though some prices may be falling, prices are, on the average, climbing d. The associated rate of unemployment is rising e. Interest rate is rising.
5. In a model in which there is no government, net investment, capital replacement or international trade, the market value of final output equals
a. Aggregate consumption b. The sum of the receipts of economic resources c. The sum of wages, rent, interest and profit d. All of the above e. None of the above.
6. If potential GDP is greater than actual GDP, then a. Exports must be greater than imports b. Inflation has increased from the year before c. There is probably some unemployment in the country d. Comparisons should be made in nominal terms e. Production is less than it could be if all resources were fully employed.
7. A reduction in the money supply a. Lowers interest rates now and in the future b. May eventually lower interest rates if it makes price inflation subside c. Increases the interest rate in the short run d. Tends to be offset by an equivalent drop in aggregate demand e. Both (b) and (c) above.
8. NDP does not include a. Payments of corporate taxes b. Net factor income from abroad c. Undistributed profits d. Net exports e. The value added from intermediate goods.
9. The value of existing houses bought in a particular period is a. Included in GNP but not GDP b. Included in GDP but not GNP c. Included in both GDP and GNP d. Sometimes included in GNP but never in GDP e. Neither included in GDP nor GNP. 10. Saving is performed a. By individuals, separately and collectively, for a variety of reasons b. To facilitate the formation of new capital c. By government, in the form of a budget deficit d. When an individual’s MPS is greater than one e. When consumption is less than income.
318
© 2004
The Ic
fai U
nivers
ity P
ress.A
ll righ
ts res
erved
.ISBN : 8
1-314
-0227
-4 Ref.
No.
MACWB 04
2004
04
Part III
11. The investment demand curve depicts the relationship between
a. Consumption and savings b. Investment and consumption c. Investment and interest rates d. Consumption and interest rates e. Savings and investment rates.
12. On the basis of the Keynesian model of output determination, which of the following will most likely result if maintainable savings exceed intended investment?
a. Output will fall. b. Output will remain the same. c. Output will rise. d. Prices will rise and inventories will accumulate. e. Savings will increase.
13. A reduction in the legal required reserve ratio will tend to
a. Reduce the money supply and reduce commercial bank loans
b. Reduce the money supply and increase commercial bank loans
c. Increase the money supply and increase commercial bank loans
d. Increase the money supply and decrease commercial bank loans
e. Leave the money supply unaffected.
14. The real rate of interest
a. Equals the nominal rate plus the rate of inflation
b. Equals the rate of inflation minus the nominal rate
c. Equals the nominal rate minus the rate of inflation
d. Tends to increase when inflation rises
e. Is more relevant to investors than consumers.
15. Personal income equals disposable income plus
a. Personal income taxes
b. Residual wages
c. Transfer payments
d. Dividend payments
e. Personal savings.
16. In the inventory theory the transaction demand for money
a. Varies positively with income but less than proportionately
b. Varies inversely with the rate of interest and is proportional to the square root of income
c. Varies positively with income but more than proportionately
d. Varies inversely with income and interest rates
e. None of the above.
319
© 2004
The Ic
fai U
nivers
ity P
ress.A
ll righ
ts res
erved
.ISBN : 8
1-314
-0227
-4 Ref.
No.
MACWB 04
2004
04
Macroeconomics
17. Which of the following are the sources of change in high-powered money in Indian economy?
i. Change in RBI credit to government.
ii. Change in RBI credit to banks.
iii. Change in RBI credit to commercial sector.
iv. Change in net foreign exchange assets of RBI.
v. Change in net non-monetary liabilities.
a. Both (i) and (ii) above.
b. Both (i) and (iii) above.
c. Only (i), (ii) and (iii) above.
d. Only (i), (ii) and (iv) above.
e. All of (i), (ii), (iii), (iv) and (v) above.
18. Average Propensity to Consume (APC) is the ratio of
a. Consumption to income
b. Consumption to disposable income
c. Consumption to savings
d. Consumption to household investment
e. Rate of change in consumption to rate of change in income.
19. Which of the following statements is true?
a. MPC is the ratio of total consumption to total income and APC is the ratio of incremental consumption to incremental income.
b. APC is the ratio of total consumption to total income and MPC is the ratio of incremental consumption to incremental income.
c. APC is the ratio of total consumption to total income and MPC is the ratio of incremental consumption to incremental disposable income.
d. MPC is the ratio of total consumption to total income and APC is the ratio of incremental consumption to incremental disposable income.
e. APC is the ratio of total consumption to total savings and MPC is the ratio of incremental consumption to incremental income.
20. Which of the following factors will affect the aggregate demand curve?
i. Change in income.
ii. Change in business expectation.
iii. Change in expected rate of inflation.
iv. Change in cost of production.
a. Both (i) and (ii) above.
b. Only (i), (ii) and (iii) above.
c. Only (ii), (iii) and (iv) above.
d. Only (i), (iii) and (iv) above. e. Only (i), (ii) and (iv) above.
320
© 2004
The Ic
fai U
nivers
ity P
ress.A
ll righ
ts res
erved
.ISBN : 8
1-314
-0227
-4 Ref.
No.
MACWB 04
2004
04
Part III
21. Increase in real stock of money will shift the
a. LM curve towards right
b. LM curve towards left
c. IS curve towards right
d. IS curve towards left
e. None of the above.
22. Fiscal expansion policy in the economy will shift
a. LM curve towards right and AD curve towards left
b. LM curve towards left and AD curve towards right
c. IS curve towards left and AD curve towards right
d. IS curve towards right and AD curve towards right
e. LM curve towards left and IS curve towards right.
23. Which of the following statements are true?
i. GDP at factor cost = Wages and salaries + Dividends + Retained profit + Profit tax.
ii. GNP at factor cost = GDP at factor cost + Net factor income from abroad.
iii. GNP at market prices = GNP at factor cost + Indirect taxes – Subsidies.
iv. GDP at market prices = GDP at factor cost + Indirect taxes – Subsidies.
a. Both (i) and (ii) above.
b. Both (i), (ii) and (iii) above.
c. Only (i), (ii) and (iv) above.
d. Only (ii), (iii) and (iv) above.
e. All of (i), (ii), (iii) and (iv) above.
24. Which of the following statements is true regarding the personal disposable income?
a. It is equal to Wages and salaries + Dividends paid at home + Factor income received from abroad + Transfers from government – Personal income tax.
b. It is equal to Wages and salaries + Dividends paid abroad + Factor income received from abroad + Transfers from government – Personal income tax.
c. It is equal to Wages and salaries + Dividends paid at home + Factor income received from abroad + Transfers from government.
d. It is equal to Wages and salaries + Dividends paid at home + Factor income received from abroad + Corporate tax.
e. It is equal to Wages and salaries + Dividends paid abroad + Transfers from government – Personal income tax.
25. NNP at market prices is equal to
a. GNP at factor cost – Depreciation
b. GNP at market prices – Depreciation
c. NNP at market prices – Net factor income from abroad
d. GNP at factor cost + Indirect taxes – Net income from abroad
e. NDP at factor cost + Depreciation.
321
© 2004
The Ic
fai U
nivers
ity P
ress.A
ll righ
ts res
erved
.ISBN : 8
1-314
-0227
-4 Ref.
No.
MACWB 04
2004
04
Macroeconomics
26. Laffer curve shows the relationship between
a. Price level and unemployment
b. Tax rates and tax revenue
c. Interest rate and income level
d. Income and money supply
e. Demand for money and supply of money.
27. When there is an equal decrease in taxes and the government spending,
a. The income level will fall by the change in the government expenditure but the level of consumption and investment remains the same
b. The income level will fall but the level of consumption will increase
c. The income level will fall but level of investment will increase
d. The income level will fall but the level of investment will decrease
e. The income level will fall but the level of consumption and investment will increase.
28. Bottlenecks in the context of macroeconomics refer to
a. Inadequate spending in a sector of the economy
b. Shortage of materials at full employment
c. Inadequate supply of labor at full employment economy
d. Inadequate supply of specific resources in an economy below full employment
e. Both (b) and (c) above.
29. Quantitative Economics means
a. The economic model which uses the quantitative methods
b. It is an alternative term from macroeconomics
c. The economic model which takes exogenous variables
d. The economic model which uses price elasticity
e. Both (a) and (c) above.
30. Marginal propensity of import is the
a. Change in imports as a result of a unit of change of income
b. Change in imports as a result of a change in exports
c. Percentage change in imports as a results of percentage change in production
d. Change in imports as a result of change in GDP
e. Percentage change in imports due to percentage change in consumption.
31. The value-added approach to GDP measurement
a. Adds up the difference between the value of output and costs of intermediate goods
b. Adds up all income received by the household sector in the economy
c. Removes the effect of inflation from the nominal GDP
d. Adds up all the expenditures incurred on the goods and services produced by the domestic sector
e. Adds the total money value of goods and services purchased by their ultimate buyers.
322
© 2004
The Ic
fai U
nivers
ity P
ress.A
ll righ
ts res
erved
.ISBN : 8
1-314
-0227
-4 Ref.
No.
MACWB 04
2004
04

Part III
32. Which of the following statements is not true?
a. When the price level increases, nominal GDP increases even if no additional goods and services are produced.
b. Personal disposable income is either consumed or paid as taxes.
c. Net investment equals gross investment less depreciation.
d. The higher the interest rate, the higher will be the opportunity cost of holding money.
e. When the value of goods imported exceeds the value of goods exported, the country faces a trade deficit.
33. The Coefficient of Acceleration is
a. Slope of the Consumption Function
b. Capital Output Ratio
c. Marginal Propensity to Consume
d. Reciprocal of Marginal Propensity to Import
e. None of the above.
34. The slope of the consumption function represents
a. Average Propensity to Save
b. Marginal Propensity to Consume
c. Marginal Propensity to Save
d. Average Propensity to Consume
e. None of the above.
35. Which of the following is not a transfer payment?
a. Invalidity benefit.
b. Flood relief.
c. Government pensions.
d. Salaries paid to Members of Parliament.
e. Scholarships.
36. According to the classical economists, the Aggregate Supply Curve is
a. Vertical
b. Horizontal
c. First horizontal and then vertical
d. First vertical and then horizontal
e. Positively sloped.
37. Which of the following is not a component of aggregate expenditure in an economy?
a. Consumption.
b. Investment.
c. Government purchases.
d. Net exports.
e. Taxes.
323
© 2004
The Ic
fai U
nivers
ity P
ress.A
ll righ
ts res
erved
.ISBN : 8
1-314
-0227
-4 Ref.
No.
MACWB 04
2004
04
Macroeconomics
38. In which sector of Indian economy do we find a high rate of disguised unemployment? a. Service sector.
b. Transport sector.
c. Agriculture sector.
d. Manufacture sector.
e. Mining sector.
39. Which of the following is included in GDP of a country?
a. The sale of a used car.
b. The sale of an old house.
c. The sale of stocks and bonds.
d. The fee paid to a broker for selling a stock.
e. None of the above.
40. Imperfect information about the labor market leads to
a. Structural unemployment
b. Cyclical unemployment
c. Frictional unemployment
d. Disguised unemployment
e. Perfect unemployment.
Part B: Problems (60 Points)
Solve all the problems. Points are indicated against each problem. 41. The following information is available from National Income Accounts of a country:
Particulars MUC
Gross National Product at Market Prices 10,000
Indirect Taxes 900
Factor Income Paid Abroad 500
Factor Income Received From Abroad 400
Subsidies 300
Gross Corporate Profits 1,700
Corporate Profit Tax 350
Net Corporate Profits 1,100
The Net National Product of the country at factor cost is
a. 8,700 MUC
b. 8,800 MUC
c. 8,900 MUC
d. 9,000 MUC
e. 9,100 MUC. (2 points)
324
© 2004
The Ic
fai U
nivers
ity P
ress.A
ll righ
ts res
erved
.ISBN : 8
1-314
-0227
-4 Ref.
No.
MACWB 04
2004
04
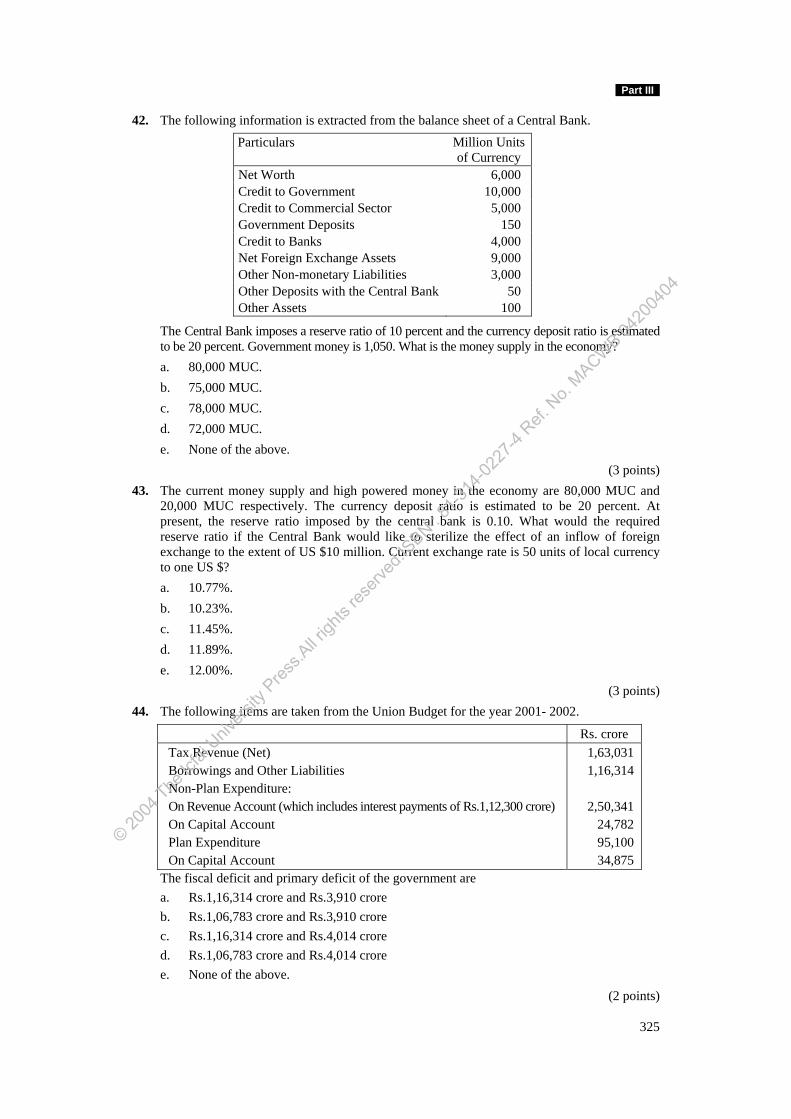
Part III
42. The following information is extracted from the balance sheet of a Central Bank.
Particulars Million Units of Currency
Net Worth 6,000 Credit to Government 10,000 Credit to Commercial Sector 5,000 Government Deposits 150 Credit to Banks 4,000 Net Foreign Exchange Assets 9,000 Other Non-monetary Liabilities 3,000 Other Deposits with the Central Bank 50 Other Assets 100
The Central Bank imposes a reserve ratio of 10 percent and the currency deposit ratio is estimated to be 20 percent. Government money is 1,050. What is the money supply in the economy?
a. 80,000 MUC. b. 75,000 MUC. c. 78,000 MUC. d. 72,000 MUC. e. None of the above.
(3 points) 43. The current money supply and high powered money in the economy are 80,000 MUC and
20,000 MUC respectively. The currency deposit ratio is estimated to be 20 percent. At present, the reserve ratio imposed by the central bank is 0.10. What would the required reserve ratio if the Central Bank would like to sterilize the effect of an inflow of foreign exchange to the extent of US $10 million. Current exchange rate is 50 units of local currency to one US $?
a. 10.77%. b. 10.23%. c. 11.45%. d. 11.89%. e. 12.00%.
(3 points) 44. The following items are taken from the Union Budget for the year 2001- 2002.
Rs. crore Tax Revenue (Net) 1,63,031 Borrowings and Other Liabilities 1,16,314 Non-Plan Expenditure: On Revenue Account (which includes interest payments of Rs.1,12,300 crore) 2,50,341 On Capital Account 24,782 Plan Expenditure 95,100 On Capital Account 34,875
The fiscal deficit and primary deficit of the government are a. Rs.1,16,314 crore and Rs.3,910 crore b. Rs.1,06,783 crore and Rs.3,910 crore c. Rs.1,16,314 crore and Rs.4,014 crore d. Rs.1,06,783 crore and Rs.4,014 crore e. None of the above.
(2 points)
325
© 2004
The Ic
fai U
nivers
ity P
ress.A
ll righ
ts res
erved
.ISBN : 8
1-314
-0227
-4 Ref.
No.
MACWB 04
2004
04
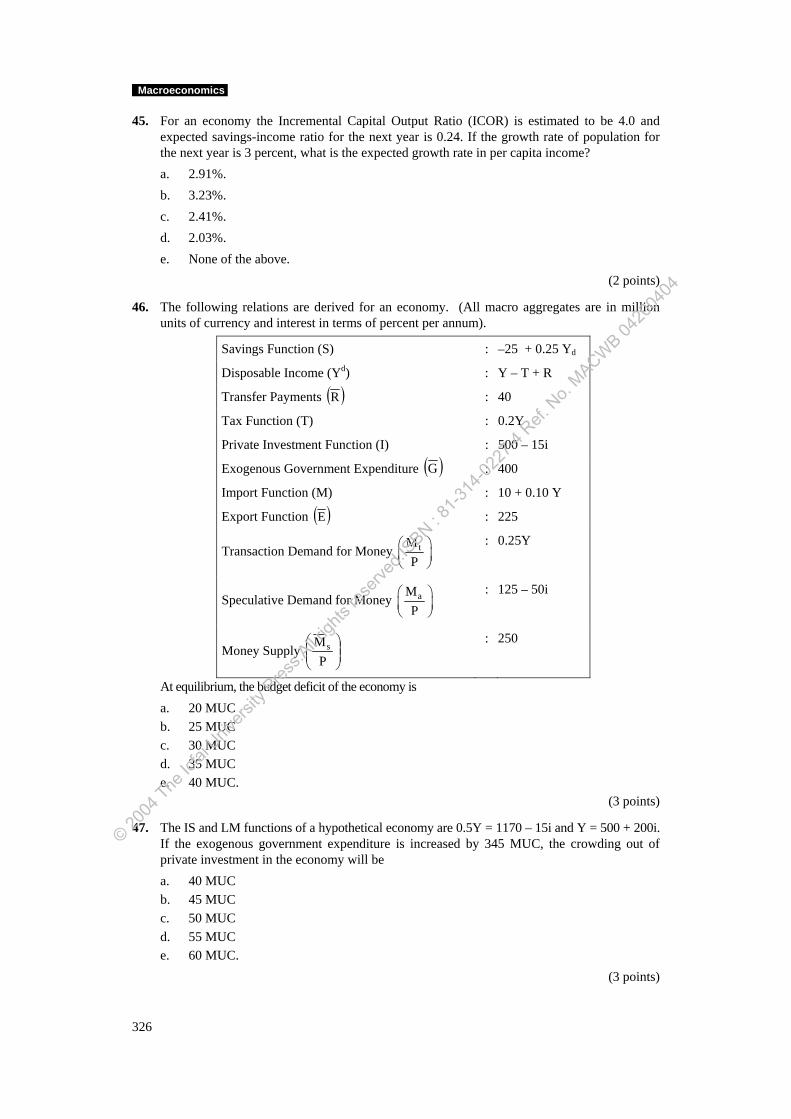
Macroeconomics
45. For an economy the Incremental Capital Output Ratio (ICOR) is estimated to be 4.0 and expected savings-income ratio for the next year is 0.24. If the growth rate of population for the next year is 3 percent, what is the expected growth rate in per capita income?
a. 2.91%. b. 3.23%. c. 2.41%. d. 2.03%. e. None of the above.
(2 points)
46. The following relations are derived for an economy. (All macro aggregates are in million units of currency and interest in terms of percent per annum).
Savings Function (S) : –25 + 0.25 Yd
Disposable Income (Yd) : Y – T + R
Transfer Payments ( )R : 40
Tax Function (T) : 0.2Y
Private Investment Function (I) : 500 – 15i
Exogenous Government Expenditure ( )G : 400
Import Function (M) : 10 + 0.10 Y
Export Function ( )E : 225
Transaction Demand for Money tMP
⎛ ⎞⎜ ⎟⎝ ⎠
: 0.25Y
Speculative Demand for Money aMP
⎛ ⎞⎜ ⎟⎝ ⎠
: 125 – 50i
Money Supply ⎟⎟⎠
⎞⎜⎜⎝
⎛P
Ms : 250
At equilibrium, the budget deficit of the economy is a. 20 MUC b. 25 MUC c. 30 MUC d. 35 MUC e. 40 MUC.
(3 points)
47. The IS and LM functions of a hypothetical economy are 0.5Y = 1170 – 15i and Y = 500 + 200i. If the exogenous government expenditure is increased by 345 MUC, the crowding out of private investment in the economy will be
a. 40 MUC b. 45 MUC c. 50 MUC d. 55 MUC e. 60 MUC.
(3 points)
326
© 2004
The Ic
fai U
nivers
ity P
ress.A
ll righ
ts res
erved
.ISBN : 8
1-314
-0227
-4 Ref.
No.
MACWB 04
2004
04
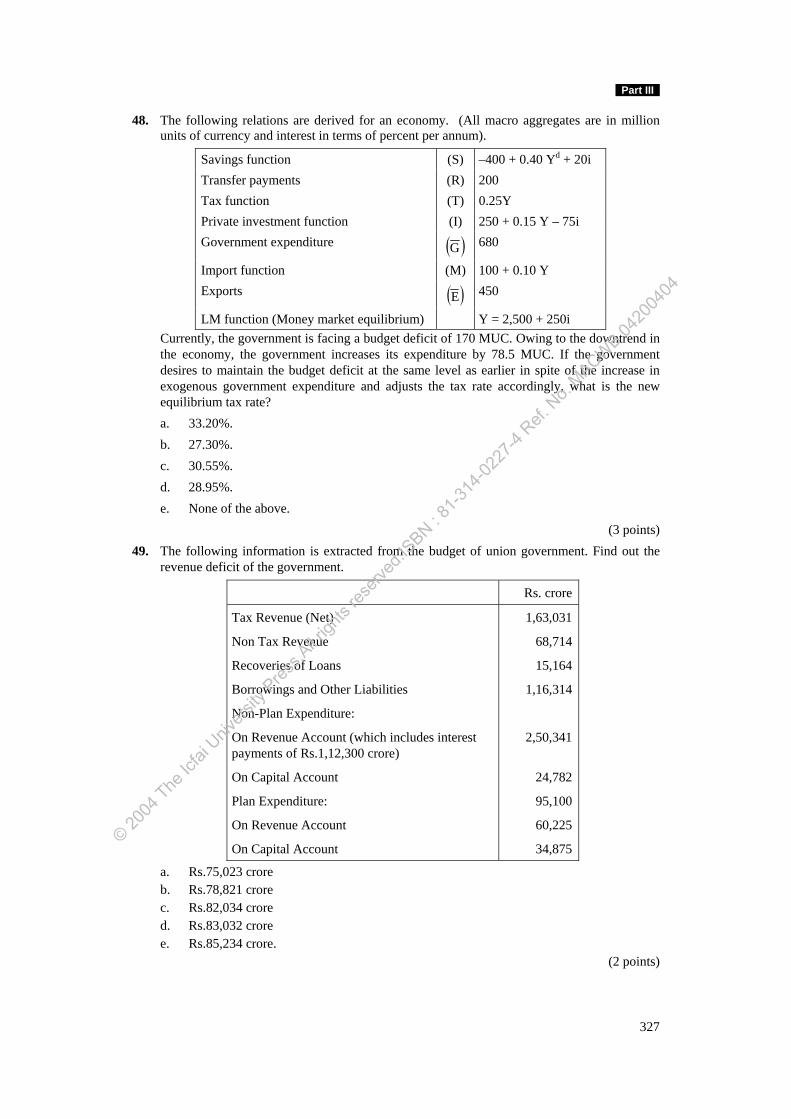
Part III
48. The following relations are derived for an economy. (All macro aggregates are in million units of currency and interest in terms of percent per annum).
Savings function (S) –400 + 0.40 Yd + 20i Transfer payments (R) 200 Tax function (T) 0.25Y Private investment function (I) 250 + 0.15 Y – 75i Government expenditure ( )G 680
Import function (M) 100 + 0.10 Y Exports ( )E 450
LM function (Money market equilibrium) Y = 2,500 + 250i Currently, the government is facing a budget deficit of 170 MUC. Owing to the downtrend in the economy, the government increases its expenditure by 78.5 MUC. If the government desires to maintain the budget deficit at the same level as earlier in spite of the increase in exogenous government expenditure and adjusts the tax rate accordingly, what is the new equilibrium tax rate?
a. 33.20%. b. 27.30%. c. 30.55%. d. 28.95%. e. None of the above.
(3 points) 49. The following information is extracted from the budget of union government. Find out the
revenue deficit of the government.
Rs. crore
Tax Revenue (Net) 1,63,031
Non Tax Revenue 68,714
Recoveries of Loans 15,164
Borrowings and Other Liabilities 1,16,314
Non-Plan Expenditure:
On Revenue Account (which includes interest payments of Rs.1,12,300 crore)
2,50,341
On Capital Account 24,782
Plan Expenditure: 95,100
On Revenue Account 60,225
On Capital Account 34,875
a. Rs.75,023 crore b. Rs.78,821 crore c. Rs.82,034 crore d. Rs.83,032 crore e. Rs.85,234 crore.
(2 points)
327
© 2004
The Ic
fai U
nivers
ity P
ress.A
ll righ
ts res
erved
.ISBN : 8
1-314
-0227
-4 Ref.
No.
MACWB 04
2004
04
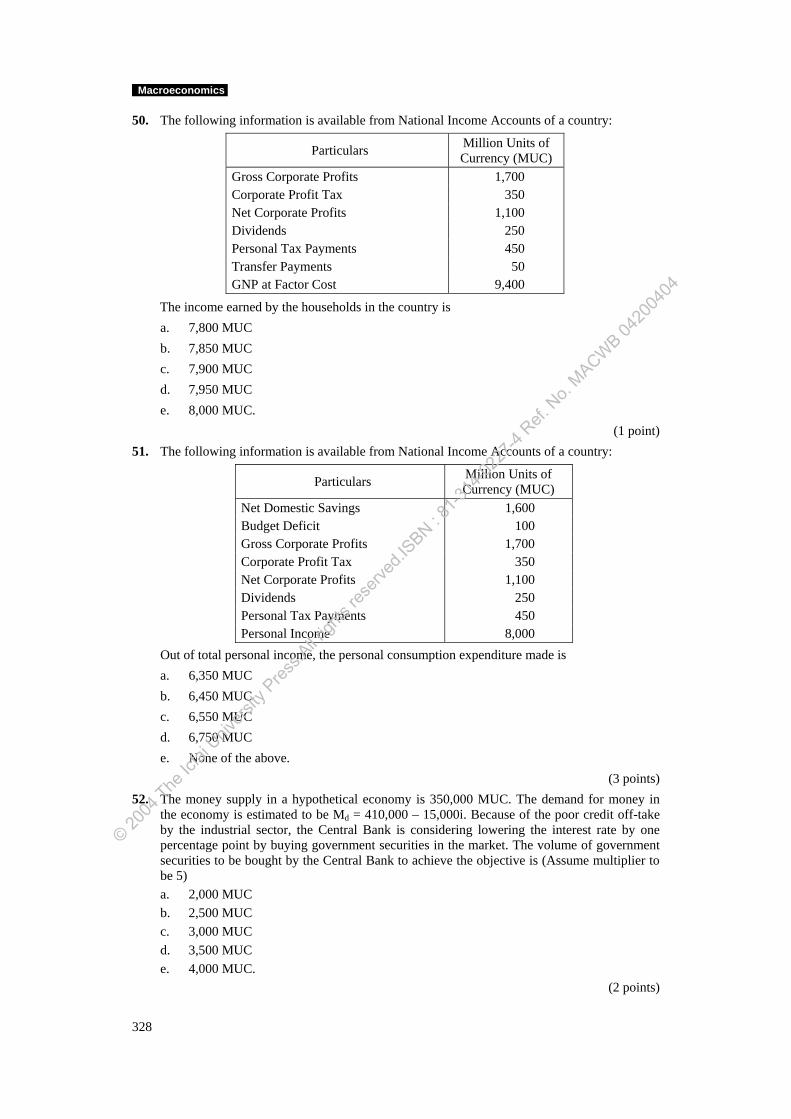
Macroeconomics
50. The following information is available from National Income Accounts of a country:
Particulars Million Units of Currency (MUC)
Gross Corporate Profits 1,700 Corporate Profit Tax 350 Net Corporate Profits 1,100 Dividends 250 Personal Tax Payments 450 Transfer Payments 50 GNP at Factor Cost 9,400
The income earned by the households in the country is a. 7,800 MUC b. 7,850 MUC c. 7,900 MUC d. 7,950 MUC e. 8,000 MUC.
(1 point) 51. The following information is available from National Income Accounts of a country:
Particulars Million Units of Currency (MUC)
Net Domestic Savings 1,600 Budget Deficit 100 Gross Corporate Profits 1,700 Corporate Profit Tax 350 Net Corporate Profits 1,100 Dividends 250 Personal Tax Payments 450 Personal Income 8,000
Out of total personal income, the personal consumption expenditure made is a. 6,350 MUC b. 6,450 MUC c. 6,550 MUC d. 6,750 MUC e. None of the above.
(3 points) 52. The money supply in a hypothetical economy is 350,000 MUC. The demand for money in
the economy is estimated to be Md = 410,000 – 15,000i. Because of the poor credit off-take by the industrial sector, the Central Bank is considering lowering the interest rate by one percentage point by buying government securities in the market. The volume of government securities to be bought by the Central Bank to achieve the objective is (Assume multiplier to be 5)
a. 2,000 MUC b. 2,500 MUC c. 3,000 MUC d. 3,500 MUC e. 4,000 MUC.
(2 points)
328
© 2004
The Ic
fai U
nivers
ity P
ress.A
ll righ
ts res
erved
.ISBN : 8
1-314
-0227
-4 Ref.
No.
MACWB 04
2004
04
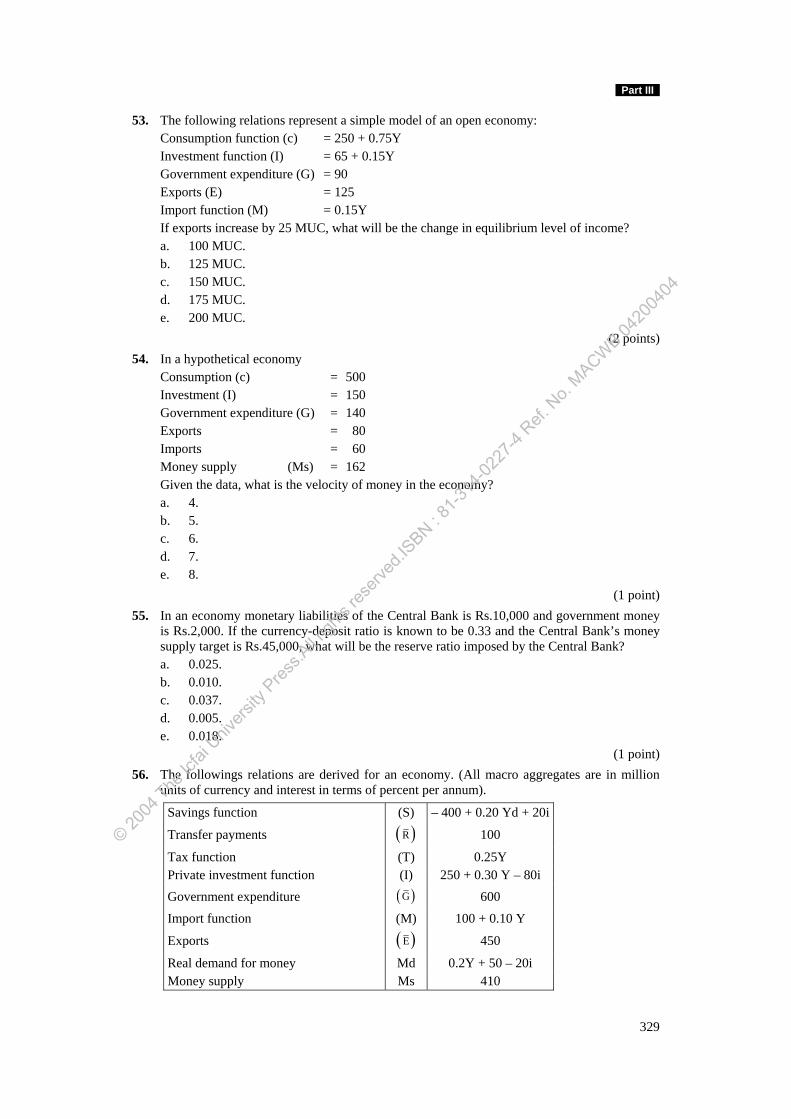
Part III
53. The following relations represent a simple model of an open economy: Consumption function (c) = 250 + 0.75Y Investment function (I) = 65 + 0.15Y Government expenditure (G) = 90 Exports (E) = 125 Import function (M) = 0.15Y If exports increase by 25 MUC, what will be the change in equilibrium level of income?
a. 100 MUC. b. 125 MUC. c. 150 MUC. d. 175 MUC. e. 200 MUC.
(2 points) 54. In a hypothetical economy Consumption (c) = 500 Investment (I) = 150 Government expenditure (G) = 140 Exports = 80 Imports = 60 Money supply (Ms) = 162
Given the data, what is the velocity of money in the economy? a. 4. b. 5. c. 6. d. 7. e. 8.
(1 point) 55. In an economy monetary liabilities of the Central Bank is Rs.10,000 and government money
is Rs.2,000. If the currency-deposit ratio is known to be 0.33 and the Central Bank’s money supply target is Rs.45,000, what will be the reserve ratio imposed by the Central Bank?
a. 0.025. b. 0.010. c. 0.037. d. 0.005. e. 0.018.
(1 point) 56. The followings relations are derived for an economy. (All macro aggregates are in million
units of currency and interest in terms of percent per annum).
Savings function (S) – 400 + 0.20 Yd + 20i
Transfer payments ( )R 100
Tax function (T) 0.25Y Private investment function (I) 250 + 0.30 Y – 80i Government expenditure ( )G 600 Import function (M) 100 + 0.10 Y
Exports ( )E 450
Real demand for money Md 0.2Y + 50 – 20i Money supply Ms 410
329
© 2004
The Ic
fai U
nivers
ity P
ress.A
ll righ
ts res
erved
.ISBN : 8
1-314
-0227
-4 Ref.
No.
MACWB 04
2004
04
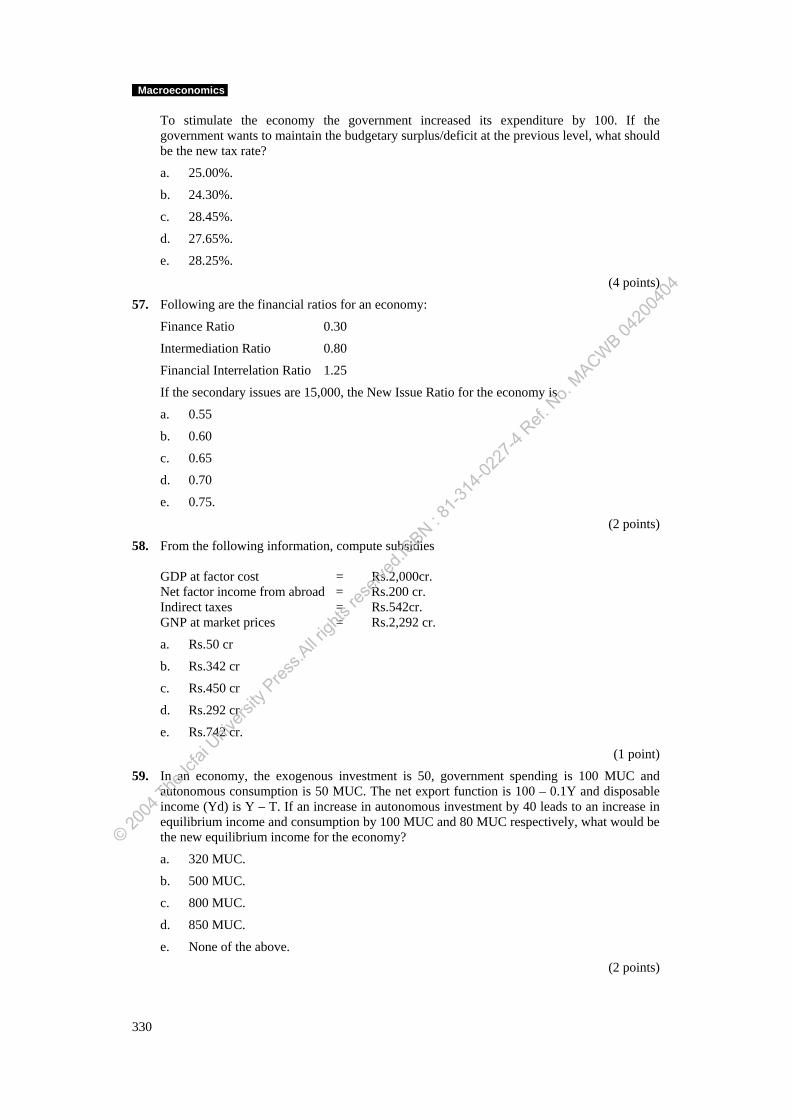
Macroeconomics
To stimulate the economy the government increased its expenditure by 100. If the government wants to maintain the budgetary surplus/deficit at the previous level, what should be the new tax rate?
a. 25.00%.
b. 24.30%.
c. 28.45%.
d. 27.65%.
e. 28.25%.
(4 points)
57. Following are the financial ratios for an economy:
Finance Ratio 0.30
Intermediation Ratio 0.80
Financial Interrelation Ratio 1.25
If the secondary issues are 15,000, the New Issue Ratio for the economy is
a. 0.55
b. 0.60
c. 0.65
d. 0.70
e. 0.75.
(2 points)
58. From the following information, compute subsidies GDP at factor cost = Rs.2,000cr. Net factor income from abroad = Rs.200 cr. Indirect taxes = Rs.542cr. GNP at market prices = Rs.2,292 cr.
a. Rs.50 cr
b. Rs.342 cr
c. Rs.450 cr
d. Rs.292 cr
e. Rs.742 cr.
(1 point)
59. In an economy, the exogenous investment is 50, government spending is 100 MUC and autonomous consumption is 50 MUC. The net export function is 100 – 0.1Y and disposable income (Yd) is Y – T. If an increase in autonomous investment by 40 leads to an increase in equilibrium income and consumption by 100 MUC and 80 MUC respectively, what would be the new equilibrium income for the economy?
a. 320 MUC.
b. 500 MUC.
c. 800 MUC.
d. 850 MUC.
e. None of the above. (2 points)
330
© 2004
The Ic
fai U
nivers
ity P
ress.A
ll righ
ts res
erved
.ISBN : 8
1-314
-0227
-4 Ref.
No.
MACWB 04
2004
04
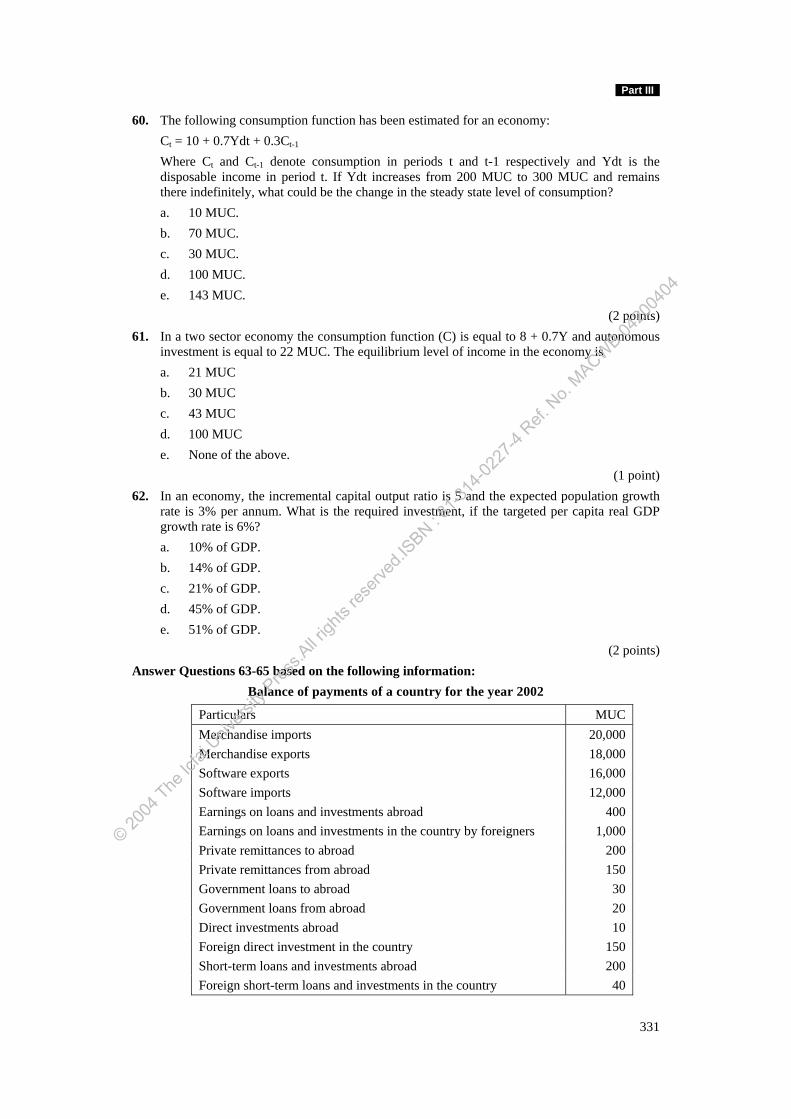
Part III
60. The following consumption function has been estimated for an economy: Ct = 10 + 0.7Ydt + 0.3Ct-1
Where Ct and Ct-1 denote consumption in periods t and t-1 respectively and Ydt is the disposable income in period t. If Ydt increases from 200 MUC to 300 MUC and remains there indefinitely, what could be the change in the steady state level of consumption? a. 10 MUC. b. 70 MUC. c. 30 MUC. d. 100 MUC. e. 143 MUC.
(2 points) 61. In a two sector economy the consumption function (C) is equal to 8 + 0.7Y and autonomous
investment is equal to 22 MUC. The equilibrium level of income in the economy is a. 21 MUC b. 30 MUC c. 43 MUC d. 100 MUC e. None of the above.
(1 point) 62. In an economy, the incremental capital output ratio is 5 and the expected population growth
rate is 3% per annum. What is the required investment, if the targeted per capita real GDP growth rate is 6%? a. 10% of GDP. b. 14% of GDP. c. 21% of GDP. d. 45% of GDP. e. 51% of GDP.
(2 points) Answer Questions 63-65 based on the following information:
Balance of payments of a country for the year 2002
Particulars MUC Merchandise imports 20,000 Merchandise exports 18,000 Software exports 16,000 Software imports 12,000 Earnings on loans and investments abroad 400 Earnings on loans and investments in the country by foreigners 1,000 Private remittances to abroad 200 Private remittances from abroad 150 Government loans to abroad 30 Government loans from abroad 20 Direct investments abroad 10 Foreign direct investment in the country 150 Short-term loans and investments abroad 200 Foreign short-term loans and investments in the country 40
331
© 2004
The Ic
fai U
nivers
ity P
ress.A
ll righ
ts res
erved
.ISBN : 8
1-314
-0227
-4 Ref.
No.
MACWB 04
2004
04
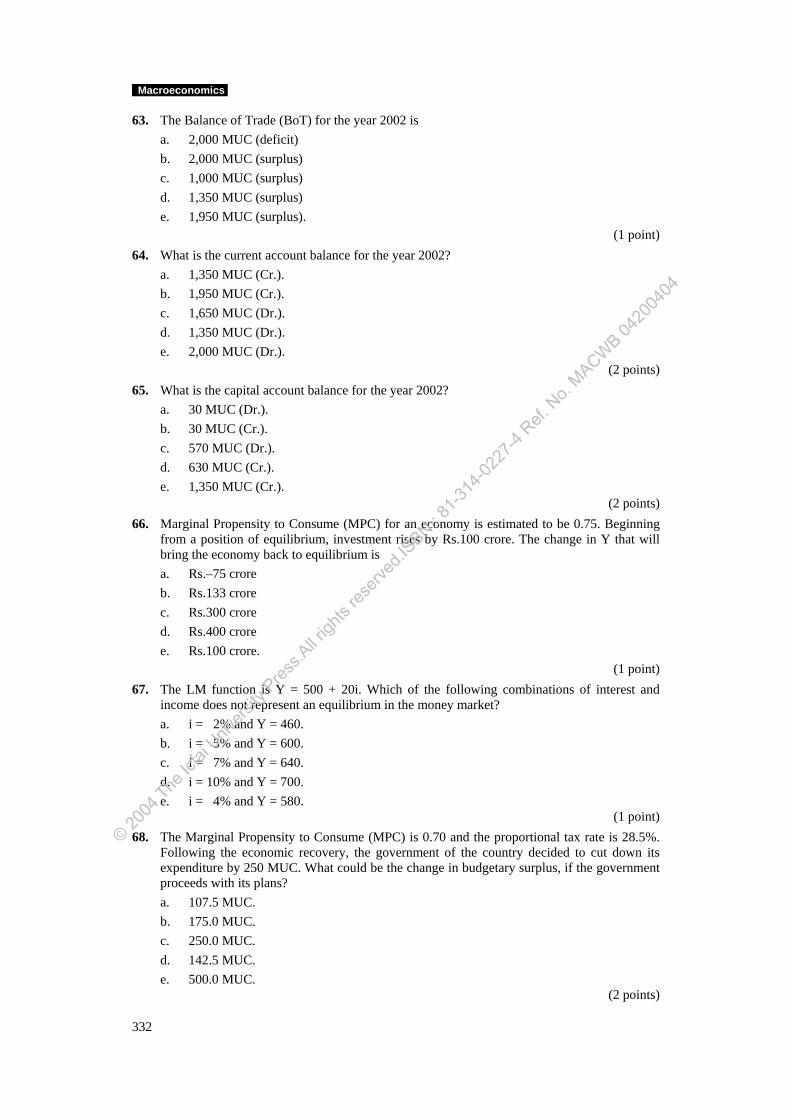
Macroeconomics
63. The Balance of Trade (BoT) for the year 2002 is a. 2,000 MUC (deficit) b. 2,000 MUC (surplus) c. 1,000 MUC (surplus) d. 1,350 MUC (surplus) e. 1,950 MUC (surplus).
(1 point) 64. What is the current account balance for the year 2002?
a. 1,350 MUC (Cr.). b. 1,950 MUC (Cr.). c. 1,650 MUC (Dr.). d. 1,350 MUC (Dr.). e. 2,000 MUC (Dr.).
(2 points) 65. What is the capital account balance for the year 2002?
a. 30 MUC (Dr.). b. 30 MUC (Cr.). c. 570 MUC (Dr.). d. 630 MUC (Cr.). e. 1,350 MUC (Cr.).
(2 points) 66. Marginal Propensity to Consume (MPC) for an economy is estimated to be 0.75. Beginning
from a position of equilibrium, investment rises by Rs.100 crore. The change in Y that will bring the economy back to equilibrium is a. Rs.–75 crore b. Rs.133 crore c. Rs.300 crore d. Rs.400 crore e. Rs.100 crore.
(1 point) 67. The LM function is Y = 500 + 20i. Which of the following combinations of interest and
income does not represent an equilibrium in the money market? a. i = 2% and Y = 460. b. i = 5% and Y = 600. c. i = 7% and Y = 640. d. i = 10% and Y = 700. e. i = 4% and Y = 580.
(1 point) 68. The Marginal Propensity to Consume (MPC) is 0.70 and the proportional tax rate is 28.5%.
Following the economic recovery, the government of the country decided to cut down its expenditure by 250 MUC. What could be the change in budgetary surplus, if the government proceeds with its plans? a. 107.5 MUC. b. 175.0 MUC. c. 250.0 MUC. d. 142.5 MUC. e. 500.0 MUC.
(2 points)
332
© 2004
The Ic
fai U
nivers
ity P
ress.A
ll righ
ts res
erved
.ISBN : 8
1-314
-0227
-4 Ref.
No.
MACWB 04
2004
04
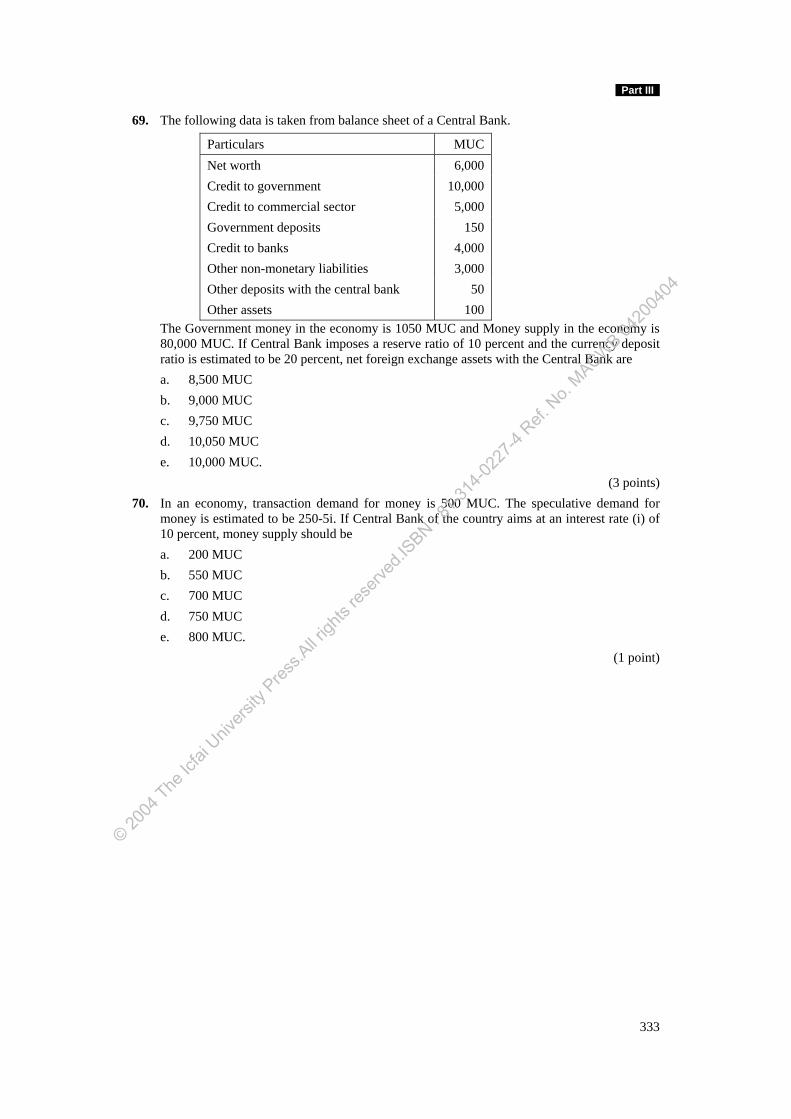
Part III
69. The following data is taken from balance sheet of a Central Bank.
Particulars MUC Net worth 6,000 Credit to government 10,000 Credit to commercial sector 5,000 Government deposits 150 Credit to banks 4,000 Other non-monetary liabilities 3,000 Other deposits with the central bank 50 Other assets 100
The Government money in the economy is 1050 MUC and Money supply in the economy is 80,000 MUC. If Central Bank imposes a reserve ratio of 10 percent and the currency deposit ratio is estimated to be 20 percent, net foreign exchange assets with the Central Bank are a. 8,500 MUC b. 9,000 MUC c. 9,750 MUC d. 10,050 MUC e. 10,000 MUC.
(3 points) 70. In an economy, transaction demand for money is 500 MUC. The speculative demand for
money is estimated to be 250-5i. If Central Bank of the country aims at an interest rate (i) of 10 percent, money supply should be a. 200 MUC b. 550 MUC c. 700 MUC d. 750 MUC e. 800 MUC.
(1 point)
333
© 2004
The Ic
fai U
nivers
ity P
ress.A
ll righ
ts res
erved
.ISBN : 8
1-314
-0227
-4 Ref.
No.
MACWB 04
2004
04
Model Question Paper I
Suggested Answers
Part A: Basic Concepts
1. (a) Macroeconomics involves studying of economy as a whole, while microeconomics involves studying the behavior of individual industries, firms and households.
2. (d) Rate of profit is not a measure of economic development.
3. (a) Policies that are related to collection of taxes and government spending constitute the fiscal policy of a government. Personal income tax is an instrument of fiscal policy.
4. (c) Inflation refers to rise in general level of price. Positive price inflation refer to a situation where although some prices may be falling, prices are, on the average climbing.
5. (c) In a model in which there is no government, net investment, capital replacement or international trade, the market value of final output equals the sum of wages, rent, interest and profit.
6. (e) Potential GDP is the maximum feasible GDP of an economy when all the resources are fully employed. If potential GDP is more than actual GDP, then production is less than it could be if all resources were fully employed.
7. (b) A reduction in money supply eventually lower interest rates if it makes price inflation subside. However, if it is not able to subside inflation, soon the interest rates will go up in the market.
8. (b) Net (Gross) Domestic Product = Net (Gross) National Product – NFIA. This implies that net domestic product does not include net factor income from abroad.
9. (e) Because the purchase of existing house is not an addition to the capital stock, the value of existing house is not added to GDP or GNP of an economy.
10. (a) Savings is done by individuals, separately and collectively, for various reasons.
11. (c) Investment demand curve (or investment spending curve or IS curve) depicts the relation between investment spending and interest rates in the goods market.
12. (a) On the basis of the Keynesian model of output determination, if maintainable savings exceed intended investment, output will fall.
13. (c) A reduction in the reserve ratio increases the credit creating and lending capacity of the commercial banks, which in turn lead to increase in money supply in the economy.
14. (c) Real interest rate = Nominal interest rate – Rate of inflation.
15. (a) Personal disposable income = Personal income – Personal income taxes. Hence, Personal income = Personal disposable income + Personal income taxes.
16. (b) According to the inventory theory, the transaction demand for money varies inversely with the rate of interest and is proportional to the square root of income.
17. (e) The high powered money in Indian economy will change due to all the five sources.
18. (a) Average propensity to consume is the ratio of change in consumption to total income.
19. (b) Whereas average propensity to consume (APC) is the ratio of total consumption to total income, marginal propensity to consume is the ratio of incremental consumption to incremental income.
© 2004
The Ic
fai U
nivers
ity P
ress.A
ll righ
ts res
erved
.ISBN : 8
1-314
-0227
-4 Ref.
No.
MACWB 04
2004
04
Part III
20. (b) Following are some of the important factors that are responsible for changes in aggregate demand. • Change in income • Rate of interest • Government policy • Change in the exchange rate • Change in the expected rate of inflation. • Change in business expectations.
21. (a) Any increase in real stock of money will shift the LM curve to words right.
22. (d) Fiscal policy affects AD demand directly. For example, increase in government spending increases the aggregate demand in the economy, which tend to increase the output at each level of interest rate. Thus the IS curve shifts out and to the right for an increase in government expenditure.
23. (e) The following statements are true.
i. GDP at factor cost = Wages and salaries + Dividends + Retained profit + Profit tax ii. GNP at factor cost = GDP at factor cost + Net factor income from abroad iii. GNP at market prices = GNP at factor cost + Indirect taxes – Subsidies iv. GDP at market prices = GDP at factor cost + Indirect taxes – Subsidies.
24. (a) Personal income = Wages and salaries + Dividends + Transfer payments; and
Personal Disposable Income = Personal income – Personal income taxes. Thus, personal disposable income is equal to wages and salaries + Dividends paid at home + Factor income received from abroad + Transfers from government – Personal income taxes.
25. (b) NNP at market (factor) prices = GNP at market (factor) prices – Depreciation.
26. (b) Laffer curve shows the relationship between tax rates and tax revenue.
27. (b) Decrease in taxes increases the disposable income and hence increases the consumption by MPC times the increase in disposable income. Decrease in government expenditure decreases the income by the same amount. Since level of increase in income due to decrease in taxes is less than that of level of decrease in income due to reduction in government spending, the income level will fall. However, due to increase in disposable income level of consumption will increase.
28. (e) Bottlenecks refer to the blockages in the achievement of full employment in the economy. Shortage of materials and inadequate supply of labor act as bottlenecks in the process of achieving full employment.
29. (b) Macroeconomics is sometimes known as quantitative economics.
30. (a) Marginal propensity of import is the change in the level of imports as a result of a unit change of income. In other words, marginal propensity to import is the percentage change in the level of imports due to a percentage change in income.
31. (a) (a) Value addition is equal to value of output less value of inputs. By summing up all the value additions in the economy GDP of the economy can be computed, which is called value added approach to measuring GDP. Hence the answer is (a).
(b) By adding all the incomes of factors of production in the economy, GDP can be computed which is called income approach to measuring GDP. Hence (b) is not the answer.
335
© 2004
The Ic
fai U
nivers
ity P
ress.A
ll righ
ts res
erved
.ISBN : 8
1-314
-0227
-4 Ref.
No.
MACWB 04
2004
04
Macroeconomics
(c) Is not the answer as we get real GDP by removing the effect of inflation from nominal GDP.
(d & e) Is not the answer as we get GDP through expenditure approach by summing up all the expenditures incurred by the ultimate buyers on the goods and services produced by the domestic sector.
32. (b) (a) True. Nominal GDP can increase both on account of increase in real production or an increase in the price level.
(b) False. Disposable income is equal to personal income less personal tax payments. Disposable income is either used for consumption expenditure or saving.
(c) True. Net investment is equal to gross investment less depreciation. (d) True. The opportunity cost of holding money is the rate of interest foregone by
holding the money. Therefore, as the rate of interest increase, opportunity cost of holding money also increases.
(e) True. Trade balance is in deficit if import are greater than export of goods.
33. (b) (a) Is not the answer. Slope of consumption function is Marginal Propensity to Consume.
(b) Is the answer. Coefficient of acceleration is equal to ΔK/ΔY, which is called Capital Output Ratio.
(c) Is not the answer. Marginal Propensity to Consume is equal to ΔC/ΔY. (d) Is not the answer. Reciprocal of Marginal Propensity to Import is equal to
ΔY/ΔImports.
34. (b) Consumption function captures the relation between the consumption and the disposable income. Slope of consumption function indicates how responsive consumption is as income changes. That is, slope of the consumption function is equal to ΔC/ΔY, which is nothing but Marginal Propensity to Consume.
(a) Is not the answer. Average Propensity to Save is equal to S/Yd. (b) Is the answer. Marginal Propensity to Consume is equal to ΔC/ΔYd. (c) Is not the answer. Marginal Propensity to Save is equal to ΔS/ΔYd. (d) Is not the answer. Average Propensity to Consume is equal to C/Yd.
35. (d) Transfer payments are payments which cannot be regarded as payment for current services or production and therefore do not enter national income. Of the above, invalidity benefit, flood relief, government pensions and Scholarships do not involve any production activity and are transfer payments. Where as, salaries paid to Members of Parliament are compensation to the services rendered by the members, hence it is not a transfer payment.
36. (a) (a) Classical economists assume flexible wages in the economy. Flexibility of wages results in full employment of labor in the economy. Hence the aggregate supply curve becomes vertical at the full employment level. Therefore, the answer is (a).
(b) Is not the answer. If Aggregate Supply curve is horizontal, increase in the Aggregate Demand does not exert pressure on the price level and more goods and services are supplied at the same price level. This can happen only if there is very high level of unemployed resources in the economy. But, classical economists assume full employment of resources.
(c) If Aggregate Supply curve is first horizontal and then vertical, it implies Aggregate Supply is perfectly elastic until the full employment level is reached and perfectly inelastic at the full employment level of output. Hence, (c) is not the answer.
(d) Is not the answer. Aggregate Supply curve with such a shape does not exist. (e) Is not the answer. A positively sloped Aggregate Supply curve is not possible under the
classical assumption of perfectly flexible wages.
336
© 2004
The Ic
fai U
nivers
ity P
ress.A
ll righ
ts res
erved
.ISBN : 8
1-314
-0227
-4 Ref.
No.
MACWB 04
2004
04
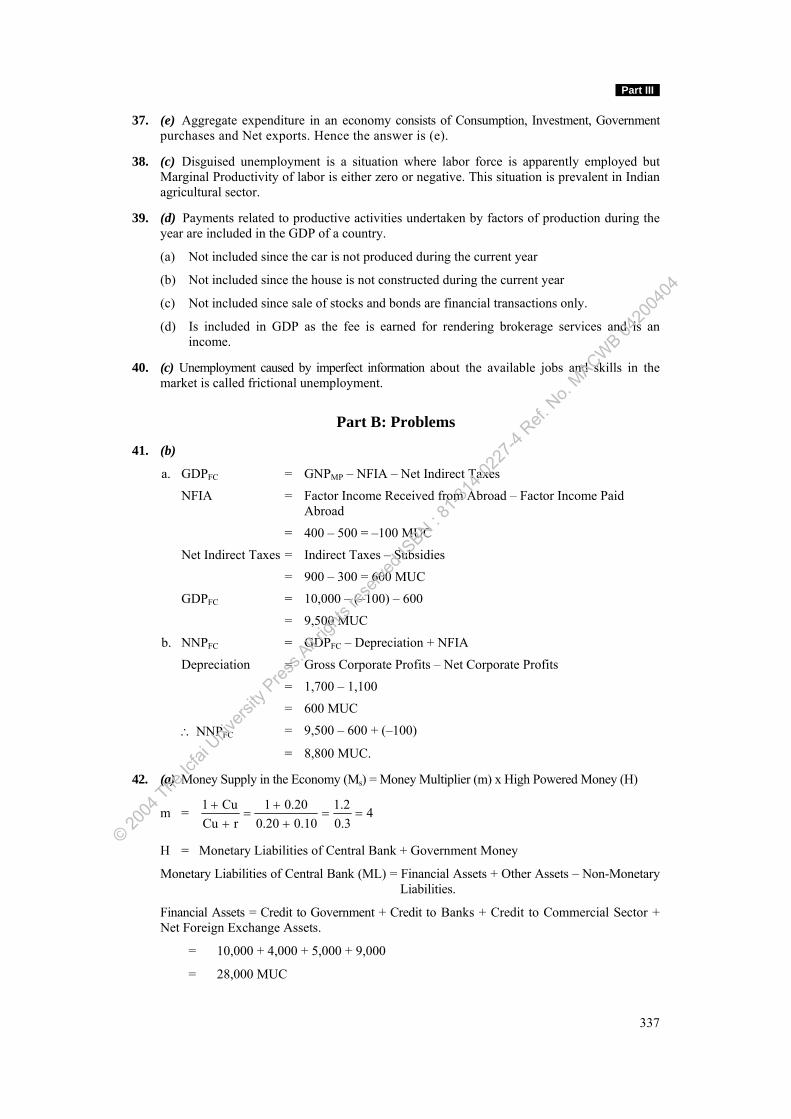
Part III
37. (e) Aggregate expenditure in an economy consists of Consumption, Investment, Government purchases and Net exports. Hence the answer is (e).
38. (c) Disguised unemployment is a situation where labor force is apparently employed but Marginal Productivity of labor is either zero or negative. This situation is prevalent in Indian agricultural sector.
39. (d) Payments related to productive activities undertaken by factors of production during the year are included in the GDP of a country.
(a) Not included since the car is not produced during the current year
(b) Not included since the house is not constructed during the current year
(c) Not included since sale of stocks and bonds are financial transactions only.
(d) Is included in GDP as the fee is earned for rendering brokerage services and is an income.
40. (c) Unemployment caused by imperfect information about the available jobs and skills in the market is called frictional unemployment.
Part B: Problems
41. (b)
a. GDPFC = GNPMP – NFIA – Net Indirect Taxes
NFIA = Factor Income Received from Abroad – Factor Income Paid Abroad
= 400 – 500 = –100 MUC
Net Indirect Taxes = Indirect Taxes – Subsidies
= 900 – 300 = 600 MUC
GDPFC = 10,000 – (–100) – 600
= 9,500 MUC
b. NNPFC = GDPFC – Depreciation + NFIA
Depreciation = Gross Corporate Profits – Net Corporate Profits
= 1,700 – 1,100
= 600 MUC
∴ NNPFC = 9,500 – 600 + (–100)
= 8,800 MUC.
42. (a) Money Supply in the Economy (Ms) = Money Multiplier (m) x High Powered Money (H)
m = 40.31.2
0.100.200.201
rCuCu1
==+
+=
++
H = Monetary Liabilities of Central Bank + Government Money
Monetary Liabilities of Central Bank (ML) = Financial Assets + Other Assets – Non-Monetary Liabilities.
Financial Assets = Credit to Government + Credit to Banks + Credit to Commercial Sector + Net Foreign Exchange Assets.
= 10,000 + 4,000 + 5,000 + 9,000
= 28,000 MUC
337
© 2004
The Ic
fai U
nivers
ity P
ress.A
ll righ
ts res
erved
.ISBN : 8
1-314
-0227
-4 Ref.
No.
MACWB 04
2004
04
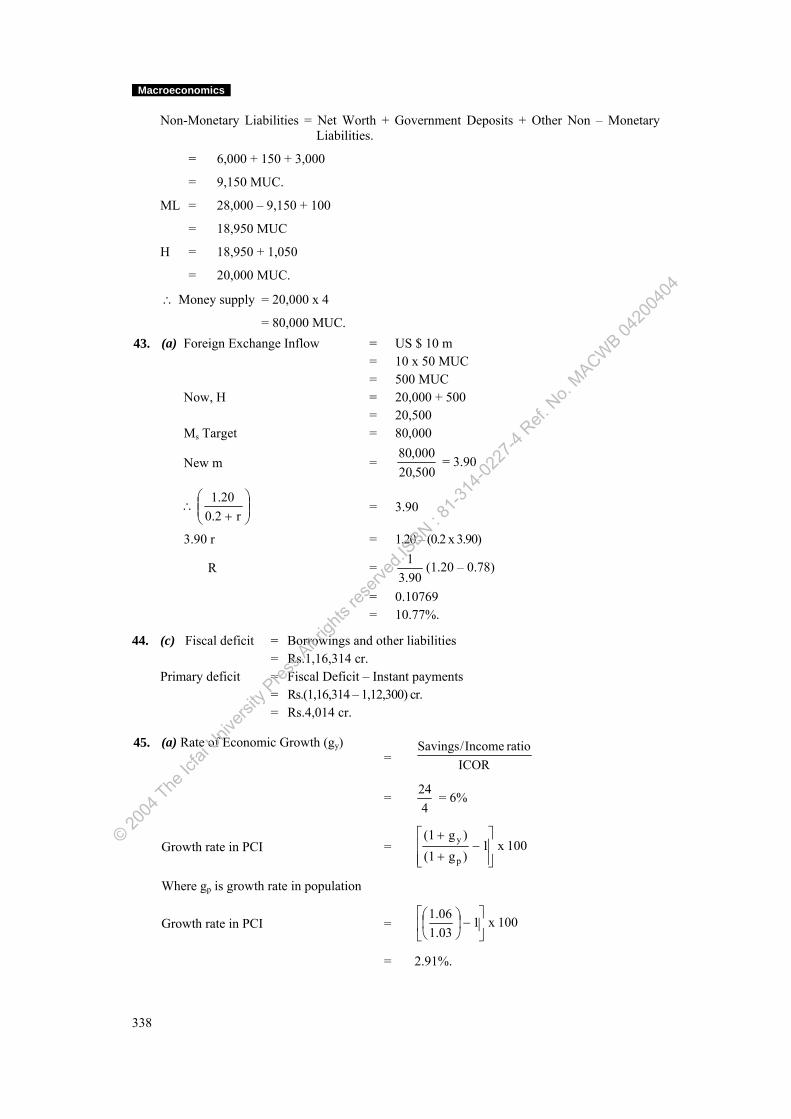
Macroeconomics
Non-Monetary Liabilities = Net Worth + Government Deposits + Other Non – Monetary Liabilities.
= 6,000 + 150 + 3,000
= 9,150 MUC.
ML = 28,000 – 9,150 + 100
= 18,950 MUC
H = 18,950 + 1,050
= 20,000 MUC.
∴ Money supply = 20,000 x 4
= 80,000 MUC. 43. (a) Foreign Exchange Inflow = US $ 10 m = 10 x 50 MUC = 500 MUC Now, H = 20,000 + 500 = 20,500 Ms Target = 80,000
New m = 500,20000,80
= 3.90
∴ ⎟⎟⎠
⎞⎜⎜⎝
⎛+ r0.2
1.20 = 3.90
3.90 r = 1.20 – (0.2 x 3.90)
R = 3.90
1 (1.20 – 0.78)
= 0.10769 = 10.77%.
44. (c) Fiscal deficit = Borrowings and other liabilities = Rs.1,16,314 cr. Primary deficit = Fiscal Deficit – Instant payments = Rs.(1,16,314 – 1,12,300) cr. = Rs.4,014 cr.
45. (a) Rate of Economic Growth (gy) = ICOR
ratioIncome/Savings
=
424 = 6%
Growth rate in PCI = 100x1
)g(1)g(1
p
y
⎥⎥⎦
⎤
⎢⎢⎣
⎡−
+
+
Where gp is growth rate in population
Growth rate in PCI = 100x1
1.031.06
⎥⎦
⎤⎢⎣
⎡−⎟
⎠⎞
⎜⎝⎛
= 2.91%.
338
© 2004
The Ic
fai U
nivers
ity P
ress.A
ll righ
ts res
erved
.ISBN : 8
1-314
-0227
-4 Ref.
No.
MACWB 04
2004
04
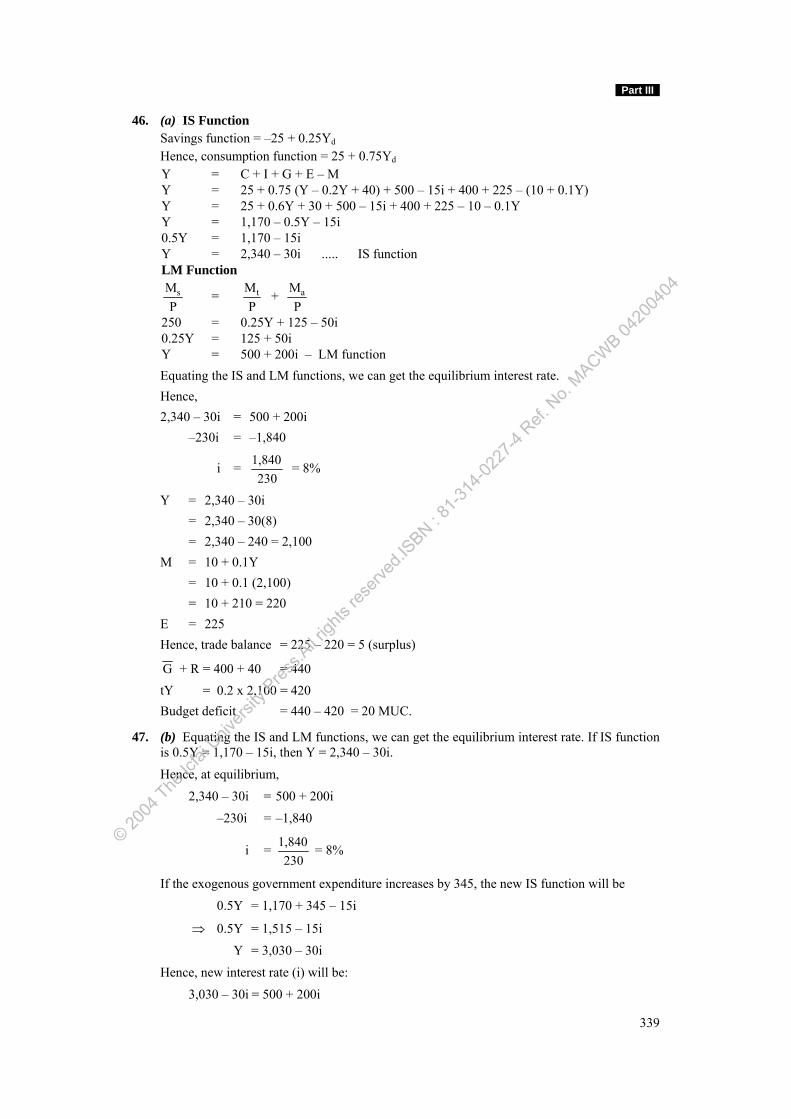
Part III
46. (a) IS Function Savings function = –25 + 0.25Yd
Hence, consumption function = 25 + 0.75Yd
Y = C + I + G + E – M Y = 25 + 0.75 (Y – 0.2Y + 40) + 500 – 15i + 400 + 225 – (10 + 0.1Y) Y = 25 + 0.6Y + 30 + 500 – 15i + 400 + 225 – 10 – 0.1Y Y = 1,170 – 0.5Y – 15i 0.5Y = 1,170 – 15i Y = 2,340 – 30i ..... IS function LM Function
PMs =
PMt +
PMa
250 = 0.25Y + 125 – 50i 0.25Y = 125 + 50i Y = 500 + 200i – LM function
Equating the IS and LM functions, we can get the equilibrium interest rate. Hence, 2,340 – 30i = 500 + 200i –230i = –1,840
i = 230
1,840 = 8%
Y = 2,340 – 30i = 2,340 – 30(8) = 2,340 – 240 = 2,100 M = 10 + 0.1Y = 10 + 0.1 (2,100) = 10 + 210 = 220 E = 225 Hence, trade balance = 225 – 220 = 5 (surplus)
G + R = 400 + 40 = 440 tY = 0.2 x 2,100 = 420 Budget deficit = 440 – 420 = 20 MUC.
47. (b) Equating the IS and LM functions, we can get the equilibrium interest rate. If IS function is 0.5Y = 1,170 – 15i, then Y = 2,340 – 30i.
Hence, at equilibrium,
2,340 – 30i = 500 + 200i
–230i = –1,840
i = 230
1,840 = 8%
If the exogenous government expenditure increases by 345, the new IS function will be
0.5Y = 1,170 + 345 – 15i
⇒ 0.5Y = 1,515 – 15i
Y = 3,030 – 30i
Hence, new interest rate (i) will be:
3,030 – 30i = 500 + 200i
339
© 2004
The Ic
fai U
nivers
ity P
ress.A
ll righ
ts res
erved
.ISBN : 8
1-314
-0227
-4 Ref.
No.
MACWB 04
2004
04
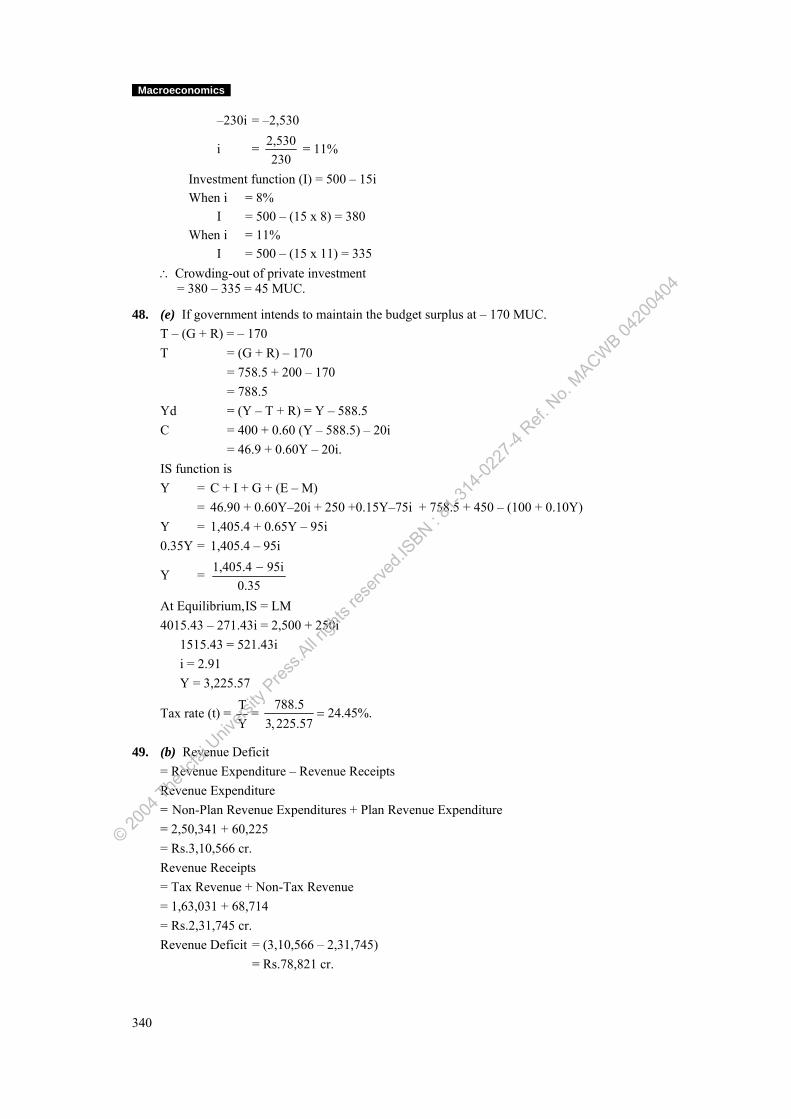
Macroeconomics
–230i = –2,530
i = 230
2,530 = 11%
Investment function (I) = 500 – 15i When i = 8% I = 500 – (15 x 8) = 380 When i = 11% I = 500 – (15 x 11) = 335 ∴ Crowding-out of private investment = 380 – 335 = 45 MUC.
48. (e) If government intends to maintain the budget surplus at – 170 MUC. T – (G + R) = – 170 T = (G + R) – 170 = 758.5 + 200 – 170 = 788.5 Yd = (Y – T + R) = Y – 588.5 C = 400 + 0.60 (Y – 588.5) – 20i = 46.9 + 0.60Y – 20i. IS function is Y = C + I + G + (E – M) = 46.90 + 0.60Y–20i + 250 +0.15Y–75i + 758.5 + 450 – (100 + 0.10Y) Y = 1,405.4 + 0.65Y – 95i 0.35Y = 1,405.4 – 95i
Y = 0.35
95i1,405.4 −
At Equilibrium, IS = LM 4015.43 – 271.43i = 2,500 + 250i
1515.43 = 521.43i i = 2.91 Y = 3,225.57
Tax rate (t) = TY
= 788.5 24.45%.3,225.57
=
49. (b) Revenue Deficit = Revenue Expenditure – Revenue Receipts Revenue Expenditure = Non-Plan Revenue Expenditures + Plan Revenue Expenditure = 2,50,341 + 60,225 = Rs.3,10,566 cr. Revenue Receipts = Tax Revenue + Non-Tax Revenue = 1,63,031 + 68,714 = Rs.2,31,745 cr. Revenue Deficit = (3,10,566 – 2,31,745) = Rs.78,821 cr.
340
© 2004
The Ic
fai U
nivers
ity P
ress.A
ll righ
ts res
erved
.ISBN : 8
1-314
-0227
-4 Ref.
No.
MACWB 04
2004
04
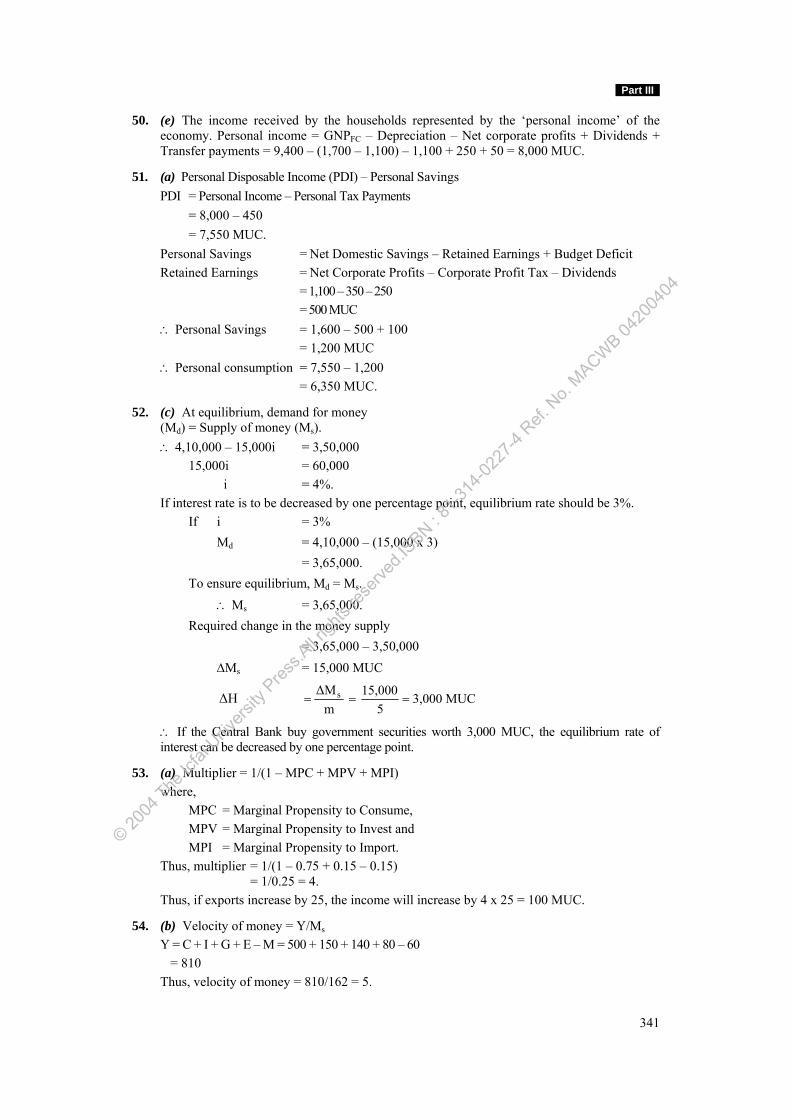
Part III
50. (e) The income received by the households represented by the ‘personal income’ of the economy. Personal income = GNPFC – Depreciation – Net corporate profits + Dividends + Transfer payments = 9,400 – (1,700 – 1,100) – 1,100 + 250 + 50 = 8,000 MUC.
51. (a) Personal Disposable Income (PDI) – Personal Savings PDI = Personal Income – Personal Tax Payments = 8,000 – 450 = 7,550 MUC.
Personal Savings = Net Domestic Savings – Retained Earnings + Budget Deficit Retained Earnings = Net Corporate Profits – Corporate Profit Tax – Dividends = 1,100 – 350 – 250 = 500 MUC ∴ Personal Savings = 1,600 – 500 + 100 = 1,200 MUC ∴ Personal consumption = 7,550 – 1,200 = 6,350 MUC.
52. (c) At equilibrium, demand for money (Md) = Supply of money (Ms).
∴ 4,10,000 – 15,000i = 3,50,000 15,000i = 60,000 i = 4%.
If interest rate is to be decreased by one percentage point, equilibrium rate should be 3%. If i = 3% Md = 4,10,000 – (15,000 x 3) = 3,65,000. To ensure equilibrium, Md = Ms. ∴ Ms = 3,65,000. Required change in the money supply = 3,65,000 – 3,50,000 ΔMs = 15,000 MUC
ΔH MUC3,0005
15,000m
ΔMs ===
∴ If the Central Bank buy government securities worth 3,000 MUC, the equilibrium rate of interest can be decreased by one percentage point.
53. (a) Multiplier = 1/(1 – MPC + MPV + MPI) where, MPC = Marginal Propensity to Consume, MPV = Marginal Propensity to Invest and MPI = Marginal Propensity to Import. Thus, multiplier = 1/(1 – 0.75 + 0.15 – 0.15)
= 1/0.25 = 4. Thus, if exports increase by 25, the income will increase by 4 x 25 = 100 MUC.
54. (b) Velocity of money = Y/Ms
Y = C + I + G + E – M = 500 + 150 + 140 + 80 – 60 = 810 Thus, velocity of money = 810/162 = 5.
341
© 2004
The Ic
fai U
nivers
ity P
ress.A
ll righ
ts res
erved
.ISBN : 8
1-314
-0227
-4 Ref.
No.
MACWB 04
2004
04
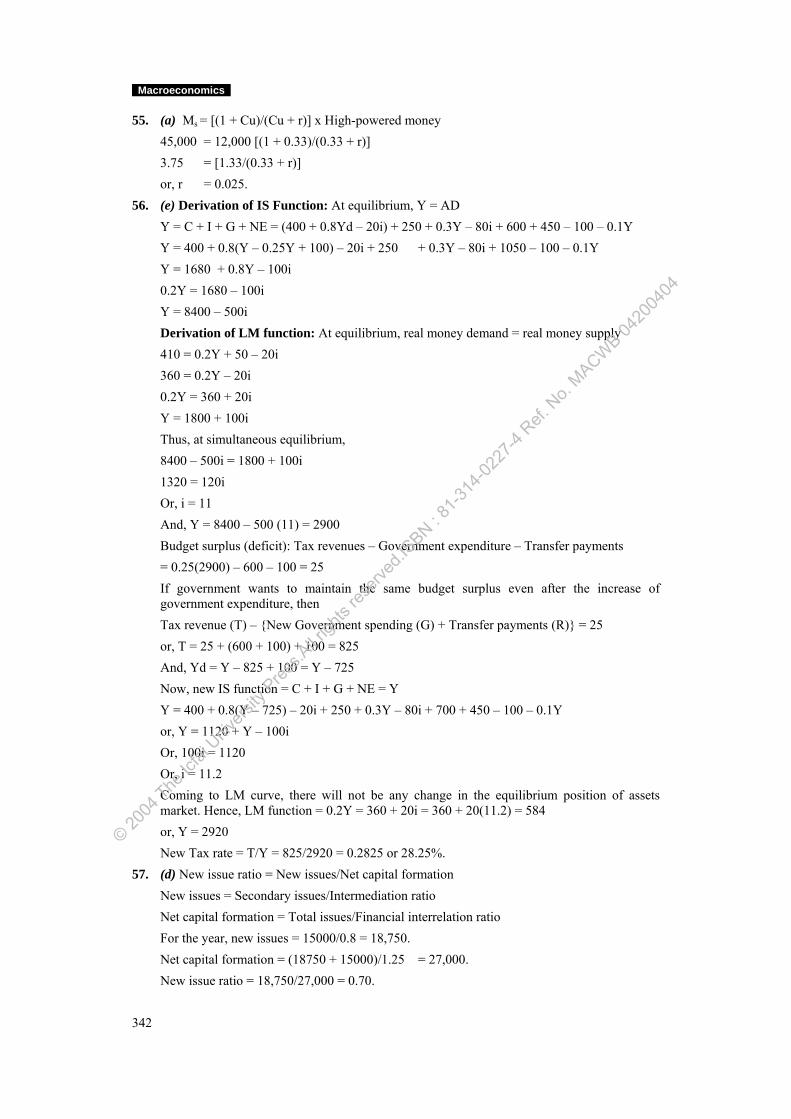
Macroeconomics
55. (a) Ms = [(1 + Cu)/(Cu + r)] x High-powered money 45,000 = 12,000 [(1 + 0.33)/(0.33 + r)] 3.75 = [1.33/(0.33 + r)] or, r = 0.025. 56. (e) Derivation of IS Function: At equilibrium, Y = AD
Y = C + I + G + NE = (400 + 0.8Yd – 20i) + 250 + 0.3Y – 80i + 600 + 450 – 100 – 0.1Y Y = 400 + 0.8(Y – 0.25Y + 100) – 20i + 250 + 0.3Y – 80i + 1050 – 100 – 0.1Y Y = 1680 + 0.8Y – 100i 0.2Y = 1680 – 100i Y = 8400 – 500i Derivation of LM function: At equilibrium, real money demand = real money supply 410 = 0.2Y + 50 – 20i 360 = 0.2Y – 20i 0.2Y = 360 + 20i Y = 1800 + 100i Thus, at simultaneous equilibrium, 8400 – 500i = 1800 + 100i 1320 = 120i Or, i = 11 And, Y = 8400 – 500 (11) = 2900 Budget surplus (deficit): Tax revenues – Government expenditure – Transfer payments = 0.25(2900) – 600 – 100 = 25 If government wants to maintain the same budget surplus even after the increase of government expenditure, then Tax revenue (T) – {New Government spending (G) + Transfer payments (R)} = 25 or, T = 25 + (600 + 100) + 100 = 825 And, Yd = Y – 825 + 100 = Y – 725 Now, new IS function = C + I + G + NE = Y Y = 400 + 0.8(Y – 725) – 20i + 250 + 0.3Y – 80i + 700 + 450 – 100 – 0.1Y or, Y = 1120 + Y – 100i Or, 100i = 1120 Or, i = 11.2 Coming to LM curve, there will not be any change in the equilibrium position of assets market. Hence, LM function = 0.2Y = 360 + 20i = 360 + 20(11.2) = 584 or, Y = 2920 New Tax rate = T/Y = 825/2920 = 0.2825 or 28.25%.
57. (d) New issue ratio = New issues/Net capital formation New issues = Secondary issues/Intermediation ratio Net capital formation = Total issues/Financial interrelation ratio For the year, new issues = 15000/0.8 = 18,750. Net capital formation = (18750 + 15000)/1.25 = 27,000. New issue ratio = 18,750/27,000 = 0.70.
342
© 2004
The Ic
fai U
nivers
ity P
ress.A
ll righ
ts res
erved
.ISBN : 8
1-314
-0227
-4 Ref.
No.
MACWB 04
2004
04
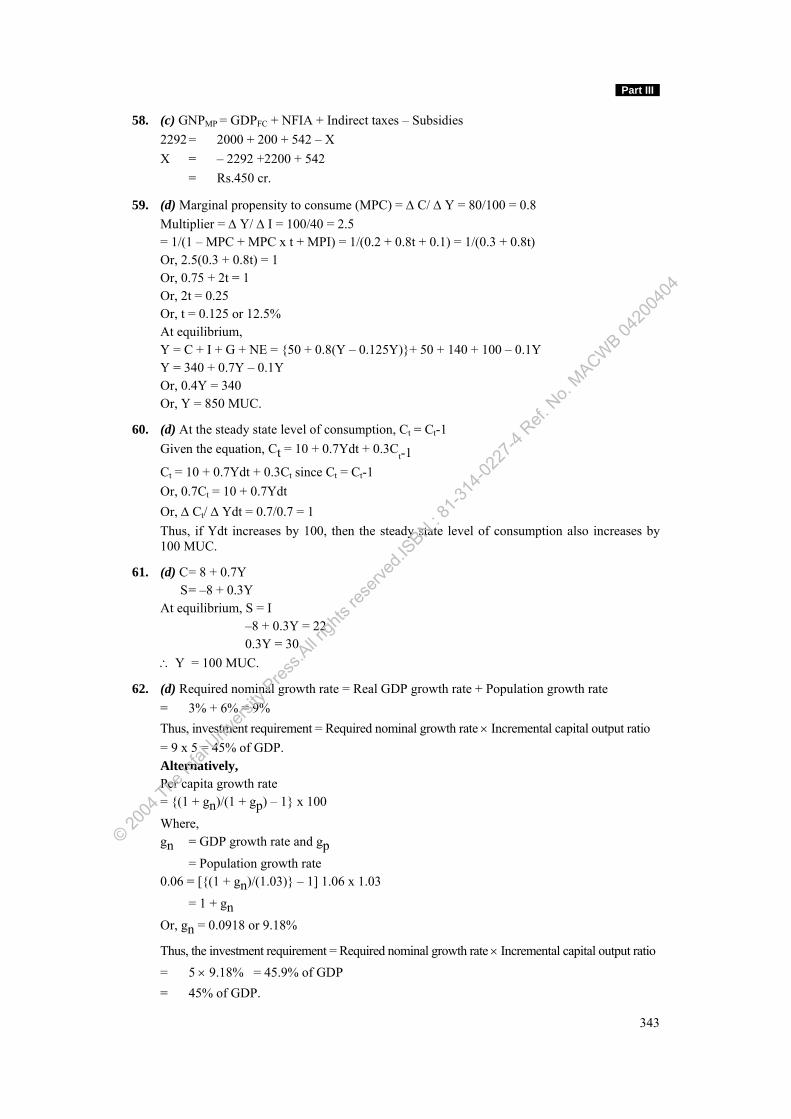
Part III
58. (c) GNPMP = GDPFC + NFIA + Indirect taxes – Subsidies 2292 = 2000 + 200 + 542 – X X = – 2292 +2200 + 542 = Rs.450 cr.
59. (d) Marginal propensity to consume (MPC) = Δ C/ Δ Y = 80/100 = 0.8 Multiplier = Δ Y/ Δ I = 100/40 = 2.5 = 1/(1 – MPC + MPC x t + MPI) = 1/(0.2 + 0.8t + 0.1) = 1/(0.3 + 0.8t) Or, 2.5(0.3 + 0.8t) = 1 Or, 0.75 + 2t = 1 Or, 2t = 0.25 Or, t = 0.125 or 12.5% At equilibrium, Y = C + I + G + NE = {50 + 0.8(Y – 0.125Y)}+ 50 + 140 + 100 – 0.1Y Y = 340 + 0.7Y – 0.1Y Or, 0.4Y = 340 Or, Y = 850 MUC.
60. (d) At the steady state level of consumption, Ct = Ct-1 Given the equation, Ct = 10 + 0.7Ydt + 0.3C
t-1
Ct = 10 + 0.7Ydt + 0.3Ct since Ct = Ct-1 Or, 0.7Ct = 10 + 0.7Ydt Or, Δ Ct/ Δ Ydt = 0.7/0.7 = 1 Thus, if Ydt increases by 100, then the steady state level of consumption also increases by 100 MUC.
61. (d) C = 8 + 0.7Y S = –8 + 0.3Y At equilibrium, S = I –8 + 0.3Y = 22 0.3Y = 30 ∴ Y = 100 MUC.
62. (d) Required nominal growth rate = Real GDP growth rate + Population growth rate = 3% + 6% = 9%
Thus, investment requirement = Required nominal growth rate × Incremental capital output ratio = 9 x 5 = 45% of GDP.
Alternatively, Per capita growth rate = {(1 + gn)/(1 + gp) – 1} x 100
Where, gn = GDP growth rate and gp
= Population growth rate 0.06 = [{(1 + gn)/(1.03)} – 1] 1.06 x 1.03
= 1 + gn
Or, gn = 0.0918 or 9.18%
Thus, the investment requirement = Required nominal growth rate × Incremental capital output ratio = 5 × 9.18% = 45.9% of GDP = 45% of GDP.
343
© 2004
The Ic
fai U
nivers
ity P
ress.A
ll righ
ts res
erved
.ISBN : 8
1-314
-0227
-4 Ref.
No.
MACWB 04
2004
04
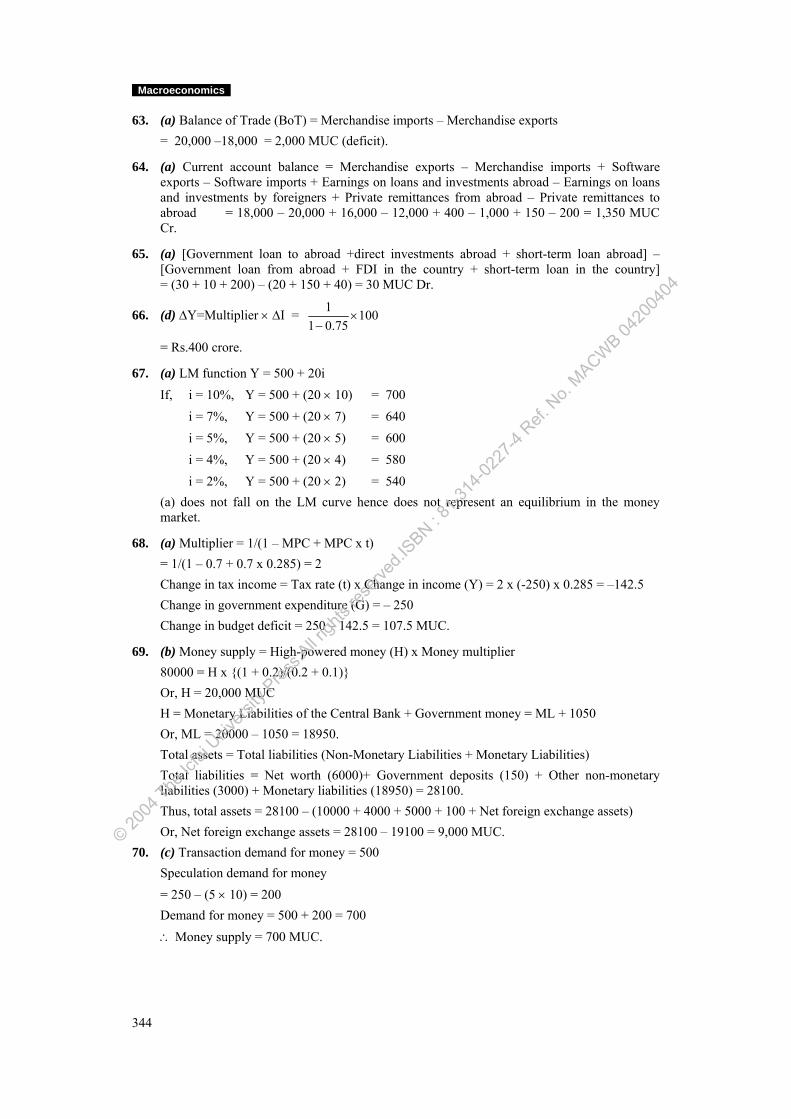
Macroeconomics
63. (a) Balance of Trade (BoT) = Merchandise imports – Merchandise exports = 20,000 –18,000 = 2,000 MUC (deficit).
64. (a) Current account balance = Merchandise exports – Merchandise imports + Software exports – Software imports + Earnings on loans and investments abroad – Earnings on loans and investments by foreigners + Private remittances from abroad – Private remittances to abroad = 18,000 – 20,000 + 16,000 – 12,000 + 400 – 1,000 + 150 – 200 = 1,350 MUC Cr.
65. (a) [Government loan to abroad +direct investments abroad + short-term loan abroad] – [Government loan from abroad + FDI in the country + short-term loan in the country] = (30 + 10 + 200) – (20 + 150 + 40) = 30 MUC Dr.
66. (d) ΔY=Multiplier × ΔI = 10075.01
1×
−
= Rs.400 crore.
67. (a) LM function Y = 500 + 20i If, i = 10%, Y = 500 + (20 × 10) = 700 i = 7%, Y = 500 + (20 × 7) = 640 i = 5%, Y = 500 + (20 × 5) = 600 i = 4%, Y = 500 + (20 × 4) = 580 i = 2%, Y = 500 + (20 × 2) = 540 (a) does not fall on the LM curve hence does not represent an equilibrium in the money market.
68. (a) Multiplier = 1/(1 – MPC + MPC x t) = 1/(1 – 0.7 + 0.7 x 0.285) = 2
Change in tax income = Tax rate (t) x Change in income (Y) = 2 x (-250) x 0.285 = –142.5 Change in government expenditure (G) = – 250 Change in budget deficit = 250 – 142.5 = 107.5 MUC.
69. (b) Money supply = High-powered money (H) x Money multiplier 80000 = H x {(1 + 0.2)/(0.2 + 0.1)} Or, H = 20,000 MUC H = Monetary Liabilities of the Central Bank + Government money = ML + 1050 Or, ML = 20000 – 1050 = 18950. Total assets = Total liabilities (Non-Monetary Liabilities + Monetary Liabilities) Total liabilities = Net worth (6000)+ Government deposits (150) + Other non-monetary liabilities (3000) + Monetary liabilities (18950) = 28100. Thus, total assets = 28100 – (10000 + 4000 + 5000 + 100 + Net foreign exchange assets) Or, Net foreign exchange assets = 28100 – 19100 = 9,000 MUC.
70. (c) Transaction demand for money = 500 Speculation demand for money = 250 – (5 × 10) = 200 Demand for money = 500 + 200 = 700 ∴ Money supply = 700 MUC.
344
© 2004
The Ic
fai U
nivers
ity P
ress.A
ll righ
ts res
erved
.ISBN : 8
1-314
-0227
-4 Ref.
No.
MACWB 04
2004
04
Model Question Paper II Time: 3 Hours Total Points: 100
Part A: Basic Concepts (40 Points)
Answer all the questions. Each question carries one point. 1. An increase in the money supply a. Must lower interest rates for all the time b. Raises interest rates for all the time c. Cannot affect the interest rate since it is a unit free pure number d. Though it tends to lower interest rates at first, but may end up raising nominal interest
rates (by speeding up inflation) e. Fiscal deficit will increase. 2. Net factor income from abroad is equal to a. GDP – GNP b. GNP – GDP c. GDP/GNP d. GNP/GDP e. None of the above. 3. Potential GDP is a. The total value of goods and services measured at current prices b. The total value of goods and services that could be produced at full employment c. The total value of goods and services measured at prices corrected for inflation d. The total value of goods and services net of government spending e. The total value of goods and services that could be produced at full efficiency. 4. The study of macroeconomics includes, among other topics, which of the following? a. The sources of inflation, unemployment, economic growth. b. The foundations of aggregate behavior. c. The reasons, why some economies succeed and some fail. d. Policies that can be enacted to improve the likelihood of success in achieving
macroeconomic objectives. e. All of the above. 5. In the Simple Keynesian multiplier model, national output moves up and down in response to a. Movements in aggregate demand b. Movements in aggregate supply c. Changes in the general price level d. Changes in the level of input prices e. Changes in the time of day.
6. A price index is necessary if: a. Nominal GDP is to be calculated b. Nominal GDP is to be converted into real GDP c. Profits are to equate the two accounting measures of GDP d. Disposable income is to be converted to personal income e. All the above statements are equally valid.
© 2004
The Ic
fai U
nivers
ity P
ress.A
ll righ
ts res
erved
.ISBN : 8
1-314
-0227
-4 Ref.
No.
MACWB 04
2004
04
Macroeconomics
7. Suppose that people were suddenly to decide to save less of their disposable incomes. You should expect to observe
a. An increase in the marginal propensity to consume
b. A reduction in the marginal propensity to consume
c. An increase in the marginal propensity to save
d. An increase in the sum of the marginal propensity to consume and the marginal propensity to save
e. An increase in the marginal propensity to consume and a corresponding increase in the sum of the marginal propensity to consume and marginal propensity to save.
8. On the basis of the Keynesian model of output determination, GDP is in equilibrium
a. Whenever there is full employment
b. Only if marginal propensity to save equals marginal propensity to invest
c. Whenever there is full employment without government interference
d. Whenever the desired saving equals the desired investment
e. Whenever actual saving equals actual investment. 9. Which of the following statements is false? a. Whatever else tax reductions do, the personal consumption resulting from tax
reductions must stimulate the real GDP. b. Tax reductions can cause inflation. c. Tax reductions tend to stimulate output. d. Tax reductions tend to increase consumption. e. Tax reductions tend to increase personal savings.
10. The resorting of the Central Bank to contractionary or expansionary monetary policies to neutralize the change in money supply caused by changes in foreign exchange reserves is referred to as
a. Transmission mechanism b. Sterilization c. Stabilization d. Monetary mechanism e. Exchange mechanism. 11. Aggregate supply in the economy depends upon a. The availability of inputs b. The level of technology c. The level of wages d. The level of import prices e. All of the above. 12. Philips curve shows the relationship between a. GDP and investment b. Unemployment rate and rate of inflation c. CPI and inflation d. Savings rate and equilibrium output e. None of the above.
346
© 2004
The Ic
fai U
nivers
ity P
ress.A
ll righ
ts res
erved
.ISBN : 8
1-314
-0227
-4 Ref.
No.
MACWB 04
2004
04
Part III
13. Which of the following g is most important in increasing the rate of economic growth? a. A highly progressive tax structure. b. High interest rates on time deposits. c. Increasing the percentage of GDP used for investment. d. A constant supply of funds available to investors. e. Reducing inequality of income distribution and wealth.
14. Keynes held that money is used
a. To settle transactions b. To meet unexpected contingencies c. To take advantage of fluctuating rates of interest d. Both (a) and (b) above e. All of (a), (b) and (c) above. 15. Unemployment, inflation and the rate of growth of actual GDP are all examples of a. Policy variables b. Exogenous variables c. Endogenous variables d. Macroeconomic variables of an economy e. None of the above. 16. Which of the following relationships is true? a. Personal income = National income – Retained earnings + Corporate taxes. b. Personal income = National income – Retained earnings – Corporate taxes. c. National income = NNP at factor cost – Depreciation. d. GDP at factor cost = GNP at market prices – Indirect taxes + Subsidies. e. Retained profit = National income – Personal income. 17. “Liquidity trap” refers to a situation where a. There is too much liquidity in the economy b. The firms in the economy are facing credit crunch c. Interest rates do not decrease, no matter how much the money supply is expanded d. The country faces a severe shortage of foreign exchange e. None of the above. 18. The difference between the actual fiscal deficit and Cyclical Neutral Fiscal Deficit (CNFD) is
known as a. Fiscal stance b. Fiscal impulse c. Gross fiscal deficit d. Neutral fiscal deficit e. Cyclical fiscal deficit.
19. An increase in government expenditure will a. Shift both IS and LM curves to the right b. Shift both IS and LM curves to the left c. Not affect the position of LM curve but shift the IS curve to left d. Not affect the position of IS curve but shift the LM curve to right e. Not affect the position of LM curve but shift the IS curve to right.
347
© 2004
The Ic
fai U
nivers
ity P
ress.A
ll righ
ts res
erved
.ISBN : 8
1-314
-0227
-4 Ref.
No.
MACWB 04
2004
04
Macroeconomics
20. Curve that illustrates the relationship between the rate of change in prices and the rate of unemployment is known as
a. Lucas supply curve b. Laffer curve c. Philips curve d. Classical aggregate supply curve e. Keynesian aggregate supply curve. 21. In which market foreign exchange is bought and sold for delivery at a future date at the rate
of exchange agreed upon today a. Euro currency market b. Forward market c. Future market d. Spot market e. Swap market. 22. Velocity of circulation means a. The average turnover of money in a period, relative to the national income b. The ratio of money supply to income c. The ratio of money demand to income d. The ratio of money demand to money supply e. The ratio of money demand to supply of high-powered money. 23. Which of the following is true regarding Laffer curve? a. Increase in tax rate always leads to an increase in tax revenue. b. Increase in tax rate always leads to a decrease in tax revenue since people search for
alternatives to evade tax. c. Increase in tax rate, up to a certain level, leads to an increase in tax revenue and later
results in decrease of tax revenue. d. Decrease in tax rate leads to an increase in tax revenue since more people will come
forward to pay taxes. e. None of the above. 24. Supply of money remaining constant, an increase in demand for money, will result in a. A fall in the level of prices b. An increase in the rate of interest c. A decrease in the rate of interest d. An increase in level of income and employment e. Both (a) and (c) above.
25. A neoclassical aggregate supply schedule exists
a. At an output rate greater than the natural rate of unemployment
b. At an output level determined by the supply of and demand for labor
c. When the demand for labor and supply of labor schedules adjust immediately to a change in the price level
d. When equilibrium in the labor markets is unaffected by shifts in the supply of labor schedule
e. None of the above.
348
© 2004
The Ic
fai U
nivers
ity P
ress.A
ll righ
ts res
erved
.ISBN : 8
1-314
-0227
-4 Ref.
No.
MACWB 04
2004
04
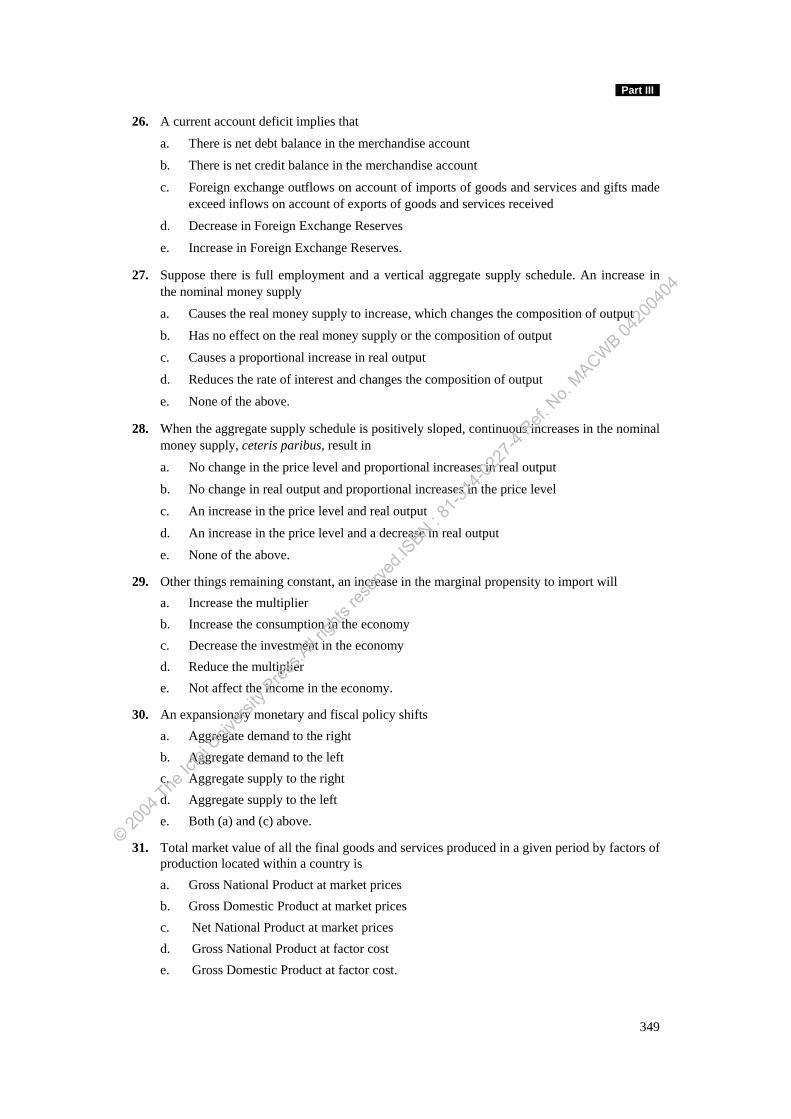
Part III
26. A current account deficit implies that
a. There is net debt balance in the merchandise account
b. There is net credit balance in the merchandise account
c. Foreign exchange outflows on account of imports of goods and services and gifts made exceed inflows on account of exports of goods and services received
d. Decrease in Foreign Exchange Reserves
e. Increase in Foreign Exchange Reserves.
27. Suppose there is full employment and a vertical aggregate supply schedule. An increase in the nominal money supply
a. Causes the real money supply to increase, which changes the composition of output
b. Has no effect on the real money supply or the composition of output
c. Causes a proportional increase in real output
d. Reduces the rate of interest and changes the composition of output
e. None of the above.
28. When the aggregate supply schedule is positively sloped, continuous increases in the nominal money supply, ceteris paribus, result in
a. No change in the price level and proportional increases in real output
b. No change in real output and proportional increases in the price level
c. An increase in the price level and real output
d. An increase in the price level and a decrease in real output
e. None of the above.
29. Other things remaining constant, an increase in the marginal propensity to import will a. Increase the multiplier b. Increase the consumption in the economy c. Decrease the investment in the economy d. Reduce the multiplier e. Not affect the income in the economy.
30. An expansionary monetary and fiscal policy shifts a. Aggregate demand to the right b. Aggregate demand to the left c. Aggregate supply to the right d. Aggregate supply to the left e. Both (a) and (c) above.
31. Total market value of all the final goods and services produced in a given period by factors of production located within a country is
a. Gross National Product at market prices b. Gross Domestic Product at market prices c. Net National Product at market prices d. Gross National Product at factor cost e. Gross Domestic Product at factor cost.
349
© 2004
The Ic
fai U
nivers
ity P
ress.A
ll righ
ts res
erved
.ISBN : 8
1-314
-0227
-4 Ref.
No.
MACWB 04
2004
04

Macroeconomics
32. The quantity theory of money implies that a given percentage change in the money supply will cause
a. An equal percentage change in nominal GDP b. A smaller percentage change in nominal GDP c. A larger percentage change in nominal GDP d. An equal percentage change in real GDP e. A smaller percentage change in real GDP.
33. All entries in the balance of payments statement should collectively sum to a. GDP of that country b. GNP of the country c. Foreign exchange reserves of that country d. Zero e. Exports of that country.
34. If the anticipated rate of inflation rises, other things remaining constant, we would expect the nominal interest rate to
a. Remain unchanged b. Rise by the same percentage as the increase in the anticipated rate of inflation c. Fall by the same percentage as the increase in the anticipated rate of inflation d. Rise, but by less than the anticipated increase in the rate of inflation e. Fall, but by less than the anticipated increase in the rate of inflation.
35. A current account deficit implies that a. Domestic spending exceeds domestic income b. Domestic income exceeds domestic spending c. Exports exceeds imports d. Domestic savings exceed domestic investment e. None of the above.
36. An increase in government expenditure will a. Shift both IS and LM curves to the right b. Shift both IS and LM curves to the left c. Not affect the position of LM curve but shift the IS curve to left d. Not affect the position of IS curve but shift the LM curve to right e. Not affect the position of LM curve but shift the IS curve to right.
37. Increase in net RBI credit to the Central Government is reflected in which of the following?
a. Budget deficit. b. Revenue deficit. c. Monetized deficit. d. Gross primary deficit. e. Gross fiscal deficit.
38. The basic difference between money stock measure M3 and M4 is that a. M3 is more than M4
b. M2 is part of M3 whereas M2 is not part of M4
c. M3 is part of M1 and M4 is not part of M1
d. M4 includes all post office deposits, whereas in M3 these are not included e. M1 is part of M4 where as M1 is not part of M3.
350
© 2004
The Ic
fai U
nivers
ity P
ress.A
ll righ
ts res
erved
.ISBN : 8
1-314
-0227
-4 Ref.
No.
MACWB 04
2004
04
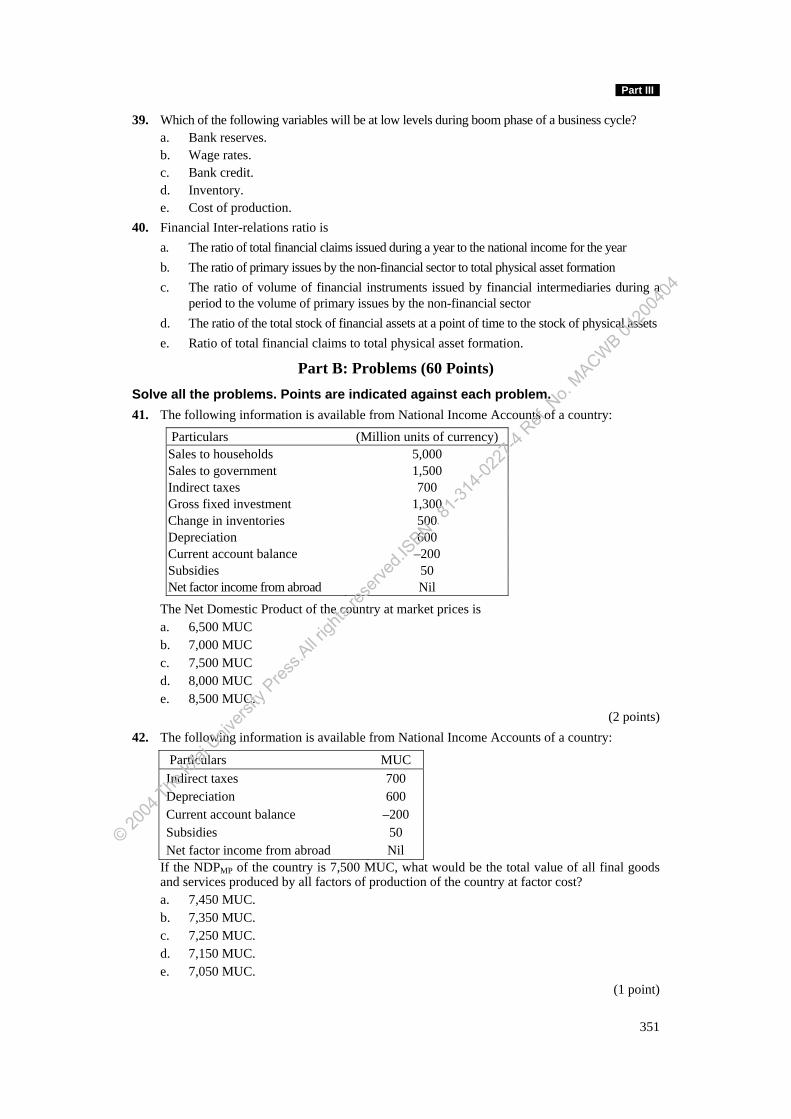
Part III
39. Which of the following variables will be at low levels during boom phase of a business cycle? a. Bank reserves. b. Wage rates. c. Bank credit. d. Inventory. e. Cost of production. 40. Financial Inter-relations ratio is a. The ratio of total financial claims issued during a year to the national income for the year b. The ratio of primary issues by the non-financial sector to total physical asset formation c. The ratio of volume of financial instruments issued by financial intermediaries during a
period to the volume of primary issues by the non-financial sector d. The ratio of the total stock of financial assets at a point of time to the stock of physical assets e. Ratio of total financial claims to total physical asset formation.
Part B: Problems (60 Points)Solve all the problems. Points are indicated against each problem. 41. The following information is available from National Income Accounts of a country:
Particulars (Million units of currency) Sales to households 5,000 Sales to government 1,500 Indirect taxes 700 Gross fixed investment 1,300 Change in inventories 500 Depreciation 600 Current account balance –200 Subsidies 50 Net factor income from abroad Nil
The Net Domestic Product of the country at market prices is a. 6,500 MUC b. 7,000 MUC c. 7,500 MUC d. 8,000 MUC e. 8,500 MUC.
(2 points) 42. The following information is available from National Income Accounts of a country:
Particulars MUC Indirect taxes 700 Depreciation 600 Current account balance –200 Subsidies 50 Net factor income from abroad Nil
If the NDPMP of the country is 7,500 MUC, what would be the total value of all final goods and services produced by all factors of production of the country at factor cost?
a. 7,450 MUC. b. 7,350 MUC. c. 7,250 MUC. d. 7,150 MUC. e. 7,050 MUC.
(1 point)
351
© 2004
The Ic
fai U
nivers
ity P
ress.A
ll righ
ts res
erved
.ISBN : 8
1-314
-0227
-4 Ref.
No.
MACWB 04
2004
04
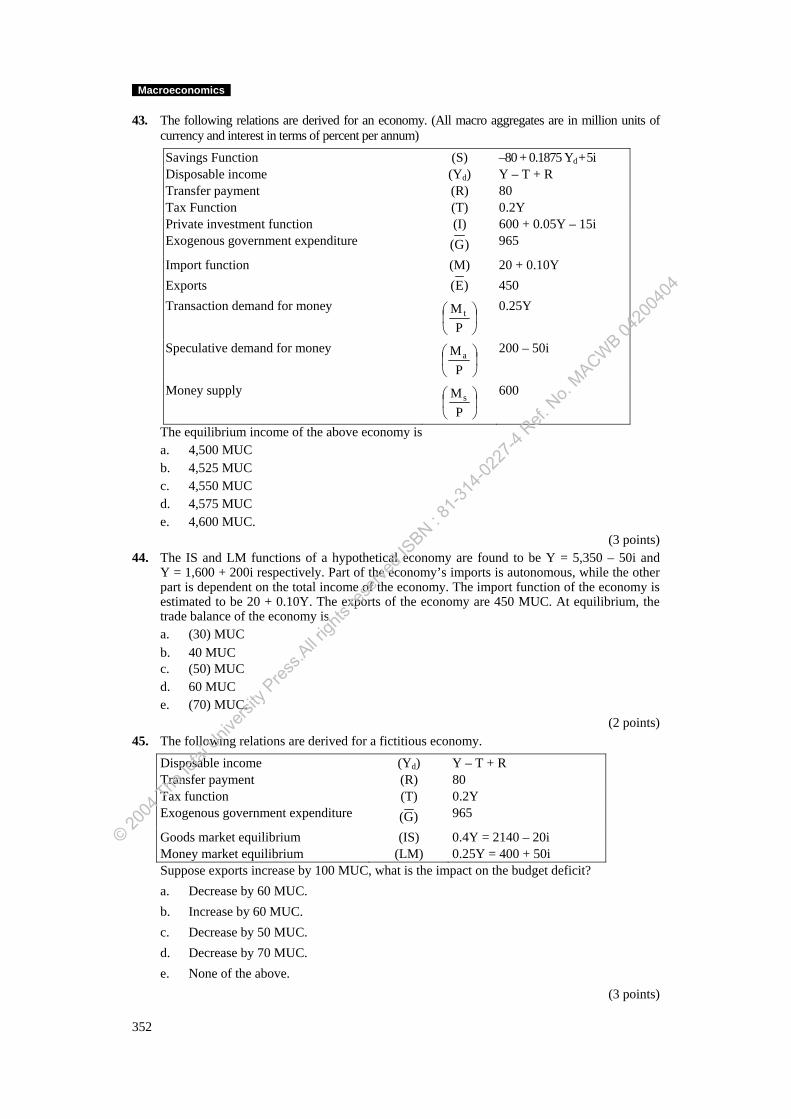
Macroeconomics
43. The following relations are derived for an economy. (All macro aggregates are in million units of currency and interest in terms of percent per annum)
Savings Function (S) –80 + 0.1875 Yd + 5i Disposable income (Yd) Y – T + R Transfer payment (R) 80 Tax Function (T) 0.2Y Private investment function (I) 600 + 0.05Y – 15i Exogenous government expenditure )G( 965
Import function (M) 20 + 0.10Y Exports )E( 450 Transaction demand for money
⎟⎠
⎞⎜⎝
⎛P
M t 0.25Y
Speculative demand for money ⎟⎠
⎞⎜⎝
⎛P
Ma
200 – 50i
Money supply ⎟⎠
⎞⎜⎝
⎛P
Ms 600
The equilibrium income of the above economy is a. 4,500 MUC b. 4,525 MUC c. 4,550 MUC d. 4,575 MUC e. 4,600 MUC.
(3 points) 44. The IS and LM functions of a hypothetical economy are found to be Y = 5,350 – 50i and
Y = 1,600 + 200i respectively. Part of the economy’s imports is autonomous, while the other part is dependent on the total income of the economy. The import function of the economy is estimated to be 20 + 0.10Y. The exports of the economy are 450 MUC. At equilibrium, the trade balance of the economy is
a. (30) MUC b. 40 MUC c. (50) MUC d. 60 MUC e. (70) MUC.
(2 points) 45. The following relations are derived for a fictitious economy.
Disposable income (Yd) Y – T + R Transfer payment (R) 80 Tax function (T) 0.2Y Exogenous government expenditure )G( 965
Goods market equilibrium (IS) 0.4Y = 2140 – 20i Money market equilibrium (LM) 0.25Y = 400 + 50i
Suppose exports increase by 100 MUC, what is the impact on the budget deficit? a. Decrease by 60 MUC. b. Increase by 60 MUC. c. Decrease by 50 MUC. d. Decrease by 70 MUC. e. None of the above.
(3 points)
352
© 2004
The Ic
fai U
nivers
ity P
ress.A
ll righ
ts res
erved
.ISBN : 8
1-314
-0227
-4 Ref.
No.
MACWB 04
2004
04
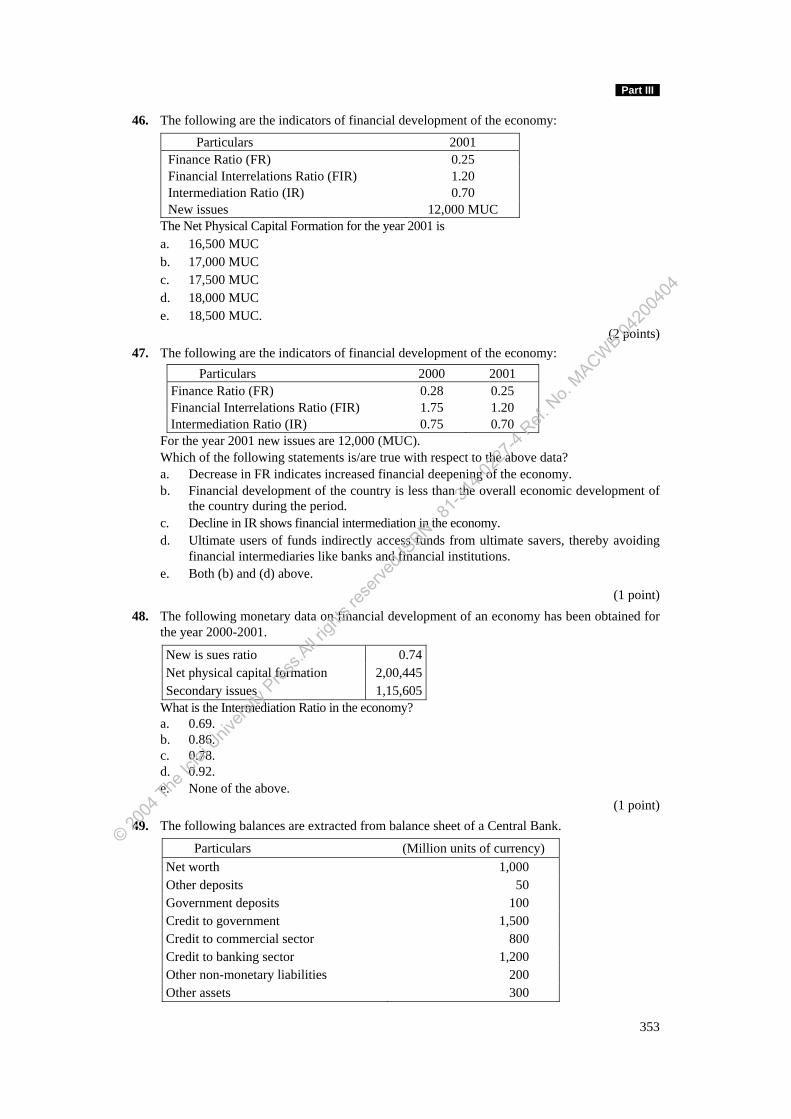
Part III
46. The following are the indicators of financial development of the economy:
Particulars 2001 Finance Ratio (FR) 0.25 Financial Interrelations Ratio (FIR) 1.20 Intermediation Ratio (IR) 0.70 New issues 12,000 MUC
The Net Physical Capital Formation for the year 2001 is a. 16,500 MUC b. 17,000 MUC c. 17,500 MUC d. 18,000 MUC e. 18,500 MUC.
(2 points) 47. The following are the indicators of financial development of the economy:
Particulars 2000 2001 Finance Ratio (FR) 0.28 0.25 Financial Interrelations Ratio (FIR) 1.75 1.20 Intermediation Ratio (IR) 0.75 0.70
For the year 2001 new issues are 12,000 (MUC). Which of the following statements is/are true with respect to the above data? a. Decrease in FR indicates increased financial deepening of the economy. b. Financial development of the country is less than the overall economic development of
the country during the period. c. Decline in IR shows financial intermediation in the economy. d. Ultimate users of funds indirectly access funds from ultimate savers, thereby avoiding
financial intermediaries like banks and financial institutions. e. Both (b) and (d) above.
(1 point) 48. The following monetary data on financial development of an economy has been obtained for
the year 2000-2001.
New is sues ratio 0.74Net physical capital formation 2,00,445Secondary issues 1,15,605
What is the Intermediation Ratio in the economy? a. 0.69. b. 0.86. c. 0.78. d. 0.92. e. None of the above.
(1 point) 49. The following balances are extracted from balance sheet of a Central Bank.
Particulars (Million units of currency) Net worth 1,000 Other deposits 50 Government deposits 100 Credit to government 1,500 Credit to commercial sector 800 Credit to banking sector 1,200 Other non-monetary liabilities 200 Other assets 300
353
© 2004
The Ic
fai U
nivers
ity P
ress.A
ll righ
ts res
erved
.ISBN : 8
1-314
-0227
-4 Ref.
No.
MACWB 04
2004
04
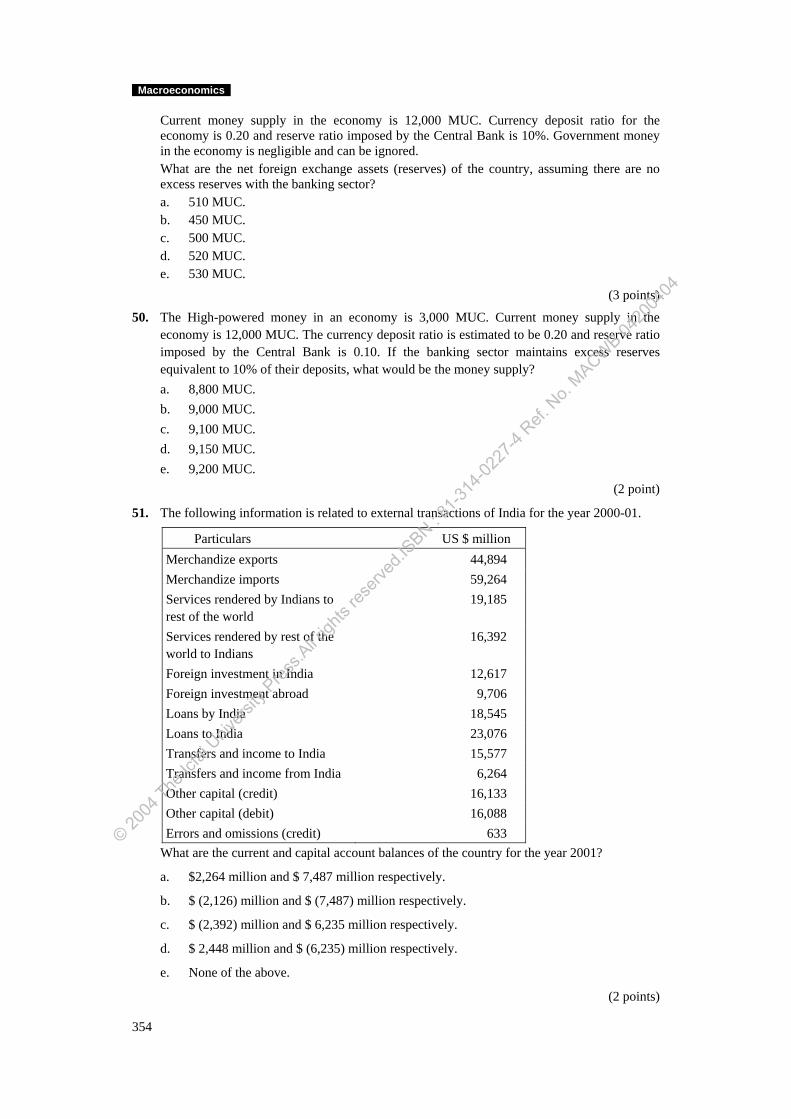
Macroeconomics
Current money supply in the economy is 12,000 MUC. Currency deposit ratio for the economy is 0.20 and reserve ratio imposed by the Central Bank is 10%. Government money in the economy is negligible and can be ignored.
What are the net foreign exchange assets (reserves) of the country, assuming there are no excess reserves with the banking sector?
a. 510 MUC. b. 450 MUC. c. 500 MUC. d. 520 MUC. e. 530 MUC.
(3 points)
50. The High-powered money in an economy is 3,000 MUC. Current money supply in the economy is 12,000 MUC. The currency deposit ratio is estimated to be 0.20 and reserve ratio imposed by the Central Bank is 0.10. If the banking sector maintains excess reserves equivalent to 10% of their deposits, what would be the money supply?
a. 8,800 MUC. b. 9,000 MUC. c. 9,100 MUC. d. 9,150 MUC. e. 9,200 MUC.
(2 point)
51. The following information is related to external transactions of India for the year 2000-01.
Particulars US $ million Merchandize exports 44,894 Merchandize imports 59,264 Services rendered by Indians to rest of the world
19,185
Services rendered by rest of the world to Indians
16,392
Foreign investment in India 12,617 Foreign investment abroad 9,706 Loans by India 18,545 Loans to India 23,076 Transfers and income to India 15,577 Transfers and income from India 6,264 Other capital (credit) 16,133 Other capital (debit) 16,088 Errors and omissions (credit) 633
What are the current and capital account balances of the country for the year 2001?
a. $2,264 million and $ 7,487 million respectively.
b. $ (2,126) million and $ (7,487) million respectively.
c. $ (2,392) million and $ 6,235 million respectively.
d. $ 2,448 million and $ (6,235) million respectively.
e. None of the above.
(2 points)
354
© 2004
The Ic
fai U
nivers
ity P
ress.A
ll righ
ts res
erved
.ISBN : 8
1-314
-0227
-4 Ref.
No.
MACWB 04
2004
04
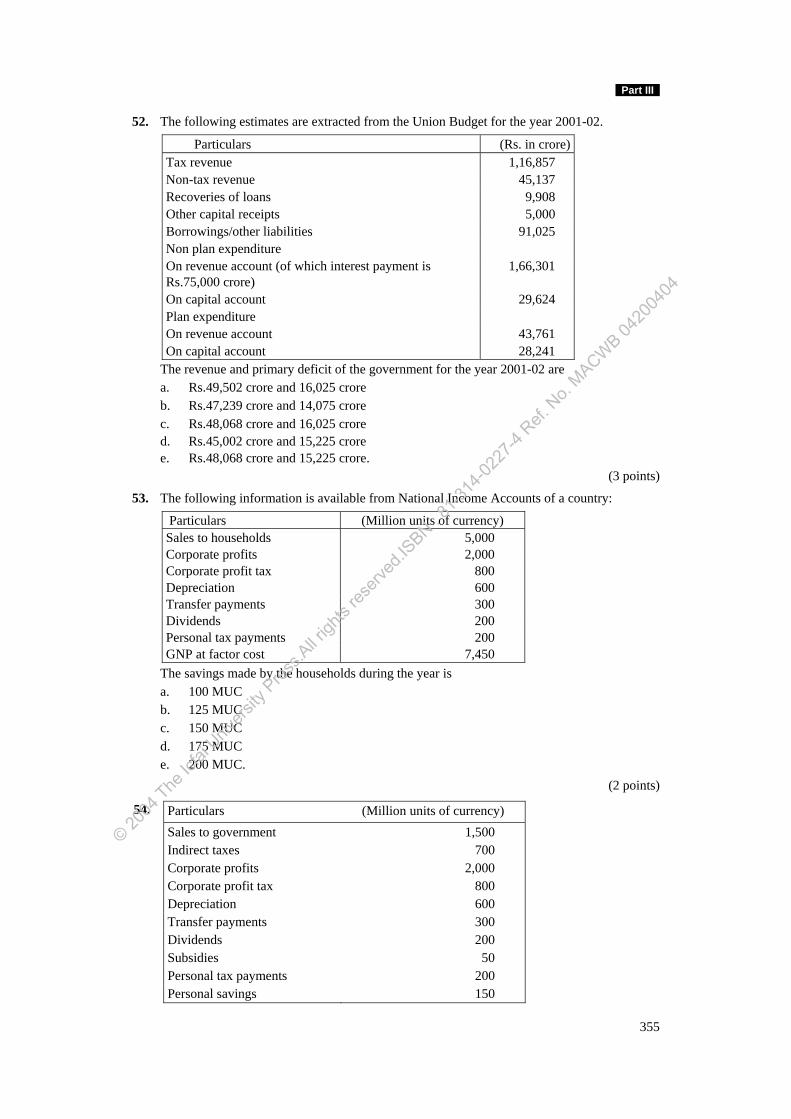
Part III
52. The following estimates are extracted from the Union Budget for the year 2001-02.
Particulars (Rs. in crore) Tax revenue 1,16,857 Non-tax revenue 45,137 Recoveries of loans 9,908 Other capital receipts 5,000 Borrowings/other liabilities 91,025 Non plan expenditure On revenue account (of which interest payment is Rs.75,000 crore)
1,66,301
On capital account 29,624 Plan expenditure On revenue account 43,761 On capital account 28,241
The revenue and primary deficit of the government for the year 2001-02 are a. Rs.49,502 crore and 16,025 crore b. Rs.47,239 crore and 14,075 crore c. Rs.48,068 crore and 16,025 crore d. Rs.45,002 crore and 15,225 crore e. Rs.48,068 crore and 15,225 crore.
(3 points)
53. The following information is available from National Income Accounts of a country:
Particulars (Million units of currency) Sales to households 5,000 Corporate profits 2,000 Corporate profit tax 800 Depreciation 600 Transfer payments 300 Dividends 200 Personal tax payments 200 GNP at factor cost 7,450
The savings made by the households during the year is a. 100 MUC b. 125 MUC c. 150 MUC d. 175 MUC e. 200 MUC.
(2 points)
54. Particulars (Million units of currency) Sales to government 1,500 Indirect taxes 700 Corporate profits 2,000 Corporate profit tax 800 Depreciation 600 Transfer payments 300 Dividends 200 Subsidies 50 Personal tax payments 200 Personal savings 150
355
© 2004
The Ic
fai U
nivers
ity P
ress.A
ll righ
ts res
erved
.ISBN : 8
1-314
-0227
-4 Ref.
No.
MACWB 04
2004
04
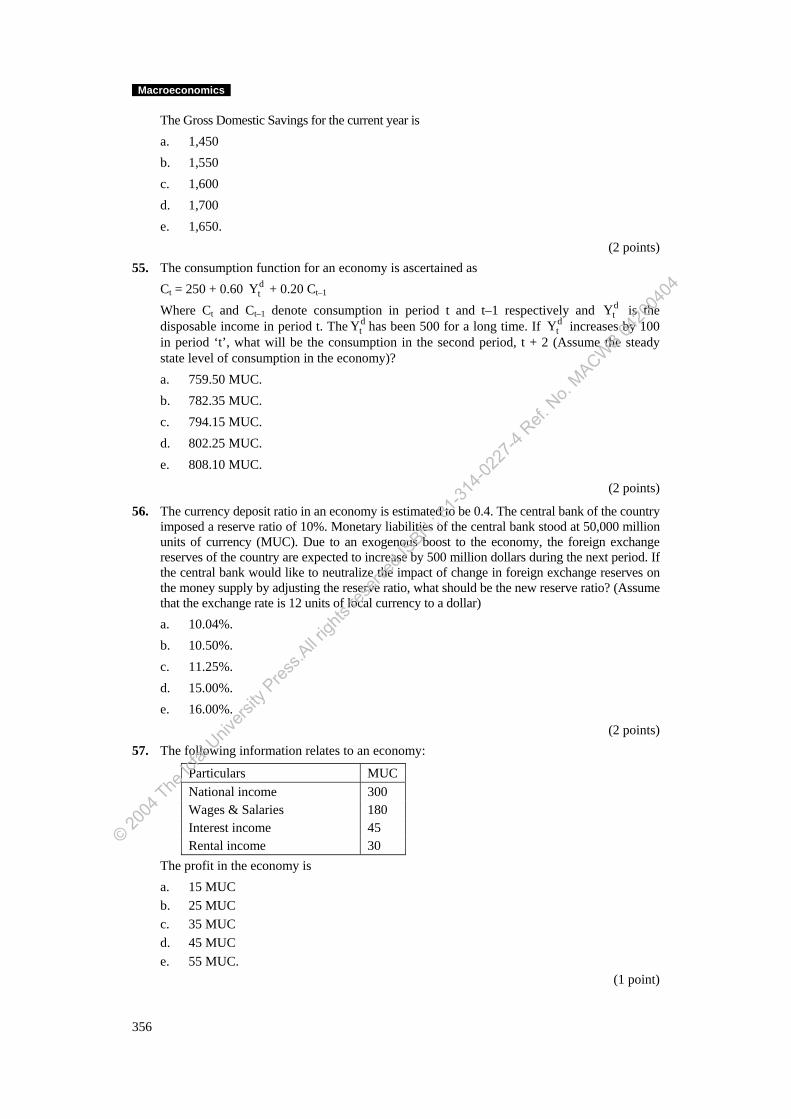
Macroeconomics
The Gross Domestic Savings for the current year is a. 1,450 b. 1,550 c. 1,600 d. 1,700 e. 1,650.
(2 points) 55. The consumption function for an economy is ascertained as Ct = 250 + 0.60 d
tY + 0.20 Ct–1
Where Ct and Ct–1 denote consumption in period t and t–1 respectively and is the disposable income in period t. The has been 500 for a long time. If increases by 100 in period ‘t’, what will be the consumption in the second period, t + 2 (Assume the steady state level of consumption in the economy)?
dtY
dtY d
tY
a. 759.50 MUC. b. 782.35 MUC. c. 794.15 MUC. d. 802.25 MUC. e. 808.10 MUC.
(2 points)
56. The currency deposit ratio in an economy is estimated to be 0.4. The central bank of the country imposed a reserve ratio of 10%. Monetary liabilities of the central bank stood at 50,000 million units of currency (MUC). Due to an exogenous boost to the economy, the foreign exchange reserves of the country are expected to increase by 500 million dollars during the next period. If the central bank would like to neutralize the impact of change in foreign exchange reserves on the money supply by adjusting the reserve ratio, what should be the new reserve ratio? (Assume that the exchange rate is 12 units of local currency to a dollar) a. 10.04%. b. 10.50%. c. 11.25%. d. 15.00%. e. 16.00%.
(2 points) 57. The following information relates to an economy:
Particulars MUC National income 300 Wages & Salaries 180 Interest income 45 Rental income 30
The profit in the economy is a. 15 MUC b. 25 MUC c. 35 MUC d. 45 MUC e. 55 MUC.
(1 point)
356
© 2004
The Ic
fai U
nivers
ity P
ress.A
ll righ
ts res
erved
.ISBN : 8
1-314
-0227
-4 Ref.
No.
MACWB 04
2004
04
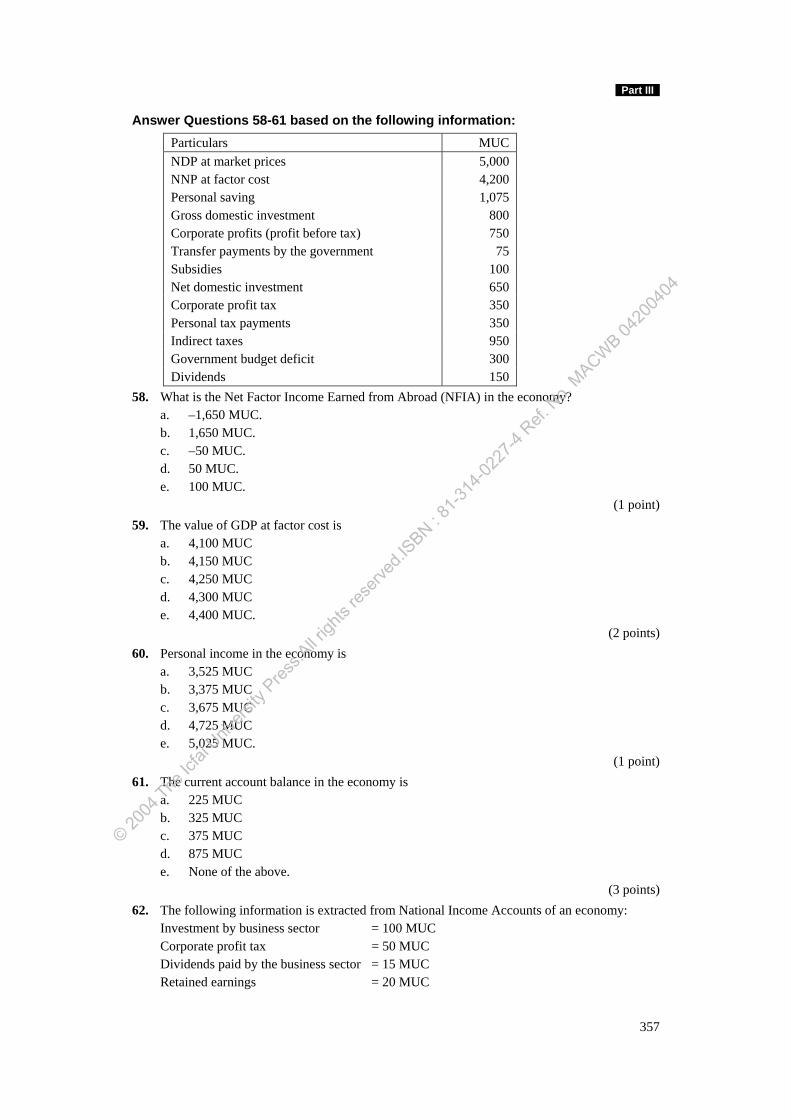
Part III
Answer Questions 58-61 based on the following information: Particulars MUC NDP at market prices 5,000 NNP at factor cost 4,200 Personal saving 1,075 Gross domestic investment 800 Corporate profits (profit before tax) 750 Transfer payments by the government 75 Subsidies 100 Net domestic investment 650 Corporate profit tax 350 Personal tax payments 350 Indirect taxes 950 Government budget deficit 300 Dividends 150
58. What is the Net Factor Income Earned from Abroad (NFIA) in the economy? a. –1,650 MUC. b. 1,650 MUC. c. –50 MUC. d. 50 MUC. e. 100 MUC.
(1 point) 59. The value of GDP at factor cost is
a. 4,100 MUC b. 4,150 MUC c. 4,250 MUC d. 4,300 MUC e. 4,400 MUC.
(2 points) 60. Personal income in the economy is
a. 3,525 MUC b. 3,375 MUC c. 3,675 MUC d. 4,725 MUC e. 5,025 MUC.
(1 point) 61. The current account balance in the economy is
a. 225 MUC b. 325 MUC c. 375 MUC d. 875 MUC e. None of the above.
(3 points) 62. The following information is extracted from National Income Accounts of an economy:
Investment by business sector = 100 MUC Corporate profit tax = 50 MUC Dividends paid by the business sector = 15 MUC Retained earnings = 20 MUC
357
© 2004
The Ic
fai U
nivers
ity P
ress.A
ll righ
ts res
erved
.ISBN : 8
1-314
-0227
-4 Ref.
No.
MACWB 04
2004
04
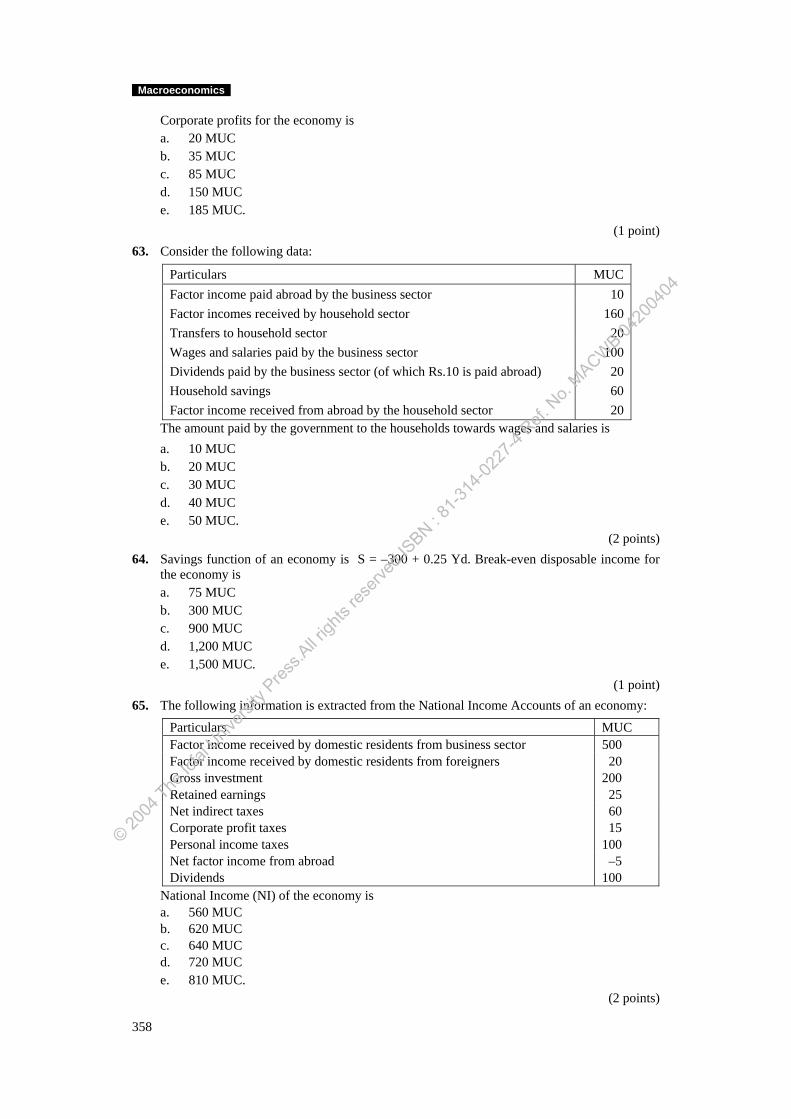
Macroeconomics
Corporate profits for the economy is a. 20 MUC b. 35 MUC c. 85 MUC d. 150 MUC e. 185 MUC.
(1 point) 63. Consider the following data:
Particulars MUC Factor income paid abroad by the business sector 10 Factor incomes received by household sector 160 Transfers to household sector 20 Wages and salaries paid by the business sector 100 Dividends paid by the business sector (of which Rs.10 is paid abroad) 20 Household savings 60 Factor income received from abroad by the household sector 20
The amount paid by the government to the households towards wages and salaries is a. 10 MUC b. 20 MUC c. 30 MUC d. 40 MUC e. 50 MUC.
(2 points) 64. Savings function of an economy is S = –300 + 0.25 Yd. Break-even disposable income for
the economy is a. 75 MUC b. 300 MUC c. 900 MUC d. 1,200 MUC e. 1,500 MUC.
(1 point) 65. The following information is extracted from the National Income Accounts of an economy:
Particulars MUC Factor income received by domestic residents from business sector 500 Factor income received by domestic residents from foreigners 20 Gross investment 200 Retained earnings 25 Net indirect taxes 60 Corporate profit taxes 15 Personal income taxes 100 Net factor income from abroad –5 Dividends 100
National Income (NI) of the economy is a. 560 MUC b. 620 MUC c. 640 MUC d. 720 MUC e. 810 MUC.
(2 points)
358
© 2004
The Ic
fai U
nivers
ity P
ress.A
ll righ
ts res
erved
.ISBN : 8
1-314
-0227
-4 Ref.
No.
MACWB 04
2004
04
Part III
66. The IS function and LM function of an economy are estimated to be Y = 2860 + 0.5Y – 60i and Y = 2600 + 400i respectively. The investment function in the economy is 800 – 50i. If the government wants to increase the output by 10% by raising the government expenditure, what is the crowding out in the economy? a. 52.5 MUC. b. 55.5 MUC. c. 62.5 MUC. d. 500.0 MUC. e. None of the above.
(2 points) 67. The money supply in an economy is estimated to be 250 MUC and the transaction ‘plus’
precautionary demand for money is 0.20Y. The speculative demand for money is 150 – 50i. If the income level in the economy is 700 the rate of interest in the economy is a. 0.7% b. 0.8% c. 0.9% d. 1.0% e. 1.2%.
(1 point) Answer Questions 68 and 69 based following information:
Year Nominal GNP GNP deflator 2001-02 5000 250 2002-03 6600 300
68. What is the growth rate of real GNP from year 2001-02 to 2002-03? a. 10.0%. b. 32.0%. c. 20.0%. d. 58.4%. e. 53.6%.
(1 point) 69. What is the rate of inflation in the economy for the year 2002-03?
a. 10.0%. b. 32.0%. c. 20.0%. d. 58.4%. e. 53.6%.
(1 point) 70. GDP of a country is 8000 MUC. Value of output produced in the domestic country by
foreign factors of production is 200 MUC and value of the output produced by domestic factors of production in foreign countries is 100. GNP of the country is a. 7,700 MUC b. 7,800 MUC c. 7,900 MUC d. 8,100 MUC e. 8,200 MUC.
(1 point) 71. The LM function of an economy is estimated to be Y = 750 –50i. The transaction demand for
money and speculative demand for money are 0.25Y and 150 – 20i respectively. If output in the economy is 600 MUC, the velocity of money in the economy is a. 0.40 b. 4.00 c. 5.00 d. 2.50 e. 250.00.
(3 points)
359
© 2004
The Ic
fai U
nivers
ity P
ress.A
ll righ
ts res
erved
.ISBN : 8
1-314
-0227
-4 Ref.
No.
MACWB 04
2004
04
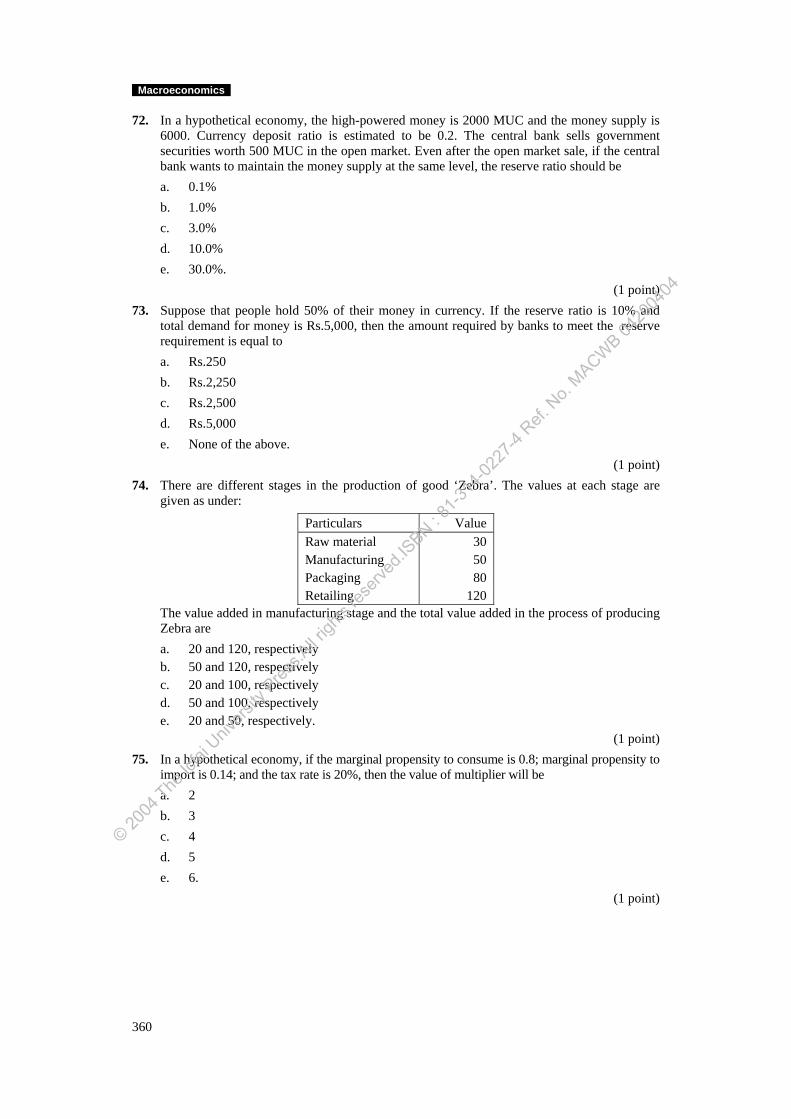
Macroeconomics
72. In a hypothetical economy, the high-powered money is 2000 MUC and the money supply is 6000. Currency deposit ratio is estimated to be 0.2. The central bank sells government securities worth 500 MUC in the open market. Even after the open market sale, if the central bank wants to maintain the money supply at the same level, the reserve ratio should be a. 0.1% b. 1.0% c. 3.0% d. 10.0% e. 30.0%.
(1 point) 73. Suppose that people hold 50% of their money in currency. If the reserve ratio is 10% and
total demand for money is Rs.5,000, then the amount required by banks to meet the reserve requirement is equal to a. Rs.250 b. Rs.2,250 c. Rs.2,500 d. Rs.5,000 e. None of the above.
(1 point) 74. There are different stages in the production of good ‘Zebra’. The values at each stage are
given as under:
Particulars Value Raw material 30 Manufacturing 50 Packaging 80 Retailing 120
The value added in manufacturing stage and the total value added in the process of producing Zebra are a. 20 and 120, respectively b. 50 and 120, respectively c. 20 and 100, respectively d. 50 and 100, respectively e. 20 and 50, respectively.
(1 point) 75. In a hypothetical economy, if the marginal propensity to consume is 0.8; marginal propensity to
import is 0.14; and the tax rate is 20%, then the value of multiplier will be a. 2 b. 3 c. 4 d. 5 e. 6.
(1 point)
360
© 2004
The Ic
fai U
nivers
ity P
ress.A
ll righ
ts res
erved
.ISBN : 8
1-314
-0227
-4 Ref.
No.
MACWB 04
2004
04
Macroeconomics
361
Model Question Paper II Suggested Answers Part A: Basic Concepts
1. (d) Increase in money supply reduces the interest rates but it may end up raising the nominal rates by increasing inflation.
2. (b) GNP = GDP + Net factor income from abroad. 3. (b) Potential GDP is the maximum feasible GDP of an economy when all the resources are
fully employed. 4. (e) Macroeconomics deals with the study of economy as a whole; it seeks to analyze the
sources of inflation, unemployment, economic growth. It also explains about the policies to be implemented for the achievement of macroeconomic objectives.
5. (a) In the Simple Keynesian model, movements of the economy from one equilibrium point to another can be gauged with the help of a single assumption that business firms raise production as soon as demand increases and that this results in an equivalent raise in income payments. Thus, the Simple Keynesian multiplier model is based on the principle that national output moves up and down in response to movements in aggregate demand.
6. (b) Real GNP is the GNP in current rupees deflated for the changes in the prices of items included in nominal GNP. [Hint: Real GNP = Nominal GNP/Price index].
7. (a) If the people decide to save less, MPS decreases. So MPC increases. [Hint: MPC = Y – MPS].
8. (d) According to the Keynesian model of output determination, GDP is in equilibrium when planned savings equals planned investment.
9. (a) Tax reductions induce more consumption, but decrease the government expenditure. If increase in the consumption is same as decrease in government expenditure then output won't change. So it is not always true that increase in personal consumption resulting from tax decreases would increase the real GDP.
10. (b) Sterilization is neutralization of changes in the money supply caused by changes in the foreign exchange reserves of a country.
11. (e) There are several factors which affect Aggregate supply such as change in the cost of production, supply shocks, technology, raw materials labor supply, etc. All the factors given affect the aggregate supply in an economy. Hence answer is (e).
12. (b) Philips curve shows the relationship between the inflation rate and unemployment rate. 13. (c) Increase in investment leads to efficiency in the use of resources and increase the rate of
economic growth. 14. (e) Keynes held that demand for money consists of i. Transaction demand for money ii. Precautionary demand for money and iii. Speculative demand for money Hence, the answer is (e). 15. (d) Since unemployment, inflation and the growth rate of GDP are all variables showing the
economy as a whole (in the macro sense) these are all macroeconomic variables. 16. (b) Personal income is the total income received by individuals that is available for
consumptions saving and payment of personal taxes. Personal income = National income – Retained earnings – Corporate taxes.
17. (c) A liquidity trap refers to a situation where lower interest rates fail to stimulate demand. It may arise when a slowing economy reduces demand for loans. Lenders see asset quality deteriorate and become more reluctant to lend. The combination of reluctant bankers and borrowers turns loan growth negative, which further depresses economic activity. During this period, interest rates do not decrease, no matter how much the money supply is expanded.
© 2004
The Ic
fai U
nivers
ity P
ress.A
ll righ
ts res
erved
.ISBN : 8
1-314
-0227
-4 Ref.
No.
MACWB 04
2004
04
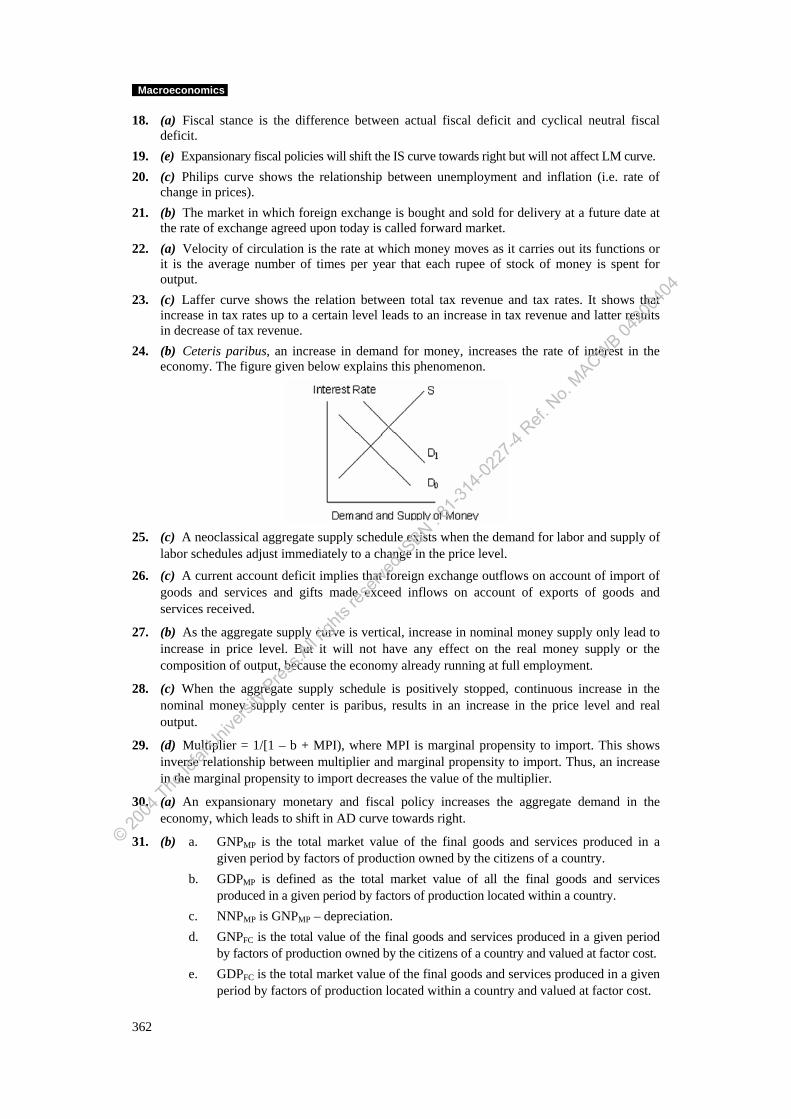
Macroeconomics
18. (a) Fiscal stance is the difference between actual fiscal deficit and cyclical neutral fiscal deficit.
19. (e) Expansionary fiscal policies will shift the IS curve towards right but will not affect LM curve. 20. (c) Philips curve shows the relationship between unemployment and inflation (i.e. rate of
change in prices). 21. (b) The market in which foreign exchange is bought and sold for delivery at a future date at
the rate of exchange agreed upon today is called forward market. 22. (a) Velocity of circulation is the rate at which money moves as it carries out its functions or
it is the average number of times per year that each rupee of stock of money is spent for output.
23. (c) Laffer curve shows the relation between total tax revenue and tax rates. It shows that increase in tax rates up to a certain level leads to an increase in tax revenue and latter results in decrease of tax revenue.
24. (b) Ceteris paribus, an increase in demand for money, increases the rate of interest in the economy. The figure given below explains this phenomenon.
25. (c) A neoclassical aggregate supply schedule exists when the demand for labor and supply of
labor schedules adjust immediately to a change in the price level.
26. (c) A current account deficit implies that foreign exchange outflows on account of import of goods and services and gifts made exceed inflows on account of exports of goods and services received.
27. (b) As the aggregate supply curve is vertical, increase in nominal money supply only lead to increase in price level. But it will not have any effect on the real money supply or the composition of output, because the economy already running at full employment.
28. (c) When the aggregate supply schedule is positively stopped, continuous increase in the nominal money supply center is paribus, results in an increase in the price level and real output.
29. (d) Multiplier = 1/[1 – b + MPI), where MPI is marginal propensity to import. This shows inverse relationship between multiplier and marginal propensity to import. Thus, an increase in the marginal propensity to import decreases the value of the multiplier.
30. (a) An expansionary monetary and fiscal policy increases the aggregate demand in the economy, which leads to shift in AD curve towards right.
31. (b) a. GNPMP is the total market value of the final goods and services produced in a given period by factors of production owned by the citizens of a country.
b. GDPMP is defined as the total market value of all the final goods and services produced in a given period by factors of production located within a country.
c. NNPMP is GNPMP – depreciation. d. GNPFC is the total value of the final goods and services produced in a given period
by factors of production owned by the citizens of a country and valued at factor cost. e. GDPFC is the total market value of the final goods and services produced in a given
period by factors of production located within a country and valued at factor cost.
362
© 2004
The Ic
fai U
nivers
ity P
ress.A
ll righ
ts res
erved
.ISBN : 8
1-314
-0227
-4 Ref.
No.
MACWB 04
2004
04
Part III
32. (a) Quantity theory of money (QTM) says MV = PY Where, M = money supply V = velocity of money P = price level Y = real GDP PY = nominal GDP Assuming V is a constant, a change in M leads to an equal percentage change in PY. 33. (d) Preparation of BoP statement is based on double-entry system of bookkeeping. Hence, all
debt items should equal credit items, and the balance is zero. 34. (b) Expected nominal interest rate = Real interest rate + Expected rate of inflation.
Therefore, if the expected inflation goes up, expected nominal rate of interest also goes up by the same amount. Hence the answer is (b).
35. (a) Y = C + I + G + Net Exports Where Y = Domestic income C + I + G = Domestic spending. Y – (C + I + G) = Net Exports (Current Account Balance) If Current Account Balance is negative, then domestic spending is greater than domestic income. ∴ The answer is (a). (b) If domestic income exceeds domestic spending, there is current account surplus. (c) Current account balance is equal to exports – imports. If exports exceed imports, there
is current account surplus. (d) If domestic savings exceed domestic investment, domestic income exceeds domestic
spending and there is current account surplus. 36. (e) Expansionary monetary policy will shift the LM curve to the right and contractionary
monetary policy will shift the LM curve to the left. Expansionary fiscal policies will shift the IS curve towards right but will not affect LM curve.
37. (c) Increase in net RBI credit to government is called Monetized deficit.
38. (d) M2 = M1 + Post office savings Bank Deposits M3 = M1 + Time Deposits M4 = M3 + All post office deposits. ∴ The answer is (d). 39. (d) a. During a boom bank reserves will be high as the bank credit is high to support the
increased economic activity. b. Wage rate will be high as demand for labor increase during the boom phase. c. As the economic activity increase during the boom phase bank credit also increases. d. During a boom demand increased at a faster rate and inventories tend to be low.
All other variables tend to increase during a boom. e. Cost of production will be high as demand for factors of production will be relatively
high during the boom phase. 40. (d) Financial Inter relations ratio
= AssetsPhysicalofStockTotalAssetsFinancialofStockTotal
Or
= FormationCapitalPhysicalNet
IssuedClaimsFinancialTotal
Therefore, the Answer is (d).
363
© 2004
The Ic
fai U
nivers
ity P
ress.A
ll righ
ts res
erved
.ISBN : 8
1-314
-0227
-4 Ref.
No.
MACWB 04
2004
04
Macroeconomics
Part B: Problems41. (c) NDP at market prices = Sales to households + Sales to government + Net investment +
Net exports (Current Account Balance)
= 5,000 + 1,500 + 1,200 – 200 = 7,500
Net Investment = Gross fixed investment + Change in inventories – Depreciation
= 1,300 + 500 – 600 = 1,200.
42. (a) GNP at factor cost = NDPMP + Depreciation – Indirect taxes + Subsides + Net factor income from abroad
= 7,500 + 600 – 700 + 50 + 0 = 7,450.
43. (e) S = –80 + 0.1875 Yd + 5i
C = 80 + 0.8125 Yd – 5i
Yd = (Y – T + R) = (Y – 0.2Y + 80)
= 0.8Y + 80
C = 80 + 0.8125 [0.8Y + 80] – 5i = 145 + 0.65Y – 5i.
IS Function
Y = C + I + G + (E – M)
= 145 +0.65Y – 5i + 600 + 0.05Y – 15i + 965 + 450 – (20 + 0.10Y)
= 2,140 + 0.60Y – 20i
Y = 0.40
20i2,140− = 5350 –50i .… (1)
LM Function
Money demand (Md) = 0.25Y + 200 – 50i
Money Supply = 600
∴ 600 = 0.25Y + 200 – 50i
0.25Y = 400 + 50i
Y = 1,600 + 200i .… (2)
Equilibrium Y and i can be found by equating (1) and (2)
∴ 5,350 – 50i = 1,600 + 200i
250i = 3,750
∴ i = 15%
Y = 5,350 – (50 x 15)
= 4,600.
44. (a) At equilibrium,
5,350 – 50i = 1,600 + 200i
250i = 3,750
i = 3,750/250 = 15
Hence, Y = 5,350 – 50 (15) = 4,600.
Trade balance = 450 – [20 + 0.10 (4,600) ] = – 30 MUC.
364
© 2004
The Ic
fai U
nivers
ity P
ress.A
ll righ
ts res
erved
.ISBN : 8
1-314
-0227
-4 Ref.
No.
MACWB 04
2004
04
Part III
45. (e) 0.4Y = 2,140 – 20i Y = 5,350 – 50i 0.25Y = 400 + 50i Y = 1,600 + 200i At equilibrium, 5,350 – 50i = 1,600 + 200i 250i = 3,750 Or, i = 15%. Hence, Y = 5,350 – 50(15) = 4,600. Budget deficit = T – G – R = 0.2(4,600) – 965 – 80. 920 – 965 – 80 = –125. If exports increase by 100, the new IS function would be 0.4Y = 2,140 + 100 – 20i 0.4Y = 2,240 – 20i Or, Y = 5,600 – 50i At equilibrium, IS = LM Thus, 5,600 – 50i = 1,600 + 200i 250i = 4,000 i = 16%. Y = 5,600 – 50(16) = 4,800 Thus, budget deficit = T – G – R = 0.2(4,800) – 965 – 80 = –85. Thus, decrease in budget deficit=125–85=40 MUC.
46. (b) issuesNewissuesSecondaryIR =
∴ Secondary issues for the year 2001= (0.70 x 12,000) = 8,400 (MUC) Total issues = New issues + Secondary issues = 12,000 + 8,400 = 20,400 (MUC)
FIR = (NPCF)FormationCapitalPhysicalNet
IssuesTotal
∴ NPCF = 1.20
20,400 = 17,000 (MUC).
47. (b) Decrease in FR indicates decreased financial deepening of the economy. That is, financial development of the country is less than the overall economic development of the country during the period.
Decline in IR indicates financial disintermediation in the economy. That is, ultimate users of funds directly access funds from ultimate savers, thereby avoiding financial intermediaries like banks and financial institutions.
48. (c) Intermediation ratio = Secondary issues/ Primary issues New issues ratio = Primary issues/Net capital formation = 0.74 Thus, 0.74 = x/2,00,445 Or, x = 1,48,329.3 Hence, intermediation ratio = 1,15,605/1,48,329.3 = 0.78 approximately.
365
© 2004
The Ic
fai U
nivers
ity P
ress.A
ll righ
ts res
erved
.ISBN : 8
1-314
-0227
-4 Ref.
No.
MACWB 04
2004
04
Macroeconomics
49. (c) Money Supply (Ms) = H x ⎥⎦
⎤⎢⎣
⎡+
+rCu
Cu1
Where, High Powered Money (H) = Monetary Liabilities of RBI (MLRBI) + Government money.
H =
⎥⎦
⎤⎢⎣
⎡+
+rCu
Cu1Ms =
⎥⎦
⎤⎢⎣
⎡++
0.100.20.21
12,000 = 3,000 MUC
Since Government money is negligible, H equals MLRBI. MLRBI = Financial Assets of RBI (FARBI) + Other Assets – Non-monetary
Liabilities (NMLRBI). FARBI = Credit to Government + Credit to Commercial Sector + Credit to
banking sector + Net Foreign Exchange Assets (NFEA). = 1,500 + 800 + 1,200 + NFEA = 3,500 + NFEA. NMLRBI = Net Worth + Government Deposits + Other Non-Monetary Liabilities = 1,000 + 100 + 200 = 1,300 MUC. ∴ 3,000 = 3,500 + NFEA + 300 – 1,300 NFEA = 3,000 – 2,500 = 500 MUC. Therefore, net foreign exchange assets of the country are 500 MUC. 50. (b) H = 3,000 Ms = 12,000 Cu = 0.2 Reserve Ratio = CRR + Excess Reserve Ratio = 0.1 + 0.1 = 0.2 Thus, the new money supply in the market = H x Money multiplier = 3,000 x (1 + 0.2)/(0.2 + 0.2)
= 9,000 MUC. 51. (e)
US $ Millions
A. Current Account Credit Debit Net
i. Merchandise 4489 59264 (1437)
ii. Invisibles (a + b) 34762 22656 12106
a. Services 19185 16392 2793
b. Transfers and Income 15577 6264 9313
Total current Account (i + ii) 79656 81920 (2264)
B. Capital Account
i. Foreign investment 12617 9706 2911
ii. Loans 23076 18545 4531
iii. Other capital 16133 16088 45
Total Capital Account (i + ii + iii)
51826 44339 7487
C. Errors and Omissions 633 - 633
D. Overall Balance (A + B +C) 132115 126259 5856
E. Foreign Exchange Reserves - 5856 (5856)
366
© 2004
The Ic
fai U
nivers
ity P
ress.A
ll righ
ts res
erved
.ISBN : 8
1-314
-0227
-4 Ref.
No.
MACWB 04
2004
04
Part III
52. (c) Revenue Surplus (Deficit) = Revenue Receipts – Revenue Expenditure = [Tax Revenue + Non-tax Revenue] – [Plan and Non-plan Revenue Expenditure] = [(1,16,857 + 45,137) – (1,66,301 + 43,761)] = Rs. (48,068) million.
Primary Deficit = Borrowings and liabilities –Interest payments = 91,025 – 75,000 = Rs. 16,025 million. 53. (c) Personal Savings = Personal Disposable Income (PDI) – Personal Consumptions PDI = Personal Income (PI) – Personal Income Tax PI = NNPFC – Corporate profits + Dividends + Transfer payments NNPFC = GNPFC – Depreciation = 7,450 – 600 = 6,850 MUC PI = 6,850 – 2,000 + 200 + 300 = 5,350 MUC PDI = 5,350 – 200 = 5,150 MUC
Personal Savings = 5,150 – 5,000 = 150 MUC. 54. (c) Gross Domestic Savings = Retained earnings (RE) + Budget surplus + Personal savings +
Depreciation.
RE = Corporate Profits–Corporate Profit tax – Dividends = 2,000 – 800 – 200 = 1,000 MUC
BS = Tax Revenue – Government Purchases – Transfer Payments – Subside = (700 + 800 + 200) – 1,500 – 300 – 50 = –150 MUC
∴ Gross Domestic Savings = 1,000 – 150 + 150 + 600 = 1,600 MUC.
55. (a) Ct = 250 + 0.60 + 0.20 CdtY t – 1
At steady state level of consumption. Ct = Ct-1
∴ At steady state level of consumption.
Ct = 250 + 0.60 + 0.20 CdtY t
0.80 Ct = 250 + 0.60 dtY
Ct = 0.80
0.60Y250 dt+
= 312.5 + 0.75 . dtY
When = 500 dtY
Ct = 312.5 + (0.75 x 500) = 687.5 MUC
If increase by 100, dtY
Ct+1 = 250 + (0.60 x 600) + (0.20 x 687.5) = 747.50 MUC Ct+2 = 250 + (0.60 x 600) + (0.20 x 747.50) = 759.50 MUC. ∴ Consumption in the second period, Ct+2, is 759.50. 56. (e) Money multiplier = {(1 + 0.4)/(0.4 + 0.10)} = 2.8
Money supply (before increase of foreign exchange reserves) = 2.8 x H = 2.8 x (50000) = 140,000. Computation of new CRR: 140,000 = {(1 + 0.4)/(0.4 + r)} (50000 + 500 × 12) 140,000 = {1.4/(0.4 + r)} × 56000 0.4 + r = (1.4 x 56000/140,000) or, r = 0.56 – 0.4 = 0.16 =16%.
367
© 2004
The Ic
fai U
nivers
ity P
ress.A
ll righ
ts res
erved
.ISBN : 8
1-314
-0227
-4 Ref.
No.
MACWB 04
2004
04
Macroeconomics
57. (d) National income (NNP at FC) = wages & salaries + interest income + rental income + profit Or, Profit = 300 – 180 – 45 – 30 = 45 MUC.
58. (d) NFIA = NNPMP – NDPMP NNPMP = NNPFC + Indirect Taxes – Subsidies = 4,200 + 950 – 100 = 5,050 MUC Thus, NFIA = 5,050 – 5,000 = 50 MUC.
59. (d) GDPFC = NDPMP + Depreciation – Indirect Taxes + Subsidies 5000 + (800 – 650) – 950 + 100 = 4,300 MUC.
60. (c) Personal Income (PI) (i.e. income received by the households) = NI – Corporate profit + Dividends + Transfer payments = 4,200 – 750 + 150 + 75 = 3,675 MUC.
61. (c) Current account balance (CAB) = Net Domestic Savings (NDS) – Net Domestic Investment (NDI) NDS = Retained Earnings (RE) + Budget surplus + PS RE = Corporate Profits – Corporate Profit Tax – Dividends = 750 – 350 – 150 = 250 Thus, NDS = 250 – 300 + 1,075 = 1,025 MUC. Thus, CAB = 1,025 – 650 = 375 (surplus).
62. (c) Corporate profits = Corporate profit tax + Dividends + Retained earnings = 50 + 15 + 20 = 85.
63. (c) Wages and salaries paid by the government = Factor income received by households – (Wages and salaries paid by the business sector + Dividends paid to households + Factor income received from abroad) = 160 – 100 – 10 – 20 = 30.
64. (d) At break-even level of disposable income, savings are zero. ∴ S = – 300 + 0.25Yd = 0
0.25 Yd = 300
Yd = 25.0
300 = 1,200 MUC.
65. (a) National income (NI) = Factor income received by domestic residents + Factor income received by domestic residents from foreigners + Corporate profit taxes + Retained earnings = 500 + 20 + 15 + 25 = 560 MUC.
66. (c) At simultaneous equilibrium, 0.5Y = 2860 – 60i (or) Y = 5720 – 120i is equal to Y = 2600 + 400i Or, 5720 – 120i = 2600 + 400i Or, 3120 = 520i Or, i = 6 Thus, Y = 2600 + 400(6) = 5000 When government spending is raised to meet the objective, Y = 5000 + 10% = 5500. If Y = 5500, then using LM function, 400i = 5500 – 2600 (or) i = 7.25% Initial investment = 800 – 50 (6) = 500 New investment = 800 – 50 (7.25) = 437.5 Change in investment = 500 – 437.5 = 62.5 MUC.
67. (b) Money supply = Money demand = (Transaction-cum-precautionary demand for money + speculative demand for money) Thus, 250 = (0.2 x 700) + (150 – 50i) Or, 110 = 150 – 50i Or, 50i = 40 Or, i = 0.8%.
368
© 2004
The Ic
fai U
nivers
ity P
ress.A
ll righ
ts res
erved
.ISBN : 8
1-314
-0227
-4 Ref.
No.
MACWB 04
2004
04
Part III
68. (a) Growth rate of real GNP = {(Real GNP 2002-03/Real GNP 2001-02) – 1} x 100 Real GNP 2002-03 = 6600 x 100/300 = 2200 Real GNP 2001-02 = 5000 x 100/250 = 2000 Growth rate = {(2200/2000) – 1} x 100 = 10%.
69. (c) Inflation rate = (GNP deflator of current period – GNP deflator of previous year) ‘divided by’ GNP deflator of previous year x 100 = (300/250 – 1) x 100 = 20%.
70. (c) GNP = GDP + NFIA NFIA = Factor income received from abroad – Factor income paid abroad. = 100 – 200 = – 100 ∴ GNP = 8000 – 100 = 7900 MUC.
71. (d) Velocity of money = Y/Ms Money supply (Ms) = Money demand (Md) = 0.25(600) + 150 – 20(3) = 240 Ms = 240 Thus, velocity of money = 600/240 = 2.5 (Working notes: Y = 600 = 750 – 50i Or, i = 150/50 = 3).
72. (d) Money supply (Ms) = High-powered money (H) x {(1 + Cu)/(Cu + r)} 6000 = (2000 - 500) {(1 + 0.2)/(0.2 + r) Or, r = 10%.
73. (a) Total money = Rs.5,000. 50% of total money which is held in the form of currency is Rs.2,500. Demand deposit component of money supply is Rs.2,500. Given the reserve ratio of 10%, required reserves are 2,500 × 0.10 = Rs.250.
74. (a) Total value added in the process = Market value of the final product = 120 Value added in the manufacturing stage = Total value of the good after manufacturing stage – Total cost for procuring raw-material = 50 – 30 = 20.
75. (a) Multiplier = 1/(1 – MPC + MPC x tax rate + MPI) = 1/(1 – 0.8 + 0.8 x 0.2 + 0.14) = 2.
369
© 2004
The Ic
fai U
nivers
ity P
ress.A
ll righ
ts res
erved
.ISBN : 8
1-314
-0227
-4 Ref.
No.
MACWB 04
2004
04

Model Question Paper III Time: 3 Hours Total Points: 100
Part A: Basic Concepts (40 Points)
Answer all the questions. Each question carries one point.
1. Ceteris paribus, if government expenditure increases
a. The output is likely to fall
b. The private investment is likely to fall because of increase in interest rate
c. The private investment is likely to increase because of fall in interest rate
d. The trade deficit is likely to come down
e. None of the above.
2. What are economic goods?
a. Goods that are very expensive.
b. Goods that are in scarce or limited supply.
c. Goods that a country produces and then trades to another country.
d. Goods that are vital to an individual’s welfare.
e. All of the above.
3. Which of the following could be an objective of monetary policy?
a. Change the prevailing interest rate.
b. Lower the inflation rate.
c. Lower the unemployment rate.
d. Both (a) and (b) above.
e. All of the above.
4. For an economy operating below its potential, the effect on GDP of an increase in intended investment will normally be
a. An increase in output is greater than the increase in investment
b. Nothing at all, unless savings also increase at once, since investment and savings must always be equal
c. Nothing at all, since consumption must go down by as much as investment goes up
d. An increase in output equal to the amount of investment
e. An increase in output has less than the amount of investment.
5. Suppose that government spending rises. Assume that the economy is operating at a level slightly below the level of potential GDP. The effect of this policy change should be
a. Higher prices with no change in output b. Higher prices with higher output c. Higher prices with lower output d. Lower prices with higher output e. Lower prices with no change in output.
© 2004
The Ic
fai U
nivers
ity P
ress.A
ll righ
ts res
erved
.ISBN : 8
1-314
-0227
-4 Ref.
No.
MACWB 04
2004
04
Part III
6. Which of the following is least applicable to the concept of NDP? a. A measure of output. b. A market value of final goods and services. c. The sum of all transactions involving money in an economy. d. A measure of income. e. GDP minus depreciation. 7. Internal balance refers to a. Equilibrium in balance of payments b. Balanced budget of government c. Domestic savings being equal to domestic investment d. Full employment level of output e. Aggregate demand being equal to aggregate supply. 8. Which of the following statements is false? a. Increases in output can cause increases in investment. b. Increases in saving can cause increases in current output. c. Increases in investment can cause increases in output. d. Decreases in taxes can cause increases in output. e. Decreases in government spending can cause decreases in output. 9. The definition of M1 includes a. Coins, currency and time deposits b. Coins, currency and demand deposits c. Coins, currency and all bank deposits d. All currencies, both in banks and in the hands of the public e. Coins and currency only. 10. Raising the discount rate, if effective, tends to
a. Expand the money supply and lower interest rates
b. Expand the money supply and raise interest rates
c. Contract the money supply and raise interest rates
d. Contract the money supply and lower interest rates
e. Expand the money supply with same interest rates.
11. The demand for money is
a. Positively related to the income level and the rate of interest
b. Negatively related to the income level and the rate of interest
c. Negatively related to the income level and positively related to the rate of interest
d. Positively related to the income level and negatively related to the rate of interest
e. None of the above.
12. Which of the following situations would you expect to see during a period of recession?
a. Falling tax receipts.
b. Falling corporate profits.
c. Falling stock prices.
d. Falling business investment.
e. All of the above.
371
© 2004
The Ic
fai U
nivers
ity P
ress.A
ll righ
ts res
erved
.ISBN : 8
1-314
-0227
-4 Ref.
No.
MACWB 04
2004
04
Macroeconomics
13. GDP differs from NDP by a. The amount of total taxes b. Government expenditure on goods and services c. Government transfer payments d. The difference between gross investment and net investment e. Purchases by business firms from other business firms.
14. The “marginal propensity to save” can be described as a. The desire to save more and consume less b. The fraction of extra income that goes into extra savings c. The fraction of extra income that fluctuates between consumption and savings d. The conditioned reflex or habit to be thrifty e. The fraction of total income that is saved.
15. A tax is regressive if
a. The percentage of income paid as taxes increases as income increases
b. The percentage of income paid as taxes decreases as income increases
c. The absolute amount of tax paid is directly proportional to income
d. The tax rate is constant
e. None of the above.
16. GDP at factor cost exceeds GDP at market price
a. When the factor income from abroad is negative
b. When the factor income from abroad is positive
c. When depreciation on fixed capital exceeds income from investment
d. When direct taxes exceed indirect taxes
e. When subsidies exceed indirect taxes.
17. In which market simultaneous spot and forward contract are entered into by two parties? a. Euro currency market. b. Forward market. c. Future market. d. Spot market. e. Swap market.
18. When the value of output exceeds planned spending a. There is unsold output, and the level of income will fall b. There is unsold output, and the level of income will rise c. There is no unsold output, and the level of income does not change d. Any of the above can happen e. None of the above.
19. Which of the following is/are true? a. The tax revenue will be zero when tax rate is zero. b. The tax revenue will be zero when tax rate is 100%. c. The tax revenue will be highest when tax rate is 100%. d. Laffer curve takes ‘U’ shape when tax rate and tax revenue are taken on X and Y axes
respectively. e. Both (a) and (b) above.
372
© 2004
The Ic
fai U
nivers
ity P
ress.A
ll righ
ts res
erved
.ISBN : 8
1-314
-0227
-4 Ref.
No.
MACWB 04
2004
04
Part III
20. An increase in the marginal propensity to import a. Has the same effect upon the multipliers as an increase in the MPC b. Has no effect upon the multipliers c. Increases the value of the multipliers d. Decreases the value of the multipliers e. None of the above. 21. Which of the following relationships is not true? a. NDP at Factor Cost = GDP at Factor Cost + Depreciation. b. GDP at Market Prices = GDP at Factor Cost + Indirect Taxes – Subsidies. c. Net Domestic Saving = Net National Saving + Retained Earnings of Foreign Companies. d. Gross Domestic Capital Formation = Gross Fixed Investment + Change in Inventories. e. None of the above. 22. In the IS-LM model of income determination, an increase in the propensity to save leads to a a. Rightward shift of the LM curve b. Rightward shift of the IS curve c. Leftward shift of the LM curve d. Leftward shift of the IS curve e. None of the above. 23. In the demand for money function we include a. Nominal income and nominal interest rate b. Real income and real interest rate c. Real income and nominal interest rate d. Nominal income and real interest rate e. None of the above. 24. When investment spending is negatively related to the rate of interest, equilibrium income in
the goods market a. Is unrelated to the rate of interest b. Is inversely related to the rate of interest c. Is positively related to the rate of interest d. Falls as the rate of interest decreases e. None of the above. 25. Which of the following theories is called as the Neoclassical theory of interest? a. The Keynesian Theory. b. Liquidity Preference Theory. c. The Time Preference Theory. d. Expectations Theory. e. Loanable Fund Theory. 26. Which of the following is not included in gross investment? a. Business and residential construction. b. Expenditures on consumer goods. c. Additions to business inventory. d. Expenditures on machinery. e. All of the above.
373
© 2004
The Ic
fai U
nivers
ity P
ress.A
ll righ
ts res
erved
.ISBN : 8
1-314
-0227
-4 Ref.
No.
MACWB 04
2004
04
Macroeconomics
27. When the actual rate of inflation turns out to be higher than expected a. Borrower will gain b. Lender will gain c. The gain depends on the extent of difference between the actual rate of inflation and the
expected rate of inflation d. Both (a) and (c) above e. None of the above.
28. The value of the expenditure multiplier relates a. The change in income to the change in autonomous spending b. The change in autonomous spending to the change in income c. The change in consumption to the change in income d. The change in income to the change in consumption e. None of the above. 29. A situation in which the marginal physical productivity of labor is zero is known as a. Seasonal unemployment b. Cyclical unemployment c. Disguised unemployment d. Structural unemployment e. Voluntary unemployment. 30. Which budget calculates the effect of business cycle on budget? a. Structural budget. b. Revenue budget. c. Capital budget. d. Cyclical budget. e. None of the above. 31. The IS curve shows a. A positive relationship between rate of interest and level of income b. A negative relationship between rate of interest and level of income c. A positive relationship between rate of interest and level of investment d. A negative relationship between rate of interest and level of investment e. A positive relationship between level of income and level of investment. 32. Laffer curve shows the relationship between a. Price level and unemployment b. Tax rates and tax revenue c. Interest rate and income level d. Income and money supply e. Demand for money and supply of money. 33. The real rate of interest a. Equals the nominal rate plus the rate of inflation b. Equals the rate of inflation minus the nominal rate c. Equals the nominal rate minus the rate of inflation d. Tends to increase when inflation rises e. Is more relevant to investors than consumers.
374
© 2004
The Ic
fai U
nivers
ity P
ress.A
ll righ
ts res
erved
.ISBN : 8
1-314
-0227
-4 Ref.
No.
MACWB 04
2004
04
Part III
34. Money earned abroad and remitted to home country is a. Included in home country GDP b. Included in home country GNP c. Included in both home country GDP and GNP d. Excluded from both home country GDP and GNP e. Included in home country GDP but excluded from home country GNP. 35. The basic difference between money stock measures M3 and M4 is that a. M3 is more than M4
b. M2 is part of M3 where as M2 is not part of M4
c. M3 is part of M1 and M4 is not part of M1
d. M4 includes all post office deposits, where as in M3 these are not included e. M1 is part of M4 where as M1 is not part of M3. 36. GDP at factor cost exceeds GDP at market price a. When the net factor income from abroad is negative b. When the net factor income from abroad is positive c. When depreciation of fixed capital exceeds gross investment d. When direct taxes exceed indirect taxes e. When subsidies exceed indirect taxes. 37. National Income is a. NDP at market prices b. NNP at market prices c. NDP at factor cost d. NNP at factor cost e. GNP at market price. 38. Which of the following is not a stock variable? a. Foreign exchange reserves. b. Public debt. c. Wealth of a country. d. Inflation. e. Money supply. 39. If interest elasticity of demand for investment and consumption is zero a. Equilibrium income depends solely on the position of LM curve b. Equilibrium income depends solely on the position of IS curve c. There is no speculative demand for money d. Speculative demand for money is infinity e. Fiscal policy is totally ineffective in changing any of the real variables. 40. ‘Liquidity trap’ refers to a situation wherein a. There is too much liquidity in the economy b. The firms in the economy are facing credit crunch c. Interest rates does not decrease, no matter how much the money supply is expanded d. The country faces severe shortage of foreign exchange e. Excessive government borrowing reduces the availability of credit in the market.
375
© 2004
The Ic
fai U
nivers
ity P
ress.A
ll righ
ts res
erved
.ISBN : 8
1-314
-0227
-4 Ref.
No.
MACWB 04
2004
04
Macroeconomics
Part B: Problems (60 Points)
Solve all the problems. Points are indicated against each problem. 41. The following balances are taken from balance sheet of the Central Bank of an economy.
Particulars MUC Credit to Government 950 Credit to Bank 350 Government Deposits 20 Other non-monetary liabilities 5 Net worth 500 Credit to commercial sector 125 Net foreign exchange assets 25 Other assets 65
The currency/deposit ratio has been ascertained as 0.20. The amount of Government money is 10 million units of currency. Total money supply in the economy is 4000 million units of currency. The reserve ratio imposed by the Central Bank is
a. 9% b. 10% c. 11% d. 11.5% e. 12%.
(3 points) 42. The monetary liabilities of the RBI and the government money in circulation are Rs.990
MUC and 10 MUC respectively. The currency deposit ratio is estimated to be 20%. If there is an increase of 100 MUC in Central Bank Credit to Government, accompanied by Government purchase of foreign exchange worth 10 MUC from the RBI, what would be the money supply in the economy? (Assume reserve ratio is 10%)
a. 4,340 MUC. b. 4,350 MUC. c. 4,360 MUC. d. 4,370 MUC. e. 4,380 MUC.
(2 points) 43. The following relations are derived for an economy.
Saving function (S) –100 + 0.25YdInvestment function (I) 400 – 15i Tax function (T) 0.20 Y Government expenditure (G) 900 Transaction demand for money (Mt) 0.25Y Speculative demand for money (Ma) 250 – 50i Money supply 600 Exports (E) 500 Import function (M) 50 + 0.10Y
All macroeconomic aggregates are in million units of currency (MUC) and the rate of interest is in percentage. What is the budget deficit of the economy at equilibrium?
a. 200 MUC. b. 210 MUC. c. 215 MUC. d. 220 MUC. e. 225 MUC.
(3 points)
376
© 2004
The Ic
fai U
nivers
ity P
ress.A
ll righ
ts res
erved
.ISBN : 8
1-314
-0227
-4 Ref.
No.
MACWB 04
2004
04
Part III
44. The IS function and LM function of an economy are 0.5Y = 1850 – 15i and 0.25Y = 350 + 50i. If exports increase by 200 and autonomous imports decrease by 30 MUC, the new equilibrium income and budget deficit are
a. 3,800 MUC and 140 MUC b. 3,750 MUC and 150 MUC c. 3,750 MUC and 160 MUC d. 3,800 MUC and 170 MUC e. 3,800 MUC and 180 MUC.
(3 points) 45. In an economy, the equilibrium functions in goods market and money market are Y = 3,700 – 30i
and Y = 1,400 + 200i. The investment function in the economy is 400 – 15i and the net exports is 450 – 0.1Y. Suppose autonomous investment increased by 230 MUC, then what would be the impact on trade balance and private investment in the economy?
a. TB decreases by 30 MUC and private investment decreases by 15 MUC. b. TB decreases by 40 MUC and private investment decreases by 15. c. TB decreases by 30 MUC and private investment decreases by 20 MUC. d. TB decreases by 40 MUC and private investment decreases by 20 MUC. e. None of the above.
(3 points) 46. In an economy which has a capital-output ratio of 5:1, population is expected to grow at the
rate of 2 percent p.a. If the targeted per capita real GDP growth rate is 4 percent, then the rate of investment (i.e. investment as % of GDP) required to achieve the target is
a. 25% b. 30% c. 35% d. 40% e. None of the above.
(3 points) 47. The following information is extracted from the union budget for the year 2001-02.
Particulars In crore of rupee Tax revenues 2,92,418 Non-tax revenues 1,14,928 Recoveries of loans 27,078 Borrowings and other liabilities 2,24,550 Other receipts (of which disinvestment proceeds committed for redemption of public debt 2,000 cr.) 20,000 Non-plan revenue expenditure (including interest payments of Rs.2,02,532 4,57,536 Non-plan capital expenditure 43,238 Planned revenue expenditure 1,04,660 Planned capital expenditure 71,540
The revenue and capital surplus (deficit) of the economy are a. (Rs.1,54,850) crore and Rs.1,56,850 crore b. (Rs.1,54,850) crore and Rs.1,54,850 crore c. (Rs.1,56,850) crore and Rs.1,56,850 crore d. (Rs.1,56,850) crore and Rs.1,56,850 crore e. None of the above.
(3 points)
377
© 2004
The Ic
fai U
nivers
ity P
ress.A
ll righ
ts res
erved
.ISBN : 8
1-314
-0227
-4 Ref.
No.
MACWB 04
2004
04
Macroeconomics
48. The borrowings and other liabilities of a hypothetical economy is Rs.2,24,550. The capital receipts (incl. disinvestment proceeds committed for redemption of public debt Rs.2,000) is Rs.20,000. Suppose the non-plan revenue expenditure of Rs.4,57,536 includes interest payments of Rs.2,02,532, then the primary and fiscal deficit for the year 2001-02 are
a. Rs.22,018 and Rs.2,24,550 respectively b. Rs.10,231 and Rs.2,24,550 respectively c. Rs.10,011 and Rs.1,11,399 respectively d. Rs.10,231 and Rs.1,11,399 respectively e. Rs.10,011 and Rs.1,11,409 respectively.
(2 points) 49. The following information pertains to the balance of payments of country X for the year 2001.
Particulars MUC Merchandize imports 20,000 Merchandize exports 18,000 Export of services, including travel and transportation 16,000 Import of services, including travel and transportation 12,000 Earnings of loans and investments abroad 400 Earnings of loans and investments in country X by foreigners 1,000 Private remittances to abroad 100 Private remittances from abroad 150 Government loans to abroad 50 Government loans from abroad 20
What is the current account balance of country X for the year 2001?
a. 1,400 Cr.
b. 1,450 Dr.
c. 1,400 Dr.
d. 1,450 Cr.
e. 1,600 Cr.
(2 points)
50. The following information pertains to the balance of payments of country Y for the year 2001.
Particulars MUC Earnings of loans and investments abroad 400 Earnings of loans and investments in country Y by foreigners 1,000 Government loans to abroad 50 Government loans from abroad 20 Direct investments abroad 30 Foreign direct investment in country Y 150 Short-term loans and investments abroad 300 Foreign short-term loans and investments in country Y 40
What is the capital account balance of country X for the year 2001?
a. (150) MUC.
b. (160) MUC.
c. (170) MUC.
d. (180) MUC.
e. (190) MUC.
(2 points)
378
© 2004
The Ic
fai U
nivers
ity P
ress.A
ll righ
ts res
erved
.ISBN : 8
1-314
-0227
-4 Ref.
No.
MACWB 04
2004
04
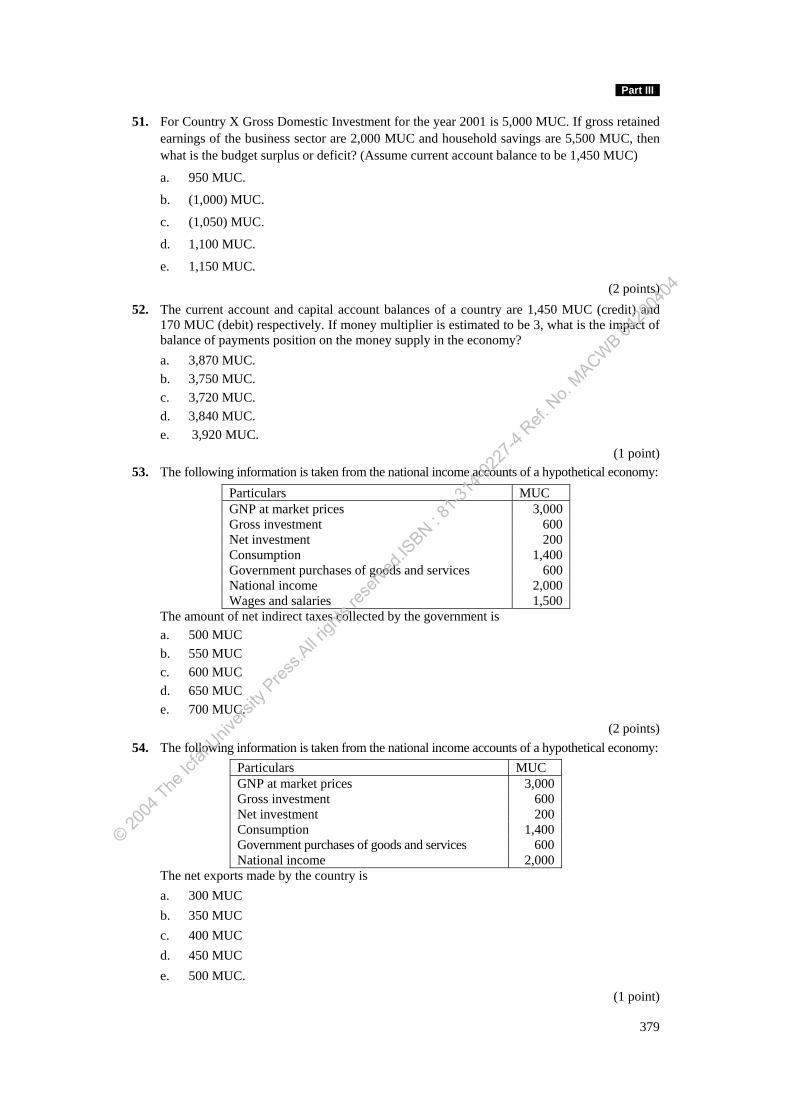
Part III
51. For Country X Gross Domestic Investment for the year 2001 is 5,000 MUC. If gross retained earnings of the business sector are 2,000 MUC and household savings are 5,500 MUC, then what is the budget surplus or deficit? (Assume current account balance to be 1,450 MUC)
a. 950 MUC.
b. (1,000) MUC.
c. (1,050) MUC.
d. 1,100 MUC.
e. 1,150 MUC.
(2 points) 52. The current account and capital account balances of a country are 1,450 MUC (credit) and
170 MUC (debit) respectively. If money multiplier is estimated to be 3, what is the impact of balance of payments position on the money supply in the economy?
a. 3,870 MUC. b. 3,750 MUC. c. 3,720 MUC. d. 3,840 MUC. e. 3,920 MUC.
(1 point) 53. The following information is taken from the national income accounts of a hypothetical economy:
Particulars MUC GNP at market prices 3,000 Gross investment 600 Net investment 200 Consumption 1,400 Government purchases of goods and services 600 National income 2,000 Wages and salaries 1,500
The amount of net indirect taxes collected by the government is a. 500 MUC b. 550 MUC c. 600 MUC d. 650 MUC e. 700 MUC.
(2 points) 54. The following information is taken from the national income accounts of a hypothetical economy:
Particulars MUC GNP at market prices 3,000 Gross investment 600 Net investment 200 Consumption 1,400 Government purchases of goods and services 600 National income 2,000
The net exports made by the country is a. 300 MUC b. 350 MUC c. 400 MUC d. 450 MUC e. 500 MUC.
(1 point)
379
© 2004
The Ic
fai U
nivers
ity P
ress.A
ll righ
ts res
erved
.ISBN : 8
1-314
-0227
-4 Ref.
No.
MACWB 04
2004
04
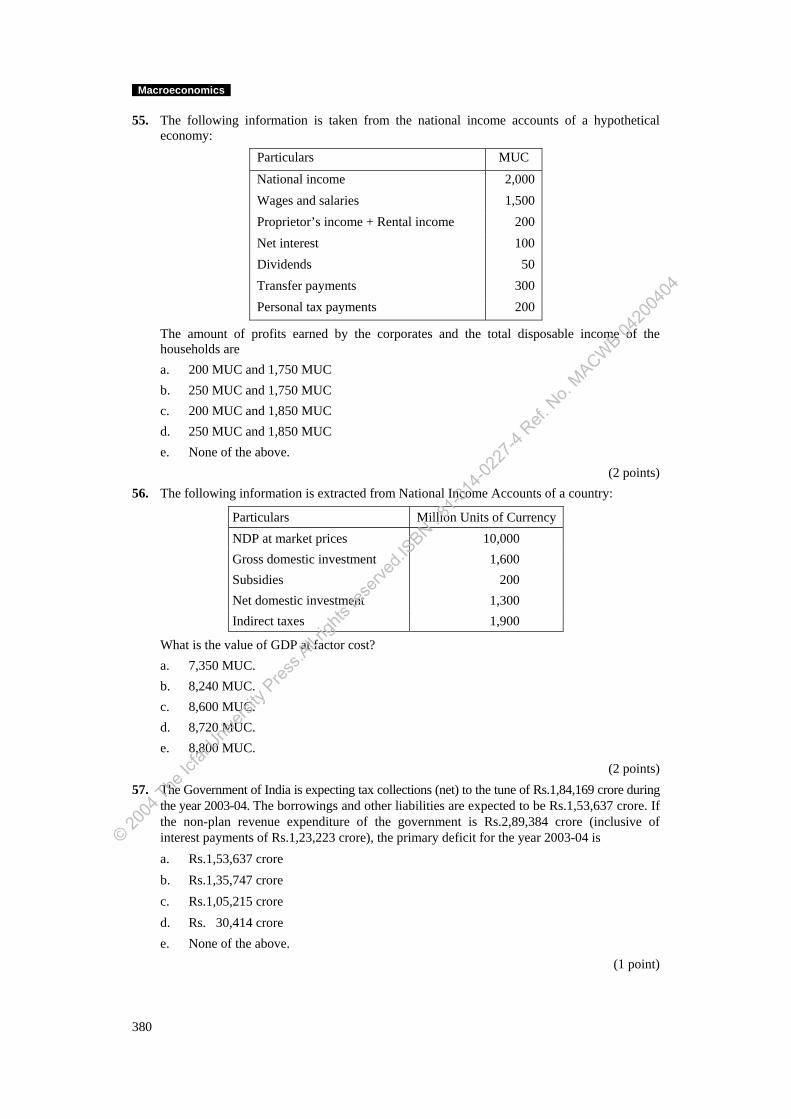
Macroeconomics
55. The following information is taken from the national income accounts of a hypothetical economy:
Particulars MUC
National income 2,000 Wages and salaries 1,500 Proprietor’s income + Rental income 200 Net interest 100 Dividends 50 Transfer payments 300 Personal tax payments 200
The amount of profits earned by the corporates and the total disposable income of the households are
a. 200 MUC and 1,750 MUC b. 250 MUC and 1,750 MUC c. 200 MUC and 1,850 MUC d. 250 MUC and 1,850 MUC e. None of the above.
(2 points) 56. The following information is extracted from National Income Accounts of a country:
Particulars Million Units of Currency NDP at market prices 10,000 Gross domestic investment 1,600 Subsidies 200 Net domestic investment 1,300 Indirect taxes 1,900
What is the value of GDP at factor cost? a. 7,350 MUC. b. 8,240 MUC. c. 8,600 MUC. d. 8,720 MUC. e. 8,800 MUC.
(2 points) 57. The Government of India is expecting tax collections (net) to the tune of Rs.1,84,169 crore during
the year 2003-04. The borrowings and other liabilities are expected to be Rs.1,53,637 crore. If the non-plan revenue expenditure of the government is Rs.2,89,384 crore (inclusive of interest payments of Rs.1,23,223 crore), the primary deficit for the year 2003-04 is a. Rs.1,53,637 crore b. Rs.1,35,747 crore c. Rs.1,05,215 crore d. Rs. 30,414 crore e. None of the above.
(1 point)
380
© 2004
The Ic
fai U
nivers
ity P
ress.A
ll righ
ts res
erved
.ISBN : 8
1-314
-0227
-4 Ref.
No.
MACWB 04
2004
04
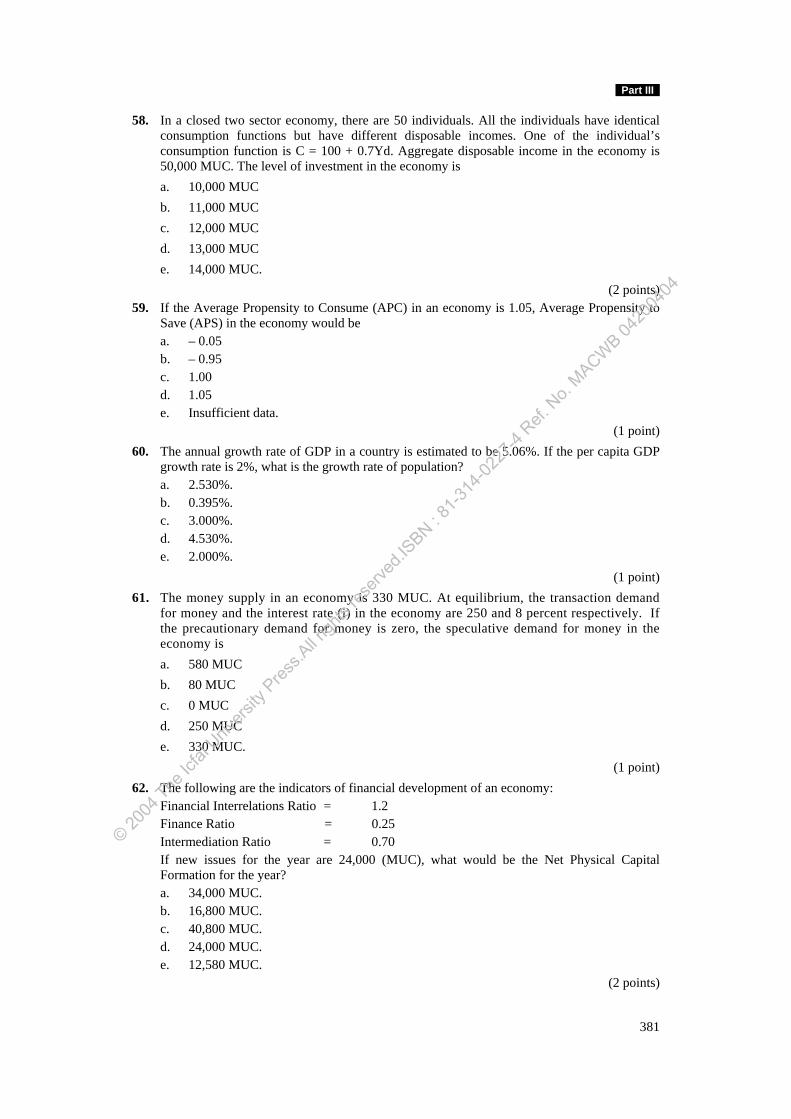
Part III
58. In a closed two sector economy, there are 50 individuals. All the individuals have identical consumption functions but have different disposable incomes. One of the individual’s consumption function is C = 100 + 0.7Yd. Aggregate disposable income in the economy is 50,000 MUC. The level of investment in the economy is a. 10,000 MUC b. 11,000 MUC c. 12,000 MUC d. 13,000 MUC e. 14,000 MUC.
(2 points) 59. If the Average Propensity to Consume (APC) in an economy is 1.05, Average Propensity to
Save (APS) in the economy would be a. – 0.05 b. – 0.95 c. 1.00 d. 1.05 e. Insufficient data.
(1 point) 60. The annual growth rate of GDP in a country is estimated to be 5.06%. If the per capita GDP
growth rate is 2%, what is the growth rate of population? a. 2.530%. b. 0.395%. c. 3.000%. d. 4.530%. e. 2.000%.
(1 point) 61. The money supply in an economy is 330 MUC. At equilibrium, the transaction demand
for money and the interest rate (i) in the economy are 250 and 8 percent respectively. If the precautionary demand for money is zero, the speculative demand for money in the economy is a. 580 MUC b. 80 MUC c. 0 MUC d. 250 MUC e. 330 MUC.
(1 point) 62. The following are the indicators of financial development of an economy:
Financial Interrelations Ratio = 1.2 Finance Ratio = 0.25 Intermediation Ratio = 0.70 If new issues for the year are 24,000 (MUC), what would be the Net Physical Capital Formation for the year? a. 34,000 MUC. b. 16,800 MUC. c. 40,800 MUC. d. 24,000 MUC. e. 12,580 MUC.
(2 points)
381
© 2004
The Ic
fai U
nivers
ity P
ress.A
ll righ
ts res
erved
.ISBN : 8
1-314
-0227
-4 Ref.
No.
MACWB 04
2004
04
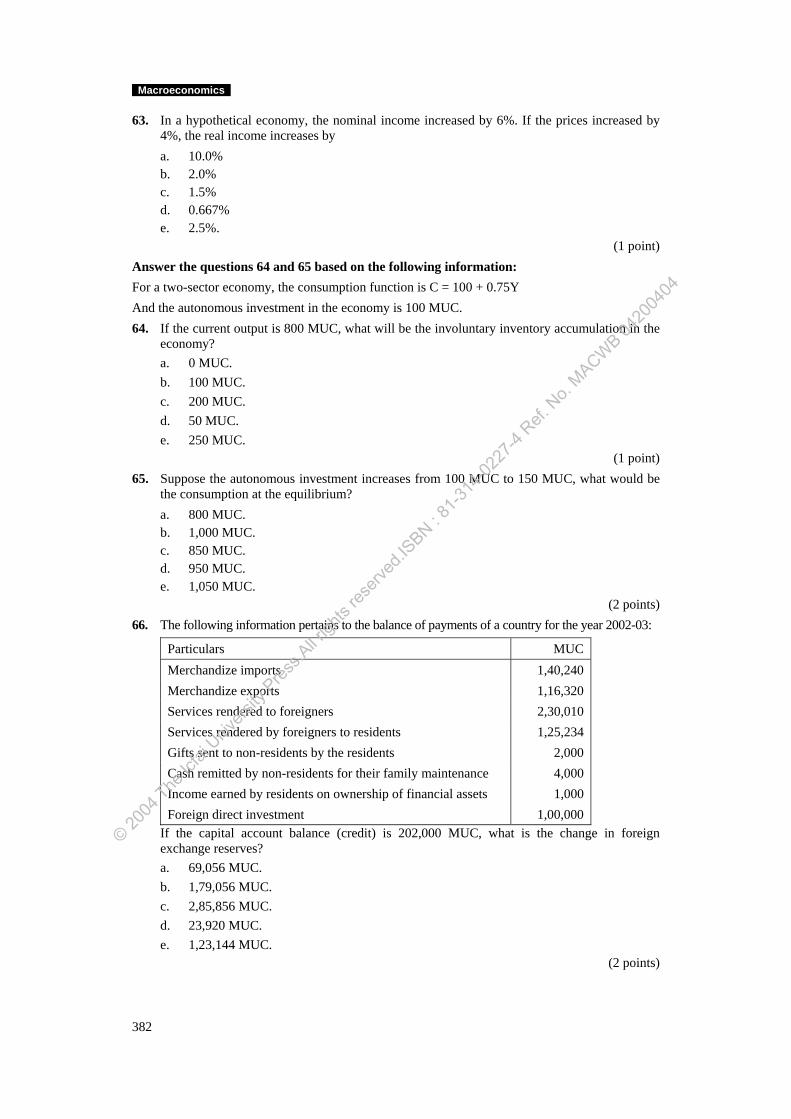
Macroeconomics
63. In a hypothetical economy, the nominal income increased by 6%. If the prices increased by 4%, the real income increases by a. 10.0% b. 2.0% c. 1.5% d. 0.667% e. 2.5%.
(1 point) Answer the questions 64 and 65 based on the following information: For a two-sector economy, the consumption function is C = 100 + 0.75Y And the autonomous investment in the economy is 100 MUC. 64. If the current output is 800 MUC, what will be the involuntary inventory accumulation in the
economy? a. 0 MUC. b. 100 MUC. c. 200 MUC. d. 50 MUC. e. 250 MUC.
(1 point) 65. Suppose the autonomous investment increases from 100 MUC to 150 MUC, what would be
the consumption at the equilibrium? a. 800 MUC. b. 1,000 MUC. c. 850 MUC. d. 950 MUC. e. 1,050 MUC.
(2 points) 66. The following information pertains to the balance of payments of a country for the year 2002-03:
Particulars MUC Merchandize imports 1,40,240 Merchandize exports 1,16,320 Services rendered to foreigners 2,30,010 Services rendered by foreigners to residents 1,25,234 Gifts sent to non-residents by the residents 2,000 Cash remitted by non-residents for their family maintenance 4,000 Income earned by residents on ownership of financial assets 1,000 Foreign direct investment 1,00,000
If the capital account balance (credit) is 202,000 MUC, what is the change in foreign exchange reserves? a. 69,056 MUC. b. 1,79,056 MUC. c. 2,85,856 MUC. d. 23,920 MUC. e. 1,23,144 MUC.
(2 points)
382
© 2004
The Ic
fai U
nivers
ity P
ress.A
ll righ
ts res
erved
.ISBN : 8
1-314
-0227
-4 Ref.
No.
MACWB 04
2004
04
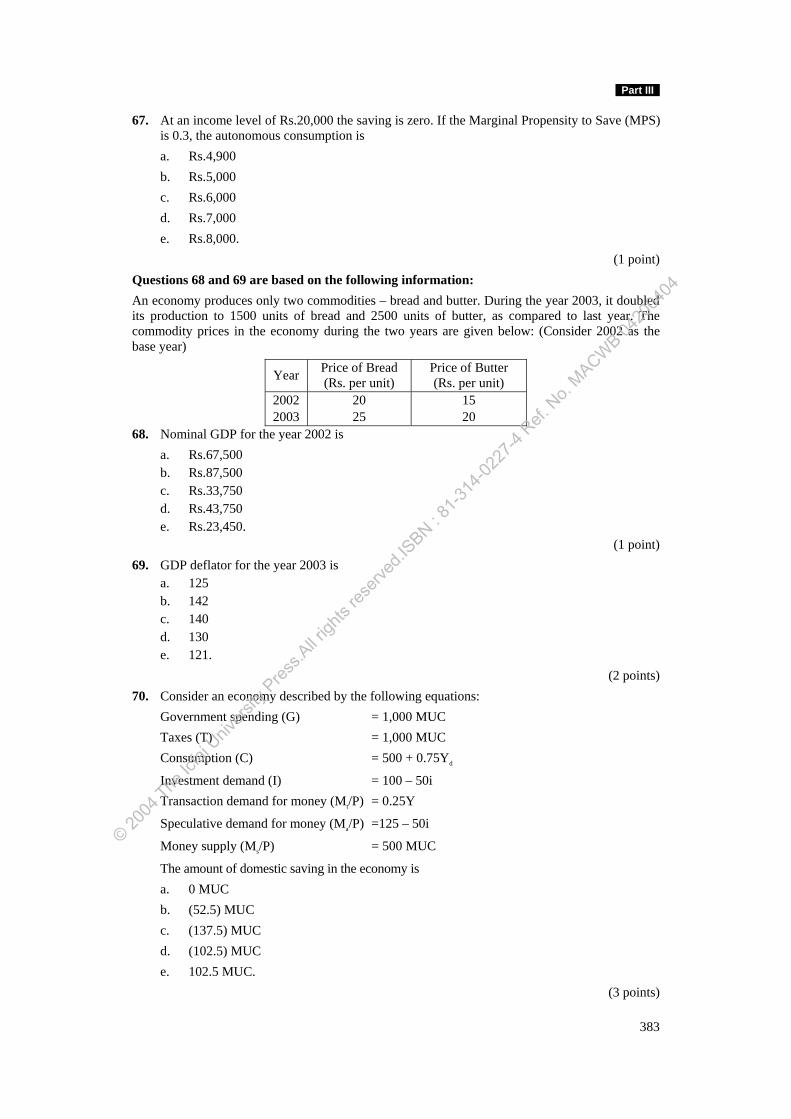
Part III
67. At an income level of Rs.20,000 the saving is zero. If the Marginal Propensity to Save (MPS) is 0.3, the autonomous consumption is a. Rs.4,900 b. Rs.5,000 c. Rs.6,000 d. Rs.7,000 e. Rs.8,000.
(1 point) Questions 68 and 69 are based on the following information: An economy produces only two commodities – bread and butter. During the year 2003, it doubled its production to 1500 units of bread and 2500 units of butter, as compared to last year. The commodity prices in the economy during the two years are given below: (Consider 2002 as the base year)
Year Price of Bread (Rs. per unit)
Price of Butter (Rs. per unit)
2002 20 15 2003 25 20
68. Nominal GDP for the year 2002 is a. Rs.67,500 b. Rs.87,500 c. Rs.33,750 d. Rs.43,750 e. Rs.23,450.
(1 point) 69. GDP deflator for the year 2003 is
a. 125 b. 142 c. 140 d. 130 e. 121.
(2 points) 70. Consider an economy described by the following equations:
Government spending (G) = 1,000 MUC Taxes (T) = 1,000 MUC Consumption (C) = 500 + 0.75Yd
Investment demand (I) = 100 – 50i Transaction demand for money (Mt/P) = 0.25Y
Speculative demand for money (Ma/P) =125 – 50i
Money supply (Ms/P) = 500 MUC
The amount of domestic saving in the economy is a. 0 MUC b. (52.5) MUC c. (137.5) MUC d. (102.5) MUC e. 102.5 MUC.
(3 points)
383
© 2004
The Ic
fai U
nivers
ity P
ress.A
ll righ
ts res
erved
.ISBN : 8
1-314
-0227
-4 Ref.
No.
MACWB 04
2004
04
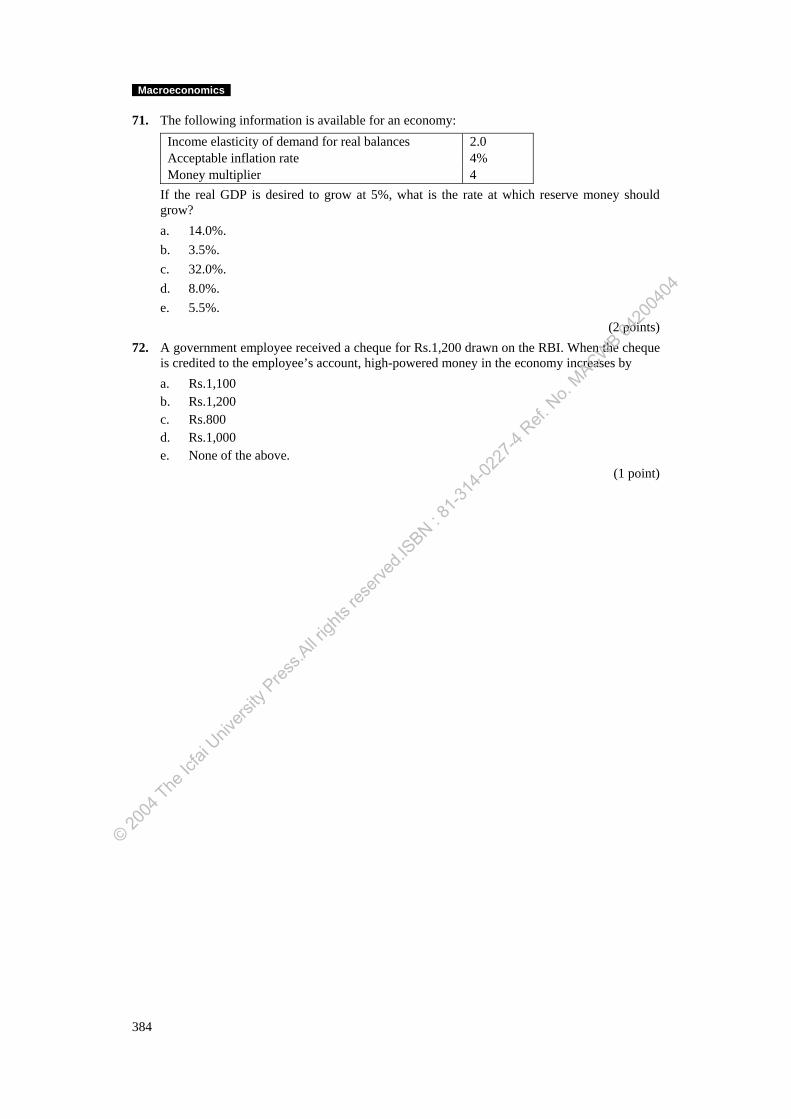
Macroeconomics
71. The following information is available for an economy: Income elasticity of demand for real balances 2.0 Acceptable inflation rate 4% Money multiplier 4
If the real GDP is desired to grow at 5%, what is the rate at which reserve money should grow? a. 14.0%. b. 3.5%. c. 32.0%. d. 8.0%. e. 5.5%.
(2 points) 72. A government employee received a cheque for Rs.1,200 drawn on the RBI. When the cheque
is credited to the employee’s account, high-powered money in the economy increases by a. Rs.1,100 b. Rs.1,200 c. Rs.800 d. Rs.1,000 e. None of the above.
(1 point)
384
© 2004
The Ic
fai U
nivers
ity P
ress.A
ll righ
ts res
erved
.ISBN : 8
1-314
-0227
-4 Ref.
No.
MACWB 04
2004
04
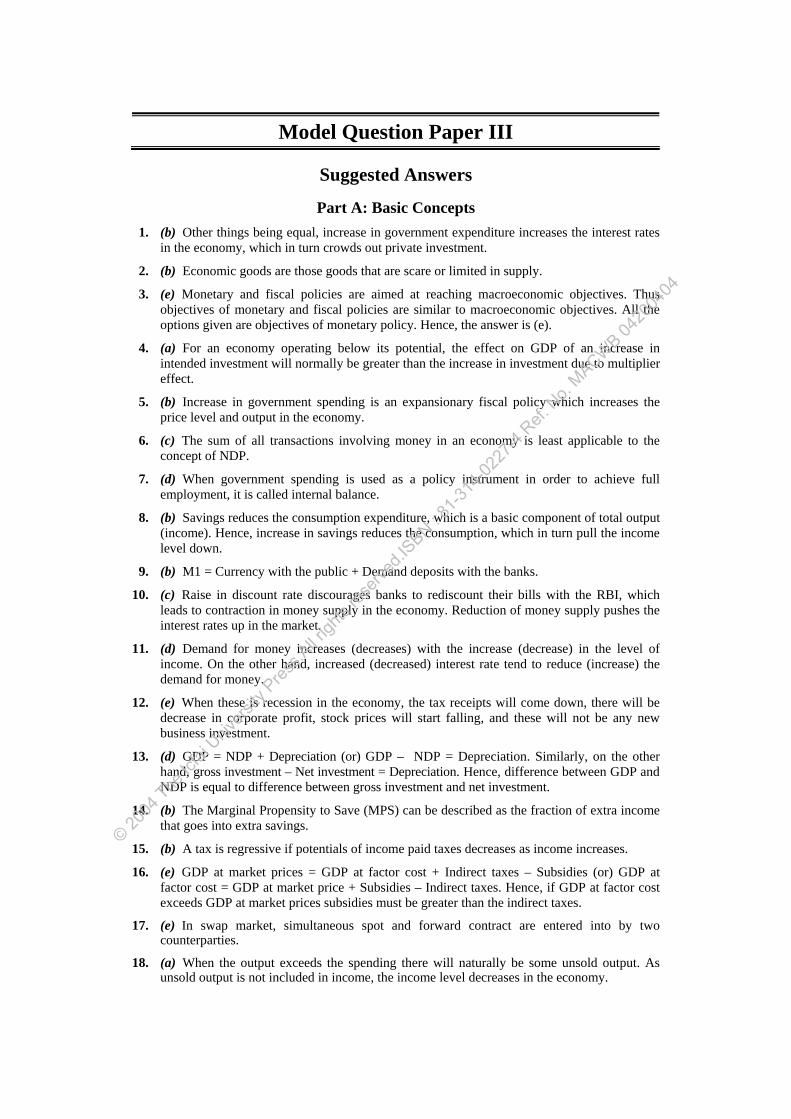
Model Question Paper III
Suggested Answers
Part A: Basic Concepts 1. (b) Other things being equal, increase in government expenditure increases the interest rates
in the economy, which in turn crowds out private investment.
2. (b) Economic goods are those goods that are scare or limited in supply.
3. (e) Monetary and fiscal policies are aimed at reaching macroeconomic objectives. Thus objectives of monetary and fiscal policies are similar to macroeconomic objectives. All the options given are objectives of monetary policy. Hence, the answer is (e).
4. (a) For an economy operating below its potential, the effect on GDP of an increase in intended investment will normally be greater than the increase in investment due to multiplier effect.
5. (b) Increase in government spending is an expansionary fiscal policy which increases the price level and output in the economy.
6. (c) The sum of all transactions involving money in an economy is least applicable to the concept of NDP.
7. (d) When government spending is used as a policy instrument in order to achieve full employment, it is called internal balance.
8. (b) Savings reduces the consumption expenditure, which is a basic component of total output (income). Hence, increase in savings reduces the consumption, which in turn pull the income level down.
9. (b) M1 = Currency with the public + Demand deposits with the banks.
10. (c) Raise in discount rate discourages banks to rediscount their bills with the RBI, which leads to contraction in money supply in the economy. Reduction of money supply pushes the interest rates up in the market.
11. (d) Demand for money increases (decreases) with the increase (decrease) in the level of income. On the other hand, increased (decreased) interest rate tend to reduce (increase) the demand for money.
12. (e) When these is recession in the economy, the tax receipts will come down, there will be decrease in corporate profit, stock prices will start falling, and these will not be any new business investment.
13. (d) GDP = NDP + Depreciation (or) GDP – NDP = Depreciation. Similarly, on the other hand, gross investment – Net investment = Depreciation. Hence, difference between GDP and NDP is equal to difference between gross investment and net investment.
14. (b) The Marginal Propensity to Save (MPS) can be described as the fraction of extra income that goes into extra savings.
15. (b) A tax is regressive if potentials of income paid taxes decreases as income increases.
16. (e) GDP at market prices = GDP at factor cost + Indirect taxes – Subsidies (or) GDP at factor cost = GDP at market price + Subsidies – Indirect taxes. Hence, if GDP at factor cost exceeds GDP at market prices subsidies must be greater than the indirect taxes.
17. (e) In swap market, simultaneous spot and forward contract are entered into by two counterparties.
18. (a) When the output exceeds the spending there will naturally be some unsold output. As unsold output is not included in income, the income level decreases in the economy.
© 2004
The Ic
fai U
nivers
ity P
ress.A
ll righ
ts res
erved
.ISBN : 8
1-314
-0227
-4 Ref.
No.
MACWB 04
2004
04
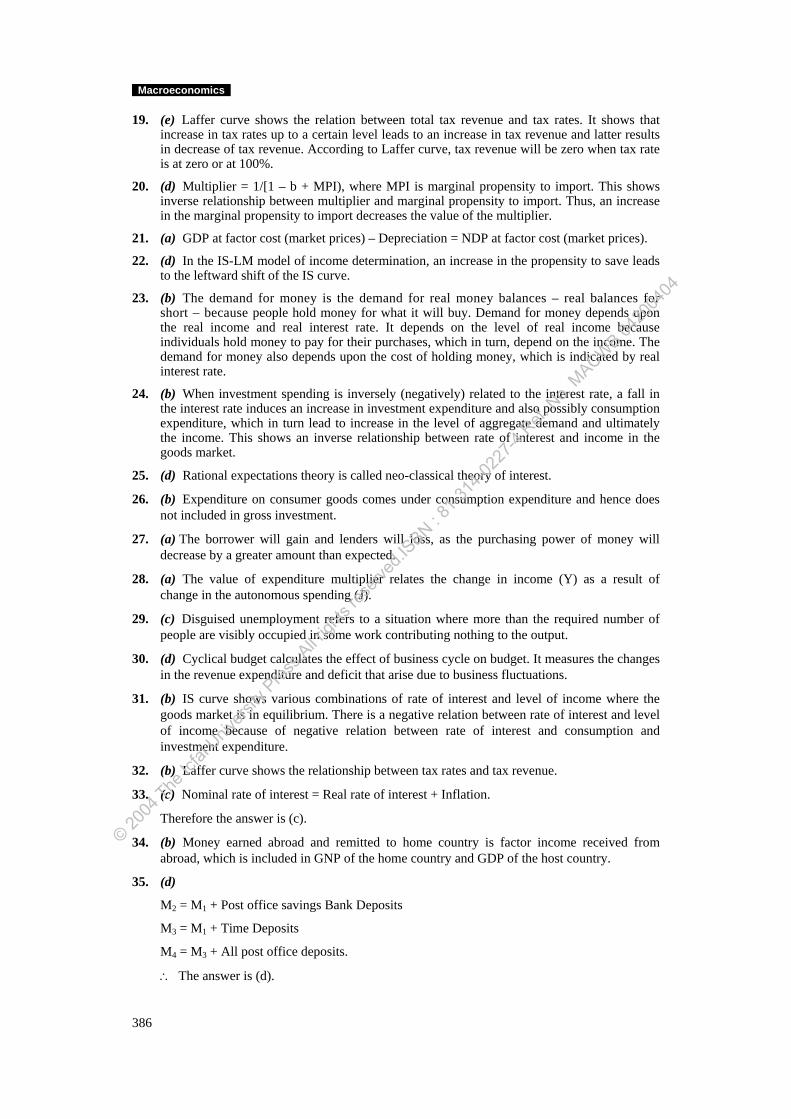
Macroeconomics
19. (e) Laffer curve shows the relation between total tax revenue and tax rates. It shows that increase in tax rates up to a certain level leads to an increase in tax revenue and latter results in decrease of tax revenue. According to Laffer curve, tax revenue will be zero when tax rate is at zero or at 100%.
20. (d) Multiplier = 1/[1 – b + MPI), where MPI is marginal propensity to import. This shows inverse relationship between multiplier and marginal propensity to import. Thus, an increase in the marginal propensity to import decreases the value of the multiplier.
21. (a) GDP at factor cost (market prices) – Depreciation = NDP at factor cost (market prices).
22. (d) In the IS-LM model of income determination, an increase in the propensity to save leads to the leftward shift of the IS curve.
23. (b) The demand for money is the demand for real money balances – real balances for short – because people hold money for what it will buy. Demand for money depends upon the real income and real interest rate. It depends on the level of real income because individuals hold money to pay for their purchases, which in turn, depend on the income. The demand for money also depends upon the cost of holding money, which is indicated by real interest rate.
24. (b) When investment spending is inversely (negatively) related to the interest rate, a fall in the interest rate induces an increase in investment expenditure and also possibly consumption expenditure, which in turn lead to increase in the level of aggregate demand and ultimately the income. This shows an inverse relationship between rate of interest and income in the goods market.
25. (d) Rational expectations theory is called neo-classical theory of interest.
26. (b) Expenditure on consumer goods comes under consumption expenditure and hence does not included in gross investment.
27. (a) The borrower will gain and lenders will loss, as the purchasing power of money will decrease by a greater amount than expected.
28. (a) The value of expenditure multiplier relates the change in income (Y) as a result of change in the autonomous spending (J).
29. (c) Disguised unemployment refers to a situation where more than the required number of people are visibly occupied in some work contributing nothing to the output.
30. (d) Cyclical budget calculates the effect of business cycle on budget. It measures the changes in the revenue expenditure and deficit that arise due to business fluctuations.
31. (b) IS curve shows various combinations of rate of interest and level of income where the goods market is in equilibrium. There is a negative relation between rate of interest and level of income because of negative relation between rate of interest and consumption and investment expenditure.
32. (b) Laffer curve shows the relationship between tax rates and tax revenue.
33. (c) Nominal rate of interest = Real rate of interest + Inflation.
Therefore the answer is (c).
34. (b) Money earned abroad and remitted to home country is factor income received from abroad, which is included in GNP of the home country and GDP of the host country.
35. (d)
M2 = M1 + Post office savings Bank Deposits
M3 = M1 + Time Deposits
M4 = M3 + All post office deposits.
∴ The answer is (d).
386
© 2004
The Ic
fai U
nivers
ity P
ress.A
ll righ
ts res
erved
.ISBN : 8
1-314
-0227
-4 Ref.
No.
MACWB 04
2004
04
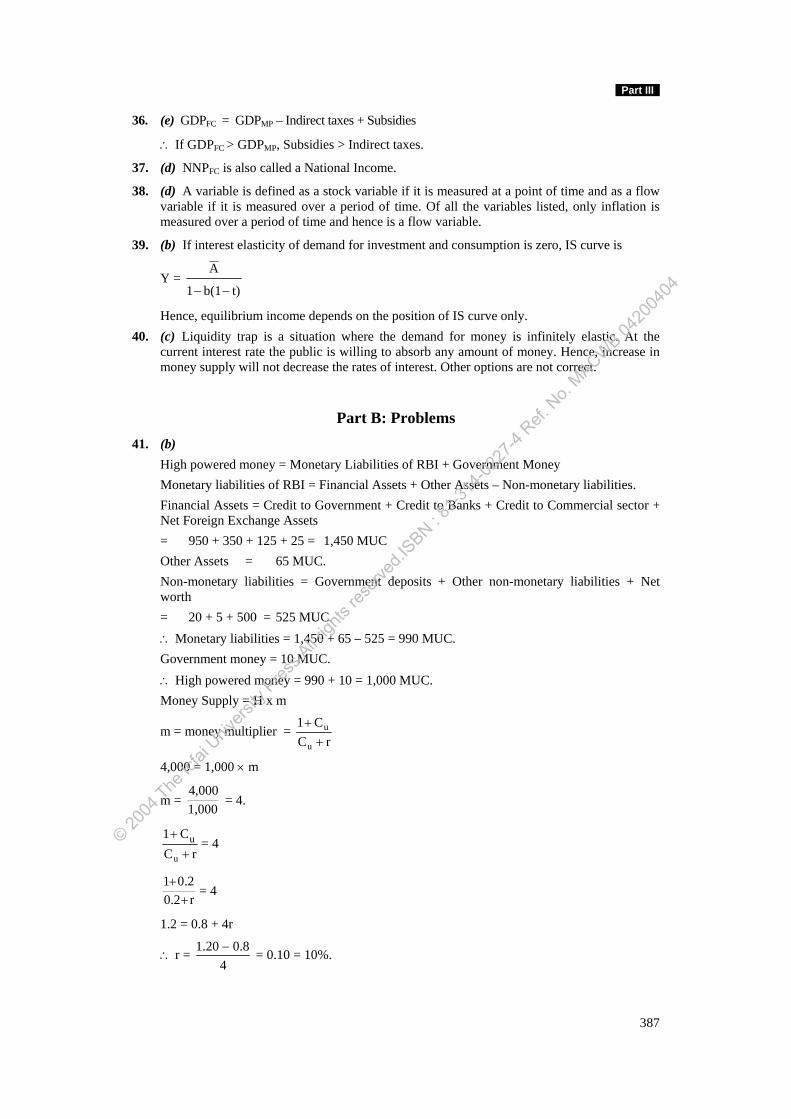
Part III
36. (e) GDPFC = GDPMP – Indirect taxes + Subsidies
∴ If GDPFC > GDPMP, Subsidies > Indirect taxes.
37. (d) NNPFC is also called a National Income.
38. (d) A variable is defined as a stock variable if it is measured at a point of time and as a flow variable if it is measured over a period of time. Of all the variables listed, only inflation is measured over a period of time and hence is a flow variable.
39. (b) If interest elasticity of demand for investment and consumption is zero, IS curve is
Y = t)b(11
A
−−
Hence, equilibrium income depends on the position of IS curve only. 40. (c) Liquidity trap is a situation where the demand for money is infinitely elastic. At the
current interest rate the public is willing to absorb any amount of money. Hence, increase in money supply will not decrease the rates of interest. Other options are not correct.
Part B: Problems41. (b) High powered money = Monetary Liabilities of RBI + Government Money Monetary liabilities of RBI = Financial Assets + Other Assets – Non-monetary liabilities. Financial Assets = Credit to Government + Credit to Banks + Credit to Commercial sector +
Net Foreign Exchange Assets = 950 + 350 + 125 + 25 = 1,450 MUC Other Assets = 65 MUC. Non-monetary liabilities = Government deposits + Other non-monetary liabilities + Net
worth = 20 + 5 + 500 = 525 MUC. ∴ Monetary liabilities = 1,450 + 65 – 525 = 990 MUC. Government money = 10 MUC. ∴ High powered money = 990 + 10 = 1,000 MUC. Money Supply = H x m
m = money multiplier = rC
C1
u
u
++
4,000 = 1,000 × m
m = 1,0004,000
= 4.
rC
C1
u
u+
+= 4
r0.2
.201+
+= 4
1.2 = 0.8 + 4r
∴ r = 1.20 0.84− = 0.10 = 10%.
387
© 2004
The Ic
fai U
nivers
ity P
ress.A
ll righ
ts res
erved
.ISBN : 8
1-314
-0227
-4 Ref.
No.
MACWB 04
2004
04
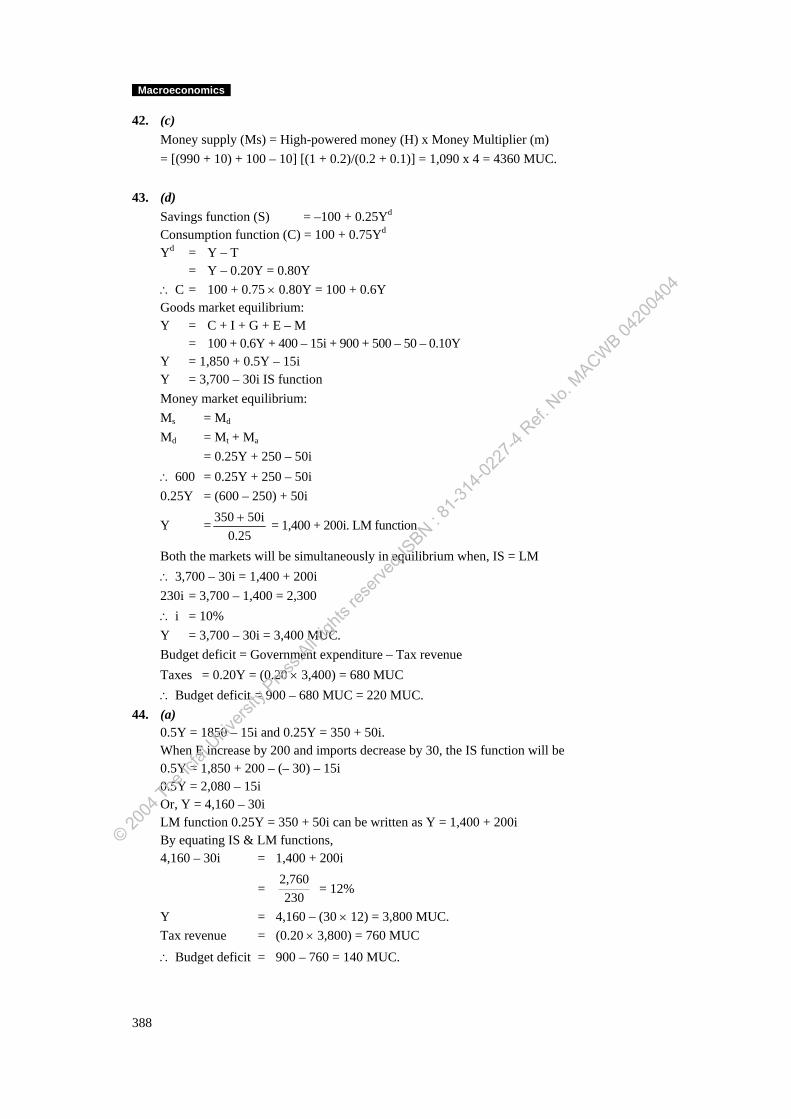
Macroeconomics
42. (c) Money supply (Ms) = High-powered money (H) x Money Multiplier (m) = [(990 + 10) + 100 – 10] [(1 + 0.2)/(0.2 + 0.1)] = 1,090 x 4 = 4360 MUC. 43. (d) Savings function (S) = –100 + 0.25Yd
Consumption function (C) = 100 + 0.75Yd
Yd = Y – T = Y – 0.20Y = 0.80Y ∴ C = 100 + 0.75 × 0.80Y = 100 + 0.6Y Goods market equilibrium: Y = C + I + G + E – M = 100 + 0.6Y + 400 – 15i + 900 + 500 – 50 – 0.10Y Y = 1,850 + 0.5Y – 15i Y = 3,700 – 30i IS function Money market equilibrium: Ms = Md
Md = Mt + Ma
= 0.25Y + 250 – 50i ∴ 600 = 0.25Y + 250 – 50i 0.25Y = (600 – 250) + 50i
Y = 350 50i0.25+ = 1,400 + 200i. LM function
Both the markets will be simultaneously in equilibrium when, IS = LM ∴ 3,700 – 30i = 1,400 + 200i 230i = 3,700 – 1,400 = 2,300 ∴ i = 10% Y = 3,700 – 30i = 3,400 MUC. Budget deficit = Government expenditure – Tax revenue Taxes = 0.20Y = (0.20 × 3,400) = 680 MUC ∴ Budget deficit = 900 – 680 MUC = 220 MUC. 44. (a) 0.5Y = 1850 – 15i and 0.25Y = 350 + 50i. When E increase by 200 and imports decrease by 30, the IS function will be 0.5Y = 1,850 + 200 – (– 30) – 15i 0.5Y = 2,080 – 15i Or, Y = 4,160 – 30i LM function 0.25Y = 350 + 50i can be written as Y = 1,400 + 200i By equating IS & LM functions, 4,160 – 30i = 1,400 + 200i
= 230
2,760 = 12%
Y = 4,160 – (30 × 12) = 3,800 MUC. Tax revenue = (0.20 × 3,800) = 760 MUC ∴ Budget deficit = 900 – 760 = 140 MUC.
388
© 2004
The Ic
fai U
nivers
ity P
ress.A
ll righ
ts res
erved
.ISBN : 8
1-314
-0227
-4 Ref.
No.
MACWB 04
2004
04
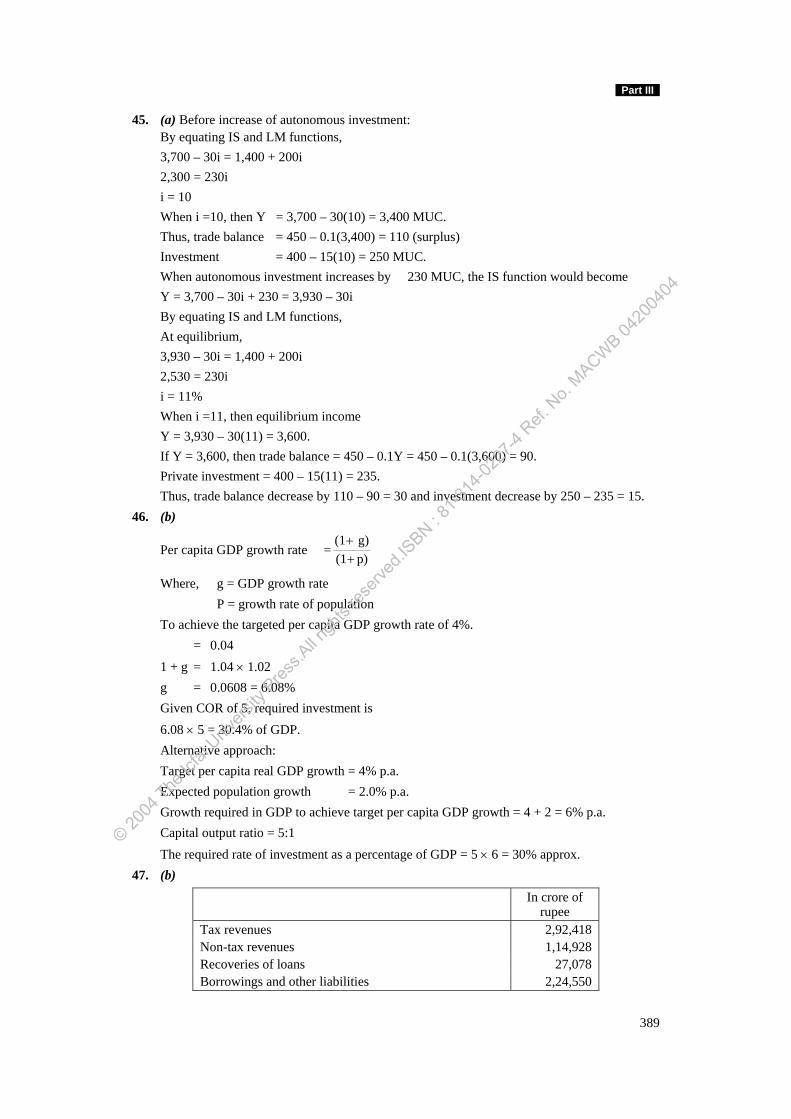
Part III
45. (a) Before increase of autonomous investment: By equating IS and LM functions, 3,700 – 30i = 1,400 + 200i 2,300 = 230i i = 10 When i =10, then Y = 3,700 – 30(10) = 3,400 MUC. Thus, trade balance = 450 – 0.1(3,400) = 110 (surplus) Investment = 400 – 15(10) = 250 MUC. When autonomous investment increases by 230 MUC, the IS function would become Y = 3,700 – 30i + 230 = 3,930 – 30i By equating IS and LM functions, At equilibrium, 3,930 – 30i = 1,400 + 200i 2,530 = 230i i = 11% When i =11, then equilibrium income Y = 3,930 – 30(11) = 3,600. If Y = 3,600, then trade balance = 450 – 0.1Y = 450 – 0.1(3,600) = 90. Private investment = 400 – 15(11) = 235. Thus, trade balance decrease by 110 – 90 = 30 and investment decrease by 250 – 235 = 15. 46. (b)
Per capita GDP growth rate =p)(1g)(1
++
Where, g = GDP growth rate P = growth rate of population To achieve the targeted per capita GDP growth rate of 4%. = 0.04 1 + g = 1.04 × 1.02 g = 0.0608 = 6.08% Given COR of 5, required investment is 6.08 × 5 = 30.4% of GDP. Alternative approach: Target per capita real GDP growth = 4% p.a. Expected population growth = 2.0% p.a. Growth required in GDP to achieve target per capita GDP growth = 4 + 2 = 6% p.a. Capital output ratio = 5:1 The required rate of investment as a percentage of GDP = 5 × 6 = 30% approx. 47. (b)
In crore of rupee
Tax revenues 2,92,418 Non-tax revenues 1,14,928 Recoveries of loans 27,078 Borrowings and other liabilities 2,24,550
389
© 2004
The Ic
fai U
nivers
ity P
ress.A
ll righ
ts res
erved
.ISBN : 8
1-314
-0227
-4 Ref.
No.
MACWB 04
2004
04
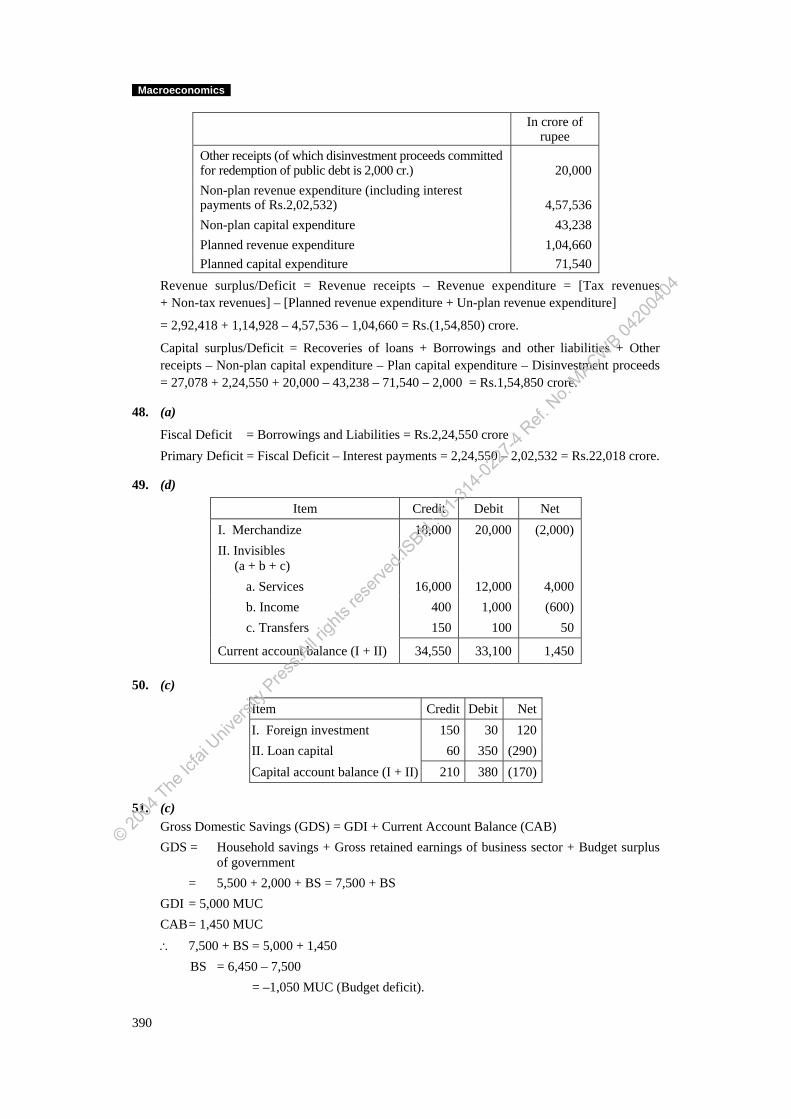
Macroeconomics
In crore of rupee
Other receipts (of which disinvestment proceeds committed for redemption of public debt is 2,000 cr.) 20,000 Non-plan revenue expenditure (including interest payments of Rs.2,02,532) 4,57,536 Non-plan capital expenditure 43,238 Planned revenue expenditure 1,04,660 Planned capital expenditure 71,540
Revenue surplus/Deficit = Revenue receipts – Revenue expenditure = [Tax revenues + Non-tax revenues] – [Planned revenue expenditure + Un-plan revenue expenditure]
= 2,92,418 + 1,14,928 – 4,57,536 – 1,04,660 = Rs.(1,54,850) crore.
Capital surplus/Deficit = Recoveries of loans + Borrowings and other liabilities + Other receipts – Non-plan capital expenditure – Plan capital expenditure – Disinvestment proceeds = 27,078 + 2,24,550 + 20,000 – 43,238 – 71,540 – 2,000 = Rs.1,54,850 crore.
48. (a)
Fiscal Deficit = Borrowings and Liabilities = Rs.2,24,550 crore Primary Deficit = Fiscal Deficit – Interest payments = 2,24,550 – 2,02,532 = Rs.22,018 crore.
49. (d)
Item Credit Debit Net I. Merchandize 18,000 20,000 (2,000) II. Invisibles (a + b + c)
a. Services 16,000 12,000 4,000 b. Income 400 1,000 (600) c. Transfers 150 100 50
Current account balance (I + II) 34,550 33,100 1,450
50. (c)
Item Credit Debit Net I. Foreign investment 150 30 120 II. Loan capital 60 350 (290) Capital account balance (I + II) 210 380 (170)
51. (c) Gross Domestic Savings (GDS) = GDI + Current Account Balance (CAB) GDS = Household savings + Gross retained earnings of business sector + Budget surplus
of government = 5,500 + 2,000 + BS = 7,500 + BS GDI = 5,000 MUC CAB = 1,450 MUC ∴ 7,500 + BS = 5,000 + 1,450 BS = 6,450 – 7,500 = –1,050 MUC (Budget deficit).
390
© 2004
The Ic
fai U
nivers
ity P
ress.A
ll righ
ts res
erved
.ISBN : 8
1-314
-0227
-4 Ref.
No.
MACWB 04
2004
04
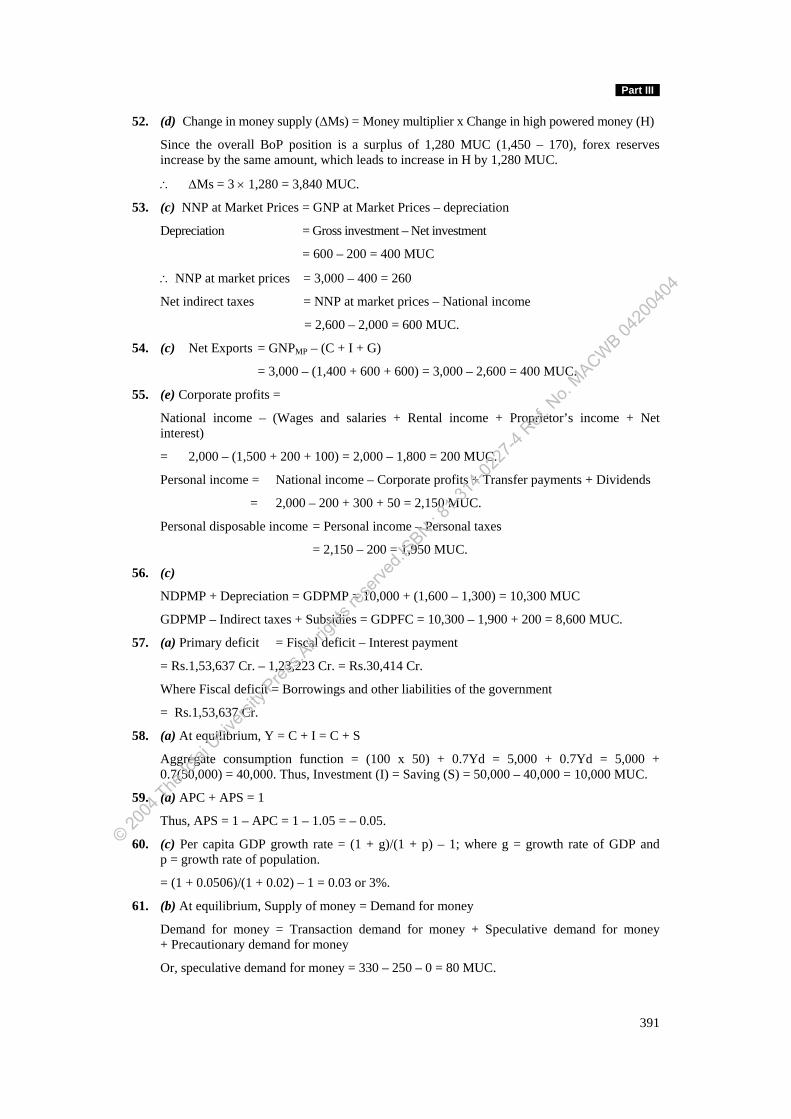
Part III
52. (d) Change in money supply (ΔMs) = Money multiplier x Change in high powered money (H)
Since the overall BoP position is a surplus of 1,280 MUC (1,450 – 170), forex reserves increase by the same amount, which leads to increase in H by 1,280 MUC.
∴ ΔMs = 3 × 1,280 = 3,840 MUC.
53. (c) NNP at Market Prices = GNP at Market Prices – depreciation
Depreciation = Gross investment – Net investment
= 600 – 200 = 400 MUC
∴ NNP at market prices = 3,000 – 400 = 260
Net indirect taxes = NNP at market prices – National income
= 2,600 – 2,000 = 600 MUC.
54. (c) Net Exports = GNPMP – (C + I + G)
= 3,000 – (1,400 + 600 + 600) = 3,000 – 2,600 = 400 MUC.
55. (e) Corporate profits =
National income – (Wages and salaries + Rental income + Proprietor’s income + Net interest)
= 2,000 – (1,500 + 200 + 100) = 2,000 – 1,800 = 200 MUC.
Personal income = National income – Corporate profits + Transfer payments + Dividends
= 2,000 – 200 + 300 + 50 = 2,150 MUC.
Personal disposable income = Personal income – Personal taxes
= 2,150 – 200 = 1,950 MUC.
56. (c)
NDPMP + Depreciation = GDPMP = 10,000 + (1,600 – 1,300) = 10,300 MUC
GDPMP – Indirect taxes + Subsidies = GDPFC = 10,300 – 1,900 + 200 = 8,600 MUC.
57. (a) Primary deficit = Fiscal deficit – Interest payment
= Rs.1,53,637 Cr. – 1,23,223 Cr. = Rs.30,414 Cr.
Where Fiscal deficit = Borrowings and other liabilities of the government
= Rs.1,53,637 Cr.
58. (a) At equilibrium, Y = C + I = C + S
Aggregate consumption function = (100 x 50) + 0.7Yd = 5,000 + 0.7Yd = 5,000 + 0.7(50,000) = 40,000. Thus, Investment (I) = Saving (S) = 50,000 – 40,000 = 10,000 MUC.
59. (a) APC + APS = 1
Thus, APS = 1 – APC = 1 – 1.05 = – 0.05.
60. (c) Per capita GDP growth rate = (1 + g)/(1 + p) – 1; where g = growth rate of GDP and p = growth rate of population.
= (1 + 0.0506)/(1 + 0.02) – 1 = 0.03 or 3%.
61. (b) At equilibrium, Supply of money = Demand for money
Demand for money = Transaction demand for money + Speculative demand for money + Precautionary demand for money
Or, speculative demand for money = 330 – 250 – 0 = 80 MUC.
391
© 2004
The Ic
fai U
nivers
ity P
ress.A
ll righ
ts res
erved
.ISBN : 8
1-314
-0227
-4 Ref.
No.
MACWB 04
2004
04
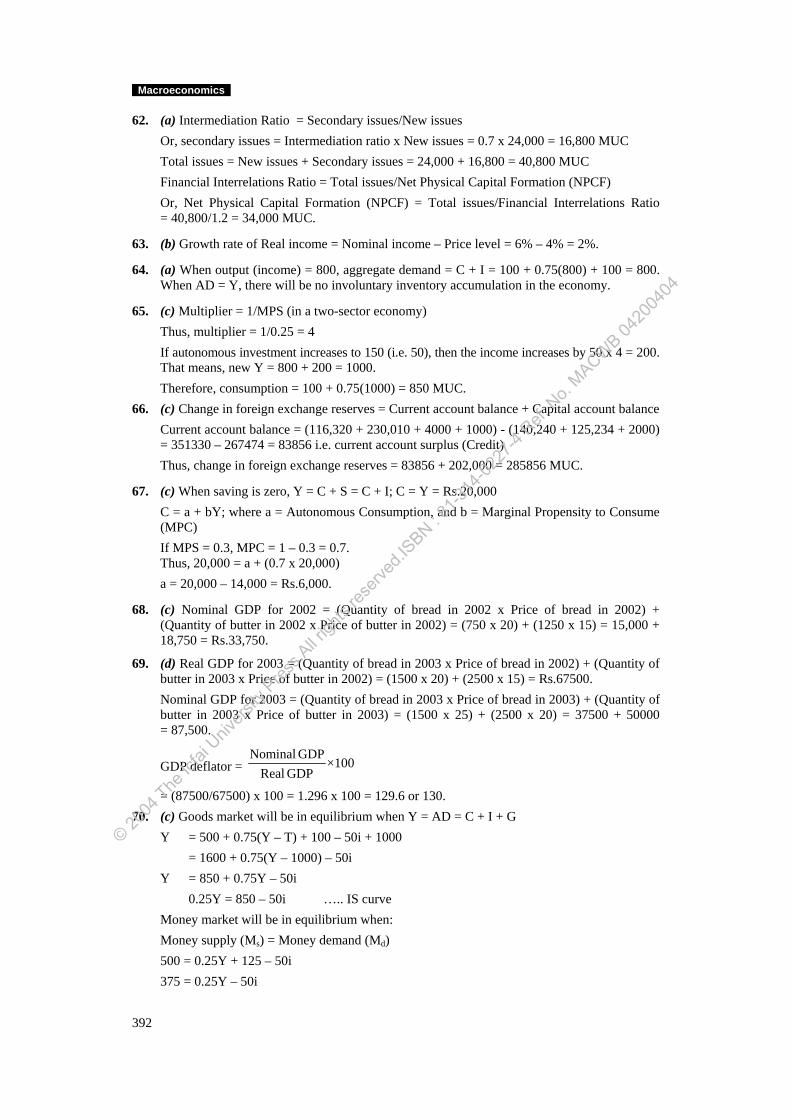
Macroeconomics
62. (a) Intermediation Ratio = Secondary issues/New issues Or, secondary issues = Intermediation ratio x New issues = 0.7 x 24,000 = 16,800 MUC Total issues = New issues + Secondary issues = 24,000 + 16,800 = 40,800 MUC Financial Interrelations Ratio = Total issues/Net Physical Capital Formation (NPCF) Or, Net Physical Capital Formation (NPCF) = Total issues/Financial Interrelations Ratio = 40,800/1.2 = 34,000 MUC.
63. (b) Growth rate of Real income = Nominal income – Price level = 6% – 4% = 2%.
64. (a) When output (income) = 800, aggregate demand = C + I = 100 + 0.75(800) + 100 = 800. When AD = Y, there will be no involuntary inventory accumulation in the economy.
65. (c) Multiplier = 1/MPS (in a two-sector economy) Thus, multiplier = 1/0.25 = 4 If autonomous investment increases to 150 (i.e. 50), then the income increases by 50 x 4 = 200. That means, new Y = 800 + 200 = 1000. Therefore, consumption = 100 + 0.75(1000) = 850 MUC.
66. (c) Change in foreign exchange reserves = Current account balance + Capital account balance Current account balance = (116,320 + 230,010 + 4000 + 1000) - (140,240 + 125,234 + 2000) = 351330 – 267474 = 83856 i.e. current account surplus (Credit) Thus, change in foreign exchange reserves = 83856 + 202,000 = 285856 MUC.
67. (c) When saving is zero, Y = C + S = C + I; C = Y = Rs.20,000 C = a + bY; where a = Autonomous Consumption, and b = Marginal Propensity to Consume (MPC) If MPS = 0.3, MPC = 1 – 0.3 = 0.7. Thus, 20,000 = a + (0.7 x 20,000) a = 20,000 – 14,000 = Rs.6,000.
68. (c) Nominal GDP for 2002 = (Quantity of bread in 2002 x Price of bread in 2002) + (Quantity of butter in 2002 x Price of butter in 2002) = (750 x 20) + (1250 x 15) = 15,000 + 18,750 = Rs.33,750.
69. (d) Real GDP for 2003 = (Quantity of bread in 2003 x Price of bread in 2002) + (Quantity of butter in 2003 x Price of butter in 2002) = (1500 x 20) + (2500 x 15) = Rs.67500. Nominal GDP for 2003 = (Quantity of bread in 2003 x Price of bread in 2003) + (Quantity of butter in 2003 x Price of butter in 2003) = (1500 x 25) + (2500 x 20) = 37500 + 50000 = 87,500.
GDP deflator = Nominal GDP
×100Real GDP
= (87500/67500) x 100 = 1.296 x 100 = 129.6 or 130. 70. (c) Goods market will be in equilibrium when Y = AD = C + I + G
Y = 500 + 0.75(Y – T) + 100 – 50i + 1000 = 1600 + 0.75(Y – 1000) – 50i Y = 850 + 0.75Y – 50i 0.25Y = 850 – 50i ….. IS curve Money market will be in equilibrium when: Money supply (Ms) = Money demand (Md) 500 = 0.25Y + 125 – 50i 375 = 0.25Y – 50i
392
© 2004
The Ic
fai U
nivers
ity P
ress.A
ll righ
ts res
erved
.ISBN : 8
1-314
-0227
-4 Ref.
No.
MACWB 04
2004
04
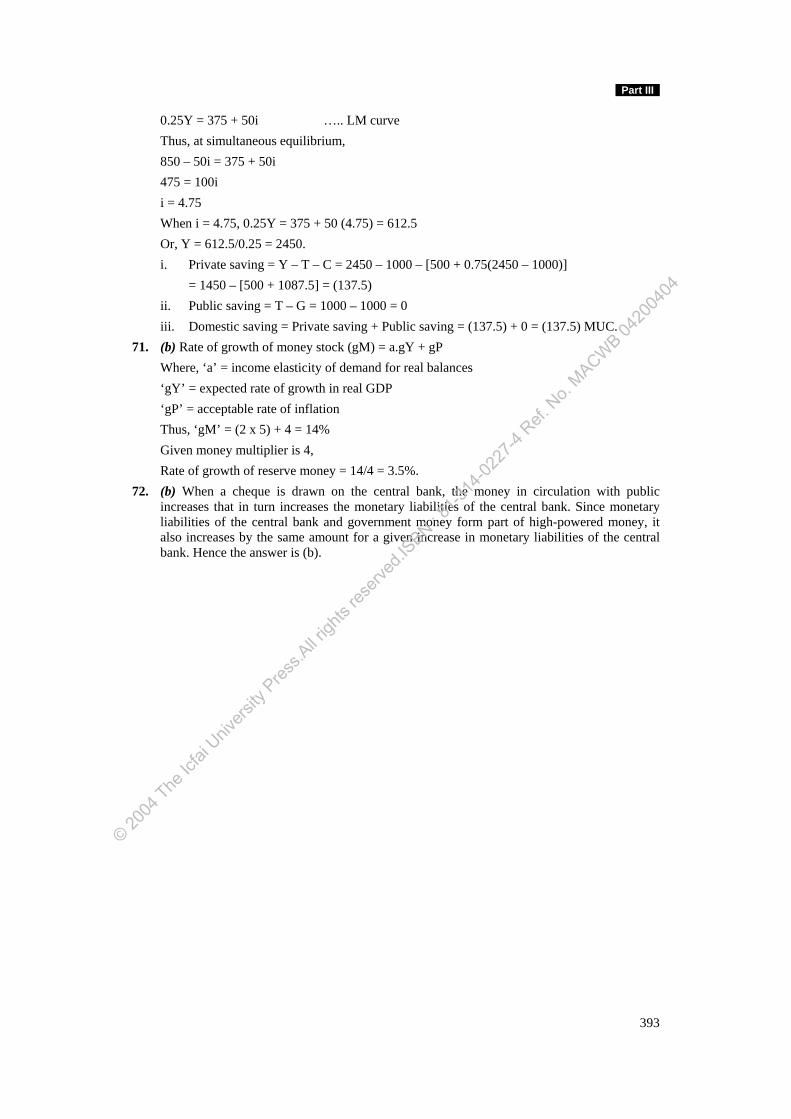
Part III
0.25Y = 375 + 50i ….. LM curve Thus, at simultaneous equilibrium, 850 – 50i = 375 + 50i 475 = 100i i = 4.75 When i = 4.75, 0.25Y = 375 + 50 (4.75) = 612.5 Or, Y = 612.5/0.25 = 2450. i. Private saving = Y – T – C = 2450 – 1000 – [500 + 0.75(2450 – 1000)] = 1450 – [500 + 1087.5] = (137.5) ii. Public saving = T – G = 1000 – 1000 = 0 iii. Domestic saving = Private saving + Public saving = (137.5) + 0 = (137.5) MUC.
71. (b) Rate of growth of money stock (gM) = a.gY + gP Where, ‘a’ = income elasticity of demand for real balances ‘gY’ = expected rate of growth in real GDP ‘gP’ = acceptable rate of inflation Thus, ‘gM’ = (2 x 5) + 4 = 14% Given money multiplier is 4, Rate of growth of reserve money = 14/4 = 3.5%.
72. (b) When a cheque is drawn on the central bank, the money in circulation with public increases that in turn increases the monetary liabilities of the central bank. Since monetary liabilities of the central bank and government money form part of high-powered money, it also increases by the same amount for a given increase in monetary liabilities of the central bank. Hence the answer is (b).
393
© 2004
The Ic
fai U
nivers
ity P
ress.A
ll righ
ts res
erved
.ISBN : 8
1-314
-0227
-4 Ref.
No.
MACWB 04
2004
04

Model Question Paper IV Time: 3 Hours Total Points: 100
Part A: Basic Concepts (40 Points) Answer all the questions. Each question carries one point. 1. Which of the following statements is correct? a. A variable is endogenous when its value is determined by forces outside the model. b. A change in an exogenous variable is classified as an autonomous change. c. A variable is exogenous when its value is determined by forces within the model. d. A variable is autonomous when its value is determined by forces within the model. e. None of the above. 2. Equilibrium occurs in a two-sector model when a. Saving equals investment b. Consumption plus investment equals the value of output c. Planned saving equals planned investment d. Aggregate spending equals the revenues of the business sector e. Both (b) and (c) above. 3. GDP deflator is given by a. Real GDP/nominal GDP b. Nominal GDP/real GDP c. GDP/GNP d. GNP/GDP e. None of the above. 4. If the level of aggregate demand were greater than the level of aggregate supply in the
economy, which of the following choices could also be seen? a. A depletion of inventories. b. An increase in recruiting labor force. c. An upward movement of the price level. d. Requests for wage increases. e. All of the above. 5. Velocity of money is given by a. Money supply/GDP b. Money supply/investment c. Investment/money supply d. GDP/money supply e. None of the above. 6. Which of the following is not a function of money? a. Medium of exchange. b. Unit of account. c. Supply of reserves. d. Store of value. e. A standard of deferred payments.
© 2004
The Ic
fai U
nivers
ity P
ress.A
ll righ
ts res
erved
.ISBN : 8
1-314
-0227
-4 Ref.
No.
MACWB 04
2004
04
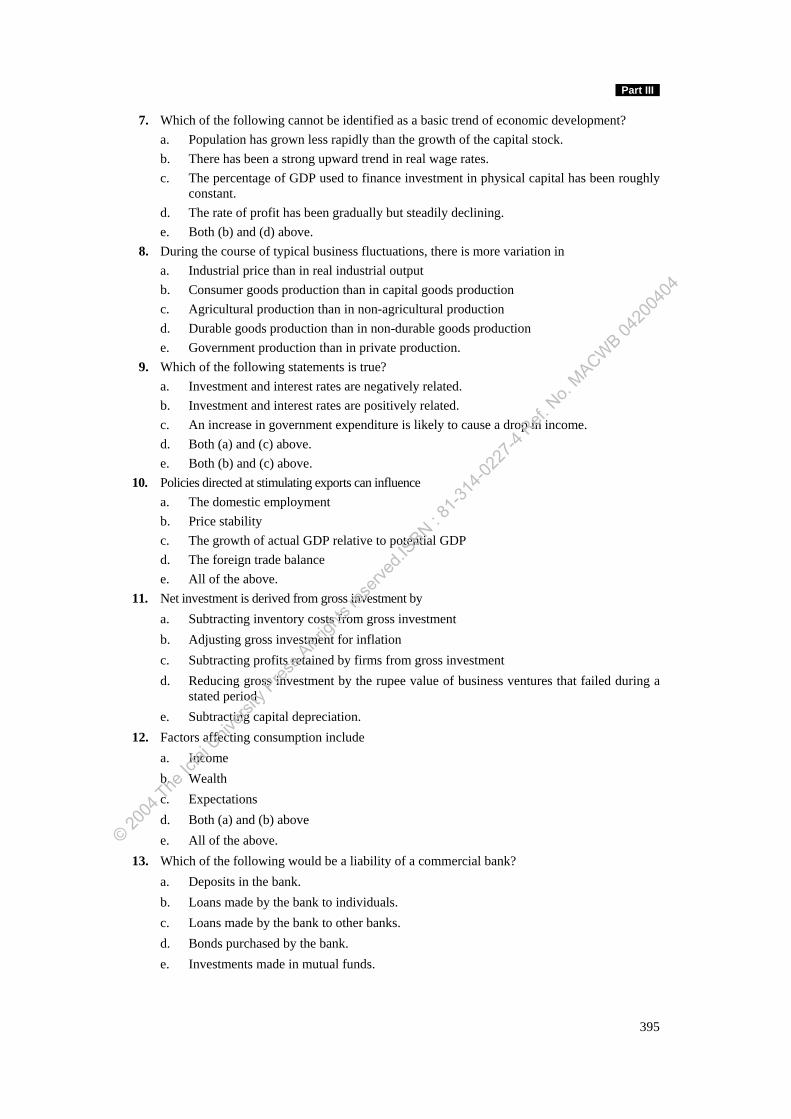
Part III
7. Which of the following cannot be identified as a basic trend of economic development? a. Population has grown less rapidly than the growth of the capital stock. b. There has been a strong upward trend in real wage rates. c. The percentage of GDP used to finance investment in physical capital has been roughly
constant. d. The rate of profit has been gradually but steadily declining. e. Both (b) and (d) above. 8. During the course of typical business fluctuations, there is more variation in a. Industrial price than in real industrial output b. Consumer goods production than in capital goods production c. Agricultural production than in non-agricultural production d. Durable goods production than in non-durable goods production e. Government production than in private production. 9. Which of the following statements is true? a. Investment and interest rates are negatively related. b. Investment and interest rates are positively related. c. An increase in government expenditure is likely to cause a drop in income. d. Both (a) and (c) above. e. Both (b) and (c) above. 10. Policies directed at stimulating exports can influence a. The domestic employment b. Price stability c. The growth of actual GDP relative to potential GDP d. The foreign trade balance e. All of the above. 11. Net investment is derived from gross investment by a. Subtracting inventory costs from gross investment b. Adjusting gross investment for inflation c. Subtracting profits retained by firms from gross investment d. Reducing gross investment by the rupee value of business ventures that failed during a
stated period e. Subtracting capital depreciation. 12. Factors affecting consumption include a. Income b. Wealth c. Expectations d. Both (a) and (b) above e. All of the above. 13. Which of the following would be a liability of a commercial bank? a. Deposits in the bank. b. Loans made by the bank to individuals. c. Loans made by the bank to other banks. d. Bonds purchased by the bank. e. Investments made in mutual funds.
395
© 2004
The Ic
fai U
nivers
ity P
ress.A
ll righ
ts res
erved
.ISBN : 8
1-314
-0227
-4 Ref.
No.
MACWB 04
2004
04
Macroeconomics
14. When a Central Bank wishes to increase the quantity of money held by the public, it
a. Sells bonds
b. Buys bonds
c. Sells goods or services
d. Buys goods or services
e. None of the above.
15. When Ct = f(Yd, t – 1)
a. There is an imperfect relationship between consumption and disposable income
b. There is no relationship between consumption and disposable income
c. Consumption spending lags the receipt of disposable income by one period
d. The receipt of disposable income lags consumption spending by one period
e. None of the above.
16. Which of the following is the largest deficit for the government?
a. Budget deficit.
b. Fiscal deficit.
c. Capital deficit.
d. Revenue deficit.
e. Primary deficit.
17. Which of the following model explains that people can quickly and easily adjust their living standards upwards but downward adjustment is very difficult?
a. Relative Income Hypothesis.
b. Permanent Income Hypothesis.
c. Life Cycle Hypothesis.
d. Inventory – Theoretic Approach.
e. Expectation Hypothesis.
18. When excise tax on cigarettes was hiked, it was found that total expenditure on cigarettes increased. A possible explanation is that
a. The tax increase was not passed onto consumer
b. People smoke more when cigarette prices go up
c. Income elasticity of demand for cigarettes is very high
d. Demand for cigarettes is price inelastic
e. None of the above.
19. Which of the following is true of I-S curve? When transfer payments are increased,
a. I-S curve will shift to the left
b. Slope of the I-S curve will increase
c. I-S curve will shift to the right
d. Slope of the I-S curve will decrease
e. I-S curve will not affect.
396
© 2004
The Ic
fai U
nivers
ity P
ress.A
ll righ
ts res
erved
.ISBN : 8
1-314
-0227
-4 Ref.
No.
MACWB 04
2004
04
Part III
20. GDP is not a very good measure of economic prosperity because
a. The expenditure and production methods of estimating GDP yield different results because of conceptual problems
b. It does not include non-monetized transactions/activities
c. It is purely a monetary measure
d. It does not include environmental degradation
e. Both (b) and (d) above.
21. The impact of a recession is likely to have a stronger impact on the economy when
a. MPC is larger
b. MPC is smaller
c. MPS is larger
d. MPS is smaller
e. Both (b) and (c) above. 22. In an inflationary period, an appropriate policy for the Reserve Bank of India would be to a. Sell government securities in the open market b. Encourage commercial banks to increase their loans c. Lower the cash reserve ratio d. Lower the bank rate e. None of the above. 23. In an economy during a particular year, GDP exceeds GNP. This must imply that a. Indirect taxes exceed subsidies b. Net factor income from abroad is negative c. Government tax revenue exceeds its expenditure d. The merchandize trade balance is in surplus e. Subsidies exceed indirect taxes. 24. A decline in foreign exchange reserves of a country, other things remaining the same will a. Cause a capital inflow into the country b. Cause a contraction of money supply in the country c. Force the country to borrow from foreign countries d. Increase the prices of imported goods e. None of the above. 25. When I sell a share for Rs.250 which I had bought for Rs.130 a. National income goes up b. Money supply goes up c. National income goes down d. High-powered money increases e. None of the above.
26. A current account deficit implies that
a. There is net debit balance in the merchandize account b. There is net credit balance in the merchandize account c. Foreign exchange outflows on account of imports of goods and services and gifts made
exceed inflows on account of exports of goods and services received d. Decrease in Foreign Exchange Reserves e. Increase in Foreign Exchange Reserves.
397
© 2004
The Ic
fai U
nivers
ity P
ress.A
ll righ
ts res
erved
.ISBN : 8
1-314
-0227
-4 Ref.
No.
MACWB 04
2004
04
Macroeconomics
27. Dynamic multipliers occur when a. The assumption of ceteris paribus is dropped b. The economy is not in equilibrium c. Consumption is unrelated to disposable income d. There is a lagged response between consumption and disposable income e. None of the above. 28. If the RBI raises the reserve ratio a. High-powered money and money supply must increase b. High-powered money will increase and money supply will decrease c. Both high-powered money and Money supply will decrease d. High-powered money will remain unchanged and money supply will decrease e. Outstanding bank credit will increase. 29. Stagflation is a period of a. High inflation b. Low inflation c. High unemployment d. Low unemployment e. Both (a) and (c) above.
30. Which of the following statements is true? a. GDP takes into account both transfer payments and leisure time. b. GDP takes into account transfer payments, but not leisure time. c. GDP takes into account leisure time, but not transfer payments. d. GDP takes into account neither transfer payments nor leisure time. e. GDP takes into account both the services of a housewife and services of a driver
engaged by a company. 31. If the marginal propensity to consume is zero, a decrease in investment would lead to a. A decrease in the equilibrium level of income by the same amount b. No change in the equilibrium level of income c. An unending downward spiral in equilibrium level of income d. An unending upward spiral in the equilibrium level of income e. An increase in the equilibrium level of income. 32. The government decreases both its expenditure and tax receipts by Rs.10 billion. This would a. Reduce the equilibrium level of income b. Increase the equilibrium level of income c. Reduce the equilibrium level of income only if the government had previously been
running a deficit d. Leave the equilibrium level of income unaffected e. Increase the equilibrium level of income only if the government had previously been
running a surplus. 33. “The money payments which are not due to any current productive activity on the part of
income receiver” is called a. Plan expenditure b. Transfer payments c. Consumption expenditure d. Past expenditure e. Either (b) or (d) above.
398
© 2004
The Ic
fai U
nivers
ity P
ress.A
ll righ
ts res
erved
.ISBN : 8
1-314
-0227
-4 Ref.
No.
MACWB 04
2004
04
Part III
34. Which of the following is/are not considered in the calculation of national income? i. Teaching in a class. ii. Shirt stitched by a father for his son. iii. Patient attended to by a doctor. iv. Services of a housewife. a. Both (i) and (ii) above. b. Both (i) and (iv) above. c. Both (ii) and (iv) above. d. Both (ii) and (iii) above. e. All (i), (ii), (iii) and (iv) above. 35. J M Keynes held that changes in the money supply a. Affect aggregate demand mainly by causing changes in the interest rate b. Affect aggregate demand mainly by causing changes in the price level c. Affect aggregate demand mainly by causing changes in the velocity of money d. Alone cannot affect output or employment e. All of the above. 36. National product at market prices is higher than national product at factor cost by the amount of a. Indirect taxes b. Subsidies c. Indirect taxes – subsidies d. Indirect taxes + subsidies e. Depreciation. 37. Which method is used to compute national income in India? a. Output method. b. Income method. c. Expenditure method. d. All of the above. e. Both (a) and (b) above. 38. The best single indicator of the standard of living is
a. Normal GNP
b. Real GNP
c. Per capita Normal GNP
d. Per capita Real GNP
e. None of the above.
39. Large government borrowings to finance its deficit will
a. Increase the supply of loanable funds
b. Exert downward pressure on interest rates
c. Have no impact on interest rates
d. Put upward pressure on interest rates
e. Makes it easier for the commercial sector to borrow money.
399
© 2004
The Ic
fai U
nivers
ity P
ress.A
ll righ
ts res
erved
.ISBN : 8
1-314
-0227
-4 Ref.
No.
MACWB 04
2004
04
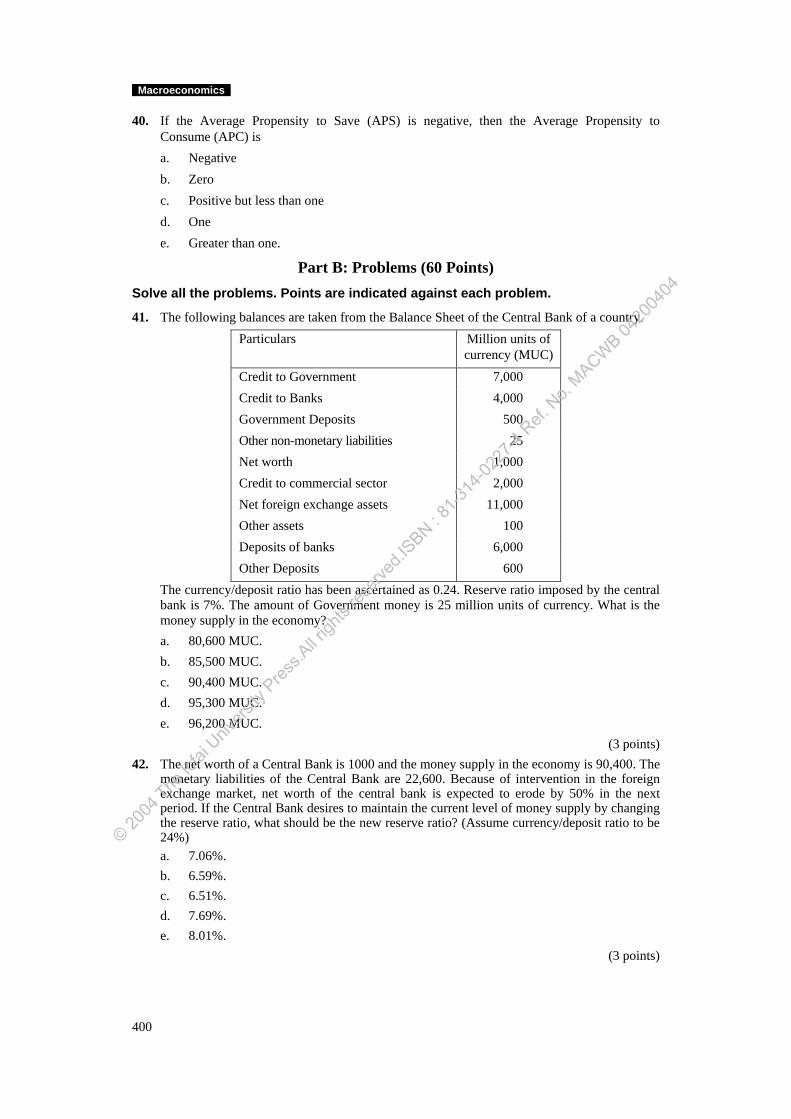
Macroeconomics
40. If the Average Propensity to Save (APS) is negative, then the Average Propensity to Consume (APC) is
a. Negative b. Zero c. Positive but less than one d. One e. Greater than one.
Part B: Problems (60 Points) Solve all the problems. Points are indicated against each problem.
41. The following balances are taken from the Balance Sheet of the Central Bank of a country. Particulars Million units of
currency (MUC)
Credit to Government 7,000 Credit to Banks 4,000 Government Deposits 500 Other non-monetary liabilities 25 Net worth 1,000 Credit to commercial sector 2,000 Net foreign exchange assets 11,000 Other assets 100 Deposits of banks 6,000 Other Deposits 600
The currency/deposit ratio has been ascertained as 0.24. Reserve ratio imposed by the central bank is 7%. The amount of Government money is 25 million units of currency. What is the money supply in the economy?
a. 80,600 MUC. b. 85,500 MUC. c. 90,400 MUC. d. 95,300 MUC. e. 96,200 MUC.
(3 points) 42. The net worth of a Central Bank is 1000 and the money supply in the economy is 90,400. The
monetary liabilities of the Central Bank are 22,600. Because of intervention in the foreign exchange market, net worth of the central bank is expected to erode by 50% in the next period. If the Central Bank desires to maintain the current level of money supply by changing the reserve ratio, what should be the new reserve ratio? (Assume currency/deposit ratio to be 24%)
a. 7.06%. b. 6.59%. c. 6.51%. d. 7.69%. e. 8.01%.
(3 points)
400
© 2004
The Ic
fai U
nivers
ity P
ress.A
ll righ
ts res
erved
.ISBN : 8
1-314
-0227
-4 Ref.
No.
MACWB 04
2004
04
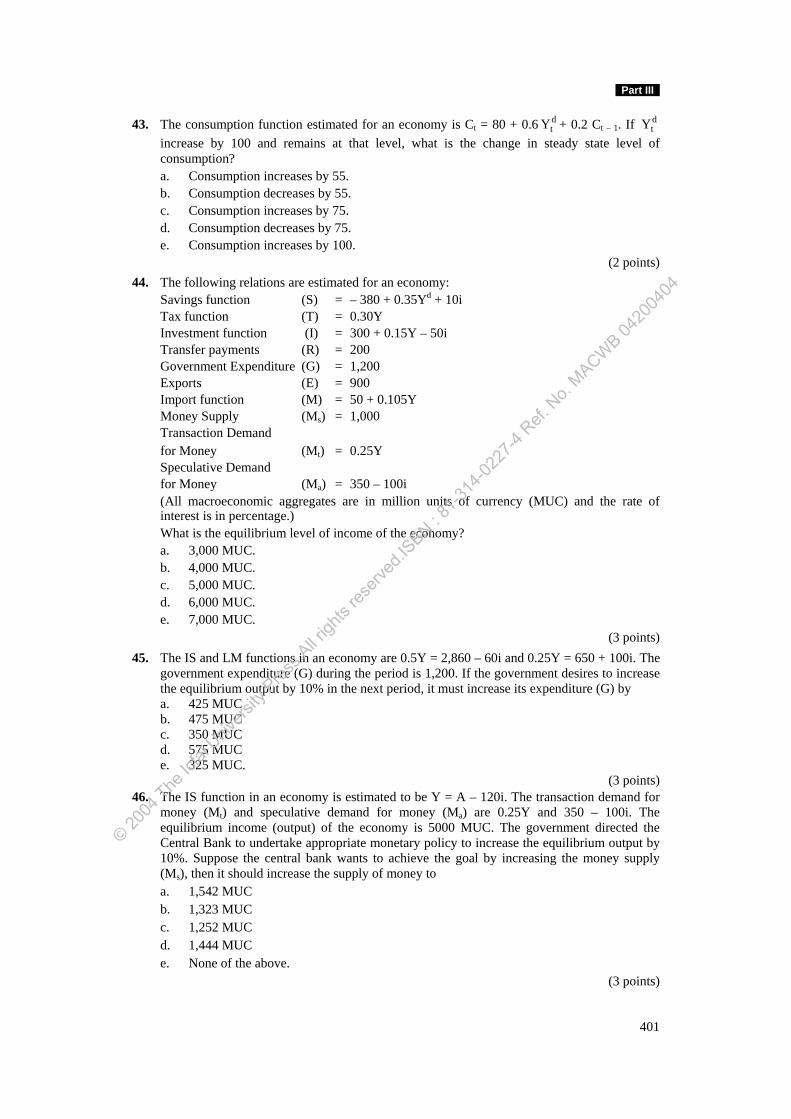
Part III
43. The consumption function estimated for an economy is Ct = 80 + 0.6 + 0.2 CdtY t – 1. If
increase by 100 and remains at that level, what is the change in steady state level of consumption?
dtY
a. Consumption increases by 55. b. Consumption decreases by 55. c. Consumption increases by 75. d. Consumption decreases by 75. e. Consumption increases by 100.
(2 points) 44. The following relations are estimated for an economy: Savings function (S) = – 380 + 0.35Yd + 10i Tax function (T) = 0.30Y Investment function (I) = 300 + 0.15Y – 50i Transfer payments (R) = 200 Government Expenditure (G) = 1,200 Exports (E) = 900 Import function (M) = 50 + 0.105Y Money Supply (Ms) = 1,000 Transaction Demand for Money (Mt) = 0.25Y Speculative Demand for Money (Ma) = 350 – 100i (All macroeconomic aggregates are in million units of currency (MUC) and the rate of
interest is in percentage.) What is the equilibrium level of income of the economy? a. 3,000 MUC. b. 4,000 MUC. c. 5,000 MUC. d. 6,000 MUC. e. 7,000 MUC.
(3 points) 45. The IS and LM functions in an economy are 0.5Y = 2,860 – 60i and 0.25Y = 650 + 100i. The
government expenditure (G) during the period is 1,200. If the government desires to increase the equilibrium output by 10% in the next period, it must increase its expenditure (G) by
a. 425 MUC b. 475 MUC c. 350 MUC d. 575 MUC e. 325 MUC.
(3 points) 46. The IS function in an economy is estimated to be Y = A – 120i. The transaction demand for
money (Mt) and speculative demand for money (Ma) are 0.25Y and 350 – 100i. The equilibrium income (output) of the economy is 5000 MUC. The government directed the Central Bank to undertake appropriate monetary policy to increase the equilibrium output by 10%. Suppose the central bank wants to achieve the goal by increasing the money supply (Ms), then it should increase the supply of money to
a. 1,542 MUC b. 1,323 MUC c. 1,252 MUC d. 1,444 MUC e. None of the above.
(3 points)
401
© 2004
The Ic
fai U
nivers
ity P
ress.A
ll righ
ts res
erved
.ISBN : 8
1-314
-0227
-4 Ref.
No.
MACWB 04
2004
04
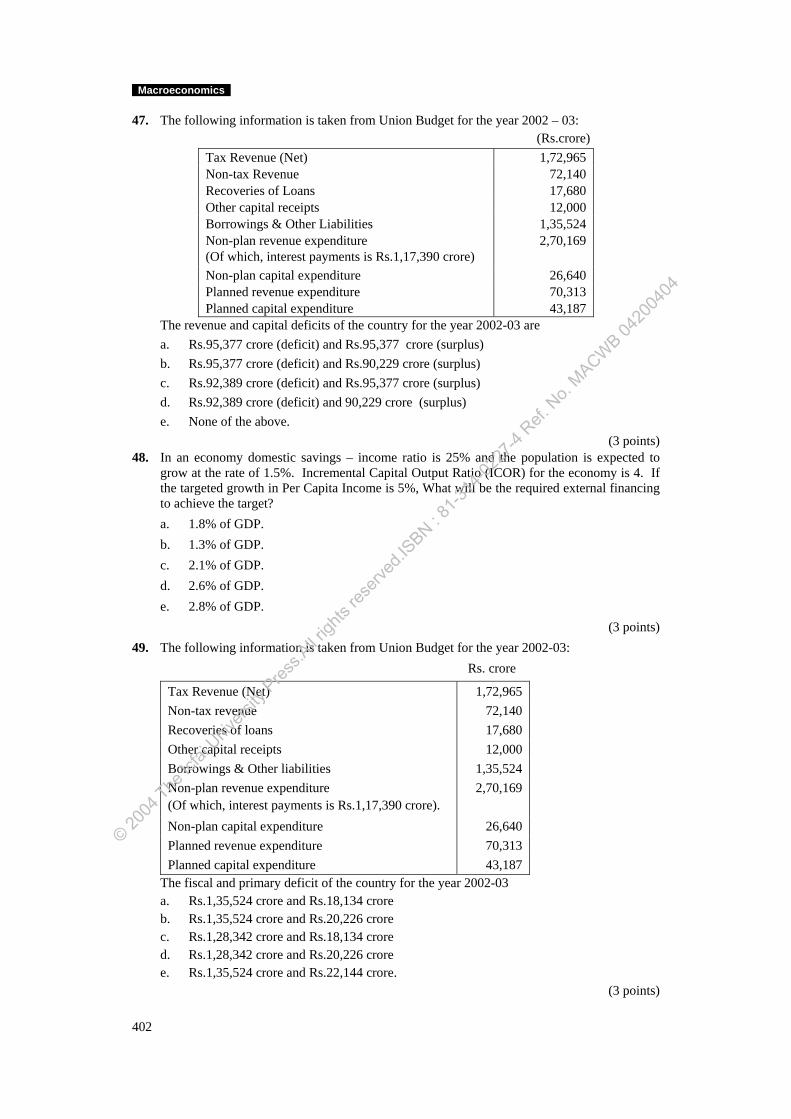
Macroeconomics
47. The following information is taken from Union Budget for the year 2002 – 03: (Rs.crore) Tax Revenue (Net) 1,72,965 Non-tax Revenue 72,140 Recoveries of Loans 17,680 Other capital receipts 12,000 Borrowings & Other Liabilities 1,35,524 Non-plan revenue expenditure (Of which, interest payments is Rs.1,17,390 crore)
2,70,169
Non-plan capital expenditure 26,640 Planned revenue expenditure 70,313 Planned capital expenditure 43,187
The revenue and capital deficits of the country for the year 2002-03 are a. Rs.95,377 crore (deficit) and Rs.95,377 crore (surplus) b. Rs.95,377 crore (deficit) and Rs.90,229 crore (surplus) c. Rs.92,389 crore (deficit) and Rs.95,377 crore (surplus) d. Rs.92,389 crore (deficit) and 90,229 crore (surplus) e. None of the above.
(3 points) 48. In an economy domestic savings – income ratio is 25% and the population is expected to
grow at the rate of 1.5%. Incremental Capital Output Ratio (ICOR) for the economy is 4. If the targeted growth in Per Capita Income is 5%, What will be the required external financing to achieve the target?
a. 1.8% of GDP. b. 1.3% of GDP. c. 2.1% of GDP. d. 2.6% of GDP. e. 2.8% of GDP.
(3 points) 49. The following information is taken from Union Budget for the year 2002-03: Rs. crore
Tax Revenue (Net) 1,72,965 Non-tax revenue 72,140 Recoveries of loans 17,680 Other capital receipts 12,000 Borrowings & Other liabilities 1,35,524 Non-plan revenue expenditure (Of which, interest payments is Rs.1,17,390 crore).
2,70,169
Non-plan capital expenditure 26,640 Planned revenue expenditure 70,313 Planned capital expenditure 43,187
The fiscal and primary deficit of the country for the year 2002-03 a. Rs.1,35,524 crore and Rs.18,134 crore b. Rs.1,35,524 crore and Rs.20,226 crore c. Rs.1,28,342 crore and Rs.18,134 crore d. Rs.1,28,342 crore and Rs.20,226 crore e. Rs.1,35,524 crore and Rs.22,144 crore.
(3 points)
402
© 2004
The Ic
fai U
nivers
ity P
ress.A
ll righ
ts res
erved
.ISBN : 8
1-314
-0227
-4 Ref.
No.
MACWB 04
2004
04
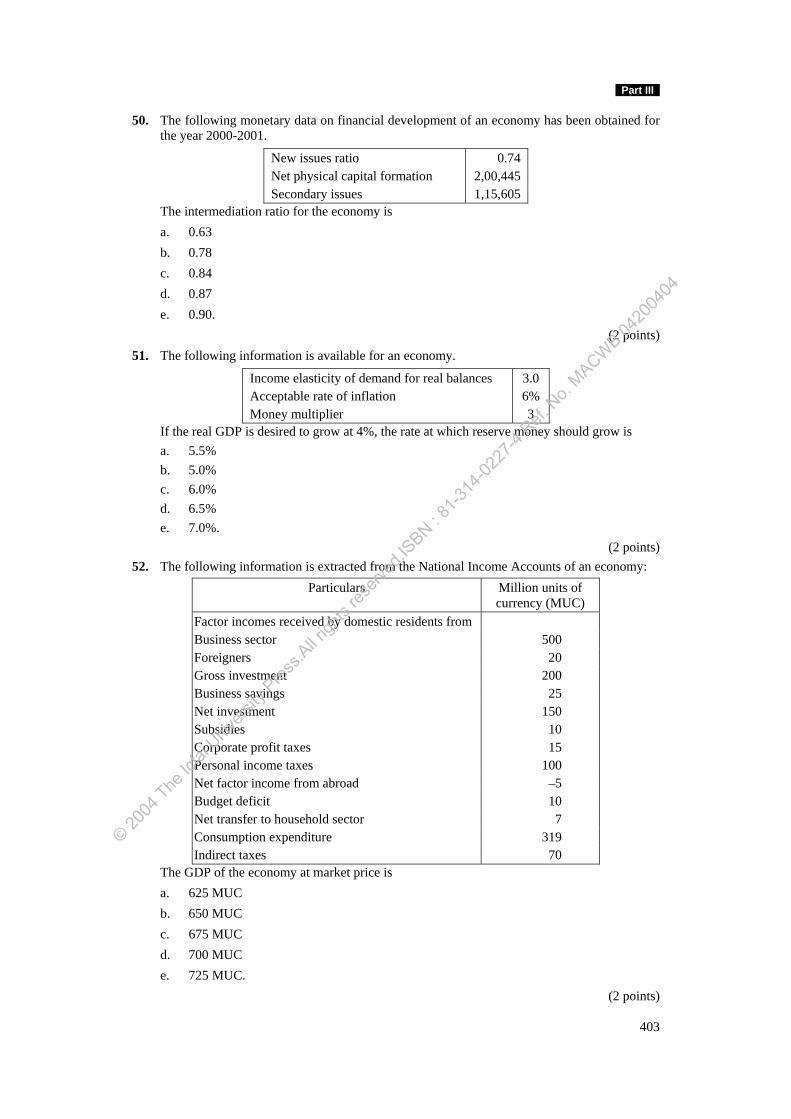
Part III
50. The following monetary data on financial development of an economy has been obtained for the year 2000-2001.
New issues ratio 0.74 Net physical capital formation 2,00,445 Secondary issues 1,15,605
The intermediation ratio for the economy is a. 0.63 b. 0.78 c. 0.84 d. 0.87 e. 0.90.
(2 points) 51. The following information is available for an economy.
Income elasticity of demand for real balances 3.0 Acceptable rate of inflation 6% Money multiplier 3
If the real GDP is desired to grow at 4%, the rate at which reserve money should grow is a. 5.5% b. 5.0% c. 6.0% d. 6.5% e. 7.0%.
(2 points) 52. The following information is extracted from the National Income Accounts of an economy:
Particulars Million units of currency (MUC)
Factor incomes received by domestic residents from Business sector 500 Foreigners 20 Gross investment 200 Business savings 25 Net investment 150 Subsidies 10 Corporate profit taxes 15 Personal income taxes 100 Net factor income from abroad –5 Budget deficit 10 Net transfer to household sector 7 Consumption expenditure 319 Indirect taxes 70
The GDP of the economy at market price is a. 625 MUC b. 650 MUC c. 675 MUC d. 700 MUC e. 725 MUC.
(2 points)
403
© 2004
The Ic
fai U
nivers
ity P
ress.A
ll righ
ts res
erved
.ISBN : 8
1-314
-0227
-4 Ref.
No.
MACWB 04
2004
04
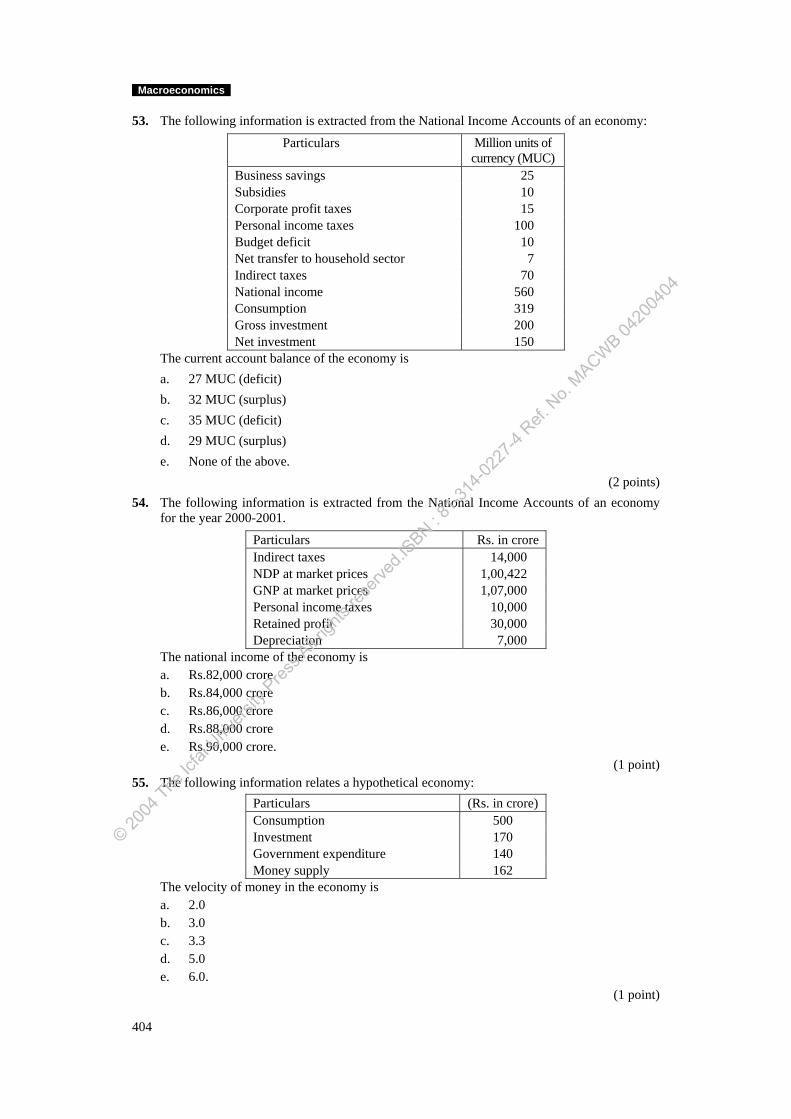
Macroeconomics
53. The following information is extracted from the National Income Accounts of an economy:
Particulars Million units of currency (MUC)
Business savings 25 Subsidies 10 Corporate profit taxes 15 Personal income taxes 100 Budget deficit 10 Net transfer to household sector 7 Indirect taxes 70 National income 560 Consumption 319 Gross investment 200 Net investment 150
The current account balance of the economy is a. 27 MUC (deficit) b. 32 MUC (surplus) c. 35 MUC (deficit) d. 29 MUC (surplus) e. None of the above.
(2 points) 54. The following information is extracted from the National Income Accounts of an economy
for the year 2000-2001.
Particulars Rs. in crore Indirect taxes 14,000 NDP at market prices 1,00,422 GNP at market prices 1,07,000 Personal income taxes 10,000 Retained profit 30,000 Depreciation 7,000
The national income of the economy is a. Rs.82,000 crore b. Rs.84,000 crore c. Rs.86,000 crore d. Rs.88,000 crore e. Rs.90,000 crore.
(1 point) 55. The following information relates a hypothetical economy:
Particulars (Rs. in crore) Consumption 500 Investment 170 Government expenditure 140 Money supply 162
The velocity of money in the economy is a. 2.0 b. 3.0 c. 3.3 d. 5.0 e. 6.0.
(1 point)
404
© 2004
The Ic
fai U
nivers
ity P
ress.A
ll righ
ts res
erved
.ISBN : 8
1-314
-0227
-4 Ref.
No.
MACWB 04
2004
04
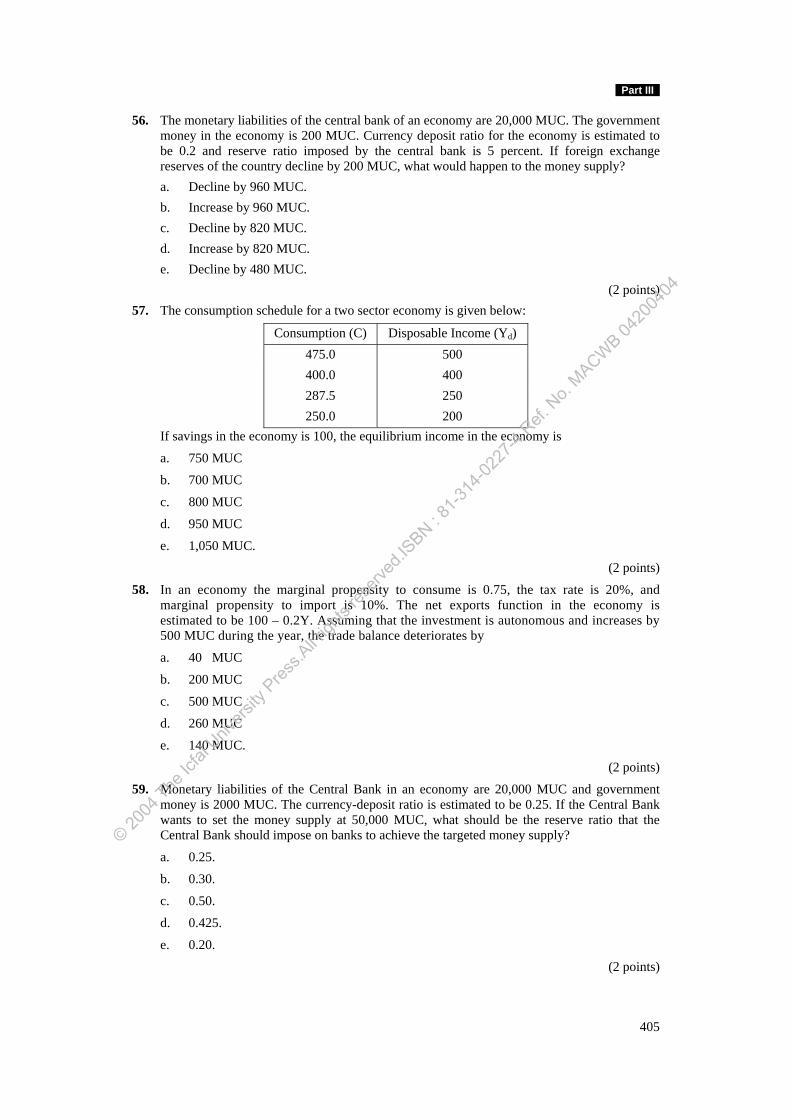
Part III
56. The monetary liabilities of the central bank of an economy are 20,000 MUC. The government money in the economy is 200 MUC. Currency deposit ratio for the economy is estimated to be 0.2 and reserve ratio imposed by the central bank is 5 percent. If foreign exchange reserves of the country decline by 200 MUC, what would happen to the money supply? a. Decline by 960 MUC. b. Increase by 960 MUC. c. Decline by 820 MUC. d. Increase by 820 MUC. e. Decline by 480 MUC.
(2 points) 57. The consumption schedule for a two sector economy is given below:
Consumption (C) Disposable Income (Yd) 475.0 500 400.0 400 287.5 250 250.0 200
If savings in the economy is 100, the equilibrium income in the economy is
a. 750 MUC
b. 700 MUC
c. 800 MUC
d. 950 MUC
e. 1,050 MUC.
(2 points)
58. In an economy the marginal propensity to consume is 0.75, the tax rate is 20%, and marginal propensity to import is 10%. The net exports function in the economy is estimated to be 100 – 0.2Y. Assuming that the investment is autonomous and increases by 500 MUC during the year, the trade balance deteriorates by
a. 40 MUC
b. 200 MUC
c. 500 MUC
d. 260 MUC
e. 140 MUC.
(2 points)
59. Monetary liabilities of the Central Bank in an economy are 20,000 MUC and government money is 2000 MUC. The currency-deposit ratio is estimated to be 0.25. If the Central Bank wants to set the money supply at 50,000 MUC, what should be the reserve ratio that the Central Bank should impose on banks to achieve the targeted money supply?
a. 0.25.
b. 0.30.
c. 0.50.
d. 0.425.
e. 0.20.
(2 points)
405
© 2004
The Ic
fai U
nivers
ity P
ress.A
ll righ
ts res
erved
.ISBN : 8
1-314
-0227
-4 Ref.
No.
MACWB 04
2004
04
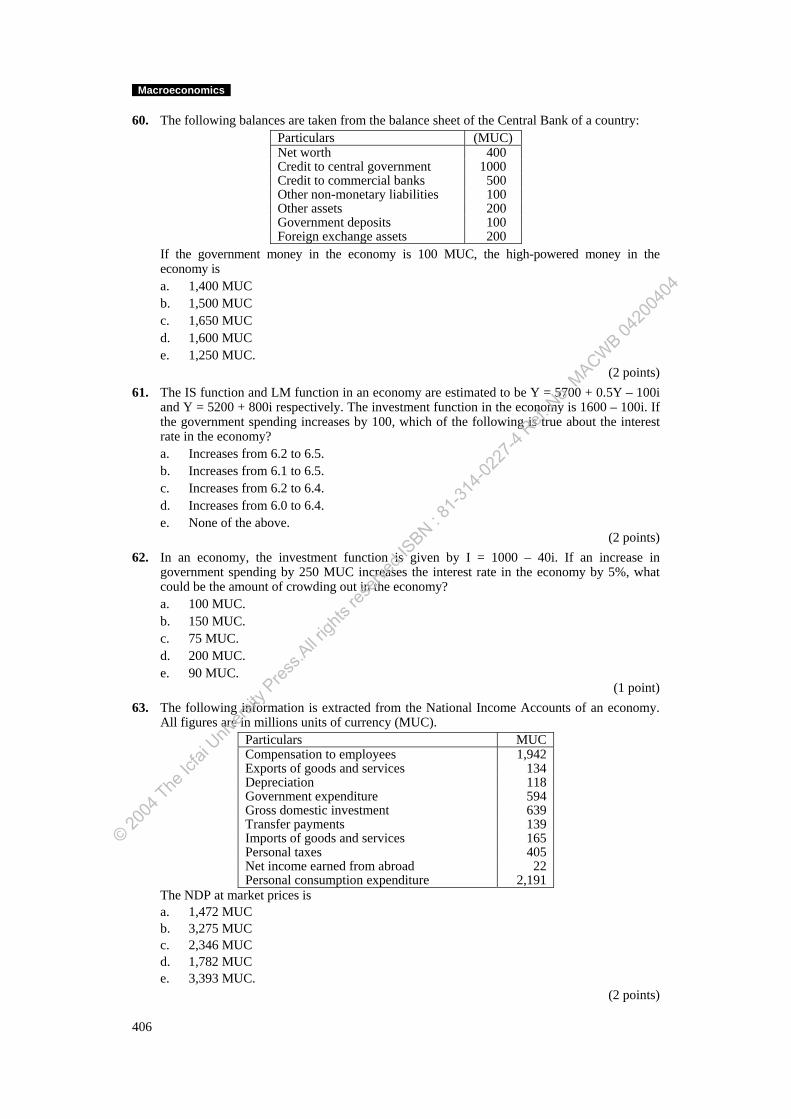
Macroeconomics
60. The following balances are taken from the balance sheet of the Central Bank of a country: Particulars (MUC) Net worth 400 Credit to central government 1000 Credit to commercial banks 500 Other non-monetary liabilities 100 Other assets 200 Government deposits 100 Foreign exchange assets 200
If the government money in the economy is 100 MUC, the high-powered money in the economy is a. 1,400 MUC b. 1,500 MUC c. 1,650 MUC d. 1,600 MUC e. 1,250 MUC.
(2 points) 61. The IS function and LM function in an economy are estimated to be Y = 5700 + 0.5Y – 100i
and Y = 5200 + 800i respectively. The investment function in the economy is 1600 – 100i. If the government spending increases by 100, which of the following is true about the interest rate in the economy? a. Increases from 6.2 to 6.5. b. Increases from 6.1 to 6.5. c. Increases from 6.2 to 6.4. d. Increases from 6.0 to 6.4. e. None of the above.
(2 points) 62. In an economy, the investment function is given by I = 1000 – 40i. If an increase in
government spending by 250 MUC increases the interest rate in the economy by 5%, what could be the amount of crowding out in the economy? a. 100 MUC. b. 150 MUC. c. 75 MUC. d. 200 MUC. e. 90 MUC.
(1 point) 63. The following information is extracted from the National Income Accounts of an economy.
All figures are in millions units of currency (MUC). Particulars MUC Compensation to employees 1,942 Exports of goods and services 134 Depreciation 118 Government expenditure 594 Gross domestic investment 639 Transfer payments 139 Imports of goods and services 165 Personal taxes 405 Net income earned from abroad 22 Personal consumption expenditure 2,191
The NDP at market prices is a. 1,472 MUC b. 3,275 MUC c. 2,346 MUC d. 1,782 MUC e. 3,393 MUC.
(2 points)
406
© 2004
The Ic
fai U
nivers
ity P
ress.A
ll righ
ts res
erved
.ISBN : 8
1-314
-0227
-4 Ref.
No.
MACWB 04
2004
04
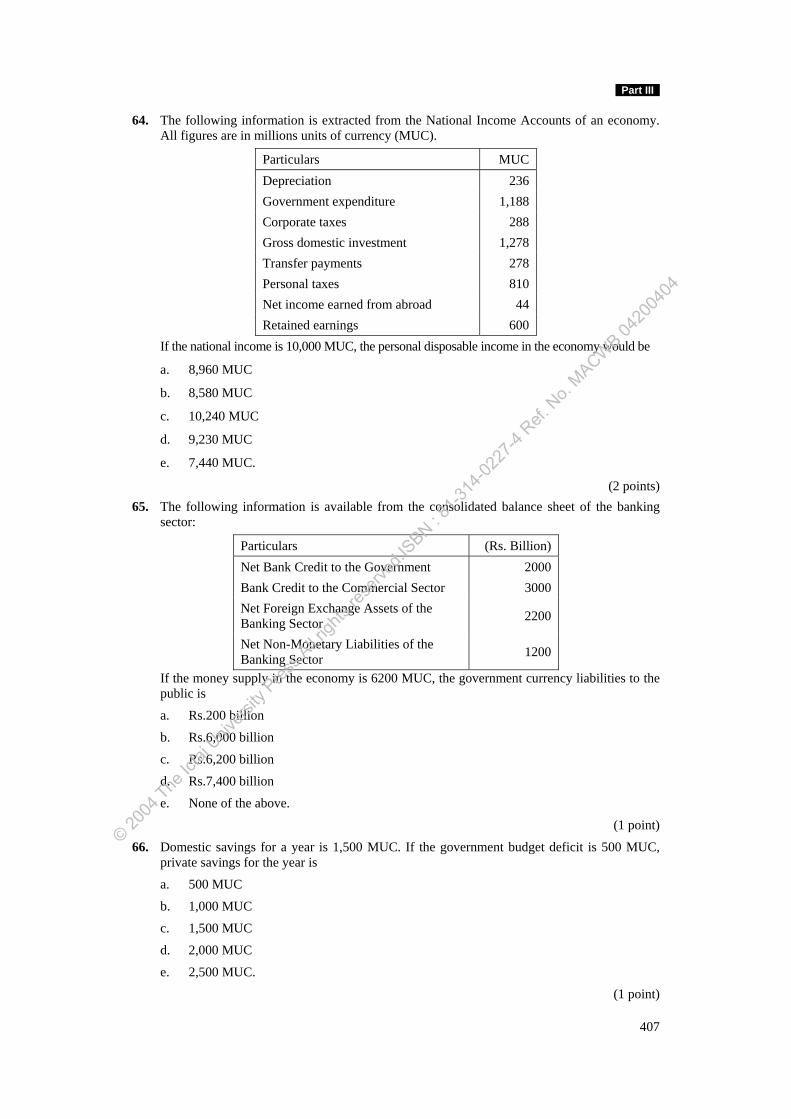
Part III
64. The following information is extracted from the National Income Accounts of an economy. All figures are in millions units of currency (MUC).
Particulars MUC Depreciation 236 Government expenditure 1,188 Corporate taxes 288 Gross domestic investment 1,278 Transfer payments 278 Personal taxes 810 Net income earned from abroad 44 Retained earnings 600
If the national income is 10,000 MUC, the personal disposable income in the economy would be
a. 8,960 MUC
b. 8,580 MUC
c. 10,240 MUC
d. 9,230 MUC
e. 7,440 MUC.
(2 points) 65. The following information is available from the consolidated balance sheet of the banking
sector:
Particulars (Rs. Billion) Net Bank Credit to the Government 2000 Bank Credit to the Commercial Sector 3000 Net Foreign Exchange Assets of the Banking Sector 2200
Net Non-Monetary Liabilities of the Banking Sector 1200
If the money supply in the economy is 6200 MUC, the government currency liabilities to the public is
a. Rs.200 billion
b. Rs.6,000 billion
c. Rs.6,200 billion
d. Rs.7,400 billion
e. None of the above.
(1 point)
66. Domestic savings for a year is 1,500 MUC. If the government budget deficit is 500 MUC, private savings for the year is
a. 500 MUC
b. 1,000 MUC
c. 1,500 MUC
d. 2,000 MUC
e. 2,500 MUC.
(1 point)
407
© 2004
The Ic
fai U
nivers
ity P
ress.A
ll righ
ts res
erved
.ISBN : 8
1-314
-0227
-4 Ref.
No.
MACWB 04
2004
04
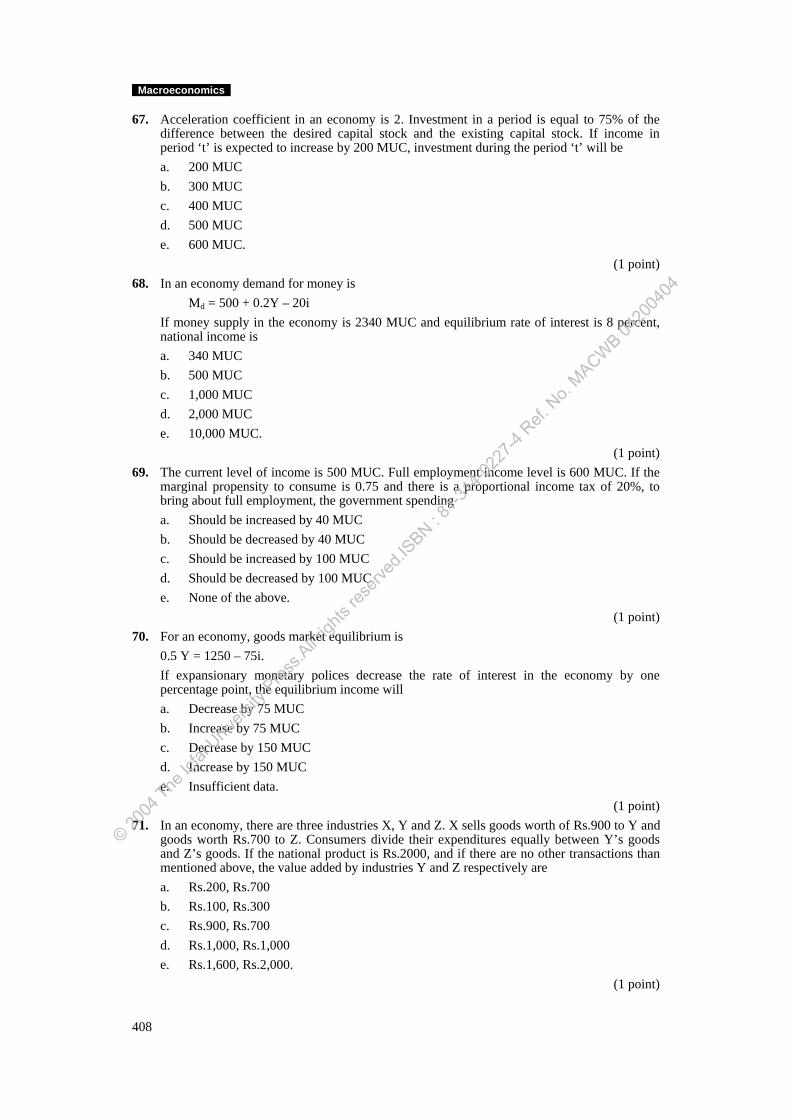
Macroeconomics
67. Acceleration coefficient in an economy is 2. Investment in a period is equal to 75% of the difference between the desired capital stock and the existing capital stock. If income in period ‘t’ is expected to increase by 200 MUC, investment during the period ‘t’ will be a. 200 MUC b. 300 MUC c. 400 MUC d. 500 MUC e. 600 MUC.
(1 point) 68. In an economy demand for money is Md = 500 + 0.2Y – 20i
If money supply in the economy is 2340 MUC and equilibrium rate of interest is 8 percent, national income is a. 340 MUC b. 500 MUC c. 1,000 MUC d. 2,000 MUC e. 10,000 MUC.
(1 point) 69. The current level of income is 500 MUC. Full employment income level is 600 MUC. If the
marginal propensity to consume is 0.75 and there is a proportional income tax of 20%, to bring about full employment, the government spending a. Should be increased by 40 MUC b. Should be decreased by 40 MUC c. Should be increased by 100 MUC d. Should be decreased by 100 MUC e. None of the above.
(1 point) 70. For an economy, goods market equilibrium is 0.5 Y = 1250 – 75i.
If expansionary monetary polices decrease the rate of interest in the economy by one percentage point, the equilibrium income will a. Decrease by 75 MUC b. Increase by 75 MUC c. Decrease by 150 MUC d. Increase by 150 MUC e. Insufficient data.
(1 point) 71. In an economy, there are three industries X, Y and Z. X sells goods worth of Rs.900 to Y and
goods worth Rs.700 to Z. Consumers divide their expenditures equally between Y’s goods and Z’s goods. If the national product is Rs.2000, and if there are no other transactions than mentioned above, the value added by industries Y and Z respectively are a. Rs.200, Rs.700 b. Rs.100, Rs.300 c. Rs.900, Rs.700 d. Rs.1,000, Rs.1,000 e. Rs.1,600, Rs.2,000.
(1 point)
408
© 2004
The Ic
fai U
nivers
ity P
ress.A
ll righ
ts res
erved
.ISBN : 8
1-314
-0227
-4 Ref.
No.
MACWB 04
2004
04
Model Question Paper IV Suggested Answers Part A: Basic Concepts
1. (b) An exogenous variable is one whose value is determined by forces outside the economic model. Hence, change in the exogenous variable is classified as an autonomous change.
2. (c) In a two sector model, equilibrium occurs when planned saving equals planned investment.
3. (b) Real GDP = Nominal GDP/GDP deflator. Hence, GDP deflator = Nominal GDP/Real GDP. 4. (e) If the level of aggregate demand were greater than the level of aggregate supply in the
economy, soon the inventory stock will be depleted, firms will recruit more labor to meet the increased demand, demand-pull inflation occurs, and labor will demand more wages.
5. (d) Velocity of money is the speed at which a given sum of money circulates in the economy, i.e. the average number of times a unit of money changes hands in a specified time period. GDP = MV, where M = money supply and V = velocity of money. Hence, velocity of money, V = GDP/Money supply.
6. (c) Supply of reserve is not a function of money. 7. (d) Economic development is defined as a process of economic transition involving the
structural and a raising of GNP and per capita income. From the fact ‘the rate of profit has been gradually but steadily declining’ we cannot identify the trend of economic development.
8. (d) There will be more variation in durable goods production than in non-durable goods production during ups and downs in the business cycles.
9. (a) Investment spending is addition to the firm’s capital such as machines or buildings typically firms borrow to purchase investment goods. Higher the interest rate, lesser will be willingness to borrow or invest. Firms want to borrow and invest more when interest rates are lower. This shows an inverse relationship between investment and interest rate.
10. (e) Policies directed to stimulating exports can influence all the given factors in an economy. 11. (e) Net investment = Gross investment – Capital depreciation. 12. (e) All the given factors affect the consumption behavior of individuals. 13. (a) Once deposits are made in a bank, the bank become liable to pay back our amount as per
specifications. Hence, deposits form a liability of a commercial bank. 14. (b) If the RBI purchases bonds from the public, the money flows from the RBI to the public,
which leads to an increase in money supply. 15. (c) When consumption spending lags the receipt of disposable income by one period, it is
given by Ct = f(Yd, t–1). 16. (b) Fiscal deficit is the largest deficit for the government. 17. (a) Relative income hypothesis states that people can easily and quickly adjust to higher
living standards, but adjust slowly for lower standards of living. 18. (d) The total expenditure in cigarettes increased irrespective of the like in excise tax because
income elasticity of demand for cigarettes is very high. 19. (c) Increase in autonomous expenditure results in an outward (rightward) shift of the IS
curve. As transfer payments is a part of government autonomous expenditure, increase in transfer payments results in increase of government autonomous expenditure, which make the IS curve to shift rightwards.
20. (e) GDP is not a very good measure of economic prosperity because, it does not include non-monetized transactions/activities. For example, the national product fails to account household production because such production does not include a market transaction. As a result the household services of millions of people are excluded from the national income accounts. Further, GDP does not include environmental degradation such as pollution, etc.
© 2004
The Ic
fai U
nivers
ity P
ress.A
ll righ
ts res
erved
.ISBN : 8
1-314
-0227
-4 Ref.
No.
MACWB 04
2004
04
Macroeconomics
21. (e) The impact of a recession is likely to have a stronger impact on the economy when MPC is smaller or MPS is larger. Note that MPC = 1 – MPS. Hence, if MPC is small, it indicates larger MPS.
22. (a) In an inflationary period, the RBI would undertake measures to reduce money supply in the economy to reduce inflation. Selling of government securities in the open market reduces the money supply, thereby helps to contain inflation.
23. (b) GNP = GDP + Net factor income from abroad (NIFA); this implies that when GDP exceeds GNP, net factor income from abroad will be negative.
24. (b) The foreign exchange reserves of a country apart from serving to balance the BoP statement of an economy have a strong impact on the monetary policy pursued by the central bank in the domestic sector. When foreign exchange reserves rises (declines), the money supply increases (decreases).
25. (e) Buying and selling stocks are not included in GDP, as it involves only swapping paper assets and the amount spent on these assets does not directly involve current production.
26. (c) Current account captures the transactions related to trade in goods and services, transfer payments and factor incomes. If foreign exchange outflow on account of these is more than inflows, the current account is in deficit.
27. (d) A single shock in autonomous demand produces a slow or distributed lag effect on output. Dynamic multiplier shows how a given change in autonomous investment affects the level of output overtime. Dynamic multipliers occur only when there is a lagged response between consumption and disposable income.
28. (c) Money Multiplier = (1 + Cu)/(Cu + r) Money Supply = [(1 + Cu)/(Cu + r)] x High powered money. Hence, if RBI increases the reserve ratio, money supply decreases. However, there will not
be any change in high-powered money, H. Note that changes in reserve ratio (r) and currency deposit (Cu) affect only money multiplier but not high-powered money (H).
29. (e) Stagflation is a period characterized by high inflation and high unemployment levels. 30. (d) In computing GDP transfer payments, leisure time and non-marketable services are not
taken into account. Therefore, the answer is (d). 31. (a) When MPC = 0
Multiplier = .101
1=
−Therefore, the equilibrium income would also decrease by the same
amount as decrease in investment. 32. (a) Reduce the equilibrium level of income because decrease in government expenditure
would reduce the AD by Rs.10 billion. Whereas decrease in tax receipts increase the AD by MPC × 10 billion. This results in net decrease in AD thereby reducing equilibrium level of income.
33. (b) Transfer payments are money payments which are not associated with any current production activity on the part of income receives.
34. (c) Alternatives ii and iv does not involve marketable transaction hence ignored in calculation of national income.
35. (a) The transmission mechanism in the Keynesian theory is
Change in Money supply → Change in r → Change in C & I → Change in AD.
36. (c) The relation between market price (MP) and factor cost (FC) is
MP = FC + Indirect taxes – Subsidies.
37. (d) All the three approaches are used to compute national income in India.
38. (d) Per capita real GNP is the best indicator of the standard of living.
410
© 2004
The Ic
fai U
nivers
ity P
ress.A
ll righ
ts res
erved
.ISBN : 8
1-314
-0227
-4 Ref.
No.
MACWB 04
2004
04
Part III
39. (d) Keeping the supply of loanable funds at the same level increase in government borrowings increase the demand for loanable funds and put upward pressure on the rate of interest.
40. (e) APS + APC = 1 If APS < 0 , APC > 1.
Part B: Problems 41. (c) High powered money = Monetary Liabilities of RBI + Government Money Monetary liabilities of RBI = Financial Assets + Other Assets – Non-monetary liabilities Financial Assets = Credit to Government + Credit to Banks + Credit to commercial sector
+ Net Foreign exchange assets = 7,000 + 4,000 + 2,000 + 11,000 = 24,000 MUC Other Assets = 100 MUC. Non-monetary liabilities = Government deposits + Other non-monetary liabilities + Net worth = 500 + 25 + 1,000 = 1,525 MUC ∴ Monetary liabilities = 24,000 + 100 – 1,525 = 22,575 MUC. Government money = 25 MUC ∴ High powered money (H) = 22,575 + 25 = 22,600 MUC Money Supply = H × m Money multiplier (m) = [(1 + 0.24)/(0.24 + 0.07)] = 4 Money Supply in the economy = 22,600 × 4 = 90,400 MUC. 42. (d) If net worth is eroded by 50%, Net worth = 500 MUC. ∴ Monetary liabilities = 22,600 + 500 = 23,100 H = 23,100. If money supply is held constant, 90,400 = 23,100 [(1 + 0.24)/(0.24 + r)] r = 0.0769 = 7.69% ∴ The central bank should increase the reserve ratio to 7.69%.
43. (c) Ct = 80 + 0.6 + 0.2 CdtY t – 1
At steady state, Ct = Ct – 1
∴ Ct = 80 + 0.6 + 0.2CdtY t
0.8 Ct = 80 + 0.6 dtY
Ct = 100 + 0.75 dtY
ΔCt = 0.75 × Δ dtY
= 0.75 × 100 = 75
∴ If increase by 100, steady state level of consumption increase by 75. dtY
411
© 2004
The Ic
fai U
nivers
ity P
ress.A
ll righ
ts res
erved
.ISBN : 8
1-314
-0227
-4 Ref.
No.
MACWB 04
2004
04
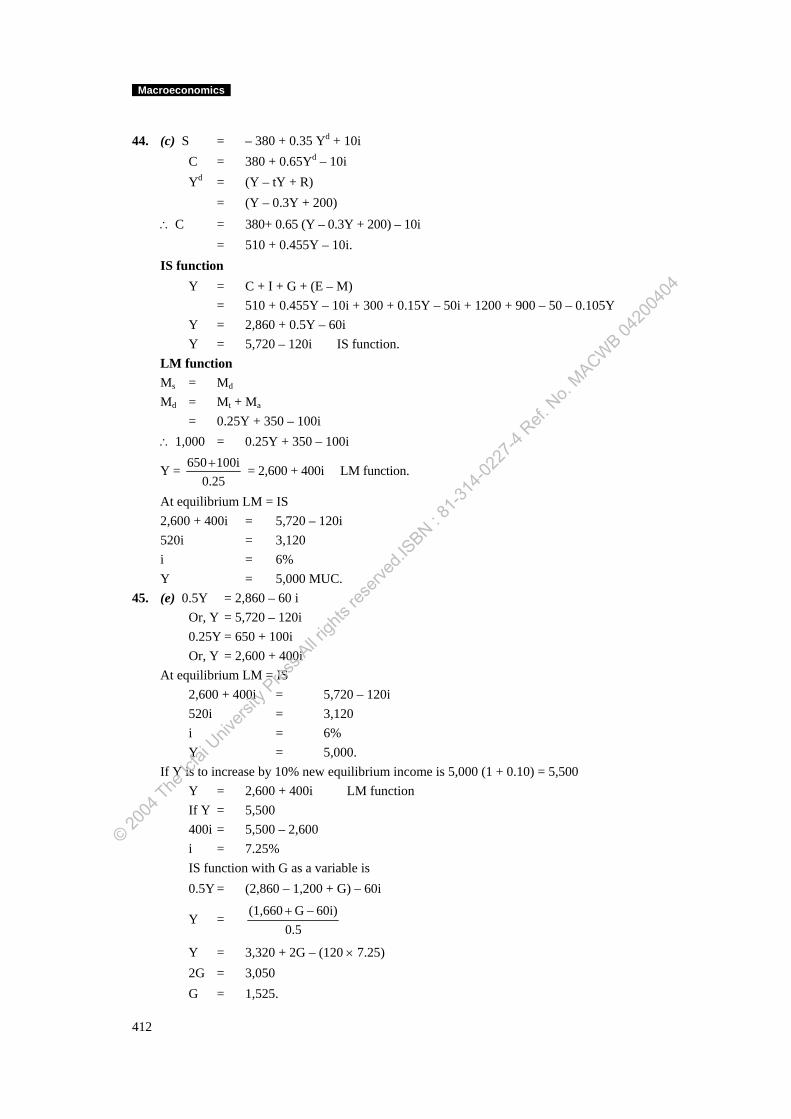
Macroeconomics
44. (c) S = – 380 + 0.35 Yd + 10i C = 380 + 0.65Yd – 10i Yd = (Y – tY + R) = (Y – 0.3Y + 200) ∴ C = 380+ 0.65 (Y – 0.3Y + 200) – 10i = 510 + 0.455Y – 10i. IS function Y = C + I + G + (E – M) = 510 + 0.455Y – 10i + 300 + 0.15Y – 50i + 1200 + 900 – 50 – 0.105Y Y = 2,860 + 0.5Y – 60i Y = 5,720 – 120i IS function. LM function Ms = Md
Md = Mt + Ma
= 0.25Y + 350 – 100i ∴ 1,000 = 0.25Y + 350 – 100i
Y = 0.25
100i650+ = 2,600 + 400i LM function.
At equilibrium LM = IS 2,600 + 400i = 5,720 – 120i 520i = 3,120 i = 6% Y = 5,000 MUC. 45. (e) 0.5Y = 2,860 – 60 i Or, Y = 5,720 – 120i 0.25Y = 650 + 100i Or, Y = 2,600 + 400i At equilibrium LM = IS 2,600 + 400i = 5,720 – 120i 520i = 3,120 i = 6% Y = 5,000. If Y is to increase by 10% new equilibrium income is 5,000 (1 + 0.10) = 5,500 Y = 2,600 + 400i LM function If Y = 5,500 400i = 5,500 – 2,600 i = 7.25% IS function with G as a variable is 0.5Y = (2,860 – 1,200 + G) – 60i
Y = 0.5
60i)G(1,660 −+
Y = 3,320 + 2G – (120 × 7.25) 2G = 3,050 G = 1,525.
412
© 2004
The Ic
fai U
nivers
ity P
ress.A
ll righ
ts res
erved
.ISBN : 8
1-314
-0227
-4 Ref.
No.
MACWB 04
2004
04
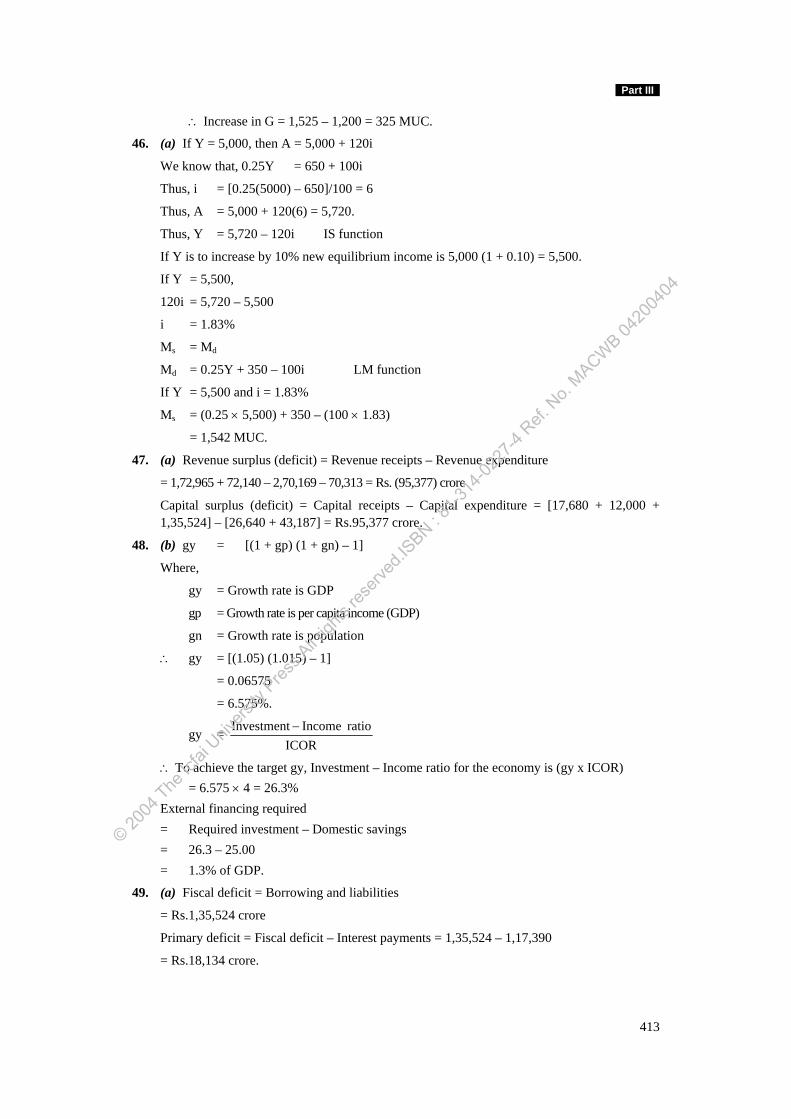
Part III
∴ Increase in G = 1,525 – 1,200 = 325 MUC.
46. (a) If Y = 5,000, then A = 5,000 + 120i
We know that, 0.25Y = 650 + 100i
Thus, i = [0.25(5000) – 650]/100 = 6
Thus, A = 5,000 + 120(6) = 5,720.
Thus, Y = 5,720 – 120i IS function
If Y is to increase by 10% new equilibrium income is 5,000 (1 + 0.10) = 5,500.
If Y = 5,500,
120i = 5,720 – 5,500
i = 1.83%
Ms = Md
Md = 0.25Y + 350 – 100i LM function
If Y = 5,500 and i = 1.83%
Ms = (0.25 × 5,500) + 350 – (100 × 1.83)
= 1,542 MUC.
47. (a) Revenue surplus (deficit) = Revenue receipts – Revenue expenditure
= 1,72,965 + 72,140 – 2,70,169 – 70,313 = Rs. (95,377) crore
Capital surplus (deficit) = Capital receipts – Capital expenditure = [17,680 + 12,000 + 1,35,524] – [26,640 + 43,187] = Rs.95,377 crore.
48. (b) gy = [(1 + gp) (1 + gn) – 1]
Where,
gy = Growth rate is GDP
gp = Growth rate is per capita income (GDP)
gn = Growth rate is population
∴ gy = [(1.05) (1.015) – 1]
= 0.06575
= 6.575%.
gy = ICOR
ratio IncomeInvestment −
∴ To achieve the target gy, Investment – Income ratio for the economy is (gy x ICOR) = 6.575 × 4 = 26.3% External financing required = Required investment – Domestic savings = 26.3 – 25.00 = 1.3% of GDP.
49. (a) Fiscal deficit = Borrowing and liabilities
= Rs.1,35,524 crore
Primary deficit = Fiscal deficit – Interest payments = 1,35,524 – 1,17,390
= Rs.18,134 crore.
413
© 2004
The Ic
fai U
nivers
ity P
ress.A
ll righ
ts res
erved
.ISBN : 8
1-314
-0227
-4 Ref.
No.
MACWB 04
2004
04
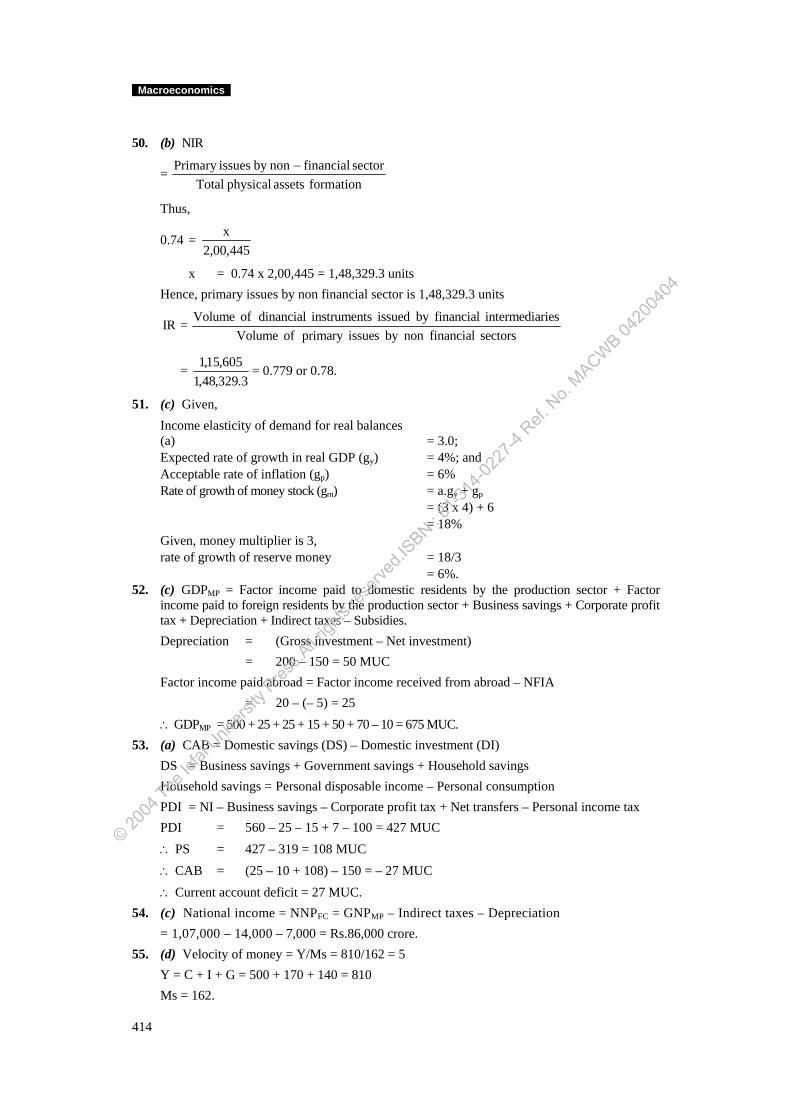
Macroeconomics
50. (b) NIR
= formationassetsphysicalTotal
sectorfinancialnonbyissuesPrimary −
Thus,
0.74 = 445,00,2
x
x = 0.74 x 2,00,445 = 1,48,329.3 units Hence, primary issues by non financial sector is 1,48,329.3 units
Volume of dinancial instruments issued by financial intermediariesIR =Volume of primary issues by non financial sectors
= 3.329,48,1
605,15,1 = 0.779 or 0.78.
51. (c) Given, Income elasticity of demand for real balances (a) = 3.0; Expected rate of growth in real GDP (gy) = 4%; and Acceptable rate of inflation (gp) = 6% Rate of growth of money stock (gm) = a.gy + gp
= (3 x 4) + 6 = 18% Given, money multiplier is 3, rate of growth of reserve money = 18/3 = 6%.
52. (c) GDPMP = Factor income paid to domestic residents by the production sector + Factor income paid to foreign residents by the production sector + Business savings + Corporate profit tax + Depreciation + Indirect taxes – Subsidies.
Depreciation = (Gross investment – Net investment) = 200 – 150 = 50 MUC Factor income paid abroad = Factor income received from abroad – NFIA = 20 – (– 5) = 25 ∴ GDPMP = 500 + 25 + 25 + 15 + 50 + 70 – 10 = 675 MUC. 53. (a) CAB = Domestic savings (DS) – Domestic investment (DI) DS = Business savings + Government savings + Household savings Household savings = Personal disposable income – Personal consumption PDI = NI – Business savings – Corporate profit tax + Net transfers – Personal income tax PDI = 560 – 25 – 15 + 7 – 100 = 427 MUC ∴ PS = 427 – 319 = 108 MUC ∴ CAB = (25 – 10 + 108) – 150 = – 27 MUC ∴ Current account deficit = 27 MUC. 54. (c) National income = NNPFC = GNPMP – Indirect taxes – Depreciation = 1,07,000 – 14,000 – 7,000 = Rs.86,000 crore. 55. (d) Velocity of money = Y/Ms = 810/162 = 5 Y = C + I + G = 500 + 170 + 140 = 810 Ms = 162.
414
© 2004
The Ic
fai U
nivers
ity P
ress.A
ll righ
ts res
erved
.ISBN : 8
1-314
-0227
-4 Ref.
No.
MACWB 04
2004
04
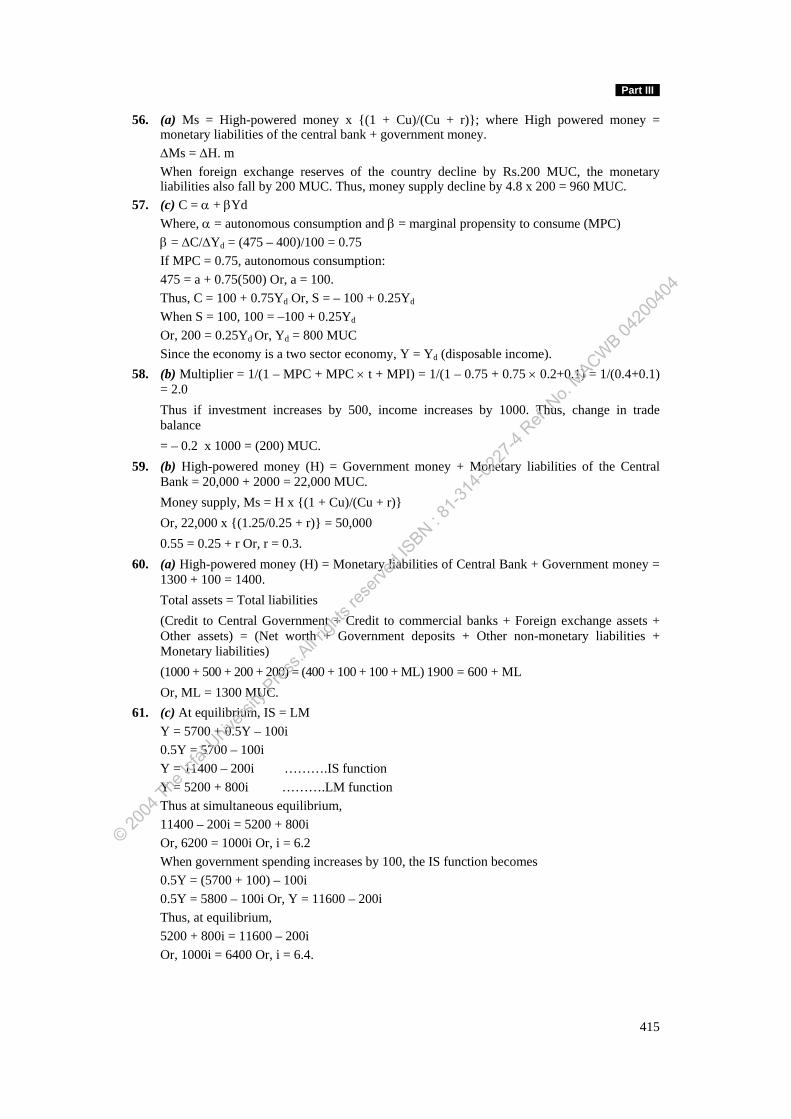
Part III
56. (a) Ms = High-powered money x {(1 + Cu)/(Cu + r)}; where High powered money = monetary liabilities of the central bank + government money. ΔMs = ΔH. m When foreign exchange reserves of the country decline by Rs.200 MUC, the monetary liabilities also fall by 200 MUC. Thus, money supply decline by 4.8 x 200 = 960 MUC.
57. (c) C = α + βYd Where, α = autonomous consumption and β = marginal propensity to consume (MPC) β = ΔC/ΔYd = (475 – 400)/100 = 0.75 If MPC = 0.75, autonomous consumption: 475 = a + 0.75(500) Or, a = 100. Thus, C = 100 + 0.75Yd Or, S = – 100 + 0.25Yd
When S = 100, 100 = –100 + 0.25Yd Or, 200 = 0.25Yd Or, Yd = 800 MUC Since the economy is a two sector economy, Y = Yd (disposable income).
58. (b) Multiplier = 1/(1 – MPC + MPC × t + MPI) = 1/(1 – 0.75 + 0.75 × 0.2+0.1) = 1/(0.4+0.1) = 2.0 Thus if investment increases by 500, income increases by 1000. Thus, change in trade balance = – 0.2 x 1000 = (200) MUC.
59. (b) High-powered money (H) = Government money + Monetary liabilities of the Central Bank = 20,000 + 2000 = 22,000 MUC. Money supply, Ms = H x {(1 + Cu)/(Cu + r)} Or, 22,000 x {(1.25/0.25 + r)} = 50,000 0.55 = 0.25 + r Or, r = 0.3.
60. (a) High-powered money (H) = Monetary liabilities of Central Bank + Government money = 1300 + 100 = 1400.
Total assets = Total liabilities (Credit to Central Government + Credit to commercial banks + Foreign exchange assets + Other assets) = (Net worth + Government deposits + Other non-monetary liabilities + Monetary liabilities) (1000 + 500 + 200 + 200) = (400 + 100 + 100 + ML) 1900 = 600 + ML Or, ML = 1300 MUC.
61. (c) At equilibrium, IS = LM Y = 5700 + 0.5Y – 100i 0.5Y = 5700 – 100i Y = 11400 – 200i ……….IS function Y = 5200 + 800i ……….LM function Thus at simultaneous equilibrium, 11400 – 200i = 5200 + 800i
Or, 6200 = 1000i Or, i = 6.2 When government spending increases by 100, the IS function becomes 0.5Y = (5700 + 100) – 100i 0.5Y = 5800 – 100i Or, Y = 11600 – 200i Thus, at equilibrium, 5200 + 800i = 11600 – 200i Or, 1000i = 6400 Or, i = 6.4.
415
© 2004
The Ic
fai U
nivers
ity P
ress.A
ll righ
ts res
erved
.ISBN : 8
1-314
-0227
-4 Ref.
No.
MACWB 04
2004
04
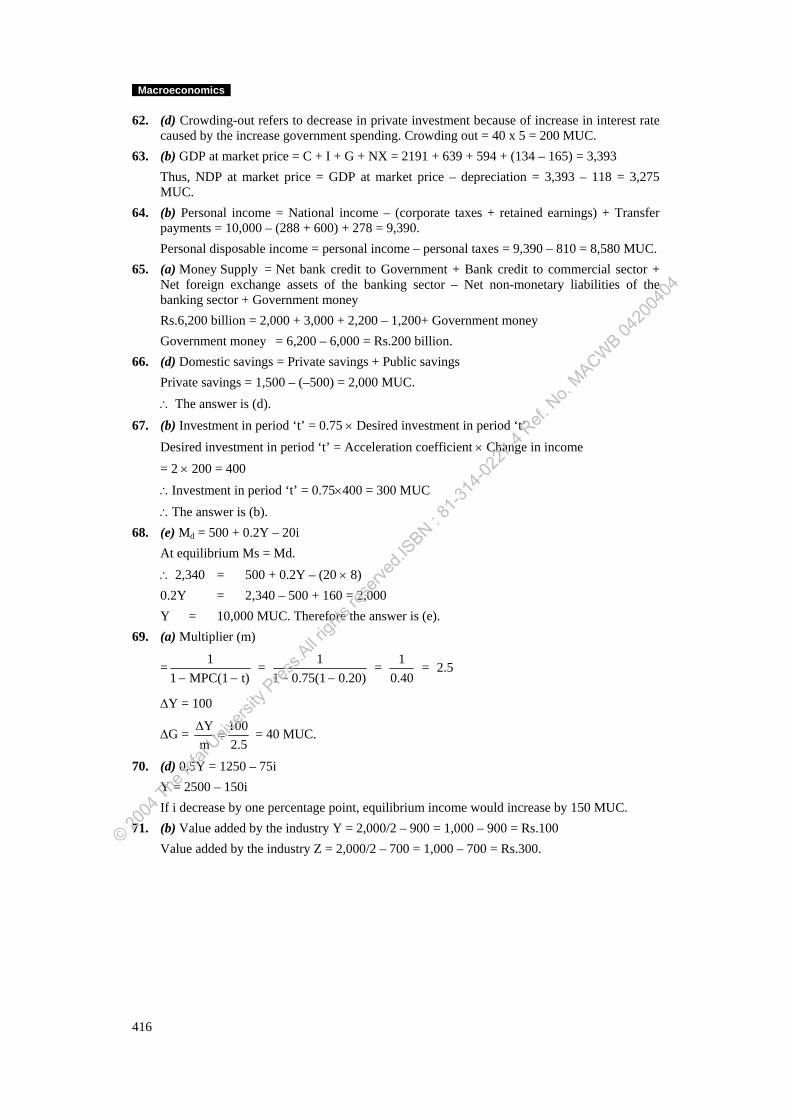
Macroeconomics
62. (d) Crowding-out refers to decrease in private investment because of increase in interest rate caused by the increase government spending. Crowding out = 40 x 5 = 200 MUC.
63. (b) GDP at market price = C + I + G + NX = 2191 + 639 + 594 + (134 – 165) = 3,393 Thus, NDP at market price = GDP at market price – depreciation = 3,393 – 118 = 3,275 MUC.
64. (b) Personal income = National income – (corporate taxes + retained earnings) + Transfer payments = 10,000 – (288 + 600) + 278 = 9,390. Personal disposable income = personal income – personal taxes = 9,390 – 810 = 8,580 MUC.
65. (a) Money Supply = Net bank credit to Government + Bank credit to commercial sector + Net foreign exchange assets of the banking sector – Net non-monetary liabilities of the banking sector + Government money
Rs.6,200 billion = 2,000 + 3,000 + 2,200 – 1,200+ Government money Government money = 6,200 – 6,000 = Rs.200 billion. 66. (d) Domestic savings = Private savings + Public savings
Private savings = 1,500 – (–500) = 2,000 MUC. ∴ The answer is (d).
67. (b) Investment in period ‘t’ = 0.75 × Desired investment in period ‘t’ Desired investment in period ‘t’ = Acceleration coefficient × Change in income
= 2 × 200 = 400 ∴Investment in period ‘t’ = 0.75×400 = 300 MUC ∴The answer is (b).
68. (e) Md = 500 + 0.2Y – 20i At equilibrium Ms = Md. ∴ 2,340 = 500 + 0.2Y – (20 × 8) 0.2Y = 2,340 – 500 + 160 = 2,000 Y = 10,000 MUC. Therefore the answer is (e).
69. (a) Multiplier (m)
= 1 1 1= =1 MPC(1 t) 1 0.75(1 0.20) 0.40− − − −
= 2.5
ΔY = 100
ΔG = Y 100m 2.5Δ
= = 40 MUC.
70. (d) 0.5Y = 1250 – 75i Y = 2500 – 150i If i decrease by one percentage point, equilibrium income would increase by 150 MUC.
71. (b) Value added by the industry Y = 2,000/2 – 900 = 1,000 – 900 = Rs.100 Value added by the industry Z = 2,000/2 – 700 = 1,000 – 700 = Rs.300.
416
© 2004
The Ic
fai U
nivers
ity P
ress.A
ll righ
ts res
erved
.ISBN : 8
1-314
-0227
-4 Ref.
No.
MACWB 04
2004
04
Model Question Paper V Time: 3 Hours
Part A: Basic Concepts (40 Points)
Answer all the questions. Each question carries one point. 1. On the basis of the Keynesian model of output determination, the multiplier effect means that a. An increase in investment will increase consumption more than itself b. An increase in investment will increase output by more than itself c. An increase in investment will increase output by as much as itself d. An increase in investment will increase saving by more than itself e. An increase in investment will increase consumption by less than itself.
2. In the equation C = C + cY, C is a. A parameter helping to determine the level of consumption b. A parameter whose value depends upon the level of disposable income c. A behavioral coefficient d. A dependent variable e. None of the above. 3. The circular flow of income for a private sector model shows a. The flow of income between the household and business sectors b. The flow of income between the government and business sectors c. The flow of income between the household, business and government sectors d. The flow of income to the household and government sectors e. None of the above. 4. Primary factors of production are a. Labor, land and capital b. Labor and capital c. Land and capital d. Labor and land e. Irreplaceable inputs. 5. The result of subtracting a depreciation allowance from GDP is a. Disposable income b. Personal income c. Net domestic product d. Yearly capital expenditure e. Adjusted gross domestic product. 6. If people do not consume all their incomes and if they put the unspent amount into a bank,
they are, in national income and product terms a. Saving but not investing b. Investing but not saving c. Both saving and investing d. Neither saving nor investing e. Saving, but investing only to the extent that they buy securities.
© 2004
The Ic
fai U
nivers
ity P
ress.A
ll righ
ts res
erved
.ISBN : 8
1-314
-0227
-4 Ref.
No.
MACWB 04
2004
04
Macroeconomics
7. When we speak of expressing the prices of goods in an economy, we are speaking primarily of money’s role as
a. A store of value or wealth
b. A precautionary hedge
c. A medium of exchange
d. A unit of account
e. A standard of deferred payments.
8. Suppose that the supply of money were fixed. An increase in the demand for money should be expected to cause
a. The equilibrium rate of interest to increase
b. The equilibrium quantity of money demanded to increase
c. Either answer (a) or (b), depending upon the circumstance
d. Both answers (a) and (b), without reservations
e. None of the above.
9. Stagflation is usually caused by
a. Supply shocks
b. Fiscal policy
c. Monetary policy
d. Budget deficit
e. Trade policy.
10. An expansion phase of the usual business cycle can be most appropriately represented as
a. An outward shift in the aggregate demand curve
b. A downward shift in the aggregate demand curve
c. An upward shift in the aggregate supply curve
d. A downward shift in the aggregate supply curve
e. A rotation of the aggregate supply curve to a more vertical position.
11. A Keynesian economist thinks that
a. Government spending always crowds-out private investment and spending
b. Higher government spending can be accomplished without crowding-out in the short run
c. Unemployment is a disequilibrium situation that cannot persist very long
d. Stabilization policy is usually futile
e. Government spending cannot crowd-out private investment and spending.
12. If you want to compute disposable personal income from NDP, then one thing you must not do is
a. Deduct depreciation
b. Add government transfer payments
c. Deduct indirect business taxes
d. Deduct social security levies
e. Deduct undistributed corporation profits.
418
© 2004
The Ic
fai U
nivers
ity P
ress.A
ll righ
ts res
erved
.ISBN : 8
1-314
-0227
-4 Ref.
No.
MACWB 04
2004
04
Part III
13. In deciding whether to hold money on other interest-bearing assets, people will compare a. The inflation rate and the nominal interest rate on the other investment b. The nominal interest rate on money and the nominal interest rate on the other investment c. The value of the other asset and the stream of future profits from it d. The purchasing power of the money and the loss incurred due to foregone consumption e. Only the inflation rate. 14. Most models of economic growth conclude that a. Technological change will impoverish at least one factor of production b. Technological change can benefit at most one factor of production c. Technological advance increases labor’s share of output d. Technological advance can increase the real returns to all factors of production e. Technological change is usually the enemy of labor because pieces of capital can
replace labor in the workplace. 15. In stating that C = f(Yd, W) a. It is hypothesized that Yd is a more important determinant of C than W b. It is hypothesized that W is a more important determinant of C than Yd c. W and Yd are dependent variables explaining C d. Yd and W are independent variables explaining C e. None of the above. 16. When the LM curve is very steep, an increase in autonomous government expenditure a. Will have little impact on rate of interest and will result in an increase in income b. Will have little impact on income and mainly interest rate will increase c. Will significantly reduce interest rate and increase level of income d. Will have little effect on interest rate and income e. Will have high impact on rate of interest and will result in a decrease in income. 17. Narrow money includes currency with public, demand portion of savings deposits and a. Demand and time deposits with banks and other deposits with RBI b. Demand and time deposits with banks
c. Demand deposits with banks and other deposits with RBI d. Demand deposits with banks and other deposits with RBI and post office savings deposits e. Demand deposits with banks and other deposits with RBI, and post office savings
deposits and time deposits. 18. A decrease in currency-deposit ratio on the part of the public will cause a. An increase in high-powered money and money supply b. An increase in bank reserves and decrease in money supply c. An increase in money supply but will not change the high-powered money d. A decrease in money supply while the high-powered money will not change e. A decrease in money supply while the high-powered money will increase. 19. Which of the following is a ‘transfer payment’? a. The payment received by a Central Government employee from the Central Government
on his being transferred from Delhi to Chennai, to meet the traveling expenses. b. A pension cheque received by former railway employee. c. Payment received from the neighbors for caring for their garden while they were on
vacation. d. The payment received by teacher. e. The payment received by nurse for taking care of a child.
419
© 2004
The Ic
fai U
nivers
ity P
ress.A
ll righ
ts res
erved
.ISBN : 8
1-314
-0227
-4 Ref.
No.
MACWB 04
2004
04
Macroeconomics
20. In a simple model of a closed economy the government expenditure is assumed to the exogenous. While calculating the income multiplier, marginal propensity to consume is considered and marginal propensity to invest is not considered. This is because
a. Only consumption of consumer goods is related to income level
b. Investment is assumed to be exogenous
c. Macroeconomic models are usually based on simplistic assumptions
d. Investment is assumed to be consistent
e. None of the above.
21. Government deposits with the RBI are
a. Part of high-powered money but not of money supply
b. A non-monetary liabilities of the RBI
c. Part of money supply but not high-powered money
d. Part of both high-powered money and money supply
e. None of the above.
22. Suppose the net export function is NX = X – mY and the net export balance is zero. An increase in autonomous investment spending will
a. Increase the net export balance and the income level
b. Increase the income level but make the net export balance negative
c. Increase the income level and have no effect upon the net export balance
d. Have no effect upon the income level but cause the net export balance to become negative
e. None of the above.
23. Which of the following is false?
a. Speculative demand for money varies directly with the interest rate.
b. If the frequency at which a person receives income is increased, transactionary demand for money increases.
c. Transactionary demand for money varies positively with income and such variation is usually more than proportionate.
d. Both (a) and (b) above.
e. All of (a), (b) and (c) above.
24. If the marginal propensity to consume is zero, a decrease in investment would lead to
a. A decrease in the equilibrium level of income by the same amount
b. No change in the equilibrium level of income
c. An unending downward spiral in the equilibrium level of income
d. An unending upward spiral in the equilibrium level of income
e. An increase in the equilibrium level of income by the same amount.
25. Which of the following components of Investment can be negative?
a. Plant and machinery.
b. Residential construction.
c. Inventory.
d. Non-residential construction.
e. None of the above.
420
© 2004
The Ic
fai U
nivers
ity P
ress.A
ll righ
ts res
erved
.ISBN : 8
1-314
-0227
-4 Ref.
No.
MACWB 04
2004
04
Part III
26. Simultaneous equilibrium in the money (LM) and goods (IS) markets exist a. At an unlimited number of income levels and rates of interest b. At only one income level and rate of interest c. At an unlimited number of income levels and only one rate of interest d. At only one income level and an unlimited number of rates of interest e. None of the above. 27. Which of the following reduces the likelihood that fiscal policy in the real world will help to
promote economic stability? a. Policy planners cannot estimate the impact on income and output that may result from a
fiscal action. b. The time lag between the recognition that a policy change is needed and the actual
impact of the policy change makes it difficult to time fiscal policy properly. c. Policy planners are reluctant to implement expansionary fiscal policy even during a
serious recession. d. Empirical studies have observed that policy planners will be more concerned with
inflation than unemployment. Thus, fiscal policy will generally be restrictive except at the time of deflation.
e. None of the above. 28. If an economy is currently experiencing both full employment and price stability, a major tax
reduction will probably cause a. An increase in unemployment in near future b. An acceleration in the inflation rate, unless government expenditures are also, reduced c. An increase in the interest rate, since individuals will reduce their savings in response to
the tax cut d. A decrease in consumption, unless the expected budget deficit is financed by selling
bonds to foreigners e. An acceleration in the inflation rate, unless government expenditures are also increased. 29. Commercial banks deposits with the RBI are a. Part of high-powered money but not of money supply b. A non-monetary liability of the RBI c. Part of money supply but not of high-powered money d. Part of both high-powered money and money supply e. None of the above. 30. The dividends received by an Indian company from its Malaysian subsidiary would be included in a. GDP of India and GNP of Malaysia b. GNP of India and GDP of Malaysia c. GNP of both India and Malaysia d. GDP of both India and Malaysia e. GDP of India. 31. Supply-side economics is also called a. Classical economics b. Keynesian economics c. Post-Keynesian economics d. Marshallian economics e. New classical economics.
421
© 2004
The Ic
fai U
nivers
ity P
ress.A
ll righ
ts res
erved
.ISBN : 8
1-314
-0227
-4 Ref.
No.
MACWB 04
2004
04
Macroeconomics
32. The balanced budget multiplier is not effected by a. Marginal propensity to save b. Marginal propensity to import c. Investment coefficient d. Both (a) and (b) above e. Both (b) and (c) above. 33. Money earned abroad and remitted to home country is a. Included in home country GDP b. Included in home country GNP c. Included in both home country GDP and GNP d. Excluded from both home country GDP and GNP e. None of the above. 34. According to the simple Keynesian model a. Aggregate supply varies positively with price level b. Aggregate supply is independent of the price level c. Involuntary unemployment cannot exist d. Nominal and real wages are perfectly flexible e. None of the above. 35. A change in the money supply has greater effect upon equilibrium income if a. The private sector spending is more interest-sensitive b. The private sector spending is less interest-sensitive c. The expenditure multiplier is smaller than anticipated d. The demand for money is more interest-sensitive e. Both (a) and (d) above. 36. Usually Marginal Propensity to Consume (MPC) is a. > Zero b. < Zero c. > 1 d. < 1 e. Both (a) and (d) above. 37. GDP at factor cost exceeds GDP at market price a. When the net factor income from abroad is negative b. When the net factor income from abroad is positive c. When depreciation of fixed capital exceeds gross investment d. When direct taxes exceed indirect taxes e. When subsidies exceed indirect taxes. 38. When the addition to capital goods in an economy exceed the capital consumption allowance,
the economy experiences a. Negative net investment b. Equilibrium investment c. Positive net investment d. Negative gross investment e. Zero gross investment.
422
© 2004
The Ic
fai U
nivers
ity P
ress.A
ll righ
ts res
erved
.ISBN : 8
1-314
-0227
-4 Ref.
No.
MACWB 04
2004
04
Part III
39. National Income is a. NDP at market prices b. NNP at market prices c. NDP at factor cost d. NNP at factor cost e. GNP at market price. 40. If interest elasticity of demand for investment and consumption is zero a. Equilibrium income depends solely on the position of LM curve b. Equilibrium income depends solely on the position of IS curve c. There is no speculative demand for money d. Speculative demand for money is infinity
e. Fiscal policy is totally ineffective in changing any of the real variables.
Part B: Problems (60 Points) Solve all the problems. Points are indicated against each problem. 41. The data relating to the various components of money supply in India are as follows:
Particulars Rs. in crore Currency with the public Notes in circulation 2,89,636 Rupee coins 3,884 Small coins 1,982 Cash in hand 9,972 Deposit money of the public Demand deposits with banks 1,98,212 Other deposits with Reserve Bank 11,254 Time deposits with banks 9,67,120 Post office deposits Post office savings bank deposits 10,082 Total post office deposits 51,938
According to M1 and M4 definition, the money stock in the country are a. Rs.5,14,940 crore and 15,33,998 crore b. Rs.5,52,880 crore and 15,33,998 crore c. Rs.5,14,940 crore and 15,22,894 crore d. Rs.5,52,880 crore and 15,22,894 crore e. None of the above.
(3 points) 42. The following savings and import functions have been estimated for an economy. S = –50 + 0.25Y M = 0.1Y Where S is aggregate savings, M is imports and Y is GDP. Private investment increases by
200 MUC and government expenditure decreases by 60 MUC. What is the impact on GDP? a. GDP decreases by 400 MUC. b. GDP increases by 250 MUC. c. GDP increases by 300 MUC. d. GDP increases by 200 MUC. e. None of the above.
(2 points)
423
© 2004
The Ic
fai U
nivers
ity P
ress.A
ll righ
ts res
erved
.ISBN : 8
1-314
-0227
-4 Ref.
No.
MACWB 04
2004
04
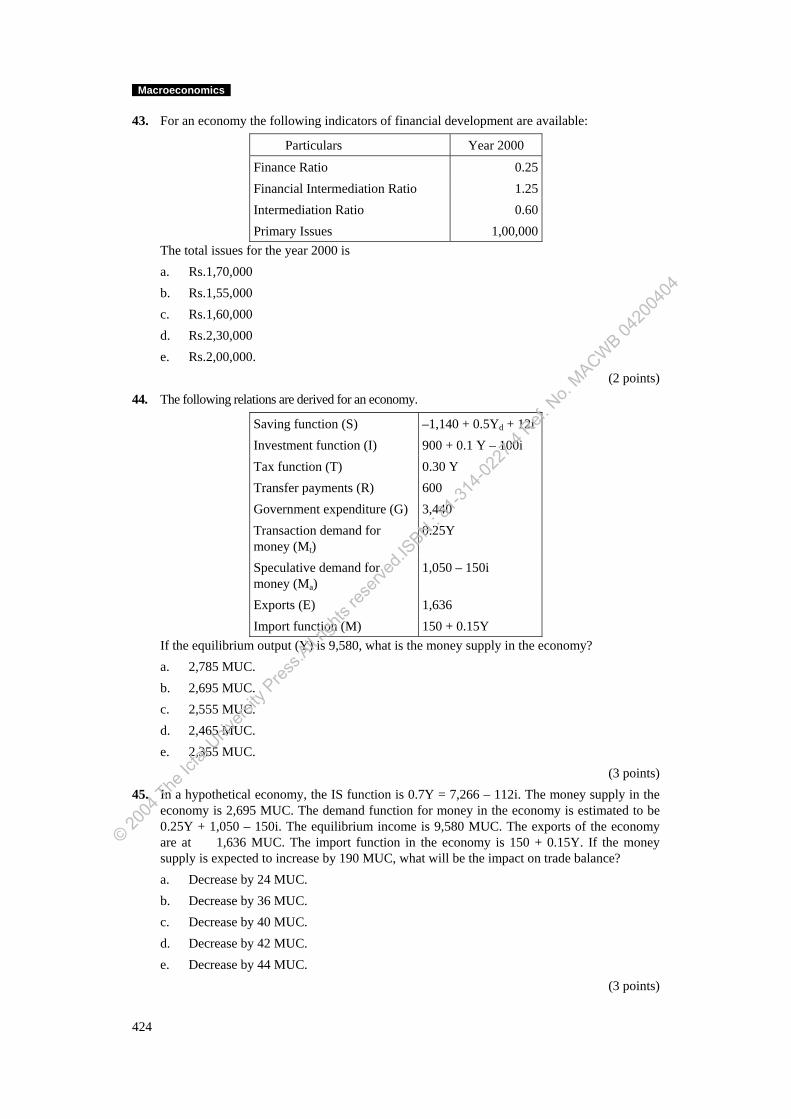
Macroeconomics
43. For an economy the following indicators of financial development are available:
Particulars Year 2000
Finance Ratio 0.25Financial Intermediation Ratio 1.25Intermediation Ratio 0.60Primary Issues 1,00,000
The total issues for the year 2000 is a. Rs.1,70,000 b. Rs.1,55,000 c. Rs.1,60,000 d. Rs.2,30,000 e. Rs.2,00,000.
(2 points) 44. The following relations are derived for an economy.
Saving function (S) –1,140 + 0.5Yd + 12i Investment function (I) 900 + 0.1 Y – 100i Tax function (T) 0.30 Y Transfer payments (R) 600 Government expenditure (G) 3,440 Transaction demand for money (Mt)
0.25Y
Speculative demand for money (Ma)
1,050 – 150i
Exports (E) 1,636 Import function (M) 150 + 0.15Y
If the equilibrium output (Y) is 9,580, what is the money supply in the economy? a. 2,785 MUC. b. 2,695 MUC. c. 2,555 MUC. d. 2,465 MUC. e. 2,355 MUC.
(3 points) 45. In a hypothetical economy, the IS function is 0.7Y = 7,266 – 112i. The money supply in the
economy is 2,695 MUC. The demand function for money in the economy is estimated to be 0.25Y + 1,050 – 150i. The equilibrium income is 9,580 MUC. The exports of the economy are at 1,636 MUC. The import function in the economy is 150 + 0.15Y. If the money supply is expected to increase by 190 MUC, what will be the impact on trade balance?
a. Decrease by 24 MUC. b. Decrease by 36 MUC. c. Decrease by 40 MUC. d. Decrease by 42 MUC. e. Decrease by 44 MUC.
(3 points)
424
© 2004
The Ic
fai U
nivers
ity P
ress.A
ll righ
ts res
erved
.ISBN : 8
1-314
-0227
-4 Ref.
No.
MACWB 04
2004
04
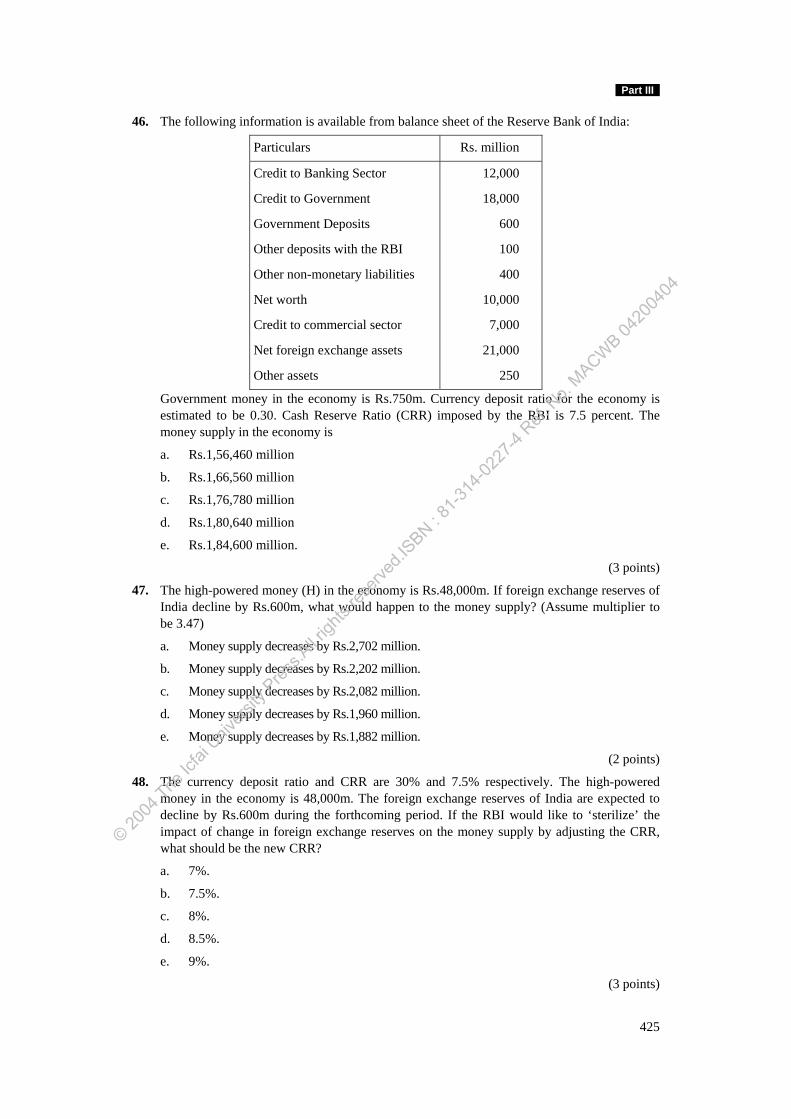
Part III
46. The following information is available from balance sheet of the Reserve Bank of India:
Particulars Rs. million
Credit to Banking Sector 12,000
Credit to Government 18,000
Government Deposits 600
Other deposits with the RBI 100
Other non-monetary liabilities 400
Net worth 10,000
Credit to commercial sector 7,000
Net foreign exchange assets 21,000
Other assets 250
Government money in the economy is Rs.750m. Currency deposit ratio for the economy is estimated to be 0.30. Cash Reserve Ratio (CRR) imposed by the RBI is 7.5 percent. The money supply in the economy is
a. Rs.1,56,460 million
b. Rs.1,66,560 million
c. Rs.1,76,780 million
d. Rs.1,80,640 million
e. Rs.1,84,600 million.
(3 points)
47. The high-powered money (H) in the economy is Rs.48,000m. If foreign exchange reserves of India decline by Rs.600m, what would happen to the money supply? (Assume multiplier to be 3.47)
a. Money supply decreases by Rs.2,702 million.
b. Money supply decreases by Rs.2,202 million.
c. Money supply decreases by Rs.2,082 million.
d. Money supply decreases by Rs.1,960 million.
e. Money supply decreases by Rs.1,882 million.
(2 points)
48. The currency deposit ratio and CRR are 30% and 7.5% respectively. The high-powered money in the economy is 48,000m. The foreign exchange reserves of India are expected to decline by Rs.600m during the forthcoming period. If the RBI would like to ‘sterilize’ the impact of change in foreign exchange reserves on the money supply by adjusting the CRR, what should be the new CRR?
a. 7%.
b. 7.5%.
c. 8%.
d. 8.5%.
e. 9%.
(3 points)
425
© 2004
The Ic
fai U
nivers
ity P
ress.A
ll righ
ts res
erved
.ISBN : 8
1-314
-0227
-4 Ref.
No.
MACWB 04
2004
04
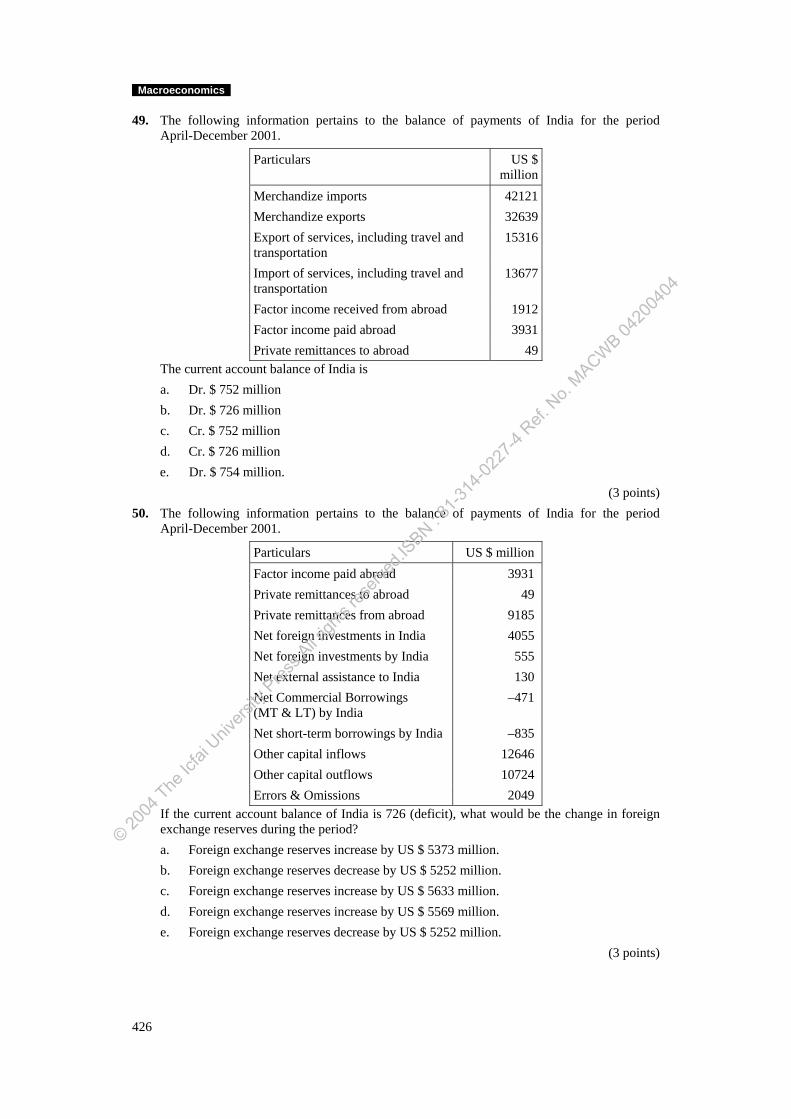
Macroeconomics
49. The following information pertains to the balance of payments of India for the period April-December 2001.
Particulars US $ million
Merchandize imports 42121Merchandize exports 32639Export of services, including travel and transportation
15316
Import of services, including travel and transportation
13677
Factor income received from abroad 1912Factor income paid abroad 3931Private remittances to abroad 49
The current account balance of India is a. Dr. $ 752 million b. Dr. $ 726 million c. Cr. $ 752 million d. Cr. $ 726 million
e. Dr. $ 754 million. (3 points)
50. The following information pertains to the balance of payments of India for the period April-December 2001.
Particulars US $ million Factor income paid abroad 3931 Private remittances to abroad 49 Private remittances from abroad 9185 Net foreign investments in India 4055 Net foreign investments by India 555 Net external assistance to India 130 Net Commercial Borrowings (MT & LT) by India
–471
Net short-term borrowings by India –835 Other capital inflows 12646 Other capital outflows 10724 Errors & Omissions 2049
If the current account balance of India is 726 (deficit), what would be the change in foreign exchange reserves during the period?
a. Foreign exchange reserves increase by US $ 5373 million. b. Foreign exchange reserves decrease by US $ 5252 million. c. Foreign exchange reserves increase by US $ 5633 million. d. Foreign exchange reserves increase by US $ 5569 million. e. Foreign exchange reserves decrease by US $ 5252 million.
(3 points)
426
© 2004
The Ic
fai U
nivers
ity P
ress.A
ll righ
ts res
erved
.ISBN : 8
1-314
-0227
-4 Ref.
No.
MACWB 04
2004
04
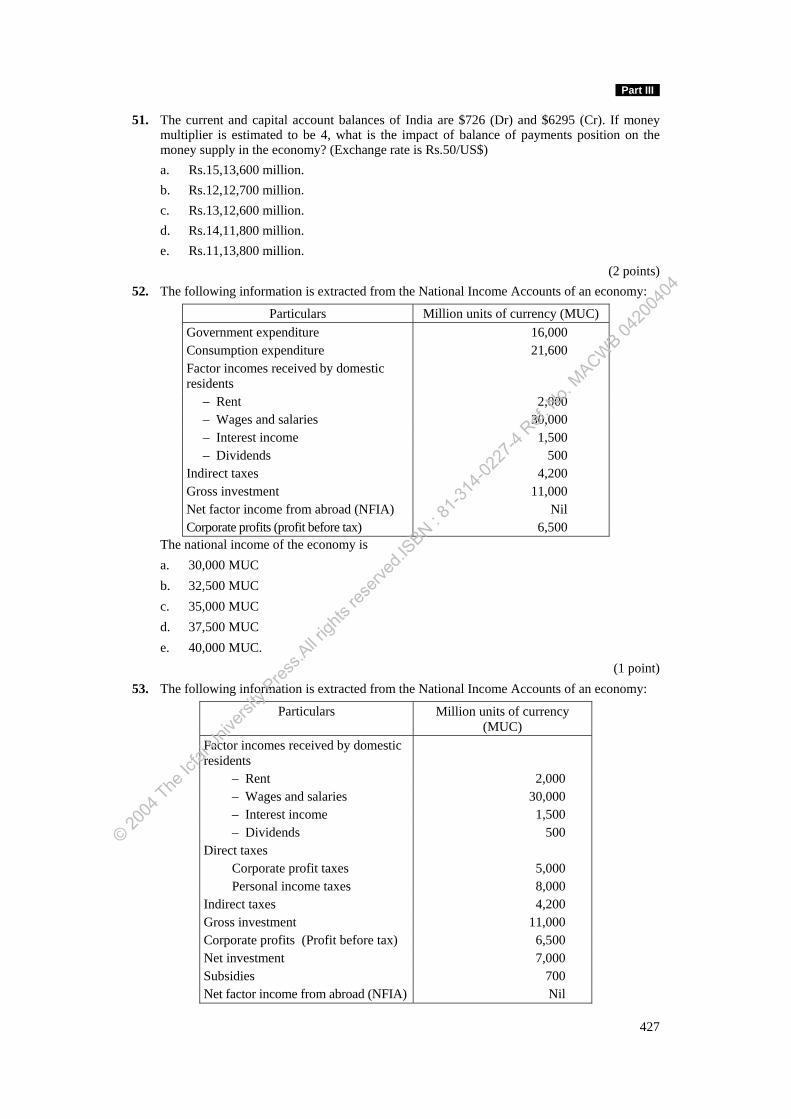
Part III
51. The current and capital account balances of India are $726 (Dr) and $6295 (Cr). If money multiplier is estimated to be 4, what is the impact of balance of payments position on the money supply in the economy? (Exchange rate is Rs.50/US$)
a. Rs.15,13,600 million. b. Rs.12,12,700 million. c. Rs.13,12,600 million. d. Rs.14,11,800 million. e. Rs.11,13,800 million.
(2 points) 52. The following information is extracted from the National Income Accounts of an economy:
Particulars Million units of currency (MUC) Government expenditure 16,000 Consumption expenditure 21,600 Factor incomes received by domestic residents
– Rent 2,000 – Wages and salaries 30,000 – Interest income 1,500 – Dividends 500 Indirect taxes 4,200 Gross investment 11,000 Net factor income from abroad (NFIA) Nil Corporate profits (profit before tax) 6,500
The national income of the economy is a. 30,000 MUC b. 32,500 MUC c. 35,000 MUC d. 37,500 MUC e. 40,000 MUC.
(1 point) 53. The following information is extracted from the National Income Accounts of an economy:
Particulars Million units of currency (MUC)
Factor incomes received by domestic residents
– Rent 2,000 – Wages and salaries 30,000 – Interest income 1,500 – Dividends 500 Direct taxes Corporate profit taxes 5,000 Personal income taxes 8,000 Indirect taxes 4,200 Gross investment 11,000 Corporate profits (Profit before tax) 6,500 Net investment 7,000 Subsidies 700 Net factor income from abroad (NFIA) Nil
427
© 2004
The Ic
fai U
nivers
ity P
ress.A
ll righ
ts res
erved
.ISBN : 8
1-314
-0227
-4 Ref.
No.
MACWB 04
2004
04
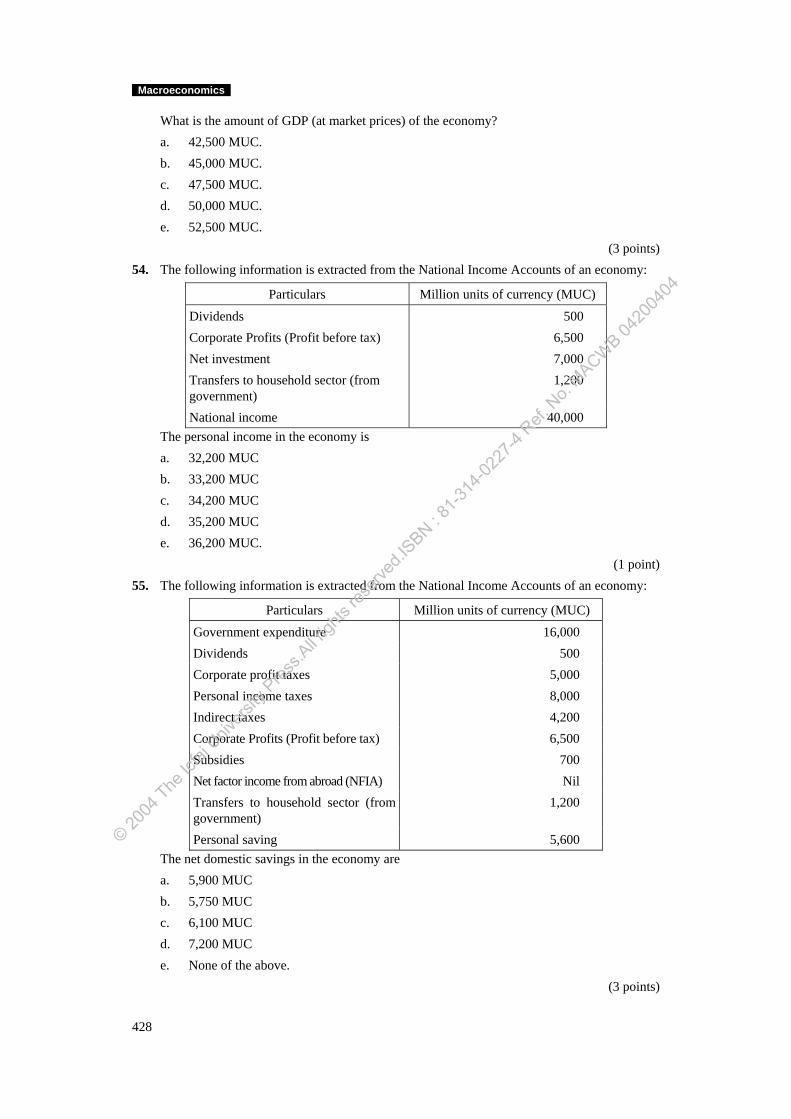
Macroeconomics
What is the amount of GDP (at market prices) of the economy? a. 42,500 MUC. b. 45,000 MUC. c. 47,500 MUC. d. 50,000 MUC. e. 52,500 MUC.
(3 points) 54. The following information is extracted from the National Income Accounts of an economy:
Particulars Million units of currency (MUC)
Dividends 500 Corporate Profits (Profit before tax) 6,500 Net investment 7,000 Transfers to household sector (from government)
1,200
National income 40,000 The personal income in the economy is a. 32,200 MUC b. 33,200 MUC c. 34,200 MUC d. 35,200 MUC e. 36,200 MUC.
(1 point) 55. The following information is extracted from the National Income Accounts of an economy:
Particulars Million units of currency (MUC)
Government expenditure 16,000 Dividends 500 Corporate profit taxes 5,000 Personal income taxes 8,000 Indirect taxes 4,200 Corporate Profits (Profit before tax) 6,500 Subsidies 700 Net factor income from abroad (NFIA) Nil Transfers to household sector (from government)
1,200
Personal saving 5,600 The net domestic savings in the economy are a. 5,900 MUC b. 5,750 MUC c. 6,100 MUC d. 7,200 MUC e. None of the above.
(3 points)
428
© 2004
The Ic
fai U
nivers
ity P
ress.A
ll righ
ts res
erved
.ISBN : 8
1-314
-0227
-4 Ref.
No.
MACWB 04
2004
04
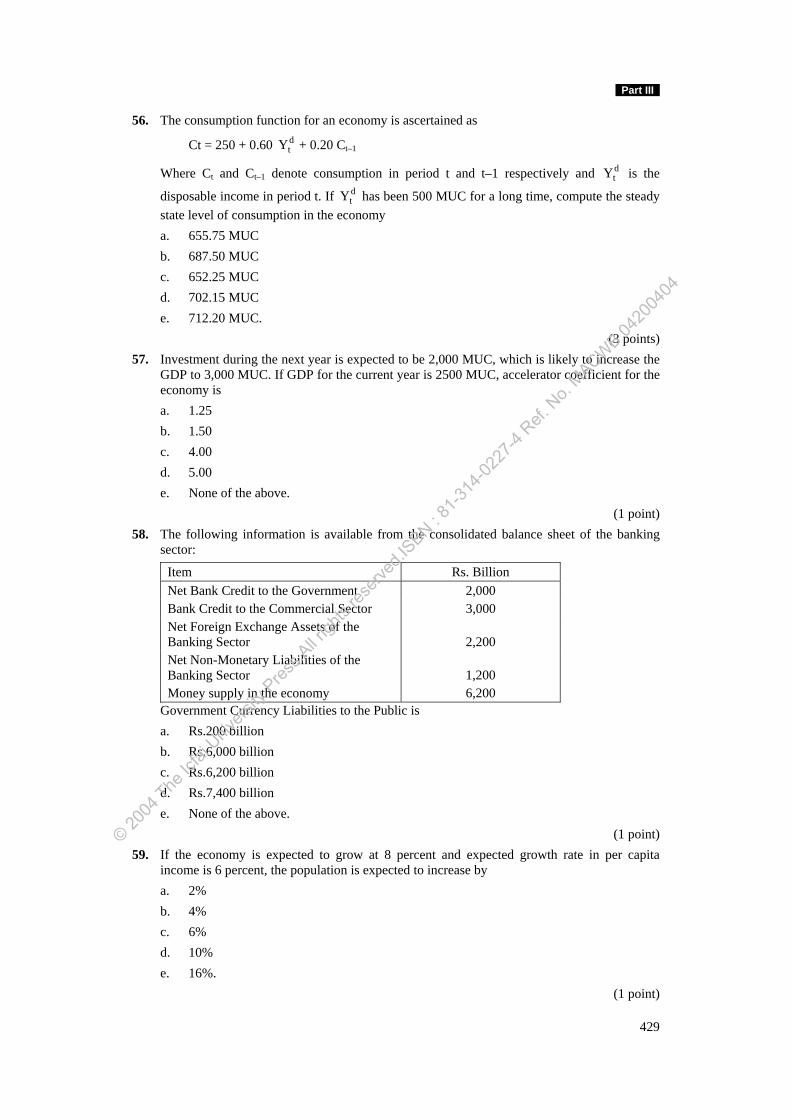
Part III
56. The consumption function for an economy is ascertained as
Ct = 250 + 0.60 dtY + 0.20 Ct–1
Where Ct and Ct–1 denote consumption in period t and t–1 respectively and is the
disposable income in period t. If has been 500 MUC for a long time, compute the steady state level of consumption in the economy
dtY
dtY
a. 655.75 MUC b. 687.50 MUC c. 652.25 MUC d. 702.15 MUC e. 712.20 MUC.
(3 points) 57. Investment during the next year is expected to be 2,000 MUC, which is likely to increase the
GDP to 3,000 MUC. If GDP for the current year is 2500 MUC, accelerator coefficient for the economy is a. 1.25 b. 1.50 c. 4.00 d. 5.00 e. None of the above.
(1 point) 58. The following information is available from the consolidated balance sheet of the banking
sector:
Item Rs. Billion Net Bank Credit to the Government 2,000 Bank Credit to the Commercial Sector 3,000 Net Foreign Exchange Assets of the Banking Sector 2,200 Net Non-Monetary Liabilities of the Banking Sector 1,200 Money supply in the economy 6,200
Government Currency Liabilities to the Public is a. Rs.200 billion b. Rs.6,000 billion c. Rs.6,200 billion d. Rs.7,400 billion e. None of the above.
(1 point) 59. If the economy is expected to grow at 8 percent and expected growth rate in per capita
income is 6 percent, the population is expected to increase by a. 2% b. 4% c. 6% d. 10% e. 16%.
(1 point)
429
© 2004
The Ic
fai U
nivers
ity P
ress.A
ll righ
ts res
erved
.ISBN : 8
1-314
-0227
-4 Ref.
No.
MACWB 04
2004
04
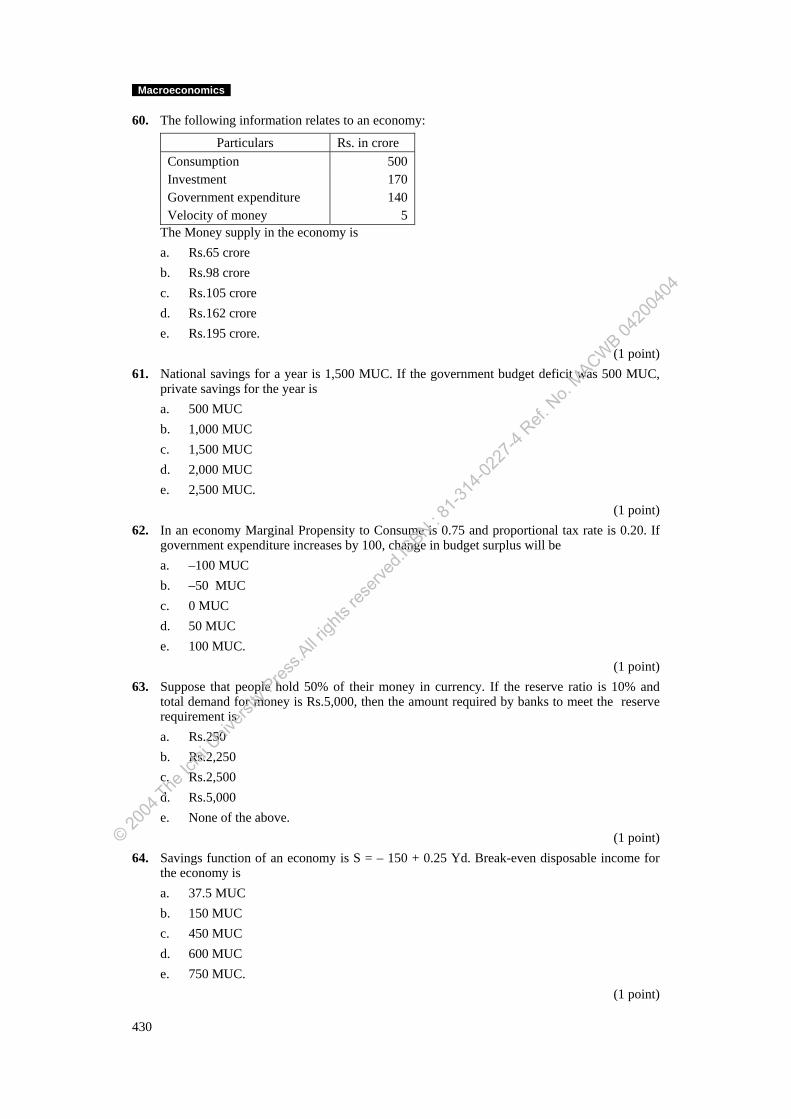
Macroeconomics
60. The following information relates to an economy:
Particulars Rs. in crore Consumption 500 Investment 170 Government expenditure 140 Velocity of money 5
The Money supply in the economy is a. Rs.65 crore b. Rs.98 crore c. Rs.105 crore d. Rs.162 crore e. Rs.195 crore.
(1 point) 61. National savings for a year is 1,500 MUC. If the government budget deficit was 500 MUC,
private savings for the year is a. 500 MUC b. 1,000 MUC c. 1,500 MUC d. 2,000 MUC e. 2,500 MUC.
(1 point) 62. In an economy Marginal Propensity to Consume is 0.75 and proportional tax rate is 0.20. If
government expenditure increases by 100, change in budget surplus will be a. –100 MUC b. –50 MUC c. 0 MUC d. 50 MUC e. 100 MUC.
(1 point) 63. Suppose that people hold 50% of their money in currency. If the reserve ratio is 10% and
total demand for money is Rs.5,000, then the amount required by banks to meet the reserve requirement is a. Rs.250 b. Rs.2,250 c. Rs.2,500 d. Rs.5,000 e. None of the above.
(1 point) 64. Savings function of an economy is S = – 150 + 0.25 Yd. Break-even disposable income for
the economy is a. 37.5 MUC b. 150 MUC c. 450 MUC d. 600 MUC e. 750 MUC.
(1 point)
430
© 2004
The Ic
fai U
nivers
ity P
ress.A
ll righ
ts res
erved
.ISBN : 8
1-314
-0227
-4 Ref.
No.
MACWB 04
2004
04
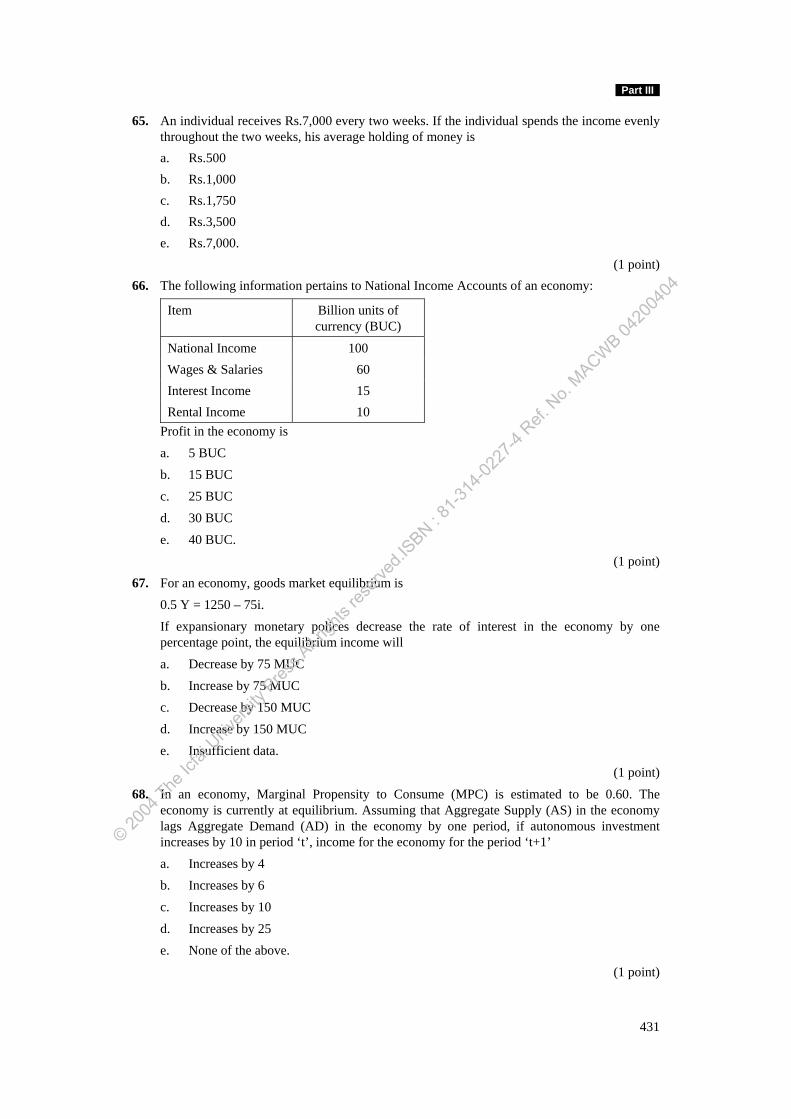
Part III
65. An individual receives Rs.7,000 every two weeks. If the individual spends the income evenly throughout the two weeks, his average holding of money is a. Rs.500 b. Rs.1,000 c. Rs.1,750 d. Rs.3,500 e. Rs.7,000.
(1 point) 66. The following information pertains to National Income Accounts of an economy:
Item Billion units of currency (BUC)
National Income 100 Wages & Salaries 60 Interest Income 15 Rental Income 10
Profit in the economy is a. 5 BUC b. 15 BUC c. 25 BUC d. 30 BUC e. 40 BUC.
(1 point) 67. For an economy, goods market equilibrium is 0.5 Y = 1250 – 75i.
If expansionary monetary polices decrease the rate of interest in the economy by one percentage point, the equilibrium income will a. Decrease by 75 MUC b. Increase by 75 MUC c. Decrease by 150 MUC d. Increase by 150 MUC e. Insufficient data.
(1 point) 68. In an economy, Marginal Propensity to Consume (MPC) is estimated to be 0.60. The
economy is currently at equilibrium. Assuming that Aggregate Supply (AS) in the economy lags Aggregate Demand (AD) in the economy by one period, if autonomous investment increases by 10 in period ‘t’, income for the economy for the period ‘t+1’ a. Increases by 4 b. Increases by 6 c. Increases by 10 d. Increases by 25 e. None of the above.
(1 point)
431
© 2004
The Ic
fai U
nivers
ity P
ress.A
ll righ
ts res
erved
.ISBN : 8
1-314
-0227
-4 Ref.
No.
MACWB 04
2004
04
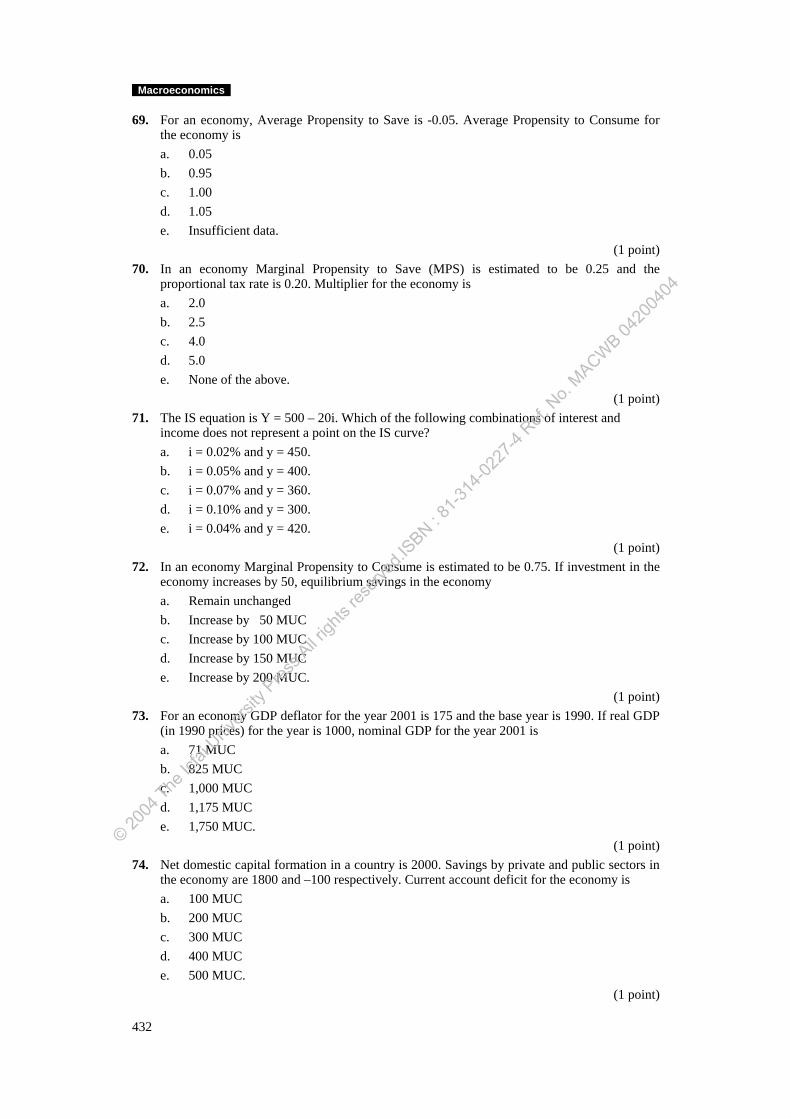
Macroeconomics
69. For an economy, Average Propensity to Save is -0.05. Average Propensity to Consume for the economy is a. 0.05 b. 0.95 c. 1.00 d. 1.05 e. Insufficient data.
(1 point) 70. In an economy Marginal Propensity to Save (MPS) is estimated to be 0.25 and the
proportional tax rate is 0.20. Multiplier for the economy is a. 2.0 b. 2.5 c. 4.0 d. 5.0 e. None of the above.
(1 point) 71. The IS equation is Y = 500 – 20i. Which of the following combinations of interest and
income does not represent a point on the IS curve? a. i = 0.02% and y = 450. b. i = 0.05% and y = 400. c. i = 0.07% and y = 360. d. i = 0.10% and y = 300. e. i = 0.04% and y = 420.
(1 point) 72. In an economy Marginal Propensity to Consume is estimated to be 0.75. If investment in the
economy increases by 50, equilibrium savings in the economy a. Remain unchanged b. Increase by 50 MUC c. Increase by 100 MUC d. Increase by 150 MUC e. Increase by 200 MUC.
(1 point) 73. For an economy GDP deflator for the year 2001 is 175 and the base year is 1990. If real GDP
(in 1990 prices) for the year is 1000, nominal GDP for the year 2001 is a. 71 MUC b. 825 MUC c. 1,000 MUC d. 1,175 MUC e. 1,750 MUC.
(1 point) 74. Net domestic capital formation in a country is 2000. Savings by private and public sectors in
the economy are 1800 and –100 respectively. Current account deficit for the economy is a. 100 MUC b. 200 MUC c. 300 MUC d. 400 MUC e. 500 MUC.
(1 point)
432
© 2004
The Ic
fai U
nivers
ity P
ress.A
ll righ
ts res
erved
.ISBN : 8
1-314
-0227
-4 Ref.
No.
MACWB 04
2004
04
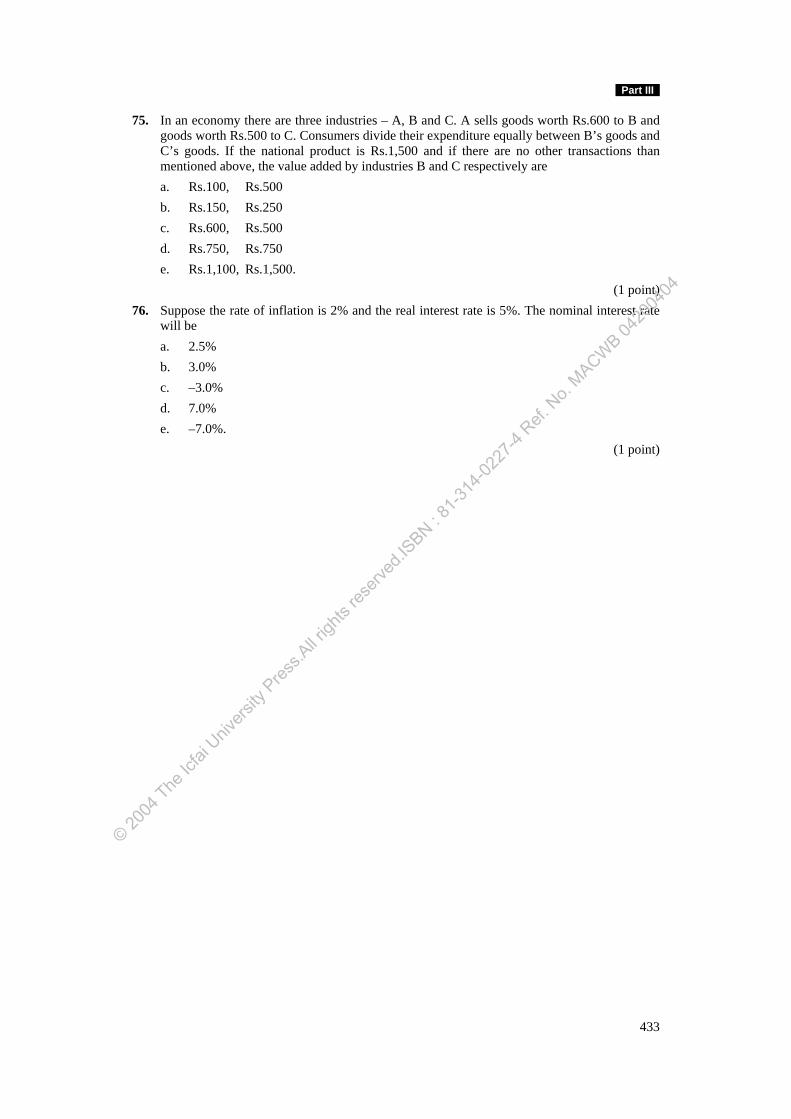
Part III
75. In an economy there are three industries – A, B and C. A sells goods worth Rs.600 to B and goods worth Rs.500 to C. Consumers divide their expenditure equally between B’s goods and C’s goods. If the national product is Rs.1,500 and if there are no other transactions than mentioned above, the value added by industries B and C respectively are a. Rs.100, Rs.500 b. Rs.150, Rs.250 c. Rs.600, Rs.500 d. Rs.750, Rs.750 e. Rs.1,100, Rs.1,500.
(1 point) 76. Suppose the rate of inflation is 2% and the real interest rate is 5%. The nominal interest rate
will be a. 2.5% b. 3.0% c. –3.0% d. 7.0% e. –7.0%.
(1 point)
433
© 2004
The Ic
fai U
nivers
ity P
ress.A
ll righ
ts res
erved
.ISBN : 8
1-314
-0227
-4 Ref.
No.
MACWB 04
2004
04
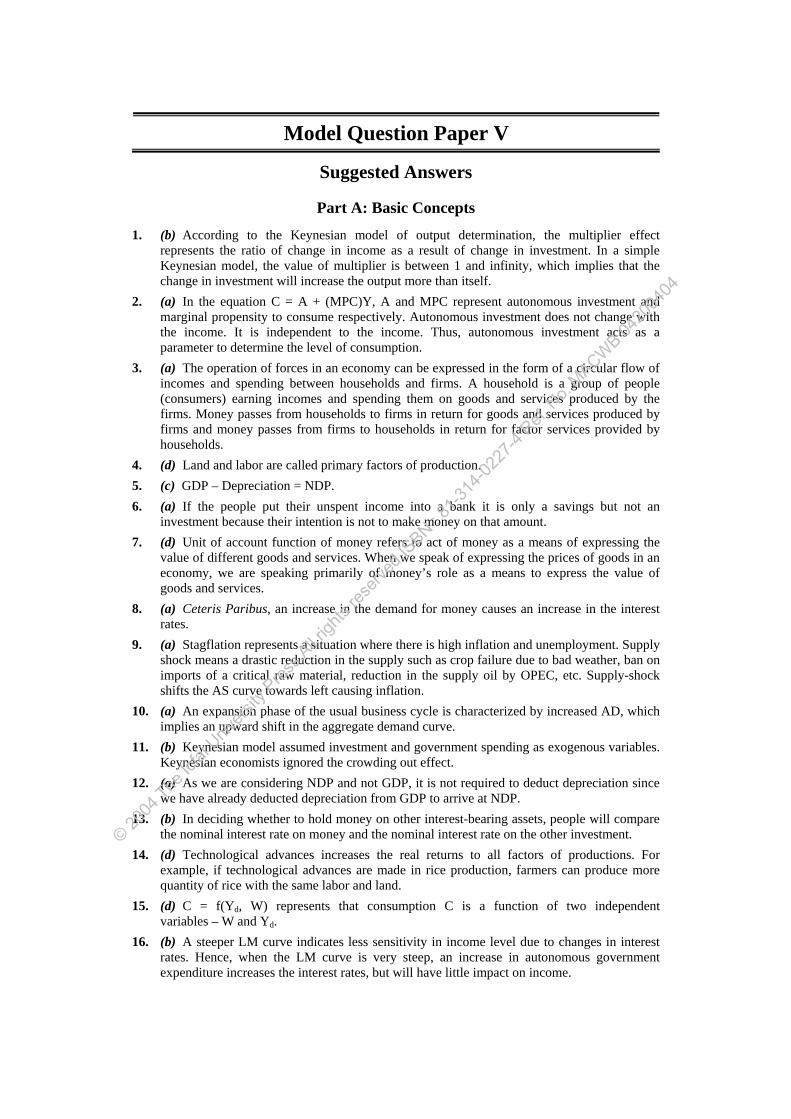
Model Question Paper V
Suggested Answers
Part A: Basic Concepts
1. (b) According to the Keynesian model of output determination, the multiplier effect represents the ratio of change in income as a result of change in investment. In a simple Keynesian model, the value of multiplier is between 1 and infinity, which implies that the change in investment will increase the output more than itself.
2. (a) In the equation C = A + (MPC)Y, A and MPC represent autonomous investment and marginal propensity to consume respectively. Autonomous investment does not change with the income. It is independent to the income. Thus, autonomous investment acts as a parameter to determine the level of consumption.
3. (a) The operation of forces in an economy can be expressed in the form of a circular flow of incomes and spending between households and firms. A household is a group of people (consumers) earning incomes and spending them on goods and services produced by the firms. Money passes from households to firms in return for goods and services produced by firms and money passes from firms to households in return for factor services provided by households.
4. (d) Land and labor are called primary factors of production. 5. (c) GDP – Depreciation = NDP. 6. (a) If the people put their unspent income into a bank it is only a savings but not an
investment because their intention is not to make money on that amount. 7. (d) Unit of account function of money refers to act of money as a means of expressing the
value of different goods and services. When we speak of expressing the prices of goods in an economy, we are speaking primarily of money’s role as a means to express the value of goods and services.
8. (a) Ceteris Paribus, an increase in the demand for money causes an increase in the interest rates.
9. (a) Stagflation represents a situation where there is high inflation and unemployment. Supply shock means a drastic reduction in the supply such as crop failure due to bad weather, ban on imports of a critical raw material, reduction in the supply oil by OPEC, etc. Supply-shock shifts the AS curve towards left causing inflation.
10. (a) An expansion phase of the usual business cycle is characterized by increased AD, which implies an upward shift in the aggregate demand curve.
11. (b) Keynesian model assumed investment and government spending as exogenous variables. Keynesian economists ignored the crowding out effect.
12. (a) As we are considering NDP and not GDP, it is not required to deduct depreciation since we have already deducted depreciation from GDP to arrive at NDP.
13. (b) In deciding whether to hold money on other interest-bearing assets, people will compare the nominal interest rate on money and the nominal interest rate on the other investment.
14. (d) Technological advances increases the real returns to all factors of productions. For example, if technological advances are made in rice production, farmers can produce more quantity of rice with the same labor and land.
15. (d) C = f(Yd, W) represents that consumption C is a function of two independent variables – W and Yd.
16. (b) A steeper LM curve indicates less sensitivity in income level due to changes in interest rates. Hence, when the LM curve is very steep, an increase in autonomous government expenditure increases the interest rates, but will have little impact on income.
© 2004
The Ic
fai U
nivers
ity P
ress.A
ll righ
ts res
erved
.ISBN : 8
1-314
-0227
-4 Ref.
No.
MACWB 04
2004
04
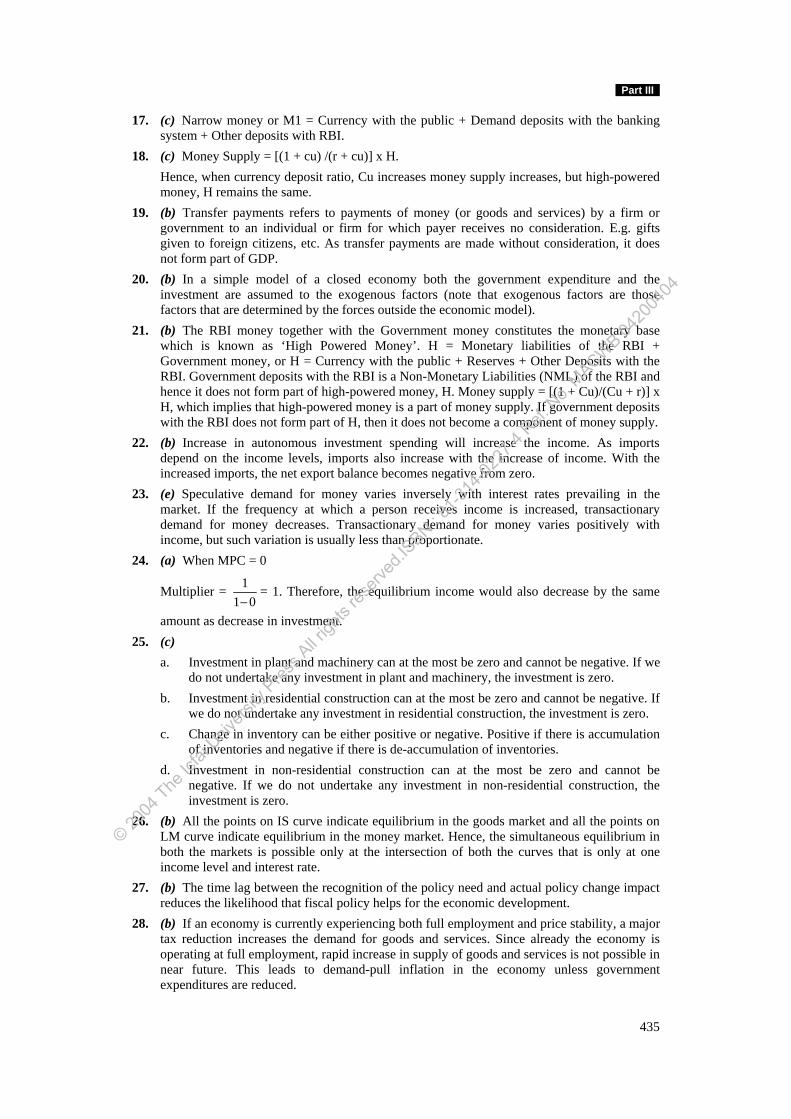
Part III
17. (c) Narrow money or M1 = Currency with the public + Demand deposits with the banking system + Other deposits with RBI.
18. (c) Money Supply = [(1 + cu) /(r + cu)] x H. Hence, when currency deposit ratio, Cu increases money supply increases, but high-powered
money, H remains the same. 19. (b) Transfer payments refers to payments of money (or goods and services) by a firm or
government to an individual or firm for which payer receives no consideration. E.g. gifts given to foreign citizens, etc. As transfer payments are made without consideration, it does not form part of GDP.
20. (b) In a simple model of a closed economy both the government expenditure and the investment are assumed to the exogenous factors (note that exogenous factors are those factors that are determined by the forces outside the economic model).
21. (b) The RBI money together with the Government money constitutes the monetary base which is known as ‘High Powered Money’. H = Monetary liabilities of the RBI + Government money, or H = Currency with the public + Reserves + Other Deposits with the RBI. Government deposits with the RBI is a Non-Monetary Liabilities (NML) of the RBI and hence it does not form part of high-powered money, H. Money supply = [(1 + Cu)/(Cu + r)] x H, which implies that high-powered money is a part of money supply. If government deposits with the RBI does not form part of H, then it does not become a component of money supply.
22. (b) Increase in autonomous investment spending will increase the income. As imports depend on the income levels, imports also increase with the increase of income. With the increased imports, the net export balance becomes negative from zero.
23. (e) Speculative demand for money varies inversely with interest rates prevailing in the market. If the frequency at which a person receives income is increased, transactionary demand for money decreases. Transactionary demand for money varies positively with income, but such variation is usually less than proportionate.
24. (a) When MPC = 0
Multiplier = 11 0−
= 1. Therefore, the equilibrium income would also decrease by the same
amount as decrease in investment. 25. (c) a. Investment in plant and machinery can at the most be zero and cannot be negative. If we
do not undertake any investment in plant and machinery, the investment is zero. b. Investment in residential construction can at the most be zero and cannot be negative. If
we do not undertake any investment in residential construction, the investment is zero. c. Change in inventory can be either positive or negative. Positive if there is accumulation
of inventories and negative if there is de-accumulation of inventories. d. Investment in non-residential construction can at the most be zero and cannot be
negative. If we do not undertake any investment in non-residential construction, the investment is zero.
26. (b) All the points on IS curve indicate equilibrium in the goods market and all the points on LM curve indicate equilibrium in the money market. Hence, the simultaneous equilibrium in both the markets is possible only at the intersection of both the curves that is only at one income level and interest rate.
27. (b) The time lag between the recognition of the policy need and actual policy change impact reduces the likelihood that fiscal policy helps for the economic development.
28. (b) If an economy is currently experiencing both full employment and price stability, a major tax reduction increases the demand for goods and services. Since already the economy is operating at full employment, rapid increase in supply of goods and services is not possible in near future. This leads to demand-pull inflation in the economy unless government expenditures are reduced.
435
© 2004
The Ic
fai U
nivers
ity P
ress.A
ll righ
ts res
erved
.ISBN : 8
1-314
-0227
-4 Ref.
No.
MACWB 04
2004
04
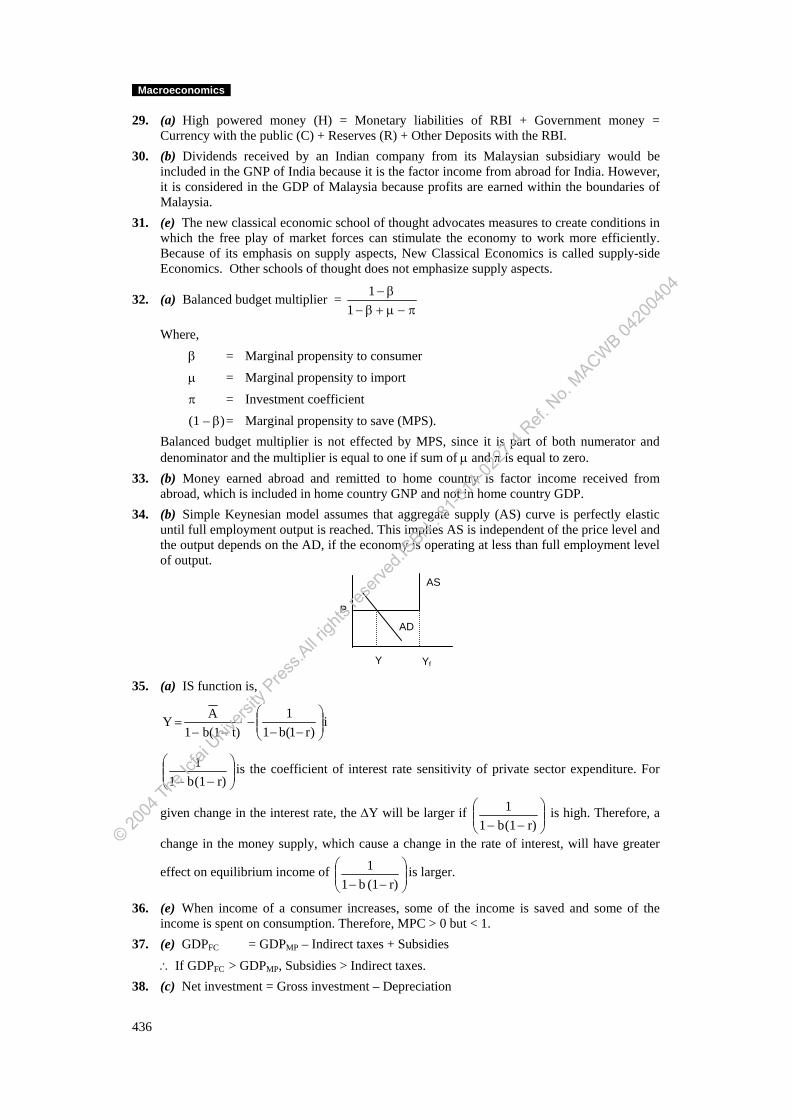
Macroeconomics
29. (a) High powered money (H) = Monetary liabilities of RBI + Government money = Currency with the public (C) + Reserves (R) + Other Deposits with the RBI.
30. (b) Dividends received by an Indian company from its Malaysian subsidiary would be included in the GNP of India because it is the factor income from abroad for India. However, it is considered in the GDP of Malaysia because profits are earned within the boundaries of Malaysia.
31. (e) The new classical economic school of thought advocates measures to create conditions in which the free play of market forces can stimulate the economy to work more efficiently. Because of its emphasis on supply aspects, New Classical Economics is called supply-side Economics. Other schools of thought does not emphasize supply aspects.
32. (a) Balanced budget multiplier = π−μ+β−
β−1
1
Where, β = Marginal propensity to consumer μ = Marginal propensity to import π = Investment coefficient (1 – β) = Marginal propensity to save (MPS). Balanced budget multiplier is not effected by MPS, since it is part of both numerator and
denominator and the multiplier is equal to one if sum of μ and π is equal to zero. 33. (b) Money earned abroad and remitted to home country is factor income received from
abroad, which is included in home country GNP and not in home country GDP. 34. (b) Simple Keynesian model assumes that aggregate supply (AS) curve is perfectly elastic
until full employment output is reached. This implies AS is independent of the price level and the output depends on the AD, if the economy is operating at less than full employment level of output.
AS
Y
ADP
Yf
35. (a) IS function is,
t)b(11AY−−
= i)r1(b1
1⎟⎟⎠
⎞⎜⎜⎝
⎛−−
−
⎟⎟⎠
⎞⎜⎜⎝
⎛−− r)(1b1
1 is the coefficient of interest rate sensitivity of private sector expenditure. For
given change in the interest rate, the ΔY will be larger if ⎟⎟⎠
⎞⎜⎜⎝
⎛−− r)(1b1
1 is high. Therefore, a
change in the money supply, which cause a change in the rate of interest, will have greater
effect on equilibrium income of ⎟⎟⎠
⎞⎜⎜⎝
⎛−− r)(1b1
1 is larger.
36. (e) When income of a consumer increases, some of the income is saved and some of the income is spent on consumption. Therefore, MPC > 0 but < 1.
37. (e) GDPFC = GDPMP – Indirect taxes + Subsidies ∴ If GDPFC > GDPMP, Subsidies > Indirect taxes. 38. (c) Net investment = Gross investment – Depreciation
436
© 2004
The Ic
fai U
nivers
ity P
ress.A
ll righ
ts res
erved
.ISBN : 8
1-314
-0227
-4 Ref.
No.
MACWB 04
2004
04
Part III
If Gross investment > Depreciation, Net investment > 0, hence other options are wrong. 39. (d) NPFC is also called a National Income. 40. (b) If interest elasticity of demand for investment and consumption is zero, IS curve is
t)b(11
AY−−
=
Hence, equilibrium income depends on the position of IS curve only.
Part B: Problems
41. (a) M1 = Currency with public + Demand deposits with banks + Demand portion of savings deposits with banks + Other deposits with RBI.
= (2,89,636 + 3,884 + 1,982 + 9,972) + (1,98,212 + 11,254) = Rs.5,14,940 crore.
M4 = M3 + All Post Office Deposits
M3 = M1 + Time deposits (i.e. fixed deposits) with banks
Thus, M4 = (5,14,940) + 9,67,120 + 51,938 = Rs.15,33,998 crore.
42. (e) Multiplier = 1/(MPS + MPI) = 1/(0.25 + 0.1) = 1/0.35 = 2.857
Thus, if autonomous expenditure increases by (200 – 60) = 140, then GDP increases by 2.857 x 140 = 400.
43. (c) Total issues = Primary issues + Secondary issues
Secondary issues = Primary issues × Intermediation ratio
National Income = RatioFinance
IssueTotal
Particulars Year 2000
Secondary issues 1,00,000 × 0.60 = 60,000
Total issues 1,60,00044. (b)
S = –1,140 + 0.5Yd + 12i
Consumption (C) = 1140 + 0.5Yd – 12i
Yd = Y – T + R = (Y – 0.3Y + 600)
Goods Market
At equilibrium in goods market
Y = C + 1 + G + E – M
Y = 1,140 + 0.5 (Y – 0.3Y + 600) – 12i + 900 + 0.1Y – 100i + 3440 + 1636 – 150 – 0.15Y
Y = 7,266 + 0.3Y – 112i 0.7Y = 7,266 – 112i Y = 10,380 – 160i … IS function At equilibrium Y = 9,580 9,580 = 10,380 – 160i 160i = 800 i = 5%
437
© 2004
The Ic
fai U
nivers
ity P
ress.A
ll righ
ts res
erved
.ISBN : 8
1-314
-0227
-4 Ref.
No.
MACWB 04
2004
04
Macroeconomics
Money Market The money market is in equilibrium when
Md = Ms
Md = Mt + Ma
Mt = 0.25 Y
Ma = 1,050 – 150i
∴ Md = 0.25Y + 1,050 – 150i
= 0.25 (9,580) + 1,050 – (150 × 5) = 2,695 MUC.
∴The money supply is 2,695 MUC.
45. (a) If the money supply increases by 190, new money supply is 2,695 + 190 = 2,885 MUC.
LM function
Ms = Md
2,885 = 0.25Y + 1050 – 150i
0.25Y = 1,835 + 150i
Y = 7,340 + 600i …. LM Function
At equilibrium, LM and IS functions are equal
∴ 10,380 – 160i = 7340 + 600i
[Note: Y = (7,266 – 112i)/0.7 = 10,380 – 160i]
760i = 3040
i = 4%
Y = 9740 MUC.
Trade Balance (TB) = E – M
Before increase in MS, TB
= 1,636 – 150 – 0.15 × 9,580 = 49 MUC.
After increase in MS, TB
= 1,636 – 150 – 0.15 × 9,740 = 25 MUC.
Impact on TB = Decrease by 24 MUC.
46. (b)
High powered money = Monetary Liabilities of RBI + Government Money
Monetary liabilities of RBI = Financial Assets + Other Assets – Non-monetary liabilities
Financial Assets = Credit to Government + Credit to Banks + Credit
Net foreign exchange to Commercial sector + Assets
= 18,000 + 12,000 + 7,000 + 21,000 = Rs.58,000 million
Other Assets = Rs.250 million
Non-monetary liabilities
= Government deposits + Other non-monetary liabilities + Net worth = 600 + 400 + 10,000 = Rs.11,000 million
438
© 2004
The Ic
fai U
nivers
ity P
ress.A
ll righ
ts res
erved
.ISBN : 8
1-314
-0227
-4 Ref.
No.
MACWB 04
2004
04
Part III
∴Monetary liabilities
= 58,000 + 250 – 11,000 = 47,250
Government money = Rs. 750 million
∴High powered money (H) = 47,250 + 750
=Rs.48,000 million
Money supply (Ms) = H x m
Money multiplier (m) = rC
C1
u
u+
+
= 075.030.0
30.01++
= 375.030.1 = 3.47
∴Money Supply in the economy
= 48,000 x 3.47 = Rs.1,66,560m.
47. (c) If foreign exchange reserves of India decline by Rs.600m, then high-powered money (H) in the economy reduces to 48,000 – 600 = 47,400. Consequently, the money supply in the economy decreases by 3.47 x 600 = Rs.2,082 million.
48. (a) Ms = High-powered money (H) x Money multiplier (m)
If foreign exchange reserves decline by 600m, then high-powered money would also reduce by 600m. Thus, H = 48,000 – 600 = 47,400.
If RBI would like to sterilize
1,66,560 = 47,400 r0.30
0.301+
+
0.30 + r = 1,66,560
47,400x1.30
560,66,1
620,61 = 0.3699
r = 0.3699 – 0.30 = 0.0699
= 6.99% = 7%
∴RBI should decrease the CRR to 7%.
49. (b)
Item Credit Debit Net
Current Account
I. Merchandise 32,639 42,121 (9,482)
II. Invisible (a + b + c) 26,413 17,657 8,756
a. Services 15,316 13,677 1,639
b. Income 1,912 3,931 (2019)
c. Transfers 9,185 49 9,136
Current account balance (I + II) 59,052 59,778 (726)
439
© 2004
The Ic
fai U
nivers
ity P
ress.A
ll righ
ts res
erved
.ISBN : 8
1-314
-0227
-4 Ref.
No.
MACWB 04
2004
04
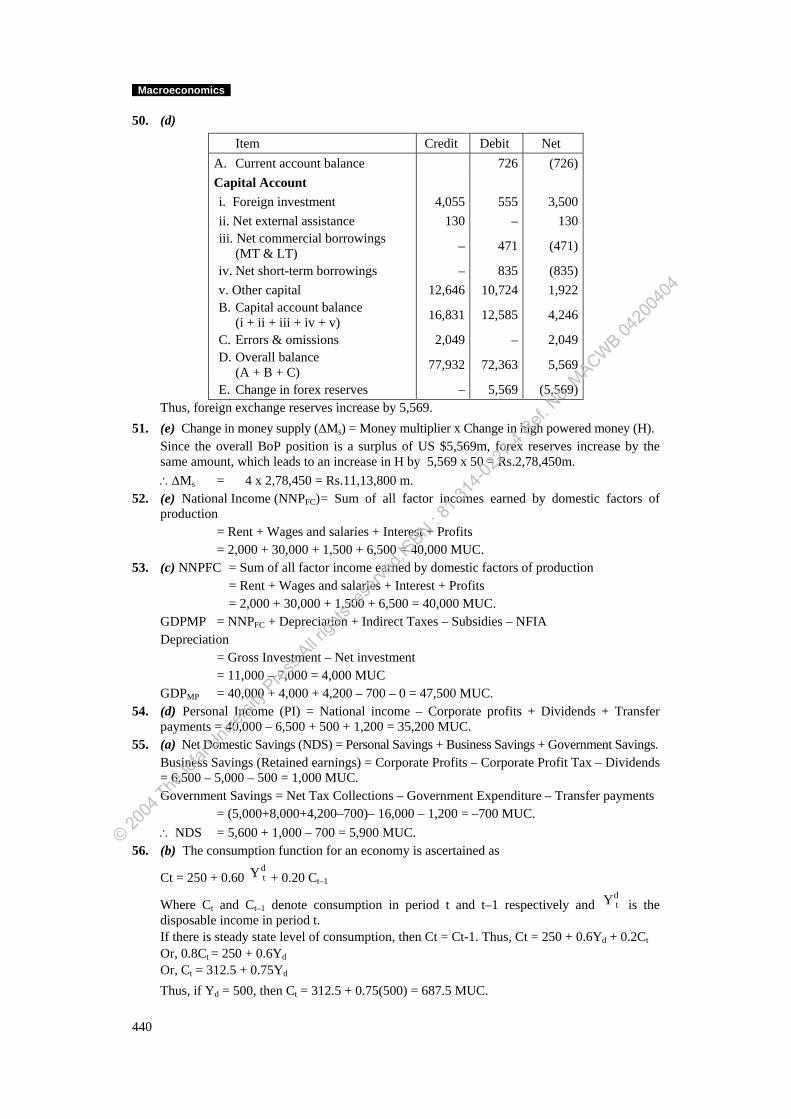
Macroeconomics
50. (d)
Item Credit Debit Net A. Current account balance 726 (726) Capital Account i. Foreign investment 4,055 555 3,500 ii. Net external assistance 130 – 130 iii. Net commercial borrowings
(MT & LT) – 471 (471)
iv. Net short-term borrowings – 835 (835) v. Other capital 12,646 10,724 1,922 B. Capital account balance
(i + ii + iii + iv + v) 16,831 12,585 4,246
C. Errors & omissions 2,049 – 2,049 D. Overall balance
(A + B + C) 77,932 72,363 5,569
E. Change in forex reserves – 5,569 (5,569) Thus, foreign exchange reserves increase by 5,569. 51. (e) Change in money supply (ΔMs) = Money multiplier x Change in high powered money (H). Since the overall BoP position is a surplus of US $5,569m, forex reserves increase by the
same amount, which leads to an increase in H by 5,569 x 50 = Rs.2,78,450m. ∴ΔMs = 4 x 2,78,450 = Rs.11,13,800 m. 52. (e) National Income (NNPFC) = Sum of all factor incomes earned by domestic factors of
production = Rent + Wages and salaries + Interest + Profits = 2,000 + 30,000 + 1,500 + 6,500 = 40,000 MUC. 53. (c) NNPFC = Sum of all factor income earned by domestic factors of production = Rent + Wages and salaries + Interest + Profits = 2,000 + 30,000 + 1,500 + 6,500 = 40,000 MUC. GDPMP = NNPFC + Depreciation + Indirect Taxes – Subsidies – NFIA Depreciation = Gross Investment – Net investment = 11,000 – 7,000 = 4,000 MUC GDPMP = 40,000 + 4,000 + 4,200 – 700 – 0 = 47,500 MUC. 54. (d) Personal Income (PI) = National income – Corporate profits + Dividends + Transfer
payments = 40,000 – 6,500 + 500 + 1,200 = 35,200 MUC. 55. (a) Net Domestic Savings (NDS) = Personal Savings + Business Savings + Government Savings. Business Savings (Retained earnings) = Corporate Profits – Corporate Profit Tax – Dividends
= 6,500 – 5,000 – 500 = 1,000 MUC. Government Savings = Net Tax Collections – Government Expenditure – Transfer payments
= (5,000+8,000+4,200–700)– 16,000 – 1,200 = –700 MUC. ∴ NDS = 5,600 + 1,000 – 700 = 5,900 MUC. 56. (b) The consumption function for an economy is ascertained as
Ct = 250 + 0.60 dtY
+ 0.20 Ct–1
Where Ct and Ct–1 denote consumption in period t and t–1 respectively and is the disposable income in period t.
dtY
If there is steady state level of consumption, then Ct = Ct-1. Thus, Ct = 250 + 0.6Yd + 0.2Ct
Or, 0.8Ct = 250 + 0.6Yd
Or, Ct = 312.5 + 0.75Yd
Thus, if Yd = 500, then Ct = 312.5 + 0.75(500) = 687.5 MUC.
440
© 2004
The Ic
fai U
nivers
ity P
ress.A
ll righ
ts res
erved
.ISBN : 8
1-314
-0227
-4 Ref.
No.
MACWB 04
2004
04
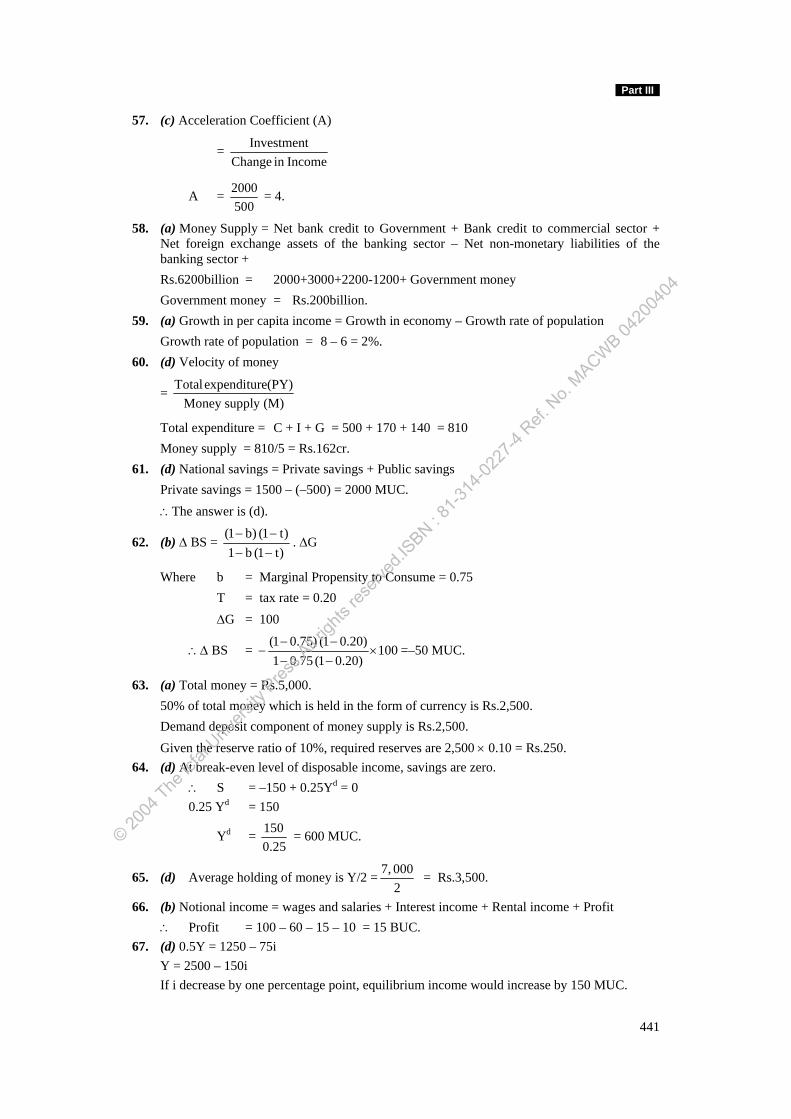
Part III
57. (c) Acceleration Coefficient (A)
= IncomeinChange
Investment
A = 2000500
= 4.
58. (a) Money Supply = Net bank credit to Government + Bank credit to commercial sector + Net foreign exchange assets of the banking sector – Net non-monetary liabilities of the banking sector +
Rs.6200billion = 2000+3000+2200-1200+ Government money Government money = Rs.200billion. 59. (a) Growth in per capita income = Growth in economy – Growth rate of population Growth rate of population = 8 – 6 = 2%. 60. (d) Velocity of money
= Totalexpenditure(PY)Money supply (M)
Total expenditure = C + I + G = 500 + 170 + 140 = 810 Money supply = 810/5 = Rs.162cr.
61. (d) National savings = Private savings + Public savings Private savings = 1500 – (–500) = 2000 MUC. ∴The answer is (d).
62. (b) Δ BS = )t1(b1)t1()b1(
−−−−
. ΔG
Where b = Marginal Propensity to Consume = 0.75 T = tax rate = 0.20 ΔG = 100
∴Δ BS = 100)20.01(75.01)20.01()75.01(×
−−−−
− =–50 MUC.
63. (a) Total money = Rs.5,000. 50% of total money which is held in the form of currency is Rs.2,500. Demand deposit component of money supply is Rs.2,500. Given the reserve ratio of 10%, required reserves are 2,500 × 0.10 = Rs.250.
64. (d) At break-even level of disposable income, savings are zero. ∴ S = –150 + 0.25Yd = 0 0.25 Yd = 150
Yd = 1500.25
= 600 MUC.
65. (d) Average holding of money is Y/2 = 7, 0002
= Rs.3,500.
66. (b) Notional income = wages and salaries + Interest income + Rental income + Profit ∴ Profit = 100 – 60 – 15 – 10 = 15 BUC.
67. (d) 0.5Y = 1250 – 75i Y = 2500 – 150i If i decrease by one percentage point, equilibrium income would increase by 150 MUC.
441
© 2004
The Ic
fai U
nivers
ity P
ress.A
ll righ
ts res
erved
.ISBN : 8
1-314
-0227
-4 Ref.
No.
MACWB 04
2004
04
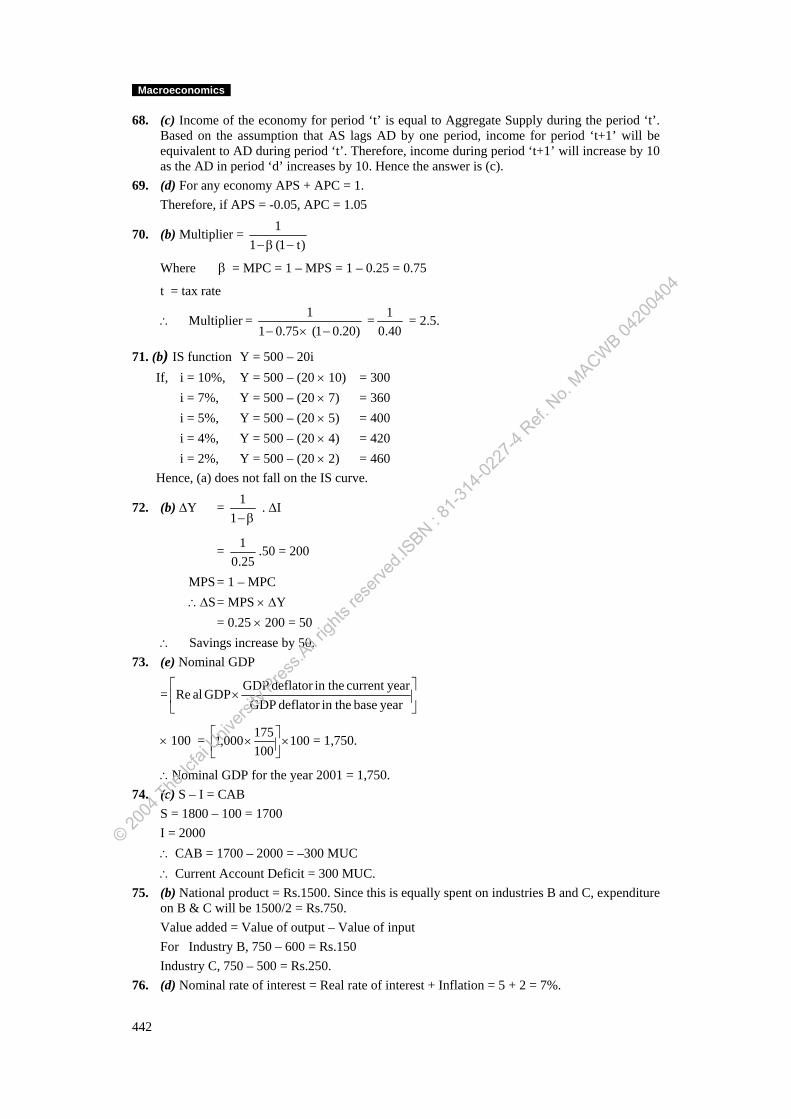
Macroeconomics
68. (c) Income of the economy for period ‘t’ is equal to Aggregate Supply during the period ‘t’. Based on the assumption that AS lags AD by one period, income for period ‘t+1’ will be equivalent to AD during period ‘t’. Therefore, income during period ‘t+1’ will increase by 10 as the AD in period ‘d’ increases by 10. Hence the answer is (c).
69. (d) For any economy APS + APC = 1. Therefore, if APS = -0.05, APC = 1.05
70. (b) Multiplier = )t1(1
1−β−
Where = MPC = 1 – MPS = 1 – 0.25 = 0.75 β
t = tax rate
∴ Multiplier = )20.01(75.01
1−×−
=40.01 = 2.5.
71. (b) IS function Y = 500 – 20i If, i = 10%, Y = 500 – (20 × 10) = 300 i = 7%, Y = 500 – (20 × 7) = 360 i = 5%, Y = 500 – (20 × 5) = 400 i = 4%, Y = 500 – (20 × 4) = 420 i = 2%, Y = 500 – (20 × 2) = 460 Hence, (a) does not fall on the IS curve.
72. (b) ΔY = β−1
1 . ΔI
= 25.01 .50 = 200
MPS = 1 – MPC ∴ΔS = MPS × ΔY = 0.25 × 200 = 50 ∴ Savings increase by 50.
73. (e) Nominal GDP
= ⎥⎦
⎤⎢⎣
⎡×
yearbasetheindeflatorGDPyearcurrenttheindeflatorGDP
GDPalRe
× 100 = 100100175000,1 ×⎥⎦
⎤⎢⎣⎡ × = 1,750.
∴Nominal GDP for the year 2001 = 1,750. 74. (c) S – I = CAB
S = 1800 – 100 = 1700 I = 2000 ∴ CAB = 1700 – 2000 = –300 MUC ∴ Current Account Deficit = 300 MUC.
75. (b) National product = Rs.1500. Since this is equally spent on industries B and C, expenditure on B & C will be 1500/2 = Rs.750. Value added = Value of output – Value of input For Industry B, 750 – 600 = Rs.150
Industry C, 750 – 500 = Rs.250. 76. (d) Nominal rate of interest = Real rate of interest + Inflation = 5 + 2 = 7%.
442
© 2004
The Ic
fai U
nivers
ity P
ress.A
ll righ
ts res
erved
.ISBN : 8
1-314
-0227
-4 Ref.
No.
MACWB 04
2004
04