
Macroeconomic Data in Real Time Tara M. Sinclair George Washington University Weidenbaum Center...
40
Macroeconomic Data in Real Time Tara M. Sinclair George Washington University Weidenbaum Center Media Retreat Wianno Club in Cape Cod June 28, 2011
-
Upload
jonas-reeves -
Category
Documents
-
view
215 -
download
2
Transcript of Macroeconomic Data in Real Time Tara M. Sinclair George Washington University Weidenbaum Center...

Macroeconomic Data in Real Time
Tara M. SinclairGeorge Washington University
Weidenbaum Center Media RetreatWianno Club in Cape CodJune 28, 2011
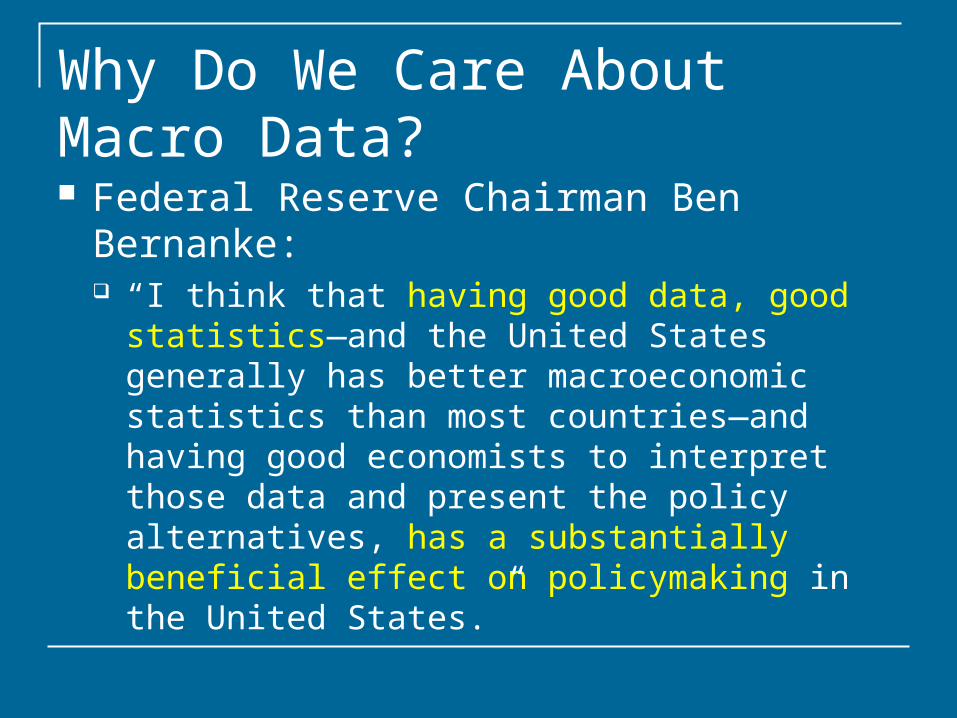
Why Do We Care About Macro Data? Federal Reserve Chairman Ben Bernanke:
“I think that having good data, good statistics—and the United States generally has better macroeconomic statistics than most countries—and having good economists to interpret those data and present the policy alternatives, has a substantially beneficial effect on policymaking in the United States.”

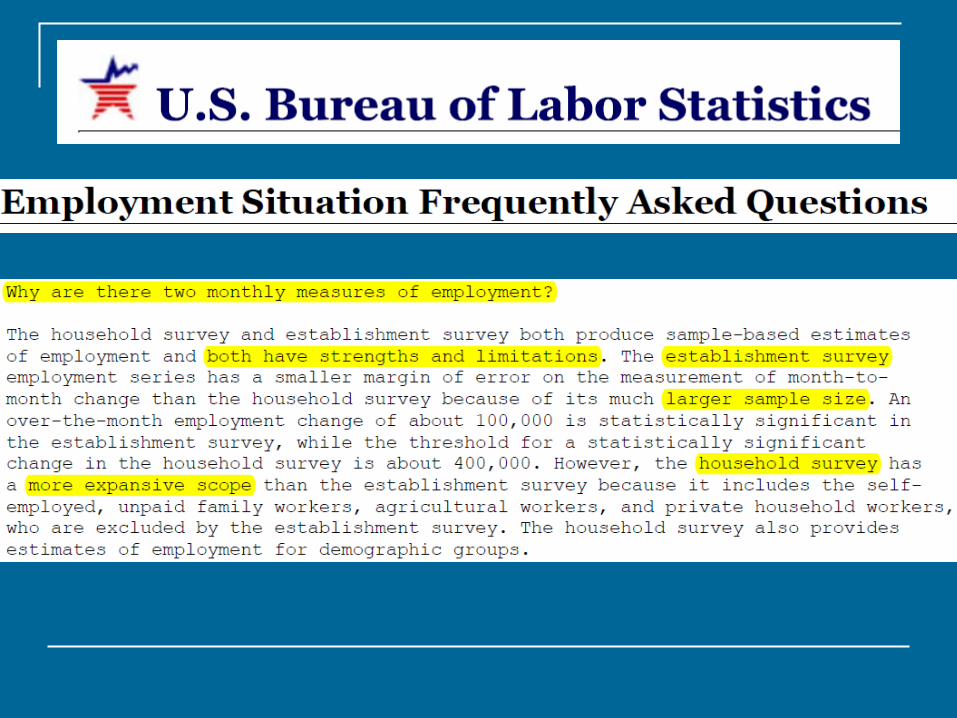
How Good Are US Macro Data? Two key issues:
We face an “accuracy-timeliness” tradeoff with almost all macroeconomic data. Data are regularly revised.
Different measures can give a very different picture of the economy. Therefore economists look at a lot of data.
One related question: What about macroeconomic forecasts?

Example: GDP Revisions
Real GDP is measured quarterly, with estimates released monthly: “Advance” estimates are released one month after the
quarter. Gross Domestic Product, 2nd Quarter 2011, (advance estimate)
will be released July 29th. “Second” estimates are released two months after the
quarter. Recently renamed – had been “preliminary.”
“Third” estimates are released three months after the quarter. Recently renamed – had been “final.”
Annual revisions each July for the previous year, plus occasional additional “comprehensive” revisions. Next annual revision will be released July 29th.

BEA News Release Friday, June 24, 2011
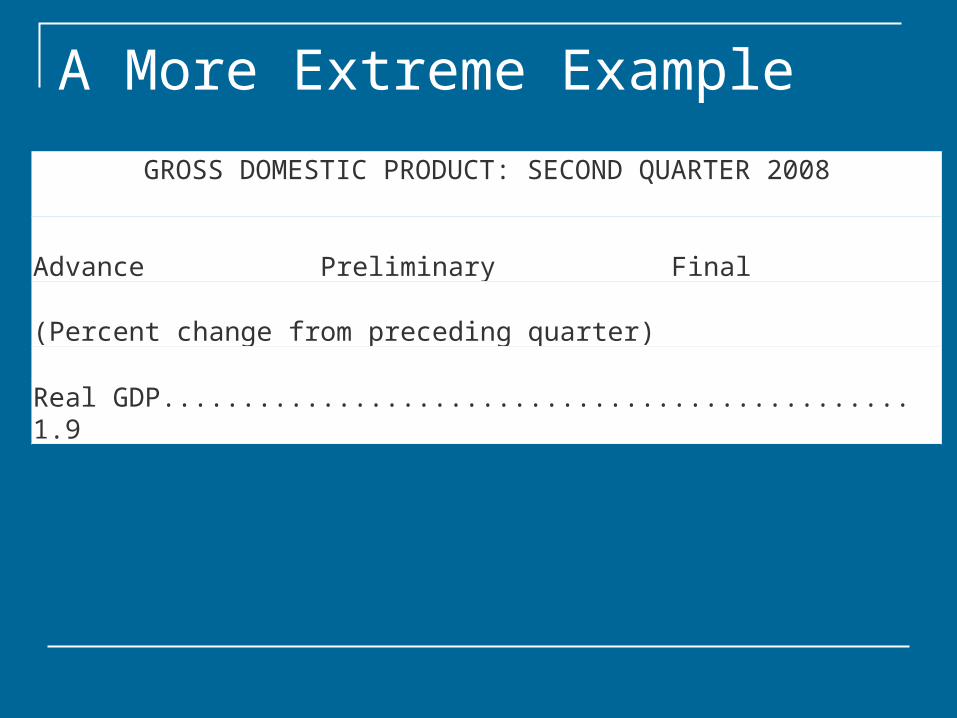
A More Extreme Example
GROSS DOMESTIC PRODUCT: SECOND QUARTER 2008
Advance Preliminary Final (Percent change from preceding quarter)
Real GDP............................................... 1.9
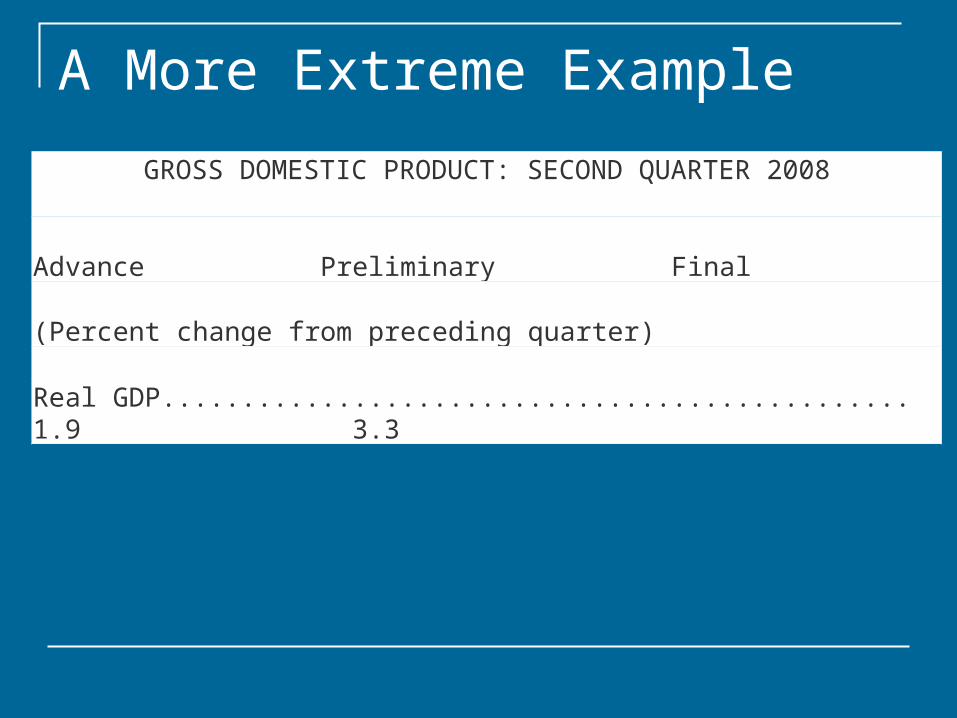
A More Extreme Example
GROSS DOMESTIC PRODUCT: SECOND QUARTER 2008
Advance Preliminary Final (Percent change from preceding quarter)
Real GDP............................................... 1.9 3.3

A More Extreme Example
GROSS DOMESTIC PRODUCT: SECOND QUARTER 2008 (FINAL)
Advance Preliminary Final (Percent change from preceding quarter)
Real GDP............................................... 1.9 3.3 2.8

A More Extreme Example
July, 2009 – revised to 1.5
GROSS DOMESTIC PRODUCT: SECOND QUARTER 2008 (FINAL)
Advance Preliminary Final (Percent change from preceding quarter)
Real GDP............................................... 1.9 3.3 2.8
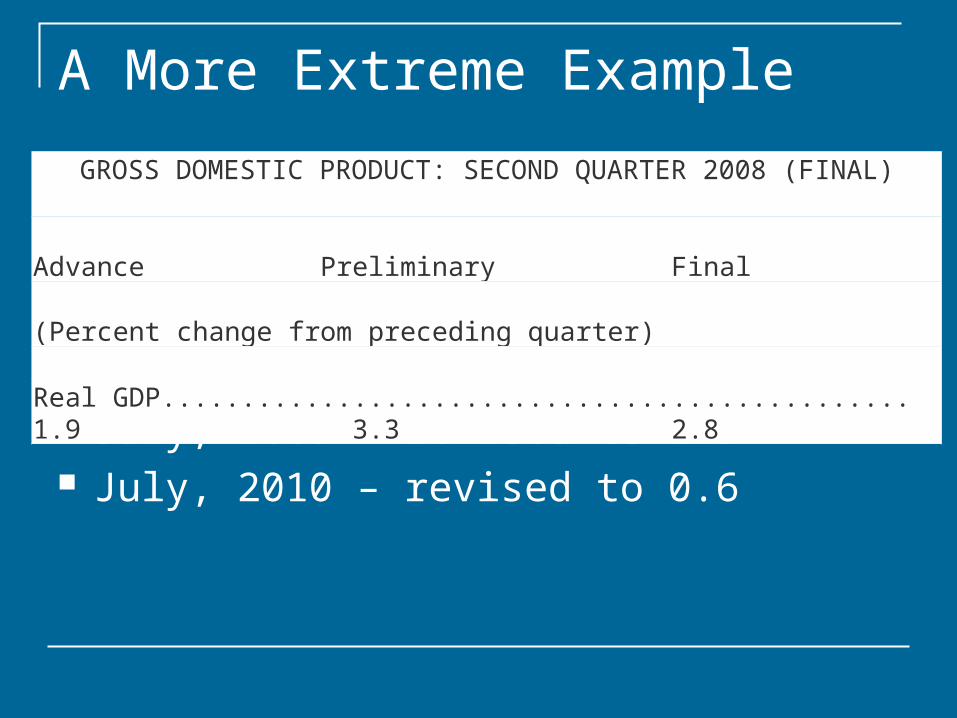
A More Extreme Example
July, 2009 – revised to 1.5 July, 2010 – revised to 0.6
GROSS DOMESTIC PRODUCT: SECOND QUARTER 2008 (FINAL)
Advance Preliminary Final (Percent change from preceding quarter)
Real GDP............................................... 1.9 3.3 2.8
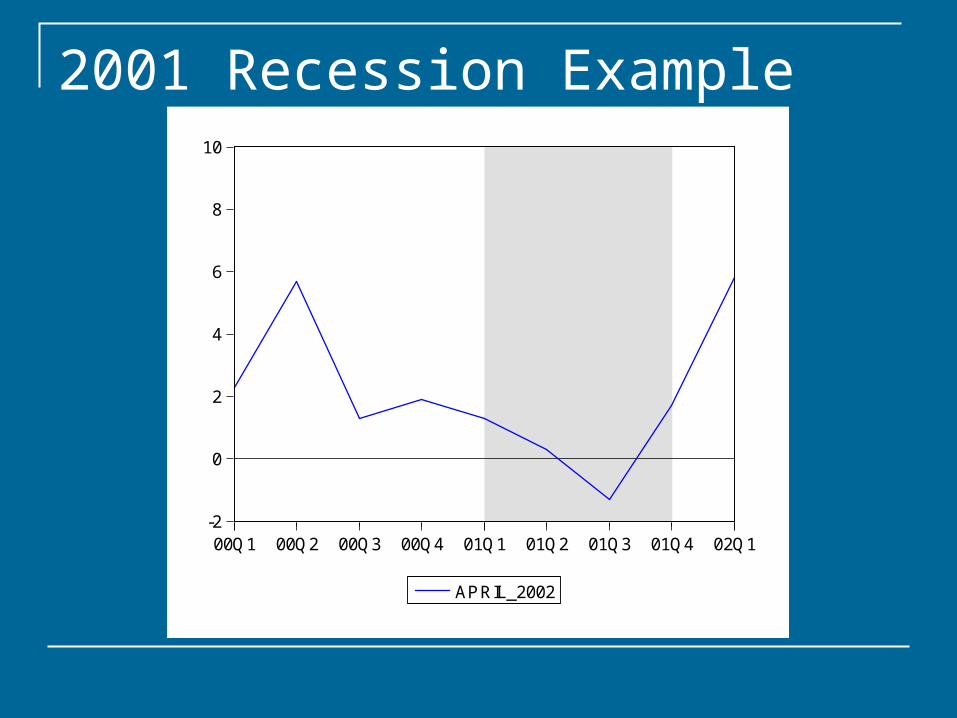
2001 Recession Example
-2
0
2
4
6
8
10
00Q1 00Q2 00Q3 00Q4 01Q1 01Q2 01Q3 01Q4 02Q1
APRIL_2002

2001 Recession Example
-2
0
2
4
6
8
10
00Q1 00Q2 00Q3 00Q4 01Q1 01Q2 01Q3 01Q4 02Q1
APRIL_2002 JULY_2002

2001 Recession Example
-2
0
2
4
6
8
10
00Q1 00Q2 00Q3 00Q4 01Q1 01Q2 01Q3 01Q4 02Q1
JULY_2002 JULY_2004

2001 Recession Example
-2
0
2
4
6
8
10
00Q1 00Q2 00Q3 00Q4 01Q1 01Q2 01Q3 01Q4 02Q1
JULY_2004 JULY_2009

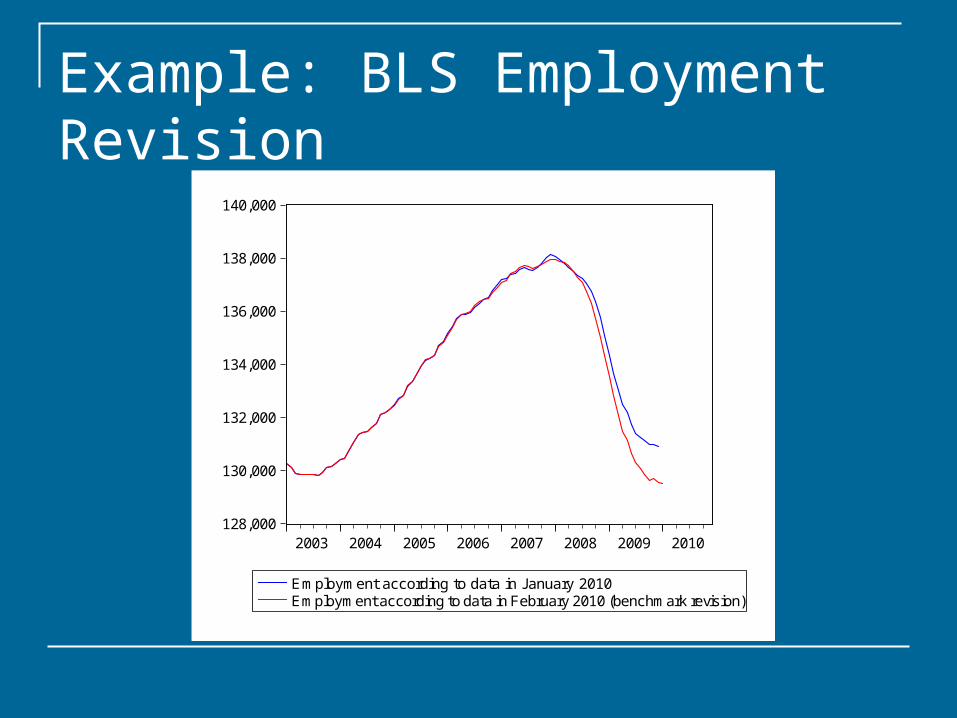
Example: BLS Employment Revision
128,000
130,000
132,000
134,000
136,000
138,000
140,000
2003 2004 2005 2006 2007 2008 2009 2010
Employment according to data in January 2010Employment according to data in February 2010 (benchmark revision)

How Good Are US Macro Data? - 2 There is a lot of macro data out there.
Which inflation measure should we rely on? How do we compare annualized growth rates to quarter-
to-quarter growth rates to…? What about seasonal adjustment?
Which measure best captures the labor market? What about cross-country comparisons?

Different Inflation Measures
Overall/Headline: General rise in the price level.
Core – excludes food and energy Reduces volatility. May be a better forecast of future inflation than
overall/headline inflation. CPI versus GDP deflator versus PCE.

BLS CPI Press Release

BEA GDP Price Index Press Release


What’s the difference between 0.2 and 0.3? At a compound annual rate:

What’s the difference between 0.2 and 0.3? At a compound annual rate: May Core CPI: 3.5%

What’s the difference between 0.2 and 0.3? At a compound annual rate: May Core CPI: 3.5% April Core CPI: 2.2%
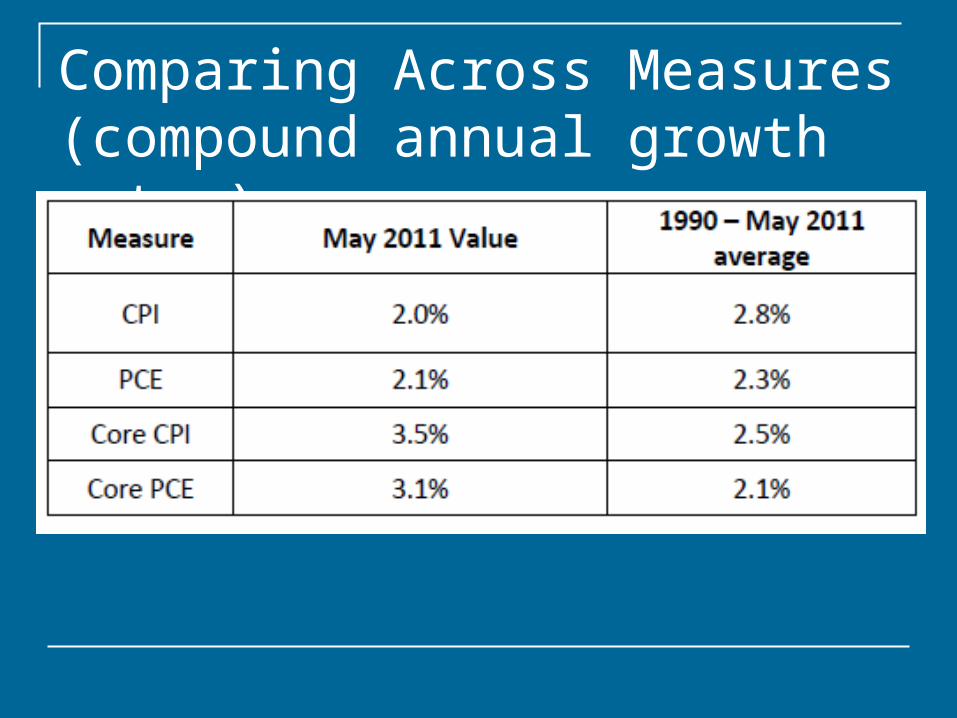
Comparing Across Measures(compound annual growth rates)

Comparing Across Measures
Seasonal Adjustment
Seasonal events affecting the economy follow a more or less regular pattern each year, so the statistics are regularly adjusted to make it easier to observe the longer term movements in the series.

BLS Press Release

Two Different Unemployment Rates The conventional unemployment rate, is
defined as: “Total unemployed persons, as a percent of the civilian labor force.”
The broadest Bureau of Labor Statistics (BLS) measure of unemployment, is defined as: “Total unemployed persons, plus all ‘marginally attached’ workers, plus all persons employed part time for economic reasons, as a percent of the civilian labor force plus all ‘marginally attached’ workers.”
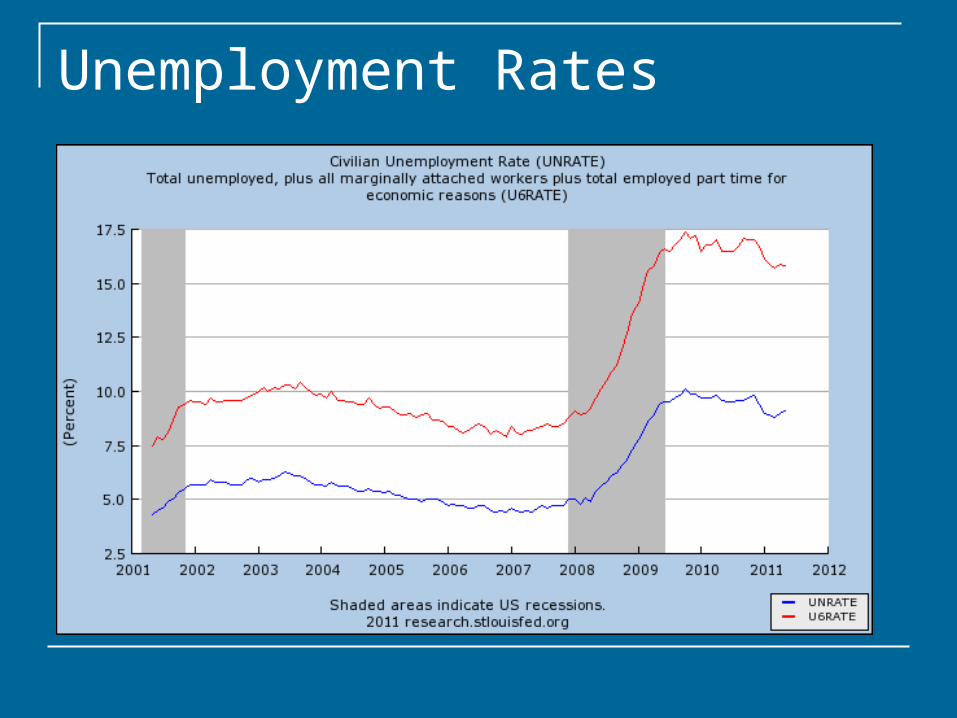
Unemployment Rates
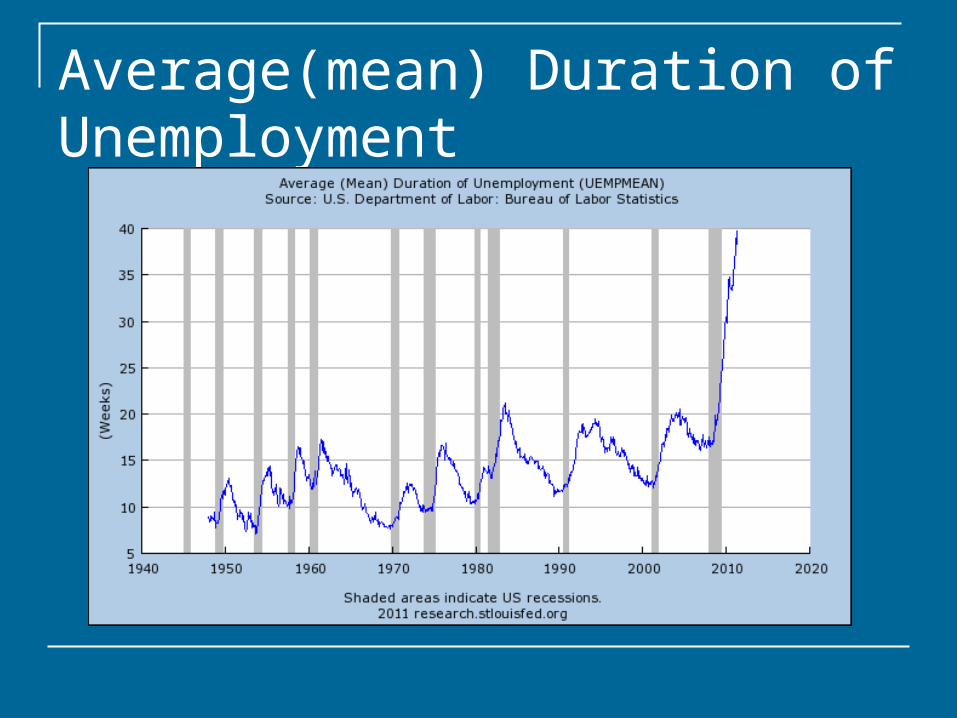
Average(mean) Duration of Unemployment

Labor Force Participation Rate
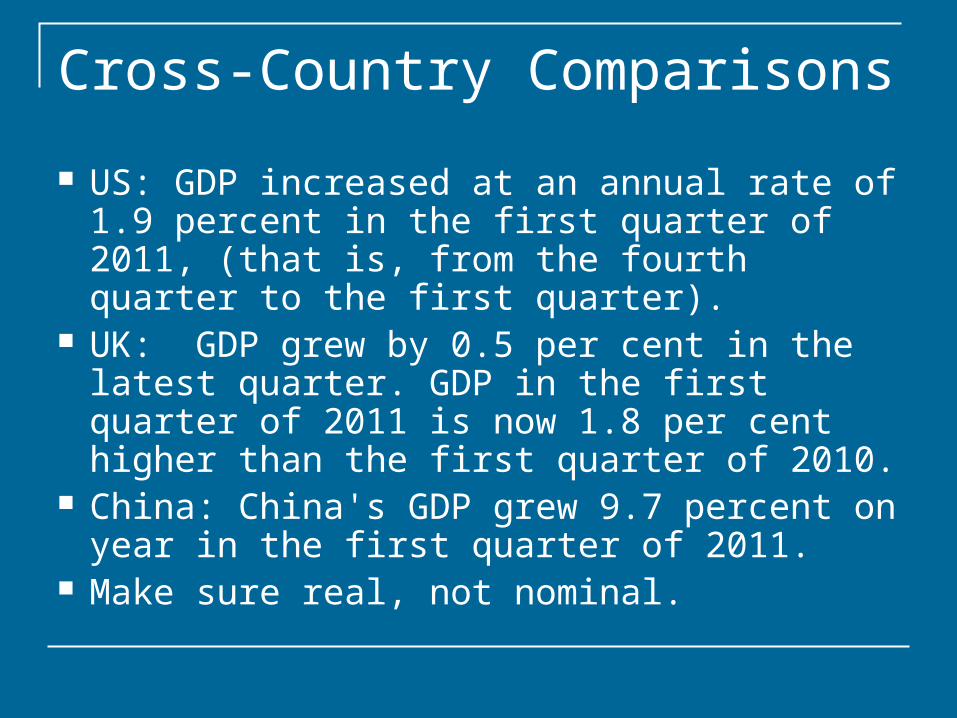
Cross-Country Comparisons
US: GDP increased at an annual rate of 1.9 percent in the first quarter of 2011, (that is, from the fourth quarter to the first quarter).
UK: GDP grew by 0.5 per cent in the latest quarter. GDP in the first quarter of 2011 is now 1.8 per cent higher than the first quarter of 2010.
China: China's GDP grew 9.7 percent on year in the first quarter of 2011.
Make sure real, not nominal.
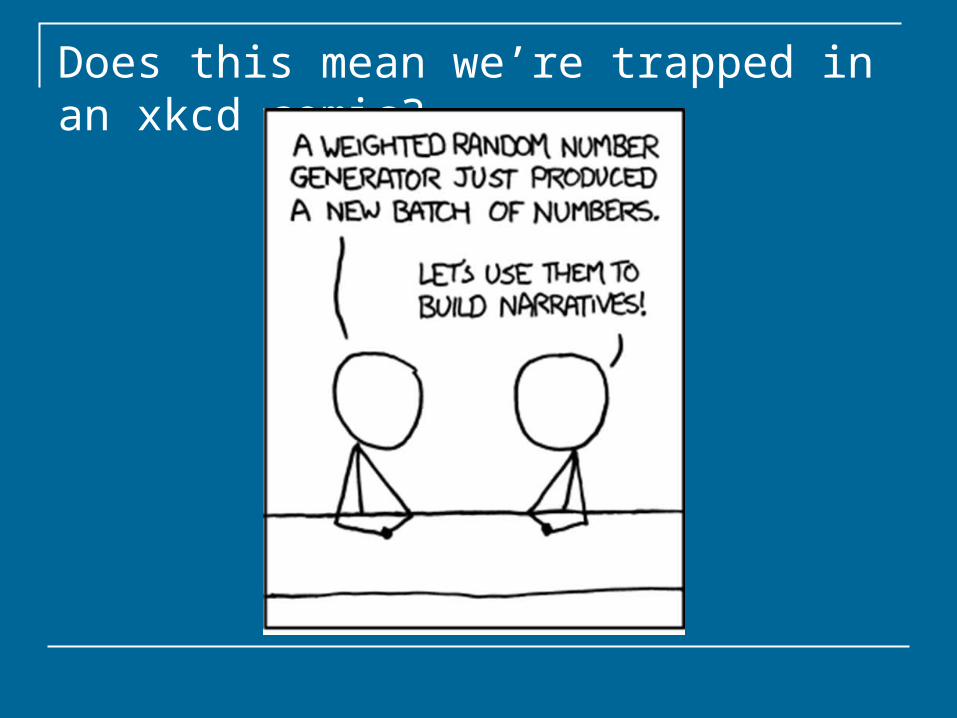
Does this mean we’re trapped in an xkcd comic?

No, But…
When it comes to forecasts, particularly about recessions, Laurence J. Peter may be right: “An economist is an expert who will know tomorrow why the
things hepredicted yesterday didn't happen today.”
Unfortunately: “The success of monetary policy depends
importantly on the quality of forecasting.”—Alan Greenspan (2004)
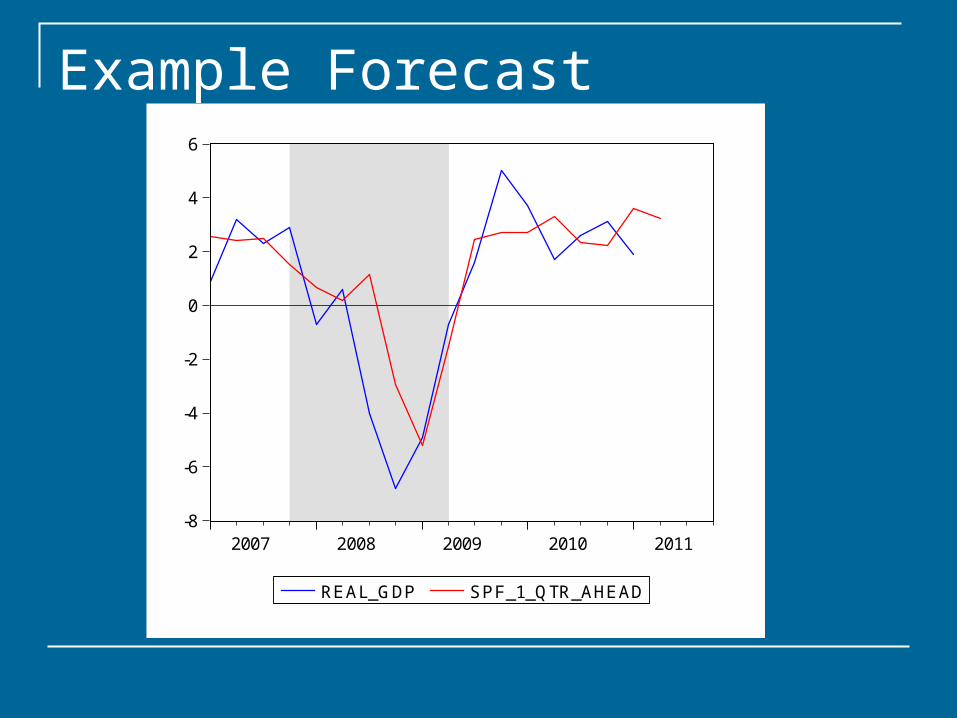
Example Forecast
-8
-6
-4
-2
0
2
4
6
2007 2008 2009 2010 2011
REAL_GDP SPF_1_QTR_AHEAD
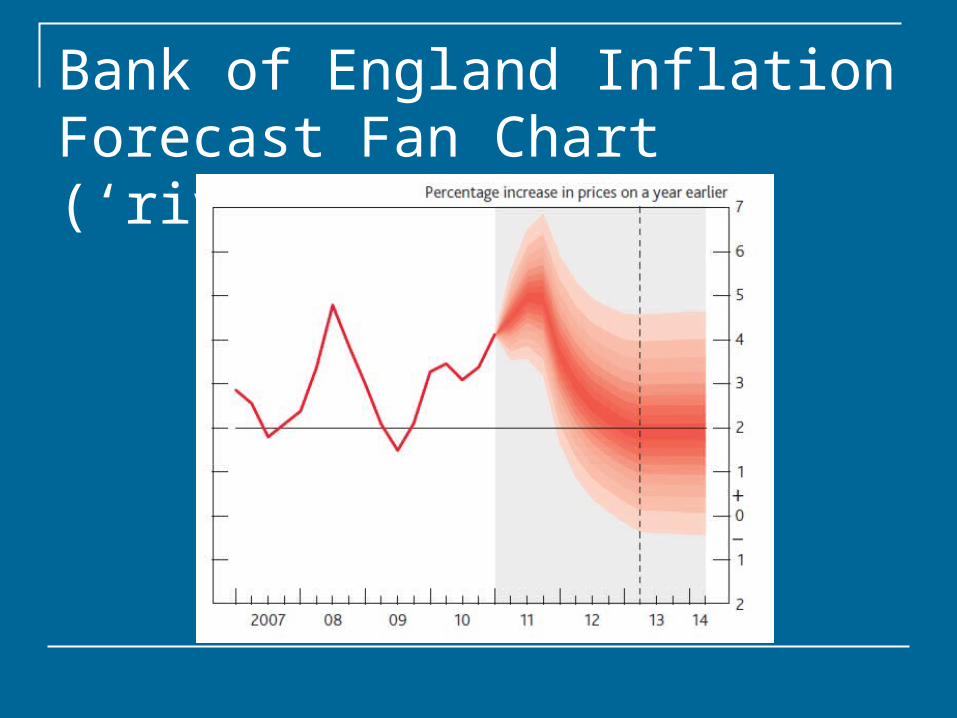
Bank of England Inflation Forecast Fan Chart (‘river of blood’)

Final Takeaways
Macroeconomic data can send mixed signals as it arrives in real time.
Macroeconomic forecasts are even less reliable than the incoming current data.
So… don’t be surprised when the data and the
forecasts change. don’t rely on a single number.

Great Data Sources
Data: St. Louis Federal Reserve Most recently revised data: Federal Reserve
Economic Data (FRED) http://research.stlouisfed.org/fred2/
“Vintage” data: ArchivaL Federal Reserve Economic Data (ALFRED) http://alfred.stlouisfed.org/
Forecasts: Philadelphia Federal Reserve Survey of Professional Forecasters
http://www.philadelphiafed.org/research-and-data/real-time-center/survey-of-professional-forecasters/