and macrobenthic Ecologically and Biologically Significant Areas

MARINE ECOLOGY PROGRESS SERIESMar Ecol Prog Ser
Vol. 341: 59–73, 2007 Published July 4
INTRODUCTION
Benthos represents a major component of the marineenvironment and plays a vital role in the overall foodchain in the sea. Yet, few benthic studies have beenconducted in the tropics compared with higherlatitudes. The first exploration of tropical continentalshelves began off the western edge of Africa in the1950s (Buchanan 1957, 1958), but there was not adiscernible increase in such studies until the mid-1970s(Wade 1972, Parulekar & Wagh 1975, Ansari et al.1977, Harkantra et al. 1980, 1982, Parulekar et al.1982, Warwick & Ruswahyuni 1987, Da Silva Attolini
& Santo Tararam 2001, Dittmann 2002). In India,Seshappa (1953) and Kurian (1953) were the first tocarry out detailed studies on the bottom fauna offMadras, Malabar and Travancore; since then, a num-ber of (isolated) investigations have been made offboth the east and west coasts (Ganapati & LakshmanaRao 1959, Radhakrishna & Ganapati 1969, Kurian1971, Damodaran 1973, Ansari et al. 1977, Harkantraet al. 1980, 1982, Parulekar et al. 1982, Raman & Adise-shasai 1989, Raut et al. 2005) albeit with little or noconcerted effort to unravel the question of faunal asso-ciations at a community level of organization or toidentify links to the key environmental factors. The
© Inter-Research 2007 · www.int-res.com*Corresponding author. Email: [email protected]
Macrobenthic community structure of the northeastIndian shelf, Bay of Bengal
T. Ganesh, A. V. Raman*
Marine Biological Laboratory, Department of Zoology, Andhra University, Waltair, Visakhapatnam 530003, India
ABSTRACT: Knowledge of tropical benthic fauna is limited. Two cruises (January 1999 and July2000) were made covering 24 stations along 5 transects between 16° and 20°N in shelf waters (depth30 to 200 m) in the Bay of Bengal off northeast India. Altogether 62 infaunal samples (Smith-McIntyregrab 0.1 m2) and 32 epibenthos (through a naturalist dredge 40 × 40 cm) were collected that revealed169 species representing 15 diverse groups. Gastropods, bivalves, polychaetes and decapodsconstituted the bulk of the population. Polychaetes were by far the most dominant group (64.98%)among the infauna followed by amphipods (25.23%), which were numerically more abundant (mean1080 ± 292 ind. m–2) at 51 to 75 m than at greater depths (345 ± 185 ind. m–2 at >150 m). Biomass washigher (wet weight 6.94 ± 4.8 g m–2) at 51 to 75 m than at 101 to 150 m (1.08 ± 1.23 g m–2). There wasa preponderance of decapods (26%), gastropods (20.7%), bivalves (8.3%) and several (28.3%) large-sized polychaetes (e.g. Diopatra neapolitana, Eunice indica, Pista sp.) in the dredge hauls (meanabundance 42 ± 8 ind. haul–1). Infaunal diversity (Shannon-Wiener H ’) was higher (H ’: 2.455 ± 0.18)at 51 to 75 m relative to the sites at >150 m depth (H ’: 0.981 ± 0.17). Multivariate analyses were usedto define assemblages named after the most important (determining) taxon. Three epifaunal associa-tions could be recognised off the northeast Indian shelf, namely the Charybdis Assemblage (30 to50 m), the Liagore Assemblage (51 to 75 m), and the Amygdalum watsoni –Tibia delicatula Assem-blage (>100 m). Infaunal associations consisted of Ampelisca (30 to 75 m), Nephtys (76 to 100 m) andCossura coasta (>100 m). Canonical correspondence analysis (CCA) showed that depth, sand, sedi-ment organic matter and sediment mean size influenced epifauna distribution, whereas for infauna,salinity, temperature, mean particle diameter, sand and depth proved important.
KEY WORDS: Macrobenthic assemblages · Shelf sediments · Canonical correspondence analysis ·Epifauna · Infauna · Marine ecosystems · Bay of Bengal
Resale or republication not permitted without written consent of the publisher

Mar Ecol Prog Ser 341: 59–73, 2007
present study concerns 2 major scientific investigations(Cruises 171 and 186 of the Fishery and Oceano-graphic Reseach Vessel [FORV] ‘Sagar Sampada’) con-ducted in January 1999 and July 2000 off the Indiannortheast shelf; the focus of the study was limited tosub-tidal macrobenthos comprising burrowing organ-isms (infauna) and surface living fauna (epifauna)retained on a 0.5 mm mesh. The main objective of thisresearch was to characterize benthic communities(based on species abundance data) and link them to asuite of environmental factors (e.g. depth, sedimenttexture and organic content, seawater temperature,salinity and dissolved oxygen) measured synchro-nously at several (24) pre-determined locations (30 to200 m) in shelf waters in the Bay of Bengal.
The Bay of Bengal is unique in many respects. Enor-mous amounts of freshwater (1.6 × 10¹² m3 yr–1) draininto the the sea each year from the hinterland riversIrravadi, Ganga, Brahmaputra, Mahanadi, Godavari,Krishna and Cauvery (Varkey et al. 1996), and theassociated suspended sediment discharge is on theorder of 1.4 × 10⁹ t. The inundation by such massiveamounts of freshwater renders surface water almostestuarine during the post-monsoon months (Septem-ber and October) while absolutely marine conditionsare present from January to June. In addition, large-scale discharges of silt by the rivers reduces the watertransparency over large areas in the Bay with a conse-quent fall in the rate and amount of photosynthesis(Ganapati 1973). An important feature of the Bay ofBengal is the influence of the southwest and northeastmonsoons that bring about a complete reversal of thesurface current pattern, either clock-wise or counterclock-wise depending on the direction of the wind(LaFond 1957, Varkey et al. 1996, Madhupratap et al.2003). The annual range of the seawater temperatureis 25 to 29°C, while salinity may vary from 20 to 33.The isohaline of 34 and above is always outside theBay (Ganapati 1973). Off Visakhapatnam, the hydro-graphical conditions are largely influenced by southerly(August–December, salinity 20.79 to 32.97) andnortherly (January–July, salinity 30.06 to 34.57) cur-rents, which run skirting the coast. Upwelling takesplace during March–May, leading to annual phyto-plankton production mainly dominated by diatoms(>90%) (Ganapati 1973). There is a marked impover-ishment of dissolved oxygen, and an increase in nutri-ents and salinity at this time of the year compared tooffshore waters (LaFond 1957).
A noted geological conformation in the Bay ofBengal is the Ganges Canyon, or ‘Swatch of NoGround’, which begins in the shallow waters off theGanges Delta and extends into the continental shelf ina northeast–southwest direction. All along the coastbeginning at the ‘Swatch of No Ground’ down to
Calimere Point, bottom contours of the shelf roughlyfollow the coastline configuration. The continentalshelf is as wide as 160 km at the head of the Bay, butnarrows towards the south (38 km). In 1963, theAndhra, Mahadevan and Krishna Canyons were dis-covered off the Andhra coast. An important featureconcerning sediments off the Indian east shelf relatesto the littoral drift, which is highest during May toAugust coinciding with strong southwest monsoon(LaFond 1966).
MATERIALS AND METHODS
Study design and sampling. Two cruises were con-ducted (January 1999 and July 2000) and altogether24 stations with 5 transects between 16°N (Divi Point)and 20°N (Paradip) representing the northeast shelfwere examined (Fig. 1, Table 1). At each transect, sam-ples were collected at 30, 50, 100, 150 and 200 m depthsites depending on the width (narrowness) of the shelfand other factors such as distance between 2 succes-sive stations. For example, off Paradip, where thecontinental shelf is steep, sampling was restricted to100 m. On the other hand, when the distance between2 successive locations exceeded 10 km, an additionalstation (at 65 m) was added (e.g. Visakhapatnam). Bothgrab and dredge hauls were obtained according tostandard protocols (e.g. Holme & McIntyre 1984).Observations on the physicochemical characteristics ofthe seawater (temperature, dissolved oxygen, salinity)were made using an onboard CTD (Sea-Bird) facilityaccording to Barnes (1959).
Benthic fauna. A Kahlsico No. 214 WA 250 modifiedSmith-McIntyre grab (0.1 m2) was used for unitsampling. While it was not always possible to collectreplicate hauls from all locations (owing to rough seas),at least 2 grab hauls were made at each site. Aftertaking out a small quantity of sub-sample (~50 g) fortextural analysis, the rest was washed at the onboardfacility (sieving platform) using 1 mm or 0.5 mm sievesdepending on the nature of sediment. For coarsesediments, a 1 mm sieve was first used. After sieving,all organisms were carefully separated and togetherwith any residual sediment, the samples were fixed in5 to 7% (neutral) formaldehyde containing BengalRose, labelled and stored for further examination. Priorto sorting (identification), wet weight was determinedusing a mono-pan electronic balance (AFCOSETER200A with an accuracy of 0.1 mg). In order to saveinimitable taxa for further examination, biomass(g m
–2) was determined as wet weight. All taxa were
first segregated into different groups and then identi-fied to specific, generic or other higher levels to thegreatest extent possible with the help of standard
60

Ganesh & Raman: Macrobenthic community in the Bay of Bengal 61
Fig. 1. Macrobenthos of northeast Indian shelf: station locations
Table 1. Benthic macrofauna of northeast Indian shelf: station locations of Cruises 171 and 186 of FORV ‘Sagar Sampada’. (Stns 190–209 represent Cruise 171 and Stns 601–664 Cruise 186). –: no data
Location Stn no. Latitude Longitude Depth No. of grab No. of dredge(m) samples samples
Divi Point 194/645 15° 59’ 46” N 81° 19’ 48” E 30 3 1193/646 16° 00’ 00” N 81° 22’ 80” E 50 3 1192/647 16° 00’ 00” N 81° 25’ 70” E 100 2 1191/648 16° 00’ 00” N 81° 27’ 70” E 150 2 –190/649 16° 00’ 50” N 81° 29’ 30” E 200 2 –
Kakinada 195/652 17° 00’ 00” N 82° 26’ 40” E 30 4 2196/653 17° 00’ 00” N 82° 31’ 00” E 50 3 2197/654 17° 00’ 00” N 82° 43’ 90” E 100 2 2198/655 17° 00’ 02” N 82° 50’ 86” E 150 2 –199/656 17° 00’ 09” N 82° 58’ 20” E 200 2 –
Visakhapatnam 200/664 17° 53’ 00” N 83° 35’ 70” E 30 3 2201/663 17° 52’ 20” N 83° 41’ 30” E 50 2 2202A/662 17° 50’ 74” N 83° 49’ 59” E 65 2 2661 17° 51’ 26” N 83° 57’ 02” E 65 2 1202/660 17° 51’ 00” N 84° 00’ 90” E 100 3 1
Barua 203/203A/601 18° 59’ 80” N 84° 46’ 10” E 30 4 1204A/602 19° 00’ 00” N 84° 48’ 40” E 50 3 2204/603 19° 00’ 06” N 85° 04’ 19” E 100 3 2205/604 19° 00’ 19” N 85° 11’ 30” E 150 2 1206/605 19° 00’ 10” N 85° 17’ 40” E 200 2 1
Paradip 207/608 20° 00’ 00” N 86° 33’ 20” E 30 3 2208/609 20° 00’ 00” N 86 °41’ 00” E 40 2 2209A/610 20° 00’ 02” N 86° 45’ 80” E 50 3 2209/611 19° 57’ 27” N 86° 46’ 18” E 100 3 2

Mar Ecol Prog Ser 341: 59–73, 2007
taxonomic references (e.g. Polychaeta: Fauvel 1953,Day 1967; Mollusca: Subba Rao et al. 1991). Theorganisms were later counted under a stereoscopicmicroscope (Olympus SZ40, 40× magnification) andabundance was expressed as ind. m–2.
Epifauna were collected using a naturalist’s dredge,a metal 40 × 40 cm frame fitted with a nylon mesh(1.0 cm2) and weighted enough to reach the sea bot-tom. At each location, the dredge was operated forvarying times (~10 to 45 min) depending on the loca-tion (depth), nature of the bottom, etc. Onboard, allorganisms were washed with seawater in a large metaltray and after separation the animals were carefullytransferred into polythene containers, labelled andpreserved in 7% formaldehyde/methylated ethanolfor later study. While sorting, only live materialwas picked. In the laboratory, these organisms werecounted (ind. haul–1) under suitable magnification (4×).
Sediment texture. Sediments (sub-samples) wereoven-dried (60°C) onboard and stored until furtheranalysis. In the laboratory, the samples were subjectedto sieving and pipette analysis according to standardprocedures (Krumbein & Pettijohn 1938, Holme &McIntyre 1984). In each case, the proportion of sand,silt and clay (%) was calculated and values plottedon triangular graphs according to nomenclature sug-gested by Sheppard (1954). Organic matter was esti-mated by the wet oxidation method of Walkley-Blackbut as modified by Gaudette et al. (1974).
Data analysis. Univariate measures included speciesrichness Shannon-Wiener diversity (H ’ loge) and even-ness (J ’). Multivariate analysis consisted of estimatingBray-Curtis similarity after suitable transformation ofsample abundance data. The similarity matrix wassubjected to both clustering (hierarchical agglome-rative method using group-average linking) andordination (non-metric multidimensional scaling, MDS)using PRIMER 5.1 (Clarke & Gorley 2001). Significancetests of sample groupings were made using theANOSIM (1-way) randomization test. The contribu-tion of each species to groupings noticed in the clusterand ordination analysis was examined using SIMPER
(similarity percentages) implemented in PRIMER(Clarke & Warwick 1994) to quantify percentage con-tribution of each species to similarity within eachgroup (i.e. characteristic) of samples and to dis-similarity between different groups. Other routines(e.g. BVSTEP), namely stepwise searches of combina-tions of species considered to be ultimately responsiblefor the observed pattern in the biotic assemblages,were also carried out using PRIMER. Canonical Corre-spondence Analysis, (CCA) (CANOCO 4.53, ter Braak1986, ter Braak & Smilauer 2002) was performed toevaluate possible correlations between environmentalvariables, macrobenthic species and variance in sitepattern, using a form of stepwise regression. A MonteCarlo permutation test (unrestricted) was used todetermine the significance of species-environmentrelationships.
RESULTS
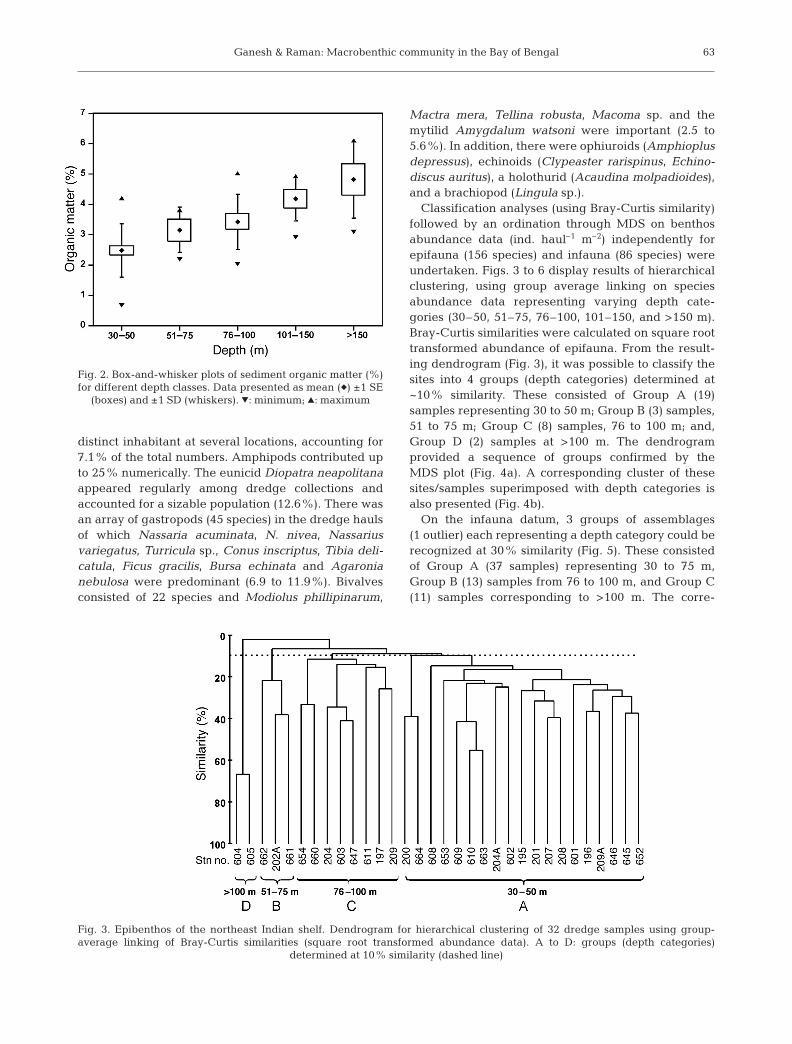
Spatially there were large differences in sedimentstructure (analysis of similarities, ANOSIM, Global R =0.187, significance p = 0.019), the predominant texturalclass in several cases (27 samples) being clayey siltfollowed by silty clay (16). At most sites, the sedimentsconsisted of relatively soft (mud) substrata even inshallow areas (<30 m) except off Visakhapatnam,where they typically represented ‘sand’ and differedmarkedly from others (R = 0.483, p = 0.004). Sedimentorganic matter also varied appreciably (Global R =0.24, p = 0.001) in relation to depth and nature of sub-stratum (Table 2, Fig. 2).
In total 169 macrobenthic species represented by15 diverse taxa were encountered, of which gas-tropods, bivalves, polychaetes and decapods formedby far the most important groups. Among the epifauna,gastropods constituted a more diverse group (49 spe-cies) followed by crustaceans (34), polychaetes (26)and bivalves (25). Polychaetes dominated the infauna(60 species) and contributed numerically up to ~65% ofthe population. The spionid Prionospio pinnata was a
62
Table 2. Sediment characteristics of northeast Indian shelf, Cruises 171 and 186. Data presented as mean ± SD (range). MPD: meanparticle diameter
Characteristic 30–50 m 51–75 m 76–100 m 101–150 m >150 m
Sand (%) 27.2 ± 31.0 (1.1–90.2) 9.4 ± 5.1 (4.0–14.1) 20.8 ± 29.1 (0.8–92.2) 2.5 ± 1.2 (1.2–4.7) 1.0 ± 0.9 (0.1–2.5)Silt (%) 35.0 ± 17.3 (6.2–61.6) 43.2 ± 15.2 (28.2–62.5) 45.6 ± 24.7 (4.0–87.5) 55.4 ± 17.5 (32.1–79.3) 55.0 ± 11.6 (35.0–67.2)Clay (%) 37.8 ± 18.3 (3.6–66.6) 47.4 ± 17.3 (23.4–21.7) 33.6 ± 18.7 (3.9–70.4) 42.0 ± 18.2 (18.2–65.9) 43.9 ± 12.1 (31.8–64.7)Organic 2.5 ± 0.2 (0.7–4.2) 3.2 ± 0.7 (2.2–3.8) 3.4 ± 0.9 (2.0–4.9) 4.2 ± 0.7 (2.9–4.9) 4.8 ± 1.3 (3.1–6.1)
matter (%)Mean size (µm) 49.4 ± 97.1 (1.5–435) 6.2 ± 5.0 (2.5–13.6) 26.9 ± 55.2 (1.2–196) 5.2 ± 3.0 (1.8–9.7) 4.2 ± 1.5 (2.5–6.1)MPD (µm) 92.5 ± 160 (0.5–500) 7.5 ± 7.9 (2.2–19.2) 37.8 ± 66.7 (0.8–196) 5.7 ± 2.7 (1.9–9.8) 5.2 ± 1.8 (2.2–7.3)
Ganesh & Raman: Macrobenthic community in the Bay of Bengal
distinct inhabitant at several locations, accounting for7.1% of the total numbers. Amphipods contributed upto 25% numerically. The eunicid Diopatra neapolitanaappeared regularly among dredge collections andaccounted for a sizable population (12.6%). There wasan array of gastropods (45 species) in the dredge haulsof which Nassaria acuminata, N. nivea, Nassariusvariegatus, Turricula sp., Conus inscriptus, Tibia deli-catula, Ficus gracilis, Bursa echinata and Agaronianebulosa were predominant (6.9 to 11.9%). Bivalvesconsisted of 22 species and Modiolus phillipinarum,
Mactra mera, Tellina robusta, Macoma sp. and themytilid Amygdalum watsoni were important (2.5 to5.6%). In addition, there were ophiuroids (Amphioplusdepressus), echinoids (Clypeaster rarispinus, Echino-discus auritus), a holothurid (Acaudina molpadioides),and a brachiopod (Lingula sp.).
Classification analyses (using Bray-Curtis similarity)followed by an ordination through MDS on benthosabundance data (ind. haul–1 m–2) independently forepifauna (156 species) and infauna (86 species) wereundertaken. Figs. 3 to 6 display results of hierarchicalclustering, using group average linking on speciesabundance data representing varying depth cate-gories (30–50, 51–75, 76–100, 101–150, and >150 m).Bray-Curtis similarities were calculated on square roottransformed abundance of epifauna. From the result-ing dendrogram (Fig. 3), it was possible to classify thesites into 4 groups (depth categories) determined at~10% similarity. These consisted of Group A (19)samples representing 30 to 50 m; Group B (3) samples,51 to 75 m; Group C (8) samples, 76 to 100 m; and,Group D (2) samples at >100 m. The dendrogramprovided a sequence of groups confirmed by theMDS plot (Fig. 4a). A corresponding cluster of thesesites/samples superimposed with depth categories isalso presented (Fig. 4b).
On the infauna datum, 3 groups of assemblages(1 outlier) each representing a depth category could berecognized at 30% similarity (Fig. 5). These consistedof Group A (37 samples) representing 30 to 75 m,Group B (13) samples from 76 to 100 m, and Group C(11) samples corresponding to >100 m. The corre-
63
Fig. 2. Box-and-whisker plots of sediment organic matter (%)for different depth classes. Data presented as mean (�) ±1 SE
(boxes) and ±1 SD (whiskers). �: minimum; �: maximum
Fig. 3. Epibenthos of the northeast Indian shelf. Dendrogram for hierarchical clustering of 32 dredge samples using group-average linking of Bray-Curtis similarities (square root transformed abundance data). A to D: groups (depth categories)
determined at 10% similarity (dashed line)

Mar Ecol Prog Ser 341: 59–73, 2007
sponding MDS plots (Fig. 6) confirmed the observedfindings.
Epifaunal density (dredge collections) variedmarkedly (3 to 160 ind. haul–1) in relation to depth(ANOSIM Global R = 0.746, p < 0.05). The 30 to50 m sites yielded the richest fauna (mean density51 ind. haul–1), contributing up to 71.82% of totalpopulation. Faunal abundance, however, decreasedat 51 to 100 m (mean 37 ind. haul–1) and >100 m(28 ind. haul–1) (Fig. 7b, Table 3). Spatially (16° to20° N), benthos densities were highest (60 ind.
haul–1) off Paradip (20° N, 86° 33’ to 46’ E) and con-tributed up to 35.4% of the total population. Differ-ing sedimentary setting (e.g. ratio of sand, silt andclay), proximity to river inflows (affecting sedimentdeposition) and local hydrographical conditions (e.g.primary production) appeared important (e.g. Paru-lekar et al. 1982, Alongi 1990). Close to where theRiver Hooghly joins the Bay of Bengal, the organi-cally rich sediments supported rich benthos as aresult of massive river inflows draining into theGangetic delta (Harkantra et al. 1982).
64
Fig. 5. Infauna of the northeast Indian shelf. Dendrogram for hierarchical clustering of 62 grab samples using group-average link-ing of Bray-Curtis similarities (square root transformed abundance data). A to C: groups (depth categories) determined at 30%
similarity (dashed line)
Fig. 4. Epibenthos of the northeast Indian shelf. (a) Multidimensional scaling (MDS) plot for 32 samples. (b) Plot superimposedwith depth classes

Ganesh & Raman: Macrobenthic community in the Bay of Bengal
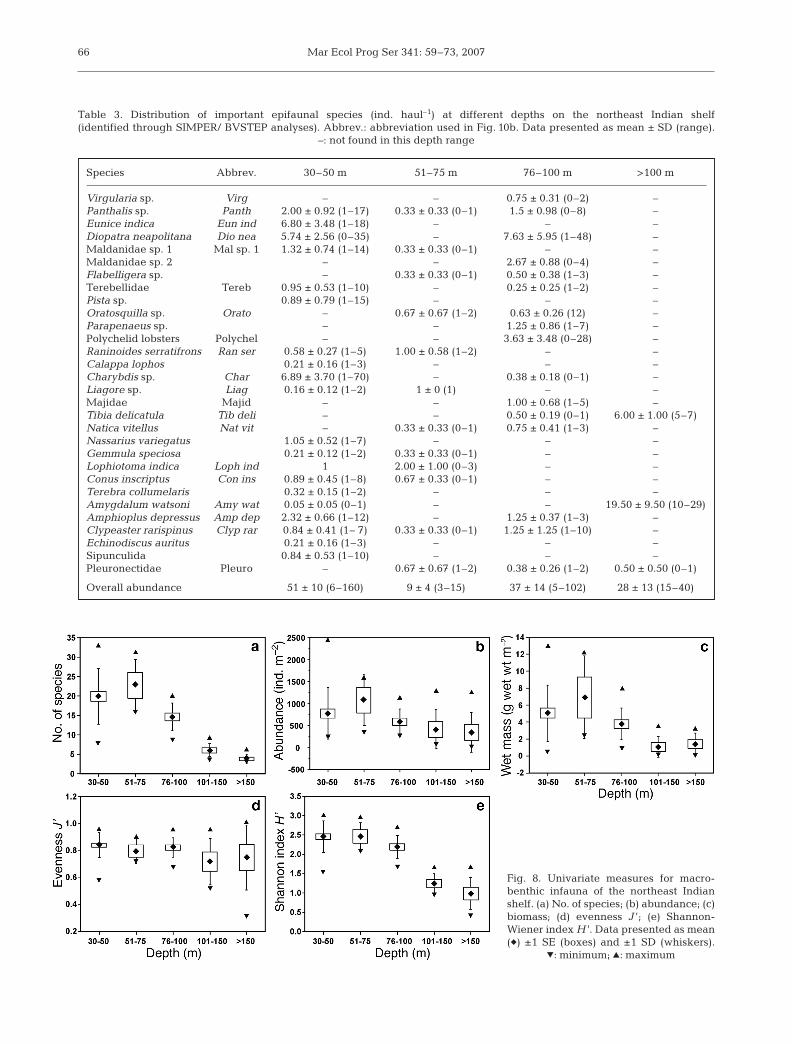
Infaunal densities (grab hauls) varied (30 to 2460 ind.m–2) significantly depth-wise (ANOSIM Global R =0.782, p = 0.001). The 30 to 50 m sites supported up to60.8% of the total population numerically (mean density775 ± 103 ind. m–2), the predominant taxa being am-phipods (17.5%, Fig. 8b, Table 4). Between the depths51 and 75 m, mean abundance was 1080 ± 292 ind. m–2.
Numbers, however, swiftly dwindled with depth. Northto south infaunal densities remained highest (mean888 ind. m–2) off Visakhapatnam (17°53’00’’ N).
Biomass (grab hauls: mean wet weight g m–2) washighest (6.941 ± 4.8) at 51 to 75 m, where large-sizedEunice sp. (~80 ind. m–2) contributed to the bulk andthe biomass was the lowest (1.078 ± 1.2) further
65
Fig. 6. Infauna of the northeast Indian shelf. (a) Multidimensional scaling (MDS) plot for 62 samples. (b) Plot superimposed withdepth classes
Fig. 7. Univariate measures for macrobenthic epifauna of the northeast Indian shelf. (a) No. of species; (b) abundance; (c) evennessJ ’; (d) Shannon-Wiener index H ’. Data presented as mean (�) ±1 SE (boxes) and ±1 SD (whiskers). �: minimum; �: maximum
Mar Ecol Prog Ser 341: 59–73, 200766
Table 3. Distribution of important epifaunal species (ind. haul–1) at different depths on the northeast Indian shelf (identified through SIMPER/ BVSTEP analyses). Abbrev.: abbreviation used in Fig. 10b. Data presented as mean ± SD (range).
–: not found in this depth range
Species Abbrev. 30–50 m 51–75 m 76–100 m >100 m
Virgularia sp. Virg – – 0.75 ± 0.31 (0–2) –Panthalis sp. Panth 2.00 ± 0.92 (1–17) 0.33 ± 0.33 (0–1) 1.5 ± 0.98 (0–8) –Eunice indica Eun ind 6.80 ± 3.48 (1–18) – – –Diopatra neapolitana Dio nea 5.74 ± 2.56 (0–35) – 7.63 ± 5.95 (1–48) –Maldanidae sp. 1 Mal sp. 1 1.32 ± 0.74 (1–14) 0.33 ± 0.33 (0–1) – –Maldanidae sp. 2 – – 2.67 ± 0.88 (0–4) –Flabelligera sp. – 0.33 ± 0.33 (0–1) 0.50 ± 0.38 (1–3) –Terebellidae Tereb 0.95 ± 0.53 (1–10) – 0.25 ± 0.25 (1–2) –Pista sp. 0.89 ± 0.79 (1–15) – – –Oratosquilla sp. Orato – 0.67 ± 0.67 (1–2) 0.63 ± 0.26 (12) –Parapenaeus sp. – – 1.25 ± 0.86 (1–7) –Polychelid lobsters Polychel – – 3.63 ± 3.48 (0–28) –Raninoides serratifrons Ran ser 0.58 ± 0.27 (1–5) 1.00 ± 0.58 (1–2) – –Calappa lophos 0.21 ± 0.16 (1–3) – – –Charybdis sp. Char 6.89 ± 3.70 (1–70) – 0.38 ± 0.18 (0–1) –Liagore sp. Liag 0.16 ± 0.12 (1–2) 1 ± 0 (1) – –Majidae Majid – – 1.00 ± 0.68 (1–5) –Tibia delicatula Tib deli – – 0.50 ± 0.19 (0–1) 6.00 ± 1.00 (5–7)Natica vitellus Nat vit – 0.33 ± 0.33 (0–1) 0.75 ± 0.41 (1–3) –Nassarius variegatus 1.05 ± 0.52 (1–7) – – –Gemmula speciosa 0.21 ± 0.12 (1–2) 0.33 ± 0.33 (0–1) – –Lophiotoma indica Loph ind 1 2.00 ± 1.00 (0–3) – –Conus inscriptus Con ins 0.89 ± 0.45 (1–8) 0.67 ± 0.33 (0–1) – –Terebra collumelaris 0.32 ± 0.15 (1–2) – – –Amygdalum watsoni Amy wat 0.05 ± 0.05 (0–1) – – 19.50 ± 9.50 (10–29)Amphioplus depressus Amp dep 2.32 ± 0.66 (1–12) – 1.25 ± 0.37 (1–3) –Clypeaster rarispinus Clyp rar 0.84 ± 0.41 (1– 7) 0.33 ± 0.33 (0–1) 1.25 ± 1.25 (1–10) –Echinodiscus auritus 0.21 ± 0.16 (1–3) – – –Sipunculida 0.84 ± 0.53 (1–10) – – –Pleuronectidae Pleuro – 0.67 ± 0.67 (1–2) 0.38 ± 0.26 (1–2) 0.50 ± 0.50 (0–1)
Overall abundance 51 ± 10 (6–160) 9 ± 4 (3–15) 37 ± 14 (5–102) 28 ± 13 (15–40)
Fig. 8. Univariate measures for macro-benthic infauna of the northeast Indianshelf. (a) No. of species; (b) abundance; (c)biomass; (d) evenness J ’; (e) Shannon-Wiener index H ’. Data presented as mean (�) ±1 SE (boxes) and ±1 SD (whiskers).
�: minimum; �: maximum

Ganesh & Raman: Macrobenthic community in the Bay of Bengal
offshore at 101 to 150 m (Fig. 8c). Parulekar et al.(1982) presented a comparative account of benthic bio-mass between the Bay of Bengal and the Arabian Seaalong with the Andaman and Lakshadweep regions,and noticed a variation between 0.01 and 601 g m–2,which was significantly higher in the Arabian Sea(mean 17.6 g m–2) than in the Bay of Bengal (5.5 g m–2),the Andaman (7.3 g m–2) or Lakshadweep Seas (0.7 gm–2). T. V. Joydas (pers. comm.) carried out a detailedinvestigation on benthos productivity for several loca-tions on the west coast of India and noticed that bio-mass often exceeded 5.555 g wet wt m–2. Macrobenthicbiomass (0.07 to 12.9 g m–2; mean 4.18 ± 0.41 g m–2) offthe northeast shelf appeared to be in conformity withthe generalized models presented above.
Species diversity was estimated according to the Shan-non-Wiener H ’ (loge) and evenness (J ’) indices. In thecase of epifauna, the Shannon-Wiener index H ’ (Fig. 7d)ranged between 0.73 ± 0.09 (>100 m) and 2.32 ± 0.01(30 to 50 m). The evenness component (J ’) (Fig. 7c)varied in conformity with H ’. The low evenness (0.76 ±0.16) at >100 m is in compliance with the presence ofspecific faunal elements, e.g. Tibia delicatula and Amyg-dalum watsoni, in the population. In the case of infauna,H ’ (Fig. 8e) generally decreased with depth, evidently asa result of dwindling numbers/species. The evennesscomponent (J ’) (Fig. 8d) varied in conformity with H ’.The low evenness (0.717 ± 0.07) at 101 to 150 m is attrib-utable to the presence of large numbers of Prionospiosp. and Cossura coasta in the population.
Multiple k-dominance plots (Clarke & Warwick1994) facilitated discrimination of benthos according to
species’ relative contribution to standing stocks. Whileup to 30 species formed 70% of the total benthosnumbers in dredge hauls at 30 to 50 m, it required 8, 11and 1 species to make up this proportion at the depths51 to 75, 76 to 100 and >100 m respectively (Fig. 9a). Inthe case of grab samples (i.e. infauna), 10 species madeup to 60% of the population at 30 to 50 m, 6 each at51 to 75 and 76 to 100 m, and 1 each at 101 to 150 and>150 m (Fig. 9b).
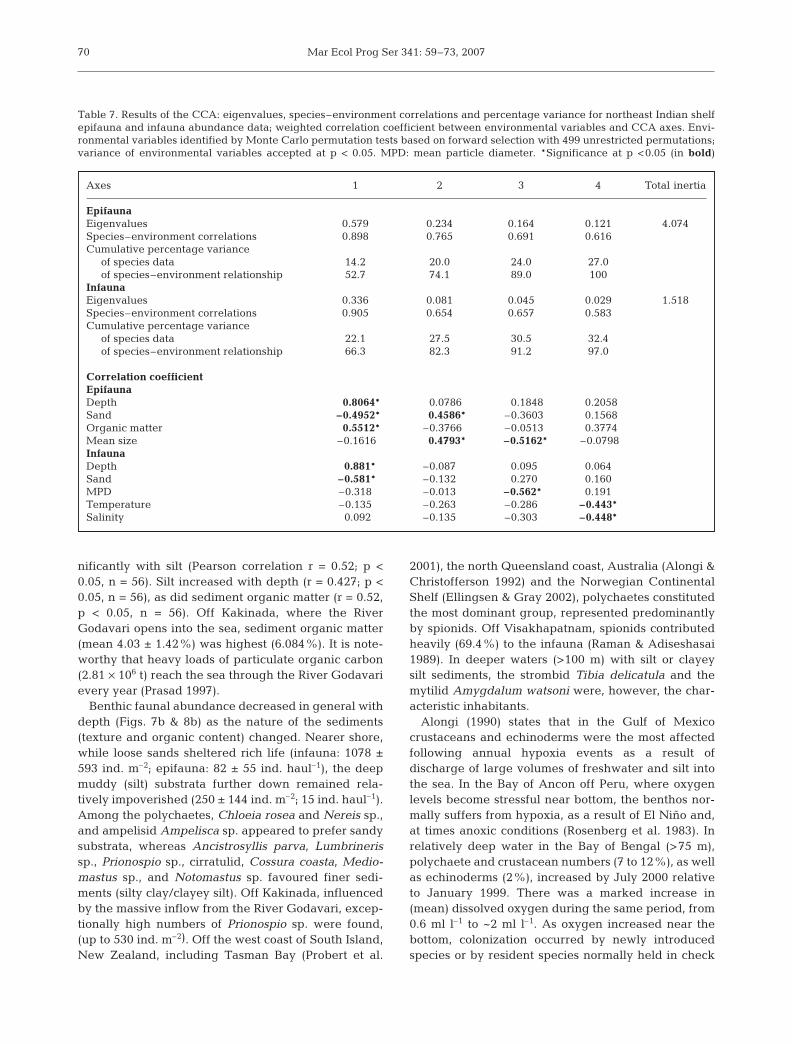
CCA was performed on select (epifaunal and infau-nal) species (identified through SIMPER, Tables 5 & 6,and BVSTEP), i.e. on the basis of their abundance andin the light of known environmental data. It was foundthat Axes 1 and 2 on the canonical ordination plots(Fig. 10) were the most important (Table 7) since theywere able to explain 74 and 82% of variation in speciesabundance data. Monte Carlo permutation tests (withforward selection) were used to identify which envi-ronmental variables (out of 10) explained the variancesignificantly (p < 0.05 level), the benthos distribution,and species abundance patterns (Table 7). For epi-fauna, the first CCA axis initially separated all shallowsites (30 to 50 m) from intermediate (76 to 100 m) anddeeper locations (>100 m), whilst the second CCA axisfurther separated the intermediate sites (76 to 100 m)from deeper sites (>100 m) (Fig. 10). While most of theintermediate sites (76 to 100 m) are positioned in theupper part of the second axis, the 51 to 75 m sites areseparated and located in the lower part of Axis 2.Axis 1 is strongly associated with depth (r = 0.80) andsediment organic matter (r = –0.55), whilst sand (r =0.46) and sediment mean size (r = 0.48) are closely
67
Table 4. Distribution of important infaunal species (ind. m–2) at different depths on the northeast Indian shelf (identified through SIMPER/ BVSTEP analyses). Abbrev.: abbreviation used in Fig. 11b. Data presented as mean ± SE (range).
–: not found in this depth range
Species Abbrev. 30–75 m 76–100 m >100 m
Chloeia rosea Chl ros 39.7 ± 17.2 (10–640) 36.2 ± 11.0 (10–130) 1.7 ± 1.7 (10–20)Ancistrosyllis parva Anc par 13.0 ± 2.7 (10–60) 73.1 ± 30.8 (10–390) 4.2 ± 2.3 (10–20)Nereis sp. Ner 10.5 ± 3.8 (10–100) 6.2 ± 2.1 (0–20) 0.8 ± 0.8 (0–10)Nephtys sp. Neph 45.4 ± 6.9 (10–210) 125.4 ± 312.0 (0–420) 1.7 ± 1.1 (0–10)Lumbrineris sp. 1 Lum sp. 1 14.6 ± 2.9 (10–60) 3.1 ± 1.3 (0–10) –Prionospio sp. 2 Prio sp. 2 9.7 ± 3.9 (10–130) 7.7 ± 2.3 (10–20) 86.7 ± 43.5 (10–530)Spionidae sp. 1 Spi sp. 1 17.0 ± 5.8 (10–200) 0.7 ± 0.7 (0–10) 0.8 ± 0.8 (0–10)Spionidae sp. 3 Spi sp. 3 7.3 ± 2.6 (10– 60) 49.2 ± 17.3 (0–200)Magelona sp. Mage 19.2 ± 4.9 (0–140) 13.9 ± 7.7 (10–100) –Cirratulidae sp. 1 Cirr sp. 1 43 ± 8.6 (10–250) 53.1 ± 15.5 (10–150) 4.2 ± 3.4 (10–40)Cossura coasta Cos coas 10.8 ± 2.4 (10–70) 44.6 ± 18.4 (10–230) 174.2 ± 69.1 (10–700)Mediomastus sp. Medio 19.2 ± 8.2 (10–260) 2.3 ± 1.7 (10–20) –Notomastus sp. Noto 16.8 ± 4.3 (10–100) 4.6 ± 4.6 (10–60) –Ampelisca sp. Ampel 211.1 ± 43.1 (10–1390) – –Maera sp. Maer 25.7 ± 5.5 (10–140) 1.5 ± 1.5 (10–20) –Corophium sp. Coro 1.4 ± 1.4 (10–50) 22.3 ± 5.0 (10–70) 70.8 ± 49.0 (10–560)Nemertean Neme 10.5 ± 1.9 (10–40) 6.2 ± 3.1 (10–30) 8.3 ± 3.2 (10–40)
Overall abundance 808 ± 97 (230–2460) 586 ± 82 (290–1140) 379 ± 124 (30–1280)

Mar Ecol Prog Ser 341: 59–73, 2007
linked with Axis 2. Single variable mean size charac-terized (r = –0.51) the third axis (Table 7).
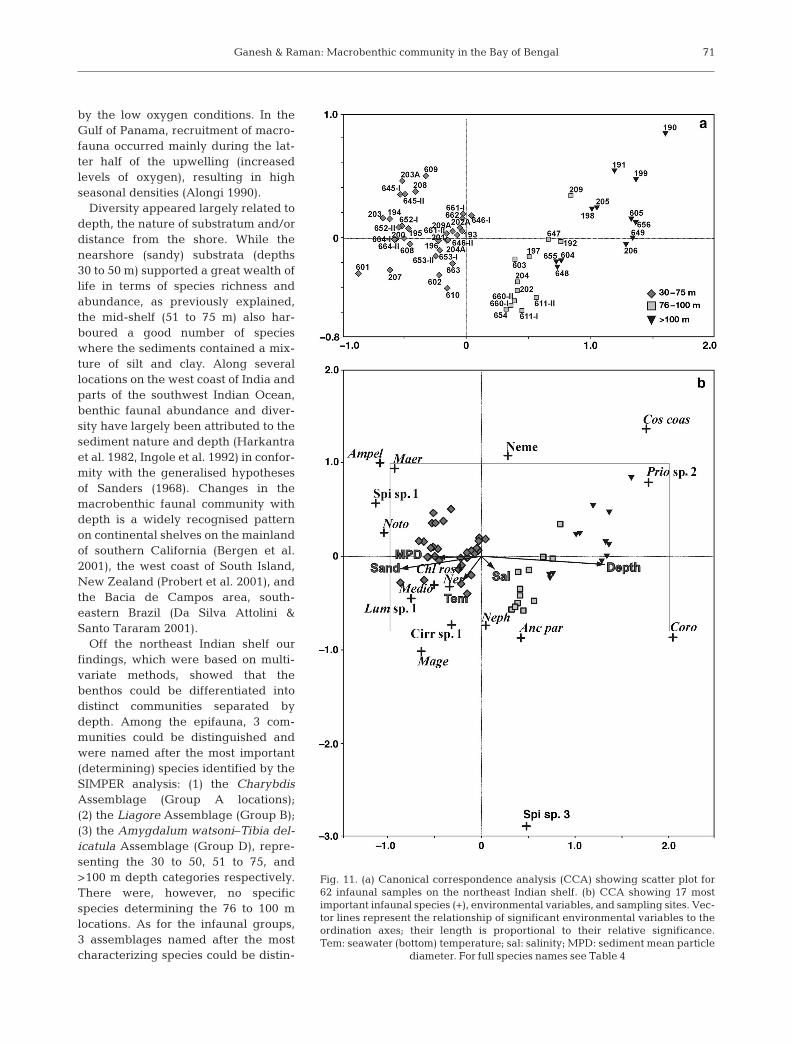
For infauna, the first CCA axis initially separated theshallow sites (30 to 75 m) from the intermediate (76 to100 m) and deeper sites (>100 m), whilst the second CCAaxis further separated the intermediate sites (76 to100 m) from deeper sites (>100 m). Most of the deepersites (>100 m) are positioned in the upper part of the sec-ond axis, whereas the intermediate 76 to 100 m sites areseparated and located in the lower part of Axis 2(Fig. 11). While Axis 1 is strongly influenced by depth(r = 0.88) and sand (r = –0.58), Axis 4 is linked with tem-perature (r = –0.44) and salinity (r = 0.45). Axis 2 did notshow any significant correlation, and Axis 3 associatedwith mean particle diameter (r = –0.56).
DISCUSSION
In marine benthic ecology, sediment grain size orgranulometry is considered central for determining thecomposition and characterization of benthos (Sanders1958, Gray 1974, Rhoads 1974, Snelgrove & Butman1994, Wijsman et al. 1999). Gray (1974) observed thelowest diversity within shelf habitats with mud, highdiversity in sand habitats and the highest diversity inmixed mud and sand–sediment with a median particle
68
Table 5. Results of SIMPER analysis for macrobenthic epifauna of the northeast Indian shelf: determining species (bold) for each depth class. Taxa are ranked according to their average contribution to dissimilarity between depths. Group A: 30–50 m; Group
B: 51–75 m; Group C: 76–100 m; Group D: >100 m
Species Average Average SD Dissimilarity/ %abundance dissimilarity SD contribution
Group A Group B Charybdis sp. 6.89a 0 5.68 3.3 1.71 6.13Amphioplus depressus 2.32 0 3.68 3.2 1.14 3.97Diopatra neapolitana 5.74 0 3.63 4.8 0.75 3.91Liagore sp. 0.16 1a 3.45 2.2 1.58 3.72
Group C Group BLiagore sp. 0 1a 5.37 2.9 1.85 5.64
Group A Group DAmygdalum watsoni 0.05 19.5a 14.72 6.8 2.18 14.81Tibia delicatula 0 6a 8.75 3.9 2.22 8.8Charybdis sp. 6.89a 0 5.58 3.2 1.75 5.62
Group C Group DAmygdalum watsoni 0 19.5a 21.14 8.9 2.38 22.42Tibia delicatula 0.5 6a 10.02 5.5 1.83 10.63
Group B Group DAmygdalum watsoni 0 19.5a 27.98 8.6 3.26 28.4Tibia delicatula 0 6a 16.55 5.6 2.95 16.79Liagore sp. 1a 0 6.89 2.7 2.56 6.99
aDetermining species of corresponding depth class
Fig. 9. k-dominance curves for species abundance data inrelation to depth on the northeast Indian shelf. (a) Dredge
haul and (b) grab haul

Ganesh & Raman: Macrobenthic community in the Bay of Bengal
diameter of about 200 µm, and it is imperative that anycorrelation between benthic organisms and sedimentnature should be viewed as the key to benthic ecology.Seven textural classes (e.g. Sheppard 1954) wereobserved for the northeast Indian shelf. These includedsand, clayey sand, silty sand, sand-silt-clay, silt, siltyclay and clayey silt.
Several factors, e.g. locality, depth, distance from theshore, river proximity and local oceanographic fea-tures such as bottom currents, etc., appeared impor-tant for determining benthos distribution patterns. Forexample, off Visakhapatnam, sediments within 30 mtypically represented ‘sand’ and differed markedlyfrom other localities with relatively soft substrata. This
is attributable to the absence of any significant riverinflows along the Visakhapatnam coast unlike otherareas (Divi Point, Kakinada, Barua, Paradip) whereheavy sediment loads (rich in silt and clay) enter thesea through the Rivers Krishna, Godavari, Vamsadharaand Mahanadi systems (see Fig. 1). Below 150 m sedi-ments along the northeast shelf are clayey silt,between 50 and 150 m, mostly silt, and from 30 to 50 m,sand, silt and clay, as reported earlier (Subba Rao1964).
It is generally believed that sediments with coarseparticles are deficient in organic matter whereas finegrain sediments show organic enrichment. For theIndian northeast shelf, organic matter correlated sig-
69
Table 6. Results of SIMPER analysis for macrobenthic infauna of the northeast Indian shelf: determining species (bold) for eachdepth class. Taxa are ranked according to their average contribution to dissimilarity between depths. Group A: 30–75 m;
Group B: 76–100 m; Group C: >100 m
Species Average Average SD Dissimilarity/ %abundance dissimilarity SD contribution
Group B Group AAmpelisca sp. 0 211.08 a 13.33 10.5794 1.26 16.33Nephtys sp. 125.38a 45.41 7.32 7.17647 1.02 8.97
Group C Group AAmpelisca sp. 0 211.08a 16.85 12.8626 1.31 17.94Cossura coasta 174.17 10.81 12.81 13.9239 0.92 13.64
Group C Group BCossura coasta 174.17a 44.62 14.55 13.34 1.09 16.31Nephtys sp. 1.67 125.38a 13.24 9.52 1.39 14.84
aDetermining species of corresponding depth class
Fig. 10. (a) Canonical correspondence analysis (CCA) showing scatter plot for 32 epifaunal samples on the northeast Indian shelf.(b) CCA showing 20 most important epifaunal species (+), environmental variables, and sampling sites. Vector lines represent the relationship of significant environmental variables to the ordination axes; their length is proportional to their relative
significance. OM: organic matter; Mz: sediment mean size. For full species names see Table 3
Mar Ecol Prog Ser 341: 59–73, 2007
nificantly with silt (Pearson correlation r = 0.52; p <0.05, n = 56). Silt increased with depth (r = 0.427; p <0.05, n = 56), as did sediment organic matter (r = 0.52,p < 0.05, n = 56). Off Kakinada, where the RiverGodavari opens into the sea, sediment organic matter(mean 4.03 ± 1.42%) was highest (6.084%). It is note-worthy that heavy loads of particulate organic carbon(2.81 × 10⁶ t) reach the sea through the River Godavarievery year (Prasad 1997).
Benthic faunal abundance decreased in general withdepth (Figs. 7b & 8b) as the nature of the sediments(texture and organic content) changed. Nearer shore,while loose sands sheltered rich life (infauna: 1078 ±593 ind. m–2; epifauna: 82 ± 55 ind. haul–1), the deepmuddy (silt) substrata further down remained rela-tively impoverished (250 ± 144 ind. m–2; 15 ind. haul–1).Among the polychaetes, Chloeia rosea and Nereis sp.,and ampelisid Ampelisca sp. appeared to prefer sandysubstrata, whereas Ancistrosyllis parva, Lumbrinerissp., Prionospio sp., cirratulid, Cossura coasta, Medio-mastus sp., and Notomastus sp. favoured finer sedi-ments (silty clay/clayey silt). Off Kakinada, influencedby the massive inflow from the River Godavari, excep-tionally high numbers of Prionospio sp. were found,(up to 530 ind. m–2). Off the west coast of South Island,New Zealand, including Tasman Bay (Probert et al.
2001), the north Queensland coast, Australia (Alongi &Christofferson 1992) and the Norwegian ContinentalShelf (Ellingsen & Gray 2002), polychaetes constitutedthe most dominant group, represented predominantlyby spionids. Off Visakhapatnam, spionids contributedheavily (69.4%) to the infauna (Raman & Adiseshasai1989). In deeper waters (>100 m) with silt or clayeysilt sediments, the strombid Tibia delicatula and themytilid Amygdalum watsoni were, however, the char-acteristic inhabitants.
Alongi (1990) states that in the Gulf of Mexicocrustaceans and echinoderms were the most affectedfollowing annual hypoxia events as a result ofdischarge of large volumes of freshwater and silt intothe sea. In the Bay of Ancon off Peru, where oxygenlevels become stressful near bottom, the benthos nor-mally suffers from hypoxia, as a result of El Niño and,at times anoxic conditions (Rosenberg et al. 1983). Inrelatively deep water in the Bay of Bengal (>75 m),polychaete and crustacean numbers (7 to 12%), as wellas echinoderms (2%), increased by July 2000 relativeto January 1999. There was a marked increase in(mean) dissolved oxygen during the same period, from0.6 ml l–1 to ~2 ml l–1. As oxygen increased near thebottom, colonization occurred by newly introducedspecies or by resident species normally held in check
70
Table 7. Results of the CCA: eigenvalues, species–environment correlations and percentage variance for northeast Indian shelfepifauna and infauna abundance data; weighted correlation coefficient between environmental variables and CCA axes. Envi-ronmental variables identified by Monte Carlo permutation tests based on forward selection with 499 unrestricted permutations;variance of environmental variables accepted at p < 0.05. MPD: mean particle diameter. *Significance at p <0.05 (in bold)
Axes 1 2 3 4 Total inertia
EpifaunaEigenvalues 0.579 0.234 0.164 0.121 4.074Species–environment correlations 0.898 0.765 0.691 0.616Cumulative percentage variance
of species data 14.2 20.0 24.0 27.0of species–environment relationship 52.7 74.1 89.0 100
InfaunaEigenvalues 0.336 0.081 0.045 0.029 1.518Species–environment correlations 0.905 0.654 0.657 0.583Cumulative percentage variance
of species data 22.1 27.5 30.5 32.4of species–environment relationship 66.3 82.3 91.2 97.0
Correlation coefficientEpifaunaDepth 0.8064* 0.0786 0.1848 0.2058Sand –0.4952* 0.4586* –0.3603 0.1568Organic matter 0.5512* –0.3766 –0.0513 0.3774Mean size –0.1616 0.4793* –0.5162* –0.0798InfaunaDepth 0.881* –0.087 0.095 0.064Sand –0.581* –0.132 0.270 0.160MPD –0.318 –0.013 –0.562* 0.191Temperature –0.135 –0.263 –0.286 –0.443*Salinity 0.092 –0.135 –0.303 –0.448*
Ganesh & Raman: Macrobenthic community in the Bay of Bengal
by the low oxygen conditions. In theGulf of Panama, recruitment of macro-fauna occurred mainly during the lat-ter half of the upwelling (increasedlevels of oxygen), resulting in highseasonal densities (Alongi 1990).
Diversity appeared largely related todepth, the nature of substratum and/ordistance from the shore. While thenearshore (sandy) substrata (depths30 to 50 m) supported a great wealth oflife in terms of species richness andabundance, as previously explained,the mid-shelf (51 to 75 m) also har-boured a good number of specieswhere the sediments contained a mix-ture of silt and clay. Along severallocations on the west coast of India andparts of the southwest Indian Ocean,benthic faunal abundance and diver-sity have largely been attributed to thesediment nature and depth (Harkantraet al. 1982, Ingole et al. 1992) in confor-mity with the generalised hypothesesof Sanders (1968). Changes in themacrobenthic faunal community withdepth is a widely recognised patternon continental shelves on the mainlandof southern California (Bergen et al.2001), the west coast of South Island,New Zealand (Probert et al. 2001), andthe Bacia de Campos area, south-eastern Brazil (Da Silva Attolini &Santo Tararam 2001).
Off the northeast Indian shelf ourfindings, which were based on multi-variate methods, showed that thebenthos could be differentiated intodistinct communities separated bydepth. Among the epifauna, 3 com-munities could be distinguished andwere named after the most important(determining) species identified by theSIMPER analysis: (1) the CharybdisAssemblage (Group A locations);(2) the Liagore Assemblage (Group B);(3) the Amygdalum watsoni–Tibia del-icatula Assemblage (Group D), repre-senting the 30 to 50, 51 to 75, and>100 m depth categories respectively.There were, however, no specificspecies determining the 76 to 100 mlocations. As for the infaunal groups,3 assemblages named after the mostcharacterizing species could be distin-
71
Fig. 11. (a) Canonical correspondence analysis (CCA) showing scatter plot for 62 infaunal samples on the northeast Indian shelf. (b) CCA showing 17 most important infaunal species (+), environmental variables, and sampling sites. Vec-tor lines represent the relationship of significant environmental variables to theordination axes; their length is proportional to their relative significance. Tem: seawater (bottom) temperature; sal: salinity; MPD: sediment mean particle
diameter. For full species names see Table 4
Mar Ecol Prog Ser 341: 59–73, 2007
guished: (1) the Ampelisca Assemblage (Group Alocations); (2) the Nephtys Assemblage (Group B); and(3) the Cossura coasta Assemblage (Group C), repre-senting the 30 to 75, 76 to 100, and >100 m depthcategories respectively.
Using the CCA routine implemented in CANOCOlinked benthos communities with environmental vari-ables (sediment texture, particle mean size, MPD,organic matter, dissolved oxygen, salinity and seawa-ter temperature). In the case of epifauna, the first axisof the CCA had an eigenvalue of 0.58, implying a largepercentage of explained variance (ter Braak 1986,Narayanaswamy et al. 2003). The noteworthy feature,however, is the high correlation (weighted correlationcoefficient >0.6) between faunal abundance andenvironmental variables on all 4 CCA axes (Table 7).Considering the epifaunal CCA ordination (Fig. 10),the distribution of some species such as the eunicidEunice indica, the amphiurid Amphioplus depressusand the cone shell Conus inscriptus was influenced bysand and sediment mean size. In contrast, the strombidTibia delicatula and the mytilid Amygdalum watsoniseemed to prefer deeper areas with finer sedimentsrich in organic content. The infaunal CCA, on theother hand, showed that polychaetes Chloeia rosea,Lumbrineris sp., Magelona sp., Mediomastus sp.,Nereis sp., and Cirrutulid sp. 1 closely associatedwith sand with a high MPD. Salinity appeared to relatewell with the distribution of the pilargid Ancistro-syllis parva and some spionids and the amphipodCorophium sp. The cossurid Cossura coasta, Prio-nospio sp. 2 and certain nemertineans negativelycorrelated with temperature, sand and MPD. In con-clusion, our findings have revealed a close concor-dance between epifaunal patterns and environmentalvariables, namely depth, sand, sediment organicmatter and mean particle size. In the case of infauna,a similar relationship with depth, sand, MPD, (bottom)water temperature and salinity was striking. MonteCarlo permutation tests confirmed the significantassociation (p < 0.05) between environmental variablesand the epifauna/infauna distribution off the northeastIndian shelf.
Acknowledgements. This work was carried out with financialassistance provided by the Department of Ocean Develop-ment (DOD/10-MLR/10/97-OD-II), Government of India. Weare grateful to R. Damodaran, Project Coordinator, School ofMarine Sciences, Cochin University of Science and Technol-ogy, and V. Ravindranathan, Director at the Centre for MarineLiving Resources & Ecology, Cochin, for encouragement. Weare very grateful to Professor J. S. Gray, University of Oslo,who made a critical appraisal of the article and offered invalu-able suggestions for its improvement. We express our specialappreciation to the Captain and crew of the FORV ‘SagarSampada’ and all those who assisted during the 2 cruisesonboard the research vessel. B. T. Sivakumar provided graph-
ics. The work, which formed part of PhD research (by T.G.),was carried out at the Marine Biological Laboratory, Depart-ment of Zoology, Andhra University. This contribution isdedicated to the late P. N. Ganapati and C.V. Kurian, whoinitiated marine benthos research in India.
LITERATURE CITED
Alongi DM (1990) The ecology of soft-bottom benthic ecosys-tems. Oceanogr Mar Biol Annu Rev 28:381–496
Alongi DM, Christoffersen P (1992) Benthic infauna andorganism-sediment relations in a shallow, tropical coastalarea: influence of outwelled mangrove detritus and physi-cal disturbance. Mar Ecol Prog Ser 81:229–245
Ansari ZA, Harkantra SN, Nair SA, Parulekar AH (1977) Ben-thos of the Bay of Bengal: a preliminary account.Mahasagar Bull Natl Inst Oceanogr 10:55–60
Barnes H (1959) Apparatus and methods of oceanography.Part I. Chemical. George Allen & Unwin, London
Bergen M, Weisberg SB, Smith RW, Cadien DB and 4 others(2001) Relationship between depth, sediment, latitude,and the structure of benthic infaunal assemblages on themainland shelf of southern California. Mar Biol 138:637–647
Buchanan JB (1957) Benthic fauna of the continental edgeoff Accra, Ghana. Nature 179:634–635
Buchanan JB (1958) The bottom fauna across the continentalshelf off Accra, Gold coast. Proc Zool Soc Lond 130:1–56
Clarke KR, Gorley RN (2001) PRIMER v5: user manual.PRIMER-E, Plymouth
Clarke KR, Warwick RM (1994) Changes in marine communi-ties: an approach to statistical analysis and interpretation.Plymouth Marine Laboratory, Natural Environmental Re-search Council, Plymouth
Damodaran R (1973) Studies on benthos of the mud banks ofthe Kerala coast. Bull Dept Mar Sci Univ Cochin 6:1–126
Da Silva Attolini F, Santo Taram A (2001) Polychaete spatialdistribution in the continental shelf of the Bacia deCampos area, Southeastern Brazil. Oceánids 16(1):17–32
Day JH (1967) A monograph on the polychaeta of SouthernAfrica, Part I (Errantia) & II (Sedentaria). Trustees of theBritish Museum (Natural History), London
Dittmann S (2002) Benthic fauna in tropical tidal flats ofHinchinbrook Channel, NE Australia: diversity, abun-dance and their spatial and temporal variation. WetlandsEcol Manag 10:323–333
Ellingsen KE, Gray JS (2002) Spatial patterns of benthicdiversity: Is there a latitudinal gradient along the Norwe-gian continental shelf? J Anim Ecol 71:373–389
Fauvel P (1953) The fauna of India including Pakistan,Ceylon, Burma and Malaya. The Indian Press, Allahabad
Ganapati PN (1973) Biological oceanography of the Bay ofBengal. Mahasagar Bull Natl Inst Oceanogr 6(2):84–94
Ganapati PN, Lakshmana Rao MV (1959) Preliminary obser-vations on the bottom fauna of the continental shelf of thenorth-east coast of India. Proc of the First All-India Con-gress of Zoology, Part 3. The Zoological Society of India,Kolkata, p 8–13
Gaudette HE, Wilson RF, Lois T, Folger DW (1974) An in-expensive titration method for determination of organiccarbon in recent sediments. J Sediment Petrol 44:249–253
Gray JS (1974) Animal–sediment relationships. OceanogrMar Biol Annu Rev 12:223–261
Harkantra SN, Nair A, Ansari ZA, Parulekar AH (1980) Ben-thos of the shelf region along the West coast of India.Indian J Mar Sci 9:106–110
72
Ganesh & Raman: Macrobenthic community in the Bay of Bengal
Harkantra SN, Rodrigues CL, Parulekar AH (1982) Macro-benthos of the shelf off northeastern Bay of Bengal. IndianJ Mar Sci 11:115–121
Holme NA, McIntyre AD (eds) (1984) Methods for the study ofmarine benthos. Blackwell Scientific Publication, Oxford
Ingole BS, Ansari ZA, Parulekar AH (1992) Benthic faunaaround Mauritius Island, southwest Indian Ocean. IndianJ Mar Sci 21:268–273
Krumbein WC, Pettijohn FJ (1938) Manual of sedimentarypetrography. Appleton Century Crofts, New York
Kurian CV (1953) A preliminary survey of the bottom faunaand bottom deposits of the Travancore coast within the15-fathom line. Proc Natl Inst Sci India 19:746–775
Kurian CV (1971) Distribution of benthos on the southwestcoast of India. In: Costlow JD Jr (ed) Fertility of the sea,Vol 1. Gordon and Breach Scientific Publications, NewYork, p 225–239
LaFond EC (1957) Oceanographic studies in the Bay of Ben-gal. Proc Indian Acad Sci 46B:1–47
LaFond EC (1966) Bay of Bengal. In: Fairbridge RW (ed) Theencyclopedia of oceanography. Encyclopedia of earth sci-ence series, Vol. 1. Reinhold Publishing Corporation, NewYork, p 110–118
Madhupratap M, Mangesh G, Ramaiaha N, Prasanna KumarS, Muraleedharan PM, de Sousa SN, Sardessai S, UshaMuraleedharan (2003) Biogeochemistry of the Bay of Ben-gal: physical, chemical and primary productivity charac-teristics of the central and western Bay of Bengal duringsummer monsoon 2001. Deep-Sea Res II 50:881–896
Narayanaswamy BE, Nickell, TD, Gage, JD (2003) Appropri-ate levels of taxonomic discrimination in deep-sea sedi-ments: species vs. family. Mar Ecol Prog Ser 257:59–68
Parulekar AH, Wagh AB (1975) Quantitative studies on ben-thic macrofauna of the Northeastern Arabian Sea shelf.Indian J Mar Sci 4:174–176
Parulekar AH, Harkantra SN, Ansari, ZA (1982) Benthic pro-duction and assessment of demersal fishery resources ofthe Indian Seas. Indian J Mar Sci 11:107
Prasad GL, Subramanian V, Ittekkot V (1997) Biogeochem-istry of particulate organic matter transported by GodavariRiver, India. Biogeochemistry 38:103–128
Probert PK, Read GB, Grove SL, Rowden AA (2001) Macro-benthic polychaete assemblages of the continental shelfand upper slope off the west coast of the South Island,New Zealand. N Z J Mar Freshw Res 35:971–984
Radhakrishna Y, Ganapati PN (1969) Fauna of the KakinadaBay. Bull Natl Inst Sci India 38:49–79
Raman AV, Adiseshasai K (1989) Macrobenthos from littoral
areas off Visakhapatnam, east coast of India. Indian JMar Sci 18:265–269
Raut D, Ganesh T, Murty NVVS, Raman AV (2005) Macro-benthos of Kakinada Bay in the Godavari delta, east coastof India: comparing decadal changes. Estuar Coast ShelfSci 62:609–620
Rhoads DC (1974) Organisms–sediment relation on the mud-dy sea floor. Oceanogr Mar Biol Annu Rev 12:263–300
Rosenberg R, Arntz WE, Chuman de Flores LA, Carbajal G,Finger I, Tarazona J (1983) Benthos biomass and oxygendeficiency in the upwelling system off Peru. J Mar Res 41:263–279
Sanders HL (1958) Benthic studies in Buzzards Bay. I. Animal–sediment relations. Limnol Oceanogr 3:245–258
Sanders HL (1968) Marine benthic diversity: a comparativestudy. Am Nat 102:243–282
Seshappa G (1953) Observations on the physical and biologi-cal features of the sea bottom along the Malabar coast.Proc Natl Inst Sci India 19:257–279
Sheppard FP (1954) Nomenclature based on sand-silt-clayratios. J Sediment Petrol 24:151–158
Snelgrove PVR, Butman CA (1994) Animal–sediment rela-tionships revisited: cause versus effect. Oceanogr Mar BiolAnnu Rev 32:111–117
Subba Rao M (1964) Some aspects of continental shelf sedi-ments off the east coast of India. Mar Geol 1:59–87
Subba Rao NV, Surya Rao KV, Maitra S (1991) Marinemolluscs. State Fauna Series 1, Part 3. Fauna of Orissa.Zoological Survey of India, Kolkata, p 1–175
ter Braak CJF (1986) Canonical corespondense analysis:a new eigenvector technique for multivariate directgradient analysis. Ecology 67:1167–1179
ter Braak CJF, Smilauer P (2002) CANOCO reference manualand user’s guide to Canoco for Windows: software forcanonical community ordination (version 4.53). Micro-computer power, Ithaca, NY
Varkey MJ, Murty VSN, Suryanarayaya A (1996) Physicaloceanography of the Bay of Bengal and Andaman Sea.Oceanogr Mar Biol Annu Rev 34:1–70
Wade BA (1972) A description of a highly diverse soft-bottomcommunity in Kingston Harbour, Jamaica. Mar Biol 13:57–69
Warwick RM, Ruswahyuni (1987) Comparative study of thestructure of some tropical and temperate marine soft-bottom macrobenthic communities. Mar Biol 95:641–649
Wijsman JWM, Herman PMJ, Marian-Traian G (1999) Spatialdistribution in sediment characteristics and benthicactivity on the northwestern Black Sea shelf. Mar EcolProg Ser 181:25–39
73
Editorial responsibility: John Gray (Contributing Editor),Oslo, Norway
Submitted: July 11, 2006; Accepted: December 11, 2006Proofs received from author(s): June 11, 2007