Macro-economic factors in credit risk calculations ... · Examples of external TVCs are the...
35
Macro-economic factors in credit risk calculations: including time-varying covariates in mixture cure models Dirick L, Bellotti T, Claeskens G, Baesens B. KBI_1630
Transcript of Macro-economic factors in credit risk calculations ... · Examples of external TVCs are the...

Macro-economic factors in credit risk calculations: including time-varying covariates in mixture cure models Dirick L, Bellotti T, Claeskens G, Baesens B.
KBI_1630

Macro-economic factors in credit riskcalculations: including time-varying
covariates in mixture cure models
Lore Dirick1,2, Tony Bellotti3, Gerda Claeskens1,2, Bart Baesens2,4,5
1 ORSTAT, Faculty of Economics and Business, KU Leuven, Belgium2 Leuven Statistics Research Center (LSTAT), KU Leuven, Belgium
3 Department of Mathematics, Imperial College, London4 LIRIS, Faculty of Economics and Business, KU Leuven, Belgium
5 School of Management, University of Southampton, [email protected]; [email protected];
[email protected]; [email protected]
November 4, 2016
Abstract
The prediction of the time of default in a credit risk setting via survival analysisneeds to take a high censoring rate into account. This rate is due to the fact thatdefault does not occur for the majority of debtors. Mixture cure models allow thepart of the loan population that is unsusceptible to default to be modelled, distinctfrom time of default for the susceptible population. In this paper, we extend themixture cure model to include time-varying covariates. We illustrate the method viasimulations and by incorporating macro-economic factors as predictors for an actualbank data set.
Keywords: Credit risk modeling; mixture cure model; time-varying covariates; macro-economic factors; survival analysis.
1

1 Introduction
With recent compliance guidelines such as the Basel accords, increased attention is devoted
to more accurate calculations of the minimum amount of capital banks need to hold to
provide a buffer against unexpected losses (Van Gestel and Baesens, 2008). Typically the
probability of default (PD) of a certain loan applicant is estimated using classification
techniques such as logistic regression. However, alternative methods have gained more
importance in the recent credit scoring literature. In particular, survival analysis is an
interesting tool as this method enables modeling of time until default, and not just whether
a certain customer will default and the can be estimated over any time horizon.
Originally mainly used in medical science (see Collett, 2003; Cox and Oakes, 1984),
survival analysis was first introduced in the credit scoring context by Narain (1992). While
initially using fully parametric accelerated failure time survival models, other authors ex-
tended the idea of Narain (1992), using a Cox proportional hazards (PH) model (see Banasik
et al., 1999), extensions on Cox PH models (Stepanova and Thomas, 2002) and including
macro-economic variables (MVs) through time-varying covariates (TVCs) in Cox PH mod-
els (see Bellotti and Crook, 2009). Crook and Bellotti (2010) review several models for
consumer loan credit risk modeling. Divino and Rocha (2013) compare survival analysis
to the use of logistic regression models. In these papers, it is shown that survival analysis
is a competitive method to logistic regression, and extending the Cox PH model further
improves the accuracy of the estimated PD.
The survival function is S(t) = P (T > t), which is the probability of observing an
event time T larger than some given t. A basic property of the survival function is that
S(t) = 1 − F (t), where F (t) is the cumulative distribution function. Because of this
relationship, S(t) is assumed to go to zero as time proceeds, which means that all subjects
under observation are expected to experience the event of interest eventually. As opposed
to medical science where the event of interest is usually death, this property does not seem
valid in the credit risk context, as a substantial part of the population will never experience
default. In fact, it can be argued that unsusceptibility to default is the main reason behind
the high censoring rate. The proportion of observations where default is not observed might
in practice even exceed 95%. Figure 1 clearly demonstrates this phenomenon for the credit
2

0 10 20 30
0.0
0.2
0.4
0.6
0.8
1.0
Time
Sur
viva
l
Figure 1: A sample of 20 estimated Kaplan-Meier estimates of the survival probability
for the credit loan data as used in Section 6. The bounds indicate the region of all such
estimated curves for this data example.
loan data set used in this paper (see Section 6). In this figure the continuous variables
have been discretized by using their median, resulting in 128 estimated survival curves
using the Kaplan-Meier estimator. To improve visibility, a random sample of 20 curves is
shown in Figure 1, together with the bounds that the region of all 128 curves span. Clearly,
the assumption that the survival function goes to zero does not hold. This implies that
standard survival analysis methods and models do not apply well to this data set.
A remedy for this, the “mixture cure model”, was initially proposed by Berkson and
Gage (1952) and Farewell (1982) to model long-term survivors in the medical context.
This model contains a logistic regression component, modeling “unsusceptibility” to the
event of interest, and a survival component, modeling the survival times of an individual
conditioning on susceptibility. While using parametric survival distributions in the survival
component initially, Kuk and Chen (1992) extended the mixture cure model using non-
parametric survival distributions (see also Peng and Dear, 2000; Sy and Taylor, 2000).
Cai et al. (2012b) introduced the smcure-package in R (R Core Team, 2013) to estimate
semi-parametric mixture cure models. This latter version of the mixture cure model was
introduced in the credit risk context by Tong et al. (2012). Dirick et al. (2015) developed
a model selection criterion for these models, and applied this to credit risk data.
While the use of TVCs has been investigated in (non-mixture) survival models, both in
medical research (see among others Andersen, 1992) and in the credit context (see Bellotti
3

and Crook, 2009), to our knowledge TVCs have not been implemented before in mixture
cure models. In the present paper, we examine TVCs in these models, more specifically
macro-economic factors, along with the usual time-independent covariates. The inclusion
of TVC allows us to get a better understanding of why customers default. These insights
can then be successfully adopted for ongoing credit risk monitoring (also called behavioural
scoring in the industry) which help to determine provisions and capital buffers for both
expected as well as unexpected losses.
The remainder of this paper is organized as follows. In Section 2, we give a short
overview of different types of TVCs. In Sections 3 and 4, we discuss the mixture cure
model with TVCs and the likelihood function, while computational details are placed in
Appendix A. The simulation setup and results are discussed in Section 5, and a credit risk
data example is presented in Section 6. Section 7 concludes.
2 Time-varying covariates
2.1 Internal versus external TVCs
TVCs can be segmented into two classes: internal and external TVCs; see, among others,
Kalbfleisch and Prentice (2002, Chapter 6), Hosmer et al. (2008, Chapter 7) and Cortese
and Andersen (2010). An internal TVC is one whose value is typically subject-specific and
requires the subject to be under direct observation. An example of an internal TVC in the
credit risk context is a customer’s current account balance, or a patient’s cholesterol level
in the medical context. From the biomedical point of view, an internal covariate generally
requires the survival of the individual for its existence. In this sense, the internal TVC-path
carries direct information on the timing of the event if this event is death.
An external TVC does not require subjects to be under direct observation, nor does its
existence depend on the occurrence of the event of interest. Examples of external TVCs are
the inflation rate (in the credit risk context) and air pollution (in the biomedical context).
In general, these TVCs are usually environmental factors that apply to all subjects under
observation; however, subject-specific properties such as age are considered to be external
as, given a subject’s birth date, age can be determined at any time. A time-fixed covariate
4

can be seen as a special case of an external time-dependent covariate, where its value is
measured in advance and fixed for the entire study (e.g. the applicant’s bureau score).
Formally, in a non-mixture survival context, denote xi(t) = (xi1(t), . . . , xil(t)) as the
covariate vector at time t for individuals i = 1, . . . , n. Additionally, denote the covariate
history up to time t: Xi(t) = {xi(u); 0 ≤ u < t}. The available information for each
observation i is given by the time Ti = min(Ui, Ci), where Ui denotes the true event time
and Ci is the censoring time, a corresponding censoring indicator δi = I(Ui ≤ Ci) and
Xi(ti), the covariate history until ti.
A TVC is external when for all v, t, such that 0 < v ≤ t it satisfies the condition
(Kalbfleisch and Prentice, 2002, Chapter 6)
P (T ∈ [v, v + dv) | X(v), T ≥ v) = P (T ∈ [v, v + dv) | X(t), T ≥ v) . (1)
The rationale behind this condition is that although a time-dependent covariate may in-
fluence the event rate over time, its future path until any time t is not affected by the
occurrence of the event of interest at time v, or rather, in the interval [v, v + dv) where dv
is a very small increment in time. The difference between internal and external covariates
has great implications on survival function estimation. In presence of external covariates,
the standard relationship between the survival function and the hazard function,
S(t | X(t)) = P (T > t | X(t)) = exp(−
∫ t
0
λ{v | X(v)}dv)
(2)
holds, where λ{v | X(v)} is the hazard function using the historyX(v). All TVCs described
in this paper are macro-economic external variables, hence (2) can be used.
However, bear in mind that in case of internal covariates, extra attention should be
given to the estimation of the survival function, see Andersen (1992) for a probabilistic
model for survival function estimation in presence of internal TVCs. Because of the nature
of internal TVCs and non-compliance to (1), however, estimation of instantaneous hazards
is possible, but cumulative hazards and survival probabilities are no longer feasible through
(2). To see this, we reconsider the example of the internal covariate cholesterol level in a
study where the event of interest is death. From (2), any measurable cholesterol level
value would indicate that the subject under investigation is still alive, hence, S (t | X(t)) =
P (T > t | X(t)) = 1 given that X(t) is measurable. For more information on this issue,
we refer to Kalbfleisch and Prentice (2002, Chapter 6) and Fisher and Lin (1999).
5

2.2 Macro-economic factors
Being a function of a (continuous) time t, TVCs can theoretically change continuously.
This is approximately the case for some macro-economic variables (e.g. stock prices), others
tend to be documented over longer periods of times such as unemployment rates (weekly,
monthly or yearly). To manage TVCs in survival models, the observation period of each
subject is split in several time-periods, which are defined by adjacent event times (Fox,
2002). Let xip(t) (where p ∈ {1, . . . , l}) be one specific time-dependent covariate, and let
B1 < . . . < Bm be all the unique event or censoring times observed in the data set. To
manage the data, subject i must have exactly one TVC value for each of the intervals
{(0, B1], (B1, B2], . . . , (Bki−1, Bki]}, where ki ∈ {1, . . . , m} and Bki = ti, hence each subject
has its own set of TVC values until its own censoring or event time ti.
Applied to default events in loans, these intervals represent the respective number of
months a subject has been repaying until default or censoring. As a result, the TVCs
are the monthly averages of specific macro-economic factors. This is denoted by replacing
xip(t) by xip(t) =(xip((0, B1]) , xip ((B1, B2]) , . . . , xip ((Bki−1, Bki])
), where xip ((Bj−1, Bj ])
is the average value of TVC p for subject i over the time interval (Bj−1, Bj].
3 A mixture cure model with TVCs
In a mixture cure model, cases are categorized into two groups: a group that will experience
the event, and a group of so-called ‘unsusceptible’ cases that will not experience the event of
interest. These groups are modeled using a mixture distribution where a logistic regression
model provides a mixing proportion of the unsusceptible cases and where a survival model
describes the cases susceptible to the event of interest (Tong et al., 2012). In the credit
risk context, where the event of interest is loan default, every event-type that is not default
(e.g. loan maturity, early repayment) is considered as censored. By consequence, there is
heavy right-censoring and a large group of unsusceptible cases is expected to be present.
For each subject i, the censoring indicator δi denotes whether subject i experiences the
event of interest during the observation period (δi = 1), or not (δi = 0). This censoring
indicator provides partial information on susceptibility; however, when an observation is
6

censored, it is unclear whether the event will still occur after the observation period has
terminated. Introducing a susceptibility indicator Yi, where Yi = 1 when an observation
is susceptible and Yi = 0 if not, three different combinations of Yi and δi are possible: (1)
Yi = 1 and δi = 1: uncensored and susceptible, the event takes place during the observation
period; (2) Yi = 1 and δi = 0: censored and susceptible, the event will take place, however is
not observed; (3) Yi = 0 and δi = 0: censored and unsusceptible, the event is not observed
and will never take place. For each observation i, Ti and δi are fully observed, Yi is only
observed and equal to 1 when δi = 1.
3.1 The model
In a model with both time-dependent covariates x(t) and time-fixed covariates z, the
unconditional survival function of the mixture cure model is given by
S(t | z,x(t)) = π(z)S(t | Y = 1, z,x(t)) + 1− π(z). (3)
The ‘incidence model’, π(z) = P (Y = 1 | z), is the proportion of susceptible accounts
given covariate vector z = (z1, . . . , zs)′, modeled using a binary logit, with b = (b1, . . . , bs)
′
π(z) = exp(b′z)/{1 + exp(b′z)}. (4)
Note that, in this part of the mixture cure model, only time-fixed covariates are incorpo-
rated. The conditional survival function is modeled using a semi-parametric proportional
hazard regression model such that, with β = (β1, . . . , βs)′,
S(t | Y = 1, z,x(t)) = exp
(− exp(β′z + β′
Tx(t))
∫ t
0
h0(u | Y = 1)du
), (5)
with h0 the unspecified baseline hazard function, x(t) = (x1(t), . . . , xl(t)) a l-vector of
time-dependent covariates and z = (z1, . . . , zs) a time-fixed covariate vector identical to
the one in the incidence model. Note that from a theoretical point of view, the incidence
and latency time-fixed covariate vectors may contain different variables; however in this
paper, focusing on time-dependent covariates, these covariates are kept equal in all practical
examples. For mixture cure models with different time-fixed covariate elements in latency
and incidence models, we refer to Dirick et al. (2015).
7

3.2 The likelihood function
To construct the likelihood function, specific attention should be devoted to the TVCs.
Data management is the biggest challenge. We require that each time period (bounded
by B1 < . . . < Bm, see section 2.2) for a specific individual appears in a separate row in
the data set (Fox, 2002). Denote λi,j the interval-specific censoring indicator for interval
j ∈ {1, . . . , ki} of observation i. The complete likelihood, given full information on Y , is
Lc(b,β,βT ) =
n∏
i=1
(1− π(zi)
)(1−Yi)π(zi)Yi
ki∏
j=1
h(tj |Yi=1, zi,xi(tj))λi,jYiS(tj |Yi=1, zi,xi(tj))
Yi
where h(tj | ·) and S(tj | ·) are, respectively, the hazard and survival contributions at the
time point given by the upper bound Bj of the corresponding interval, and xi(tj) is the
value of the TVC of observation i in the interval (Bj−1, Bj]. The log likelihood function
can be written as the sum of the latency and incidence log likelihoods,
logLc(b,β,βT | z,x(t), Y ) = logLinc(b | z, Y ) + logLlat(β,βT | z,x(t), Y ), (6)
where
logLinc(b | z, Y ) =
n∑
i=1
(1− Yi)(1− π(zi)
)+ Yi π(zi) (7)
logLlat(β,βT | z,x(t), Y ) =n∑
i=1
ki∑
j=1
Yiλi,j log h(tj | Yi = 1, zi,xi(tj))
+Yi log S(tj | Yi = 1, zi,xi(tj)). (8)
As noted at the start of Section 3, Yi is missing for the censored cases. As we do not have
an exact expression for logLc(b,β,βT | z,x(t), Y ), the expectation maximization (EM)
algorithm is used. This is an iterative procedure to find the maximum likelihood estimates
using data that are incomplete (Dempster et al., 1977). We provide the needed adjustments
to the algorithm to incorporate TVCs in mixture cure models, see the Appendix.
8

δi ti z1 z2
obs 1 1 1 -1 2
obs 2 0 2 0.3 3
obs 3 1 3 0.4 2.3
Bj−1 Bj λi,j δi ti z1 z2 x1(t) x2(t)
obs 1 0 1 1 1 1 -1 2 0.3 -0.7
obs 2 0 1 0 0 2 0.3 3 0.2 0.4
obs 2 1 2 0 0 2 0.3 3 0.7 -0.1
obs 3 0 1 0 1 3 0.4 2.3 0.5 -1
obs 3 1 2 0 1 3 0.4 2.3 0.2 -0.3
obs 3 2 3 1 1 3 0.4 2.3 0.4 0.2
Table 1: Example of the incidence versus latency model data structure. At the left: data
structure for the binomial logit part of the mixture cure model, where no TVCs are present.
At the right: the long data structure incorporating TVCs in the survival part of the model.
4 Computational scheme
4.1 Data structure
Including TVCs in the survival part of the mixture cure model requires rearrangement of
the data. To make TVCs computationally feasible in a Cox PH model, each time period
(Bj−1, Bj] with j = 1, . . . , ki for each individual i is represented as a single row in the
data set (Fox, 2002). Note that the number of rows for each observation depends on the
observation itself as Bki = ti. The advantage of this data structure is that one can use the
coxph-function in package survival in R (Therneau, 2014), using preamble “Surv(start,
stop, default)” instead of the more familiar “Surv(time, default)”.
The mixing proportions of the mixture cure model modeled by the binomial logit do
not include TVCs, and using several lines per observation in this model part would lead to
wrong estimates of b. As a result, for the mixture cure model with TVCs, different data
set structures are used depending on whether the respective calculations are performed on
the latency or the incidence part of the model. An example of the ‘short’ (incidence) data
structure versus the ‘long’ (latency) data structure is given in Table 1. To transform the
short form of survival data into the long structure, Fox and Carvalho (2012) introduced
the “unfold” function in the R-package RcmdrPlugin.survival.
9

4.2 Procedure
The procedure consists of three main steps: initialization, the E-step and the M-step.
4.2.1 Initialization
1) Initialize w: Initialize w(0)i by taking w
(0)i = δi. Each observation has one w
(0)i .
2) Initialize b: Fit a binomial logit model to w(0)i using the ‘short’ data set and covariate
vector z, in order to retrieve an initial estimate b(0).
3) Initialize β and βT : Obtain β(0)
and β(0)
T using the coxph-function for the long
survival data including TVCs. Use wi’s as weights in the model, matching wi with
each line that corresponds with observation i.
4) Initialize S0(t): Compute S(0)0 (t) using formula (14).
4.2.2 Expectation step
1) Compute π(1)i (zi) for each i, using Formula (4), and b
(0).
2) Compute w(1)i for each i, using Formula (13), and β(0). Note that the survival esti-
mates used here, S(0)(ti | Yi = 1, zi,xi(ti)) = S(0)0 (ti)
exp(β′(0)zi+β
′(0)t xi(ti)), correspond
for each observation to the estimate at the time of the last observation, hence the
linear predictor consists of the TVC-values at time ti.
4.2.3 Maximization step
1) Update b: Obtain a new estimate b(1)
using the w(1)i of the E-step when fitting the
binomial logit model.
2) Update β and βT : Obtain β(1)
T and β(1)
including the w(1)i s as weights.
3) Update S: Obtain a new estimate S(0)(t) using formula (14).
The E and M-step are repeated with all updated estimates, until parameter convergence.
The algorithm stops when the sum of the squared differences between (β(r+1)
T , β(r+1)
T , b(r+1)
)
and (β(r)
T , β(r)
T , b(r)) is smaller than a pre-specified value.
10
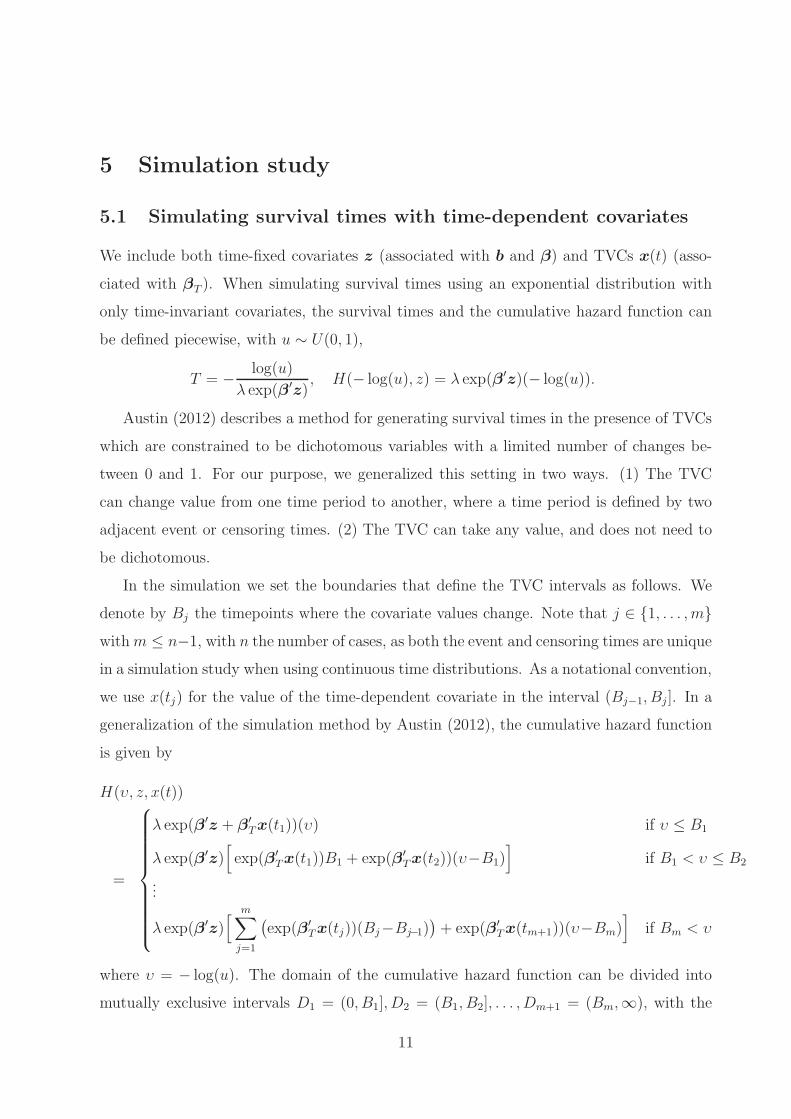
5 Simulation study
5.1 Simulating survival times with time-dependent covariates
We include both time-fixed covariates z (associated with b and β) and TVCs x(t) (asso-
ciated with βT ). When simulating survival times using an exponential distribution with
only time-invariant covariates, the survival times and the cumulative hazard function can
be defined piecewise, with u ∼ U(0, 1),
T = −log(u)
λ exp(β′z), H(− log(u), z) = λ exp(β′z)(− log(u)).
Austin (2012) describes a method for generating survival times in the presence of TVCs
which are constrained to be dichotomous variables with a limited number of changes be-
tween 0 and 1. For our purpose, we generalized this setting in two ways. (1) The TVC
can change value from one time period to another, where a time period is defined by two
adjacent event or censoring times. (2) The TVC can take any value, and does not need to
be dichotomous.
In the simulation we set the boundaries that define the TVC intervals as follows. We
denote by Bj the timepoints where the covariate values change. Note that j ∈ {1, . . . , m}
withm ≤ n−1, with n the number of cases, as both the event and censoring times are unique
in a simulation study when using continuous time distributions. As a notational convention,
we use x(tj) for the value of the time-dependent covariate in the interval (Bj−1, Bj ]. In a
generalization of the simulation method by Austin (2012), the cumulative hazard function
is given by
H(υ, z, x(t))
=
λ exp(β′z + β′Tx(t1))(υ) if υ ≤ B1
λ exp(β′z)[exp(β′
Tx(t1))B1 + exp(β′Tx(t2))(υ−B1)
]if B1 < υ ≤ B2
...
λ exp(β′z)[ m∑
j=1
(exp(β′
Tx(tj))(Bj−Bj−1))+ exp(β′
Tx(tm+1))(υ−Bm)]
if Bm < υ
where υ = − log(u). The domain of the cumulative hazard function can be divided into
mutually exclusive intervals D1 = (0, B1], D2 = (B1, B2], . . . , Dm+1 = (Bm,∞), with the
11

corresponding ranges of the cumulative hazard functions,
R1 =(0, λ exp(β′z + β′
Tx(t1))B1
];
R2 =(λ exp(β′z + β′
Tx(t1))B1, λ exp(β′z){exp(β′
Tx(t1))B1 + exp(β′Tx(t2))(B2−B1)}
];
...
Rm+1 =(λ exp(β′z)
m∑
j=1
(exp(β′
Tx(tj))(Bj−Bj−1)),∞).
By inverting each of the piecewise components of the cumulative hazard function we can
simulate the survival time as H−1(υ, z, x) with
H−1(υ, z, x(t))
=
υ
λ exp(β′z + β′Tx(t1))
if υ ∈ R1
υ − λ exp(β′z + β′Tx(t1))B1 + λ exp(β′z + β′
Tx(t2))B1
λ exp(β′z + β′Tx(t2))
if υ ∈ R2
...
υ + λ exp(β′z){∑m
j=1 (− exp(β′Tx(tj))(Bj−Bj−1)) + exp(β′
Tx(tm+1))(Bm)}
λ exp(β′z + β′Tx(tm+1))
if υ ∈ Rm+1.
5.2 Simulation setup and results
5.2.1 Uncorrelated time-varying covariates
The probability of being unsusceptible is generated using a logistic model where π(z) =
exp(b′z)/{1 + exp(b′z)}, and the survival times of the susceptible cases are generated
using an exponential distribution with λ = 0.7. We generate two uncorrelated time-fixed
covariates z1 ∼ N(1.5, 0.6) and z2 ∼ bin(1, 0.5), and two time-dependent covariates x1(t) ∼
N(2, 0.5) and x2(t) ∼ N(0.8, 0.5).
Different simulation settings are implemented in order to explore different aspects of
model behaviour. In settings I, II and III, β = (−1.2, 1)′ and βT = (1,−0.7)′, while in set-
tings IV, V and VI, β = (1,−3)′ and βT = (−0.5, 0.9)′. Susceptibility is managed through
the vector b, which is (2, 0.5, -2.3) for settings I and IV (low censoring/susceptibility),
(-0.5, 0.8, -1.5) for settings II and V (medium censoring/susceptibility) and (-1.5, 0.5, -2)
for settings III and VI (high censoring/susceptibility). Censoring times are generated from
an exponential distribution using λ = 0.1 for low and medium settings, and λ = 0.2 for the
12

high censoring settings. For each of the six settings, we take n=300, n=500 and n=1000
and use 100 replications for each sample size. Note that the TVC can theoretically change
value n − 1 times. To imitate real-data situations, we constrained the TVCs to change
values at most 60 times, as the data sets we typically use have a loan term of 60 months
(i.e. five years) or less.
In Table 2 and 4, the true generating parameter values are shown, as well as the mean of
the parameter estimates, the standard errors over the 100 simulation runs for each sample
size and the absolute biases and the mean squared errors between the parameter estimates
and the true values.
From Tables 2 and 4, we see that higher censorship leads to higher MSE, while a
larger n tends to lower the MSE. A small n in combination with high censorship led to
a degeneration of some of the β2 estimates for Setting IV. This issue does not translate
to the bias, despite the fact that the same effect of sample size and censorship seems to
apply. Even under large censorship, the parameter estimates related to the TVCs (βT1 and
βT2) are more stable according to the simulations. The abundant information in the TVCs
(for each case in our simulation 40 to 60 different values for one TVC) enables an accurate
parameter estimation.
Table 3 shows the results of a comparison with the standard Cox proportional hazard
regression model. The results are for settings I–III, for sample size n = 1000 and should
be compared to the corresponding cases in Table 4. Other settings give a similar inferior
performance as compared to the mixture cure models, although those results are not shown.
In particular the time independent variables are estimated with a bias.
5.2.2 Correlated time-varying covariates
In real life, macro-economic factors are all linked and influence each other. To mimic this
behaviour, setting VII takes TVCs that are highly correlated. Time-fixed covariates have
the same distributions as for the previous settings, n = 1000 and the generating parameters
are as in setting I. However, this time we included three TVCs that are highly correlated,
13

n = 300 n = 500 n = 1000
true avg est avg sd bias MSE avg est avg sd bias MSE avg est avg sd bias MSE
SettingI
b0 2.00 2.151 0.474 0.151 0.384 2.151 0.368 0.151 0.249 2.076 0.254 0.076 0.094
b1 0.5 0.481 0.269 0.019 0.105 0.532 0.213 0.032 0.077 0.540 0.153 0.040 0.027
b2 -2.3 -2.349 0.290 0.049 0.219 -2.439 0.225 0.139 0.235 -2.368 0.148 0.068 0.079
β1 -1.2 -1.137 0.125 0.063 0.032 -1.152 0.101 0.048 0.018 -1.150 0.070 0.050 0.009
β2 1.0 0.898 0.132 0.102 0.043 0.876 0.108 0.124 0.033 0.894 0.077 0.106 0.022
βT1 1.0 0.983 0.132 0.017 0.016 0.990 0.102 0.010 0.010 0.988 0.072 0.012 0.005
βT2 -0.7 -0.687 0.132 0.013 0.023 -0.692 0.101 0.008 0.014 -0.691 0.071 0.009 0.006
SettingII
b0 -0.50 -0.372 0.332 0.128 0.203 -0.453 0.255 0.047 0.120 -0.421 0.183 0.079 0.088
b1 0.8 0.796 0.165 0.004 0.086 0.889 0.120 0.089 0.063 0.896 0.109 0.096 0.050
b2 -1.5 -1.571 0.231 0.071 0.093 -1.612 0.181 0.112 0.094 -1.655 0.123 0.155 0.081
β1 -1.2 -1.072 0.160 0.128 0.064 -1.088 0.132 0.112 0.040 -1.029 0.084 0.171 0.042
β2 1.0 0.911 0.185 0.089 0.094 0.896 0.142 0.104 0.045 0.838 0.097 0.162 0.049
βT1 1.0 0.991 0.170 0.009 0.029 0.976 0.130 0.024 0.019 1.006 0.091 0.006 0.006
βT2 -0.7 -0.680 0.168 0.020 0.045 -0.673 0.129 0.027 0.024 -0.715 0.090 0.015 0.009
SettingIII
b0 -1.50 -1.316 0.396 0.184 0.421 -1.391 0.315 0.109 0.247 -1.379 0.213 0.121 0.126
b1 0.5 0.449 0.227 0.051 0.147 0.494 0.145 0.006 0.114 0.521 0.093 0.021 0.061
b2 -2.0 -2.020 0.338 0.020 0.226 -2.048 0.265 0.048 0.163 -2.091 0.187 0.091 0.072
β1 -1.2 -1.000 0.293 0.200 0.241 -1.080 0.233 0.120 0.134 -1.064 0.148 0.136 0.069
β2 1.0 0.921 0.387 0.079 0.284 0.848 0.320 0.152 0.250 0.866 0.204 0.134 0.096
βT1 1.0 0.974 0.311 0.026 0.102 0.978 0.230 0.022 0.064 0.943 0.159 0.057 0.025
βT2 -0.7 -0.697 0.306 0.003 0.100 -0.693 0.231 0.007 0.076 -0.686 0.159 0.014 0.027
Table 2: Simulation study. True values, averaged estimates, standard deviation, bias
and mean squared error for different settings and sample sizes. Setting I: unsusceptible=
22.63%, censoring= 32.89%; Setting II: unsusceptible= 50.9%, censoring= 58.26%; Setting
III: unsusceptible= 80.70%, censoring= 86.08%.
x(t) = (x1(t), x2(t), x3(t))′ with mean, covariance matrix and correlation matrix
µ =
2
0.8
−0.7
; Σ =
0.7 0.8 0.8
0.8 1.2 0.8
0.8 0.8 1.0
; ρ =
1 0.873 0.956
0.873 1 0.730
0.956 0.730 1
.
In setting VII, censoring times are generated using an exponential distribution with λ =
0.15. Although mean standard errors of the TVCs are larger as compared to the time-fixed
covariates and the results in Tables 2 and 4 (the right panel for Setting I in particular),
14

Setting I true value avg est avg std Bias MSE
β1 -1.2 -0.3315 0.0645 0.8685 0.7579
β2 1.0 -0.4704 0.0801 1.4704 2.1687
βT1 1.0 0.9216 0.0777 0.0784 0.0118
βT2 -0.7 -0.6530 0.0777 0.0470 0.0082
Setting II true value avg est avg std Bias MSE
β1 -1.2 0.1224 0.0808 1.3224 1.7546
β2 1.0 -0.7599 0.1038 1.7599 3.1088
βT1 1.0 0.9022 0.0985 0.0978 0.0199
βT2 -0.7 -0.6492 0.0986 0.0508 0.0130
Setting III true value avg value avg std Bias MSE
β1 -1.2 0.0274 0.1419 1.2274 1.5267
β2 1.0 -1.5891 0.2205 2.5891 6.7396
βT1 1.0 0.9003 0.1708 0.0997 0.0322
βT2 -0.7 -0.6490 0.1710 0.0510 0.0266
Table 3: Simulation study with n = 1000 and using the Cox proportional hazard regression
model. True values, averaged estimates, standard deviation, bias and mean squared error
for different settings.
Table 5 show that biases and mean squared errors are not notably larger for b and βT .
Estimators of β1 and β2 seem to have a higher bias. This result is due to the larger gap
between the percentage of censored and unsusceptible cases (39.01 − 22.72% = 16.29%).
Throughout our simulations, it has become clear that the estimates of β deteriorate when
this gap becomes bigger than 10%. The βT estimates, however, do not seem to be affected.
6 Data set with macro-economic variables
The data used was provided by a major Belgian financial institution. The sample, consisting
of 20 000 personal loans with a fixed loan term of 36 months, spanned a period of loans that
were initiated between January 2004 and May 2014. Among these 20 000 loans, 839 ended in
15

n = 300 n = 500 n = 1000
true avg est avg sd bias MSE avg est avg sd bias MSE avg est avg sd bias MSE
SettingIV
b0 2.00 2.232 0.489 0.232 0.617 2.120 0.355 0.120 0.328 2.121 0.244 0.121 0.146
b1 0.50 0.499 0.229 0.001 0.199 0.527 0.174 0.027 0.112 0.475 0.120 0.025 0.056
b2 -2.30 -2.429 0.423 0.129 0.372 -2.367 0.324 0.067 0.193 -2.195 0.217 0.105 0.122
β1 1.00 1.012 0.131 0.012 0.024 0.978 0.098 0.022 0.017 0.990 0.068 0.010 0.006
β2 -3.00 -2.983 0.255 0.017 0.126 -2.960 0.172 0.040 0.052 -3.016 0.118 0.016 0.023
βT1 -0.50 -0.441 0.135 0.059 0.030 -0.388 0.103 0.112 0.021 -0.406 0.072 0.094 0.014
βT2 0.90 0.907 0.137 0.007 0.027 0.895 0.105 0.005 0.013 0.895 0.073 0.005 0.006
SettingV
b0 -0.50 -0.464 0.305 0.036 0.216 -0.419 0.233 0.081 0.134 -0.470 0.166 0.030 0.066
b1 0.80 0.809 0.186 0.009 0.089 0.799 0.141 0.001 0.047 0.797 0.098 0.003 0.023
b2 -1.50 -1.455 0.249 0.045 0.123 -1.496 0.187 0.004 0.097 -1.415 0.132 0.085 0.049
β1 1.00 1.007 0.164 0.007 0.035 0.970 0.124 0.030 0.026 0.983 0.087 0.017 0.012
β2 -3.00 -2.910 0.319 0.090 0.135 -2.925 0.227 0.075 0.115 -2.985 0.141 0.015 0.045
βT1 -0.50 -0.424 0.167 0.076 0.042 -0.406 0.128 0.094 0.024 -0.395 0.090 0.105 0.022
βT2 0.90 0.852 0.169 0.048 0.040 0.886 0.130 0.014 0.019 0.882 0.091 0.018 0.010
SettingVI
b0 -1.50 -1.351 0.380 0.149 0.324 -1.465 0.292 0.035 0.214 -1.415 0.202 0.085 0.118
b1 0.50 0.459 0.226 0.041 0.104 0.496 0.176 0.004 0.064 0.480 0.121 0.020 0.035
b2 -2.00 -2.226 0.396 0.226 0.567 -2.315 0.313 0.315 0.372 -2.190 0.207 0.190 0.176
β1 1.00 1.094 0.261 0.094 0.131 0.962 0.196 0.038 0.070 0.977 0.150 0.023 0.024
β2 -3.00 -3.219 125.338 0.219 9.256 -3.114 94.559 0.114 9.057 -2.576 0.335 0.424 0.503
βT1 -0.50 -0.416 0.273 0.084 0.085 -0.404 0.210 0.096 0.070 -0.415 0.145 0.085 0.033
βT2 0.90 0.917 0.278 0.017 0.088 0.843 0.213 0.057 0.049 0.888 0.145 0.012 0.023
Table 4: Simulation study. True values, averaged estimates, standard deviation, bias and
mean squared error for different settings and sample sizes. Setting IV: unsusceptible=
22.56%, censoring= 36.51%; Setting V: unsusceptible= 51.07%, censoring= 58.14%; Setting
VI: unsusceptible= 80.67%, censoring= 83.45%.
a default and 5 376 in an early repayment. As could be expected given the rather short term
of the loans, the loan amounts are sized accordingly. The distribution of loan amounts is
shown in Figure 2. In the sample, 76.28% of the loan amounts are below 10 000 and 97.85%
below 20 000. In each of the models that are discussed, seven time-independent covariates
described in Table 6 (further information about these covariates cannot be disclosed due to
reasons of commercial confidentiality) are included as a baseline. As these variables are used
in a Cox PH model, a graphical check, through parallel discretized Kaplan-Meier curves,
16

true avg est avg sd bias MSE
b0 2 2.0834 0.2654 0.0834 0.1273
b1 0.5 0.6053 0.1562 0.1053 0.0592
b2 -2.3 -2.3036 0.1682 0.0036 0.1363
β1 -1.2 -1.0529 0.0728 0.1471 0.0303
β2 1 0.6866 0.0769 0.3134 0.1189
βT1 1 0.9276 0.2716 0.0724 0.1048
βT2 -0.7 -0.6663 0.0924 0.0337 0.0120
βT3 0.5 0.5036 0.1673 0.0036 0.0367
Table 5: Results for simulation setting VII, true values, averaged estimates, standard
deviation, bias and mean squared error. Unsusceptible= 22.72%, censoring= 39.01%.
Description Type
z1 Annual income (per 1000) continuous
z2 Age continuous
z3 Monthly child allowance (Y/N) categorical
z4 Number of years at current address continuous
z5 Total employment years continuous
z6 Bureau score continuous
z7 Mortgage on real estate (Y/N) categorical
Table 6: Credit loan data, time-independent covariates. Covariates z1, z2, z4 and z5 are
mean-centered and z6 log transformed.
for the proportional hazards assumption was performed and showed that this assumption
was satisfied. Additionally, six macro-economic factors were gathered through the online
database from the Belgian National Bank (NBB, 2015). A TVC-value was retained for each
month in the years 2004 until 2014, correcting for both trend and seasonality by taking the
yearly difference for each TVC (e.g. the TVC-value for unemployment in August 2008 is the
difference between its value in August 2008 and August 2007). As some macro-economic
17

Type Lag Description
x1(t) Interest Rate 6 months
As the interest rates of the Belgian financial institution were not disclosed,
the minimum bid interest rate was chosen. This refers to the minimum
interest rate at which counterparties may place their bids for refinancing
operations.
x2(t) BEL 20 index none
The benchmark stock market index of Euronext Brussels, consisting of ten
to twenty (depending on the period) companies that are traded at Brussels
Stock Exchange. The TVC is expressed as the difference between the index
of the current period and the previous year, divided by 1000.
x3(t) Consumer confidence none
Monthly survey on a variable sample of 1850 households conducted by the
National Bank. The survey, harmonized at European level, supplies infor-
mation on the appreciation of the consumers regarding the progress of the
economy in general and regarding their own situation in particular.
x4(t) Gross Domestic product noneGrowth in the Belgian Gross Domestic Product with respect to the same
period in the previous year (GDP growth is documented quarterly).
x5(t) Inflation rate 6 monthsPercentage changes in consumer price compared to the corresponding period
of the previous year.
x6(t) Unemployment 6 months
Harmonised data derived from the Labour Force Survey (LFS, population
older than 15 years), monthly adjusted by using the administrative national
unemployment figures, in accordance with the Eurostat methodology.
Table 7: Time-dependent covariates x1(t) to x6(t) are differential macro-economic factors
that change month by month. A specific TVC is the difference between the nominal macro-
economic factor value in a specific month and the same factor twelve months earlier.
factors may have a delayed effect on default, time lags of six months were introduced for
the TVCs of market interest rate, inflation rate and unemployment. Hence, we examine
the effect of the inflation rate in, say, February 2005 on possible default in August 2005.
As the financial crisis of 2007–2008 was fully covered in the sample, we examined the
effect of the crisis on the number of defaults. Figure 3 shows the proportion of defaults
in each month, represented by the number of defaults in each month divided by the total
number of loans that were actually running in that month (and were hence “at risk”).
Evidence of elevated defaults in the period 2007-01 to 2008-12 is present in the histogram,
with an average monthly default proportion of 0.0021 in the latter period versus an overall
average of 0.0017.
18

Loan Amounts (in EUR)
Fre
quen
cy
10000 20000 30000 40000 50000
050
010
0020
0030
00
Figure 2: Data example. Histogram representing the distribution of the loan amounts.
Only 3 loans had amounts over 50 000 EUR (not shown in the plot for reasons of clarity).
0.00
000.
0010
0.00
200.
0030
months
defa
ult c
ount
/num
ber
at r
isk
2004−07 2006−02 2007−05 2008−08 2009−11 2011−02 2012−05 2013−08
Figure 3: Data example. Proportion of defaults in each month as a fraction of the total
number of loans that were actually running in each month.
6.1 Data analysis using the mixture cure model
Information about the time-independent and time-dependent covariates can be found in
Tables 6 and 7 respectively. Several mixture cure models, each including the same seven
19

time-independent covariates, and three or four different TVCs (leading to thirty-five mod-
els in total) were analyzed. For each of these models, a corrected version of the Akaike
information criterion (named complete-data AIC or the AICcd) was computed. This AICcd
is based on the converged complete-data log likelihood Q(Θ | Θ
)instead of the standard
log likelihood and can be computed through
AICcd = −2Q(Θ | Θ
)+ 2d+ 2 trace{DM(Id −DM)−1},
where d is the length of the parameter vector, Id is a d× d identity matrix and DM is the
matrix rate of convergence of the EM algorithm, which is automatically computed when
using the SEM-algorithm (Meng and Rubin, 1991). The AICcd in the mixture cure context
is discussed in detail in Dirick et al. (2015).
When performing model selection one typically fits a series of models that are deemed
appropriate for the data at hand. A statistical model search via information criteria differs
from fitting one full model and reducing this by considering individual significance tests,
which leads to well-known multiple testing and pre-testing problems (Danilov and Magnus,
2004). The efficiency of AIC makes it preferable to other such criteria (e.g. the Schwarz
Bayesian information criterion) when the model is to be used to make predictions (see
for example Claeskens and Hjort, 2008, Chapter 2), which is the purpose of credit risk
modeling. Statistical individual significance is not considered in this process.
A general result from the analysis of the thirty-five models was that both BEL 20 index
and the interest rate tended to have a significant impact on default. The other macro-
economic factors, however, did not have a significant effect. The parameter information for
the three best models with respect to the AICcd-values, along with the model that only
contains the seven time-independent covariates, are given in Table 8. As a general result,
the AICcd clearly improves by including TVCs in the models. On the other hand, a lower
AICcd does not guarantee a model with significant TVCs, as can be seen in the AICcd
“best” model. For an explanation on how particular parameter estimates affect default, we
look at the model with significant effects for the interest rate and BEL 20 index. Residential
stability (z4), length of employment (z5), a higher bureau score (z6) and the presence of
a mortgage (z7) lead to a lower susceptibility (b is negative). The corresponding negative
estimates β for these four variables indicate a longer time until default as well. Both b and
20

AICcd (int) z1 z2 z3 z4 z5 z6 z7 IR BEL 20 cons conf GDP infl unempl
no TVC b 2.492 0.016 0.005 -0.076 -0.023 -0.039 -1.083 -1.319
(0.015) (0.002) (0.001) (0.033) (0.001) (0.002) (0.038) (0.026)
*** *** *** ** *** *** *** ***
30126.98 β -0.000 -0.011 -0.074 -0.024 -0.023 -0.615 -0.488
(0.005) (0.003) (0.077) (0.004) (0.006) (0.104) (0.092)
ns *** ns *** *** *** ***
best b 3.55 0.046 0.058 0.192 0.009 -0.07 -1.406 -2.153
(0.085) (0.002) (0.002) (0.037) (0.002) (0.002) (0.04) (0.033)
*** *** *** *** *** *** *** ***
26685.22 β -0.011 -0.026 -0.188 -0.036 -0.016 -0.519 -0.119 -0.003 -0.011 0.001
(0.005) (0.003) (0.076) (0.004) (0.006) (0.101) (0.077) (0.005) (0.021) (0.041)
* *** * *** ** *** ns ns ns ns
second best b 2.861 0.035 0.034 0.067 -0.003 -0.059 -1.23 -1.829
(0.079) (0.002) (0.001) (0.036) (0.002) (0.002) (0.039) (0.032)
*** *** *** · * *** *** ***
27743.78 β -0.008 -0.021 -0.133 -0.031 -0.016 -0.543 -0.188 0.071 -0.14 0.009 -0.033
(0.005) (0.003) (0.077) (0.004) (0.005) (0.1) (0.075) (0.036) (0.057) (0.022) (0.041)
· *** · *** ** *** * · * ns ns
third best b 3.309 0.028 0.023 0 -0.011 -0.048 -1.22 -1.588
(0.072) (0.002) (0.001) (0.034) (0.002) (0.002) (0.037) (0.033)
*** *** *** ns *** *** *** ***
29378.38 β -0.002 -0.015 -0.108 -0.029 -0.025 -0.659 -0.489 -0.003 0.005 -0.051
(0.005) (0.002) (0.074) (0.004) (0.006) (0.102) (0.085) (0.005) (0.031) (0.05)
ns *** ns *** *** *** *** ns ns ns
Table 8: Data example. Parameter estimates for the three best models according to their
AICcd-values and for the model without TVCs. (·) significant at the 10% level, (*) at the
5% level, (**) at the 1% level and (***) significant at the 0.1% level.
β indicate that debtors with more job and residential stability, as well as a higher bureau
score and having a real estate mortgage tend to be less prone to default. The effect of
annual income (z1), age (z2) and presence of a monthly child allowance (z3) is less clear:
with positive estimates b, susceptibility to default is increased, but the negative estimates β
indicate delayed default. Comparing parameter estimates over all models, it seems that the
only variable that leads to significant parameter estimates that have consistently opposite
signs for the two model parts, is variable z2 (age). It is not surprising that the signs
often are the same because the underlying intuition behind both model parts is risk of
default. However, a higher risk of being susceptible to default does not necessarily mean
that default will occur sooner. This is what is observed for the variable age: it seems that
susceptibility to default increases slightly with age, but older people seem to go into default
21

closer to the maturity of the loan. When looking at the TVCs, logically, a higher interest
rate leads to an increase in default hazard (βT is positive), and a better state of the BEL
20 index leads to a decrease in default (negative sign). With insignificant effects of the
gross domestic product and inflation rate on default, there is no conclusive effect of these
TVCs on default. Baseline hazard estimates (not shown here) are consistently larger for
the model without TVCs as compared to the estimates for the other models. The model
that has been selected as the best gives the lowest baseline hazard estimates, compared to
the whole range of models.
The magnitude of the macro-economic effects is small, which is an expected result,
as the models are averaging across people that are more or less likely to be affected by
the economy. Small effects at individual level will potentially aggregate to large effects at
portfolio level, as macro-economic factors will have the same effect for all individuals. This
result also follows previous studies such as Bellotti and Crook (2009).
6.2 The effect of the covariate value on the survival probability
To illustrate the effect of a certain covariate combination on the fitted probabilities of
default, we looked at two different covariate combinations in the data set and fitted survival
probabilities using the best model in Table 8. Additionally, a combination of two different
time-dependent covariate vectors was examined. The resulting covariate values can be
found in Table 9. In covariate combinations 1a and 2a, the lowest observed consumer
confidence level was attached, along with the lowest observed GDP and the highest inflation
rate. These values lead to the worst possible survival probabilities in presence of the time-
fixed covariates for covariate 1 or 2 (because of the negative sign for the former two TVC-
parameters, and the positive sign of the latter). For covariate combinations 2a and 2b, the
best observed consumer confidence level was attached, along with the best observed GDP
and the worst observed inflation rate.
The fitted survival probabilities for multiples of six months using the covariate values
in Table 9 and the best model in Table 8 are shown in Table 10. Fitting the model using
covariate combinations 1a and 2a leads to lower survival probabilities compared to 1b and
2b respectively, and the time-fixed covariates for covariate combinations 1a and 1b lead to
22

higher survival probabilities compared to 2a and 2b. The difference in TVCs can make up
to nearly 3% difference in the 36th month of the loan.
It is important to note that these fitted probabilities are purely intended as an illustra-
tion of the effect certain covariate values might have on the probability of default (ie 1 -
survival probability). In reality forecasting and stress testing can only be done using eco-
nomic forecasts and not the actual values of the macro-economic factors. Secondly, TVCs
change from one month to another, whereas for this illustration, TVCs were assumed to
stay at their maximal (minimal) level for the entire loan duration.
Example z1 z2 z3 z4 z5 z6 z7 cons conf GDP infl
1a 6.46 10.17 1 -3.73 13.80 2.29 0 -21 -6.30 5.91
1b 6.46 10.17 1 -3.73 13.80 2.29 0 20 7.20 -1.69
2a -11.49 8.17 0 -7.81 -8.28 1.61 1 -21 -6.30 5.91
2b -11.49 8.17 0 -7.81 -8.28 1.61 1 20 7.20 -1.69
Table 9: Data example. Two random covariate combinations for the non-TVCs were
selected from the data set. For each of them, the lowest (highest) observed TVC-level for
consumer confidence and GDP, and the highest observed TVC-level for the inflation rate
were attached. This results in four different covariate combinations 1a, 1b, 2a and 2b.
Time (months) 6 12 18 24 30 36
1a 0.9949 0.9895 0.9846 0.9807 0.9755 0.9258
1b 0.9962 0.9921 0.9884 0.9854 0.9814 0.9432
2a 0.9892 0.9780 0.9679 0.9602 0.9498 0.8618
2b 0.9919 0.9833 0.9756 0.9696 0.9616 0.8907
Table 10: Data example. Fitted survival probabilities for multiples of six months.
6.3 Extension: the multiple event mixture cure model
In reality, default is not the only possible event when considering credit risk. Another event
type is early repayment, which occurs when a customer repays the loan before the prede-
23

fined end term. The mixture cure model could be used to repeat the exact same analysis
for modeling early repayment instead of default, but it is also possible to include early
repayment as an extra term in the mixture cure model (for more information on mixture
cure models with multiple events, see Watkins et al., 2014; Dirick et al., 2015). For this
type of models, event-specific censoring indicators δi,d, δi,e and δi,m are introduced (denot-
ing default, early repayment and maturity indicators respectively), along with a general
censoring indicator δi = δi,d + δi,e + δi,m for each observation i. Analogous to the suscep-
tibility indicator Yi, three indicators Yi,d, Yi,e and Yi,m are introduced. The unconditional
survival function of the multiple event mixture cure model is then given by
S(t | z,x(t)) = πe(z)Se(t | Ye = 1, z,x(t)) + πd(z)Sd(t | Yd = 1, z,x(t)) +(1− πe(z)− πd(z)
),
with Se(t | Ye = 1, z,x(t)) and Sd(t | Yd = 1, z,x(t)) the conditional survival functions for
early repayment and default respectively. These functions are modeled using two Cox PH
models, as in (5).
Two major changes with regard to the single event mixture cure model are the compu-
tation of πd(z) and πe(z), and the conditional expectations of the Y -indicators, resulting
in the weights w. With more than two groups, the binomial logit is replaced by the multi-
nomial logit,
πd(z) = P (Yd = 1 | z) =exp(bd
′z)
1 + exp(bd′z) + exp(be
′z)(9)
and πe(x) is found analogously. As an extension to (13), the event-specific weights for
early repayment and default can be computed, with in this case Θ = (b,βd,βT,d,βe,βT,e),
and O = (λd,i,j, λe,i,j, δi, δi,d, δi,e, δi,m, ti,d, ti,e). The interval-specific censoring indicators λ
as well as the event time t depend on the event type, default or early repayment. The
event-specific weight for default is then given by
w(r)i,d = E(Yi,d | Θ(r),O) (10)
=
πd(zi)Sd(ti |Yi,d=1, zi,xi(ti))
πe(zi)Se(ti |Yi,e=1, zi,xi(ti))+πd(zi)Sd(ti |Yi,d=1, zi,xi(ti))+(1−πe(zi)−πd(zi)
) for δi = 0
1 for δi,d = 1.
0 for δi,d = 0 ; δi = 1
Note that, when δi = 0, ti,d = ti,e = ti, w(r)i,e can be computed in a similar fashion. Again,
the EM-algorithm is used for computation of the expected complete-data log likelihood.
24

The multiple event mixture cure model was applied to the data, adding the information
about early repayments which was ignored when applying the single event mixture cure
model.
Ten arbitrarily selected models containing three to four TVCs were analyzed, each time
including the same TVCs for the default and early repayment events. The result for one
of these models is listed in Table 11. A general result from the ten models was that, where
the effect and statistical significance of b on default lies relatively close to the results in
Table 8, nearly all β became statistically insignificant. The significant effects that generally
remain, are the number of years at current address and the bureau score. Additionally, no
significant βT remains for default. The signs of the early repayment parameter estimates
tend to be the same as those of the default parameter. While an early repayment does
not immediately incur costs for a bank, this event type does lead to a decline in expected
revenue, as the interest payments for the months following the time of early repayment are
lost. In fact, one can look at both default and early repayment as events that are results
of a common trigger, which is customer instability. Therefore early repayment is seen as
a negative event that banks prefer to avoid, and this is also reflected in the parameter
estimates. For early repayment, two TVCs tend to have a significant effect on the hazard
of early repayment, which is also illustrated in the model from Table 11, by the BEL20
index and the gross domestic product.
6.4 Extension: The mixture cure model with piecewise linear
relationship for the TVCs
With abundant information on the TVCs (with one TVC-value per subject per month that
the subject is observed), estimating just one βT for each TVC might be overly simplistic.
On the other hand, the effect of a certain TVC on default might depend on the specific range
this TVC is in. For example, the effect of the TVC associated with the GDP value might
be different when the GDP is declining with respect to the previous year, compared with
when GDP is increasing. A way of overcoming this is by using piecewise linear functions
instead of just one linear effect (or one βT ) per TVC.
Six new models were constructed from our data, each time with the seven “baseline”
25

d/e (int) b1 b2 b3 b4 b5 b6 b7 AICcd
d -0.033 0.006 -0.014 -0.103 -0.037 -0.047 -1.246 -1.208 98836.3
(0.163) (0.004) (0.003) (0.078) (0.004) (0.005) (0.1) (0.083)
ns ns *** ns *** *** *** ***
e 0.695 -0.007 -0.017 0.008 -0.017 -0.014 -0.741 -0.217
(0.095) (0.002) (0.001) (0.034) (0.002) (0.002) (0.041) (0.034)
*** ** *** ns *** *** *** ***
β1 β2 β3 β4 β5 β6 β7 IR BEL20 C Conf GDP infl rate unemp
d -0.001 -0.001 -0.049 -0.007 -0.006 -0.198 -0.107 0.039 0.011 0.007 0.029
(0.005) (0.003) (0.079) (0.004) (0.006) (0.103) (0.086) (0.038) (0.061) (0.022) (0.042)
ns ns ns . ns . ns ns ns ns ns
e 0.002 -0.001 0.037 -0.002 -0.001 -0.176 -0.136 0.01 -0.056 0.023 0.022
(0.002) (0.001) (0.036) (0.002) (0.002) (0.042) (0.035) (0.019) (0.025) (0.009) (0.023)
ns ns ns ns ns *** *** ns * * ns
Table 11: Data example. The parameter estimates of a multiple event mixture cure models
containing four TVCs. d are parameter estimates related to the default event, e denotes
early repayment parameter estimates.
time-independent covariates and just one of the TVCs, split into four piecewise linear
functions. The TVC-part of the linear predictor in (5), β′z+β′Tx(t) is replaced by several
TVCs xj(t) for each j = 1, . . . , 6:
βT1xj(t) + βT2
(xj(t)−Q1
)++ βT3
(xj(t)−Q2
)++ βT4
(xj(t)−Q3
)+, (11)
where Q1, Q2 and Q3 refer to the first quantile, the second quantile (or median value) and
the third quantile of all the TVC-values of the relevant macro-economic factor in the data
set. The notation(x)+ denotes the value x if x > 0, or 0 otherwise. The result of this
construction is that the effect of a TVC changes depending on whether the xj(t) are in the
interval [0, Q1], [Q1, Q2],[Q2, Q3] or [Q3, Q4] (respectively βT1, βT1 + βT2, βT1 + βT2 + βT3
and βT1 + βT2 + βT3 + βT4).
In Table 12, this principle is illustrated using the interest rate. While this model shows
that the effect between interest rate and default hazard rate is negative in the interval
[0, Q1], the effect is positive (as would be expected) in all other intervals (the effects are
-0.064, 0.404, 0.343 and 0.034 respectively). The effect of the middle ranges of the interest
rate seems to be more distinct (0.404, 0.343) compared to the “border intervals”. However,
it should be noted that from the results, no conclusions can be drawn, as none of the
estimates are statistically significant. Other TVCs were examined using this method as
26

(int) z1 z2 z3 z4 z5 z6 z7 βT1 βT2 βT3 βT4 AICcd
b 4.019 0.05 0.041 0.062 0.005 -0.066 -1.506 -1.95 27484.3
(0.084) (0.002) (0.002) (0.035) (0.002) (0.002) (0.039) (0.034)
*** *** *** . ** *** *** ***
β -0.007 -0.02 -0.131 -0.033 -0.02 -0.574 -0.351 -0.064 0.468 -0.061 -0.309
(0.004) (0.003) (0.079) (0.003) (0.006) (0.101) (0.083) (0.057) (0.344) (0.509) (0.39)
. *** . *** *** *** *** ns ns ns ns
Table 12: Data example. The parameter estimates of mixture cure models containing the
TVC interest rate, split up into four piecewise linear pieces bounded by the quantiles of
the interest rate, as expressed in (11).
well, but they all lacked statistical significance hence these results are not included in this
paper.
7 Discussion
The main reason and motivation for using the mixture cure models is that the common
assumption of survival analysis, that the survival function goes to zero as time goes to
infinity, clearly does not hold in many practical application settings (e.g. credit risk mod-
eling, fraud prediction, churn detection) as illustrated in Figure 1. We have shown that
time-dependent covariates can be included in mixture cure models to address this problem
whilst also enabling our models to include macroeconomic conditions.
A general result we found for the data set we used is that only a limited number of
macro-economic factors tended to have an effect on default (in the single event mixture
cure model) and early repayment (in the multiple event mixture cure model). Where the
BEL20 index had an influence on both event types, the interest rate had an influence on
the former and GDP on the latter event type only. It is indeed plausible that some macro-
economic factors do not affect default or early repayment. Let us take the unemployment
rate as an example: because of a selection bias (as banks only granted loans to suppos-
edly creditworthy customers), the debtors in the data set might not be affected by higher
unemployment, if a rise in unemployment was not present among the subjects in the data
set. On the other hand, some actual effects of TVC on default might be lost as a result
27

of the averaging of TVCs over a monthly period. Interesting results might be obtained by
applying the models when looking at weekly or even daily TVC levels; however, this would
largely increase the data size, and requires daily information regarding default and early
repayment events.
De Leonardis and Rocci (2014) approached the mixture cure models from a discrete
time perspective and applied this to study the default of firms. In that paper they work
only with the observed data likelihood. This simplification allows them to avoid the use
of the EM algorithm. An extension of the discrete time model of De Leonardis and Rocci
(2014) to incorporate multiple events, i.e. default, early repayment and maturity, would
be interesting for further research.
Several extensions of the basic model are possible. Piecewise linear functions can model
more complex relationships between the TVCs and the event of interest. An interesting
future research focus is setting appropriate “knots” instead of the quantile values.
As the goal of this study was to include time-dependent covariates in the latency part of
the already existing (and popular) mixture cure model, we did not explore time-dependent
incidence models. In fact, this is not straightforward as we are using a logistic regression
model. A related yet different type of model that accommodates for time-dependency
in both model parts is the promotion time cure model (Yakovlev et al., 1993). Its use for
default modeling is an interesting topic for further research, as are the use of an accelerated
failure time model as well as a Bayesian modeling approach.
Our extension of mixture cure models with time varying covariates is relevant in other
settings too. In a fraud analytics setting, where not all customers become fraudsters,
our approach will allow better disentanglement of the time varying tactics adopted by
fraudsters which may lead to better fraud prevention mechanisms. In a churn prediction
setting, where some customers may end up never churning, the inclusion of TVCs can
enable an understanding of latent and time varying symptoms of customer dissatisfaction.
To summarize, we think there are many application settings with high censoring rates
caused by the fact that the event does not occur for a majority of subjects. We believe our
extension of mixture cure models with time varying covariates is a valuable tool to better
understand the time varying nature of the events studied.
28

Acknowledgements
We wish to thank all reviewers of this paper for their helpful suggestions and comments.
We acknowledge the support of the Fund for Scientific Research Flanders, KU Leuven grant
GOA/12/14 and of the IAP Research Network P7/06 of the Belgian Science Policy. The
computational resources and services used in this work were provided by the VSC (Flemish
Supercomputer Center), funded by the Hercules Foundation and the Flemish Government
– department EWI.
A Appendix. Implementation using the EM-algorithm
A.1 The E-step
Denote the parameter-triplet (b,β,βT ) by Θ, and the observed information for each ob-
servation (λi,j, δi, ti) by O. The conditional expectation of the complete-data log likelihood
(formula (6)) in the (r + 1)th E-step is given by
Q(Θ(r+1) | Θ(r)) = E[logLc(Θ(r+1) | z,x(t), Y ) | Θ(r),O]. (12)
It can easily be seen that these functions are linear in Yi, which reduces the problem to
find an expression for the conditional expectation of Yi, which is given by
w(r)i = E(Yi | Θ
(r),O) =
π(zi)S(ti | Yi = 1, zi,xi(ti))
π(zi)S(ti | Yi = 1, zi,xi(ti)) + (1− π(zi))for δi = 0
1 for δi = 1.
(13)
Note that E(Yi | Θ(r),O) takes one value per iteration for each observation. The weights
w(r)i are computed using the value of the TVCs at time of censoring, and can be interpreted
as the probability that individual i will be susceptible to the event.
A.2 The M-step
The expected complete-data log likelihood in (12) is maximized with respect to the un-
known parameters. The conditional expectation of the incidence log likelihood is straight-
forward, replacing Yi’s in (7) by w(r)i . The conditional expectation of the latency log
29

likelihood (8) equals, using λi,j logw(r)i = 0 and λi,jw
(r)i = λi,j (Cai et al., 2012a)
E[logLlat(β,βT | z,x(t), Y ) | Θ(r),O]
=n∑
i=1
ki∑
j=1
λi,j log(w
(r)i h(tj | Yi = 1, zi,xi(tj))
)+ w
(r)i logS(tj | Yi = 1, zi,xi(tj))
= log
n∏
i=1
ki∏
j=1
(w
(r)i h0(tj) exp(β
′zi + β′Txi(tj))
)λi,j(S0(tj)
exp(β′zi+β′
Txi(tj)))w(r)
i
= log
n∏
i=1
ki∏
j=1
(h0(tj) exp(β
′zi + β′Txi(tj) + logw
(r)i ))λi,j
(S0(tj)
exp(β′zi+β′
Txi(tj)+logw(r)i
)).
When (12) is maximized, the baseline survival function of the rth M-step is updated before
proceeding with the next E-step. This is done non-parametrically using the Breslow-type
estimator for S0(t) and combining the results of Andersen (1992) and Cai et al. (2012a).
Denote R(tj) the individuals at risk in the interval (Bj−1, Bj], then
S0(t) = exp
(−∑
j:tj≤t
∑n
iǫR(tj )λi,j
∑n
iǫR(tj)w
(r)i exp(β′(r)zi + β
′(r)T xi(tj))
). (14)
The E-step and the M-step are repeated until parameter convergence.
A.3 Variance estimation
Standard errors of parameter estimators obtained via an EM-algorithm are not directly
available. A widespread method for estimating variances in the mixture cure context is
bootstrapping (e.g. Peng, 2003; Cai et al., 2012a; Tong et al., 2012). While easy to im-
plement, this method is computationally expensive, especially with big data sets and a
slow convergence of the EM-algorithm. We use the supplemented EM (SEM) algorithm
introduced by Meng and Rubin (1991). While other approximation methods exist (see,
among others, Sy and Taylor (2000); Peng and Dear (2000)) the advantage of SEM is that
it can be applied to any problem to which EM is applied, assuming that there is access to
the complete-data asymptotic variance-covariance matrix, which is indeed the case here.
30

References
Andersen, P. K. (1992). Repeated assessment of risk factors in survival analysis. Statistical
Methods in Medical Research, 1(3):297–315.
Austin, P. C. (2012). Generating survival times to simulate cox proportional hazards models
with time-varying covariates. Statistics in medicine, 31(29):3946–3958.
Banasik, J., Crook, J., and Thomas, L. (1999). Not if but when will borrowers default.
The Journal of the Operational Research Society, 50(12):1185–1190.
Bellotti, T. and Crook, J. (2009). Credit scoring with macroeconomic variables using
survival analysis. The Journal of the Operational Research Society, 60(12):1699–1707.
Berkson, J. and Gage, R. P. (1952). Survival curve for cancer patients following treatment.
Journal of the American Statistical Association, 47(259):501–515.
Cai, C., Zou, Y., Peng, Y., and Zhang, J. (2012a). smcure: An R-package for estimating
semiparametric mixture cure models. Computer Methods and Programs in Biomedicine,
108:1255–1260.
Cai, C., Zou, Y., Peng, Y., and Zhang, J. (2012b). smcure: Fit Semiparametric Mixture
Cure Models. R package version 2.0.
Claeskens, G. and Hjort, N. L. (2008). Model Selection and Model Averaging. Cambridge
University Press.
Collett, D. (2003). Modelling Survival Data in Medical Research, Second Edition. Chapman
& Hall/CRC Texts in Statistical Science. CRC Press.
Cortese, G. and Andersen, P. K. (2010). Competing risks and time-dependent covariates.
Biometrical Journal, 52(1):138–158.
Cox, D. and Oakes, D. (1984). Analysis of Survival Data. Chapman & Hall/CRC Mono-
graphs on Statistics & Applied Probability. Taylor & Francis.
Crook, J. and Bellotti, T. (2010). Time varying and dynamic models for default risk in
consumer loans. Journal of the Royal Statistical Society: Series A (Statistics in Society),
173(2):283–305.
Danilov, D. and Magnus, J. R. (2004). On the harm that ignoring pretesting can cause.
Journal of Econometrics, 122(1):27–46.
De Leonardis, D. and Rocci, R. (2014). Default risk analysis via a discrete-time cure rate
31

model. Applied Stochastic Models in Business and Industry, 30(5):529–543.
Dempster, A. P., Laird, N. M., and Rubin, D. B. (1977). Maximum likelihood from in-
complete data via the em algorithm. Journal of the Royal Statistical Society. Series B
(Methodological), pages 1–38.
Dirick, L., Claeskens, G., and Baesens, B. (2015). An Akaike information criterion for
multiple event mixture cure models. European Journal of Operational Research, 241:449–
457.
Divino, J. A. and Rocha, L. C. S. (2013). Probability of default in collateralized credit
operations. The North American Journal of Economics and Finance, 25:276 – 292.
Farewell, V. T. (1982). The use of mixture models for the analysis of survival data with
long-term survivors. Biometrics, 38(4):1041–1046.
Fisher, L. D. and Lin, D. Y. (1999). Time-dependent covariates in the Cox proportional-
hazards regression model. Annual review of public health, 20(1):145–157.
Fox, J. (2002). Cox proportional-hazards regression for survival data. An R and S-PLUS
companion to applied regression, pages 1–18.
Fox, J. and Carvalho, M. S. (2012). The RcmdrPlugin.survival package: Extending the R
commander interface to survival analysis. Journal of Statistical Software, 49(7):1–32.
Hosmer, D. W., May, S., and Lemeshow, S. (2008). Applied Survival Analysis: Regression
Modelling of Time to Event Data. Wiley-Interscience, second edition.
Kalbfleisch, J. and Prentice, R. (2002). The Statistical Analysis of Failure Time Data. John
Wiley & Sons, New Jersey, second edition.
Kuk, A. and Chen, C. (1992). A mixture model combining logistic regression with propor-
tional hazards regression. Biometrika, 79(3):531–541.
Meng, X.-L. and Rubin, D. B. (1991). Using EM to obtain asymptotic variance-
covariance matrices: The SEM algorithm. Journal of the American Statistical Asso-
ciation, 86(416):899–909.
Narain, B. (1992). Survival analysis and the credit granting decision. In Thomas, L. C.,
Crook, J. N., and Edelman, D. B., editors, Credit Scoring and Credit Control, pages
109–121. Clarendon Press, Oxford.
NBB (2015). National Bank of Belgium: Database with macro-economic factors. http:
32

//stat.nbb.be.
Peng, Y. (2003). Fitting semiparametric cure models. Computational Statistics & Data
Analysis, 41(3-4):481 – 490. Recent Developments in Mixture Model.
Peng, Y. and Dear, K. (2000). A nonparametric mixture model for cure rate estimation.
Biometrics, 56(1):227–236.
R Core Team (2013). R: A Language and Environment for Statistical Computing. R
Foundation for Statistical Computing, Vienna, Austria. ISBN 3-900051-07-0.
Stepanova, M. and Thomas, L. (2002). Survival analysis methods for personal loan data.
Operations Research Quarterly, 50(2):277–289.
Sy, J. and Taylor, J. (2000). Estimation in a Cox proportional hazards cure model. Bio-
metrics, 56(1):227–236.
Therneau, T. M. (2014). A Package for Survival Analysis in S. R package version 2.37-7.
Tong, E. N. C., Mues, C., and Thomas, L. C. (2012). Mixture cure models in credit scoring:
if and when borrowers default. European Journal of Operational Research, 218(1):132–
139.
Van Gestel, T. and Baesens, B. (2008). Credit Risk Management : Basic Concepts: Fi-
nancial Risk Components, Rating Analysis, Models, Economic and Regulatory Capital.
OUP Oxford.
Watkins, J. G. T., Vasnev, A. L., and Gerlach, R. (2014). Multiple event incidence and
duration analysis for credit data incorporating non-stochastic loan maturity. Journal of
Applied Econometrics, 29:627–648.
Yakovlev, A. Y., Asselain, B., Bardou, V., Fourquet, A., Hoang, T., Rochefediere, A.,
and Tsodikov, A. (1993). A simple stochastic model of tumor recurrence and its ap-
plication to data on premenopausal breast cancer. Biometrie et analyse de donnees
spatio-temporelles, 12:66–82.
33

FACULTY OF ECONOMICS AND BUSINESS Naamsestraat 69 bus 3500
3000 LEUVEN, BELGIË tel. + 32 16 32 66 12 fax + 32 16 32 67 91
[email protected] www.econ.kuleuven.be