
Macro BULLETIN - FGV Europe
28
January 2021 • No. 115 WAITING FOR VACCINES As the year begins, there are different high-impact variables operating in opposite directions. On the one hand, imposing a contractionary effect, there is the second wave of the pandemic. On the other hand, there is the beginning of the vaccination process and the prospect of strong expansion in the world’s two largest economies Macro BULLETIN
Transcript of Macro BULLETIN - FGV Europe

January 2021 • No. 115
WAITING FOR VACCINES
As the year begins, there are different high-impact variables
operating in opposite directions. On the one hand, imposing a contractionary effect, there is the second wave of the pandemic.
On the other hand, there is the beginning of the vaccination process and the prospect of strong expansion in the world’s two largest economies
MacroBULLETIN

J a n u a r y 2021 | M a c r o B u l l e t i n 3
Waiting for vaccines Armando Castelar Pinheiro and Silvia Matos
As the year begins, there are different high-impact variables operating in opposite directions. On the one hand, imposing a contractionary effect, there is the second wave of the pandemic, which has led many governments to reinstate restrictions on economic activity and consumers to reduce their demand for services. On the other hand, there is the beginning of the vaccination process and the prospect of strong expansion in the world’s two largest economies. Not only the final result, but also the dynamics of growth this year, will depend on the intensity and temporal distribution of these two effects.
In the first quarter, at least, contractionary forces will tend to prevail. The signs indicate that the coronavirus pandemic will still take some time to be fully brought under control across the world. Even though vaccination began in December 2020, with a large number of doses available, the pace of immunization has been slower than expected in the vast majority of developed countries, due to logistical difficulties. Only recently has the vaccination process accelerated in the United States and United Kingdom. In the eurozone countries, on the other hand, the process remains very slow.
In emerging countries, vaccination looks set to be an even more challenging process. Many countries have now started their vaccination campaigns, but few doses are available. Immunization is only likely to accelerate as the Oxford-AstraZeneca, Sinovac and Sinopharm vaccines are approved in these countries, given that the first batches of the Pfizer and Moderna vaccines have already been purchased by developed countries.
At the same time, the number of new cases remains at very high levels, around 700,000 per day, according to data from the Worldometers website. Regarding the number of daily deaths, the seven-day global moving average is around 14,000 and there are no signs of decline. As a result, the world has passed the tragic milestones of 100 million confirmed infections and more than 2 million deaths caused by the virus. There is great uncertainty about the pandemic’s dynamics and infectious disease specialists are concerned about the spread of virus mutations that have a high degree of transmission.
Due to the intensification of the pandemic, many European countries and Japan have adopted social distancing measures, such as restrictions on the functioning of non-essential establishments. These measures may be extended to contain the current outbreak. It is still unclear when it will be possible to relax these restrictions, although the situation is expected to improve with the arrival of spring in the Northern Hemisphere. Gradually, together with vaccination, this should allow for a progressive recovery of activity in the advanced economies.
The current picture is not only difficult, but also very heterogeneous across countries. As of the middle of 2021, there will be a rapid economic recovery in developed countries, especially in the services sector, which is likely to recover as vaccination progresses.
In the United States in particular, despite the pandemic’s intensity, economic growth remains resilient. In addition, the Joe Biden administration is expected to pass a strong fiscal stimulus package, taking advantage of

4 M a c r o B u l l e t i n | J a n u a r y 2021
the Democratic Party’s control of the Senate. The Fed chairman has also emphasized that the present monetary stimulus policy will be maintained. As a result, American growth should remain brisk.
In Europe, social distancing measures are expected to reduce growth in the first quarter. Furthermore, if the speed of vaccination does not increase, 2021 may end with an incomplete recovery of activity, even if the situation improves in the second half of the year.
The Chinese economy continues to surprise positively, as highlighted in this month’s IBRE In Focus section, written by researcher Livio Ribeiro. China’s GDP accelerated in the fourth quarter, resulting in 2.3% growth in 2020. As a result, China was the only major economy that did not shrink last year. Our forecast for 2021 is fast growth of 9.2%.
In spite of all these challenges, vaccination and consequently the reopening of economies, together with fiscal stimulus measures in the United States, make the external environment more favorable. This has been reflected in the recent increase in the prices of risky assets and commodities. This context has also favored the currencies of emerging countries, especially in Latin America.
However, even in this more favorable environment, the Brazilian real remains very weak compared to before the pandemic. This can be explained by domestic factors, especially fiscal uncertainties and the intensification of the pandemic. Brazil’s sharp currency depreciation, in a context of rising commodity prices and income compensation policies, has generated greater inflationary pressure in the country, increasing the degree of uncertainty in the economy, and so the Central Bank feels under more pressure to act.
Therefore, the better performance of the economy in the fourth quarter of last year does not translate into better prospects for the Brazilian economy at the start of this year. Despite the high carry over of 2.5% for this year, we project that Brazil’s GDP will increase just 3.5% in 2021, mainly concentrated in the second half. However, the spread of the virus, delay in implementing vaccination plans and uncertainty about the number of doses that will be available to Brazil in the short term represent a negative risk for our growth projections.
Additional delays in the vaccination campaign would further hold back the recovery in economic activity, alongside worsening fiscal risks related to the 2021 budget, including discussions about the extension of emergency aid, influenced by electoral motivations. The unorganized debate on fiscal policy, in a context of political pressure and lack of leadership in the government, may generate a new round of economic uncertainty and decline in activity.
With these concerns in mind, this edition of IBRE’s Macro Bulletin includes the following highlights:
Economic activity – � page 7: Figures for October and November reveal a significant slowdown in the pace of economic growth. The reduction in emergency aid in the last quarter of 2020, the acceleration of inflation and the resurgence of the pandemic are some of the factors that contributed to slowing growth in consumption of both goods and services at the end of last year. We forecast GDP growth of 1.9% compared to the third quarter and a decrease of 2.8%, year-over-year. For the year 2020, we expect a drop of 4.5%, to be followed by growth of 3.5% this year. In 2021, we expect growth to be concentrated in the second half, while GDP will shrink in the first half. Uncertainties about the economy’s ability to recover persist.
Business people’s and consumers’ expectations – � page 8: Business and consumer confidence indexes continued with the downward trend begun in October, ending the year below neutral level (below 100 points). Extremely low consumer confidence – caused by uncertainty related to the pandemic, the end of emergency welfare benefits, rising inflation and fear of unemployment – has led to the greatest detachment from business confidence since 2010. Among sectors, only manufacturing continues to show high levels of confidence, while the other sectors have slowed more and show some pessimism in relation to the first half of 2021.

J a n u a r y 2021 | M a c r o B u l l e t i n 5
Labor Market – � page 10: In October, the Continuous National Household Sampling Survey (PNADC) showed the first decline in the unemployment rate since the start of pandemic. It was 14.3%, less than FGV IBRE’s projection. For November, it is expected to fall to 13.9%, which in seasonally adjusted terms represents stability in relation to the previous month. However, the economically active population, which has been increasing rapidly according to IBGE’s official records, declined in monthly terms. In fact, this Bulletin shows that the increasingly better results in moving three-month periods were caused only by the fact that the last month was the first since the pandemic with a sequence of three months of growth in the economically active population, and the indicator is actually slowing down. Breaking down the figures by type of job, it can be seen that the increase is fully explained by the informal sector, a movement coinciding with a sharp reduction in emergency aid payments. The General Employment Registry (CAGED) once more showed a large increase in formal employment – 414,000 net new hires in November. In December, we expect a decline of 188,000.
Inflation – � page 13: Regarding inflation, despite pressure on producer prices, FGV IBRE’s Official Inflation Monitor anticipates that the IPCA rates for January and February may be approximately 0.25% and 0.35%, numbers close to the financial markets’ forecasts. The confirmation of these well-behaved rates will depend on the result of the tug-of-war between the rise in commodity prices and the end of emergency welfare payments. It is too early to determine which of these two factors will have the greatest influence on the short-term trend in inflation, but certainly 2021 will require greater attention from monetary policy. Looking ahead, it will be necessary to monitor the spread of inflationary pressures by tracking the diffusion index and core inflation measures. This will undoubtedly be a key element to consider in monetary policy management this year.
Monetary Policy – � page 14: The monetary policy section looks at the hard decision on when to raise interest rates. Those who were concerned about factors that indicated a possible rise in official inflation projections were right. New estimates released by the Central Bank show that projected inflation for the relevant monetary policy horizon, weighted according to signals given by the monetary authorities themselves, reached a level “sufficiently close” to the targets, weighted according to these signs. This was a criterion for abandoning forward guidance. And that is exactly what the Central Bank did. From now on, the benchmark Selic interest rate may be raised without any previous signal from the Central Bank. However, our analyst believes it is very likely that the weakness of the economy at the beginning of the year will lead the Central Bank to be very cautious, avoiding any precipitous upward movement in the rate.
Fiscal Policy – � page 16: The topic of our fiscal section is fiscal uncertainties this year. The government’s license to spend ended together with 2020, but the pandemic has not. The 2021 Budget Bill, presented in August, did not reflect recognized public health and social demands generated by the coronavirus. In the absence of a feasible plan to address existing fiscal challenges and taking into account recent events that will have a major impact on the public finances, further reductions in discretionary expenditure are expected in 2021. Despite efforts to contain mandatory expenditure in recent years, they have not been enough to prevent compliance with the spending ceiling from depending on significant cuts in discretionary expenses. This has led the federal government’s operating expenses and investment to reach historically low levels. With no budgetary provision of resources to continue to fight COVID-19, we are watching the world put into practice one of the most comprehensive vaccination campaigns in history, while fiscal uncertainties multiply in Brazil.
External Sector – � page 18: The external sector section of this Bulletin highlights China’s contribution to Brazil’s trade balance. In 2020, China explained 70% of our trade surplus. Together with other Asian countries, it was the main market that imported larger volumes of goods from Brazil. China’s share of Brazilian exports

6 M a c r o B u l l e t i n | J a n u a r y 2021
has now surpassed the sum of the United States’ and European Union’s shares. In 2021, sales of commodities, stimulated by Chinese expansion, will continue to determine the pace of growth of Brazilian exports. In addition, expansionary policies in the United States and a cycle of higher commodity prices are expected. The latter may also favor sales of Brazil’s manufactured goods to its South American partners, which are exporters of raw materials. However, this is still uncertain. Vaccination is likely to boost global economic growth, but risks persist. In the case of Brazil, uncertainties about politics and the direction of economic reforms are influencing the exchange rate, and the deterioration of relations with key trading partners may harm the country’s exports. Nevertheless, to begin with at least, we expect Brazil’s trade balance to continue to help mitigate its current account deficit.
International Panorama – � page 21: The international section explores the strong recovery of the American economy, which seemingly performed much better in 2020 than previously thought. According to data from the Atlanta Fed, the economy grew 1.8% in the fourth quarter compared to the third quarter. In the 2020-2021 two-year period, GDP is expected to grow 2.4%. If we consider that the economy was in full employment in the fourth quarter of 2019 and that the potential growth rate is approximately 1.6%, at the end of 2021 the United States will be 0.8 percentage points below the cyclical position in which it found itself in the fourth quarter of 2019. Everything indicates that by mid-2022 or a little earlier, the U.S. economy will return to full employment. The combination of a robust fiscal package and normalization of the economy in the second half, due to vaccination, supports this more optimistic view for the American economy. Consequently, inflationary risk may occur a little earlier than expected.
IBRE in focus – � page 22: Finally, the IBRE In Focus section, written by researcher Livio Ribeiro, looks at the Chinese economy: “The flight of the dragon.”
J a n u a r y 2021 | M a c r o B u l l e t i n 7
Economic ActivitySlowdown in activity in fourth quarter precedes further
deacceleration in first few months of 2021
Silvia Matos and Luana Miranda
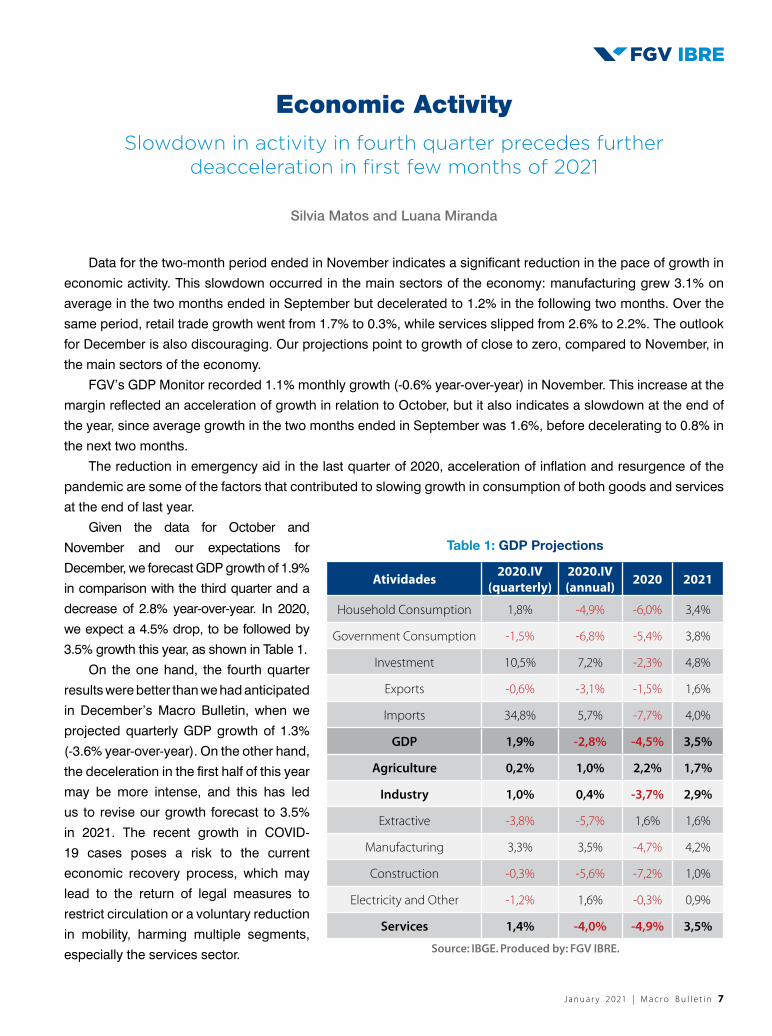
Data for the two-month period ended in November indicates a significant reduction in the pace of growth in economic activity. This slowdown occurred in the main sectors of the economy: manufacturing grew 3.1% on average in the two months ended in September but decelerated to 1.2% in the following two months. Over the same period, retail trade growth went from 1.7% to 0.3%, while services slipped from 2.6% to 2.2%. The outlook for December is also discouraging. Our projections point to growth of close to zero, compared to November, in the main sectors of the economy.
FGV’s GDP Monitor recorded 1.1% monthly growth (-0.6% year-over-year) in November. This increase at the margin reflected an acceleration of growth in relation to October, but it also indicates a slowdown at the end of the year, since average growth in the two months ended in September was 1.6%, before decelerating to 0.8% in the next two months.
The reduction in emergency aid in the last quarter of 2020, acceleration of inflation and resurgence of the pandemic are some of the factors that contributed to slowing growth in consumption of both goods and services at the end of last year.
Given the data for October and November and our expectations for December, we forecast GDP growth of 1.9% in comparison with the third quarter and a decrease of 2.8% year-over-year. In 2020, we expect a 4.5% drop, to be followed by 3.5% growth this year, as shown in Table 1.
On the one hand, the fourth quarter results were better than we had anticipated in December’s Macro Bulletin, when we projected quarterly GDP growth of 1.3% (-3.6% year-over-year). On the other hand, the deceleration in the first half of this year may be more intense, and this has led us to revise our growth forecast to 3.5% in 2021. The recent growth in COVID-19 cases poses a risk to the current economic recovery process, which may lead to the return of legal measures to restrict circulation or a voluntary reduction in mobility, harming multiple segments, especially the services sector.
Table 1: GDP Projections
Atividades2020.IV
(quarterly)2020.IV (annual)
2020 2021
Household Consumption 1,8% -4,9% -6,0% 3,4%
Government Consumption -1,5% -6,8% -5,4% 3,8%
Investment 10,5% 7,2% -2,3% 4,8%
Exports -0,6% -3,1% -1,5% 1,6%
Imports 34,8% 5,7% -7,7% 4,0%
GDP 1,9% -2,8% -4,5% 3,5%
Agriculture 0,2% 1,0% 2,2% 1,7%
Industry 1,0% 0,4% -3,7% 2,9%
Extractive -3,8% -5,7% 1,6% 1,6%
Manufacturing 3,3% 3,5% -4,7% 4,2%
Construction -0,3% -5,6% -7,2% 1,0%
Electricity and Other -1,2% 1,6% -0,3% 0,9%
Services 1,4% -4,0% -4,9% 3,5%
Source: IBGE. Produced by: FGV IBRE.

8 M a c r o B u l l e t i n | J a n u a r y 2021
From the perspective of supply, expectations regarding the fourth quarter for all major sectors of the activity have improved compared to last month. The main positive highlight was industry, whose projection was revised from -0.5% quarter-over-quarter (-1.5% year-over-year) to 1.0% quarter-over-quarter (0.4% year-over-year). To a large extent, this upward movement is due to manufacturing, which registered better-than-expected growth in November. It is also due to smaller marginal declines in construction and the “electricity and other” category.
The main highlights of GDP from the perspective of demand were revisions to our growth projections for investment and imports. Last month, we forecast that imports would increase 7.1% in relation to the third quarter (-14.5% year-over-year) and that investment would shrink 2.3% (-7.7% year-over-year) over the same period. These projections were updated to 34.8% quarter-over-quarter (5.7% year-over-year) in the case of imports, and to 10.5% quarter-over-quarter (7.2% year-over-year) in the case of investment. These strong revisions are explained by oil platform imports in December. According to ICOMEX figures, imports of capital goods grew 253.6% in December compared to the same month of the previous year, but stripping out oil platforms, this growth was just 10.6%.
In turn, household consumption is set to expand 1.8% quarter-over-quarter (-4.9% year-over-year) in the fourth quarter and to drop 6.0% in the year. The 3.3% growth in overall income was fundamental at driving consumption of goods. In the absence of government stimulus policies, overall income would have slumped 5.7%.
Growth in 2021 is likely to be focused in the second half. Indeed, GDP will probably shrink in the first half. However, uncertainties regarding the evolution of economic activity persist due to the recent increase in COVID-19 cases in Brazil, the lack of stimulus policies implemented over the past year and uncertainties regarding the evolution of the vaccination process in the country.
Business People’s and Consumers’ ExpectationsLabor market may be obstacle to recovery
Aloisio Campelo Jr, Rodolpho Tobler and Viviane Seda Bittencourt
In December, business and consumer confidence indexes continued with the downward trend begun in October, ending the year below neutral level (below 100 points). The Business Confidence Index fell 0.4 points, to 95.2 points, while the Consumer Confidence Index declined 3.2 points, to 78.5 points. In both cases, the reduction in confidence was driven by worsened expectations, although current situation indexes are signaling a slowdown in activity level at the end of the year.
There is a notable difference of 16.7 points between busines confidence and consumer confidence, the biggest since February 2010. Back then, which was another period of economic recovery, the difference seemed to be a consequence of the gap between executives’ perceptions of improvement in the business environment and consumers’ perceptions of improvement in the job market. In other words, business people somehow anticipated an improvement in consumers’ mood.
In 2021, it is hard to say whether the path will be similar. In addition to factors affecting everyone, such as the challenging economic situation and uncertainty regarding the pace of economic activity, consumers are very

J a n u a r y 2021 | M a c r o B u l l e t i n 9
concerned about the pandemic’s evolution, the end of the government’s emergency aid period, inflation and above all the job market. Except for inflation, which may slow in the coming months, the fate of the other variables is uncertain or will tend to be unfavorable in the first half of this year.
Graph 1: Consumers’ and business people’s confidence
(seasonally adjusted, in points)
-10,0
-5,0
0,0
5,0
10,0
15,0
20,0
50
60
70
80
90
100
110
120
jun/
06de
c/06
jun/
07de
c/07
jun/
08de
c/08
jun/
09de
c/09
jun/
10de
c/10
jun/
11de
c/11
jun/
12de
c/12
jun/
13de
c/13
jun/
14de
c/14
jun/
15de
c/15
jun/
16de
c/16
jun/
17de
c/17
jun/
18de
c/18
jun/
19de
c/19
jun/
20de
c/20
Difference Business Confidence Index Consumer Confidence Index
95,2
78,5
Source: FGV IBRE.
Concern about the job market is justified. As well as the present economic slowdown, the pace of new hiring may be affected in the next few months by the end of lockdowns, in the case of companies that participated in the government’s emergency programs to maintain jobs in 2020. Extraordinary questions added to our December surveys show that more than 60% of consulted companies took part in at least one emergency job maintenance program. The risk is higher for the services sector, especially for services provided to families – an item that is highly sensitive to movement restrictions that could return during COVID-19’s second wave.
The evolution of the labor market is likely to be quite heterogeneous in terms of sectors. At the end of 2020, industry continued to signal a strong pace of activity and optimism regarding the coming months. The sector’s recruitment forecasts for the next three months were much better than in the same period of 2019, before the pandemic. The recruitment forecasts for commerce and construction were slightly better than in the same period of 2019, while the services sector’s prospects were much less favorable than in the period before the pandemic.
Table 2: Net predicted increase/decrease in workforce in subsequent three months
(seasonally adjusted, in percentage points)
Industry Services Commerce Construction Business
dec/19 3,2 6,7 9,8 10,4 7,7
dec/20 20,7 -0,3 15,8 11,2 9,2
Source: FGV IBRE.

1 0 M a c r o B u l l e t i n | J a n u a r y 2021
Despite the prospect of the start of the vaccination campaign in Brazil, the resurgence of the pandemic and the end of the period of emergency aid add much uncertainty to the economic situation. Consumers are returning to the labor market and finding it very hard to get a job. There was a slowdown in activity at the end of the year, which may intensify in the first quarter of 2021. In industry, the recovery continues and the sector should continue to grow, including to replenish inventories, despite localized raw material shortages. In this context, companies will respond to demand stimulus but they will tend to remain cautious about investment and hiring decisions.
Labor MarketUnemployment provides positive surprise but monthly
growth in economically active population loses impetus, driven by informal sector
Daniel Duque
The October edition of the Continuous National Household Sampling Survey (PNADC) indicated the biggest drop in the unemployment rate since 2019, from 14.6% to 14.3% (14.4% in seasonally adjusted terms). This result was better than forecasts made by FGV IBRE (14.8%) and market analysts. For November, we now expect the rate to be 13.9%, which would represent stability in relation to the previous month in seasonally adjusted terms.
Graph 2: Unemployment Rate, 2019-20
10,0%
10,5%
11,0%
11,5%
12,0%
12,5%
13,0%
13,5%
14,0%
14,5%
15,0%
jan/
19fe
b/19
mar
/19
apr/
19m
ay/1
9ju
n/19
jul/1
9au
g/19
sep/
19oc
t/19
nov/
19de
c/19
jan/
20fe
b/20
mar
/20
apr/
20m
ay/2
0ju
n/20
jul/2
0au
g/20
sep/
20oc
t/20
nov/
20
Unemployment Rate Seasonally Adjusted Unemployment Rate
Source: PNADC (IBGE). Produced by: FGV IBRE.

J a n u a r y 2021 | M a c r o B u l l e t i n 11
According to IBGE’s official data, the labor market recovery accelerated to some extent in October. The economically active population grew 2% in relation to the previous month. However, this result was strongly influenced by the way three-month results are smoothed in PNADC – the last three months in the series were the first to grow since the pandemic, as shown in the series converted into monthly figures (using the Central Bank’s methodology). This coincidence had the consequence of inducing higher growth in the last three-month period due to a statistical effect. However, the magnitude of monthly growth has been declining since August. In relation to November, PNAD COVID-19 pointed to a further slowdown.
Graph 3: Change in economically active population, seasonally adjusted, in moving quarterly and monthly periods in 2020
-8,0%
-6,0%
-4,0%
-2,0%
0,0%
2,0%
4,0%
1 2 3 4 5 6 7 8 9 10
Monthly Quarterly
Source: PNADC (IBGE), converted into monthly data using Central Bank methodology. Produced by: FGV IBRE.
Breaking down the trends in the economically active population by sector, we can see that formal employment declined less and recovered more quickly between July and September, although this movement came to an end in the last month. Informal employment experienced a larger reduction up to June, as well as smaller increases until October, when there was a sharp rise of more than 2 million. The informal sector was solely responsible for overall employment growth that month.
This movement coincided with a strong decline in the volume of emergency aid transfers, as shown by PNAD COVID-19, while many beneficiaries received a final payment of R$300, down from R$600 before. Although we cannot establish a precise cause-and-effect relationship between all this data, we can assume, given the greater flexibility of the informal labor market, especially the self-employed segment, that the reduction in emergency aid played a major role in the recovery of this group of workers, whose employment depends almost exclusively on their own participation in the workforce.
In view of the further expected reductions in the volume of emergency aid transfers in the following months, in addition to its end in January 2021, more increases in the economically active population in the informal job market can be expected. However, this movement may be limited by the absorption capacity of the self-employed labor market, mainly concentrated in the small retail and traditional services sectors. On the other hand, formal employment, whose level stagnated between September and October in PNADC, may present new increases by the end of 2020, but it will be limited in early 2021 by the second wave, given its greater sensitivity to legal restrictions on economic activities, especially services.

12 M a c r o B u l l e t i n | J a n u a r y 2021
Graph 4: Employment by sector and emergency aid per capita, by month in 2020
R$ 0
R$ 50
R$ 100
R$ 150
R$ 200
R$ 250
R$ 300
35
37
39
41
43
45
47
49
51
1 2 3 4 5 6 7 8 9 10 11
Mill
ion
Formal Informal Emergency aid (per capita)
Source: PNADC (IBGE), converted into monthly data using Central Bank methodology, and PNAD COVID-19. Produced by: FGV IBRE.
Thus, we expect the economically active population to grow 1.2% in 2021 (following a projected drop of 7.9% in 2020). The unemployment rate is expected to average 15.3% this year. Thus, despite the growth in the economically active population, the unemployment rate would be almost two percentage points above the probable average level to be recorded in 2020.
In turn, the General Employment Registry (CAGED) showed the creation of 414,000 jobs with formal employment contracts (equivalent to 396,500 in seasonally adjusted terms), influenced by the further rise in the amount of hiring, which once more exceeded that of the same month of 2019. For November, we forecast a reduction of 188,000 jobs, equivalent to a gain of 206,000 jobs in seasonally adjusted terms.
Graph 5: Net Change in Employment According to CAGED, 2019-20
-1.000.000
-800.000
-600.000
-400.000
-200.000
0
200.000
400.000
600.000
jan/
19
mar
/19
may
/19
jul/1
9
sep/
19
nov/
19
jan/
20
mar
/20
may
/20
jul/2
0
sep/
20
nov/
20
Caged CAGED, seasonally adjusted
Source: CAGED (Labor Ministry). Produced by: FGV IBRE.

J a n u a r y 2021 | M a c r o B u l l e t i n 13
CAGED’s recent strong positive results have systematically outperformed IBRE’s and market analysts’ projections. An article by Ottoni and Barboza (2020) suggested three hypotheses for this discrepancy, including underreporting of layoffs and a change in the data collection method in 2020. Finally, the authors say that in this context, PNADC gives a better indication of the labor market’s real situation.
Bibliography
OTTONI, Bruno; BARBOZA, Ricardo. As inquietudes que cercam o mercado de trabalho. Valor Econômico. Rio de Janeiro. December 29, 2020. Available at: https://valor.globo.com/opiniao/coluna/as-inquietudes-que-cercam-o-mercado-de-trabalho.ghtml.
InflationIncrease in commodity prices versus end of emergency aid:
what will happen to IPCA in 2021?
André Braz
Higher food and energy prices (via the level-2 “red flag” electricity surcharge) raised inflation in the last month of the year and contributed to the Extended Consumer Price Index (IPCA) ending 2020 up 4.5%, exceeding the inflation target.
Even though food inflation slowed between November and December (from 2.5% to 1.7%), it played a decisive role in keeping IPCA above the 4% target in 2020. Because of food’s influence, IPCA would have risen 1% even if there had been no change to the electricity surcharge in December – enough to close the year up 4.1%, slightly higher than the target.
Inflation in 2020 was strongly influenced by the behavior of the food and beverage group, which accounted for 60% of the year’s total inflation. In the last 12 months, the price of food at home (a group mostly composed of items purchased in supermarkets) rose 18.2%.
Although inflation in 2020 was heavily focused on food, the diffusion index1 rose gradually throughout the second half, from 54% in July to 72% in December, showing that inflation was progressively spreading to other spending categories.
Between August and December 2020, there were successive increases in 12-month inflation for unregulated services (0.9% to 1.7%), durable goods (0% to 4.5%), semi-durable goods (-1.7% to -0.1%) and utility charges (1.1% to 2.6%). Despite this, almost all groups recorded only moderate increases, resulting in rates equal to or below inflation of 4.5% for IPCA in 2020. Only the rate for non-durable goods, a group composed mostly of food, came in well above average inflation, leading to a rise of 13.2% in the year.
For 2021, according to the Central Bank’s Focus Report, financial market analysts forecast IPCA of around 3.4%, below the inflation target set for the year, which is 3.75%.
1This measures the percentage of IPCA subitems with positive variations each month.

14 M a c r o B u l l e t i n | J a n u a r y 2021
However, inflationary pressure on some important inputs for productive activity remains in place. The first two preliminary IGP-M results in January indicate an acceleration in producer prices. Agricultural and industrial commodities, which put pressure on production chains in 2020, are expected to go up in price again in the first quarter of 2021, which may boost IPCA beyond the level predicted by the financial markets this year.
In the international market, the U.S. dollar prices of agricultural commodities rose sharply in the first two weeks of 2021: wheat, soy and corn went up 5.3%, 7.9% and 9.9%, respectively.2 These movements are starting to provoke a new cycle of acceleration in the producer price index, according to the first two preliminary IPA-M results in January. Metallic commodities are following a similar trend, especially iron ore, which went up in price 7.8% in the same period, according to an international source.
Increases in grain prices are also affecting animal feed, which in turn will tend to put pressure on meat prices. According to the second preliminary IPA-M results in January, the prices of live animals (cattle, pigs and poultry) are falling. However, this trend may change in the next few surveys.
Despite the pressures that are beginning to influence producer inflation, FGV IBRE’s Official Inflation Monitor anticipates that IPCA in January and February may be approximately 0.25% and 0.35% – numbers close to financial market estimates.
The explanation for these well-behaved rates lies in the tug-of-war between the rise in commodity prices and the end of emergency welfare payments. It is too early to determine which of these two factors will have the greatest influence on the short-term trend in inflation, but certainly 2021 will require greater attention from monetary policy. Looking ahead, it will be necessary to monitor the spread of inflationary pressures by tracking the diffusion index and core inflation measures. This will be crucial in determining the exact moment when it will be necessary to raise interest rates without harming the resumption of economic activity.
Monetary PolicyThe difficult decision on when to raise interest rates
José Júlio Senna
At the Monetary Policy Committee meeting of August of last year, Central Bank officials formally introduced the idea of forward guidance. Through this new instrument, the Central Bank signaled that it did not intend to reduce the degree of monetary stimulus and did not rule out the possibility of further reducing the benchmark Selic interest rate. In other words, it involved a kind of “downward bias” for interest rates, provided that certain conditions were still met.
At the December meeting, Central Bank officials said that at that moment, the conditions for maintaining its forward guidance were still in place. “In particular, for 2021, inflation expectations and inflation projections in our base scenario remain below the inflation target for the relevant monetary policy horizon. The tax regime has not been changed and long-term inflation expectations remain anchored,” they said.
2The behavior of soy, corn and wheat prices was obtained from the Macrotrends website.

J a n u a r y 2021 | M a c r o B u l l e t i n 15
Later on, the minutes of the meeting made it clear that the calendar year 2021 will soon lose importance as a reference for the Central Bank’s actions. In other words, the year 2022 will acquire increasing importance and soon become the relevant reference. The fact that inflation expectations and projections for 2022 are already around the target therefore means that in a short time, the conditions for maintaining forward guidance will no longer be present.
This signal was accompanied by a warning that any withdrawal of forward guidance would not cause a mechanical reaction by the Central Bank to increase the Selic rate. After all, the economic situation continued to suggest extraordinary monetary stimulus. Without forward guidance, monetary policy would follow the classic prescription of the target regime, i.e., it would be based on an analysis of prospective inflation and its balance of risks.
Certainly, speculation soon arose about the withdrawal of forward guidance at Copom’s first meeting of the new year. The strong inflationary shock experienced by the economy throughout the second half of 2020 fueled this speculation.
The first meeting of the year was preceded by much discussion on some relevant points related to the decision regarding forward guidance. The most important aspects raised then may be similar to those mentioned below.
First, after remaining stable for a long time, the median Focus Report forecast was adjusted upward last week. In the top five group, the increase was more pronounced, with the forecast rising to 3.75%.
Second, the upward trend in producer prices cooled off, especially in the agriculture sector. However, the pace of growth in the Broad Producer Price Index (IPA) remains high and there is a good chance that at the end of January, it will show an increase of around 2.8% per month, in the case of both industrial products and agriculture.
Third, the fact that inflation in 2020 was higher than what the Central Bank had predicted was possibly seen by many analysts as a sign that the new official projections would be higher than the previous ones. In fact, throughout the second half of 2020, the market itself underestimated monthly inflation, in a systematic and growing way. We refer to the one-month lag estimates presented in the Focus Reports.
In view of this, many analysts believe that the customary revisions of official projections could indicate projected levels of inflation very close to the official targets. In the first quarter of 2021, the Central Bank is working with the idea of allocating different weightings to 2021 and 2022 in the relevant inflation targets, with 75% for 2022 and 25% for 2021. The target now would therefore be 3.56%. As of the second quarter, it will only incorporate the target for 2022.
The minutes of the Monetary Policy Committee’s first meeting of the year, which ended on Wednesday, January 20, show that concern with the upward adjustment of official inflation projections, based on the basic scenario, was pertinent. The new numbers generate a weighted average, using the aforementioned percentages, of 3.45%, which is very close to 3.56%. As a result, Central Bank officials concluded that the projections “are close enough” to inflation targets for the relevant monetary policy horizon. Faithful to the criteria widely signaled to the markets, the Central Bank abandoned its forward guidance.
Going forward, the Central Bank says that the next monetary policy actions will follow “the usual analysis of the balance of risks for prospective inflation.” In examining this balance, the Central Bank continues to see risk factors in both directions. Although the conclusion continues to indicate an upward bias in inflation, compared to the projection, the weakness of the economy at the beginning of the year will probably make the Central Bank very cautious, avoiding any precipitous upward movement in Selic. The weakness of the economy may persist for at least the entire first half of the year.

16 M a c r o B u l l e t i n | J a n u a r y 2021
Fiscal PolicyPending matters for the 2021 budget:
it’s a new year, but fiscal uncertainties remain
Juliana Damasceno and Matheus Rosa Ribeiro
The government’s license to spend ended together with 2020, but the pandemic has not. Since the budget bill for this year was presented in August, some questions have surrounded the fiscal situation in 2021, adding to the uncertainty already guaranteed by the ongoing pandemic. The failure to issue the budget law by December 31 led to the temporary execution of the bill at the beginning of his year, as established in the budget guidelines law. However, the 2021 budget bill’s failure to address health and social demands triggered by the coronavirus postponed a feasible plan for the fiscal challenges that existed at the time, which were reinforced by new events of significant fiscal impact in recent months. With no provision for extraordinary expenses to continue the direct fight against COVID-19, including purchases of vaccines and other medical supplies, fiscal uncertainties are multiplying while there are still no clues about the end of this crisis.
In the last 10 years, only two (2013 and 2015) ended without a vote on the following year’s budget being held, and the respective laws were only published in April. Just as the world is embarking on one of the biggest vaccination movements in history, new fiscal issues look set to increase the already painful challenge of approving a budget that can reconcile an executable spending ceiling and additional reductions in discretionary spending. An amendment to the budget, cutting discretionary expenditure again, must be presented, while including, among other items, the increase in the minimum salary based on the National Consumer Price Index (INPC) result, which was higher than forecast. In previous years, such cuts were also made, but the situation will be more difficult in 2021, given that inflationary pressure in the second half of 2020 generated a significant difference between the increase in the federal government’s spending ceiling (based on IPCA in the 12 months to June 2020) and growth in expenses indexed to INPC (based on INPC between January and December 2020).
Between the 2021 budget bill of August and the 2021 budget guidelines law, budgeted discretionary expenditure fell from R$96 billion to R$84 billion. As well as this cut, the economic team’s new prediction in mid-December was for INPC to end the year at 5.26%. This meant that the minimum monthly salary had to be raised to R$1,100 and it accelerated an additional spending adjustment of around R$4.2 billion. In January, the national statistics agency, IBGE, revealed that INPC in 2020 was 5.45%, and this means that discretionary expenditure will have to be reduced further, possibly to less than R$70 billion.
The government must demonstrate whether this new level of discretionary spending is enough to run the public administration. The spending ceiling was established by Constitutional Amendment 95 of 2016 in order to encourage reforms to alter the dynamics of mandatory expenditure in the medium and long term, anchoring primary expenditure growth to inflation. Although efforts to contain mandatory expenditure have been observed in recent years, they have not been enough to prevent compliance with the spending ceiling from depending on reductions in discretionary spending to extremely low levels. In addition, the government’s control over discretionary spending has been eroded in recent years by the increasing tendency of lawmakers to vote themselves individual mandatory budget allocations, based on Constitutional Amendment 86 of 2015, and state-level budget allocations, based on Constitutional Amendment 100 of 2019.

J a n u a r y 2021 | M a c r o B u l l e t i n 17
As part of this process of cutting the discretionary budget, another reduction in the federal government’s operating expenses and investment, which are already at historically low levels, is expected. Graph 6 presents the downward trend in operating expenses in recent years. In addition, since 2014, the federal government’s annual investment has not even been enough to make up for capital depreciation.3 This context makes the possibility of further cuts in operating expenses and investment imposed by the smaller discretionary budget worrying. It may accentuate net divestment and bring public sector management to minimum funding limits, which may not be feasible. The strategic role of public investment, especially in infrastructure, is increasingly becoming a residual item, adjusted according to the needs of a spending ceiling that sooner or later will require adjustments to its technical design.
While the budget remains unapproved and the pandemic’s numbers continue to escalate, old and new fiscal issues remain and there is no evidence of a strategic plan capable of avoiding: i) a short-term shutdown of the public administration; ii) the collapse of fiscal anchors in the medium term; and iii) the end of fiscal sustainability in the long term.
Graph 6: DFederal government’s annual administrative expenses, R$ million, as of November 2020
(adjusted for inflation using IPCA)
35.000,0
37.000,0
39.000,0
41.000,0
43.000,0
45.000,0
47.000,0
dec/
11
jun/
12
dec/
12
jun/
13
dec/
13
jun/
14
dec/
14
jun/
15
dec/
15
jun/
16
dec/
16
jun/
17
dec/
17
jun/
18
dec/
18
jun/
19
dec/
19
jun/
20
Source: Data from National Treasury’s Administrative Costs Bulletins (including mandatory expenditure).
3Source: General government’s quarterly fiscal statistics, National Treasury.

18 M a c r o B u l l e t i n | J a n u a r y 2021
External SectorChina accounted for around 70% of Brazil’s trade surplus in 2020.
In 2021, this dependency will continue
Lia Baker Valls Pereira
In 2020, Brazil’s trade surplus was US$50.9 billion, foreign investment in the country was US$33 billion (between January and November) and GDP fell an estimated 4.7%, according to IBRE’s Macro Bulletin. In this context, the only encouraging result was the trade surplus, which helped reduce the current account deficit at a time of capital flight.
The global recession caused by the pandemic led to a drop in the volume of world trade in goods. According to estimates by the World Trade Organization, the volume of world trade declined 9.2% in 2020 compared to 2019. However, this number may be revised downward, as it did not incorporate new lockdowns during the second wave of the pandemic. Regardless of this revision, in all countries, the pandemic led to reductions in both exports and imports. However, the magnitude of these setbacks depended on the structure of each country’s foreign trade. Here we are only dealing with trade in goods and, in this case, Brazil’s exports are focused on commodities bought by China.
Out of Brazil’s trade surplus of US$50.9 billion, China contributed US$33.6 billion (Graph 7). We can see that out of our main trading partners, the United States had a negative contribution, the European Union had a positive contribution of US$1.5 billion, South America including Argentina) contributed US$6 billion, and the rest of Asia contributed US$9.7 billion.
Graph 7: Trade balance with main trading partners in US$ billion, 2019 and 2020
main partners
48,0
28,1
-0,4 -0,8
1,95,9 8,1
50,9
33,6
-2,7
0,7 1,5
9,75,3
Global China UnitedStates
Argentina EuropeanUnion
Asia,excluding
China
South America,excludingArgentina
2019 2020
Source: Trade balance, Economy Ministry.
It is noteworthy that China and other Asian countries were the only ones to import more from Brazil in 2020 (Graph 8). Brazil’s exports to other major partners fell between 2019 and 2020. This strong performance in Asia market meant that the region’s share of Brazilian exports rose to 47.2%, while China alone accounted for 32.3%. China’s share exceeded the sum of the percentages of the European Union (13.5%) and United States (10.2%).

J a n u a r y 2021 | M a c r o B u l l e t i n 19
In the case of Brazil’s imports, China’s share (21.4%) is higher than those of the United States (15.2%) and European Union (16.9%). Asia’s share (33.4%) is larger than the sum of Brazil’s two biggest trading partners after China.
The growth in volumes exported to Asia was not enough to compensate for the decrease observed in other markets. In terms of value, exports fell 6.9% and imports dropped 10.4%. The improvement in the trade balance is therefore due more to the fall in imports driven by the recession than to the performance of exports.
Graph 8: Change (%) in volume exported to Brazil’s main trading partners between 2019 and 2020
17,0
-17,1
-7,8 -7,1
-11,6
11,1
China United States European Union Argentina OtherSouth America
Asia(excluding Chinaand Middle East)
Fonte: SECEX. Elaboração IBRE/FGV-Índices de Comércio Exterior (ICOMEX).
However, analysis of foreign trade indexes shows that the bigger drop in imports was led by lower prices (Graph 9). Including oil platforms, export volumes fell 8.8% and import volumes fell 3.1%. Excluding oil platforms, the difference between the two volumes decreases: exports (-7.6%) and imports (-7.0%). The world recession has pushed down the prices of imported products. Export prices, however, have fallen less, explained by Chinese demand, which has sustained and contributed to the rise in commodity prices.
Graph 9: Change (%) in price and volume indexes for exports and imports between 2019 and 2020
-5,7
-8,8
-7,6
-7,5
-3,1
-7,0
-10,0 -9,0 -8,0 -7,0 -6,0 -5,0 -4,0 -3,0 -2,0 -1,0 0,0
Price
Volume
Volume withoutoil platforms
Imports Exports
Source: Economy Ministry’s Foreign Trade System (Siscomex). Produced by: FGV IBRE’s monthly foreign trade bulletin, ICOMEX.

2 0 M a c r o B u l l e t i n | J a n u a r y 2021
What should we expect in 2021?
The uncertainties associated with the pandemic have not yet been resolved on the world stage and in Brazil. Some points, however, suggest positive conditions for Brazilian exports.
The first refers to the increase in commodity prices, which began to be observed in the second half of 2020 and was reflected in the improvement in Brazil’s terms of trade, starting in July of last year (Graph 10). Chinese investments in new infrastructure projects demanded purchases of iron ore and copper. In addition, the prices of some food products, such as soybeans, meat and wheat, rose because of the reduction in supply caused by droughts and the ongoing effects of the pork crisis in China. Biden’s victory could intensify expansionist policies and the weakening of the dollar, which is always accompanied by rising commodity prices.
The improvement in the terms of trade, associated with commodity prices, is also helping Brazil’s manufacturing exports to South American raw material-exporting partners.
However, for Brazil to continue to be a leader in sales of commodities, especially agricultural ones, the government must prioritize its environmental and climate policy. In addition to Emmanuel Macron, the French president, U.S. President Joe Biden is also expected to focus on the environmental agenda, as well as China.
Graph 10: Terms of trade – three-month moving average
90
95
100
105
110
115
120
125
130
135
mar
/10
may
/10
jul/
10se
p/10
nov/
10ja
n/11
mar
/11
may
/11
jul/
11se
p/11
nov/
11ja
n/12
mar
/12
may
/12
jul/
12se
p/12
nov/
12ja
n/13
mar
/13
may
/13
jul/
13se
p/13
nov/
13ja
n/14
mar
/14
may
/14
jul/
14se
p/14
nov/
14ja
n/15
mar
/15
may
/15
jul/
15se
p/15
nov/
15ja
n/16
mar
/16
may
/16
jul/
16se
p/16
nov/
16ja
n/17
mar
/17
may
/17
jul/
17se
p/17
nov/
17ja
n/18
mar
/18
may
/18
jul/
18se
p/18
nov/
18ja
n/19
mar
/19
may
/19
jul/
19se
p/19
nov/
19ja
n/20
mar
/20
may
/20
jul/
20se
p/20
nov/
20
Source: Economy Ministry’s Foreign Trade System (Siscomex). Produced by: FGV IBRE’s monthly foreign trade bulletin, ICOMEX.
The second positive point for Brazilian exports refers to the 41% devaluation of the real exchange rate between December 2019 and October 2020, which favored exports, including manufacturing ones, which recorded positive annualized variations as of November 2020.
The Brazilian currency’s exchange rate remained unstable between October and December 2020 and the real effective rate appreciated by 9.2%. This rise did not create an anti-export bias, but for foreign trade decisions, a lot of exchange rate volatility is unwelcome. How will the exchange rate behave in 2021? We do not make projections, but we note that domestic factors associated with the government’s performance in the vaccination program and the progress or lack of progress of tax and administrative reforms, in addition to political issues, may or may not contribute to a worsening of this exchange rate instability.
On the import side, Graph 11 shows growth in all categories of industry use in the year to December – a sign of recovery in economic activity. The Central Bank’s Focus Report of January 8, 2021 projects GDP growth

J a n u a r y 2021 | M a c r o B u l l e t i n 2 1
of 3.4% in 2021, while IBRE projected growth of 3.6% in December 2020. If these projections prove accurate, an increase in imports will be expected, in the event of exchange rate stability.
Conditions are very uncertain. One notable fact is that external circumstances may be positive if the pandemic starts to be controlled. On the domestic front, however, political uncertainties and the direction of economic reforms are influencing the exchange rate, and the deterioration in trade relations with key partners may harm Brazilian exports. In any case, at first, we expect the trade balance to continue to make a positive contribution to reducing the current account deficit. In an optimistic scenario (external and domestic), the trade balance could reach a surplus of around US$50 billion. However, this is a “qualitative projection.” We will wait for IBRE’s model before making new projections for 2021.
Graph 11: Change (%) in import volumes of machines/equipment and intermediate goods used in agriculture and industry
10,6
20,6 24,419,7
-11,4
-25,5
11,0
-7,3
Industrial machines/equipment without
oil platforms
Agriculturalmachines/equipment
Intermediate goodsfor industry
Intermediate goodsfor agriculture
Dec 19 to Dec 20 Jan-Dec 19 to Jan-Dec 20
Source: Economy Ministry’s Foreign Trade System (Siscomex). Produced by: FGV IBRE’s monthly foreign trade bulletin, ICOMEX.
International PanoramaThe american economy in 2021: strong recovery
Samuel Pessôa
The year 2020 ended and all the signs indicate that the performance of the American economy was much better than imagined. According to data from the Atlanta Fed, in the fourth quarter, the economy grew 1.8% compared to the quarter immediately before. GDP is now estimated to have fallen 3.3% in 2020 (my forecast based on the Atlanta Fed’s “GDPnow” results for the fourth quarter). This is much less than the forecast by Goldman Sachs (the most optimistic major investment bank last year) of a decline of 6.5%.
As the recovery was very strong in the second half, after the collapse of the economy in the second quarter, the year will end with the economy larger than the average rate for 2020. So, even if growth in 2021 is nil, the United States’ GDP will be higher than in 2020. This residual growth is called “carry over” from 2020 to 2021. According to the Atlanta Fed’s estimates, it will amount to 2.6%.

2 2 M a c r o B u l l e t i n | J a n u a r y 2021
The Democratic candidate was elected and obtained a majority in the Senate: there are 50 Republican senators, 48 Democrats and two independents who generally vote with the Democrats. The vice president gets the casting vote. This minimal majority is not enough to change the Constitution and it is also not sufficient for more structural measures, such as electoral laws, which require 60% of votes in both houses of Congress. However, it is enough to approve a budget with higher spending. The budget is a theme that is naturally guided year by year.
The prospects for the recovery of the American economy are very positive. Goldman Sachs, the investment bank that has been most accurate, projects that the U.S. economy will grow 6.4% in 2021, that is, almost 4 percentage points more than the carry over effect. Thus, in the 2020-2021 two-year period, GDP will grow 2.4%. If we consider that the economy was in full employment in the fourth quarter of 2019 and that the potential growth rate is approximately 1.6%, at the end of 2021 the United States will be 0.8 percentage points below the cyclical position in which it found itself in the fourth quarter of 2019. Everything indicates that by mid-2022 or a little earlier, the U.S. economy will return to full employment.
This optimism was reinforced by the announcement of a fiscal package worth US$1.9 trillion in 2021. This corresponds to 9% of GDP. To give you an idea of its size, according to a database that compiles fiscal packages around the world executed because of the pandemic, http://web.boun.edu.tr/elgin/COVID.htm, the U.S. Treasury has spent around 14% of GDP in this way, in the form of public spending, tax breaks and loan guarantees.
The combination of a robust fiscal package and normalization of the economy in the second half, due to vaccination, supports this more optimistic view for the American economy. I believe the greatest risk is that inflationary pressure may appear a little earlier than imagined. This is more likely than the economy falling into recession.
The United States economy and others in the Northern Hemisphere have been experiencing macroeconomic equilibrium close to the situation of secular stagnation: deflationary pressures are very strong and monetary policy alone cannot bring the economy to full employment.
The epidemic brought the missing justification for fiscal policy compatible with secular stagnation. The recovery of the American economy will be very different from the slow normalization of the labor market that we observed in the decade after the great global financial crisis of 2008.
IBRE In FocusChina: The flight of the dragon
Lívio Ribeiro
In the IBRE In Focus section in the October 2020 edition of IBRE’s Macro Bulletin, we stressed that despite a certain negative surprise with the GDP result in the third quarter of 2020, China was in a privileged position compared to other major global economies. Its institutional, social and economic characteristics supported a faster and more intense recovery from the shock of COVID-19. High savings, a more favorable sector composition (less services and more industry), stimulus aimed at “Old China” (credit, investment and construction) and greater tolerance for social control indicated that China would emerge from the crisis relatively faster and potentially stronger.

J a n u a r y 2021 | M a c r o B u l l e t i n 2 3
China’s recently released GDP results confirmed this expectation, with growth of 2.3% in 2020. Although this growth rate is the lowest since 1976, it was higher than market expectations (2.0%). China will be one of the very few economies – and the only major one – to have experienced growth during the most intense period of the pandemic. China’s GDP growth and key crises4 since 1976 are presented in the graph below.
Graph 12: Annual growth in Chinese GDP
-1,6
5,13,9
7,79,4
2,3
-4
-2
0
2
4
6
8
10
12
14
16
1976
1978
1980
1982
1984
1986
1988
1990
1992
1994
1996
1998
2000
2002
2004
2006
2008
2010
2012
2014
2016
2018
2020
Source: CEIC.
Undeniably, the “good” result in 2020 represented a return to “Old China,” at least for now. The transition to an economic model based on the domestic market and consumption was put on hold, not least due to the asymmetric sector impacts of COVID-19 (much more severe in consumption and services). When faced with difficulty, China’s rulers resorted to the tried-and-tested solution of incentives for investment, construction and the state sector, thereby removing the economy from its downward trajectory.
The importance of “Old China” stands out when we analyze the behavior of annual GDP growth from the perspective of demand. Investment’s contribution to growth was remarkable last year, accounting for practically the whole result. The external sector also made a significant contribution, equivalent to that recorded in 2019. On the other hand, there was a negative contribution from consumption (public and private sector). This result was clearly exceptional and never before seen since records began in 1978. The recent contribution of demand components can be seen in the following graph.
4The events were the following: (i) 1976: death of Mao Zedong and end of “Gang of Four” regime; (ii) 1981: initial period of adjustment under Deng Xiaoping; (iii) 1998/1999: Asian financial crisis; (iv) 2008/2009: global financial crisis; and (v) 2020: COVID-19 pandemic.

2 4 M a c r o B u l l e t i n | J a n u a r y 2021
Graph 13: Contribution to annual GDP growth – demand side
6,5 5,5 6,84,2 5,4 5,0 6,3
4,4 3,9 4,2 4,9 4,6 4,0 4,4 3,5
-0,5
3,8 5,46,3
5,1
8,06,7 3,9
3,3 4,1 3,3 1,6 3,12,6 2,8
1,9
2,2
1,11,8
1,1
0,3
-4,0 -1,1 -0,6
0,2
-0,3 -0,1
0,6
-0,8
0,3
-0,5
0,7
0,7
-8,0
-4,0
0,0
4,0
8,0
12,0
16,0
2005
2006
2007
2008
2009
2010
2011
2012
2013
2014
2015
2016
2017
2018
2019
2020
Total consumption Investment External sectorSource: NBS.
The prominence of “Old China” is also seen in the GDP results from the perspective of supply, albeit a little more indirectly. As can be seen in the graph below, the contributions of the secondary (industry and construction) and tertiary (services) sectors to growth in 2020 were practically identical, and in both cases much smaller than those recorded previously. The shift back to “Old China” took place in relative terms. The secondary sector’s contribution was comparatively much greater than that observed in the last five years, approaching the performance since before Xi Jinping came to power in 2012.
Graph 14: Contribution to annual GDP growth – supply side
5,7 6,4 7,04,6 4,7 5,9 5,0 3,8 3,5 3,1 2,3 2,3 2,3 2.3 1,9 1,0
5,15,9
6,9
4,5 4,34,3
4,23,7 3,9 4,0 4,3 4,2 4,3 4,2 3,8
1,1
0
2
4
6
8
10
12
14
16
2005
2006
2007
2008
2009
2010
2011
2012
2013
2014
2015
2016
2017
2018
2019
2020
Primary Secondary TertiarySource: NBS.
In addition to the annual data, the behavior of China’s GDP in 2020 warrants two additional comments. First, it is important to recognize that China has indeed managed to achieve a “V-shaped” recovery. On the one hand, it is true that it was unbalanced (as we have seen, with relative growth in “Old China”) and it reversed part of the structural process of economic transition. On the other hand, however, it was a complete recovery. In seasonally adjusted terms, Chinese GDP exceeded the pre-COVID-19 peak before the end of 2020.

J a n u a r y 2021 | M a c r o B u l l e t i n 2 5
Graph 15: Chinese GDP (quarterly index, seasonally adjusted, fourth quarter of 2010 = 100)
198.6
165
170
175
180
185
190
195
200
mar
-18
jun-
18
sep-
18
dec-
18
mar
-19
jun-
19
sep-
19
dec-
19
mar
-20
jun-
20
sep-
20
dec-
20
Source: NBS and own calculations.
Second, and implicit in the graph above, there was an important acceleration in annualized growth in the second half of 2020. This was particularly true in the fourth quarter, when GDP grew 6.5% year-over-year, surpassing market expectations of 6.2%. An overview of the annual expansion rates of the main components of GDP (on the supply side) can be seen in the table below.
Table 3: Annualized expansion rates in selected sectors
2019.Q4 2020.Q1 2020.Q2 2020.Q3 2020.Q4
Primary 3,4 -3,2 3,3 3,9 4,1
Second 5,8 -9,6 4,7 6,0 6,8
Manufacturing 5,9 -10,2 4,4 6,1 7,3
Construction 5,3 -17,5 7,8 8,1 6,6
Tertiary 6,6 -5,2 1,9 4,3 6,7
Transport and storage 6,3 -14,0 1,7 3,9 7,6
Commerce 5,4 -17,8 1,2 3,1 6,3
Accommodations and food 6,2 -35,3 -18,0 -5,1 2,7
Financial intermediation 7,0 6,0 7,2 7,9 7,0
Real estate activities 2,5 -6,1 4,1 6,3 6,7
Information technology 15,6 13,2 15,7 18,8 19,7
Leasing and miscellaneous commercial services 9,9 -9,4 -8,0 -6,9 2,2
Other services provided 6,0 -1,8 -0,9 2,3 4,5
GDP 6,0 -6,8 3,2 4,9 6,5
Source: NBS and CEIC.
Continuing with what had already been observed in the previous quarter, figures for the fourth quarter of 2020 showed a progressive normalization of activity and more homogeneous performance across sectors. Virtually all sectors and sub-sectors registered an acceleration in growth in the last quarter of 2020, with the

2 6 M a c r o B u l l e t i n | J a n u a r y 2021
notable exceptions of construction and financial intermediation, even though, in both cases, performance merely levelled off and it remained stronger than at the end of 2019.
Some specific results deserve additional comments. The 6.8% annualized expansion in the secondary sector was the strongest since the third quarter of 2014, mainly driven by 7.3% annualized growth in manufacturing. The tertiary sector grew 6.7% year-over-year at the end of 2020, resuming the speed observed at the end of 2019. This behavior is relevant if we remember that this sector experienced the deepest and most persistent impacts of COVID-19.
In conclusion, the GDP figures provided a lot of evidence of greater diffusion and robust acceleration of growth at the end of 2020. No subsector registered an annualized decline. This even applies to the tertiary sub-sectors most affected by the pandemic. Following sharp drops during most of 2020, the “accommodations and food” and “leasing and miscellaneous commercial services” groups returned to expansion, albeit at relatively low rates.
How will the 2020 results affect our predictions for 2021? We do not yet have any high-frequency information available for the beginning of this year, so our projections will naturally have a higher degree of inaccuracy. It is possible, however, to be sure that growth in 2021 will be strong, given that the comparative base is favorable and also because the strong acceleration in the second half of 2020 will cause an estimated carry over effect of 6.1 percentage points this year.
Our most recent projection, incorporating the 2020 results, indicates 9.2% growth in 2021 GDP. Our estimate is higher than the median market forecast (of just above 8.5%) and especially reflects a stronger result in the first half of the year (most notably estimated annualized growth of 18.2% in the first quarter of 2021, higher than analysts’ median rate of 17.5%).
Thus, our projection incorporates two very different dynamics for growth during 2021. In the first half of the year, the favorable comparative base should lead to average expansion of over 13.0% in relation to the first half of 2020. In the second half, we should see a normalization of growth rates, at least for the Chinese standard (average growth of just over 5.5% compared to the second half of 2019).
We always try to build our projections in a centered manner, with a balance of risks that involves both favorable and unfavorable factors. To help define these (conflicting) vectors, the behavior of key high-frequency activity indicators is relevant. An overview of this information in the second half of 2020 can be seen in the table below.
Tabela 4: Selected monthly indicators (year-over-year)
2020.Q3 2020.Q4
Jul Aug Sep Oct Nov Dec
Industrial production 4,8 5,6 6,9* 6,9 7,0 7,3*
Processing 6,0 6,0 7,6 7,5 7,7 7,7*
Extractive -2,6 1,6 2,2 3,5 2,0 4,9*
Retail (real)** -3,7 -1,9 1,6* 3,8 5,5 4,4*
Goods 0,2 1,5 4,1* 4,8 5,8 5,2*
Meals (food) -11,0 -7,2 -2,9* 0,8 -0,6 0,4*
Investment in fixed assets 6,0 7,6 7,6* 9,3 9,7 5,6*
New construction 11,3 2,4 -1,9* 3,5 4,1 6,3*
Real estate sales 9,5 13,7 7,3* 15,3 12,1 11,5*
Bank credit*** 23,3 14,1 9,9* 18,8 11,0 -0,9
Broad credit**** 31,4 63,4 38,3* 60,5 7,1 -21,9
* Variable published together with quarterly GDP . ** Real retail results deflated by CPI, including results for goods and food. *** Including loans in local and foreign currency. **** Total social financing, including banking and shadow banking operations.
Source: NBS and CEIC.

J a n u a r y 2021 | M a c r o B u l l e t i n 2 7
On the positive side, there was a clear acceleration in indicators for industrial production, construction, real retail and real estate sales in the last quarter of the year. Although the recovery has been uneven across sectors (stronger in industry and construction, not by chance associated with “Old China”), it is difficult not to argue that the turn of the year features some strong signals from main indicators of activity. The improvement in the economy’s momentum has increased the carry over for the beginning of 2021 and seems to guarantee significant growth at the beginning of the year, not least because the basis of comparison will be favorable. A more intense recovery in global demand, due to acceleration of mass vaccination, is another positive risk that should not be overlooked.
It should also be noted that China retains a considerable degree of freedom to accommodate a possible more intense slowdown in growth, if that is in its interest. Inflation remains low, with prices ending 2020 almost stable compared to the previous year. There is room for maneuver for further monetary easing if the situation demands it. Furthermore, the fiscal policy package used by China was more moderate than that observed in the vast majority of countries, and in an adverse event, there is scope for further growth in indebtedness (in the short term, given that rampant debt, already higher than 285% of GDP, places restrictions on that strategy in the medium term).
On the negative side, it should not be forgotten that there is clear evidence of a second wave of COVID-19 – the first global and, more timidly, also in China itself. This would tend to reduce the momentum of external demand and further delay the rebalancing of Chinese domestic consumption. Changes in U.S.-China relations should also be put into perspective. The Trump era is over, but strategic rivalry between the United States and China has only just begun.
More important, however, is what already appears in the last two lines of the table above. There was an evident deceleration in credit at the end of 2020, reflecting two consecutive shocks in the same direction. The first was of a regulatory nature and it was designed by the Chinese government at the end of the third quarter of 2020. Restrictions on the indebtedness of real estate developers, from a correct prudential perspective, discouraged the taking out of loans, the use of land as collateral for operations and the offering of non-bank instruments associated with the real estate market. There has been a slowdown in shadow banking loans taken out for 2021.
At the same time, we observed a significant deterioration in the functioning of the Chinese bond market in the last quarter of 2020, with a series of defaults in bonds of state-owned companies that cast doubts on the market’s smoothness, the government’s performance as “final guarantor” and the premiums demanded by final claimants. The cost of rolling over bonds has increased. If defaults get out of hand and a crisis of confidence occurs, we may see a disorganized slowdown in the credit market, affecting the banking, non-banking and interbank markets.
At least for now, the government has been able to contain pressure, maintain abundant liquidity and avoid contamination beyond the private credit market. We consider this to be the main asymmetry in China, and if this event were to happen, it would have unpredictable consequences. We also note that the comparative base of the credit market will be very unfavorable between the second and third quarters of 2021 (average annualized expansion of broad credit was 62.3% between March and August 2020).
In conclusion, there will clearly be Chinese decoupling in the 2020-2021 two-year period. In the central scenario, China will emerge from the COVID-19 shock relatively stronger, with even more importance to global growth and “flexed muscles” to impose its strategic agenda of growth in the value chain and projection of economic, financial and geopolitical power. This scenario has clear risks, but at least at this moment, it seems controlled and symmetrical. The Chinese dragon took off in 2020 and it will fly high in 2021.

Brazilian Institute of Economics
DirectorLuiz Guilherme Schymura de Oliveira
Deputy DirectorVagner Ardeo
Coordinator of Applied EconomicsArmando Castelar Pinheiro
IBRE’s Macro BulletinGeneral and Technical CoordinationSilvia Matos
Editorial RevisionFernando Dantas
Artwork EditingMarcelo Nascimento Utrine
Permanent TeamAloisio Campelo Jr.
André Braz
Armando Castelar Pinheiro
Daniel Duque
José Júlio Senna
Juliana Damasceno
Lia Valls Pereira
Lívio Ribeiro
Luana Miranda
Matheus Rosa Ribeiro
Samuel Pessôa
Viviane Seda
NoticeAll statements expressed by Fundação Getulio Vargas employe-es, in which they are identified as such, in articles and interviews published in the media in general, exclusively represent their opinions and not necessarily FGV’s institutional position.
This Bulletin was written on the basis of internal studies and using data and analyses produced by IBRE and other information of pu-blic knowledge, dated up to January 21, 2021. IBRE’s Macro Bulletin is aimed at clients and professional investors. IBRE cannot be held liable for any loss directly or indirectly arising from its usage or its content. It may not be reproduced, distributed or published by anyone, for any purpose.
We are an institution of a technical, scientific, educational and philanthropic nature, founded on December 20, 1944, as a legal entity subject to private law. Our purpose is to act in the field of the social sciences, particularly economics and administration, as well as to contribute to environmental protection and sustainable development.
Praia de Botafogo, 190 – CEP 22250-900 – Rio de Janeiro – RJCaixa Postal 62.591 – CEP 22257-970 – Tel.: (21) 3799-4747
First President and FounderLuiz Simões Lopes
PresidentCarlos Ivan Simonsen Leal
Vice Presidents: Francisco Oswaldo Neves Dornelles (licenciado), Marcos Cintra Cavalcanti de Albuquerque, Sergio Franklin Quintella
Board of DirectorsChairperson: Carlos Ivan Simonsen Leal
Deputy Chairpersons: Francisco Oswaldo Neves Dornelles (licenciado), Marcos Cintra Cavalcanti de Albuquerque
Board Members: Armando Klabin, Carlos Alberto Pires de Carvalho e Albuquerque, Cristiano Buarque Franco Neto, Ernane Galvêas, José Luiz Miranda, Lindolpho de Carvalho Dias, Marcílio Marques Moreira, Roberto Paulo Cezar de Andrade
Alternate Board Members: Aldo Floris, Antonio Monteiro de Castro Filho, Ary Oswaldo Mattos Filho, Eduardo Baptista Vianna, Gilberto Duarte Prado, José Ermírio de Moraes Neto, Marcelo José Basílio de Souza Marinho
Board of TrusteesChairperson: Carlos Alberto Lenz César Protásio
Deputy Chairperson: João Alfredo Dias Lins (Klabin Irmãos & Cia.)
Board Members: Alexandre Koch Torres de Assis, Jorge Irribarra (Souza Cruz S/A), Antonio Alberto Gouvêa Vieira, Carlos Eduardo de Freitas, Cid Heraclito de Queiroz, Eduardo M. Krieger, Estado da Bahia, Estado do Rio de Janeiro, Estado do Rio Grande do Sul, José Carlos Cardoso (IRB-Brasil Resseguros S.A), Luiz Chor, Luiz Ildefonso Simões Lopes, Marcelo Serfaty, Marcio João de Andrade Fortes, Miguel Pachá, Isaac Sidney Menezes Ferreira (Federação Brasileira de Bancos), Pedro Henrique Mariani Bittencourt, Ronaldo Vilela (Sindicato das Empresas de Seguros Privados, de Previdência Complementar e de Capitalização nos Estados do Rio de Janeiro e do Espírito Santo), Willy Otto Jordan Neto
Alternate Board Members: Almirante Luiz Guilherme Sá de Gusmão, Carlos Hamilton Vasconcelos Araújo, General Joaquim Maia Brandão Júnior, José Carlos Schmidt Murta Ribeiro, Leila Maria Carrilo Cavalcante Ribeiro Mariano, Luiz Roberto Nascimento Silva, Manoel Fernando Thompson Motta Filho, Solange Srour (Banco de Investimentos Crédit Suisse S.A), Olavo Monteiro de Carvalho (Monteiro Aranha Participações S.A), Patrick de Larragoiti Lucas (Sul América Companhia Nacional de Seguros), Ricardo Gattass, Rui Barreto
Brazilian Institute of EconomicsDirector: Luiz Guilherme Schymura de Oliveira
Deputy Director: Vagner Laerte Ardeo
Public Statistics Superintendent: Aloisio Campelo Junior
Infrastructure and Governmental Markets Superintendent: Túlio Barbosa
Innovation and Markets Superintendent: Pedro Guilherme Ferreira
Research, Data and Operations Superintendent: André Lavinas
Applied Economics Superintendent: Armando Castelar
Publications Superintendent: Claudio Roberto Gomes Conceição
Strategic and Organizational Management Superintendent: Joana Braconi

MacroBULLETIN