MACQUARIE GROUP MANAGEMENT DISCUSSION … · presentation and to reflect the ... not intended to be...
88
MACQUARIE GROUP LIMITED ACN 122 169 279 MACQUARIE GROUP MANAGEMENT DISCUSSION AND ANALYSIS YEAR ENDED 31 MARCH 2011
Transcript of MACQUARIE GROUP MANAGEMENT DISCUSSION … · presentation and to reflect the ... not intended to be...

MA
CQ
UA
RIE
GR
OU
P M
AN
AG
EM
EN
T DIS
CU
SS
ION
AN
D A
NA
LYS
IS
MACqUArIE GrOUP LIMITED ACN 122 169 279macquarie.com.au
MACQUARIE GROUP MANAGEMENT DISCUSSION AND ANALYSISYEAR ENDED 31 MARCH 2011

Macquarie Group Head OfficeNo.1 Martin PlaceSydney NSW 2000Australia
Tel: +61 2 8232 3333
Registered OfficeMacquarie Group LimitedLevel 7, No.1 Martin PlaceSydney NSW 2000Australia
Tel: +61 2 8232 3333Fax: +61 2 8232 4330
Des
igne
d by
Fro
st*D
esig
n
Prin
t m
anag
emen
t by
Oct
opus
Sol
utio
ns
The Holey DollarIn 1813 Governor Lachlan Macquarie overcame an acute currency shortage by purchasing Spanish silver dollars (then worth five shillings), punching the centres out and creating two new coins – the ‘Holey Dollar’ (valued at five shillings) and the ‘Dump’ (valued at one shilling and three pence).
This single move not only doubled the number of coins in circulation but increased their worth by 25 per cent and prevented the coins leaving the colony. Governor Macquarie’s creation of the Holey Dollar was an inspired solution to a difficult problem and for this reason it was chosen as the symbol for Macquarie Group.
The Macquarie name and Holey Dollar device are registered trade marks of Macquarie Group Limited.
Macquarie Group Limited Management Discussion and Analysis macquarie.com.au
Contents
1
1.0 Result overview 3 1.1 Result overview 3 2.0 Income statement analysis 5 2.1 Net interest income 5 2.2 Fee and commission income 7 2.3 Net trading income 10 2.4 Share of net profits/(losses) of associates and joint ventures 12 2.5 Other operating income and charges 13 2.6 Operating expenses 15 2.7 Headcount 16 2.8 Income tax expense 17 3.0 Segment analysis 18 3.1 Basis of preparation 18 3.2 Macquarie Securities 24 3.3 Macquarie Capital 26 3.4 Macquarie Funds 30 3.5 Fixed Income, Currencies and Commodities 33 3.6 Corporate and Asset Finance 36 3.7 Banking and Financial Services 38 3.8 Real Estate Banking 41 3.9 Corporate 43 3.10 International income 45 4.0 Balance sheet 46 4.1 Statutory consolidated balance sheet 46 4.2 Loan assets 49 4.3 Equity investments 50 4.4 Maturity analysis of monetary assets and liabilities 52 5.0 Funding and liquidity 53 5.1 Overview 53 5.2 Funded balance sheet 57 5.3 Funding profile for consolidated MGL Group 58 5.4 Funding profile for Banking Group 61 5.5 Funding profile for Non-Banking Group 65 5.6 Explanatory notes concerning funding sources and funded assets 68 6.0 Capital 69 6.1 Overview 69 6.2 Banking Group capital 70 6.3 Non-Banking Group capital 73 7.0 Funds management 75 7.1 Assets under Management 75 7.2 Equity under Management 76 8.0 Glossary 77 9.0 Ten year history 82
Macquarie Group Limited Management Discussion and Analysis macquarie.com.au
2
Notice to readers
Date of this report
This report has been prepared for the year ended 31 March 2011 and is current as at 29 April 2011.
Comparative information and conventions
Where necessary, comparative figures have been restated to conform with changes in current year financial presentation and to reflect the effect of group restructures.
References to the prior year are to the 12 months ended 31 March 2010.
References to the first half are to the six months ended 30 September 2010.
References to the second half are to the six months ended 31 March 2011.
In the financial tables throughout this document “*” indicates that the percentage change in the balance was not meaningful, including instances where the absolute percentage movement was greater than 300% or where the result was a gain in one period but a loss in another, or vice versa.
Independent auditor’s report
This document should be read in conjunction with the Macquarie Group Limited Financial Report for the year ended 31 March 2011, which was subject to independent audit by PricewaterhouseCoopers.
PricewaterhouseCoopers’ Independent Auditor’s report to the members of Macquarie Group Limited dated 29 April 2011 was unqualified.
Disclaimer
The material in this update has been prepared by Macquarie Group Limited ABN 94 122 169 279 (“Macquarie”) and is current at the date of this update. The material in this update is general background information about Macquarie’s activities, is given in summary form and does not purport to be complete. It is not intended to be relied upon as advice to investors or potential investors and does not take into account the investment objectives, financial situation or needs of any particular investor. These should be considered, with or without professional advice, when deciding if an investment is appropriate.

Macquarie Group Limited Management Discussion and Analysis macquarie.com.au
1.0 Result overview
3
1.1 Result overview
Half year to Full year to
Mar 11 $Am
Sep 10 $Am
Movement %
Mar 11 $Am
Mar 10 $Am
Movement %
Income statement
Net interest income 670 605 11 1,275 1,080 18 Fee and commission income 1,896 1,995 (5) 3,891 3,721 5 Net trading income 762 606 26 1,368 1,299 5 Share of net profits/(losses) of associates and joint ventures accounted for using the equity method 94 85 11 179 (230) * Other operating income and charges 561 370 52 931 768 21 Net operating income 3,983 3,661 9 7,644 6,638 15 Employment expenses (1,994) (1,896) 5 (3,890) (3,101) 25 Brokerage and commission expenses (344) (441) (22) (785) (645) 22 Occupancy expenses (246) (237) 4 (483) (482) <1 Non-salary technology expenses (157) (159) (1) (316) (283) 12 Other operating expenses (467) (432) 8 (899) (833) 8 Total operating expenses (3,208) (3,165) 1 (6,373) (5,344) 19 Operating profit before income tax 775 496 56 1,271 1,294 (2) Income tax expense (197) (85) 132 (282) (201) 40 Profit after income tax 578 411 41 989 1,093 (10) Profit attributable to non-controlling interests (25) (8) 213 (33) (43) (23) Profit attributable to ordinary equity holders of Macquarie Group Limited 553 403 37 956 1,050 (9)
Key metrics
Expense to income ratio (%) 80.5 86.5 83.4 80.5 Compensation ratio (%) 46.6 47.9 47.3 42.9 Effective tax rate (%) 26.3 17.4 22.8 16.1 Basic earnings per share (cents per share) 163.3 119.2 282.5 320.2 Diluted earnings per share (cents per share) 158.5 117.1 275.9 317.4 Dividends per share (cents per share) 100.0 86.0 186.0 186.0 Dividend payout ratio (%) 62.7 73.4 67.3 60.4 Annualised return on equity (%) 10.2 7.4 8.8 10.1
Profit attributable to ordinary equity holders of $A956 million for the year ended 31 March 2011 decreased 9% from $A1,050 million in the prior year. Net profit for the second half of the year of $A553 million increased 37% from $A403 million in the six months to 30 September 2010. Recently acquired businesses, including Sal. Oppenheim, Macquarie Private Wealth Canada and Delaware Investments, contributed to increases in both operating income and operating expenses.

Macquarie Group Limited Management Discussion and Analysis macquarie.com.au
1.0 Result overview continued
4
Net operating income of $A7,644 million for the year ended 31 March 2011 increased 15% from $A6,638 million in the prior year. The main drivers of this increase were:
– an 18% increase in net interest income to $A1,275 million for the year ended 31 March 2011 from $A1,080 million in the prior year driven by an increase in corporate lending volumes, recent acquisitions of leasing portfolios and improved margins;
– equity accounted income from investments in associates and joint ventures of $A179 million for the year ended 31 March 2011, up from a net loss of $A230 million in the prior year driven by an improvement in the underlying results of investments. In addition, the prior year included equity accounted losses of $A82 million relating to fees paid by MAp Group, Southern Cross Media Group and Macquarie Infrastructure Group to terminate management agreements with Macquarie; and
– a 21% increase in other operating income to $A931 million for the year ended 31 March 2011 from $A768 million in the prior year driven by a 76% increase in net operating lease income from $A138 million in the prior year to $A243 million for the year ended 31 March 2011 and a significant increase in dividends/distributions received/receivable on investment securities available for sale from $A22 million in the prior year to $A126 million for the year ended 31 March 2011. In addition, there was a significant reduction in write-downs and impairment charges from a net expense of $A686 million for the prior year to a net expense of $A258 million for the year ended 31 March 2011.
Total operating expenses of $A6,373 million for the year ended 31 March 2011 increased 19% from $A5,344 million in the prior year. The increase was largely driven by:
– a 25% increase in employment expenses to $A3,890 million for the year ended 31 March 2011 from $A3,101 million in the prior year, which was due to the full year impact of acquisitions that contributed to a 17% increase in average headcount. The increase in employment expenses resulted in a compensation ratio of 47.3% for the year ended 31 March 2011, up from 42.9% in the prior year; and
– a 22% increase in brokerage and commission expenses to $A785 million from $A645 million in the prior year mainly due to the full year contribution of Delaware Investments.
Income tax expense for the year ended 31 March 2011 of $A282 million increased 40% from $A201 million in the prior year mainly as a result of reduced levels of writedowns and impairment charges. The effective tax rate of 22.8% for the year ended 31 March 2011 increased from 16.1% in the prior year.

2.0 Income statement analysis
5
2.1 Net interest income
Half year to Full year to Mar 11
$Am Sep 10
$Am Movement
% Mar 11
$Am Mar 10
$Am Movement
%
Interest revenue 2,667 2,637 1 5,304 4,591 16 Interest expense (1,997) (2,032) (2) (4,029) (3,511) 15 Net interest income (as reported) 670 605 11 1,275 1,080 18 Adjustment for accounting for swaps1 (41) (4) * (45) (117) (62) Adjusted net interest income 629 601 5 1,230 963 28
1 Australian Accounting Standards require derivatives hedging interest rate risk to be carried at fair value through trading income unless they form part of a qualifying hedge relationship. This distorts the analysis of net interest income and trading income in each operating group. To assist in the analysis of net interest margins, the impact of accounting for swaps used to economically hedge interest rate risk that is included in trading income for statutory purposes, has been adjusted against net interest income above.
Adjusted net interest income was $A1,230 million for the year ended 31 March 2011, up 28% from $A963 million in the prior year. The main drivers of the increase were improved margins and continued growth of the lending and finance leasing portfolio, including the acquisition of the GMAC portfolio in April 2010, and the full year impact of the acquisition of the Ford Credit portfolio in October 2009.
The table below provides further details of adjusted net interest income.
Analysis of net interest margins
Full year to Mar 11 Full year to Mar 10
Interest $Am
Average volume
$Am
Average spread
% Interest
$Am
Average volume
$Am
Average spread
% Mortgages 188 21,766 0.86% 183 22,399 0.82% Other lending areas 929 25,299 3.67% 680 23,113 2.94% Total net interest margin from interest bearing assets 1,117 47,065 2.37% 863 45,512 1.90% Other net interest income 113 100 Adjusted net interest income 1,230 963

Macquarie Group Limited Management Discussion and Analysis macquarie.com.au
2.0 Income statement analysis continued
6
Mortgages
Net interest income from mortgage assets of $A188 million is up 3% from $A183 million in the prior year. Average margins increased from 82 basis points in the prior year to 86 basis points in the year ended 31 March 2011. The impact of increased margins was partially offset by a reduction in average mortgage volumes which decreased 3% from $A22.4 billion at 31 March 2010 to $A21.8 billion at 31 March 20111
Other lending areas
resulting from run-off of the Australian residential mortgage portfolio and the impact of the stronger Australian Dollar on the Canadian mortgage portfolio.
Net interest income from other lending areas increased 37% from $A680 million in the prior year to $A929 million in the year ended 31 March 2011 largely as a result of average margins increasing from 294 basis points in the prior year to 367 basis points in the year ended 31 March 2011. This was largely due to a change in the product mix, including an increase in higher yielding loans and finance leases within Corporate and Asset Finance. Overall, average volumes have increased 9% to $A25.3 billion at 31 March 2011 from $A23.1 billion in the prior year. The growth in the Corporate and Asset Finance loan and finance lease portfolio, including the acquisition of the GMAC portfolio in April 2010, has been partially offset by a decrease in real estate loans and structured finance loans.
Other net interest income
Other net interest income includes earnings on capital offset by costs associated with excess liquidity and the funding cost of non-interest bearing assets. Other net interest income of $A113 million for the year ended 31 March 2011 increased 13% from $A100 million in the prior year. The movement was mainly due to an increased earnings base and a decrease in the Government guarantee fee resulting from reduced deposits subject to the guarantee. This was partially offset by the increase in the cost of funding non-interest bearing assets.
1 At 31 March 2011 $A8.8 billion (31 March 2010: $A11.2 billion) of the Australian mortgage portfolio was funded by third parties through external securitisations.

7
2.2 Fee and commission income
Half year to Full year to Mar 11
$Am Sep 10
$Am Movement
% Mar 11
$Am Mar 10
$Am Movement
%
Base fees 454 496 (8) 950 926 3 Performance fees 21 15 40 36 57 (37) Mergers and acquisitions, advisory and underwriting fees 529 402 32 931 1,085 (14) Brokerage and commissions 555 582 (5) 1,137 1,077 6 Other fee and commission income 300 454 (34) 754 532 42 Income from life investment contracts and other unit holder investment assets 37 46 (20) 83 44 89 Total fee and commission income 1,896 1,995 (5) 3,891 3,721 5
Total fee and commission income of $A3,891 million for the year ended 31 March 2011 increased 5% from $A3,721 million in the prior year largely due to the full year contribution of Delaware Investments to base fees and other fee and commission income.
Base and performance fees
Base fees of $A950 million for the year ended 31 March 2011 increased 3% from $A926 million in the prior year. This increase was driven by the full year impact of the acquisition of Delaware Investments, which increased Assets under Management (AUM) by $A151 billion in January 2010, reduced by the impact of the conversion of Cash Management Trust (CMT) to Cash Management Accounts (CMA) in July 2010, decreasing AUM by $A9.6 billion; the internalisation of certain Macquarie Infrastructure and Real Assets (MIRA) funds in the prior year; and the adverse impact of a stronger Australian Dollar on AUM denominated in foreign currencies. For further details of Assets under Management refer to Section 7.1.
Performance fees of $A36 million for the year ended 31 March 2011 decreased 37% from $A57 million in the prior year. The prior year included $A34 million from the sale of the Kukdong building by Macquarie Central Office CR-REIT.

Macquarie Group Limited Management Discussion and Analysis macquarie.com.au
2.0 Income statement analysis continued
8
The table below provides more detail on base and performance fees. Refer to Section 3 for a discussion of base and performance fees by operating group.
Half year to Full year to Mar 11
$Am Sep 10
$Am Movement
% Mar 11
$Am Mar 10
$Am Movement
%
Base fees Macquarie Funds Macquarie Investment Management 252 250 1 502 210 139 Macquarie Infrastructure and Real Assets 170 181 (6) 351 463 (24) Macquarie Specialist Investment Solutions 10 10 — 20 24 (17) Total Macquarie Funds 432 441 (2) 873 697 25 Other Operating Groups 22 55 (60) 77 229 (66) Total base fee income 454 496 (8) 950 926 3
Performance fees Macquarie Funds Macquarie Investment Management 11 7 57 18 9 100 Macquarie Infrastructure and Real Assets 4 8 (50) 12 12 — Macquarie Specialist Investment Solutions — — * — 1 (100) Total Macquarie Funds 15 15 — 30 22 36 Other Operating Groups 6 — * 6 35 (83) Total performance fee income 21 15 40 36 57 (37)
9
Mergers and acquisitions, advisory and underwriting fees
Mergers and acquisitions, advisory and underwriting fees of $A931 million for the year ended 31 March 2011 decreased 14% from $A1,085 million in the prior year reflecting lower levels of activity, especially in equity capital markets. Refer to Section 3.3 Macquarie Capital for details of significant transactions for the year ended 31 March 2011.
Brokerage and commissions
Brokerage and commissions income of $A1,137 million for the year ended 31 March 2011 increased 6% from $A1,077 million in the prior year mainly due to the acquisition by Banking and Financial Services of Macquarie Private Wealth Canada in December 2009, improving market conditions globally and increased brokerage revenues in the Fixed Income, Currencies and Commodities (FICC) futures execution and clearing markets.
Brokerage and commissions income from Macquarie Securities was broadly in line with the prior year. The Americas and Europe continued to grow, benefiting from recent acquisitions including Sal. Oppenheim in April 2010 and Fox-Pitt Kelton Group (FPK) in November 2009. This was offset by lower commissions in Asia and Australia due to reduced client activity as well as Asian revenues being negatively impacted by the stronger Australian Dollar.
Other fee and commission income
Other fee and commission income of $A754 million for the year ended 31 March 2011 increased 42% from $A532 million in the prior year. This increase was mainly due to distribution service fees in the Delaware Investments business, which offset with associated expenses that, for accounting purposes, are recognised in brokerage and commissions expense.
There has also been an increase in platform fees from higher average Wrap Funds under Administration compared to the prior year and the growth of the Macquarie Professional Series. The average Australian Wrap platform volumes during the year ended 31 March 2011 increased 6% on the prior year and Funds under Administration in the Macquarie Professional Series grew by 28%.
Income from life investment contracts and other unit holder investment assets
Income from life investment contracts and other unit holder investment assets of $A83 million for the year ended 31 March 2011 increased 89% from $A44 million in the prior year largely as a result of growth in the insurance inforce book. The inforce book is the aggregate annualised life insurance premium payable for policies issued by the life company, and still paying premiums, at the balance date.
Macquarie Group Limited Management Discussion and Analysis macquarie.com.au
2.0 Income statement analysis continued
10
2.3 Net trading income
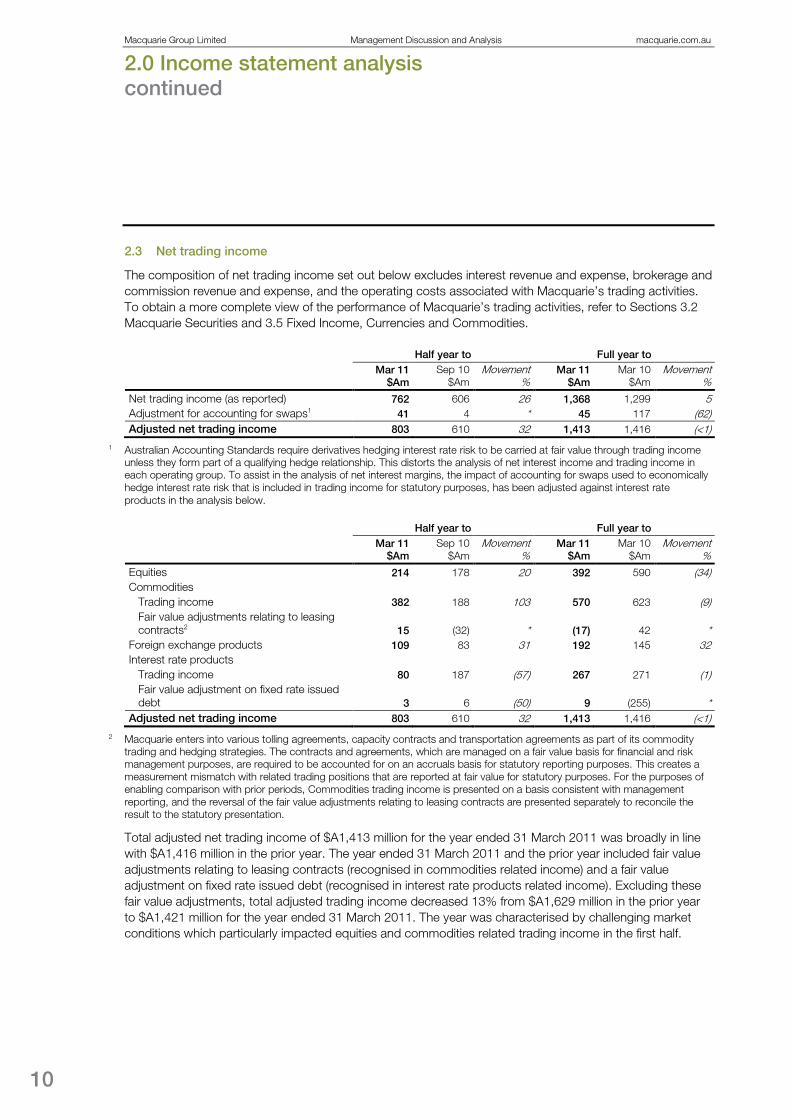
The composition of net trading income set out below excludes interest revenue and expense, brokerage and commission revenue and expense, and the operating costs associated with Macquarie’s trading activities. To obtain a more complete view of the performance of Macquarie’s trading activities, refer to Sections 3.2 Macquarie Securities and 3.5 Fixed Income, Currencies and Commodities.
Half year to Full year to Mar 11
$Am Sep 10
$Am Movement
% Mar 11
$Am Mar 10
$Am Movement
%
Net trading income (as reported) 762 606 26 1,368 1,299 5 Adjustment for accounting for swaps1 41 4 * 45 117 (62) Adjusted net trading income 803 610 32 1,413 1,416 (<1)
1 Australian Accounting Standards require derivatives hedging interest rate risk to be carried at fair value through trading income unless they form part of a qualifying hedge relationship. This distorts the analysis of net interest income and trading income in each operating group. To assist in the analysis of net interest margins, the impact of accounting for swaps used to economically hedge interest rate risk that is included in trading income for statutory purposes, has been adjusted against interest rate products in the analysis below.
Half year to Full year to Mar 11
$Am Sep 10
$Am Movement
% Mar 11
$Am Mar 10
$Am Movement
% Equities 214 178 20 392 590 (34) Commodities
Trading income 382 188 103 570 623 (9) Fair value adjustments relating to leasing contracts2 15 (32) * (17) 42 *
Foreign exchange products 109 83 31 192 145 32 Interest rate products
Trading income 80 187 (57) 267 271 (1) Fair value adjustment on fixed rate issued debt 3 6 (50) 9 (255) *
Adjusted net trading income 803 610 32 1,413 1,416 (<1)
2 Macquarie enters into various tolling agreements, capacity contracts and transportation agreements as part of its commodity trading and hedging strategies. The contracts and agreements, which are managed on a fair value basis for financial and risk management purposes, are required to be accounted for on an accruals basis for statutory reporting purposes. This creates a measurement mismatch with related trading positions that are reported at fair value for statutory purposes. For the purposes of enabling comparison with prior periods, Commodities trading income is presented on a basis consistent with management reporting, and the reversal of the fair value adjustments relating to leasing contracts are presented separately to reconcile the result to the statutory presentation.
Total adjusted net trading income of $A1,413 million for the year ended 31 March 2011 was broadly in line with $A1,416 million in the prior year. The year ended 31 March 2011 and the prior year included fair value adjustments relating to leasing contracts (recognised in commodities related income) and a fair value adjustment on fixed rate issued debt (recognised in interest rate products related income). Excluding these fair value adjustments, total adjusted trading income decreased 13% from $A1,629 million in the prior year to $A1,421 million for the year ended 31 March 2011. The year was characterised by challenging market conditions which particularly impacted equities and commodities related trading income in the first half.

11
Equities
Trading income from equities of $A392 million for the year ended 31 March 2011 decreased 34% from $A590 million in the prior year. The decrease was driven by challenging market conditions which impacted revenue throughout the year, particularly in the first half.
Retail and institutional product revenues were down across all regions with the exception of Europe which benefited from the acquisition of Sal. Oppenheim in April 2010. However, leading market share was maintained in core Asian markets. Arbitrage trading continued to make a strong contribution. Reduced volatility and liquidity in equities markets, especially in the first half, adversely impacted trading income.
The second half of the 2011 financial year provided some improvement over the first half with trading income from equities for the six months ended 31 March 2011 of $A214 million, up 20% from $A178 million in the six months ended 30 September 2010.
Commodities
Commodities trading income of $A570 million for the year ended 31 March 2011 decreased 9% from $A623 million for the prior year. Challenging trading conditions and lower client term hedging activity in some commodities markets during the year ended 31 March 2011 negatively impacted trading revenues, particularly in the first half. Energy markets occasionally experienced more difficult trading conditions with periods when the market moved away from fundamentals resulting in reduced income compared to the prior year.
Commodities trading income improved in the second half of the 2011 financial year with income of $A382 million for the six months ended 31 March 2011, up 103% from $A188 million in the six months to 30 September 2010. In metals and agricultural markets, client activity in term hedging improved in the second half of the year after a sporadic first half. Global weather events and geopolitical unrest in the Middle East led to significant volatility in a number of commodities markets during the year. Northern hemisphere energy revenues were stronger in the second half of the year reflecting the seasonal nature of the energy market.
Foreign exchange products
Trading income on foreign exchange products of $A192 million for the year ended 31 March 2011 increased 32% from $A145 million in the prior year, however the total net income from trading activities relating to foreign exchange products, including net interest income/expense, was down. Global volatility in currency markets remained suppressed and the higher Australian Dollar impacted the level of client term hedging. Together with some margin compression this had a negative impact on total net income from trading activities. Refer to Section 3.5 Fixed Income, Currencies and Commodities for further information.
Interest rate products
Trading income on interest rate products of $A267 million for the year ended 31 March 2011 was broadly in line with $A271 million in the prior year. Income in the year ended 31 March 2011 included gains on the sale of fixed rate bonds from the liquid assets portfolio by Group Treasury. These gains are offset by lower levels of income in FICC. Although FICC’s base of offerings has been expanded in the US and Asia over the last twelve months, income for the year ended 31 March 2011 is down, reflecting lower levels of client activity. The prior year was characterised by strong rallies in credit markets globally post the financial crisis, yielding strong returns in FICC’s interest rate related businesses.
Macquarie Group Limited Management Discussion and Analysis macquarie.com.au
2.0 Income statement analysis continued
12
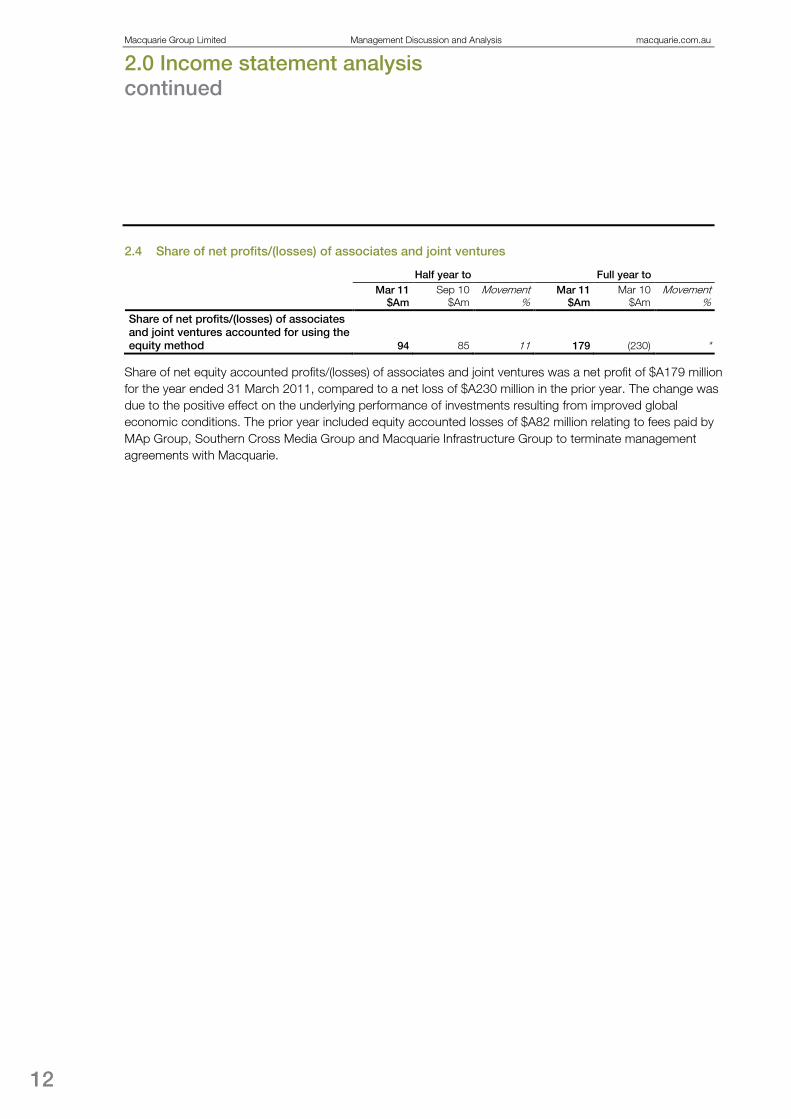
2.4 Share of net profits/(losses) of associates and joint ventures
Half year to Full year to Mar 11
$Am Sep 10
$Am Movement
% Mar 11
$Am Mar 10
$Am Movement
%
Share of net profits/(losses) of associates and joint ventures accounted for using the equity method 94 85 11 179 (230) *
Share of net equity accounted profits/(losses) of associates and joint ventures was a net profit of $A179 million for the year ended 31 March 2011, compared to a net loss of $A230 million in the prior year. The change was due to the positive effect on the underlying performance of investments resulting from improved global economic conditions. The prior year included equity accounted losses of $A82 million relating to fees paid by MAp Group, Southern Cross Media Group and Macquarie Infrastructure Group to terminate management agreements with Macquarie.

13
2.5 Other operating income and charges
Half year to Full year to Mar 11
$Am Sep 10
$Am Movement
% Mar 11
$Am Mar 10
$Am Movement
% Net gains on sale of investment securities available for sale 124 105 18 229 96 139 Impairment charge on investment securities available for sale (35) (3) * (38) (77) (51) Net gains on sale of associates (including associates held for sale) and joint ventures 10 9 11 19 50 (62) Impairment charge on investments in associates and joint ventures1 (23) (46) (50) (69) (357) (81) Impairment charge on disposal groups held for sale (16) — * (16) — * Gain on acquiring, disposing and change in ownership interest in subsidiaries, associates and businesses held for sale 63 33 91 96 393 (76) Gain on re-measurement of retained investments2 15 114 (87) 129 — * Impairment charge on non-financial assets (3) (4) (25) (7) (36) (81) Sale of management rights 14 — * 14 428 (97) Gain on repurchase of subordinated debt — — * — 55 (100) Net operating lease income3 167 76 120 243 138 76 Dividends/distributions received/receivable:
Investment securities available for sale 60 66 (9) 126 22 * Collective allowance for credit losses written back/(provided for) during the financial year (4) 9 * 5 2 150 Specific provisions (47) (86) (45) (133) (218) (39) Other income 236 97 143 333 272 22 Total other operating income and charges 561 370 52 931 768 21
1 Includes impairment reversals of $A10 million (31 March 2010: $A43 million). 2 Includes gains on re-measurement of retained ownership interests to fair value on the loss of control of investments in
subsidiaries and the loss of significant influence on investments in associates. 3 Includes rental income of $A401 million (31 March 2010: $A370 million) less depreciation of $A158 million (31 March 2010:
$A232 million) in relation to operating leases where the Consolidated Entity is the lessor.
Other operating income and charges was a net gain of $A931 million for the year ended 31 March 2011, an increase of 21% from $A768 million in the prior year.
Net gains on sale of investment securities available for sale of $A229 million for the year ended 31 March 2011 increased significantly from $A96 million in the prior year. The year ended 31 March 2011 included realisations of some investments in resource markets, particularly in the gold sector, and the sale of some debt securities held for liquidity management purposes by Group Treasury.
Impairment charges on investment securities available for sale, associates, disposal groups held for sale and non-financial assets totalled $A130 million in the year ended 31 March 2011, down 72% from $A470 million in the prior year. Lower impairment charges on Macquarie’s co-investments during the period compared to the prior year resulted from a stabilisation of global markets and improved operating conditions.

Macquarie Group Limited Management Discussion and Analysis macquarie.com.au
2.0 Income statement analysis continued
14
Gains on acquiring, disposing and change in ownership interests in subsidiaries, associates and businesses held for sale for the year ended 31 March 2011 was $A96 million, down 76% from $A393 million in the prior year. The year ended 31 March 2011 included $A33 million from the sale of Macquarie Asset Leasing Trust and $A23 million from the partial sell-down of ownership in the OzForex group of companies (OzForex). The prior year result included a gain of $A127 million from the financing of £157.5 million of Macquarie Income Preferred Securities, income from the sale of Macquarie Communications Infrastructure Management Limited and income from the sale of the majority of the real estate funds platform to Charter Hall Group.
Gains on reclassification of retained investments of $A129 million in the year ended 31 March 2011 includes gains from the reclassification of investments in MAp Group and OzForex to available for sale investments. On reclassification the retained stakes were required to be remeasured to fair value and the gain recognised in the income statement.
The gain on sale of management rights of $A14 million in the year ended 31 March 2011 relates to the sale of management rights in Macquarie Power and Infrastructure Corporation. The income of $A428 million in the prior year comprised $A345 million from Macquarie Airports, $A42 million from Macquarie Infrastructure Group and $A41 million from Macquarie Media Group.
Net operating lease income of $A243 million for the year ended 31 March 2011 increased 76% from $A138 million in the prior year mainly due to the acquisition by Corporate and Asset Finance of aircraft assets and associated operating leases from American International Group’s International Lease Finance Corporation (ILFC) throughout the year.
Dividends/distributions received/receivable on investment securities available for sale were $A126 million in the year ended 31 March 2011, increasing significantly from $A22 million in the prior year. The increase was largely attributable to distributions received from MAp Group subsequent to its reclassification from an investment in associate to an available for sale investment.
Net charges for specific and collective provisions of $A128 million in the year ended 31 March 2011 decreased 41% from $A216 million in the prior year, reflecting improved market and economic conditions.
Other income of $A333 million for the year ended 31 March 2011 increased 22% from $A272 million in the prior year largely due to the sale of net profit interests and royalties from participants in the metals and energy sectors.

15
2.6 Operating expenses
Half year to Full year to Mar 11
$Am Sep 10
$Am Movement
% Mar 11
$Am Mar 10
$Am Movement
%
Employment expenses Salary, commissions, superannuation and performance-related profit share (1,673) (1,596) 5 (3,269) (2,595) 26 Share based payments (181) (125) 45 (306) (224) 37 Provision for annual leave (4) (25) (84) (29) (21) 38 Provision for long service leave — (8) (100) (8) (8) —
Total compensation expense (1,858) (1,754) 6 (3,612) (2,848) 27 Other employment expenses including on-costs, staff procurement and staff training (136) (142) (4) (278) (253) 10 Total employment expenses (1,994) (1,896) 5 (3,890) (3,101) 25 Brokerage and commission expenses (344) (441) (22) (785) (645) 22 Occupancy expenses (246) (237) 4 (483) (482) <1 Non-salary technology expenses (157) (159) (1) (316) (283) 12 Professional fees (163) (133) 23 (296) (287) 3 Travel and entertainment expenses (92) (92) — (184) (160) 15 Advertising and communication expenses (66) (61) 8 (127) (99) 28 Other expenses (146) (146) — (292) (287) 2 Total operating expenses (3,208) (3,165) 1 (6,373) (5,344) 19
Total operating expenses of $A6,373 million for the year ended 31 March 2011 increased 19% from $A5,344 million in the prior year predominantly due to increases in employment expenses and brokerage and commission expenses reflecting the investment in and expansion of global platforms.
Employment expenses of $A3,890 million for the year ended 31 March 2011 increased 25% from $A3,101 million in the prior year mainly due to a 17% increase in average headcount during the year.
Brokerage and commission expenses of $A785 million increased 22% from $A645 million in the prior year. The increase in brokerage and commission expenses was mainly due to the full year contribution of Delaware Investments which was acquired in January 2010. The brokerage and commission expenses for Delaware Investments largely offsets with related distribution service fee income that, for accounting purposes, is required to be recognised in other fee and commission income (refer to Section 2.2 for further information).
Non-salary technology expenses of $A316 million for the year ended 31 March 2011 increased 12% from $A283 million in the prior year mainly due to increased investment in technology platforms, especially in Macquarie Securities and FICC.
Macquarie Group Limited Management Discussion and Analysis macquarie.com.au
2.0 Income statement analysis continued
16
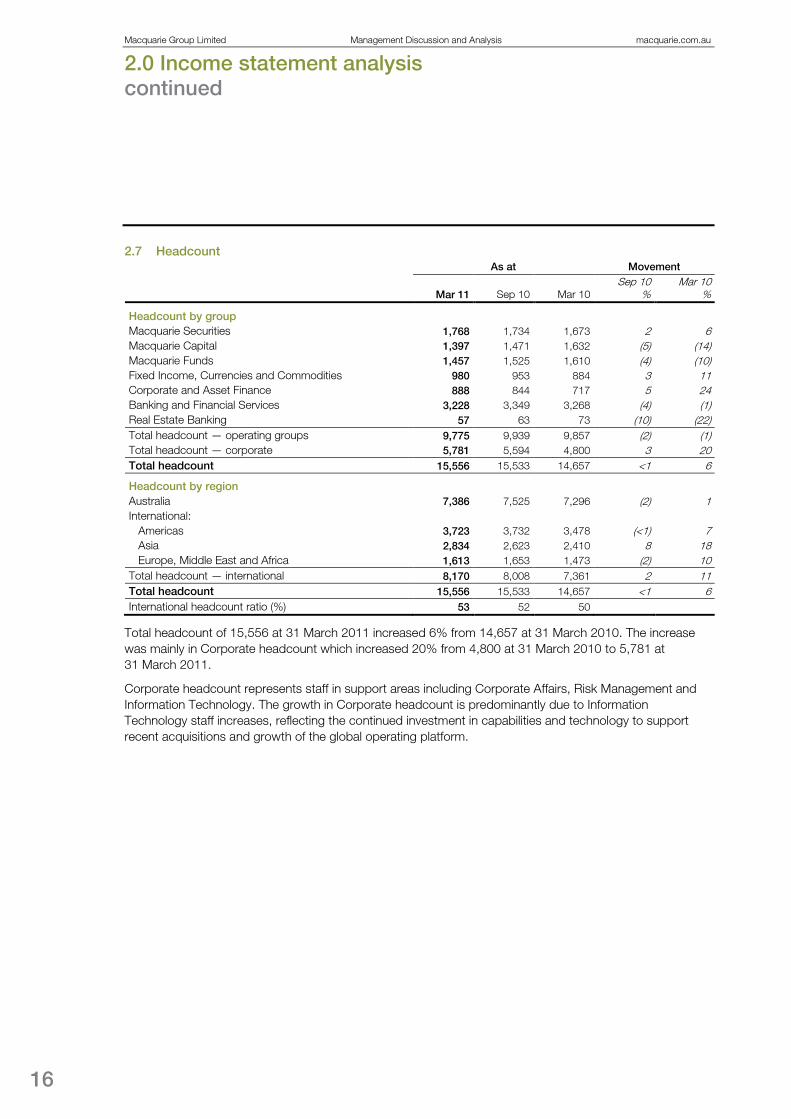
2.7 Headcount
As at Movement
Mar 11 Sep 10 Mar 10 Sep 10
% Mar 10
%
Headcount by group Macquarie Securities 1,768 1,734 1,673 2 6 Macquarie Capital 1,397 1,471 1,632 (5) (14) Macquarie Funds 1,457 1,525 1,610 (4) (10) Fixed Income, Currencies and Commodities 980 953 884 3 11 Corporate and Asset Finance 888 844 717 5 24 Banking and Financial Services 3,228 3,349 3,268 (4) (1) Real Estate Banking 57 63 73 (10) (22) Total headcount — operating groups 9,775 9,939 9,857 (2) (1) Total headcount — corporate 5,781 5,594 4,800 3 20 Total headcount 15,556 15,533 14,657 <1 6
Headcount by region Australia 7,386 7,525 7,296 (2) 1 International:
Americas 3,723 3,732 3,478 (<1) 7 Asia 2,834 2,623 2,410 8 18 Europe, Middle East and Africa 1,613 1,653 1,473 (2) 10
Total headcount — international 8,170 8,008 7,361 2 11 Total headcount 15,556 15,533 14,657 <1 6 International headcount ratio (%) 53 52 50
Total headcount of 15,556 at 31 March 2011 increased 6% from 14,657 at 31 March 2010. The increase was mainly in Corporate headcount which increased 20% from 4,800 at 31 March 2010 to 5,781 at 31 March 2011.
Corporate headcount represents staff in support areas including Corporate Affairs, Risk Management and Information Technology. The growth in Corporate headcount is predominantly due to Information Technology staff increases, reflecting the continued investment in capabilities and technology to support recent acquisitions and growth of the global operating platform.

17
2.8 Income tax expense Full year to
Mar 11
$Am Mar 10
$Am
Net profit before tax 1,271 1,294 Add back: write-downs, impairment charges and equity accounted gains/(losses) 79 854 Net profit before write-downs, impairment charges, equity accounted gains/(losses) and tax 1,350 2,148
Prima facie tax @ 30% 405 644 Income tax permanent differences (99) (187) Income tax expense (before impact of write-downs, impairment charges and equity accounted gains/(losses)) 306 457 Implied effective tax rate (%)1 23% 22%
Prima facie tax of write-downs, impairment charges and equity accounted gains/(losses) @ 30% (24) (256) Income tax expense 282 201 Actual effective tax rate (%)1 23% 16%
1 The effective tax rate is calculated on net profit before tax and after non-controlling interests. Non-controlling interests reduce net profit before tax by $A33 million for the year ended 31 March 2011 (31 March 2010: $A43 million).
The effective tax rate for the year ended 31 March 2011 was 23%, up from 16% in the prior year, largely due to reduced write-downs and impairment charges in the year ended 31 March 2011 compared to the prior year and a reduction in income tax permanent differences compared to the prior year.
The implied effective tax rate before the impact of write-downs and impairment charges is comparable to the prior year.

Macquarie Group Limited Management Discussion and Analysis macquarie.com.au
3.0 Segment analysis
18
3.1 Basis of preparation
AASB 8 ‘Operating Segments’ requires the ‘management approach’ to disclosing information about Macquarie’s reportable segments. The financial information is reported on the same basis as used internally by senior management for evaluating operating segment performance and for deciding how to allocate resources to operating segments. Such information is produced using different measures to those used in preparing the income statement.
For internal reporting and risk management purposes, Macquarie is divided into six operating groups and one division (generally referred to as “the Operating groups”).
Operating groups: – Macquarie Securities – Macquarie Capital – Macquarie Funds – Fixed Income, Currencies and Commodities – Corporate and Asset Finance – Banking and Financial Services
Division: – Real Estate Banking
In addition, there is a Corporate segment which includes Group Treasury, head office and central support functions. Items of income and expense within the Corporate segment include the net impact of managing liquidity for Macquarie, earnings on capital, non-trading derivative volatility, unallocated head office costs and employment related costs of central support functions (service areas), performance related profit share and share based payments expense, income tax expense and distributions to holders of CPS, MIS and MIPS.
Operating group restructures
Since 31 March 2010 there have been two significant restructures of operating groups and divisions. The restructures are effective from 1 April 2010, and comparative information presented in this document has been restated to reflect the current Group structure. – MIRA (formerly Macquarie Capital Funds) – this division of Macquarie Capital was transferred to
Macquarie Funds. – Real Estate Structured Finance (RESF) – this division of Real Estate Banking was transferred to
Corporate and Asset Finance.
Internal transactions
Any transactions or transfers between segments are determined on an arm’s length basis and are included within the relevant categories of income and/or expense. These transactions eliminate on aggregation/ consolidation. Over the page is a selection of the key policies.

19
Internal funding arrangements
Group Treasury has the responsibility for managing the overall funding for the Group, and operating groups obtain funding from Group Treasury. The interest rates charged by Group Treasury are determined by the types of assets being funded and the term of the funding, and are fully costed.
Operating Groups may only source funding directly from external sources generally when there is recourse only to the assets being funded and not to the Group.
Deposits are a funding source for Macquarie. Banking and Financial Services receives a deposit premium from Group Treasury on deposits they generate. This deposit premium is included within net interest income for segment reporting purposes.
Transactions between Operating groups
Operating Groups that enter into arrangements with other Operating groups must do so on an arm’s length basis. There is a requirement for accounting symmetry in such transactions.
Transactions between Operating groups are recognised in each of the relevant categories of income and expense as appropriate.
Service area recoveries
Service areas recover their costs to operating groups on either a time and effort allocation basis or a fee for service basis. Service areas include Corporate Affairs (Finance, Market Operations, Tax, Company Secretarial, Human Resources, Business Services, Corporate Communications and Investor Relations), Risk Management, Information Technology, Group Legal and Central Executive.
Service area recoveries are recognised within Other operating expenses in the income statement.
Internal management revenue/charges
Internal management revenue/charges are primarily used to recognise an Operating Group’s contribution to income tax expenses and benefits. Non-assessable income generated by an Operating Group results in a benefit added to that group’s operating result. Conversely a non-deductible expense results in a charge to the operating result. These management charges are offset by an equal and opposite amount recognised in the Corporate segment such that on aggregation the total nets to nil.
Internal management revenue/charges are reported separately in the income statement of each Operating group.
Presentation of segment income statements
The income statements in the following pages for each of the reported segments are in some cases summarised by grouping non-material balances together. All material or key balances have been reported separately to provide users with the most relevant information.
Macquarie Group Limited Management Discussion and Analysis macquarie.com.au
3.0 Segment analysis continued
20
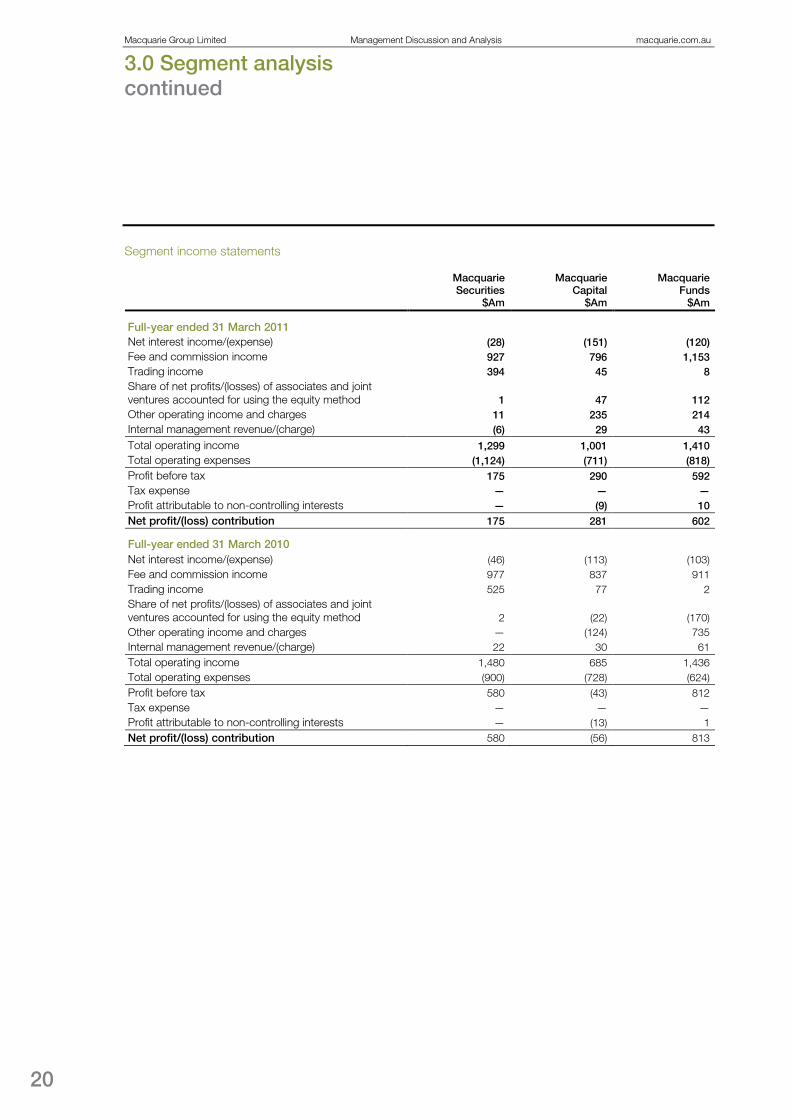
Segment income statements
Macquarie Securities
$Am
Macquarie Capital
$Am
Macquarie Funds
$Am
Full-year ended 31 March 2011 Net interest income/(expense) (28) (151) (120) Fee and commission income 927 796 1,153 Trading income 394 45 8 Share of net profits/(losses) of associates and joint ventures accounted for using the equity method 1 47 112 Other operating income and charges 11 235 214 Internal management revenue/(charge) (6) 29 43
Total operating income 1,299 1,001 1,410 Total operating expenses (1,124) (711) (818) Profit before tax 175 290 592 Tax expense — — — Profit attributable to non-controlling interests — (9) 10 Net profit/(loss) contribution 175 281 602
Full-year ended 31 March 2010 Net interest income/(expense) (46) (113) (103) Fee and commission income 977 837 911 Trading income 525 77 2 Share of net profits/(losses) of associates and joint ventures accounted for using the equity method 2 (22) (170) Other operating income and charges — (124) 735 Internal management revenue/(charge) 22 30 61 Total operating income 1,480 685 1,436 Total operating expenses (900) (728) (624) Profit before tax 580 (43) 812 Tax expense — — — Profit attributable to non-controlling interests — (13) 1 Net profit/(loss) contribution 580 (56) 813

21
Fixed Income,
Currencies and Commodities
$Am
Corporate and Asset
Finance $Am
Banking and Financial Services
$Am
Real Estate Banking
$Am Corporate
$Am Total $Am
(29) 583 713 (12) 319 1,275 171 5 752 12 75 3,891 954 (3) 6 (1) (35) 1,368
15 9 1 (5) (1) 179
250 171 12 — 38 931 55 21 10 (2) (150) —
1,416 786 1,494 (8) 246 7,644 (841) (285) (1,214) (34) (1,346) (6,373) 575 501 280 (42) (1,100) 1,271
— — — — (282) (282) — — (5) — (29) (33)
575 501 275 (42) (1,411) 956
116 382 551 (37) 330 1,080 155 8 727 67 39 3,721
1,042 41 1 (6) (383) 1,299
11 (5) 2 (41) (7) (230) 37 7 (41) (102) 256 768 80 32 11 5 (241) —
1,441 465 1,251 (114) (6) 6,638 (614) (208) (984) (34) (1,252) (5,344) 827 257 267 (148) (1,258) 1,294
— — — — (201) (201) — (2) (6) — (23) (43)
827 255 261 (148) (1,482) 1,050
Macquarie Group Limited Management Discussion and Analysis macquarie.com.au
3.0 Segment analysis continued
22
Macquarie
Securities $Am
Macquarie Capital
$Am
Macquarie Funds
$Am
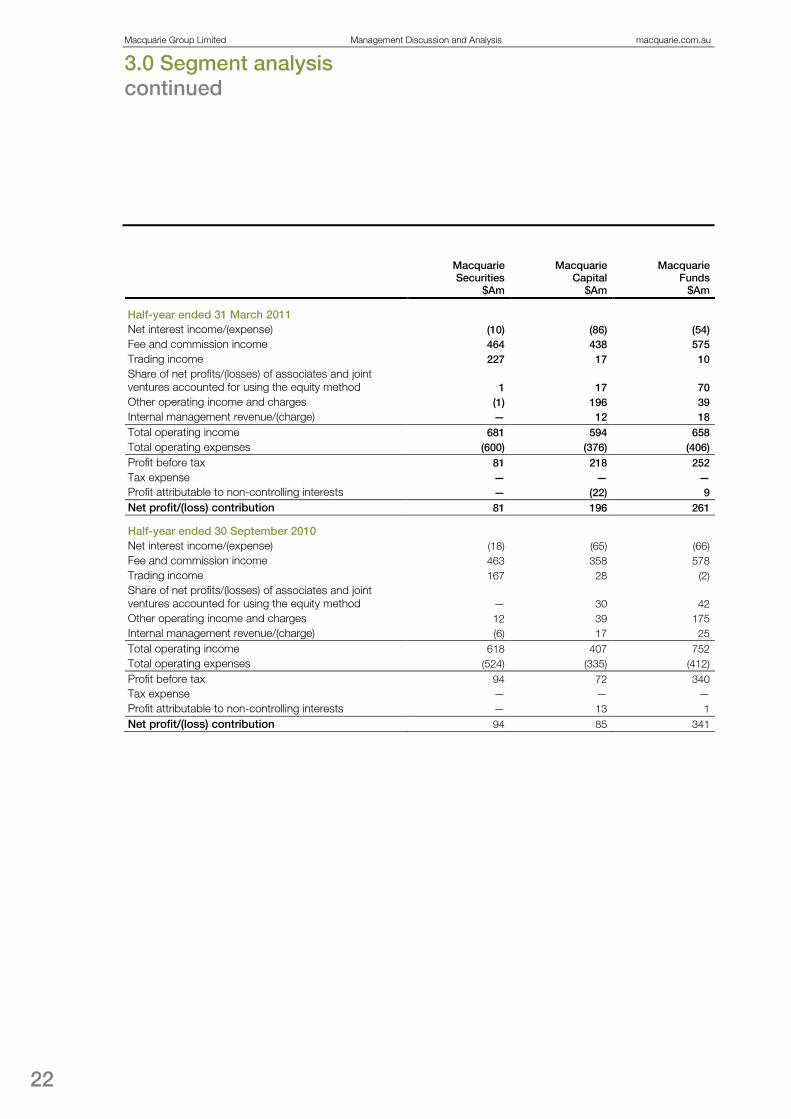
Half-year ended 31 March 2011 Net interest income/(expense) (10) (86) (54) Fee and commission income 464 438 575 Trading income 227 17 10 Share of net profits/(losses) of associates and joint ventures accounted for using the equity method 1 17 70 Other operating income and charges (1) 196 39 Internal management revenue/(charge) — 12 18 Total operating income 681 594 658 Total operating expenses (600) (376) (406) Profit before tax 81 218 252 Tax expense — — — Profit attributable to non-controlling interests — (22) 9 Net profit/(loss) contribution 81 196 261
Half-year ended 30 September 2010 Net interest income/(expense) (18) (65) (66) Fee and commission income 463 358 578 Trading income 167 28 (2) Share of net profits/(losses) of associates and joint ventures accounted for using the equity method — 30 42 Other operating income and charges 12 39 175 Internal management revenue/(charge) (6) 17 25 Total operating income 618 407 752 Total operating expenses (524) (335) (412) Profit before tax 94 72 340 Tax expense — — — Profit attributable to non-controlling interests — 13 1 Net profit/(loss) contribution 94 85 341

23
Fixed Income, Currencies and
Commodities $Am
Corporate and Asset
Finance $Am
Banking and Financial Services
$Am
Real Estate Banking
$Am Corporate
$Am Total $Am
10 301 369 (6) 146 670 84 (6) 359 9 (27) 1,896
587 (1) 8 — (86) 762
— 3 1 3 (1) 94 158 112 19 3 35 561 28 9 8 (3) (72) —
867 418 764 6 (5) 3,983 (459) (150) (623) (20) (574) (3,208) 408 268 141 (14) (579) 775
— — — — (197) (197) — — — — (12) (25)
408 268 141 (14) (788) 553
(39) 282 344 (6) 173 605 87 11 393 3 102 1,995
367 (2) (2) (1) 51 606
15 6 — (8) — 85 92 59 (7) (3) 3 370 27 12 2 1 (78) —
549 368 730 (14) 251 3,661 (382) (135) (591) (14) (772) (3,165) 167 233 139 (28) (521) 496
— — — — (85) (85) — — (5) — (17) (8)
167 233 134 (28) (623) 403

Macquarie Group Limited Management Discussion and Analysis macquarie.com.au
3.0 Segment analysis continued
24
3.2 Macquarie Securities
Half year to Full year to Mar 11
$Am Sep 10
$Am Movement
% Mar 11
$Am Mar 10
$Am Movement
%
Net trading income (including net interest income)1 217 149 46 366 479 (24) Fee and commission income Brokerage and commissions 343 372 (8) 715 714 <1 Other fee and commission income 121 91 33 212 263 (19) Total fee and commission income 464 463 <1 927 977 (5) Share of net profits of associates and joint ventures accounted for using the equity method 1 — * 1 2 (50) Other operating income and charges (1) 12 * 11 — * Internal management revenue/(charge) — (6) (100) (6) 22 * Total operating income 681 618 10 1,299 1,480 (12)
Operating expenses Employment expenses (208) (174) 20 (382) (278) 37 Brokerage and commission expenses (136) (106) 28 (242) (218) 11 Other operating expenses (256) (244) 5 (500) (404) 24 Total operating expenses (600) (524) 15 (1,124) (900) 25 Net profit contribution 81 94 (14) 175 580 (70)
Non-GAAP metrics Headcount 1,768 1,734 2 1,768 1,673 6
1 The relative contribution of net interest income and trading income to income from trading activities can vary from period to period depending on the underlying trading strategies undertaken by Macquarie and its clients. As such, to obtain a more complete view of Macquarie Securities’ trading activities, net interest income has been combined with trading income above.
Macquarie Securities’ net profit contribution of $A175 million for the year ended 31 March 2011 decreased 70% from $A580 million in the prior year primarily due to reduced equity capital market activity in Australia and reduced levels of both institutional and retail client activity globally. Operating expenses have increased as a result of the full year impact of prior year acquisitions including FPK in November 2009, and the acquisition of Sal. Oppenheim in April 2010.
Net trading income (including net interest income)
Net trading income (including net interest income) of $A366 million for the year ended 31 March 2011 decreased 24% from $A479 million in the prior year.
As a result of challenging market conditions, retail and institutional product revenues were down across all regions with the exception of Europe which benefited from the acquisition of Sal. Oppenheim in April 2010. Despite this, leading market share was maintained in core Asian markets. The second half of the 2011 financial year provided some improvement over the first half.
Arbitrage trading continued to make a strong contribution to net trading income. Lower volatility and liquidity in the market, notably in the first half of the 2011 financial year, adversely impacted trading conditions.

25
Brokerage and commissions
Brokerage and commissions income of $A715 million for the year ended 31 March 2011 was in line with $A714 million in the prior year. Brokerage and commissions income predominantly includes transaction related fees from cash equities services provided to institutional clients. Revenues from the Americas and Europe continued to grow, benefiting from the FPK acquisition in November 2009 and Sal. Oppenheim acquisition in April 2010. This was offset by lower commissions in Asia and Australia due to reduced client activity as well as Asian revenues being negatively impacted by the stronger Australian Dollar.
Client rankings show the business is maintaining or improving rankings with clients and Macquarie is considered to be an improving global presence in securities markets.
Other fee and commission income
Other fee and commission income of $A212 million for the year ended 31 March 2011 decreased 19% from $A263 million in the prior year. Other fee and commission income consists primarily of equity capital markets fees. Capital raising activity was down in Australia and Europe compared to the prior year, however increased activity in America and Asia resulted in increased revenues in these regions, with notable transactions for the period including the listing of Agricultural Bank of China Limited on the Stock Exchange of Hong Kong as part of a $A22.1 billion dual listing in Hong Kong and Shanghai, featuring Macquarie Securities as joint bookrunner and joint lead manager.
Operating expenses
Total operating expenses of $A1,124 million for the year ended 31 March 2011 increased 25% from $A900 million in the prior year.
Employment expenses of $A382 million for the year ended 31 March 2011 increased 37% from $A278 million in the prior year. The increase was mainly due to the full year impact of prior year acquisitions including FPK in November 2009, the acquisition of Sal. Oppenheim in April 2010, and the build out of new business in Europe and America.
Brokerage and commission expenses of $A242 million for the year ended 31 March 2011 increased 11% from $A218 million in the prior year. The increase was primarily driven by the acquisition of the Sal. Oppenheim business in Europe (April 2010), higher rebates paid to clients in Asia and increased fee trades in the Stock Borrow Loan business.
Other operating expenses of $A500 million for the year to 31 March 2011 increased 24% from $A404 million in the prior year primarily driven by the full year impact of prior year acquisitions including FPK in November 2009, the acquisition of Sal. Oppenheim in April 2010, and the build out of new business in Europe and America. Other operating expenses were also impacted by increased investment in technology platforms during the year.

Macquarie Group Limited Management Discussion and Analysis macquarie.com.au
3.0 Segment analysis continued
26
3.3 Macquarie Capital
Half year to Full year to Mar 11
$Am Sep 10
$Am Movement
% Mar 11
$Am Mar 10
$Am Movement
%
Net interest expense (86) (65) 32 (151) (113) 34 Fee and commission income Mergers and acquisitions, advisory and underwriting fees 482 380 27 862 996 (13) Brokerage and commissions 22 21 5 43 33 30 Other fee and commission expense (66) (43) 53 (109) (192) (43) Total fee and commission income 438 358 22 796 837 (5) Net trading income 17 28 (39) 45 77 (42) Share of net profits/(losses) of associates and joint ventures accounted for using the equity method 17 30 (43) 47 (22) * Other operating income and charges Net gains on sale of equity investments 1 6 (83) 7 84 (92) Gain/(loss) on reclassification of retained investments (2) 19 * 17 — * Impairment charge on equity investments (22) (8) 175 (30) (387) (92) Impairment charge on non-financial assets (1) — * (1) (6) (83) Gain on acquiring, disposing and change in ownership interest in subsidiaries and businesses held for sale 33 8 * 41 27 52 Net operating lease income 62 30 107 92 66 39 Specific provisions and collective allowance for credit losses — (10) (100) (10) (4) 150 Other income 125 (6) * 119 96 24 Total other operating income and charges 196 39 * 235 (124) * Internal management revenue 12 17 (29) 29 30 (3) Total operating income 594 407 46 1,001 685 46
Operating expenses Employment expenses (207) (181) 14 (388) (386) 1 Brokerage and commission expenses (2) (4) (50) (6) (6) — Other operating expenses (167) (150) 11 (317) (336) (6) Total operating expenses (376) (335) 12 (711) (728) (2) Non-controlling interests1 (22) 13 * (9) (13) (31) Net profit/(loss) contribution 196 85 131 281 (56) *
Non-GAAP metrics Headcount 1,397 1,471 (5) 1,397 1,632 (14)
1 The non-controlling interests category adjusts reported consolidated profit or loss for the share that is attributable to non-controlling interests, such that the net profit or loss contribution represents the net profit or loss attributable to ordinary equity holders.
Macquarie Capital’s net profit contribution of $A281 million for the year ended 31 March 2011 increased from a loss of $A56 million in the prior year primarily due to lower impairment charges, partially offset by reduced advisory income.

27
Net interest expense
Net interest expense of $A151 million for the year ended 31 March 2011 increased 34% from $A113 million in the prior year. The expense mainly relates to the funding cost of principal investments. The increase is primarily due to higher interest rates during the year ended 31 March 2011 compared to the prior year.
Mergers and acquisitions, advisory and underwriting income
Mergers and acquisitions, advisory and underwriting income of $A862 million for the year to 31 March 2011 decreased 13% from $A996 million in the prior year reflecting lower levels of equity capital markets activity. The volume and value of deals in which Macquarie participated for the year ended 31 March 2011 (547 deals valued at approximately $A159 billion) was higher compared to the prior year (448 deals valued at approximately $A121 billion).
Significant advisory deals completed for the year ended 31 March 2011 included: – Co-developer, financial adviser, and equity underwriter for the $US2.1 billion Denver Fastracks Eagle P3
project. The first US rail public-private partnership (PPP), it involves a 35-year concession to design, build, finance, operate and maintain two greenfield commuter rail lines and associated rolling stock for the Denver metro area;
– Financial adviser to Cintra Infraestructuras, S.A. and Meridiam Infrastructure Finance S.à.r.l. on the $US2.7 billion Interstate 635 Managed Lanes Project to develop, finance, construct and maintain 13 miles of managed lanes in Dallas County, Texas;
– Adviser to Eiffarie (owned by Macquarie Atlas Roads, Macquarie European Infrastructure Fund, Macquarie European Infrastructure Fund II and French construction company, Eiffage), on the acquisition of a further 13.7 per cent interest in Autoroutes Paris-Rhin-Rhone (APRR);
– Adviser and lender to TPG Capital and Carlyle Group on the $A2.7 billion acquisition of Healthscope Limited, via scheme of arrangement;
– Lead sponsor and sole financial adviser on the €100 million Irish Schools PPP Bundle 2 project which will provide six new schools and subsequently 4,700 pupil places. This is the second Macquarie sponsored PPP to reach close in Ireland;
– Joint sponsor, joint bookrunner and joint lead manager for the listing of Agricultural Bank of China Limited on the Stock Exchange of Hong Kong as part of a $A22.1 billion dual listing in Hong Kong and Shanghai;
– Joint lead manager and bookrunner on Sino-Ocean Land’s $US900 million issue of perpetual subordinated convertible securities, the largest international equity-linked issuance ever for a mainland Chinese property developer, and one of the first convertible securities to achieve balance sheet equity treatment for an Asian Corporate (ex Japan);
– Financial adviser to a consortium of Macquarie-managed funds on the acquisition of 100% of Ceske Radiokomunikace. The transaction represents one of the largest telecommunications transactions in Central and Eastern Europe in calendar year 2010;
– Financial adviser to Macquarie-managed funds on the acquisition of 100 per cent of Thyssengas from RWE. Thyssengas is the owner and operator of a regulated supra-regional gas transmission network in Germany, transporting almost 10 billion cubic metres of natural gas annually to 56 downstream networks;
– Financial adviser to a consortium comprising Global Infrastructure Partners, Industry Funds Management, QIC Global Infrastructure and the Abu Dhabi Investment Authority on the acquisition of the 99-year lease of the Port of Brisbane for consideration valued at $A2.1 billion;
– Financial adviser, debt arranger and equity bridge provider to Southern Cross Media Group Limited for the takeover offer for Austereo Group Limited;
Macquarie Group Limited Management Discussion and Analysis macquarie.com.au
3.0 Segment analysis continued
28
– Sole sponsor, joint global coordinator, joint bookrunner and joint lead manager on the $US369 million ($US425 million post-greenshoe) Initial Public Offering (IPO) of China Suntien Green Energy Corporation Limited on the Hong Kong Stock Exchange. China Suntien is one of the leading clean energy companies in Northern China;
– Sole global coordinator, sole sponsor, joint bookrunner and joint lead manager on the $US204 million IPO of Global Dairy Holdings Limited on the Hong Kong Stock Exchange. Global Dairy is one of the top ten locally-branded milk powder companies in the Peoples’ Republic of China;
– Joint bookrunner on a $US183 million equity offering for InterOil Corporation, an integrated energy company focused in Papua New Guinea;
– Joint global coordinator, joint bookrunner and transaction adviser, on the IPO of Royal Bafokeng Platinum Limited on the Main Board of the Johannesburg Stock Exchange for $US433 million listing;
– Exclusive financial adviser and sole bookrunner to the Government of the Republic of Ghana for a $US215 million sell down in AngloGold Ashanti Limited ordinary shares by way of an accelerated bookbuild;
– Joint financial adviser to the Administrators of The Griffin Coal Mining Company Pty Ltd on the sale of coal mining assets to Indian company Lanco Infratech Ltd. This transaction represents the largest inbound investment from an Indian company into the Australian resources sector;
– Financial adviser to CoreLogic, a leading provider of information, analytics and business services, on the sale of employer e-services and litigation support businesses, collectively First Advantage, to Symphony Technology Group; and
– Sole sponsor, sole global coordinator and joint bookrunner on the $US200 million Hong Kong IPO of Top Spring International Holdings Limited. The deal represented the first real estate IPO (Asia-ex Japan) in 2011.
Other fee and commission expense
Other fee and commission expense of $A109 million for the year ended 31 March 2011 decreased 43% from $A192 million in the prior year. For Macquarie Capital, other fee and commission expense predominantly relates to internal transactions with other Operating Groups. The decrease is due to lower payments to Macquarie Securities on equity underwriting transactions, which were well down on the prior year due to reduced equity capital markets activity, partially offset with receipts from Corporate and Asset Finance relating to the acquisition of aircraft assets and associated leases from AIG’s International Lease Finance Corporation.
Net trading income
Net trading income of $A45 million for the year ended 31 March 2011 decreased 42% from $A77 million in the prior year. The year ended 31 March 2011 included profits in relation to listed and unlisted equity investments, interest rates swaps and warrants and options. The income in the prior year included a realised profit in relation to a United States listed investment and an unrealised profit on warrants and options.
Share of net profits/(losses) of associates and joint ventures accounted for using the equity method
Improved operating conditions resulted in net equity accounted profits of $A47 million for the year ended 31 March 2011 compared to a net loss of $A22 million in the prior year. Net equity accounted profits of $A20 million were recognised in the year ended 31 March 2011 for listed associates and $A27 million for unlisted associates.

29
Net gains on sale of equity investments
Net gains on sale of equity investments of $A7 million for the year ended 31 March 2011 decreased significantly from $A84 million in the prior year. The year ended 31 March 2011 included a gain on an unlisted investment in the infrastructure industry. The prior year included income from the sale of Moto Hospitality and Puget Energy.
Gains on reclassification of retained investments
Gains on reclassification of retained investments of $A17 million predominantly relates to a gain recognised when Macquarie lost significant influence over an equity accounted investment on IPO and was required to revalue its retained investment to fair value.
Impairment charge on equity investments
Impairment charges on equity investments of $A30 million for the year ended 31 March 2011 decreased significantly from $A387 million in the prior year reflecting the improving market and economic conditions.
Gain on acquiring, disposing and change in ownership interest in subsidiaries and businesses held for sale
The gain on acquiring, disposing and change in ownership interest in subsidiaries and businesses held for sale of $A41 million for the year ended 31 March 2011 increased 52% from $A27 million in the prior year. The gain in the year ended 31 March 2011 included income from the sale of the Macquarie Asset Leasing Trust.
Operating expenses
Total operating expenses for the year ended 31 March 2011 were $A711 million, a reduction of 2% from $A728 million in the prior year.
Employment expenses for the year ended 31 March 2011 were $A388 million, broadly in line with $A386 million in the prior year. Other operating expenses of $A317 million for the year ended 31 March 2011 decreased 6% from $A336 million in the prior year mainly due to lower average headcount and favourable FX movements.

Macquarie Group Limited Management Discussion and Analysis macquarie.com.au
3.0 Segment analysis continued
30
3.4 Macquarie Funds
Half year to Full year to Mar 11
$Am Sep 10
$Am Movement
% Mar 11
$Am Mar 10
$Am Movement
%
Net interest expense (54) (66) (18) (120) (103) 17 Fee and commission income Base fees 432 441 (2) 873 697 25 Performance fees 15 15 — 30 22 36 Mergers and acquisitions, advisory and underwriting fees 18 3 * 21 39 (46) Brokerage and commissions 13 17 (24) 30 33 (9) Other fee and commission income 97 102 (5) 199 120 66 Total fee and commission income 575 578 (1) 1,153 911 27 Net trading income/(expense) 10 (2) * 8 2 300 Share of net profits/(losses) of associates and joint ventures accounted for using the equity method 70 42 67 112 (170) * Other operating income and charges Impairment charge/writeback on equity investments (27) 4 * (23) 31 * Impairment charge on non-financial assets — — * — (6) (100) Gain/(loss) on acquiring, disposing and change in ownership interest in subsidiaries and businesses held for sale (4) (1) 300 (5) 238 * Gain on reclassification of retained investments — 95 (100) 95 — * Sale of management rights 14 — * 14 428 (97) Specific provisions and collective allowance for credit losses (8) (5) 60 (13) (9) 44 Other income 64 82 (22) 146 53 175 Total other operating income and charges 39 175 (78) 214 735 (71) Internal management revenue 18 25 (28) 43 61 (30) Total operating income 658 752 (13) 1,410 1,436 (2)
Operating expenses Employment expenses (159) (153) 4 (312) (248) 26 Brokerage and commission expenses (69) (67) 3 (136) (101) 35 Other operating expenses (178) (192) (7) (370) (275) 35 Total operating expenses (406) (412) (1) (818) (624) 31 Non-controlling interests1 9 1 * 10 1 * Net profit contribution 261 341 (23) 602 813 (26)
Non-GAAP metrics Assets under management ($A billion) 305.1 312.5 (2) 305.1 311.0 (2) Headcount 1,457 1,525 (4) 1,457 1,610 (10)
1 The non-controlling interests category adjusts reported consolidated profit or loss for the share that is attributable to non-controlling interests, such that the net profit or loss contribution represents the net profit or loss attributable to ordinary equity holders.
Macquarie Funds’ net profit contribution of $A602 million for the year ended 31 March 2011 decreased 26% from $A813 million in the prior year. The prior year included significant gains from listed fund initiatives, while the year ended 31 March 2011 benefited from the full year effect of the acquisition of Delaware Investments in January 2010. Excluding the gains from listed fund initiatives in both years, net profit contribution increased 105%.

31
Net interest expense
Net interest expense of $A120 million for the year ended 31 March 2011 increased 17% from $A103 million in the prior year. This was primarily driven by the full year effect of funding of the investment in Delaware Investments and higher interest rates on MFG’s other investments.
Base fees
Base fee income of $A873 million for the year ended 31 March 2011 increased 25% from $A697 million in the prior year. The increase in base fee income was largely a result of the full year effect of the acquisition of Delaware Investments, which increased AUM by $A151 billion in January 2010. The increase in AUM was partially offset by decreases due to listed fund initiatives undertaken including Macquarie Airports and Macquarie Infrastructure Group, and the strengthening of the Australian Dollar against major currencies.
Refer to Section 7 for details of Macquarie Funds’ AUM and Equity under Management.
Performance fees
Performance fee income of $A30 million for the year ended 31 March 2011 increased 36% from $A22 million in the prior year. The increase is primarily due to additional performance fees from the sale of co-investments and a performance fee from Macquarie Atlas Roads.
Mergers and acquisitions, advisory and underwriting fees
Mergers and acquisitions, advisory and underwriting fees of $A21 million for the year ended 31 March 2011 decreased 46% from $A39 million in the prior year. Fees earned in the prior year primarily related to listed real estate funds transactions. The majority of the Australian listed real estate funds management platform was sold to Charter Hall Group in March 2010.
Other fee and commission income
Other fee and commission income includes distribution service fees earned by Delaware Investments, structuring fees, capital protection fees, income from True Index products and internal fees received for managing and administering investment products on behalf of Banking and Financial Services.
Other fee and commission income of $A199 million for the year ended 31 March 2011 increased 66% from $A120 million in the prior year mainly due to distribution service fees in the Delaware Investments business, which offset associated expenses that, for accounting purposes, are recognised in brokerage and commissions expense.
Share of net profits/(losses) of associates and joint ventures using the equity method
Net equity accounted profits of $A112 million for the year ended 31 March 2011 compare with a loss of $A170 million in the prior year. The result in the prior year was driven by the significant market disruption associated with the global financial crisis and the resultant deterioration of the underlying results of the investments held by funds. The prior year also included equity accounted losses of $A82 million related to fees paid by MAp Group, Southern Cross Media Group and Macquarie Infrastructure Group to terminate management arrangements with Macquarie. The profit for the year ended 31 March 2011 reflects improved economic and operating conditions for the investments.
Impairment charge/writeback on equity investments
Impairment charges on equity investments of $A23 million for the year ended 31 March 2011 primarily relate to the writedown of unlisted investments. The writeback of impairment charges of $A31 million in the prior year primarily related to Macquarie Infrastructure Company and Southern Cross Media Group.

Macquarie Group Limited Management Discussion and Analysis macquarie.com.au
3.0 Segment analysis continued
32
Gain/(loss) on acquiring, disposing and change in ownership interest in subsidiaries and businesses held for sale
The gain on acquiring, disposing and change in ownership interest in subsidiaries and businesses held for sale of $A238 million in the prior year primarily related to income from the sale of Macquarie Communications Infrastructure Management Limited, income in relation to the internalisation of management of Ardent Leisure Group and income from the sale of the majority of the Australian listed real estate funds management platform to Charter Hall Group. There were no significant items in the year ended 31 March 2011.
Gain on reclassification of retained investments
In early September 2010, Macquarie lost significant influence over MAp Group and consequently reclassified its retained investment to available for sale. On reclassification, Macquarie was required to re-measure its retained stake in MAp Group to fair value. The gain on reclassification of this investment was $A95 million.
Sale of management rights
Income from the termination of management arrangements of $A14 million in the year ended 31 March 2011 related to the sale of the management rights of Macquarie Power and Infrastructure Corporation. Fees to terminate management arrangements of $A428 million in the prior year related to the sale of the management rights of MAp Group ($A345 million), Macquarie Infrastructure Group ($A42 million) and Southern Cross Media Group ($A41 million).
Other income
Other income of $A146 million for the year ended 31 March 2011 increased significantly from $A53 million in the prior year. The income for the year ended 31 March 2011 included distributions from MAp Group of $A83 million subsequent to its reclassification from an investment in associate to an available for sale investment. Other income also included a gain on the disposal of MFG’s investment in Intoll ($A11 million).
Operating expenses
Total operating expenses of $A818 million for the year ended 31 March 2011 increased 31% from $A624 million in the prior year.
Employment expenses increased 26% from $A248 million to $A312 million mainly as a result of the full year effect of the acquisition of Delaware Investments in January 2010.
Brokerage and commission expenses of $A136 million for the year ended 31 March 2011 increased 35% from $A101 million in the prior year. The increase in brokerage and commission expenses is primarily related to distribution expenses in the Delaware Investments business that offset related distribution service fee income that, for accounting purposes, is recognised in other fee and commission income.
Other operating expenses increased 35% from $A275 million to $A370 million mainly as a result of the full year effect of the acquisition of Delaware Investments in January 2010.

33
3.5 Fixed Income, Currencies and Commodities
Half year to Full year to Mar 11
$Am Sep 10
$Am Movement
% Mar 11
$Am Mar 10
$Am Movement
%
Net trading income (including net interest income)1,2 Commodities3 421 197 114 618 671 (8) Foreign exchange products 25 13 92 38 93 (59) Interest rate products 136 150 (9) 286 352 (19) Fair value adjustments relating to leasing contracts3 15 (32) * (17) 42 * Total net trading income (including net interest income) 597 328 82 925 1,158 (20) Fee and commission income Brokerage and commissions 45 42 7 87 69 26 Other fee and commission income 39 45 (13) 84 86 (2) Total fee and commission income 84 87 (3) 171 155 10 Share of net profits of associates and joint ventures accounted for using the equity method — 15 (100) 15 11 36 Other operating income and charges Net gains on sale of equity investments 87 52 67 139 64 117 Impairment charge on equity investments (7) (2) 250 (9) (3) 200 Specific provisions and collective allowance for credit losses 1 12 (92) 13 (53) * Other income 77 30 157 107 29 269 Total other operating income and charges 158 92 72 250 37 * Internal management revenue 28 27 4 55 80 (31) Total operating income 867 549 58 1,416 1,441 (2)
Operating expenses
Employment expenses (179) (123) 46 (302) (209) 44 Brokerage and commission expenses (82) (91) (10) (173) (138) 25 Other operating expenses (198) (168) 18 (366) (267) 37
Total operating expenses (459) (382) 20 (841) (614) 37 Net profit contribution 408 167 144 575 827 (30)
Non-GAAP metrics Headcount 980 953 3 980 884 11
1 The relative contribution of net interest income and trading income to income from trading activities can vary from period to period depending on the underlying trading strategies undertaken by Macquarie and its clients. As such, to obtain a more complete view of Fixed Income, Currencies and Commodities’ trading activities, net interest income has been combined with trading income above. The categories of trading income above are based on business lines within Fixed Income, Currencies and Commodities.
2 There were no impairments taken through trading income for the year ended 31 March 2011 (31 March 2010: $A20 million). 3 Macquarie enters into various tolling agreements, capacity contracts and transportation agreements as part of its commodity
trading and hedging strategies. The contracts and agreements, which are managed on a fair value basis for financial and risk management purposes, are required to be accounted for on an accruals basis for statutory reporting purposes. This creates a measurement mismatch with related trading positions that are reported at fair value for statutory purposes. For the purposes of enabling comparison with prior periods, Commodities trading income is presented on a basis consistent with management reporting, and the reversal of the fair value adjustments relating to leasing contracts are presented separately to reconcile the result to the statutory presentation.

Macquarie Group Limited Management Discussion and Analysis macquarie.com.au
3.0 Segment analysis continued
34
Fixed Income, Currencies and Commodities’ (FICC) net profit contribution was $A575 million for the year ended 31 March 2011, a decrease of 30% from $A827 million in the prior year. Total operating income of $A1,416 million was down 2% from $A1,441 million in the prior year. FICC experienced challenging trading conditions and subdued client activity in a number of markets during the first half of the year with client activity beginning to show signs of improvement in the second half of the year. The 37% growth in operating expenses to $A841 million for the year ended 31 March 2011 from $A614 million in the prior year reflects the investment in new capabilities in credit sales and trading, the extension of these platforms from the US into Europe and the establishment of new capabilities in rates, currencies and credit sales and trading in Asia.
Commodities trading income
Commodities trading income of $A618 million for the year ended 31 March 2011 decreased 8% from $A671 million in the prior year. In line with the broader market, FICC experienced challenging trading conditions and lower client term hedging activity in some of its commodities markets during the year, especially in the first half.
In metals and agricultural markets, client activity in term hedging improved in the second half of the year after a sporadic first half. Global weather events and geopolitical unrest in the Middle East led to significant volatility in a number of commodities markets during the year. Energy markets experienced more difficult trading conditions with periods when the market moved away from fundamentals resulting in lower income compared to the prior year. Northern hemisphere energy revenues were stronger in the second half of the year reflecting the seasonal nature of the energy market.
Foreign exchange products trading income
Foreign exchange products trading income of $A38 million for the year ended 31 March 2011 decreased 59% from $A93 million in the prior year. Global volatility in currency markets remained suppressed and the higher Australian Dollar impacted the level of client term hedging. Together with some margin compression this had a significant impact on revenues.
Interest rate products trading income
Interest rate products trading income of $A286 million for the year ended 31 March 2011 decreased 19% from $A352 million in the prior year. The prior year was characterised by strong rallies in credit markets globally post the financial crisis. This yielded strong returns in FICC’s interest rate related businesses. Although FICC’s base of offerings has been expanded in the US and Asia over the last twelve months, income for the year ended 31 March 2011 is down, reflecting lower levels of client activity.
Fee and commission income
Fee and commission income of $A171 million for the year ended 31 March 2011 increased 10% from $A155 million in the prior year mainly due to improved brokerage revenues in the futures execution and clearing markets.
Net gains on sale of equity investments
Net gains on sale of resources sector equity investments of $A139 million for the year ended 31 March 2011 increased significantly from $A64 million in the prior year. The improved result was due to stronger resource equity markets, particularly in the gold sector.
Specific provisions and collective allowance for credit losses
Net provision releases of $A13 million for the year ended 31 March 2011 compares to net provision charges of $A53 million in the prior year, reflecting an overall improvement in the collectability of the loan portfolio and the impact of restructures or repayments received on previously provided for receivables.

35
Other income
Other income of $A107 million for the year ended 31 March 2011 increased from $A29 million in the prior year. The improvement is largely driven by the sale of net profit interests and royalties from participants in the metals and energy sectors.
Operating expenses
Total operating expenses of $A841 million for the year ended 31 March 2011 increased 37% from $A614 million in the prior year.
Employment expenses of $A302 million for the year ended 31 March 2011 increased 44% from $A209 million in the prior year. The main driver of the increase in employment costs is the continued investment in the credit trading business in the US and its expansion into Europe, as well as the establishment of the new Asian Markets business in Singapore. Over half the increase in headcount since 31 March 2010 relates to coverage in new markets or regions.
Brokerage and commission expenses of $A173 million for the year ended 31 March 2011 increased 25% from $A138 million in the prior year, largely attributable to growth in futures execution and clearing volumes.
Other operating expenses of $A366 million for the year ended 31 March 2011 increased 37% from $A267 million in the prior year. The increase is largely attributable to costs supporting the expansion of the FICC business platforms, including risk management, information technology and operations.
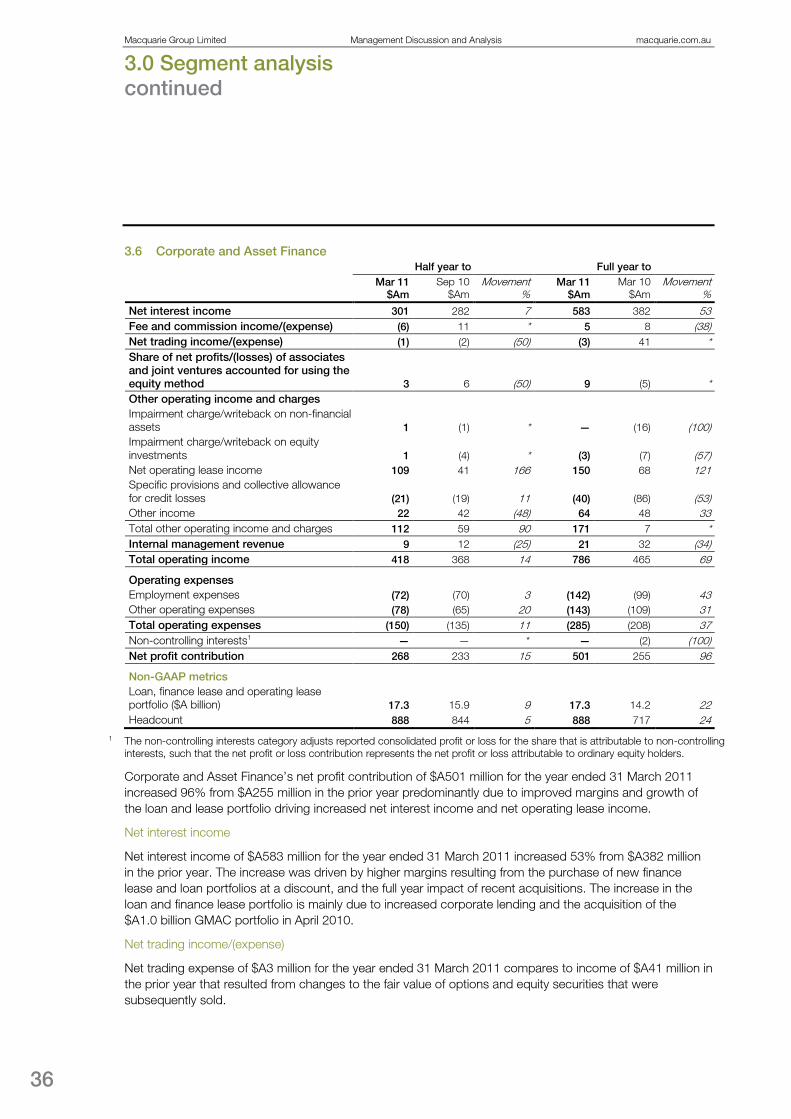
Macquarie Group Limited Management Discussion and Analysis macquarie.com.au
3.0 Segment analysis continued
36
3.6 Corporate and Asset Finance
Half year to Full year to Mar 11
$Am Sep 10
$Am Movement
% Mar 11
$Am Mar 10
$Am Movement
%
Net interest income 301 282 7 583 382 53 Fee and commission income/(expense) (6) 11 * 5 8 (38) Net trading income/(expense) (1) (2) (50) (3) 41 * Share of net profits/(losses) of associates and joint ventures accounted for using the equity method 3 6 (50) 9 (5) * Other operating income and charges Impairment charge/writeback on non-financial assets 1 (1) * — (16) (100) Impairment charge/writeback on equity investments 1 (4) * (3) (7) (57) Net operating lease income 109 41 166 150 68 121 Specific provisions and collective allowance for credit losses (21) (19) 11 (40) (86) (53) Other income 22 42 (48) 64 48 33 Total other operating income and charges 112 59 90 171 7 * Internal management revenue 9 12 (25) 21 32 (34) Total operating income 418 368 14 786 465 69
Operating expenses Employment expenses (72) (70) 3 (142) (99) 43 Other operating expenses (78) (65) 20 (143) (109) 31 Total operating expenses (150) (135) 11 (285) (208) 37 Non-controlling interests1 — — * — (2) (100) Net profit contribution 268 233 15 501 255 96
Non-GAAP metrics Loan, finance lease and operating lease portfolio ($A billion) 17.3 15.9 9 17.3 14.2 22 Headcount 888 844 5 888 717 24
1 The non-controlling interests category adjusts reported consolidated profit or loss for the share that is attributable to non-controlling interests, such that the net profit or loss contribution represents the net profit or loss attributable to ordinary equity holders.
Corporate and Asset Finance’s net profit contribution of $A501 million for the year ended 31 March 2011 increased 96% from $A255 million in the prior year predominantly due to improved margins and growth of the loan and lease portfolio driving increased net interest income and net operating lease income.
Net interest income
Net interest income of $A583 million for the year ended 31 March 2011 increased 53% from $A382 million in the prior year. The increase was driven by higher margins resulting from the purchase of new finance lease and loan portfolios at a discount, and the full year impact of recent acquisitions. The increase in the loan and finance lease portfolio is mainly due to increased corporate lending and the acquisition of the $A1.0 billion GMAC portfolio in April 2010.
Net trading income/(expense)
Net trading expense of $A3 million for the year ended 31 March 2011 compares to income of $A41 million in the prior year that resulted from changes to the fair value of options and equity securities that were subsequently sold.
37
Net operating lease income
Net operating lease income (net of depreciation) of $A150 million for the year ended 31 March 2011 increased 121% from $A68 million in the prior year mainly due to the acquisition of 44 aircraft assets and associated operating leases from ILFC throughout the year.
Specific provisions and collective allowance for credit losses
Specific provisions and collective allowance for credit losses of $A40 million for the year ended 31 March 2011 decreased 53% from $A86 million in the prior year mainly resulting from a reduction in the collective allowance for credit losses due to improved loss rates on the loan and finance lease portfolio compared to the prior year.
Other income
Other income of $A64 million for the year ended 31 March 2011 increased 33% from $A48 million in the prior year largely as a result of increased sales of off-lease assets and inventory.
Operating expenses
Total operating expenses of $A285 million for the year ended 31 March 2011 increased 37% from $A208 million in the prior year, reflecting increased average headcount.

Macquarie Group Limited Management Discussion and Analysis macquarie.com.au
3.0 Segment analysis continued
38
3.7 Banking and Financial Services
Half year to Full year to Mar 11
$Am Sep 10
$Am Movement
% Mar 11
$Am Mar 10
$Am Movement
%
Net interest income 369 344 7 713 551 29 Fee and commission income Base fees 22 54 (59) 76 199 (62) Brokerage and commissions 130 130 — 260 224 16 Other fee and commission income 182 183 (1) 365 264 38
Income from life insurance business and other unit holder businesses 25 26 (4) 51 40 28 Total fee and commission income 359 393 (9) 752 727 3 Net trading income/(expense) 8 (2) * 6 1 * Share of net profits of associates and joint ventures accounted for using the equity method 1 — * 1 2 (50) Other operating income and charges Net gains on sale of equity investments 1 2 (50) 3 2 50
Impairment charge on equity investments and disposal groups held for sale (4) (5) (20) (9) (5) 80 Impairment charge on non-financial assets (3) (2) 50 (5) (3) 67 Gain on acquiring, disposing and change in ownership interest in subsidiaries and businesses held for sale 23 1 * 24 4 * Gain on reclassification 17 1 * 18 — * Specific provisions and collective allowance for credit losses (22) (15) 47 (37) (45) (18) Other income 7 11 (36) 18 6 200 Total other operating income and charges 19 (7) * 12 (41) * Internal management revenue 8 2 300 10 11 (9) Total operating income 764 730 5 1,494 1,251 19
Operating expenses Employment expenses (253) (253) — (506) (408) 24 Brokerage and commission expenses (74) (75) (1) (149) (121) 23 Other operating expenses (296) (263) 13 (559) (455) 23 Total operating expenses (623) (591) 5 (1,214) (984) 23 Non-controlling interests1 — (5) (100) (5) (6) (17) Net profit contribution 141 134 5 275 261 5
Non-GAAP metrics Assets under management ($A billion) 3.9 4.1 (5) 3.9 14.3 (73) Funds under management/advice/ administration2 ($A billion) 121.7 119.2 2 121.7 120.0 1 Loan portfolio3 ($A billion) 25.5 26.0 (2) 25.5 26.4 (3) Deposits ($A billion) 26.6 26.5 <1 26.6 15.5 72 Headcount 3,228 3,349 (4) 3,228 3,268 (1)
1 The non-controlling interests category adjusts reported consolidated profit or loss for the share that is attributable to non-controlling interests, such that the net profit or loss contribution represents the net profit or loss attributable to ordinary equity holders.
2 Funds under management/advice/administration includes Assets under Management plus items such as funds on Banking and Financial Services platforms (e.g. Wrap Funds under Administration), total Banking and Financial Services loan and deposit portfolios, CHESS holdings of Banking and Financial Services clients, and funds under advice (e.g. assets under advice of Macquarie Private Bank).
3 The loan book primarily comprises residential mortgages in Australia, Canada and the United States, as well as loans to Australian and Canadian businesses, loans on capital protected products, and credit cards.

39
Banking and Financial Services’ net profit contribution of $A275 million for the year ended 31 March 2011 increased 5% from $A261 million in the prior year.
Net interest income
Net interest income of $A713 million for the year ended 31 March 2011 increased 29% from $A551 million in the prior year. The increase was driven by retail deposits, which were up 72% to $A26.6 billion at 31 March 2011 from $A15.5 billion at 31 March 2010 predominantly due to the conversion of $A9.6 billion of Macquarie CMT balances into CMA on 31 July 2010.
Banking and Financial Services’ loan book primarily comprises residential mortgages in Australia, Canada and the United States, as well as loans to Australian and Canadian businesses, loans on capital protected products and credit cards. The total loan book decreased 3% to $A25.5 billion at 31 March 2011, from $A26.4 billion at 31 March 2010. The decrease was primarily due to run-off in the Australian mortgage portfolio which was 19% lower at 31 March 2011 ($A11.6 billion)1
The Canadian loan portfolio, which includes mortgages, insurance premium funding, margin loans and capital protected products, closed at $A8.8 billion at 31 March 2011, up 26% from $A7.0 billion at 31 March 2010 despite the stronger Australian Dollar.
compared to 31 March 2010 ($A14.3 billion).
Base fees
Base fee income of $A76 million for the year ended 31 March 2011 decreased 62% from $A199 million in the prior year largely as a result of a 73% decrease in AUM to $A3.9 billion at 31 March 2011 from $A14.3 billion at 31 March 2010. The decrease was predominantly due to the conversion of $A9.6 billion of CMT balances to CMA on 31 July 2010.
CMA do not form part of AUM and income from these accounts is reported in net interest income.
Brokerage and commissions
Brokerage and commission income of $A260 million for the year ended 31 March 2011 increased 16% from $A224 million in the prior year as a result of the full year impact of the acquisition of Macquarie Private Wealth Canada in December 2009 and improving equity market conditions globally. Macquarie Private Wealth was again the number one full-service retail stockbroker in Australia in terms of volume and market share.
Other fee and commission income
Other fee and commission income of $A365 million for the year ended 31 March 2011 increased 38% from $A264 million in the prior year mainly due to an increase in platform and other administration fee income.
Funds under Administration on the Australian Wrap platform closed at $A22.7 billion at 31 March 2011, up from $A22.5 billion at 31 March 2010. While closing Wrap Funds under Administration on the Australian Wrap platform at 31 March 2011 increased 1% on the prior year, average volumes of Funds under Administration on the Australian Wrap platform during the year ended 31 March 2011 were up 6% on the prior year mainly due to the impacts of inflows and market volatility. Inflows of $A2.6 billion were largely offset by negative market movements of $A2.4 billion.
The decision was taken to exit the UK wrap platform business in November 2010.
1 At 31 March 2011 $A8.8 billion (31 March 2010: $A11.2 billion) of the Australian mortgage portfolio was funded by third parties through external securitisations.

Macquarie Group Limited Management Discussion and Analysis macquarie.com.au
3.0 Segment analysis continued
40
Other drivers of the increase in Other fee and commission income include a 28% growth in Funds under Administration in the Macquarie Professional Series from $A2.9 billion at 31 March 2010 to $A3.7 billion at 31 March 2011, the full year effect of Macquarie Private Wealth Canada which was acquired in December 2009, and the contribution of some agricultural businesses that were previously part of Macquarie Funds. Income from these agricultural businesses accounted for $A23 million of this income category in the year ended 31 March 2011.
Income from life insurance business and other unit holder businesses
Income from life insurance business and other unit holder business of $A51 million increased 28% from $A40 million in the prior year primarily due to a 59% increase in the insurance inforce book from $A59 million at 31 March 2010 to $A94 million at 31 March 2011. The inforce book is the aggregate annualised life insurance premium payable for polices issued by the life company, and still paying premiums, at the balance date.
Gain on acquiring, disposing and change in ownership interest in subsidiaries and businesses held for sale and gain on reclassification
The gain on acquiring, disposing and change in ownership interest in subsidiaries and businesses held for sale of $A24 million and the gain on reclassification of $A18 million in the year ended 31 March 2011 were largely related to the partial sell down of ownership in Ozforex, in November 2010.
Specific provisions and collective allowance for credit losses
Specific provisions and collective allowance for credit losses of $A37 million for the year ended 31 March 2011 decreased 18% from $A45 million in the prior year. Provision charges in the year ended 31 March 2011 were lower compared to the prior year across most of the loan portfolio, particularly the capital protected products in Australia as a result of improving equity markets, loans approaching maturity and product redemptions.
Operating expenses
Total operating expenses of $A1,214 million for the year ended 31 March 2011 increased 23% from $A984 million in the prior year.
Employment expenses of $A506 million were up 24% from $A408 million in the prior year. Whilst headcount at 31 March 2011 decreased 1%, from 3,268 at 31 March 2010 to 3,228 at 31 March 2011, average headcount during the year ended 31 March 2011 was 19% higher than the prior year. The increase in average headcount was primarily driven by the acquisition of Macquarie Private Wealth Canada in December 2009 which added 398 staff to Banking and Financial Services at the time of acquisition.
Brokerage and commission expenses of $A149 million for the year ended 31 March 2011 increased 23% from $A121 million in the prior year. This was largely due to increased volumes in products such as the Macquarie Professional Series, insurance premium funding and credit cards.
Other operating expenses of $A559 million for the year ended 31 March 2011 increased 23% from $A455 million in the prior year. Expenses associated with the integration of Macquarie Private Wealth Canada and the closure of the UK wrap business contributed to the increase, as well as the contribution of some agricultural products that were included in Macquarie Funds in the prior year.
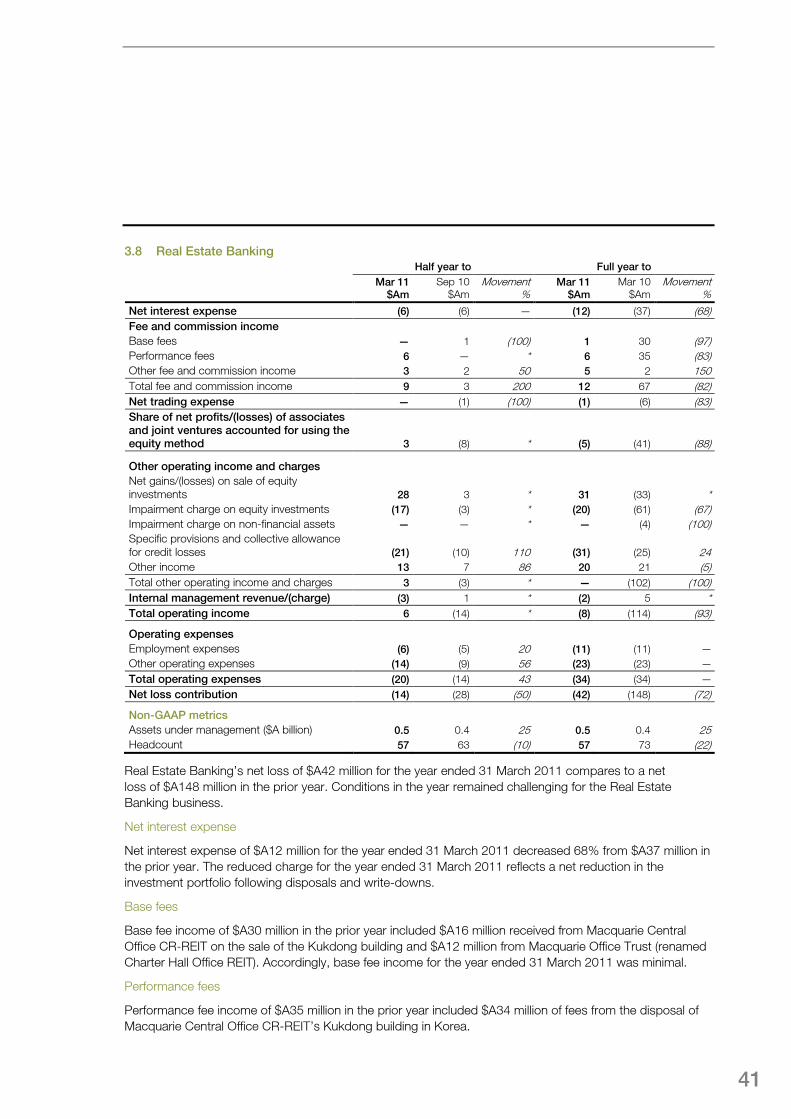
41
3.8 Real Estate Banking
Half year to Full year to Mar 11
$Am Sep 10
$Am Movement
% Mar 11
$Am Mar 10
$Am Movement
%
Net interest expense (6) (6) — (12) (37) (68) Fee and commission income Base fees — 1 (100) 1 30 (97) Performance fees 6 — * 6 35 (83) Other fee and commission income 3 2 50 5 2 150 Total fee and commission income 9 3 200 12 67 (82) Net trading expense — (1) (100) (1) (6) (83) Share of net profits/(losses) of associates and joint ventures accounted for using the equity method 3 (8) * (5) (41) (88)
Other operating income and charges Net gains/(losses) on sale of equity investments 28 3 * 31 (33) * Impairment charge on equity investments (17) (3) * (20) (61) (67) Impairment charge on non-financial assets — — * — (4) (100) Specific provisions and collective allowance for credit losses (21) (10) 110 (31) (25) 24 Other income 13 7 86 20 21 (5) Total other operating income and charges 3 (3) * — (102) (100) Internal management revenue/(charge) (3) 1 * (2) 5 * Total operating income 6 (14) * (8) (114) (93)
Operating expenses Employment expenses (6) (5) 20 (11) (11) — Other operating expenses (14) (9) 56 (23) (23) — Total operating expenses (20) (14) 43 (34) (34) — Net loss contribution (14) (28) (50) (42) (148) (72)
Non-GAAP metrics Assets under management ($A billion) 0.5 0.4 25 0.5 0.4 25 Headcount 57 63 (10) 57 73 (22)
Real Estate Banking’s net loss of $A42 million for the year ended 31 March 2011 compares to a net loss of $A148 million in the prior year. Conditions in the year remained challenging for the Real Estate Banking business.
Net interest expense
Net interest expense of $A12 million for the year ended 31 March 2011 decreased 68% from $A37 million in the prior year. The reduced charge for the year ended 31 March 2011 reflects a net reduction in the investment portfolio following disposals and write-downs.
Base fees
Base fee income of $A30 million in the prior year included $A16 million received from Macquarie Central Office CR-REIT on the sale of the Kukdong building and $A12 million from Macquarie Office Trust (renamed Charter Hall Office REIT). Accordingly, base fee income for the year ended 31 March 2011 was minimal.
Performance fees
Performance fee income of $A35 million in the prior year included $A34 million of fees from the disposal of Macquarie Central Office CR-REIT’s Kukdong building in Korea.

Macquarie Group Limited Management Discussion and Analysis macquarie.com.au
3.0 Segment analysis continued
42
Share of net profits/(losses) of associates and joint ventures accounted for using the equity method
Equity accounted losses of $A5 million for the year ended 31 March 2011 decreased 88% from $A41 million in the prior year. The result for the year ended 31 March 2011 was driven by losses in Real Estate Banking’s investments in associates, primarily Medallist. The loss in the prior year included equity accounted losses from investments in Medallist and Macquarie Goodman Japan.
Net gains/(losses) on sales of equity investments
The net gain on sales of equity investments of $A31 million for the year ended 31 March 2011 compares to a $A33 million loss in the prior year. The gain in the current year includes a profit on disposal of investments in Charter Hall Office Trust, Australian development projects and the US manager for EDT Retail Trust (formerly Macquarie DDR Trust). The net loss for the year ended 31 March 2010 mainly relates to the sale of the Australian listed REIT unit holdings to Charter Hall Group.
Impairment charge on equity investments
The impairment charge on equity investments of $A20 million for the year ended 31 March 2011 decreased 67% from $A61 million in prior year. The write-downs for the year ended 31 March 2011 included impairments of an Australian listed REIT investment of $A8 million and other Australian investments of $A12 million. The impairment charge of $A61 million in the prior year included $A28 million relating to offshore investments, $A9 million relating to Australian listed and unlisted REIT investments and $A24 million relating to other Australian investments.
Specific provisions and collective allowance for credit losses
Specific provisions and collective allowance for credit losses of $A31 million for the year ended 31 March 2011 increased 24% from $A25 million in the prior year. Provisions during the year included amounts provided for loans extended to Medallist.
Operating expenses
Total operating expenses of $A34 million were recognised for the year ended 31 March 2011 were in line with the prior year. Operating expenses during the year included transaction costs related to the disposal of investments.

43
3.9 Corporate
Half year to Full year to Mar 11
$Am Sep 10
$Am Movement
% Mar 11
$Am Mar 10
$Am Movement
%
Net interest income 146 173 (16) 319 330 (3) Fee and commission income/(expense) (27) 102 * 75 39 92 Net trading income/(expense) (86) 51 * (35) (383) (91) Share of net profits/(losses) of associates and joint ventures accounted for using the equity method (1) — * (1) (7) (86) Other operating income and charges Net gains on sale of debt and equity securities 18 42 (57) 60 28 114 Impairment charge on equity investments — (30) (100) (30) (1) * Gain on acquiring, disposing and change in ownership interest in subsidiaries and businesses held for sale — — * — 128 (100) Gain on repurchase of debt — — * — 55 (100) Specific provisions and collective allowance for credit losses 14 (29) * (15) 6 * Other income 3 20 (85) 23 40 (43) Total other operating income and charges 35 3 * 38 256 (85) Internal management charge (72) (78) (8) (150) (241) (38) Total operating income (5) 251 * 246 (6) *
Operating expenses Employment expenses (912) (936) (3) (1,848) (1,463) 26 Brokerage and commission expenses 24 (86) * (62) (49) 27 Other operating expenses 314 250 26 564 260 117 Total operating expenses (574) (772) (26) (1,346) (1,252) 8
Tax expense (197) (85) 132 (282) (201) 40 Macquarie Income Preferred Securities (2) (2) — (4) (8) (50) Macquarie Income Securities (13) (13) — (26) (21) 24 Other non-controlling interests 3 (2) * 1 6 (83)
Net loss contribution (788) (623) 26 (1,411) (1,482) (5)
Non-GAAP metrics Headcount 5,781 5,594 3 5,781 4,800 20
The Corporate segment’s net loss for the year ended 31 March 2011 of $A1,411 million decreased 5% from a net loss of $A1,482 million in the prior year.
Net interest income
Interest income is mainly generated through the investment of MGL’s capital, offset by funding costs not passed on to businesses through Group Treasury. Net interest income for the year ended 31 March 2011 was $A319 million, a decrease of 3% from the prior year.
Fee and commission income/(expense)
Fee and commission income of $A75 million for the year ended 31 March 2011, which increased 92% from $A39 million in the prior year, mainly offsets with a related item that, for accounting purposes, is required to be recognised in brokerage and commission expense.

Macquarie Group Limited Management Discussion and Analysis macquarie.com.au
3.0 Segment analysis continued
44
Net trading income/(expense)
The primary drivers of net trading income/(expense) in the Corporate segment are derivative volatility and the impact of changes in the fair value of fixed rate issued debt. Net trading expense of $A35 million for the year ended 31 March 2011 decreased 91% from $A383 million in the prior year, which included negative fair value adjustments on fixed rate issued debt of $A255 million. This compares to positive fair value adjustments of $A9 million for the year ended 31 March 2011.
Net gains on sale of debt and equity securities
Net gains on sale of debt and equity securities of $A60 million for the year ended 31 March 2011 increased 114% from $A28 million in the prior year. Gains in the year ended 31 March 2011 primarily related to liquidity management activities by Group Treasury in the first half of the year.
Impairment charge on equity investments
The impairment charge on equity investments of $A30 million for the year ended 31 March 2011 related to investments in the real estate sector.
Employment expenses
Employment expenses in the Corporate segment relate to staff profit share, share based payments expense, the impact of mark-to-market adjustments of DPS liabilities and the employment costs associated with the Group’s support functions, including Corporate Affairs, Risk Management and Information Technology.
For the year ended 31 March 2011, employment expenses were $A1,848 million, up 26% from $A1,463 million in the prior year. The majority of the increase was due to a 20% increase in support function headcount to 5,781 at 31 March 2011 from 4,800 at 31 March 2010. The growth in Corporate headcount is predominantly due to Information Technology staff increases, reflecting the continued investment in capabilities and technology to support recent acquisitions and growth of the global operating platform.
Brokerage and commission expenses
Brokerage and commission expenses in the Corporate segment includes amounts that offset with fee and commission income as described above.
Other operating expenses
The other operating expenses category in the Corporate segment includes non-employment related costs of support functions, net of recoveries of support function costs from the operating groups. The increase in net recoveries from the operating groups is largely due to the increase in employment costs of the support functions as described above.
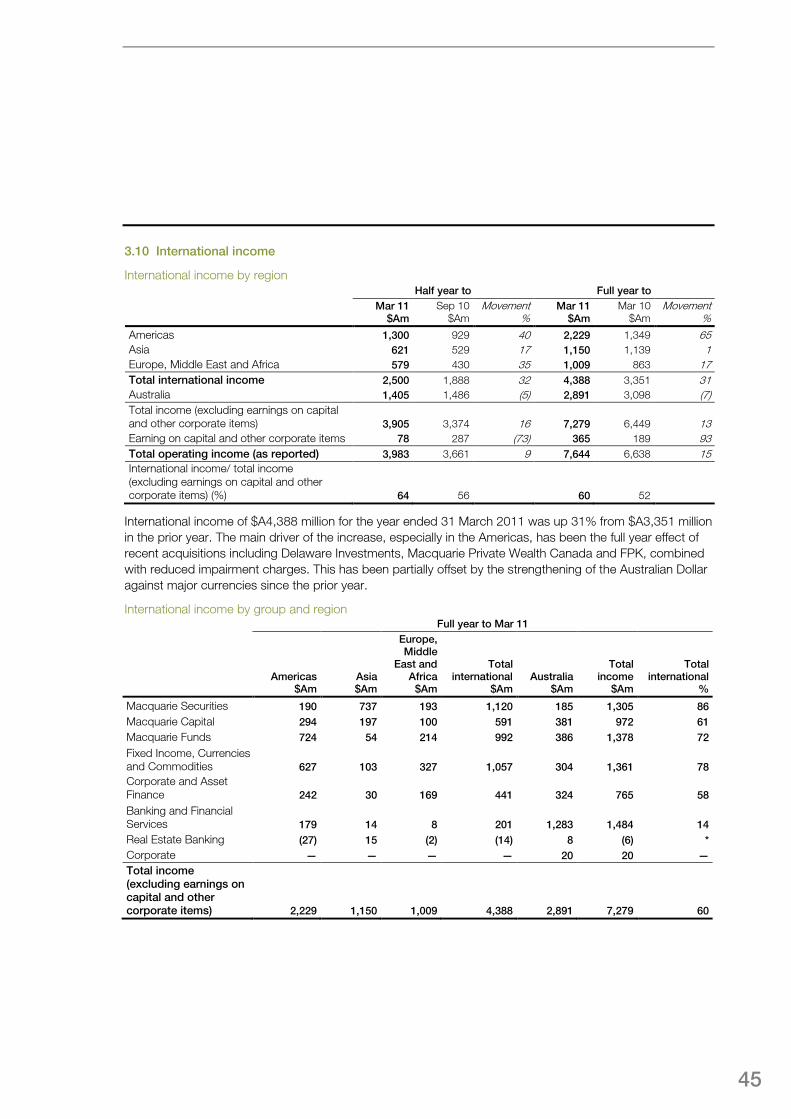
45
3.10 International income
International income by region
Half year to Full year to Mar 11
$Am Sep 10
$Am Movement
% Mar 11
$Am Mar 10
$Am Movement
%
Americas 1,300 929 40 2,229 1,349 65 Asia 621 529 17 1,150 1,139 1 Europe, Middle East and Africa 579 430 35 1,009 863 17 Total international income 2,500 1,888 32 4,388 3,351 31 Australia 1,405 1,486 (5) 2,891 3,098 (7) Total income (excluding earnings on capital and other corporate items) 3,905 3,374 16 7,279 6,449 13 Earning on capital and other corporate items 78 287 (73) 365 189 93 Total operating income (as reported) 3,983 3,661 9 7,644 6,638 15 International income/ total income (excluding earnings on capital and other corporate items) (%) 64 56 60 52
International income of $A4,388 million for the year ended 31 March 2011 was up 31% from $A3,351 million in the prior year. The main driver of the increase, especially in the Americas, has been the full year effect of recent acquisitions including Delaware Investments, Macquarie Private Wealth Canada and FPK, combined with reduced impairment charges. This has been partially offset by the strengthening of the Australian Dollar against major currencies since the prior year.
International income by group and region Full year to Mar 11
Americas
$Am Asia $Am
Europe, Middle
East and Africa
$Am
Total international
$Am Australia
$Am
Total income
$Am
Total international
%
Macquarie Securities 190 737 193 1,120 185 1,305 86 Macquarie Capital 294 197 100 591 381 972 61 Macquarie Funds 724 54 214 992 386 1,378 72
Fixed Income, Currencies and Commodities 627 103 327 1,057 304 1,361 78 Corporate and Asset Finance 242 30 169 441 324 765 58
Banking and Financial Services 179 14 8 201 1,283 1,484 14 Real Estate Banking (27) 15 (2) (14) 8 (6) * Corporate — — — — 20 20 — Total income (excluding earnings on capital and other corporate items) 2,229 1,150 1,009 4,388 2,891 7,279 60

Macquarie Group Limited Management Discussion and Analysis macquarie.com.au
4.0 Balance sheet
46
4.1 Statutory consolidated balance sheet As at Movement
Mar 11 $Am
Sep 10 $Am
Mar 10 $Am
Sep 10 %
Mar 10 %
Assets Due from financial institutions 9,817 9,766 8,251 1 19 Cash collateral on securities borrowed and reverse repurchase agreements 8,790 9,266 7,149 (5) 23 Trading portfolio assets 14,898 15,938 12,138 (7) 23 Loan assets held at amortised cost 46,016 45,130 44,267 2 4 Other financial assets at fair value through profit or loss 11,668 11,025 9,172 6 27 Derivative financial instruments — positive values 21,185 23,430 21,561 (10) (2) Other assets 12,646 11,671 11,801 8 7 Investment securities available for sale 17,051 18,576 18,221 (8) (6) Intangible assets 1,317 1,411 1,456 (7) (10) Life investment contracts and other unit holder investment assets 5,059 5,047 4,846 <1 4 Interests in associates and joint ventures accounted for using the equity method 2,790 2,719 3,927 3 (29) Property, plant and equipment 5,007 2,899 1,900 73 164 Deferred income tax assets 1,245 1,107 1,124 12 11 Non-current assets and assets of disposal groups classified as held for sale 79 75 127 5 (38) Total assets 157,568 158,060 145,940 (<1) 8
Liabilities Due to financial institutions 7,810 9,981 9,927 (22) (21) Cash collateral on securities lent and repurchase agreements 6,617 6,482 7,490 2 (12) Trading portfolio liabilities 5,808 5,811 5,432 (<1) 7 Derivative financial instruments — negative values 21,572 24,326 21,706 (11) (1) Deposits 35,338 35,047 22,484 1 57 Debt issued at amortised cost 41,177 39,955 42,614 3 (3) Other financial liabilities at fair value through profit or loss 4,339 3,710 4,413 17 (2) Other liabilities 14,327 12,973 12,679 10 13 Current tax liabilities 197 94 119 110 66 Life investment contracts and other unit holder liabilities 5,055 5,069 4,864 (<1) 4 Provisions 215 221 191 (3) 13 Deferred income tax liabilities 287 235 235 22 22 Liabilities of disposal groups classified as held for sale — — 9 * (100) Total liabilities excluding loan capital 142,742 143,904 132,163 (1) 8
Loan capital Macquarie Convertible Preference Securities 595 593 593 <1 <1 Subordinated debt at amortised cost 1,832 1,483 916 24 100 Subordinated debt at fair value through profit or loss 467 487 499 (4) (6) Total loan capital 2,894 2,563 2,008 13 44 Total liabilities 145,636 146,467 134,171 (1) 9 Net assets 11,932 11,593 11,769 3 1

47
As at Movement
Mar 11 $Am
Sep 10 $Am
Mar 10 $Am
Sep 10 %
Mar 10 %
Equity Contributed equity
Ordinary share capital 7,140 7,063 6,990 1 2 Treasury shares (731) (719) (443) 2 65 Exchangeable shares 104 129 137 (19) (24)
Reserves 310 263 280 18 11 Retained earnings 4,581 4,325 4,268 6 7 Total capital and reserves attributable to ordinary equity holders of Macquarie Group Limited 11,404 11,061 11,232 3 2
Non-controlling interests Macquarie Income Preferred Securities 63 66 67 (5) (6) Macquarie Income Securities 391 391 391 — — Other non-controlling interests 74 75 79 (1) (6) Total equity 11,932 11,593 11,769 3 1
Total assets of $A157.6 billion at 31 March 2011 increased 8% from $A145.9 billion at 31 March 2010.
Cash collateral on securities borrowed and reverse repurchase agreements increased $A1.6 billion from $A7.1 billion at 31 March 2010 to $A8.8 billion at 31 March 2011 and trading portfolio assets increased $A2.8 billion from $A12.1 billion at 31 March 2010 to $A14.9 billion at 31 March 2011 primarily as a result of increased trading activities in Macquarie Securities and FICC.
Loan assets increased 4% from $A44.3 billion at 31 March 2010 to $A46.0 billion at 31 March 2011 primarily due to an increase in loan and finance lease volumes in Corporate and Asset Finance, driven by increased corporate lending and the acquisition of the $A1.0 billion GMAC lease portfolio in April 2010, combined with growth in the Canadian mortgages portfolio. These increases were partially offset by the impact of the strengthening of the Australian Dollar since 31 March 2010.
Other financial assets at fair value through profit or loss increased $A2.5 billion from $A9.2 billion at 31 March 2010 to $A11.7 billion at 31 March 2011 and Investment securities available for sale decreased $A1.1 billion from $A18.2 billion at 31 March 2010 to $A17.1 billion at 31 March 2011 mainly due to liquidity management activities.
Interests in associates and joint ventures accounted for using the equity method decreased 29% from $A3.9 billion at 31 March 2010 to $A2.8 billion at 31 March 2011 largely as a result of the reclassification of some interests in associates and joint ventures to equity investments available for sale when the sale of either the respective fund managers (in the case of Macquarie-managed funds) or the sale of units in the relevant investment since 31 March 2010 resulted in a loss of significant influence over the investment. Such reclassifications included investments in Macquarie Atlas Roads Group and Intoll Group (together, formerly Macquarie Infrastructure Group), MAp Group and the Charter Hall REITs (formerly Macquarie Office Trust and Macquarie CountryWide). The strengthening of the Australian Dollar compared with major currencies since 31 March 2010 also contributed to a reduction in the value of investments held in foreign currencies.
Property, plant and equipment increased significantly from $A1.9 billion at 31 March 2010 to $A5.0 billion at 31 March 2011 partly due to the acquisition of 44 aircraft assets from ILFC during the year as well as the acquisition of the remaining stake in Macquarie AirFinance Limited resulting in the consolidation of the entity and its assets.
Macquarie Group Limited Management Discussion and Analysis macquarie.com.au
4.0 Balance sheet continued
48
Total liabilities (excluding loan capital) increased 8% from $A132.2 billion at 31 March 2010 to $A142.7 billion at 31 March 2011, an increase of $A10.5 billion. The main driver of the increase was the conversion of $A9.6 billion of CMT balances to CMA accounts in July 2010.
Total equity has increased $A163 million since 31 March 2010 to $A11.9 billion at 31 March 2011. The growth has been driven by an increase in retained earnings of $A313 million since 31 March 2010 and an increase in ordinary share capital of $A150 million, offset by an increase of $A288 million in treasury shares relating to MGL shares held for the Macquarie Group Employee Retained Equity Plan.

49
4.2 Loan assets
Reconciliation between loan assets per statutory and funded balance sheets.
As at Movement
Mar 11 $Ab
Sep 10 $Ab
Mar 10 $Ab
Sep 10 %
Mar 10 %
Loan assets at amortised cost per statutory balance sheet 46.0 45.1 44.3 2 4 Other loans held at fair value 2.5 2.3 2.9 9 (14) Operating lease assets 4.4 2.2 1.2 100 267 Less: loans held by consolidated SPEs which are available as security to noteholders and debt providers (12.8) (13.5) (15.2) (5) (16) Less: segregated funds (1.3) (1.4) (1.3) (7) — Less: margin balances (reclassed to trading) (2.0) (2.3) (2.4) (13) (17) Less: other reclassification (0.6) (0.3) — 100 * Total per funded balance sheet 36.2 32.1 29.5 13 23
Loan assets per the funded balance sheet are shown below in further detail.
As at Movement
Mar 11 $Ab
Sep 10 $Ab
Mar 10 $Ab
Sep 10 %
Mar 10 %
Mortgages: Australia 2.1 1.9 2.2 11 (5) United States 0.8 0.9 0.9 (11) (11) Canada 8.5 8.0 6.7 6 27
Structured investments 3.4 3.4 4.0 — (15) Banking 3.7 3.6 3.6 3 3 Real estate 0.4 0.5 0.6 (20) (33) Resources and commodities 1.5 1.5 1.7 — (12) Leasing (finance and operating) 8.2 5.9 3.7 39 122 Corporate and Asset Finance lending 6.5 5.2 5.1 25 27 Other lending 1.1 1.2 1.0 (8) 10 Total 36.2 32.1 29.5 13 23

Macquarie Group Limited Management Discussion and Analysis macquarie.com.au
4.0 Balance sheet continued
50
4.3 Equity investments
Equity investments are reported in the following categories in the statutory balance sheet: – Other financial assets at fair value through profit or loss – Investment securities available for sale – Interests in associates and joint ventures – Assets and disposal groups held for sale.
The classification is driven by a combination of the level of influence Macquarie has over the investment and management’s intention with respect to the holding of the asset in the short term. For the purpose of analysis, equity investments have been re-grouped into the following categories: – Investments in Macquarie-managed funds – Other investments not held for sale or are not investments in Macquarie-managed funds – Held for sale investments.
Equity investments reconciliation
As at Movement
Mar 11 $Am
Sep 10 $Am
Mar 10 $Am
Sep 10 %
Mar 10 %
Equity investments (excluding held for sale) Statutory balance sheet Equity investments within other financial assets at fair value through profit or loss 2,542 2,144 1,254 19 103 Equity investments within investment securities available for sale 2,541 2,737 1,345 (7) 89 Interests in associates and joint ventures accounted for using the equity method 2,790 2,719 3,927 3 (29) Total equity investments per statutory balance sheet 7,873 7,600 6,526 4 21 Adjustment for funded balance sheet Equity hedge positions1 (2,332) (1,830) (1,030) 27 126 Total funded equity investments 5,541 5,770 5,496 (4) 1 Adjustments for equity investments analysis Available for sale reserves2 (385) (228) (36) 69 * Associates reserves3 2 10 37 (80) (95) Total adjusted equity investments4 5,158 5,552 5,497 (7) (6)
Held for sale investments Net assets of disposal groups classified as held for sale 79 75 118 5 (33) Total equity investments including held for sale investments 5,237 5,627 5,615 (7) (7)
1 These relate to assets held for the purposes of economically hedging Macquarie's fair valued liabilities to external parties arising from various equity linked instruments. These have been excluded from the analysis of equity investment exposures as Macquarie does not have an economic exposure to them.
2 Available for sale reserves that will be released to income upon realisation of the investment. 3 Associates reserves that will be released to income upon realisation of the investment. 4 The adjusted book value represents the total net exposure to Macquarie.

51
Equity investments by category As at Movement
Mar 11 $Am
Sep 10 $Am
Mar 10 $Am
Sep 10 %
Mar 10 %
Macquarie-managed funds DUET Group 15 15 15 — — Macquarie DDR Trust — — 1 * (100) Macquarie Infrastructure Company 65 66 60 (2) 8 Macquarie Atlas Roads Group 80 80 80 — — Macquarie International Infrastructure Fund 54 54 55 — (2) Macquarie Korea Infrastructure Fund 51 52 55 (2) (7) Total listed MIRA managed funds 265 267 266 (1) (<1) Unlisted MIRA managed funds 615 542 521 13 18 Other Macquarie-managed funds 361 368 388 (2) (7) Total Macquarie-managed funds 1,241 1,177 1,175 5 6
Other investments Finance, investment, funds management and exchanges 609 749 748 (19) (19) Transport, industrial and infrastructure 1,803 2,202 2,242 (18) (20) Real estate 479 581 547 (18) (12) Debt investment entities 148 167 225 (11) (34) Energy and resources 509 362 289 41 76 Telecommunications, internet, media and entertainment 369 314 271 18 36 Total other investments 3,917 4,375 4,322 (10) (9) Held for sale investments 79 75 118 5 (33)
Total equity investments including held for sale investments 5,237 5,627 5,615 (7) (7)
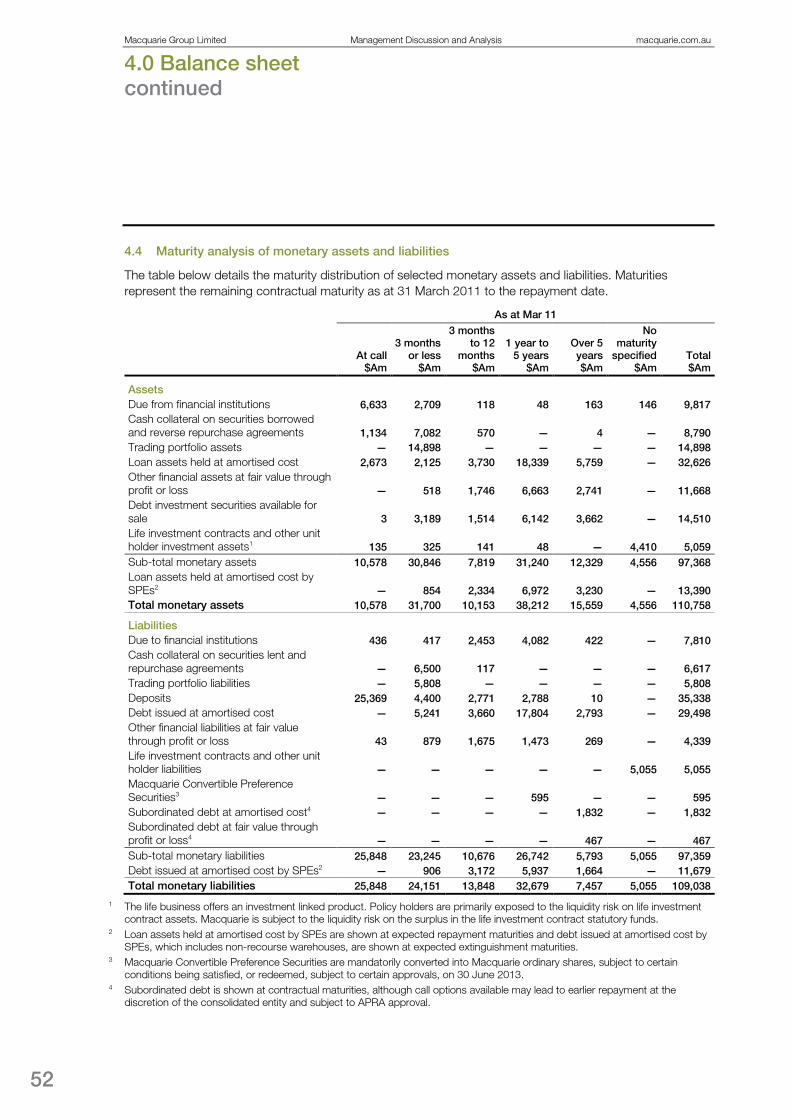
Macquarie Group Limited Management Discussion and Analysis macquarie.com.au
4.0 Balance sheet continued
52
4.4 Maturity analysis of monetary assets and liabilities
The table below details the maturity distribution of selected monetary assets and liabilities. Maturities represent the remaining contractual maturity as at 31 March 2011 to the repayment date.
As at Mar 11
At call $Am
3 months or less
$Am
3 months to 12
months $Am
1 year to 5 years
$Am
Over 5 years $Am
No maturity
specified $Am
Total $Am
Assets Due from financial institutions 6,633 2,709 118 48 163 146 9,817 Cash collateral on securities borrowed and reverse repurchase agreements 1,134 7,082 570 — 4 — 8,790 Trading portfolio assets — 14,898 — — — — 14,898 Loan assets held at amortised cost 2,673 2,125 3,730 18,339 5,759 — 32,626 Other financial assets at fair value through profit or loss — 518 1,746 6,663 2,741 — 11,668 Debt investment securities available for sale 3 3,189 1,514 6,142 3,662 — 14,510 Life investment contracts and other unit holder investment assets1 135 325 141 48 — 4,410 5,059 Sub-total monetary assets 10,578 30,846 7,819 31,240 12,329 4,556 97,368 Loan assets held at amortised cost by SPEs2 — 854 2,334 6,972 3,230 — 13,390 Total monetary assets 10,578 31,700 10,153 38,212 15,559 4,556 110,758
Liabilities Due to financial institutions 436 417 2,453 4,082 422 — 7,810 Cash collateral on securities lent and repurchase agreements — 6,500 117 — — — 6,617 Trading portfolio liabilities — 5,808 — — — — 5,808 Deposits 25,369 4,400 2,771 2,788 10 — 35,338 Debt issued at amortised cost — 5,241 3,660 17,804 2,793 — 29,498 Other financial liabilities at fair value through profit or loss 43 879 1,675 1,473 269 — 4,339 Life investment contracts and other unit holder liabilities — — — — — 5,055 5,055 Macquarie Convertible Preference Securities3 — — — 595 — — 595 Subordinated debt at amortised cost4 — — — — 1,832 — 1,832 Subordinated debt at fair value through profit or loss4 — — — — 467 — 467 Sub-total monetary liabilities 25,848 23,245 10,676 26,742 5,793 5,055 97,359 Debt issued at amortised cost by SPEs2 — 906 3,172 5,937 1,664 — 11,679 Total monetary liabilities 25,848 24,151 13,848 32,679 7,457 5,055 109,038
1 The life business offers an investment linked product. Policy holders are primarily exposed to the liquidity risk on life investment contract assets. Macquarie is subject to the liquidity risk on the surplus in the life investment contract statutory funds.
2 Loan assets held at amortised cost by SPEs are shown at expected repayment maturities and debt issued at amortised cost by SPEs, which includes non-recourse warehouses, are shown at expected extinguishment maturities.
3 Macquarie Convertible Preference Securities are mandatorily converted into Macquarie ordinary shares, subject to certain conditions being satisfied, or redeemed, subject to certain approvals, on 30 June 2013.
4 Subordinated debt is shown at contractual maturities, although call options available may lead to earlier repayment at the discretion of the consolidated entity and subject to APRA approval.

5.0 Funding and liquidity
53
5.1 Overview
The two primary external funding vehicles for the Group are MGL and MBL. MGL provides funding principally to the Non-Banking Group and limited funding to some MBL Group subsidiaries. MBL provides funding to the Banking Group.
The high level funding relationships of the Group are shown below:
Liquidity management
The Group’s liquidity risk management framework ensures that both MGL and MBL are able to meet their funding requirements as they fall due under a range of market conditions.
Liquidity management is performed centrally by Group Treasury, with oversight from the Asset and Liability Committee and the Risk Management Group (RMG). MGL Group and MBL Group’s liquidity policies are approved by their respective Boards after endorsement by the Asset and Liability Committee. The Asset and Liability Committee includes the Chief Executive Officer, Chief Financial Officer, Head of RMG, Treasurer and Business Group Heads.
RMG provides independent prudential oversight of liquidity risk management, including the independent validation of liquidity scenario assumptions, liquidity policies, and the required funding maturity profile.
Liquidity policy and principles
MGL provides funding predominantly to the Non-Banking Group. As such, the MGL liquidity policy outlines the liquidity requirements for the Non-Banking Group. The key requirement of the policy is that MGL is able to meet all of its liquidity obligations on a daily basis and during a period of liquidity stress: a 12 month period with no access to funding markets and with only a limited impact on franchise businesses.
Reflecting the longer-term nature of the Non-Banking Group asset profile, MGL is funded predominantly with a mixture of capital and long-term wholesale funding.
The MBL liquidity policy outlines the liquidity requirements for the Banking Group. The key requirement of the policy is that MBL is able to meet all of its liquidity obligations on a daily basis and during a period of liquidity stress: a 12 month period of constrained access to funding markets and with only a limited impact on franchise businesses. MBL is funded mainly by capital, long-term liabilities and deposits.

Macquarie Group Limited Management Discussion and Analysis macquarie.com.au
5.0 Funding and liquidity continued
54
The liquidity management principles apply to both MGL and MBL and include the following:
Liquidity and funding management – All liquidity requirements are managed centrally by Group Treasury – Liquidity risk is managed through setting limits on the maturity profile of assets and liabilities – A liquidity contingency plan is approved by the Board and reviewed periodically – A funding strategy is prepared annually – Internal pricing incorporates liquidity costs, benefits and risks to align risk-taking activities with liquidity
risk exposures – Diversity and stability of funding sources is a key priority. Liquidity limits – Term assets must be funded by term liabilities – Cash and liquid assets are sufficient to cover a 12 month stress scenario – Cash and liquid assets held to meet stress scenarios must be unencumbered, high quality liquid assets
and cash – Short-term assets exceed short-term wholesale liabilities.
Scenario analysis
Scenario analysis is central to the Group’s liquidity risk management framework. Group Treasury models a number of liquidity scenarios covering both market-wide crises and firm-specific crises. The objective of this modelling is to ensure MGL and MBL’s ability to meet all repayment obligations under each scenario and determine the capacity for asset growth. The modelling includes 12 month liquidity scenarios significantly more severe than the conditions that have been experienced since August 2007.
Scenarios are run over a number of timeframes and a range of conservative assumptions are used with regard to access to capital markets, deposit outflows, contingent funding requirements and asset sales.
Liquid asset holdings
Group Treasury maintains a portfolio of highly liquid unencumbered assets in both MGL and MBL to ensure adequate liquidity is available in all funding environments, including worst case conditions. The minimum liquid asset requirement is calculated from scenario projections and complies with minimum regulatory requirements.
To determine the minimum level of liquid assets, reference is made to the expected minimum cash requirement during a combined market-wide and firm-specific crisis scenario over a 12 month timeframe. This scenario assumes no access to new funding sources, a significant loss of deposits and contingent funding outflows resulting from undrawn commitments, market moves on derivatives and other margined positions. The size of the liquid asset portfolio must always exceed the minimum cash requirement as calculated in this model.
The liquid asset portfolio contains only unencumbered assets that can be relied on to maintain their liquidity in a crisis scenario. At least 90% of the liquid asset portfolio held to meet the minimum liquid asset requirement must be repo eligible with a central bank. The remainder must be approved by Group Treasury and RMG before inclusion in the liquid asset portfolio. As at 31 March 2011, 98% of the liquid asset portfolio was eligible for repurchase with central banks.
The liquid asset portfolio typically includes unencumbered cash and central bank repo eligible government, semi-government, supranational, government guaranteed and unguaranteed bank securities and AAA rated Australian residential mortgage backed securities. In addition, the portfolio includes other very short dated, high quality liquid assets such as A-1+ rated Australian residential mortgage backed commercial paper.
The liquid asset portfolio is largely denominated and held in Australian Dollars and to a lesser extent in US Dollars or other currencies where appropriate.

55
Liquidity contingency plan
Group Treasury maintains a liquidity contingency plan. The liquidity contingency plan applies to the entire Macquarie Group and defines roles and responsibilities and actions to be taken in a liquidity event. This includes identification of key information requirements and appropriate communication plans with both internal and external parties.
Specifically, the plan details factors that may constitute a crisis, the officer responsible for enacting the contingency management, a committee of senior executives who would be responsible for managing a crisis, the information required to effectively manage a crisis, a public relations strategy, a high level check list of actions to be taken and contact lists to facilitate prompt communication with all key internal and external stakeholders. The liquidity contingency plan is subject to regular review (at least annually) by both Group Treasury and RMG, and is submitted to the Board for approval.
Funding transfer pricing An internal funding transfer pricing framework is in place which aims to align businesses with the overall funding strategy of the Group. Under this framework the costs of long and short-term funding are charged out and credits are made to business units that provide long-term stable funding.
Credit ratings
Credit ratings at 31 March 2011 are detailed below.
Macquarie Group Limited Macquarie Bank Limited
Short-term rating
Long-term rating
Long-term rating
outlook Short-term
rating Long-term
rating
Long-term rating
outlook
Fitch Ratings F-1 A Stable F-1 A+ Stable Moody’s Investors Service P-1 A2 Negative P-1 A1 Negative Standard and Poor’s A-2 A- Stable A-1 A Stable
Regulatory developments
In December 2010, the Basel Committee finalised its framework for liquidity regulation and reconfirmed two proposed liquidity metrics: the Liquidity Coverage Ratio (LCR) and the Net Stable Funding Ratio (NSFR).
Liquidity Coverage Ratio
The LCR requires liquid assets to be held to cover cash outflows under a combined ‘idiosyncratic’ and market-wide stress scenario lasting 30 days. The ratio is subject to an observation period prior to being introduced as a minimum requirement by Basel in 2015.
The Basel Committee provided some scope within their latest proposals for countries with an insufficient quantity of eligible liquid assets to meet the narrow liquid asset definition proposed by Basel. In Australia, APRA subsequently announced this would take the form of a committed secured liquidity facility (for a fee) with the Reserve Bank of Australia (RBA). The facility would include all assets eligible for intra-day repurchase with the RBA and count towards meeting the overall LCR requirement. Details of the facility are yet to be finalised, including operational aspects and applicable fees.
At this stage, with the introduction of the above changes, Macquarie estimates that it will meet the overall requirements of the LCR. However, draft APRA standards have not yet been released and will be subject to change over the consultation period.

Macquarie Group Limited Management Discussion and Analysis macquarie.com.au
5.0 Funding and liquidity continued
56
Net Stable Funding Ratio
The NSFR is a 12 month structural funding metric, requiring that ‘available stable funding’ is sufficient to cover ‘required stable funding’, where ‘stable’ funding has an actual or assumed maturity of greater than 12 months. As with the LCR, the NSFR is subject to an observation period prior to being introduced as a minimum requirement by Basel in 2018.
Macquarie has minimal reliance on short term funding and has sufficient cash and liquid assets to repay all short-term wholesale funding. In addition, Macquarie’s internal liquidity policy requires that term assets are funded with term liabilities. As draft APRA standards have not been released, there is still uncertainty surrounding details of the NSFR and its full impact on Australian banks.
Macquarie continues to monitor developing liquidity regulations.
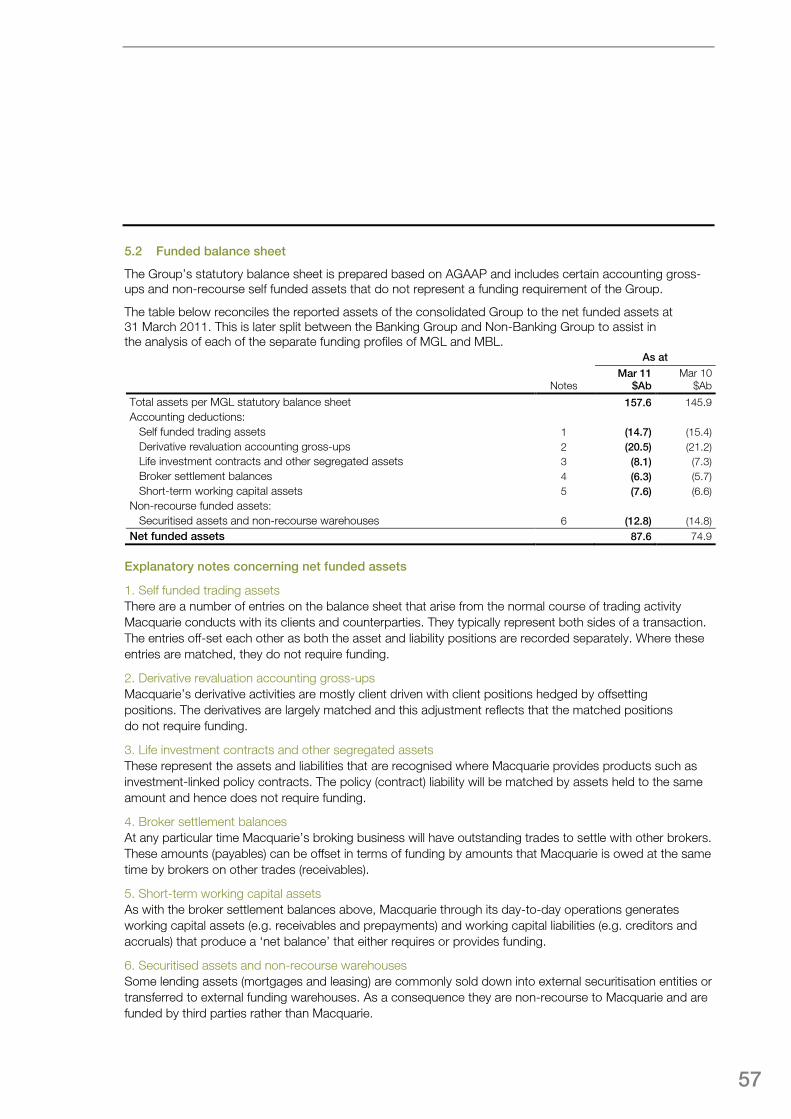
57
5.2 Funded balance sheet
The Group’s statutory balance sheet is prepared based on AGAAP and includes certain accounting gross-ups and non-recourse self funded assets that do not represent a funding requirement of the Group.
The table below reconciles the reported assets of the consolidated Group to the net funded assets at 31 March 2011. This is later split between the Banking Group and Non-Banking Group to assist in the analysis of each of the separate funding profiles of MGL and MBL.
As at
Notes Mar 11
$Ab Mar 10
$Ab
Total assets per MGL statutory balance sheet 157.6 145.9 Accounting deductions:
Self funded trading assets 1 (14.7) (15.4) Derivative revaluation accounting gross-ups 2 (20.5) (21.2) Life investment contracts and other segregated assets 3 (8.1) (7.3) Broker settlement balances 4 (6.3) (5.7) Short-term working capital assets 5 (7.6) (6.6)
Non-recourse funded assets: Securitised assets and non-recourse warehouses 6 (12.8) (14.8)
Net funded assets 87.6 74.9
Explanatory notes concerning net funded assets
1. Self funded trading assets There are a number of entries on the balance sheet that arise from the normal course of trading activity Macquarie conducts with its clients and counterparties. They typically represent both sides of a transaction. The entries off-set each other as both the asset and liability positions are recorded separately. Where these entries are matched, they do not require funding.
2. Derivative revaluation accounting gross-ups Macquarie’s derivative activities are mostly client driven with client positions hedged by offsetting positions. The derivatives are largely matched and this adjustment reflects that the matched positions do not require funding.
3. Life investment contracts and other segregated assets These represent the assets and liabilities that are recognised where Macquarie provides products such as investment-linked policy contracts. The policy (contract) liability will be matched by assets held to the same amount and hence does not require funding.
4. Broker settlement balances At any particular time Macquarie’s broking business will have outstanding trades to settle with other brokers. These amounts (payables) can be offset in terms of funding by amounts that Macquarie is owed at the same time by brokers on other trades (receivables).
5. Short-term working capital assets As with the broker settlement balances above, Macquarie through its day-to-day operations generates working capital assets (e.g. receivables and prepayments) and working capital liabilities (e.g. creditors and accruals) that produce a ‘net balance’ that either requires or provides funding.
6. Securitised assets and non-recourse warehouses Some lending assets (mortgages and leasing) are commonly sold down into external securitisation entities or transferred to external funding warehouses. As a consequence they are non-recourse to Macquarie and are funded by third parties rather than Macquarie.
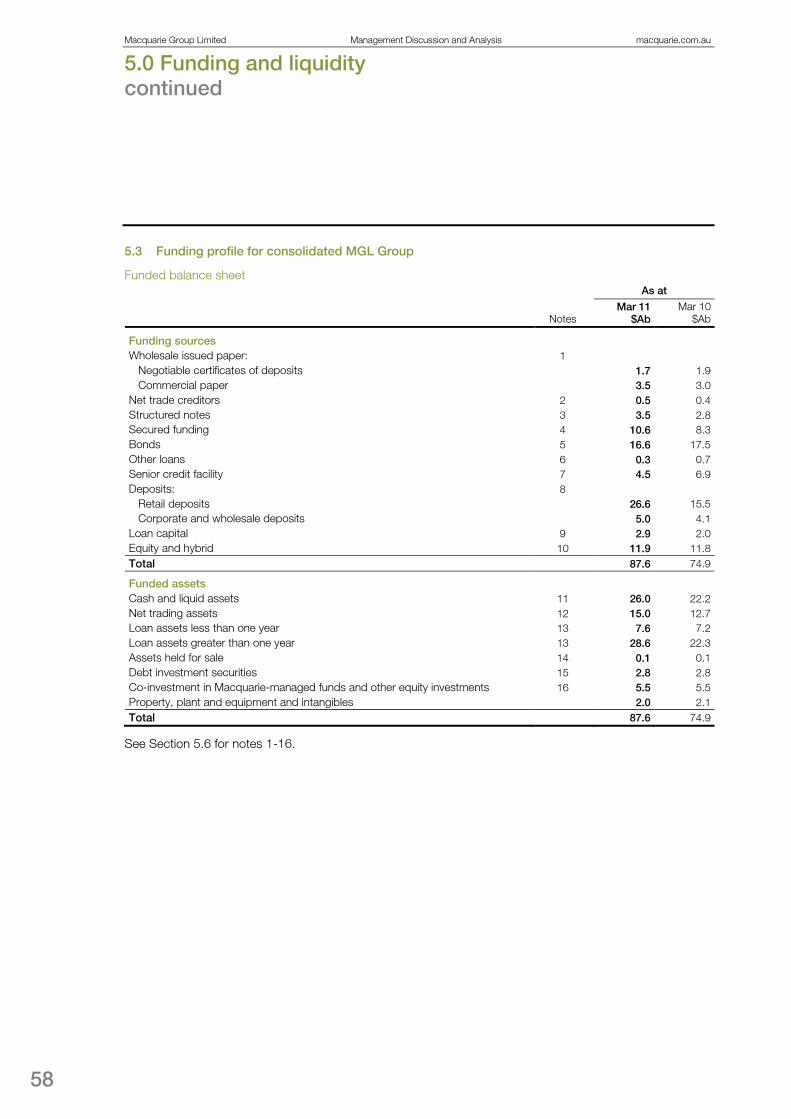
Macquarie Group Limited Management Discussion and Analysis macquarie.com.au
5.0 Funding and liquidity continued
58
5.3 Funding profile for consolidated MGL Group
Funded balance sheet
As at
Notes Mar 11
$Ab Mar 10
$Ab
Funding sources Wholesale issued paper: 1
Negotiable certificates of deposits 1.7 1.9 Commercial paper 3.5 3.0
Net trade creditors 2 0.5 0.4 Structured notes 3 3.5 2.8 Secured funding 4 10.6 8.3 Bonds 5 16.6 17.5 Other loans 6 0.3 0.7 Senior credit facility 7 4.5 6.9 Deposits: 8
Retail deposits 26.6 15.5 Corporate and wholesale deposits 5.0 4.1
Loan capital 9 2.9 2.0 Equity and hybrid 10 11.9 11.8 Total 87.6 74.9
Funded assets Cash and liquid assets 11 26.0 22.2 Net trading assets 12 15.0 12.7 Loan assets less than one year 13 7.6 7.2 Loan assets greater than one year 13 28.6 22.3 Assets held for sale 14 0.1 0.1 Debt investment securities 15 2.8 2.8 Co-investment in Macquarie-managed funds and other equity investments 16 5.5 5.5 Property, plant and equipment and intangibles 2.0 2.1 Total 87.6 74.9
See Section 5.6 for notes 1-16.

59
As at Mar 11
1-2yrs $Ab
2-3yrs $Ab
3-4yrs $Ab
4-5yrs $Ab
5yrs+ $Ab
Total $Ab
Structured notes 0.6 0.2 0.3 — 0.9 2.0 Secured funding 1.1 3.2 2.2 2.9 0.4 9.8 Bonds 1.6 4.9 3.8 — 2.7 13.0 Other loans — — — 0.2 — 0.2 Senior credit facility 2.1 — — — — 2.1 Total debt 5.4 8.3 6.3 3.1 4.0 27.1 Loan capital — 0.6 — 0.4 1.9 2.9 Equity and hybrid — — — — 11.9 11.9 Total funding sources drawn 5.4 8.9 6.3 3.5 17.8 41.9 Undrawn 0.3 — — 0.2 0.2 0.7 Total funding sources drawn and undrawn 5.7 8.9 6.3 3.7 18.0 42.6
Macquarie has a stable funding base, with minimal reliance on short-term wholesale funding markets. At 31 March 2011 MGL Group’s term assets were covered by term funding maturing beyond one year (including undrawn facilities), stable deposits and equity.
Excluding equity as a permanent source of funding, the weighted average term to maturity of term funding (excluding short-term funding) increased from 3.9 years at 31 March 2010 to 4.11
years at 31 March 2011.
1 Includes $A1 billion MBL subordinated debt issuance in April 2011.

Macquarie Group Limited Management Discussion and Analysis macquarie.com.au
5.0 Funding and liquidity continued
60
Term funding initiatives
Macquarie has a liability driven balance sheet approach where funding is put in place before assets are taken to the balance sheet. Since March 2010, MGL and MBL have continued to raise term wholesale funding.
Details of term funding raised since 31 March 20101
:
Banking Group
$Ab
Non-Banking
Group $Ab
Total $Ab
Securitised assets Term secured finance 6.1 — 6.1 Issued paper – Subordinated debt 1.8 — 1.8 – Senior 0.1 1.3 1.4 Loan capital – Preferred Membership Interests (PMIs) — 0.4 0.4 Total 8.0 1.7 9.7
The change in composition of the funded balance sheet is illustrated in the chart below.
1 Includes Structured Notes, Secured Funding, Bonds, Other Bank Loans maturing within the next 12 months and
Net Trade Creditors. 2 This represents the Group’s co-investment in Macquarie-managed funds and equity investments.
1 Includes $A1 billion MBL subordinated debt issuance and $A0.7 billion term secured finance in April 2011.

61
5.4 Funding profile for Banking Group
Funded balance sheet
As at
Notes Mar 11
$Ab Mar 10
$Ab
Funding sources Wholesale issued paper: 1
Negotiable certificates of deposits 1.7 1.9 Commercial paper 3.5 3.0
Structured notes 3 2.9 2.6 Secured funding 4 8.9 7.7 Bonds 5 12.5 14.3 Other loans 6 — 0.2 Deposits: 8
Retail deposits 26.6 15.5 Corporate and wholesale deposits 5.0 4.1
Loan capital 9 1.9 1.4 Equity and hybrid 10 9.1 8.5 Total 72.1 59.2
Funded assets Cash and liquid assets 11 23.8 20.1 Net trading assets 12 13.4 11.3 Loan assets less than one year 13 7.2 6.8 Loan assets greater than one year 13 26.2 21.3 Assets held for sale 14 — 0.1 Debt investment securities 15 2.6 2.5 MBL intra-group loan to MGL 0.7 1.2 Non-Banking Group deposit with MBL (4.6) (6.9) Co-investment in Macquarie-managed funds and other equity investments 16 1.8 1.6 Property, plant and equipment and intangibles 1.0 1.1 Net trade debtors 17 — 0.1 Total 72.1 59.2
See Section 5.6 for notes 1-17.

Macquarie Group Limited Management Discussion and Analysis macquarie.com.au
5.0 Funding and liquidity continued
62
As at Mar 11
1-2yrs $Ab
2-3yrs $Ab
3-4yrs $Ab
4-5yrs $Ab
5yrs+ $Ab
Total $Ab
Structured notes 0.6 0.2 0.3 — 0.3 1.4 Secured funding 0.9 2.1 2.2 2.7 0.4 8.3 Bonds 1.4 4.8 2.8 — — 9.0 Total debt 2.9 7.1 5.3 2.7 0.7 18.7 Loan capital — — — — 1.9 1.9 Equity and hybrid — — — — 9.1 9.1 Total funding sources drawn 2.9 7.1 5.3 2.7 11.7 29.7 Undrawn — — — 0.2 0.2 0.4 Total funding sources drawn and undrawn 2.9 7.1 5.3 2.9 11.9 30.1
The Banking Group has diversity of funding by both source and maturity. Term funding beyond one year (excluding equity) has a weighted average term to maturity of 4.01
1 Includes $A1 billion MBL subordinated debt issuance in April 2011.
years.

63
The key tools used for accessing wholesale debt funding markets for MBL, which primarily funds the Banking Group, are as follows: – $US25 billion multi-instrument Regulation S Debt Instrument Program, incorporating both Government
Guaranteed and unguaranteed securities that may be issued including Euro Commercial Paper, Euro Commercial Deposits, Euro-Medium Term Notes, senior and subordinated fixed/floating rate notes, and Transferable Deposits. The Debt Instrument Program had $US8.0 billion debt securities outstanding at 31 March 2011
– $US10 billion Commercial Paper Program incorporating Government Guaranteed and unguaranteed securities under which $US0.6 billion of debt securities were outstanding at 31 March 2011
– $US20 billion Rule 144A/Regulation S Medium Term Note Program incorporating both Government Guaranteed and unguaranteed securities. At 31 March 2011 issuance amounted to $US7.5 billion under the Rule 144A/Regulation S Medium Term Note Program.
MBL Group accesses the Australian capital markets through the issuance of Negotiable Certificates of Deposits. At 31 March 2011, MBL Group had $A1.7 billion of these securities outstanding.
MBL Group, as an ADI, has access to liquidity from the Reserve Bank of Australia’s (RBA) daily market operations. At 31 March 2011, MBL Group had internally securitised $A1.9 billion of its own mortgages, which is a form of collateral on the RBA’s list of eligible securities for repurchase agreements.
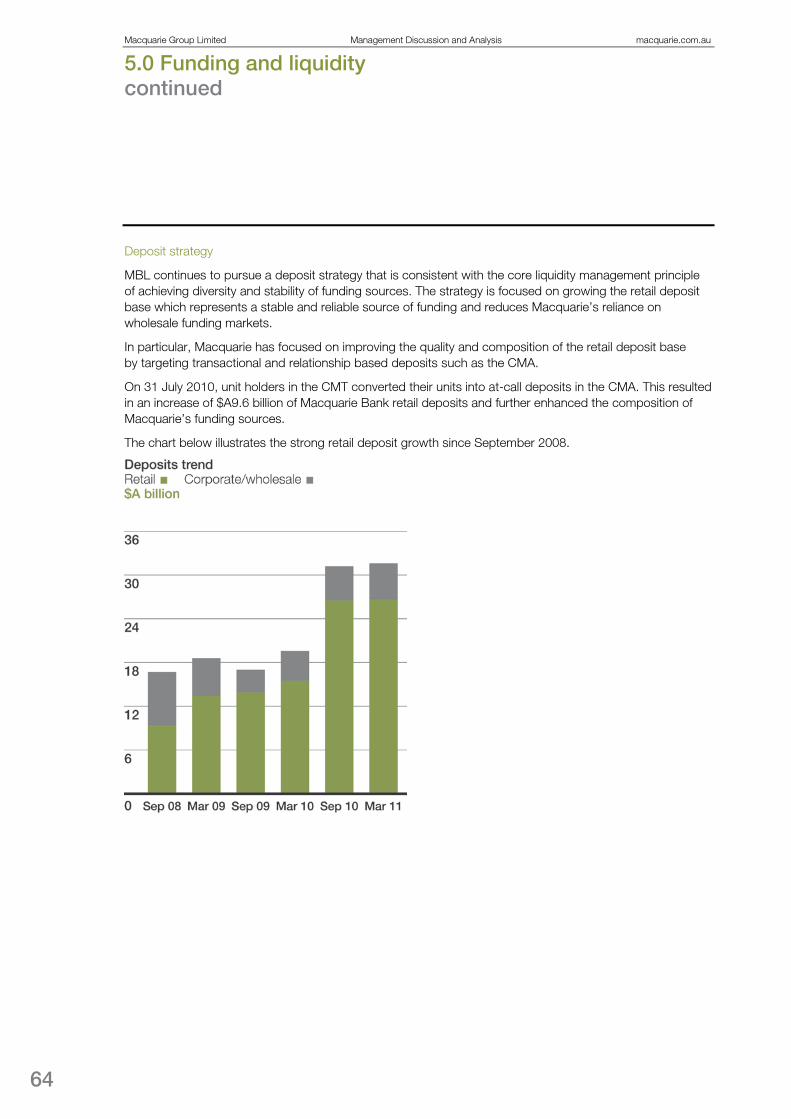
Macquarie Group Limited Management Discussion and Analysis macquarie.com.au
5.0 Funding and liquidity continued
64
Deposit strategy
MBL continues to pursue a deposit strategy that is consistent with the core liquidity management principle of achieving diversity and stability of funding sources. The strategy is focused on growing the retail deposit base which represents a stable and reliable source of funding and reduces Macquarie’s reliance on wholesale funding markets.
In particular, Macquarie has focused on improving the quality and composition of the retail deposit base by targeting transactional and relationship based deposits such as the CMA.
On 31 July 2010, unit holders in the CMT converted their units into at-call deposits in the CMA. This resulted in an increase of $A9.6 billion of Macquarie Bank retail deposits and further enhanced the composition of Macquarie’s funding sources.
The chart below illustrates the strong retail deposit growth since September 2008.

65
5.5 Funding profile for Non-Banking Group
Funded balance sheet
As at
Notes Mar 11
$Ab Mar 10
$Ab
Funding sources MBL intra-group loan to MGL 0.7 1.2 Net trade creditors 2 0.5 0.5 Structured notes 3 0.6 0.2 Secured funding 4 1.7 0.6 Bonds 5 4.1 3.2 Other loans 6 0.3 0.5 Senior credit facility 7 4.5 6.9 Loan capital 9 1.0 0.6 Equity 10 2.8 3.3 Total 16.2 17.0
Funded assets Cash and liquid assets 11 2.2 2.1 Non-Banking Group deposit with MBL 4.6 6.9 Net trading assets 12 1.6 1.4 Loan assets less than one year 13 0.4 0.4 Loan assets greater than one year 13 2.4 1.0 Assets held for sale 14 0.1 — Debt investment securities 15 0.2 0.3 Co-investment in Macquarie-managed funds and other equity investments 16 3.7 3.9 Property, plant and equipment and intangibles 1.0 1.0 Total 16.2 17.0
See Section 5.6 for notes 2-16.

Macquarie Group Limited Management Discussion and Analysis macquarie.com.au
5.0 Funding and liquidity continued
66
As at Mar 11
1-2yrs $Ab
2-3yrs $Ab
3-4yrs $Ab
4-5yrs $Ab
5yrs+ $Ab
Total $Ab
Structured notes — — — — 0.6 0.6 Secured funding 0.2 1.1 — 0.2 — 1.5 Bonds 0.2 0.1 1.0 — 2.7 4.0 Other loans — — — 0.2 — 0.2 Senior credit facility 2.1 — — — — 2.1 Total debt 2.5 1.2 1.0 0.4 3.3 8.4 Loan capital — 0.6 — 0.4 — 1.0 Equity — — — — 2.8 2.8 Total funding sources drawn 2.5 1.8 1.0 0.8 6.1 12.2 Undrawn 0.3 — — — — 0.3 Total funding sources drawn and undrawn 2.8 1.8 1.0 0.8 6.1 12.5

67
Term funding beyond one year (excluding equity) has a weighted average term to maturity of 4.51
The key tools used for debt funding of MGL, which primarily funds the activities of the Non-Banking Group, include:
years.
– Senior Credit Facility, which was $A4.5 billion drawn and $A0.5 billion undrawn at 31 March 2011 – $US10 billion Rule 144A/Regulation S Medium Term Note Program. $US3.7 billion was outstanding
under the Rule 144A/Regulation S Medium Term Note Program at 31 March 2011 – An intra-group loan from MBL. At 31 March 2011, the balance outstanding was $US0.7 billion, which
was repaid in full on 27 April 2011. – $US10 billion multi-instrument Regulation S Debt Instrument Program, under which securities that may
be issued include Euro Commercial Paper, Euro Commercial Deposits, Euro-Medium Term Notes, senior and subordinated fixed/floating rate notes, and Transferable Deposits and MGL Wholesale Notes. The Debt Instrument Program had $US0.5 billion debt securities outstanding at 31 March 2011.
1 Does not include $US0.7 billion intra-group loan, which was repaid in full in April 2011.

Macquarie Group Limited Management Discussion and Analysis macquarie.com.au
5.0 Funding and liquidity continued
68
5.6 Explanatory notes concerning funding sources and funded assets
1. Wholesale issued paper Unsecured short-term wholesale funding comprised of both Negotiable Certificates of Deposit and Commercial Paper.
2. Net trade creditors Short-term working capital balances (debtors and creditors) are created through the day-to-day operations of the Group. A net funding source (or use) will result due to timing differences in cash flows.
3. Structured notes These are debt instruments on which the return is linked to commodities, equities, currencies or other assets. They are generally issued as part of structured transactions with clients and are hedged with positions in underlying assets or derivative instruments.
4. Secured funding Certain funding arrangements secured against an asset (or pool of assets).
5. Bonds Unsecured long-term wholesale funding.
6. Other loans Unsecured loans provided by financial institutions and other counterparties.
7. Senior credit facility MGL’s senior credit facility provided by a syndicate of wholesale lenders.
8. Deposits Unsecured funding from retail, corporate and wholesale depositors. The Australian Government guarantee is made available on eligible deposits in MBL.
9. Loan capital Long-term subordinated debt, Convertible Preference Securities and Preferred Membership Interests.
10. Equity and hybrids Equity balances are comprised of issued capital, retained earnings and reserves. Hybrid instruments include the MIPS and MIS.
11. Cash and liquid assets Cash and liquid assets generally consist of amounts due from banks and short-term debt investment securities available for sale. Liquid assets are almost entirely repo eligible with central banks or are very short dated.
12. Net trading assets The net trading asset balance consists of financial markets and equity trading assets including the net derivative position and any margin or collateral balances. It also includes trading assets which are hedging structured notes issued.
13. Loan assets This represents all loans provided to retail and wholesale borrowers, in addition to operating lease assets.
14. Assets held for sale These are the net assets/liabilities of the held for sale categories on the balance sheet.
15. Debt investment securities These include various categories of debt securities including asset backed securities, bonds, commercial mortgage backed securities and residential mortgage backed securities.
16. Co-investment in Macquarie-managed funds and other equity investments These equity securities include co-investments in Macquarie managed funds.
17. Net trade debtors Short-term working capital balances (debtors and creditors) are created through the day-to-day operations of the Group. A net funding use (or source) will result due to timing differences in cash flows.
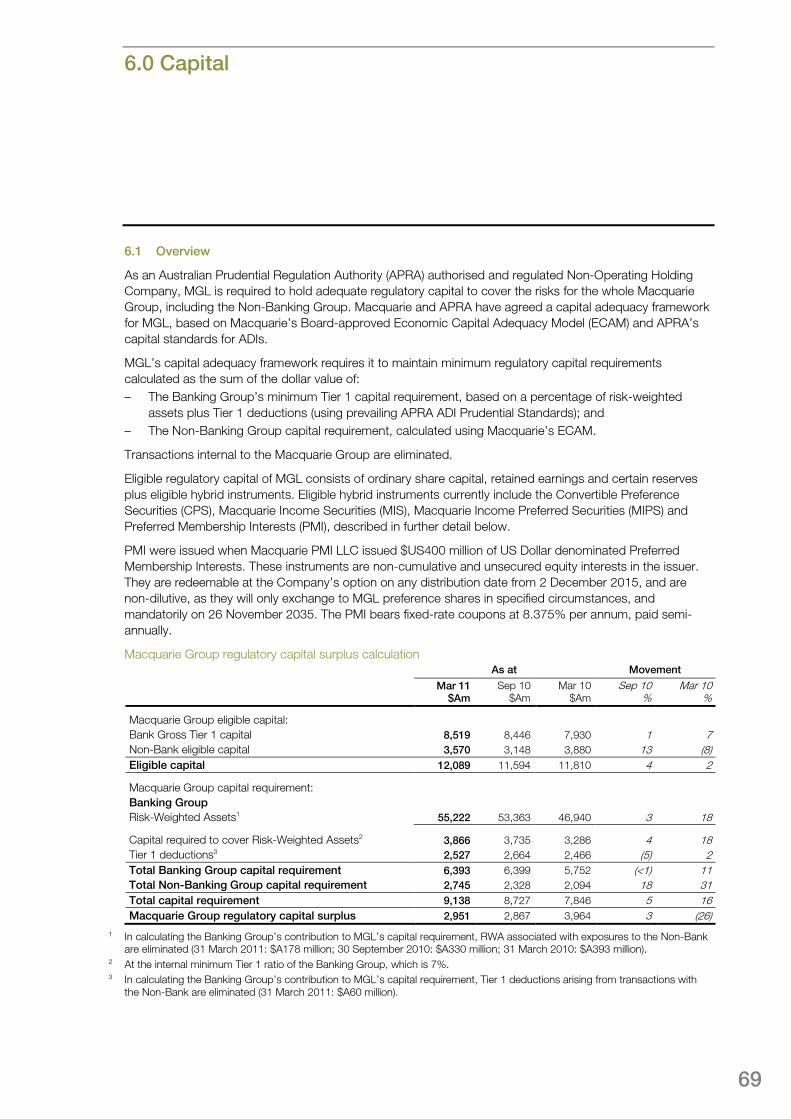
Macquarie Group Limited Management Discussion and Analysis macquarie.com.au
6.0 Capital
69
6.1 Overview
As an Australian Prudential Regulation Authority (APRA) authorised and regulated Non-Operating Holding Company, MGL is required to hold adequate regulatory capital to cover the risks for the whole Macquarie Group, including the Non-Banking Group. Macquarie and APRA have agreed a capital adequacy framework for MGL, based on Macquarie’s Board-approved Economic Capital Adequacy Model (ECAM) and APRA’s capital standards for ADIs.
MGL’s capital adequacy framework requires it to maintain minimum regulatory capital requirements calculated as the sum of the dollar value of: – The Banking Group’s minimum Tier 1 capital requirement, based on a percentage of risk-weighted
assets plus Tier 1 deductions (using prevailing APRA ADI Prudential Standards); and – The Non-Banking Group capital requirement, calculated using Macquarie’s ECAM.
Transactions internal to the Macquarie Group are eliminated.
Eligible regulatory capital of MGL consists of ordinary share capital, retained earnings and certain reserves plus eligible hybrid instruments. Eligible hybrid instruments currently include the Convertible Preference Securities (CPS), Macquarie Income Securities (MIS), Macquarie Income Preferred Securities (MIPS) and Preferred Membership Interests (PMI), described in further detail below.
PMI were issued when Macquarie PMI LLC issued $US400 million of US Dollar denominated Preferred Membership Interests. These instruments are non-cumulative and unsecured equity interests in the issuer. They are redeemable at the Company’s option on any distribution date from 2 December 2015, and are non-dilutive, as they will only exchange to MGL preference shares in specified circumstances, and mandatorily on 26 November 2035. The PMI bears fixed-rate coupons at 8.375% per annum, paid semi-annually.
Macquarie Group regulatory capital surplus calculation
As at Movement
Mar 11 $Am
Sep 10 $Am
Mar 10 $Am
Sep 10 %
Mar 10 %
Macquarie Group eligible capital: Bank Gross Tier 1 capital 8,519 8,446 7,930 1 7 Non-Bank eligible capital 3,570 3,148 3,880 13 (8) Eligible capital 12,089 11,594 11,810 4 2
Macquarie Group capital requirement: Banking Group Risk-Weighted Assets1 55,222 53,363 46,940 3 18
Capital required to cover Risk-Weighted Assets2 3,866 3,735 3,286 4 18 Tier 1 deductions3 2,527 2,664 2,466 (5) 2 Total Banking Group capital requirement 6,393 6,399 5,752 (<1) 11 Total Non-Banking Group capital requirement 2,745 2,328 2,094 18 31 Total capital requirement 9,138 8,727 7,846 5 16 Macquarie Group regulatory capital surplus 2,951 2,867 3,964 3 (26)
1 In calculating the Banking Group’s contribution to MGL’s capital requirement, RWA associated with exposures to the Non-Bank are eliminated (31 March 2011: $A178 million; 30 September 2010: $A330 million; 31 March 2010: $A393 million).
2 At the internal minimum Tier 1 ratio of the Banking Group, which is 7%. 3 In calculating the Banking Group’s contribution to MGL’s capital requirement, Tier 1 deductions arising from transactions with
the Non-Bank are eliminated (31 March 2011: $A60 million).

Macquarie Group Limited Management Discussion and Analysis macquarie.com.au
6.0 Capital continued
70
6.2 Banking Group capital
Macquarie Bank is accredited by APRA under the Basel II Foundation Internal Ratings Based Approach (FIRB) for credit risk, the Advanced Measurement Approach (AMA) for operational risk, the internal model approach for market risk and the internal model approach for interest rate risk in the banking book.
These advanced approaches place a higher reliance on a bank’s internal capital measures and therefore require a more sophisticated level of risk management and risk measurement practices.
APRA requires ADIs to have a minimum ratio of capital to risk weighted assets of 8% at both Level 1 (ELE Group) and Level 2 (Consolidated Banking Group), with at least half of this capital in the form of Tier 1 capital. In addition, APRA imposes ADI specific minimum capital ratios that may be higher than these levels. The MBL Group internal capital policy set by the Board requires capital floors above the minimum regulatory required levels.
Tier 1 capital
The MBL Group’s Tier 1 capital consists of ordinary share capital, retained earnings, certain reserves, plus eligible hybrid capital instruments. Reserves included in Tier 1 capital are the share based payment reserve and foreign currency translation reserve. The hybrid Tier 1 capital includes MIS and MIPS. MBL periodically pays dividends to MGL, and is recapitalised by MGL as required to support projected business growth.
MIS are a perpetual instrument with no conversion rights. MIS were listed for trading on the Australian Stock Exchange (now known as the Australian Securities Exchange) on 19 October 1999 and became redeemable (in whole or in part) at the Bank’s discretion on 19 November 2004. MIS distributions are paid quarterly at a floating rate of BBSW plus 1.7% per annum and payment is subject to certain conditions including profitability of the Bank.
MIPS were issued when the London branch of the Bank issued reset subordinated convertible debentures to Macquarie Capital Funding LP, a controlled entity of the Bank. The convertible debentures currently pay a fixed return of 6.177% per annum until April 2020. As at 31 March 2011, Macquarie Bank had £42.5 million of MIPS on issue which are held by parties not associated with Macquarie.
Tier 2 capital
The MBL Group Upper Tier 2 capital consists of a portion of certain equity reserves. The MBL Group Lower Tier 2 capital consists of subordinated debt issued to financial institutions, subject to limits imposed by APRA based on Tier 1 capital. Repayment of this debt is subordinated to the claims of depositors and other creditors but ranks ahead of equity instruments.
During the year ended 31 March 2011, the Group issued $A827 million, repurchased $A41 million, and redeemed $A234 million of subordinated debt instruments. Remaining movements related to changes in value as a result of foreign currency fluctuations.
Pillar 3
The APRA Prudential Standard APS 330 Capital Adequacy: Public Disclosure of Prudential Information (Pillar 3) details the market disclosure requirements for Australian domiciled banks. APS 330 requires qualitative and quantitative disclosure of risk management practices and capital adequacy.
These disclosures are required to be published within 40 business days of the reporting date and are available on Macquarie’s website.

71
Banking Group total capital base
As at Movement Mar 11
$Am Sep 10
$Am Mar 10
$Am Sep 10
% Mar 10
%
Tier 1 capital Paid-up ordinary share capital 7,379 7,235 6,595 2 12 Reserves (457) (257) (86) 78 * Retained earnings 1,142 1,011 962 13 19 Innovative Tier 1 capital 455 457 459 (<1) (1) Gross Tier 1 capital 8,519 8,446 7,930 1 7 Deductions from Tier 1 capital:
Goodwill 181 193 193 (6) (6) Deferred tax assets 291 381 434 (24) (33) Changes in the ADI’s own creditworthiness on banking book liabilities 51 66 49 (23) 4 Intangible component of investments in non-consolidated subsidiaries and other non-Level 2 entities 583 610 621 (4) (6) Loan and lease origination fees and commissions paid to mortgage originators and brokers 97 131 132 (26) (27) Other Tier 1 capital deductions 231 252 283 (8) (18)
Deductions from Tier 1 capital only 1,434 1,633 1,712 (12) (16) 50/50 deductions from Tier 1 capital:
Non-subsidiary entities exceeding prescribed limits (50%) 347 312 151 11 130 Non-consolidated subsidiaries (50%) 276 275 255 <1 8 All other deductions relating to securitisation (50%) 277 165 43 68 * Shortfall in provisions for credit losses (50%) 141 155 171 (9) (18) Other 50/50 deductions from Tier 1 capital (50%) 112 124 134 (10) (16)
Total 50/50 deductions from Tier 1 capital 1,153 1,031 754 12 53 Total Tier 1 capital deductions 2,587 2,664 2,466 (3) 5 Net Tier 1 capital 5,932 5,782 5,464 3 9
Tier 2 capital Upper Tier 2 capital:
Other Upper Tier 2 capital instruments 212 180 168 18 26 Lower Tier 2 capital:
Term subordinated debt 1,871 1,959 1,404 (4) 33 Gross Tier 2 capital 2,083 2,139 1,572 (3) 33 Deductions from Tier 2 capital:
50/50 deductions from Tier 2 capital 1,153 1,031 754 12 53 Total Tier 2 capital deductions 1,153 1,031 754 12 53 Net Tier 2 capital 930 1,108 818 (16) 14
Total capital base 6,862 6,890 6,282 (<1) 9
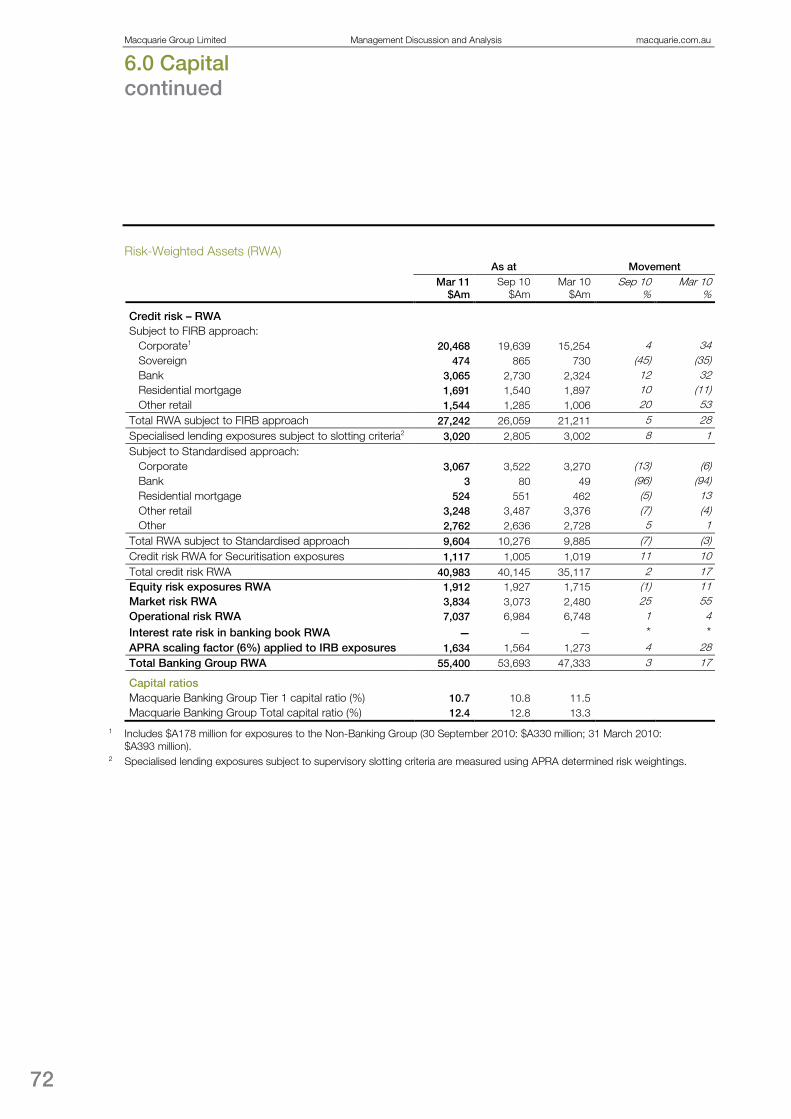
Macquarie Group Limited Management Discussion and Analysis macquarie.com.au
6.0 Capital continued
72
Risk-Weighted Assets (RWA)
As at Movement Mar 11
$Am Sep 10
$Am Mar 10
$Am Sep 10
% Mar 10
%
Credit risk – RWA Subject to FIRB approach:
Corporate1 20,468 19,639 15,254 4 34 Sovereign 474 865 730 (45) (35) Bank 3,065 2,730 2,324 12 32 Residential mortgage 1,691 1,540 1,897 10 (11) Other retail 1,544 1,285 1,006 20 53
Total RWA subject to FIRB approach 27,242 26,059 21,211 5 28 Specialised lending exposures subject to slotting criteria2 3,020 2,805 3,002 8 1 Subject to Standardised approach:
Corporate 3,067 3,522 3,270 (13) (6) Bank 3 80 49 (96) (94) Residential mortgage 524 551 462 (5) 13 Other retail 3,248 3,487 3,376 (7) (4) Other 2,762 2,636 2,728 5 1
Total RWA subject to Standardised approach 9,604 10,276 9,885 (7) (3) Credit risk RWA for Securitisation exposures 1,117 1,005 1,019 11 10 Total credit risk RWA 40,983 40,145 35,117 2 17 Equity risk exposures RWA 1,912 1,927 1,715 (1) 11 Market risk RWA 3,834 3,073 2,480 25 55 Operational risk RWA 7,037 6,984 6,748 1 4
Interest rate risk in banking book RWA — — — * * APRA scaling factor (6%) applied to IRB exposures 1,634 1,564 1,273 4 28 Total Banking Group RWA 55,400 53,693 47,333 3 17
Capital ratios
Macquarie Banking Group Tier 1 capital ratio (%) 10.7 10.8 11.5 Macquarie Banking Group Total capital ratio (%) 12.4 12.8 13.3
1 Includes $A178 million for exposures to the Non-Banking Group (30 September 2010: $A330 million; 31 March 2010: $A393 million).
2 Specialised lending exposures subject to supervisory slotting criteria are measured using APRA determined risk weightings.
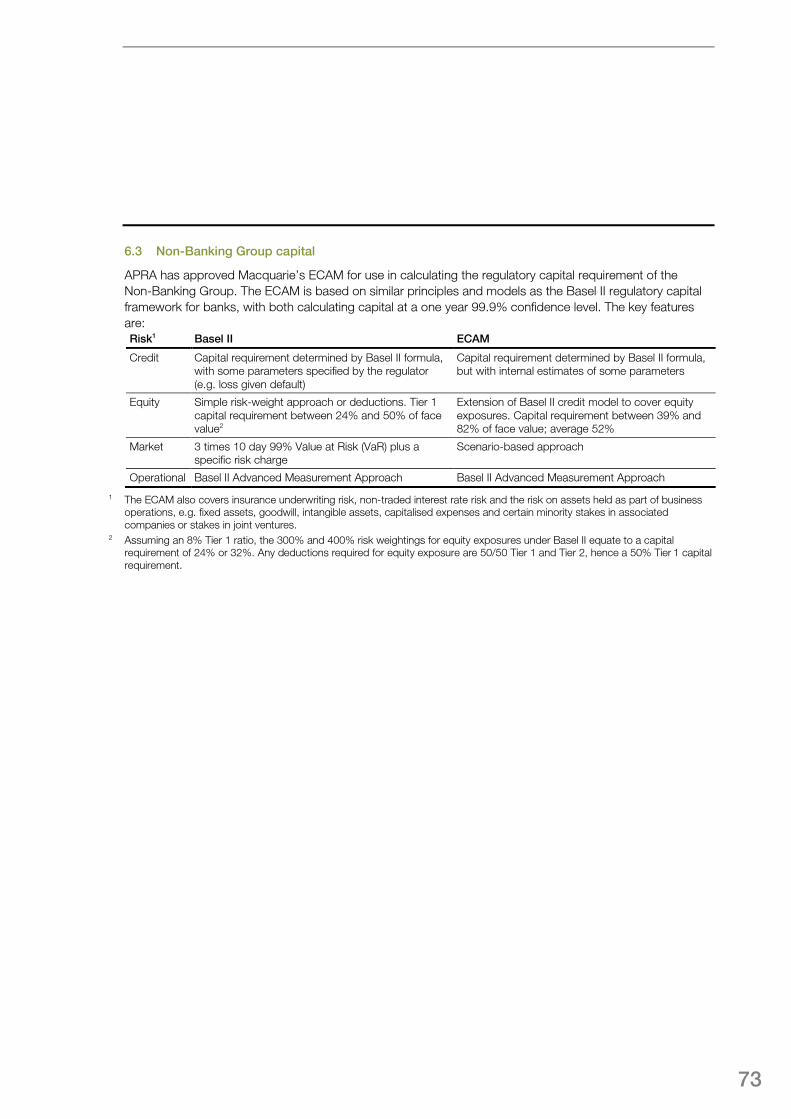
73
6.3 Non-Banking Group capital
APRA has approved Macquarie’s ECAM for use in calculating the regulatory capital requirement of the Non-Banking Group. The ECAM is based on similar principles and models as the Basel II regulatory capital framework for banks, with both calculating capital at a one year 99.9% confidence level. The key features are: Risk1 Basel II ECAM
Credit Capital requirement determined by Basel II formula, with some parameters specified by the regulator (e.g. loss given default)
Capital requirement determined by Basel II formula, but with internal estimates of some parameters
Equity Simple risk-weight approach or deductions. Tier 1 capital requirement between 24% and 50% of face value2
Extension of Basel II credit model to cover equity exposures. Capital requirement between 39% and 82% of face value; average 52%
Market 3 times 10 day 99% Value at Risk (VaR) plus a specific risk charge
Scenario-based approach
Operational Basel II Advanced Measurement Approach Basel II Advanced Measurement Approach
1 The ECAM also covers insurance underwriting risk, non-traded interest rate risk and the risk on assets held as part of business operations, e.g. fixed assets, goodwill, intangible assets, capitalised expenses and certain minority stakes in associated companies or stakes in joint ventures.
2 Assuming an 8% Tier 1 ratio, the 300% and 400% risk weightings for equity exposures under Basel II equate to a capital requirement of 24% or 32%. Any deductions required for equity exposure are 50/50 Tier 1 and Tier 2, hence a 50% Tier 1 capital requirement.

Macquarie Group Limited Management Discussion and Analysis macquarie.com.au
6.0 Capital continued
74
Non-Banking Group regulatory capital requirement
The capital requirement of the Non-Banking Group is set out in the table below.
As at Mar 11
Asset $Ab
Capital requirement
$Am Equivalent risk weight
Funded assets Cash and liquid assets 2.2 24 14% Loan assets1 2.8 278 124% Assets held for sale 0.1 42 648% Debt investment securities 0.2 9 48% Co-investments in Macquarie-managed funds and equity investments 3.6 1,690 581% Co-investments in Macquarie-managed funds and equity investments (relating to Directors’ profit share) 0.1 Property, plant and equipment and intangibles2 1.0 283 371% Non Banking Group deposit with MBL 4.6 Net Trading Assets 1.6 Total funded assets 16.2 2,326
Self-funded and non-recourse assets Self funded trading assets 1.7 Broker settlement balances 4.9 Derivative revaluation accounting gross-ups (0.1) Working capital assets 3.4 Total self-funded and non-recourse assets 9.9 Total Non-Banking Group assets 26.1 Off balance sheets exposures, operational, market and other risk and diversification offset3 419 Non-Banking Group capital requirement 2,745
1 Includes leases. 2 A component of the intangibles relating to the acquisitions of Orion Financial Inc. and Tristone Capital Global Inc. are supported
100% by exchangeable shares. These exchangeable shares have not been included in eligible regulatory capital. 3 Includes capital associated with net trading assets (e.g. market risk capital).
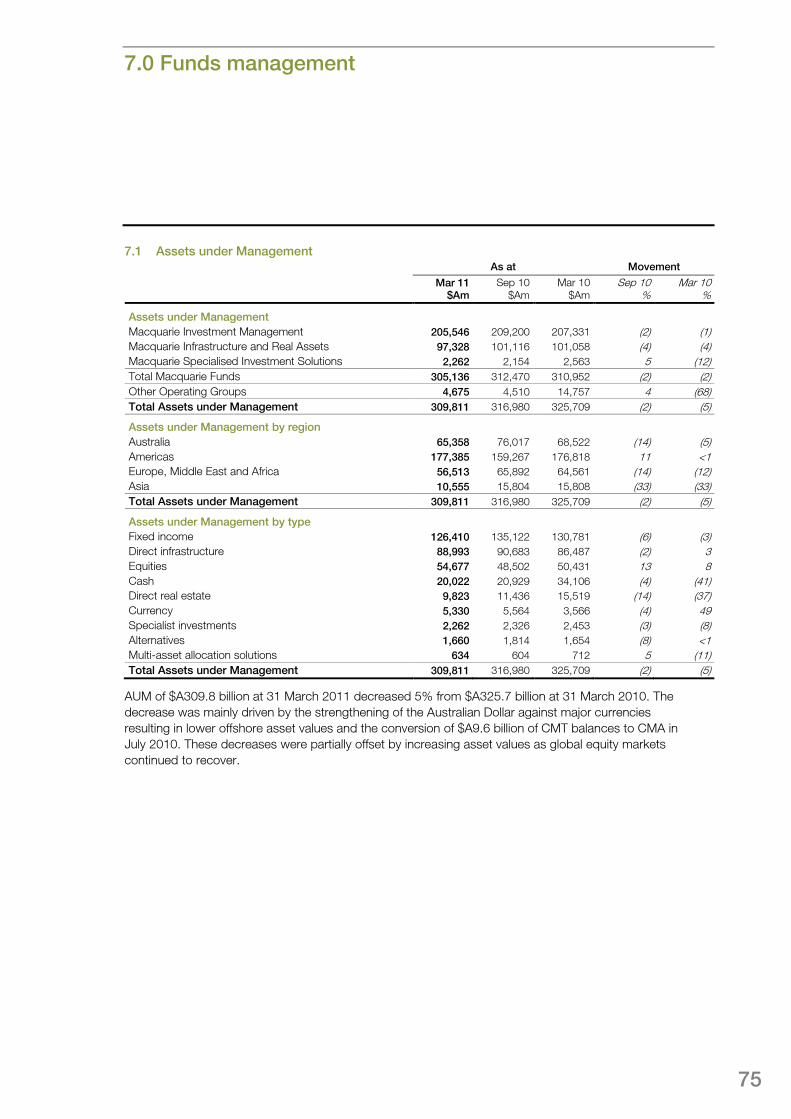
7.0 Funds management
75
7.1 Assets under Management
AUM of $A309.8 billion at 31 March 2011 decreased 5% from $A325.7 billion at 31 March 2010. The decrease was mainly driven by the strengthening of the Australian Dollar against major currencies resulting in lower offshore asset values and the conversion of $A9.6 billion of CMT balances to CMA in July 2010. These decreases were partially offset by increasing asset values as global equity markets continued to recover.
As at Movement
Mar 11 $Am
Sep 10 $Am
Mar 10 $Am
Sep 10 %
Mar 10 %
Assets under Management Macquarie Investment Management 205,546 209,200 207,331 (2) (1) Macquarie Infrastructure and Real Assets 97,328 101,116 101,058 (4) (4) Macquarie Specialised Investment Solutions 2,262 2,154 2,563 5 (12) Total Macquarie Funds 305,136 312,470 310,952 (2) (2) Other Operating Groups 4,675 4,510 14,757 4 (68) Total Assets under Management 309,811 316,980 325,709 (2) (5)
Assets under Management by region Australia 65,358 76,017 68,522 (14) (5) Americas 177,385 159,267 176,818 11 <1 Europe, Middle East and Africa 56,513 65,892 64,561 (14) (12) Asia 10,555 15,804 15,808 (33) (33) Total Assets under Management 309,811 316,980 325,709 (2) (5)
Assets under Management by type Fixed income 126,410 135,122 130,781 (6) (3) Direct infrastructure 88,993 90,683 86,487 (2) 3 Equities 54,677 48,502 50,431 13 8 Cash 20,022 20,929 34,106 (4) (41) Direct real estate 9,823 11,436 15,519 (14) (37) Currency 5,330 5,564 3,566 (4) 49 Specialist investments 2,262 2,326 2,453 (3) (8) Alternatives 1,660 1,814 1,654 (8) <1 Multi-asset allocation solutions 634 604 712 5 (11) Total Assets under Management 309,811 316,980 325,709 (2) (5)

Macquarie Group Limited Management Discussion and Analysis macquarie.com.au
7.0 Funds management continued
76
7.2 Equity under Management
The MIRA division of Macquarie Funds tracks its funds under management using an Equity under Management (EUM) measure as base management fee income is more closely aligned with EUM. EUM differs from the AUM measure which other Macquarie-managed funds use to determine base fee income. EUM is determined as follows:
Type of equity investment Basis of EUM calculation
Listed equity – Market capitalisation at the measurement date plus underwritten or committed future capital raisings for listed funds and face value for hybrid instruments
Unlisted equity – Committed capital from investors at the measurement date less called capital subsequently returned to investors for unlisted funds
– Invested capital at measurement date for managed businesses1
1 Managed businesses includes third party equity invested in MIRA managed businesses where management fees may be payable to Macquarie.
If a fund is managed through a joint venture with another party, the EUM amount is weighted based on Macquarie’s proportionate economic interest in the joint venture management entity.
Equity under Management by type and region
As at1,2 Movement Mar 11
$Am Sep 10
$Am Mar 10
$Am Sep 10
% Mar 10
%
Equity under Management by type Listed equity 4,485 3,836 3,577 17 25 Unlisted equity 31,908 33,986 35,000 (6) (9)
Total EUM 36,393 37,822 38,577 (4) (6)
Equity under Management by region3 Australia 4,754 4,662 4,319 2 10 Europe, Middle East and Africa 15,658 17,594 18,336 (11) (15) Americas 11,396 12,017 12,376 (5) (8) Asia 4,585 3,549 3,546 29 29
Total EUM 36,393 37,822 38,577 (4) (6)
1 Excludes equity invested by Macquarie Group in businesses managed by MIRA. 2 Where a fund’s EUM is denominated in a foreign currency, amounts are translated to Australian Dollars at the exchange rate
prevailing at the measurement date. 3 By location of fund management team.
EUM of $A36.4 billion at 31 March 2011 decreased 6% from $A38.6 billion at 31 March 2010. The decrease was mainly driven by the strengthening of the Australian Dollar against major currencies, partially offset by increases in listed equity prices.

8.0 Glossary
77
AASB Australian Accounting Standards Board.
ADI Authorised Deposit-taking Institution.
AGAAP Australian Generally Accepted Accounting Principles.
AMA Advanced Measurement Approach (for determining operational risk).
APRA Australian Prudential Regulation Authority.
Asset under Management (AUM)
AUM is a metric that provides a consistent basis for measuring Macquarie’s funds management activities. AUM is calculated as the proportional ownership interest in the underlying assets of funds and mandated assets that Macquarie actively manages for the purpose of wealth creation, adjusted to exclude cross-holdings in funds and reflect Macquarie’s proportional ownership interest of the fund manager.
Assets under Management by region
AUM by region is defined by the location of the assets, as opposed to the domicile of the fund or fund manager.
Associates Associates are entities over which Macquarie has significant influence, but not control. Investments in associates may be further classified as HFS associates. HFS investments are those that have a high probability of being sold within 12 months to external parties. Associates that are not held for sale are carried at cost and equity-accounted. Macquarie’s share of the investment’s post-acquisition profits or losses is recognised in the income statement and its share of post-acquisition movements in reserves is recognised within equity.
ASX Australian Securities Exchange (formerly Australian Stock Exchange).
Available for Sale (AVS) AVS assets are investments where Macquarie does not have significant influence or control and are intended to be held for an indefinite period. AVS investments are initially recognised at cost and revalued in subsequent periods to recognise changes in the assets’ fair value with these revaluations included in the AVS reserve in equity. If and when the AVS asset is sold or impaired, the cumulative unrealised gain or loss will be recognised in the income statement.
BBSW Bank Bill Swap Rate.
CMA Cash Management Account.
CMT Cash Management Trust.
Collective allowance for credit losses
The provision relating to loan losses inherent in a loan portfolio that have not yet been specifically identified.
Contingent liabilities Defined in AASB 137 ‘Provisions, Contingent Liabilities and Contingent Assets’ as a possible obligation that arises from past events and whose existence will be confirmed only by the occurrence or non-occurrence of one or more uncertain future events not wholly within the control of the entity; or a present obligation that arises from past events but is not recognised because it is not probable to occur or the amount cannot be reliably measured.
CPS Convertible Preference Securities.
CEA Credit Equivalent Amount. The on balance sheet equivalent value of an off balance sheet transaction.

Macquarie Group Limited Management Discussion and Analysis macquarie.com.au
8.0 Glossary continued
78
Deconsolidated entities Entities involved in conducting insurance, funds management and non financial operations including special purpose vehicles (SPV) that are not consolidated for the APRA regulatory reporting group.
Directors’ Profit Share (DPS) The pre-2009 remuneration arrangement in which 20 per cent of each Executive Director’s annual gross profit share allocation is withheld and is subject to restrictions through the DPS Plan. The DPS Plan is a tool in Macquarie’s retention and alignment strategies, encompassing both long-term retention arrangements and equity holding requirements. The amounts retained under the DPS Plan begin to vest after five years of service as an Executive Director and fully vest after ten years. Vested amounts are then released to an Executive Director at the earliest of the Executive Director’s ceasing employment or at the end of a ten year period.
Dividend reinvestment plan (DRP)
The plan that provides shareholders with the opportunity to reinvest part or all of their dividends as additional shares in Macquarie, with no transaction costs.
EAD Exposure at Default – the gross exposure under a facility (the amount that is legally owed to the ADI) upon default of an obligor.
Earnings on capital and certain corporate income items
Total operating income includes the income generated by Macquarie’s operating groups, income from the investment of Macquarie’s capital, and certain items of operating income not attributed to Macquarie’s operating groups. Earnings on capital and certain corporate income items is total operating income less the operating income generated by Macquarie’s operating groups.
Earnings per share A performance measure that measures earnings attributable to each ordinary share, defined in AASB 133 ‘Earnings Per Share’.
ECAI External Credit Assessment Institution.
ECAM Economic Capital Adequacy Model.
Effective tax rate The income tax expense as a percentage of the profit before income tax adjusted for MIS and MIPS distributions paid or provided.
EL Expected Loss, which is a function of PD and LGD.
ELE Extended Licensed Entity is an entity that is treated as part of the ADI (Level 1) for the purpose of measuring the ADI’s capital adequacy and exposures to related entities. The criterion for qualification as an ELE is detailed in the APRA Prudential Standards.
Equity under management (EUM)
Refer definition in Section 7.2.
ERL Equity Risk Limit – Board imposed limit by which equity risk positions are managed.
Expense/Income ratio Total operating expenses expressed as a percentage of total operating income.
Fair value through profit or loss
Other financial assets at fair value through profit or loss include those financial assets that contain embedded derivatives which must be otherwise separated and carried at fair value if it is part of a group of financial assets managed and evaluated on a fair value basis.

79
FIRB Foundation Internal Ratings Based Approach whereby PD and Maturity are internally estimated by the ADI and LGD is set by APRA.
FX Foreign exchange.
Gross credit risk exposure The potential loss that Macquarie would incur as a result of a default by an obligor excluding the impact of netting and credit risk mitigation.
Headcount Headcount includes both permanent staff (full time, part time and fixed term hires) and contractors (including consultants and secondees). It excludes temporary staff, staff on leave without pay and staff on parental leave. Headcount figures include employees of Macquarie Group subsidiaries, except where the entity is acquired with the intention of disposal (i.e. businesses held for sale).
ICAAP Internal Capital Adequacy Assessment Process.
International income International income provides a consistent basis for determining the size of Macquarie’s operations outside of Australia. Operating income is classified as ‘international’ with reference to the geographic location from which the operating income is generated. This may not be the same geographic location where the operating income is recognised. For example, operating income generated by work performed for clients based overseas but recognised in Australia for reporting purposes would be classified as ‘international’ income. Income from funds management activities is allocated by reference to the location of the fund’s assets.
IPO Initial public offering.
Level 2 MBL Regulatory Group
MBL, its parent Macquarie B.H. Pty Limited and MBL’s subsidiaries but excluding deconsolidated entities for APRA reporting purposes.
Level 3 Regulatory Group MGL and its subsidiaries.
LGD Loss given default is the economic loss which arises upon default of the obligor.
Macquarie Income Preferred Securities (MIPS)
MIPS were issued when the London branch of the Bank issued 7,000 reset subordinated convertible debentures, each with a face value of £50,000, to Macquarie Capital Funding LP, a controlled entity of the Bank. The convertible debentures currently pay a fixed return of 6.177% until April 2020. As at 31 March 2011, Macquarie Bank had £42.5 million of MIPS on issue which are held by parties not associated with Macquarie.
Macquarie Income Securities (MIS)
The Macquarie Income Securities (MIS) are perpetual and carry no conversion rights. Distributions are paid quarterly, based on a floating rate of BBSW plus 1.7%. Subject to limitations on the amount of hybrids eligible for inclusion as Tier 1 Capital, they qualify as Tier 1 Capital. They are treated as equity in the balance sheet. There are four million $A100 face value MIS on issue.
Managed assets Managed assets include third party equity invested in assets managed by Macquarie Infrastructure and Real Assets (MIRA) where management fees may be payable to Macquarie; and assets held directly by Macquarie acquired with a view that they may be sold into new or existing funds managed by MIRA. This measure excludes assets of Macquarie-managed funds.

Macquarie Group Limited Management Discussion and Analysis macquarie.com.au
8.0 Glossary continued
80
MBI Macquarie Bank International Limited.
MBL Macquarie Bank Limited.
MGL Macquarie Group Limited.
Net loan losses The impact on the income statement of loan amounts provided for or written-off during the period, net of the recovery of any such amounts which were previously written-off or provided for out of the income statement.
Net profit interests A share of production or proceeds from production derived from rights to various commodity assets (without the obligation to pay any of the costs of explorations and development).
Net tangible assets per ordinary share
(Total equity less Macquarie Income Securities less non-controlling interest less the Future Income Tax Benefit plus the Deferred Tax Liability less Intangible assets) divided by the number of ordinary shares on issue at the end of the period.
Non-GAAP metrics Non-GAAP metrics include financial measures, ratios and other information that are either not required or defined under Australian Accounting Standards.
PCE Potential Credit Exposure. The potential exposures arising on a transaction calculated as the notional principal amount multiplied by a credit conversion factor specified by APRA.
PD Probability of Default. The likelihood of an obligor not satisfying its financial obligations.
Preferred Membership Interests (PMI)
On 2 December 2010, Macquarie PMI LLC, a subsidiary of the Company, issued $US400 million of US Dollar denominated Preferred Membership Interests (Macquarie PMI). These instruments are non-cumulative and unsecured equity interests in the issuer. They are redeemable at the Company’s option on any distribution date from 2 December 2015, and are non-dilutive, as they will only exchange to MGL preference shares in specified circumstances, and mandatorily on 26 November 2035. The PMI bears fixed-rate coupons at 8.375 per cent per annum, paid semi-annually.
REIT Real Estate Investment Trust.
Return on equity The profit after income tax attributable to Macquarie’s ordinary shareholders expressed as an annualised percentage of the average ordinary equity over the relevant period, less the average balances of AVS and cash flow hedging reserves.
Risk-weighted assets (RWA)
A risk-based measure of an entity’s exposures, which is used in assessing its overall capital adequacy.
SPEs Special purpose entities.
Subordinated debt Debt issued by Macquarie for which agreements between Macquarie and the lenders provide, in the event of liquidation, that the entitlement of such lenders to repayment of the principal sum and interest thereon is and shall at all times be and remain subordinated to the rights of all other present and future creditors of Macquarie. Subordinated debt is classified as liabilities in the Macquarie financial statements and is included in Tier 2 Capital.

81
Tier 1 Capital A capital measure defined by APRA, comprising the highest quality components of capital that fully satisfy all the following essential characteristics: - provide a permanent and unrestricted commitment of funds; - are freely available to absorb losses; - do not impose any unavoidable servicing charge against earnings; and - rank behind the claims of depositors and other creditors in the event of winding up.
Tier 1 Capital Deductions An amount deducted in determining Tier 1 Capital, as defined in Prudential Standard APS 111 Capital Adequacy: Measurement of Capital. Tier 1 deductions are divided into deductions from Tier 1 capital only (paragraph 44) and other 50/50 deductions from Tier 1 capital (paragraph 46).
Tier 1 Capital Ratio Tier 1 Capital expressed as a percentage of RWA.
Tier 2 Capital A capital measure defined by APRA, comprising other components of capital which contribute to the strength of the entity.
Tier 2 Capital Deductions An amount deducted in Tier 2 Capital, as defined in Prudential Standard APS 111 Capital Adequacy: Measurement of Capital, Tier 2 deductions are divided into deductions from Tier 2 capital only (paragraph 45) and other 50/50 deductions from Tier 2 capital (paragraph 46).
Total Capital Tier 1 Capital plus Tier 2 Capital less Total Capital Deductions.
Total Capital Ratio Total Capital expressed as a percentage of RWA.
Trading Income Income that represents realised or unrealised gains and losses that relate to financial markets products. This income does not necessarily relate to ‘trading’ in such products and may arise through the manufacturing of new financial products by bringing together existing financial instruments.
True Index products True Index products deliver clients pre-tax index returns (before buy/sell spreads on transactions). Any under-performance is compensated by Macquarie and conversely, any out-performance is retained by Macquarie.

Macquarie Group Limited Management Discussion and Analysis macquarie.com.au
9.0 Ten year history
82
With the exception of 31 March 2005, the financial information presented below has been based on the accounting standards adopted at each reporting date. The financial information for the periods ended 31 March 2005 and later are based on results reported under International Financial Reporting Standards and their related pronouncements.
2002 2003 2004
Financial performance ($A million) Total income from ordinary activities 1,822 2,155 2,823
Total expenses from ordinary activities (1,467) (1,695) (2,138)
Profit from ordinary activities before income tax 355 460 685 Income tax expense (76) (96) (161)
Profit from ordinary activities after income tax 279 364 524
Profit attributable to non-controlling interests (29) (31) (30)
Profit from ordinary activities after income tax attributable to ordinary equity holders 250 333 494
Financial position ($A million) Total assets 30,234 32,462 43,771
Total liabilities (27,817) (29,877) (40,938)
Net assets 2,417 2,585 2,833
Total loan assets 9,209 9,839 10,777
Impaired assets (net of provisions) 49 16 61
Share information(a)
Cash dividends per share (cents per share) Interim 41 41 52 Final 52 52 70 Special — 50 —
Total 93 143 122
Basic earnings per share (cents per share) 132.8 164.8 233.0 Share price at end of period ($A) 33.26 24.70 35.80 Ordinary share capital (million shares)(b) 198.5 204.5 215.9 Market capitalisation at end of period (fully paid ordinary shares) ($A million) 6,602 5,051 7,729
Net tangible assets per ordinary share ($A)(c) 7.94 8.23 10.72
Ratios Return on average ordinary shareholders’ funds (%) 18.7 18.0 22.3 Dividend payout ratio (%) 73.6 87.4(d) 53.2 Expense/income ratio (%) 80.5 78.7 75.7
Net loan losses/loan assets (excluding securitisation SPVs and segregated future funds) (%) 0.2 0.0 0.3
Assets under management ($A billion)(e) 41.3 52.3 62.6
Staff numbers(f) 4,726 4,839 5,716
a) Macquarie’s ordinary shares were listed on the Australian Stock Exchange on 29 July 1996. b) Number of fully paid ordinary shares at end of period, excluding options and partly paid shares. c) Net tangible assets include intangibles (net of associated deferred tax assets and deferred liabilities) within assets and disposal
groups held for sale. d) The special dividend for 2003 was paid to release one-off franking credits to shareholders on entry into tax consolidation.
Excluding the special dividend of 50 cents per share, the Dividend payout ratio would have been 56.8%. e) The methodology used to calculate assets under management was revised in September 2005. Comparatives at 31 March
2005 have been restated in accordance with the revised methodology. f) Includes both permanent staff (full time, part time and fixed term) and contractors (including consultants and secondees).

83
Year ended 31 March
2005 2006 2007 2008 2009 2010 2011
4,197 4,832 7,181 8,248 5,526 6,638 7,644
(3,039) (3,545) (5,253) (6,043) (4,537) (5,344) (6,373)
1,158 1,287 1,928 2,205 989 1,294 1,271
(288) (290) (377) (317) (15) (201) (282)
870 997 1,551 1,888 974 1,093 989 (58) (81) (88) (85) (103) (43) (33)
812 916 1,463 1,803 871 1,050 956
67,980 106,211 136,389 167,250 149,144 145,940 157,568
(63,555) (100,874) (128,870) (157,189) (139,584) (134,171) (145,636)
4,425 5,337 7,519 10,061 9,560 11,769 11,932
28,425 34,999 45,796 52,407 44,751 44,267 46,016
42 85 88 165 952 647 377
61 90 125 145 145 86 86
100 125 190 200 40 100 100 40 — — — — — —
201 215 315 345 185 186 186
369.6 400.3 591.6 670.6 309.6 320.2 282.5 48.03 64.68 82.75 52.82 27.05 47.25 36.60 223.7 232.4 253.9 274.6 283.4 344.2 346.8
10,744 15,032 21,010 14,504 7,666 16,266 12,693
13.97 16.63 22.86 28.18 23.72 25.82 26.16
29.8 26.0 28.1 23.7 9.9 10.1 8.8
53.2 54.4 54.3 52.2 60.2 60.4 67.3 72.4 73.4 73.2 73.3 82.1 80.5 83.4
0.2 0.2 0.1 0.3 1.9 0.8 0.4
96.7 140.3 197.2 232.0 243.1 325.7 309.8
6,556 8,183 10,023 13,107 12,716 14,657 15,556

Macquarie Group Limited Management Discussion and Analysis macquarie.com.au
84
This page has been intentionally left blank.

Macquarie Group Head OfficeNo.1 Martin PlaceSydney NSW 2000Australia
Tel: +61 2 8232 3333
Registered OfficeMacquarie Group LimitedLevel 7, No.1 Martin PlaceSydney NSW 2000Australia
Tel: +61 2 8232 3333Fax: +61 2 8232 4330
Des
igne
d by
Fro
st*D
esig
n
Prin
t m
anag
emen
t by
Oct
opus
Sol
utio
ns
The Holey DollarIn 1813 Governor Lachlan Macquarie overcame an acute currency shortage by purchasing Spanish silver dollars (then worth five shillings), punching the centres out and creating two new coins – the ‘Holey Dollar’ (valued at five shillings) and the ‘Dump’ (valued at one shilling and three pence).
This single move not only doubled the number of coins in circulation but increased their worth by 25 per cent and prevented the coins leaving the colony. Governor Macquarie’s creation of the Holey Dollar was an inspired solution to a difficult problem and for this reason it was chosen as the symbol for Macquarie Group.
The Macquarie name and Holey Dollar device are registered trade marks of Macquarie Group Limited.

MA
CQ
UA
RIE
GR
OU
P M
AN
AG
EM
EN
T DIS
CU
SS
ION
AN
D A
NA
LYS
IS
MACqUArIE GrOUP LIMITED ACN 122 169 279macquarie.com.au
MACQUARIE GROUP MANAGEMENT DISCUSSION AND ANALYSISYEAR ENDED 31 MARCH 2011