MACQUARIE EQUINOX LIMITED Financial Statements · MACQUARIE EQUINOX LIMITED Financial Statements...
68
MACQUARIE EQUINOX LIMITED Financial Statements For the year ended December 31, 2010
Transcript of MACQUARIE EQUINOX LIMITED Financial Statements · MACQUARIE EQUINOX LIMITED Financial Statements...

MACQUARIE EQUINOX LIMITED Financial Statements For the year ended December 31, 2010

- 1 -
MACQUARIE EQUINOX LIMITED Table of Contents December 31, 2010 Investment Manager’s Report 2 Independent Auditor’s Report 3 Statement of Financial Position 4 Schedule of Investments 5-18 Statement of Comprehensive Income 19 Statement of Changes in Net Assets Attributable to Shareholders 20 Statement of Cash Flows 21 Notes to the Financial Statements 22-63 Fund Information 64-65 Additional Information 66-67

- 2 -
MACQUARIE EQUINOX LIMITED Investment Manager’s Report December 31, 2010 Due to the ongoing redemption suspensions imposed by some component funds within Equinox’s underlying portfolios, the investor redemption suspension invoked at the portfolio level in November 2008 is currently still in place. Realisation of illiquid underlying investments is progressing steadily. However due to the unpredictability of the frequency and size of redemption proceeds from illiquid component funds, we are currently unable to provide any guidance as to when the redemption suspension can be lifted. Within the Equinox portfolios the liquidity solution completed in April 2010 provided investors with the option of a partial return of capital along with a commensurate reduction to the capital protection levels. Investors whom participated in the liquidity solution had their shares reclassified as a separate class of shares (e.g. from Class A to A1) and received a cash distribution based on the available liquid proceeds in the fund. The newly created sub class is maintained separately from the original Class with capital protection also adjusted downwards by the Future value of the cash payment. With limited visibility as to when the Equinox portfolios will be sufficiently liquid to merit lifting the redemption suspension, the liquidity solution gave investors a feasible option of availing of cash in what has been a difficult economic climate. Although the portfolios in Equinox still remain illiquid, overall illiquidity levels have decreased during the year following distributions received from the underlying fund holdings. We will continue to actively monitor and track the ongoing realisation of these remaining illiquid assets.

Liability limited by a scheme approved under Professional Standards Legislation
Independent auditor’s report to the shareholders of Macquarie Equinox Limited We have audited the accompanying financial report of Macquarie Equinox Limited (the “Fund”), which comprises the statement of financial position as at 31 December 2010, and the statement of comprehensive income, statement of changes in net assets attributable to shareholders and statement of cash flows for the year ended on that date, a summary of significant accounting policies, other explanatory notes. Directors’ Responsibility for the Financial Report The directors of the Fund are responsible for the preparation and fair presentation of the financial report in accordance with International Financial Reporting Standards and for such internal controls as the directors determine are necessary to enable the preparation of the financial report that is free from material misstatement, whether due to fraud or error. Auditor’s Responsibility Our responsibility is to express an opinion on the financial report based on our audit. We conducted our audit in accordance with International Standards on Auditing. Those standards require that we comply with relevant ethical requirements relating to audit engagements and plan and perform the audit to obtain reasonable assurance about whether the financial report is free from material misstatement. An audit involves performing procedures to obtain audit evidence about the amounts and disclosures in the financial report. The procedures selected depend on our judgment, including the assessment of the risks of material misstatement of the financial report, whether due to fraud or error. In making those risk assessments, we consider internal controls relevant to the Fund’s preparation and fair presentation of the financial report in order to design audit procedures that are appropriate in the circumstances, but not for the purpose of expressing an opinion on the effectiveness of the Fund’s internal controls. An audit also includes evaluating the appropriateness of accounting policies used and the reasonableness of accounting estimates made by the directors, as well as evaluating the overall presentation of the financial report. We believe that the audit evidence we have obtained is sufficient and appropriate to provide a basis for our audit opinion. Opinion In our opinion the financial report presents fairly, in all material respects, the financial position of Macquarie Equinox Limited as of 31 December 2010, and its financial performance and cash flows for the year then ended in accordance with International Financial Reporting Standards.
Ernst & Young Sydney 30 June 2011


- 5 -
MACQUARIE EQUINOX LIMITED Schedule of Investments December 31, 2010 (Expressed in Australian Dollars) Investments in other investment companies as at December 31, 2010
Class A Number of
Shares Investments Cost Fair Value % of Net
Assets Diversified
63.33 Macquarie Absolute Return Strategies - A Side Pocket $ 121,916 $ 82,799 0.10%
1,702.15 Irongate Global Strategy Fund Limited Dollar Class (note 17) 283,353 141,602 0.17%
7.06 Drake Global Opportunities Fund Series 1 Class D 14,844 6,093 0.01%
Total Class A investments $ 420,113 $ 230,494 0.28%
Class A
Side Pocket
Number of Shares Investments Cost Fair Value
% of Net Assets
Global Macro
1.49 Drake Global Opportunities Fund Ltd. Class D Series 1 $ 1,581 $ 1,288 0.00%
Total Class A Side Pocket investments $ 1,581 $ 1,288 0.00%
Investments in fixed income securities as at December 31, 2010
Class A Number of
Shares Fixed Income Securities Cost Fair Value % of Net
Assets Global Macro
2,877,214.45 Macquarie Bank ZCB 0% 31/03/11 $ 3,197,458 $ 2,810,099 3.41% Total Class A fixed income securities $ 3,197,458 $ 2,810,099 3.41%
Investments in other investment companies as at December 31, 2010
Class A1 Number of
Shares Investments Cost Fair Value % of Net
Assets Diversified
29.11 Macquarie Absolute Return Strategies - A Side Pocket $ 40,162 $ 38,058 0.05%
782.38 Irongate Global Strategy Fund Limited Dollar Class (note 17) 90,707 65,087 0.08%
3.49 Drake Global Opportunities Fund Series 1 Class D 2,892 3,011 0.00%
Total Class A1 investments $ 133,761 $ 106,156 0.13%

- 6 -
MACQUARIE EQUINOX LIMITED Schedule of Investments (continued) December 31, 2010 (Expressed in Australian Dollars) Investments in fixed income securities as at December 31, 2010
Class A1 Number of
Shares Fixed Income Securities Cost Fair Value % of Net
Assets Global Macro
62,473.88 Macquarie Bank ZCB 0% 31/03/11 $ 69,427 $ 61,017 0.07% Total Class A fixed income securities $ 69,427 $ 61,017 0.07%
Investments in other investment companies as at December 31, 2010
Class B Number of
Shares Investments Cost Fair Value % of Net
Assets Diversified
492.32 Macquarie Absolute Return Strategies - A Side Pocket $ 947,810 $ 643,706 0.78%
21,903.46 Irongate Global Strategy Fund Limited Dollar Class (note 17) 3,762,430 1,822,156 2.21%
41.82 Drake Global Opportunities Fund Series 1 Class D 82,749 36,109 0.04%
Total Class B investments $ 4,792,989 $ 2,501,971 3.03%
Class B
Side Pocket
Number of Shares Investments Cost Fair Value
% of Net Assets
Global Macro
8.08 Drake Global Opportunities Fund Ltd. Class D Series 1 $ 11,994 $ 6,974 0.01%
Total Class B Side Pocket investments $ 11,994 $ 6,974 0.01%
Investments in fixed income securities as at December 31, 2010
Class B Number of
Shares Fixed Income Securities Cost Fair Value % of Net
Assets Global Macro
18,307,011.56 Macquarie Bank ZCB 0% 31/03/11 $ 20,192,569 $ 17,830,947 21.62% Total Class B fixed income securities $ 20,192,569 $ 17,830,947 21.62%

- 7 -
MACQUARIE EQUINOX LIMITED Schedule of Investments (continued) December 31, 2010 (Expressed in Australian Dollars) Investments in other investment companies as at December 31, 2010
Class B1 Number of
Shares Investments Cost Fair Value % of Net
Assets Diversified
97.92 Macquarie Absolute Return Strategies- A Side Pocket $ 135,111 $ 128,032 0.15%
4,356.57 Irongate Global Strategy Fund Limited Dollar Class (note 17) 505,088 362,424 0.44%
8.83 Drake Global Opportunities Fund Series 1 Class D 7,323 7,624 0.01%
Total Class B1 investments $ 647,522 $ 498,080 0.60%
Investments in fixed income securities as at December 31, 2010
Class B1 Number of
Shares Fixed Income Securities Cost Fair Value % of Net
Assets Global Macro
1,083,457.87 Macquarie Bank ZCB 0% 31/03/11 $ 1,195,050 $ 1,055,283 1.28% Total Class B1 fixed income securities $ 1,195,050 $ 1,055,283 1.28%
Investments in other investment companies as at December 31, 2010
Class C Number of
Shares Investments Cost Fair Value % of Net
Assets Diversified
98.60 Drake Global Opportunities Fund Series 1 Class D $ 207,628 $ 85,124 0.10%
4.67 Harbinger Class L Holdings (Cayman) Series 2, Ltd. 6,628 18,550 0.02%
6.92 Harbinger Class L Holdings (Cayman) Series 3, Ltd. 9,970 23,529 0.03%
221.70 Harbinger Class PE Holdings (Cayman) Series 1, Ltd. 314,647 155,810 0.19%
182.58 Harbinger Class PE Holdings (Cayman) Series 2, Ltd. 263,043 137,830 0.17%
7,433.40 Selectinvest ARV Plus 1.25X Ltd. Series-R 2009 904,523 784,679 0.95%
41.07 The Canyon Value Realization Cl B DI 61,804 57,004 0.07%
506.78 Macquarie Absolute Return Strategies- A Side Pocket 975,651 662,615 0.80%
Total Class C investments $ 2,743,894 $ 1,925,141 2.33%

- 8 -
MACQUARIE EQUINOX LIMITED Schedule of Investments (continued) December 31, 2010 (Expressed in Australian Dollars)
Class C Side
Pocket Number of
Shares Investments Cost Fair Value % of Net
Assets Global Macro
26.55 Drake Global Opportunities Fund Class D Series 1 $ 31,101 $ 22,919 0.03%
Total Class C Side Pocket investments $ 31,101 $ 22,919 0.03%
Investments in fixed income securities as at December 31, 2010
Class C Number of
Shares Fixed Income Securities Cost Fair Value % of Net
Assets Global Macro
16,579,098.94 Macquarie Bank ZCB 0% 31/12/11 $ 20,565,654 $ 16,131,139 19.56% Total Class C fixed income securities $ 20,565,654 $ 16,131,139 19.56%
Investments in other investment companies as at December 31, 2010
Class C1 Number of
Shares Investments Cost Fair Value % of Net
Assets Diversified
19.98 Drake Global Opportunities Fund Series 1 Class D $ 16,566 $ 17,248 0.02%
0.96 Harbinger Class L Holdings (Cayman) Series 2, Ltd. 3,861 3,813 0.00%
1.43 Harbinger Class L Holdings (Cayman) Series 3, Ltd. 4,932 4,862 0.01%
43.29 Harbinger Class PE Holdings (Cayman) Series 1, Ltd. 40,337 30,424 0.04%
35.65 Harbinger Class PE Holdings (Cayman) Series 2, Ltd. 35,682 26,913 0.03%
128.63 Selectinvest ARV Plus 1.25X Ltd. Series-C-H 14,018 12,584 0.02%
11.96 Selectinvest ARV Plus 1.25X Ltd. Series-R 0109 1,305 1,173 0.00%
1,736.60 Selectinvest ARV Plus 1.25X Ltd. Series-R 2009 194,037 181,112 0.22%
41.07 Selectinvest ARV Plus 1.25X Ltd. Series-R 2009 RR 4,258 4,335 0.01%
9.08 The Canyon Value Realization Cl B DI 12,882 12,608 0.02%
98.95 Macquarie Absolute Return Strategies- A Side Pocket 136,532 129,379 0.15%
Total Class C1investments $ 464,410 $ 424,451 0.52%

- 9 -
MACQUARIE EQUINOX LIMITED Schedule of Investments (continued) December 31, 2010 (Expressed in Australian Dollars) Investments in fixed income securities as at December 31, 2010
Class C1 Number of
Shares Fixed Income Securities Cost Fair Value % of Net
Assets Global Macro
470,588.49 Macquarie Bank ZCB 0% 31/12/11 $ 506,382 $ 457,874 0.55% Total Class C1 fixed income securities $ 506,382 $ 457,874 0.55%
Investments in other investment companies as at December 31, 2010
Class D Number of
Shares Investments Cost Fair Value % of Net
Assets Diversified
110.39 Drake Global Opportunities Fund Series 1 Class D $ 109,991 $ 95,315 0.12%
0.85 Harbinger Class L Holdings (Cayman) Series 2, Ltd. 608 3,376 0.00%
9.00 Harbinger Class L Holdings (Cayman) Series 3, Ltd. 6,803 30,604 0.04%
39.74 Harbinger Class PE Holdings (Cayman) Series 1, Ltd. 28,481 27,934 0.03%
203.85 Harbinger Class PE Holdings (Cayman) Series 2, Ltd. 154,100 153,911 0.19%
38.99 The Canyon Value Realization Cl B DI 30,644 54,130 0.06%
465.75 Macquarie Absolute Return Strategies- A Side Pocket 446,091 609,050 0.74%
Total Class D investments $ 776,718 $ 974,320 1.18%
Investments in other investment companies as at December 31, 2010
Class E Number of
Shares Investments Cost Fair Value % of Net
Assets Diversified
37.64 Drake Global Opportunities Fund Series 1 Class D $ 79,443 $ 32,496 0.04%
4.70 Selectinvest ARV Plus 1.25X Ltd. Series-R 2009 489 490 0.00%
1,220.77 Selectinvest ARV Plus 1.25X Ltd. Series-R 2009 RR 138,397 128,866 0.16%
7.20 The Canyon Value Realization Cl B DI 10,608 9,997 0.01%
55.99 Macquarie Absolute Return Strategies - A Side Pocket 107,793 73,208 0.09%
Total Class E investments $ 336,730 $ 245,057 0.30%

- 10 -
MACQUARIE EQUINOX LIMITED Schedule of Investments (continued) December 31, 2010 (Expressed in Australian Dollars)
Class E
Side Pocket
Number of Shares Investments Cost Fair Value
% of Net Assets
Global Macro
17.16 Drake Global Opportunities Fund Class D Series 1 $ 20,316 $ 14,818 0.02%
Total Class E Side Pocket investments $ 20,316 $ 14,818 0.02%
Investments in fixed income securities as at December 31, 2010
Class E Number of
Shares Fixed Income Securities Cost Fair Value % of Net
Assets Global Macro
3,679,649.94 Macquarie Bank ZCB 0% 31/05/12 $ 4,552,484 $ 3,566,765 4.32% Total Class E fixed income securities $ 4,552,484 $ 3,566,765 4.32%
Investments in other investment companies as at December 31, 2010
Class E1 Number of
Shares Investments Cost Fair Value % of Net
Assets Diversified
19.00 Drake Global Opportunities Fund Series 1 Class D $ 15,756 $ 16,405 0.02%
100.20 Selectinvest ARV Plus 1.25X Ltd. Series-C-H 10,919 9,803 0.01%
9.31 Selectinvest ARV Plus 1.25X Ltd. Series-R 0109 1,016 914 0.00%
696.17 Selectinvest ARV Plus 1.25X Ltd. Series-R 2009 77,785 72,604 0.09%
3.92 The Canyon Value Realization Cl B DI 5,566 5,447 0.01%
26.12 Macquarie Absolute Return Strategies - A Side Pocket 36,043 34,155 0.04%
Total Class E1 investments $ 147,085 $ 139,328 0.17%
Investments in fixed income securities as at December 31, 2010
Class E1 Number of
Shares Fixed Income Securities Cost Fair Value % of Net
Assets Global Macro
404,504.41 Macquarie Bank ZCB 0% 31/05/12 $ 425,713 $ 392,095 0.48% Total Class E1 fixed income securities $ 425,713 $ 392,095 0.48%

- 11 -
MACQUARIE EQUINOX LIMITED Schedule of Investments (continued) December 31, 2010 (Expressed in Australian Dollars) Investments in other investment companies as at December 31, 2010
Class F Number of
Shares Investments Cost Fair Value % of Net
Assets Diversified
26.25 Drake Global Opportunities Fund Series 1 Class D $ 51,929 $ 22,663 0.03%
141.90 Selectinvest ARV Plus 1.25X Ltd. Series-C-H 17,060 13,883 0.02%
13.19 Selectinvest ARV Plus 1.25X Ltd. Series-R 0109 1,872 1,294 0.00%
1,631.63 Selectinvest ARV Plus 1.25X Ltd. Series-R 2009 181,736 170,164 0.02%
116.40 Macquarie Absolute Return Strategies-E Side Pocket 199,720 131,364 0.16%
Total Class F investments $ 452,317 $ 339,368 0.41%
Class F
Side Pocket
Number of Shares Investments Cost Fair Value
% of Net Assets
Global Macro
4.82 Drake Global Opportunities Fund Class D Series 1 $ 5,368 $ 4,163 0.01%
Total Class F Side Pocket investments $ 5,368 $ 4,163 0.01%
Investments in fixed income securities as at December 31, 2010
Class F Number of
Shares Fixed Income Securities Cost Fair Value % of Net
Assets $ $ Global Macro
5,805,520.65 Macquarie Bank ZCB 0% 28/09/12 $ 6,284,977 $ 5,603,886 6.79% Total Class F fixed income securities $ 6,284,977 $ 5,603,886 6.79%

- 12 -
MACQUARIE EQUINOX LIMITED Schedule of Investments (continued) December 31, 2010 (Expressed in Australian Dollars) Investments in other investment companies as at December 31, 2010
Class F1 Number of
Shares Investments Cost Fair Value % of Net
Assets Diversified
10.88 Drake Global Opportunities Fund Series 1 Class D $ 9,026 $ 9,397 0.01%
54.95 Selectinvest ARV Plus 1.25X Ltd. Series-C-H 5,989 5,376 0.01%
5.11 Selectinvest ARV Plus 1.25X Ltd. Series-R 0109 557 501 0.00%
630.61 Selectinvest ARV Plus 1.25X Ltd. Series-R 2009 70,460 65,767 0.08%
45.08 Macquarie Absolute Return Strategies - E Side Pocket 54,471 50,872 0.06%
Total Class F1 investments $ 140,503 $ 131,913 0.16%
Investments in fixed income securities as at December 31, 2010
Class F1 Number of
Shares Fixed Income Securities Cost Fair Value % of Net
Assets Global Macro
221,775.79 Macquarie Bank ZCB 0% 28/09/12 $ 240,091 $ 214,074 0.26% Total Class F1 fixed income securities $ 240,091 $ 214,074 0.26%
Investments in other investment companies as at December 31, 2010
Class J Number of
Shares Investments Cost Fair Value % of Net
Assets Diversified
249.3951 Drake Global Opportunities Fund Series 1 Class D $ 248,501 $ 215,345 0.26%
30,776.21 Irongate Global Strategy Fund Limited Dollar Class (note 17) 3,122,290 2,560,707 3.10%
1,051.33 Macquarie Absolute Return Strategies - A Side Pocket 1,006,964 1,374,808 1.67%
905.55 Macquarie Absolute Return Strategies - E Side Pocket 772,983 1,022,078 1.24%
Total Class J investments $ 5,150,738 $ 5,172,938 6.27%
Total Fund investments $ 73,506,944 $ 60,862,558 73.79%

- 13 -
MACQUARIE EQUINOX LIMITED Schedule of Investments December 31, 2009 (Expressed in Australian Dollars) Investments in other investment companies as at December 31, 2009
Class A Number of
Shares Investments Cost Fair Value % of Net
Assets Diversified
153.55 Macquarie Absolute Return Strategies- A Side Pocket $ 295,611 $ 216,027 0.20%
4,891.79 Irongate Global Strategy Fund Limited Dollar Class 822,338 581,248 0.54%
Total Class A investments $ 1,117,949 $ 797,275 0.74%
Class A Side
Pocket Number of
Shares Investments Cost Fair Value % of Net
Assets $ $ Global Macro
17.80 Drake Global Opportunities Fund Ltd. Class D Series 1 $ 32,312 $ 14,600 0.01%
Total Class A Side Pocket investments $ 32,312 $ 14,600 0.01%
Investments in other investment companies as at December 31, 2009
Class B Number of
Shares Investments Cost Fair Value % of Net
Assets Diversified
980.48 Macquarie Absolute Return Strategies- A Side Pocket $ 1,341,599 $ 1,379,436 1.29%
51,703.40 Irongate Global Strategy Fund Limited Dollar Class 7,642,953 6,143,463 5.76%
Total Class B investments $ 8,984,552 $ 7,522,899 7.05%
Class B Side
Number of
Shares Investments Cost Fair Value % of Net
Assets Global Macro
86.85 Drake Global Opportunities Fund Ltd. Class D Series 1 $ 126,244 $ 71,236 0.07%
Total Class B Side Pocket investments $ 126,244 $ 71,236 0.07%

- 14 -
MACQUARIE EQUINOX LIMITED Schedule of Investments (continued) December 31, 2009 (Expressed in Australian Dollars) Investments in other investment companies as at December 31, 2009
Class C Number of
Shares Investments Cost Fair Value % of Net
Assets Diversified
12.03 Pendragon (Merlin) Fund INC, Class R1 $ 26,980 $ 24,764 0.02% 37.00 Pendragon (Merlin) Fund INC, Class R2 61,393 83,711 0.08%
18.90 Harbinger Class L Holdings (Cayman) Series 2, Ltd. 21,051 71,925 0.07%
28.00 Harbinger Class L Holdings (Cayman) Series 3, Ltd. 31,187 91,208 0.09%
321.94 Harbinger Class PE Holdings (Cayman) Series 1, Ltd. 358,588 320,212 0.30%
265.14 Harbinger Class PE Holdings (Cayman) Series 2, Ltd. 295,320 283,272 0.27%
787.43 Selectinvest ARV Plus 1.25X Ltd. Series-C-H 87,706 87,722 0.08%
73.19 Selectinvest ARV Plus 1.25X Ltd. Series-R 0109 8,153 8,160 0.01%
17,118.35 Selectinvest ARV Plus 1.25X Ltd. Series-R 0409 1,906,699 2,099,072 1.97%
91.41 The Canyon Value Realization Cl B DI 101,818 122,740 0.12%
1,006.21 Macquarie Absolute Return Strategies - A Side Pocket 1,376,812 1,415,641 1.33%
Total Class C investments $ 4,275,707 $ 4,608,427 4.34%
Class C Side
Number of
Shares Investments Cost Fair Value % of Net
Assets Global Macro
214.60 Drake Global Opportunities Fund Ltd. Class D Series 1 $ 312,265 $ 176,018 0.17%
Total Class C Side Pocket investments $ 312,265 $ 176,018 0.17%
Investments in fixed income securities as at December 31, 2009
Class C Number of
Shares Fixed Income Securities Cost Fair Value % of Net
Assets Global Macro
7,254,890.71 Macquarie Bank ZCB 0% 31/12/11 $ 7,682,235 $ 7,862,116 7.37% Total Class C fixed income securities $ 7,682,235 $ 7,862,116 7.37%

- 15 -
MACQUARIE EQUINOX LIMITED Schedule of Investments (continued) December 31, 2009 (Expressed in Australian Dollars) Investments in other investment companies as at December 31, 2009
Class D Number of
Shares Investments Cost Fair Value % of Net
Assets Diversified
2.84 Harbinger Class L Holdings (Cayman) Series 2, Ltd. $ 3,156 $ 10,785 0.01%
30.18 Harbinger Class L Holdings (Cayman) Series 3, Ltd. 33,611 98,300 0.09%
48.29 Harbinger Class PE Holdings (Cayman) Ser 1, Ltd. 53,772 48,018 0.05%
247.67 Harbinger Class PE Holdings (Cayman) Ser 2, Ltd. 275,791 264,536 0.25%
773.68 Macquarie Absolute Return Strategies - A Side Pocket 1,058,346 1,088,194 1.02%
30.29 Pendragon (Merlin) Fund INC, Class R2 50,249 68,514 0.06% 71.07 The Canyon Value Realization Cl B DI 79,141 95,403 0.09%
Total Class D investments $ 1,554,066 $ 1,673,750 1.57%
Class D Side
Number of
Shares Investments Cost Fair Value % of Net
Assets Global Macro
163.24 Drake Global Opportunities Fund Ltd. Class D Series 1 $ 257,956 $ 133,854 0.13%
Total Class D Side Pocket investments $ 257,956 $ 133,854 0.13%

- 16 -
MACQUARIE EQUINOX LIMITED Schedule of Investments (continued) December 31, 2009 (Expressed in Australian Dollars) Investments in other investment companies as at December 31, 2009
Class E Number of
Shares Investments Cost Fair Value % of Net
Assets Diversified
136.40 Macquarie Absolute Return Strategies - A Side Pocket $ 186,644 $ 191,907 0.18%
10.54 Pendragon (Merlin) Fund INC, Class R2 17,482 23,837 0.02%
314.97 Selectinvest ARV Plus 1.25X Ltd. Series -C-H 35,082 35,089 0.03%
29.28 Selectinvest ARV Plus 1.25X Ltd. Series -R 0109 3,261 3,264 0.00%
3,453.89 Selectinvest ARV Plus 1.25X Ltd. Series -R 0409 384,706 423,520 0.40%
20.28 The Canyon Value Realization Cl B DI 22,589 27,231 0.03% Total Class E investments $ 649,764 $ 704,848 0.66%
Class E Side
Number of
Shares Investments Cost Fair Value % of Net
Assets Global Macro
109.14 Drake Global Opportunities Fund Ltd. Class D Series 1 $ 152,632 $ 89,517 0.08%
Total Class E Side Pocket investments $ 152,632 $ 89,517 0.08%
Investments in fixed income securities as at December 31, 2009
Class E Number of
Shares Fixed Income Securities Cost Fair Value % of Net
Assets Global Macro
5,126,042.76 Macquarie Bank ZCB 0% 31/05/12 $ 5,386,308 $ 5,484,325 5.14% Total Class E fixed income securities $ 5,386,308 $ 5,484,325 5.14%

- 17 -
MACQUARIE EQUINOX LIMITED Schedule of Investments (continued) December 31, 2009 (Expressed in Australian Dollars) Investments in other investment companies as at December 31, 2009
Class F Number of
Shares Investments Cost Fair Value % of Net
Assets Diversified
271.65 Macquarie Absolute Return Strategies - E Side Pocket $ 331,266 $ 335,932 0.31%
196.86 Selectinvest ARV Plus 1.25X Ltd. Series -C-H 21,927 21,930 0.02%
18.30 Selectinvest ARV Plus 1.25X Ltd. Serie s-R 0109 2,038 2,040 0.00%
3,563.94 Selectinvest ARV Plus 1.25X Ltd. Series -R 0409 396,964 437,015 0.41%
Total Class F investments $ 752,195 $ 796,917 0.74%
Class F Side
Number of
Shares Investments Cost Fair Value % of Net
Assets Global Macro
62.04 Drake Global Opportunities Fund Ltd. Class D Series 1 $ 91,580 $ 50,890 0.05%
Total Class F Side Pocket investments $ 91,580 $ 50,890 0.05%

- 18 -
MACQUARIE EQUINOX LIMITED Schedule of Investments (continued) December 31, 2009 (Expressed in Australian Dollars) Investments in other investment companies as at December 31, 2009
Class J Number of
Shares Investments Cost Fair Value % of Net
Assets Diversified
60,595.30 Irongate Global Strategy Fund Limited Dollar Class $ 8,943,091 $ 7,198,046 6.75%
1,746.42 Macquarie Absolute Return Strategies - A Side Pocket 2,389,004 2,456,380 2.30%
1,523.34 Macquarie Absolute Return Strategies - E Side Pocket 1,857,157 1,883,314 1.77%
Total Class J investments $ 13,189,252 $ 11,537,740 10.82%
Class J Side
Number of
Shares Investments Cost Fair Value % of Net
Assets Global Macro
368.79 Drake Global Opportunities Class D Fund Series 1 $ 582,782 $ 302,407 0.28%
Total Class J Side Pocket investments $ 582,782 $ 302,407 0.28%
Total Fund investments $ 45,147,799 $ 41,826,819 39.22%
- 19 -
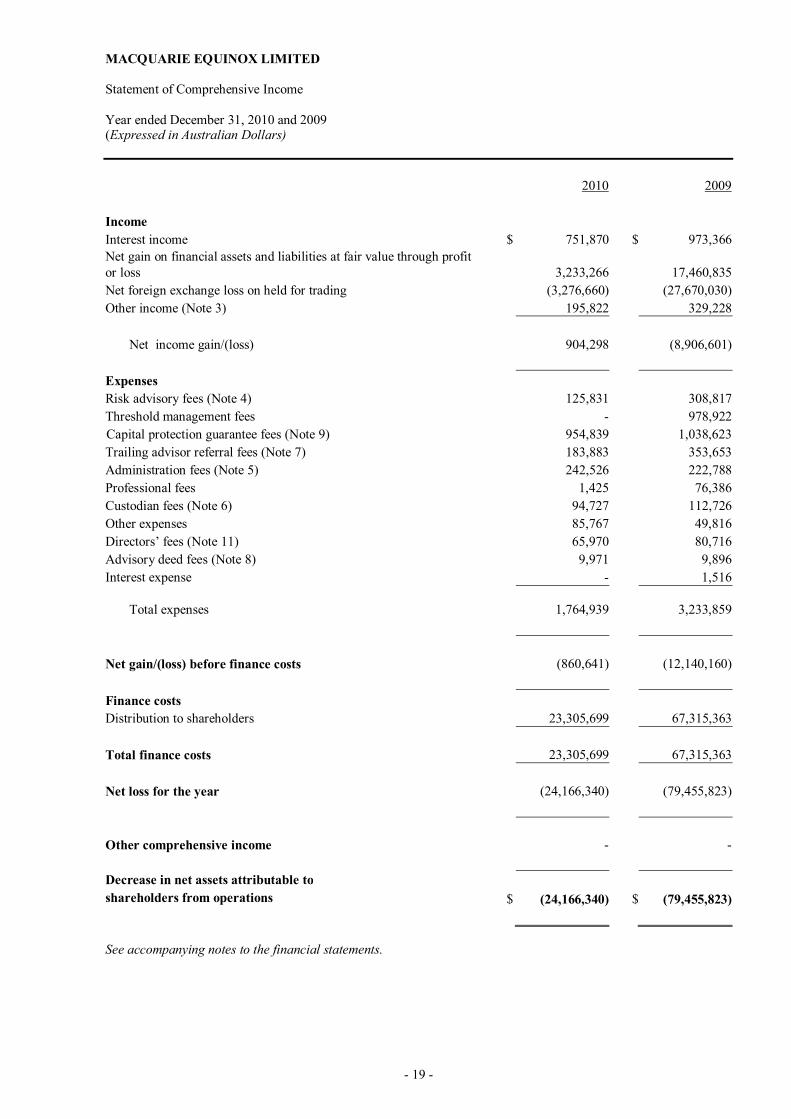
MACQUARIE EQUINOX LIMITED Statement of Comprehensive Income Year ended December 31, 2010 and 2009 (Expressed in Australian Dollars) 2010 2009 Income Interest income $ 751,870 $ 973,366 Net gain on financial assets and liabilities at fair value through profit or loss 3,233,266 17,460,835 Net foreign exchange loss on held for trading (3,276,660) (27,670,030) Other income (Note 3) 195,822 329,228
Net income gain/(loss) 904,298 (8,906,601) Expenses Risk advisory fees (Note 4) 125,831 308,817 Threshold management fees - 978,922 Capital protection guarantee fees (Note 9) 954,839 1,038,623 Trailing advisor referral fees (Note 7) 183,883 353,653 Administration fees (Note 5) 242,526 222,788 Professional fees 1,425 76,386 Custodian fees (Note 6) 94,727 112,726 Other expenses 85,767 49,816 Directors’ fees (Note 11) 65,970 80,716 Advisory deed fees (Note 8) 9,971 9,896 Interest expense - 1,516
Total expenses 1,764,939 3,233,859 Net gain/(loss) before finance costs (860,641) (12,140,160) Finance costs Distribution to shareholders 23,305,699 67,315,363 Total finance costs 23,305,699 67,315,363 Net loss for the year (24,166,340) (79,455,823) Other comprehensive income - - Decrease in net assets attributable to shareholders from operations $ (24,166,340) $ (79,455,823) See accompanying notes to the financial statements.

- 20 -
MACQUARIE EQUINOX LIMITED Statement of Changes in Net Assets Attributable to Shareholders Year ended December 31, 2010 and 2009 (Expressed in Australian Dollars) 2010 2009 Balance at beginning of year $ 106,670,339 $ 186,599,895 Change in net assets attributable to shareholders (24,166,340) (79,455,823) Issue of redeemable Shares during the year
Class A1 – 1,549,000.000 Participating Shares (2009 - Nil) 1,734,048 - Class B1 – 4,408,929.000 Participating Shares (2009 - Nil) 5,062,267 - Class C1 – 4,742,236.000 Participating Shares (2009 - Nil) 4,944,008 - Class E1 – 2,770,665.000 Participating Shares (2009 - Nil) 2,452,950 - Class F1 – 2,675,648.000 Participating Shares (2009 - Nil) 2,855,965 -
Total issue of shares during the year 17,049,238 - Redemption of redeemable Shares during the year
Class A –1,549,647.242 Participating Shares (2009 - 11,477.910) (1,734,651) (12,164) Class B – 4,412,169.173 Participating Shares (2009 - 57,458.843) (5,065,534) (65,864) Class C – 4,752,935.030 Participating Shares (2009 - 189,728.358) (4,954,747) (216,456) Class E – 2,779,366.317 Participating Shares (2009 - 154,303.813) (2,459,893) (139,926) Class F – 2,677,887.394 Participating Shares (2009 - 39,711.6758) (2,857,916) (39,323)
Total redemption of shares during the year (17,072,741) (473,733)
Balance at end of year $ 82,480,496 $ 106,670,339 See accompanying notes to the financial statements.

- 21 -
MACQUARIE EQUINOX LIMITED Statement of Cash Flows Year ended December 31, 2010 and 2009 (Expressed in Australian Dollars) 2010 2009 Cash flows from operating activities
Change in net assets attributable to shareholders from operations $ (24,166,340) $ (79,455,823) Changes in operating assets and liabilities Increase in loss on forward contracts (8,977,831) (38,798,254)Decrease in investments in other investment companies 15,741,003 132,088,329Increase in fixed income securities at fair value (34,776,738) (10,746,441)Increase in receivable from redemption of investment in other investment companies 705,535 10,957,576Decrease/(Increase) in interest receivable 143,685 (28,505)Decrease in prepaid expenses - 13,395Increase in due from Manager 1,669,664 644,969Decrease in unsettled trades - (10,025)Increase/(decrease) in loan interest payable - (1,460)Increase in fees payable (161,832) (3,658,933)Decrease in accounts payable and accrued expenses (60,036) (1,853,623)Net change in operating assets and liabilities (49,882,890) 9,151,205 Cash flows from financing activities Decrease in redemption payable 27,209 22,982Decrease in loan payable - (495,943)Proceeds from issuance of redeemable Shares 17,049,238 -Payments on redemption of redeemable Shares (17,072,741) (473,733) Cash used in financing activities 3,706 (949,694) Net (decrease)/increase in cash (49,879,184) 8,204,511Cash at beginning of year 59,768,212 51,563,701 Cash at end of year $ 9,889,028 $ 59,768,212 See accompanying notes to the financial statements.

- 22 -
MACQUARIE EQUINOX LIMITED Notes to the Financial Statements December 31, 2010 (Amounts expressed in Australian Dollars) 1. The Fund
Macquarie FX Feeder Fund No. 2 Limited, an open-ended investment company, was incorporated under the laws of Bermuda on April 26, 2001. Macquarie FX Feeder Fund No. 2 Limited was renamed Macquarie Equinox Limited (the “Fund”) on July 2, 2003. The Directors approved the issue and offer of Class A, B, C, D, E, F and J Shares by resolutions dated November 26, 2003, April 23, 2004, June 25, 2004, January 12, 2006, December 15, 2004, February 4, 2006 and January 12, 2007, respectively. At present, Class A, Class B, Class D and Class J Shares are not listed on the Irish Stock Exchange. Class C, Class E and Class F Shares are listed on the Irish Stock Exchange. In January 2008 the Fund created side pocket classes for its investments in Drake Global Opportunities fund, as described in Note 14. Effective 28th November 2008 the Fund implemented a redemption freeze in all share classes as described in Note 13. The investment portfolios of Class A, B, C, D, E, F and J Shares consist of investments in diversified funds and in tactical trading. The portfolio mix for each Share Class is chosen to provide diversification across a variety of sophisticated hedge fund and tactical trading strategies in a way that it believes will provide attractive risk-adjusted returns in a variety of market conditions. Initially, 60% of the Class A portfolio was allocated to diversified funds and 40% to tactical traders. Class B, C, E, F and J portfolios initially consisted of 50% diversified funds and 50% tactical traders. Class D portfolio initially consisted of 2/3 diversified funds and 1/3 tactical traders. The diversified funds provide exposure to a broad range of international trading strategies such as long/short equity strategies, discretionary macro and trading strategies, event-driven and relative value strategies. The tactical traders have been included to provide a more concentrated exposure to global financial markets through a series of trading strategies that complement the diversified funds’ overall profile. Being more directional in nature they attempt to profit from outright moves in single instruments and in some cases moves in spreads and ratios of instruments, rather than sourcing equity long/short trades, event-driven or relative value strategies. As a result, the sources of risk and return within the tactical traders can be quite different to those within diversified funds and tactical traders have generally displayed higher volatility than many diversified funds. In March 2010 the Directors approved by resolution the creation of classes A1, B1, C1, E1 and F1.These classes were created to assist shareholders in the main classes to obtain liquidity from their investment in the Fund. This is described in more detail in note 13. At December 31, 2010, the Fund had no employees.
2. Significant accounting policies (a) Statement of compliance
The accompanying financial statements are prepared in accordance with International Financial Reporting Standards (“IFRS”), adopted by the International Accounting Standards Board (“IASB”), and interpretations issued by the International Financial Reporting Interpretations Committee (“IFRIC”) of the IASB. The following are the significant accounting policies adopted by the Fund:
(b) Basis of preparation The financial statements are prepared on a going concern basis with the presumption that the Fund will continue in operational existence for the foreseeable future.

- 23 -
MACQUARIE EQUINOX LIMITED Notes to the Financial Statements (continued) December 31, 2010 (Amounts expressed in Australian Dollars) 2. Significant accounting policies (continued) (b) Basis of preparation (continued)
The Directors and the Investment Manager are taking all reasonable actions to address these issues and meet the Fund’s liquidity requirements, and will review the situation regularly to determine when the suspension of redemptions may be lifted. The Directors have a reasonable expectation that the Fund has adequate resources to continue in operational existence for the foreseeable future. Accordingly, they continue to adopt the going concern basis in preparing these financial statements. The financial statements are presented in Australian Dollars ($) which is also the functional currency of the Fund. The Australian Dollar is the currency of the primary economic environment in which the Fund operates and the majority of the Fund’s Share Classes are denominated in Australian Dollars. The financial statements are prepared on a fair value basis for financial assets and financial liabilities through profit or loss and derivative financial instruments held for trading. The preparation of financial statements in conformity with IFRS requires management to make judgments, estimates and assumptions that affect the application of policies and reported accounting policies and the reported amounts of assets and liabilities, income and expense. The estimates and associated assumptions are based on historical experience and various other factors that are believed to be reasonable. The estimates underlying assumptions are reviewed on an ongoing basis. Revisions to accounting estimates are recognised in the year in which the estimate is revised if the revision affects only that year, or in the years of revision and future years if the revision affects both current and future years. Actual results could differ from estimates.
(c) Foreign currency translation Transactions in foreign currencies are translated at the foreign currency exchange rate ruling at the date of the transaction. Monetary assets and liabilities denominated in foreign currencies are translated to Australian Dollars at the foreign currency exchange rate ruling at the reporting date. Foreign currency exchange differences arising on translation and realised gains and losses on disposals or settlements of monetary assets and liabilities are recognised in the Statement of Comprehensive Income. Non-monetary assets and liabilities denominated in foreign currencies that are measured at fair value are translated to Australian Dollars at the foreign currency exchange rate ruling at the dates that the values are determined. Foreign exchange differences relating to investments at fair value through profit or loss and derivative financial instruments are included in gains and losses on investments.
(d) Financial instruments
(i) Classification The Fund designates all its investments into the financial assets at fair value through profit or loss category. These investments are managed and their performance is evaluated on a fair value basis, in accordance with the Fund’s investment strategy. The category of financial assets and financial liabilities at fair value through profit or loss comprises:
• Financial instruments held-for-trading include forward foreign currency contracts. All derivative financial instruments in a net receivable position (positive fair value) are reported as financial assets held-for-trading. All derivatives in a net payable position (negative fair value) are reported as financial liabilities held-for-trading.

- 24 -
MACQUARIE EQUINOX LIMITED Notes to the Financial Statements (continued) December 31, 2010 (Amounts expressed in Australian Dollars) 2. Significant accounting policies (continued) (d) Financial instruments (continued)
(i) Classification (continued)
• Financial instruments designated at fair value through profit or loss upon initial recognition. These include financial assets that are not held for trading purposes and which may be sold. These include the Fund’s investments in other investment companies and fixed income securities.
Financial assets that are classified as receivables include advance payment for investment in other investment companies, receivable from disposal of investment in other investment companies and interest receivable. Financial liabilities that are not at fair value through profit or loss include accounts payable and financial liabilities arising on redeemable Shares. (ii) Derivative financial instruments The Fund uses derivative financial instruments, such as forward foreign currency contracts, to minimise the exposure arising from investments in other investment companies denominated in United States Dollars and Japanese Yen. The Fund attempts to protect itself against any adverse changes in the exchange rates; however, by doing this, it is also precluded from participating in any favorable exchange rate movements. Although the Fund attempts to minimise its net United States Dollar and Japanese Yen exposure, some residual foreign exchange exposure may occur. Unrealised gains and losses on open forward foreign currency contracts are calculated as the difference between the contract rate and the applicable forward rate, based upon the applicable forward exchange rates reported in published sources on the valuation date, applied to the face amount of the contracts. The Fund recognises unrealised gains and losses as they occur and recognises realised gains and losses when the contract matures. (iii) Recognition The Fund recognises financial instruments at fair value through profit or loss on the date it commits to purchase the instruments. From this date, any gains and losses arising from changes in the fair value of the assets or liabilities are recorded. Investments in other investment companies are recorded on the effective date of the subscription. (iv) Measurement Financial instruments are measured initially at fair value, plus, in the case of a financial asset or financial liability not at fair value through profit or loss, transaction costs that are directly attributable to the acquisition or issue of the financial asset or financial liability. Transaction costs on financial assets and financial liabilities at fair value through profit or loss are expensed immediately. Subsequent to initial recognition, all financial instruments classified at fair value through profit or loss are measured at fair value with changes in their fair value recognised in the Statement of Comprehensive Income. Net realised gains and losses on the sale of investments in other investment companies include gains less losses realised on the sale of shares of other investment companies, the difference between the amount received on sale, and the fair value at the last valuation point, are included in the Statement of Comprehensive Income. (v) Fair value measurement principles The fair values of financial assets at fair value through profit and loss (comprised of investments in other investment companies) are based on the net asset value per share of the underlying investment companies as reported by the administrators of those companies. The reported net asset value is determined by the underlying investment company by valuing the securities of each underlying entity at fair value.

- 25 -
MACQUARIE EQUINOX LIMITED Notes to the Financial Statements (continued) December 31, 2010 (Amounts expressed in Australian Dollars) 2. Significant accounting policies (continued) (d) Financial instruments (continued)
(v) Fair value measurement principles (continued) The fair value of derivative financial instruments at the reporting date generally reflects the amount that the Fund would receive or pay to terminate the contract at the reporting date. The Fund uses derivative financial instruments that are traded in the over-the-counter market for which fair values are readily available. (vi) Derecognition The Fund derecognises a financial asset when the contractual rights to the cash flows from the financial assets expire or it transfers the financial asset and the transfer meets the criteria specified in IAS 39 Financial Instruments: Recognition and Measurement (“IAS 39”). The Fund derecognises a financial liability when the obligation is discharged, cancelled or expires. The Fund uses the first-in-first-out basis to determine realised gains and losses on derecognition.
(e) Interest income Interest income is recognised in the Statement of Comprehensive Income on the accrual basis, taking into account the historical effective interest rate of the monetary asset.
(f) Expenses All expenses are recognised in the Statement of Comprehensive Income on the accruals basis.
(g) Redeemable Shares All redeemable shares issued by the Fund provide the investor with the right to require redemption for cash at the value proportionate to the investor’s share in the Fund’s net assets at the redemption date. In accordance with IAS 32 Financial Instruments: Presentation (“IAS 32”), such instruments give rise to a financial liability for the present value of the redemption amount.
(h) Distributions to shareholders
In accordance with the Fund’s operating memorandum, the Fund fully distributes its distributable income to shareholders. Distributions are payable as determined by Directors. Distributions to shareholders are recognised in the Statement of Comprehensive Income. Distributions during the period are listed in note 13.
(i) Cash and cash equivalents
Cash and cash equivalents in the Statement of Financial Position comprise cash on hand, cash deposits and margin cash on futures contracts.

- 26 -
MACQUARIE EQUINOX LIMITED Notes to the Financial Statements (continued) December 31, 2010 (Amounts expressed in Australian Dollars) 2. Significant accounting policies (continued)
(j) New accounting standards and interpretations
Accounting Standards and interpretations that have been issued or amended but are not yet effective have
not been adopted by the fund for the annual reporting period ended 31 December 2010. Management is yet to assess the impact of these standards and interpretations but those likely to impact the fund are:
- IFRS9 - IFRS 9 was issued by the IASB in November 2009 and introduces new requirements for
the classification and measurement of financial assets effective from 1 January 2013 with early adoption permitted. The Directors have not decided on early adoption.
Standards and interpretations that are not expected to have a material impact on the fund have not been
included. 3. Other income
Other income includes management fee rebates of $100,853 (2009: $312,677) and performance fee rebates of $Nil (2009: $Nil) from the Investment Manager in relation to management fees and performance fees charged by the Investment Manager to funds in which the Fund holds investments.
4. Risk advisory fee The Fund has entered into a Risk Advisory Agreement with MQ Capital Pty Limited, (the “Investment Manager”) to manage the Fund’s investment portfolios. Each Class of Shares is subject to certain risk advisory fees, as follows:
Class A
Under the terms of the Risk Advisory Agreement dated September 5, 2003, the Investment Manager receives a risk advisory fee at an annual rate of 0.75% of the primary investments of the Class A Shares of the Fund, calculated and payable monthly in arrears. As per the Risk Advisory Agreement, primary investments are the net asset value of the portfolio pertaining to Class A Shares less any security deposits.
Risk advisory fees incurred by the Fund on Class A Shares during the year ended December 31, 2010 were $2,921 (2009- $10,611), of which $1,800 (2009 - $3,093) were payable at December 31, 2010. Class A1
Under the terms of the Risk Advisory Agreement dated September 5, 2003, the Investment Manager receives a risk advisory fee at an annual rate of 1.25% of the primary investments of the Class A1 Shares of the Fund, calculated and payable monthly in arrears. As per the Risk Advisory Agreement, primary investments are the net asset value of the portfolio pertaining to Class A1 Shares less any security deposits.
Risk advisory fees incurred by the Fund on Class A1 Shares during the year ended December 31, 2010 were $1,381 (2009- $Nil), of which $1,381 (2009 - $Nil) were payable at December 31, 2010. Class B
Under the terms of the Risk Advisory Agreement dated February 13, 2004, the Investment Manager receives a risk advisory fee at an annual rate of 0.75% of the primary investments of the Class B Shares of the Fund, calculated and payable monthly in arrears. As per the Risk Advisory Agreement, primary investments are the net asset value of the portfolio pertaining to Class B Shares less any security deposits. Risk advisory fees incurred by the Fund on Class B Shares during the year ended December 31, 2010 were $29,772 (2009 - $85,231), of which $19,744 (2009 - $28,930) were payable at December 31, 2010.

- 27 -
MACQUARIE EQUINOX LIMITED Notes to the Financial Statements (continued) December 31, 2010 (Amounts expressed in Australian Dollars) 4. Risk advisory fee (continued)
Class B1
Under the terms of the Risk Advisory Agreement dated February 13, 2004, the Investment Manager receives a risk advisory fee at an annual rate of 1.25% of the primary investments of the Class B1 Shares of the Fund, calculated and payable monthly in arrears. As per the Risk Advisory Agreement, primary investments are the net asset value of the portfolio pertaining to Class B1 Shares less any security deposits. Risk advisory fees incurred by the Fund on Class B1 Shares during the year ended December 31, 2010 were $6,549 (2009 - $Nil), of which $6,549 (2009 - $Nil) were payable at December 31, 2010. Class C
Under the terms of the Risk Advisory Agreement dated May 12, 2004, the Investment Manager receives a risk advisory fee at an annual rate of 0.75% of the primary investments of the Class C Shares of the Fund, calculated and payable monthly in arrears. As per the Risk Advisory Agreement, primary investments are the net asset value of the portfolio pertaining to Class C Shares less any security deposits. Risk advisory fees incurred by the Fund on Class C Shares during the year ended December 31, 2010 were $23,814 (2009 - $68,975), of which $15,623 (2009 - $18,798) were payable at December 31, 2010. Class C1
Under the terms of the Risk Advisory Agreement dated May 12, 2004, the Investment Manager receives a risk advisory fee at an annual rate of 1.25% of the primary investments of the Class C1 Shares of the Fund, calculated and payable monthly in arrears. As per the Risk Advisory Agreement, primary investments are the net asset value of the portfolio pertaining to Class C1 Shares less any security deposits. Risk advisory fees incurred by the Fund on Class C1 Shares during the year ended December 31, 2010 were $5,440 (2009 - $Nil), of which $5,440 (2009 - $Nil) were payable at December 31, 2010. Class D
Under the terms of the Risk Advisory Agreement dated December 8, 2004, the Investment Manager receives a risk advisory fee at an annual rate of 0.50% of the primary investments of the Class D Shares of the Fund, calculated and payable monthly in arrears. As per the Risk Advisory Agreement, primary investments are the net asset value of the portfolio pertaining to Class D Shares less any security deposits. Risk advisory fees incurred by the Fund on Class D Shares during the year ended December 31, 2010 were $7,121 (2009 - $23,410), of which $4,584 (2009 - $4,558) were payable at December 31, 2010. Class E
Under the terms of the Risk Advisory Agreement dated September 24, 2004, the Investment Manager receives a risk advisory fee at an annual rate of 0.75% of the primary investments of the Class E Shares of the Fund, calculated and payable monthly in arrears. As per the Risk Advisory Agreement, primary investments are the net asset value of the portfolio pertaining to Class E Shares less any security deposits. Risk advisory fees incurred by the Fund on Class E Shares during the year ended December 31, 2010 were $3,294 (2009 - $11,129), of which $6,374 (2009 - $3,080) were payable at December 31, 2010.

- 28 -
MACQUARIE EQUINOX LIMITED Notes to the Financial Statements (continued) December 31, 2010 (Amounts expressed in Australian Dollars) 4. Risk advisory fee (continued)
Class E1
Under the terms of the Risk Advisory Agreement dated September 24, 2004, the Investment Manager receives a risk advisory fee at an annual rate of 1.25% of the primary investments of the Class E1 Shares of the Fund, calculated and payable monthly in arrears. As per the Risk Advisory Agreement, primary investments are the net asset value of the portfolio pertaining to Class E Shares less any security deposits. Risk advisory fees incurred by the Fund on Class E1 Shares during the year ended December 31, 2010 were $1,747 (2009 - $Nil), of which $1,747 (2009 - $Nil) were payable at December 31, 2010.
Class F
Under the terms of the Risk Advisory Agreement dated February 3, 2006, the Investment Manager receives a risk advisory fee at an annual rate of 0.75% of the primary investments of the Class F Shares of the Fund, calculated and payable monthly in arrears. As per the Risk Advisory Agreement, primary investments are the net asset value of the portfolio pertaining to Class F Shares less any security deposits. Risk advisory fees incurred by the Fund on Class F Shares during the year ended December 31, 2010 were $4,039 (2009 - $12,855), of which $2,576 (2009 - $3,308) were payable at December 31, 2010. Class F1 Under the terms of the Risk Advisory Agreement dated February 3, 2006, the Investment Manager receives a risk advisory fee at an annual rate of 1.25% of the primary investments of the Class F1 Shares of the Fund, calculated and payable monthly in arrears. As per the Risk Advisory Agreement, primary investments are the net asset value of the portfolio pertaining to Class F Shares less any security deposits. Risk advisory fees incurred by the Fund on Class F1 Shares during the year ended December 31, 2010 were $1,670 (2009 - $Nil), of which $1,670 (2009 -$Nil) were payable at December 31, 2010.
Class J
Under the terms of the Risk Advisory Agreement dated January 19, 2007, the Investment Manager receives a risk advisory fee at an annual rate of 0.50% of the primary investments of the Class J Shares of the Fund, calculated and payable monthly in arrears. As per the Risk Advisory Agreement, primary investments are the net asset value of the portfolio pertaining to Class J Shares less any security deposits. Risk advisory fees incurred by the Fund on Class J Shares during the year ended December 31, 2010 were $38,083 (2009 - $96,606), of which $24,616 (2009 - $29,048) were payable at December 31, 2010.

- 29 -
MACQUARIE EQUINOX LIMITED Notes to the Financial Statements (continued) December 31, 2010 (Amounts expressed in Australian Dollars) 5. Administration fee
The Fund has entered into an Administration Agreement with Citigroup Fund Services (Bermuda) Ltd. (the “Administrator”). Under the terms of the Administration Agreement dated November 12, 2003, the Administrator receives an administration fee of US$13,000 per annum per Class of Shares, calculated and payable monthly in arrears. The Administrator is also reimbursed for certain out-of-pocket expenses incurred by the Fund. In respect of corporate secretarial services, the Administrator receives a fee of US$7,500 per annum from the Fund, which is prorated across each Class of Shares in proportion to the net asset value of each Class of Shares. Effective January 1, 2006, the Administration Agreement was amended, whereby the administration fee charged by the Administrator is based on a percentage of net assets, computed on a sliding scale and subject to an annual minimum fee of US$24,000 per annum per Class of Shares. This applies to Classes A, B, C, D, E, F and J. The administration fee is prorated across each Class of Shares in proportion to the net asset value of each Class of Shares. The remaining classes are charged a flat fee of US$1,567 per month. Effective July 01, 2007, Citigroup Fund Services (Bermuda) Limited have sub-contracted Citigroup Global Transaction Services, Dublin to undertake the transfer agency services and valuations preparation, under the terms of the Sub-Contract agreement dated April 2007 between Citigroup Fund Services (Bermuda) and Citigroup Global Transaction Services, Dublin. Class A Administration fees incurred by the Fund with respect to Class A Shares during the year ended December 31, 2010 were $22,277 (2009 - $32,458), of which $6,126 (2009 - $9,309) were payable at December 31, 2010. Class A1 Administration fees incurred by the Fund with respect to Class A1 Shares during the year ended December 31, 2010 were $15,296 (2009 - $Nil), of which $6,126 (2009 - $Nil) were payable at December 31, 2010.
Class B Administration fees incurred by the Fund with respect to Class B Shares during the year ended December 31, 2010 were $22,277 (2009 - $31,670), of which $6,126 (2009 - $9,309) were payable at December 31, 2010. Class B1 Administration fees incurred by the Fund with respect to Class B Shares during the year ended December 31, 2010 were $15,296 (2009 - $Nil), of which $6,126 (2009 - $Nil) were payable at December 31, 2010.
Class C Administration fees incurred by the Fund with respect to Class C Shares during the year ended December 31, 2010 were $22,277 (2009 - $31,534), of which $6,126 (2009 - $9,308) were payable at December 31, 2010. Class C1 Administration fees incurred by the Fund with respect to Class C Shares during the year ended December 31, 2010 were $15,296 (2009 - $Nil), of which $6,126 (2009 - $Nil) were payable at December 31, 2010.

- 30 -
MACQUARIE EQUINOX LIMITED Notes to the Financial Statements (continued) December 31, 2010 (Amounts expressed in Australian Dollars) 5. Administration fee (continued)
Class D Administration fees incurred by the Fund with respect to Class D Shares during the year ended December 31, 2010 were $27,326 (2009 - $31,863), of which $8,181(2009 - $9,307) were payable at December 31, 2010.
Class E Administration fees incurred by the Fund with respect to Class E Shares during the year ended December 31, 2010 were $22,277 (2009 - $32,345), of which $6,126 (2009 - $9,308) were payable at December 31, 2010. Class E1 Administration fees incurred by the Fund with respect to Class E1 Shares during the year ended December 31, 2010 were $15,296 (2009 - $Nil), of which $6,126 (2009 - $Nil) were payable at December 31, 2010. Class F Administration fees incurred by the Fund with respect to Class F Shares during the year ended December 31, 2010 were $22,277 (2009 - $32,330), of which $6,126 (2009 - $11,636) were payable at December 31, 2010. Class F1 Administration fees incurred by the Fund with respect to Class F Shares during the year ended December 31, 2010 were $15,296 (2009 - $Nil), of which $6,126 (2009 - $Nil) were payable at December 31, 2010.
Class J Administration fees incurred by the Fund with respect to Class J Shares during the year ended December 31, 2010 were $27,335 (2009 - $30,588), of which $8,187 (2009 - $9,307) were payable at December 31, 2010.
6. Custodian fee On December 3, 2004, the Fund entered into a Custodian Agreement with The Bank of Bermuda Limited (the “Custodian”), pursuant to which the Fund appointed The Bank of Bermuda Limited as custodian to the portfolios of Class C, D, E, F and J Shares. On September 1, 2007, The Fund moved Custodian from The Bank of Bermuda Limited (Member HSBC Group) in Bermuda to HSBC Institutional Trust Services (Asia) Limited in Hong Kong. The Custodian receives and records all cash and securities of the portfolios of the Class C, C1, D, E, E1, F and F1 Shares, and maintains proper custody records, in accordance with the terms of the Custodian Agreement. Under the terms of the Custodian Agreement dated December 3, 2004, the Custodian receives an inception fee of US$2,500 and a custody fee based on a percentage of net assets, computed on a sliding scale, and subject to a monthly minimum of US$1,000 for each Class of Shares. The Custodian is also reimbursed for certain out-of pocket expenses and transaction charges incurred by the Fund. There is no external custodian for the portfolios of Class A, A1, B and B1 Shares.
- 31 -
MACQUARIE EQUINOX LIMITED Notes to the Financial Statements (continued) December 31, 2010 (Amounts expressed in Australian Dollars) 6. Custodian fee (continued) Class C
Custodian fees incurred by the Fund with respect to Class C Shares during the year ended December 31, 2010 were $13,083 (2009 - $24,913), of which $6,842 (2009 - $5,569) were payable at December 31, 2010.
Class C1 Custodian fees incurred by the Fund with respect to Class C1 Shares during the year ended December 31, 2010 were $9,750 (2009 - $Nil), of which $6,842 (2009 - $Nil) were payable at December 31, 2010.
Class D Custodian fees incurred by the Fund with respect to Class D Shares during the year ended December 31, 2010 were $13,115 (2009 - $21,358), of which $6,843 (2009 - $5,568) were payable at December 31, 2010.
Class E Custodian fees incurred by the Fund with respect to Class E Shares during the year ended December 31, 2010 were $13,083 (2009 - $22,013), of which $6,842 (2009 - $5,569) were payable at December 31, 2010.
Class E1 Custodian fees incurred by the Fund with respect to Class E1 Shares during the year ended December 31, 2010 were $9,750 (2009 - $Nil), of which $6,842 (2009 - $Nil) were payable at December 31, 2010.
Class F Custodian fees incurred by the Fund with respect to Class F Shares during the year ended December 31, 2010 were $13,082 (2009 - $24,671), of which $6,842 (2009 - $5,569) were payable at December 31, 2010.
Class F1 Custodian fees incurred by the Fund with respect to Class F Shares during the year ended December 31, 2010 were $9,750 (2009 - $Nil), of which $6,842 (2009 - $Nil) were payable at December 31, 2010.
Class J Custodian fees incurred by the Fund with respect to Class J Shares during the year ended December 31, 2010 were $13,114 (2009 - $19,771), of which $6,843 (2009 - $5,568) were payable at December 31, 2010.
7. Advisor referral fee and trailing advisor referral fee Class A
The advisor referral fee and trailing advisor referral fee are payable by the Fund to the various sales agents, advisors, brokers (“Financial Advisor”) who arranged the investment. Where a shareholder invests in the Fund without obtaining the services of a Financial Advisor, these fees are payable by the Fund to the arranger. The Financial Advisor and arranger receive an up-front advisor referral fee of 3% of the Shareholder’s total subscription amount. This fee is paid from the net assets attributable to the Class A Shares to the Financial Advisor and the arranger.

- 32 -
MACQUARIE EQUINOX LIMITED Notes to the Financial Statements (continued) December 31, 2010 (Amounts expressed in Australian Dollars) 7. Advisor referral fee and trailing advisor referral fee (continued) Class A (continued)
There were no advisor referral fees incurred by the Fund with respect to Class A Shares during the year ended December 31, 2010 and 2009. Starting in the second year of the investment, the Financial Advisor and the arranger also receive a trailing advisor referral fee at an annual rate of 0.5% of the net asset value of the Class A Shares of the Fund, calculated and payable quarterly in arrears. Trailing advisor referral fees incurred by the Fund with respect to Class A Shares during the year ended December 31, 2010 were $10,796 (2009 - $27,416), of which $3,902 were payable (2009 - $13,745) at December 31, 2010. Class A1 The advisor referral fee and trailing advisor referral fee are payable by the Fund to the various sales agents, advisors, brokers (“Financial Advisor”) who arranged the investment. Where a shareholder invests in the Fund without obtaining the services of a Financial Advisor, these fees are payable by the Fund to the arranger. The Financial Advisor and arranger receive an up-front advisor referral fee of 3% of the shareholder’s total subscription amount. This fee is paid from the net assets attributable to the Class A1 Shares to the Financial Advisor and the arranger. There were no advisor referral fees incurred by the Fund with respect to Class A1 Shares during the year ended December 31, 2010. Starting in the second year of the investment, the Financial Advisor and the arranger also receive a trailing advisor referral fee at an annual rate of 0.5% of the net asset value of the Class A1 Shares of the Fund, calculated and payable quarterly in arrears. Trailing advisor referral fees incurred by the Fund with respect to Class A1 Shares during the year ended December 31, 2010 were $1,577 (2009 - $Nil), of which $1,577 were payable (2009 - $Nil) at December 31, 2010.
Class B The advisor referral fee and trailing advisor referral fee are payable by the Fund to the Financial Advisor who arranged the investment. Where a shareholder invests in the Fund without obtaining the services of a Financial Advisor, these fees are payable by the Fund to the arranger. The Financial Advisor and arranger receive an up-front advisor referral fee of 3% of the shareholder’s total subscription amount. This fee is paid from the net assets attributable to the Class B Shares to the Financial Advisor and the arranger. There were no advisor referral fees incurred by the Fund with respect to Class B Shares during the year ended December 31, 2010 and 2009. Starting in the second year of the investment, the Financial Advisor and the arranger also receive a trailing advisor referral fee at an annual rate of 0.5% of the net asset value of the Class B Shares of the Fund, calculated and payable quarterly in arrears. Trailing advisor referral fees incurred by the Fund with respect to Class B Shares during the year ended December 31, 2010 were $69,063 (2009 - $150,698) of which $30,909 were payable (2009 - $75,762) at December 31, 2010. Class B1 The advisor referral fee and trailing advisor referral fee are payable by the Fund to the Financial Advisor who arranged the investment. Where a shareholder invests in the Fund without obtaining the services of a Financial Advisor, these fees are payable by the Fund to the arranger. The Financial Advisor and arranger receive an up-front advisor referral fee of 3% of the shareholder’s total subscription amount. This fee is paid from the net assets attributable to the Class B Shares to the Financial Advisor and the arranger.

- 33 -
MACQUARIE EQUINOX LIMITED Notes to the Financial Statements (continued) December 31, 2010 (Amounts expressed in Australian Dollars) 7. Advisor referral fee and trailing advisor referral fee (continued)
Class B (continued)
There were no advisor referral fees incurred by the Fund with respect to Class B1 Shares during the year ended December 31, 2010. Starting in the second year of the investment, the Financial Advisor and the arranger also receive a trailing advisor referral fee at an annual rate of 0.5% of the net asset value of the Class B1 Shares of the Fund, calculated and payable quarterly in arrears. Trailing advisor referral fees incurred by the Fund with respect to Class B1 Shares during the year ended December 31, 2010 were $4,386 (2009 - $Nil) of which $4,386 were payable (2009 - $Nil) at December 31, 2010. Class C The advisor referral fee and trailing advisor referral fee are payable by the Fund to the Financial Advisor who arranged the investment. Where a shareholder invests in the Fund without obtaining the services of a Financial Advisor, these fees are payable by the Fund to the arranger. The Financial Advisor and arranger receive an up-front advisor referral fee of 3% of the shareholder’s total subscription amount. This fee is paid from the net assets attributable to the Class C Shares to the Financial Advisor and the arranger. There were no advisor referral fees incurred by the Fund with respect to Class C Shares during the year ended December 31, 2010 and 2009. Starting in the second year of the investment, the Financial Advisor and the arranger also receive a trailing advisor referral fee at an annual rate of 0.5% of the net asset value of the Class C Shares of the Fund, calculated and payable quarterly in arrears. Trailing advisor referral fees incurred by the Fund with respect to Class C Shares during the year ended December 31, 2010 were $62,315 (2009 - $109,234), of which $34,360 were payable (2009 - $54,586) at December 31, 2010 . Class C1 The advisor referral fee and trailing advisor referral fee are payable by the Fund to the Financial Advisor who arranged the investment. Where a shareholder invests in the Fund without obtaining the services of a Financial Advisor, these fees are payable by the Fund to the arranger. The Financial Advisor and arranger receive an up-front advisor referral fee of 3% of the shareholder’s total subscription amount. This fee is paid from the net assets attributable to the Class C Shares to the Financial Advisor and the arranger. There were no advisor referral fees incurred by the Fund with respect to Class C1 Shares during the year ended December 31, 2010. Starting in the second year of the investment, the Financial Advisor and the arranger also receive a trailing advisor referral fee at an annual rate of 0.5% of the net asset value of the Class C1 Shares of the Fund, calculated and payable quarterly in arrears. Trailing advisor referral fees incurred by the Fund with respect to Class C1 Shares during the year ended December 31, 2010 were $3,894 (2009 - $Nil), of which $3,894 were payable (2009 - $Nil) at December 31, 2010.
Class D There were no advisor referral fees or trailing advisor referral fees payable by the Fund with respect to the Class D Shares during the years ended December 31, 2010 and December 31, 2009.

- 34 -
MACQUARIE EQUINOX LIMITED Notes to the Financial Statements (continued) December 31, 2010 (Amounts expressed in Australian Dollars) 7. Advisor referral fee and trailing advisor referral fee (continued)
Class E The placement incentive and trailing placement incentive fee are payable to the Financial Advisor who arranged the investment. Where a shareholder invests in the Fund without obtaining the services of a Financial Advisor, these fees are payable to the arranger. The Financial Advisor and arranger receive an up-front placement incentive fee of 3.3% of the shareholder’s total subscription amount. This fee is payable by the Investment Manager. In consideration of paying the placement incentive fee the Investment Manager is entitled to charge the Fund an offer fee as described in Note 3. There were no placement incentive fees incurred by the Fund with respect to Class E Shares during the year ended December 31, 2010 and 2009. Starting in the second year of the investment, the Financial Advisor and arranger also receive from the Fund a trailing placement incentive fee at an annual rate of 0.5% of the net asset value of the Class E Shares of the Fund, calculated monthly and payable quarterly in arrears. Trailing placement incentive fees incurred by the Fund with respect to Class E Shares during the year ended December 31, 2010 were $8,453 (2009 - $15,670), of which $14,587 were payable (2009 - $6,134) at December 31, 2010. Class E1 The placement incentive and trailing placement incentive fee are payable to the Financial Advisor who arranged the investment. Where a shareholder invests in the Fund without obtaining the services of a Financial Advisor, these fees are payable to the arranger. The Financial Advisor and arranger receive an up-front placement incentive fee of 3.3% of the shareholder’s total subscription amount. This fee is payable by the Investment Manager. In consideration of paying the placement incentive fee the Investment Manager is entitled to charge the Fund an offer fee as described in Note 3. There were no placement incentive fees incurred by the Fund with respect to Class E1 Shares during the year ended December 31, 2010. Starting in the second year of the investment, the Financial Advisor and arranger also receive from the Fund a trailing placement incentive fee at an annual rate of 0.5% of the net asset value of the Class E Shares of the Fund, calculated monthly and payable quarterly in arrears. Trailing placement incentive fees incurred by the Fund with respect to Class E1 Shares during the year ended December 31, 2010 were $1,676 (2009 - $Nil), of which $1,676 were payable (2009 - $Nil) at December 31, 2010.
Class F The placement incentive and trailing placement incentive fee are payable to the various sales agents, financial advisors and brokers (“Financial Advisor”) who arranged the investment. Where a shareholder invests in the Fund without obtaining the services of a Financial Advisor, these fees are payable to the arranger. The Financial Advisor and arranger receive an up-front placement incentive fee of 3.3% of the shareholder’s total subscription amount. This fee is payable by the Investment Manager. In consideration of paying the placement incentive fee the Investment Manager is entitled to charge the Fund an offer fee as described in Note 3. There were no advisor referral fees incurred by the Fund with respect to Class F Shares during the year ended December 31, 2010 and 2009. Starting in the second year of the investment, the Financial Advisor and arranger also receive from the Fund a trailing placement incentive fee at an annual rate of 0.5% of the net asset value of the Class F Shares of the Fund, calculated monthly and payable quarterly in arrears. Trailing placement incentive fees incurred by the Fund with respect to Class F Shares during the year ended December 31, 2010 were $20,220 (2009 - $50,635), of which $7,424 (2009 - $25,363) were payable at December 31, 2010.

- 35 -
MACQUARIE EQUINOX LIMITED Notes to the Financial Statements (continued) December 31, 2010 (Amounts expressed in Australian Dollars) 7. Advisor referral fee and trailing advisor referral fee (continued) Class F1
The placement incentive and trailing placement incentive fee are payable to the various sales agents, financial advisors and brokers (“Financial Advisor”) who arranged the investment. Where a shareholder invests in the Fund without obtaining the services of a Financial Advisor, these fees are payable to the arranger. The Financial Advisor and arranger receive an up-front placement incentive fee of 3.3% of the shareholder’s total subscription amount. This fee is payable by the Investment Manager. In consideration of paying the placement incentive fee the Investment Manager is entitled to charge the Fund an offer fee as described in Note 3. There were no advisor referral fees incurred by the Fund with respect to Class F1 Shares during the year ended December 31, 2010 and 2009. Starting in the second year of the investment, the Financial Advisor and arranger also receive from the Fund a trailing placement incentive fee at an annual rate of 0.5% of the net asset value of the Class F1 Shares of the Fund, calculated monthly and payable quarterly in arrears. Trailing placement incentive fees incurred by the Fund with respect to Class F1 Shares during the year ended December 31, 2010 were $1,503 (2009 - $Nil), of which $1,503 (2009 - $25,363) were payable at December 31, 2010.
Class J There were no advisor referral fees or trailing advisor referral fees payable by the Fund with respect to the Class J Shares during the years ended December 31, 2010 and December 31, 2009.
8. Advisory deed fee The Fund has entered into an Advisory Deed agreement with the Investment Manager. The Investment Manager will provide financial advice on, and services in relation to, general administration and the issue of financial products by the Fund. Under the terms of the Advisory Deed Agreement dated September 15, 2004, the Investment Manager receives an advisory fee of $10,000 per annum from the Fund (to be prorated across all Classes of Shares) accrued daily and charged each year on June 30. Class A Advisory deed fees incurred by the Fund with respect to Class A Shares during the year ended December 31, 2010 were $464 (2009 - $332), of which $218 (2009 - $182) were payable at December 31, 2010. Class A1 Advisory deed fees incurred by the Fund with respect to Class A1 Shares during the year ended December 31, 2010 were $36 (2009 - $Nil), of which $27 (2009 - $Nil) were payable at December 31, 2010. Class B Advisory deed fees incurred by the Fund with respect to Class B Shares during the year ended December 31, 2010 were $2,923 (2009 - $1,823), of which $1,476 (2009 - $1,002) were payable at December 31, 2010.
- 36 -
MACQUARIE EQUINOX LIMITED Notes to the Financial Statements (continued) December 31, 2010 (Amounts expressed in Australian Dollars) 8. Advisory deed fee (continued)
Class B1 Advisory deed fees incurred by the Fund with respect to Class B1 Shares during the year ended December 31, 2010 were $167 (2009 - $Nil), of which $126 (2009 - $Nil) were payable at December 31, 2010.
Class C Advisory deed fees incurred by the Fund with respect to Class C Shares during the year ended December 31, 2010 were $2,911 (2009 - $1,803), of which $1,475 (2009 - $987) were payable at December 31, 2010. Class C1 Advisory deed fees incurred by the Fund with respect to Class C1 Shares during the year ended December 31, 2010 were $116 (2009 - $Nil), of which $87 (2009 - $Nil) were payable at December 31, 2010.
Class D Advisory deed fees incurred by the Fund with respect to Class D Shares during the year ended December 31, 2010 were $249 (2009 - $1,137), of which $101 (2009 - $453) were payable at December 31, 2010. Class E Advisory deed fees incurred by the Fund with respect to Class E Shares during the year ended December 31, 2010 , were $653 (2009 - $464), of which $905 (2009 - $252) were payable at December 31, 2010. Class E1 Advisory deed fees incurred by the Fund with respect to Class E1 Shares during the year ended December 31, 2010 were $61 (2009 - $Nil), of which $61 (2009 - $Nil) were payable at December 31, 2010. Class F Advisory deed fees incurred by the Fund with respect to Class F Shares during the year ended December 31, 2010 were $892 (2009 - $613), of which $429 (2009 - $336) were payable at December 31, 2010. Class F1 Advisory deed fees incurred by the Fund with respect to Class F1 Shares during the year ended December 31, 2010 were $46 (2009 - $Nil), of which $35 (2009 - $Nil) were payable at December 31, 2010. Class J Advisory deed fees incurred by the Fund with respect to Class J Shares during the year ended December 31, 2010 were $1,453 (2009 - $3,724), of which $609 (2009 - $1,666) were payable at December 31, 2010.

- 37 -
MACQUARIE EQUINOX LIMITED Notes to the Financial Statements (continued) December 31, 2010 (Amounts expressed in Australian Dollars) 9. Capital protection guarantee fee
The Fund has entered into Option Agreements with Macquarie Bank Limited (the “Bank”), the parent company of the Investment Manager, for the purpose of capital protection, as follows: Class A Under the terms of the Option Agreement dated September 5, 2003, the Fund purchases over-the-counter put options to protect the initial value of invested assets attributable to Class A Shares. The Option Agreement is exercisable at March 31, 2011, and is intended to ensure that holders of Class A Shares of the Fund receive $1.05 per Class A Share if redeemed at the March 31, 2011 valuation date. The Bank receives a capital protection fee at an annual rate of 1.25% of the net asset value of the Class A Shares of the Fund, calculated and payable monthly in arrears. The fee is paid out of the assets attributable to the Class A Shares. Capital protection guarantee fees incurred by the Fund with respect to Class A Shares during the year ended December 31, 2010 were $52,896 (2009 - $68,510), of which $35,666 (2009 - $34,347) were payable at December 31, 2010. Class A1 Under the terms of the Option Agreement dated September 5, 2003, the Fund purchases over-the-counter put options to protect the initial value of invested assets attributable to Class A1 Shares. The Option Agreement is exercisable at March 31, 2011, and is intended to ensure that holders of Class A1 Shares of the Fund receive $0.1983 per Class A1 Share if redeemed at the March 31, 2011 valuation date. The Bank receives a capital protection fee at an annual rate of 1.25% of the net asset value of the Class A1 Shares of the Fund, calculated and payable monthly in arrears. The fee is paid out of the assets attributable to the Class A1 Shares. Capital protection guarantee fees incurred by the Fund with respect to Class A1 Shares during the year ended December 31, 2010 were $4,503 (2009 - $Nil), of which $4,503 (2009 - $Nil) were payable at December 31, 2010. Class B Under the terms of the Option Agreement dated February 13, 2004, the Fund purchases over-the-counter put options to protect the initial value of invested assets attributable to Class B Shares. The Option Agreement is exercisable at October 31, 2011, and is intended to ensure that holders of Class B Shares of the Fund receive $1.091 per Class B Share if redeemed at the October 31, 2011 valuation date. The Bank receives a capital protection fee at an annual rate of 1.25% of the net asset value of the Class B Shares of the Fund, calculated and payable monthly in arrears. The fee is paid out of the assets attributable to the Class B Shares. Capital protection guarantee fees incurred by the Fund with respect to Class B Shares during the year ended December 31, 2010 were $336,797 (2009 - $376,588), of which $241,454 (2009 - $189,328) were payable at December 31, 2010.
- 38 -
MACQUARIE EQUINOX LIMITED Notes to the Financial Statements (continued) December 31, 2010 (Amounts expressed in Australian Dollars) 9. Capital protection guarantee fee (continued)
Class B1 Under the terms of the Option Agreement dated February 13, 2004, the Fund purchases over-the-counter put options to protect the initial value of invested assets attributable to Class B1 Shares. The Option Agreement is exercisable at October 31, 2011, and is intended to ensure that holders of Class B1 Shares of the Fund receive $0.3792 per Class B1 Share if redeemed at the October 31, 2011 valuation date. The Bank receives a capital protection fee at an annual rate of 1.25% of the net asset value of the Class B1 Shares of the Fund, calculated and payable monthly in arrears. The fee is paid out of the assets attributable to the Class B1 Shares. Capital protection guarantee fees incurred by the Fund with respect to Class B1 Shares during the year ended December 31, 2010 were $20,678 (2009 - $Nil), of which $20,678 (2009 - $Nil) were payable at December 31, 2010. Class C Under the terms of the Option Agreement dated May 12, 2004, the Fund purchases over-the-counter put options to protect the initial value of invested assets attributable to Class C Shares. The Option Agreement is exercisable at December 31, 2011, and is intended to ensure that holders of Class C Shares of the Fund receive $1.106 per Class C Share if redeemed at the December 31, 2011 valuation date. The Bank receives a capital protection fee at an annual rate of 1.25% of the net asset value of the Class C Shares of the Fund, calculated and payable monthly in arrears. The fee is paid out of the net assets attributable to the Class C Shares. Capital protection guarantee fees incurred by the Fund with respect to Class C Shares during the year ended December 31, 2010 were $335,672 (2009 - $371,690), of which $241,091 (2009 - $186,457) were payable at December 31, 2010. Class C1 Under the terms of the Option Agreement dated May 12, 2004, the Fund purchases over-the-counter put options to protect the initial value of invested assets attributable to Class C1 Shares. The Option Agreement is exercisable at December 31, 2011, and is intended to ensure that holders of Class C1 Shares of the Fund receive $0.3116 per Class C1 Share if redeemed at the December 31, 2011 valuation date. The Bank receives a capital protection fee at an annual rate of 1.25% of the net asset value of the Class C Shares of the Fund, calculated and payable monthly in arrears. The fee is paid out of the net assets attributable to the Class C1 Shares. Capital protection guarantee fees incurred by the Fund with respect to Class C1 Shares during the year ended December 31, 2010 were $14,359 (2009 - $Nil), of which $14,359 (2009 - $Nil) were payable at December 31, 2010.

- 39 -
MACQUARIE EQUINOX LIMITED Notes to the Financial Statements (continued) December 31, 2010 (Amounts expressed in Australian Dollars) 9. Capital protection guarantee fee (continued)
Class E Under the terms of the Option Agreement dated September 23, 2004, the Fund purchases over-the-counter put options to protect the initial value of invested assets attributable to Class E Shares. The Option Agreement is exercisable at May 31, 2012, and is intended to ensure that holders of Class E Shares of the Fund receive $1.00 per Class E Share if redeemed at the May 31, 2012 valuation date. The Bank receives a capital protection fee at an annual rate of 1.25% of the net asset value of the Class E Shares of the Fund, calculated and payable monthly in arrears. The fee is paid out of the net assets attributable to the Class E Shares. Capital protection guarantee fees incurred by the Fund with respect to Class E Shares during the year ended December 31, 2010 were $74,454 (2009 - $95,301), of which $121,918 (2009 - $47,465) were payable at December 31, 2010. Class E1 Under the terms of the Option Agreement dated September 23, 2004, the Fund purchases over-the-counter put options to protect the initial value of invested assets attributable to Class E1 Shares. The Option Agreement is exercisable at May 31, 2012, and is intended to ensure that holders of Class E1 Shares of the Fund receive $0.3354 per Class E1 Share if redeemed at the May 31, 2012 valuation date. The Bank receives a capital protection fee at an annual rate of 1.25% of the net asset value of the Class E1 Shares of the Fund, calculated and payable monthly in arrears. The fee is paid out of the net assets attributable to the Class E1 Shares. Capital protection guarantee fees incurred by the Fund with respect to Class E1 Shares during the year ended December 31, 2010 were $7,627 (2009 - $Nil), of which $7,627 (2009 - $Nil) were payable at December 31, 2010. Class F Under the terms of the Option Agreement dated February 3, 2006, the Fund purchases over-the-counter put options to protect the initial value of invested assets attributable to Class F Shares. The Option Agreement is exercisable at September 30, 2012, and is intended to ensure that holders of Class F Shares of the Fund receive $1.00 per Class F Share if redeemed at the September 30, 2012 valuation date. The Bank receives a capital protection fee at an annual rate of 1.25% of the net asset value of the Class F Shares of the Fund, calculated and payable monthly in arrears. The fee is paid out of the net assets attributable to the Class F Shares. Capital protection guarantee fees incurred by the Fund with respect to Class F Shares during the year ended December 31, 2010 were $102,129 (2009 - $126,534), of which $70,150 (2009 - $63,382) were payable at December 31, 2010.

- 40 -
MACQUARIE EQUINOX LIMITED Notes to the Financial Statements (continued) December 31, 2010 (Amounts expressed in Australian Dollars) 9. Capital protection guarantee fee (continued)
Class F1 Under the terms of the Option Agreement dated February 3, 2006, the Fund purchases over-the-counter put options to protect the initial value of invested assets attributable to Class F1 Shares. The Option Agreement is exercisable at September 30, 2012, and is intended to ensure that holders of Class F1 Shares of the Fund receive $0.0324 per Class F1 Share if redeemed at the September 30, 2012 valuation date. The Bank receives a capital protection fee at an annual rate of 1.25% of the net asset value of the Class F1 Shares of the Fund, calculated and payable monthly in arrears. The fee is paid out of the net assets attributable to the Class F1 Shares. Capital protection guarantee fees incurred by the Fund with respect to Class F1 Shares during the year ended December 31, 2010 were $5,724 (2009 - $Nil), of which $5,724 (2009 - $Nil) were payable at December 31, 2010 . The Fund is a capital protected product and due to current performance in Classes A, A1, B, B1, C, C1, E, E1, F and F1 it has purchased zero coupon bonds from Macquarie Bank Ltd in order to ensure these classes mature to at least at their capital protection level on capital protection date. As at December 31, 2010 Classes A, A1, B, B1, C, C1, E, E1, F and F1 have purchased US$2,810,099, US$61,017, US$17,830,947, US$1,055,283 US$16,131,139, US$457,874, US$3,566,765, US$392,095, US$5,603,886 and US$214,074 of zero coupon bonds respectively. As at December 31, 2010 Classes D and J have no fixed income securities. At December 31, 2009 Classes C and E have purchased US$7,862,116 and US$5,484,325 of zero coupon bonds respectively.

- 41 -
MACQUARIE EQUINOX LIMITED Notes to the Financial Statements (continued) December 31, 2010 (Amounts expressed in Australian Dollars) 10. Fair values of financial instruments with off-balance sheet risk
In the normal course of its business, the Fund buys and sells derivative financial instruments, which include forward foreign currency contracts. Generally, derivative financial instruments represent future commitments to purchase or sell other financial instruments at specific terms at future dates. The derivative financial instruments are negotiated between contracting parties (over-the-counter). Derivative financial instruments may result in off-balance sheet market and credit risk. Market risk is the possibility that future changes in market price may make a financial instrument less valuable or more onerous. If the markets should move against one or more positions that the Fund holds, the Fund could incur losses greater than the unrealised amounts recorded in the Statement of Financial Position. The principal credit risk is that the counterparty will default and fail to fulfill the terms of the agreement. The Fund buys and sells forward foreign currency contracts in order to protect against adverse foreign exchange movements in its investments in other investment companies. Upon entering into a forward foreign currency contract, the Fund is required to provide initial margin, which is a deposit of either cash or securities in an amount equal to a certain percentage of the contract value. Derivative financial instruments are generally based upon notional values. Notional values are not recorded in the Statement of Financial Position, but they represent the extent of the Fund’s participation in these financial instruments. At December 31, 2010, the notional or contractual amounts of the Fund’s outstanding forward foreign currency contracts were as follows:
Currency to be bought
Currency to be sold
Contract date due
Unrealised gain/(loss)
% of Net Assets
CLASS A AUD (2,877,214) USD 3,315,419 31-Mar-11 467,371 0.56%
AUD 461,000 USD (468,639) 7-Feb-11 (16,125) (0.02%) AUD (447,000) USD 459,735 9-May-11 15,631 0.02% AUD (461,000) USD 515,833 7-Feb-11 63,085 0.08%
CLASS A1 AUD (62,474) USD 71,989 31-Mar-11 10,148 0.01%
AUD 249,000 USD (253,126) 7-Feb-11 (8,709) (0.01%) AUD (240,000) USD 246,837 9-May-11 8,393 0.01% AUD (249,000) USD 278,617 7-Feb-11 34,074 0.04%
CLASS B AUD (18,307,012) USD 21,593,324 31-Oct-11 2,860,942 3.42%
AUD 4,246,000 USD (4,316,357) 7-Feb-11 (148,514) (0.18%) AUD (3,706,000) USD 3,811,581 9-May-11 129,595 0.16% AUD (4,246,000) USD 4,751,035 7-Feb-11 581,037 0.70%
CLASS B1 AUD (1,083,458) USD 1,277,951 31-Oct-11 169,318 0.20% AUD 831,000 USD (844,770) 7-Feb-11 (29,066) (0.03%) AUD (799,000) USD 821,763 9-May-11 27,940 0.03% AUD (831,000) USD 929,842 7-Feb-11 113,717 0.14%
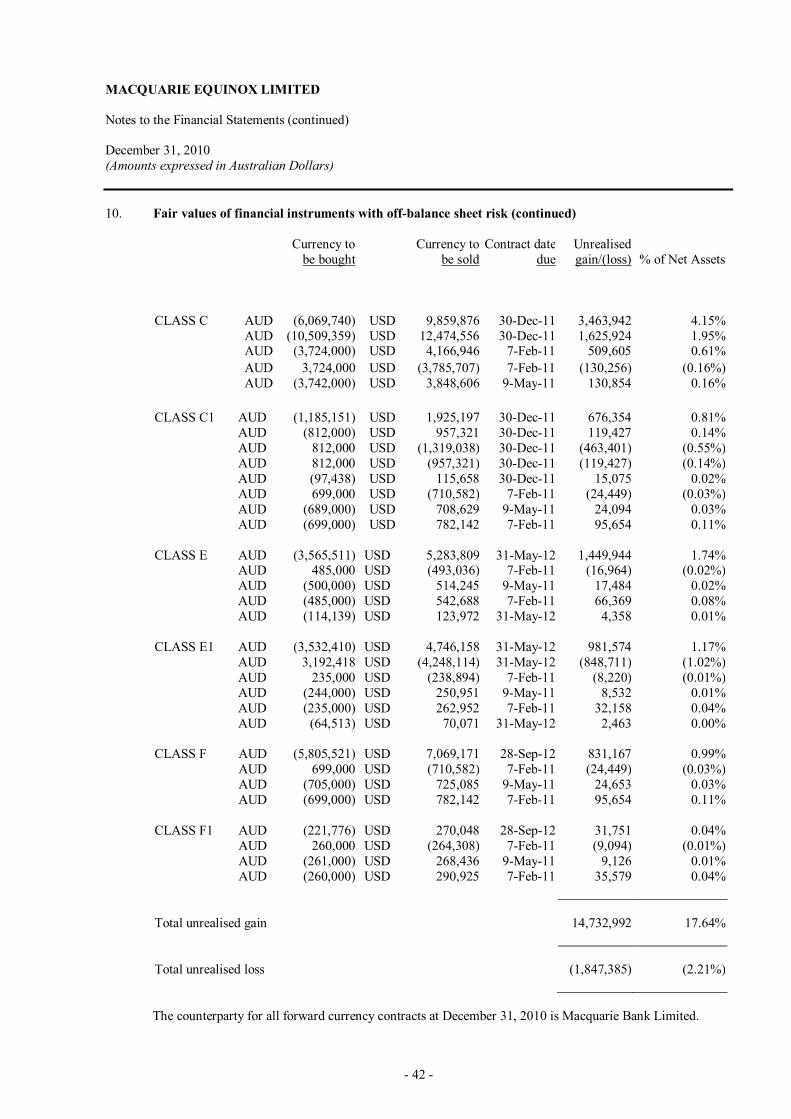
- 42 -
MACQUARIE EQUINOX LIMITED Notes to the Financial Statements (continued) December 31, 2010 (Amounts expressed in Australian Dollars) 10. Fair values of financial instruments with off-balance sheet risk (continued)
Currency to be bought Currency to
be sold Contract date
due Unrealised gain/(loss) % of Net Assets
CLASS C AUD (6,069,740) USD 9,859,876 30-Dec-11 3,463,942 4.15% AUD (10,509,359) USD 12,474,556 30-Dec-11 1,625,924 1.95% AUD (3,724,000) USD 4,166,946 7-Feb-11 509,605 0.61% AUD 3,724,000 USD (3,785,707) 7-Feb-11 (130,256) (0.16%) AUD (3,742,000) USD 3,848,606 9-May-11 130,854 0.16% CLASS C1 AUD (1,185,151) USD 1,925,197 30-Dec-11 676,354 0.81% AUD (812,000) USD 957,321 30-Dec-11 119,427 0.14% AUD 812,000 USD (1,319,038) 30-Dec-11 (463,401) (0.55%) AUD 812,000 USD (957,321) 30-Dec-11 (119,427) (0.14%) AUD (97,438) USD 115,658 30-Dec-11 15,075 0.02% AUD 699,000 USD (710,582) 7-Feb-11 (24,449) (0.03%) AUD (689,000) USD 708,629 9-May-11 24,094 0.03% AUD (699,000) USD 782,142 7-Feb-11 95,654 0.11%
CLASS E AUD (3,565,511) USD 5,283,809 31-May-12 1,449,944 1.74% AUD 485,000 USD (493,036) 7-Feb-11 (16,964) (0.02%) AUD (500,000) USD 514,245 9-May-11 17,484 0.02% AUD (485,000) USD 542,688 7-Feb-11 66,369 0.08% AUD (114,139) USD 123,972 31-May-12 4,358 0.01% CLASS E1 AUD (3,532,410) USD 4,746,158 31-May-12 981,574 1.17% AUD 3,192,418 USD (4,248,114) 31-May-12 (848,711) (1.02%) AUD 235,000 USD (238,894) 7-Feb-11 (8,220) (0.01%) AUD (244,000) USD 250,951 9-May-11 8,532 0.01% AUD (235,000) USD 262,952 7-Feb-11 32,158 0.04% AUD (64,513) USD 70,071 31-May-12 2,463 0.00% CLASS F AUD (5,805,521) USD 7,069,171 28-Sep-12 831,167 0.99% AUD 699,000 USD (710,582) 7-Feb-11 (24,449) (0.03%) AUD (705,000) USD 725,085 9-May-11 24,653 0.03% AUD (699,000) USD 782,142 7-Feb-11 95,654 0.11% CLASS F1 AUD (221,776) USD 270,048 28-Sep-12 31,751 0.04% AUD 260,000 USD (264,308) 7-Feb-11 (9,094) (0.01%) AUD (261,000) USD 268,436 9-May-11 9,126 0.01% AUD (260,000) USD 290,925 7-Feb-11 35,579 0.04% Total unrealised gain 14,732,992 17.64% Total unrealised loss (1,847,385) (2.21%)
The counterparty for all forward currency contracts at December 31, 2010 is Macquarie Bank Limited.

- 43 -
MACQUARIE EQUINOX LIMITED Notes to the Financial Statements (continued) December 31, 2010 (Amounts expressed in Australian Dollars) 10. Fair values of financial instruments with off-balance sheet risk (continued)
At December 31, 2009, the notional or contractual amounts of the Fund’s outstanding forward foreign currency contracts were as follows:
Currency to be bought
Currency to be sold
Contract date due
Unrealised gain/(loss)
% of Net Assets
CLASS A AUD 2,161,473 USD (1,696,000) 25-Jan-10 267,917 0.25% AUD (2,161,473) USD 1,696,000 25-Jan-10 (267,917) (0.25%) AUD 1,884,444 USD (1,696,000) 25-Jan-10 (8,378) (0.01%) AUD (1,884,444) USD 1,696,000 25-Jan-10 8,378 0.01% AUD 954,389 USD (851,000) 25-Jan-10 (3,615) 0.00%
CLASS B AUD 15,855,477 USD (12,441,000) 25-Jan-10 1,965,304 1.84% AUD (15,855,477) USD 12,441,000 25-Jan-10 (1,965,304) (1.84%) AUD 13,823,333 USD (12,441,000) 25-Jan-10 (61,455) (0.06%) AUD (13,823,333) USD 12,441,000 25-Jan-10 61,455 0.06% AUD 7,942,400 USD (7,082,000) 25-Jan-10 (30,084) (0.03%)
CLASS C AUD 14,342,701 USD (11,254,000) 25-Jan-10 1,777,793 1.67% AUD (14,342,701) USD 11,254,000 25-Jan-10 (1,777,793) (1.67%) AUD 12,504,444 USD (11,254,000) 25-Jan-10 (55,592) (0.05%) AUD (12,504,444) USD 11,254,000 25-Jan-10 55,592 0.05% AUD 5,715,119 USD (5,096,000) 25-Jan-10 (21,648) (0.02%) AUD 11,785,073 USD (7,254,891) 25-Jan-10 2,755,289 2.58% CLASS D EUR 4,602,851 USD (6,441,000) 25-Jan-10 176,793 0.17% EUR (4,602,851) USD 6,441,000 25-Jan-10 (176,793) (0.17%) EUR 4,401,093 USD (6,441,000) 25-Jan-10 (145,081) (0.14%) EUR (4,401,093) USD 6,441,000 25-Jan-10 145,081 0.14% CLASS E AUD (361,345) USD 285,000 25-Jan-10 (43,152) (0.04%) AUD 2,748,996 USD (2,157,000) 25-Jan-10 340,741 0.32% AUD (907,331) USD 750,000 25-Jan-10 (70,097) (0.07%) AUD (2,748,996) USD 2,157,000 25-Jan-10 (340,741) (0.32%) AUD 361,345 USD (285,000) 25-Jan-10 43,152 0.04% AUD 907,331 USD (750,000) 25-Jan-10 70,097 0.07% AUD 228,964 USD (200,000) 25-Jan-10 5,736 0.01% AUD 1,024,444 USD (922,000) 25-Jan-10 (4,554) 0.00% AUD (1,024,444) USD 922,000 25-Jan-10 4,554 0.00% AUD (228,964) USD 200,000 25-Jan-10 (5,736) (0.01%) AUD 1,032,893 USD (921,000) 25-Jan-10 (3,912) 0.00% AUD 3,814,988 USD (2,333,628) 25-Jan-10 857,098 0.80% AUD 656,468 USD (402,350) 25-Jan-10 146,635 0.14% AUD 453,829 USD (320,631) 25-Jan-10 55,455 0.05% AUD 1,115,318 USD (825,447) 25-Jan-10 95,778 0.09% AUD 1,034,323 USD (795,911) 25-Jan-10 55,953 0.05% AUD 260,512 USD (208,865) 25-Jan-10 5,011 0.00%

- 44 -
MACQUARIE EQUINOX LIMITED Notes to the Financial Statements (continued) December 31, 2010 (Amounts expressed in Australian Dollars) 10. Fair values of financial instruments with off-balance sheet risk (continued)
Currency to be bought
Currency to be sold
Contract date due
Unrealised gain/(loss)
% of Net Assets
CLASS F AUD 3,040,846 USD (2,386,000) 25-Jan-10 376,916 0.35% AUD (3,040,846) USD 2,386,000 25-Jan-10 (376,916) (0.35%) AUD 2,651,111 USD (2,386,000) 25-Jan-10 (11,786) (0.01%) AUD (2,651,111) USD 2,386,000 25-Jan-10 11,786 0.01% AUD 1,104,669 USD (985,000) 25-Jan-10 (4,184) 0.00%
CLASS J EUR 20,025,726 USD (28,023,000) 25-Jan-10 752,147 0.71% EUR (20,025,726) USD 28,023,000 25-Jan-10 (752,147) (0.71%) EUR 19,066,832 USD (28,023,000) 25-Jan-10 (777,622) (0.73%) EUR (19,066,832) USD 28,023,000 25-Jan-10 777,622 0.73% Total unrealised gain 10,812,283 10.14% Total unrealised loss (6,904,507) (6.48%)
The counterparty for all forward currency contracts at December 31, 2009 is Macquarie.
11. Related parties
As at December 31, 2010, the Fund had $3,037,162 (31 December 2009: $59,260,532) held in accounts at Macquarie Bank Limited (the “Bank”), which is the parent company of MQ Capital Pty Limited, the Fund’s Investment Manager. The Bank is also the counterparty to all forward foreign currency contracts and bonds to the value of $12,885,607 and $48,123,179 as at 31 December 2010 (31 December 2009: $3,907,776 and $13,068,543) entered into by the Fund. In addition, certain officers and Directors of the Fund are also officers and directors of the Investment Manager, Administrator and the Bank. Directors fees incurred by the Fund with respect to Class A Shares during the year ended December 31, 2010 were $6,634 (2009: $11,460), of which $679 (2009: $1,989) were payable at December 31, 2010. Directors fees incurred by the Fund with respect to Class A1 Shares during the year ended December 31, 2010 were $3,947 (2009: $Nil), of which $679 (2009: $Nil) were payable at December 31, 2010. Directors fees incurred by the Fund with respect to Class B Shares during the year ended December 31, 2010 were $6,630 (2009: $11,459), of which $679 (2009: $1,989) were payable at December 31, 2010. Directors fees incurred by the Fund with respect to Class B1 Shares during the year ended December 31, 2010 were $3,947 (2009: $Nil), of which $679 (2009: $Nil) were payable at December 31, 2010. Directors fees incurred by the Fund with respect to Class C Shares during the year ended December 31, 2010 were $6,635 (2009: $11,459), of which $679 (2009: $1,988) were payable at December 31, 2010. Directors fees incurred by the Fund with respect to Class C1 Shares during the year ended December 31, 2010 were $3,497 (2009: $Nil), of which $679 (2009: $Nil) were payable at December 31, 2010. Directors fees incurred by the Fund with respect to Class D Shares during the year ended December 31, 2010 were $6,564 (2009: $11,709), of which $679 (2009: $ 1,988) were payable at December 31, 2010. .

- 45 -
MACQUARIE EQUINOX LIMITED Notes to the Financial Statements (continued) December 31, 2010 (Amounts expressed in Australian Dollars)
11. Related parties (continued) Directors fees incurred by the Fund with respect to Class E Shares during the year ended December 31, 2010 were $6,633 (2009: $11,459), of which $677 (2009: $1,988) were payable at December 31, 2010 Directors fees incurred by the Fund with respect to Class E1 Shares during the year ended December 31, 2010 were $3,947 (2009: $Nil), of which $679 (2009: $Nil) were payable at December 31, 2010. Directors fees incurred by the Fund with respect to Class F Shares during the year ended December 31, 2010 were $6,635 (2009: $11,459), of which $679 (2009: $1,988) were payable at December 31, 2010. Directors fees incurred by the Fund with respect to Class F1 Shares during the year ended December 31, 2010 were $3,888 (2009: $Nil), of which $630 (2009: $Nil) were payable at December 31, 2010. Directors fees incurred by the Fund with respect to Class J Shares during the year ended December 31, 2010 were $6,563 (2009: $11,711), of which $680 (2009: $1,990) were payable at December 31, 2010. The Fund holds investments in an investment company that has common Directors (Cradle Mountain Trading Fund No. 1 Limited). The Fund holds investments in MQ Absolute Return Strategies – Asia, an investment company managed by the Investment Manager. The fund receives management and performance fee rebates from the Investment Manager on fees paid by MQ Absolute Return Strategies – Asia. During 2010, the fund received management fee rebates of $100,853 (2009: $312,677) and performance fee rebates of $Nil (2009: $Nil). All of the Class D and Class J Shares outstanding at December 31, 2010 are held by Macquarie Bank Limited who controls the Investment Manager. At December 31, 2010, accounts payable and accrued expenses included $Nil due to the Bank (2009 - $ Nil).

- 46 -
MACQUARIE EQUINOX LIMITED Notes to the Financial Statements (continued) December 31, 2010 (Amounts expressed in Australian Dollars)
12. Loan payable
The Fund has entered into Loan Agreements with the Bank.
Class B Under the terms of the Loan Agreement dated October 26, 2007, the Bank agreed to provide the Class B Shares of the Fund with a US Dollar revolving credit facility, in an amount no greater than the lesser of (a) the US Dollar equivalent of 15% of the net asset value of the Class B Shares; or (b) US$4,600,000. Interest will accrue on the outstanding balance on a daily basis, at a rate of 1.5% per annum or a rate that is equivalent to the cost to the Bank of funding the outstanding balance, and will be payable monthly. The Bank may demand full repayment of the facility if a diminution in the net asset value of the Class B Shares has occurred, as defined in the Loan Agreement. As at December 31, 2010, an amount of $Nil (2009 - $Nil) was outstanding under the Loan Agreement in relation to Class B Shares, upon which interest of $Nil was accrued (2009 - $Nil). Loan interest expense incurred by the Fund with respect to Class B Shares during the year ended December 31, 2010 was $Nil (2009 - $658).
Class C Under the terms of the Loan Agreement dated October 26, 2007, the Bank agreed to provide the Class C Shares of the Fund with a US Dollar revolving credit facility, in an amount no greater than the lesser of (a) the US Dollar equivalent of 15% of the net asset value of the Class C Shares; or (b) US$5,900,000. Interest will accrue on the outstanding balance on a daily basis, at a rate of 1.5% per annum or a rate that is equivalent to the cost to the Bank of funding the outstanding balance, and will be payable monthly. The Bank may demand full repayment of the facility if a diminution in the net asset value of the Class C Shares has occurred, as defined in the Loan Agreement. As at December 31, 20100, an amount of $Nil (2009 - $Nil) was outstanding under the Loan Agreement in relation to Class C Shares, upon which interest of $Nil was accrued (2009 - $Nil). Loan interest expense incurred by the Fund with respect to Class C Shares during the year ended December 31, 2010 was $Nil (2009 - $438).
Class D Under the terms of the Loan Agreement dated December 19, 2007, the Bank agreed to provide the Class D Shares of the Fund with a US Dollar revolving credit facility, in an amount no greater than the lesser of (a) the US Dollar equivalent of 15% of the net asset value of the Class D Shares; or (b) US$1,400,000. Interest will accrue on the outstanding balance on a daily basis, at a rate of 1.5% per annum or a rate that is equivalent to the cost to the Bank of funding the outstanding balance, and will be payable monthly. The Bank may demand full repayment of the facility if a diminution in the net asset value of the Class D Shares has occurred, as defined in the Loan Agreement. As at December 31, 2010, an amount of $Nil (2009 - $Nil) was outstanding under the Loan Agreement in relation to Class D Shares, upon which interest of $Nil was accrued (2009 - $Nil). Loan interest expense incurred by the Fund with respect to Class D Shares during the year ended December 31, 2010 was $Nil (2009 - $Nil).

- 47 -
MACQUARIE EQUINOX LIMITED Notes to the Financial Statements (continued) December 31, 2010 (Amounts expressed in Australian Dollars) 12. Loan payable (continued)
Class E
Under the terms of the Loan Agreement dated October 26, 2007 and amended December 19, 2007, the Bank agreed to provide the Class E Shares of the Fund with a US Dollar revolving credit facility, in an amount no greater than the lesser of (a) the US Dollar equivalent of 30% of the net asset value of the Class E Shares; or (b) US$1,700,000. Interest will accrue on the outstanding balance on a daily basis, at a rate of 1.5% per annum or a rate that is equivalent to the cost to the Bank of funding the outstanding balance, and will be payable monthly. The Bank may demand full repayment of the facility if a diminution in the net asset value of the Class E Shares has occurred, as defined in the Loan Agreement. As at December 31, 2010, an amount of $Nil (2009 - $Nil) was outstanding under the Loan Agreement in relation to Class E Shares, upon which interest of $Nil was accrued (2009 - $Nil). Loan interest expense incurred by the Fund with respect to Class E Shares during the year ended December 31, 2010 was $Nil (2009 - $94).
Class F Under the terms of the Loan Agreement dated October 26, 2007 and amended December 19, 2007, the Bank agreed to provide the Class F Shares of the Fund with a US Dollar revolving credit facility, in an amount no greater than the lesser of (a) the US Dollar equivalent of 30% of the net asset value of the Class F Shares; or (b) US$1,500,000. Interest will accrue on the outstanding balance on a daily basis, at a rate of 1.5% per annum or a rate that is equivalent to the cost to the Bank of funding the outstanding balance, and will be payable monthly. The Bank may demand full repayment of the facility if a diminution in the net asset value of the Class F Shares has occurred, as defined in the Loan Agreement. As at December 31, 2010, an amount of $Nil (2009 - $Nil) was outstanding under the Loan Agreement in relation to Class F Shares, upon which interest of $Nil was accrued (2009 - $Nil). Loan interest expense incurred by the Fund with respect to Class F Shares during the year ended December 31, 2010 was $Nil (2009 - $106). Class J Under the terms of the Loan Agreement dated December 19, 2007, the Bank agreed to provide the Class J Shares of the Fund with a US Dollar revolving credit facility, in an amount no greater than the lesser of (a) the US Dollar equivalent of 15% of the net asset value of the Class J Shares; or (b) US$3,900,000. Interest will accrue on the outstanding balance on a daily basis, at a rate of 1.5% per annum or a rate that is equivalent to the cost to the Bank of funding the outstanding balance, and will be payable monthly. The Bank may demand full repayment of the facility if a diminution in the net asset value of the Class J Shares has occurred, as defined in the Loan Agreement. As at December 31, 2010, an amount of $Nil (2009 - $Nil) was outstanding under the Loan Agreement in relation to Class J Shares, upon which interest of $Nil was accrued (2009 - $Nil). Loan interest expense incurred by the Fund with respect to Class J Shares during the year ended December 31, 2010 was $Nil (2009 - $162).
- 48 -
MACQUARIE EQUINOX LIMITED Notes to the Financial Statements (continued) December 31, 2010 (Amounts expressed in Australian Dollars)
13. Share capital
The Fund has an authorised Share capital of $160,000, divided into 2,000 non-redeemable, voting, non-participating Shares (the “Voting Shares”) at a par value of $0.001 each and 1,599,980,000 redeemable, non-voting, participating Shares (the “Shares”) at a par value of $0.0001 each. By resolutions dated November 26, 2003, April 23, 2004, June 25, 2004, January 12, 2006, December 15, 2004, February 4, 2006, January 12, 2007 and 31 March 2010 the Directors approved the issue and offer of Class A1 Shares, Class B1 Shares, Class C1 Shares, Class E1 Shares, Class F1 Shares, Class A Shares, Class B Shares, Class C Shares, Class D Shares, Class E Shares, Class F Shares, and Class J Shares, respectively. The terms of all share classes are the same. The Fund creates and maintains a separate portfolio in respect of each Class of Shares. Assets held in each portfolio are applied solely in respect of each Class of Shares to which the portfolio pertains. The holders of shares in one class have no rights whatsoever in respect of the assets of any other portfolio held in another class. However, in the event of any insolvency of any one or more class, creditors in respect of such portfolio or portfolios would be creditors of the Fund as a whole, and accordingly could proceed against any assets held in any Class of Shares of the Fund. The holders of Shares are entitled to distributions as declared by the Board of Directors and to the surplus assets of the Fund in the event of a winding up or dissolution of the Fund. The holders of Voting Shares are not entitled to dividends declared or paid by the Board of Directors and, in the event of a winding up or dissolution of the Fund, are only entitled to receive paid-up capital to the extent it has been called and paid. As at 31 December 2010 the only shareholders are Macquarie Equities Limited and Macquarie Bank Limited. Shares may be redeemed on the last business day of each month or at such other times as the Board of Directors may determine. All share classes of the Fund put in place an investor redemption freeze effective November 28, 2008. This was considered necessary to ensure fair treatment of all shareholders in light of the liquidity restrictions imposed by certain underlying component funds. Since this date the Fund has been winding down its investments in funds that have redemption restrictions with the intention to fully redeem from these funds as soon as possible. The Board of Directors will decide when to lift the redemption freeze in due course. The side pocket classes are locked until the underlying investments are fully liquidated. Each time Shares are redeemed from Class D prior to December 31 in any given year, the Investment Manager receives an additional fee (a “redemption fee”) equal to one twelfth of 1.25% of the net asset value of corresponding Shares being redeemed, multiplied by the number of months from the time of redemption until December 31 in any given year. The fee is paid out of the redemption proceeds attributable to the Class D Shares redeemed. The Investment Manager also received a fee (an “offer fee”) in arrears on the last business day of each offer fee year month (considered to be the month in which the Shares are initially allotted, and the next 35 consecutive calendar months, the last of which ended on March 31, 2008) calculated at a rate of 0.1% of the total amount subscribed for Class F Shares reduced by $1 per Class F Share redeemed. Each time shares were redeemed from Class F prior to March 31, 2008, the Investment Manager received a fee (an “additional offer fee”) calculated as the greater of zero and Nr *$1* [3.3% - (M*0.1%)] where M is 1 plus the number of whole calendar months from March 24, 2006 until the Redemption Date, and Nr is the number of shares subject to the redemption that were not issued under the dividend reinvestment facility (an optional facility whereby Shareholder cash dividends, if any, are applied by the Fund and used to pay for additional shares for such Shareholders). No additional offer fee was payable in relation to a redemption if the total offer fees paid on or before the date of the redemption exceeded 3.6% of the total amount subscribed for Class F Shares.

- 49 -
MACQUARIE EQUINOX LIMITED Notes to the Financial Statements (continued) December 31, 2010 (Amounts expressed in Australian Dollars) 13. Share Capital (continued)
The net asset value and net asset value per Share of each Class at December 31, 2010 were as follows: Class of Shares
Number of Shares
NAV per Share
NAV of Class at December 31, 2010
Class A 3,370,000.000 $ 1.1317 $ 3,813,992 Class A Side Pocket 1,352.028 0.9527 1,288 Class A1 1,549,000.000 0.3008 465,893 Class B 22,166,721.000 1.1540 25,580,567 Class B Side Pocket 6,768.265 1.0304 6,974 Class B1 4,408,929.000 0.4849 2,137,830 Class C 24,287,318.000 1.0709 26,008,239 Class C Side Pocket 22,348.743 1.0255 22,919 Class C1 4,742,236.000 0.3248 1,540,457 Class D 1,321.583 809.1578 1,397,238* Class E 5,938,500.996 0.9124 5,418,049 Class E Side Pocket 18,176.640 0.8152 14,818 Class E1 2,770,665.000 0.2953 818,207 Class F 6,909,144.997 1.0909 7,537,509 Class F Side Pocket 4,677.764 0.8901 4,164 Class F1 2,675,648.000 0.2282 610,492 Class J 3,860.380 1,407.9895 7,101,860** $ 82,480,496 Classes D and J Shares are denominated in Euro. * equivalent of €1,069,369 ** equivalent of €5,435,375 Distributions were paid as follows:
• 18 January 2010 Class J $2,544,270. • 28 May 2010: Class A1 $1,243,885, Class B1 $2,861,747, Class C1 $ 3,401,655, Class D
€549,214, Class E1 $1,622,342, Class F1 $2,235,800 and Class J €2,637,848. • 08 December 2010 Class D $300,333 and Class J $2,253,860.
The net asset value and net asset value per Share of each class at December 31, 2009 were as follows: Class of Shares
Number of Shares
NAV per Share
NAV of Class at December 31, 2009
Class A 4,919,000.000 $ 1.118 $ 5,500,911 Class A Side Pocket 1,999.270 0.906 1,811 Class B 26,575,650.000 1.144 30,397,739 Class B Side Pocket 10,008.438 0.980 9,808 Class C 29,029,554.000 1.035 30,036,662 Class C Side Pocket 33,047.773 0.975 32,233 Class D 1,321.583 1,366.805 2,882,567* Class E 8,709,165.996 0.880 7,661,910 Class E Side Pocket 26,877.957 0.775 20,840 Class F 9,584,792.997 1.060 10,159,964 Class F Side Pocket 6,917.158 0.847 5,856 Class J 3,860.384 3,240.055 19,960,038* $ 106,670,339 Classes D and J Shares are denominated in Euro. * equivalent of €1,806,345 ** equivalent of €12,507,857

- 50 -
MACQUARIE EQUINOX LIMITED Notes to the Financial Statements (continued) December 31, 2010 (Amounts expressed in Australian Dollars)
13. Share Capital (continued)
The following distributions were declared and paid during the year ended 31 December 2009: 5 October, 2009 2 November, 2009 30 November, 2009
Class D $13,182.94 $1,116.37 - Class J $2,896.79 $8,310.42 $185.10 The Fund does not have externally imposed capital requirements. The following table shows the number of shares issued and redeemed during the year to 31 December 2010 and during the year to 31 December 2009:
01 January 2010 to 31 December 2010
01 January 2009 to 31 December 2009
Units Units Number of Shares at the beginning of the year Class A 4,919,000.000 4,919,000.000 Class A Side Pocket 1,999.270 13,477.180 Class A1 - - Class B 26,575,650.000 26,575,650.000 Class B Side Pocket 10,008.438 67,467.281 Class B1 - - Class C 29,029,554.000 29,029,554.000 Class C Side Pocket 33,047.773 222,776.131 Class C1 - - Class D 1,321.583 1,321.583 Class E 8,709,165.996 8,709,165.996 Class E Side Pocket 26,877.957 181,181.770 Class E1 - - Class F 9,584,792.997 9,584,792.997 Class F Side Pocket 6,917.158 46,628.834 Class F1 - - Class J 3,860.380 3,860.384 Number of Shares issued during the year Class A - - Class A Side Pocket - - Class A1 1,549,000.000 - Class B - - Class B Side Pocket - - Class B1 4,408,929.000 - Class C - - Class C Side Pocket - - Class C1 4,742,236.000 - Class D - - Class E - - Class E Side Pocket - - Class E1 2,770,665.000 - Class F - - Class F Side Pocket - - Class F1 2,675,648.000 - Class J - -

- 51 -
MACQUARIE EQUINOX LIMITED Notes to the Financial Statements (continued) December 31, 2010 (Amounts expressed in Australian Dollars) 13. Share Capital (continued)
01 January 2010 to 31 December 2010
01 January 2009 to 31 December 2009
Number of Shares redeemed during the year Units Units Class A (1,549,000.000) - Class A Side Pocket (647.242) (11,477.910) Class A1 - Class B (4,408,929.000) - Class B Side Pocket (3,240.173) (57,458.843) Class B1 - Class C 4,742,236.000 - Class C Side Pocket 10,699.030 (189,728.358) Class C1 - Class D - - Class E (2,770,665.000) - Class E Side Pocket (8,701.317) (154,303.813) Class E1 - Class F (2,675,648.000) - Class F Side Pocket (2,239.394) (39,711.676) Class F1 - - Class J - -
Number of Shares at the end of the year Class A 3,370,000.000 4,919,000.000 Class A Side Pocket 1,352.028 1,999.270 Class A1 1,549,000.000 - Class B 22,166,721.000 26,575,650.000 Class B Side Pocket 6,768.265 10,008.438 Class B1 4,408,929.000 - Class C 24,287,318.000 29,029,554.000 Class C Side Pocket 22,348.743 33,047.773 Class C1 4,742,236.000 - Class D 1,321.583 1,321.583 Class E 5,938,500.996 8,709,165.996 Class E Side Pocket 18,176.640 26,877.957 Class E1 2,770,665.000 - Class F 6,909,144.997 9,584,792.997 Class F Side Pocket 4,677.764 6,917.158 Class F1 2,675,648.000 - Class J 3,860.380 3,860.380
14. Side Pocket Share Class
One of the underlying funds in the portfolio - the Drake Global Opportunities Fund (“Drake”) - is in the process of winding down. Drake is liquidating its portfolio and is making payments to investors as its underlying assets are realised.

- 52 -
MACQUARIE EQUINOX LIMITED Notes to the Financial Statements (continued) December 31, 2010 (Amounts expressed in Australian Dollars) 14. Side Pocket Share Class (continued)
The winding up of Drake has resulted in a delay for redeeming investors in receiving the Drake portion of their investment. In accordance with the Fund’s by-laws and to ensure that all investors are treated fairly and equitably, the Fund has created Side Pocket Classes to segregate the Drake investment component of redeeming investors. The Drake proceeds are being repaid to redeeming investors as and when they are received by the Fund. The Drake Investments have not been side pocketed in the all classes as in some there is only one investor and so a side pocket was not required as the investor would not have been disadvantaged by redemptions from this class. At December 31, 2010, the investment in the Drake fund represented US$596,992 (0.96%) of the Fund’s net asset value and has been valued based on the net asset value as reported by the administrator of Drake as at 31 December 2010. No adjustment has been made to reflect the delayed redemption.
15. Taxes Under current Bermuda laws, the Fund is not required to pay any taxes in Bermuda on either income or capital gains. The Fund has received an undertaking from the Minister of Finance in Bermuda exempting it from any such taxes at least until the year 2016. It is management’s belief that the Fund is not engaged in a United States trade or business and will not be subject to United States income or withholding taxes in respect of the profits and losses of the Fund other than the 30% withholding tax on United States source dividends. As a result, management has made no provision for income taxes in these financial statements.
16. Risk Factors
Financial risk management The Investment Manager adopted the following investment objectives, policies and processes for managing the Fund’s capital: Investment objectives The Fund's investment objective is capital appreciation. The Fund seeks to achieve its investment objective through investing in a series of component funds. These component funds employ sophisticated international investment and trading strategies. The Fund is therefore exposed to currency risk, credit risk, interest rate risk, market price risk and liquidity risk. Investment policies The Fund’s portfolio will contain diversified funds and tactical traders so as to provide exposure to a portfolio of investment and trading strategies believed to be capable of achieving absolute returns in a variety of market conditions. The Fund’s portfolio will also include foreign exchange contracts, cash at call and may include notional liabilities to increase investment exposure and security deposits as appropriate. Investment processes The Investment Manager uses a number of criteria to identify potential investment opportunities in component funds. These include but are not limited to;
i. An assessment of the potential rate of return expected;
ii. An assessment of the degree of risk and volatility likely to be experienced from holding a given investment;
iii. The liquidity of the investment, including an assessment of the liquidity of the underlying asset classes in which the component fund invests;

- 53 -
MACQUARIE EQUINOX LIMITED Notes to the Financial Statements (continued) December 31, 2010 (Amounts expressed in Australian Dollars) 16. Risk Factors
Financial risk management (continued) Investment processes (continued)
iv. An evaluation of the costs associated in the investing of the component fund including management and performance fees;
v. Due diligence over the component funds to determine whether the Fund meets its stated investment strategy and policies on risk management and operations control;
vi. Consideration of the overall exposure of the Fund to the contemplated investment and to particular
strategies, markets and countries.
Once the investment criteria are applied, the Investment Manager must manage the portfolio makeup in accordance with certain guidelines. These guidelines specify amongst other things:
i. The minimum number of component funds to be included in the investment portfolio and the maximum allocation to any single component fund;
ii. The maximum exposure the investment portfolio should have to certain strategies and countries;
iii. The maximum allocation to component funds based on their liquidity.
The Investment Manager will monitor the investment portfolio on an ongoing basis to ensure that it generally complies with these guidelines. Where the portfolio does not comply with these guidelines, the Investment Manager will, as soon as practicable, re-balance the portfolio so as to ensure it meets these guidelines. The risks and the respective risk management policies employed by the Fund to manage these risks are discussed below:
(a) Market risk
(i) Other price risk Other price risk is the risk that the value of a financial instrument will fluctuate as a result of changes in market prices whether those changes are caused by factors specific to the individual instrument or factors affecting all instruments in the market. The Fund is exposed to other price risk on all of its investments in the component funds. The Fund's management policies and sensitivity analysis in relation to other price risk are discussed in part (b) of this note.

- 54 -
MACQUARIE EQUINOX LIMITED Notes to the Financial Statements (continued) December 31, 2010 (Amounts expressed in Australian Dollars) 16. Risk Factors (continued)
Financial risk management (continued)
(a) Market risk (continued) (ii) Currency risk The Fund is exposed to currency risk on its investment in the component funds. The Fund holds both monetary and non-monetary assets denominated in currencies other than the Australian dollar. The currency risk relating to non-monetary assets and liabilities is a component of price risk. Currency risk arises as the value of securities denominated in other currencies will fluctuate due to changes in exchange rates. The risk is measured using sensitivity analysis. The majority of the currency risk is hedged by the Investment Manager of the Fund through the use of currency forward exchange contracts. The Investment Manager believes that through hedging, the Fund's sensitivity to movements in exchange rates is minimised. Currency hedging will not remove the foreign currency exposure which arises where the component funds hold investments in currencies other than the relevant Class currency. These exposures may be significant and may not be hedged fully by the component funds. In accordance with the Fund’s policy, an independent risk management function is performed by risk managers employed by the Fund to monitor the Fund’s currency position on a daily basis. The table below summarises the Fund’s exposure to currency risk: At December 31, 2010
Currency
Monetary assets
Exposure
Monetary liabilities Exposure
Forward Exchange Contract Exposure
Underlying Investment Exposure
Net Exposure
% of Net
Asset Value
Japanese Yen $ 1,303 $ - $ - $ - $ 1,303 0.00% U S Dollar $27,506,374 $ 77,538 ($75,503,034) $60,862,558 $12,943,436 15,.69%
At December 31, 2009
Currency
Monetary assets
Exposure
Monetary liabilities Exposure
Forward Exchange Contract Exposure
Underlying Investment Exposure
Net Exposure
% of Net
Asset Value
Japanese Yen $ 1,036 $ - $ - $ - $ 1,036 0.00% U S Dollar $ 16,822,446 $ 176,390 ($ 27,076,723) $ 28,480,378 $ 18,049,711 16.92%
The Fund does not mange currency exposure of the classes denominated in Euro. (iii) Interest rate risk The majority of the Fund’s financial assets and liabilities are non interest bearing. Any excess cash and cash equivalents are invested at short term market interest rates. As a result, the Fund is not subject to significant amounts of fair value risk due to fluctuations in the prevailing levels of market interest rates.

- 55 -
MACQUARIE EQUINOX LIMITED Notes to the Financial Statements (continued) December 31, 2010 (Amounts expressed in Australian Dollars) 16. Risk Factors (continued)
Financial risk management (continued)
(a) Market risk (continued) (iii) Interest rate risk (continued) Interest rate risk arises from the possibility that changes in interest rate will affect future cash flows or the fair value of financial instruments. The majority of interest rate exposure arises on investment in cash and cash equivalents in Australia, United States of America and European Union. These investments carry variable interest rates. Fixed income securities mature within 3 years and carry zero interest rates. The following table demonstrates the sensitivity of the fund’s profit (loss) for the year and fair value to a reasonably possible change in interest rate, with all other variables held constant. The sensitivity of the profit (loss) for the year and fair value is the effect of the assumed changes in interest rates on; • The net interest income for one year, based on floating rate financial assets such as cash and cash
equivalents held at the reporting date. • Changes in fair value of investment for the year, based on revaluing fixed rate financial assets held
at the reporting date. There is no sensitivity effect on “other comprehensive income” as the fund has no assets classified as “available for sale” or designated hedging instruments. In practice, the actual results may differ from the below sensitivity analysis and the difference could be significant.
Change in basis
points Sensitivity of interest
income
Sensitivity of changes in fair value
of investments 31-Dec-10 Increase/ (Decrease) Increase/ (Decrease) Increase/ (Decrease)
Security Type $'000 $'000 Cash - AUD 150/(150) 40/(40) 40/(40) Cash - EUR 120/(120) 33/(33) 33/(33) Cash - USD 100/(100) 52/(52) 52/(52) Fixed Income Security - USD 150/(150) NA 1,033/(1,033)
Change in basis
points Sensitivity of interest
income
Sensitivity of changes in fair value
of investments 31-Dec-09 Increase/ (Decrease) Increase/ (Decrease) Increase/ (Decrease)
Security Type $'000 $'000 Cash - AUD 150/(150) 756 / (756) 756 / (756) Cash - EUR 120/(120) 98 / (98) 98 / (98) Cash - USD 100/(100) 13 / (13) 13 / (13) Fixed Income Security - USD 150/(150) N/A (450) / 450

- 56 -
MACQUARIE EQUINOX LIMITED Notes to the Financial Statements (continued) December 31, 2010 (Amounts expressed in Australian Dollars) 16. Risk Factors (continued)
Financial risk management (continued)
(b) Market risk management and summarised sensitivity analysis In order to monitor and manage the Fund's market risk the Investment Manager has retained the services of Macquarie International Capital Advisors Pty Limited (“MICAP”), a wholly owned subsidiary of Macquarie, to act as risk adviser. In this role MICAP will monitor the Fund's exposure to the component funds and advise if it believes there is a material breach of conduct, in terms of the investing, trading or business activities of the managers of the component funds. Material breaches of conduct by component funds would include significant deviation from stated investment mandate, failure to adhere to stated risk limits, deterioration in operational risk management or trading practices, significant deterioration of, or inadequate, infrastructure or personnel, rapidly exceeding capacity limits, deception, misrepresentation or inadequate disclosure, inadequate data redundancy, or other circumstances that might arise that may be considered to increase the investment, trading, operational or business risk of the manager to unacceptably high levels. MICAP’s role will include frequent portfolio monitoring, regular contact with the managers of the component funds, site visits to those managers and risk monitoring. MICAP also monitors the Fund's currency position on a daily basis. The table below summarises the impact on the Fund’s profit, of reasonably possible changes in the returns of each of the strategies to which the Fund is exposed through the Funds in which it invests at year end. A reasonably possible change is management's assessment, based on historical data sourced from internal calculations of annualised average returns, of what is a reasonably possible percentage movement in the value of a fund following each respective strategy over the next year in Australian Dollar terms. The impact on profit is calculated by applying the reasonably possible movement determined for each strategy to the value of each fund held by the Fund. The analysis is based on the assumption that the returns on each strategy have increased or decreased as disclosed with all other variables held constant. The Underlying risk disclosures represent the market risks to which the Fund is exposed, with “O” representing other price risk. This analysis is dependent on historical data and therefore relies on the appropriateness of the data set being used. Therefore, an increase of X% in a particular underlying strategy may generate a different net amount in result on the Fund to a particular underlying strategy decrease of X%. Further, as the data is historical in nature it is important to view the below analysis in the context, such that the changes in market indexes, and projected impact on the Fund’s net asset value may not replicate the impact on the Fund that has been outlined based on historical information.

- 57 -
MACQUARIE EQUINOX LIMITED Notes to the Financial Statements (continued) December 31, 2010 (Amounts expressed in Australian Dollars) 16. Risk Factors (continued)
Financial risk management (continued)
(b) Market risk management and summarised sensitivity analysis (continued)
At 31 December 2010
Underlying Strategy
Underlying Risk
Exposures Number of
Funds
Annualised Historical
Return (%)
* Weighted Reasonably
Possible change (%)
Impact on Net Assets & Net Profit (AUD)
Emerging Markets Credit O 1 0.00% 0.00% $ - Event-Driven O 2 5.78% 0.03% $ 25,064 Fund of Funds O 4 2.11% 0.39% $ 325,831 Multi-Strategy O 1 17.41% 0.03% $ 25,064 Relative-Value O 1 0.00% 0.00% $ - Tactical Trading O 2 19.67% 0.17% $ 142,029
At 31 December 2009
Underlying Strategy
Underlying Risk
Exposures Number of
Funds
Annualised Historical
Return (%)
* Weighted Reasonably
Possible change (%)
Impact on Net Assets & Net Profit (AUD)
Emerging Markets Credit O 1 (0.93%) 0.00% ($ 4,235) Event-Driven O 2 30.60% 0.19% $ 202,674 Fund of Funds O 4 7.24% 1.79% $ 1,909,399 Multi-Strategy O 1 49.35% 0.26% $ 277,343 Relative-Value O 1 2.47% 0.05% $ 53,335 Tactical Trading O 2 5.97% 0.09% $ 96,003 * Weighted, in this context refers to the percentage holding of the underlying strategy in this fund The performance of the Fund will depend largely on the investment performance achieved by the component funds. The component funds will engage in a wide variety of strategies and invest in a variety of markets and securities. There is a risk that the component funds may perform poorly. The strategy employed by the manager of a component fund or their characteristics, such as assets under management, may change over time, which may adversely affect the component fund's returns. Component funds may not perform successfully under all market conditions.

- 58 -
MACQUARIE EQUINOX LIMITED Notes to the Financial Statements (continued) December 31, 2010 (Amounts expressed in Australian Dollars) 16. Risk Factors (continued)
Financial risk management (continued)
(b) Market risk management and summarised sensitivity analysis (continued) The Fund’s underlying investment exposures to the U.S. market:
2010 2009
Exposure Exposure Exposure
% of Gross
Exposure Listed/Quoted Investments Long Positions - United States $ 12,739,379 15.45% $ 28,480,378 26.70% Total Market Positions $ 12,739,379 15.45% $ 28,480,378 26.70%
(c) Credit risk
Credit risk is the risk that one party to a financial instrument will fail to discharge its obligation and cause the other party to incur a financial loss. The Fund is exposed to credit risk, which is the risk that an issuer or counterparty will be unable or unwilling to meet a commitment (including payment of amounts arising from derivative contracts) in full when due, that it has entered into with the Fund. All investment transactions are settled/paid for upon delivery using approved brokers. The risk of default is considered minimal since delivery of securities sold is only made once the broker has received payment and payment for securities purchased is only made once the broker has received the securities. If either party fails to meet their obligation, the trade will fail. The Fund is exposed to credit risk on its cash and cash equivalents, amounts due from broker, cash held at the broker and all derivatives and securities where the prime broker is the custodian. This risk is monitored on an ongoing basis. The Custodians, HSBC International for Equinox Classes C - J and Macquarie Bank Limited for Equinox Classes A & B are responsible for the safekeeping of all investments and other assets of the Fund delivered to them (the “Custody Assets”). The Custodians will establish and maintain on their books a segregated account or accounts for or on behalf of the Fund, into which account or accounts may be transferred the Custody Assets. The Custody Assets will be registered in the names of the Custodians or their nominees or in such other name and held to their order as they may think proper and/or held by physical possession of the certificates or other instruments representing the Custody Assets in registered or bearer form or the broker’s receipts or confirmations for investments. Such Custody Assets should therefore not be available to the creditors of the Custodians in the event of their insolvency.

- 59 -
MACQUARIE EQUINOX LIMITED Notes to the Financial Statements (continued) December 31, 2010 (Amounts expressed in Australian Dollars) 16. Risk Factors (continued)
Financial risk management (continued)
(c) Credit risk (continued) The carrying amounts of financial assets best represent the maximum credit risk exposure at the reporting date. At December 31, 2010, assets with carrying amounts of $14,611,120 (2009: $20,629,986) were held with HSBC International and assets with carrying amounts of $56,140,466 (2009: $80,965,044) were held with Macquarie Bank Limited. At December 31, 2010, gross-settled derivatives with gross principal amounts of $8,825,044 (2009: $20,074,375) were held with HSBC International and gross-settled derivatives with gross principal amounts of $53,103,304 (2009: $21,752,443) were held with Macquarie Bank Limited. The credit ratings issued by Moody’s at the year end were:
December 2010 December 2009 Macquarie Bank (Belike Nominees Pty Ltd) A2 A2 HSBC Institutional Trust Services (Asia) Ltd Aa2 Aa2
The Fund may also be subject to credit risk and counterparty risk in respect of derivative contracts it may enter into for hedging purposes, or in respect of arrangements entered into with service providers. The total exposure to forward contracts at December 31, 2010 is $73,798,293. The Fund may borrow or employ internal leverage (through borrowings undertaken with other entities in the group). Each of the component funds in which the Fund invests may also employ leverage. This leverage can magnify the gains and losses relative to an un-leveraged investment. The Fund or component funds may also incur losses if they are forced to dispose of assets at unfavourable prices in order to repay interest or borrowings. In 2009, four of the underlying funds in the Fund’s portfolio created sidepocket classes due to overwhelming redemption requests and illiquidity within their own portfolios. These may also expose the Fund to credit risk. More detail on this exposure is given in note 16(f). Credit quality of financial assets
The Fund invests only in financial assets with at least investment grade credit rating as rated by S&P. All fixed income securities held at December 31, 2010 have a credit rating of A-2.
Component funds may be exposed to the credit risk of the parties with whom they trade or invest and will also bear the risk of settlement default. Market practices in the less developed markets in relation to the settlement of securities transactions and custody of assets will provide increased risk. At December 31, 2010 $4,951,976 (6.00%) of the Fund’s net asset value was made up of its investment in the Irongate Global Strategy Fund Ltd. The December 31, 2009 financial statements made reference to the Equinox investment in the illiquid fund Irongate Global Strategy and the implications of its 2008 redemption freeze. Since this date Irongate has begun an orderly liquidation of it’s portfolio, with four distribution payments being made up to and including December 31, 2010. Irongate Global Strategy Fund intends to continue to distribute cash to shareholders as it receives proceeds from underlying funds, however the liquidity characteristics at this time are yet unconfirmed. One underlying fund - Drake - is in the process of winding down. Drake is liquidating its portfolio and is making payments to investors as its underlying assets are realised. The proceeds are being repaid to redeeming investors as and when they are received by the Fund.

- 60 -
MACQUARIE EQUINOX LIMITED Notes to the Financial Statements (continued) December 31, 2010 (Amounts expressed in Australian Dollars) 16. Risk Factors (continued)
Financial risk management (continued)
(c) Credit risk (continued)
In accordance with the Fund’s policy, the Investment Manager monitors the Fund’s credit position on a regular basis. In 2009, four of the underlying funds in the Fund’s portfolio created sidepocket classes due to overwhelming redemption requests and illiquidity within their own portfolios. More detail on this exposure is given in note 16(f).
(d) Liquidity risk Liquidity risk is the risk that the Fund will encounter difficulty in raising funds to meet commitments, which may result from difficulty in selling financial assets quickly at close to its fair value. The Fund is exposed to liquidity risk on all of its investments. Investments in component funds may be relatively illiquid and may be subject to redemption restrictions or "lock ups". Component funds may also impose fees or charges in connection with redemption requests by the Fund which may be passed on to redeeming Shareholders to the extent they have necessitated the redemption. Investment of the Fund's assets in relatively illiquid investments may restrict the ability of the Fund to dispose of its investments at a price and time that it wishes to do so. Consequently, the Fund may not be able to satisfy redemption requests (in whole or in part) until the Fund is able to redeem its investment in component funds. Redeeming Shareholders will bear the risk of any decline in the value of those component funds until the redemption is able to be fully effected. Each of the component funds may also invest in securities or assets which are relatively illiquid. The market for relatively illiquid securities tends to be more volatile than the market for more liquid securities. As a result, component funds may have to dispose of investments at unfavourable prices in order to satisfy redemption requests or in response to changing market conditions. In 2009, four of the underlying funds in the Fund’s portfolio created sidepocket classes due to overwhelming redemption requests and illiquidity within their own portfolios. These may also expose the Fund to liquidity risk. More detail on this exposure is given in note 16(f). The table below analyses the Fund’s financial liabilities that will be settled on a gross basis into relevant maturity groupings based on the remaining year at the Statement of Financial Position as at December 31, 2010 to the contractual maturity date. The amounts disclosed in the table are the contractual undiscounted cash flows. Balances due within 12 months equal their carrying amounts, as the impact of discounting is not significant.

- 61 -
MACQUARIE EQUINOX LIMITED Notes to the Financial Statements (continued) December 31, 2010 (Amounts expressed in Australian Dollars) 16. Risk Factors (continued)
Financial risk management (continued) At December 31, 2010
1 - 3 months 3 - 6
months
Greater than
12 months No stated maturity
6 – 12 months
Loans payable Other payables ($ 2,978,244) - - - - Redemptions payable ($ 62,447) - - - - Net assets attributable to shareholders - - - ($ 82,480,496) Derivative financial liabilities, settled gross
Outflows ($ 415,847) - ($ 582,828) ($ 848,711) - Inflows $ 2,104,450 $ 378,819 $ 8,948,467 $ 3,301,256 - ($ 1,352,088) $ 378,819 $ 8,365,639 $2,452,545 ($82,480,496)
Although there is no maturity all figures in the above table are frozen due to the redemption freeze. At December 31, 2009
1 - 3 months 3 - 6 months Greater than
No stated maturity 12 months Loans payable - - - - Other payables ($ 465,920) - - - Redemptions payable ($ 35,238) - - - Net assets attributable to shareholders - -
($ 106,670,339) -
Derivative financial liabilities, settled gross
-
Outflows - ($ 16,635,108) ($ 13,523,861) - Inflows - $ 16,749,470 $ 19,120,511 - ($ 501,158) $ 114,362 $ 5,596,650 ($ 106,670,339)
In accordance with the Fund’s policy, the Investment Manager monitors the Fund’s liquidity position on a continual basis to enable them to close out of positions at any point in time. Further, prior to any derivative position being entered into, the relationship between the likely liquidity and the size of the position taken is considered.

- 62 -
MACQUARIE EQUINOX LIMITED Notes to the Financial Statements (continued) December 31, 2010 (Amounts expressed in Australian Dollars) 16. Risk Factors (continued)
Financial risk management (continued)
(e) Fair values
The Fund adopted the amendments to IFRS 7, effective 1 January 2009. The fair value hierarchy has the following levels:
1. Quoted prices (unadjusted) in active markets for identical assets or liabilities (level 1);
2. Inputs other than quoted prices included within level 1 that are observable for the asset or liability, either directly (that is, as prices) or indirectly (that is, derived from prices) (level 2); and 3. Inputs for the asset or liability that are not based on observable market date (that is, unobservable inputs) (level 3).
The level in the fair value hierarchy within which the fair value measurement is categorised in its entirety is determined on the basis of the lowest level input that is significant to the fair value measurement in its entirety. For this purpose, the significance of an input is assessed against the fair value measurement in its entirety. If a fair value measurement uses observable inputs that require significant adjustment based on unobservable inputs, that measurement is a level 3 measurement. Assessing the significance of a particular input to the fair value measurement in its entirety requires judgement, considering factors specific to the asset or liability. The following table analyses within the fair value hierarchy the Fund’s financial assets and liabilities (by class) measured at fair value.
At December 31, 2010 Assets Level 1 Level 2 Level 3 Total Investments in other investment companies, at fair value - - $ 12,739,379 $ 12,739,379 Investments in fixed securities, at fair value - $48,123,179 - $ 48,123,179 Forward foreign currency contracts - $ 14,732,992 - $ 14,732,992 Liabilities Forward foreign currency contracts - $ 1,847,385 - $ 1,847,385
At December 31, 2009 Assets Level 1 Level 2 Level 3 Total Investments in other investment companies, at fair value - -
$28,480,378
$28,480,378
Investments in fixed securities, at fair value - $ 13,346,441 - $13,346,441 Forward foreign currency contracts - $10,812,283 - $10,812,283 Liabilities Forward foreign currency contracts - $6,904,507 - $6,904,507

- 63 -
MACQUARIE EQUINOX LIMITED Notes to the Financial Statements (continued) December 31, 2010 (Amounts expressed in Australian Dollars) 16. Risk Factors (continued)
Financial risk management (continued)
(f) Risk management
Financial assets at fair value through profit or loss
Year ended
December 31, 2010 Year ended
December 31, 2009 Opening balance $28,480,378 $75,855,217 Total gain and losses - in profit or loss ($2,690,959) ($1,285,603) Sales ($18,654,168) ($46,089,236) Purchases $5,604,128 - Closing balance $12,739,379 $28,480,378
The Fund attempts to mitigate risks in addition to those described above during the investment selection process and management of its assets on an ongoing basis and through diversification across strategy Classes. In 2009, four of the underlying funds in the Fund’s portfolio created sidepocket classes due to overwhelming redemption requests and illiquidity within their own portfolios.
These underlying funds, Harbinger Capital Offshore Fund Ltd, Canyon Value Realization Fund Ltd and Selectinvest Arbitrage/Relative Value Ltd represented US$617,556 (1.00%), US$139,186 (0.22%) and US$1,453,545 (2.35%) of the Fund’s net asset value as at December 31, 2010.
17. Valuation of Irongate
The Fund invests into Irongate Global Strategy Fund (IGSF). In 2008, IGSF redeemed its investment into Bernard L. Madoff Investment Securities LLC (“BLMIS”). The proceeds from this redemption were received by IGSF during the 90 day period prior to the BLMIS bankruptcy filing date of December 11, 2008. On 6 December 2010 following the settlement of a legal claim arising from the investment in BLMIS the full redemption proceeds were payable by IGSF back to BLMIS. As such the Fund has written down the value of its investment into IGSF at 31 December 2010 as detailed in the table below. IGSF continues to hold $42,880,000 in cash reserves to cover a further two court cases involving BLMIS. IGSF management believes this balance to be recoverable. The Fund has not made additional provision against its investment into IGSF at 31 December 2010.
December 31, 2010 Irongate Exposure Units Valuation per IGSF
Revised valuation Write down
Class A 1702.145 $ 172,081 $ 141,602 $ 30,479 Class A1 782.381 $ 79,096 $ 65,087 $ 14,009 Class B 21903.465 $ 2,214,363 $1,822,156 $ 392,207 Class B1 4356.567 $ 440,434 $ 362,424 $ 78,010 Class J 30776.205 $ 3,111,366 $2,560,707 $ 550,659
18. Events after the reporting date There were no significant events after balance sheet date 31 December 2010
19. Approval of financial statements
The Directors approved the financial statements of the Fund on 30 June 2011.

- 64 -
MACQUARIE EQUINOX LIMITED Fund Information December 31, 2010 Board of Directors Damon Hambly (Chairman) Mr. Hambly is a Division Director of Macquarie Funds Group and head of the Investment Solutions and Sales Group in Asia. Mr. Hambly also has more than 15 years experience in the asset management business and is currently responsible for sales and product development in Asia for retail, high net worth and institutional client segments. Prior to the formation of Macquarie Funds Group, Mr Hambly held senior positions in business and product development for the Macquarie Funds Management Group and for several Macquarie joint ventures in Taiwan, Korea and Malaysia. Mr Hambly graduated from Macquarie University in Sydney with a Bachelor of Economics. Edith G. Conyers Mrs. Conyers is Chief Executive Officer and an Executive Director of ISIS Fund Services Ltd., a hedge fund administration company and part of the ISIS Group based in Bermuda and Australia. Mrs. Conyers has approximately twenty years offshore funds industry experience, ten of which she acted as a Director and General Manager of Citigroup Fund Services (Bermuda) Ltd. (formerly Forum Fund Services Ltd.) which she helped establish in September 1997. Prior to joining Citigroup, Mrs. Conyers held the position of General Manager of International Corporate Management of Bermuda Limited, a wholly-owned subsidiary of Bermuda Commercial Bank Limited, specialising in offshore fund administration and management of exempted companies in Bermuda. Mrs. Conyers acts as director of a number of offshore funds and companies. Mrs. Conyers graduated with a BA from Trinity College in Hartford, Connecticut in 1977. Sharon A. Beesley Ms. Beesley is an Executive Director and founding Shareholder of ISIS Limited (ISIS) and a director of ISIS Fund Services which is part of the ISIS Group based in Bermuda and Australia. ISIS works as a consultant to clients who are structuring their businesses or financings using Bermuda as a base, as well as fund managers wishing to launch or restructure offshore investment funds. In addition, ISIS is licensed in Bermuda as an insurance intermediary, focusing on structuring and sourcing finance-related insurance products for the Bermuda insurance and reinsurance markets. ISIS also administers and manages The ISIS Foundation, a Bermuda charitable trust. Before joining ISIS, Ms. Beesley was head of banking at the Bermuda law firm of Mello Jones & Martin and was the principal external counsel for one of Bermuda's banks, Bermuda Commercial Bank (“BCB”). Sharon advised BCB in all its corporate areas, including treasury, custody, fund administration and trusts. Sharon also advised BCB in all its major transactional work. Sharon’s other practice areas were predominantly offshore investment funds and general international cross-border transactions. Sharon has a Master's Degree in law from Cambridge University and a BA (Hons) in law from the University of Westminster, and is qualified to practise law in the UK, Hong Kong and Bermuda. Sharon spent eight years with one of the leading English international law firms, Linklaters, working in their City of London Head Office and in Hong Kong, where she worked primarily in the fields of banking and capital markets' transactions and in that capacity she advised international banks and lead managers in large-scale international finance transactions. Prior to coming to Bermuda, she worked in South Africa, advising on corporate transactions. Sharon is a director of a number of private companies and is also a director of the public funds, Macquarie Airports Limited (which is part of MAp) and Martin Currie China A Foundation Limited. In addition she is the chairman of the Investment Funds Committee for the Bermuda International Business Association (BIBA; a director of the Association of Bermuda International Companies and a member of the International Business Forum in Bermuda.

- 65 -
MACQUARIE EQUINOX LIMITED Fund Information (continued) December 31, 2010 Board of Directors (continued) Brian Desmond Brian Desmond is one of the principal founders and Chief Operating Officer of ISIS Fund Services Ltd., (ISIS) a fund administration company established and licensed in Bermuda in 2007 to provide comprehensive fund administration services to investment managers with both offshore and onshore funds and other cross border structures. Brian joined ISIS in July 2007 and has over eleven years of offshore fund industry experience having previously worked as Senior Vice President and Head of Operations at Citigroup Fund Services (Citigroup). Brian joined Citigroup in July 2000 where he gained extensive experience in fund administration working and was responsible for overseeing the fund accounting, shareholder services, audit and Net Asset Value preparation for global clients. He was also responsible for managing all new client implementations from an operational perspective and for establishing standards, controls and procedures for all North American operations. Prior to joining Citigroup, he worked as an audit senior in the investment group of Ernst & Young. He is a Chartered Accountant and acts as director of a number of offshore fund companies.

- 66 -
MACQUARIE EQUINOX LIMITED Additional Information December 31, 2010
Risk Advisor and Advisor
MQ Capital Pty Limited
No.1 Martin Place Sydney
New South Wales 2000 Australia
Arranger, Sub-registrar and Sub-transfer Agent
Macquarie Securities (Australia) Ltd.
No. 1 Martin Place Sydney
New South Wales 2000 Australia
Administrator
Citigroup Fund Services (Bermuda) Ltd.
(formerly Forum Fund Services Ltd.) 3rd Floor, Washington Mall I
Reid Street Hamilton HM 11
Bermuda
Legal Advisors
Mallesons Stephen Jaques Governor Phillip Tower
1 Farrer Place Sydney
New South Wales 2000 Australia
Cox Hallett Wilkinson
Milner House 18 Parliament Street Hamilton HM FX
Bermuda
Consultant
ISIS Ltd. 35 Crow Lane East Broadway Paget HM 20
Bermuda

- 67 -
MACQUARIE EQUINOX LIMITED Additional Information (continued) December 31, 2010
Auditor
Ernst & Young
Ernst & Young Centre 680 George Street
Sydney New South Wales 2000
Australia
Custodian
HSBC INSTITUTIONAL TRUST SERVICES (ASIA) LTD. (HTHK) 39/F, Dorset House 979 King’s Road
Quarry Bay Hong Kong
Macquarie Bank Limited
No. 1 Martin Place Sydney
New South Wales 2000 Australia
Listing Sponsor
McCann Fitzgerald
Riverside One Sir John Rogerson
Dublin 2
Board of Directors
Edith Conyers Sharon Beesley* Damon Hambly*
Brian Desmond (appointed 17/01/10)
* Independent, non-executive Directors as defined under ISE Listing Requirement and Procedures 2.20.