Macneill, S. J. , & Drake, M. J. (2020). TRIUMPH: TReatIng ...
45
Macneill, S. J., & Drake, M. J. (2020). TRIUMPH: TReatIng Urinary symptoms in Men in Primary Healthcare using non-pharmacological and non-surgical intervention. University of Bristol. Publisher's PDF, also known as Version of record Link to publication record in Explore Bristol Research PDF-document University of Bristol - Explore Bristol Research General rights This document is made available in accordance with publisher policies. Please cite only the published version using the reference above. Full terms of use are available: http://www.bristol.ac.uk/red/research-policy/pure/user-guides/ebr-terms/
Transcript of Macneill, S. J. , & Drake, M. J. (2020). TRIUMPH: TReatIng ...
Macneill, S. J., & Drake, M. J. (2020). TRIUMPH: TReatIng Urinarysymptoms in Men in Primary Healthcare using non-pharmacologicaland non-surgical intervention. University of Bristol.
Publisher's PDF, also known as Version of record
Link to publication record in Explore Bristol ResearchPDF-document
University of Bristol - Explore Bristol ResearchGeneral rights
This document is made available in accordance with publisher policies. Please cite only thepublished version using the reference above. Full terms of use are available:http://www.bristol.ac.uk/red/research-policy/pure/user-guides/ebr-terms/

STATISTICAL ANALYSIS PLAN TRIUMPH
Version 1 1 31 July 2020
TReatIng Urinary symptoms in Men in Primary Healthcare using non-
pharmacological and non-surgical intervention
Statistical Analysis Plan
Version 1 (31/7/2020) Based on Protocol version 6.0 (dated 4/4/2019)
ISRCTN 11669964
The following people have reviewed the Statistical Analysis Plan and are in agreement with the contents
NAME TITLE SIGNATURE DATE
Author and senior statistician responsible
Stephanie MacNeill Lecturer in medical statistics [redacted] 31/7/2020
Study CI Dr Marcus Drake Chief investigator [redacted] 31/7/2020
Statistical reviewer
Siobhan Creanor Professor in Medical Statistics & Clinical Trials, University of Exeter
[redacted] 31/7/2020
Effective Date: 31/7/2020
STATISTICAL ANALYSIS PLAN TRIUMPH
Version 1 2 31 July 2020
Table of contents
List of abbreviations .................................................................................................................................................. 4
1. INTRODUCTION AND PURPOSE ......................................................................................................................... 5
2. SYNOPSIS OF STUDY DESIGN AND PROCEDURES ............................................................................................... 5
2.1 Trial objectives and aims ................................................................................................................................... 6
2.1.1 Primary objective............................................................................................................................................. 6
2.1.2 Secondary objectives ....................................................................................................................................... 6
2.2 Trial design and configuration ........................................................................................................................... 6
2.3 Trial centres ....................................................................................................................................................... 6
2.4 Eligibility criteria ................................................................................................................................................ 6
2.4.1 GP practice selection criteria ........................................................................................................................... 6
2.4.2 Participant inclusion criteria ............................................................................................................................ 6
2.4.3 Participant exclusion criteria ........................................................................................................................... 7
2.5 Description of intervention ............................................................................................................................... 7
2.6 Description of the comparator arm ................................................................................................................... 7
2.7 Recruitment, screening and consent .................................................................................................................. 7
2.8 Randomisation procedures ................................................................................................................................ 8
2.9 Sample size justification .................................................................................................................................... 9
2.10 Blinding ............................................................................................................................................................. 9
2.11 Interim analyses ................................................................................................................................................ 9
2.12 Trial oversight .................................................................................................................................................. 10
2.12.1 Trial management group ............................................................................................................................... 10
2.12.2 Trial steering committee ............................................................................................................................... 10
2.12.3 Data monitoring committee .......................................................................................................................... 10
2.13 Outcome measures ......................................................................................................................................... 10
2.13.1 Primary outcome ........................................................................................................................................... 10
2.13.2 Secondary outcomes ..................................................................................................................................... 10
3. GENERAL ANALYSIS CONSIDERATIONS ............................................................................................................ 11
3.1 Analysis populations........................................................................................................................................ 11
3.2 Derived variables ............................................................................................................................................. 11
3.3 Procedures for missing data ............................................................................................................................ 12
3.4 Study centre effects ......................................................................................................................................... 12
3.5 Potential outliers ............................................................................................................................................. 12
3.6 Visit windows .................................................................................................................................................. 13
4. DESCRIPTION OF PARTICIPANT CHARACTERISTICS........................................................................................... 13
4.1 Disposition ...................................................................................................................................................... 13
4.2 Baseline characteristics ................................................................................................................................... 13
STATISTICAL ANALYSIS PLAN TRIUMPH
Version 1 3 31 July 2020
5. ASSESSMENT OF STUDY QUALITY .................................................................................................................... 13
5.1 Eligibility checks .............................................................................................................................................. 13
5.2 Selection bias .................................................................................................................................................. 13
5.3 Data validation ................................................................................................................................................ 14
5.4 Study completion ............................................................................................................................................ 14
5.5 Protocol deviations.......................................................................................................................................... 14
6. ANALYSIS OF EFFECTIVENESS ........................................................................................................................... 14
6.1 Mis-randomised practices ............................................................................................................................... 14
6.2 Summary of primary and secondary endpoints ............................................................................................... 15
6.3 Primary analysis .............................................................................................................................................. 15
6.4 Sensitivity analyses ......................................................................................................................................... 16
6.4.1 Imbalance between treatment groups .......................................................................................................... 16
6.4.2 Clustering by nurse/HCA ............................................................................................................................... 16
6.4.3 Per protocol analysis ..................................................................................................................................... 16
6.4.4 Complier average causal effect (CACE) analysis ............................................................................................ 17
6.4.5 Exclusion of patients later found to be ineligible .......................................................................................... 17
6.4.6 Impact of COVID-19 on IPSS scores ............................................................................................................... 17
6.4.7 Missing outcome data ................................................................................................................................... 17
6.4.8 Impact of outliers .......................................................................................................................................... 18
6.5 Secondary outcomes analyses ......................................................................................................................... 18
6.6 Subgroup analyses ........................................................................................................................................... 18
6.6.1 Nature of LUTS at baseline ............................................................................................................................ 18
6.6.2 Intervention delivery ..................................................................................................................................... 18
6.6.3 Method of contact ......................................................................................................................................... 19
6.6.4 Dose-effects ................................................................................................................................................... 19
6.7 Exploratory analyses ....................................................................................................................................... 19
6.7.1 Descriptive analyses ...................................................................................................................................... 19
6.7.2 IPSS severity banding ..................................................................................................................................... 19
6.7.3 Characterising patients whose symptoms are not captured on the IPSS ...................................................... 19
7. ANALYSIS OF SAFETY ....................................................................................................................................... 20
8. CHANGES TO THE SAP ...................................................................................................................................... 20
9. FINAL REPORT TABLES AND FIGURES (SUBJECT TO CHANGE) ........................................................................... 21
9.1 Populations: Tables, figures and listings detailing the study population .......................................................... 23
9.2 Baseline data: Summary tables of baseline information .................................................................................. 30
9.3 Outcomes: Summary data and treatment estimates ....................................................................................... 35
9.4 Safety data: Summary tables and listings of all adverse events and serious adverse events ............................ 43
10. REFERENCES .................................................................................................................................................... 44

STATISTICAL ANALYSIS PLAN TRIUMPH
Version 1 4 31 July 2020
List of abbreviations
Acronym Details
AE Adverse event AHP Allied health professional B-IPQ Brief Illness Perception Questionnaire BRTC Bristol Randomised Trials Collaboration BTC Bristol Trials Centre CACE Causal Average Complier Effect CCG Clinical Commissioning Group CI Confidence interval CRF Case report form CRN Clinical research network DMC Data monitoring committee EOI Expression of interest EQ-5D-5L EuroQol 5-dimension 5-level GP General practitioner HEAP Health economics analysis plan HCA Health care assistant HCP Health care professional ICIQ-UI-SF International Consultation on Incontinence Questionnaire – Urinary Incontinence Short Form IMD Index of multiple deprivation IPSS International Prostate Symptom Score IPSS QoL International Prostate Symptom Score Quality of life IQR Inter-quartile range ITT Intention to treat LUTS Lower urinary tract symptoms MSOA Middle layer super output area NHS National Health Service NICE National Institute of Clinical Excellence QALY Quality adjusted life years RCT Randomised controlled trial SAE Serious adverse event (subset of AE) SAP Statistical analysis plan SD Standard deviation TMG Trial management group TRIUMPH TReatIng Urinary symptoms in Men in Primary Healthcare using non-pharmacological and non-
surgical intervention
TSC Trial steering committee UK United Kingdom UoB University of Bristol
UPSTREAM Urodynamics for Prostate Surgery Trial; Randomised Evaluation of Assessment Methods
STATISTICAL ANALYSIS PLAN TRIUMPH
Version 1 5 31 July 2020
1. INTRODUCTION AND PURPOSE
This document details the rules proposed and the presentation that will be followed, as closely as possible, when analysing and reporting the main results from TRIUMPH.
The purpose of the plan is to:
1. Ensure that the analysis is appropriate for the aims of the trial, reflects good statistical practice, and that interpretation of a priori and post hoc analyses is appropriate.
2. Explain in detail how the data will be handled and analysed to enable others to perform the actual analysis in the event of sickness or other absence.
Additional exploratory or auxiliary analyses of data not specified in the protocol are permitted but fall outside the scope of this analysis plan (although such analyses would be expected to follow Good Statistical Practice).
The analysis strategy will be made available if required by journal editors or referees when the main papers are submitted for publication. Additional analyses suggested by reviewers or editors will, if considered appropriate, be performed in accordance with this analysis plan, but if reported the source of the request of the post-hoc analysis will be declared.
Amendments to the statistical analysis plan will be described and justified in the final report of the trial.
2. SYNOPSIS OF STUDY DESIGN AND PROCEDURES
Lower Urinary Tract Symptoms (LUTS) refer to issues of difficulty with either storing or passing urine. Problems with storing urine (“storage LUTS”) include increased urinary frequency, urgency and having to pass urine overnight (nocturia). Urinary urgency can be sufficiently severe to cause urinary incontinence. Problems with passing urine may occur while actually urinating (“voiding LUTS”), such as slow stream, or immediately afterwards (“post voiding LUTS”), such as dribbling. LUTS are common and bothersome, and affect the lives of the sufferers, and also their partners and family. Half of all men over 40 regularly experience at least one LUTS.
Four LUTS are particularly bothersome: 1) urgency- sudden need to pass urine for fear of leakage; 2) increased urinary frequency; 3) nocturia- getting up at night to pass urine; 4) post urination dribbling- leakage just after finished passing urine. The impact of these may be exacerbated by concern the individual has that they might have a serious illness.
In primary care, general practitioners (GPs) principally assess men presenting with LUTS to exclude serious conditions, and often treat LUTS in general with a drug aimed at the prostate. However, the wide range of potential contributory factors may not be considered. For example, urgency and increased urinary frequency may mainly be caused by the bladder rather than the prostate. They may also be caused by the patients’ own habits, such as the amount and timing of their caffeine intake. Furthermore, post urination dribbling does not respond to drug treatment, and instead needs advice on the need for gentle pressure applied in the right place to help expel the few drops of trapped urine. Detecting these factors and giving the patient relevant advice is time-consuming and often not offered in primary care. Consequently, men may not receive effective treatment, or may be referred to hospital services, leading to extra healthcare costs and potentially major interventions.

STATISTICAL ANALYSIS PLAN TRIUMPH
Version 1 6 31 July 2020
2.1 Trial objectives and aims
2.1.1 Primary objective
To determine whether manualised and standardised care (intervention) achieves superior symptomatic outcome versus usual care for LUTS, measured by the overall International Prostate Symptom Score (IPSS), at 12 months after consent.
2.1.2 Secondary objectives
To determine:
• Whether manualised and standardised care intervention achieves superior disease-specific quality of life outcome for LUTS measured by the IPSS Quality of Life score at 6 and 12 months after consent
• Whether manualised and standardised care intervention achieves superior symptomatic outcome for LUTS. This will be measured separately by the overall IPSS score at 6 months after consent and International Consultation on Incontinence Questionnaire – Urinary Incontinence Short Form (ICIQ- UI-SF) at 6 and 12 months after consent
• The relative harms of the two pathways
• The differential effects on other outcomes, such as overall quality of life and general health
• The acceptability of assessment and provision of care
• Change in patient perception of their LUTS condition in the two management pathways
• The cost effectiveness of LUTS management pathways, measured using quality-adjusted life-years (QALYs) and the primary outcome at 12 months after consent (to be studied in a health economics analysis described in a separate Health Economics Analysis Plan (HEAP))
• The differential use of National Health Service (NHS) resources (to be studied in a health economics analysis described in a separate HEAP)
2.2 Trial design and configuration
TRIUMPH is a two-arm cluster superiority trial randomising GP practices (1:1) to treat men with a diagnosis of LUTS between a care pathway based on manualised and standardised care using active management (non- pharmacological “Intervention arm”) and one based on current management (usual care “Comparator arm”). The trial design also included an internal pilot recruitment phase of four months’ duration, primarily to verify that recruitment was possible before progression to the main phase of the trial. Progression to the full trial was based on patient and practice recruitment by month four of patient recruitment (see section 9.2.1 of the study protocol).
2.3 Trial centres
TRIUMPH has two centres: (i) Bristol and (ii) Southampton.
2.4 Eligibility criteria
2.4.1 GP practice selection criteria
GP practices are eligible for the study if a standardised pre-randomisation database search identifies an adequate number of eligible patients. Practices must be able to provide adequate treatment room space and availability for a trial or practice nurse/healthcare assistant (HCA) to complete intervention training and the intervention visit.
2.4.2 Participant inclusion criteria
Adult men (≥ 18 years) with bothersome LUTS.
STATISTICAL ANALYSIS PLAN TRIUMPH
Version 1 7 31 July 2020
2.4.3 Participant exclusion criteria
Men are excluded if they:
• Lack capacity to consent;
• Are unable to pass urine without a catheter (indwelling or intermittent catheterisation);
• Have a relevant neurological disease or referral;
• Are undergoing urological testing for LUTS;
• Are currently being treated for prostate or bladder cancer;
• Have previously had prostate surgery;
• Have poorly controlled diabetes mellitus as determined by the patient’s GP through screening;
• Have visible haematuria;
• Are unable to complete assessments in English
2.5 Description of intervention
The intervention arm offers manualised and standardised active management according to the symptomatic presentation of the individual patient. The central aspects of the intervention are:
1. The personal delivery by a nurse/HCA (from either the practice or research team) to educate, emphasise positive aspects, and direct the patient to the relevant steps to take personally.
2. The illustrated booklet of written information “Helping you to take control of your waterworks”. The sections included are:
• Advice on drinks and liquid intake;
• Advice on controlling an urgent need to pee (urinate);
• Exercising the muscles between the legs (pelvic floor) to help stop bladder leakage;
• Advice on emptying the bladder as completely as possible;
• Advice on getting rid of the last drops;
• Reducing sleep disturbance caused by needing to pee.
3. To encourage and gauge adherence to the intervention, we will use regular contacts (initial face-to-face appointment, phone call after one week and further contacts 4 and 12 weeks later by phone or email according to patient preference). Subsequent routine health care professional (HCP) contact is not planned.
The sections of the booklet are tabbed to allow manualised tailoring by the HCP with discrete stickers. The booklet is water-resistant and able to lie flat when open.
The research/practice nurse/HCA will be provided with a decision tool to assist them in tailoring the treatment for each patient at the baseline visit.
2.6 Description of the comparator arm
Usual care (the comparator arm for TRIUMPH) in this study requests sites to continue to follow their standard local practice for trial patients allocated to the comparator arm. The qualitative aspect of this trial is exploring what usual care looks like for a sample of comparator and intervention practices.
2.7 Recruitment, screening and consent
If practices have sufficient numbers of eligible patients, practices are then eligible for randomisation to either the Usual care or Intervention arm. All eligible men with LUTS are identified from the GP site’s clinical database using the database search protocol. The list of potential patients is screened for eligibility by the GPs . Once screening is complete, the list of eligible patients are uploaded to Docmail for mailout and the trial team confirms that this has been done correctly and it is at this point that practices are informed of their randomisation (see below for details).
STATISTICAL ANALYSIS PLAN TRIUMPH
Version 1 8 31 July 2020
Patients are invited to return an expression of interest (EOI) form to indicate whether they are interested in taking part in the trial. On receipt of the EOI, the research nurse/HCA/allied health professional (AHP) from the Clinical Research Network (CRN) phones the patient to discuss the study further. The CRN is blinded to which arm the practices have been randomised to.
The CRN informs the central research team which patients have been confirmed as eligible and have verbally agreed to participate so they can be sent the relevant patient pack depending on which arm the patient’s GP practice is randomised to. All patients receive the same consent forms and questionnaires, but those in the intervention arm also receive a bladder diary to be completed before their face-to-face visit.
For patients attending practices in the usual care arm, the central research team will send the consent form and symptom score questionnaires by post for the patient to complete.
For patients attending practices in the intervention arm, the central research team sends the consent form, bladder diary and symptom score questionnaires by post. Once the consent forms, bladder diary and questionnaires have been returned, the trial research or practice nurse/HCA arrange an appointment for a face-to-face consultation to review the bladder diary and symptoms scores and administer the standardised manualised intervention(s) as applicable, to the individual patient.
For patients in both arms, the return of the completed consent form demonstrates explicit consent to participate in the study.
All men who enter the study are logged with the central trial office at the University of Bristol (UoB) and given a unique Study Number. The patient’s GP is informed by the central study team by letter about the patient’s participation in the trial. The GP electronic patient record is updated to record participation.
Alongside providing explicit consent to take part in the study, the men will also be asked on the consent form if they are willing to consent to (i) being contacted by a qualitative researcher to undertake an interview and (ii) being contacted about other research. Declining to consent to these does not disqualify a man from participating in the main trial.
2.8 Randomisation procedures
GP practices are the unit of allocation to the two study arms. Practices are randomised on a 1:1 basis to receive either the intervention or continue care as usual (control group) by a Bristol Randomised Trials Collaboration (BRTC; part of the Bristol Trials Centre) statistician who is blinded to the identity of practices. This is done after the practice list searches have been conducted, lists are screened by GPs and mailout uploaded (see section 2.7). As there are a relatively small number of GP practices in the trial, minimisation is used to allocate practices to treatment arms to ensure balance. Allocation is minimised by centre (Bristol and Southampton), practice size (numeric variable) and area-level deprivation (Index of multiple deprivation (IMD); numeric variable) of the practice. A random element was incorporated in the minimisation procedure such that there was a 40% probability that allocation was random. Where allocation was random, there was a 50-50 chance of practices being allocated to either arm.
While it is common to use lower super output area level (LSOA) deprivation scores to estimate deprivation for individuals (using home postcodes to identify the LSOA), it has been shown that middle layer super output area level (MSOA) data better reflect the area-level deprivation of GP practices (1). As such, GP practice postcodes are mapped onto LSOAs then MSOAs. Population averaged IMD scores (2015) are then calculated based on the scores of LSOAs within each MSOA.

STATISTICAL ANALYSIS PLAN TRIUMPH
Version 1 9 31 July 2020
2.9 Sample size justification
This study is powered to detect a mean between-group difference of 2 points on our primary outcome of IPSS scores at 12 months post-consent. This target difference was chosen because while the recognised minimum important difference in IPSS scores is 3.0 (2), men may be bothered by just one symptom (e.g. nocturia). A change of 2 points might mean a small improvement in two symptoms or a bigger improvement in one symptom.
To inform the sample size calculation, a scoping search was conducted with local GP practices within NHS Bristol Clinical Commissioning Group (CCG) to gain a sense of the likely number of patients available on their lists based on our inclusion and exclusion criteria. This search suggested that an average sized GP practice might identify 100 patients. We originally assumed that 50% of these patients would be eligible and of these, 70% consent, so each practice would consent ~35 eligible patients. Our estimates of eligibility rates, consent and loss-to-follow up were conservative and based on our experience running pragmatic trials in primary care settings.
Based on this, we estimated that 840 patients were needed from at least 24 practices to detect a difference in IPSS scores of 2 (common standard deviation of 5: in line with the assumptions made in the Urodynamics for Prostate Surgery Trial; Randomised Evaluation of Assessment Methods (UPSTREAM study) (3)) with 90% power and significance level 5%. Our estimate incorporated a design effect to account for clustering of effects in practices, which assumed that practices would be able to recruit 35 patients each (i.e. mean cluster size of 35) and that the intra-class correlation between practices would be 0.05 – an estimate in line with results from other primary care studies (4). We allowed for up to 30% of men being lost to follow-up.
During the early stages of recruitment, however, it became apparent that practices were not consistently consenting 35 patients and that the variability in recruitment would necessitate more practices being recruited to achieve our objective of 90% power to detect a mean difference in IPSS scores of 2. Using information from the numbers and proportions of patients consenting from practices recruited early in the trial, and projections regarding practices soon to start recruiting patients, we revised our assumptions and assumed that the mean number of patients consented at each practice would be 26 and that the coefficient of variation for the mean cluster size between practices would be 0.26. Based on these revised assumptions, this increased the number of practices required for the study by 6 and the trial management group agreed to recruit additional practices. This amendment was agreed with both the trial steering committee and the funder.
2.10 Blinding
Two statisticians support this trial. The senior statistician is blinded throughout the trial. A junior statistician will perform all disaggregated analyses according to this statistical analysis plan (SAP) and attends closed meetings of the independent data monitoring committee (DMC) as required. The CRN support team is blinded to minimise selection and recruitment bias. The remaining members of the study team are blinded to aggregate data only. GP practice staff, research nurses involved in delivering the intervention and patients are not blinded.
2.11 Interim analyses
No interim analyses were planned.

STATISTICAL ANALYSIS PLAN TRIUMPH
Version 1 10 31 July 2020
2.12 Trial oversight
2.12.1 Trial management group
The trial will be managed by a Trial Management Group (TMG), which meets face-to-face/by teleconference approximately every 2 months. The TMG is chaired by the Chief Investigator and includes all members of the named research team.
2.12.2 Trial steering committee
The role of the Trial Steering Committee (TSC) is to provide the overall supervision of the trial, monitor trial progress and conduct and advise on scientific credibility. The membership consists of an independent chair (Prof. Peter Bower), together with three other independent members including an independent statistician (Prof. Siobhan Creanor) and one patient representative. The trial manager and the Chief Investigator (Prof. Marcus Drake) also attend. Observers may also attend, as may other members of the TMG or members of other professional bodies, at the invitation of the Chair. The TSC will consider and act, as appropriate, upon the recommendations of the Data Monitoring Committee (DMC) or equivalent and ultimately carries the responsibility for deciding whether a trial needs to be stopped on grounds of safety or efficacy. It is anticipated that the TSC will meet twice a year.
2.12.3 Data monitoring committee
The Data Monitoring Committee (DMC) has an independent chair (Mr Chris Harding), and monitors accumulating trial data during the trial and makes recommendations to the TSC as to whether there are any ethical or safety issues that may necessitate a modification to the protocol or closure of the trial. It is anticipated that the DMC will meet twice a year.
In accordance with the Trial Terms of Reference for the DMC, this group is responsible for assessing safety and efficacy of the trial.
2.13 0Outcome measures
2.13.1 Primary outcome
The primary endpoint will be the patient-reported IPSS score at 12 months after consent.
2.13.2 Secondary outcomes
• Symptoms: IPSS score at 6 months and ICIQ-UI-SF at 6 and 12 months;
• Cost-effectiveness from an NHS perspective;
• Overall quality of life: EuroQol 5-dimension 5-level (EQ-5D-5L);
• LUT specific quality of life: IPSS Quality of life (IPSS QoL) at 6 and 12 months;
• Number of related adverse events (identified using medical notes at the end of the study; SAEs are reported separately by practices and patients);
• Number of GP consultations (identified using medical notes at the end of the study);
• Number of referrals to secondary care (identified using medical notes at the end of the study);
• Patient perception of their LUTS - Brief Illness Perception Questionnaire (B-IPQ);
• Patient experiences of the intervention
Cost-effectiveness, EQ-5D-5L and the number of GP consultations are analysed as part of the health economics analysis. The patient experiences of the intervention are analysed as part of the qualitative analysis.

STATISTICAL ANALYSIS PLAN TRIUMPH
Version 1 11 31 July 2020
3. GENERAL ANALYSIS CONSIDERATIONS
3.1 Analysis populations
The Full Analysis set includes all participants at randomised practices. The primary intention-to-treat (ITT) analysis will be conducted using this dataset.
Per protocol analyses will be conducted on all participants in the Full Analysis set who did not experience protocol violations.
Safety analyses will be conducted on all participants at randomised practices according to whether or not the participant received the intervention. For the purposes of these analyses, receiving the intervention booklet constitutes receiving the intervention.
3.2 Derived variables
The algorithms for the calculation of derived variables in this study are described below:
IPSS The IPSS score is derived from the responses to seven items regarding urinary
symptoms (incomplete emptying, frequency, intermittency, urgency, weak stream, straining and nocturia). For each item, patients choose one of six responses indicating increasing severity to describe their symptoms. Responses are coded from 0-5. The total score is calculated as the sum of each of the responses. The total score ranges from 0 (asymptomatic) to 35 (symptomatic).
IPSS QoL The eighth item from the IPSS questionnaire relates to the patient’s perception of their quality of life (“If you were to spend the rest of your life with your urinary condition just the way it is now, how would you feel about that?”). Patients are given seven potential responses to choose from, coded 0 (delighted) to 6 (terrible).
ICIQ-UI-SF The ICIQ-UI-SF assesses the impact of symptoms of incontinence on quality of life and the outcome of treatment. A score is derived from the sum of the scores of the first three items:
• “How often do you leak urine?” There are six potential responses, each scored on a scale of 0 (never) to 5 (all of the time).
• “How much do you usually leak?” There are four potential responses coded 0 (none), 2 (small amount), 4 (a moderate amount) and 6 (a large amount).
• “Overall, how much does leaking urine interfere with your everyday life?” There are 11 possible responses, each ranging from 0 (not at all) to 10 (a great deal).
The IPSS scores will be used to identify the nature of the symptoms patients have. Because the IPSS does not cover post-micturition dribble or incontinence, the ICIQ-UI-SF will be used to decide if a patient experiences those symptoms. The ICIQ-UI-SF incorporates a question asking patients when they experience urine leaks. The options are:
1. Never 2. Leaks before getting to the toilet
3. Leaks when coughing or sneezing 4. Leaks when asleep 5. Leaks when being physically active/exercising

STATISTICAL ANALYSIS PLAN TRIUMPH
Version 1 12 31 July 2020
6. Leaks for no obvious reason
7. Leaks when having finished urinating and are dressed Responses 2 to 6 (which are not mutually exclusive) will categorise someone as having incontinence. Option 7 will be used to categorise post-micturition dribble.
EQ-5D-5L The EQ-5D-5L questionnaire comprises five items each having 5-level responses coded 1-5. NICE currently advises that the 5-level valuation set for England is not recommended for use to derive utilities, instead advising that the validated mapping function to the 3-level valuation set be used (5).
B-IPQ The B-IPQ is comprised of nine items of which the first eight ask patients to score each item on a scale of 0-10 regarding their perceptions of how their illness affects different aspects of their life. With permissions, we modified it slightly to reflect that we wished to enquire about “urinary symptoms” rather than “illness”. The questions asked are as follows:
1. How much do your urinary symptoms affect your life? 2. How long do you think your urinary symptoms will continue? 3. How much control do you feel you have over your urinary
symptoms? 4. How much do you think your treatment can help your urinary
symptoms? 5. How much do you experience urinary symptoms?
6. How concerned are you about your urinary symptoms? 7. How well do you feel you understand your urinary symptoms? 8. How much do your urinary symptoms affect you emotionally?
To compute an overall score, items 3, 4, and 7 are reverse scored and added to the scores for items 1, 2, 5, 6, and 8. A higher score reflects a more threatening view of the urinary symptoms.
Patients were also asked to list in rank-order the three most important factors that they believe caused their urinary symptoms. This information will be described using descriptive statistics only.
3.3 Procedures for missing data
In all tables, missing data will be indicated using footnotes. For the primary outcome of IPSS at 12 months, we will use descriptive statistics to describe the baseline characteristics of patients who do and do not have missing primary outcome data. Missing primary outcome data will also be imputed as part of a sensitivity analysis described in section 6.4.5. Missing secondary outcome data will not be imputed.
3.4 Study centre effects
Randomisation of practices minimises on centre and all analyses will adjust for centre (Bristol or Southampton) and all other minimisation variables using fixed effects.
3.5 Potential outliers
Prior to commencing the formal analysis, the trial statistician will use graphs and descriptive statistics to identify potential outliers in the data. These will be queried with the trial manager who will verify hard copy questionnaires to confirm whether or not they are data entry mistakes. Where outlier values prove not to be
STATISTICAL ANALYSIS PLAN TRIUMPH
Version 1 13 31 July 2020
data entry mistakes the impact of these observations will be explored in sensitivity analyses (see section 6.4.8).
3.6 Visit windows
All questionnaires will be analysed regardless of when they are returned. We will, however, describe the mean time between baseline and receipt of questionnaires.
4. DESCRIPTION OF PARTICIPANT CHARACTERISTICS
4.1 Disposition
The flow of patients and practices (clusters) through the trial will be summarised in a CONSORT diagram that will include the eligibility, reasons for exclusion, numbers of patients consenting, numbers of practices randomised to the two treatment groups, losses to follow up and the numbers analysed for the primary outcome.
TRIUMPH also contains an internal pilot stage which will be described in accordance to the guidelines set out in the CONSORT extension for pilot and feasibility studies.
4.2 Baseline characteristics
Baseline characteristics of patients and practice characteristics will be compared between the two arms by reporting relevant summary statistics in order to describe the study sample and determine whether any potentially influential imbalance occurred by chance. Baseline characteristics will be summarised using means (SD), medians (inter-quartile range; IQR), ranges (minimum and maximum) or number (%) depending on the nature of the data and its respective distribution. If the baseline characteristics of the groups differ by more than 10%, or half a standard deviation, then the effect of this variable on the outcome (primary and secondary) will be investigated in sensitivity analyses.
5. ASSESSMENT OF STUDY QUALITY
5.1 Eligibility checks
The numbers of patients and reasons for exclusions will be described.
5.2 Selection bias
To assess how randomised patients differed from the wider group of men with LUTs at participating practices, we will report the mean (SD) age and age range of participants at the time of GP screening, of the following groups:
• Men who were identified as having LUTS through the GP records search and manual screening by GPs and were invited to participate. Within this group we will describe separately those who returned the EOI and indicated they were potentially interested, those who at this stage said they were not interested, and those who did not return the EOI;
• Men who were invited for further screening by the CRNs. Within this group we will describe separately those who were deemed eligible and willing to participate in the study at this stage, those who were eligible and not willing, those who were deemed ineligible and those who were not contactable by the CRN;

STATISTICAL ANALYSIS PLAN TRIUMPH
Version 1 14 31 July 2020
• Eligible men who consented to participate in the study and eligible men who did not consent to participate.
5.3 Data validation
Once the data are downloaded by the trial statistician, internal consistency checks will be performed by them in preparing the data for analysis in Stata. These checks aim to identify spurious values or inconsistencies in responses. When inconsistencies are identified, these will be reported to the trial manager who will verify against the completed forms.
5.4 Study completion
Final patient questionnaires are sent at 12-month post-consent and data on primary care consultations and referrals are collected until 12-months post-consent. For the latter, these data are collected by the practices using a standardised medical records search conducted at least one month after their last patient reaches their 12-month follow-up.
5.5 Protocol deviations
There are no prospective, planned deviations or waivers to the protocol. Accidental protocol deviations will be recorded and the frequency of each type of deviation will be tabulated by treatment allocation with full details given in separate listings.
At the patient level, we note that patients in the intervention arm might not have:
• Received the intervention booklet;
• Received follow-up contact at the scheduled time points (1, 4 and 12 weeks);
• Received follow-up contact in the protocolised format;
• Received any follow-up contact
All of these will be reported.
6. ANALYSIS OF EFFECTIVENESS
Data will be analysed and reported in accordance with CONSORT principles and its extensions for cluster randomised trials and patient reported outcome measures. The internal pilot will be reported in accordance with CONSORT principles and its extension for pilot and feasibility studies.
Stata version 15 (or higher) will be used for all TRIUMPH analyses. Two-tailed tests will be used with effect estimates, 95% confidence intervals (CI) and p-values presented. A significance level of 5% will be used and no adjustment will be used for multiple testing. Analyses using regression models will adjust for minimisation variables as well as baseline values of the outcome studied. The primary approach for analysis will be on an intention-to-treat (ITT) basis defined as analysing participants according to the arm to which their practice was randomised.
6.1 Mis-randomised practices
Patients will be analysed according to the arm to which their practice was randomised.
STATISTICAL ANALYSIS PLAN TRIUMPH
Version 1 15 31 July 2020
6.2 Summary of primary and secondary endpoints
The primary and secondary endpoints are summarised below:
Outcome Measure Timepoints Interpretation Range
Primary
Patient-reported urinary symptoms
IPSS Baseline and 12 months
The total score is a discrete number with higher scores reflecting more severe symptoms.
0-35
Secondary
Patient reported urinary symptoms
IPSS Baseline and 6 months
As above As above
Patient reported incontinence
symptoms
ICIQ-UI-SF Baseline, 6 and 12 months
The score is a discrete number with higher scores reflecting worse quality of life.
0-21
LUTS specific quality of life
IPSS QoL Baseline, 6 months and 12 months
The total score is a discrete number with higher scores reflecting more severe symptoms.
0-6
Overall quality of life EQ-5D-5L Baseline only
(analysis at 6
and 12 months is
included in the
health economic analysis)
Continuous measure with larger values reflecting better quality of life.
-0.594 - 1
Patient perception of their LUTS
B-IPQ Baseline, 6 and 12 months
A higher score reflects a more threatening view of their symptoms
0-90
Number of GP consultations (number
in the previous 12 months)
- Baseline, analysis at 12 months is included in the health economic analysis)
Discrete variable Minimum of 0
Number of referrals to secondary care in the
previous 12 months
- Baseline and 12 months
Binary variable coded 0 and 1 at the individual level based on whether the patient did not (0) or did (1) have a referral to secondary care urology services.
0-1
6.3 Primary analysis
The primary outcome is IPSS score collected at 12 months post-consent. It will be described in each treatment group using means and standard deviations. Comparisons between treatment arms will be made using a mixed-effect multilevel linear model (individual patients (level 1) nested within GP practices (level 2)) and adjusting for patient-level baseline IPSS scores and practice-level variables used in the randomisation. The results will be presented as the mean between-group difference, corresponding 95% confidence interval and
STATISTICAL ANALYSIS PLAN TRIUMPH
Version 1 16 31 July 2020
P-value. The results adjusted only for baseline scores will also be presented. The intra-class correlation (ICC) will be reported, with a 95% confidence interval.
We will check the normality assumptions of the residuals from the fixed part of the multi-level model and the random effects at the cluster level using graphs. The choice of covariance structure will be decided upon based on a review of the data. Alternative methods of analysis will be considered if the assumptions of the model are not be met. This might include, for example, using a bootstrap framework to estimate confidence intervals.
6.4 Sensitivity analyses
A number of analyses are proposed to assess the sensitivity of the primary analysis to various assumptions. These are described below. Sensitivity analyses will be presented alongside those of the primary analysis in order for them to be compared and contrasted. As these will be exploratory in nature, 95% confidence intervals and p-values will be presented, but will be interpreted with due caution.
6.4.1 Imbalance between treatment groups
Should there be evidence of imbalance between treatment groups on important baseline characteristics as described in section 4.2, sensitivity analyses will be conducted where the primary analysis is repeated, adjusting for variables showing an imbalance. This sensitivity analysis will be performed for the primary outcome as well as all secondary outcomes.
6.4.2 Clustering by nurse/HCA
Exploring whether there is evidence of clustering by the individual nurse/HCA delivering care (in the Intervention arm) is complicated by the fact that where research nurses were invited to deliver the intervention, individual research nurses may work across multiple practices. As such, nurses/HCAs are not clustered within (single) practices. Furthermore, within a given practice, the intervention may be delivered by more than one nurse/HCA.
In an attempt to explore this, we will group the patient-level data into clusters based on the combination of practice where the patient is registered and nurse/HCA delivering the intervention (first visit). We will then repeat the primary analysis of the IPSS at 12 months using a single random effect for this level of clustering and compare the results with those of the primary analysis.
In the event that this modelling proves infeasible, we will consider a cross-classified multi-level model approach which incorporates the fact that nurses/HCAs do not nest neatly within practices. We will also calculate the mean IPSS at 12 months for each of these nurse/HCA-practice clusters and explore descriptively how the means compared between individual nurses/HCAs.
6.4.3 Per protocol analysis
Based on the protocol deviations outlined in section 5.5, we will conduct five separate per protocol analyses of the primary outcome:
• Excluding those in the intervention arm who received no intervention booklet by the time of the primary outcome measure at 12 months and had none of the follow-up contacts at 1, 4 and 12 weeks;
• Excluding those in the intervention arm who received the intervention booklet by the time of the primary outcome measure at 12 months, but only had 2 of the 3 follow-up contact visits (regardless of whether or not these were early or late);
• Excluding those in the intervention arm who received the intervention booklet by the time of the primary outcome measure at 12 months and had only 1 follow-up contact (regardless of whether or not this was early or late);
STATISTICAL ANALYSIS PLAN TRIUMPH
Version 1 17 31 July 2020
• Excluding those in the intervention arm who received their intervention booklet by the time of the primary outcome measure at 12 months but had no follow-up contact;
• Excluding those in the intervention arm who did not receive their follow-up contact in the protocolised format (i.e. by phone, post or email)
6.4.4 Complier average causal effect (CACE) analysis
Recognising the inherent bias in estimates derived from per protocol analyses, we will also conduct a CACE analysis for the primary outcome. Compliers can only be observed amongst those randomised to the intervention arm. In the first instance, compliers will be defined as those who will have received the intervention booklet by the time of the primary outcome follow-up. Non-compliers will be defined as those who have not received the booklet at all or received it after the primary outcome time point. These categories will be compared in terms of key baseline characteristics. The CACE estimates will be obtained using instrumental variable regression including the same variables used in the primary analysis with randomised group as the instrumental variable and the indicator variable for compliance.
6.4.5 Exclusion of patients later found to be ineligible
Patients in the study who, after consenting and providing data, are found to be ineligible will be included in the primary ITT analysis. A sensitivity analysis of the primary outcome excluding these individuals will also be conducted.
6.4.6 Impact of COVID-19 on IPSS scores
By the time the COVID-19 outbreak was declared a pandemic by the World Health Organisation on 11 March 2020, the study had already reached its target recruitment and was no longer recruiting. All patients will have reached at least 7 months of follow-up by then and many will have completed final follow-up. The only change required to trial procedures was to move to online questionnaires for the 12-month follow-up. It is estimated that 45% of patients will have had their final follow-up after the start of the pandemic.
Recognising that trial participation and symptom reporting may have been impacted by the outbreak and subsequent lock-down, we will:
• Explore whether there were differences in the proportions of missing data for the primary
outcome (IPSS at 12 months) before and after 11 March 2020;
• Explore whether IPSS scores at 12 months differed depending on whether data were collected
before or during the COVID-19 pandemic. Scores before and after 11 March 2020 will be described using descriptive statistics and the primary analysis model will be re-fitted including a binary term to indicate whether the outcome was measured before (0) or from 11 March 2020 onwards (1).
6.4.7 Missing outcome data
We will explore patterns of missing IPSS responses at 12 months and consider possible mechanisms for this. This will include comparing the baseline characteristics of patients with and without IPSS data at 12 months. Based on these and observed data, appropriate methods for imputing missing data will be considered in sensitivity analyses, including both “best” (lowest IPSS score possible) and “worst” (highest IPSS score possible) case scenarios. Where assumptions are met, this may include multiple imputation by chained equations. Imputation models will include baseline, 6-month IPSS data (as available), allocated treatment arm, variables used in the randomisation as well as other variables such as baseline and auxiliary covariates

STATISTICAL ANALYSIS PLAN TRIUMPH
Version 1 18 31 July 2020
informative of missingness. To allow for clustering in Stata, imputations will be performed separately for each practice where possible.
6.4.8 Impact of outliers
As outlined in section 3.5, we will check outlier values to ensure that they are not, in fact, data entry mistakes. If after data checking outliers remain in any of the variables used in the primary analysis we will assess the impact of these outliers by re-fitting the primary analysis model excluding outlier values.
6.5 Secondary outcomes analyses
The approach for analysis of the secondary outcomes will be on an ITT basis defined as analysing all participants according to the group their practice was randomised to.
IPSS symptom scores at 6 months will be analysed in the same manner as the primary outcome using a linear mixed model (individual patients (level 1) nested within GP practices (level 2)) adjusting for baseline scores and minimisation variables. A separate repeated measures analysis using a linear mixed model (6-monthly observations of IPSS scores (level 1), nested within participants (level 2) and nested within GP practices (level 3)) will also be conducted to incorporate all time points. ICIQ-UI-SF, IPSS QoL and B-IPQ at 6 and 12 months will be studied in the same manner.
We will check the normality assumptions of the residuals from the fixed part of these multi-level models and the random effects at the cluster level using graphs. Appropriate transformations will be considered if the assumptions of the model are not met. The choice of covariance structure will be decided upon based on a review of the data.
Whether or not a patient has a referral to secondary care will be studied using a logistic mixed model with individual patients nested within GP practices. The model will adjust for minimisation variables and whether or not the patient had a referral pre-baseline.
6.6 Subgroup analyses
Four pre-specified subgroup analyses will be performed. In all cases effect modification will be assessed by including an interaction term in the regression model and formal tests of interaction will be performed to test whether the treatment effect differs between these groups. As with all other analyses, a significance level of 5% will be used. These analyses, however, are not statistically powered and will be interpreted with due caution as exploratory.
6.6.1 Nature of LUTS at baseline
The effects of the intervention may differ between groups of patients according to the nature of LUTS experienced at baseline. The ratio of the IPSS voiding sub-score to the storage sub-score (IPSS-V/S ratio) has been used to describe the relative dominance of voiding to storage LUTS (6). Subgroup analysis will be carried out to assess the difference in treatment effect on the primary outcome according to the voiding/storage sub- score ratio reported at baseline.
6.6.2 Intervention delivery
We will explore if the effect of the intervention differed according to whether the practice nurse or TRIUMPH study nurse delivered the intervention to the patient. This will be explored by including an interaction term in
STATISTICAL ANALYSIS PLAN TRIUMPH
Version 1 19 31 July 2020
the regression model between a binary practice vs study nurse delivery indicator variable and allocated treatment group.
6.6.3 Method of contact
Patients in the intervention arm specified how they preferred to be contacted by the research team for their intervention follow-up contacts. This might be by telephone or text, for example. We will report the frequency of each preferred mode of contact as well, the model of contact used and how often this differed. We will explore whether the effect of the intervention differed by model of contact by including a “preferred method of contact” and treatment group interaction term in the model.
6.6.4 Dose-effects
To explore the possibility that the number of nurse/HCA contacts modifies the effect of the intervention we will create a “dose” variable equal to the number of nurse/HCA contacts patients at the intervention practices received (0-3). We will then repeat the primary analysis using the “dose” variable as the treatment variable.
6.7 Exploratory analyses
We will conduct a small number of further exploratory analyses as described below.
6.7.1 Descriptive analyses
Among patients in the intervention arm, we will describe which sections of the treatment booklet they were advised to read according to the categories of LUTS patients present with at baseline (based on IPSS and ICIQ- UI-SF scores). We will also explore how the EQ-5D-5L responses at baseline relate to the IPSS-QoL at baseline.
6.7.2 IPSS severity banding
Existing severity bands for the IPSS score have been developed for patients referred for specialist urological care and in mixed populations of patients with and without LUTS. Our population of men – all experiencing bothersome LUTS and being treated in primary care – may not report similar illness patterns. We aim to explore whether different bandings may be more appropriate in this group.
Another trial recently considered this question within their own patient group (7). We will adopt a similar approach to derive cut-off points in the IPSS for banding by using the sensitivity and specificity levels derived from the receiver operating characteristic curve plotted using IPSS quality of life scores. We will describe if/how new bandings differ to previously established bandings.
6.7.3 Characterising patients whose symptoms are not captured on the IPSS
The IPSS questionnaire is not able to capture all LUTS and patients may have low IPSS scores despite having high ICIQ-UI-SF scores due to leakage. Qualitative interviews conducted at the end of the pilot phase of the study may help us to understand how the IPSS and ICIQ-UI-SF questionnaires are completed when leakage is the only symptom present.

STATISTICAL ANALYSIS PLAN TRIUMPH
Version 1 20 31 July 2020
7. ANALYSIS OF SAFETY
All related adverse events will be tabulated by whether or not the patient had received the intervention (see section 3.1). The number of events, number of patients having at least one event and the number of patients with more than one event will be tabulated. Serious adverse events (SAEs) will also be listed according to whether or not the patient received the intervention.
8. CHANGES TO THE SAP
All changes made to the planned statistical analyses are described below:
Previous version
Previous date
New version
New date
Brief summary of changes Changes made before or after the statistician analysing the data was unblinded

STATISTICAL ANALYSIS PLAN TRIUMPH
Version 1 21 31 July 2020
9. FINAL REPORT TABLES AND FIGURES (SUBJECT TO CHANGE)
9.1 Populations: Tables, figures and listings detailing the study population
Figure 1 CONSORT flow diagram
Figure 2 Cumulative number of practices randomised over time
Figure 3 Cumulative patient recruitment over time
Table 1 Patient recruitment by centre and practice
Table 2 Patient withdrawals from the study
Table 3 Practice level characteristics
Table 4 Follow-up rates by practice
Table 5 Timing of questionnaire completion at all follow-ups
Table 6 Comparison of the ages of men identified as having LUTS who were invited to participate
Table 7 Comparison of the ages of men identified who were invited to have further screening by the CRNs
Table 8 Comparison of the ages of men eligible and willing to participate at the CRN stage of screening
Table 9 Intervention delivery
9.2 Baseline data: Summary tables of baseline information
Table 10 Patient characteristics at baseline
Table 11 Electronic medical records search: relevant prescriptions issued to patients in the 3 months pre-baseline
Table 12 Baseline characteristics associated with missing IPSS data at 6 months
Table 13 Baseline characteristics associated with missing IPSS data at 12 months
9.3 Outcomes: Summary data and treatment estimates
Table 14 Primary outcome: mean and difference in mean patient-reported urinary symptom (IPSS) score at 12 months
Table 15 Sensitivity analysis: Comparison of results from the primary ITT analysis, per protocol analyses and CACE analysis (IPSS score at 12 months)
Table 16 Sensitivity analysis: comparison of demographics between compliers and non-compliers
Table 17 Sensitivity analysis: comparison of results of primary analysis using the ITT population and analysis excluding those patients later found to be ineligible (IPSS score at 12 months)
Table 18 Sensitivity analysis: comparison of results of primary analysis with and without adjusting for the COVID-19 pandemic (IPSS score at 12 months)
Table 19 Sensitivity analysis: comparison of results of ITT analysis of complete cases with ITT analysis where missing data were imputed for IPSS scores (12 months)
Table 20 Sensitivity analysis: comparison of results of primary analysis with and without the exclusion of outlier values (IPSS score 12 months)
Table 21 Secondary outcome: mean and difference in mean patient-reported urinary symptom (IPSS) score at 6 months
Table 22 Mean and difference in mean patient-reported urinary symptom (IPSS) score using repeated measures data at 6 and 12 months
Table 23 Secondary outcome: mean and difference in mean patient-reported urinary symptoms (ICIQ-UI-SF) score at 6 and 12 months
Table 24 Secondary outcome: mean and difference in mean LUTS specific quality of life (IPSS QoL) at 6 and 12 months
Table 25 Secondary outcome: mean and difference in mean score of patient perception of LUTS (B- IPQ) at 6 and 12 months
Table 26 Secondary outcome: percentage and OR of referral to secondary care (urology)
Figure 4 Relationship between EQ-5D-5L and IPSS-QoL at baseline
9.4 Safety data: Summary tables and listings of all adverse events and serious adverse events

STATISTICAL ANALYSIS PLAN TRIUMPH
Version 1 22 31 July 2020
Table 27 Related adverse events identified from GP records search
Table 28 All related adverse events including severity classification
Table 29 All related adverse events by patient
Table 30 List of individual SAEs

STATISTICAL ANALYSIS PLAN TRIUMPH
Version 1 23 31 July 2020
9.1 Populations: Tables, figures and listings detailing the study population
Figure 1: CONSORT flow diagram
Practices expressing interest in study (n=XX) Practices performing an initial search (n=XX)
Participating practices (n=XX); Patient population (n=XXXXXX)
Excluded practices due to
insufficient patients w/LUTS (n=XX)
List of other reasons (n=XX)
Patients manually screened by GPs (n=XXXX)
Patients eligible at database search (n=XXXX)
Patients ineligible at database search (n=XXXXXX)
Patients not screened (n=XXX)
Patients eligible at manual screening (n=XXXX)
Patients ineligible at manual screening (n=XXXX)
Practices randomised
Practices randomised to the intervention (n=XX) Patients eligible at manual screening (n=XXXX)
Practices randomised to usual care (n=XX) Patients eligible at manual screening (n=XXXX)
Patients not included in mail out (n=XXX) Patients not included in mail out (n=XXX)
Patients included in mail out (n=XXX) Patients included in mail out (n=XXX)
EOI not returned by patient (n=XXX) EOI not returned by patient (n=XXX)
Patient returned EOI (n=XXX) Patient returned EOI (n=XXX)
Patient declined in EOI (n=XXX) Patient declined in EOI (n=XXX)
Patient interested in EOI (n=XXX) Patient interested in EOI (n=XXX)
Patient excluded at CRN screening (n=XXX) Ineligible (n=XXX); Unwilling (n=XXX) Uncontactable (n=XXX)
Patient excluded at CRN screening (n=XXX) Ineligible (n=XXX); Unwilling (n=XXX);
Uncontactable (n=XXX)
Patients eligible at CRN screening (n=XXX) Patients eligible at CRN screening (n=XXX)
Patients excluded (n=XXX) Did not consent (n=XXX)
Patients excluded (n=XXX) Did not consent (n=XXX)
Patients consented (n=XXX) Patients providing baseline IPSS (n=XXX)
Patients consented (n=XXX) Patients providing baseline IPSS (n=XXX)
6-month follow-up Practices (n=XX); Patients (n=XXX) Patients providing complete IPSS data (n=XXX) Patients lost to follow-up (n=XXX) Reasons listed
6-month follow-up Practices (n=XX); Patients (n=XXX) Patients providing complete IPSS data (n=XXX) Patients lost to follow-up (n=XXX) Reasons listed
12-month follow-up Practices (n=XX); Patients (n=XXX) Patients providing complete IPSS data (n=XXX) Patients lost to follow-up (n=XXX) Reasons listed
12-month follow-up Practices (n=XX); Patients (n=XXX) Patients providing complete IPSS data (n=XXX) Patients lost to follow-up (n=XXX) Reasons listed
Patients included in primary analysis (n=XXX); Patients excluded from primary analysis (n=XXX)

STATISTICAL ANALYSIS PLAN TRIUMPH
Version 1 24 31 July 2020
Figure 2: Cumulative number of practices randomised over time (x axis: time; y-axis: cumulative number of practices recruited)
Figure 3: Cumulative patient recruitment over time (x axis: time; y-axis: cumulative number of patients recruited)
Table 1: Patient recruitment by centre and practice
Centre Arm Practice ID
Number of patients included in initial mail out
Number of patients returning EOI form
Number of patients interested in further screening
Number of patients eligible at CRN screening
Number of patients consented
Bristol
Bristol
Bristol
Bristol
Bristol
Bristol
Bristol
Bristol
Bristol
Bristol
Bristol
Bristol
Bristol
Bristol
Bristol
Bristol
Southampton
Southampton
Southampton
Southampton
Southampton
Southampton
Southampton
Southampton
Southampton
Southampton
Southampton
Southampton
Southampton
Across Bristol practices
Across Southampton practices
Table 2: Patient withdrawals from the study
Practice ID
Arm Date Months since consent
Reason Withdrawal from complying with the trial treatment and/or withdrawal from providing further trial data
Table 3: Practice level characteristics
Centre Arm Practice ID Type of electronic records system used
Practice size Number of patients consented
Area-level deprivation of the practice based on surgery postcode
Bristol

STATISTICAL ANALYSIS PLAN TRIUMPH
Version 1 25 31 July 2020
Bristol
Bristol
Bristol
Bristol
Bristol
Bristol
Bristol
Bristol
Bristol
Bristol
Bristol
Bristol
Bristol
Bristol
Bristol
Southampton
Southampton
Southampton
Southampton
Southampton
Southampton
Southampton
Southampton
Southampton
Southampton
Southampton
Southampton
Southampton
Mean (SD) across intervention practices
Mean (SD) across usual care practices
Table 4: Follow-up rates by practice
Centre Arm Practice ID
Total number of patients consented
Follow-upa; n (%)
6 months 12 months
Bristol
Bristol
Bristol
Bristol
Bristol
Bristol
Bristol
Bristol
Bristol
Bristol
Bristol
Bristol
Bristol
Bristol
Bristol
Bristol
Southampton
Southampton
Southampton
Southampton
Southampton
Southampton
Southampton
Southampton
Southampton

STATISTICAL ANALYSIS PLAN TRIUMPH
Version 1 26 31 July 2020
Southampton
Southampton
Southampton
Southampton
Across intervention practices
Across usual care practices
a For the purpose of this analysis a patient is considered to have provided follow-up data if they returned any of the questionnaires for that follow-up period regardless of missing data for individual outcomes. The denominator for proportions reported is the number of patients consented

STATISTICAL ANALYSIS PLAN TRIUMPH
Version 1 27 31 July 2020
Table 5: Timing of questionnaire completion at all follow-ups
Follow-up Number of questionnaires returned Mean (months) since baseline SD
Intervention practices
6 months
12 months
Usual care practices
6 months
12 months
Table 6: Comparison of the ages of men identified as having LUTS who were invited to participate N na Mean SD Min, Max
Returned EOI and interested
Returned EOI and were not interested
Did not return EOI
All groups combined
a Number with available data
Table 7: Comparison of the ages of men identified who were invited to have further screening by the CRNs
N na Mean SD Min, Max
Eligible at CRN screening and willing to participate in the study
Eligible at CRN screening and not willing to participate in the study
Ineligible at CRN screening
Not contactable by the CRN
All groups combined
a Number with available data

STATISTICAL ANALYSIS PLAN TRIUMPH
Version 1 28 31 July 2020
Table 8: Comparison of the ages of men eligible and willing to participate at the CRN stage of screening
All practices Intervention practices Usual care practices N na Mean SD Min, Max N na Mean SD Min, Max N na Mean SD Min, Max
Eligible men who consented to participate
Eligible men who did not consent to participate
Both groups combined
a Number with available data

STATISTICAL ANALYSIS PLAN TRIUMPH
Version 1 29 31 July 2020
Table 9: Intervention delivery
Site ID
Centre Practice or
TRIUMPH nurse
Number of
patients consented
Visit 1-week F/U 4-week F/U 12-week F/u
Number of patients receiving this stage of the
intervention; n(%)
Loss-to- follow- up; n
(%)
Number of patients receiving this stage of
the intervention; n(%)
Loss-to- follow- up; n
(%)
Number of patients receiving this stage of the intervention;
n(%)
Loss-to- follow-up;
n (%)
Number of patients receiving this stage of the intervention;
n(%)
Loss-to- follow- up; n (%)
Across Bristol practices
Across Southampton practices

STATISTICAL ANALYSIS PLAN TRIUMPH
Version 1 30 31 July 2020
9.2 Baseline data: Summary tables of baseline information
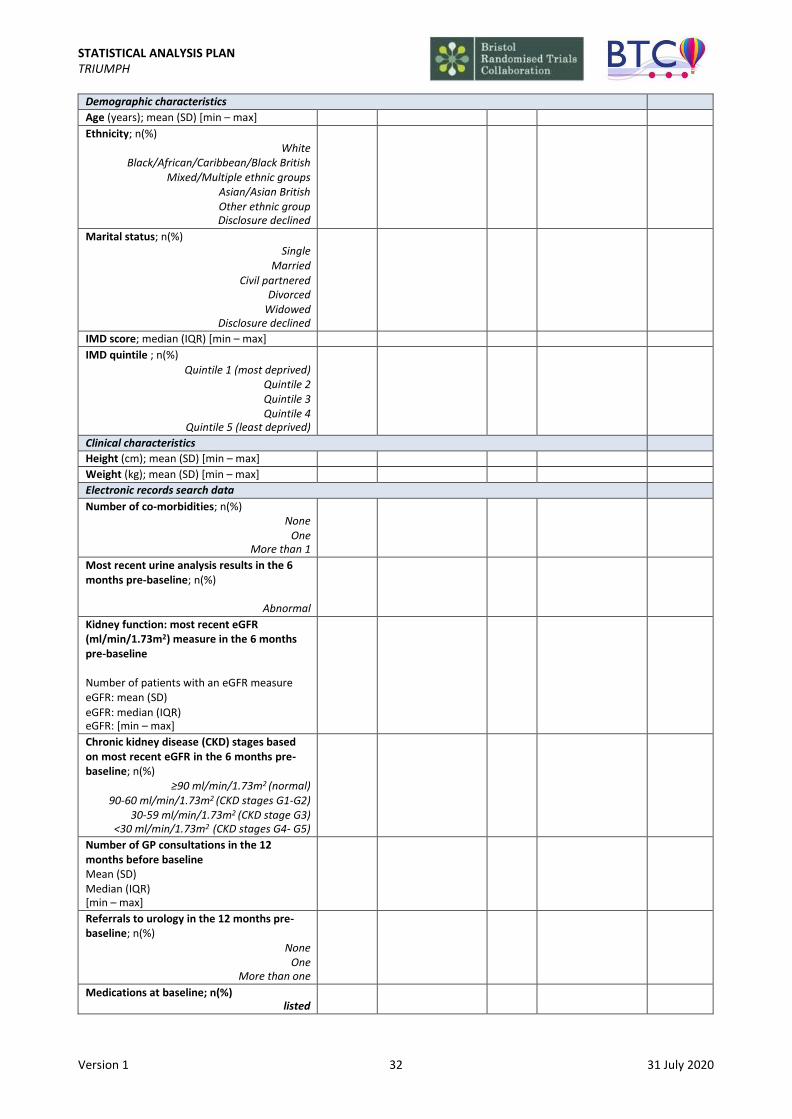
Table 10: Patient characteristics at baseline
Intervention Usual care
na na
Total number of participants; n
Demographic characteristics
Age (years); mean (SD) [min – max]
Ethnicity; n(%) White
Black/African/Caribbean/Black British Mixed/Multiple ethnic groups
Asian/Asian British Other ethnic group Disclosure declined
Marital status; n(%) Single
Married Civil partnered
Divorced Widowed
Disclosure declined
IMD score; median (IQR) [min – max]
IMD quintile ; n(%) Quintile 1 (most deprived)
Quintile 2 Quintile 3 Quintile 4
Quintile 5 (least deprived)
Clinical characteristics
Height (cm); mean (SD) [min – max]
Weight (kg); mean (SD) [min – max]
Electronic records search data
Number of co-morbidities; n(%) None
One More than 1
Most recent urine analysis results in the 6 months pre-baseline; n(%)
Abnormal
Kidney function: most recent eGFR (ml/min/1.73m2) measure in the 6 months pre-baseline
Number of patients with an eGFR measure eGFR: mean (SD) eGFR: median (IQR) eGFR: min - max
Chronic kidney disease (CKD) stages based on most recent eGFR in the 6 months pre- baseline; n(%)
≥90 ml/min/1.73m2 (normal) 90-60 ml/min/1.73m2 (CKD stages G1-G2)
30-59 ml/min/1.73m2 (CKD stage G3) <30 ml/min/1.73m2 (CKD stages G4- G5)
Number of GP consultations in the 12 months before baseline Mean (SD) Median (IQR) [min – max]

STATISTICAL ANALYSIS PLAN TRIUMPH
Version 1 31 31 July 2020
Referrals to urology in the 12 months pre- baseline; n(%)
None One
More than one
Patient reported symptoms and quality of life
IPSS symptoms; mean (SD) [min – max] Incomplete emptying
Frequency Intermittency
Urgency Weak stream
Straining Nocturia
Total IPSS score; mean (SD) [min – max]
IPSS QoL score; mean (SD) [min – max]
ICIQ-UI-SF total score; mean (SD) [min – max]
ICIQ-UI-SF: when does urine leak? n (%) Never
Leaks before you can get to the toilet Leaks when you cough/sneeze
Leaks when you are asleep Leaks when you are physically active
Leaks when you have finished urinating/ are dressed
Leaks for no obvious reason Leaks all of the time
EQ-5D-5L utility score; mean (SD) [min – max]
EQ5D visual analogue score; mean (SD) [min – max]
B-IPQ total score; mean (SD) [min – max]
Bladder diary; n(%) Incontinence
Urgency nocturia
N/A N/A
a Number of patients providing non-missing data at baseline
Table 11: Electronic medical records search: relevant prescriptions issued to patients in the 3 months pre-baseline
Intervention Usual care
Total number of patients
Number of patients for whom electronic medical records data were available
Number of patients having at least one prescription (%)
Number of patients having at least one prescription (%)
List of medications as observed
…
…
Table 12: Associations between baseline characteristics and missing IPSS data at 6 months
Missing Present p-value
na na
Total number of participants; n
Treatment arm; n(%)
Intervention Usual care
STATISTICAL ANALYSIS PLAN TRIUMPH
Version 1 32 31 July 2020
Demographic characteristics
Age (years); mean (SD) [min – max]
Ethnicity; n(%) White
Black/African/Caribbean/Black British Mixed/Multiple ethnic groups
Asian/Asian British Other ethnic group Disclosure declined
Marital status; n(%) Single
Married Civil partnered
Divorced Widowed
Disclosure declined
IMD score; median (IQR) [min – max]
IMD quintile ; n(%)
Quintile 1 (most deprived) Quintile 2 Quintile 3 Quintile 4
Quintile 5 (least deprived)
Clinical characteristics
Height (cm); mean (SD) [min – max]
Weight (kg); mean (SD) [min – max]
Electronic records search data
Number of co-morbidities; n(%) None
One More than 1
Most recent urine analysis results in the 6 months pre-baseline; n(%)
Abnormal
Kidney function: most recent eGFR (ml/min/1.73m2) measure in the 6 months pre-baseline
Number of patients with an eGFR measure eGFR: mean (SD)
eGFR: median (IQR) eGFR: [min – max]
Chronic kidney disease (CKD) stages based on most recent eGFR in the 6 months pre- baseline; n(%)
≥90 ml/min/1.73m2 (normal) 90-60 ml/min/1.73m2 (CKD stages G1-G2)
30-59 ml/min/1.73m2 (CKD stage G3) <30 ml/min/1.73m2 (CKD stages G4- G5)
Number of GP consultations in the 12 months before baseline Mean (SD) Median (IQR) [min – max]
Referrals to urology in the 12 months pre- baseline; n(%)
None One
More than one
Medications at baseline; n(%) listed
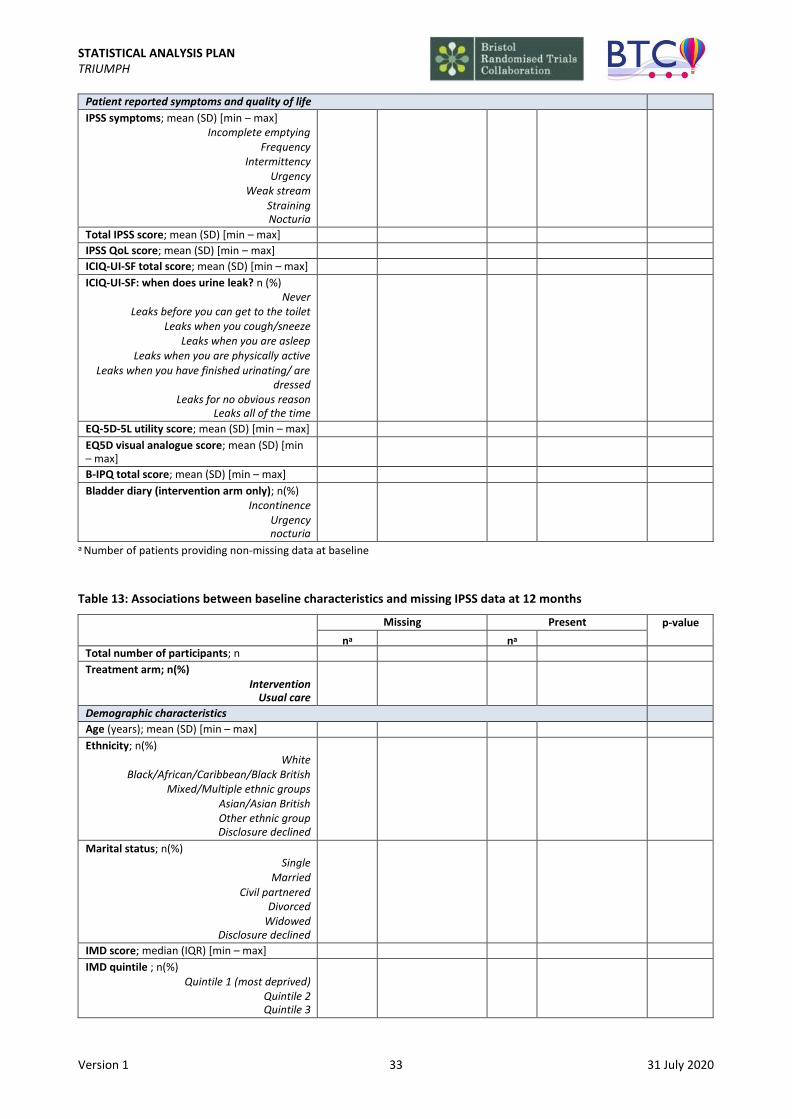
STATISTICAL ANALYSIS PLAN TRIUMPH
Version 1 33 31 July 2020
Patient reported symptoms and quality of life
IPSS symptoms; mean (SD) [min – max] Incomplete emptying
Frequency Intermittency
Urgency Weak stream
Straining Nocturia
Total IPSS score; mean (SD) [min – max]
IPSS QoL score; mean (SD) [min – max]
ICIQ-UI-SF total score; mean (SD) [min – max]
ICIQ-UI-SF: when does urine leak? n (%) Never
Leaks before you can get to the toilet Leaks when you cough/sneeze
Leaks when you are asleep Leaks when you are physically active
Leaks when you have finished urinating/ are dressed
Leaks for no obvious reason Leaks all of the time
EQ-5D-5L utility score; mean (SD) [min – max]
EQ5D visual analogue score; mean (SD) [min – max]
B-IPQ total score; mean (SD) [min – max]
Bladder diary (intervention arm only); n(%) Incontinence
Urgency nocturia
a Number of patients providing non-missing data at baseline
Table 13: Associations between baseline characteristics and missing IPSS data at 12 months
Missing Present p-value
na na
Total number of participants; n
Treatment arm; n(%) Intervention
Usual care
Demographic characteristics
Age (years); mean (SD) [min – max]
Ethnicity; n(%) White
Black/African/Caribbean/Black British Mixed/Multiple ethnic groups
Asian/Asian British Other ethnic group Disclosure declined
Marital status; n(%) Single
Married Civil partnered
Divorced Widowed
Disclosure declined
IMD score; median (IQR) [min – max]
IMD quintile ; n(%) Quintile 1 (most deprived)
Quintile 2 Quintile 3
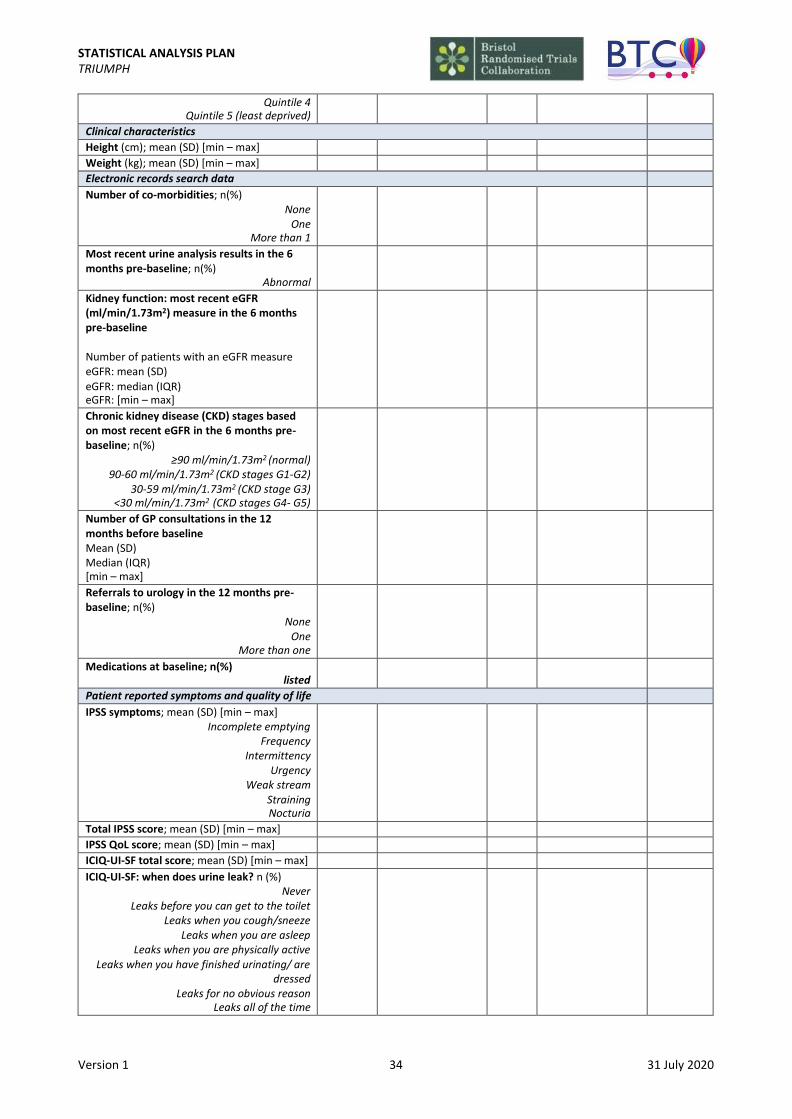
STATISTICAL ANALYSIS PLAN TRIUMPH
Version 1 34 31 July 2020
Quintile 4 Quintile 5 (least deprived)
Clinical characteristics
Height (cm); mean (SD) [min – max]
Weight (kg); mean (SD) [min – max]
Electronic records search data
Number of co-morbidities; n(%) None
One More than 1
Most recent urine analysis results in the 6 months pre-baseline; n(%)
Abnormal
Kidney function: most recent eGFR (ml/min/1.73m2) measure in the 6 months pre-baseline
Number of patients with an eGFR measure eGFR: mean (SD)
eGFR: median (IQR) eGFR: [min – max]
Chronic kidney disease (CKD) stages based on most recent eGFR in the 6 months pre- baseline; n(%)
≥90 ml/min/1.73m2 (normal) 90-60 ml/min/1.73m2 (CKD stages G1-G2)
30-59 ml/min/1.73m2 (CKD stage G3) <30 ml/min/1.73m2 (CKD stages G4- G5)
Number of GP consultations in the 12 months before baseline Mean (SD) Median (IQR) [min – max]
Referrals to urology in the 12 months pre- baseline; n(%)
None One
More than one
Medications at baseline; n(%) listed
Patient reported symptoms and quality of life
IPSS symptoms; mean (SD) [min – max] Incomplete emptying
Frequency Intermittency
Urgency Weak stream
Straining Nocturia
Total IPSS score; mean (SD) [min – max]
IPSS QoL score; mean (SD) [min – max]
ICIQ-UI-SF total score; mean (SD) [min – max]
ICIQ-UI-SF: when does urine leak? n (%) Never
Leaks before you can get to the toilet Leaks when you cough/sneeze
Leaks when you are asleep Leaks when you are physically active
Leaks when you have finished urinating/ are dressed
Leaks for no obvious reason Leaks all of the time
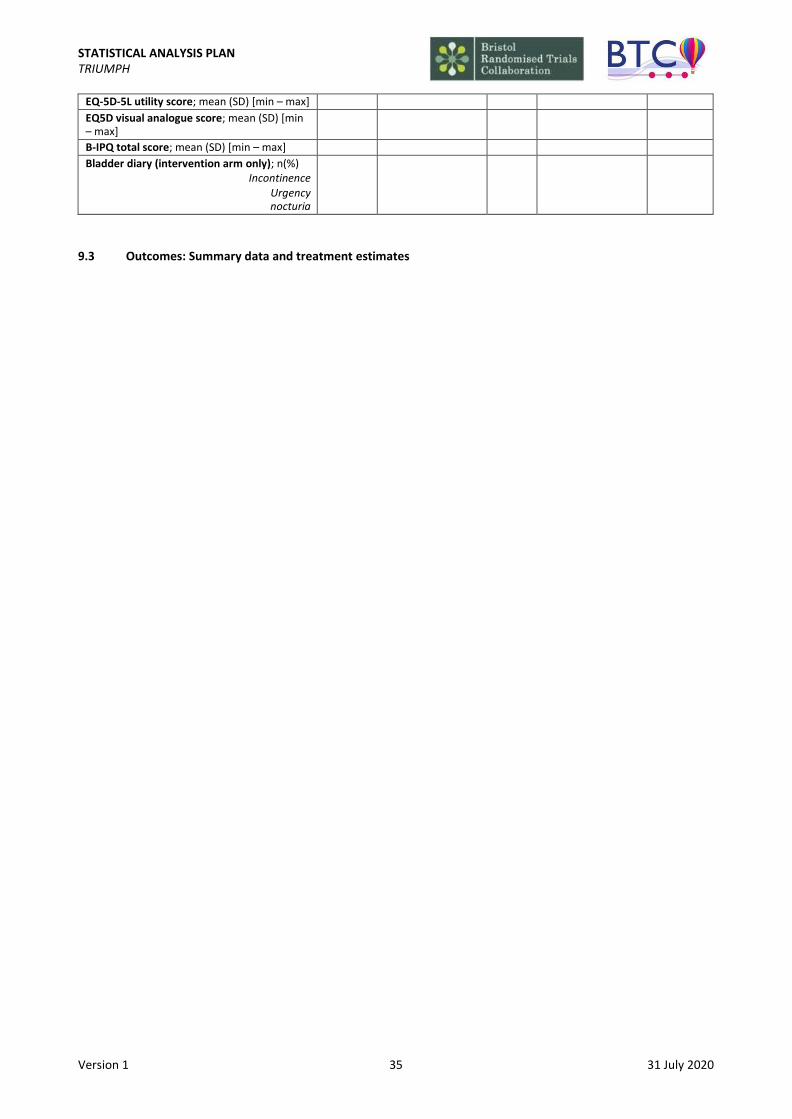
STATISTICAL ANALYSIS PLAN TRIUMPH
Version 1 35 31 July 2020
EQ-5D-5L utility score; mean (SD) [min – max]
EQ5D visual analogue score; mean (SD) [min – max]
B-IPQ total score; mean (SD) [min – max]
Bladder diary (intervention arm only); n(%) Incontinence
Urgency nocturia
9.3 Outcomes: Summary data and treatment estimates
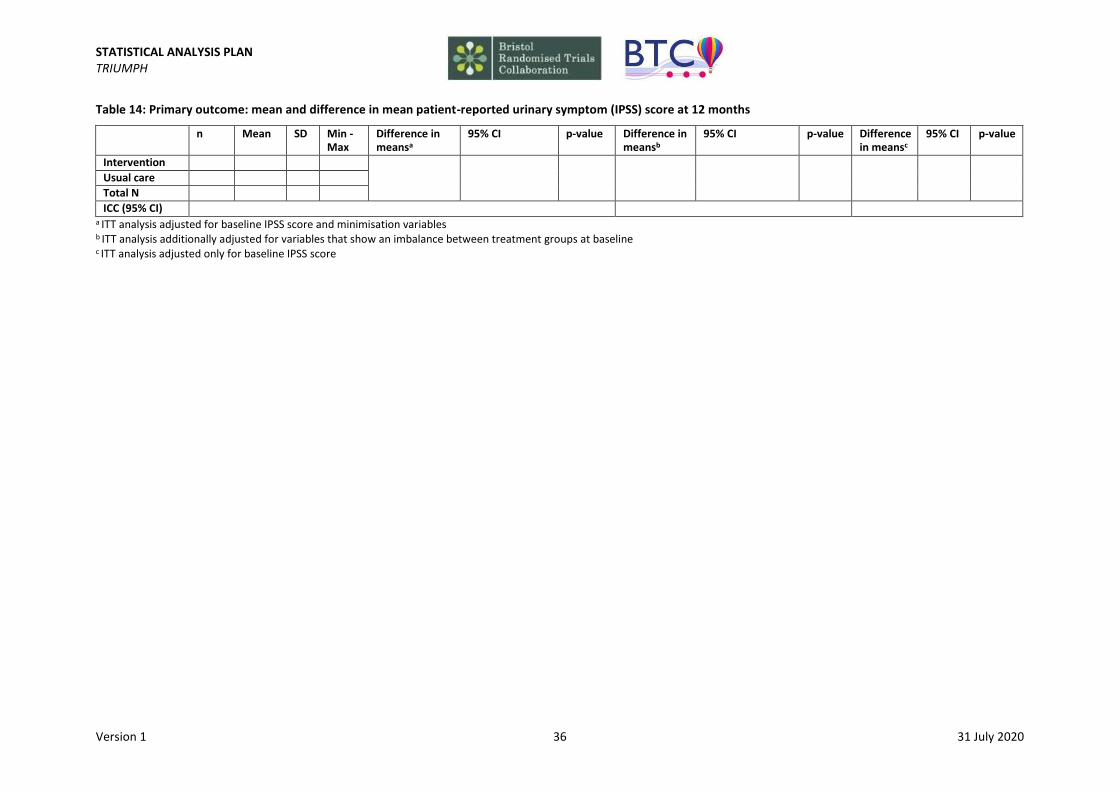
Version 1 36 31 July 2020
STATISTICAL ANALYSIS PLAN TRIUMPH
Table 14: Primary outcome: mean and difference in mean patient-reported urinary symptom (IPSS) score at 12 months
n Mean SD Min - Max
Difference in meansa
95% CI p-value Difference in meansb
95% CI p-value Difference in meansc
95% CI p-value
Intervention
Usual care
Total N
ICC (95% CI)
a ITT analysis adjusted for baseline IPSS score and minimisation variables b ITT analysis additionally adjusted for variables that show an imbalance between treatment groups at baseline c ITT analysis adjusted only for baseline IPSS score

STATISTICAL ANALYSIS PLAN TRIUMPH
Version 1 37 31 July 2020
Table 15: Sensitivity analysis: Comparison of results from the ITT analysis, per protocol analyses and CACE analysis (IPSS score at 12 months) n Mean SD Min -
Max Difference in meansa
95% CI p-value
ITT
Per protocol: Excluding those in the intervention arm who received no intervention booklet by the time of the primary outcome measure at 12 months and had none of the follow-up contacts
Per protocol: Excluding those in the intervention arm who received the intervention booklet by the time of the primary outcome measure at 12 months, but only had 2 of the 3 follow-up contact visits
Per protocol: Excluding those in the intervention arm who received the intervention booklet by the time of the primary outcome measure at 12 months and had only 1 follow-up contact
Per protocol: Excluding those in the intervention arm who received their intervention booklet by the time of the primary outcome measure at 12 months but had no follow-up contact
Per protocol: Excluding those in the intervention arm who did not receive their follow-up contacts in the protocolised format
CACE analysis
a Analysis adjusted for baseline IPSS score and randomisation variables
Table 16: Sensitivity analysis: comparison of demographics between compliers and non-compliers Compliers Non-compliers p-value
na na
Total number of participants; n
Demographic characteristics
Age (years); mean (SD) [min – max]
Ethnicity; n(%) White
Black/African/Caribbean/Black British Mixed/Multiple ethnic groups
Asian/Asian British Other ethnic group Disclosure declined
Marital status; n(%) Single
Married Civil partnered
Divorced Widowed
Disclosure declined
IMD score; median (IQR) [min – max]
IMD quintile; n(%) Quintile 1 (most deprived)
Quintile 2
Quintile 3 Quintile 4
Quintile 5 (least deprived)
Clinical characteristics

STATISTICAL ANALYSIS PLAN TRIUMPH
Version 1 38 31 July 2020
Height (cm); mean (SD) [min – max]
Weight (kg); mean (SD) [min – max]
Electronic records search data
Number of co-morbidities; n(%) None
One More than 1
Most recent urine analysis results in the 6 months pre-baseline; n(%)
Abnormal
Kidney function: most recent eGFR (ml/min/1.73m2) measure in the 6 months pre-baseline
Number of patients with an eGFR measure eGFR: mean (SD) eGFR: median (IQR) eGFR: [min – max]
Chronic kidney disease (CKD) stages based on most recent eGFR in the 6 months pre- baseline; n(%)
≥90 ml/min/1.73m2 (normal) 90-60 ml/min/1.73m2 (CKD stages G1-G2)
30-59 ml/min/1.73m2 (CKD stage G3) <30 ml/min/1.73m2 (CKD stages G4- G5)
Number of GP consultations in the 12 months before baseline Mean (SD) Median (IQR) [min – max]
Referrals to urology in the 12 months pre- baseline; n(%)
None One
More than one
Medications at baseline; n(%) listed
Patient reported symptoms and quality of life
IPSS symptoms; mean (SD) [min – max] Incomplete emptying
Frequency Intermittency
Urgency Weak stream
Straining Nocturia
Total IPSS score; mean (SD) [min – max]
IPSS QoL score; mean (SD) [min – max]
ICIQ-UI-SF total score; mean (SD) [min – max]
ICIQ-UI-SF: when does urine leak? n (%) Never
Leaks before you can get to the toilet Leaks when you cough/sneeze
Leaks when you are asleep Leaks when you are physically active
Leaks when you have finished urinating/ are dressed
Leaks for no obvious reason Leaks all of the time
EQ-5D-5L utility score; mean (SD) [min – max]
EQ5D visual analogue score; mean (SD) [min – max]
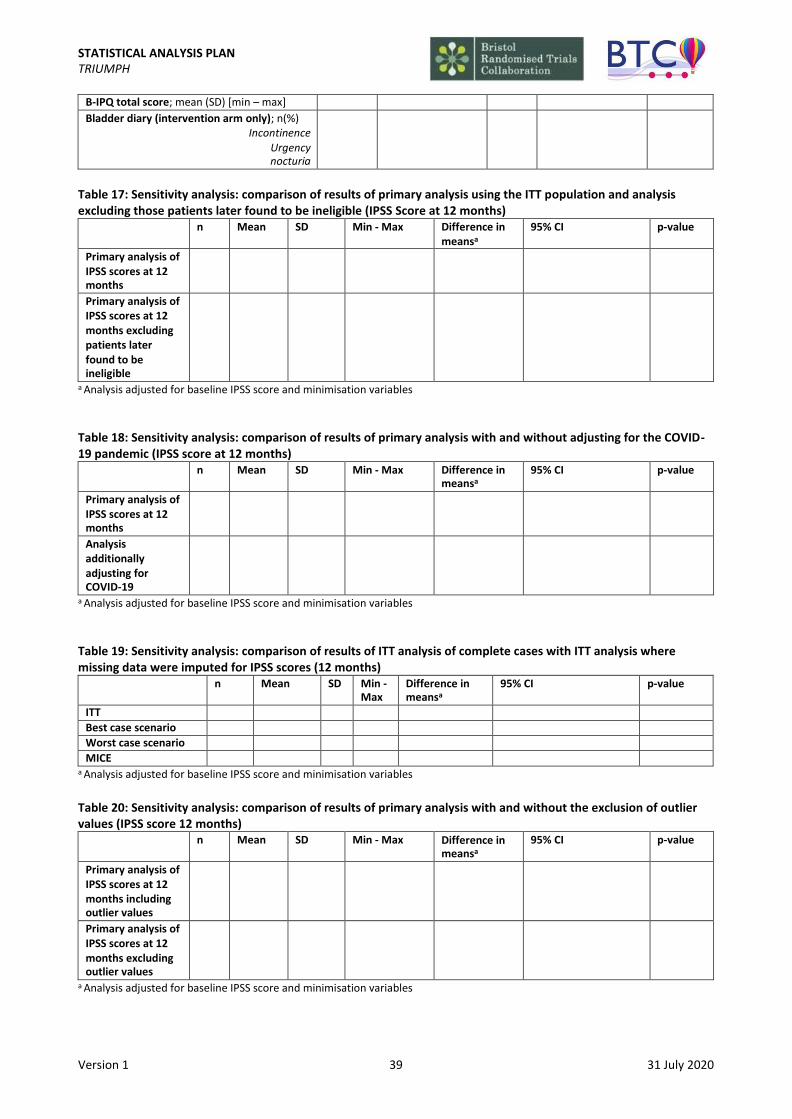
STATISTICAL ANALYSIS PLAN TRIUMPH
Version 1 39 31 July 2020
B-IPQ total score; mean (SD) [min – max]
Bladder diary (intervention arm only); n(%) Incontinence
Urgency nocturia
Table 17: Sensitivity analysis: comparison of results of primary analysis using the ITT population and analysis excluding those patients later found to be ineligible (IPSS Score at 12 months) n Mean SD Min - Max Difference in
meansa
95% CI p-value
Primary analysis of IPSS scores at 12 months
Primary analysis of IPSS scores at 12 months excluding patients later found to be ineligible
a Analysis adjusted for baseline IPSS score and minimisation variables
Table 18: Sensitivity analysis: comparison of results of primary analysis with and without adjusting for the COVID- 19 pandemic (IPSS score at 12 months) n Mean SD Min - Max Difference in
meansa
95% CI p-value
Primary analysis of IPSS scores at 12 months
Analysis additionally adjusting for COVID-19
a Analysis adjusted for baseline IPSS score and minimisation variables
Table 19: Sensitivity analysis: comparison of results of ITT analysis of complete cases with ITT analysis where missing data were imputed for IPSS scores (12 months) n Mean SD Min -
Max Difference in meansa
95% CI p-value
ITT
Best case scenario
Worst case scenario
MICE
a Analysis adjusted for baseline IPSS score and minimisation variables
Table 20: Sensitivity analysis: comparison of results of primary analysis with and without the exclusion of outlier values (IPSS score 12 months) n Mean SD Min - Max Difference in
meansa
95% CI p-value
Primary analysis of IPSS scores at 12 months including outlier values
Primary analysis of IPSS scores at 12 months excluding outlier values
a Analysis adjusted for baseline IPSS score and minimisation variables
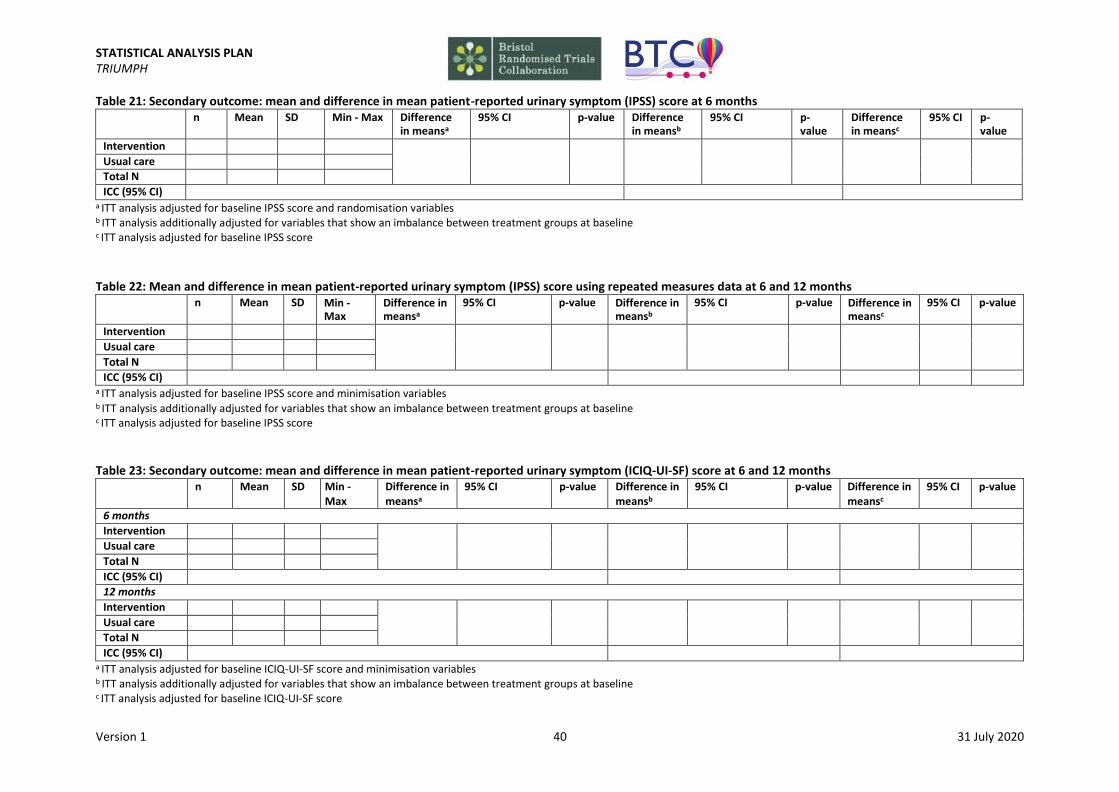
STATISTICAL ANALYSIS PLAN TRIUMPH
Version 1 40 31 July 2020
Table 21: Secondary outcome: mean and difference in mean patient-reported urinary symptom (IPSS) score at 6 months n Mean SD Min - Max Difference
in meansa
95% CI p-value Difference in meansb
95% CI p- value
Difference in meansc
95% CI p- value
Intervention
Usual care
Total N
ICC (95% CI)
a ITT analysis adjusted for baseline IPSS score and randomisation variables b ITT analysis additionally adjusted for variables that show an imbalance between treatment groups at baseline c ITT analysis adjusted for baseline IPSS score
Table 22: Mean and difference in mean patient-reported urinary symptom (IPSS) score using repeated measures data at 6 and 12 months n Mean SD Min -
Max Difference in meansa
95% CI p-value Difference in meansb
95% CI p-value Difference in meansc
95% CI p-value
Intervention
Usual care
Total N
ICC (95% CI)
a ITT analysis adjusted for baseline IPSS score and minimisation variables b ITT analysis additionally adjusted for variables that show an imbalance between treatment groups at baseline c ITT analysis adjusted for baseline IPSS score
Table 23: Secondary outcome: mean and difference in mean patient-reported urinary symptom (ICIQ-UI-SF) score at 6 and 12 months n Mean SD Min -
Max Difference in meansa
95% CI p-value Difference in meansb
95% CI p-value Difference in meansc
95% CI p-value
6 months
Intervention
Usual care
Total N
ICC (95% CI)
12 months
Intervention
Usual care
Total N
ICC (95% CI)
a ITT analysis adjusted for baseline ICIQ-UI-SF score and minimisation variables b ITT analysis additionally adjusted for variables that show an imbalance between treatment groups at baseline c ITT analysis adjusted for baseline ICIQ-UI-SF score

STATISTICAL ANALYSIS PLAN TRIUMPH
Version 1 41 31 July 2020
Table 24: Secondary outcome: mean and difference in mean LUTS specific quality of life (IPSS QoL) at 6 and 12 months n Mean SD Min -
Max Difference in meansa
95% CI p-value Difference in meansb
95% CI p-value Difference in meansc
95% CI p-value
6 months
Intervention
Usual care
Total N
ICC (95% CI)
12 months
Intervention
Usual care
Total N
ICC (95% CI)
a ITT analysis adjusted for baseline IPSS QoL and minimisation variables b ITT analysis additionally adjusted for variables that show an imbalance between treatment groups at baseline c ITT analysis adjusted for baseline IPSS QoL score
Table 25: Secondary outcome: mean and difference in mean score of patient perception of LUTS (B-IPQ) at 6 and 12 months n Mean SD Min-
Max Difference in meansa
95% CI p-value Difference in meansb
95% CI p-value Difference in meansc
95% CI p-value
6 months
Intervention
Usual care
Total N
ICC (95% CI)
12 months
Intervention
Usual care
Total N
ICC (95% CI)
a ITT analysis adjusted for baseline B-IPQ score and randomisation variables b ITT analysis additionally adjusted for variables that show an imbalance between treatment groups at baseline c ITT analysis adjusted for baseline B-IPQ score

STATISTICAL ANALYSIS PLAN TRIUMPH
Version 1 42 31 July 2020
Table 26: Secondary outcome: percentage and OR of referral to secondary care (urology) N n %a ORb 95% CI p-value ORc 95% CI p-value ORd 95% CI p-value
Intervention
Usual care
Total N
ICC (95% CI)
a number with referral (n) in relation to number in treatment arm (N) b ITT analysis adjusted for whether or not the patient had a referral pre-baseline and minimisation variables c ITT analysis additionally adjusted for variables that show an imbalance between treatment groups at baseline d ITT analysis adjusted for whether or not the patient had a referral pre-baseline
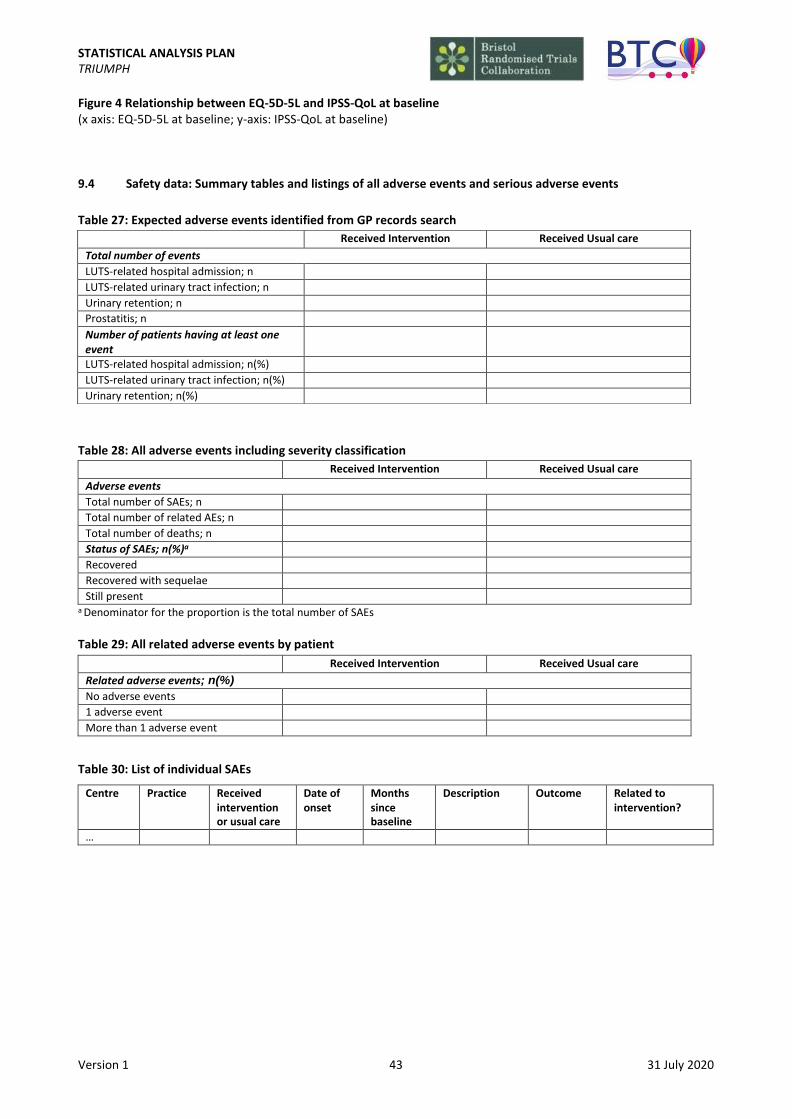
STATISTICAL ANALYSIS PLAN TRIUMPH
Version 1 43 31 July 2020
Figure 4 Relationship between EQ-5D-5L and IPSS-QoL at baseline (x axis: EQ-5D-5L at baseline; y-axis: IPSS-QoL at baseline)
9.4 Safety data: Summary tables and listings of all adverse events and serious adverse events
Table 27: Expected adverse events identified from GP records search
Table 28: All adverse events including severity classification
Received Intervention Received Usual care
Adverse events
Total number of SAEs; n
Total number of related AEs; n
Total number of deaths; n
Status of SAEs; n(%)a
Recovered
Recovered with sequelae
Still present
a Denominator for the proportion is the total number of SAEs
Table 29: All related adverse events by patient
Received Intervention Received Usual care
Related adverse events; n(%)
No adverse events
1 adverse event
More than 1 adverse event
Table 30: List of individual SAEs
Centre Practice Received intervention or usual care
Date of onset
Months since baseline
Description Outcome Related to intervention?
…
Received Intervention Received Usual care
Total number of events
LUTS-related hospital admission; n
LUTS-related urinary tract infection; n
Urinary retention; n
Prostatitis; n
Number of patients having at least one event
LUTS-related hospital admission; n(%)
LUTS-related urinary tract infection; n(%)
Urinary retention; n(%)
STATISTICAL ANALYSIS PLAN TRIUMPH
Version 1 44 31 July 2020
10. REFERENCES
1. Griffin T, Peters TJ, Sharp D, Salisbury C, Purdy S. Validation of an improved area-based method of calculating general practice-level deprivation. J Clin Epidemiol. 2010;63(7):746-51. 2. Barry MJ, Cantor A, Roehrborn CG, Group CS. Relationships among participant international prostate symptom score, benign prostatic hyperplasia impact index changes and global ratings of change in a trial of phytotherapy in men with lower urinary tract symptoms. J Urol. 2013;189(3):987-92. 3. Bailey K, Abrams P, Blair PS, Chapple C, Glazener C, Horwood J, et al. Urodynamics for Prostate Surgery Trial; Randomised Evaluation of Assessment Methods (UPSTREAM) for diagnosis and management of bladder outlet obstruction in men: study protocol for a randomised controlled trial. Trials. 2015;16:567. 4. Campbell MK, Fayers PM, Grimshaw JM. Determinants of the intracluster correlation coefficient in cluster randomized trials: the case of implementation research. Clin Trials. 2005;2(2):99-107. 5. van Hout B, Janssen MF, Feng YS, Kohlmann T, Busschbach J, Golicki D, et al. Interim scoring for the EQ-5D- 5L: mapping the EQ-5D-5L to EQ-5D-3L value sets. Value Health. 2012;15(5):708-15. 6. Jiang YH, Lin VC, Liao CH, Kuo HC. International Prostatic Symptom Score-voiding/storage subscore ratio in association with total prostatic volume and maximum flow rate is diagnostic of bladder outlet-related lower urinary tract dysfunction in men with lower urinary tract symptoms. PLoS One. 2013;8(3):e59176. 7. Ito H, Young GJ, Lewis AL, Blair PS, Cotterill N, Lane JA, et al. Grading Severity and Bother Using the IPSS and ICIQ-MLUTS Scores in Men Seeking Lower Urinary Tract Symptoms Therapy. J Urol. 2020:101097JU0000000000001149.