Machines Secondary analysis Oct 2012. 1 Contents Overview of approach Part 1: key findings Part 2:...
23
Machines Secondary analysis Oct 2012
-
Upload
jonah-peters -
Category
Documents
-
view
220 -
download
0
Transcript of Machines Secondary analysis Oct 2012. 1 Contents Overview of approach Part 1: key findings Part 2:...

Machines Secondary analysis
Oct 2012

2
ContentsOverview of approachPart 1: key findingsPart 2: key findingsDiscussionNext steps

3
Overview of project design
Aim to fully explore BGPS data in relation to machine
players
Iterative and exploratory analysis – meeting in August to
discuss key findings
Some further changes due to limitations of what is possible
Findings presented in two parts:
Part 1 – changes over time
Part 2 – In-depth profile of machine player sub-types
using 2010 data

4
Part 1: Changes over time
0
5
10
15
20
25
1999 2007 2010
Perc
en
t
Male Female
Past year prevalence of playing slots, by survey year and sex
5
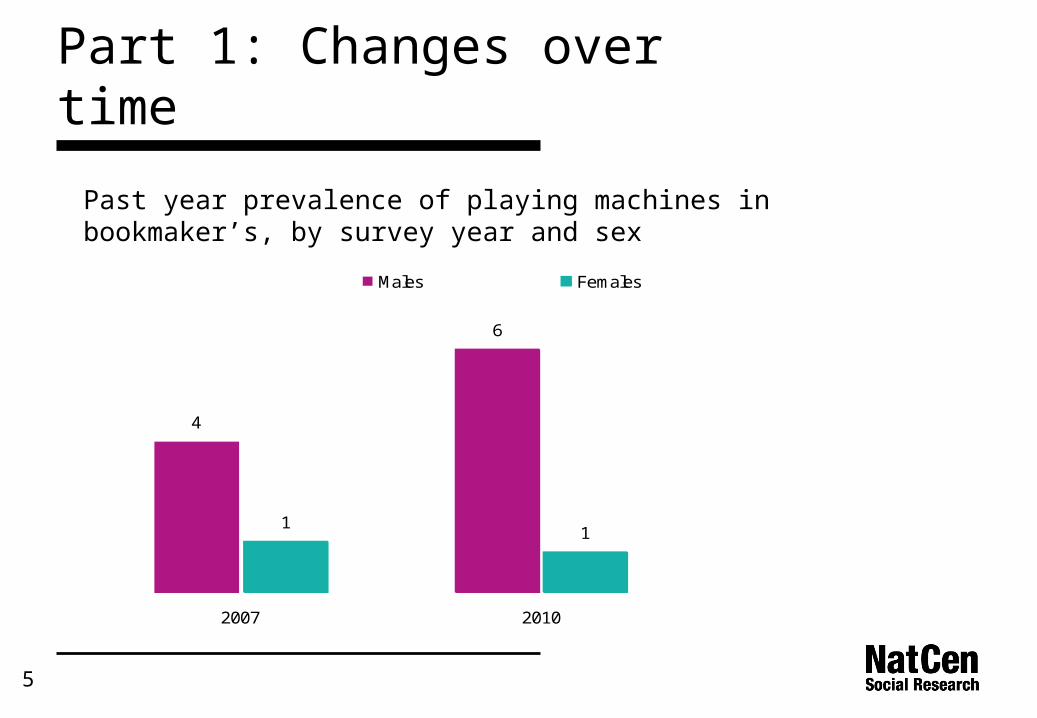
Part 1: Changes over time
Past year prevalence of playing machines in bookmaker’s, by survey year and sex
4
6
11
2007 2010
Males FemalesBase: All aged 16+

6
Part 1: Changes over time
Past year prevalence of playing machines in bookmaker’s, by survey year, age and sex
0.0
2.0
4.0
6.0
8.0
10.0
12.0
14.0
16.0
16-34 35-54 55+ 16-34 35-54 55+
2007 2010
Per
cen
t
Male FemaleBase: All respondents
0.0
2.0
4.0
6.0
8.0
10.0
12.0
14.0
16.0
16-34 35-54 55+ 16-34 35-54 55+
2007 2010
Per
cen
t
Male FemaleBase: All respondents

7
Part 1: other profile changes [slots]
Slot machine gamblers:
Age and sex profile different Decreases among those aged 16-35; increases among
those aged 35+
Some variations by marital status (likely age related)
Changes in profile by educational attainment (reflecting age changes and changing profile of education status in past decade?)
Changes in profile by income – greater % of slot machine gamblers from lower income groups. But reflective of broader changes?
Need to question how all of the above are related to policy change
8
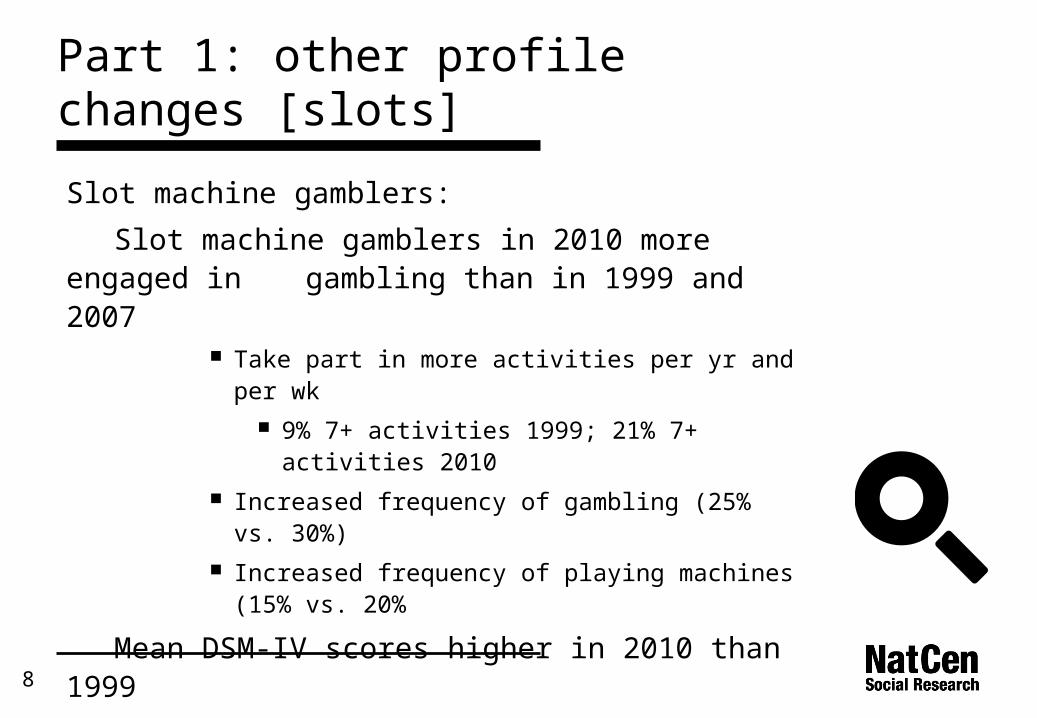
Part 1: other profile changes [slots]
Slot machine gamblers:
Slot machine gamblers in 2010 more engaged in gambling than in 1999 and 2007
Take part in more activities per yr and per wk 9% 7+ activities 1999; 21% 7+ activities
2010 Increased frequency of gambling (25% vs.
30%) Increased frequency of playing machines
(15% vs. 20%
Mean DSM-IV scores higher in 2010 than 1999
Potentially reflection of changing profile of slot machine players

9
Part 1: other profile changes [Fobts]
Fobt machine gamblers:
Increasingly male, increasingly younger
Higher levels of educational attainment
Lower income groups
BUT
Unlike slots, no evidence of any change in levels of engagement in gambling
Heavily engaged in other activities – majority take part in 7+ activities in past year & over two thirds gambler once a week or more

10
Part 2: Machine gambler sub-types
Methods Used Latent Class Analysis to identify machine gamblers sub-types Number of approaches tried to determine which method was most
robust Past year participation & Frequency Venue of play
Used standard criteria to identify the best approach Key part of the criteria is also how useful and how interpretable
resultant groups are.
11
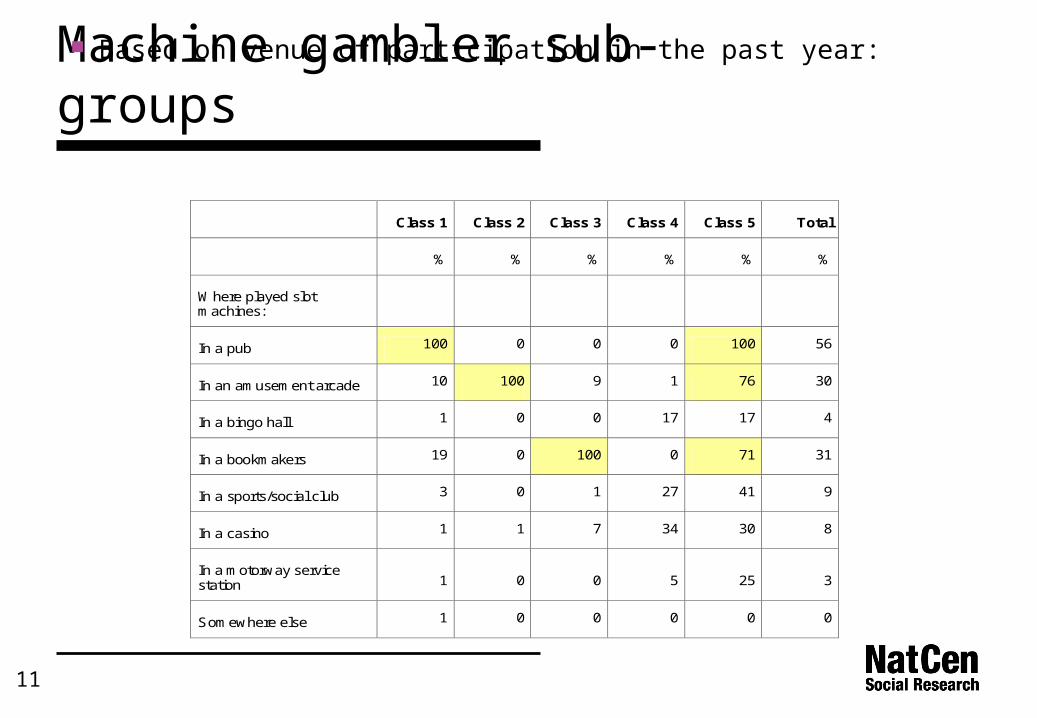
Machine gambler sub-groups
Based on venue of participation in the past year:
Class 1 Class 2 Class 3 Class 4 Class 5 Total
% % % % % %
Where played slot machines:
In a pub 100 0 0 0 100 56
In an amusement arcade 10 100 9 1 76 30
In a bingo hall 1 0 0 17 17 4
In a bookmakers 19 0 100 0 71 31
In a sports/social club 3 0 1 27 41 9
In a casino 1 1 7 34 30 8
In a motorway service station 1 0 0 5 25 3
Somewhere else 1 0 0 0 0 0

12
Machine gambler sub-groups: categorisation Class 1: Mainly Pubs (46.7%; n=483)
Class 2: Only AGCs (17.1%; n=194)
Class 3: Mainly bookmaker’s (15.2%; n=147)
Class 4: Other venues (11.3%; n=130)
Class 5: Multi-venues (9.7%; n=94)

13
Machine gambler sub-groups: categorisation Class 1: Mainly Pubs (46.7%; n=483)
Class 2: Only AGCs (17.1%; n=194)
Class 3: Mainly bookmaker’s (15.2%; n=147)
Class 4: Other venues (11.3%; n=130)
Class 5: Multi-venues (9.7%; n=94)

14
Machine gambler sub-groups: context
Mainly used regression to model membership of belonging to
each group
Need context of understanding what differentiates machines
gamblers from other gamblers first:Variables entered into model:AgeSexEthnicityMarital statusEducational qualificationsGeneral healthSmoking statusAlcohol consumption Personal IncomeNS-SEC of household reference personEconomic activity
Significant variables in model:Age (younger)Sex (men)
Educational qualifications (lower quals)
Smoking status (smokers)Alcohol consumption (heavier drinkers)
15
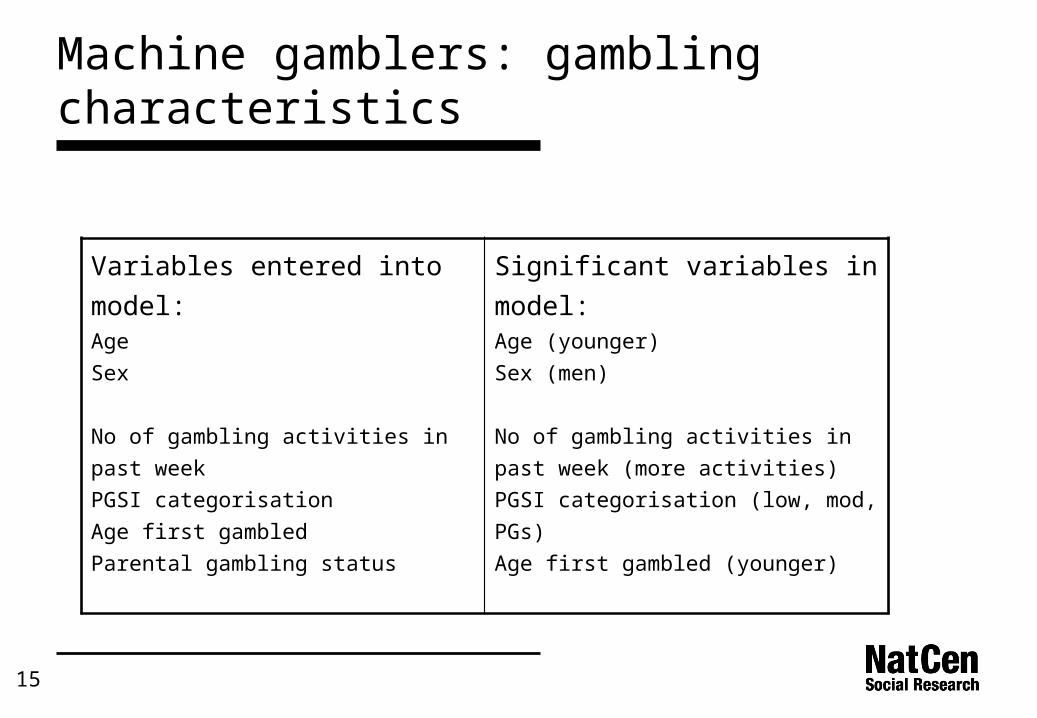
Machine gamblers: gambling characteristics
Variables entered into model:AgeSex
No of gambling activities in past weekPGSI categorisationAge first gambledParental gambling status
Significant variables in model:Age (younger)Sex (men)
No of gambling activities in past week (more activities)PGSI categorisation (low, mod, PGs)Age first gambled (younger)

16
Machine gamblers: summary
Compared with other gamblers (excl NL only):
Machine gamblers more likely to be younger,
male, to engage in other risk behaviours, to be
highly engaged in gambling generally, to have
started younger and to experience some
problems with behaviour

17
Machine gamblers sub-groups
How does this vary among our machine gambler sub-groups?
Are all machine players alike?

18
High time/high spend machine players
12
27
18
25
17
Mainly pubs Bookmaker's Other venues Multi venue All
Base: All regular machine players

19
% gamble 2+ days per week
29
18
45
26
43
31
Mainly pubs AGCs Bookmaker's Other venues Multi venue All
Base: All machine players

20
Regression 1: socio-demographics
Pubs AGCs Bookies Other Multi
Age Sex Ethnicity Marital status
Educational qualifications
General health
Smoking Alcohol Income Economic activity NS-SEC of household reference person
21
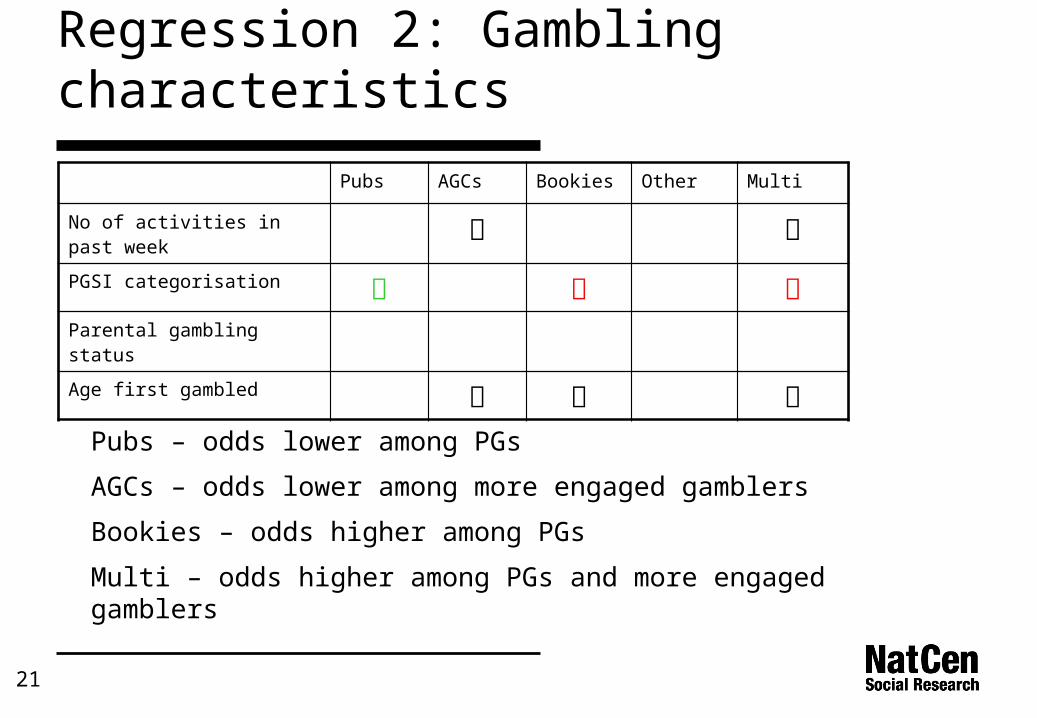
Regression 2: Gambling characteristics
Pubs AGCs Bookies Other Multi
No of activities in past week
PGSI categorisation Parental gambling status
Age first gambled
Pubs – odds lower among PGs
AGCs – odds lower among more engaged gamblers
Bookies – odds higher among PGs
Multi – odds higher among PGs and more engaged gamblers

22
Discussion
What are most salient findings from GC perspective?
How do we refer to B2/Fobt players?
What implications for stakeholders – how do we manage this?
Need to fully quality assure statistics (double verification and checking process)

23
Next steps
• Agree timescale for production of final report
• Agree publication strategy
• Agree stakeholder management and impact strategy