Machine Learning FabSpace March 2018 - irit.fr Learning FabSpace March 2018... · Machine Learning...
17
MACHINE LEARNING [email protected] https://www.irit.fr/~Josiane.Mothe/welcome_a.html Introduction 2 • If you use or reuse this document or part of it; you need to give the credit to « J. Mothe (2018) » or « J. Mothe (2018) Introduction to Machine Learning in FabSpace Bootcamp » • Objectives: • What machine learning covers? • Basics in machine learning • Plan • Introduction • Data representation for ML • ML approaches • Applications • Books and MOOCs Your turn ! I. INTRODUCTION Machine Learning 4 • What does Machine Learning cover ? • What is it linked to?
Transcript of Machine Learning FabSpace March 2018 - irit.fr Learning FabSpace March 2018... · Machine Learning...
MACHINE [email protected]
https://www.irit.fr/~Josiane.Mothe/welcome_a.html
Introduction
2
• If you use or reuse this document or part of it; you need to give the creditto « J. Mothe (2018) » or « J. Mothe (2018) Introduction to Machine Learning in FabSpaceBootcamp »
• Objectives:• What machine learning covers?
• Basics in machine learning
• Plan• Introduction
• Data representation for ML
• ML approaches
• Applications
• Books and MOOCsYour turn !
I. INTRODUCTION
Machine Learning
4
• What does Machine Learning cover ?
• What is it linked to?

Machine Learning
5
Machine Learning
• Supervised : Train / test
• Predictive analysis
Machine Learning
6
Machine Learning
Data Mining• Supervised : Train / test
• Predictive analysis• Un-supervised
• Descriptive analysis
Machine Learning
7
Machine Learning
Data Mining
Visualisation
• Supervised : Train / test
• Predictive analysis• Un-supervised
• Descriptive analysis• Interpretation• Graphs
• Synthetic views
Machine Learning
8
Machine Learning
Data Mining
Visualisation
Data representation
• Data features
• Matrices
• Supervised : Train / test
• Predictive analysis• Un-supervised
• Descriptive analysis• Interpretation• Graphs
• Synthetic views

Machine Learning
9
• Volume
• Variety
• Velocity
• Veracity
Big Data
Machine Learning
Data Mining
Visualisation
Data representation
• Data features
• Matrices
• Supervised : Train / test
• Predictive analysis• Un-supervised
• Descriptive analysis• Interpretation• Graphs
• Synthetic views
Machine Learning• Is part of a more general process
DataBig data
Information extraction
Model extraction
Data representation Data miningMachine learning
Data visualisationInterpretationResults
Machine Learning• Machine learning designs and studies algorithms that can
learn from data and make predictions on data
Machine Learning
Training / Learning
• Annotated data : Examplesfor which we know the decision
Testing / Predicting
• Non-annotated data :for which we want the decision
SUN
BALLON
?

Machine Learning
Training / Learning
• Annotated data : Examplesfor which we know the decision
Testing / Predicting
• Non-annotated data :for which we want the decision
Ind Weight Height Hair Class
I1 20 1.12 Blond Child
I2 75 1.80 Brown Adult
I3 80 1.74 Brown Adult
I4 18 0.80 Brown Child
Ind Weight Height Hair Class
I8 15 0.87 Blond ?
Machine Learning
Training / Learning
• Annotated data : Examplesfor which we know the decision
Testing / Predicting
• Non-annotated data :for which we want the decision
X
YX=5Y=?
II. DATA REPRESENTATION
FOR MACHINE LEARNING
Data representation
• Indexing
• Information Extraction
• Individuals / Features - Variables
• Matrices or Vectors
• Quality• Cleaning, sampling, completeness
Data representation• Depends on the data type
• Text – non structured• Indexing = term extraction
• Vectors
• Images• Histograms of colors
• CNN
• Structured data• Vectors: characteristics of each individuals
• Matrices
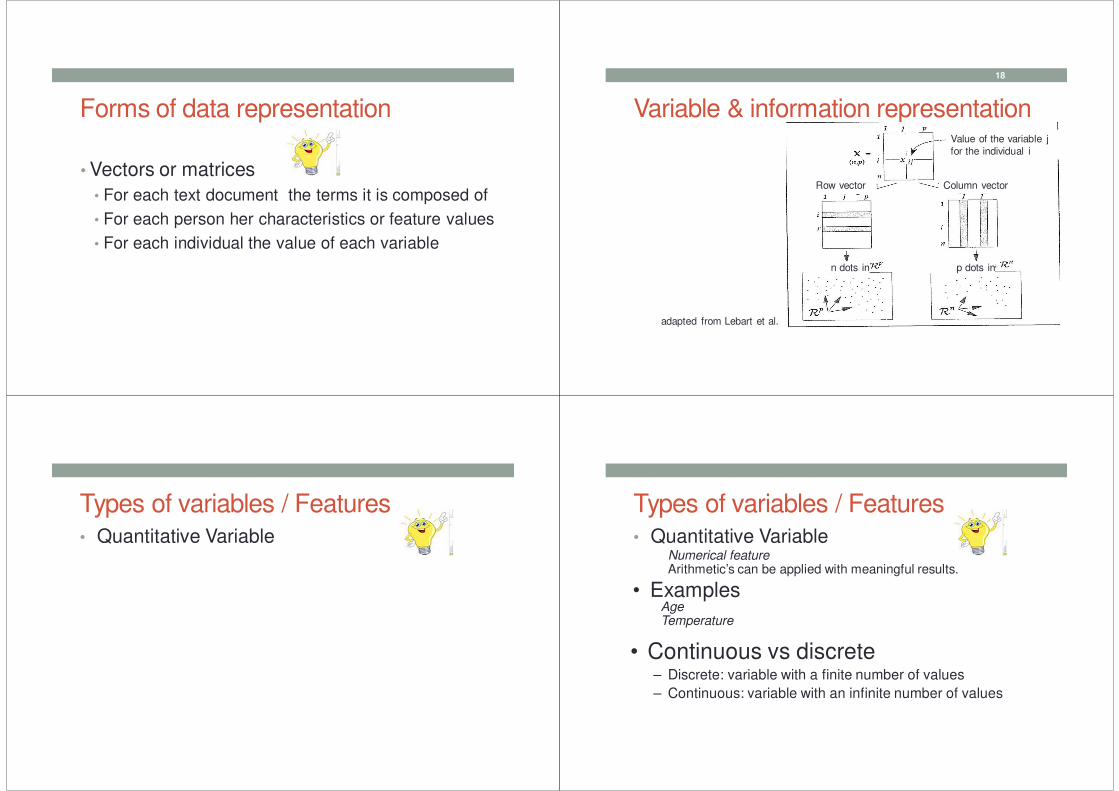
Forms of data representation
• Vectors or matrices
• For each text document the terms it is composed of
• For each person her characteristics or feature values
• For each individual the value of each variable
Variable & information representation
18
Value of the variable j
for the individual i
Column vectorRow vector
n dots in p dots in
adapted from Lebart et al.
Types of variables / Features• Quantitative Variable
Types of variables / Features• Quantitative Variable
• Examples
• Continuous vs discrete– Discrete: variable with a finite number of values
– Continuous: variable with an infinite number of values
Numerical featureArithmetic’s can be applied with meaningful results.
AgeTemperature
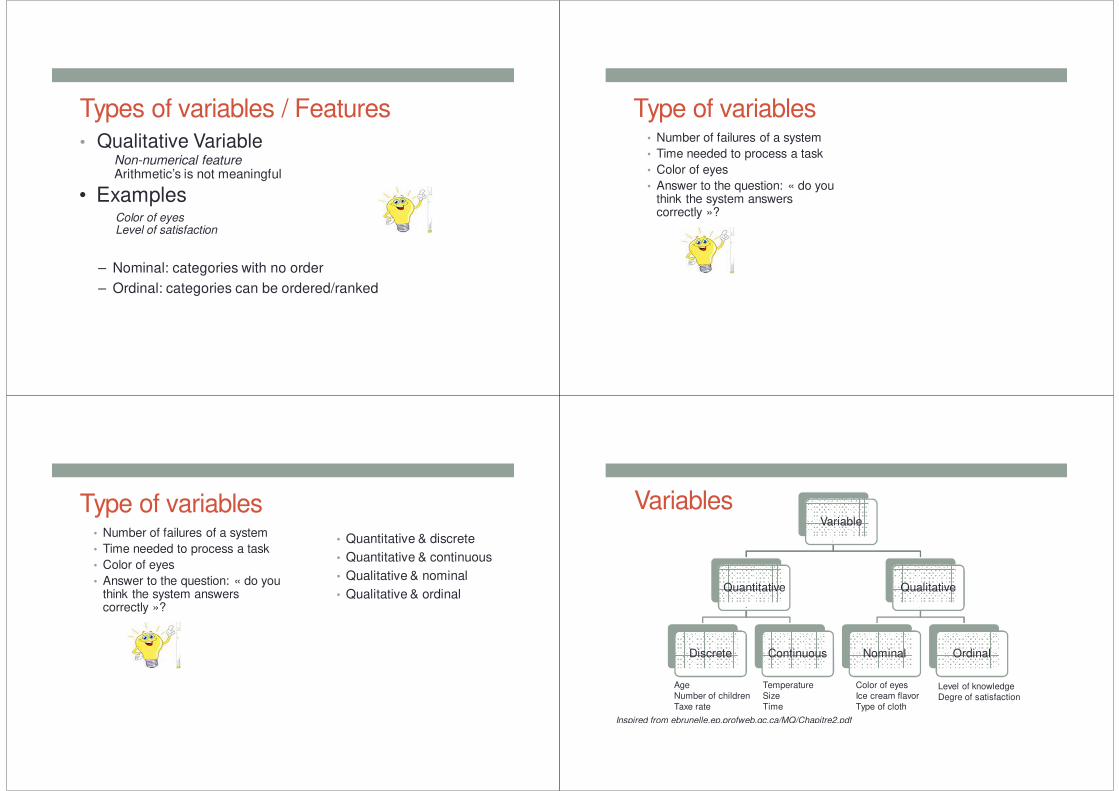
Types of variables / Features• Qualitative Variable
• Examples
– Nominal: categories with no order
– Ordinal: categories can be ordered/ranked
Non-numerical featureArithmetic’s is not meaningful
Color of eyesLevel of satisfaction
Type of variables• Number of failures of a system
• Time needed to process a task
• Color of eyes
• Answer to the question: « do youthink the system answerscorrectly »?
Type of variables
• Quantitative & discrete
• Quantitative & continuous
• Qualitative & nominal
• Qualitative & ordinal
• Number of failures of a system
• Time needed to process a task
• Color of eyes
• Answer to the question: « do youthink the system answerscorrectly »?
Variables
Inspired from ebrunelle.ep.profweb.qc.ca/MQ/Chapitre2.pdf
Variable
Quantitative
Discrete Continuous
Qualitative
Nominal Ordinal
Age
Number of children
Taxe rate
Temperature
Size
Time
Color of eyes
Ice cream flavor
Type of cloth
Level of knowledge
Degre of satisfaction

III. MACHINE LEARNINGAPPROACHES
Machine learning approaches
Descriptive analysis
• Analysis of the data
• No train/test
• Extract the model from the data
Predictive analysis
• Analysis of the training set
• Extract the model
• Use the model on the test
or data for which we need
a prediction
Machine learning approaches
Descriptive analysis
• Analysis of the data
• No train/test
• Extract the model from the data
Predictive analysis
• Analysis of the training set
• Extract the model
• Use the model on the test
or data for which we need
a prediction• Once the model is extracted, it can be considered as a trained one and used for new data: the border is not that easy.
Data quality• Completeness of the training data set
• Lack of examples
SUN
BALLON
?

Data quality• Completeness of the features
• Lack of values in training or testing
Ind Weight Height Hair Class
I1 1.12 Blond Child
I2 75 1.80 Brown Adult
I3 80 1.74 Adult
I4 18 Brown Child
Ind Weight Height Hair Class
I8 1.30 Blond ?
Over-fitting
SUN
BALLON
A few supervised methods Simple/Multiple linear regression• Simple: Relationships between two continuous
(quantitative) variables
• One (simple) variable is regarded as the predictor/explanatory/independant variable
• The other variable is regarded as the response/outcome/dependent variable
• Extract the trend / relationship that may exist between the
predictor and the response
• Linear
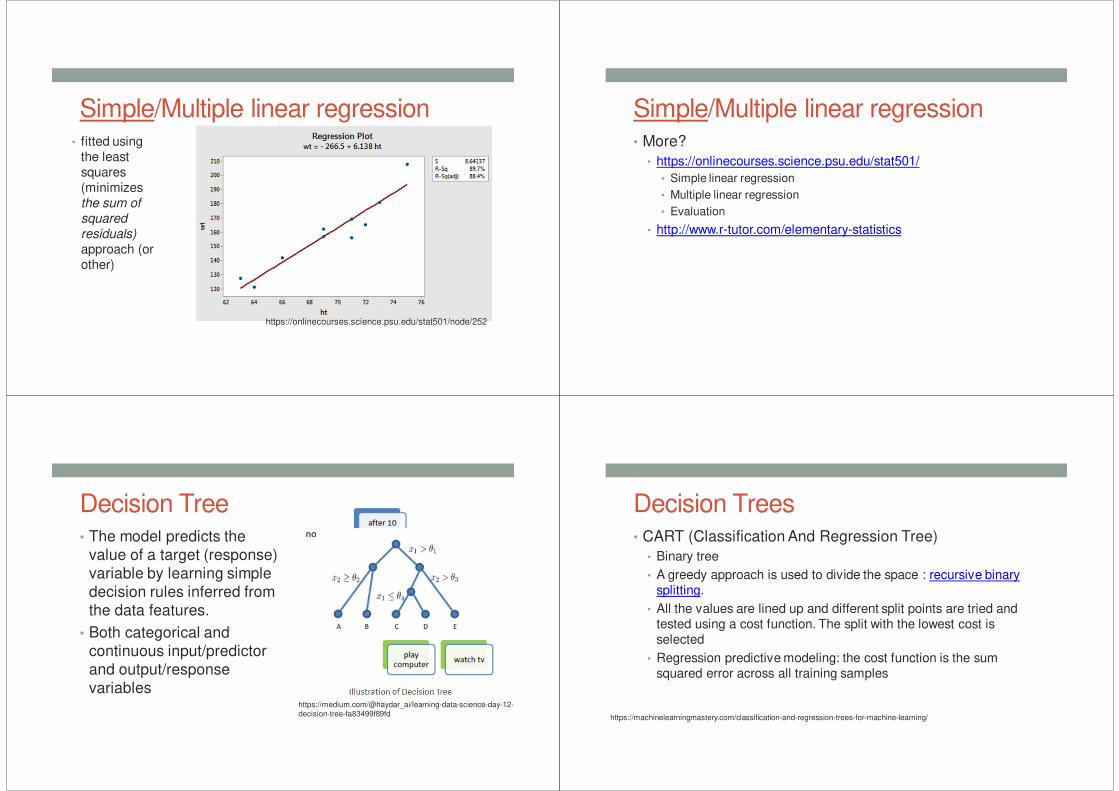
Simple/Multiple linear regression• fitted using
the least squares (minimizes the sum of squared residuals) approach (or other)
https://onlinecourses.science.psu.edu/stat501/node/252
Simple/Multiple linear regression• More?
• https://onlinecourses.science.psu.edu/stat501/
• Simple linear regression
• Multiple linear regression
• Evaluation
• http://www.r-tutor.com/elementary-statistics
Decision Tree• The model predicts the
value of a target (response)
variable by learning simple
decision rules inferred from
the data features.
• Both categorical and
continuous input/predictor
and output/response
variableshttps://medium.com/@haydar_ai/learning-data-science-day-12-
decision-tree-fa83499f89fd
Decision Trees• CART (Classification And Regression Tree)
• Binary tree
• A greedy approach is used to divide the space : recursive binary splitting.
• All the values are lined up and different split points are tried and tested using a cost function. The split with the lowest cost is selected
• Regression predictive modeling: the cost function is the sum squared error across all training samples
https://machinelearningmastery.com/classification-and-regression-trees-for-machine-learning/

Decision Tree• More?
• http://scikit-learn.org/stable/modules/tree.html
• https://machinelearningmastery.com/classification-and-
regression-trees-for-machine-learning
• https://www.analyticsvidhya.com/blog/2016/04/complete-
tutorial-tree-based-modeling-scratch-in-python/
SVM• Support Vector Machine
Binary classification (multi-classes too)
www.robots.ox.ac.uk/~az/lectures/ml/lect2.pdf
SVM
www.robots.ox.ac.uk/~az/lectures/ml/lect2.pdf
SVM• More?
• www.robots.ox.ac.uk/~az/lectures/ml/lect2.pdf (slides)
• cs229.stanford.edu/notes/cs229-notes3.pdf(textual)
• https://ocw.mit.edu/courses/electrical-engineering-and-computer-science/6-034-artificial-intelligence-fall-2010/lecture-videos/lecture-16-learning-support-vector-machines/ (video)

From NN to Deep Learning• Perceptron
• Unique neuron
• Learns the connection weights
• Using examplesInputExpected output
From NN to Deep Learning• Multi layer NN
From NN to Deep Learning• Convolutional NN
From NN to Deep Learning• Want to know more?
• Udacity (Google) https://www.udacity.com/course/deep-learning--ud730
• Coding http://course.fast.ai/
• Tensorflow library: https://www.tensorflow.org/
• Keras: https://elitedatascience.com/keras-tutorial-deep-learning-in-python

Evaluation in supervised methods• Cross validation
• A training set (to calculate the model)
• A testing set (to check the results)
• [A validation set]
• How to choose the training/testing sets?
• 80 / 20
Evaluation in supervised methods• 10-folds
cross validation
https://www.researchgate.net/figure/239386696_fig3_Fig-4-10-
fold-cross-validation-procedure
Evaluation in supervised methods• Leave-one out
http://www.nosimpler.me/machine-learning/
A few non-supervised methods

Agglomerative clustering
49
Agglomerative clustering
50
• Results in a hierarchy of
partitions
• Dendrogram or tree
that can be cut at different
levels
Aggomerative clustering• Needs a distance
51
Agglomerative clustering• Needs an aggregation criteria
52
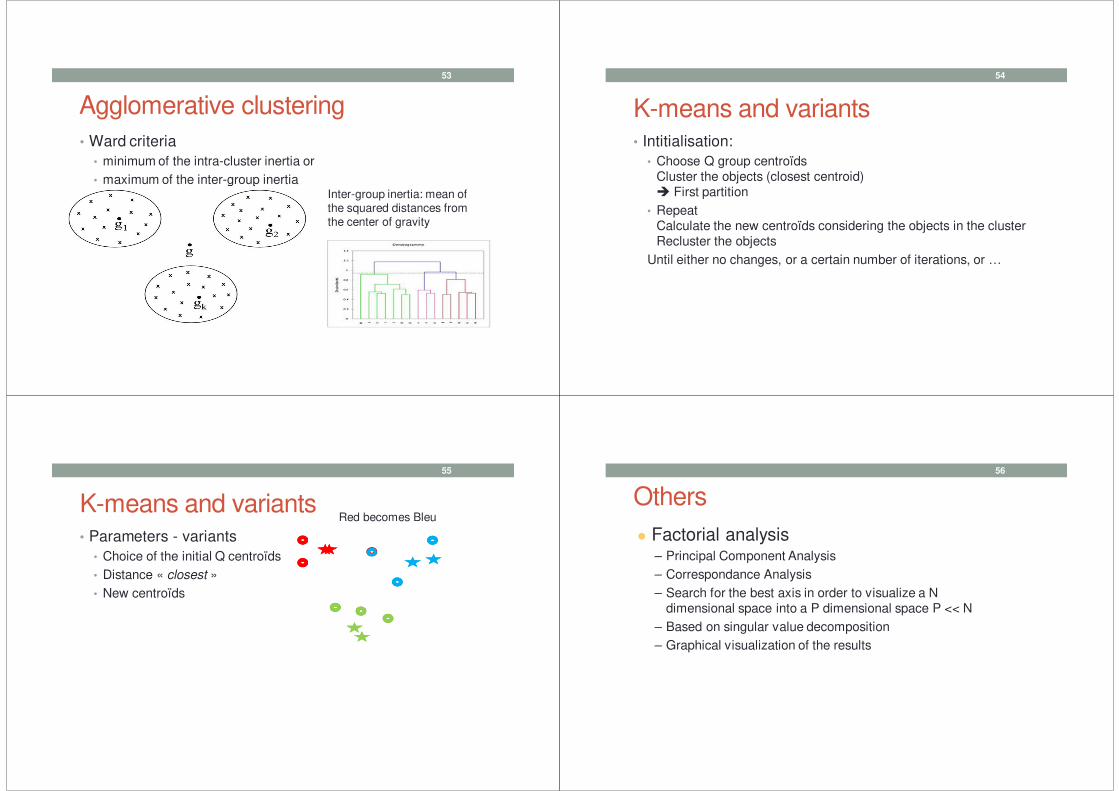
Agglomerative clustering
• Ward criteria
• minimum of the intra-cluster inertia or
• maximum of the inter-group inertia
53
Inter-group inertia: mean of the squared distances fromthe center of gravity
• Intitialisation:
• Choose Q group centroïdsCluster the objects (closest centroid) First partition
• RepeatCalculate the new centroïds considering the objects in the clusterRecluster the objects
Until either no changes, or a certain number of iterations, or …
54
K-means and variants
K-means and variants
55
• Parameters - variants
• Choice of the initial Q centroïds
• Distance « closest »
• New centroïds
Red becomes Bleu
Others
56
Factorial analysis– Principal Component Analysis
– Correspondance Analysis
– Search for the best axis in order to visualize a N dimensional space into a P dimensional space P << N
– Based on singular value decomposition
– Graphical visualization of the results

Others
57
Graph analysis IV. WANT TO KNOW MORE?MOOCs
Books
Practical works
MOOCs• Machine Learning :
http://online.stanford.edu/course/machine-learning or https://www.coursera.org/learn/machine-learning
https://www.youtube.com/watch?v=UzxYlbK2c7E
Andrew Ng, Co-founder, Coursera; Adjunct Professor, Stanford University; formerly head of Baidu AI Group/Google Brain
MOOCs• Machine Learning :
https://lagunita.stanford.edu/courses/HumanitiesSciences/StatLearning/Winter2016/about

MOOCs• Deep learning:
https://www.udacity.com/course/deep-learning--ud730
Vincent Vanhoucke, Principal Scientist at Google
Practice ML with R• https://www.datacamp.com/community/tutorials/machine-
learning-in-r (Karlijn Willems, 2015)This small tutorial is meant to introduce you to the basics of machine learning in R: it will show you how to use R to work with KNN
• https://machinelearningmastery.com/machine-learning-in-
r-step-by-step/ (Jason Brownlee, 2016)
Practice ML with Python• https://machinelearningmastery.com/machine-learning-in-
python-step-by-step/ (Jason Brownlee, 2016)
Books

Bookshttps://github.com/josephmisiti/awesome-machine-learning/blob/master/books.md