MACENIE CORE PLUS GLOBAL FIXED INCOME ETF · Alibaba Group Holding Ltd. 3.40% 12-06-2027 Callable...
24
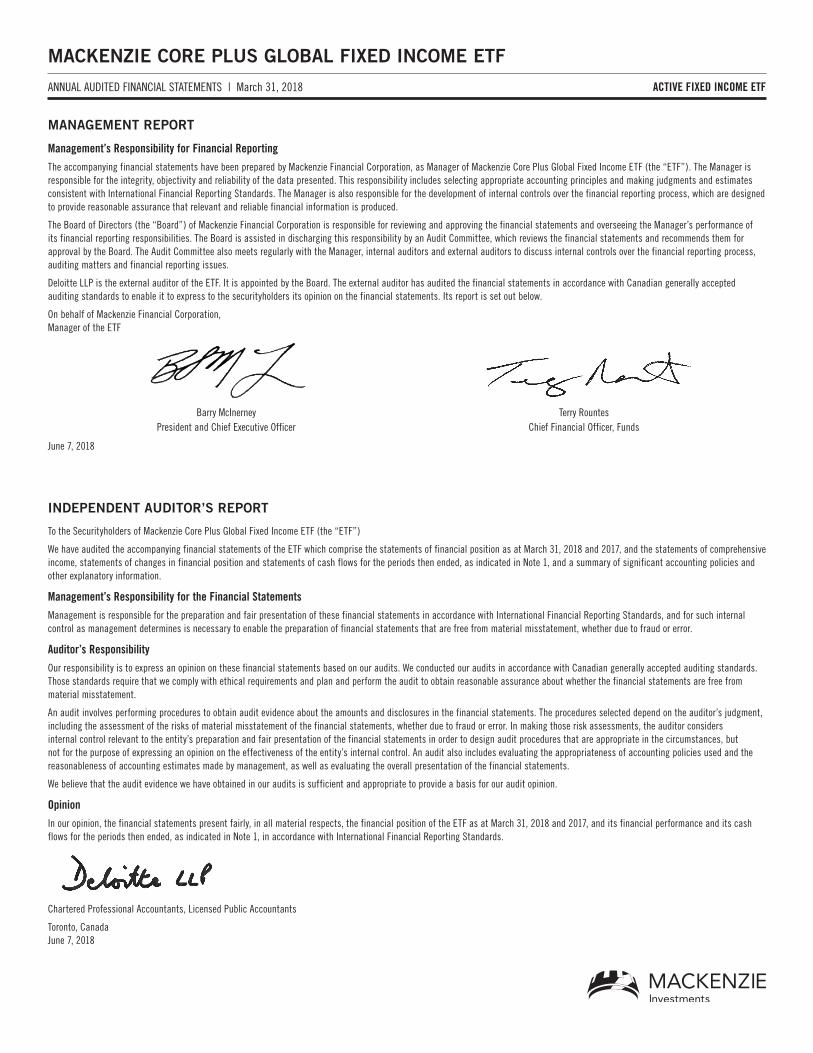
MACKENZIE CORE PLUS GLOBAL FIXED INCOME ETF ACTIVE FIXED INCOME ETF ANNUAL AUDITED FINANCIAL STATEMENTS | March 31, 2018 Management’s Responsibility for Financial Reporting The accompanying financial statements have been prepared by Mackenzie Financial Corporation, as Manager of Mackenzie Core Plus Global Fixed Income ETF (the “ETF”). The Manager is responsible for the integrity, objectivity and reliability of the data presented. This responsibility includes selecting appropriate accounting principles and making judgments and estimates consistent with International Financial Reporting Standards. The Manager is also responsible for the development of internal controls over the financial reporting process, which are designed to provide reasonable assurance that relevant and reliable financial information is produced. The Board of Directors (the “Board”) of Mackenzie Financial Corporation is responsible for reviewing and approving the financial statements and overseeing the Manager’s performance of its financial reporting responsibilities. The Board is assisted in discharging this responsibility by an Audit Committee, which reviews the financial statements and recommends them for approval by the Board. The Audit Committee also meets regularly with the Manager, internal auditors and external auditors to discuss internal controls over the financial reporting process, auditing matters and financial reporting issues. Deloitte LLP is the external auditor of the ETF. It is appointed by the Board. The external auditor has audited the financial statements in accordance with Canadian generally accepted auditing standards to enable it to express to the securityholders its opinion on the financial statements. Its report is set out below. On behalf of Mackenzie Financial Corporation, Manager of the ETF Barry McInerney President and Chief Executive Officer Terry Rountes Chief Financial Officer, Funds June 7, 2018 MANAGEMENT REPORT INDEPENDENT AUDITOR’S REPORT To the Securityholders of Mackenzie Core Plus Global Fixed Income ETF (the “ETF”) We have audited the accompanying financial statements of the ETF which comprise the statements of financial position as at March 31, 2018 and 2017, and the statements of comprehensive income, statements of changes in financial position and statements of cash flows for the periods then ended, as indicated in Note 1, and a summary of significant accounting policies and other explanatory information. Management’s Responsibility for the Financial Statements Management is responsible for the preparation and fair presentation of these financial statements in accordance with International Financial Reporting Standards, and for such internal control as management determines is necessary to enable the preparation of financial statements that are free from material misstatement, whether due to fraud or error. Auditor’s Responsibility Our responsibility is to express an opinion on these financial statements based on our audits. We conducted our audits in accordance with Canadian generally accepted auditing standards. Those standards require that we comply with ethical requirements and plan and perform the audit to obtain reasonable assurance about whether the financial statements are free from material misstatement. An audit involves performing procedures to obtain audit evidence about the amounts and disclosures in the financial statements. The procedures selected depend on the auditor’s judgment, including the assessment of the risks of material misstatement of the financial statements, whether due to fraud or error. In making those risk assessments, the auditor considers internal control relevant to the entity’s preparation and fair presentation of the financial statements in order to design audit procedures that are appropriate in the circumstances, but not for the purpose of expressing an opinion on the effectiveness of the entity’s internal control. An audit also includes evaluating the appropriateness of accounting policies used and the reasonableness of accounting estimates made by management, as well as evaluating the overall presentation of the financial statements. We believe that the audit evidence we have obtained in our audits is sufficient and appropriate to provide a basis for our audit opinion. Opinion In our opinion, the financial statements present fairly, in all material respects, the financial position of the ETF as at March 31, 2018 and 2017, and its financial performance and its cash flows for the periods then ended, as indicated in Note 1, in accordance with International Financial Reporting Standards. Chartered Professional Accountants, Licensed Public Accountants Toronto, Canada June 7, 2018
Transcript of MACENIE CORE PLUS GLOBAL FIXED INCOME ETF · Alibaba Group Holding Ltd. 3.40% 12-06-2027 Callable...
MACKENZIE CORE PLUS GLOBAL FIXED INCOME ETF
ACTIVE FIXED INCOME ETFANNUAL AUDITED FINANCIAL STATEMENTS | March 31, 2018
Management’s Responsibility for Financial Reporting
The accompanying financial statements have been prepared by Mackenzie Financial Corporation, as Manager of Mackenzie Core Plus Global Fixed Income ETF (the “ETF”). The Manager is responsible for the integrity, objectivity and reliability of the data presented. This responsibility includes selecting appropriate accounting principles and making judgments and estimates consistent with International Financial Reporting Standards. The Manager is also responsible for the development of internal controls over the financial reporting process, which are designed to provide reasonable assurance that relevant and reliable financial information is produced.
The Board of Directors (the “Board”) of Mackenzie Financial Corporation is responsible for reviewing and approving the financial statements and overseeing the Manager’s performance of its financial reporting responsibilities. The Board is assisted in discharging this responsibility by an Audit Committee, which reviews the financial statements and recommends them for approval by the Board. The Audit Committee also meets regularly with the Manager, internal auditors and external auditors to discuss internal controls over the financial reporting process, auditing matters and financial reporting issues.
Deloitte LLP is the external auditor of the ETF. It is appointed by the Board. The external auditor has audited the financial statements in accordance with Canadian generally accepted auditing standards to enable it to express to the securityholders its opinion on the financial statements. Its report is set out below.
On behalf of Mackenzie Financial Corporation, Manager of the ETF
Barry McInerney President and Chief Executive Officer
Terry Rountes Chief Financial Officer, Funds
June 7, 2018
MANAGEMENT REPORT
INDEPENDENT AUDITOR’S REPORT
To the Securityholders of Mackenzie Core Plus Global Fixed Income ETF (the “ETF”)
We have audited the accompanying financial statements of the ETF which comprise the statements of financial position as at March 31, 2018 and 2017, and the statements of comprehensive income, statements of changes in financial position and statements of cash flows for the periods then ended, as indicated in Note 1, and a summary of significant accounting policies and other explanatory information.
Management’s Responsibility for the Financial Statements
Management is responsible for the preparation and fair presentation of these financial statements in accordance with International Financial Reporting Standards, and for such internal control as management determines is necessary to enable the preparation of financial statements that are free from material misstatement, whether due to fraud or error.
Auditor’s Responsibility
Our responsibility is to express an opinion on these financial statements based on our audits. We conducted our audits in accordance with Canadian generally accepted auditing standards. Those standards require that we comply with ethical requirements and plan and perform the audit to obtain reasonable assurance about whether the financial statements are free from material misstatement.
An audit involves performing procedures to obtain audit evidence about the amounts and disclosures in the financial statements. The procedures selected depend on the auditor’s judgment, including the assessment of the risks of material misstatement of the financial statements, whether due to fraud or error. In making those risk assessments, the auditor considers internal control relevant to the entity’s preparation and fair presentation of the financial statements in order to design audit procedures that are appropriate in the circumstances, but not for the purpose of expressing an opinion on the effectiveness of the entity’s internal control. An audit also includes evaluating the appropriateness of accounting policies used and the reasonableness of accounting estimates made by management, as well as evaluating the overall presentation of the financial statements.
We believe that the audit evidence we have obtained in our audits is sufficient and appropriate to provide a basis for our audit opinion.
Opinion
In our opinion, the financial statements present fairly, in all material respects, the financial position of the ETF as at March 31, 2018 and 2017, and its financial performance and its cash flows for the periods then ended, as indicated in Note 1, in accordance with International Financial Reporting Standards.
Chartered Professional Accountants, Licensed Public Accountants
Toronto, Canada June 7, 2018
MACKENZIE CORE PLUS GLOBAL FIXED INCOME ETF
ACTIVE FIXED INCOME ETFANNUAL AUDITED FINANCIAL STATEMENTS | March 31, 2018
The accompanying notes are an integral part of these financial statements.
In thousands (except per unit figures) As at March 31
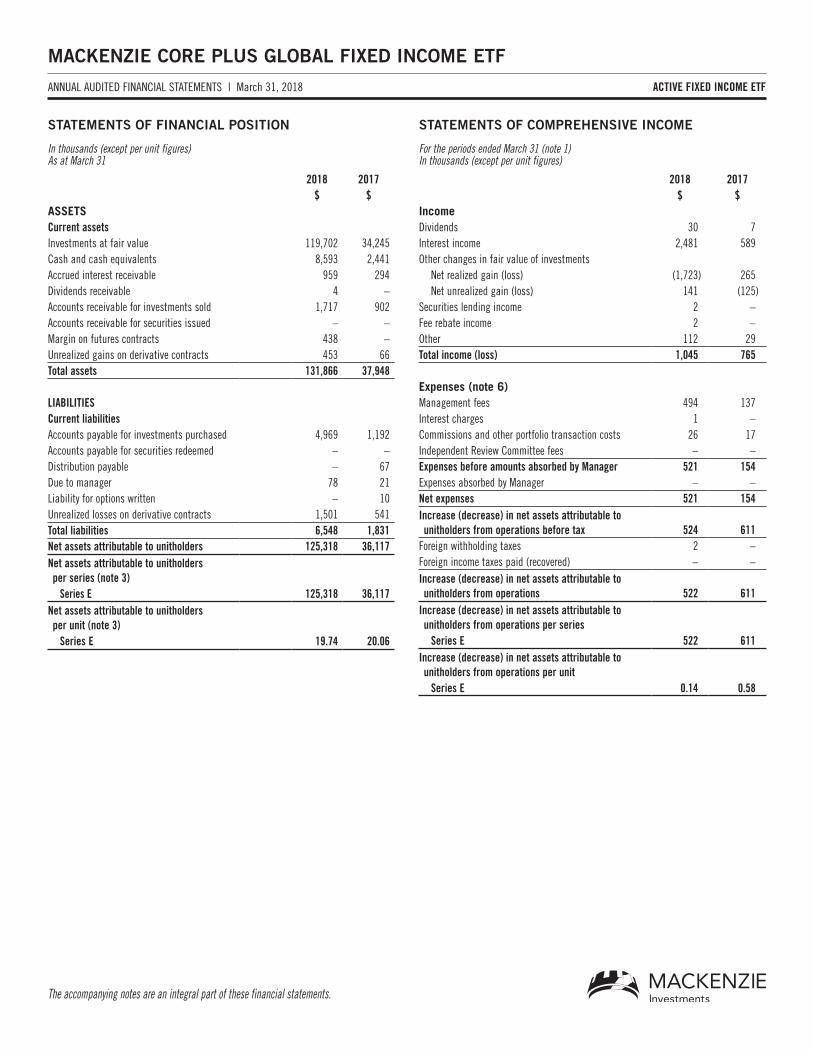
STATEMENTS OF FINANCIAL POSITION
2018 $
2017 $
ASSETSCurrent assetsInvestments at fair value 119,702 34,245 Cash and cash equivalents 8,593 2,441 Accrued interest receivable 959 294 Dividends receivable 4 –Accounts receivable for investments sold 1,717 902 Accounts receivable for securities issued – – Margin on futures contracts 438 –Unrealized gains on derivative contracts 453 66 Total assets 131,866 37,948
LIABILITIESCurrent liabilitiesAccounts payable for investments purchased 4,969 1,192 Accounts payable for securities redeemed – – Distribution payable – 67 Due to manager 78 21 Liability for options written – 10 Unrealized losses on derivative contracts 1,501 541 Total liabilities 6,548 1,831 Net assets attributable to unitholders 125,318 36,117 Net assets attributable to unitholders per series (note 3)
Series E 125,318 36,117Net assets attributable to unitholders per unit (note 3)
Series E 19.74 20.06
STATEMENTS OF COMPREHENSIVE INCOME
For the periods ended March 31 (note 1) In thousands (except per unit figures)
2018 $
2017 $
IncomeDividends 30 7 Interest income 2,481 589 Other changes in fair value of investments
Net realized gain (loss) (1,723) 265 Net unrealized gain (loss) 141 (125)
Securities lending income 2 – Fee rebate income 2 –Other 112 29 Total income (loss) 1,045 765
Expenses (note 6)Management fees 494 137 Interest charges 1 – Commissions and other portfolio transaction costs 26 17 Independent Review Committee fees – – Expenses before amounts absorbed by Manager 521 154 Expenses absorbed by Manager – – Net expenses 521 154 Increase (decrease) in net assets attributable to unitholders from operations before tax 524 611
Foreign withholding taxes 2 – Foreign income taxes paid (recovered) – – Increase (decrease) in net assets attributable to unitholders from operations 522 611
Increase (decrease) in net assets attributable to unitholders from operations per series
Series E 522 611Increase (decrease) in net assets attributable to unitholders from operations per unit
Series E 0.14 0.58

MACKENZIE CORE PLUS GLOBAL FIXED INCOME ETF
ACTIVE FIXED INCOME ETFANNUAL AUDITED FINANCIAL STATEMENTS | March 31, 2018
The accompanying notes are an integral part of these financial statements.
For the periods ended March 31 (note 1) In thousands
STATEMENTS OF CHANGES IN FINANCIAL POSITION
2018 2017 Series E
NET ASSETS ATTRIBUTABLE TO UNITHOLDERS $Beginning of period 36,117 – Increase (decrease) in net assets from operations 522 611 Distributions paid to unitholders:
Investment Income (2,098) (600)Capital gains – (53)
Total distributions paid to unitholders (2,098) (653)Unit transactions:
Proceeds from units issued 93,772 36,106 Reinvested distributions – 53 Value of units redeemed (2,995) –
Total unit transactions 90,777 36,159 Total increase (decrease) in net assets 89,201 36,117 End of period 125,318 36,117
Increase (decrease) in units (note 7): UnitsUnits outstanding – beginning of period 1,800 – Issued 4,700 1,800 Reinvested distributions – – Redeemed (150) – Units outstanding – end of period 6,350 1,800

MACKENZIE CORE PLUS GLOBAL FIXED INCOME ETF
ACTIVE FIXED INCOME ETFANNUAL AUDITED FINANCIAL STATEMENTS | March 31, 2018
The accompanying notes are an integral part of these financial statements.
STATEMENTS OF CASH FLOWS
For the periods ended March 31 (note 1) In thousands
2018 $
2017 $
Cash flows from operating activitiesNet increase (decrease) in net assets attributable to unitholders from operations 522 611
Adjustments for:Net realized loss (gain) on investments 1,723 (265)Change in net unrealized loss (gain) on investments (141) 125 Purchase of investments (159,144) (59,723)Proceeds from sale and maturity of investments 77,055 26,333
Change in accrued interest receivable (665) (294)Change in dividends receivable (4) –Change in margin on futures contracts (438) –Change in due to manager 57 21 Change in liability for options written (10) 10Net cash from operating activities (81,045) (33,182)
Cash flows from financing activitiesProceeds from redeemable securities issued 92,358 36,106 Payments on redemption of redeemable securities (2,995) – Distributions paid net of reinvestments (2,165) (533)Net cash from financing activities 87,198 35,573
Net increase (decrease) in cash and cash equivalents 6,153 2,391 Cash and cash equivalents at beginning of period 2,441 – Effect of exchange rate fluctuations on cash and cash equivalents (1) 50
Cash and cash equivalents at end of period 8,593 2,441
Cash 8,593 2,441 Cash equivalents – – Cash and cash equivalents at end of period 8,593 2,441
Supplementary disclosures on cash flow from operating activities:
Dividends received 26 7 Foreign taxes paid 3 – Interest received 1,816 295 Interest paid 1 –

MACKENZIE CORE PLUS GLOBAL FIXED INCOME ETF
ACTIVE FIXED INCOME ETFANNUAL AUDITED FINANCIAL STATEMENTS | March 31, 2018
SCHEDULE OF INVESTMENTS
As at March 31, 2018
Country Sector
Par Value/ No. of
Shares/Units
Average Cost
($ 000s)
Fair Value
($ 000s)
BONDSAIMCo Realty Investors LP 3.04% 06-01-2028 Callable 2028 Canada Corporate - Non Convertible 90,000 90 89 Algonquin Power & Utilities Corp. 4.65% 02-15-2022 Canada Corporate - Non Convertible 550,000 580 582 Alibaba Group Holding Ltd. 3.40% 12-06-2027 Callable 2027 China Corporate - Non Convertible USD 700,000 901 857 Allied Properties Real Estate Investment Trust 3.93% 11-14-2022 Canada Corporate - Non Convertible 100,000 104 102 AltaGas Ltd. 3.98% 10-04-2027 Callable 2027 Canada Corporate - Non Convertible 80,000 80 81 AltaLink LP 3.72% 12-03-2046 Callable MTN Canada Corporate - Non Convertible 1,000,000 1,029 1,037 Amneal Pharmaceuticals LLC Term loan B 1st Lien
F/R 03-23-2025 United States Term Loans USD 110,000 141 142 Anheuser-Busch InBev Finance Inc. 2.65% 02-01-2021
Callable 2021 Belgium Corporate - Non Convertible USD 1,725,000 2,230 2,206 Anheuser-Busch InBev Finance Inc. 3.30% 02-01-2023
Callable 2022 Belgium Corporate - Non Convertible USD 245,000 333 316 Anheuser-Busch InBev Finance Inc. 2.60% 05-15-2024
Callable 2024 Belgium Corporate - Non Convertible 160,000 159 156 Apple Inc. 3.00% 06-20-2027 Callable 2027 United States Corporate - Non Convertible USD 400,000 504 497 APT Pipelines Ltd. 4.20% 03-23-2025 Callable 2024 Australia Corporate - Non Convertible USD 500,000 674 653 Arch Merger Sub Inc. 8.50% 09-15-2025 Callable 2020 United States Corporate - Non Convertible USD 80,000 102 96 Argentine Bonos del Tesoro 21.20% 09-19-2018 Argentina Foreign Governments ARS 18,150,000 1,275 1,148 Asian Development Bank 6.00% 02-24-2021 Supra - National n/a INR 12,000,000 237 237 Asian Development Bank 6.45% 08-08-2021 Supra - National n/a INR 4,210,000 87 83 Asian Development Bank 5.90% 12-20-2022 Supra - National n/a INR 65,020,000 1,254 1,248 ASP AMC Merger Sub Inc. 8.00% 05-15-2025 Callable 2020 United States Corporate - Non Convertible USD 100,000 133 121 AT&T Inc. 3.825% 11-25-2020 United States Corporate - Non Convertible 500,000 517 515 ATS Consolidated Inc. Term Loan B 1st Lien F/R 02-23-2025 United States Term Loans USD 40,000 50 52 Aviva PLC 4.50% 05-10-2021 United Kingdom Corporate - Non Convertible 140,000 149 146 Bank of America Corp. F/R 02-07-2022 Callable 2021 United States Corporate - Non Convertible EUR 510,000 778 817 Bank of America Corp. 3.228% 06-22-2022 United States Corporate - Non Convertible 40,000 41 41 Bank of America Corp. F/R 03-15-2023 Callable 2022 United States Corporate - Non Convertible 110,000 110 109 Bank of Montreal 2.27% 07-11-2022 Canada Corporate - Non Convertible 170,000 170 167 Bank of Montreal 2.70% 09-11-2024 DPNT Canada Corporate - Non Convertible 30,000 30 30 Bank of Montreal 3.32% 06-01-2026 Canada Corporate - Non Convertible 350,000 361 354 Bank of Montreal F/R 12-15-2032 Callable 2027 Canada Corporate - Non Convertible USD 150,000 193 183 The Bank of Nova Scotia 2.36% 11-08-2022 Canada Corporate - Non Convertible 350,000 350 345 The Bank of Nova Scotia F/R 04-12-2066 Callable 2022 Canada Corporate - Non Convertible USD 170,000 213 207 bcIMC Realty Corp. 3.00% 03-31-2027 Callable 2026 Canada Corporate - Non Convertible 50,000 50 50 Bell Canada 3.60% 09-29-2027 Callable Canada Corporate - Non Convertible 290,000 293 293 Boardriders Inc. Term Loan B 1st Lien F/R 03-21-2024 United States Term Loans USD 140,000 177 179 Brazil Notas do Tesouro Nacional 10.00% 01-01-2027 Brazil Foreign Governments BRL 2,000,000 786 807 Brookfield Renewable Energy Partners ULC 3.63% 01-15-2027
Callable 2026 Canada Corporate - Non Convertible 500,000 495 497 Bruce Power LP 2.84% 06-23-2021 Canada Corporate - Non Convertible 400,000 414 400 Bruce Power LP 3.00% 06-21-2024 Callable 2024 Canada Corporate - Non Convertible 30,000 30 30 Bruce Power LP 3.97% 06-23-2026 Canada Corporate - Non Convertible 190,000 195 198 BWAY Holding Co. 7.25% 04-15-2025 United States Corporate - Non Convertible USD 40,000 53 53 Calpine Corp. 5.25% 06-01-2026 Callable 2021 United States Corporate - Non Convertible USD 50,000 64 62 Calpine Corp. 5.25% 06-01-2026 Callable 2021 United States Corporate - Non Convertible USD 60,000 75 75 Camelot Finance LP Term Loan 1st Lien F/R 10-03-2023 United States Term Loans USD 236,418 317 307
MACKENZIE CORE PLUS GLOBAL FIXED INCOME ETF
ACTIVE FIXED INCOME ETFANNUAL AUDITED FINANCIAL STATEMENTS | March 31, 2018
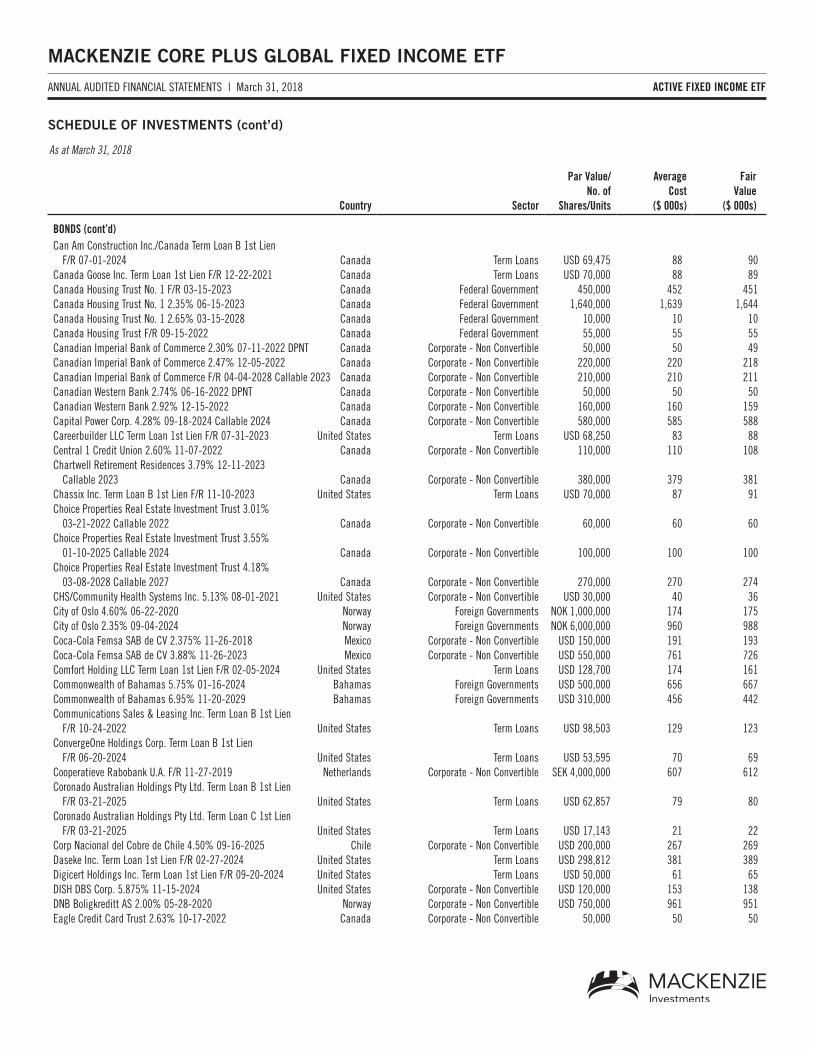
SCHEDULE OF INVESTMENTS (cont’d)
As at March 31, 2018
Country Sector
Par Value/ No. of
Shares/Units
Average Cost
($ 000s)
Fair Value
($ 000s)
BONDS (cont’d)Can Am Construction Inc./Canada Term Loan B 1st Lien
F/R 07-01-2024 Canada Term Loans USD 69,475 88 90 Canada Goose Inc. Term Loan 1st Lien F/R 12-22-2021 Canada Term Loans USD 70,000 88 89 Canada Housing Trust No. 1 F/R 03-15-2023 Canada Federal Government 450,000 452 451 Canada Housing Trust No. 1 2.35% 06-15-2023 Canada Federal Government 1,640,000 1,639 1,644 Canada Housing Trust No. 1 2.65% 03-15-2028 Canada Federal Government 10,000 10 10 Canada Housing Trust F/R 09-15-2022 Canada Federal Government 55,000 55 55 Canadian Imperial Bank of Commerce 2.30% 07-11-2022 DPNT Canada Corporate - Non Convertible 50,000 50 49 Canadian Imperial Bank of Commerce 2.47% 12-05-2022 Canada Corporate - Non Convertible 220,000 220 218 Canadian Imperial Bank of Commerce F/R 04-04-2028 Callable 2023 Canada Corporate - Non Convertible 210,000 210 211 Canadian Western Bank 2.74% 06-16-2022 DPNT Canada Corporate - Non Convertible 50,000 50 50 Canadian Western Bank 2.92% 12-15-2022 Canada Corporate - Non Convertible 160,000 160 159 Capital Power Corp. 4.28% 09-18-2024 Callable 2024 Canada Corporate - Non Convertible 580,000 585 588 Careerbuilder LLC Term Loan 1st Lien F/R 07-31-2023 United States Term Loans USD 68,250 83 88 Central 1 Credit Union 2.60% 11-07-2022 Canada Corporate - Non Convertible 110,000 110 108 Chartwell Retirement Residences 3.79% 12-11-2023
Callable 2023 Canada Corporate - Non Convertible 380,000 379 381 Chassix Inc. Term Loan B 1st Lien F/R 11-10-2023 United States Term Loans USD 70,000 87 91 Choice Properties Real Estate Investment Trust 3.01%
03-21-2022 Callable 2022 Canada Corporate - Non Convertible 60,000 60 60 Choice Properties Real Estate Investment Trust 3.55%
01-10-2025 Callable 2024 Canada Corporate - Non Convertible 100,000 100 100 Choice Properties Real Estate Investment Trust 4.18%
03-08-2028 Callable 2027 Canada Corporate - Non Convertible 270,000 270 274 CHS/Community Health Systems Inc. 5.13% 08-01-2021 United States Corporate - Non Convertible USD 30,000 40 36 City of Oslo 4.60% 06-22-2020 Norway Foreign Governments NOK 1,000,000 174 175 City of Oslo 2.35% 09-04-2024 Norway Foreign Governments NOK 6,000,000 960 988 Coca-Cola Femsa SAB de CV 2.375% 11-26-2018 Mexico Corporate - Non Convertible USD 150,000 191 193 Coca-Cola Femsa SAB de CV 3.88% 11-26-2023 Mexico Corporate - Non Convertible USD 550,000 761 726 Comfort Holding LLC Term Loan 1st Lien F/R 02-05-2024 United States Term Loans USD 128,700 174 161 Commonwealth of Bahamas 5.75% 01-16-2024 Bahamas Foreign Governments USD 500,000 656 667 Commonwealth of Bahamas 6.95% 11-20-2029 Bahamas Foreign Governments USD 310,000 456 442 Communications Sales & Leasing Inc. Term Loan B 1st Lien
F/R 10-24-2022 United States Term Loans USD 98,503 129 123 ConvergeOne Holdings Corp. Term Loan B 1st Lien
F/R 06-20-2024 United States Term Loans USD 53,595 70 69 Cooperatieve Rabobank U.A. F/R 11-27-2019 Netherlands Corporate - Non Convertible SEK 4,000,000 607 612 Coronado Australian Holdings Pty Ltd. Term Loan B 1st Lien
F/R 03-21-2025 United States Term Loans USD 62,857 79 80 Coronado Australian Holdings Pty Ltd. Term Loan C 1st Lien
F/R 03-21-2025 United States Term Loans USD 17,143 21 22 Corp Nacional del Cobre de Chile 4.50% 09-16-2025 Chile Corporate - Non Convertible USD 200,000 267 269 Daseke Inc. Term Loan 1st Lien F/R 02-27-2024 United States Term Loans USD 298,812 381 389 Digicert Holdings Inc. Term Loan 1st Lien F/R 09-20-2024 United States Term Loans USD 50,000 61 65 DISH DBS Corp. 5.875% 11-15-2024 United States Corporate - Non Convertible USD 120,000 153 138 DNB Boligkreditt AS 2.00% 05-28-2020 Norway Corporate - Non Convertible USD 750,000 961 951 Eagle Credit Card Trust 2.63% 10-17-2022 Canada Corporate - Non Convertible 50,000 50 50
MACKENZIE CORE PLUS GLOBAL FIXED INCOME ETF
ACTIVE FIXED INCOME ETFANNUAL AUDITED FINANCIAL STATEMENTS | March 31, 2018
SCHEDULE OF INVESTMENTS (cont’d)
As at March 31, 2018
Country Sector
Par Value/ No. of
Shares/Units
Average Cost
($ 000s)
Fair Value
($ 000s)
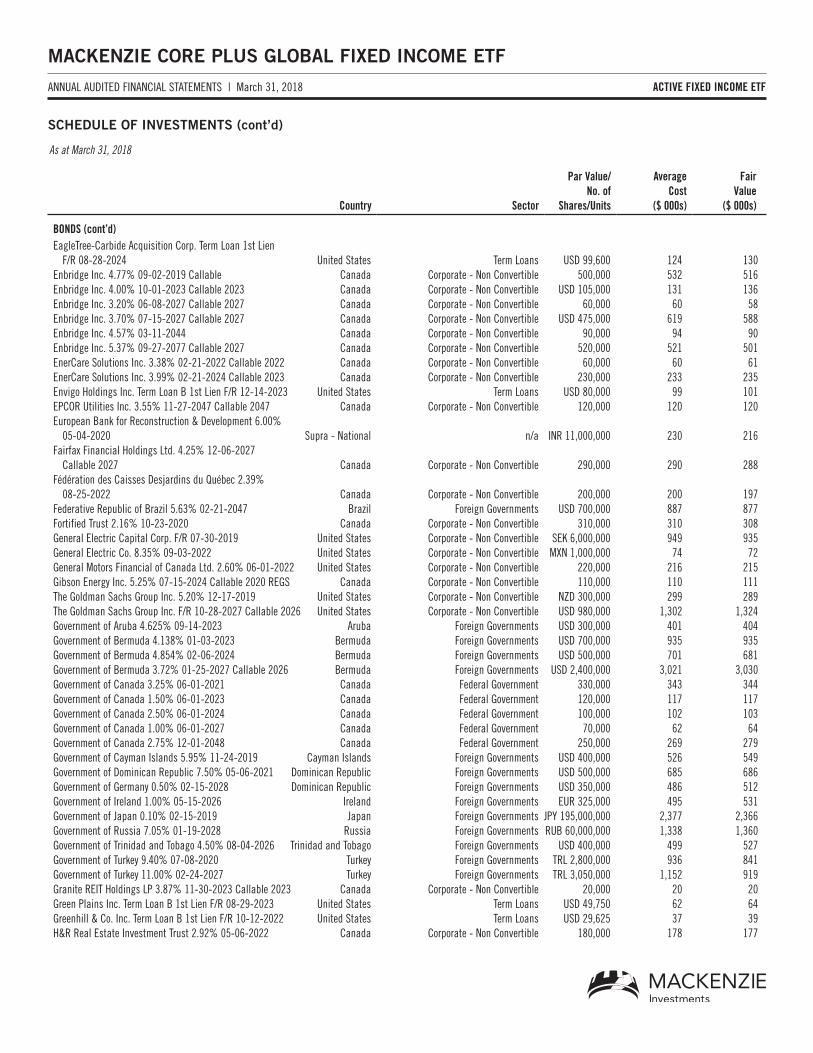
BONDS (cont’d)EagleTree-Carbide Acquisition Corp. Term Loan 1st Lien
F/R 08-28-2024 United States Term Loans USD 99,600 124 130 Enbridge Inc. 4.77% 09-02-2019 Callable Canada Corporate - Non Convertible 500,000 532 516 Enbridge Inc. 4.00% 10-01-2023 Callable 2023 Canada Corporate - Non Convertible USD 105,000 131 136 Enbridge Inc. 3.20% 06-08-2027 Callable 2027 Canada Corporate - Non Convertible 60,000 60 58 Enbridge Inc. 3.70% 07-15-2027 Callable 2027 Canada Corporate - Non Convertible USD 475,000 619 588 Enbridge Inc. 4.57% 03-11-2044 Canada Corporate - Non Convertible 90,000 94 90 Enbridge Inc. 5.37% 09-27-2077 Callable 2027 Canada Corporate - Non Convertible 520,000 521 501 EnerCare Solutions Inc. 3.38% 02-21-2022 Callable 2022 Canada Corporate - Non Convertible 60,000 60 61 EnerCare Solutions Inc. 3.99% 02-21-2024 Callable 2023 Canada Corporate - Non Convertible 230,000 233 235 Envigo Holdings Inc. Term Loan B 1st Lien F/R 12-14-2023 United States Term Loans USD 80,000 99 101 EPCOR Utilities Inc. 3.55% 11-27-2047 Callable 2047 Canada Corporate - Non Convertible 120,000 120 120 European Bank for Reconstruction & Development 6.00%
05-04-2020 Supra - National n/a INR 11,000,000 230 216 Fairfax Financial Holdings Ltd. 4.25% 12-06-2027
Callable 2027 Canada Corporate - Non Convertible 290,000 290 288 Fédération des Caisses Desjardins du Québec 2.39%
08-25-2022 Canada Corporate - Non Convertible 200,000 200 197 Federative Republic of Brazil 5.63% 02-21-2047 Brazil Foreign Governments USD 700,000 887 877 Fortified Trust 2.16% 10-23-2020 Canada Corporate - Non Convertible 310,000 310 308 General Electric Capital Corp. F/R 07-30-2019 United States Corporate - Non Convertible SEK 6,000,000 949 935 General Electric Co. 8.35% 09-03-2022 United States Corporate - Non Convertible MXN 1,000,000 74 72 General Motors Financial of Canada Ltd. 2.60% 06-01-2022 United States Corporate - Non Convertible 220,000 216 215 Gibson Energy Inc. 5.25% 07-15-2024 Callable 2020 REGS Canada Corporate - Non Convertible 110,000 110 111 The Goldman Sachs Group Inc. 5.20% 12-17-2019 United States Corporate - Non Convertible NZD 300,000 299 289 The Goldman Sachs Group Inc. F/R 10-28-2027 Callable 2026 United States Corporate - Non Convertible USD 980,000 1,302 1,324 Government of Aruba 4.625% 09-14-2023 Aruba Foreign Governments USD 300,000 401 404 Government of Bermuda 4.138% 01-03-2023 Bermuda Foreign Governments USD 700,000 935 935 Government of Bermuda 4.854% 02-06-2024 Bermuda Foreign Governments USD 500,000 701 681 Government of Bermuda 3.72% 01-25-2027 Callable 2026 Bermuda Foreign Governments USD 2,400,000 3,021 3,030 Government of Canada 3.25% 06-01-2021 Canada Federal Government 330,000 343 344 Government of Canada 1.50% 06-01-2023 Canada Federal Government 120,000 117 117 Government of Canada 2.50% 06-01-2024 Canada Federal Government 100,000 102 103 Government of Canada 1.00% 06-01-2027 Canada Federal Government 70,000 62 64 Government of Canada 2.75% 12-01-2048 Canada Federal Government 250,000 269 279 Government of Cayman Islands 5.95% 11-24-2019 Cayman Islands Foreign Governments USD 400,000 526 549 Government of Dominican Republic 7.50% 05-06-2021 Dominican Republic Foreign Governments USD 500,000 685 686 Government of Germany 0.50% 02-15-2028 Dominican Republic Foreign Governments USD 350,000 486 512 Government of Ireland 1.00% 05-15-2026 Ireland Foreign Governments EUR 325,000 495 531 Government of Japan 0.10% 02-15-2019 Japan Foreign Governments JPY 195,000,000 2,377 2,366 Government of Russia 7.05% 01-19-2028 Russia Foreign Governments RUB 60,000,000 1,338 1,360 Government of Trinidad and Tobago 4.50% 08-04-2026 Trinidad and Tobago Foreign Governments USD 400,000 499 527 Government of Turkey 9.40% 07-08-2020 Turkey Foreign Governments TRL 2,800,000 936 841 Government of Turkey 11.00% 02-24-2027 Turkey Foreign Governments TRL 3,050,000 1,152 919 Granite REIT Holdings LP 3.87% 11-30-2023 Callable 2023 Canada Corporate - Non Convertible 20,000 20 20 Green Plains Inc. Term Loan B 1st Lien F/R 08-29-2023 United States Term Loans USD 49,750 62 64 Greenhill & Co. Inc. Term Loan B 1st Lien F/R 10-12-2022 United States Term Loans USD 29,625 37 39 H&R Real Estate Investment Trust 2.92% 05-06-2022 Canada Corporate - Non Convertible 180,000 178 177
MACKENZIE CORE PLUS GLOBAL FIXED INCOME ETF
ACTIVE FIXED INCOME ETFANNUAL AUDITED FINANCIAL STATEMENTS | March 31, 2018
SCHEDULE OF INVESTMENTS (cont’d)
As at March 31, 2018
Country Sector
Par Value/ No. of
Shares/Units
Average Cost
($ 000s)
Fair Value
($ 000s)
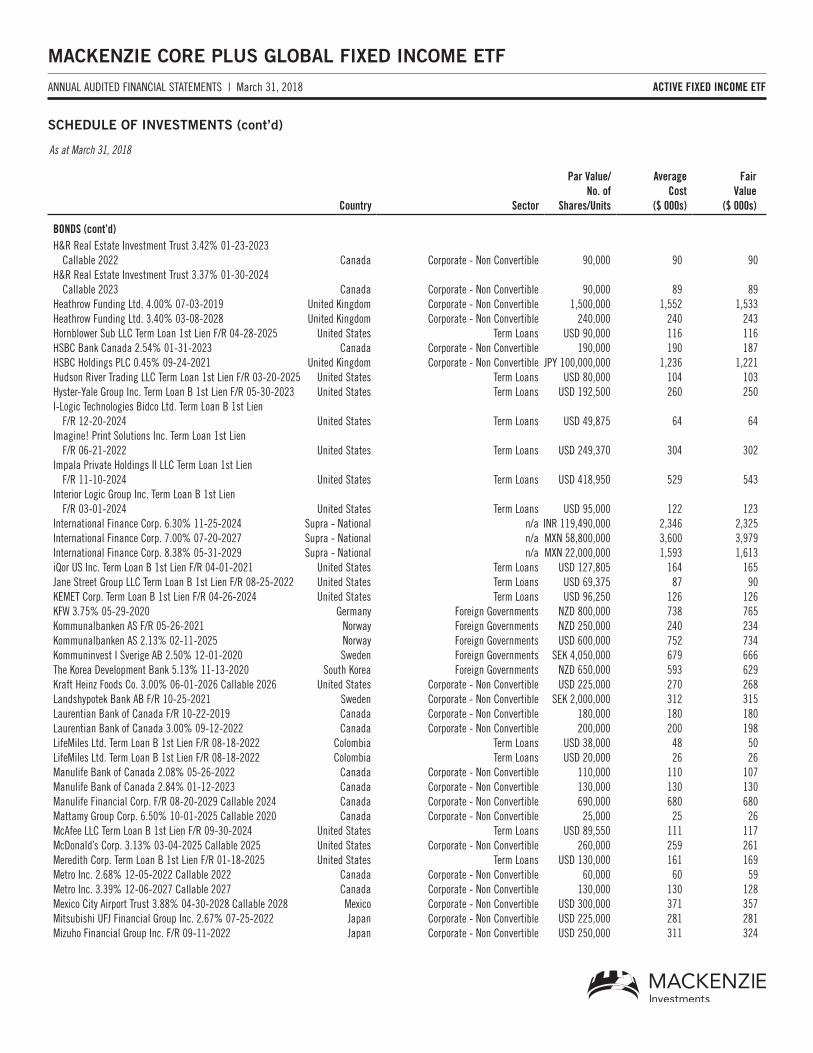
BONDS (cont’d)H&R Real Estate Investment Trust 3.42% 01-23-2023
Callable 2022 Canada Corporate - Non Convertible 90,000 90 90 H&R Real Estate Investment Trust 3.37% 01-30-2024
Callable 2023 Canada Corporate - Non Convertible 90,000 89 89 Heathrow Funding Ltd. 4.00% 07-03-2019 United Kingdom Corporate - Non Convertible 1,500,000 1,552 1,533 Heathrow Funding Ltd. 3.40% 03-08-2028 United Kingdom Corporate - Non Convertible 240,000 240 243 Hornblower Sub LLC Term Loan 1st Lien F/R 04-28-2025 United States Term Loans USD 90,000 116 116 HSBC Bank Canada 2.54% 01-31-2023 Canada Corporate - Non Convertible 190,000 190 187 HSBC Holdings PLC 0.45% 09-24-2021 United Kingdom Corporate - Non Convertible JPY 100,000,000 1,236 1,221 Hudson River Trading LLC Term Loan 1st Lien F/R 03-20-2025 United States Term Loans USD 80,000 104 103 Hyster-Yale Group Inc. Term Loan B 1st Lien F/R 05-30-2023 United States Term Loans USD 192,500 260 250 I-Logic Technologies Bidco Ltd. Term Loan B 1st Lien
F/R 12-20-2024 United States Term Loans USD 49,875 64 64 Imagine! Print Solutions Inc. Term Loan 1st Lien
F/R 06-21-2022 United States Term Loans USD 249,370 304 302 Impala Private Holdings II LLC Term Loan 1st Lien
F/R 11-10-2024 United States Term Loans USD 418,950 529 543 Interior Logic Group Inc. Term Loan B 1st Lien
F/R 03-01-2024 United States Term Loans USD 95,000 122 123 International Finance Corp. 6.30% 11-25-2024 Supra - National n/a INR 119,490,000 2,346 2,325 International Finance Corp. 7.00% 07-20-2027 Supra - National n/a MXN 58,800,000 3,600 3,979 International Finance Corp. 8.38% 05-31-2029 Supra - National n/a MXN 22,000,000 1,593 1,613 iQor US Inc. Term Loan B 1st Lien F/R 04-01-2021 United States Term Loans USD 127,805 164 165 Jane Street Group LLC Term Loan B 1st Lien F/R 08-25-2022 United States Term Loans USD 69,375 87 90 KEMET Corp. Term Loan B 1st Lien F/R 04-26-2024 United States Term Loans USD 96,250 126 126 KFW 3.75% 05-29-2020 Germany Foreign Governments NZD 800,000 738 765 Kommunalbanken AS F/R 05-26-2021 Norway Foreign Governments NZD 250,000 240 234 Kommunalbanken AS 2.13% 02-11-2025 Norway Foreign Governments USD 600,000 752 734 Kommuninvest I Sverige AB 2.50% 12-01-2020 Sweden Foreign Governments SEK 4,050,000 679 666 The Korea Development Bank 5.13% 11-13-2020 South Korea Foreign Governments NZD 650,000 593 629 Kraft Heinz Foods Co. 3.00% 06-01-2026 Callable 2026 United States Corporate - Non Convertible USD 225,000 270 268 Landshypotek Bank AB F/R 10-25-2021 Sweden Corporate - Non Convertible SEK 2,000,000 312 315 Laurentian Bank of Canada F/R 10-22-2019 Canada Corporate - Non Convertible 180,000 180 180 Laurentian Bank of Canada 3.00% 09-12-2022 Canada Corporate - Non Convertible 200,000 200 198 LifeMiles Ltd. Term Loan B 1st Lien F/R 08-18-2022 Colombia Term Loans USD 38,000 48 50 LifeMiles Ltd. Term Loan B 1st Lien F/R 08-18-2022 Colombia Term Loans USD 20,000 26 26 Manulife Bank of Canada 2.08% 05-26-2022 Canada Corporate - Non Convertible 110,000 110 107 Manulife Bank of Canada 2.84% 01-12-2023 Canada Corporate - Non Convertible 130,000 130 130 Manulife Financial Corp. F/R 08-20-2029 Callable 2024 Canada Corporate - Non Convertible 690,000 680 680 Mattamy Group Corp. 6.50% 10-01-2025 Callable 2020 Canada Corporate - Non Convertible 25,000 25 26 McAfee LLC Term Loan B 1st Lien F/R 09-30-2024 United States Term Loans USD 89,550 111 117 McDonald’s Corp. 3.13% 03-04-2025 Callable 2025 United States Corporate - Non Convertible 260,000 259 261 Meredith Corp. Term Loan B 1st Lien F/R 01-18-2025 United States Term Loans USD 130,000 161 169 Metro Inc. 2.68% 12-05-2022 Callable 2022 Canada Corporate - Non Convertible 60,000 60 59 Metro Inc. 3.39% 12-06-2027 Callable 2027 Canada Corporate - Non Convertible 130,000 130 128 Mexico City Airport Trust 3.88% 04-30-2028 Callable 2028 Mexico Corporate - Non Convertible USD 300,000 371 357 Mitsubishi UFJ Financial Group Inc. 2.67% 07-25-2022 Japan Corporate - Non Convertible USD 225,000 281 281 Mizuho Financial Group Inc. F/R 09-11-2022 Japan Corporate - Non Convertible USD 250,000 311 324
MACKENZIE CORE PLUS GLOBAL FIXED INCOME ETF
ACTIVE FIXED INCOME ETFANNUAL AUDITED FINANCIAL STATEMENTS | March 31, 2018
SCHEDULE OF INVESTMENTS (cont’d)
As at March 31, 2018
Country Sector
Par Value/ No. of
Shares/Units
Average Cost
($ 000s)
Fair Value
($ 000s)
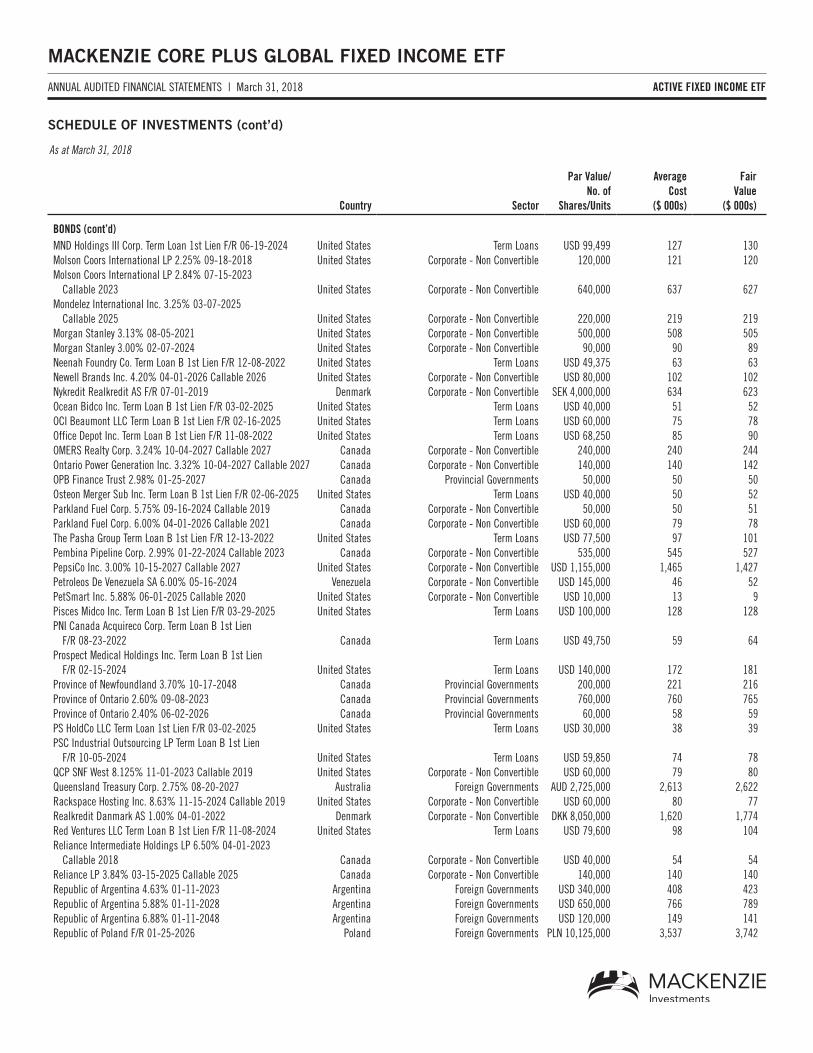
BONDS (cont’d)MND Holdings III Corp. Term Loan 1st Lien F/R 06-19-2024 United States Term Loans USD 99,499 127 130 Molson Coors International LP 2.25% 09-18-2018 United States Corporate - Non Convertible 120,000 121 120 Molson Coors International LP 2.84% 07-15-2023
Callable 2023 United States Corporate - Non Convertible 640,000 637 627 Mondelez International Inc. 3.25% 03-07-2025
Callable 2025 United States Corporate - Non Convertible 220,000 219 219 Morgan Stanley 3.13% 08-05-2021 United States Corporate - Non Convertible 500,000 508 505 Morgan Stanley 3.00% 02-07-2024 United States Corporate - Non Convertible 90,000 90 89 Neenah Foundry Co. Term Loan B 1st Lien F/R 12-08-2022 United States Term Loans USD 49,375 63 63 Newell Brands Inc. 4.20% 04-01-2026 Callable 2026 United States Corporate - Non Convertible USD 80,000 102 102 Nykredit Realkredit AS F/R 07-01-2019 Denmark Corporate - Non Convertible SEK 4,000,000 634 623 Ocean Bidco Inc. Term Loan B 1st Lien F/R 03-02-2025 United States Term Loans USD 40,000 51 52 OCI Beaumont LLC Term Loan B 1st Lien F/R 02-16-2025 United States Term Loans USD 60,000 75 78 Office Depot Inc. Term Loan B 1st Lien F/R 11-08-2022 United States Term Loans USD 68,250 85 90 OMERS Realty Corp. 3.24% 10-04-2027 Callable 2027 Canada Corporate - Non Convertible 240,000 240 244 Ontario Power Generation Inc. 3.32% 10-04-2027 Callable 2027 Canada Corporate - Non Convertible 140,000 140 142 OPB Finance Trust 2.98% 01-25-2027 Canada Provincial Governments 50,000 50 50 Osteon Merger Sub Inc. Term Loan B 1st Lien F/R 02-06-2025 United States Term Loans USD 40,000 50 52 Parkland Fuel Corp. 5.75% 09-16-2024 Callable 2019 Canada Corporate - Non Convertible 50,000 50 51 Parkland Fuel Corp. 6.00% 04-01-2026 Callable 2021 Canada Corporate - Non Convertible USD 60,000 79 78 The Pasha Group Term Loan B 1st Lien F/R 12-13-2022 United States Term Loans USD 77,500 97 101 Pembina Pipeline Corp. 2.99% 01-22-2024 Callable 2023 Canada Corporate - Non Convertible 535,000 545 527 PepsiCo Inc. 3.00% 10-15-2027 Callable 2027 United States Corporate - Non Convertible USD 1,155,000 1,465 1,427 Petroleos De Venezuela SA 6.00% 05-16-2024 Venezuela Corporate - Non Convertible USD 145,000 46 52 PetSmart Inc. 5.88% 06-01-2025 Callable 2020 United States Corporate - Non Convertible USD 10,000 13 9 Pisces Midco Inc. Term Loan B 1st Lien F/R 03-29-2025 United States Term Loans USD 100,000 128 128 PNI Canada Acquireco Corp. Term Loan B 1st Lien
F/R 08-23-2022 Canada Term Loans USD 49,750 59 64 Prospect Medical Holdings Inc. Term Loan B 1st Lien
F/R 02-15-2024 United States Term Loans USD 140,000 172 181 Province of Newfoundland 3.70% 10-17-2048 Canada Provincial Governments 200,000 221 216 Province of Ontario 2.60% 09-08-2023 Canada Provincial Governments 760,000 760 765 Province of Ontario 2.40% 06-02-2026 Canada Provincial Governments 60,000 58 59 PS HoldCo LLC Term Loan 1st Lien F/R 03-02-2025 United States Term Loans USD 30,000 38 39 PSC Industrial Outsourcing LP Term Loan B 1st Lien
F/R 10-05-2024 United States Term Loans USD 59,850 74 78 QCP SNF West 8.125% 11-01-2023 Callable 2019 United States Corporate - Non Convertible USD 60,000 79 80 Queensland Treasury Corp. 2.75% 08-20-2027 Australia Foreign Governments AUD 2,725,000 2,613 2,622 Rackspace Hosting Inc. 8.63% 11-15-2024 Callable 2019 United States Corporate - Non Convertible USD 60,000 80 77 Realkredit Danmark AS 1.00% 04-01-2022 Denmark Corporate - Non Convertible DKK 8,050,000 1,620 1,774 Red Ventures LLC Term Loan B 1st Lien F/R 11-08-2024 United States Term Loans USD 79,600 98 104 Reliance Intermediate Holdings LP 6.50% 04-01-2023
Callable 2018 Canada Corporate - Non Convertible USD 40,000 54 54 Reliance LP 3.84% 03-15-2025 Callable 2025 Canada Corporate - Non Convertible 140,000 140 140 Republic of Argentina 4.63% 01-11-2023 Argentina Foreign Governments USD 340,000 408 423 Republic of Argentina 5.88% 01-11-2028 Argentina Foreign Governments USD 650,000 766 789 Republic of Argentina 6.88% 01-11-2048 Argentina Foreign Governments USD 120,000 149 141 Republic of Poland F/R 01-25-2026 Poland Foreign Governments PLN 10,125,000 3,537 3,742

MACKENZIE CORE PLUS GLOBAL FIXED INCOME ETF
ACTIVE FIXED INCOME ETFANNUAL AUDITED FINANCIAL STATEMENTS | March 31, 2018
SCHEDULE OF INVESTMENTS (cont’d)
As at March 31, 2018
Country Sector
Par Value/ No. of
Shares/Units
Average Cost
($ 000s)
Fair Value
($ 000s)
BONDS (cont’d)Research Now Group Inc. Term Loan 1st Lien F/R 12-20-2024 United States Term Loans USD 119,700 146 153 Rite Aid Corp. 7.70% 02-15-2027 United States Corporate - Non Convertible USD 455,000 511 497 Royal Bank of Canada 2.50% 01-19-2021 Canada Corporate - Non Convertible USD 75,000 98 95 Royal Bank of Canada 2.36% 12-05-2022 Canada Corporate - Non Convertible 120,000 120 118 Royal Bank of Canada 4.65% 01-27-2026 GMTN Canada Corporate - Non Convertible USD 40,000 57 53 Santander Consumer Bank AS F/R 03-30-2020 Norway Corporate - Non Convertible SEK 2,000,000 309 310 Sigma Bidco BV Term Loan B 1st Lien F/R 03-07-2025 Netherlands Term Loans EUR 80,000 127 126 Sigma US Corp. Term Loan B 1st Lien F/R 03-06-2025 Netherlands Term Loans USD 80,000 103 103 Skandiabanken Aktiebolag F/R 03-02-2022 Sweden Corporate - Non Convertible SEK 5,000,000 783 787 SmartCentres Real Estate Investment Trust 3.83% 12-21-2027
Callable 2027 Canada Corporate - Non Convertible 40,000 40 39 SNC-Lavalin Group Inc. 2.69% 11-24-2020 Canada Corporate - Non Convertible 40,000 40 40 SNC-Lavalin Group Inc. 3.24% 03-02-2023 Callable 2023 Canada Corporate - Non Convertible 130,000 130 131 Source Energy Services Canada LP 10.50% 12-15-2021
Callable 2018 Canada Corporate - Non Convertible 58,000 58 63 The Southern Co. 2.15% 09-01-2019 Callable 2019 United States Corporate - Non Convertible USD 800,000 1,007 1,018 Staples Inc. Term Loan 1st Lien F/R 08-15-2024 United States Term Loans USD 69,825 89 89 Stepstone Group LP Term Loan B 1st Lien F/R 03-19-2025 United States Term Loans USD 40,000 52 52 Sun Life Financial Inc. F/R 11-23-2027 Callable 2022 Canada Corporate - Non Convertible 120,000 120 119 Superior Plus LP 5.25% 02-27-2024 Callable 2020 Canada Corporate - Non Convertible 60,000 61 61 Sydney Airport Finance Co. Pty. Ltd. 3.625% 04-28-2026
Callable 2026 Australia Corporate - Non Convertible USD 215,000 281 270 Talen Energy Supply LLC 9.50% 07-15-2022 Callable 2020 United States Corporate - Non Convertible USD 130,000 152 163 Talen Energy Supply LLC 10.50% 01-15-2026 Callable 2022 United States Corporate - Non Convertible USD 30,000 37 33 Telefonica Emisiones SAU 5.597% 03-12-2020 Spain Corporate - Non Convertible GBP 100,000 205 195 TELUS Corp. 3.63% 03-01-2028 Callable 2027 Canada Corporate - Non Convertible 130,000 129 131 Tenet Healthcare Corp. 6.75% 06-15-2023 United States Corporate - Non Convertible USD 45,000 55 57 TerraForm Power Operating LLC 5.00% 01-31-2028
Callable 2027 United States Corporate - Non Convertible USD 50,000 64 61 Teva Pharmaceutical Finance Netherlands III BV 3.15%
10-01-2026 Callable Israel Corporate - Non Convertible USD 45,000 47 47 Thomson Reuters Corp. 4.35% 09-30-2020 United States Corporate - Non Convertible 500,000 527 521 Titan Acquisition Ltd. Term Loan 1st Lien F/R 03-16-2025 United Kingdom Term Loans USD 100,000 131 129 T-Mobile USA Inc. 6.50% 01-15-2024 Callable 2019 United States Corporate - Non Convertible USD 65,000 89 88 TMX Group Ltd. 2.30% 12-11-2024 Callable 2024 Canada Corporate - Non Convertible 120,000 120 119 The Toronto-Dominion Bank F/R 07-25-2029 Callable 2024 Canada Corporate - Non Convertible 40,000 40 40 The Toronto-Dominion Bank F/R 09-15-31 Callable 2026 Canada Corporate - Non Convertible USD 100,000 131 124 Tortoise Borrower LLC Term Loan 1st Lien F/R 11-20-2024 United States Term Loans USD 200,000 255 261 TransCanada PipeLines Ltd. 3.30% 07-17-2025
Callable 2025 MTN Canada Corporate - Non Convertible 600,000 623 609 TransCanada Pipelines Ltd. 3.39% 03-15-2028 Callable 2027 Canada Corporate - Non Convertible 160,000 160 162 TransCanada Trust F/R 05-18-2077 Callable 2027 Canada Corporate - Non Convertible 120,000 120 119 Traverse Midstream Partners LLC Term Loan B 1st Lien
F/R 09-21-2024 United States Term Loans USD 20,000 25 26 Treasury Corp. of Victoria 3.00% 10-20-2028 Australia Foreign Governments AUD 2,400,000 2,394 2,367 Trico Products Corp. Term Loan 1st Lien F/R 02-02-2024 United States Term Loans USD 70,000 84 91 Uber Technologies Inc. Term Loan 1st Lien F/R 03-21-2025 United States Term Loans USD 130,000 167 168 Uber Technologies Inc. Term Loan B 1st Lien F/R 07-13-2023 United States Term Loans USD 29,401 37 38

MACKENZIE CORE PLUS GLOBAL FIXED INCOME ETF
ACTIVE FIXED INCOME ETFANNUAL AUDITED FINANCIAL STATEMENTS | March 31, 2018
SCHEDULE OF INVESTMENTS (cont’d)
As at March 31, 2018
Country Sector
Par Value/ No. of
Shares/Units
Average Cost
($ 000s)
Fair Value
($ 000s)
BONDS (cont’d)Union Gas Ltd. 3.59% 11-22-2047 Callable 2047 Canada Corporate - Non Convertible 80,000 80 80 United Kingdom Treasury 4.25% 12-07-2027 United Kingdom Foreign Governments GBP 1,225,000 2,732 2,795 United States Treasury Inflation Indexed 0.13% 01-15-2023 United States Foreign Governments USD 2,000,000 2,465 2,720 United States Treasury Inflation Indexed 2.00% 01-15-2026 United States Foreign Governments USD 1,510,000 2,113 2,682 United States Treasury Inflation Indexed 0.38% 07-15-2027 United States Foreign Governments USD 600,000 759 764 United States Treasury Inflation Indexed 0.89% 02-15-2047 United States Foreign Governments USD 2,150,000 2,634 2,825 United States Treasury 1.88% 02-28-2022 United States Foreign Governments USD 1,100,000 1,462 1,384 United States Treasury 2.13% 02-29-2024 United States Foreign Governments USD 1,100,000 1,473 1,378 United States Treasury 1.625% 02-15-2026 United States Foreign Governments USD 910,000 1,164 1,082 United States Treasury 2.25% 02-15-2027 United States Foreign Governments USD 300,000 373 372 United States Treasury 2.75% 02-15-2028 United States Foreign Governments USD 20,000 25 26 Ventas Canada Finance Ltd. 2.55% 03-15-2023 Callable 2023 United States Corporate - Non Convertible 610,000 598 597 Vistage Worldwide Inc. Term Loan 1st Lien F/R 02-01-2025 United States Term Loans USD 60,000 75 78 Wells Fargo & Co. 2.09% 04-25-2022 United States Corporate - Non Convertible 500,000 486 485 Wells Fargo & Co. 2.98% 05-19-2026 United States Corporate - Non Convertible 185,000 187 179 Werner FinCo LP Term Loan 1st Lien F/R 06-23-2024 United States Term Loans USD 300,000 383 389 YRC Worldwide Inc. Term Loan 1st Lien F/R 07-21-2022 United States Term Loans USD 49,251 61 64 Zotec Partners LLC Term Loan 1st Lien F/R 02-09-2024 United States Term Loans USD 80,000 100 103 Total bonds 111,827 112,805
EQUITIES AltaGas Ltd. Pfd. Series K Canada Energy 6,641 166 168 Brookfield Asset Management Inc. Pfd. Series 46 Canada Real Estate 4,150 106 107 Brookfield Asset Management Inc. Pfd. Series 48 Canada Real Estate 5,314 133 135 Brookfield Renewable Partners LP Pfd. Series 11 Canada Utilities 10,275 258 259 Source Energy Services Ltd. Canada Energy 540 – 3 TransAlta Corp. Pfd. Series A Canada Utilities 7,788 109 116 TransCanada Corp. Pfd. Series 15 Canada Energy 13,503 345 352 Total equities 1,117 1,140
EXCHANGE-TRADED FUNDS/NOTES Mackenzie US Investment Grade Corporate Bond
Index ETF (CAD-Hedged) Canada Exchange-Traded Funds/Notes 58,566 5,785 5,757 Total exchange-traded funds/notes 5,785 5,757
Transaction costs (2) – Total investments 118,727 119,702
Derivative instruments (see schedule of derivative instruments) (1,048)Cash and cash equivalents 8,593 Other assets less liabilities (1,929)Total net assets 125,318

MACKENZIE CORE PLUS GLOBAL FIXED INCOME ETF
ACTIVE FIXED INCOME ETFANNUAL AUDITED FINANCIAL STATEMENTS | March 31, 2018
SUMMARY OF INVESTMENT PORTFOLIO
March 31, 2018Portfolio Allocation % of NAVBonds 89.9
Bonds 90.0Short futures (0.1)
Cash and short-term investments 6.9Exchange-traded funds/notes 4.6Equities 0.9Other assets (liabilities) (2.3)
Regional Allocation % of NAVUnited States 26.4Canada 21.4Other 16.2Cash and short-term investments 6.9United Kingdom 4.8Australia 4.7Bermuda 3.7Poland 3.0Norway 2.7Japan 2.4Belgium 2.1Argentina 2.0Denmark 1.9Sweden 1.4Turkey 1.4Brazil 1.3Other assets (liabilities) (2.3)
Sector Allocation % of NAVCorporate bonds 42.7Foreign government bonds 38.0Cash and short-term investments 6.9Term loans 6.0Exchange-traded funds/notes 4.6Federal bonds 2.4Provincial bonds 0.9Energy 0.4Utilities 0.3Financials 0.2Other (0.1)Other assets (liabilities) (2.3)
March 31, 2017Portfolio Allocation % of NAVBonds 93.4
Bonds 93.3Purchased options 0.2Written options (0.0)Short futures (0.1)
Cash and short-term investments 6.8Equities 1.3Other assets (liabilities) (1.5)
Regional Allocation % of NAVUnited States 38.4Canada 9.8Mexico 8.1Other 7.8Denmark 6.8Cash and short-term investments 6.8Ireland 4.4Poland 4.0Netherlands 3.5Bahamas 2.4Brazil 1.9Belgium 1.6Bermuda 1.6France 1.5Romania 1.5Italy 1.4Other assets (liabilities) (1.5)
Sector Allocation % of NAVForeign government bonds 50.3Corporate bonds 27.3Term loans 11.9Cash and short-term investments 6.8Supra-national bonds 1.9Other 1.4Provincial bonds 1.2Energy 0.7Other assets (liabilities) (1.5)

MACKENZIE CORE PLUS GLOBAL FIXED INCOME ETF
ACTIVE FIXED INCOME ETFANNUAL AUDITED FINANCIAL STATEMENTS | March 31, 2018
SCHEDULE OF DERIVATIVE INSTRUMENTS
As at March 31, 2018
Schedule of Futures Contracts
Number of Contracts
Type of Contract
Expiration Date
Average Rate of
Contracts ($)
Notional Value*
($ 000s)
Unrealized (Losses) ($ 000s)
(12) Eurex Euro-BOBL Futures June 2018 June 7, 2018 159.43 EUR (3,033) (54)(22) 10 Year Swedish Government Bond Futures June 2018 June 14, 2018 150.81 SEK (5,119) (41)(17) CME Ultra Term United States Treasury Bond Futures June 2018 June 20, 2018 160.47 USD (3,515) (128)
Unrealized (Losses) (11,667) (223)
Total futures contracts (11,667) (223)
*Notional value represents the exposure to the underlying instruments as at March 31, 2018
Schedule of Forward Currency Contracts
Counterparty Credit Rating
Bought ($ 000s)
Sold ($ 000s)
Settlement Date
Contract Cost
($ 000s)
Current Fair Value ($ 000s)
Unrealized Gains (Losses)
($ 000s)AA 40 British pound (55) U.S. dollar Apr. 05, 2018 71 72 1 AA 866 U.S. dollar (810) Swiss franc Apr. 05, 2018 (1,116) (1,092) 24 AA 786 U.S. dollar (6,442) Swedish krona Apr. 05, 2018 (1,013) (994) 19 A 15,800 Mexican peso (1,045) Canadian dollar Apr. 06, 2018 1,045 1,119 74
AA 340 British pound (602) Canadian dollar Apr. 11, 2018 602 615 13 AA 1,937 Canadian dollar (12,300) Swedish krona Apr. 18, 2018 (1,937) (1,900) 37 A 1,000 U.S. dollar (1,258) Canadian dollar Apr. 27, 2018 1,258 1,288 30 A 1,353 Canadian dollar (1,350) Australian dollar May 09, 2018 (1,353) (1,335) 18 A 1,606 Canadian dollar (1,615) Australian dollar May 09, 2018 (1,606) (1,597) 9
AA 720 U.S. dollar (916) Canadian dollar May 11, 2018 916 927 11 AA 571 Canadian dollar (612) New zealand dollar Jun. 13, 2018 (571) (569) 2 AA 1,353 Canadian dollar (1,350) Australian dollar Jun. 20, 2018 (1,353) (1,334) 19 AA 1,817 Canadian dollar (8,390) Danish kroner Jun. 22, 2018 (1,817) (1,792) 25 AA 9,661 Canadian dollar (7,500) U.S. dollar Jun. 22, 2018 (9,661) (9,649) 12 AA 10,709 Canadian dollar (8,230) U.S. dollar Jun. 29, 2018 (10,709) (10,586) 123 AA 1,578 Canadian dollar (859) British pound Jul. 11, 2018 (1,578) (1,556) 22 AA 1,160 Canadian dollar (900) U.S. dollar Jul. 13, 2018 (1,160) (1,157) 3 AA 547 Canadian dollar (3,455) Swedish krona Jul. 18, 2018 (547) (536) 11
Unrealized Gains 453
AA 446 Australian dollar (349) U.S. dollar Apr. 05, 2018 450 441 (9)AA 32 Canadian dollar (25) U.S. dollar Apr. 05, 2018 (32) (32) –AA 417 Euro (519) U.S. dollar Apr. 05, 2018 668 661 (7)AA 8,486 Japanese yen (80) U.S. dollar Apr. 05, 2018 103 103 –AA 2,254 Norwegian krone (290) U.S. dollar Apr. 05, 2018 374 371 (3)AA 178 New zealand dollar (130) U.S. dollar Apr. 05, 2018 167 166 (1)A 2,109 Canadian dollar (32,150) Mexican peso Apr. 06, 2018 (2,109) (2,277) (168)
AA 1,911 Canadian dollar (1,131) British pound Apr. 11, 2018 (1,911) (2,045) (134)AA 2,090 Canadian dollar (1,670) U.S. dollar Apr. 13, 2018 (2,090) (2,151) (61)AA 10,887 Canadian dollar (8,700) U.S. dollar Apr. 20, 2018 (10,887) (11,205) (318)AA 2,949 Canadian dollar (2,350) U.S. dollar Apr. 20, 2018 (2,949) (3,027) (78)AA 932 Canadian dollar (597) Euro Apr. 20, 2018 (932) (947) (15)
MACKENZIE CORE PLUS GLOBAL FIXED INCOME ETF
ACTIVE FIXED INCOME ETFANNUAL AUDITED FINANCIAL STATEMENTS | March 31, 2018
SCHEDULE OF DERIVATIVE INSTRUMENTS (cont’d)
As at March 31, 2018
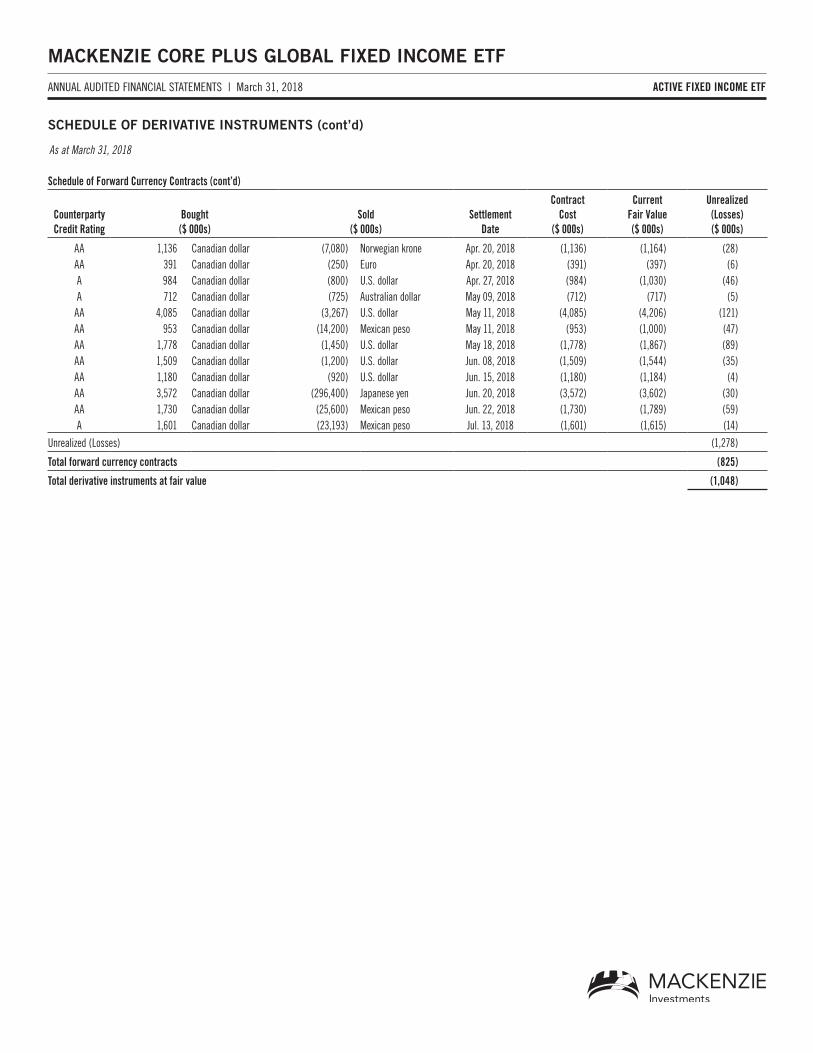
AA 1,136 Canadian dollar (7,080) Norwegian krone Apr. 20, 2018 (1,136) (1,164) (28)AA 391 Canadian dollar (250) Euro Apr. 20, 2018 (391) (397) (6)A 984 Canadian dollar (800) U.S. dollar Apr. 27, 2018 (984) (1,030) (46)A 712 Canadian dollar (725) Australian dollar May 09, 2018 (712) (717) (5)
AA 4,085 Canadian dollar (3,267) U.S. dollar May 11, 2018 (4,085) (4,206) (121)AA 953 Canadian dollar (14,200) Mexican peso May 11, 2018 (953) (1,000) (47)AA 1,778 Canadian dollar (1,450) U.S. dollar May 18, 2018 (1,778) (1,867) (89)AA 1,509 Canadian dollar (1,200) U.S. dollar Jun. 08, 2018 (1,509) (1,544) (35)AA 1,180 Canadian dollar (920) U.S. dollar Jun. 15, 2018 (1,180) (1,184) (4)AA 3,572 Canadian dollar (296,400) Japanese yen Jun. 20, 2018 (3,572) (3,602) (30)AA 1,730 Canadian dollar (25,600) Mexican peso Jun. 22, 2018 (1,730) (1,789) (59)A 1,601 Canadian dollar (23,193) Mexican peso Jul. 13, 2018 (1,601) (1,615) (14)
Unrealized (Losses) (1,278)
Total forward currency contracts (825)
Total derivative instruments at fair value (1,048)
Schedule of Forward Currency Contracts (cont’d)
Counterparty Credit Rating
Bought ($ 000s)
Sold ($ 000s)
Settlement Date
Contract Cost
($ 000s)
Current Fair Value ($ 000s)
Unrealized (Losses) ($ 000s)
MACKENZIE CORE PLUS GLOBAL FIXED INCOME ETF
ACTIVE FIXED INCOME ETFANNUAL AUDITED FINANCIAL STATEMENTS | March 31, 2018
NOTES TO FINANCIAL STATEMENTS
1. Fiscal Periods and General Information
The information provided in these financial statements and notes thereto is for the periods ended or as at March 31, 2018 and 2017, as applicable. In the year an exchange-traded fund (“the ETF”) is established, ‘period’ represents the period from inception to the period end of that fiscal year. Refer to Note 10 for the formation date of the ETF.
The ETF is organized as an open-ended mutual fund trust established under the laws of the Province of Ontario pursuant to a Declaration of Trust as amended and restated from time to time. The address of the ETF’s registered office is 180 Queen Street West, Toronto, Ontario, Canada. The ETF is authorized to issue an unlimited number of units for sale under a Prospectus. The units of the ETF are listed on the Toronto Stock Exchange/Aequitas NEO Exchange (“the Exchange”).
Mackenzie Financial Corporation (“Mackenzie”) is the manager of the ETF and is wholly owned by IGM Financial Inc., a subsidiary of Power Financial Corporation, which itself is a subsidiary of Power Corporation of Canada. Investments in companies within the Power Group of companies held by the ETF are identified in the Schedule of Investments.
2. Basis of Preparation and Presentation
These audited annual financial statements (“financial statements”) have been prepared in accordance with International Financial Reporting Standards (“IFRS”), as issued by the International Accounting Standards Board (“IASB”). A summary of the ETF’s significant accounting policies under IFRS is presented in Note 3.
These financial statements are presented in Canadian dollars, which is the ETF’s functional and presentation currency, and rounded to the nearest thousand unless otherwise indicated. These financial statements are prepared on a going concern basis using the historical cost basis, except for financial assets and liabilities that have been measured at fair value.
These financial statements were authorized for issue by the Board of Directors of Mackenzie Financial Corporation on June 7, 2018.
Standards issued but not yet effective for the current accounting year, as applicable, are described in Note 3.
3. Significant Accounting Policies
(a) Financial instruments
Financial instruments include financial assets and liabilities such as debt and equity securities, open-ended investment funds and derivatives. The ETF classifies and measures financial instruments in accordance with IFRS 9 Financial Instruments (“IFRS 9”). Upon initial recognition, financial instruments are classified as fair value through profit or loss (“FVTPL”). All financial instruments are recognized in the Statement of Financial Position when the ETF becomes a party to the contractual requirements of the instrument. Financial assets are derecognized when the right to receive cash flows from the instrument has expired or the ETF has transferred substantially all risks and rewards of ownership. Financial liabilities are derecognized when the obligation is discharged, cancelled or expires. As such, investment purchase and sale transactions are recorded as of the trade date.
Financial instruments are subsequently measured at FVTPL with changes in fair value recognized in the Statement of Comprehensive Income – Net unrealized gain (loss).
The ETF’s redeemable units are held by different types of unitholders that are entitled to different redemption rights. Unitholders may redeem units of the ETF at a redemption price per unit equal to 95% of the closing price of the units on the Exchange on the effective day of the redemption, subject to a maximum redemption price of the applicable NAV per unit. These different redemption features create equally subordinate but not identical units of the ETF which therefore meet the criteria for classification as financial liabilities under IAS 32, Financial Instruments: Presentation. The ETF’s obligation for net assets attributable to unitholders is presented at the redemption amount. Refer to Note 7 for details of subscriptions and redemptions of the ETF’s units.
IAS 7, Statement of Cash Flows, requires disclosures related to changes in liabilities and assets, such as the units of the ETF, arising from financing activities. Changes in units of the ETF, including both changes from cash flows and non-cash changes, are included in the Statement of Changes in Financial Position. Any changes in the units not settled in cash as at the end of the period are presented as either Accounts receivable for units issued or Accounts payable for units redeemed in the Statement of Financial Position. These accounts receivable and accounts payable amounts typically settle shortly after year-end.
Realized and unrealized gains and losses on investments are calculated based on the weighted average cost of investments and exclude commissions and other portfolio transaction costs, which are separately reported in the Statement of Comprehensive Income – Commissions and other portfolio transaction costs.
Gains and losses arising from changes in the fair value of the investments are included in the Statement of Comprehensive Income for the period in which they arise.
MACKENZIE CORE PLUS GLOBAL FIXED INCOME ETF
ACTIVE FIXED INCOME ETFANNUAL AUDITED FINANCIAL STATEMENTS | March 31, 2018
NOTES TO FINANCIAL STATEMENTS
3. Significant Accounting Policies (cont’d)
(a) Financial instruments (cont’d)
The ETF accounts for its holdings in unlisted open-ended investment funds and exchange-traded funds, if any, at fair value through profit and loss. Mackenzie has concluded that any unlisted open-ended investment fund and exchange-traded funds in which the ETF invests, does not meet either the definition of a structured entity or the definition of an associate.
(b) Fair value measurement
Fair value is defined as the price that would be received to sell an asset or paid to transfer a liability in an orderly transaction between market participants at the measurement date.
Investments listed on a public securities exchange or traded on an over-the-counter market are valued on the basis of the last traded market price or close price recorded by the security exchange on which the security is principally traded, where this price falls within the quoted bid-ask spread for the investment. In circumstances where this price is not within the bid-ask spread, Mackenzie determines the point within the bid-ask spread that is most representative of fair value based on the specific facts and circumstances. Mutual fund securities of an underlying fund are valued on a business day at the price calculated by the manager of such underlying fund in accordance with the constating documents of such underlying fund. Unlisted or non-exchange traded investments, or investments where a last sale or close price is unavailable or investments for which market quotations are, in Mackenzie’s opinion, inaccurate, unreliable, or not reflective of all available material information, are valued at their fair value as determined by Mackenzie using appropriate and accepted industry valuation techniques including valuation models. The fair value determined using valuation models requires the use of inputs and assumptions based on observable market data including volatility and other applicable rates or prices. In limited circumstances, the fair value may be determined using valuation techniques that are not supported by observable market data.
The cost of investments is determined on a weighted average cost basis.
Cash and cash equivalents which includes cash on deposit with financial institutions and short term investments that are readily convertible to cash, are subject to an insignificant risk of changes in value, and are used by the ETF in the management of short-term commitments. Cash and cash equivalents are reported at fair value which closely approximates their amortized cost due to their nature of being highly liquid and having short terms to maturity. Bank overdraft positions are presented under current liabilities as bank indebtedness in the Statement of Financial Position.
The ETF may use derivatives (such as written options, futures, forward contracts, swaps or customized derivatives) to hedge against losses caused by changes in securities prices, interest rates or exchange rates. The ETF may also use derivatives for non-hedging purposes in order to invest indirectly in securities or financial markets, to gain exposure to other currencies, to seek to generate additional income, and/or for any other purpose considered appropriate by the ETF’s portfolio manager(s), provided that the use of the derivative is consistent with the ETF’s investment objectives. Any use of derivatives will comply with Canadian mutual fund laws, subject to the regulatory exemptions granted to the ETF, as applicable.
Valuations of derivative instruments are carried out daily, using normal exchange reporting sources for exchange-traded derivatives and specific broker enquiry for over-the-counter derivatives.
The value of forward contracts is the gain or loss that would be realized if, on the valuation date, the positions were to be closed out. The change in value of forward contracts is included in the Statement of Comprehensive Income – Other changes in fair value of investments – Net unrealized gain (loss).
The value of futures contracts or swaps fluctuates daily, and cash settlements made daily, where applicable, by the ETF are equal to the unrealized gains or losses on a “mark to market” basis. These unrealized gains or losses are recorded and reported as such until the ETF closes out the contract or the contract expires. Margin paid or deposited in respect of futures contracts or swaps is reflected as a receivable in the Statement of Financial Position – Margin on futures contracts or swaps. Any change in the variation margin requirement is settled daily.
Premiums received from writing options are included in the Statement of Financial Position as a liability and subsequently adjusted daily to fair value. If a written option expires unexercised, the premium received is recognized as a realized gain. If a written call option is exercised, the difference between the proceeds of the sale plus the value of the premium, and the cost of the security is recognized as a realized gain or loss. If a written put option is exercised, the cost of the security acquired is the exercise price of the option less the premium received.
Refer to the Schedule of Derivative Instruments and Schedule of Options Purchased/Written, as applicable, included in the Schedule of Investments for a listing of derivative and options positions as at March 31, 2018.
(c) Income recognition
Interest income from interest bearing investments is recognized using the effective interest method. Dividends are accrued as of the ex-dividend date. Realized gains or losses on the sale of investments, including foreign exchange gains or losses on such investments, are calculated on an average cost basis. Distributions received from an underlying fund are included in interest income, dividend income or realized gains (losses) on sale of investments, as appropriate.
MACKENZIE CORE PLUS GLOBAL FIXED INCOME ETF
ACTIVE FIXED INCOME ETFANNUAL AUDITED FINANCIAL STATEMENTS | March 31, 2018
NOTES TO FINANCIAL STATEMENTS
3. Significant Accounting Policies (cont’d)
(d) Commissions and other portfolio transaction costs
Commissions and other portfolio transaction costs are costs incurred to acquire, issue or dispose of financial assets or liabilities. They include fees and commissions paid to agents, advisers, brokers and dealers. Commissions may be paid to brokerage firms which provide (or pay for) certain services, other than order execution, which may include investment research, analysis and reports, and databases or software in support of these services. Where applicable and ascertainable, the value of third-party services that were paid for by brokers during the periods is disclosed in Note 10. The value of certain proprietary services provided by brokers cannot be reasonably estimated. Mackenzie may reimburse the ETF for certain commissions and other portfolio transaction costs. Mackenzie may make these reimbursements at its discretion and stop these reimbursements at any time without notice. Any such reimbursements are included in expenses absorbed by Manager in the Statement of Comprehensive Income.
(e) Securities lending, repurchase and reverse repurchase transactions
The ETF is permitted to enter into securities lending, repurchase and reverse repurchase transactions as set out in the ETF’s Prospectus. These transactions involve the temporary exchange of securities for collateral with a commitment to redeliver the same securities on a future date. Securities lending transactions are administered by Canadian Imperial Bank of Commerce (the “Securities Lending Agent”). The value of cash or securities held as collateral must be at least 102% of the fair value of the securities loaned, sold or purchased. Income is earned from these transactions in the form of fees paid by the counterparty and, in certain circumstances, interest paid on cash or securities held as collateral. Income earned from these transactions is included in the Statement of Comprehensive Income – Securities lending income and recognized when earned.
Note 10 summarizes the details of securities loaned and collateral received, as well as a reconciliation of securities lending income, if applicable.
(f) Offsetting
Financial assets and liabilities are offset and the net amount reported in the Statement of Financial Position only when there is a legally enforceable right to offset the recognized amounts and there is an intention to settle on a net basis, or to realize the asset and settle the liability simultaneously. In the normal course of business, the ETF enters into various master netting agreements or similar agreements that do not meet the criteria for offsetting in the Statement of Financial Position but still allow for the related amounts to be set off in certain circumstances, such as bankruptcy or termination of the contracts. Note 10 summarizes the details of such offsetting, if applicable.
Income and expenses are not offset in the Statement of Comprehensive Income unless required or permitted to by an accounting standard, as specifically disclosed in the IFRS policies of the ETF.
(g) Foreign currency
The functional and presentation currency of the ETF is Canadian dollars. Foreign currency purchases and sales of investments and foreign currency dividend and interest income and expenses are translated to Canadian dollars at the rate of exchange prevailing at the time of the transactions.
Foreign exchange gains (losses) on purchases and sales of foreign currencies are included in the Statement of Comprehensive Income – Net realized gain (loss).
The fair value of investments and other assets and liabilities, denominated in foreign currencies, are translated to Canadian dollars at the rate of exchange prevailing on each business day.
(h) Net assets attributable to unitholders per unit
Net assets attributable to unitholders per unit is computed by dividing the net assets attributable to unitholders on a business day by the total number of units outstanding on that day.
(i) Net asset value per unit
The daily Net Asset Value (“NAV”) of an investment fund may be calculated without reference to IFRS as per the Canadian Securities Administrators’ (“CSA”) regulations. The difference between NAV and Net assets attributable to unitholders (as reported in the financial statements), if any, is mainly due to differences in fair value of investments and other financial assets and liabilities. Refer to Note 10 for the ETF’s NAV per unit.
(j) Increase (decrease) in net assets attributable to unitholders from operations per unit
Increase (decrease) in net assets attributable to unitholders from operations per unit in the Statement of Comprehensive Income represents the increase (decrease) in net assets attributable to unitholders from operations for the period, divided by the weighted average number of units outstanding during the period.

MACKENZIE CORE PLUS GLOBAL FIXED INCOME ETF
ACTIVE FIXED INCOME ETFANNUAL AUDITED FINANCIAL STATEMENTS | March 31, 2018
NOTES TO FINANCIAL STATEMENTS
4. Critical Accounting Estimates and Judgments
The preparation of these financial statements requires management to make estimates and assumptions that primarily affect the valuation of investments. Estimates and assumptions are reviewed on an ongoing basis. Actual results may differ from these estimates.
Use of Estimates
Fair value of securities not quoted in an active market
The ETF may hold financial instruments that are not quoted in active markets and are valued using valuation techniques that make use of observable data, to the extent practicable. Various valuation techniques are utilized, depending on a number of factors, including comparison with similar instruments for which observable market prices exist and recent arm’s length market transactions. Key inputs and assumptions used are company specific and may include estimated discount rates and expected price volatilities. Changes in key inputs, could affect the reported fair value of these financial instruments held by the ETF.
Use of Judgments
Classification and measurement of investments and application of the fair value option
In classifying and measuring financial instruments held by the ETF, Mackenzie is required to make significant judgments in order to determine the most appropriate classification in accordance with IFRS 9. Mackenzie has assessed the ETF’s business model, the manner in which all financial instruments are managed and performance evaluated as a group on a fair value basis, and concluded that FVTPL in accordance with IFRS 9 provides the most appropriate measurement and presentation of the ETF’s financial instruments.
Functional currency
The ETF’s functional and presentation currency is the Canadian dollar, which is the currency considered to best represent the economic effects of the ETF’s underlying transactions, events and conditions taking into consideration the manner in which units are issued and redeemed and how returns and performance by the ETF are measured.
Structured entities and associates
In determining whether an unlisted open-ended investment fund or an exchange-traded fund in which the ETF invests, but that it does not consolidate, meets the definitions of either a structured entity or of an associate, Mackenzie is required to make significant judgments about whether these underlying funds have the typical characteristics of a structured entity or of an associate. Mackenzie has assessed the characteristics of these underlying funds and has concluded that they do not meet the definition of either a structured entity or of an associate because the ETF does not have contracts or financing arrangements with these underlying funds and the ETF does not have an ability to influence the activities of these underlying funds or the returns it receives from investing in these underlying funds.
5. Income Taxes
The ETF qualifies as a mutual fund trust under the provisions of the Income Tax Act (Canada) and, accordingly, is subject to tax on its income including net realized capital gains in the taxation year, which is not paid or payable to its unitholders as at the end of the taxation year. It is the intention of the ETF to distribute all of its net income and sufficient net realized capital gains so that the ETF will not be subject to income taxes other than foreign withholding taxes, if applicable.
Losses of the ETF cannot be allocated to investors and are retained in the ETF for use in future years. Non-capital losses may be carried forward up to 20 years to reduce taxable income and realized capital gains of future years. Capital losses may be carried forward indefinitely to reduce future realized capital gains. Refer to Note 10 for the ETF’s loss carryforwards.
6. Management Fees and Operating Expenses
Mackenzie is paid a management fee for managing the investment portfolio, providing investment analysis and recommendations, making investment decisions and making brokerage arrangements relating to the purchase and sale of the investment portfolio. The management fee is calculated as a fixed annual percentage of the daily net asset value of the units of the ETF.
MACKENZIE CORE PLUS GLOBAL FIXED INCOME ETF
ACTIVE FIXED INCOME ETFANNUAL AUDITED FINANCIAL STATEMENTS | March 31, 2018
NOTES TO FINANCIAL STATEMENTS
6. Management Fees and Operating Expenses (cont’d)
In addition to the applicable management fee, the operating expenses payable by the ETF include interest and borrowing costs, brokerage expenses and related transaction fees, fees and expenses relating to the operation of the Mackenzie ETFs’ Independent Review Committee (IRC), fees under any derivative instrument used by the ETF, cost of complying with the regulatory requirement to produce summary documents, ETF facts or other similar disclosure documents, the costs of complying with governmental or regulatory requirements introduced after the date of the most recently filed prospectus, including, without limitation, any new fees or increases in fees, the fees related to external services that are not commonly charged in the Canadian exchange-traded fund industry after the date of the most recently filed prospectus, fees paid to external service providers associated with tax reclaims, refunds or the preparation of foreign tax reports on behalf of the ETFs, fees paid to external legal counsel and/or others in connection with corporate or other actions affecting the portfolio holdings of the ETF, and any applicable taxes, including income, withholding or other taxes and also including G.S.T. or H.S.T. on expenses.
Mackenzie may waive or absorb management fees and operating expenses at its discretion and stop waiving or absorbing such fees at any time without notice. Mackenzie may charge a reduced management fee rate with respect to investments in the ETF by large investors, including other funds managed by Mackenzie or affiliates of Mackenzie. An amount equal to the difference between the fee otherwise chargeable and the reduced fee will be distributed in cash to those unitholders by the ETF as a management fee distribution. Refer to Note 10 for the management fee rates charged to units of the ETF.
7. Units and Unit Transactions
Mackenzie, on behalf of the ETF, has entered into a designated broker agreement with one or more designated brokers pursuant to which the designated broker has agreed to perform certain duties relating to the ETF including, without limitation: (i) to subscribe for a sufficient number of units to satisfy the Exchange’s original listing requirements; (ii) to subscribe for units on an ongoing basis in connection with any rebalancing event, as applicable, and when cash redemptions of units occur; and (iii) to post a liquid two-way market for the trading of units on the Exchange. In accordance with the designated broker agreement, Mackenzie may from time to time require the designated broker to subscribe for units of the ETF for cash.
The number of units issued for subscription orders (the “Prescribed Number of Units”) is determined by Mackenzie. On any trading day, a designated broker may place a subscription or redemption order for an integral multiple of the Prescribed Number of Units of the ETF based on the NAV per unit determined on the applicable trading day. A trading day is each day on which the Exchange is opened for business.
Generally, all orders to purchase units directly from an ETF must be placed by a designated broker or a dealer. The ETF reserves the absolute right to reject any subscription order placed by a designated broker or a dealer. No fees will be payable by the ETF to a designated broker or a dealer in connection with the issuance of units. On the issuance of units, an amount may be charged to a designated broker or a dealer to offset the expenses incurred in issuing the units.
For each Prescribed Number of Units issued, a dealer must deliver payment consisting of: (i) a basket of securities and cash equal to the aggregate NAV per unit of the Prescribed Number of Units next determined following the receipt of the subscription order; (ii) cash in an amount equal to the aggregate NAV per unit of the Prescribed Number of Units next determined following the receipt of the subscription order; or (iii) a combination of securities and cash, as determined by Mackenzie, in an amount sufficient so that the value of the securities and cash received is equal to the aggregate NAV per unit of the Prescribed Number of Units next determined following the receipt of the subscription order.
8. ETF’s Capital
The capital of the ETF is comprised of the net assets attributable to unitholders. The units outstanding for the ETF as at March 31, 2018 and 2017 and units issued, reinvested and redeemed for the periods are presented in the Statement of Changes in Financial Position. Mackenzie manages the capital of the ETF in accordance with the investment objectives as discussed in Note 10.
9. Financial Instruments Risk
i. Risk exposure and management
The ETF’s investment activities expose it to a variety of financial risks, as defined in IFRS 7 Financial Instruments: Disclosures (“IFRS 7”). The ETF’s exposure to financial risks is concentrated in its investments, which are presented in the Schedule of Investments, as at March 31, 2018, grouped by asset type, with geographic and sector information.
Mackenzie seeks to minimize potential adverse effects of financial risks on the ETF’s performance by employing professional, experienced portfolio advisors, by monitoring the ETF’s positions and market events daily, by diversifying the investment portfolio within the constraints of the ETF’s investment objectives, and where applicable, by using derivatives to hedge certain risk exposures. To assist in managing risks, Mackenzie also maintains a governance structure that oversees the ETF’s investment activities and monitors compliance with the ETF’s stated investment strategy, internal guidelines, and securities regulations.
MACKENZIE CORE PLUS GLOBAL FIXED INCOME ETF
ACTIVE FIXED INCOME ETFANNUAL AUDITED FINANCIAL STATEMENTS | March 31, 2018
NOTES TO FINANCIAL STATEMENTS
9. Financial Instruments Risk (cont’d)
ii. Liquidity risk
Liquidity risk arises when the ETF encounters difficulty in meeting its financial obligations as they come due. The ETF is exposed to liquidity risk due to potential daily cash redemptions of redeemable units. In accordance with securities regulations, the ETF must maintain at least 90% of its assets in liquid investments (i.e., investments that can be readily sold). The ETF also has the ability to borrow up to 5% of its net assets for the purposes of funding redemptions and an additional 5% of its net assets for the purpose of funding distributions paid to its investors.
iii. Currency risk
Currency risk arises when the fair value of financial instruments that are denominated in a currency other than the Canadian dollar, which is the ETF’s reporting currency, fluctuates due to changes in exchange rates. Note 10 summarizes the ETF’s exposure, if applicable and significant, to currency risk.
iv. Interest rate risk
Interest rate risk arises when the fair value of interest-bearing financial instruments fluctuates due to changes in the prevailing levels of market interest rates. Cash and cash equivalents do not expose the ETF to significant amounts of interest rate risk. Note 10 summarizes the ETF’s exposure, if applicable and significant, to interest rate risk.
v. Other price risk
Other price risk is the risk that the value of financial instruments will fluctuate as a result of changes in market prices (other than those arising from interest rate risk or currency risk), whether caused by factors specific to an individual investment, its issuer, or all factors affecting all instruments traded in a market or market segment. All investments present a risk of loss of capital. This risk is managed through a careful selection of investments and other financial instruments within the parameters of the investment strategies. Except for certain derivative contracts, the maximum risk resulting from financial instruments is equivalent to their fair value. The maximum risk of loss on certain derivative contracts such as forwards, swaps, and futures contracts is equal to their notional values. In the case of written call (put) options and short futures contracts, the loss to the ETF continues to increase, without limit, as the fair value of the underlying interest increases (decreases). However, these instruments are generally used within the overall investment management process to manage the risk from the underlying investments and do not typically increase the overall risk of loss to the ETF. This risk is mitigated by ensuring that the ETF holds a combination of the underlying interest, cash cover and/or margin that is equal to or greater than the value of the derivative contract. Note 10 summarizes the ETF’s exposure, if applicable and significant, to other price risk.
vi. Credit risk
Credit risk is the risk that a counterparty to a financial instrument will fail to discharge an obligation or commitment that it has entered into with the ETF. Note 10 summarizes the ETF’s exposure, if applicable and significant, to credit risk.
All transactions in listed securities are executed with approved brokers. To minimize the possibility of settlement default, securities are exchanged for payment simultaneously, where market practices permit, through the facilities of a central depository and/or clearing agency where customary.
The carrying amount of investments and other assets represents the maximum credit risk exposure as at the date of the Statement of Financial Position.
The ETF may enter into securities lending transactions with counterparties and it may also be exposed to credit risk from the counterparties to the derivative instruments it may use. Credit risk associated with these transactions is considered minimal as all counterparties have a rating equivalent to a designated rating organization’s credit rating of not less than A-1 (low) on their short-term debt and of A on their long-term debt, as applicable.
vii. Underlying ETFs
The ETF may invest in underlying ETFs and may be indirectly exposed to currency risk, interest rate risk, other price risk and credit risk from fluctuations in the value of financial instruments held by the underlying ETFs. Note 10 summarizes the ETF’s exposure, if applicable and significant, to these risks from underlying ETF.

MACKENZIE CORE PLUS GLOBAL FIXED INCOME ETF
ACTIVE FIXED INCOME ETFANNUAL AUDITED FINANCIAL STATEMENTS | March 31, 2018
NOTES TO FINANCIAL STATEMENTS
(a) ETF Formation and Series Information
Date of Formation April 1, 2016
The ETF may issue an unlimited number of units. The number of issued and outstanding units is disclosed in the Statements of Changes in Financial Position.
Series E units were listed on the TSX under the symbol MGB on April 19, 2016. The closing market price, or the midpoint of the bid and ask prices in the absence of a closing market price, at March 31, 2018 was $19.75 (2017 – $20.06).
The management fee rate for Series E units is 0.60%.
As at March 31, 2018 and 2017, the ETF’s NAV per unit was $19.75 (2017 – $20.06) and its Net Assets per unit calculated in accordance with IFRS was $19.74 (2017 – $20.06).
(b) Loss Carryforwards
As at the last taxation year-end, there were no capital and non-capital losses available to carry forward for tax purposes.
(c) Securities Lending
The value of securities loaned and collateral received from securities lending at March 31, 2018 and 2017 were as follows:
March 31, 2018 March 31, 2017($) ($)
Value of securities loaned 1,433 891
Value of collateral received 1,509 937
Collateral received is comprised of debt obligations of the Government of Canada and other countries, Canadian provincial and municipal governments and financial institutions.
A reconciliation of the gross amount generated from the securities lending transactions to the security lending income to the ETF for the periods ended March 31, 2018 and 2017 is as follows:
2018 2017($) (%) ($) (%)
Gross securities lending income 3 100.0 – –
Tax withheld (1) (33.3) – –
2 66.7 – –
Payments to Securities Lending Agent – – – –
Securities lending income 2 66.7 – –
(d) Offsetting of Financial Assets and Liabilities
The table below presents financial assets and financial liabilities that are subject to master netting arrangements or other similar agreements and the net impact on the Fund’s Statements of Financial Position if all set-off rights were exercised as part of future events such as bankruptcy or termination of contracts. No amounts were offset in the financial statements.
March 31, 2018Gross amount of
assets/liabilities ($)Amount available
for offset ($) Margin ($) Net amount ($)
Unrealized gains on derivative contracts 45 (45) – –
Unrealized losses on derivative contracts (395) 45 438 88
Liability for options written – – – –
Total (350) – 438 88
10. ETF Specific Information (in ’000s, except for (a))

MACKENZIE CORE PLUS GLOBAL FIXED INCOME ETF
ACTIVE FIXED INCOME ETFANNUAL AUDITED FINANCIAL STATEMENTS | March 31, 2018
NOTES TO FINANCIAL STATEMENTS
10. ETF Specific Information (in ’000s, except for (a)) (cont’d)
(d) Offsetting of Financial Assets and Liabilities (cont’d)
March 31, 2017Gross amount of
assets/liabilities ($)Amount available
for offset ($) Margin ($) Net amount ($)
Unrealized gains on derivative contracts 3 – – 3
Unrealized losses on derivative contracts (27) – – (27)
Liability for options written – – – –
Total (24) – – (24)
(e) Risks Associated with Financial Instruments
i. Risk exposure and management
The ETF seeks a steady flow of income with an emphasis on capital preservation by investing primarily in investment grade fixed income securities denominated in Canadian or foreign currencies that are issued by companies or governments.
ii. Currency risk
The table below indicates currencies to which the ETF had significant exposure as at period end in Canadian dollar terms, including the underlying principal amount of any derivative instruments. Other financial assets and liabilities (including accrued interest and dividends receivable, and receivables/payables for investments sold/purchased) that are denominated in foreign currencies do not expose the ETF to significant currency risk.
March 31, 2018
Currency
Investments ($)
Cash and Short-Term
Investments ($)
Derivative Instruments
($)Net Exposure*
($)
Indian rupee 4,109 – – 4,109
Polish zloty 3,742 – – 3,742
Turkish lira 1,760 – – 1,760
Russian ruble 1,360 – – 1,360
New Zealand dollar 1,917 – (569) 1,348
Argentine peso 1,148 123 – 1,271
Brazilian real 807 – – 807
U.S. dollar 47,361 150 (47,124) 387
Mexican peso 5,664 – (5,562) 102
Australian dollar 4,989 – (4,983) 6
British pound 2,990 – (2,986) 4
Norwegian krone 1,163 – (1,164) (1)
Japanese yen 3,587 – (3,602) (15)
Danish krone 1,774 – (1,792) (18)
Swiss franc – – (1,092) (1,092)
Swedish krona 4,248 152 (6,463) (2,063)
Euro 1,474 49 (6,463) (4,940)
Total 88,093 474 (81,800) 6,767
% of Net Assets 70.3 0.4 (65.3) 5.4

MACKENZIE CORE PLUS GLOBAL FIXED INCOME ETF
ACTIVE FIXED INCOME ETFANNUAL AUDITED FINANCIAL STATEMENTS | March 31, 2018
NOTES TO FINANCIAL STATEMENTS
10. ETF Specific Information (in ’000s, except for (a)) (cont’d)
(e) Risks Associated with Financial Instruments (cont’d)
ii. Currency risk (cont’d)
March 31, 2017
Currency
Investments ($)
Cash and Short-Term
Investments ($)
Derivative Instruments
($)Net Exposure*
($)
U.S. dollar 15,507 1,416 (14,772) 2,151
Indian rupee 703 – – 703
Brazilian real 688 – – 688
Swedish krona 1,125 106 (676) 555
Norwegian krone 487 – (144) 343
Australian dollar 33 49 – 82
Mexican peso 2,950 – (2,932) 18
Polish zloty 1,438 – (1,422) 16
Chilean peso 415 – (413) 2
New Zealand dollar 290 – (292) (2)
Danish krone 2,457 – (2,475) (18)
Euro 4,287 55 (4,771) (429)
British pound 187 12 (1,914) (1,715)
Total 30,567 1,638 (29,811) 2,394
% of Net Assets 84.6 4.5 (82.5) 6.6
* Includes both monetary and non-monetary financial instruments
As at March 31, 2018, had the Canadian dollar increased by 5% relative to all foreign currencies, with all other variables held constant, net assets would have decreased by approximately $338 or 0.3% of total net assets (2017 – $220 or 0.6%). Similarily, had the Canadian dollar decreased by 5% relative to all foreign currencies, with all other variables held constant, net assets would have increased by approximately $338 or 0.3% of the total net assets (2017 – $153 or 0.4%). In practice, the actual trading results may differ and the difference could be material.
iii. Interest rate risk
The table below summarizes the ETF’s exposure to interest rate risks from its investments in bonds by term to maturity.
March 31, 2018 ($) March 31, 2017 ($)Term to Maturity Bonds Derivative Instruments Bonds Derivative Instruments
Less than 1 year 3,827 (11,667) 140 (3,067)
1-5 years 36,973 – 9,766 –
5-10 years 60,402 – 18,954 –
Greater than 10 years 11,603 – 4,843 –
Total 112,805 (11,667) 33,703 (3,067)
As at March 31, 2018, had prevailing interest rates increased or decreased by 1%, assuming a parallel shift in the yield curve, with all other variables held constant, net assets would have decreased or increased by approximately $4,572 or 3.6% of total net assets (2017 – $1,753 or 4.9%). In practice, the actual trading results may differ and the difference could be material.
iv. Other price risk
As at March 31, 2018 and 2017, the ETF did not have a significant exposure to price risk.

MACKENZIE CORE PLUS GLOBAL FIXED INCOME ETF
ACTIVE FIXED INCOME ETFANNUAL AUDITED FINANCIAL STATEMENTS | March 31, 2018
NOTES TO FINANCIAL STATEMENTS
10. ETF Specific Information (in ’000s, except for (a)) (cont’d)
(e) Risks Associated with Financial Instruments (cont’d)
v. Credit risk
The ETF’s greatest concentration of credit risk is in debt securities, such as bonds. The fair value of debt securities includes consideration of the creditworthiness of the debt issuer. The maximum exposure to any one debt issuer as at March 31, 2018, was 3.2% of the net assets of the ETF (2017 – 18.4%).
As at March 31, 2018 and 2017, debt securities by credit rating are as follows:
March 31, 2018 March 31, 2017Bond Rating* % of Net Assets % of Net Assets
AAA 29.1 31.3
AA 13.3 8.9
A 21.5 20.6
BBB 12.8 10.4
Less than BBB 12.2 20.8
Unrated 1.1 1.3
Total 90.0 93.3
* Credit ratings and rating categories are based on ratings issued by a designated rating organization
(f) Fair Value Classification
The table below summarizes the fair value of the ETF’s financial instruments using the following fair value hierarchy:
Level 1 – Unadjusted quoted prices in active markets for identical assets or liabilities;
Level 2 – Inputs other than quoted prices that are observable for the asset or liability either directly or indirectly; and
Level 3 – Inputs that are not based on observable market data.
The inputs are considered observable if they are developed using market data, such as publicly available information about actual events or transactions, and that reflect the assumption that market participants would use when pricing the asset or liability.
March 31, 2018 March 31, 2017Level 1
($)Level 2
($)Level 3
($)Total ($)
Level 1 ($)
Level 2 ($)
Level 3 ($)
Total ($)
Bonds – 112,805 – 112,805 – 33,703 – 33,703
Equities 1,140 – – 1,140 466 – – 466
Options – – – – 12 64 – 76
Exchange-traded funds/notes 5,757 – – 5,757 – – – –
Derivative assets – 453 – 453 3 63 – 66
Derivative liabilities (223) (1,278) – (1,501) (27) (524) – (551)
Total 6,674 111,980 – 118,654 454 33,306 – 33,760
The ETF’s policy is to recognize transfers into and transfers out of fair value hierarchy levels as of the date of the event or change in circumstances that caused the transfer.
During the period, there were no significant transfers between Level 1 and Level 2.
Financial instruments classified as Level 2 investments are valued based on the prices provided by an independent reputable pricing services company who prices the securities based on recent transactions and quotes received from market participants and through incorporating observable market data and using standard market convention practices.