Macedonia Gap Analysis May 2013 · Macedonia Gap Analysis Update ... , the EC notes that the...
29
1 Macedonia Gap Analysis Update Strategic Planning and Analysis Division, Program Office, E&E Bureau, USAID May 2013 Introduction This analysis is intended to update and build on our September 2012 gap analysis of Macedonia, and focus largely on where new data and new evidence have emerged since September 2012. Primary sources for this analysis include the EBRD, Transition Report (November 2012), the World Bank, World Development Indicators (latest online), World Bank, Doing Business (2013), the IMF, World Economic Outlook (April 2013), IMF, Central, Eastern and Southeastern Europe: Regional Economic Issues (April 2013), the Economist Intelligence Unit, Macedonia Country Report (first quarter 2013), Freedom House, Freedom in the World (January 2013), and the European Commission, Macedonia: Implementation of Reforms within the Framework of the High Level Accession Dialogue (April 2013). Highlights of Findings Reforms. Macedonia continues to lead the Balkans in macroeconomic reforms and is among the reform leaders in the Balkans in democratic reforms (Figure 1). Progress in macroeconomic reforms continues to be modest albeit steady in Macedonia and generally throughout the Balkans (Figures 2 and 3). According to the EBRD (November 2012), Macedonia advanced in financial sector reforms in 2012 and in competition policy and infrastructure reforms in 2011. The European Commission (EC) in its April 2013 report on the Implementation of Reforms in Macedonia noted that reforms (both economic and democratic) “continued to be carried out during the reporting period (i.e., from October 2012 to April 2013), despite the political crisis affecting the work of Parliament.” On economic reforms (or “strengthening the market economy”), the EC notes that the Macedonian government adopted in October 2012 an Action Plan for Youth Employment “that should help to tackle the problem of high level of youth unemployment by promoting more and better jobs for young people. The plan includes both structural and active measures.” In addition, a December 2012 amendment to the labor market laws focuses on improving labor market statistics and better identifying the real number of unemployed. Amendments to the Company law were also adopted by Parliament in December 2012, aimed at improving market exit of firms. According to the World Bank’s Doing Business dataset, Macedonia’s business environment (or microeconomic reforms) continues to be among the most favorable in E&E and in the world (Figures 4 and 5). Out of 185 countries, Macedonia ranks 23 nd . In E&E, only Estonia and Georgia have more favorable business environments by these measures. Macedonia’s progress in these reforms has been substantial in recent years; from nearly a 50 th percentile rank in 2006 to close to a 90 th percentile rank by 2011, and remaining the same in 2012. The most problematic constraints (or at least the constraints with the worst rankings) for businesses in Macedonia are “getting electricity” (101), “trading across borders” (76), “dealing with construction permits” (65), “resolving insolvency” (60) and “enforcing contracts” (59).
Transcript of Macedonia Gap Analysis May 2013 · Macedonia Gap Analysis Update ... , the EC notes that the...

1
Macedonia Gap Analysis Update
Strategic Planning and Analysis Division, Program Office, E&E Bureau, USAID
May 2013
Introduction
This analysis is intended to update and build on our September 2012 gap analysis of Macedonia, and
focus largely on where new data and new evidence have emerged since September 2012. Primary
sources for this analysis include the EBRD, Transition Report (November 2012), the World Bank, World
Development Indicators (latest online), World Bank, Doing Business (2013), the IMF, World Economic
Outlook (April 2013), IMF, Central, Eastern and Southeastern Europe: Regional Economic Issues (April
2013), the Economist Intelligence Unit, Macedonia Country Report (first quarter 2013), Freedom House,
Freedom in the World (January 2013), and the European Commission, Macedonia: Implementation of
Reforms within the Framework of the High Level Accession Dialogue (April 2013).
Highlights of Findings
Reforms. Macedonia continues to lead the Balkans in macroeconomic reforms and is among the reform
leaders in the Balkans in democratic reforms (Figure 1). Progress in macroeconomic reforms continues
to be modest albeit steady in Macedonia and generally throughout the Balkans (Figures 2 and 3).
According to the EBRD (November 2012), Macedonia advanced in financial sector reforms in 2012 and in
competition policy and infrastructure reforms in 2011. The European Commission (EC) in its April 2013
report on the Implementation of Reforms in Macedonia noted that reforms (both economic and
democratic) “continued to be carried out during the reporting period (i.e., from October 2012 to April
2013), despite the political crisis affecting the work of Parliament.” On economic reforms (or
“strengthening the market economy”), the EC notes that the Macedonian government adopted in
October 2012 an Action Plan for Youth Employment “that should help to tackle the problem of high level
of youth unemployment by promoting more and better jobs for young people. The plan includes both
structural and active measures.” In addition, a December 2012 amendment to the labor market laws
focuses on improving labor market statistics and better identifying the real number of unemployed.
Amendments to the Company law were also adopted by Parliament in December 2012, aimed at
improving market exit of firms.
According to the World Bank’s Doing Business dataset, Macedonia’s business environment (or
microeconomic reforms) continues to be among the most favorable in E&E and in the world (Figures 4
and 5). Out of 185 countries, Macedonia ranks 23nd. In E&E, only Estonia and Georgia have more
favorable business environments by these measures. Macedonia’s progress in these reforms has been
substantial in recent years; from nearly a 50th percentile rank in 2006 to close to a 90th percentile rank by
2011, and remaining the same in 2012. The most problematic constraints (or at least the constraints
with the worst rankings) for businesses in Macedonia are “getting electricity” (101), “trading across
borders” (76), “dealing with construction permits” (65), “resolving insolvency” (60) and “enforcing
contracts” (59).

2
While democratic reforms in Macedonia are relatively advanced by Balkan standards, progress in these
reforms has largely stagnated since at least 2009, according to Freedom House (Figure 6). In 2011,
according to Freedom House in its Nations in Transit report, independent media and national
governance regressed in Macedonia, while all other democratic reform dimensions showed no
measurable change. 2012 democratic reform scores from Freedom House’s Nations in Transit report
will not be available until June 2013. In the meantime, and as rough proxy, we draw on Freedom
House’s political rights and civil liberties scores in its Freedom in the World report (January 2013), which
provides for broad democratization trends in the world in 2012. According to these data, Macedonia
made no gains in democratization in 2012; and in fact, across the Balkans, only Bosnia‐Herzegovina saw
measurable progress in democratization in 2012.
The EC, in its April 2013 report on Macedonia: Implementation of Reforms, provides a more nuanced
analysis of some trends in democratic reforms in Macedonia since September 2012. Overall, progress
and change has been mixed. From end‐December 2012 to end‐February, Macedonia experienced a
political stalemate which adversely affected the functioning of the Parliament and the organization of
local elections. The political crisis arose out of events which took place in the Parliament on December
24, 2012 and entailed the forcible removal of opposition political leaders as well as journalists. Despite
these events and this context, the EC reports some gains in media (including the adoption of an
amendment to the Criminal Code which decriminalized defamation and insult, and progress towards
training judges, lawyers, journalist and other practitioners on freedom of expression), in rule of law
(including modest gains in the capacity of the Supreme Court and the Administrative Court to handle
caseloads), and in electoral reform (including the adoption of amendments to the Electoral Code and the
Law on Financing of Political Parties).
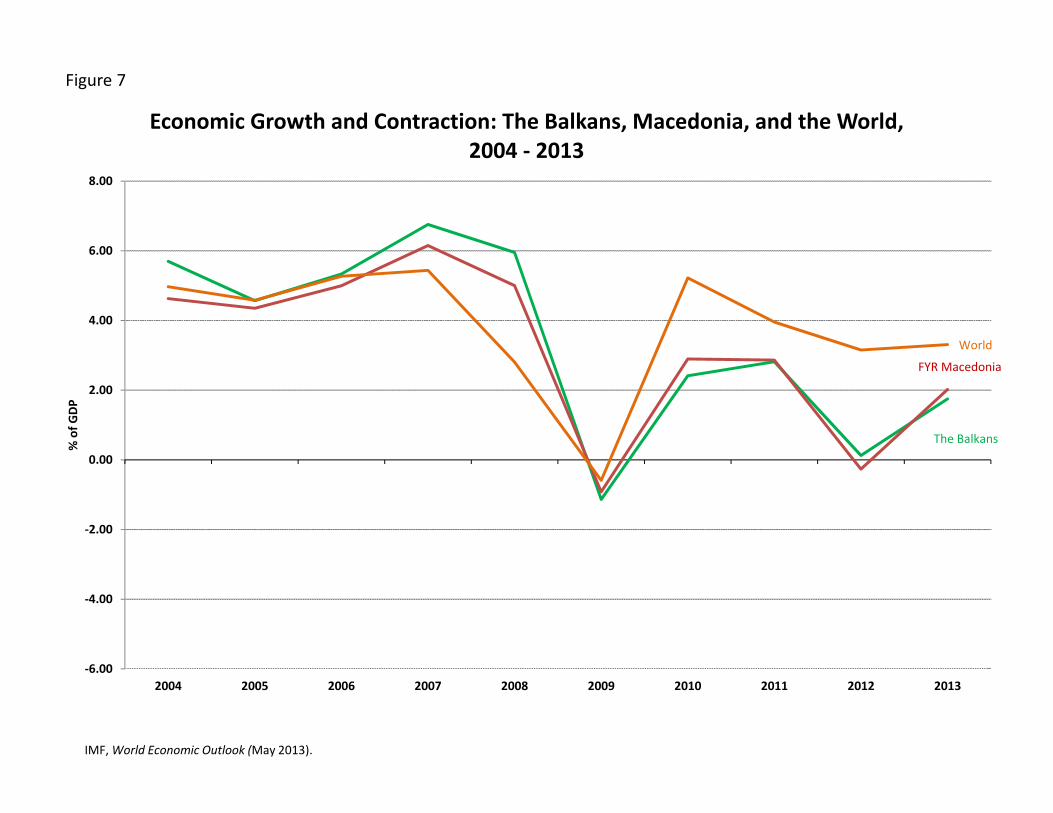
Macroeconomic performance. The pattern of economic growth in Macedonia has been very similar to
the pattern of growth in the Balkans, particularly since the global financial crisis in 2008‐2009 (Figure 7).
Economic growth in Macedonia (and the Balkans) was roughly comparable or greater than worldwide
economic growth in the immediate years leading up to the global financial crisis. Since 2009, however,
economic performance in Macedonia and throughout the Balkans has lagged significantly behind the
global norm, or, in other words, has been significantly worse in post‐ global crisis years compared to pre‐
global crisis years. In fact, Macedonia’s economy witnessed a recession in 2012, on the heels of the
2009 recession, and economic output overall in the Balkans was stagnant in 2012. The ongoing Euro
Area economic crisis is likely playing a very large role in the economic output stagnation in the Balkans.
Figure 8 supports this observation by highlighting the apparent close link between economic output
trends in Western Europe and Eastern Europe, closer post‐crisis than pre‐crisis.
The detrimental impacts of the Euro Area on Macedonia’s economy have been transmitted primarily
through weaker export demand, lower foreign direct investment (FDI), decreased bank credit flows, and
reduced remittances. Both the EIU (first quarter 2013) and the IMF (April 2013) have noted that a main
driver of economic growth in Macedonia (and in the Balkans more broadly) leading up to the global
financial crisis was the substantial influx of foreign capital, both FDI and bank credit flows. Since 2009,
according to the EIU, FDI flows to the Balkans have essentially collapsed. After reaching a record high of
$36.5 billion in 2008, FDI inflows plummeted to $16.5 billion in 2009 and again to $8.5 billion in 2010.

3
The EIU estimates FDI inflows to the Balkans in 2012 at $9.7 billion, or about one‐fourth the inflows
experienced in 2008. According to World Bank data, FDI inflows as a percent of GDP in Macedonia from
2004‐2008 averaged 6%; from 2009‐2011, it was significantly lower, 3.6% of GDP.
Almost half of Macedonia’s exports go to Western Europe (48% in 2011 to EU‐15), and almost one‐
fourth of Macedonia’s exports go to other countries in the Balkans (Figure 9). In other words, close to
three quarters of Macedonia’s exports go to economies currently mired in economic stagnation or crisis.
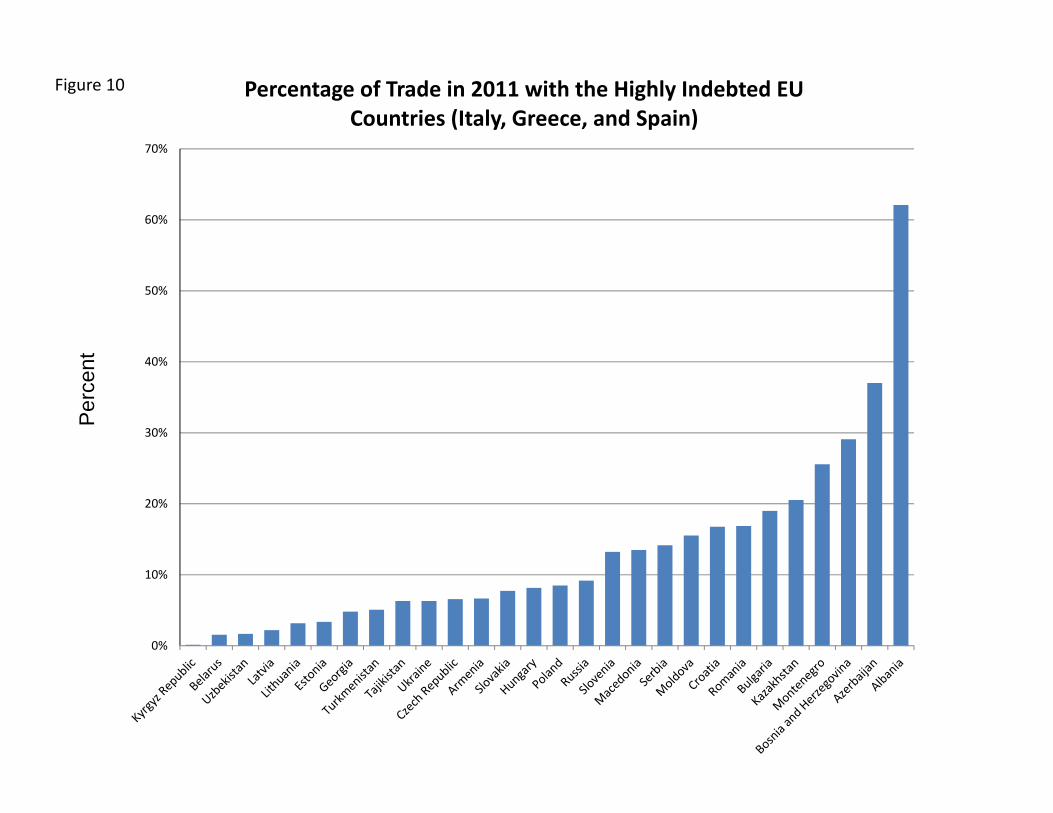
Economic exposure to the most vulnerable economies in Western Europe (specifically, to Italy, Greece,
and Spain) is high throughout the Balkans (at least through trade), particularly in Albania, Bosnia‐
Herzegovina, and Montenegro; and to a lesser though still significant extent in Macedonia (Figure 10).
The export sectors in the Balkans are small relative to GDP and have increased modestly in size since
2000 (Figure 11). Macedonia’s export share of GDP is larger than the Balkan average, though smaller
than the E&E graduates. After factoring in the fact that exports in Macedonia fell more than did GDP in
2012, there has been little if any growth of export share of GDP in Macedonia since 2000. Figure 12
underscores how little the Balkans trade relative to the other E&E sub‐regions. Figure 13 highlights that
Macedonia’s current account deficit is not nearly as problematic as elsewhere in the Balkans; nor is its
external debt particularly high relative to many E&E countries and nowhere near the order of magnitude
found in Greece, Italy, and Spain.
The labor market and physical and human capital. As noted in our September 2012 gap analysis, labor
market challenges continue to be substantial in Macedonia and throughout the Balkans. This includes
labor productivity which is dwarfed by labor productivity in the EU countries (Figure 14), and
unemployment rates which, while slowly decreasing, remain extraordinarily high (Figure 15). From
1995‐2009, labor productivity growth in Macedonia was slower than anywhere else in the Balkans
(Figure 14). The unemployment rate trends in Figure 15 show relatively little evidence of the 2008‐2009
global economic crisis, particularly in Macedonia, further underscoring the structural rather than cyclical
nature of unemployment in these economies. One explanation as to how it is possible that an economy
and society can maintain such extraordinarily high rates of unemployment sustained over the years is
that much employment is not sufficiently captured in the labor market statistics; much, in other words,
is found in the informal sector of the economy. This notion, in any event, is generally supported by the
measures of the shadow economy in Macedonia and elsewhere in Figure 16. In many countries where
unemployment rates are high, so too is the informal sector economic activity.
High unemployment rates in Macedonia and elsewhere in the Balkans are likely due to a combination of
demand and supply factors. On the demand side, sluggish economic growth and/or jobless growth no
doubt play a role. The low and slow growing labor productivity points to supply side issues. Low
productivity in turn is a function in large part of poor and/or eroding capital. Broadly defined, capital
refers to the physical, human, and, particularly in the context of the former communist countries, social
capital. Figures 17 and 18 show how low the physical capital stock is in the Balkans relative to the EU as
well as the E&E graduates. Fixed capital formation per labor force is six times higher in the EU than it is
in the Balkans (Figure 17); it is three times higher in the E&E graduates compared to the Balkans (Figure
18). These data also underscore that fixed capital formation per labor force has been very slow growing
in the Balkans.
4
Figures 19‐24 address human capital aspects; i.e., trends in education. There continue to be a number
of indications that education challenges in Macedonia are significant. This includes tertiary enrollment
rates in Macedonia which are low by E&E standards, and a growth of these enrollments which has been
stagnant in recent years (Figure 21). Moreover, available evidence suggests that most of those enrolled
in tertiary education in Macedonia do not complete the education. According to World Bank data,
tertiary education enrollment was 40% in 2011. Yet only 15% of the population aged 30‐34 had
completed tertiary education by one survey (Figure 22).
As previously reported in our September 2012 gap analysis and in earlier analyses, Macedonia’s
education gap is due in part to relatively poor international test scores which reflect poorly on the
quality of Macedonia’s education system. New test scores emerged in early 2013 and correspond to
2011 performance in math (for 8th graders in forty‐two countries and 4th graders in fifty countries) and in
critical reading (for 4th graders in forty‐five countries). Macedonian 8th graders were included in the
math tests, in the Trends in Mathematics and Sciences Study or TIMSS 2013.
Figure 23 provides a sample of countries where 8th graders scored below the Intermediate International
Benchmark in 2011 in the TIMSS test. Figure 24 provides a sample of countries where the students
scored above the benchmark in 2011. The intermediate benchmark is one of four thresholds: advanced,
high, intermediate, and low. At the low benchmark (with a score of 400) students have some basic math
knowledge; they can add and subtract and read simple bar graphs and tables. At the intermediate
benchmark (with a score of 475), students can apply basic math knowledge in straightforward
situations; they can interpret bar graphs and tables to solve simple problems; i.e., a very basic threshold.
As shown in Figure 23, Macedonian 8th graders scored well below the intermediate benchmark in 2011,
closer to the low benchmark in fact. Moreover, these scores have been backsliding in Macedonia since
at least 1999. Of the ten E&E countries which participated in the TIMSS math tests for 8th graders in
2011, the students in Macedonia scored the lowest. In ascending order: Macedonia (426), Georgia
(431), Romania (458), Armenia (467), Ukraine (479), Kazakhstan (487), Lithuania (502), Slovenia (505),
Hungary (505), and Russia (539).
Macedonia Gap Analysis
USAIDE&E Bureau
Strategic Planning and Analysis DivisionMay 2013

Ratings are based on a 1 to 5 scale, with 5 representing most advanced worldwide. Freedom House, Nations in Transit (June 2012) and Freedom in the World (January 2013); and EBRD, Transition Report 2012 (November 2012).
Figure 1
Bulgaria
Croatia
Czech RepublicEstoniaHungary
LatviaLithuania
Poland
Romania
Slovak
Slovenia
Albania
Bosnia‐Herz
Kosovo
Macedonia
Montenegro
Serbia
Armenia
Azerbaijan
Belarus
Georgia
Moldova
Russia
UkraineKazakhstan
Kyrgyz Rep.
Tajikistan
Turkmenistan
Uzbekistan
1
2
3
4
5
1 2 3 4 5
Econ
omic Reforms
Democratic Reforms
Economic and Democratic Reforms, 2012
E&E Grads
Balkans
E&E Eurasia
CARs
Romania, Bulgaria, Croatia Threshold, 2006

Drawn from the EBRD Transition Report (2012 and earlier versions). The E&E Graduates (n=11) consist of Estonia, Hungary, Latvia, Lithuania, Poland, Slovakia, Slovenia, Czech Republic, Romania, Bulgaria, and Croatia. The Balkans (n=6): Albania, Bosnia & Herzegovina, Macedonia, Kosovo, Serbia, and Montenegro. E&E Eurasia (n=7): Armenia, Azerbaijan, Belarus, Georgia, Moldova, Russia, and Ukraine. The Central Asian Republics or the CARs (n=5): Kazakhstan, Kyrgyzstan, Tajikistan, Turkmenistan, and Uzbekistan.
Figure 2
E&E Graduates
Balkans
E&E Eurasia
CARs
1
1.5
2
2.5
3
3.5
4
4.5
5
1989 1990 1991 1992 1993 1994 1995 1996 1997 1998 1999 2000 2001 2002 2003 2004 2005 2006 2007 2008 2009 2010 2011 2012
1 to 5 Scale
Macroeconomic Reforms

Drawn from the EBRD Transition Report (2011 and earlier editions).
Figure 3
Albania
Bosnia & Herzegovina
Macedonia
Kosovo
Serbia
Montenegro
1
1.5
2
2.5
3
3.5
4
4.5
5
1989 1990 1991 1992 1993 1994 1995 1996 1997 1998 1999 2000 2001 2002 2003 2004 2005 2006 2007 2008 2009 2010 2011 2012
1 to 5 Scale
Macroeconomic Reforms in The Balkans

World Bank, Doing Business 2013 (2012). The analysis is based on 10 aspects: starting a business; dealing with construction permits; getting electricity; registering a property; getting credit; protecting investors; paying taxes; trading across borders; enforcing contracts; and resolving insolvency.
Figure 4
E&E Grads
The Balkans
Macedonia
0
10
20
30
40
50
60
70
80
90
100
2005 2006 2007 2008 2009 2010 2011 2012
Percen
tile Ra
nk
Business EnvironmentBe
tter Enviro
nmen
t

Figure 5
World Bank, Doing Business (2013), 185 countries are included in the analysis. The business environment is gauged based on 10 aspects: starting a business; dealing with construction permits; getting electricity; registering a property; getting credit; protecting investors; paying taxes; trading across borders; enforcing contracts; and resolving insolvency.
0
20
40
60
80
100
120
140
160
180
200
Rank
Business Environment in 2012
E&E Grads
The Balkans
E&E Eurasia
CARs
Others

Figure 6
Ratings from 1 to 5, with 5 representing greatest development of democratic reforms. Freedom House, Nations in Transit 2012; Freedom in the World, 2013.
E&E Graduates
Balkans
E&E Eurasia
CARs
Macedonia
1
1.5
2
2.5
3
3.5
4
4.5
5
1986 1988 1990 1992 1994 1996 1998 2000 2002 2004 2006 2008 2010 2012
1 to 5 Scale
Democratic Reforms
IMF, World Economic Outlook (May 2013).
Figure 7
The Balkans
FYR Macedonia
World
‐6.00
‐4.00
‐2.00
0.00
2.00
4.00
6.00
8.00
2004 2005 2006 2007 2008 2009 2010 2011 2012 2013
% of G
DP
Economic Growth and Contraction: The Balkans, Macedonia, and the World, 2004 ‐ 2013

IMF, World Economic Outlook (May 2013). The Euro Area consists of Austria, Belgium, Cyprus, Estonia, Finland, France, Germany, Greece, Ireland, Italy, Luxembourg, Malta, Netherlands, Portugal, Slovak Republic, Slovenia, and Spain.
Figure 8
The Balkans
FYR Macedonia
Euro Area
‐6.00
‐4.00
‐2.00
0.00
2.00
4.00
6.00
8.00
2004 2005 2006 2007 2008 2009 2010 2011 2012 2013
% of G
DP
Economic Growth and Contraction: The Balkans, Macedonia, and the Euro Area, 2004 ‐ 2013

IMF, Direction of Trade (2012).
Balkans12.38%
CARs0.00%
E&E Eurasia0.03%
E&E Grad2.34%
EU‐1568.28%
Other16.97%
Albania, Direction of Exports, 2011
Balkans23.05%
CARs0.71%
E&E Eurasia4.91%E&E Grad
13.69%
EU‐1548.11%
Other9.53%
Macedonia, Direction of Exports, 2011
Balkans19.22%
CARs0.13%
E&E Eurasia9.70%
E&E Grad25.96%
EU‐1536.10%
Other8.90%
Serbia, Direction of Exports, 2011
Balkans2.34%
CARs0.00%
E&E Eurasia1.60%
E&E Grad42.30%EU‐15
45.72%
Other8.04%
Bosnia and Herzegovina, Direction of Exports, 2011
Balkans3.78%
CARs0.00%
E&E Eurasia1.09%
E&E Grad40.98%EU‐15
39.82%
Other14.32%
Montenegro, Direction of Exports, 2011
Figure 9
Per
cent
0%
10%
20%
30%
40%
50%
60%
70%
Percentage of Trade in 2011 with the Highly Indebted EU Countries (Italy, Greece, and Spain)
Figure 10

World Bank, World Development Indicators (2013).
Figure 11
E&E Graduates
Balkans
Macedonia, FYR
0
10
20
30
40
50
60
70
80
2000 2001 2002 2003 2004 2005 2006 2007 2008 2009 2010 2011
Percen
tage
of G
DP
Exports as a Percentage of GDP

Taken from IMF, Direction of Trade (2012).
Balkans1.51%
CARs6.85%
E&E Eurasia39.59%E&E Graduate
52.05%
% Total Exports from E&E Sub‐Regions, 2011Figure 12

EBRD, Transition Report 2010 and Transition Report 2012 and IMF, World Economic Outlook (2013).
ALB
B‐H
KOS
MAC
SER
KAZKYR
TAJ
TRK
UZB
RUS
ARM
BEL
GEO
MOL
UKRBUL
CRO
HUN
LAT
LITPOL
ROMSLK
SLV
EST
GREECE
SPAIN
ITALY
USA
0
20
40
60
80
100
120
140
160
180
200
‐20.0 ‐15.0 ‐10.0 ‐5.0 0.0 5.0 10.0
External Deb
t % of G
DP, 201
1
Current Accounts % of GDP, 3 Year Average 2010‐2012
Current Account Balance & External Debt in 2010‐2012
Balkans
CARs
E&E Eurasia
E&E Grad
Other
SurplusDeficit
MON (‐21.37,45.64)
AZE (25.08, 14.94)
Figure 13

I. Gill and M. Raiser, Golden Growth: Restoring the Luster of the European Economic Model, World Bank (2012).
0
10
20
30
40
50
60
70
80
90
1995 2009
Labor productivity in E&E vs. EU-15(constant 2005 US$, thousands)
Figure 14

Albania
Serbia
Montenegro
Bosnia and Herz
Macedonia
Kosovo
0
10
20
30
40
50
60
2000 2001 2002 2003 2004 2005 2006 2007 2008 2009 2010 2011 2012
Percen
tage
Unemployment Rates in the Balkans
Eurostat (2012) and IMF World Economic Outlook (2013). Data on Kosovo from European Commission, Kosovo 2010 Progress Report, Brussels, 9 November 2010.
Figure 15

Shadow EconomyPercentage of Official Economy (2007)
0
10
20
30
40
50
60
70
I. Gill and M. Raiser, Golden Growth: Restoring the Lustre of European Economic Model, World Bank (2012).
Per
cent
age
Figure 16

EU
Balkans
$0
$1,000
$2,000
$3,000
$4,000
$5,000
$6,000
$7,000
$8,000
$9,000
1990 1991 1992 1993 1994 1995 1996 1997 1998 1999 2000 2001 2002 2003 2004 2005 2006 2007 2008 2009 2010
Constant 200
5 USD
(PPP
)
Physical (Fixed) Capital per WorkerFigure 17
World Bank,World Development Indicators (2013).

World Bank,World Development Indicators (2013).
Alban
Macedonia
Serbia
Balkan
E&E Grad
$0
$500
$1,000
$1,500
$2,000
$2,500
$3,000
$3,500
$4,000
$4,500
$5,000
2005 2006 2007 2008 2009 2010
USD
/Worker
Fixed Capital Formation in Central and Eastern Europe (per labor force)
Figure 18

Upper secondary education includes ISCED 3, which is the final stage of secondary education. It begins at age 15‐16 and lasts three to five years. UNICEF, TransMONEE Database 2012 (Accessed 2‐12‐2013).
E&E Grads
Balkans w/o Kosovo
E&E Eurasia
CARs
Macedonia
0
20
40
60
80
100
120
Stud
ents/Schoo
l‐aged Ch
ildren
Upper Secondary Education Enrollment in Eastern Europe & Eurasia
Figure 19

E&E Grad
Balkans
E&E Eurasia
CARs w/o Turkmenistan
0
10
20
30
40
50
60
70
1989 1990 1991 1992 1993 1994 1995 1996 1997 1998 1999 2000 2001 2002 2003 2004 2005 2006 2007 2008 2009 2010 2011
Stud
ents/Schoo
l‐aged child
ren
Tertiary Gross Enrollment Ratio
World Bank, World Development Indicators (2013).
Figure 20
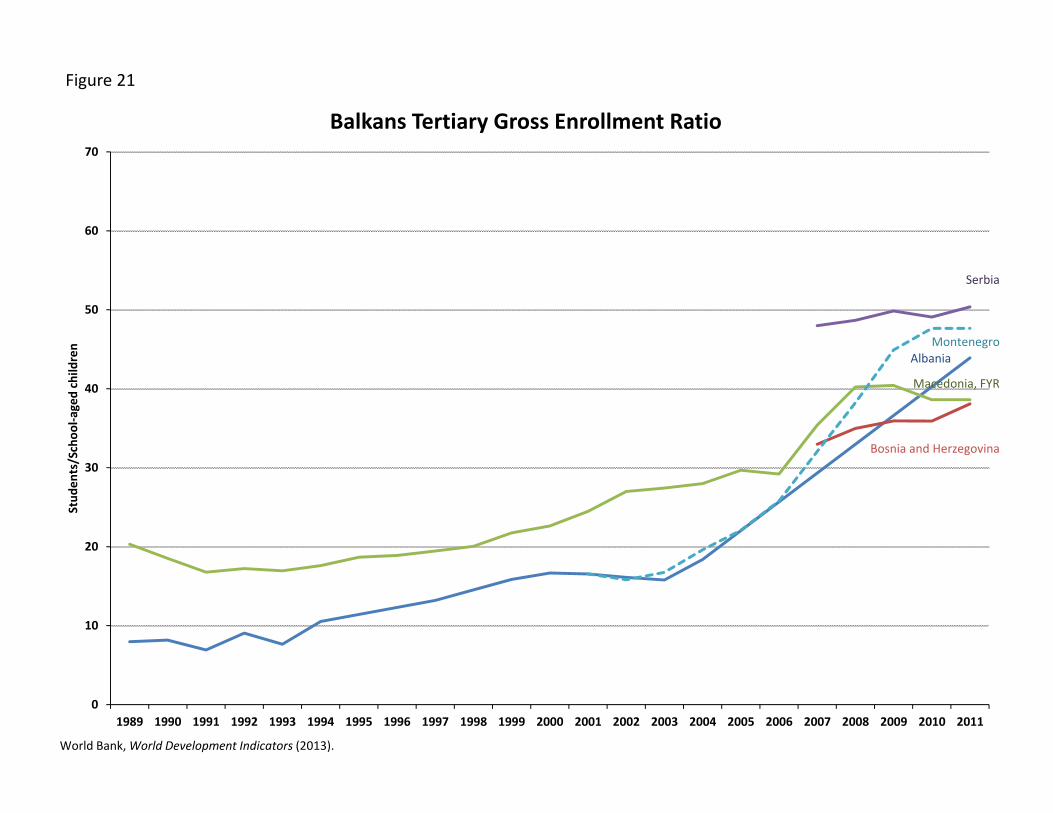
World Bank, World Development Indicators (2013).
Albania
Bosnia and Herzegovina
Macedonia, FYR
Serbia
Montenegro
0
10
20
30
40
50
60
70
1989 1990 1991 1992 1993 1994 1995 1996 1997 1998 1999 2000 2001 2002 2003 2004 2005 2006 2007 2008 2009 2010 2011
Stud
ents/Schoo
l‐aged child
ren
Balkans Tertiary Gross Enrollment Ratio
Figure 21

I. Gill and M. Raiser, Golden Growth: Restoring the Luster of the European Economic Model, World Bank (2012).
Tertiary Education Attainment
% of populationages 30‐34
0
5
10
15
20
25
30
35
EU15 E&E Graduates Serbia Macedonia Russia Armenia Ukraine
Figure 22

International Association for the Evaluation of Educational Achievement (IEA), Trends in International Mathematics and Sciences Study (TIMSS) (2013).
Intermediate International Benchmark
Oman
Indonesia
Romania
Macedonia
Thailand
Malaysia
360
380
400
420
440
460
480
500
520
1995 1999 2003 2007 2011
TIMSS Score
Functional Literacy: International Test Scores in Math for 8th Graders (Below the Benchmark)
Figure 23

IEA, TIMSS (2013).
Intermediate International Benchmark
South Korea
US
Lithuania
Russia
Slovenia
Hungary
440
460
480
500
520
540
560
580
600
1995 1999 2003 2007 2011
TIMSS Score
Functional Literacy: International Test Scores in Math for 8th Graders(Above the Benchmark)
Figure 24