Macedonia, Former Yugoslav Republic of Macedonia ICT TA...Former Yugoslav Republic of Macedonia is...
47
Report No: ACS11069 Macedonia, Former Yugoslav Republic of Macedonia ICT TA Evaluation of Former Yugoslav Republic of Macedonia’s Wi-Fi Kiosk Program December 4, 2014 GTIDR EUROPE AND CENTRAL ASIA Public Disclosure Authorized Public Disclosure Authorized Public Disclosure Authorized Public Disclosure Authorized Public Disclosure Authorized Public Disclosure Authorized Public Disclosure Authorized Public Disclosure Authorized
Transcript of Macedonia, Former Yugoslav Republic of Macedonia ICT TA...Former Yugoslav Republic of Macedonia is...
Report No: ACS11069
Macedonia, Former Yugoslav Republic of
Macedonia ICT TA
Evaluation of Former Yugoslav Republic of Macedonia’s Wi-Fi Kiosk Program
December 4, 2014
GTIDR
EUROPE AND CENTRAL ASIA
Pub
lic D
iscl
osur
e A
utho
rized
Pub
lic D
iscl
osur
e A
utho
rized
Pub
lic D
iscl
osur
e A
utho
rized
Pub
lic D
iscl
osur
e A
utho
rized
Pub
lic D
iscl
osur
e A
utho
rized
Pub
lic D
iscl
osur
e A
utho
rized
Pub
lic D
iscl
osur
e A
utho
rized
Pub
lic D
iscl
osur
e A
utho
rized
2
Standard Disclaimer:
This volume is a product of the staff of the International Bank for Reconstruction and Development/ The World Bank. The findings,
interpretations, and conclusions expressed in this paper do not necessarily reflect the views of the Executive Directors of The World Bank or the
governments they represent. The World Bank does not guarantee the accuracy of the data included in this work. The boundaries, colors,
denominations, and other information shown on any map in this work do not imply any judgment on the part of The World Bank concerning the
legal status of any territory or the endorsement or acceptance of such boundaries.
Copyright Statement:
The material in this publication is copyrighted. Copying and/or transmitting portions or all of this work without permission may be a violation of
applicable law. The International Bank for Reconstruction and Development/ The World Bank encourages dissemination of its work and will
normally grant permission to reproduce portions of the work promptly.
For permission to photocopy or reprint any part of this work, please send a request with complete information to the Copyright Clearance Center,
Inc., 222 Rosewood Drive, Danvers, MA 01923, USA, telephone 978-750-8400, fax 978-750-4470, http://www.copyright.com/.
All other queries on rights and licenses, including subsidiary rights, should be addressed to the Office of the Publisher, The World Bank, 1818 H
Street NW, Washington, DC 20433, USA, fax 202-522-2422, e-mail [email protected].
3
White Paper Evaluation of Former Yugoslav Republic of Macedonia’s Wi-Fi
Kiosk Program
Transport and Information and Communication Technologies (ICT) Global Practice, World Bank’s Skopje Office
Natalija Gelvanovska, Ievgeniia Viatchaninova, Artan Saliu

4
TABLE OF CONTENTS
ACKNOWLEDGMENTS .......................................................................................................................... 5
EXECUTIVE SUMMARY ........................................................................................................................ 6
INTRODUCTION AND METHODOLOGY............................................................................................. 8
1. AFFORDABILITY AND AVAILABILITY OF COMMERCIAL BROADBAND INTERNET
ACCESS SERVICES IN RURAL AREAS OF FORMER YUGOSLAV REPUBLIC OF MACEDONIA
………………………………………………………………………………………………………...9
1.1 Affordability of Broadband Internet Access for the Poor and At-risk Populations ........................ 10
1.2. Availability of Broadband Internet Access in Rural Areas ............................................................ 15
2. DESCRIPTION OF THE WI-FI KIOSK PROJECT......................................................................... 20
2.1 Project Mission, Goals, and Objectives .......................................................................................... 20
2.2 Project Planning and Implementation Conditions ........................................................................... 21
2.3 Technical Implementation ............................................................................................................... 25
2.4 Supervision of the Project ............................................................................................................... 30
2.5 Maintenance issues .......................................................................................................................... 30
2.6 Usage of the Wi-Fi kiosks ............................................................................................................... 33
2.7 Project Beneficiaries ....................................................................................................................... 36
2.8 Future Plans ..................................................................................................................................... 39
3. PUBLIC POLICY AND INITIATIVES ADDRESSING CONNECTIVITY IN RURAL AREAS . 40
4. OBSERVATIONS AND RECOMMENDATIONS .......................................................................... 43

5
ACKNOWLEDGMENTS
World Bank’s ICT research team would like to thank the Ministry of Information Society and
Administration (MIOA) of the Republic of Macedonia for the fruitful cooperation on this assignment.
Additionally, the researchers wish to extend their gratitude to the World Bank’s Country Office in
Skopje, the former Yugoslav Republic of Macedonia, including Tatiana Proskuryakova (Country
Manager, World Bank’s Skopje Office), Bojana Naceva (Senior Education Specialist, World Bank’s
Skopje Office), Anita Bozinovska (Communications Assistant, World Bank’s Skopje Office), Bekim
Imeri (Social Scientist, World Bank’s Skopje Office), and Bojan Shimbov (Research Analyst, World
Bank’s Skopje Office) who have provided utmost support and valuable insights which have enriched
this White Paper.
The research team also wish to thank the peer reviewers Dr. Tim Kelly (Lead ICT Specialist, TWICT
and infoDev), Carlo Maria Rossotto (Lead ICT Specialist, Regional Coordinator for ECA and MENA,
World Bank’s ICT Unit), Robert J. Hawkins (Senior Education Specialist, World Bank Institute) and
Dimce Grozdanoski (Chief IT Officer, Ministry of Education and Science of the Republic of
Macedonia) who have given a detailed and actionable guidance on the White Paper.
The research team would like to extend their acknowledgements to Sinisa Apostoloski (Adviser, AEC),
Vladimir Ristevski (Adviser, AEC), Miroslav Jovanovic (Chief IT Officer, Makedonski Telekom),
Liljana Najdenova (Director of Technical Strategy and Business Development Directorate, Makedonski
Telekom), Dr. Ciril Kafol (CEO, One – Telecommunications Services), Goran Cvetkovski (Sales and
System Integration Manager, Neocom), Goran Capovski (Sales Specialist, Neocom), Dragan Kuculovski
(Operational Director), Dushko Ajdin (Emmetron), Maria Davalos (Economist, Poverty Reduction and
Economic Management), Tanja Markovska (Project Management Specialist, USAID FYR Macedonia),
and Natasha Buleska (Education and Workforce Development Specialist, USAID FYR Macedonia) for
their kind cooperation and availability to respond to the information requests and questionnaires, and
partake in the interviews and video conferences.
Last but not least, the researcher team are grateful to Luan Aliu (Program Assistant, World Bank’s
Skopje Office), Jasminka Sopova (Program Assistant, World Bank’s Skopje Office), Dragan Ivanov
(Resource Management Analyst), and Emilija Cvetanovska-Milojevic (Accounting Assistant) who
facilitated team’s communication with FYR Macedonia’s government and private sector stakeholders.
6
EXECUTIVE SUMMARY
Former Yugoslav Republic of Macedonia is home to a fast-growing electronic communications market.
As a result of the opening up of the telecommunications sector to competition, and of the considerable
progress achieved in the area of regulatory reform and harmonization with EU Acquis, the country now,
for example, boasts the highest fixed broadband Internet household penetration in the region.
Yet not all Macedonians have an equal access to broadband Internet and the benefits it has borne over
the years of rapid rollout. Residents of the rural and remote areas constitute the most vulnerable user
group, with fewer Internet access options at their disposal and higher financial barriers to broadband
access services. Fixed and mobile Internet operators are currently prioritizing networks deployment in or
around the urban areas not finding a compelling business case to move inside the areas with poor
backbone connectivity. Similarly, fixed and mobile broadband prices, although fairly affordable for the
average household in FYR Macedonia, remain far too high for the population with lower incomes,
which is concentrated in the rural areas as compared to urban households. Mobile broadband, commonly
considered to be a realistic alternative for reaching the most remote and isolated areas, is particularly
unaffordable: the country has one of the highest-priced mobile broadband packages in the region. Since
lower incomes go hand in hand with geography, the rural poor are mostly disadvantaged in the context
of the broadband diffusion.
In stimulating broadband uptake and information society development the Ministry of Information
Society and Administration (MIOA) has rightly focused on subsidizing the rural and remote areas under
the auspices of its flagship project “Wi-Fi covering the Republic of Macedonia”. The project has been in
operation since 2009 provisioning free Internet connectivity to 680 localities through Internet access
point (Wi-Fi) kiosks. The remit behind the project was to stimulate the local demand for the Internet
access services, which the kiosks should potentially satisfy after the end of the project (2014-2016). It
was envisioned that after the project ends the private operators could start selling access to connectivity
through the kiosks on a commercial basis. Apart from this vision, the project has pursued the following
objectives:
(i) increasing the percentage of Internet users;
(ii) improving business climate;
(iii) retaining its position as a country-innovator on a regional scale and increasing attractiveness
as a destination for foreign direct investments;
(iv) stimulating democracy;
(v) increasing benefits offered by ICTs in education; and
(vi) increasing users’ mobility.
While no key performance indicators (KPIs) have been set out by the project strategists to measure the
above objectives, World Bank’s research team has drawn conclusions on the project successfulness
based on the multiple observations and opinion survey results. First, Wi-Fi Kiosk Project did bring
Internet connectivity to many locations for the first time and this can be considered as one of the biggest
7
achievements of the project. Second, the benefits that arose thanks to the Wi-Fi Kiosk Project go beyond
those initially foreseen. It was found that a portion of the rural schools which would remain without
central Internet connectivity provided by the project of the Ministry of Education and Science are
receiving and using free connectivity through the Wi-Fi kiosks. Third, the Wi-Fi Kiosk Project
implementation went without major issues, which means that MIOA has put in place a workable project
operation framework. At the same time, a more clear outline of the project objectives, KPIs, monitoring,
reporting, and evaluation framework as well as timely project awareness building could have enabled
more robust results. Fourth, the fixed and mobile coverage data received from several telecom operators
helps to conclude that the generally low broadband coverage has remained stable in selected 680
localities for a number of years. Moreover, the evidence suggests that the situation is unlikely to
drastically improve in the short to medium term. At the moment of writing this current White Paper,
there are fewer than two Internet service providers (ISPs) in 69% (or 470) of all of the selected localities
and there is no commercial Internet access coverage in ~8% (or 52) of them. Fifth, it was identified that
the private sector would unlikely subsidize Internet access in the selected 680 localities and the already
installed Wi-Fi kiosks would not be commercialized. Finding no business case in the localities with poor
or no backbone connectivity the operators expect the government to intervene.
In view of the aforementioned, World Bank’s research team outlines a set of the following main
recommendations.
1. Important achievements of the project, such as the newly-deployed connectivity in the most
remote and rural communities, need to be preserved and leveraged after the project closing date.
In view of the operators’ unwillingness to leverage existing Wi-Fi Internet Access Kiosks to
develop business activities, it is recommended that the project should be subsidized further, but
in a more limited scope, benefiting primarily selected localities with no or only one ISP.
2. In order to address the digital divide in line with the EU State aid rules, we advocate for the
government intervention in the ~77% (or 522) localities in which the Wi-Fi kiosks were initially
installed. Beyond the broadband availability issue such intervention should also address the
affordability of the Internet access for the rural population with lower incomes.
3. Broadband demand should be supported by introduction of further e-government services and
applications specifically benefitting the rural population, while taking into account the state of
Internet access development in the rural areas and peculiar needs of the local population. It is
also recommended that a capacity building program intended to increase the Internet usage and
digital literacy in rural areas should be initiated.
4. It is recommended to establish a framework under which a set of indicators to collect and
monitor the broadband coverage, pricing, and Internet usage development in the rural areas will
be outlined.
8
INTRODUCTION AND METHODOLOGY
This White Paper has been prepared by World Bank’s Transport and Information and Communication
Technologies (ICT) Global Practice at the request of the MIOA1. Delivery of the White Paper is part of
a wider package of technical assistance by the World Bank to the Government of FYR Macedonia.
The aim of the White paper is to perform a high-level assessment of the project “Wi-Fi covering the
Republic of Macedonia” (hereinafter Wi-Fi Kiosk Project) under the auspices of which 680 remote and
rural locations across the country have received free-of-charge connectivity through Wi-Fi Internet
access kiosks. In the process of carrying out the assessment, the authors have found it important to
present a number of recommendations on how the Government could capitalize on the project to
improve existing and / or design future similar interventions.
No impact assessments or evaluations of the Wi-Fi Kiosk Project have been performed to date, thus this
current White Paper is the first attempt to evaluate the project. It should be noted that the detailed
project impact assessment and considerations on how to make the recommendations outlined in the
White Paper operational are not in the scope of this current assignment; they can be elaborated in the
future at the request of the Government of FYR Macedonia.
The methodology used to assess the Wi-Fi Kiosk Project presents a mixture of qualitative and
quantitative research techniques encompassing desk research, field work, focused interviews, and a
survey. The desk research was carried out in the English and Macedonian languages in October-
December, 2013: the authors have studied the project documentation provided by MIOA, Ministry of
Education and Science (MoES), Wi-Fi kiosk operators, broadband operators as well as publicly
available online materials. The field work was carried out on October 7-9th, 2013 and November 27-
29th, 2013, and included kiosk site visits to five villages in Staro Nagoričane, Aerodrom, and Ohrid
municipalities. A series of focused interviews with the relevant stakeholders from the government,
private sector, and civil society were conducted in November-December 2013. The research team has
conducted interviews by e-mail, video conferences, and during in-person meetings. The government
stakeholders included representatives of MIOA, MoES, and Agency for Electronic Communications
(AEC). The private sector was represented by Wi-Fi kiosk backbone network operator, Wi-Fi kiosk
operators, and other fixed and mobile Internet operators operating on the territory of FYR Macedonia.
The civil society interviewees comprised USAID representatives and World Bank specialists from
Social Development, Development Economics, and Education sectors. Finally, an opinion survey was
designed and distributed in the period of December 24, 2013 – February 4, 2014 in 66 villages which
roughly represent 10% of the total number of localities where Wi-Fi kiosks have been installed. The
survey was compiled with an aim to garner personal feedback on the experiences of the kiosk use from
1 The remit for preparing this White Paper was formulated in the Aide-mémoire from the World Bank to the
Government of FYR Macedonia on August 26, 2013, stating: “The World Bank team will work closely with the staff of the Ministry
of Information Society and Public Administration in developing a simple White Paper to assess the experience of Wi-Fi centres in
schools”. The official name of the project in English is “Wi-Fi covering the Republic of Macedonia”, but for the purposes of this
assessment a short version will be used - Wi-Fi Kiosk Project.
9
the sample of end-users who are likely to be using kiosks to satisfy their connectivity needs in lieu of
other options. Through a competitive bidding procedure a Skopje-based polling company Publik CTS
was selected to collect and process the survey data. The survey methodology, composition of the
sample, and the survey itself can be found in Annex D, the survey findings are featured in Annex G.
The paper starts off by giving an overview of the state of telecom development in rural FYR Macedonia
from the standpoint of affordability and availability of the commercial broadband2 Internet access
services for the less advantaged groups of the population. The next section describes the Wi-Fi Kiosk
Project outlining its scope, aim, and implementation process while bringing forward publics’
experiences with respect to the Wi-Fi kiosk use. This section also examines technical parameters related
to the Internet usage and demonstrates the problematic of the kiosk maintenance in the remote and rural
areas. Section 5 references specific policy and regulatory measures designed by different government
stakeholders with a goal to analyse the approach which has been chosen to ensure availability of the
fixed and (or) mobile broadband Internet in the rural areas of the country. The White Paper concludes
with a set of observations and recommendations aiming to address the sustainability of the results
achieved by the Wi-Fi Kiosk Project and to offer next steps to increase rural connectivity in FYR
Macedonia.
1. AFFORDABILITY AND AVAILABILITY OF COMMERCIAL BROADBAND
INTERNET ACCESS SERVICES IN RURAL AREAS OF FORMER YUGOSLAV
REPUBLIC OF MACEDONIA
Broadband connectivity is of strategic importance to the growth and innovation in all sectors of the
economy as well as for social and territorial cohesion. Meeting the challenge of financing a good-quality
affordable ubiquitous broadband infrastructure is a crucial factor for increasing competitiveness and
innovation, providing job opportunities, preventing relocation of economic activity, and attracting
inward investments.
Global experience has demonstrated that private investors alone are not capable of providing adequate
broadband coverage to all citizens or users, thus leaving a significant part of the population unconnected
and the digital divide growing. Socioeconomic inequalities (e.g. in terms of income) and (or) existence
of the geographically remote and/or isolated territories translate into inadequately high connection costs,
which present the main obstacle to the broadband infrastructure rollout (or) extension by the private
sector.
2 The commonly accepted definition of bandwidth rates for broadband, according to the International Telecommunications Union
(ITU), is at least 256 kbps. This definition of broadband (“always on”, download speed rates higher than 256 kbps) will be used
throughout this paper. Source: Core ICT Indicators 2010. Geneva, Switzerland: Partnership on Measuring ICT4D, ITU.
http://www.itu.int/dms_pub/itu-d/opb/ind/D-IND-ICT_CORE-2010-PDF-E.pdf; Telecommunication Indicators Handbook. 2011,
Geneva, Switzerland: ITU. http://www.itu.int/dms_pub/itu-d/opb/ind/D-IND-ITC_IND_HBK-2011-PDF-E.pdf
10
Depending on the peculiarities of the region or country, one or the other reason may have a bigger
impact on the development of the digital divide. In the case of FYR Macedonia, both territorial and
socioeconomic circumstances are likely to be impacting the development of broadband connectivity.
The below two sections will address these circumstances, as they are of particular importance in the
context of the Wi-Fi Kiosk Project, specifically initiated to narrow the digital divide.
1.1 Affordability of Broadband Internet Access for the Poor and At-risk Populations
Former Yugoslav Republic of Macedonia belongs to a range of upper middle income countries in
Europe and Central Asia3. In 2012, FYR Macedonia’s gross domestic product (GDP) totalled US$9.576
bln, with GDP per capita at US$4,634.14. Yet, despite the recently elevated income group
5, 27.3% of the
population is at-risk-of-poverty6 and 38.7% of the households have “great difficulty” to make ends
meet.7
The unemployment and poverty in FYR Macedonia are intimately connected. Though decreasing, the
unemployment rate has been stubbornly high at over 30% for the last five years8 having a particularly
negative effect on women, the elderly, long-term unemployed, under-qualified workers, and minority
groups.9 Without well-paying and secure jobs, Macedonians seek better opportunities abroad, thus
adding to a growing shortage of labour and skills which presents an impediment to FYR Macedonia’s
economic development in the long term.
The work migration translates into a higher income received from private transfers, which is twice as
high in rural areas as in urban areas10
. In general, the percentage of the net transfers constitutes 21.9% of
total GDP (2012), out of which workers’ remittances officially constitute 2.5% of the GDP11
. Active
migration from the rural areas into the cities and abroad translates into an elevated demand for
3 Per GNI per capita income group classification using the World Bank Atlas method http://data.worldbank.org/about/country-
classifications 4 Balance of Payments. National Bank of the Republic of FYR Macedonia 1998-2012. http://www.nbrm.mk/default-
en.asp?ItemID=16C5679A8986CE4391D1F76413410999 5 FYR Macedonia has recently become an upper middle income country, per income group classification laid out in footnote 3.
6 This is equivalent to 60% of the median national equivalised income of the persons living in households. Republic of Macedonia
State Statistical Office. “Survey on income and living, 2010.” http://www.stat.gov.mk/PrikaziPoslednaPublikacija_en.aspx?id=68.
Note: “Survey on income and living, 2010” cited in this paper is based on EU-SILC methodology which examines poverty in
relative and NOT absolute terms. Relative poverty is defined in relation to the average level of prosperity in a given country and
point in time. As an indicator of relative poverty, the proportion of individuals living in households where equivalised income is
below the threshold of 60% of the national equivalised median income is taken. http://ec.europa.eu/employment_social/soc-
prot/soc incl/final_joint_inclusion_report_2003_en.pdf 7 See supra note 6
8 Unemployment (% of population). World Development Indicators. World Bank.
http://data.worldbank.org/indicator/SL.UEM.TOTL.ZS 9 Republic of Macedonia State Statistical Office. “Macedonia in Figures 2012.”
http://www.stat.gov.mk/Publikacii/Mak_Brojki_2012_A.pdf 10
See supra note 6 11
See supra note 4
11
communications between rural inhabitants and their family members, as noticed by Wi-Fi kiosk
operators12
.
The rural population of FYR Macedonia (40,6% of the total population13
or about 876,000 people) is
considered to be poorer than urban, even though there is no official data available over the last five years
on the poverty headcount or poverty gap at rural poverty line14
. The higher incidence rate of poverty in
rural areas can be attributed to the lower wages and salaries in the rural areas, higher levels of self-
employment yielding lower incomes, and a higher number of inhabitants living off subsidies for
agricultural production15
. A high incidence of poverty in the rural areas offers additional economic
explanation of why Internet service providers (ISPs) are moving slowly with the infrastructure
development in the rural areas being hindered by more costly investments (in comparison with the urban
areas) and potentially lower returns on their investments.
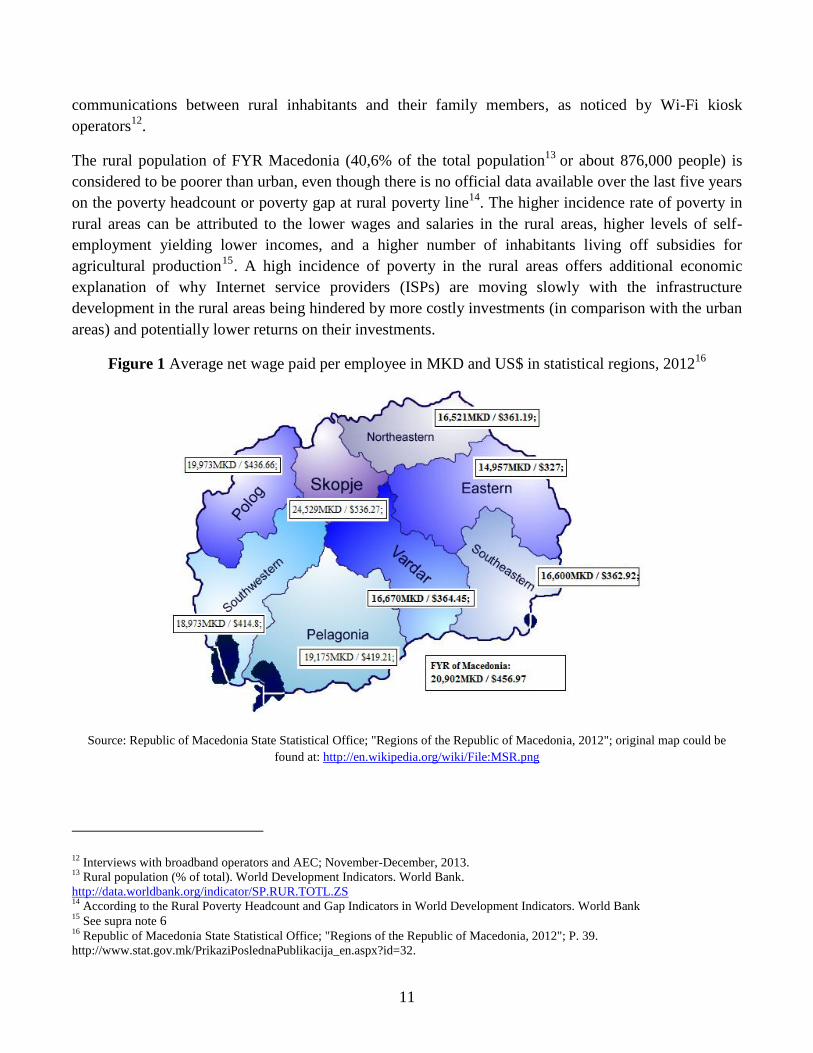
Figure 1 Average net wage paid per employee in MKD and US$ in statistical regions, 201216
Source: Republic of Macedonia State Statistical Office; "Regions of the Republic of Macedonia, 2012"; original map could be
found at: http://en.wikipedia.org/wiki/File:MSR.png
12 Interviews with broadband operators and AEC; November-December, 2013.
13 Rural population (% of total). World Development Indicators. World Bank.
http://data.worldbank.org/indicator/SP.RUR.TOTL.ZS 14
According to the Rural Poverty Headcount and Gap Indicators in World Development Indicators. World Bank 15
See supra note 6 16
Republic of Macedonia State Statistical Office; "Regions of the Republic of Macedonia, 2012"; P. 39.
http://www.stat.gov.mk/PrikaziPoslednaPublikacija_en.aspx?id=32.
12
In terms of the differences in wages and salaries, an average rural household annually earns MKD77,256
or US$1,68917
less than a comparable urban household,18
and average net wage paid per employee in the
region constitutes from 60.9% (lowest) to 81.4% (highest) of the wage paid in Skopje region (see Figure
1). Similarly, the difference in income19
from self-employment in rural areas versus a similar type of
income in the urban areas makes up MKD 74,494 or US$1,62820
per household. The self-employment
mainly centres on agricultural activities, which contribute much less to country’s GDP than industry or
services sectors21
.
Taking into account the above analysis it is plausible to suggest that socioeconomic inequalities between
urban and rural populations and across different income groups within these two populations make the
uptake of broadband services less affordable for FYR Macedonia’s rural inhabitants, as compared with
urban.
The price of broadband Internet access service plays a critical role in broadband diffusion. According to
the International Telecommunication Union (ITU), broadband penetration grows rapidly after the level
of retail broadband price falls below 3–5% of average monthly income22
. The rates of broadband
diffusion in FYR Macedonia are reflective of the wider broadband development in the former Yugoslav
states. As Table 1 posits, FYR Macedonia is no outlier in terms of affordability of fixed broadband: the
former constitutes 10.84% of the average disposable monthly income in FYR Macedonia. Only
Slovenia, Croatia, and Bosnia and Herzegovina show better indicators, according to the ITU standard. In
terms of mobile broadband, prices in FYR Macedonia may be considered relatively high when
compared to regional peers (although more affordable than fixed broadband): 7.21% of the average
disposable monthly income.
17 USD1-45.74 MKD. UN Operational Rate from 12/1/2013,. http://treasury.un.org/operationalrates/OperationalRates.aspx
18 See supra note 6.
19 Income is understood as gross income which includes income from market sources and cash benefits. For a more precise
definition what constitutes income and total household disposable income please see p. 20 of "Survey on income and living
conditions, 2010." http://www.stat.gov.mk/Publikacii/2.4.13.03.pdf. 20
See supra note 17. 21
The World Factbook; "Europe: Macedonia" https://www.cia.gov/library/publications/the-world-factbook/geos/mk.html. 22
Broadband targets for 2015 established by the Broadband Commission for Digital Development:
http://www.broadbandcommission.org/Documents/Broadband_Targets.pdf
13
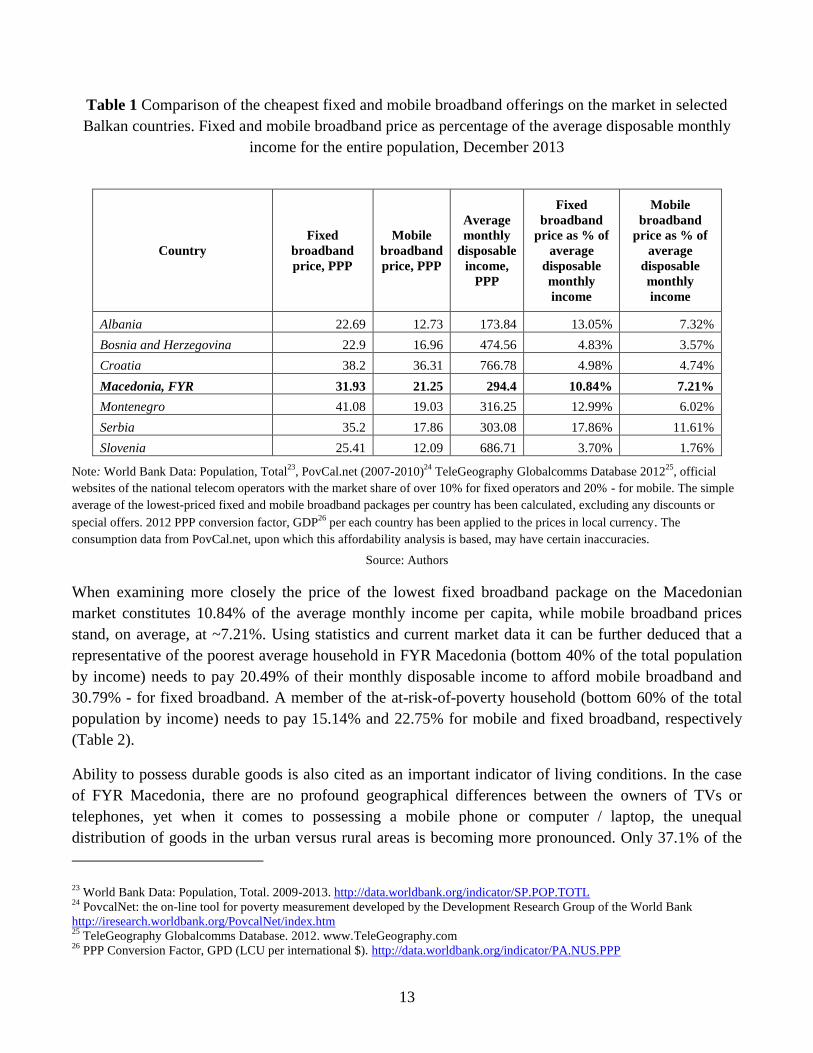
Table 1 Comparison of the cheapest fixed and mobile broadband offerings on the market in selected
Balkan countries. Fixed and mobile broadband price as percentage of the average disposable monthly
income for the entire population, December 2013
Country
Fixed
broadband
price, PPP
Mobile
broadband
price, PPP
Average
monthly
disposable
income,
PPP
Fixed
broadband
price as % of
average
disposable
monthly
income
Mobile
broadband
price as % of
average
disposable
monthly
income
Albania 22.69 12.73 173.84 13.05% 7.32%
Bosnia and Herzegovina 22.9 16.96 474.56 4.83% 3.57%
Croatia 38.2 36.31 766.78 4.98% 4.74%
Macedonia, FYR 31.93 21.25 294.4 10.84% 7.21%
Montenegro 41.08 19.03 316.25 12.99% 6.02%
Serbia 35.2 17.86 303.08 17.86% 11.61%
Slovenia 25.41 12.09 686.71 3.70% 1.76%
Note: World Bank Data: Population, Total23
, PovCal.net (2007-2010)24
TeleGeography Globalcomms Database 201225
, official
websites of the national telecom operators with the market share of over 10% for fixed operators and 20% - for mobile. The simple
average of the lowest-priced fixed and mobile broadband packages per country has been calculated, excluding any discounts or
special offers. 2012 PPP conversion factor, GDP26
per each country has been applied to the prices in local currency. The
consumption data from PovCal.net, upon which this affordability analysis is based, may have certain inaccuracies.
Source: Authors
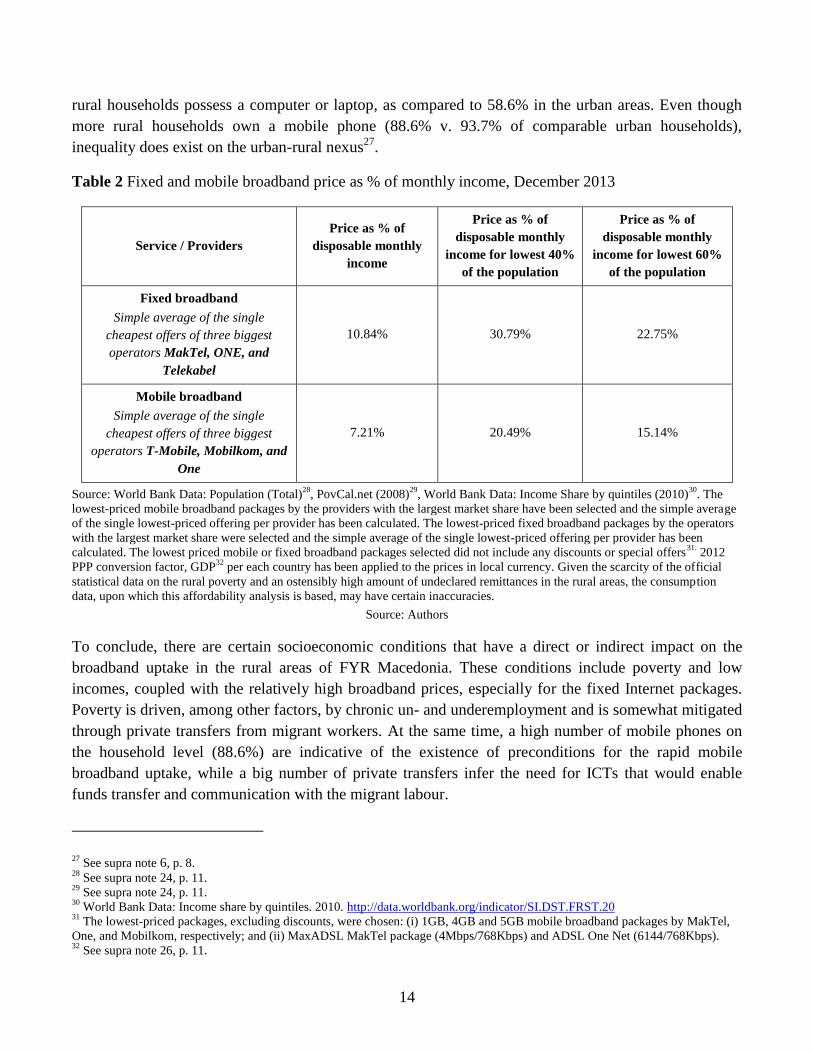
When examining more closely the price of the lowest fixed broadband package on the Macedonian
market constitutes 10.84% of the average monthly income per capita, while mobile broadband prices
stand, on average, at ~7.21%. Using statistics and current market data it can be further deduced that a
representative of the poorest average household in FYR Macedonia (bottom 40% of the total population
by income) needs to pay 20.49% of their monthly disposable income to afford mobile broadband and
30.79% - for fixed broadband. A member of the at-risk-of-poverty household (bottom 60% of the total
population by income) needs to pay 15.14% and 22.75% for mobile and fixed broadband, respectively
(Table 2).
Ability to possess durable goods is also cited as an important indicator of living conditions. In the case
of FYR Macedonia, there are no profound geographical differences between the owners of TVs or
telephones, yet when it comes to possessing a mobile phone or computer / laptop, the unequal
distribution of goods in the urban versus rural areas is becoming more pronounced. Only 37.1% of the
23 World Bank Data: Population, Total. 2009-2013. http://data.worldbank.org/indicator/SP.POP.TOTL
24 PovcalNet: the on-line tool for poverty measurement developed by the Development Research Group of the World Bank
http://iresearch.worldbank.org/PovcalNet/index.htm 25
TeleGeography Globalcomms Database. 2012. www.TeleGeography.com 26
PPP Conversion Factor, GPD (LCU per international $). http://data.worldbank.org/indicator/PA.NUS.PPP
14
rural households possess a computer or laptop, as compared to 58.6% in the urban areas. Even though
more rural households own a mobile phone (88.6% v. 93.7% of comparable urban households),
inequality does exist on the urban-rural nexus27
.
Table 2 Fixed and mobile broadband price as % of monthly income, December 2013
Service / Providers
Price as % of
disposable monthly
income
Price as % of
disposable monthly
income for lowest 40%
of the population
Price as % of
disposable monthly
income for lowest 60%
of the population
Fixed broadband
Simple average of the single
cheapest offers of three biggest
operators MakTel, ONE, and
Telekabel
10.84% 30.79% 22.75%
Mobile broadband
Simple average of the single
cheapest offers of three biggest
operators T-Mobile, Mobilkom, and
One
7.21% 20.49% 15.14%
Source: World Bank Data: Population (Total)28
, PovCal.net (2008)29
, World Bank Data: Income Share by quintiles (2010)30
. The
lowest-priced mobile broadband packages by the providers with the largest market share have been selected and the simple average
of the single lowest-priced offering per provider has been calculated. The lowest-priced fixed broadband packages by the operators
with the largest market share were selected and the simple average of the single lowest-priced offering per provider has been
calculated. The lowest priced mobile or fixed broadband packages selected did not include any discounts or special offers31.
2012
PPP conversion factor, GDP32
per each country has been applied to the prices in local currency. Given the scarcity of the official
statistical data on the rural poverty and an ostensibly high amount of undeclared remittances in the rural areas, the consumption
data, upon which this affordability analysis is based, may have certain inaccuracies.
Source: Authors
To conclude, there are certain socioeconomic conditions that have a direct or indirect impact on the
broadband uptake in the rural areas of FYR Macedonia. These conditions include poverty and low
incomes, coupled with the relatively high broadband prices, especially for the fixed Internet packages.
Poverty is driven, among other factors, by chronic un- and underemployment and is somewhat mitigated
through private transfers from migrant workers. At the same time, a high number of mobile phones on
the household level (88.6%) are indicative of the existence of preconditions for the rapid mobile
broadband uptake, while a big number of private transfers infer the need for ICTs that would enable
funds transfer and communication with the migrant labour.
27 See supra note 6, p. 8.
28 See supra note 24, p. 11.
29 See supra note 24, p. 11.
30 World Bank Data: Income share by quintiles. 2010. http://data.worldbank.org/indicator/SI.DST.FRST.20
31 The lowest-priced packages, excluding discounts, were chosen: (i) 1GB, 4GB and 5GB mobile broadband packages by MakTel,
One, and Mobilkom, respectively; and (ii) MaxADSL MakTel package (4Mbps/768Kbps) and ADSL One Net (6144/768Kbps). 32
See supra note 26, p. 11.
15
1.2. Availability of Broadband Internet Access in Rural Areas
The broadband operators operating in FYR Macedonia do not segment their customers along the urban
or rural lines arguing that the country is fairly small for this type of telecom marketing.33
Operators point
that a definition of “rural” in the context of Internet connectivity provision has not been cemented,
either. The gradation of “rural” ranges from suburban to remote rural and (or) is based on the population
density, which ultimately complicates the assessment of the existing coverage.
Rural broadband coverage data, including pricing data are neither systematically collected, nor analysed
by any government institution, which makes it challenging to determine the precise coverage and the
dynamics behind the coverage development. The research team made an attempt to collect the data on
the availability of the commercial Internet access offers (both fixed and mobile) in Wi-Fi kiosk locations
relying on the following sources: (i) commercial ISPs34
; (ii) Wi-Fi kiosk operators35
; (iii) MoES36
; and
(iv) survey37
. The aggregated information about the number of commercial operators per Wi-Fi kiosk
location may be found in the Annex F of this paper.
At the moment of writing this paper the research team has determined that 7.6% of the Wi-Fi kiosk
locations (or 52 locations out of 680) have no commercial fixed broadband Internet access coverage and
have no 3G coverage. In terms of the rural coverage, incumbent fixed line operator MakTel, and private
operator ONE have similarly wide broadband coverage38
, thus these two operators have been repeatedly
winning MoES tenders for the Internet access provision in the schools across the entire country,
including those located in the remote and rural areas39
. The information on the wide coverage of MakTel
and ONE in rural areas is also consistent with the survey results showing that 50% of all the respondents
(680) has fixed or mobile Internet access at home with MakTel and ONE being among the most
common service providers.
However, existing broadband coverage of either ISP is deemed to be insufficient and incapable of
covering all 680 Wi-Fi kiosk locations. The research team has also established that above 69% (or 470)
of the locations have no more than one commercial ISP. According to European Union (EU) guidelines
for the application of state aid rules in relation to the rapid deployment of broadband networks, the state
33 See supra note 12, p. 8.
34 Information requests were sent to the companies having the greatest subscribers market and (or) coverage (MakTel, T-Mobile,
Mobilkom VIP, ONE). For greater accuracy, the coverage information from smaller peripheral ISPs should also be taken into
account. 35
While operating in the area ISPs are usually aware of the presence of other commercial operators. 36
MoES. 37
The survey respondents who are rural inhabitants of the selected 68 locations where Wi-Fi kiosks have been installed were asked
if they have purchased Internet access from local ISP(s), which denotes service availability. See Annex D for more details on survey
questionnaire and sample and Annex G for survey findings. 38
Although it is worth pointing that the coverage maps do not match, which becomes evident from the list of Internet connections
(not) provided to the schools in the rural areas by both companies. 39
MoES.
16
aid intervention may be justified when a geographic area is served by fewer than two operators40
. In
other words, where market forces are not addressing the connectivity issue to a sufficient extent, the
state aid should follow. As is likely the case in 522 locations where broadband provision is non-existent
or is limited to only one ISP41
.
Development of the mobile broadband Internet access
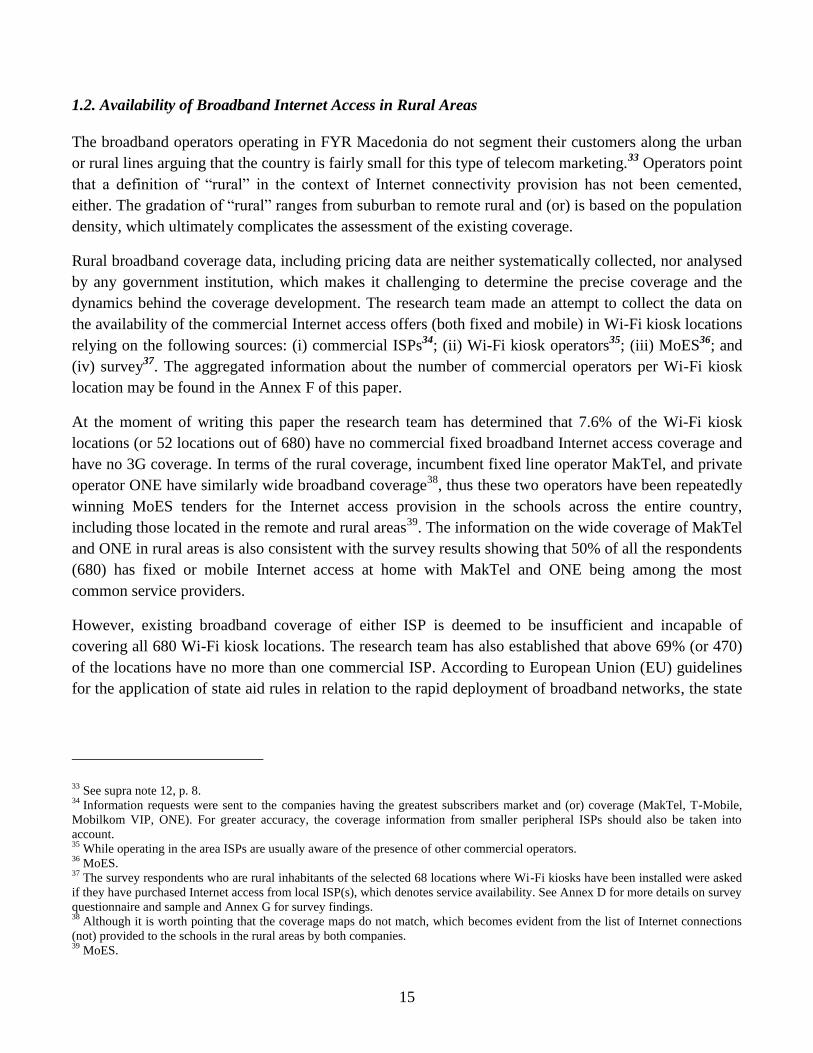
As a rule, mobile broadband is considered to be a realistic alternative for reaching the most remote and
isolated areas, yet in the case of FYR Macedonia, the mobile broadband take-up is relatively low at
16.65% when compared to other countries in the region (Table 3). In the rural areas the penetration rate
is likely to be even lower, because the field data shows that only 12.7% of the surveyed respondents
living in the villages with installed Wi-Fi kiosks receive connectivity via mobile broadband42
. Mobile
operators believe that expansion of the mobile broadband coverage to the rural areas is not reasonable
from the economic standpoint for at least five years from now, and even then the expansion should
remain selective.
Table 3 Mobile broadband penetration in Western Balkan region, 1Q 2013
Country
Mobile Broadband
Penetration
(%, Population)
Macedonia,
FYR 16.65
Bosnia &
Herzegovina 28.85
Albania 12.81
Montenegro 19.31
Serbia 39.61
Kosovo n.a.
Source: Fixed and Mobile Broadband subscribers: www.TeleGeography.com, data as of March, 2013;
Households and Population: Word Bank.
Speaking about mobile broadband development in the wider Balkan region, as of 2012, Slovenia has
leads in terms of mobile broadband penetration (3G and 4G) at 50% of the population and has exhibited
the greatest affordability in the market by having the lowest price per mobile broadband package at a
40 EU guidelines for the application of state aid rules in relation to the rapid deployment of broadband networks Section 3.2. “The
distinction between white, grey and black areas for basic broadband networks” Paragraph 72. http://eur-
lex.europa.eu/LexUriServ/LexUriServ.do?uri=OJ:C:2013:025:0001:0026:EN:PDF 41
In a coverage analysis, T-Mobile and T-Home were considered as one undertaking. 42
See Annex G, Questions 11.
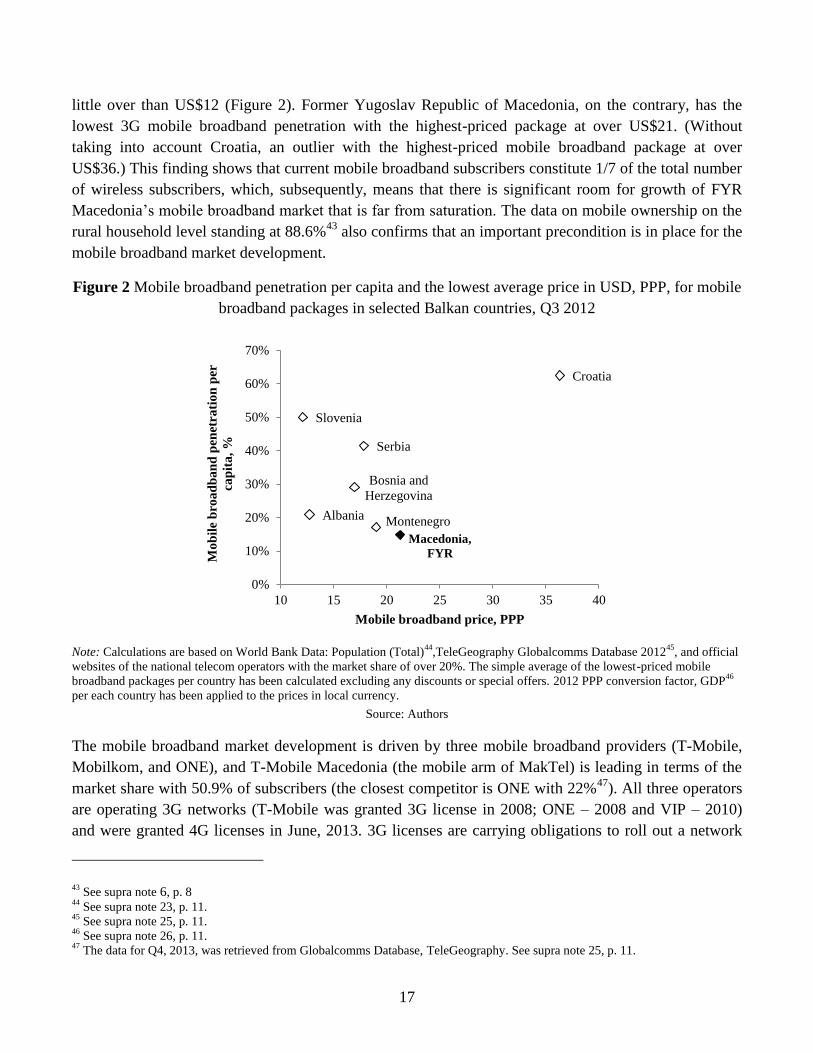
17
little over than US$12 (Figure 2). Former Yugoslav Republic of Macedonia, on the contrary, has the
lowest 3G mobile broadband penetration with the highest-priced package at over US$21. (Without
taking into account Croatia, an outlier with the highest-priced mobile broadband package at over
US$36.) This finding shows that current mobile broadband subscribers constitute 1/7 of the total number
of wireless subscribers, which, subsequently, means that there is significant room for growth of FYR
Macedonia’s mobile broadband market that is far from saturation. The data on mobile ownership on the
rural household level standing at 88.6%43
also confirms that an important precondition is in place for the
mobile broadband market development.
Figure 2 Mobile broadband penetration per capita and the lowest average price in USD, PPP, for mobile
broadband packages in selected Balkan countries, Q3 2012
Note: Calculations are based on World Bank Data: Population (Total)
44,TeleGeography Globalcomms Database 2012
45, and official
websites of the national telecom operators with the market share of over 20%. The simple average of the lowest-priced mobile
broadband packages per country has been calculated excluding any discounts or special offers. 2012 PPP conversion factor, GDP46
per each country has been applied to the prices in local currency.
Source: Authors
The mobile broadband market development is driven by three mobile broadband providers (T-Mobile,
Mobilkom, and ONE), and T-Mobile Macedonia (the mobile arm of MakTel) is leading in terms of the
market share with 50.9% of subscribers (the closest competitor is ONE with 22%47
). All three operators
are operating 3G networks (T-Mobile was granted 3G license in 2008; ONE – 2008 and VIP – 2010)
and were granted 4G licenses in June, 2013. 3G licenses are carrying obligations to roll out a network
43 See supra note 6, p. 8
44 See supra note 23, p. 11.
45 See supra note 25, p. 11.
46 See supra note 26, p. 11.
47 The data for Q4, 2013, was retrieved from Globalcomms Database, TeleGeography. See supra note 25, p. 11.
Albania
Bosnia and
Herzegovina
Croatia
Macedonia,
FYR
Montenegro
Serbia
Slovenia
0%
10%
20%
30%
40%
50%
60%
70%
10 15 20 25 30 35 40
Mo
bil
e b
roa
db
an
d p
enet
rati
on
per
cap
ita
, %
Mobile broadband price, PPP
18
covering 50% of the population within a year, rising to 80% in three years. Under the 4G licence
requirements, the operators are obliged to offer mobile service to 20% of the population in two years
after the licence issue date; in four years the coverage should reach 40%, and in six years – 70% of the
population. Therefore, the license requirements suggest that up to 20% of the population may still not be
covered by 3G and up to 30% - by 4G networks, even in the longer term.
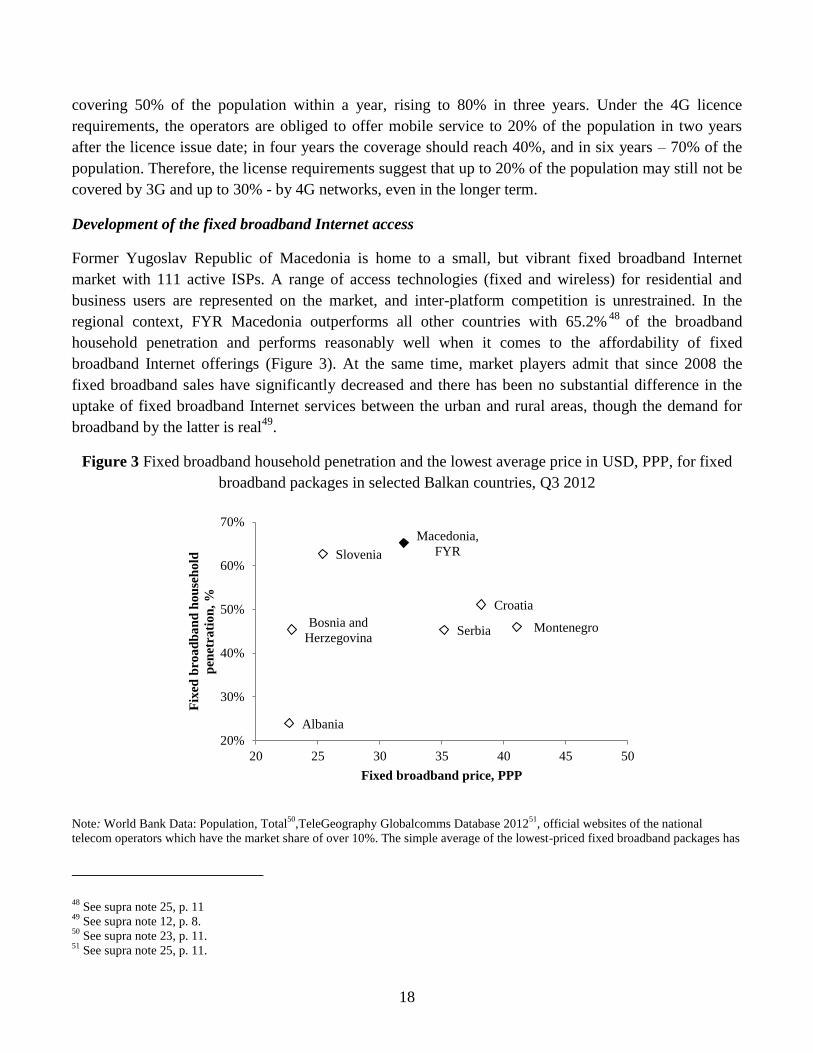
Development of the fixed broadband Internet access
Former Yugoslav Republic of Macedonia is home to a small, but vibrant fixed broadband Internet
market with 111 active ISPs. A range of access technologies (fixed and wireless) for residential and
business users are represented on the market, and inter-platform competition is unrestrained. In the
regional context, FYR Macedonia outperforms all other countries with 65.2%48
of the broadband
household penetration and performs reasonably well when it comes to the affordability of fixed
broadband Internet offerings (Figure 3). At the same time, market players admit that since 2008 the
fixed broadband sales have significantly decreased and there has been no substantial difference in the
uptake of fixed broadband Internet services between the urban and rural areas, though the demand for
broadband by the latter is real49
.
Figure 3 Fixed broadband household penetration and the lowest average price in USD, PPP, for fixed
broadband packages in selected Balkan countries, Q3 2012
Note: World Bank Data: Population, Total50
,TeleGeography Globalcomms Database 201251
, official websites of the national
telecom operators which have the market share of over 10%. The simple average of the lowest-priced fixed broadband packages has
48 See supra note 25, p. 11
49 See supra note 12, p. 8.
50 See supra note 23, p. 11.
51 See supra note 25, p. 11.
Albania
Bosnia and
Herzegovina
Croatia
Macedonia,
FYR
Montenegro Serbia
Slovenia
20%
30%
40%
50%
60%
70%
20 25 30 35 40 45 50
Fix
ed b
roa
db
an
d h
ou
seh
old
pen
etra
tio
n,
%
Fixed broadband price, PPP
19
been calculated excluding any discounts or special offers. 2012 PPP conversion factor, GDP52
per each country has been applied to
the prices in local currency.
Source: Authors
The survey of the rural population living in the areas where Wi-Fi kiosks have been installed53
demonstrates that fixed Internet is the number one connectivity option for 32% of 680 respondents who,
in their majority, pay for monthly unbundled Internet access packages from MKD100 (US$5.3254
) to
MKD500 (~US$2755
), with MKD100 and MKD500 being the two most popular options. The operators
with the largest share of the users who purchase unbundled Internet access packages (70 respondents)
are T-Mobile (over 40%) and ONE (14%), although it should be mentioned that a myriad of small
private ISPs provide connectivity to a significant portion of the remaining users56
. At the same time, the
field data shows that the bundles are getting embraced by part of the rural Internet users. According to
the survey, the most frequent Internet access option among the rural residents is “triple play” (Internet +
TV + telephone) package, the cost of which ranges from MKD350 (~US$1957
) to MKD2,200
(US$11758
), with the most popular bundle with a price tag of MKD1200 (~US$6459
). Around 68% of
110 users paying for this bundle spend MKD1200 or less on a monthly basis. The most popular service
providers are T-Home (MakTel) (38%) and ONE (30%)60
which is consistent with the wide coverage
that enjoy both network operators. Normally each location is served by one operator only. Absence of
alternative offerings and (or) government subsidies make it difficult to lower the broadband prices which
as it was concluded in the section 1.1 of the present paper are quite high for the rural households.
When it comes to the issue of infrastructure upgrade and (or) development, ISPs are actively deploying
fibre-to-the-x (FTTx) in the urban areas anticipating a good uptake rate. 15% of all of the households
have already been passed by FTTx61
. Similarly, the demand for mobile broadband and bundled TV
services is rapidly growing in the urban areas where the infrastructure is in place and the prices for
broadband tend to be lower. To increase the take-up of bundled TV services in the rural areas, the
operators would need to make an additional investment to have the existing broadband coverage
upgraded to at least 6 Mbps, which, as industry experts argue, is unlikely to be accomplished any time
soon62
.
Low broadband penetration in selected 680 villages is therefore poised to remain stable as it was before:
for example, the number of schools which MoES has difficulty connecting (apparently due to the lack of
52 See supra note 26, p. 11
53 Note that in some of the villages the Wi-Fi kiosks initially installed were eventually moved to a different location. Therefore, the
survey included the villages in which there are functioning kiosks as well as those where the kiosks used to be. 54
2012 PPP conversion factor, GDP for FYR Macedonia (18.7) has been applied to the price in MKD. 55
Ibid. 56
See Annex G questions 13, 14a, 14b and 15. 57
2012 PPP conversion factor, GDP for FYR Macedonia (18.7) has been applied to the price in MKD. 58
Ibid. 59
Ibid. 60
See Annex G questions 14a, 14b and 15. 61
See supra note 12, p. 8. 62
See supra note 12, p. 8.
20
coverage) on an annual basis to the arising technical requirements63
continues to be in the range of 138-
150 for the last four years64
.
2. DESCRIPTION OF THE WI-FI KIOSK PROJECT
2.1 Project Mission, Goals, and Objectives
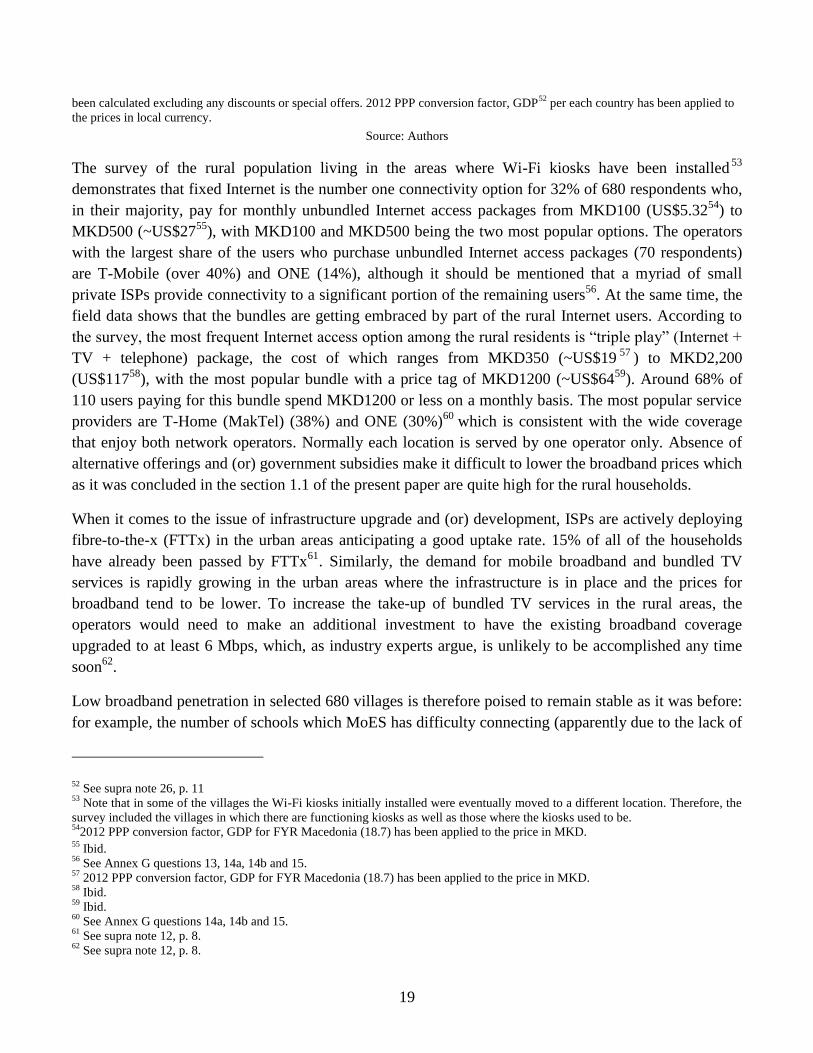
The project was launched by MIOA in 2010 through installation of 680 free-of-charge Wi-Fi Internet
access kiosks in the rural and remote parts of the country. The installation started in April 2010 and
ended in September 2012. Each of the Wi-Fi kiosks provides Internet access through the installed
facility enabling free wireless Wi-Fi coverage around the kiosk in the radius of around 100 m (Figure 4).
Modalities and technical details of the project are discussed in more detail in sections 2.2-2.7.
The project description states that the primary motive for this undertaking is to stimulate development of
the information society in the rural and remote areas by subsidizing the work of the private Internet
operators in those localities, which are considered to be less commercially attractive than the urban
areas65
. The main goal of the project is defined as “to prepare Macedonian citizens for the modern IT
economic market and global competitive economy”66
.With this project, MIOA expects FYR Macedonia
to set an example for other states in bridging the digital divide and reaching e-inclusion, one of the
prerequisites for the entry into the EU67
. Furthermore, this project is intended to stimulate the local
demand for the Internet access services, which the kiosks should potentially satisfy after the end of the
project (2014-2016). It is envisaged that after the project closing date Wi-Fi kiosk operators will be able
to start selling access to Internet connectivity through the kiosks on a commercial basis.68
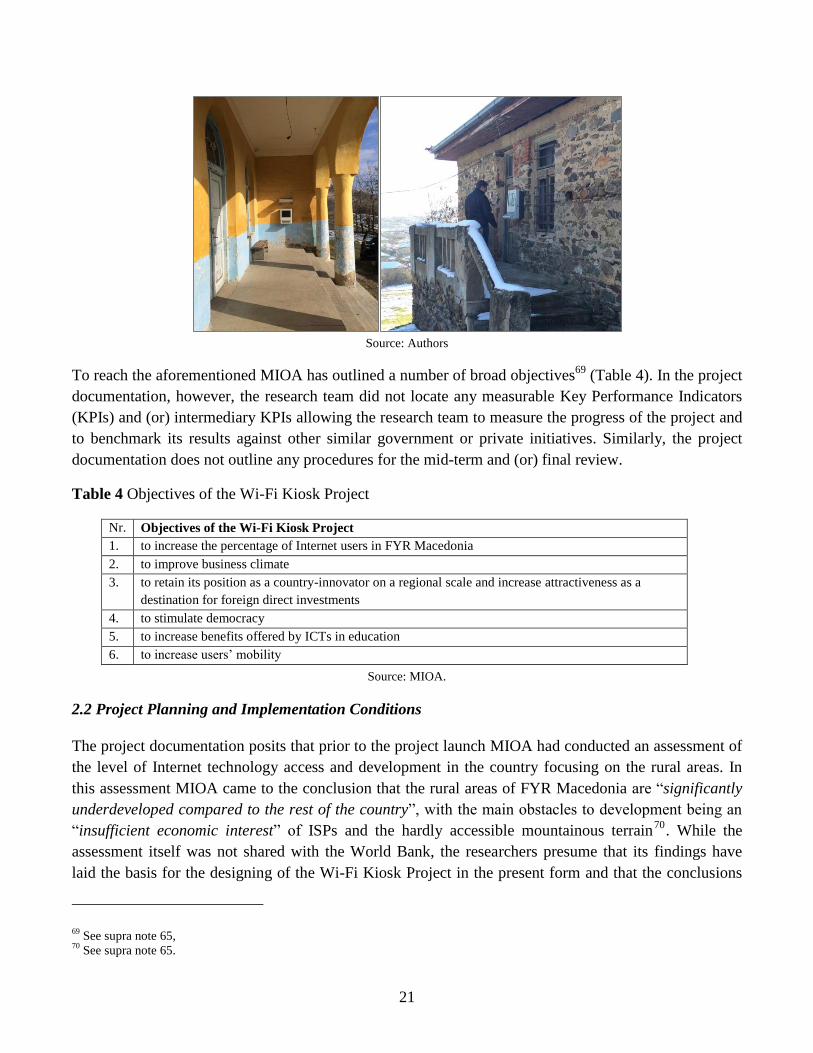
Figure 4 The Wi-Fi kiosks in the schools of Algunja and Pelince in Staro Nagoričane municipality (left
and right).
63 The most important requirement is sufficient Internet speed capacity which is expected to increase in line with users’
expectations. For example, for the school year of 2009/2010 MoES set the speed requirement for primary schools in rural areas at
1/0.25 Mbps, while in year 2013/2014 this parameter has been raised to 3/1 Mbps. 64
MoES requirements for Internet access service for schools 65
MIOA 66
Ibid. 67
“И чист воздух и бесплатен Интернет.” Утрински Весник / Utrinski Vesnik. Jan. 25, 2010.
http://www.utrinski.mk/default.asp?ItemID=C2E532F8DD585D4BA51282413D3B4488 68
Blazhevska, Svetlana. “Македонија со најголем раст во користење на широкопојасен интернет.” Vecer, 7 July 2010.
<http://www.vecer.com.mk/?ItemID=6D04B84127052D4A9CE3A75F06E3CB0F>.
21
Source: Authors
To reach the aforementioned MIOA has outlined a number of broad objectives69
(Table 4). In the project
documentation, however, the research team did not locate any measurable Key Performance Indicators
(KPIs) and (or) intermediary KPIs allowing the research team to measure the progress of the project and
to benchmark its results against other similar government or private initiatives. Similarly, the project
documentation does not outline any procedures for the mid-term and (or) final review.
Table 4 Objectives of the Wi-Fi Kiosk Project
Nr. Objectives of the Wi-Fi Kiosk Project
1. to increase the percentage of Internet users in FYR Macedonia
2. to improve business climate
3. to retain its position as a country-innovator on a regional scale and increase attractiveness as a
destination for foreign direct investments
4. to stimulate democracy
5. to increase benefits offered by ICTs in education
6. to increase users’ mobility
Source: MIOA.
2.2 Project Planning and Implementation Conditions
The project documentation posits that prior to the project launch MIOA had conducted an assessment of
the level of Internet technology access and development in the country focusing on the rural areas. In
this assessment MIOA came to the conclusion that the rural areas of FYR Macedonia are “significantly
underdeveloped compared to the rest of the country”, with the main obstacles to development being an
“insufficient economic interest” of ISPs and the hardly accessible mountainous terrain70
. While the
assessment itself was not shared with the World Bank, the researchers presume that its findings have
laid the basis for the designing of the Wi-Fi Kiosk Project in the present form and that the conclusions
69 See supra note 65,
70 See supra note 65.
22
drawn in the assessment have objectively reflected the state of the telecom sector development in FYR
Macedonia.
The main criteria for the kiosk placement have been defined as their proximity to the “peripheral
schools all across the country” and their accessibility to everyone71
. The Ministry of Information and
Science (MoES) has been consulted on the project: in its formal opinion MoES has outlined a set of
concerns with respect to the kiosk placement arguing for the need of installing the kiosks selectively and
primarily in the rural areas72
. Not all of the kiosks have been eventually placed on the school premises,
since in the course of the kiosk installation and during the initial maintenance period, due to the safety
reasons and (or) the need to ensure ubiquitous electricity supply, Wi-Fi kiosk operators were forced to
move some kiosks inside the school buildings or even to other locations73
.
In general, the placement of the kiosks was mapped to 13 regions covering the entire territory of the
country, with the number of kiosks ranging per region from 13 (North of FYR Macedonia, close to
Skopje) to 84 (South East). The average distribution of kiosks per region has been 52, with more kiosks
concentrated in the country’s Pelagonia, Vardar, Southeastern, Eastern, and Northeastern regions
(Figure 5).
The public procurement of kiosks and Internet services was announced on July 3, 2009, the call for
submission was open until August 11, 2009, and the time-limit for contract completion was set to be 6
months from the award of the contract. The right to submit an offer, on a single offer principle, was
given to “every interested domestic or foreign legal and physical entity – economic operator, registered
for an activity related to the subject of procurement.74
” Each bidder was evaluated on the basis of the
information accompanying the offer related to the bidder’s personal standing, capacity to pursue
professional activity, economic and financial standing, technical or professional capacity to implement
the contract75
. In total, 9 of companies from 3 countries have submitted their bids and all of them have
been allowed to take part in the online auction76
. According to MIOA, the online auction has reached a
very low price, resulting in savings per region from 10 to 36 percent. MIOA was initially ready to
allocate EUR4.72 mln for the project, but the auction results have shown much lower bids than initially
expected, thus bringing the costs down to EUR 2.5 mln.77
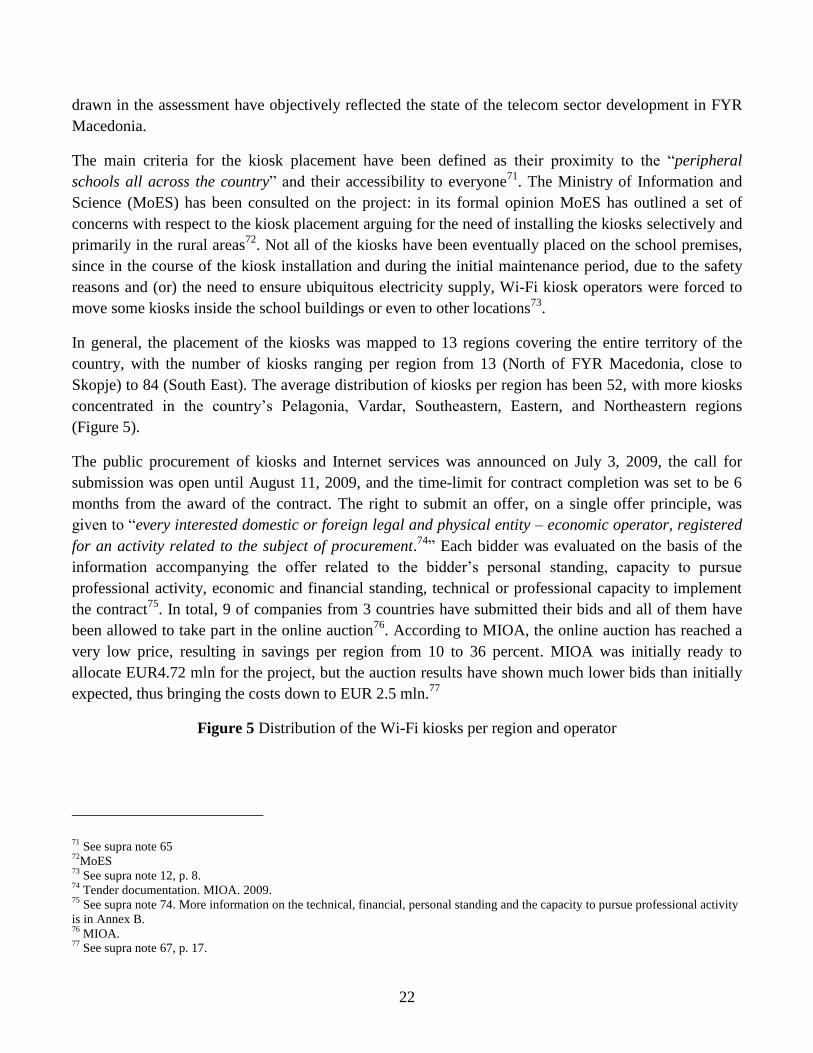
Figure 5 Distribution of the Wi-Fi kiosks per region and operator
71 See supra note 65
72MoES
73 See supra note 12, p. 8.
74 Tender documentation. MIOA. 2009.
75 See supra note 74. More information on the technical, financial, personal standing and the capacity to pursue professional activity
is in Annex B. 76
MIOA. 77
See supra note 67, p. 17.
23
Source: MIOA.
Ultimately, three companies have been selected to operate the kiosks: Telelink MK DOOEL (FYR
Macedonia) won the bid to operate 388 kiosks, Neocom AD Skopje (FYR Macedonia) – 205, and
Helektron S.A.78
(Greece) - 87. The distribution of the regions per operator shows that Telelink was
designated to maintain the kiosks in the landlocked Center as well as South, South Eastern, and Eastern
parts of the country, bordering on Greece and Bulgaria; Neocom - in the Northern part of the country
bordering on Kosovo, Serbia, and Bulgaria; and Emmetron – in the country’s West, bordering on
Albania (Figure 6).
The lowest price was determined to be the main criterion for awarding the public procurement contract.
The potential supplier (Wi-Fi kiosk operator) was bound to purchase, set up, install, and maintain
Internet kiosks with wireless access, according to the instructions detailed in the technical specification79
and in line with the conditions set out in the public procurement contract. Among such conditions, for
example, has been the obligation to pay a fixed fee every six months to each of the schools where
Internet kiosks have been located for the use of space80
.
In terms of the payment amount, the Contracting Authority (MIOA) offered Wi-Fi kiosk providers a
fixed amount per kiosk to cover for the costs incurred by the operators. The single monthly price per
Internet kiosk has been calculated as follows: X = A / (B * C), where A is value of the contract for the
specific region, B is a total number of kiosks in the specific region, and C represents the duration of the
contract (48 months). The total value of the monthly invoice, however, varies based on the number of
kiosks in operation in a specific region. In this vein, the regions with a higher number of kiosks, like #4,
#7, #5, and #9, with 83, 84, 77, and 72 kiosks, respectively, have had higher monetary value, whereas
regions with a lower number of kiosks installed, for instance regions #3 (13 kiosks) or #1 (16 kiosks),
78 After the merger the company is known in FYR Macedonia as Emmetron S.A. Emmetron Ltd. Skopje is part of Emmetron group
of companies from Athens, Greece. 79
Tender technical specifications are outlined in the Annex C. 80
See supra note 74., p. 20.

24
have lower funds allocation. In result, region #11 (36 kiosks) is the most costly and region #7 (84
kiosks) is the least expensive81
(Table 5). The funds’ distribution per kiosk shows that three regions #11,
#13, and #12 have had the highest kiosk cost which is between 16% and over 33% higher than the
average monthly price per kiosk estimated at over EUR79.0182
. The three most expensive regions, with
129 kiosks cumulatively, geographically belong to the mountainous Polog and the far Western part of
the South Western regions of FYR Macedonia. The same analysis shows that the lowest monthly kiosk
price is in the regions #6 (54 kiosks) and #7 (84 kiosks) where prices drop 12 and 21% lower than the
average. Region #6 (Vardar) is considered to be flatter than the rest of the territory of FYR Macedonia.
Table 5 Estimations of the kiosk cost per region and operator
Nr.* Region** Costs per kiosk, EUR per
month***
Operator
1 Region 11 105.64 Emmetron
2 Region 13 95.61 Neocom
3 Region 12 91.76 Neocom
4 Region 1 79.17 Neocom
5 Region 10 79.15 Emmetron
6 Region 5 78.09 Telelink
7 Region 4 75.70 Neocom
8 Region 8 74.88 Telelink
9 Region 9 73.71 Telelink
10 Region 2 71.60 Telelink
11 Region 3 70.04 Neocom
12 Region 6 69.44 Telelink
13 Region 7 62.33 Telelink
Average: 79.01
Note: *Regions are grouped according to the costs starting from the most expensive; **Regions are numbered as they are presented
in the Figure 7; ***Costs are estimated based on the government expenditure per region in EUR, (exchange rate of
1EUR=MKD61.67, per National Bank of Macedonia for Dec. 16, 2013); population density per sq. km83
.
Source: Authors
MIOA is paying, on average, EUR79.01 per kiosk per month, which includes kiosk purchase,
installation, and maintenance. The amount of investment the operators have allocated for the purchase
and installation of kiosks has reached 74% of the entire contract award84
.
81 See supra note 74., p. 20.
82 Funds allocation per regions serviced by Telelink and Neocom is found in “Dovoror in Wi Fi Tele-Link” (2010) and in “Wi-Fi-
dogovor-Neocom” (2010) files, MIOA. Information on funds allocation for Emmetron has not been received and the monthly price
per kiosks for this provider has been calculated using the data available. Inaccuracies are possible. 83
Geographic area from Discovering Macedonia at http://makedonija.name/, population data from municipalities’ websites or, if
data is unavailable, from Discovering Macedonia. Note: the demographic data featured on the majority of municipalities’ websites
is from Census, 2002. 84
Wi-Fi kiosk operators; Tender documentation, MIOA.
25
Instalment of the kiosks and launch of the wireless service had to be completed within a 180-day
deadline after signing the contract, with a penalty in the amount of 0,5% of the total price of the offer for
each day of delay. The installation of the kiosks was divided into three phases: 30% of installation
completed within 120 days (phase I), 60% - within 150 days (phase II), and 100% - within 180 days
(phase III)85
. Kiosk installation was largely performed on time, with minor delay in some regions86
.
The contract duration is set to be 48 months per each Internet kiosk starting from the day when kiosk
was formally put into operation. The first kiosk started operation on April 19, 2010 (Telelink), and the
last – on September 3, 2012 (Emmetron)87
. Subsequently, the first kiosk will discontinue provision of
services in April, 2014, and the last one – in September, 2016. The full list of kiosks per municipality
and their operation date is provided in Annex A.
Responsibility for the kiosks, their operation and functionality (incl. all unexpected costs), during the
installation, transportation, setting up, and maintenance lies with the Wi-Fi kiosk operators, although it
is noted in the tender documentation that the provider(s) cannot be held accountable for the damages
caused by the third parties (such as vandalism, theft, fire or force majeure). After the contract expiry, the
Wi-Fi kiosk operators are allowed to retain the ownership right over the Internet kiosks with wireless
access and the rest of the equipment used in the project. If the contract is not extended or replaced with a
new contract, the Internet kiosks will be returned to the supplier as their owner88
.
2.3 Technical Implementation
Wi-Fi Internet Kiosks are leveraging existing Wi-Fi 802.11b network, accessible on a commercial basis
from ONE Telecommunications Services (ONE). This network is serving as the backbone and backhaul
for the all three Wi-Fi kiosk operators (Telelink, Neocom, and Emmetron) each of whom has a cable
running from ONE telecom Wi-Fi antenna to their respective kiosks. All three kiosk operators explain
that at the time of the project launch no other provider than ONE could offer a more ubiquitous network
coverage reaching the most remote, often mountainous, areas where the kiosks had to be installed89
.
Wide coverage of the network is result of “Macedonia Connects” project completed by the United States
Agency for International Development (USAID) with a purpose to deploy a nationwide Wi-Fi network.
On.Net was commissioned by USAID to deploy the network, later the company was purchased by ONE
(Box 1).
The technical specifications of the Wi-Fi kiosks installed by the operators correspond to the minimum
necessary criteria set out in the tender documentation. A procured kiosk typically consists of a desktop
PC running on a Linux platform, a monitor, a metal keyboard with integrated mouse (or trackball), a
router with two antennas to repeat the signal, and a USB stick which is used for the maintenance of the
85 MIOA.
86 MIOA.
87 MIOA.
88 See supra note .74, p. 20.
89 See supra note 12, p. 8.
26
kiosk (Figure 7). The metal construction of the kiosk cannot be damaged by chance, unless someone
uses physical force and equipment to damage the kiosk or its parts. In addition, the kiosk is typically
protected by awning.
The electricity for the kiosk is supplied from the school (if the kiosk is attached to the school) or any
other adjacent building: a shop, somebody’s yard, local municipal office, etc. According to the contract
agreements, Wi-Fi kiosk operators bear no responsibility for the electricity costs consumed by the
kiosks, therefore electricity costs have to be borne by the schools90
. This condition is contrary to
Box 1 USAID Project “Macedonia Connects”
The Macedonia Connects project (“MK Connects”) which lasted from 2004 until 2007 is one of USAID’s flagship
projects in FYR Macedonia which is cited by the donor agency as a model for ICT-focused development initiatives. The
project, worth US$3.9 mln, aimed at providing affordable and reliable Internet connectivity and ICT applications to the
rural primary and secondary schools of FYR Macedonia. In October 2007, the project connected 545 locations,
including 465 schools, 18 secondary school dormitories, 16 Bureau for Development of Education regional offices, 31
NGOs, and 15 university faculties. All of the secondary schools connected through this project (102) showed average
monthly Internet traffic at or far above the target – 50 Mb per day. Out of 364 primary schools, all except four had daily
traffic at or above the targeted 15 Mb per day.
The deployed technology is a combination of Wi-Fi and Motorola’s Canopy technology: the former was chosen for the
access part, the latter - as a wireless backhaul solution. Motorola Canopy 2,4 GHz 802.11b has a limited bandwidth of
under 11Mbps which itself is maximum only in point to point in the range of up to 500 meters with clear line of sight
links. The canopy network was constructed in 2005 by On.Net hired by USAID. Later, the company was acquired by
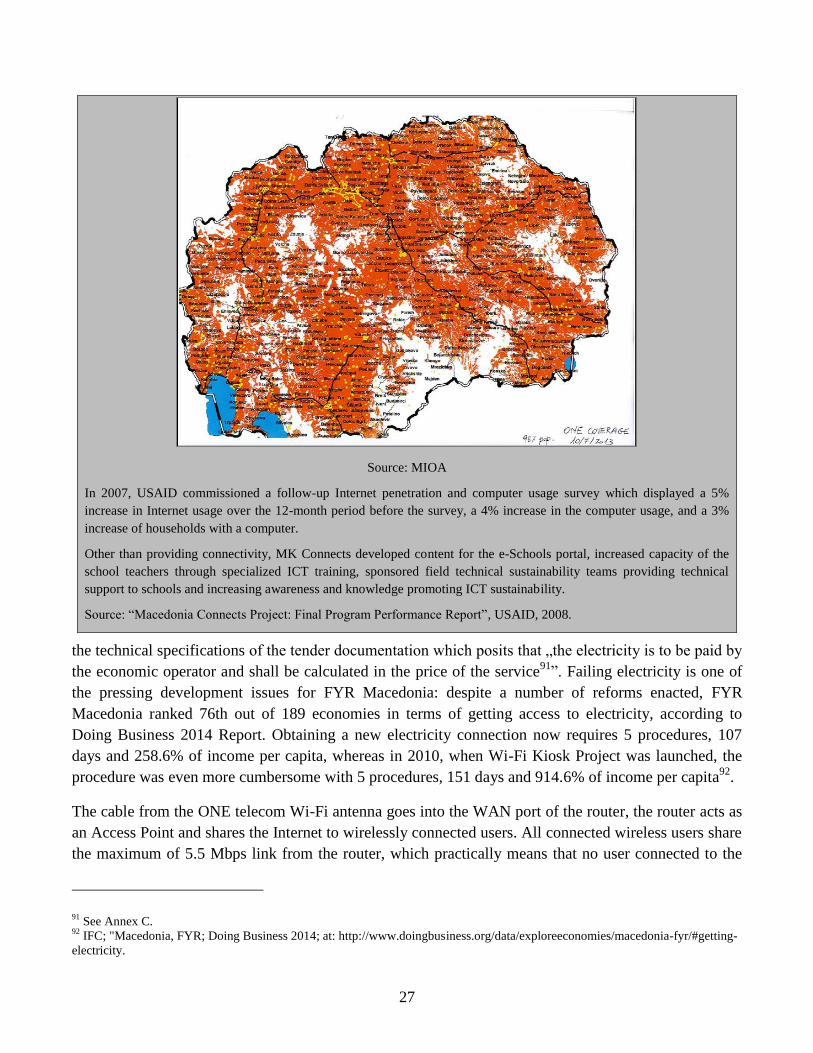
One Telecommunications which now owns the backbone wireless infrastructure (Figure 6).
Figure 6 Motorola canopy backbone wireless infrastructure of One Telecommunications
90 According to the contract agreements between MIOA and Emmetron, Neocom, and Telelink (article 20).
27
Source: MIOA
In 2007, USAID commissioned a follow-up Internet penetration and computer usage survey which displayed a 5%
increase in Internet usage over the 12-month period before the survey, a 4% increase in the computer usage, and a 3%
increase of households with a computer.
Other than providing connectivity, MK Connects developed content for the e-Schools portal, increased capacity of the
school teachers through specialized ICT training, sponsored field technical sustainability teams providing technical
support to schools and increasing awareness and knowledge promoting ICT sustainability.
Source: “Macedonia Connects Project: Final Program Performance Report”, USAID, 2008.
the technical specifications of the tender documentation which posits that „the electricity is to be paid by
the economic operator and shall be calculated in the price of the service91
”. Failing electricity is one of
the pressing development issues for FYR Macedonia: despite a number of reforms enacted, FYR
Macedonia ranked 76th out of 189 economies in terms of getting access to electricity, according to
Doing Business 2014 Report. Obtaining a new electricity connection now requires 5 procedures, 107
days and 258.6% of income per capita, whereas in 2010, when Wi-Fi Kiosk Project was launched, the
procedure was even more cumbersome with 5 procedures, 151 days and 914.6% of income per capita92
.
The cable from the ONE telecom Wi-Fi antenna goes into the WAN port of the router, the router acts as
an Access Point and shares the Internet to wirelessly connected users. All connected wireless users share
the maximum of 5.5 Mbps link from the router, which practically means that no user connected to the
91 See Annex C.
92 IFC; "Macedonia, FYR; Doing Business 2014; at: http://www.doingbusiness.org/data/exploreeconomies/macedonia-fyr/#getting-
electricity.
28
kiosk can achieve the speed higher than 1.1 Mbps, given that 5.5 Mbps has to be shared with the
unknown number of connected clients, located in the radius of around 100m (there is no limit on the
number of users who can be connected.) Wireless clients connect to the kiosk with open SSID without
encryption. The SSID, named “Ostvaruvame,” pops up without asking for authentication when one
approaches any of the kiosks.
The speed that wireless clients connect to the Wi-Fi router is 802.11b or 802.1g which delivers the
maximum of 11 Mbps or 54. This is the possible theoretical maximum bandwidth only from the client
machines to the router. There is only one wired PC connected to the router, which is the kiosk itself,
therefore one can achieve the highest speed through using the kiosk directly. The technical
specifications for procurement stipulate that the minimum speed for the first year of kiosk operation has
to be no less than 256Kbps, for the second year – 512Kbps, for the third and fourth – 1 Mbps.93
During the site visits the research team has performed a number of measurements to determine the speed
of the Internet connection through two independent publicly available online Internet connection speed
measurement tools94
. The measurements were performed both via the kiosks and via the smart phones
connected to the Wi-Fi network provided by the kiosks. The results have shown that the average speed
of Internet connection reaches 512 Kbps download per location in the case of two end users connected,
in the case of more users - the speed of the connection drops significantly and provided Internet access is
becoming not functional. A similar observation was made by the majority of 680 survey respondents,
whose assessments of the quality of the Internet connection speed vary from “sometimes good,
sometimes bad” (16% of all respondents) to “very slow” (around 15%). It is telling that only around 7%
of all respondents regard the speed to be “fast” or “very fast”95
.
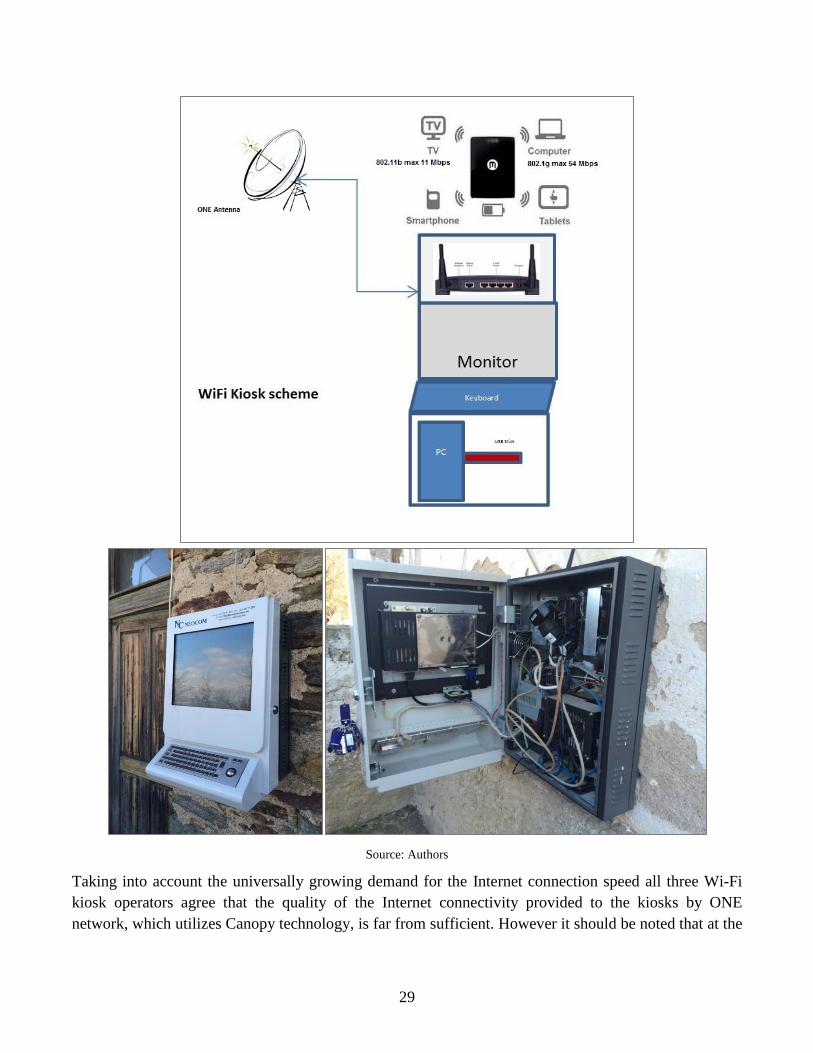
Figure 7 Principal scheme of the Wi-Fi School Kiosk and functioning Wi-Fi kiosks in the schools of
Celopek and Algunja in Staro Nagoričane municipality, 2013 (left and right)
93 See supra note 74, p. 22.
94 Internet Speed Test v13 at www.testmy.net; Ookla Speed Test at www.speedtest.net
95 See Annex G, question 16.
29
Source: Authors
Taking into account the universally growing demand for the Internet connection speed all three Wi-Fi
kiosk operators agree that the quality of the Internet connectivity provided to the kiosks by ONE
network, which utilizes Canopy technology, is far from sufficient. However it should be noted that at the
30
time of deployment the Canopy technology was successfully used in several countries (e.g. Canada96
),
exhibiting a good combination of coverage v. costs.
2.4 Supervision of the Project
The tender documentation established minimum reporting requirements and software parameters for the
Wi-Fi kiosk operators. Every two months and at the end of each year the operators are bound to provide
several electronic reports which feature (i) average availability time, (ii) average Internet speed, (iii)
Internet traffic, (iv) the graph showing the average ping time, (v) actual usage, and (vi) number and
description of defects97
. It should be noted that the information provided by the Wi-Fi kiosk operators to
date was used to a limited capacity. From the research team’s observation, the information collected
from the operators was near solely used to establish the fact of the service delivery in order to take the
decisions on the disbursement of monthly payments. The research team has analyzed some of the reports
shared by MIOA98
from the perspective of the Wi-Fi kiosk maintenance and has summarized the main
findings below.
2.5 Maintenance issues
Per contract agreement all three Wi-Fi kiosk operators have installed web-based monitoring, reporting,
and management software enabling content filtering on each Kiosk (blocking undesirable content such
as pornography, transmission of Nazi ideology, etc. on the kiosk and its wireless clients); problem
recording, user statistics tracking, etc. For instance, the Helpdesk (24/7) was established for the real-time
reporting on the equipment defects, emerging maintenance, and operational issues. Both the Wi-Fi kiosk
operators and MIOA have access to the Helpdesk that displays the operational performance of the
kiosks. If the operators notice any defect they are obligated to notify MIOA by email stating the number
of the kiosk, its locality, date, time, and nature of the defect. Kiosk users, too, can report any issue by
contacting Wi-Fi kiosk operators by the phone number which is typically displayed on each kiosk above
the kiosk screen. The time frame for remedying the issues varies based on the source of the problem and
the location; per contract, it must be no longer than 71 hours. In a number of cases, however, the amount
of time needed for fixing the kiosk defects was bigger than 71 hours, given the fact that the kiosks are
located in the country’s most remote parts which the Wi-Fi kiosk operators cannot easily access,
especially in the winter time when the roads become impassable99
. After the reported defect or
functionality issues have been remedied, Wi-Fi kiosk operators are obliged to submit reports to
MIOA100
.
96 Case Study of Broadband for Rural Nova Scotia Initiative Utilizing Motorola Canopy, "The Role Model For Sustainable Rural
Broadband." Motorola Solutions. 2011, at:
http://www.motorolasolutions.com/web/Business/_Documents/Case%20studies/_Static%20files/WNS_Case%20Study_Utilities_Br
oadband%20for%20Rural%20Nova%20Scotia%20Initiative.pdf 97
See supra note 74, ,p. 20. 98
Note: MIOA did not share with the research team all the reports. Only the reports provided by MIOA were analysed. 99
See supra note 12, p. 8. 100
See supra note 74, p. 19.
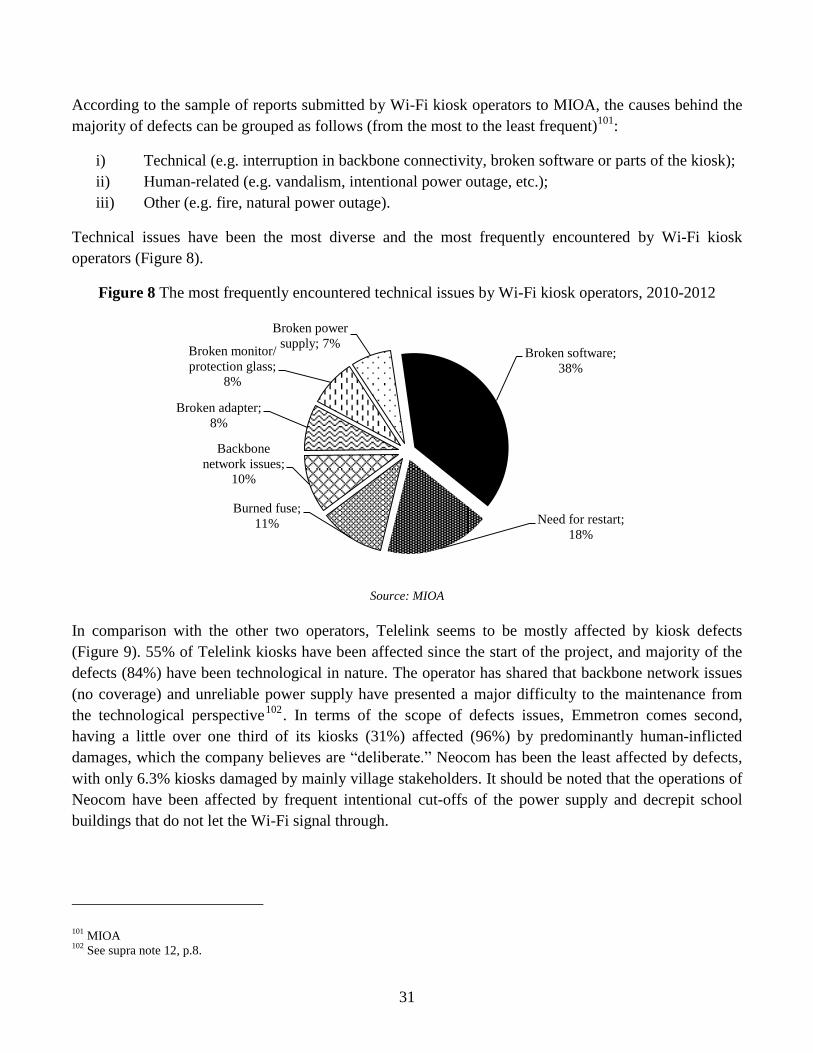
31
According to the sample of reports submitted by Wi-Fi kiosk operators to MIOA, the causes behind the
majority of defects can be grouped as follows (from the most to the least frequent)101
:
i) Technical (e.g. interruption in backbone connectivity, broken software or parts of the kiosk);
ii) Human-related (e.g. vandalism, intentional power outage, etc.);
iii) Other (e.g. fire, natural power outage).
Technical issues have been the most diverse and the most frequently encountered by Wi-Fi kiosk
operators (Figure 8).
Figure 8 The most frequently encountered technical issues by Wi-Fi kiosk operators, 2010-2012
Source: MIOA
In comparison with the other two operators, Telelink seems to be mostly affected by kiosk defects
(Figure 9). 55% of Telelink kiosks have been affected since the start of the project, and majority of the
defects (84%) have been technological in nature. The operator has shared that backbone network issues
(no coverage) and unreliable power supply have presented a major difficulty to the maintenance from
the technological perspective102
. In terms of the scope of defects issues, Emmetron comes second,
having a little over one third of its kiosks (31%) affected (96%) by predominantly human-inflicted
damages, which the company believes are “deliberate.” Neocom has been the least affected by defects,
with only 6.3% kiosks damaged by mainly village stakeholders. It should be noted that the operations of
Neocom have been affected by frequent intentional cut-offs of the power supply and decrepit school
buildings that do not let the Wi-Fi signal through.
101 MIOA
102 See supra note 12, p.8.
Broken software;
38%
Need for restart;
18%
Burned fuse;
11%
Backbone
network issues;
10%
Broken adapter;
8%
Broken monitor/
protection glass;
8%
Broken power
supply; 7%
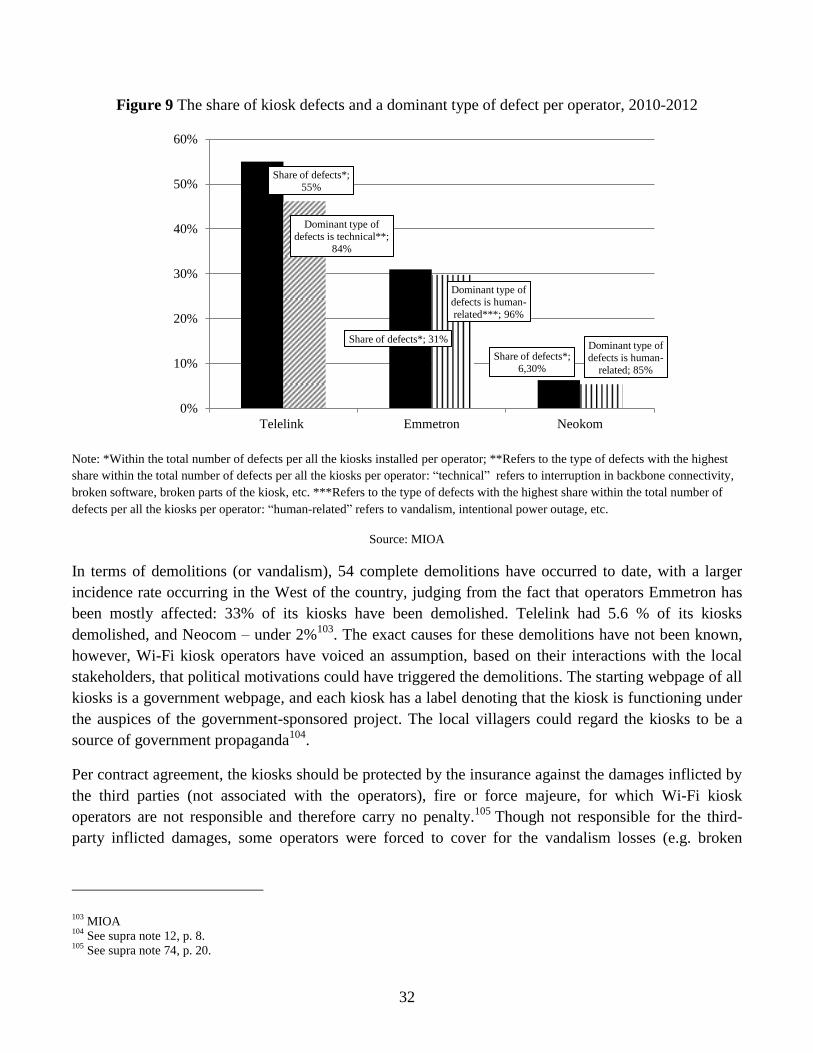
32
Figure 9 The share of kiosk defects and a dominant type of defect per operator, 2010-2012
Note: *Within the total number of defects per all the kiosks installed per operator; **Refers to the type of defects with the highest
share within the total number of defects per all the kiosks per operator: “technical” refers to interruption in backbone connectivity,
broken software, broken parts of the kiosk, etc. ***Refers to the type of defects with the highest share within the total number of
defects per all the kiosks per operator: “human-related” refers to vandalism, intentional power outage, etc.
Source: MIOA
In terms of demolitions (or vandalism), 54 complete demolitions have occurred to date, with a larger
incidence rate occurring in the West of the country, judging from the fact that operators Emmetron has
been mostly affected: 33% of its kiosks have been demolished. Telelink had 5.6 % of its kiosks
demolished, and Neocom – under 2%103
. The exact causes for these demolitions have not been known,
however, Wi-Fi kiosk operators have voiced an assumption, based on their interactions with the local
stakeholders, that political motivations could have triggered the demolitions. The starting webpage of all
kiosks is a government webpage, and each kiosk has a label denoting that the kiosk is functioning under
the auspices of the government-sponsored project. The local villagers could regard the kiosks to be a
source of government propaganda104
.
Per contract agreement, the kiosks should be protected by the insurance against the damages inflicted by
the third parties (not associated with the operators), fire or force majeure, for which Wi-Fi kiosk
operators are not responsible and therefore carry no penalty.105
Though not responsible for the third-
party inflicted damages, some operators were forced to cover for the vandalism losses (e.g. broken
103 MIOA
104 See supra note 12, p. 8.
105 See supra note 74, p. 20.
Share of defects*;
55%
Share of defects*; 31%
Share of defects*;
6,30%
Dominant type of
defects is technical**;
84%
Dominant type of
defects is human-
related***; 96%
Dominant type of
defects is human-
related; 85%
0%
10%
20%
30%
40%
50%
60%
Telelink Emmetron Neokom
33
router), which the insurance company refused to pay.106
Such expenditure increased the variable costs
associated with the damages.107
2.6 Usage of the Wi-Fi kiosks108
The service availability initially set by MIOA was 85%, but it was later revised due to the power supply
and backbone network issues109
. The average Internet speed as measured by the field tests (and which is
supported by Wi-Fi kiosk operators’ observations) rarely reaches 1 Mbps and fails to go beyond it. The
survey findings affirm this finding: the survey respondents regard the quality of speed to be the most oft-
cited source for complaints from Wi-Fi kiosk users, and their #1 recommendation is to increase the
Internet speed110
. The most credible reason behind the lower average Internet speed has been the
placement of the kiosks in the schoolyards or inside of the schools, contrary to the placement in the
highest point of the village which would have enabled the higher speeds. Moreover, Motorola Canopy
has a limited speed upgrade available (2Mbps) which, though, recently executed translates into a
maximum of 1 only Mbps on the ground.111
The analysis of the content accessed in May-June 2013 through Neocom kiosks has shown that the most
popular websites browsed by the kiosk users belong to the Government of FYR Macedonia (above 60%
of all of the opened websites in January-June 2013), while the second preferred destination is social
networking websites such as Facebook or Twitter. The analysis of the most accessed domains of
Telelink from July 27th until August 9th, 2013, has shown that the social networking domains and their
subdomains (e.g. Facebook) have prevailed over any other type of accessed content and constitute 25%
of all the domains visited112
(Figure 10).
The survey results reflect the desk research findings: the Wi-Fi kiosks are most often used for
educational and professional purposes, followed by entertainment (or leisure). It is also not uncommon
to find the users who are driven by both professional and educational motives or out of desire for both
education and leisure113
. 38% of 251 respondents who have used the kiosks state that since they have
started to use the kiosk their usage patterns have shifted toward accessing more content for leisure, while
30% have been using them more frequently for educational purposes. Around 22% of respondents have
not noticed any change in terms of the content accessed: they continue to access kiosks for education
and leisure114
.
106 See supra note 12, p. 8.
107 See supra note 12, p. 8.
108 Usage reports of two operators (out of three) have been shared by MIOA. The reports submitted by Telelink are “Interface”and
“Ping” and by Neocom - “Availability Report for August (Sept. 17, 2013)” and “Availability Report for July (Aug. 29, 2013)”. 109
See supra note 12, p. 8. 110
See Annex G, questions 16 & 31. 111
See supra note 12, p. 8. 112
Because of the large number of content-delivery network domains it is rather difficult to provide a more precise evaluation. 113
See Annex G, question 8. 114
See Annex G, question 10.
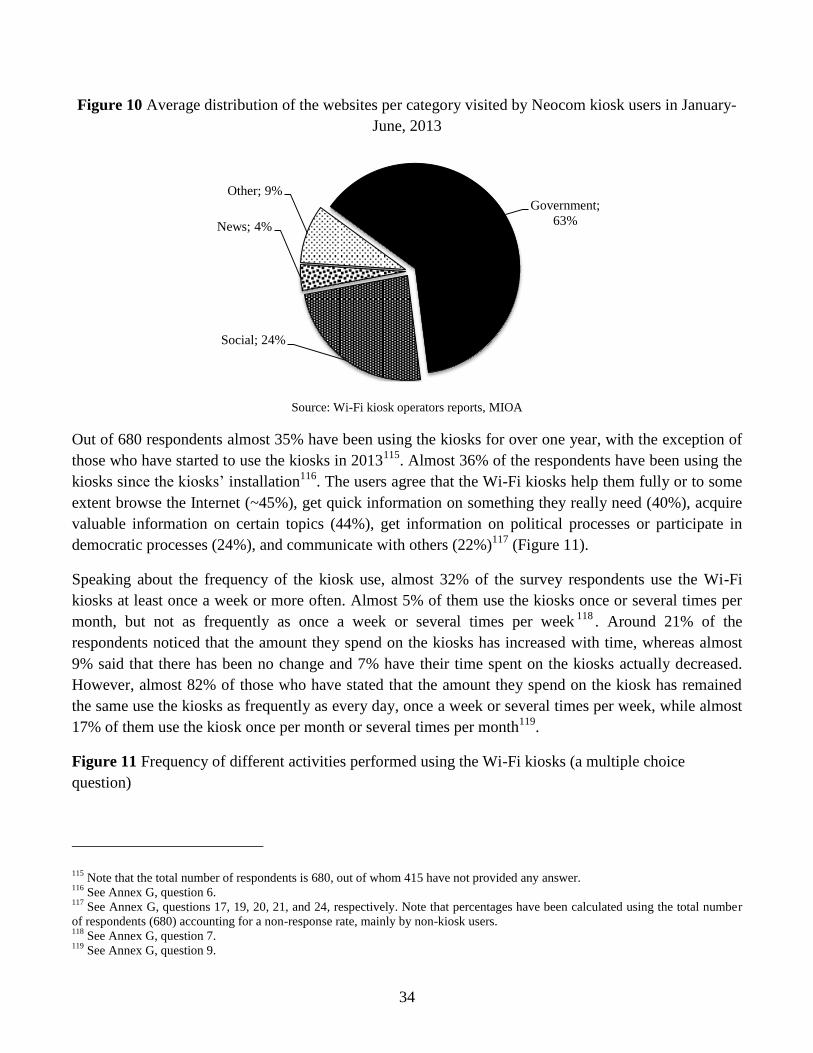
34
Figure 10 Average distribution of the websites per category visited by Neocom kiosk users in January-
June, 2013
Source: Wi-Fi kiosk operators reports, MIOA
Out of 680 respondents almost 35% have been using the kiosks for over one year, with the exception of
those who have started to use the kiosks in 2013115
. Almost 36% of the respondents have been using the
kiosks since the kiosks’ installation116
. The users agree that the Wi-Fi kiosks help them fully or to some
extent browse the Internet (~45%), get quick information on something they really need (40%), acquire
valuable information on certain topics (44%), get information on political processes or participate in
democratic processes (24%), and communicate with others (22%)117
(Figure 11).
Speaking about the frequency of the kiosk use, almost 32% of the survey respondents use the Wi-Fi
kiosks at least once a week or more often. Almost 5% of them use the kiosks once or several times per
month, but not as frequently as once a week or several times per week118
. Around 21% of the
respondents noticed that the amount they spend on the kiosks has increased with time, whereas almost
9% said that there has been no change and 7% have their time spent on the kiosks actually decreased.
However, almost 82% of those who have stated that the amount they spend on the kiosk has remained
the same use the kiosks as frequently as every day, once a week or several times per week, while almost
17% of them use the kiosk once per month or several times per month119
.
Figure 11 Frequency of different activities performed using the Wi-Fi kiosks (a multiple choice
question)
115 Note that the total number of respondents is 680, out of whom 415 have not provided any answer.
116 See Annex G, question 6.
117 See Annex G, questions 17, 19, 20, 21, and 24, respectively. Note that percentages have been calculated using the total number
of respondents (680) accounting for a non-response rate, mainly by non-kiosk users. 118
See Annex G, question 7. 119
See Annex G, question 9.
Government;
63%
Social; 24%
News; 4%
Other; 9%
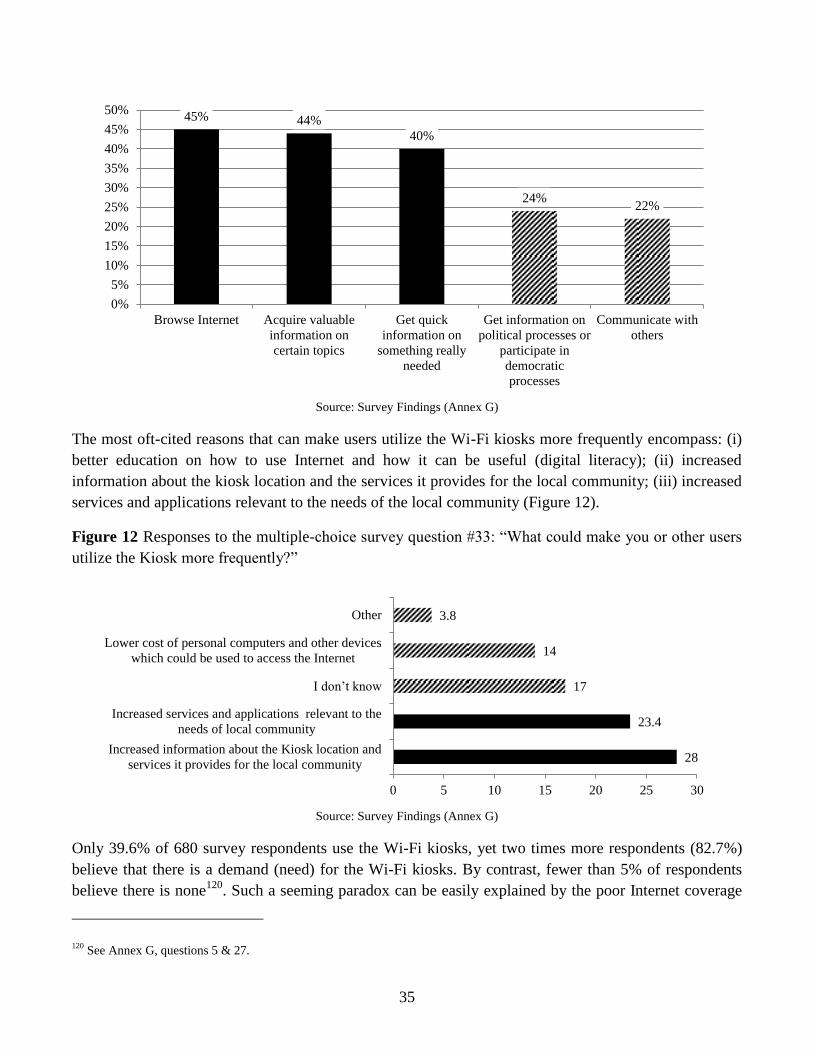
35
Source: Survey Findings (Annex G)
The most oft-cited reasons that can make users utilize the Wi-Fi kiosks more frequently encompass: (i)
better education on how to use Internet and how it can be useful (digital literacy); (ii) increased
information about the kiosk location and the services it provides for the local community; (iii) increased
services and applications relevant to the needs of the local community (Figure 12).
Figure 12 Responses to the multiple-choice survey question #33: “What could make you or other users
utilize the Kiosk more frequently?”
Source: Survey Findings (Annex G)
Only 39.6% of 680 survey respondents use the Wi-Fi kiosks, yet two times more respondents (82.7%)
believe that there is a demand (need) for the Wi-Fi kiosks. By contrast, fewer than 5% of respondents
believe there is none120
. Such a seeming paradox can be easily explained by the poor Internet coverage
120 See Annex G, questions 5 & 27.
45% 44%
40%
24% 22%
0%
5%
10%
15%
20%
25%
30%
35%
40%
45%
50%
Browse Internet Acquire valuable
information on
certain topics
Get quick
information on
something really
needed
Get information on
political processes or
participate in
democratic
processes
Communicate with
others
28
23.4
17
14
3.8
0 5 10 15 20 25 30
Increased information about the Kiosk location and
services it provides for the local community
Increased services and applications relevant to the
needs of local community
I don’t know
Lower cost of personal computers and other devices
which could be used to access the Internet
Other

36
in the surveyed villages and the arising need for connectivity: around 1/3 of respondents who don’t have
Internet at home live in the localities with an installed Wi-Fi kiosk.121
Subsequently, if the Wi-Fi kiosks
were de-installed around 30% of respondents said that the residents of their village would be
disappointed, as they would not be able otherwise to access the Internet. Nearly 22% said there would be
a minor reaction. Around 9% said there would be no reaction as no one would notice de-installation122
.
While the survey sample majority may not be using Wi-Fi kiosks, these respondents realize the local
need for connectivity and the possible outcry when the kiosks are taken away.
According to the observations of the Wi-Fi kiosk operators, the kiosk locations with the higher demand
for the Wi-Fi kiosks have certain characteristics. First, these are villages with poor Internet coverage.
Second, these areas tend to be populated with migrant labour. Third, these villages have a higher share
of children and youth in the local demographic structure123
. The data received from the fixed and mobile
operators support the first argument (see Annex F), while the survey findings corroborate the third
argument, for the main user base of the kiosks is indeed comprised of the children and youth under 35
years of age.
2.7 Project Beneficiaries
While performing this assessment the research team has learned that a primary group of the project
beneficiaries constitutes rural schools’ administrators, teachers, and students who were not initially
intended to be the direct beneficiaries of the project124
. According to the survey findings, almost 81% of
270 Wi-Fi kiosk users are connected with the local schools: they are either representatives of the school
administration (6%) or teachers (29%) or students (46% of the surveyed). Only nearly 2% of users are
farmers125
. The most represented user age group is comprised of children and adolescents aged 10-14
(34%), followed by young people aged 25-34 (~21%). Cumulatively, young people (under 35 years old)
constitute the most represented age group (73% of the total number of users). Users aged 35-44 make up
~11% of the user base and so does population aged 45-54 years old. The elderly, aged 65 or older, do
not use the kiosks126
.
Other that through the Wi-Fi kiosks, the above beneficiary group benefits from the Internet connectivity
provided through a different government project commissioned by MoES. Since 2009, MoES has
committed to connecting all primary (central and satellite) and secondary schools, as well as student
dormitories (almost 1200 locations). Yet, the Ministry has faced difficulties in providing connectivity to
some 10 percent of the access points, as it could not provide connectivity to the most remote and
isolated schools due to the lack of adequate infrastructure by the fixed ISP selected to provide
connectivity under MoES tender. For instance, MoES has estimated that the connectivity in 138 rural
121 See Annex G, questions 4 & 13.
122 See Annex G, question 30.
123 See supra note 12, p. 8.
124 The project documentation does not segment the project beneficiaries. The main beneficiaries are identified as a general public.
125 See Annex G, question 1. Only those who have stated that they have used the Wi-Fi kiosks are accounted.
126 See Annex G, question 2. Only those who have stated that they have used the Wi-Fi kiosks are accounted.
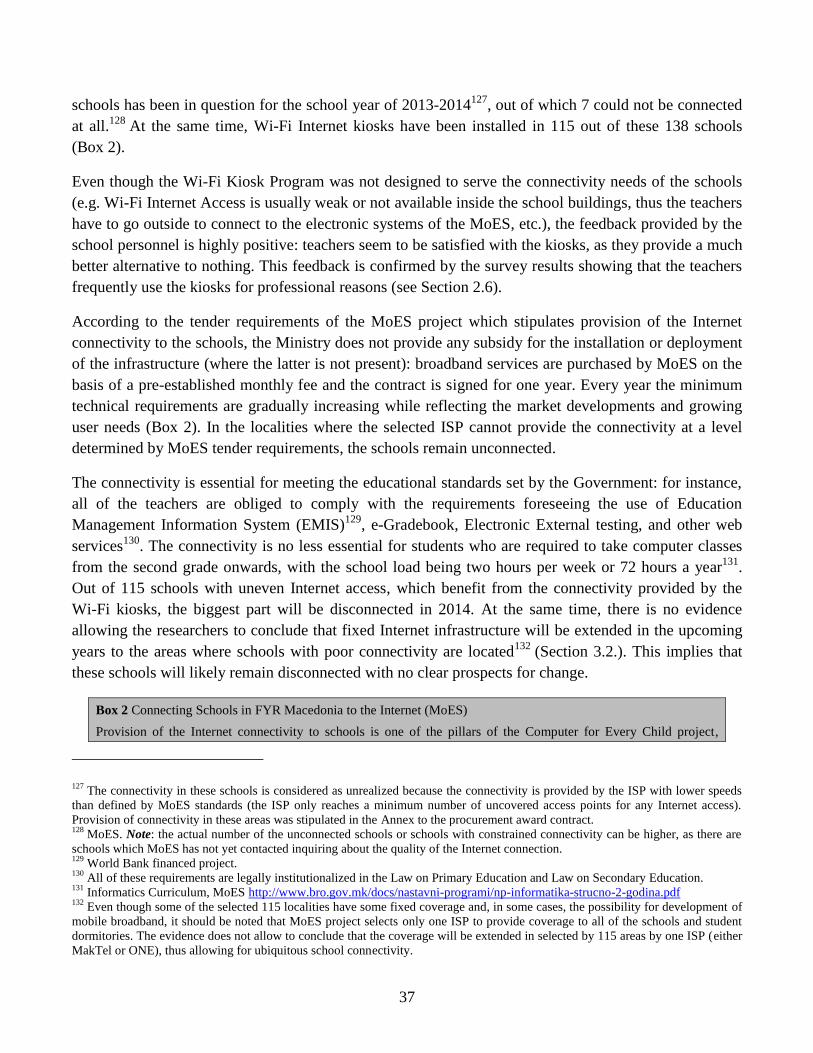
37
schools has been in question for the school year of 2013-2014127
, out of which 7 could not be connected
at all.128
At the same time, Wi-Fi Internet kiosks have been installed in 115 out of these 138 schools
(Box 2).
Even though the Wi-Fi Kiosk Program was not designed to serve the connectivity needs of the schools
(e.g. Wi-Fi Internet Access is usually weak or not available inside the school buildings, thus the teachers
have to go outside to connect to the electronic systems of the MoES, etc.), the feedback provided by the
school personnel is highly positive: teachers seem to be satisfied with the kiosks, as they provide a much
better alternative to nothing. This feedback is confirmed by the survey results showing that the teachers
frequently use the kiosks for professional reasons (see Section 2.6).
According to the tender requirements of the MoES project which stipulates provision of the Internet
connectivity to the schools, the Ministry does not provide any subsidy for the installation or deployment
of the infrastructure (where the latter is not present): broadband services are purchased by MoES on the
basis of a pre-established monthly fee and the contract is signed for one year. Every year the minimum
technical requirements are gradually increasing while reflecting the market developments and growing
user needs (Box 2). In the localities where the selected ISP cannot provide the connectivity at a level
determined by MoES tender requirements, the schools remain unconnected.
The connectivity is essential for meeting the educational standards set by the Government: for instance,
all of the teachers are obliged to comply with the requirements foreseeing the use of Education
Management Information System (EMIS)129
, e-Gradebook, Electronic External testing, and other web
services130
. The connectivity is no less essential for students who are required to take computer classes
from the second grade onwards, with the school load being two hours per week or 72 hours a year131
.
Out of 115 schools with uneven Internet access, which benefit from the connectivity provided by the
Wi-Fi kiosks, the biggest part will be disconnected in 2014. At the same time, there is no evidence
allowing the researchers to conclude that fixed Internet infrastructure will be extended in the upcoming
years to the areas where schools with poor connectivity are located132
(Section 3.2.). This implies that
these schools will likely remain disconnected with no clear prospects for change.
Box 2 Connecting Schools in FYR Macedonia to the Internet (MoES)
Provision of the Internet connectivity to schools is one of the pillars of the Computer for Every Child project,
127 The connectivity in these schools is considered as unrealized because the connectivity is provided by the ISP with lower speeds
than defined by MoES standards (the ISP only reaches a minimum number of uncovered access points for any Internet access).
Provision of connectivity in these areas was stipulated in the Annex to the procurement award contract. 128
MoES. Note: the actual number of the unconnected schools or schools with constrained connectivity can be higher, as there are
schools which MoES has not yet contacted inquiring about the quality of the Internet connection. 129
World Bank financed project. 130
All of these requirements are legally institutionalized in the Law on Primary Education and Law on Secondary Education. 131
Informatics Curriculum, MoES http://www.bro.gov.mk/docs/nastavni-programi/np-informatika-strucno-2-godina.pdf 132
Even though some of the selected 115 localities have some fixed coverage and, in some cases, the possibility for development of
mobile broadband, it should be noted that MoES project selects only one ISP to provide coverage to all of the schools and student
dormitories. The evidence does not allow to conclude that the coverage will be extended in selected by 115 areas by one ISP (either
MakTel or ONE), thus allowing for ubiquitous school connectivity.
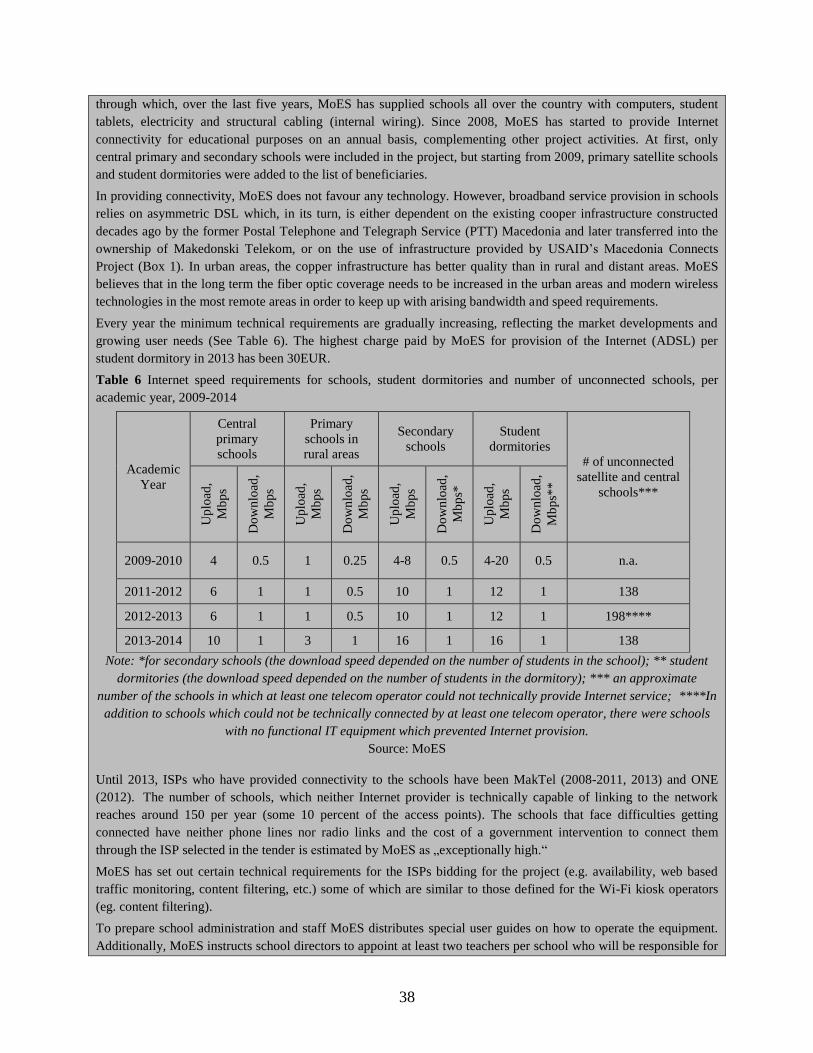
38
through which, over the last five years, MoES has supplied schools all over the country with computers, student
tablets, electricity and structural cabling (internal wiring). Since 2008, MoES has started to provide Internet
connectivity for educational purposes on an annual basis, complementing other project activities. At first, only
central primary and secondary schools were included in the project, but starting from 2009, primary satellite schools
and student dormitories were added to the list of beneficiaries.
In providing connectivity, MoES does not favour any technology. However, broadband service provision in schools
relies on asymmetric DSL which, in its turn, is either dependent on the existing cooper infrastructure constructed
decades ago by the former Postal Telephone and Telegraph Service (PTT) Macedonia and later transferred into the
ownership of Makedonski Telekom, or on the use of infrastructure provided by USAID’s Macedonia Connects
Project (Box 1). In urban areas, the copper infrastructure has better quality than in rural and distant areas. MoES
believes that in the long term the fiber optic coverage needs to be increased in the urban areas and modern wireless
technologies in the most remote areas in order to keep up with arising bandwidth and speed requirements.
Every year the minimum technical requirements are gradually increasing, reflecting the market developments and
growing user needs (See Table 6). The highest charge paid by MoES for provision of the Internet (ADSL) per
student dormitory in 2013 has been 30EUR.
Table 6 Internet speed requirements for schools, student dormitories and number of unconnected schools, per
academic year, 2009-2014
Academic
Year
Central
primary
schools
Primary
schools in
rural areas
Secondary
schools
Student
dormitories
# of unconnected
satellite and central
schools***
Up
load
,
Mb
ps
Do
wn
load
,
Mb
ps
Up
load
,
Mb
ps
Do
wn
load
,
Mb
ps
Up
load
,
Mb
ps
Do
wn
load
,
Mb
ps*
Up
load
,
Mb
ps
Do
wn
load
,
Mb
ps*
*
2009-2010 4 0.5 1 0.25 4-8 0.5 4-20 0.5 n.a.
2011-2012 6 1 1 0.5 10 1 12 1 138
2012-2013 6 1 1 0.5 10 1 12 1 198****
2013-2014 10 1 3 1 16 1 16 1 138
Note: *for secondary schools (the download speed depended on the number of students in the school); ** student
dormitories (the download speed depended on the number of students in the dormitory); *** an approximate
number of the schools in which at least one telecom operator could not technically provide Internet service; ****In
addition to schools which could not be technically connected by at least one telecom operator, there were schools
with no functional IT equipment which prevented Internet provision.
Source: MoES
Until 2013, ISPs who have provided connectivity to the schools have been MakTel (2008-2011, 2013) and ONE
(2012). The number of schools, which neither Internet provider is technically capable of linking to the network
reaches around 150 per year (some 10 percent of the access points). The schools that face difficulties getting
connected have neither phone lines nor radio links and the cost of a government intervention to connect them
through the ISP selected in the tender is estimated by MoES as „exceptionally high.“
MoES has set out certain technical requirements for the ISPs bidding for the project (e.g. availability, web based
traffic monitoring, content filtering, etc.) some of which are similar to those defined for the Wi-Fi kiosk operators
(eg. content filtering).
To prepare school administration and staff MoES distributes special user guides on how to operate the equipment.
Additionally, MoES instructs school directors to appoint at least two teachers per school who will be responsible for
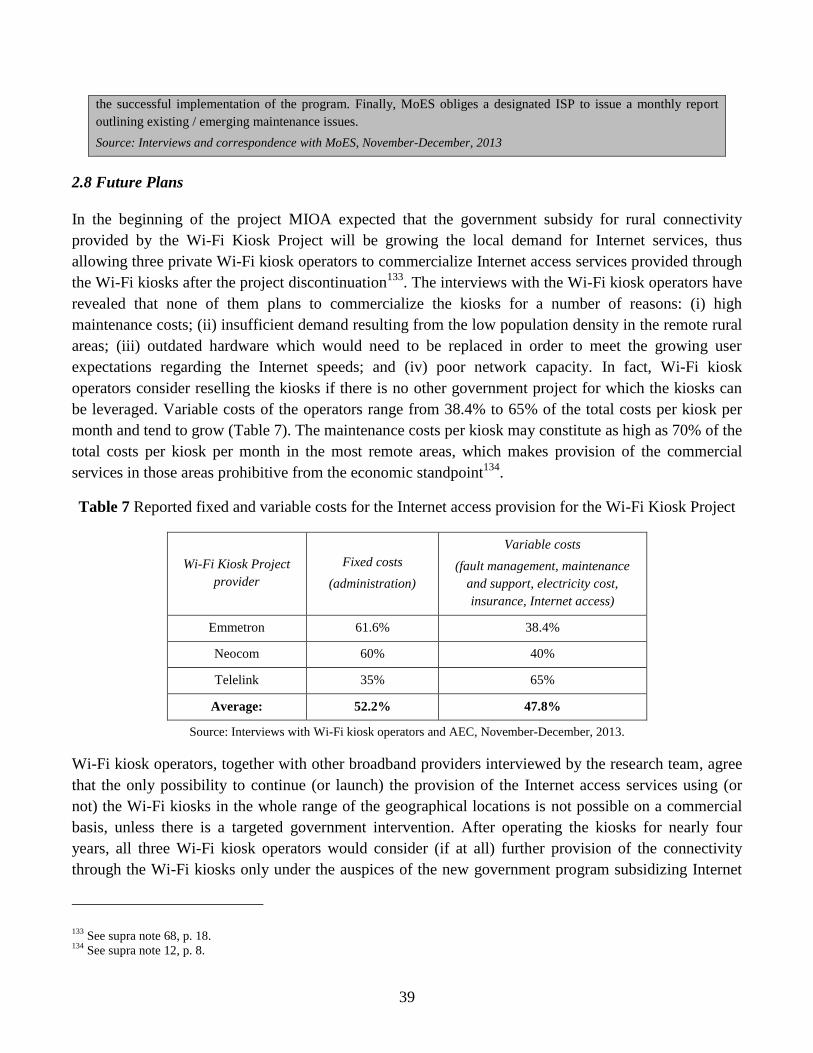
39
the successful implementation of the program. Finally, MoES obliges a designated ISP to issue a monthly report
outlining existing / emerging maintenance issues.
Source: Interviews and correspondence with MoES, November-December, 2013
2.8 Future Plans
In the beginning of the project MIOA expected that the government subsidy for rural connectivity
provided by the Wi-Fi Kiosk Project will be growing the local demand for Internet services, thus
allowing three private Wi-Fi kiosk operators to commercialize Internet access services provided through
the Wi-Fi kiosks after the project discontinuation133
. The interviews with the Wi-Fi kiosk operators have
revealed that none of them plans to commercialize the kiosks for a number of reasons: (i) high
maintenance costs; (ii) insufficient demand resulting from the low population density in the remote rural
areas; (iii) outdated hardware which would need to be replaced in order to meet the growing user
expectations regarding the Internet speeds; and (iv) poor network capacity. In fact, Wi-Fi kiosk
operators consider reselling the kiosks if there is no other government project for which the kiosks can
be leveraged. Variable costs of the operators range from 38.4% to 65% of the total costs per kiosk per
month and tend to grow (Table 7). The maintenance costs per kiosk may constitute as high as 70% of the
total costs per kiosk per month in the most remote areas, which makes provision of the commercial
services in those areas prohibitive from the economic standpoint134
.
Table 7 Reported fixed and variable costs for the Internet access provision for the Wi-Fi Kiosk Project
Wi-Fi Kiosk Project
provider
Fixed costs
(administration)
Variable costs
(fault management, maintenance
and support, electricity cost,
insurance, Internet access)
Emmetron 61.6% 38.4%
Neocom 60% 40%
Telelink 35% 65%
Average: 52.2% 47.8%
Source: Interviews with Wi-Fi kiosk operators and AEC, November-December, 2013.
Wi-Fi kiosk operators, together with other broadband providers interviewed by the research team, agree
that the only possibility to continue (or launch) the provision of the Internet access services using (or
not) the Wi-Fi kiosks in the whole range of the geographical locations is not possible on a commercial
basis, unless there is a targeted government intervention. After operating the kiosks for nearly four
years, all three Wi-Fi kiosk operators would consider (if at all) further provision of the connectivity
through the Wi-Fi kiosks only under the auspices of the new government program subsidizing Internet
133 See supra note 68, p. 18.
134 See supra note 12, p. 8.
40
access. As the provision of connectivity, particularly in some regions, is both challenging and costly, the
amount of current subsidy may not be sufficient to trigger the commercial interest to engage.
Furthermore, all three operators are unanimous that the backhaul infrastructure emerged as a bottleneck
for Internet access provision to the Wi-Fi kiosk locations and should be considerably upgraded to
provide higher capacity. Each of the operators has also expressed an opinion that the Wi-Fi coverage
and the speeds should be increased in order to provide better functionality for a greater number of
simultaneous users135
.
In case the project is not extended beyond its initially planned four years life circle, the first of the
kiosks will cease to operate in April, 2014, and the last - in September, 2016136
. In this vein, it is
important to determine whether the locations served with the Internet access today (through the kiosks)
will continue to be connected to the Internet in the near future or whether they are doomed to receive the
“Internet blackout.”
3. PUBLIC POLICY AND INITIATIVES ADDRESSING CONNECTIVITY IN RURAL
AREAS
From the policy standpoint, there are at least several policy initiatives aiming to address the connectivity
gap between the rural and urban areas. It should be noted, however, that research team did not locate any
initiatives addressing connectivity of those specific Wi-Fi locations beyond the project lifecycle.
National Strategy for the Development of the Next Generation of Broadband Internet
In April 2009 FYR Macedonia has adopted the ‘National Strategy for the Development of the Next
Generation of Broadband Internet’ (hereinafter - Broadband strategy), together with an action plan for
its implementation.137
The Ministry of Transport and Communications138
announced the plans which
also set out a series of initiatives aimed at resolving a number of key connectivity issues such as the
broadband access provision in the rural areas. Despite the fact that FYR Macedonia does not specify any
specific broadband coverage targets (Box 3) the country has established a set of initiatives aiming to put
in place a basis for the broadband infrastructure development in the rural areas, with municipalities
playing the pivotal role.
For instance, Section II.8 of the strategy posits that the local governments shall within one and a half
year adopt local ICT strategies (Measure 2.8.a), Campaign on the advantages and benefits from
constructing and development of municipal electronic communications networks as a basis for an
information society (Measure 2.8.b). However, to date only near 1/4 of 84 municipalities have adopted
135 See supra note 12, p. 8.
136 Ibid.
137“Parliament adopts next generation of broadband development plan.” 2009. TeleGeography.
http://www.TeleGeography.com/products/commsupdate/articles/2009/04/23/parliament-adopts-next-generation-of-broadband-
development-plan/ 138
Eventually restructured into MIOA.
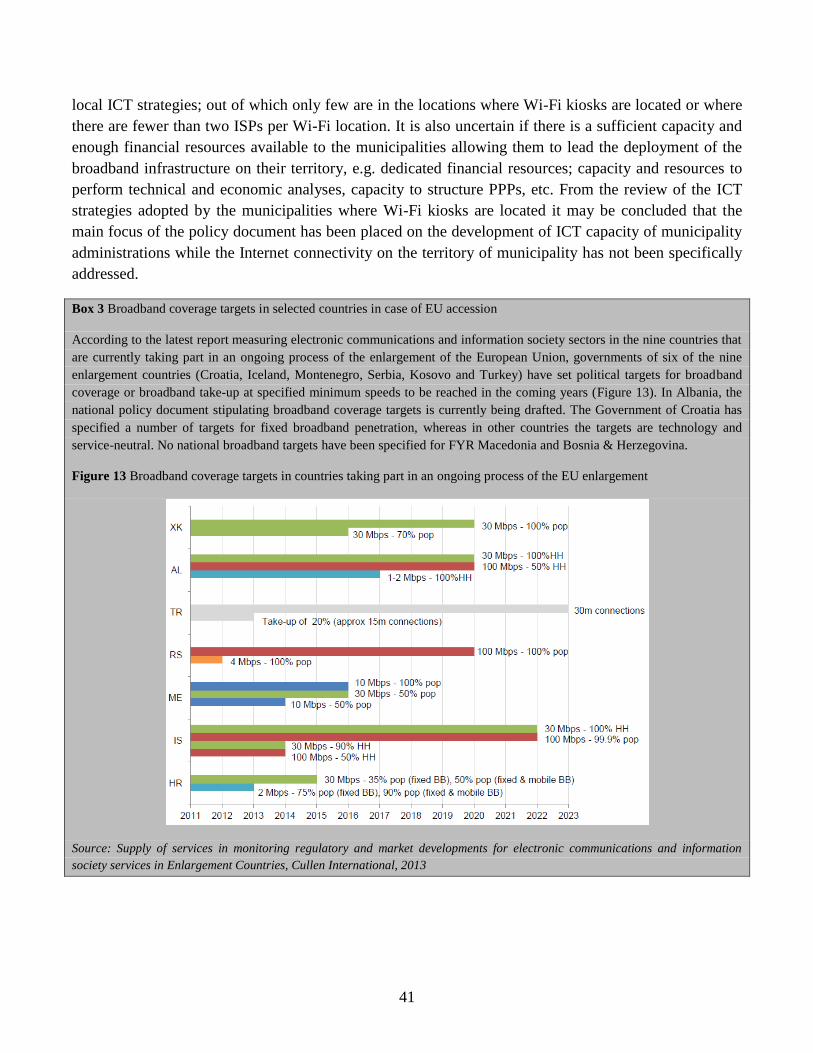
41
local ICT strategies; out of which only few are in the locations where Wi-Fi kiosks are located or where
there are fewer than two ISPs per Wi-Fi location. It is also uncertain if there is a sufficient capacity and
enough financial resources available to the municipalities allowing them to lead the deployment of the
broadband infrastructure on their territory, e.g. dedicated financial resources; capacity and resources to
perform technical and economic analyses, capacity to structure PPPs, etc. From the review of the ICT
strategies adopted by the municipalities where Wi-Fi kiosks are located it may be concluded that the
main focus of the policy document has been placed on the development of ICT capacity of municipality
administrations while the Internet connectivity on the territory of municipality has not been specifically
addressed.
Box 3 Broadband coverage targets in selected countries in case of EU accession
According to the latest report measuring electronic communications and information society sectors in the nine countries that
are currently taking part in an ongoing process of the enlargement of the European Union, governments of six of the nine
enlargement countries (Croatia, Iceland, Montenegro, Serbia, Kosovo and Turkey) have set political targets for broadband
coverage or broadband take-up at specified minimum speeds to be reached in the coming years (Figure 13). In Albania, the
national policy document stipulating broadband coverage targets is currently being drafted. The Government of Croatia has
specified a number of targets for fixed broadband penetration, whereas in other countries the targets are technology and
service-neutral. No national broadband targets have been specified for FYR Macedonia and Bosnia & Herzegovina.
Figure 13 Broadband coverage targets in countries taking part in an ongoing process of the EU enlargement
Source: Supply of services in monitoring regulatory and market developments for electronic communications and information
society services in Enlargement Countries, Cullen International, 2013
42
e-Inclusion Strategy
In May 2011, the Government of FYR Macedonia has adopted e-Inclusion Strategy (2011-2014) 139
reflecting European policies and legislation in the area of digital inclusion and information society. The
strategy defines a list of priorities, goals, and measures needed to create an inclusive information society
in view of socioeconomic and demographic peculiarities of FYR Macedonia. The main goal of the
Strategy is to reduce the digital divide and create an inclusive information society, which is responsive
to the needs of all citizens by providing better quality and increased use of ICTs in everyday life,
creating conditions for easier access to ICTs, and increasing ICT skills of the population. Several
projects were realized prior to the Strategy adoption in 2007-2008, including provision of free basic IT
courses for 40,000 residents of selected municipalities, allocation of connectivity subsidy which allowed
all citizens to enjoy a total of four months of free Internet in the year of 2008, direct financial assistance
to full-time students who were assigned value vouchers for purchasing personal computers, and
provision of Internet connectivity through computer clubs in 15 different cities. Fifteen computer clubs
were opened for free use for all interested citizens under the auspices of “The world at your fingertips”
project in 2007 and 2008. In 2009 and 2010, there were 22 cyber cafes. On the basis of these facilities
the government was able to subsidize specialized advanced IT course training for 80 unemployed.
As a whole, e-Inclusion strategy makes a strong focus on the educational aspects and puts together
actions aiming to create enabling environment for ICT skills development, e.g. free Internet clubs, etc.
However this strategy does not specifically address the sustainability of the Wi-Fi Kiosk Project; neither
it foresees how the digital divide will be addressed in the locations that are today served with free Wi-Fi
Internet access.
Five year regulatory strategy of AEC
As implementation of the requirements laid out in the Broadband strategy AEC has adopted its Five year
regulatory strategy (AEC’s strategy) in 2012.140
In addition to outlining certain regulatory issues AEC’s
strategy explains the regulator’s approach towards Broadband Universal Service Obligation (USO),
which, as a matter of fact, may be used to address the universality of broadband coverage across the
country, including its rural and remote areas. For instance, in Croatia and Montenegro the basic
broadband coverage targets have been included in the USO: Montenegro – 144 kbps (since January
2011); Croatia – 144 kbps (since March 2013); 1 Mbps (since January 2015).
At the moment, MIOA is preparing amendments to the draft law which will include provisions on the
addition of the broadband service into the set of USO which currently include directory inquiries and
telephony. The draft law is expected to be adopted in spring 2014. At the moment of writing of this
139 “National e-Inclusion Strategy 2011-2014”. 2011. MIOA. http://www.mio.gov.mk/files/pdf/dokumenti/Strategija_za_e-
vklucuvanje.pdf 140
“Five years regulatory strategy of AEK”. 2012. AEC.
http://www.aec.mk/index.php?option=com_content&view=article&id=580&Itemid=103&lang=en
43
paper the implementation details of the USO reform were not determined. It also remains unclear if and
how exactly these funds may support the development of the connectivity in Wi-Fi kiosk locations.
4. OBSERVATIONS AND RECOMMENDATIONS
Observations
1. Wi-Fi Kiosk Project brought Internet connectivity to nearly all of the locations for the first
time. This was named among the biggest achievements of the project and supported by all the
interviewees. It is also evident that the Internet connectivity brought into the most remote
communities is moderately but also increasingly used by local inhabitants. Better education on
how to use Internet (digital literacy), increased information about the kiosk location and services
it provides for the local community and increased amount of services and applications relevant
for the needs of the local community could foster higher usage and user penetration.
2. The benefits provided by the Wi-Fi Kiosk Project go beyond those initially foreseen. It was
found that satellite schools, which would remain unconnected under MoES project, are receiving
Wi-Fi connectivity from the kiosks. For example, 115 schools with unrealized connectivity under
the MoES initiative in the school year 2013-2014 are benefiting from the Internet connectivity
provided by the Wi-Fi kiosks. School administration, teachers, and students constitute one
stakeholder group that most often uses the Wi-Fi kiosks to satisfy certain professional and
educational needs, some of which are stipulated in the Law on Primary Education and Law on
Secondary Education;
3. Implementation of the Wi-Fi Kiosk Project may be considered fairly effective. MIOA put in
place a workable framework for operation of the kiosks. No major issues related to the
implementation and (or) operation of the project were identified.
4. Key survey factoids: A primary group of the project beneficiaries constitutes rural schools’
administrators, teachers, and students: almost 81% of 270 Wi-Fi kiosk users are connected
with the local schools. Young people (under 35 years old) constitute the most represented
age group (73%).
Over time, Wi-Fi kiosks have been most often used for educational, professional purposes,
and leisure. Majority of kiosk users acknowledge that the amount they spend on the kiosks has
increased with time. The reasons that can make users utilize the kiosks more frequently include:
(i) improved digital literacy; (ii) increased information about the kiosk location and the
services it provides for the local community; and (iii) increased services and applications
relevant to the needs of the local community. Most often, Wi-Fi kiosk users complain about
the kiosk speed, and to a lesser extent – about the kiosk model, location, and setup.
44
Wi-Fi kiosks help users fully or to some extent browse the Internet (~45%), get quick
information on something they really need (40%), acquire valuable information on certain topics
(44%), get information on political processes or participate in democratic processes (24%), and
communicate with others (22%). If the Wi-Fi kiosks were de-installed the majority of
villagers would be somewhat or really disappointed, as there is a real demand for the
kiosks.
5. Although there is not enough information to draw definitive conclusions upon the development
of the Internet coverage in Wi-Fi kiosk locations since the project launch, at the moment of
writing this Paper, in ~69% (470) of all of the Wi-Fi kiosk locations there have been fewer
than two ISPs and in ~8% (52) of all of the Wi-Fi kiosk locations commercial Internet
access is not available at all.
6. Broadband prices, although fairly affordable for the average household in FYR
Macedonia, remain far too high for the population with lower incomes. The price for the
cheapest available broadband package, in case of a representative of the poorest average
household in FYR Macedonia, is likely to range from 7.21% of the monthly disposable income
(mobile broadband) to 10.84% or higher (fixed broadband). An at-risk-of-poverty household is
likely to need from 15.14% to 22.75% of its average disposable income per month to afford
mobile and fixed broadband, respectively. Broadband is even more expensive for the lowest 40%
of the total population by income who will need to pay 20.49% of their monthly disposable
income to afford mobile broadband and 30.79% - for fixed broadband;
7. Low broadband coverage in 680 villages where the Wi-Fi kiosks are located has remained
stable for a number of years and the evidence suggests that the situation is unlikely to
improve in the short to medium term. According to MoES, the number of the rural schools
that face connectivity issues or cannot be connected at all remains in the range of 138-150
starting from 2009. The survey commissioned in 66 localities where the Wi-Fi kiosks have been
installed has shown that around 1/3 of respondents who don’t have Internet at home happen to
live in the localities with an installed Wi-Fi kiosk, and 82.7% of respondents believe that there
is a demand (need) for the Wi-Fi kiosks;
8. According to the EU State aid rules, the government support is potentially required in
remaining ~77% locations (out 522 of 680) in order to address the digital divide. In over
69% (470) of all the locations where the Wi-Fi kiosk are currently operating there are no more
than one commercial Internet access provider and in ~8% (52) of all the locations commercial
internet access is not available making the Wi-Fi kiosks the only remaining alternative;
9. National policy framework in a way that it addresses the rural connectivity puts a
significant emphasis on the role of the local municipalities. It is uncertain if there is a
sufficient capacity and financial resources available to the municipalities allowing them to lead
45
the deployment of the broadband infrastructure on their territory, e.g., to perform technical and
economic analysis, to structure PPPs, etc.;
10. There is a risk that the locations served with the Internet access today (through the Wi-Fi
Kiosk Project) will be doomed to receive the “Internet blackout” after the project
discontinuation. Low coverage of commercial ISP networks in rural areas, low population
density, and relatively high prices for broadband Internet access services provide the basis to
presume that despite the growing local demand for Internet services, as of today there is an
insufficient business case to have the Wi-Fi kiosks commercialized after the project
discontinuation either by three operators or other ISPs. This presumption is consistent with the
opinion of the Wi-Fi kiosk operators who all have confirmed their lack of intention to continue
providing the service on a commercial basis after the project closing date. High maintenance
costs, a low number of potential users, and the need for further investments to upgrade / deploy
the backbone and backhaul infrastructure, replace the outdated hardware, increase the low
Internet access speeds have been cited as the rationale.
Recommendations
1. It is recommended that MIOA ensure that important achievements of the project, such as
the newly-deployed connectivity in the most remote and rural communities, are preserved
and leveraged after the project closing date. Closing kiosks without offering an alternative
source of connectivity may potentially have a negative social impact and will contribute to
increasing the digital divide. It is also worth pointing that the areas with fewer than two operators
are unlikely to be covered with additional ISPs in the foreseeable future;
2. Alternative program (project) needs to be designed to specifically address the connectivity
in the areas with zero or only one ISP, thus ensuring that the efforts to bridge the digital
divide will continue. In this regard, for instance, local ICT strategies’ development and
implementation could be accelerated to have higher capacity networks deployed in order to
sustain the growing demand coming from the local community. Existing backhaul / backbone
infrastructure connecting the remote areas may be not sufficient to sustain high speed internet
connectivity. Thus, existing backhaul / backbone infrastructure needs to be upgraded and (or)
new infrastructure should be deployed;
3. In the alternative program (project) or any other future endeavours MIOA should clearly
identify project / program objectives, set key performance indicators, design a robust
monitoring, reporting, and evaluation framework. As objectives and KPIs should be
measurable and systematically measured, so should the oversight framework be robust and
action-oriented. Lessons learnt from one project ought to be proactively incorporated into the
next, thus creating the repository of good government ICT practice.
4. MIOA may consider establishing a framework and outlining a set of indicators to collect
and monitor the broadband coverage, pricing and Internet usage development in the rural
46
areas (e.g. interactive maps, provision of information about the coverage, services, operators,
level of ownership and usage of smart phones, tablets, laptops and desk computers, etc.). This
approach will allow to better adjust state policy and regulatory measures to the realities on the
ground. It will also help identify which, where, and for how long the government interventions
are needed. As of today, the data related to the broadband coverage (as well as pricing141
) are
neither systematically collected nor analysed by any government institution, which makes it
challenging to determine the precise broadband coverage and its development dynamics. At the
same time, it is worth emphasizing that the rural population in FYR Macedonia is sizeable
(40.6% of the total population) and its information and communication needs should be properly
addressed.
5. Development of e-government services and applications should take into account the state
of Internet access development in the rural areas and peculiar needs of the local
population. The former includes Internet access issues such as lower average speeds and failing
backbone connectivity as well as specific factors directly affecting Internet development (e.g. the
fairly high rate of mobile phones in households (88.6%). The latter include the needs arising
from lower wages and salaries, higher levels of self-employment in agriculture, and local work
migration flows.
A good example of an application designed to meet the needs of the country’s rural population
while heeding local consumer behaviour and purchasing power is the recently-launched mobile
wallet service “MobiPay”, a brainchild of T-Mobile. In view of the low penetration of smart
phones in the country, this service has been designed using Data over Voice technology to be
accessible on all mobile phones. “MobiPay” allows users to make payments in cafes,
supermarkets, gas stations, taxis, etc. suing a mobile handset142
. Even without resorting to
commissioning creation of certain services or apps to the private sector MIOA can consider
organizing a civic apps hackathon(s) or similar contest(s) intended to spur innovation for
the benefit of rural un- and underserved populations.
6. Along with development of e-government services and applications, it is recommended that
MIOA should initiate a capacity building program intended to increase the Internet usage
and digital literacy in rural areas. To reach better results, their sustainability and local project
ownership, it is suggested that MIOA consider conducting / commissioning a study looking into
specific social and economic issues faced by the rural population which can be tackled through
ICTs (eg. A study on how unemployment can be tackled or how agricultural productivity can be
raised).
141 The level of laptop ownership can be tracked to a certain extent through the outcomes of MIOA’s Laptop Program targeting
university graduates. World Bank’s team has requested certain data on this project, but has not received it by the deadline. 142
“T-Mobile launches m-wallet service in Macedonia”. 2013. Telecompaper. http://www.telecompaper.com/news/t-mobile-
launches-m-wallet-service-in-macedonia--952007 and “T-Mobile to launch m-wallet service in Macedonia”. 2013. Telecompaper.
http://www.telecompaper.com/news/t-mobile-to-launch-m-payment-service-in-macedonia--926957
47
7. When introducing e-government services and applications (or any other similar ICT
program) it is vital that MIOA clearly communicate to the beneficiaries the remit of e-
government and how specific services and applications function. The rate of vandalism and
several news reports covering the Wi-Fi Kiosk Project (see Annex E) have demonstrated a
certain lack of understanding, acceptance, and ownership of the project, which could have been
averted through a carefully designed and timely implemented communications campaign
explaining the benefits of the government intervention. The survey findings also point to the
need of increasing digital literacy and the amount of services and applications relevant to the
needs of the local community.
8. In view of the operators’ unwillingness to leverage existing Wi-Fi Internet Access Kiosks to
develop business activities, MIOA should consider subsidizing the project further but in a
more limited scope, benefiting primarily select localities with no or only one ISP. As an
alternative, MIOA and MoES can join forces in providing connectivity to the general public as
well as schools whereby the WiFi kiosks in select localities can be maintained and upgraded
under the annual MoES procurement143
. The projects of both ministries are complementary and
could be united under one framework.
143 MoES procurement would need to be amended to become more inclusive of the smaller ISPs operating in certain rural areas.