Macalester Journal of Physics and Astronomy
20
Macalester Journal of Physics and Astronomy Macalester Journal of Physics and Astronomy Volume 1 Issue 1 Spring 2013 Article 15 May 2013 Photometric and Spectroscopic Analysis of Young, Nearby Open Photometric and Spectroscopic Analysis of Young, Nearby Open Cluster Collinder 70 Cluster Collinder 70 Clara M. Thomann Macalester College, [email protected] Follow this and additional works at: https://digitalcommons.macalester.edu/mjpa Part of the Astrophysics and Astronomy Commons, and the Physics Commons Recommended Citation Recommended Citation Thomann, Clara M. (2013) "Photometric and Spectroscopic Analysis of Young, Nearby Open Cluster Collinder 70," Macalester Journal of Physics and Astronomy: Vol. 1 : Iss. 1 , Article 15. Available at: https://digitalcommons.macalester.edu/mjpa/vol1/iss1/15 This Capstone is brought to you for free and open access by the Physics and Astronomy Department at DigitalCommons@Macalester College. It has been accepted for inclusion in Macalester Journal of Physics and Astronomy by an authorized editor of DigitalCommons@Macalester College. For more information, please contact [email protected].
Transcript of Macalester Journal of Physics and Astronomy

Macalester Journal of Physics and Astronomy Macalester Journal of Physics and Astronomy
Volume 1 Issue 1 Spring 2013 Article 15
May 2013
Photometric and Spectroscopic Analysis of Young, Nearby Open Photometric and Spectroscopic Analysis of Young, Nearby Open
Cluster Collinder 70 Cluster Collinder 70
Clara M. Thomann Macalester College, [email protected]
Follow this and additional works at: https://digitalcommons.macalester.edu/mjpa
Part of the Astrophysics and Astronomy Commons, and the Physics Commons
Recommended Citation Recommended Citation Thomann, Clara M. (2013) "Photometric and Spectroscopic Analysis of Young, Nearby Open Cluster Collinder 70," Macalester Journal of Physics and Astronomy: Vol. 1 : Iss. 1 , Article 15. Available at: https://digitalcommons.macalester.edu/mjpa/vol1/iss1/15
This Capstone is brought to you for free and open access by the Physics and Astronomy Department at DigitalCommons@Macalester College. It has been accepted for inclusion in Macalester Journal of Physics and Astronomy by an authorized editor of DigitalCommons@Macalester College. For more information, please contact [email protected].

Photometric and Spectroscopic Analysis of Young, Nearby Open Cluster Collinder Photometric and Spectroscopic Analysis of Young, Nearby Open Cluster Collinder 70 70
Abstract Abstract We present the results of a wide-field (80’ x 80’) photometric and spectroscopic survey of the young open cluster Collinder 70, which is also known as the ORI OB 1b association, centered on the central star of Orion’s belt, ε Ori (Alnilam). Seventy Coll 70 spectroscopy targets were selected from BVRIc color magnitude diagrams for observation using the CTIO HYDRA multi-object spectrograph; we aimed to identify targets exhibiting H" in emission and a strong lithium 6708Å line in absorption. About a third of our targets (23/70 stars) are consistent with being youthful members of Coll 70. Intermediate resolution (R!20000) HYDRA Li I 6708Å equivalent widths and Baraffe et al. (2002) evolutionary models strongly suggest that this association is << 30 Myr. Observational evidence showing that some stars exhibit primordial levels of lithium, giant-like features in low-resolution spectra and the presence of infra-red excesses indicate that the association is considerably younger than 30 Myr and is a potentially valuable target for age determination using the Lithium Depletion Boundary method.
Keywords Keywords open clusters, lithium, Collinder 70
This capstone is available in Macalester Journal of Physics and Astronomy: https://digitalcommons.macalester.edu/mjpa/vol1/iss1/15

Photometric and Spectroscopic Analysis
of Young, Nearby Open Cluster Collinder 70
Clara M. Thomann1, David D. James2, Owen Boberg3, Phillip Cargile4, and Alicia Aarnio5
Cerro Tololo Inter-American Observatory, La Serena, Chile
ABSTRACT
We present the results of a wide-field (80’ x 80’) photometric and spectroscopic
survey of the young open cluster Collinder 70, which is also known as the ORI OB
1b association, centered on the central star of Orion’s belt, ε Ori (Alnilam). Seventy
Coll 70 spectroscopy targets were selected from BVRIc color magnitude diagrams for
observation using the CTIO HYDRA multi-object spectrograph; we aimed to identify
targets exhibiting Hα in emission and a strong lithium 6708A line in absorption. About
a third of our targets (23/70 stars) are consistent with being youthful members of
Coll 70. Intermediate resolution (R∼20000) HYDRA Li I 6708A equivalent widths
and Baraffe et al. (2002) evolutionary models strongly suggest that this association is
"30 Myr. Observational evidence showing that some stars exhibit primordial levels
of lithium, giant-like features in low-resolution spectra and the presence of infra-red
excesses indicate that the association is considerably younger than 30 Myr and is a
potentially valuable target for age determination using the Lithium Depletion Boundary
method.
Subject headings: open clusters, lithium, Collinder 70
1. Introduction
Initial observations indicated a group of 55 A and B stars around Epsilon Ori (or Alnilam), a B0
super giant located in the Orion constellation. According to the initial mass function, this collection
of high-mass stars would indicate hundreds of low mass stars in the vicinity, but these stars had
yet to be studied. This grouping of high- and low-mass stars is called open cluster Collinder 70,
otherwise known as Epsilon Ori. Collinder 70 is amenable to in-depth analysis since it is close
(roughly 400 pc away), and located out of the galactic plane and away from the galactic center,
thus reducing extinction and contamination of foreground and background stars. B0 stars like
Alnilam are estimated to live about 10 Myr, and as a member of Collinder 70 indicates youth that
would provide a unique snapshot of stellar evolution. If Collinder 70 is less than 10 Myr old, we
would hope to find low-mass stars moving onto the main sequence, higher mass stars beginning to
1Macalester College, Research Assistant for CTIO 2012 REU program
2Visiting Astronomer, Cerro Tololo Inter-American Observatory (CTIO). CTIO is operated by AURA, Inc. under
contract to the National Science Foundation.
3Fullbright Scholar, CTIO
4Post-Doctorate Research Scientist, Dept of Physics & Astronomy, Vanderbilt University
4Post-Doctorate Research Scientist, Dept of Astronomy, University of Michigan - Ann Arbor
1
Thomann: Photometric and Spectroscopic Analysis of Young, Nearby Open Cluster Collinder 70
Published by DigitalCommons@Macalester College, 2013

– 2 –
burn helium in their cores, Classical T Tauri stars with thick circumstellar disks emitting infrared
excess, and giant-like pre-main sequence (PMS) stars.
Open clusters in general are of particular interest because they are an excellent test bed for stellar
evolution astrophysics. Since the stars formed from the same molecular cloud, they should have the
same age, metallicity, distance, proper motion and systemic velocity. These parameters therefore
provide a homogeneity to allow comparison between stars within the cluster.
While none of these parameters are easy to quote with certainty, the age of a cluster can act as
a timestamp for the observed stellar processes. As a cluster ages, more solar-type stars contract,
expel circumstellar disks and interstellar dust, and join the main sequence. More massive stars will
burn through the hydrogen fueling fusion and evolve into red giants or traumatically explode into
supernovae. Models exist to describe a star of a certain mass, metallicity, and temperature at a
particular age, but it is difficult to verify these models without a precise age. Yet, how does one age
a cluster of stars? The three methods used to analyze Collinder 70 were isochronal fitting to the
upper and lower main sequence —“turn-on” and “turn-off” ages — and calculating the amount of
lithium in the stars, known as the lithium depletion boundary age. The isochrone fitting methods
are degenerate to distance, metallicity, and age. In an attempt find another age not completely
dependent on photometry, this paper will focus on the spectroscopically identified lithium depletion
boundary age to compare to the other two methods in the future. Lithium abundances are currently
derived for seven clusters, hence independently listing three ages for the same cluster is a unique
check on accepted stellar models.
1.1. Lithium Depletion in Stars
Before diving into the research, I would like to introduce the theory behind measuring the amount
of lithium in Collinder 70. The lithium depletion boundary, sensitive to temperature, mass and
age, is a consequence of the ephemeral nature of lithium. Essentially, lithium is easy to destroy
yet difficult to create. Lithium burns in stars once the core reaches the threshold temperature of
3×10⁶ K (Jeffries & Naylor 2001). It is depleted more rapidly in low mass stars since the convective
cores reach deeper in the star and continuously renew the material in contact with the threshold
temperature (Jeffries & Naylor 2001). If a star has lithium abundances at the primordial amount,
this would hint towards a star that has not reached this temperature in its core.
Measuring the lithium absorption feature can be difficult since it is sensitive to many conditions.
For example, young stars commonly rotate rapidly, producing broad lines which cannot be robustly
modeled by a Gaussian function, and may include other nearby absorption features. Pre-main
sequence (PMS) stars with a thick circumstellar disk may be veiled, which result in hot continuum
emission filling in an absorption line. Veiling, originally described in (Calvet & Gullbring 1998) and
common in Classical T Tauri stars, is from a shock forming in the photosphere caused by accreting
matter in the circumstellar region.
2
Macalester Journal of Physics and Astronomy, Vol. 1, Iss. 1 [2013], Art. 15
https://digitalcommons.macalester.edu/mjpa/vol1/iss1/15
– 3 –
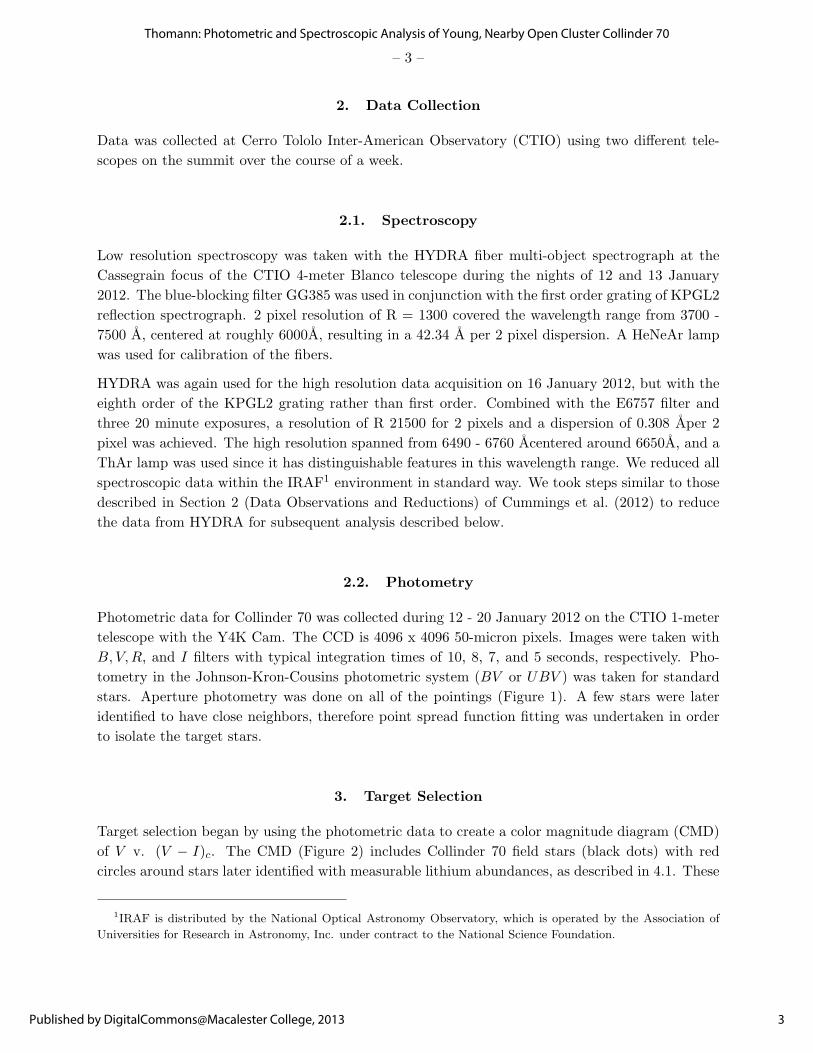
2. Data Collection
Data was collected at Cerro Tololo Inter-American Observatory (CTIO) using two different tele-
scopes on the summit over the course of a week.
2.1. Spectroscopy
Low resolution spectroscopy was taken with the HYDRA fiber multi-object spectrograph at the
Cassegrain focus of the CTIO 4-meter Blanco telescope during the nights of 12 and 13 January
2012. The blue-blocking filter GG385 was used in conjunction with the first order grating of KPGL2
reflection spectrograph. 2 pixel resolution of R = 1300 covered the wavelength range from 3700 -
7500 A, centered at roughly 6000A, resulting in a 42.34 A per 2 pixel dispersion. A HeNeAr lamp
was used for calibration of the fibers.
HYDRA was again used for the high resolution data acquisition on 16 January 2012, but with the
eighth order of the KPGL2 grating rather than first order. Combined with the E6757 filter and
three 20 minute exposures, a resolution of R 21500 for 2 pixels and a dispersion of 0.308 Aper 2
pixel was achieved. The high resolution spanned from 6490 - 6760 Acentered around 6650A, and a
ThAr lamp was used since it has distinguishable features in this wavelength range. We reduced all
spectroscopic data within the IRAF1 environment in standard way. We took steps similar to those
described in Section 2 (Data Observations and Reductions) of Cummings et al. (2012) to reduce
the data from HYDRA for subsequent analysis described below.
2.2. Photometry
Photometric data for Collinder 70 was collected during 12 - 20 January 2012 on the CTIO 1-meter
telescope with the Y4K Cam. The CCD is 4096 x 4096 50-micron pixels. Images were taken with
B, V,R, and I filters with typical integration times of 10, 8, 7, and 5 seconds, respectively. Pho-
tometry in the Johnson-Kron-Cousins photometric system (BV or UBV ) was taken for standard
stars. Aperture photometry was done on all of the pointings (Figure 1). A few stars were later
identified to have close neighbors, therefore point spread function fitting was undertaken in order
to isolate the target stars.
3. Target Selection
Target selection began by using the photometric data to create a color magnitude diagram (CMD)
of V v. (V − I)c. The CMD (Figure 2) includes Collinder 70 field stars (black dots) with red
circles around stars later identified with measurable lithium abundances, as described in 4.1. These
1IRAF is distributed by the National Optical Astronomy Observatory, which is operated by the Association of
Universities for Research in Astronomy, Inc. under contract to the National Science Foundation.
3
Thomann: Photometric and Spectroscopic Analysis of Young, Nearby Open Cluster Collinder 70
Published by DigitalCommons@Macalester College, 2013

– 4 –
red encircled stars populate near the 10 Myr isochrone from D’Antona & Mazzetelli (1997), high-
lighting the fact that target selection began with picking stars around this model isochrone. The
isochrone is degenerate with respects to age, distance, metallicity, and reddening, thus changing
these parameters alters which stars cluster around the model isochrone. In other words, if I were
to slightly change the metallicity or distance of the model isochrone, I could manipulate the other
parameters such that the isochrone would appear in the exact same location as shown in (Figure 2),
yet would represent a completely different set of stars. These two isochrones would appear to be
identical only illuminating the shortcomings of the isochronal models.
These 70 stars then underwent low resolution spectroscopic observations spanning nearly 4000 As of
wavelength space for initial detection of lithium as described below in Section 4. The low resolution
also allows us to rule out background giants by discounting stars with redshifted high mass spectral
types. For example, Figure 3 is one low resolution spectra that has Hα emission, Li absorption for
a low-mass star spectral type — thus a Collinder 70 candidate.
Next, high resolution (Figure 4) spectroscopy was collected in order to measure the neutral lithium,
Hα and radial velocity of each target star. How these measurements are made is described below
in Section 4. Any star with neutral lithium are considered members until further observations can
conclusively discount them.
4. Measurements
4.1. Lithium I equivalent widths (Li I EW)
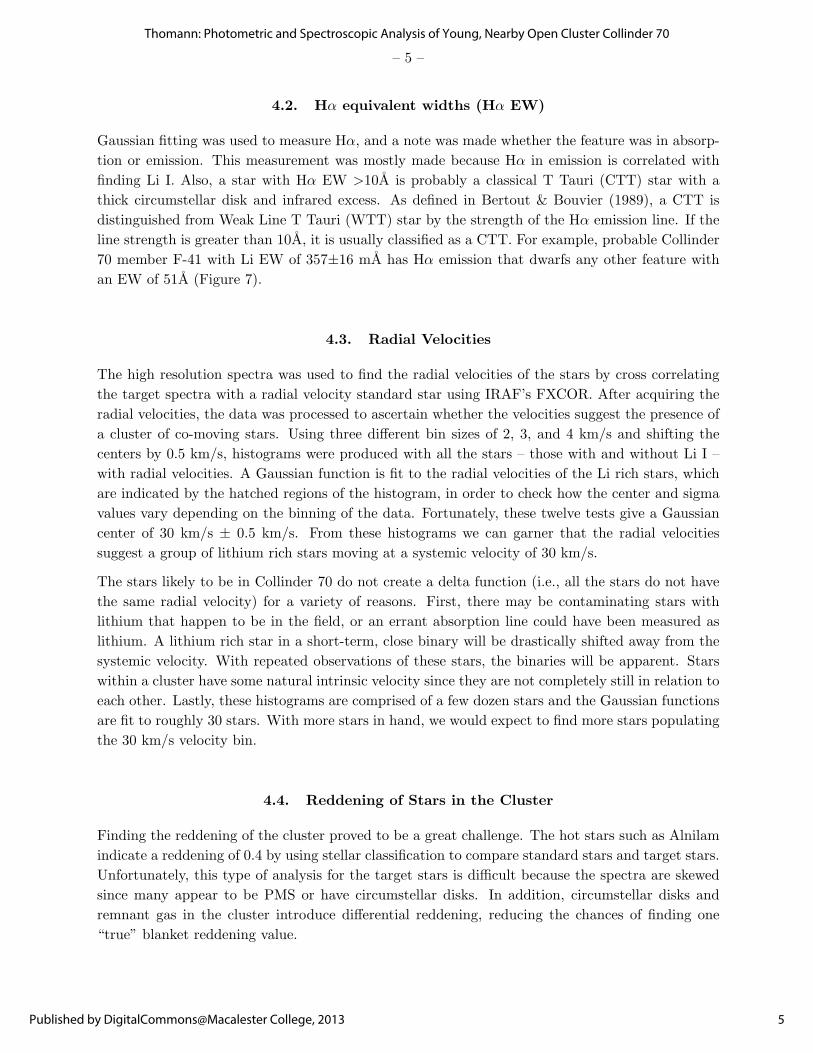
To measure the amount of lithium, we used two different methods to derive the equivalent width of
a normalized spectra — direct integration and Gaussian fitting. Direct integration is sensitive to
noise in the absorption line while Gaussian fitted methods can more easily measure an equivalent
width regardless of spikes, as shown in Figure 5. For error of the lithium measurements, we used
the Jeffries et al. (2009) equation
σEW =[
1.5√
(pw)]
/SNR (1)
In this equation, p is pixel size, w is the full width half max of the absorption feature, and SNR
is the signal to noise ratio for each spectrum. We measured SNR around a pseudo continuum 10
piece of the spectrum centered at 6600A. If a star had no lithium absorption line, we used the full
width half max (FWHM) of the Fe I (6677A) or Ca I (6718A) line to estimate a 3σ upper limit for
lithium in the star.
To check if these two methods for measuring absorption features are robust, we plotted direct
integration EW vs Gaussian fitted EW for all stars with Li, as shown in Figure 6. Member stars
jump out above 200 mA with most of the stars falling along the equivalency line. The apparently
errant stars appear spectroscopically as broad features, possibly indicating stars that are rapidly
rotating but still contain lithium.
4
Macalester Journal of Physics and Astronomy, Vol. 1, Iss. 1 [2013], Art. 15
https://digitalcommons.macalester.edu/mjpa/vol1/iss1/15
– 5 –
4.2. Hα equivalent widths (Hα EW)
Gaussian fitting was used to measure Hα, and a note was made whether the feature was in absorp-
tion or emission. This measurement was mostly made because Hα in emission is correlated with
finding Li I. Also, a star with Hα EW >10A is probably a classical T Tauri (CTT) star with a
thick circumstellar disk and infrared excess. As defined in Bertout & Bouvier (1989), a CTT is
distinguished from Weak Line T Tauri (WTT) star by the strength of the Hα emission line. If the
line strength is greater than 10A, it is usually classified as a CTT. For example, probable Collinder
70 member F-41 with Li EW of 357±16 mA has Hα emission that dwarfs any other feature with
an EW of 51A (Figure 7).
4.3. Radial Velocities
The high resolution spectra was used to find the radial velocities of the stars by cross correlating
the target spectra with a radial velocity standard star using IRAF’s FXCOR. After acquiring the
radial velocities, the data was processed to ascertain whether the velocities suggest the presence of
a cluster of co-moving stars. Using three different bin sizes of 2, 3, and 4 km/s and shifting the
centers by 0.5 km/s, histograms were produced with all the stars – those with and without Li I –
with radial velocities. A Gaussian function is fit to the radial velocities of the Li rich stars, which
are indicated by the hatched regions of the histogram, in order to check how the center and sigma
values vary depending on the binning of the data. Fortunately, these twelve tests give a Gaussian
center of 30 km/s ± 0.5 km/s. From these histograms we can garner that the radial velocities
suggest a group of lithium rich stars moving at a systemic velocity of 30 km/s.
The stars likely to be in Collinder 70 do not create a delta function (i.e., all the stars do not have
the same radial velocity) for a variety of reasons. First, there may be contaminating stars with
lithium that happen to be in the field, or an errant absorption line could have been measured as
lithium. A lithium rich star in a short-term, close binary will be drastically shifted away from the
systemic velocity. With repeated observations of these stars, the binaries will be apparent. Stars
within a cluster have some natural intrinsic velocity since they are not completely still in relation to
each other. Lastly, these histograms are comprised of a few dozen stars and the Gaussian functions
are fit to roughly 30 stars. With more stars in hand, we would expect to find more stars populating
the 30 km/s velocity bin.
4.4. Reddening of Stars in the Cluster
Finding the reddening of the cluster proved to be a great challenge. The hot stars such as Alnilam
indicate a reddening of 0.4 by using stellar classification to compare standard stars and target stars.
Unfortunately, this type of analysis for the target stars is difficult because the spectra are skewed
since many appear to be PMS or have circumstellar disks. In addition, circumstellar disks and
remnant gas in the cluster introduce differential reddening, reducing the chances of finding one
“true” blanket reddening value.
5
Thomann: Photometric and Spectroscopic Analysis of Young, Nearby Open Cluster Collinder 70
Published by DigitalCommons@Macalester College, 2013

– 6 –
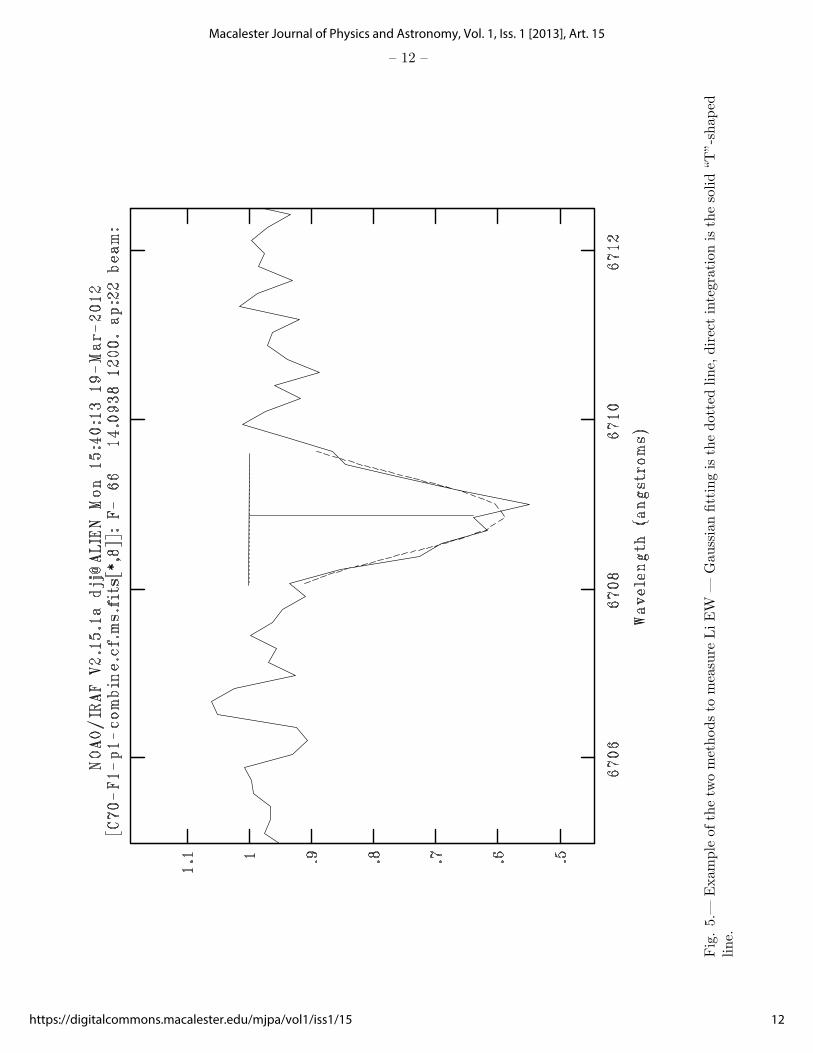
For this paper, reddening is found by using Ramirez & Mendelez (2005) temperature and photo-
metric color relationships. We relate these temperatures to reddening. With a given reddening
value, we have five different colors (B − V , V − I, V − J , V −H, V −K) for each star, and these
five colors relate to a specific effective temperature. Taking the mean of these five temperatures
provides a standard deviation for a reddening value. We repeated this process for every star with
reddening values from 0.1 to 1 in increments of 0.1, giving 99 STDEV for each star. At some point,
the STDEV is minimized giving us a specific reddening value for that star; see Figure 8 for an
example plot. If a star’s reddening value is at a minimum at 0.1, we applied the standard hot star
reddening value of 0.4. This is a novel way to find reddening, and has not yet been proven to be
valid. There are not many ways to find the reddening, and the conventional way using stellar types
was not a viable option due to the lack of standard low mass stellar spectra in the literature. In the
future we hope to compare this method to others, or find another way to find the reddening.
5. Discussion
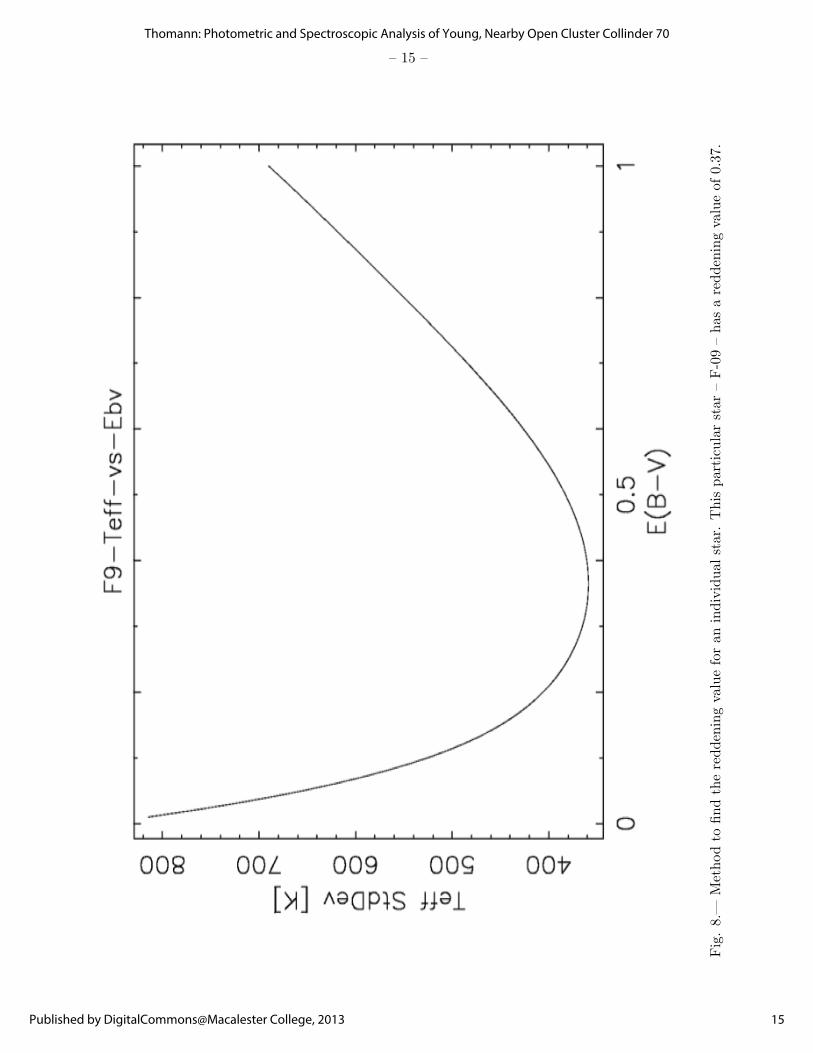
To begin, we were curious where Collinder 70 stars fall along evolutionary tracks in a color-color
diagram such as Figure 9. This figure includes field, Collinder 70 Li-rich, and Orion Classical T
Tauri (CTT) stars. Fortunately, we see stars that appear giant-like — or stars that have not moved
onto the main sequence and are therefore still contracting. A few stars have infrared excess, located
near other CTT stars since they are circumstellar disks that re-radiate light in the infrared. Finally,
a handful of stars are on the main sequence. These lithium abundant stars in the giant-like and IR
excess regions are great indicators of stellar youth.
With the lithium equivalent widths, 3σ upper limits, and individual reddening corrected colors in
hand, Figure 10 is produced to age a cluster using the Lithium Depletion Boundary method. This
figure is based on Jeffries et al. (2009) Figure 6, utilizing model isochrones for lithium depletion
from Baraffe et al. (2002) evolutionary models to age target stars on an EW and color diagram.
Stars cannot easily shift up or down since this is reliant on the amount of lithium, but can move
significantly left and right depending on the reddening value. As mentioned in Sect 4.4, each star
has a unique reddening value, but this value may not be correct. By changing this value, a star’s
nearest isochrone can drastically change as the star shifts location.
Looking at Figure 10, Collinder 70 stars (encircled in red) appear to fall anywhere from above
the undepleted lithium level to below the 100 Myr isochrone. From this graph, any conclusions
regarding Collinder 70 age would be dependent on small number statistics from 23 member stars,
and thus not statistically robust. With further observations of low mass stars, there will naturally
be more data points to populate this graph and better constrain the age of the cluster using the
Lithium Depletion Boundary method.
6. Conclusion
The observation of stars in Figure 10 at the undepleted level is yet another piece of evidence that
points to a young cluster. This piece of data, along with other indicators of youth present in
6
Macalester Journal of Physics and Astronomy, Vol. 1, Iss. 1 [2013], Art. 15
https://digitalcommons.macalester.edu/mjpa/vol1/iss1/15

– 7 –
Collinder 70, such as giant-like PMS stars, Classicial T Tauri stars and large, hot B0 stars like
Alnilam, suggest that Collinder 70 is younger than 10 Myr. Future observations of Collinder 70
will increase the number of detected target low-mass stars, adding more points to Figure 10. The
location of the stars in this figure will illuminate the strengths and weaknesses of the Lithium
Depletion Boundary models as compared to photometric isochronal fitting models. Although the
LDB method is not foolproof, it provides the possibility of spectroscopically aging a cluster, comple-
menting early and late type stellar isochronal fitting. In the end, each method of aging stars allows
researchers to calibrate and constrain stellar evolution models that further our understanding of
how stars change with time.
7. Acknowledgments
I would like to acknowledge Dr. David James for acting as my research mentor during the CTIO
REU program, and Owen Boberg for teaching me basic Python. Thank you to Catherine Kaleida
and the staff at CTIO for your assistance and creating a welcoming environment in Chile. This
project was conducted in the framework of the CTIO REU Program, which is supported by the
National Science Foundation under grant AST-1062976, and was additionally supported by the
NSF Astronomy & Astrophysics Grant AST-1109612 (P.I. Cargile).
REFERENCES
Baraffe, I., Chabrier G., Allard F., Hauschildt P.H. 2002, A&A, 314, 173
Bertout, C. & Bouvier, J., 1989, in B. Reipurth (ed.), Low Mass Star Formation and Pre-Main
Sequence Objects, ESO Workshop, p. 215
Bodenheimer, P. 1965, ApJ, 77, 455
Calvet, N. & Gullbring, E., 1998, ApJ, 509, 802
Cummings, J.D., Deliyannis, C.P., Anthony-Twarog, C., Twarog, B. & Maderak, R.M., 2012, AJ,
144, 137
D’Antona, F. & Mazzetelli, I., 1997, Mem. S. A. It., 68, 807
Jeffries, R.D., Jackson, R.J., James, D.J., Cargile, P.A. 2009, MNRAS, 400, 317
Jeffries, R.D. & Naylor, T. 2000, in Astronomical Society of the Pacic Conference Series, Vol. 243,
From Darkness to Light: Origin and Evolution of Young Stellar Clusters, ed. T. Montmerle
& P. Andre, 633
Lejeune, T. & Schaerer, D., 2001, A&A, 366, 538
Ramirez, I. & Mendelez, J., 2005, ApJ, 626, 446
This preprint was prepared with the AAS LATEX macros v5.2.
7
Thomann: Photometric and Spectroscopic Analysis of Young, Nearby Open Cluster Collinder 70
Published by DigitalCommons@Macalester College, 2013

– 8 –
Fig.1.—
Pointings
forCollinder
70forphotom
etricdatacollection
areou
tlined
ingreenan
dred.Thebrigh
tcenterstar
isεOri,or
Alnilam
.
8
Macalester Journal of Physics and Astronomy, Vol. 1, Iss. 1 [2013], Art. 15
https://digitalcommons.macalester.edu/mjpa/vol1/iss1/15

– 9 –
Fig.2.—
Color-m
agnitudediagram
ofCollinder
70,focusingon
thelow
massstars.
Stars
lateridentified
asLirich
areencircledin
red.
9
Thomann: Photometric and Spectroscopic Analysis of Young, Nearby Open Cluster Collinder 70
Published by DigitalCommons@Macalester College, 2013

– 10 –
Fig.3.—
Low
resolution
spectrum
ofCollinder
70mem
ber
F-33.
This
spectrum
isusedforidentifyingHα(656
2.8A)em
ission
andLiI
(670
7.8A)ab
sorption
andspectral
classification
.
10
Macalester Journal of Physics and Astronomy, Vol. 1, Iss. 1 [2013], Art. 15
https://digitalcommons.macalester.edu/mjpa/vol1/iss1/15

– 11 –
Fig.4.—
Highresolution
spectrum
ofCollinder
70mem
ber
F-33,
alate
Kor
earlyM
classstar.Hα(656
2.8A)em
ission
andLiI(670
7.8
A)ab
sorption
are
clearlyvisible,indicatingapossible
mem
ber
ofCollinder
70.Notethewavelengthrange
issign
ificantlysm
allerthan
Figure
3.
11
Thomann: Photometric and Spectroscopic Analysis of Young, Nearby Open Cluster Collinder 70
Published by DigitalCommons@Macalester College, 2013
– 12 –
Fig.5.—
Exam
ple
ofthetw
omethodsto
measure
LiEW
—Gau
ssianfittingisthedottedline,
directintegrationisthesolid“T
”-shap
edline.
12
Macalester Journal of Physics and Astronomy, Vol. 1, Iss. 1 [2013], Art. 15
https://digitalcommons.macalester.edu/mjpa/vol1/iss1/15

– 13 –
Fig.6.—
Plotdem
onstratingtheaccuracy
betweentheGau
ssianfittingan
ddirectintegration.Notethat
theon
lystarsnot
fallingalon
gtheequivalency
linearebroad
-lined
featuresof
LiIab
sorption
.
13
Thomann: Photometric and Spectroscopic Analysis of Young, Nearby Open Cluster Collinder 70
Published by DigitalCommons@Macalester College, 2013

– 14 –
Fig.7.—
Exam
ple
ofHα
excess
indicatingapossible
CTT:probab
leCollinder
70mem
ber
F-41withLiEW
of35
7±16
mA
has
Hα
emission
(EW
=51
A)thatdwarfs
anyother
feature.
14
Macalester Journal of Physics and Astronomy, Vol. 1, Iss. 1 [2013], Art. 15
https://digitalcommons.macalester.edu/mjpa/vol1/iss1/15
– 15 –
Fig.8.—
Methodto
findthereddeningvalueforan
individual
star.This
particularstar
–F-09–has
areddeningvalueof
0.37
.
15
Thomann: Photometric and Spectroscopic Analysis of Young, Nearby Open Cluster Collinder 70
Published by DigitalCommons@Macalester College, 2013
– 16 –
Fig.9.—
Color-color
diagram
withfieldstars(black
dots),Orion
classicalT-Tau
ristars(black
open
circles)
andCollinder
70stars(red
crosses).
This
diagram
dem
onstratesthatsomemem
ber
starsap
peargian
t-like
whileothershaveinfrared
excess
—bothproperties
are
indicatorsof
youngstars.
16
Macalester Journal of Physics and Astronomy, Vol. 1, Iss. 1 [2013], Art. 15
https://digitalcommons.macalester.edu/mjpa/vol1/iss1/15

– 17 –
Fig.10.—
Model
isochrones
from
Baraff
eet
al.(200
2)evolution
arymodelsoverlaid
onCollinder
70Li-rich
starswithrespective
errors;
arrowsrepresent3σupper
limit.Somestarsareab
ovetheundepletedLilevel,whileothersareolder
than
30Myr.
17
Thomann: Photometric and Spectroscopic Analysis of Young, Nearby Open Cluster Collinder 70
Published by DigitalCommons@Macalester College, 2013
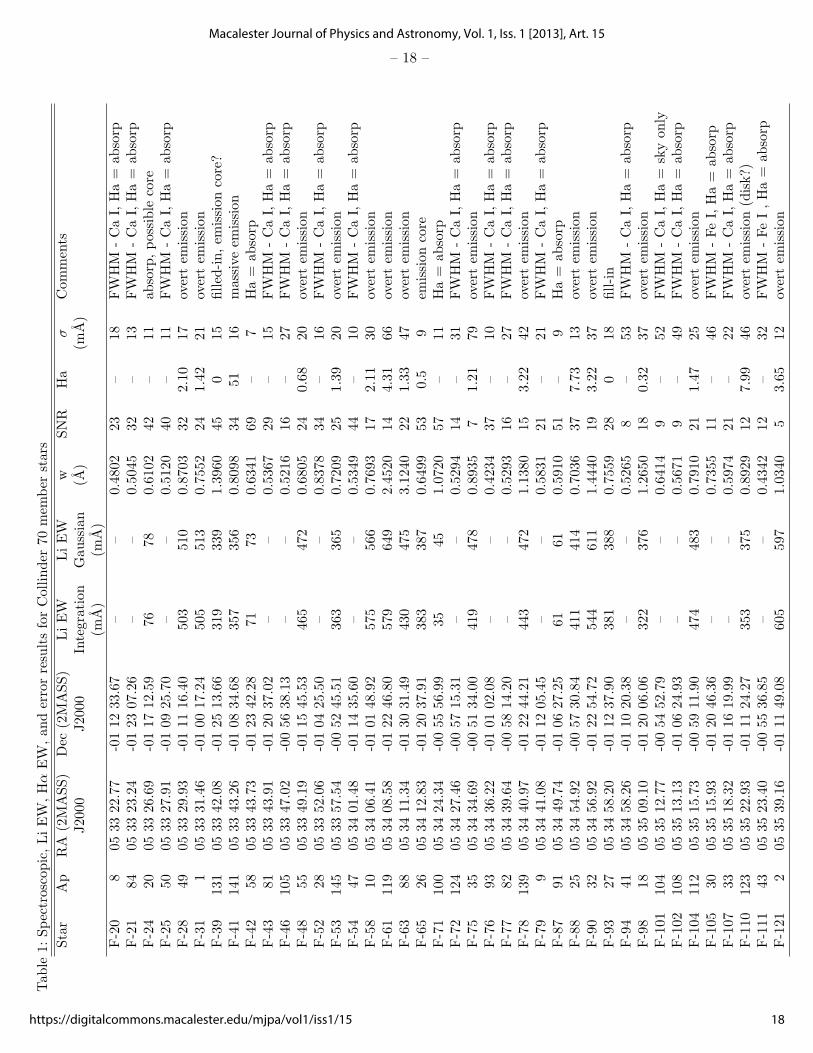
Tab
le1:
Spectroscopic,LiEW
,HαEW
,an
derrorresultsforCollinder
70mem
ber
stars
Star
Ap
RA
(2MASS)
Dec
(2MASS)
LiEW
LiEW
wSNR
Ha
σComments
J2000
J2000
Integration
Gau
ssian
(A)
(mA)
(mA)
(mA)
F-20
805
3322.77
-0112
33.67
––
0.4802
23–
18
FW
HM
-CaI,Ha=
absorp
F-21
8405
3323.24
-0123
07.26
––
0.5045
32–
13
FW
HM
-CaI,Ha=
absorp
F-24
2005
3326.69
-0117
12.59
7678
0.6102
42–
11
absorp,possible
core
F-25
5005
3327.91
-0109
25.70
––
0.5120
40–
11
FW
HM
-CaI,Ha=
absorp
F-28
4905
3329.93
-0111
16.40
503
510
0.8703
322.10
17
overtem
ission
F-31
105
3331.46
-0100
17.24
505
513
0.7552
241.42
21
overtem
ission
F-39
131
0533
42.08
-0125
13.66
319
339
1.3960
450
15
filled-in,em
issioncore?
F-41
141
0533
43.26
-0108
34.68
357
356
0.8098
3451
16
massiveem
ission
F-42
5805
3343.73
-0123
42.28
7173
0.6341
69–
7Ha=
absorp
F-43
8105
3343.91
-0120
37.02
––
0.5367
29–
15
FW
HM
-CaI,Ha=
absorp
F-46
105
0533
47.02
-0056
38.13
––
0.5216
16–
27
FW
HM
-CaI,Ha=
absorp
F-48
5505
3349.19
-0115
45.53
465
472
0.6805
240.68
20
overtem
ission
F-52
2805
3352.06
-0104
25.50
––
0.8378
34–
16
FW
HM
-CaI,Ha=
absorp
F-53
145
0533
57.54
-0052
45.51
363
365
0.7209
251.39
20
overtem
ission
F-54
4705
3401.48
-0114
35.60
––
0.5349
44–
10
FW
HM
-CaI,Ha=
absorp
F-58
1005
3406.41
-0101
48.92
575
566
0.7693
172.11
30
overtem
ission
F-61
119
0534
08.58
-0122
46.80
579
649
2.4520
144.31
66
overtem
ission
F-63
8805
3411.34
-0130
31.49
430
475
3.1240
221.33
47
overtem
ission
F-65
2605
3412.83
-0120
37.91
383
387
0.6499
530.5
9em
issioncore
F-71
100
0534
24.34
-0055
56.99
3545
1.0720
57–
11
Ha=
absorp
F-72
124
0534
27.46
-0057
15.31
––
0.5294
14–
31
FW
HM
-CaI,Ha=
absorp
F-75
3505
3434.69
-0051
34.00
419
478
0.8935
71.21
79
overtem
ission
F-76
9305
3436.22
-0101
02.08
––
0.4234
37–
10
FW
HM
-CaI,Ha=
absorp
F-77
8205
3439.64
-0058
14.20
––
0.5293
16–
27
FW
HM
-CaI,Ha=
absorp
F-78
139
0534
40.97
-0122
44.21
443
472
1.1380
153.22
42
overtem
ission
F-79
905
3441.08
-0112
05.45
––
0.5831
21–
21
FW
HM
-CaI,Ha=
absorp
F-87
9105
3449.74
-0106
27.25
6161
0.5910
51–
9Ha=
absorp
F-88
2505
3454.92
-0057
30.84
411
414
0.7036
377.73
13
overtem
ission
F-90
3205
3456.92
-0122
54.72
544
611
1.4440
193.22
37
overtem
ission
F-93
2705
3458.20
-0112
37.90
381
388
0.7559
280
18
fill-in
F-94
4105
3458.26
-0110
20.38
––
0.5265
8–
53
FW
HM
-CaI,Ha=
absorp
F-98
1805
3509.10
-0120
06.06
322
376
1.2650
180.32
37
overtem
ission
F-101
104
0535
12.77
-0054
52.79
––
0.6414
9–
52
FW
HM
-CaI,Ha=
skyonly
F-102
108
0535
13.13
-0106
24.93
––
0.5671
9–
49
FW
HM
-CaI,Ha=
absorp
F-104
112
0535
15.73
-0059
11.90
474
483
0.7910
211.47
25
overtem
ission
F-105
3005
3515.93
-0120
46.36
––
0.7355
11–
46
FW
HM
-FeI,Ha=
absorp
F-107
3305
3518.32
-0116
19.99
––
0.5974
21–
22
FW
HM
-CaI,Ha=
absorp
F-110
123
0535
22.93
-0111
24.27
353
375
0.8929
127.99
46
overtem
ission(disk?)
F-111
4305
3523.40
-0055
36.85
––
0.4342
12–
32
FW
HM
-FeI,Ha=
absorp
F-121
205
3539.16
-0111
49.08
605
597
1.0340
53.65
12
overtem
ission
– 18 –
18
Macalester Journal of Physics and Astronomy, Vol. 1, Iss. 1 [2013], Art. 15
https://digitalcommons.macalester.edu/mjpa/vol1/iss1/15