MAB-E - Harding University powered refrigerated... · MAB-E (Most Awesome Backpack ... 3....
75
Harding University MAB-E (Most Awesome Backpack - Ever) Final Design Report December 7, 2010 Eric Locke Natalie Nill Simon Reinhardt Adrian Villalobos
Transcript of MAB-E - Harding University powered refrigerated... · MAB-E (Most Awesome Backpack ... 3....

0
Harding University
MAB-E (Most Awesome Backpack - Ever)
Final Design Report December 7, 2010
Eric Locke Natalie Nill Simon Reinhardt Adrian Villalobos
1
Table of Contents Requirements Specification ….…………………………………………………………………...3 Overview ……………………………………………………………………………….…4 Problem Statement ………………………………………………………………………..4 Operational Description …………………………………………………………………..4 Technical Requirements …………………………………………………………………..5 Deliverables ………………………………………………………………………………6 Preliminary Test Plan ……………………………………………………………………..6 System Design ……………………………………………………………………………………7 System Overview ……………………………………………………………..…………..8 Organization and Management ………………………………………………..…….........9 Block Diagram …………………………………………………………………………..10 Functional Decomposition of Blocks …………………………………………...……….11 Electrical Design ………………………………………………………………………………...12 User Interface ....…………………………………………………………………………13 Microcontroller ……………………………………………………………….…………15 Temperature Sensor ……………………………………………………………………..18 Car Cigarette Lighter Charging Circuit …………………………………………………20 DC to DC Converter …………………………………………………………………….21 DC to DC Converter for the LCD Screen ……………………………………………….23 DC to DC Converter for the Microprocessor ……………………………………………25 DC to DC Converter for the Temperature Sensor ………………………………………28 Solar Panels ……………………………………………………………………………...32 Battery………………………………………………………………………………...... Mechanical Design ………………………………………………………………………………35 Air-to-Air Thermoelectric Cooler Module Design ……………………………….........36 Thermoelectric Cooler Selection …………………………………………………..........36 Liquid Cooler Selection ………………………………………………….………….......37 Cold Side Fan ………………………………………………………………………........38 Chamber Material ……………………………………………………………………….38 Insulation ………………………………………………………………………………...39 Door Design ……………………………………………………………………………..39 SolidWorks Images .……………………………………………………………………..40 Calculations ……………………………………………………………………………...43 Budget ……………………………………………………………………………………….......46 Updated Prototype Budget ……………………………………………………………....47 Production Budget ……………………………………………………………………....48 Project Status ……………………………………………………………………………………49 Gantt Chart Fall 2010 …………………………………………………………………....50 Gantt Chart Spring 2011………………………………………………………………....51

2
Work Breakdown Structure Fall 2010 ………………………………………………..…52 Work Breakdown Structure Spring 2011 …………………………………………...…...53 Appendices …………………………………………………………………………………..…..54 Appendix A: Requirements Specifications Attachments …………………..………...….55 Appendix B: TPS40192 Datasheet……………………...……………………………….64 Appendix C: CSD16321Q5 Transitor Data Sheet…………………..…………………..65 Appendix D: Fan 3106kl ……………………………………………………..………….66 Appendix E: TEMP. SENSOR TD5A-Honeywell-datasheet-89078 ………………...…67 Appendix F: OP AMP LM741……………………...…………………………………...68 Appendix G: KEYPAD 96BB2-006-F-Grayhill-datasheet-71161………………………69 Appendix H: KP_ENCODER_EDE1144…………………………..…………………....70
Appendix I -Solar Panels Datasheet…………………………..……………………...….71 Appendix J -TEC - ZT5,16,F1,4040 Datasheet…………………………..……………...72 Appendix K -LCD Screen - RT204…………………………………………..………….73 Appendix L -Cooling - ECO A.L.C.…………………………..…………………...…….74 Appendix M -PIC24FJ256GB110.…………………………..…………………….…….75

3
Requirements Specification
Requirements Specification Solar Powered Backpack Refrigeration Unit
Adrian Villalobos Eric Locke Natalie Nill

4
Simon Reinhardt
Overview Vaccines have been one of the most beneficial healthcare discoveries of the past couple centuries. Unfortunately, many people are unable to receive vaccines because, among other reasons, health services are unable to reach them while keeping the vaccines cool enough. According to the PATH organization, transporting vaccines in Africa can be extremely challenging because regulating the temperatures of vaccines, while transporting them to rural areas, is difficult and especially challenging in areas without constant power sources. In 2002, over 84,000 people died from Hepatitis B (a vaccine that requires cooling) alone. Some of these deaths are due to the inability of health organizations to transport vaccines to every place they are needed. Many of these organizations are working to raise awareness about this issue and find ways to reach more people. If more people could be reached, thousands of lives could be saved.
There are multiple ways of using alternate power to refrigerate vaccines currently being used. The most predominant include nonelectric/uncontrolled cold packs, kerosene powered refrigeration, and solar power. The cold packs have limited use because they have a maximum cooling time of 48 hours. The kerosene refrigeration is impractical because it requires continuous refueling and is potentially dangerous. Therefore, our team has decided to use solar power because it is a portable, reliable, and an efficient way to solve this problem.
Problem Statement
There is a need for a better method for transferring vaccines into rural areas of developing nations where power is not easily accessible for refrigeration. There is no developed method that involves continuous refrigeration from a portable, consistent, and environmentally friendly power source. By having a refrigeration system that can be powered during transportation, the ability to distribute vaccines will be greatly increased and the chances of ruining vaccines will be diminished.
Operational Description:
Before Transportation: Before using the refrigeration backpack to transport vaccines any distance, the target temperature must be met inside the refrigeration chamber. This can be achieved by one of four ways:
1. External Power: The pack can be cooled by using external power from any outlet that has an output standard to the US or African power grid.
2. Cooling Packs: The backpack can be cooled by placing cold packs, such as those used to keep non-electric vaccine shipping boxes cool, inside the chamber.
3. Refrigerator: The backpack can be cooled by placing the chamber inside a larger refrigerator or freezer until the target temperature is reached.

5
4. Solar Power: The backpack can be cooled beforehand using solar power. This method may require time to charge the pack’s batteries and cool the chamber.
Also, the batteries must be charged before the vaccines are transported any distance. This can be accomplished by either using an external power source and/or using solar power to charge the batteries. For a faster charge time, the batteries can be charged while the cooling system is off to send all power from the solar panels or external source to the batteries. The user will be able to select the allowable temperature range via the user interface. First select the mode for temperature selection, then type in the lowest allowable temperature and then the highest allowable temperature in that order when prompted on the screen. During Transportation: IMPORTANT- avoid opening the refrigerator door until the destination has been reached as this will compromise the environment of the vaccines and might deplete the backpack’s energy supply prematurely. The user will be able to monitor the current temperature inside the refrigerator via the indicator mounted on the outside of the refrigeration chamber. They will also be able to read the approximate battery life reading that will inform them as to the amount of energy currently in the pack on the same screen. The user should make sure that the solar panels are clear of anything that may block them from the sun when possible. After Transportation: When the destination is reached the user should transfer the vaccines to a secure environment to be used as needed. The backpack should remain in the refrigeration mode until vaccines are no longer stored in the chamber.
Technical Requirements
• The unit will cool a chamber within the backpack and maintain it at a temperature range between 2℃ and 8℃ (35℉ and 46℉ ), for a minimum of 48 hours, at an average ambient temperature up to 30°C (86°F), while stationary.
• The temperature inside the refrigeration chamber will be read and relayed so it can be displayed on the outside of the unit. The temperature sensor will have a maximum resolution range of ± 1℃ , and will cover a temperature range of at least 0°C to 30°C (32°F to 86°F).
• The entire unit will weigh less than 37 kg (≈ 82 lbs). • The backpack will not exceed a size of 60 cm x 100 cm x 60 cm. • The refrigeration system will be controlled to within the specified temperature range. • The unit will be able to measure the temperature inside the chamber to within ± 1℃ . • The unit will be able to control the temperature inside the chamber to within± 3℃ .

6
• There will be a user interface used to control the refrigeration system. It will include: an on/off switch, a digital temperature display, a temperature control interface, and battery status indicators.
• The unit will have a frame that can perform while being transported on foot and by vehicle.
• All systems will operate in a safe manner that will pose no threat of harm to the users. Temperatures will not go above 50°C or below -30°C, voltages will not exceed 30 V DC, and moving parts will be protected by a grill.
Deliverables
1. User’s Manual 2. Technical Drawings and Analysis of Hardware 3. Schematic of Circuit with Simulation Results 4. Code and Flowcharts 5. Report of Testing 6. Parts List with Budget 7. Final Technical Report 8. Solar Powered Refrigeration Backpack
Preliminary Test Plan
• Four healthy individuals, with a minimum height of 1.6 m (≈ 63 inches) and weight of 54 kg (≈ 120 lbs), will be able to pick up, put on, and take off the backpack with the assistance of one other individual.
• A performance test will be conducted. The backpack will be taken on a mile hike then will immediately be put into a ventilation chamber for a 48 hour period. It will be tested at temperatures between 22°C and 30°C (≈ 72°F and 86°F). The solar panels will be exposed to two cycles of simulated sunlight for 12 hours then darkness for 12 hours. The maximum and minimum temperatures will be recorded over that period. This test will be executed three times.
• Temperature gauge will be tested to ensure accurate (within ± 1°C) temperature readings inside the chamber.
• Backpack will be weighed to ensure it does not exceed the maximum weight.

7
System Design
System Overview There is a need for a better method for transferring vaccines into rural areas of developing nations where power is not easily accessible for refrigeration. There is no developed method that involves continuous refrigeration from a portable, consistent, and environmentally

8
friendly power source. By having a refrigeration system that can be powered during transportation, the ability to distribute vaccines will be greatly increased and the chances of ruining vaccines will be diminished.
Our goal is to create a means of transporting vaccines to remote areas in rural parts of developing countries. The design is a solar powered backpack refrigerator. The device will be driven by a battery which can be recharged by either plugging it into a 110 V AC power outlet or 12 V DC car jack when available, or by a solar panel that is attached to the backpack when on foot. A user interface will allow the user to set the temperature within the insulated chamber and will inform him of the current temperature. It will also warn the user if the temperature ever gets too high so that the ruining of vaccines can be prevented. A microcontroller continuously checks the temperature within the insulated chamber and decides whether it needs to be cooled. The device will weigh less than 37 kg (≈ 82 lbs) and will not exceed a size of 60 cm x 100 cm x 60 cm.
Organization and Management Eric Locke – Eric is a senior level electrical engineering student, and was designated to be the
project leader for this design. He is primarily responsible for selecting and programming the microcontroller that will control all of the functionality of the backpack. He will also

9
be responsible for designing and constructing the user interface that will allow the user to control the backpack. Eric will assist Adrian with general circuit design and all other team members in general project implementation. Finally, he will make sure that the project is moving at the pace needed for its success as well as oversee each team member’s work to ensure compatibility and communication between projects.
Adrian Villalobos – Adrian is a senior level electrical engineering student. He is primarily
responsible for the power and hardware circuits of the project. These include the battery and battery charger, power control, and DC to DC converter circuits. Adrian will also be responsible for any other circuitry that is needed for the backpack’s functionality. Adrian will also assist other members in general device design.
Simon Reinhardt – Simon is a senior level mechanical engineering student. His primary
responsibility is to select and design the cooling system for the backpack. This will include analyzing heat flow into and out of the chamber along with Natalie. Simon will also assist Eric with selecting and mounting the temperature sensor. Lastly, he will assist other team members in general project design and engineering decisions.
Natalie Nill – Natalie is a senior level mechanical engineering student. She is primarily
responsible for designing and constructing the cooling chamber of the backpack. This will include selecting and applying the insulation that will line the chamber. Natalie will also assist Simon in analyzing heat flow into and out of the chamber. She will assist other team members with general project design and major engineering decisions.
The lists of tasks for each engineer are not all inclusive. Each team member is equipped and able to assist one another in their respective tasks. Because of this, the schedule of tasks is subject to change. Every member is responsible for consistent and thorough documentation of their research, work, and progress. They are also responsible for presenting their data and progress in each A3 status report.

10
Block Diagram

11
Functional Decomposition of Blocks Solar Power: There will be solar panels attached to the unit that will output a minimum of
25W of power to the battery circuit. Wall Outlet/ Car Outlet: The prototype will be able to run on power from a standard wall
outlet in a US home or business, and a standard vehicle dashboard power source. Battery and Battery Charger: The battery will be able to hold enough energy to run the
backpack for 2 hours minimum, and be light enough to keep the backpack from exceeding the weight limit of 37 kg. The battery charger circuit will allow the battery to be charged from any power source connected at the time as well as ensuring that the battery will not be discharged through undesirable sources.
User Interface: The user interface will be a panel on the outside of the unit that displays
the chamber temperature and the amount of battery power left. It will also allow the user to input and change the desired temperature range.
Microprocessor: The microprocessor will have the following functions: 1) Read a user input from the user interface specifying a desired temperature range. 2) Read the current temperature inside the chamber and compare that temperature with the
user specified temperature. It will then be able to adjust the output from the power control circuit to allow the chamber temperature to reach the user specified temperature range, and then hold that temperature for a minimum of 48 hours.
3) Read an input from the battery circuit and analyze the battery life remaining. Once the battery life is determined, it will output that value to the user interface screen.
4) Keep a time stamped record of the temperature during use and store the values in memory to allow the user to trace the temperature history after use.
Power Control Circuit: The power control circuit will be controlled by the microprocessor
and will regulate the amount of power flowing from the battery to the cooling system. DC to DC Converter: The DC to DC converter will take the power coming from the
battery and convert it to the desired input powers for the user interface, the microprocessor, and the temperature sensor.
Temperature Sensor: The temperature sensor will be able to read the temperature inside
the cooling chamber to within ±1°C and relay that value to the microcontroller. Cooling System and Chamber: The cooling chamber will have 35cm x 25cm x 20cm of
storage space as well as an insulation layer that will restrict heat flow into the chamber. The cooling system will be permanently attached to the chamber and will consist of the thermo-electric cooler, the heat sink, and the ventilation system to displace heat.

12
Electrical Design

13
User Interface The user interface will be composed of three major parts. These are, the LCD screen, the 4x4 keypad, and the indicator LEDs. LCD Screen:
Inputs: 5V dc (all components) Outputs: ASCII characters on user 1.6 mA (operation) interface screen. 145 mA (LED) The LCD screen will be connected to power via the DC to DC converter and will have its data lines connected directly to the microcontroller’s I/O pins. This configuration can be seen below. Each switch in the circuit represents one I/O pin on the microcontroller. VCC will be provided from the DC to DC converter and the circuit will be grounded to the same ground as the battery. The values that are entered from switches 1-8 are recognized by the LCD screen as ASCII values and interpreted in the internal circuitry of the screen. The pin marked A is the enable pin and will be closed every time a character is written to the screen. The pin marked B is the pin that controls whether the screen receives a control input or a data input. Finally, the pin marked C controls whether the screen will read information from the microcontroller or write to it. This pin will always be open, or grounded, because we will never need to write information from the screen. The eight switches marked 1-8 represent the leads coming from the microcontroller’s I/O port E. This port is composed of 8 bits (RE0 – RE7) which are listed as pins 1-3 and 60-64 on the processor pin diagram on page ##. Switches A-C will represent the leads coming from I/O port G. The three lines used (RG6 – RG8) are located at pins 4-6 on the processor pin diagram on page ##.
Figure 1: LCD Screen

14
4x4 Keypad:
Inputs (rated): 12V dc Outputs (rated): 12V dc 5 mA 5 mA The keypad that will be used will be the Grayhill Standard Series 96BB2-056-F keypad. Datasheet The 4x4 keypad has 16 buttons that allow current to pass through the keypad along a certain path based on which key is pressed. These paths enter and exit the keypad through its eight terminals located on the back side of the keypad.
The keypad’s eight terminals will be connected to a keypad encoder that will convert the eight voltage signals from the terminals into a four bit binary input that will go to the microcontroller. The encoder that will be used is the EDE1144 Keypad Encoder IC from eLab. Datasheet This will reduce the amount of necessary I/O pins down to four and reduce the amount of program calculation that will be needed to convert the keypad inputs into numerical inputs. Figure 2 below is the circuit that will be used to connect the encoder to the keypad and send the output to the microcontroller. The parallel outputs D0-D3 will be the outputs that are sent to the microcontroller.
On the actual keypad, the buttons marked with the numbers 1-9, * and # will be used to allow the user to input the specified temperature range that the backpack will operate within. The buttons marked A-D will be used to allow the user to control the mode in which the backpack is to run.
LED Indicators:
Inputs: 0 or 5 V dc 20 mA per LED (80mA total) The LED indicators will be directly connected to the microcontroller I/O pins. There will be a LED designated to display: Cooling system on, battery charging, low battery, and chamber temperature out of range.
Figure 2: Keypad/encoder circuit

15
Microcontroller The microcontroller that will be used is the PIC24FJ256GB106 microprocessor. The decision between this processor and other TQFP 64 pin processors was made with the decision matrix below.
Table 1: Microcontroller Decision Matrix
PIC24FJ192GB106 PIC24FJ256GB106 dsPIC30F6012A Weight CPU Speed 2 2 4 0.1
Progammable Memory 3 4 2 0.2 RAM 4 4 2 0.16
USB Capable 2 2 0 0.04 A/D Converter Size 3 3 4 0.15
A/D Converter Speed 4 4 2 0.15 Price 3 3 1 0.2
Total 21 22 15 1.0 Weighted Total 3.17 3.37 1.86
These processors were considered because they were compatible with the MPLAB module for programming and also because they have a sufficient number of I/O pins for our applications. The PIC24FJ256GB106 was chosen primarily for its superior Programmable Memory and RAM. These attributes make it preferable for embedded control and monitoring applications.
The microcontroller will control all data flow between subsystems and signal analysis of output signals that are needed in the backpack’s operation. The functions of the microprocessor include:
• Temperature reading and control • User input interpretation/User interface output control • Battery status interpretation and display • Controlling the operation mode of the backpack
The microcontroller will be able analyze the current temperature from the chamber by receiving a voltage output from the temperature sensor. It will then convert that voltage into a numerical temperature value using its A to D converter system. The microcontroller contains a 10-bit A to D converter that has 16 channels and can take 500k samples per second. Once the temperature is found it will make a decision to turn the cooling system on, off or to have it remain unchanged. These decisions will be based on the user specified temperature values that will be entered via the user interface. The flow charts for these actions can be seen on the following pages. The converted temperature values will constantly be sent to the LCD screen during operation so little memory will be needed to record these values. These values will be sent to the LCD screen continuously and will be recorded to memory every minute by using one of the microcontroller’s five 16 bit timers.

16
Every minute the microcontroller will store a time stamped record of the temperature to memory. These readings will contain an 8-bit temperature value and an 8-bit minute value that will begin counting minutes when the backpack is turned on. The memory allotted for these values will be enough to last the full 48 hour trip. That is 2880 slots of 16-bit records. That comes out to 46 Kb of memory needed for these records. The microprocessor’s 256 Kb of programmable flash memory will be able to hold this amount of data and have room for all other functionality. The microcontroller will also be able to read a voltage input from the battery and convert that voltage into an estimation of the remaining battery life using the A to D converter. Because a Lead Acid battery will be used in the project, there is no need to use any data besides the present battery voltage to obtain an accurate battery life reading. To obtain the function for this reading, the battery will be discharged over 12 hours over a constant load. The voltage will be read every hour to obtain a curve that relates the voltage across the battery to the remaining run time. The function of the runtime curve will then be mathematically entered into the microcontroller code and used to convert the voltage into a numeric battery life result. The microcontroller will then output that value to the LCD screen for the user to see. Finally, the microprocessor will be able to control what mode the backpack is in by controlling switches that connect and disconnect the different power source circuits and the power control circuit. The flow charts for these actions can be seen on the pages below. The flowcharts on the following pages have the conditions for the question blocks next to the Yes or No condition indicators on the leads leading from the question block. If the condition depends on whether a pin on the microprocessor is high or low, the values next to the yes/no indicators is marked as a (1) for voltage high and a (0) for voltage low. If the conditions are based on an analog value, the conditions for that are stated by the yes indicator. Whenever a value is stored to memory it will be stored on the microprocessor’s general flash memory. The bit by bit organization of this memory is not necessary because of the large value of memory that is contained on the microprocessor. The C compiler will be used to assign the specific spot in memory that the data and variables will be stored to.

17
Temperature Reading and Control Read User Input Start
Load voltage from temperature sensor to
memory
Convert voltage to a temperature integer
value
Convert temperature to
ASCII
Output present temperature to LCD Screen
Is the temperature
above or approaching the
upper limit?
Turn cooling system on
Is the temperature approaching the
lower limit?
Turn cooling system off
Is the cooling system on?
Turn on cooling system LED
Is the temperature out of the specified
range?
Turn on temperature out of
range LED
Is time elapsed greater than one
minute?
Store temperature to flash memory
Store total time elapsed to flash
memory
end
Start
Has Input button(#) been
pressed?
Ask for lower limit temperature
Store value to flash memory
Ask for upper limit temperature
Store value to flash memory
Output upper and lower limit strings
to LCD screen
end
No(0)
No
No
No(0)
No
No
Yes(1)
Yes (temp_max –temp) <= 2°C
Yes(temp –temp_min) <= 2°C
Yes(temp > temp_max // temp
< temp_min
Yes(# clock cycles >= 60*(cycles/sec)
Yes(1)
Interrupt normal processor operation
Convert hexadecimal input from keypad into a
numerical string
Convert hexadecimal input from keypad into a
numerical string
Increment Total time elapsed(min)

18
Reading Input from Battery Controlling the Mode of the Backpack

19
Temperature Sensor Inputs: 3V dc Outputs: 0 – 2.6V dc 0.1 mA 0.1mA Three different choices for the temperature sensor were considered and can be seen in the decision matrix below.
Table 2: Temperature sensor decision matrix
A5003MA22P0 TMP122 TD5A Weight Accuracy 4 2 3 0.2
Price 1 4 3 0.2 RTD Linearity 1 3 4 0.12
Easy Circuit Application 3 1 2 0.18
Multisim Simulation 0 0 2 0.3 Total 9 10 14 1.0
Weighted Total 1.66 1.74 2.64
The temperature sensor chosen was the NIFE TD5A temperature sensor chip. Datasheet. This temperature sensor was chosen because it was sufficiently accurate for our specifications, it can be inserted into a circuit relatively easily, and is found in Multisim’s library. The sensor basically works as a resistor that varies in its resistance as the temperature changes. This change in resistance based on temperature is known as a resistance to temperature differential, or RTD. The resistance to temperature change is very close to linear across the temperatures present in the backpack (0-43°C) and can be represented precisely by the equation:
�� = �� ∗(1 + 3.84��� ∗� + 4.94��� ∗��) Where �� is the resistance at the temperature T �� is the resistance at 0°C � is the temperature in °C
The schematic for this device can be seen in Figure 3 below. As the resistance of the sensor changes with temperature, the voltage Vout going to the microcontroller will also change. The change in the voltage coming out of the temperature sensor only changes by 0.04 volts due to a temperature change of 0 – 65°C. This output needs to be amplified to use the full range of the microcontrollers A to D converter system. Thus an op amp summer was used to subtract the minimum voltage across the temperature range (2.8V) and then the voltage change (0 – 0.04V) was amplified to make the change in voltage approximately 0V to 5V. This can be seen in Figure 3. At 0°C the voltage should be at its maximum value for the temperature range, the output voltage at that point is 5.112 V.

20
The high R1 value was selected to limit the current flowing through the circuit to below
100uA. This is done because any current beyond a value of 100uA will cause internal heating of the temperature sensor and will cause the temperature reading to be less accurate. The voltage value of 3V was chosen also to decrease the current going through the temperature sensor from the normal 5V used in digital applications. This voltage value also allowed for a fairly simple amplification to obtain an output voltage that uses the entire range of the microcontroller’s A to D converter (0-5V). This amplification occurs across the op amp to the right of Figure 3 and the gain is equal to the ratio of resistances R5 and R6. Another consideration that must be addressed is the positive and negative voltages required to power the op amps. To provide this from a battery it is required to use a separate ground to reference the circuit. In Figure 4 the battery is represented by the 12V power supply and the battery ground is seen at the bottom of the circuit. Voltage division is used to create a node that is at 6V relative to battery ground. A voltage follower op amp is used to buffer that 6V node to not allow the circuitry to the right of the op amp affect the 6V node. Thus the 6V output can be used as a new ground and the 12Vsource and battery ground can be used as the 6V and -6Vseen in Figure 4. Finally, the voltage that is to be subtracted from the circuit to obtain the correct output from the summing amplifier (V4 in Figure 3) will need to be tested in circuit to obtain the exact value that must be subtracted to have an output of 0V at around 50°C. A dc to dc converter will be used to provide this voltage similar to the ones used to send power to the microcontroller. The actual voltage that will be produced by this converter relative to the battery will be 6V minus the level that needs to be subtracted because this will be negative relative to the new ground that will be used in this circuit.

21
Figure 4: Temperature Sensor Circuit
Figure 5: Op Amp Power Provision Circuit
Figure 3: Temperature sensor circuit
Figure 3: Op amp power provision circuit

22
Car Cigarette Lighter Charging Circuit Inputs: 12-14.5V dc Outputs: 12-14.5V dc 0-10A 0-10A The car connection circuit will be plugged into a cigarette lighter output on a car. The standard output of these connections is rated at 12V and will output current up to their fuse rating which is usually around 20-30A. When the car is off the input from the cigarette lighter will be very close to 12V. When the car is turned on, however, the voltage will rise to anywhere from 13.5 to 14.5 V. Due to the durability of the lead acid battery no circuitry will be needed to protect it from the higher voltage values. Thus the only circuitry needed is the car jack input and the diodes to prevent discharge back into the car battery. There will be a switch that the microcontroller will control that will connect and disconnect the input from the car to the battery and the system. This switch will be closed if the backpack is in the vehicle power mode and open otherwise. Also, diodes will be used to prevent the battery from discharging if the voltage on the input drops below the voltage of the battery. This is expected to happen when the car is first turned on and the engine is starting. The lighter that will be used is the Digi-Key APP-001-20AMP-ND cigarette lighter plug. Datasheet. This assembly contains a connection that will fit any standard car cigarette lighter plug and is rated for 12V and up to 20A. This is well above the power requirements of our system. The circuit can be seen in Figure 5. The 14.5V supply on the left is the car power supply and the 12V supply on the right is the battery for the system.
Figure 4: Car Cigarette Lighter/Battery Circuit

23
DC to DC Converter After researching about different circuit configurations for the design of the DC to DC converter, we decided that we are going to use pulse switching regulators. This method is used to transfer energy from the input to the output, converting one DC voltage level to another. It is more efficient (power efficiency of 75-98%) than using a linear voltage regulator that would dissipate unwanted power as heat. By using pulse-width modulation (PWM), the average value of voltage (and current) fed to the load is controlled by turning the switch between supply and load on and off at a fast pace. The longer the switch is on compared to the off periods, the higher the power supplied to the load is. A LabVIEW file we found online demonstrates this, as shown in Figure 6.
Figure 5: This LabVIEW simulation shows the longer the switch is on compared to the off periods, the higher the power supplied to the load is.

24
According to the operating voltages and currents of the elements to be powered, the DC to DC converter circuit needs to provide a power of about 0.8 W as shown in Table 1.
Table 3: Specifications for the DC to DC converter
Operating Voltage (V) Operating Current (A) Operating Power (W) Microprocessor 2 0.001 0.002
Temperature Sensor 10 0.0001 0.001 Key Pad 12 0.005 0.06
LCD Screen 5 0.1465 0.7325 Total 0.1526 0.7955
The TPS40192 is an integrated circuit that is useful for this purpose. It has 4.5 V to 18 V input voltage range and adjustable output voltage range of 0.59-15 V. The TPS40192 integrated circuit is available in an 10-pin SOIC (Small outline integrated circuit) package which is a convenient size for the design of the DC to DC converter circuits. This a very small integrated circuit that may need to attached to the circuit board by using surface mount soldering. If the budget allows us and we don’t have many further expenses, we can ask the company that will make our printed boards to do this. The datasheet of the TPS40192 is available in Appendix C.
The TPS40192 integrated circuit is a cost-optimized synchronous buck controller. This controller implements a voltage-mode control architecture with the switching frequency fixed at 600 kHz. The higher switching frequency facilitates the use of smaller inductor and output capacitors, thereby providing a compact power-supply solution. The TPS40192 also has short circuit detection, pulse by pulse limiting (to prevent current runaway) and provides limited power dissipation in the event of a sustained fault. Texas Instruments, on its website, provides software named SwitcherPro that can be used to create circuits according to the specifications of the user. Using this software, the circuits for the DC to DC converters were designed. These circuits use the TPS40192 integrated circuit described previously.

25
Figure 6: DC to DC converter for the LCD screen VinMin: 12.00V VinMax: 13.50V Vout: 5.00V Iout: 0.20A
26
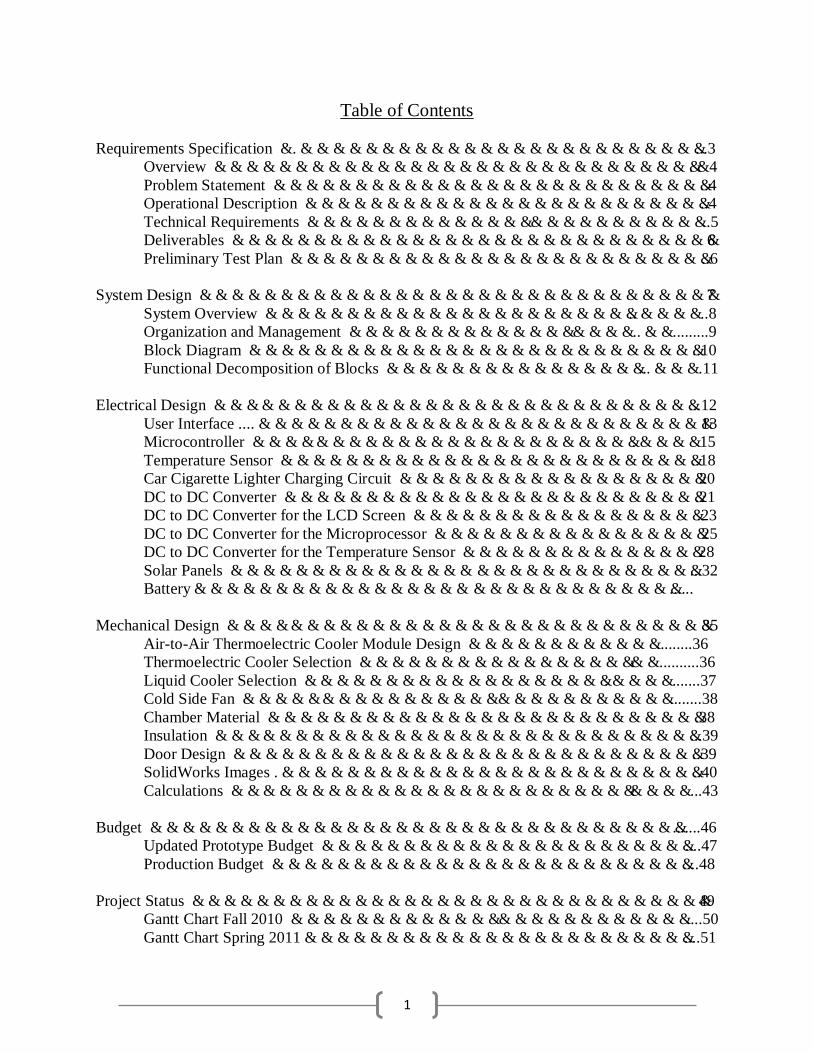
Table 4 shows a list of the elements that the circuit for the LCD screen uses, along with their values and manufacturer name.
Table 4: Elements of the DC to DC converter for the LCD screen
Name Part Number Description Manufacturer C10 Standard Capacitor, Ceramic, 1uF, 6.3V, 10% Standard C11 Standard Capacitor, Ceramic, 1uF, 35V, 10% Standard C12 Standard Capacitor, Ceramic, 4.7uF, 10V, 10% Standard C2 C3216X5R1C106KT Capacitor, Ceramic, 10uF, 16V, 10% TDK C3 Standard Capacitor, Ceramic, 0.47uF, 16V, 10% Standard C6 Standard Capacitor, Ceramic, 8200pF, 10V, 20% Standard C7 Standard Capacitor, Ceramic, 330pF, 10V, 20% Standard C8 Standard Capacitor, Ceramic, 3300pF, 10V, 20% Standard C9 GRM32ER72A225KA35L Capacitor, Ceramic, 2.2uF, 100V, 10% muRata L1 NPIS75T101MTRF Inductor, 100uH, 0.5A, 360mΩ Nic
Q1 CSD16321Q5 Transistor, NFET, 25V, 100A, 3mΩ Texas Instruments, Inc.
Q2 CSD16321Q5 Transistor, NFET, 25V, 100A, 3mΩ Texas Instruments, Inc.
R1 Standard Resistor, SurfaceMount, 10KΩ, 100mW, 1% Standard
R10 Standard Resistor, SurfaceMount, 0.0Ω, 100mW, 1% Standard
R11 Standard Resistor, SurfaceMount, 0.0Ω, 100mW, 1% Standard
R2 Standard Resistor, SurfaceMount, 1.33KΩ, 100mW, 1% Standard
R3 Standard Resistor, SurfaceMount, 4.22KΩ, 100mW, 1% Standard
R5 Standard Resistor, SurfaceMount, 422Ω, 100mW, 1% Standard
U1 TPS40192 IC, Controller, 10 pins Texas Instruments, Inc.
The DC to DC converter for the LCD screen was designed for a minimum input voltage of 12V, maximum input voltage of 13.5 V, output voltage of 5V and 0.2 A output current. This circuit, compared to the DC to DC converters for the other elements has the best efficiency. Its efficiency is displayed in Figure 8. The DC to DC converters for the microprocessor and temperature sensor have the same configuration. Their only differences are the values of the elements which provide the desired outputs.
27
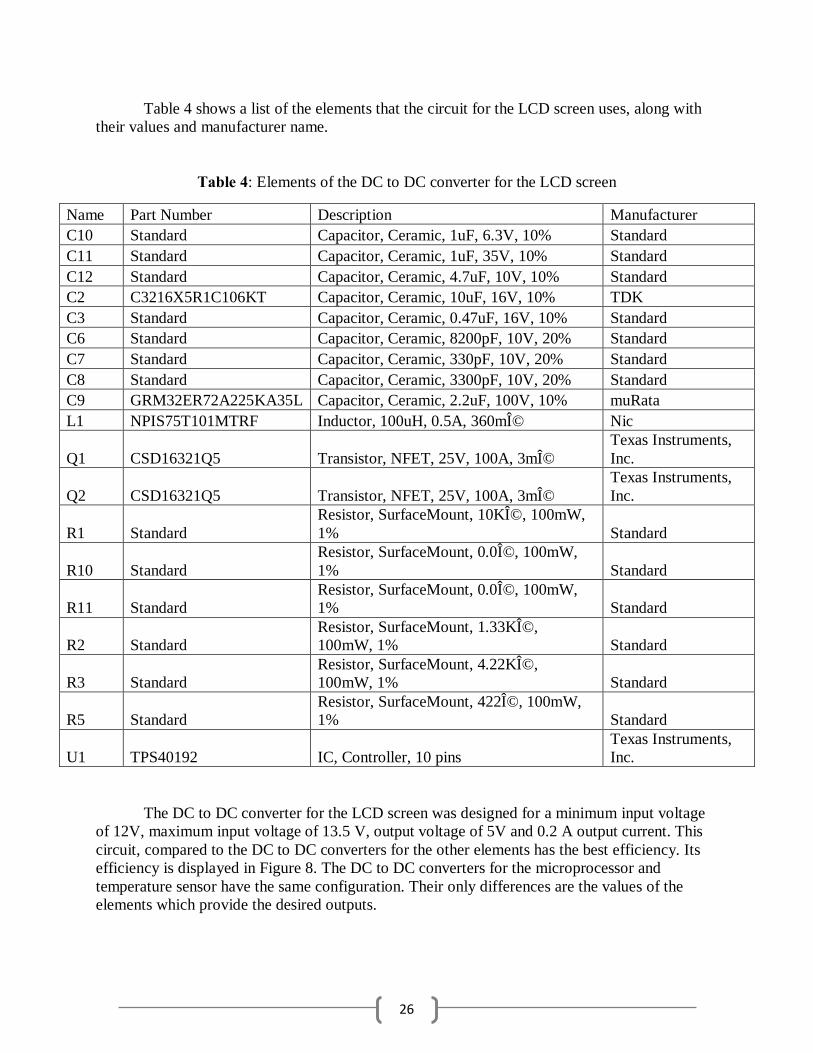
. Figure 7: Efficieny of the DC to DC converter for the LCD screen
DC to DC converter for the Microprocessor Figure 9 displays the circuit designed to provide the required energy for the microprocessor. Table 5 shows an analysis for the outputs of this circuit.
Table 5: This analysis provided by SwitcherPro shows the desired outputs of 2V
Parameter User Input
Nominal
User Input
Maximum
Default Input
Minimum
Default Input
Nominal
Default Input
Maximum
Calculated Minimum
Calculated Nominal
Calculated Maximum Units
Output Voltage 2.000 - - - - 1.987 - 2.065 Volts
Output Ripple - - - - 40 - - 1 mVp-p
Output Current - 0.050 1.000 - - - - - Amps Inductor Peak
to Peak Current
- - - - - 0.034 - 0.034 Amps
Current Limit Threshold - - - 1.075 - - - - Amps
Gain Margin - - -10 - - - -19 - dB
Phase Margin - - 45 - - - 48 - Deg. Upper FET
RDSon - - - - - 2 - 2 mOhms
Lower FET RDSon - - - - - 2 - 2 mOhms
Duty Cycle - - - - - 14.9 - 16.8 % On Time
Min(switch) - - - - - 212.9 - 337.7 ns
Cross Over Frequency - - - - - - 24 - KHz
0
10
20
30
40
50
60
70
80
0 0.05 0.1 0.15 0.2 0.25
Effic
ienc
y (%
)
Current (A)
Efficiency
Efficiency For Vin Max
Efficiency For Vin Min

28
Figure 8: Circuit design of DC to DC converter for microprocessor VinMin: 12.00V VinMax: 13.50V Vout: 2.00V Iout: 0.05A

29
Table 6: Values for the elements of the DC to DC converter for the microprocessor
Table 7: Stress on the components of the DC to DC converter of the microprocessor
The DC to DC converters involve many elements, which imply lots of surface mount parts. This is still more convenient than using voltage regulators that expel a lot of heat and are less power efficient.
Name Part Number Description Manufacturer Package C10 Standard Capacitor, Ceramic, 1uF, 2.5V, 10% Standard 603 C11 Standard Capacitor, Ceramic, 1uF, 35V, 10% Standard 805 C12 Standard Capacitor, Ceramic, 4.7uF, 10V, 10% Standard 603 C2 C3216X5R1C106KT Capacitor, Ceramic, 10uF, 16V, 10% TDK X5R C3 Standard Capacitor, Ceramic, 0.47uF, 16V, 10% Standard 603 C6 Standard Capacitor, Ceramic, 0.01uF, 4V, 20% Standard 603 C7 Standard Capacitor, Ceramic, 390pF, 4V, 20% Standard 603 C8 Standard Capacitor, Ceramic, 3300pF, 4V, 20% Standard 603 C9 GRM32ER72A225KA35L Capacitor, Ceramic, 2.2uF, 100V, 10% muRata 1210 L1 NPIS75T101MTRF Inductor, 100uH, 0.5A, 360mΩ Nic Shielded Q1 CSD16321Q5 Transistor, NFET, 25V, 100A, 3mΩ Texas Instruments, Inc. QFN 5x6 Q2 CSD16321Q5 Transistor, NFET, 25V, 100A, 3mΩ Texas Instruments, Inc. QFN 5x6 R1 Standard Resistor, SurfaceMount, 10KΩ, 100mW, 1% Standard 603 R10 Standard Resistor, SurfaceMount, 0.0Ω, 100mW, 1% Standard 603 R11 Standard Resistor, SurfaceMount, 0.0Ω, 100mW, 1% Standard 603
R2 Standard Resistor, SurfaceMount, 4.12KΩ, 100mW, 1% Standard 603
R3 Standard Resistor, SurfaceMount, 3.74KΩ, 100mW, 1% Standard 603
R5 Standard Resistor, SurfaceMount, 412Ω, 100mW, 1% Standard 603 U1 TPS40192 IC, Controller, 10 pins Texas Instruments, Inc. SON
Device Rated Voltage
Calculated Voltage
Rated Current (RMS)
Calculated Current (RMS)
Power Calculated
Max. Temp.
C9 (High Freq. Input Cap) 100V 13.6V 2.55A 19mA 731nW -
C2 (Bulk Output Cap) 16V 2.01V 3.5A 9.9mA 99nW - L1 (Output Inductor) - - 0.5A 51mA 936uW - Q1 (Power Switch) 25V 13.6V 100A 21mA 142mW 30˚C Q2 (Sync. Rectifier) 25V 13.6V 100A 47mA 87mW 28˚C

30
Figure 9: DC to DC converter for the temperature sensor VinMin: 12.00V VinMax: 13.50V Vout: 10.00V Iout: 0.01A

31
Table 8: Main analysis for DC to DC converter for the Temperature Sensor
Table 9: Output analysis for DC to DC converter for the Temperature Sensor
Parameter User Input Nominal
User Input Maximum
Default Input
Minimum
Default Input
Nominal
Default Input Maximum
Calculated Minimum
Calculated Nominal
Calculated Maximum Units
Output Voltage 10.000 - - - - 9.900 - 10.383 Volts
Output Ripple - - - - 200 - - 1 mVp-p Output Current - 0.010 1.000 - - - - - Amps
Inductor Peak to Peak Current
- - - - - 0.033 - 0.052 Amps
Current Limit Threshold - - - 0.015 - - - - Amps
Gain Margin - - -10 - - - -18 - dB
Phase Margin - - 45 - - - 48 - Deg. Upper FET
RDSon - - - - - 2 - 2 mΩ
Lower FET RDSon - - - - - 2 - 2 mΩ
Duty Cycle - - - - - 74.1 - 83.4 % On Time
Min(switch) - - - - - 1055.6 - 1674.0 ns
Cross Over Frequency - - - - - - 22 - kHz
Parameter User Input
Minimum
User Input
Maximum
Default Input
Nominal
Default Input
Maximum
Calculated Nominal
Calculated Maximum Units
Input Voltage 12 13.5 - - - - Volts
Input Ripple - - - 270 - 1.8 mVp-p
UVLO(Start) - - - - 4.2 - Volts UVLO(Stop) - - - - 3.4 - Volts
Switching Frequency - - 600 - - - KHz
Slow Start - - 1 - - - ms Estimated PCB
Area - - - - 309 - mm²
Max Component Height - - - 25 - 8 mm

32
Table 10: List of elements used in circuit design
Name Quantity Part Number Description Manufacturer
C10 1 Standard Capacitor, Ceramic, 1uF, 16V, 10% Standard
C11 1 Standard Capacitor, Ceramic, 1uF, 35V, 10% Standard
C12 1 Standard Capacitor, Ceramic, 4.7uF, 10V, 10% Standard
C2 1 C3216X5R1C106KT Capacitor, Ceramic, 10uF, 16V, 10% TDK
C3 1 Standard Capacitor, Ceramic, 0.47uF, 16V, 10% Standard
C6 1 Standard Capacitor, Ceramic, 0.015uF, 20V, 20% Standard
C7 1 Standard Capacitor, Ceramic, 560pF, 20V, 20% Standard
C8 1 Standard Capacitor, Ceramic, 3900pF, 20V, 20% Standard
C9 1 GRM32ER72A225KA35L Capacitor, Ceramic, 2.2uF, 100V, 10% muRata
L1 1 NPIS75T101MTRF Inductor, 100uH, 0.5A, 360mΩ Nic
Q1 1 CSD16321Q5 Transistor, NFET, 25V, 100A, 3mΩ
Texas Instruments, Inc.
Q2 1 CSD16321Q5 Transistor, NFET, 25V, 100A, 3mΩ
Texas Instruments, Inc.
R1 1 Standard Resistor, SurfaceMount, 10KΩ, 100mW, 1% Standard
R10 1 Standard Resistor, SurfaceMount, 0.0Ω, 100mW, 1% Standard
R11 1 Standard Resistor, SurfaceMount, 0.0Ω, 100mW, 1% Standard
R2 1 Standard Resistor, SurfaceMount, 619Ω, 100mW, 1% Standard
R3 1 Standard Resistor, SurfaceMount, 2.87KΩ, 100mW, 1% Standard
R5 1 Standard Resistor, SurfaceMount, 402Ω, 100mW, 1% Standard
U1 1 TPS40192 IC, Controller, 10 pins Texas Instruments, Inc.

33
Table 11: Stress analysis for the components of the circuit
Device Rated Voltage
Calculated Voltage
Rated Current (RMS)
Calculated Current (RMS) Power Calculated
Max Temp
C9 (High Freq. Input Cap) 100V 13.6V 2.55A 13mA 363nW -
C2 (Bulk Output Cap) 16V 10V 3.5A 15mA 226nW -
L1 (Output Inductor) - - 0.5A 18mA 117uW -
Q1 (Power Switch) 25V 13.6V 100A 16mA 138mW 30˚C Q2 (Sync. Rectifier) 25V 13.6V 100A 9.2mA 297mW 36˚C
C9 (High Freq. Input Cap) 100V 13.6V 2.55A 13mA 363nW -
C2 (Bulk Output Cap) 16V 10V 3.5A 15mA 226nW -
L1 (Output Inductor) - - 0.5A 18mA 117uW -
Q1 (Power Switch) 25V 13.6V 100A 16mA 138mW 30˚C Q2 (Sync. Rectifier) 25V 13.6V 100A 9.2mA 297mW 36˚C
Figure 10: Efficiency - this circuit is not as efficient as the other DC to DC converters, although the overall power is very low.
0
2
4
6
8
10
12
14
16
18
20
0 0.002 0.004 0.006 0.008 0.01 0.012
Effic
ienc
y (%
)
Current (A)
Efficiency For Vin Max
Efficiency For Vin Min

34
Solar Panels
In order to choose the solar panels, 3 deciding factors were considered: • The power draw during daytime use. (Governs the Solar Panel Wattage) • The current draw during nighttime use. (Governs the Battery Size) • The expected sunlight intensity during use.
For the system operation conditions during use it was assumed that there would be 12 hours of day and 12 hours of night for each day cycle. This means that there will be two days and two nights in which the backpack must operate during the objective 48 hours of run time. During the day the backpack will be charged by the solar panels if it is not being run by the wall outlet or the car cigarette lighter. During the night, however, the backpack will be powered only by the battery. Therefore it is necessary to obtain calculations on the power draw during the day to find the amount of power that the solar panels must output to run the backpack along with the battery. It is also necessary to find the current draw at night to find the amount of Amp-hours that the battery must contain to provide energy through two night cycles.
To find the power draw during the day the heat gained through the insulation and the heat expelled by the TEC are evaluated. The insulation is expected to have an average of 1.728W of heat gain while the TEC is expected to expel heat from the pack by around 13W. These numbers will be rounded, to account for inefficiencies and undesirable conditions, to 2W gained and 10W expelled. Thus the cooling system will need to be turned on about one sixth of the total time to expel the same amount of heat that was gained during the other five sixths. Or, the backpack will be turned on 4 hours out of every day to expel the heat that was gained in the other 20 hours. The amount of power draw taken by the system is now evaluated while the cooling system is on and off. The values for this can be seen in Table 10 below.
Table 12: Full system (normal operation)
Operating
Voltage (V) Operating
Current (A) Operating
Wattage (W) Microprocessor 2 0.001 0.002
Temperature Sensor 3 0.0001 0.0003 Key Pad 5 0.0018 0.009
LCD Screen 5 0.1465 0.7325 Op Amps 12 0.0082 0.0984
DC to DC converter ICs 12 0.004 0.048 TEC 11.67 2.82 32.9094
Cold Sink Fan 12 0.3 3.6 Heat Sink Fan 12 0.3 3.6
Total (Cooling system off) 0.1616 0.8902 Total 3.5816 40.9996
Now that the amount of time per day that the TEC will be turned on and the amount of power in watts that the system draws are known, the power that the Solar panels must output per

35
day can be calculated. This was calculated using a 12 hour day and a 2 hour cooling system run period. Increased values of for the power draw were used to compensate for undesirable conditions.
��� ℎ��= ��� ��ℎ��∗����� ���� �� �= (2ℎ� ∗ 44� ) + (10ℎ� ∗ 1� ) = 98 � ℎ�
Thus the backpack will use 98 Watt-hours per day. A solar panel will need to output more than this per day while being exposed to an average amount of sunlight.
Since the backpack will be operating solely on the battery during the 12 night hours per day, the battery must provide most of the energy needed for the two night cycles that will occur during the 48 hour period. The only energy that will be added to the battery for these times will come from the recharge from the solar panels during the second day cycle. Thus the amount of Amp-hours used during both night cycles must be evaluated to find how many Amp-hours the battery must output for two nights before being fully discharged. The equation to find this, using current values taken from Table 10, is as follows. The current values are also increased to account for undesirable conditions. # �� �ℎ� = ��� ��ℎ��∗ ������� ���� ���= �4 ℎ�∗3.8��+ �20ℎ�∗0.2��= ��. � ���
This shows that the backpack will draw 19.2 Ahr in the 24 hour period of two night
cycles. Thus the battery must be able to hold at least this much energy. The wattage needed from the solar panel is governed by both the Watt-hours used by the
backpack during the day and the expected time of average sunlight per day. This can be found many places and in many ways. A view of the solar Insolation or a measure of solar radiation energy received on a given surface area in a given time (kWh/m�/day) for each part of the world can be seen in Figure 12.
Figure 11: Solar insolation in different parts of the world

36
From this map of sunlight intensity it can be deduced that the average amount of sunlight for most target parts of the world (including most of Africa, South America, and Asia) is somewhere around 4 kWhr/m�/day. The areas that meet this sunlight intensity are shown in dark orange, red, and dark red in Figure 12. The backpack will be designed assuming this amount of sunlight intensity. 4 kWhr/m�/day converts to about 165 Watts/m�/day. The backpack’s power requirement of 98 Whr/day is well below 4kWhr/day therefore the area of the solar panel can be much less than 1 meter squared.
To obtain 98 Whr/day and charge the backpack’s battery, the solar panel’s wattage must be high enough to absorb more than 98Whr of energy within the amount of time that the sunlight intensity is high enough to provide power to the system. In an undesirable situation, the number of hours of sunlight per day would be around 4 while in better cases the number would be around 10. The backpack will be designed for the worst case scenario of 4 hours. At 4 hours of sunlight per day the backpack would need at least 25 Watts to provide the 98 Whr/day needed to run the backpack. To partially charge the battery, the wattage would need to be higher than this. 30 Watts is a common output rating for solar panels and would be sufficient for this application. Furthermore, 30W solar panels can be obtained within the budget requirements of the project. Therefore 30W is the minimum wattage that will sufficiently power and charge the backpack when the solar panel is exposed to 4 hrs of sunlight per day.

37
Battery
In order to choose the most convenient 12V battery, a decision matrix was made (Shown in Table 11). The characteristics that were taken into consideration in this decision were: price, amp hours, size, weight and energy density. For the batteries with less than 15Ahs, the distribution of weights was given taking into consideration that 2 batteries would be used instead of one in order to provide the required power.
Table 13: Decision matrix for choosing the battery
According to the results of the matrix, it was decided that the B&B HR15-12 battery would be used to provide energy to the system. The datasheet for this battery can be found in Appendix X.
12 V Batteries: Price 30% Ah 20% Size (in) 18% Weight(lb) 22% Energy density 10% Total
B&B HR15-12 $23.80 10 14 10 5.95x3.86x3.7 7 9.26 7 Lead Acid 8 8.6 Shmarock $214.11 4 10 6 small 10 1.32 9 Lithium Ion 10 7.18 U1-12RTL $249.99 4 24 10 7.75x5.2x7.2 6 9 7 Lithium Ion 10 6.82 Batterygeek $27.24 10 10 6 5.94x2.57x4.42 7 7 7 Lead Acid 8 7.8 2010wonder 15 $72.32 6 15 10 2.1x5.5mm 10 1.27 9 Lithium Ion 10 8.58 2010wonder 9.8 $40.00 8 9.8 6 4.4x1.7x1.49 9 0.94 10 Lithium Ion 10 8.42 UB121180 $38.95 9 18 9 7.13x3.01x6.57 5 11.9 6 Lead Acid 8 7.52 UB121181 $38.95 9 18 9 7.13x3.01x6.58 5 11.9 6 Lead Acid 8 7.52 SLA24-12 $54.95 9 26 10 6.89x6.54x4.92 6 19 5 Lead Acid 8 7.68

38
Mechanical Design
39
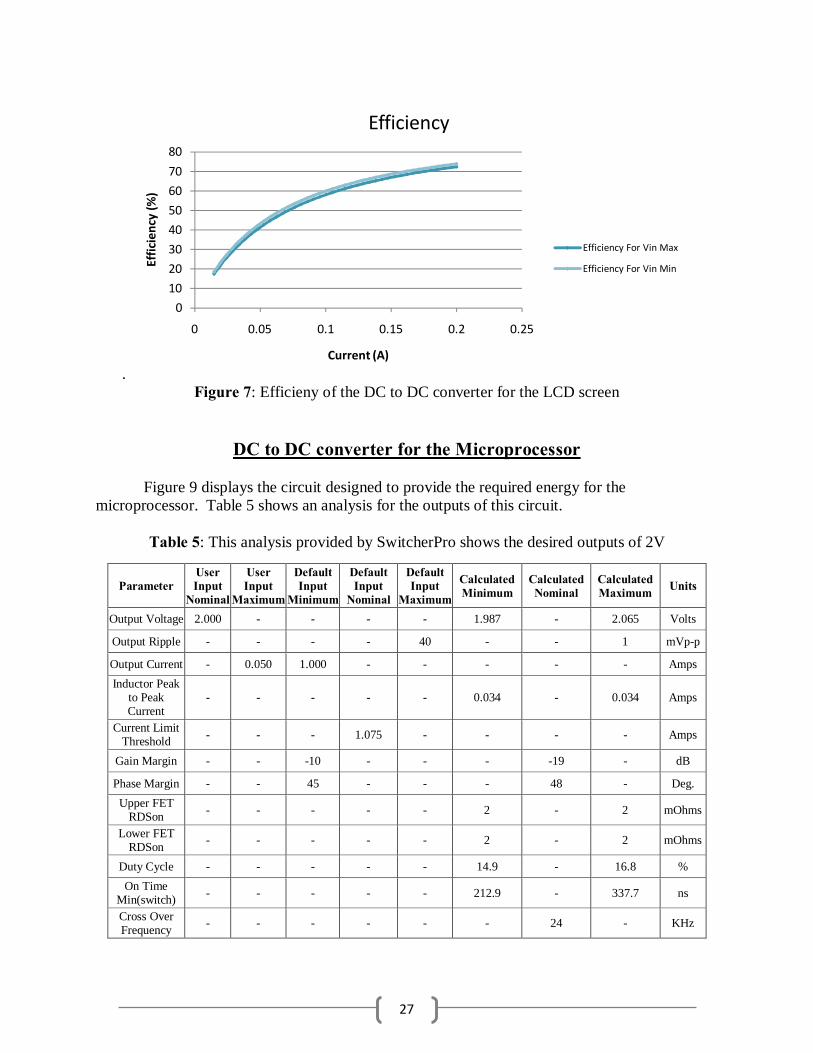
Air-to-Air Thermoelectric Cooler Module Design An air-to-air thermoelectric cooler module was chosen for our cooling system. Alternative solutions such as a free-piston Stirling cooler (FPSC) or a compressor proved to be either unavailable or not suitable for our project due to cost, weight, and safety specifications. The air-to-air thermoelectric cooler module consists of a thermoelectric cooler (TEC), a self contained liquid cooler with radiator and fan to dissipate heat to the environment, and a cold sink with fan to distribute the cold air within the insulated chamber.
Table 11: Decision matrix for cooler selection
Thermoelectric Cooler Selection Laird Technologies, a manufacturer of TECs, offers free software called “AZTEC Thermoelectric Design Guide” which lets the user enter certain parameters and then recommends one or more TECs that are appropriate. The AZTEC software can be found at http://www.lairdtech.com/Products/AZTec-Software-Download/. Using this software, parameters for the ambient temperature, the cold surface temperature, and the required heat pumping were entered. At an ambient temperature of 30℃ , the TEC draws a current of 2.82 A at an operating voltage of 11.67 V and is able to expel 13.10 W of heat. The liquid cooler and the cold side fan draw an additional current of about 0.725 A. In order to account for inefficiencies, it was assumed that the TEC expels 10 W of heat, and with a heat gain of 2 W, the TEC has to run only 20% of the time, therefore justifying such high amperage for a portable backpack refrigerator.

40
Liquid Cooler Selection
Figure 12: ECO Advanced Liquid Cooler
The “CoolIT ECO Advanced Liquid Cooler” (DATASHEET is found in Appendix __) is a self contained, low profile liquid cooling system that was designed to cool a CPU of a desktop computer. Liquid coolers are the next generation heatsink and have many advantages over conventional extruded heatsinks. This cooler was chosen, because it is has a very low thermal resistance and therefore is able to reject the heat from the TEC to the environment well, because it is lightweight, and because it is reasonably priced (≈ $60). Another reason why the ECO A.L.C. is an attractive way to remove heat from the TEC is that the water block with the pump and the radiator with the attached fan are two separate parts. This feature allows for more options in the design of the air-to-air thermoelectric cooler module, because the radiator and the fan can be attached below the insulated chamber rather than in its wall. The pump that is attached to the water block uses only 1.5W, and the 120mm fan that blows air through the radiator uses about 0.3A, which our system will be able to support.
Table 12: Decision matrix for heatsink selection

41
Cold Side Fan
For the cold side fan an 80 mm fan will be used, because the brackets of the ECO A.L.C. are 80 mm apart and that way the TEC can be sandwiched between the water block and the cold sink. Long screws will be used to attach the fan to the cold sink and to the water block. The NMB-MAT 3106KL 80mm x 15mm fan (DATASHEET is found in Appendix__) was chosen for the cold side fan. This fan is able to produce a maximum airflow of 0.93 � �
� ��
drawing a current of 0.3 A. Its low profile makes it ideal for this design, because the air-to-air thermoelectric cooler module will be incorporated into the insulation of the inner chamber of the backpack. It costs only $12 and its weight is negligible. Compared to other low profile 80 mm fans, the 3106KL has the ability to produce a much larger airflow, which will increase convection and therefore increase the efficiency of the cooling system. At its maximum speed of 3000 rpm, this fan is much louder (34 dB) than other fans of its size, but creating too much noise is not an issue, so this property is totally acceptable. Overall, the Panaflo 80mm x 15mm fan has everything that is needed for the cold side fan.
Chamber Material The material chosen for the inner chamber and outer chamber is tempered hardboard. The only types of materials practical for the chambers were hard plastics and metals. Most metals were out of the question because the weight of the backpack must be minimized and they would definitely be too heavy. The one metal considered was aluminum. It is a light enough metal that it was a possibility, but it was more expensive than some of the other options we considered. Injection molding was briefly considered because it would be the easiest way to make it and because this is the usual way a chamber such as this would be made. But it is very expensive and out of the range of our budget. Arcylic sheets were an option that we seriously considered. They were very light and strongy, which were two very important qualities to us. Their price was reasonable, but not the best. And while they were strong, they were also flexible, which worried us. Tempered hardboard was a material we found based on a suggestion by a Lowe’s employee. It is slightly heavier than the acrylic sheets, but it was still lighter than aluminum. It is a very strong, non-flexible material and it has a very good price. These reasons together contributed to it being chosen as the chamber material.
Table 13: Decision matrix for chamber material selection
Aluminum Molded Plastic Acrylic Sheets Tempered
Hardboard Weight
Weight 2 2 3 2 0.3 Cost 2 0 2 3 0.4
Strength 3 2 3 3 0.2 Flexibility 2 3 1 3 0.1
Total 9 7 9 11 1.0 Weighted Total 2.2 1.3 2.4 2.7

42
Insulation Polystyrene sheathing was chosen as the type of insulation for the unit. There were multiple materials considered for the insulation. A vacuum was briefly considered because it is the best insulator. But that would have presented problems in sealing it and if the box was accidentally punctured the insulation would become completely void. Aerogel sheets were also considered. They have very high R-values (insulation values), but they were very expensive and out of the range of our budget. Fiberglass insulation was considered. It is commonly used as housing insulation. Fiberglass also has a high R-value, but it greatly decreases when the fiberglass is compressed (because its air pockets are what give it such a high R-value); which it would be in our design. Also, fiberglass is not made to get wet, which it would from condensation on the inner chamber, and it would not have provided a firm support for the inner chamber, which was something we were looking for. Different types of spray foams were also considered. Types of spray foam used in housing insulation were considered, but that could only be gotten through a contractor, which would have been too expensive. Small bottles of spray foam are sold at local hardware stores for home use, but these had a lower R-value than we wanted. Also, they took several hours to cure and once cured become rigid. This would have caused problems with holding the inner chamber in place while the foam cured and would not have allowed for changing of the insulation if something unexpected happened. The material that was then decided upon was rigid foam boards; more specifically, polystyrene sheathing insulation. These had high R-values, provided protection/support for the inner chamber, are relatively cheap, and locally available. Our team took a trip to Lowes and found a type of board that fit our needs.
Table 14: Decision matrix for insulation selection
Vaccuum Aerogel Fiberglass Sprayfoam Rigid Board Weight
R-Value 3 3 3 2 2 0.4
Durability 0 0 0 2 3 0.25
Cost 2 0 2 3 3 0.25 Ease of
Installation 1 2 1 1 3 0.1
Total 6 5 6 8 11 1.0
Weighted Total 1.8 1.4 1.8 2.15 2.6
Door Design There were multiple way to design the door of the refrigeration unit. The door could either be on one of the sides of the backpack or on the top. We decided to put it on the top of the unit because it has less surface area and would therefore experience less heat loss when opened as opposed to a side door. Another reason we choose to put it on the top was because there

43
would be less chance if it not being shut all the way or catching on something and being torn open.
There will be one door on top that will open the outer chamber and have the insulation below attached to it. Then the inner chamber will have its own door as well. Both of the doors will be attached with hinges. Gasket seals will be applied around the edges of each door in order to prevent heat loss. The rough cross sectional sketches below illustrated how these doors will be designed.
SolidWorks Images On the following pages are pictures of the model of our project in SolidWorks. The model is built to the actual dimension and each part has its correct material properties applied to it in order to allow future finite element analysis (FEA) studies. The outside box dimensions (H× W× D) are 79.64cm x 59.48cm x 54.48cm.

44
Figure 13: Backpack unit - front view
Figure 14: Backpack unit - back view
Outer Shell
Strap Attachments Location
Outer Shell
User Interface
User Interface
Door Hinges
Door Hinges

45
Figure 15: Cross sectional front view of the backpack (note: vaccines are not packaged in a
standard way, this type of vaccine packaging is an example of one way to package them)
Figure 16: Cross sectional side view of the backpack
Outer Shell
Insulation
Inner Shell
Vaccine Packages
Circuitry
Battery
Inner Shell
Outer Shell
Insulation Vaccine Packages
Battery
Cool Pack
User Interface
Frame
Frame
Cool Pack
Door Hinges
Door Hinges

46
Figure 17: Model of user interface
Calculations
Heat Loss Through Insulation: The R-value of each sheet of our insulation is � = 6.82 ���∙℉ ∙��
���.
Each sheet is 2.54 cm (1 in) thick. We will be using 12.7 cm (5 in), so our R-value of the insulation on each side is:
���� = 5 �6.82 ���∙℉ ∙�����
� = 34.10 ���∙℉ ∙�����
.
Converting to metric units:
���� = �34.10 ���∙℉ ∙�����
���.������ �∙℃
�
����∙℉ ∙��� ��
� = 6.005 � �∙℃�
.
The surface area is:
� = 2���� ������+ 2����� ������+ 2������ ������
� = 2�0.20� ∙ 0.25� �+ 2�0.25� ∙ 0.35� �+ 2�0.35� ∙ 0.20� �
� = 0.415� �
LED Screen
LED Screen
Keypad
LED Lights

47
The average external temperature the backpack will operate at will be 30℃ (86℉ ) and the maximum external temperature will be 43℃ (110℉ ). Our temperature changes then are:
∆���� = 30℃ − 5℃ = 25℃
∆�� �� = 43℃ − 2℃ = 41℃
Using these values, our heat loss is calculated to be:
����� =∆���� ∙ �
����=
25℃ ∙ 0.415� �
6.005 � � ∙ ℃�
= 1.728 �
��� �� =∆���� ∙ �
����=
41℃ ∙ 0.415� �
6.005 � � ∙ ℃�
= 2.833 �
Box Dimensions
Figure 18: Outer chamber design
Bottom Panel
Top Panel
Front Panel
Back Panel
Right Panel
Left Panel

48
Figure 19 shows how all the panels will fit together. The calculations for the sizing of the outer panels are shown below. Height = top insulation height + inner top panel thickness + inner chamber height + inner bottom
panel thickness + bottom insulation height + error/uncertainty + bottom chamber height
Height = 2(insulation height) + 2(panel thickness) + inner chamber height + error/uncertainty + bottom chamber height
Height = 2(12.7cm) + 2(1.27cm) + 35cm + 4cm + 12.7cm
Height = 79.64cm Width = outer left panel thickness + left insulation width + inner left panel thickness + inner
chamber width + inner right panel thickness + right insulation width + outer right panel thickness + error/uncertainty
Width = 2(insulation width) + 4(panel thickness) + inner chamber width + error/uncertainty
Width = 2(12.7cm) + 4(1.27cm) + 25cm + 4cm
Width = 59.48cm Depth = outer front panel thickness + front insulation depth + inner front panel thickness + inner
chamber depth + inner back panel thickness + back insulation depth + outer back panel thickness + error/uncertainty
Depth = 2(insulation depth) + 4(panel thickness) + inner chamber depth + error/uncertainty
Depth = 2(12.7cm) + 4(1.27cm) + 20cm + 4cm
Depth = 54.48cm

49
Budget

50
Updated Prototype Budget
Estimated Cost of Supplies(Prototype)
Item (Quantity) Possible Vendor Cost Date of Estimate
Electrical
Solar Panel(2) eBay $215 7-Dec-10
Microprocessor(6) microchipDIRECT $0 11-Oct-10
LCD Screen auspicious-e $13 16-Nov-10
keypad/Encoder Grayhill/ $25 7-Dec-10
Temperature Sensor(4) NIFE $13 7-Dec-10
Battery(2) Battery Sharks $65 7-Dec-10
Op amps(10) bananza $14 7-Dec-10
DC to DC Converter(8) Texas Instruments $16 7-Dec-10
Mechanical
Insulation LOWES $28 7-Dec-10
Casing LOWES $25 7-Dec-10
Frame LOWES $15 7-Dec-10
Thermoelectric cooler Mouser $50 16-Nov-10
Fan/Guard Newark $16 7-Dec-10
heat sink Joorat $61 11/16/2010
Misc.
Circuit Board SUNSTONE $40 11-Oct-10
Miscellaneous $404 7-Dec-10
Total $1,000
The budget above contains the rough costs for each of the components that were purchased for the prototype. Shipping and handling has been incorporated into the prices that are displayed. The solar panels, battery, and frame material all much less expensive than originally expected. This will allow us to have sufficient miscellaneous funds for next semester if difficulties are encountered. There were no real unpleasant surprises as far as pricing is concerned. All parts can be found at reasonable prices and many decrease in price when purchased in bulk.

51
Production Budget
Estimated Cost of Supplies(Production)
Item (Quantity) Possible Vendor Cost Date of Estimate
Electrical
Solar Panel eBay $175 7-Dec-10
Microprocessor microchipDIRECT $5 11-Oct-10
LCD Screen auspicious-e $9 7-Dec-10
keypad/Encoder Grayhill/ $19 7-Dec-10
Temperature Sensor(4) NIFE $9 7-Dec-10
Battery ATBATT $52 7-Dec-10
Op amps(10) bananza $6 7-Dec-10
DC to DC Converter(8) Texas Instruments $9 7-Dec-10
Mechanical
Insulation LOWES $11 7-Dec-10
Casing LOWES $10 7-Dec-10
Frame LOWES $6 7-Dec-10
Thermoelectric cooler Mouser $37 7-Dec-10
Fan/Guard Newark $7 7-Dec-10
heat sink Joorat $61 7-Dec-10
Misc.
Circuit Board SUNSTONE $40 11-Oct-10
Total $456
The budget displayed here contains the estimations for the cost of the backpack if it were to be sent into production and made in bulk. The key differences between this budget and the prototype budget are: The microprocessor now has a $5 cost for purchasing the chips in bulk, and the miscellaneous category has been taken out of this estimate. Some other component prices have been dropped to account for the price drop when buying in large quantities. The circuit board price under the miscellaneous category was kept the same as in the prototype budget because the increase in number of circuits to be made is offset by the decrease in cost when made in bulk. Many of the smaller electrical and mechanical parts are greatly reduced in price because of the decrease in shipping costs per part ordered.

52
Project Status

53
Gantt Chart Fall 2010

54
Gantt Chart Spring 2011

55
Work Breakdown Structure – Fall 2010 Tasks Activity Description Deliverables Start/Stop People Resources
F1.0 Develop Requirements Specification
Document stating the goals of the project
Written document, requirements list
8/30 – 9/28
ALL Computer
F2.0 Overall Project Design Develop block diagram, design entire project layout
Block Diagram, major decisions on parts and methods
9/20 – 12/3 ALL Computer
F2.1 Microcontroller Selection Select a microcontroller that will meet the project’s needs
Microcontroller/ Data sheets
10/04 – 10/12
Eric Computer
F2.2 Cooling System Selection Select the method of cooling that is the most efficient within budget constraints
Cooling System method
10/4 – 10/29
Simon Computer
F3.0 Device Design Design sub-systems of project. Specify inputs and outputs.
Schematics and simulations for each sub-system
9/28 – 11/19
ALL Computer/Mulisim/ Solidworks
F3.1 Cooling Chamber Design Decide what material to use and compute heat transfer equations.
Results of heat transfer equations/ material choice
9/28 – 11/19
Natalie Computer
F3.2 Cooling System Design Define inputs and outputs of cooling system. Develop a multisim circuit of system
Multisim schematic 10/12 – 11/19
Simon/ Eric
Computer/ Multisim
F3.3 Battery and Battery Charger Circuit Design
Define inputs and outputs of battery and battery charger. Simulate circuit in multisim
Multisim schematic 11/15 – 12/3
Adrian Computer/ Multisim
F3.4 Temperature Sensor Design Decide what type of temperature sensor to use and design circuit for sensor
Multisim schematic/ Decision on temperature sensor
11/8 – 11/19
Simon / Adrian
Computer/ Multisim
F3.5 User Interface Design Design user interface and indicators to be used in the system.
Multisim schematic 11/8 – 12/3 Eric Computer/ Multisim
F3.6 Power Control Circuit Design Design circuit to control the power into the cooling system
Multisim schematic 11/15 – 11/30
Adrian Computer/ Multisim
F3.7 DC to DC Converter Design
Design circuit for the converter that will control power into system devices
Multisim schematic/ decision on DC to DC converter
10/29 – 11/12
Adrian Computer/ Multisim
F3.8 Program Microcontroller Develop software for the microcontroller to be able to control the system
Software on Microcontroller
11/1 – 12/17
Eric Computer
F4.0 System Compilation
Make sure that Sub-systems will be compatible with one another. Find final parts to order
Total System design and all Simulations
11/29 – 12/10
ALL Computer
F5.0 Final Design Finalize design for entire system and sub-systems
Documentation, presentation
12/6 – 12/17
ALL Computer
A1.0 Project Management Make sure all projects are on schedule and within budget constraints.
Project progress accounted for
8/30 – 12/17
Eric Communication
A2.0 Documentation Record design work and progress. Record all research and tests.
Documents, reports, Engineering Notebooks
8/30 – 12/17
ALL Computer/ Engineering Notebooks

56
Work Breakdown Structure – Spring 2010 Tasks Activity Description Deliverables Start/Stop People Resources
S1.0 Parts Assembly and Testing Assemble Parts. Confirm parts are operational
Working Parts. Test Results
1/18 – 3/11 ALL Computer/ Test equipment
S1.1 Cooling Chamber Build Cooling Chamber and apply insulation. Test heat resistance.
Cooling Chamber with insulation. Test results
1/18 – 2/10 Natalie Work Shop
S1.2 Cooling System Assemble Cooling System, heat sink, and ventilation system.
Compiled Cooling System
1/25 – 2/21 Simon Work Shop
S1.3 Battery and Battery Charger Circuit
Create circuit for the battery and battery charger. Test charger and output from battery.
Battery/Battery Charger Circuit. Test Results
2/2 – 2/15 Adrian Work Shop
S1.4 Temperature Sensor Create circuit for the Temperature sensor. Test for accuracy.
Temperature Sensor Circuit. Test Results
2/3 – 2/9 Eric/ Simon
Work Shop
S1.5 User Interface
Assemble User Interface. Test LED and screen output. Test communication with microcontroller
User Interface circuit and LEDs. Proof of communication
2/10 – 3/2 Eric Work Shop
S1.6 Power Control Circuit
Create Power Control circuit. Test for output. Test communication with microcontroller
Power Control Circuit/ Test Results Proof of Communication
2/1 – 2/21 Adrian Work Shop
S1.7 DC to DC Converter
Create circuit for DC to DC converter. Test outputs.
DC to DC circuit. Test results
2/1 – 2/9 Adrian Work Shop
S1.8 Program Microcontroller Develop software for the microcontroller to be able to control the system
Software on Microcontroller
1/18 – 2/21 Eric Computer
S2.0 Full Frame Assembly Assemble frame that will house all sub-systems
Full System Frame 1/24 – 2/25 Natalie/ Simon
Work Shop
S3.0 System Integration Compile all sub-systems into system frame.
Full Frame with Integrated Sub-Systems
2/21 – 4/25 ALL Work Shop
S4.0 System Testing
Test and verify functionality and compatibility of system as a whole
Test Results 3/21 – 4/25 ALL Work Shop/ Computer
S5.0 Project Finalization Final testing and troubleshooting
Finished Prototype 4/26 – 5/9 ALL Work Shop/ Computer
S6.0 Prototype Presentation Present completed prototype.
All test results, models, simulation data/ Prototype
5/9 – 5/13 ALL Computer/ Documentation
A1.0 Project Management Make sure all projects are on schedule and within budget constraints.
Project progress accounted for
1/18 – 5/13 Eric Communication
A2.0 Documentation Record all design work and progress. Record all research and tests.
Documents, reports, Engr Notebooks
1/18 – 5/13 ALL Computer/ Engineering Notebooks

57
Appendices

58
Appendix A Requirements Specifications Attachments

59
Attachments The following attachments come from the site: “Centers for Disease Control and Prevention.” Web. 13 Sept 2010.
Guidelines for Maintaining and Managing the Vaccine Cold Chain:
In February 2002, the Advisory Committee on Immunization Practices (ACIP) and American Academy of Family Physicians (AAFP) released their revised General Recommendations on Immunization (1), which included recommendations on the storage and handling of immunobiologics. Because of increased concern over the potential for errors with the vaccine cold chain (i.e., maintaining proper vaccine temperatures during storage and handling to preserve potency), this notice advises vaccine providers of the importance of proper cold chain management practices. This report describes proper storage units and storage temperatures, outlines appropriate temperature-monitoring practices, and recommends steps for evaluating a temperature-monitoring program. The success of efforts against vaccine-preventable diseases is attributable in part to proper storage and handling of vaccines. Exposure of vaccines to temperatures outside the recommended ranges can affect potency adversely, thereby reducing protection from vaccine-preventable diseases (1). Good practices to maintain proper vaccine storage and handling can ensure that the full benefit of immunization is realized.
Recommended Storage Temperatures:
The majority of commonly recommended vaccines require storage temperatures of 35°F--46°F (2°C--8°C) and must not be exposed to freezing temperatures. Introduction of varicella vaccine in 1995 and of live attenuated influenza vaccine (LAIV) more recently increased the complexity of vaccine storage. Both varicella vaccine and LAIV must be stored in a continuously frozen state <5°F (-15°C) with no freeze-thaw cycles (Table 1). In recent years, instances of improper vaccine storage have been reported. An estimated 17%--37% of providers expose vaccines to improper storage temperatures, and refrigerator temperatures are more commonly kept too cold than too warm (2,3).
Freezing temperatures can irreversibly reduce the potency of vaccines required to be stored at 35°F--46°F (2°C--8°C). Certain freeze-sensitive vaccines contain an aluminum adjuvant that precipitates when exposed to freezing temperatures. This results in loss of the adjuvant effect and vaccine potency (4). Physical changes are not always apparent after exposure to freezing temperatures and visible signs of freezing are not necessary to result in a decrease in vaccine potency.
Although the potency of the majority of vaccines can be affected adversely by storage temperatures that are too warm, these effects are usually more gradual, predictable, and smaller in magnitude than losses from temperatures that are too cold. In contrast, varicella vaccine and LAIV are required to be stored in continuously frozen states and lose potency when stored above the recommended temperature range.

60
Vaccine Storage Requirements:
Vaccine storage units must be selected carefully and used properly. A combination refrigerator/freezer unit sold for home use is acceptable for vaccine storage if the refrigerator and freezer compartments each have a separate door. However, vaccines should not be stored near the cold air outlet from the freezer to the refrigerator. Many combination units cool the refrigerator compartment by using air from the freezer compartment. In these units, the freezer thermostat controls freezer temperature while the refrigerator thermostat controls the volume of freezer temperature air entering the refrigerator. This can result in different temperature zones within the refrigerator.
Refrigerators without freezers and stand-alone freezers usually perform better at maintaining the precise temperatures required for vaccine storage, and such single-purpose units sold for home use are less expensive alternatives to medical specialty equipment. Any refrigerator or freezer used for vaccine storage must maintain the required temperature range year-round, be large enough to hold the year's largest inventory, and be dedicated to storage of biologics (i.e., food or beverages should not be stored in vaccine storage units). In addition, vaccines should be stored centrally in the refrigerator or freezer, not in the door or on the bottom of the storage unit, and sufficiently away from walls to allow air to circulate.
Temperature Monitoring:
Proper temperature monitoring is key to proper cold chain management. Thermometers should be placed in a central location in the storage unit, adjacent to the vaccine. Temperatures should be read and documented twice each day, once when the office or clinic opens and once at the end of the day. Temperature logs should be kept on file for >3 years, unless state statutes or rules require a longer period. Immediate action must be taken to correct storage temperatures that are outside the recommended ranges. Mishandled vaccines should not be administered.
One person should be assigned primary responsibility for maintaining temperature logs, along with one backup person. Temperature logs should be reviewed by the backup person at least weekly. All staff members working with vaccines should be familiar with proper temperature monitoring.
Different types of thermometers can be used, including standard fluid-filled, min-max, and continuous chart recorder thermometers (Table 2). Standard fluid-filled thermometers are the simplest and least expensive products, but some models might perform poorly. Product temperature thermometers (i.e., those encased in biosafe liquids) might reflect vaccine temperature more accurately. Min-max thermometers monitor the temperature range. Continuous chart recorder thermometers monitor temperature range and duration and can be recalibrated at specified intervals. All thermometers used for monitoring vaccine storage temperatures should be calibrated and certified by an appropriate agency (e.g., National Institute of Standards and Technology). In addition, temperature indicators (e.g., Freeze Watch™ [3M, St. Paul, Minnesota] or ColdMark™ [Cold Ice, Inc., Oakland, California]) can be considered as a backup monitoring system (5); however, such indicators should not be used as a substitute for twice daily temperature readings and documentation.

61
All medical care providers who administer vaccines should evaluate their cold chain maintenance and management to ensure that 1) designated personnel and backup personnel have written duties and are trained in vaccine storage and handling; 2) accurate thermometers are placed properly in all vaccine storage units and any limitations of the storage system are fully known; 3) vaccines are placed properly within the refrigerator or freezer in which proper temperatures are maintained; 4) temperature logs are reviewed for completeness and any deviations from recommended temperature ranges; 5) any out-of-range temperatures prompt immediate action to fix the problem, with results of these actions documented; 6) any vaccines exposed to out-of-range temperatures are marked "do not use" and isolated physically; 7) when a problem is discovered, the exposed vaccine is maintained at proper temperatures while state or local health departments, or the vaccine manufacturers, are contacted for guidance; and 8) written emergency retrieval and storage procedures are in place in case of equipment failures or power outages. Around-the-clock monitoring systems might be considered to alert staff to after-hours emergencies, particularly if large vaccine inventories are maintained.
Additional information on vaccine storage and handling is available from the Immunization Action Coalition at http://www.immunize.org/izpractices/index.htm. Links to state and local health departments are available at http://www.cdc.gov/other.htm. Especially detailed guidelines from the Commonwealth of Australia on vaccine storage and handling, vaccine storage units, temperature monitoring, and stability of vaccines at different temperatures (6) are available at http://immunise.health.gov.au/cool.pdf.
References:
1. CDC. General recommendations on immunization: recommendations of the Advisory Committee on Immunization Practices (ACIP) and the American Academy of Family Physicians (AAFP). MMWR 2002;51(No. RR-2).
2. Gazmararian JA, Oster NV, Green DC, et al. Vaccine storage practices in primary care physician offices. Am J Prev Med 2002;23:246--53.
3. Bell KN, Hogue CJ, Manning C, Kendal AP. Risk factors for improper vaccine storage and handling in private provider offices. Pediatrics 2001;107:E100.
4. World Health Organization. Thermostability of vaccines. Geneva, Switzerland: World Health Organization, 1998; publication no. WHO/GPV/98.07. Available at http://www.who.int/vaccines-documents/DocsPDF/www9661.pdf.
5. World Health Organization. Temperature monitors for vaccines and the cold chain. Geneva, Switzerland: World Health Organization, 1999; publication no. WHO/V&B/99.15. Available at http://www.who.int/vaccines-documents/DocsPDF/www9804.pdf.
6. Commonwealth Department of Health and Aged Care. Keep it cool: the vaccine cold chain. Guidelines for immunisation providers on maintaining the cold chain, 2nd ed. Canberra, Australia: Commonwealth of Australia, 2001.

62
TABLE 1. Vaccine storage temperature requirements
35°F-46°F (2°C-8°C)
≤5°F (-15°C)
Instructions Vaccine Instructions Instructions Vaccine
Do not freeze or
Diphteria-, tetanus, or pertussis-containning vaccines Maintain in continuosly
Live attenuated influenza
expose the freezing (DT, DTaP, Td) frozen state with no freeze- vaccine (LAIV)
temperatures.
thaw cycles.
Haemophilus conjugate vaccine (Hib)*
Contact state or local health
Hepatitis A (HepA) and hepatitis B (HepB) vaccines
department or manufacturer
Inactivated polio vaccine (IPV)
for guidance on vaccines
Measles, mumps, and rubella vaccine (MMR) in the
exposed to temperatures
lyophilized (freeze-dried) state†
above the recommended
Meningoccoccal polysaccharide vaccine
range.
Pneumococcal conjugate vaccine (PVC)
Pneumococcal polysaccharide vaccine (PPV)
Trivalent inactivated inflenza vaccine (TIV)
*ActHIB® (Aventis Pasteur, Lyon, France) in the lyophilized state is not expected to be affected detrimentally by freezing temperatures, although nodata are available.
†MMR in the lyophilized state is not affected detrimentally by freezing temperatures.
TABLE 2. Comparison of thermometers used to monitor avccine temperatures
Thermometer type Advantages Disadvantages
Standard fluid-filled Inexpensive and simple to use. Less accurate (+/-1°C).
Thermometers encased in biosafe liquids can reflect No information on duration of out of specification exposure.
vaccine temperatures more accurately. No information on min/max temperatures.
Cannot be recalibrated.
Inexpensive models might perform poorly.
Min-max inexpensive Less accurate (+/-1°C).
Monitors temperature range. No information on duration of out of specification exposure.
Cannot be recalibrated.
Continuous chart recorder Most accurate Most expensive.
Continuous 24-hour readings of temperature range Requires most training and maintenance.
and duration.
Can be recalibrated at regular intervals.

63
Appendix B TPS40192 DC to DC Converter Data Sheet

64
Appendix C
CSD16321Q5 Transistor Data Sheet

65
Appendix D Solar Panel Fan 3106kl Data Sheet

66
Appendix E Temperature Sensor Data Sheet

67
Appendix F OP AMP LM741 Data Sheet

68
Appendix G KEYPAD 96BB2-006-F-Grayhill
Data Sheet

69
Appendix H Keypad Encoder Data Sheet

70
Appendix I Solar Panels Data Sheet

71
Appendix J Thermoelectric Cooler Data Sheet

72
Appendix K LCD Screen Data Sheet

73
Appendix L Cooling Data Sheet

74
Appendix M Microprocessor Data Sheet