Maasai fertility: Kenya-Tanzania comparisons Impacts of land-use policy on environment, wildlife,...
33
Maasai fertility: Kenya-Tanzania comparisons Impacts of land-use policy on environment, wildlife, demography and socio-economic indicators in east African savannas: the Serengeti Ecological Unit University College London Kenya Wildlife Service University of Dar Es Salaam Catholic University of Louvain European Union [Grant No. IC18-CT976-0070];
-
Upload
noah-arnold -
Category
Documents
-
view
220 -
download
0
Transcript of Maasai fertility: Kenya-Tanzania comparisons Impacts of land-use policy on environment, wildlife,...

Maasai fertility: Kenya-Tanzania comparisons
Impacts of land-use policy on environment, wildlife, demography and socio-economic indicators in east African savannas: the Serengeti
Ecological Unit
University College London
Kenya Wildlife Service
University of Dar Es Salaam
Catholic University of Louvain
European Union [Grant No. IC18-CT976-0070]; Parkes Foundation

“Everyone “knows” the Maasai” (Spear, 1993:1)
Ethnographic writing/ Filming
Colonial records
Tourism
Photography
Conservation
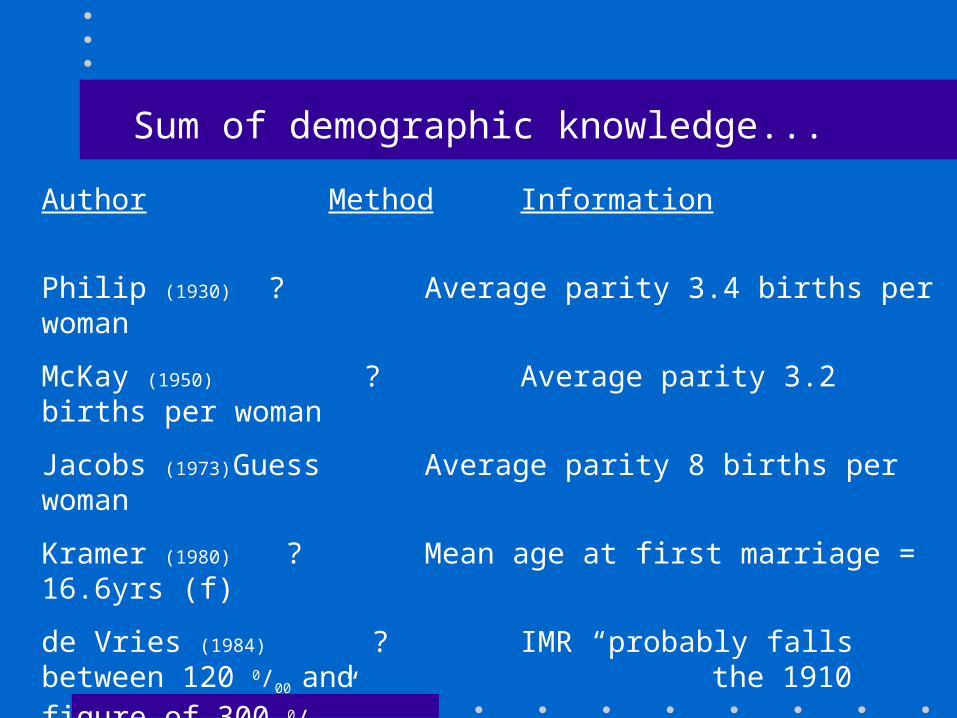
Sum of demographic knowledge...
Author Method Information
Philip (1930) ? Average parity 3.4 births per woman
McKay (1950) ? Average parity 3.2 births per woman
Jacobs (1973) Guess Average parity 8 births per woman
Kramer (1980) ? Mean age at first marriage = 16.6yrs (f)
de Vries (1984) ? IMR “probably falls between 120 0/00 and the 1910 figure of 300 0/00”
Nangawe (1985) ? IMR 355 0/00
Megan (1994) ? IMR 186 0/00
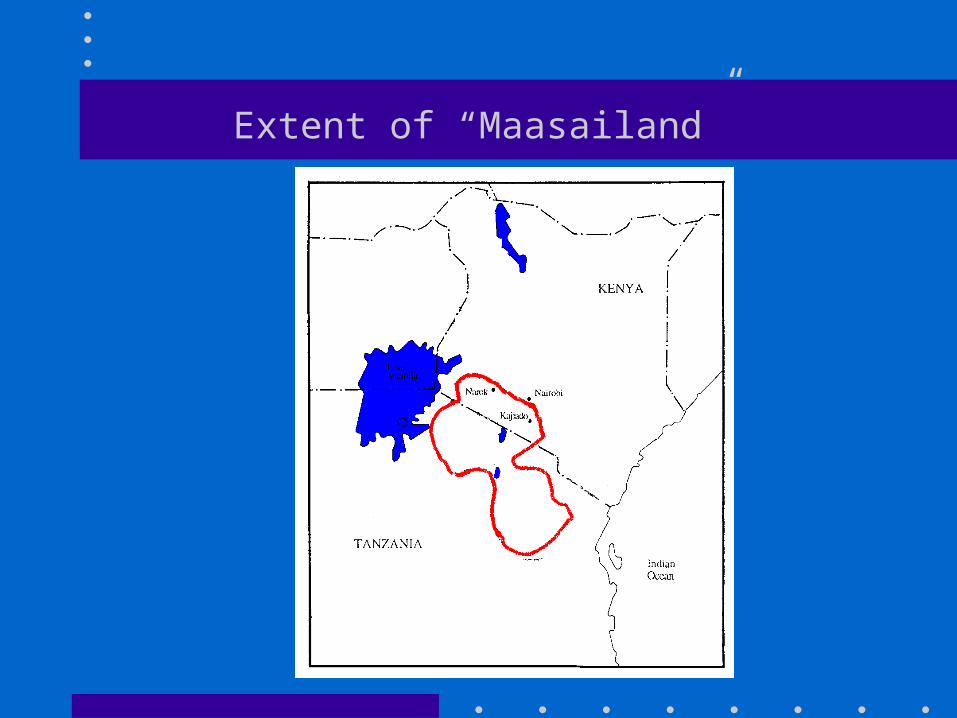
Extent of “Maasailand”

Campbell (1979)
“population growth rate of the Maasai is 2.2%…this is an estimate made by […] who has spent many years studying
health-related issues in Maasailand”

Data collectionSingle Round Demographic Survey
Sampling frames Unavailable/ out of date
Sampling strategy Availability
Research instrument Pre-tested questionnaire
Enumeration unit Household
Enumerators Locally recruited Maasai
Sample size 14,928 individuals
1,565 households
2,828 women aged 15-49

Map of study sites

Issues of data collection
Enumerators
Reference to death
Age
Counting
Paternity
El Niño
No widowers
Birth history
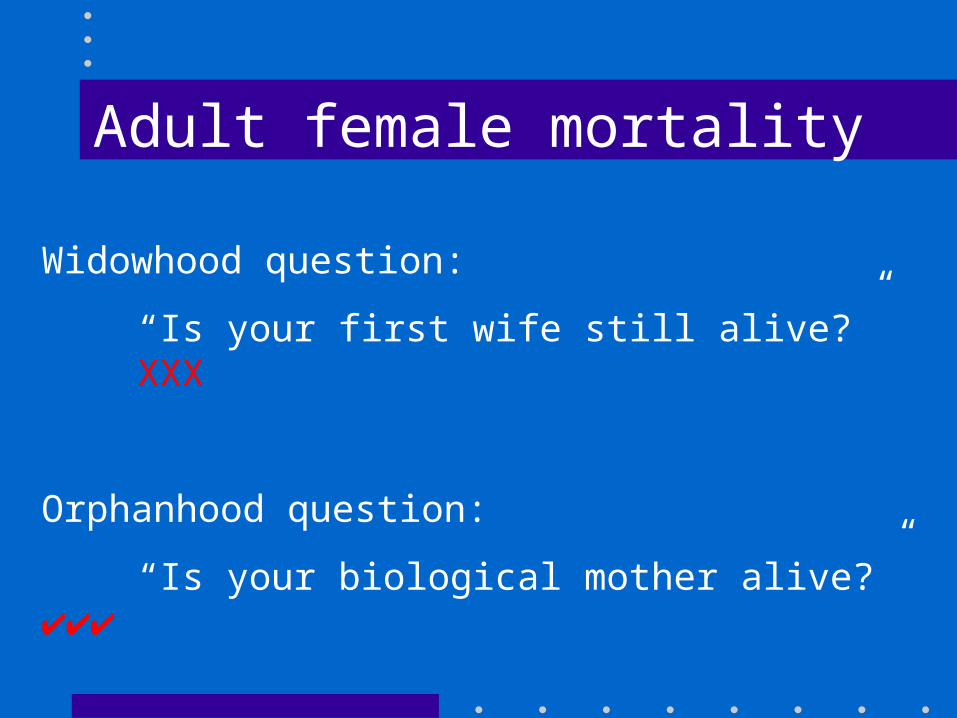
Adult female mortality
Widowhood question:
“Is your first wife still alive?” XXX
Orphanhood question:
“Is your biological mother alive?”
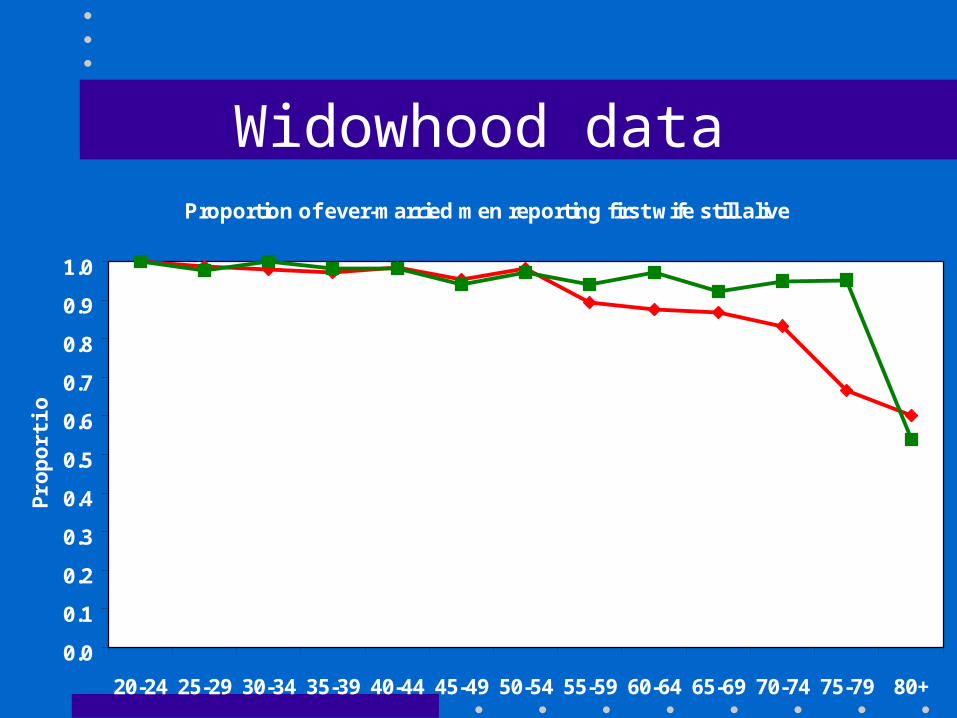
Widowhood dataProportion of ever-married men reporting first wife still alive
0.0
0.1
0.2
0.3
0.4
0.5
0.6
0.7
0.8
0.9
1.0
20-24 25-29 30-34 35-39 40-44 45-49 50-54 55-59 60-64 65-69 70-74 75-79 80+
Pro
po
rtio
n

Maternal Orphanhood DataProportion of individuals reporting biological mother still alive, by age group and
country of respondent
0.0
0.1
0.2
0.3
0.4
0.5
0.6
0.7
0.8
0.9
1.0
0-4 5-9 10-14 15-19 20-24 25-29 30-34 35-39 40-44 45-49 50-54
Pro
porti
on

Maternal Mortality
Maternal death = misdemeanour
Based on reports of adult sisters
Lifetime risk = 1 in 40
1 in 4 of all reported adult sister deaths was due to maternal causes
Pregnancy behaviour

Adult male mortality
Widowhood question:
“Is your first husband still alive?”
Orphanhood question:
“Is your biological father alive?” XXX
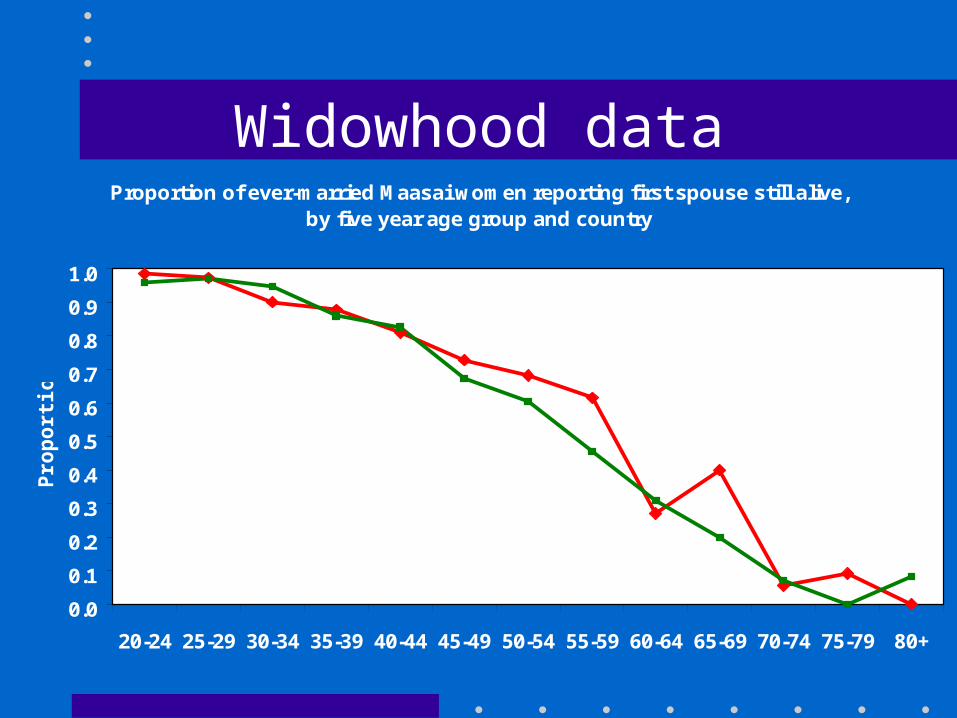
Widowhood dataProportion of ever-married Maasai women reporting first spouse still alive,
by five year age group and country
0.0
0.1
0.2
0.3
0.4
0.5
0.6
0.7
0.8
0.9
1.0
20-24 25-29 30-34 35-39 40-44 45-49 50-54 55-59 60-64 65-69 70-74 75-79 80+
Pro
po
rtio
n
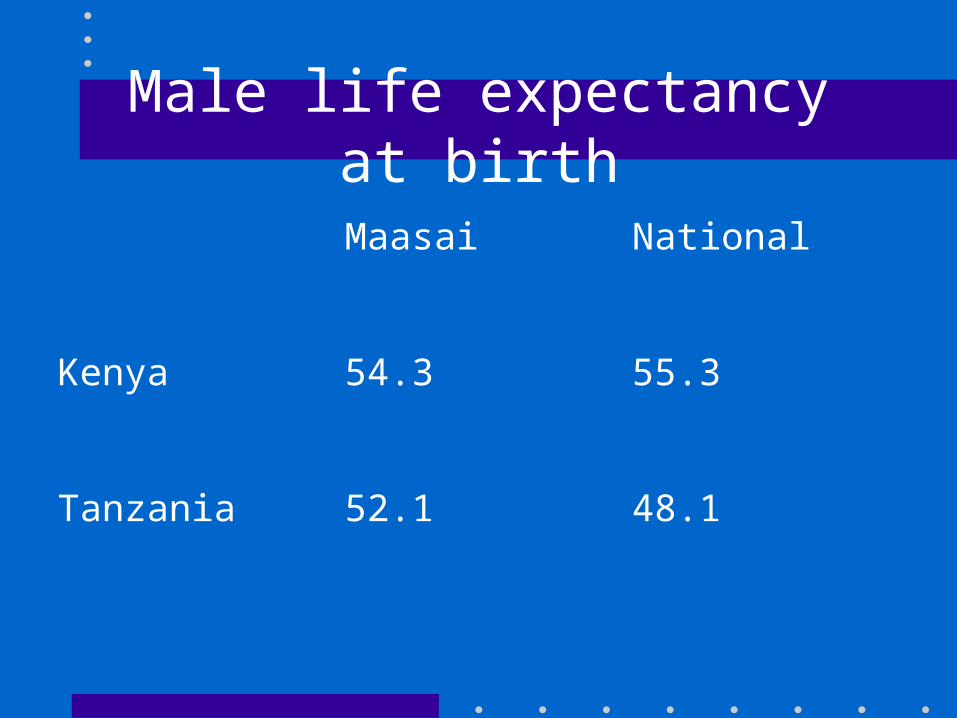
Male life expectancy at birth
Maasai National
Kenya 54.3 55.3
Tanzania 52.1 48.1

Early age mortality - expectations
Raise Lower
Nutritional stress Population density
Healthcare
Living environment

Early age mortality
1q0 4q1
Kenya 17 38
Tanzania 17 39
(per 1,000 live births)

Sexual initiation
M arriag eP o lyg yn ou s
E xtra -m arita l sex
P re -m arriag eIllic it sexu a l p a trn e rs
o f m arriedw om en
C ircu m c is ionTeen s - m id 2 0 s
P re -c ircu m c is ionTh eore tica lly ab s tin en t
M a le
M arriag eW ith in 1 year
P o lyg yn ou s m arriag esE xtra -m arita l sex
C ircu m c is ionB efo re p u b erty
P re -c ircu m c is ionS exu a l in it ia t ion
P artn e rs o f c ircu m c isedyou n g m en
F em ale

Children represent
For men
Power and influence (political and social)
“How can a man without children advise others as to how best to command others?”
“The status of an elder ultimately hinges on the fertility of his wives”
For women
Access to livestock
Security in widowhood

Fertility data
Collected from all ever-married women
“Brass” questions on ceb-cs
Births in the last 12 months
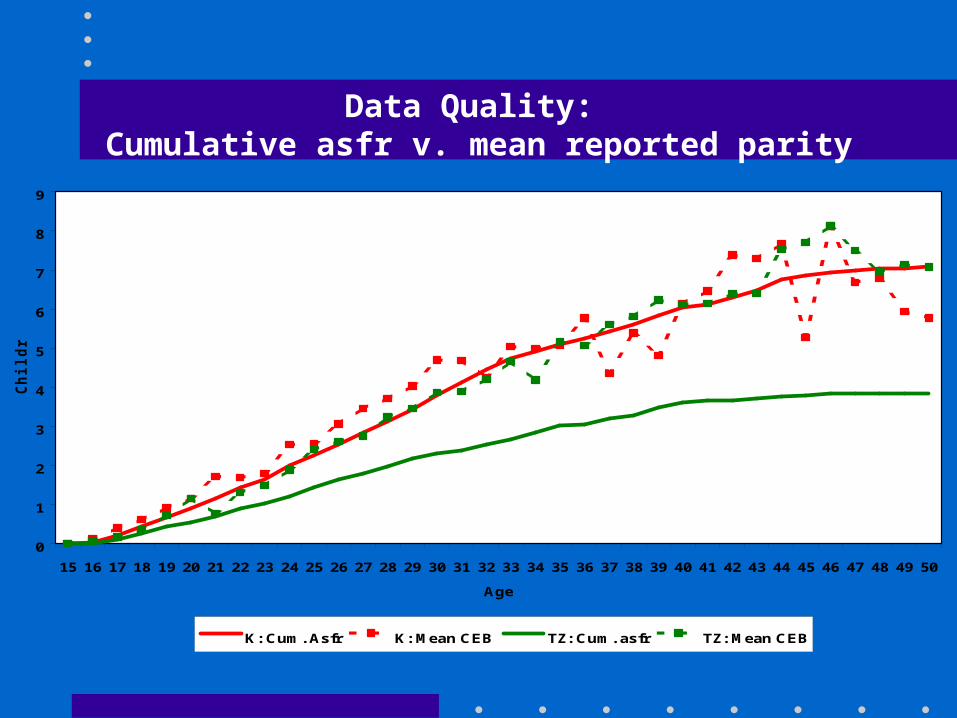
Data Quality: Cumulative asfr v. mean reported parity
0
1
2
3
4
5
6
7
8
9
15 16 17 18 19 20 21 22 23 24 25 26 27 28 29 30 31 32 33 34 35 36 37 38 39 40 41 42 43 44 45 46 47 48 49 50
Age
Ch
ild
ren
K: Cum. Asfr K: Mean CEB TZ: Cum. asfr TZ: Mean CEB
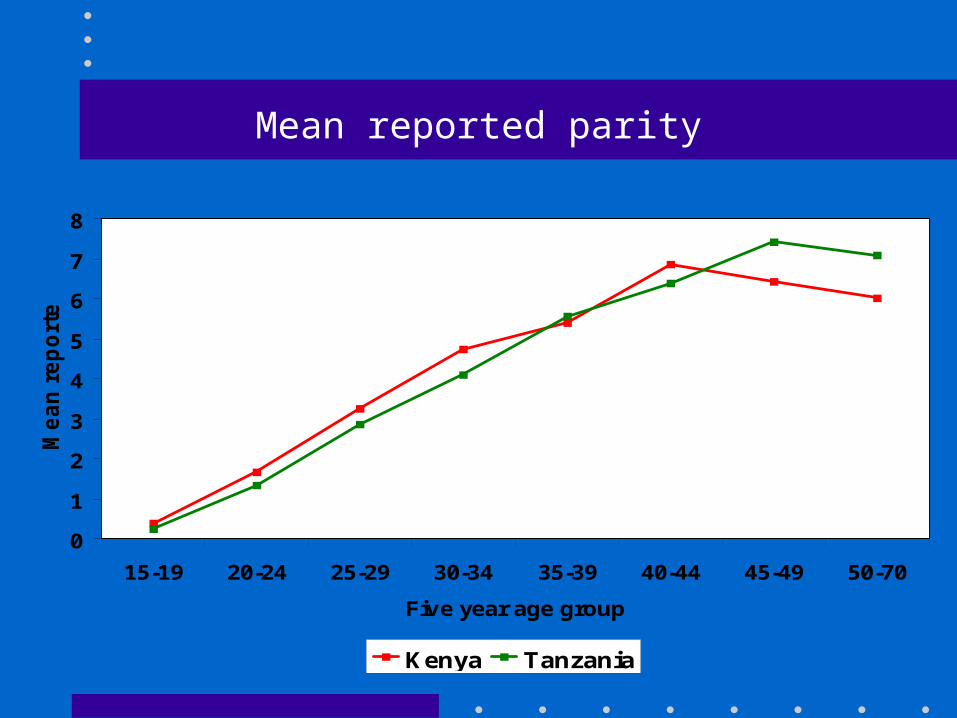
Mean reported parity
0
1
2
3
4
5
6
7
8
15-19 20-24 25-29 30-34 35-39 40-44 45-49 50-70
Five year age group
Me
an
re
po
rte
d
Kenya Tanzania

TFR (p/f ratio) by location
Tanzania (6.4)
Narok District (Kenya)
(9.2) Kajiado District (Kenya)
(7.7)
Kenya (8.2)
0
1
2
3
4
5
6
7
8
9
10
TF
R

TFR in national contexts
Maasai National Rural
Kenya 8.2 5.2
Tanzania 6.4 6.3

Kenya-Tanzania fertility differential
nuptiality*
lactational amenorrhea
sterility*
abortion
contraception
fecundability
abstinence

Female age at first marriage
Kenya Tanzania
Median 17.0 17.0
SMAM 17.3 18.9
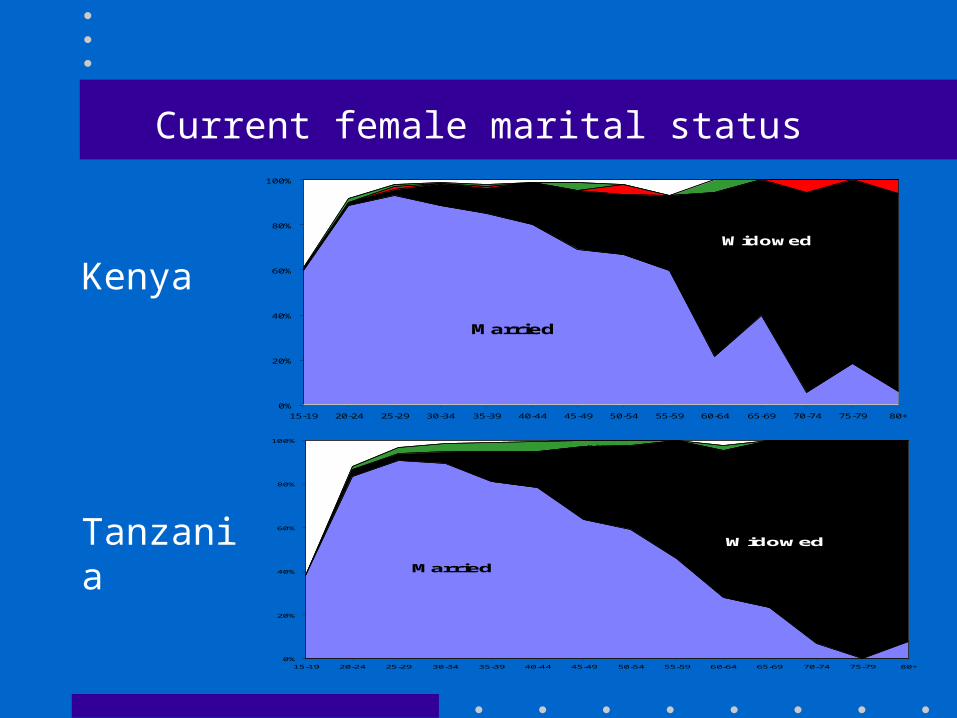
Current female marital status
Married
Widowed
0%
20%
40%
60%
80%
100%
15-19 20-24 25-29 30-34 35-39 40-44 45-49 50-54 55-59 60-64 65-69 70-74 75-79 80+
Divorced
Married
Widowed
0%
20%
40%
60%
80%
100%
15-19 20-24 25-29 30-34 35-39 40-44 45-49 50-54 55-59 60-64 65-69 70-74 75-79 80+
Kenya
Tanzania
Sterility
“It is said…that…the Masai females are becoming increasingly sterile” (1902)
“Sterility before marriage and after miscarriage has resulted in a greatly decreased birth rate” (1930)
“Healthworkers hold that venereal diseases are rampant in the Maasai communities” (1999)

Sterility
Primary sterility
Kenya 2.9%
Tanzania 1.8%
Secondary sterility
Up to age 44 higher levels in Tanzanian Maasai than Kenyan Maasai

Age specific secondary sterility rates, by country
0
10
20
30
40
50
60
70
80
90
100
25-29 30-34 35-39 40-44 45-49 50-54
Age group
Se
co
nd
ary
ste
rili
ty r
ate Kenya
Tanzania

Kenya fertility
Kenya (8.2)
Narok (9.2)
Kajiado (7.7)
Olkirmatian (7.8) Shompole
(7.6)
0
1
2
3
4
5
6
7
8
9
10
TF
R

Kenyan fertility differentials
Narok Kajiado
Land tenure Sub-division Communal Grp. R,
Outside interest(s) Tourism Extremely limited
Wheat farming
Land grabbing
Agri. Potential High and rising Very restricted
Circumcised sons Very advantageous Unchanged
Ecol. sustainability Falling Unchanged

Natural Increase (% p.a.)
Kenya Tanzania Both
National 2.89 3.22 -
Maasai (Census) 4.46 n/a -
Maasai (Survey) - - 3.9