MA=9, CT=13, VT=17, ME=23, NH=25, RI=42 Source: USDA National Agricultural Statistical Service: 2007...
19
$0 $20,000 $40,000 $60,000 $80,000 $100,000 $120,000 $140,000 $160,000 $180,000 thousand dollars 2007 D irectSales Incom e by State MA=9, CT=13, VT=17, ME=23, NH=25, RI=42 Source: USDA National Agricultural Statistical Service: 2007 Census of Agriculture
-
date post
22-Dec-2015 -
Category
Documents
-
view
217 -
download
4
Transcript of MA=9, CT=13, VT=17, ME=23, NH=25, RI=42 Source: USDA National Agricultural Statistical Service: 2007...

$0
$20,000
$40,000
$60,000
$80,000
$100,000
$120,000
$140,000
$160,000
$180,000
tho
us
an
d d
olla
rs2007 Direct Sales Income by State
MA=9, CT=13, VT=17, ME=23, NH=25, RI=42
Source: USDA National Agricultural Statistical Service: 2007 Census of Agriculture

NH=1, CT=2, MA=4, VT=5, ME=6, RI=7
Source: USDA National Agricultural Statistical Service: 2007 Census of Agriculture

$0
$5
$10
$15
$20
$25
$30
$35
$40
do
llars
2007 Direct Sales Income Per Capita by State
VT=1, ME=3, NH=4, CT=5, MA=12, RI=14
Source: USDA National Agricultural Statistical Service: 2007 Census of Agriculture
Source: US Census Bureau: Population Estimates 2007

$0
$20,000
$40,000
$60,000
$80,000
$100,000
$120,000
tho
us
an
d d
olla
rs2007 Agritourism and Recreation Services Income by State
Please see next slide for a note regarding the definition of agritourism and recreation services
CT=19, MA=34, NH=42, VT=43, ME=46, RI=49
Source: USDA National Agricultural Statistical Service: 2007 Census of Agriculture

Notes about Agritourism and Recreational Services
•The 2007 Census of Agriculture asked respondents to report their income related to:
•Agritourism and recreational services, such as farm or winery tours, hay rides, hunting, fishing, etc.
•In many states, this income includes rental and lease fees for hunting, fishing, and other recreational purposes. •Income from these sources does not include value-added products such as jams, salsas, wines, etc.
Source: USDA National Agricultural Statistical Service: 2007 Census of Agriculture

0.00%
0.50%
1.00%
1.50%
2.00%
2.50%
3.00%
3.50%
4.00%
4.50%
2007 Percentage of Farms Involved in Agri-tourism
RI=3, NH=8, CT=9, MA=10, VT=16, ME=19
Source: USDA National Agricultural Statistical Service: 2007 Census of Agriculture

$0
$50,000
$100,000
$150,000
$200,000
$250,000
tho
us
an
d d
olla
rs2007 Combined Agritourism and Direct Sales Income by State
MA=9, CT=13, VT=17, ME=23, NH=25, RI=42
Source: USDA National Agricultural Statistical Service: 2007 Census of Agriculture

US County ranking:
Addison Co. ranked 28th
Chittenden Co. ranked 105th
Windsor Co. ranked 129th
Rutland Co. ranked 153rd
Windham Co. ranked 154th
2007 Census of Agriculture Combined Direct Market and Agritourism Income by county
Addison$5,512,000.00
Orleans$1,592,000.00
Franklin$1,528,000.00
Orange$1,580,000.00
Windsor$2,557,000.00
Rutland$2,153,000.00
Windham$2,125,000.00
Essex$172,000.00
Bennington$489,000.00
Washington$1,345,000.00
Caledonia$1,209,000.00
Chittenden$2,957,000.00
Lamoille$582,000.00
Grand Isle$540,000.00
Source: USDA National Agricultural Statistical Service: 2007 Census of Agriculture
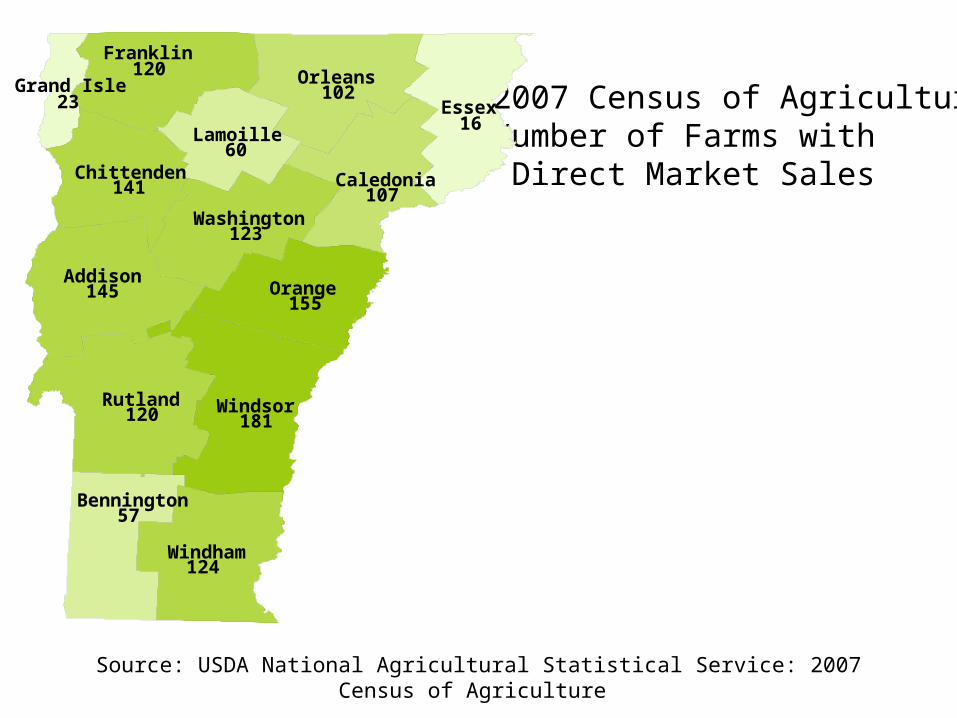
2007 Census of Agriculture Number of Farms with Direct Market Sales
Rutland 120 Windsor
181
Essex 16
Addison 145 Orange
155
Orleans 102
Franklin 120
Windham 124
Caledonia 107
Washington 123
Bennington 57
Chittenden 141
Lamoille 60
Grand Isle 23
Source: USDA National Agricultural Statistical Service: 2007 Census of Agriculture

Source: USDA National Agricultural Statistical Service: 2007 Census of Agriculture

Agri-tourism value not disclosed for oilseeds and grains, sheep and goats, and beef cattle
Source: USDA National Agricultural Statistical Service: 2007 Census of Agriculture

Direct Market values not disclosed for $1million or more and $5,000 to $9,999.Agri-tourism value not disclosed for $250,000 to $499,999, $50,000 to $99,999, and $1,000 to $2,499.
Source: USDA National Agricultural Statistical Service: 2007 Census of Agriculture

Source: USDA National Agricultural Statistical Service: 2007 Census of Agriculture
VT=1, ME=2, NH=5, MA=9, CT=11, RI=19

VT=12, ME=16, MA=18, NH=20, CT=32, RI=41
Source: USDA National Agricultural Statistical Service: 2007 Census of Agriculture

Percentage of Farms with Organic Sales, New England and U.S. 2002 and 2007 Census of Agriculture
In 2007, Vermont had 554 farms with Organic Sales.This was almost 8% of Vermont’s farms and the highest percentage in the Nation.
Source: USDA National Agricultural Statistical Service: 2007 Census of Agriculture

Organic Sales as Percent of all Agricultural Sales, New England States and U.S., 2002 and 2007 Census of Agriculture
In 2007, Vermont had $38.4 million dollars of Organic Sales. This was 5.7% of Vermont’s total agricultural sales and the 2nd highest percentage in the Nation.
Source: USDA National Agricultural Statistical Service: 2007 Census of Agriculture

Percentage of Farms with Women Principal Operators,New England States and U.S., 2002 and 2007 Census of Agriculture
In 2007 Vermont had 1,466 women principal farm operators, which was 21 percent of all farmers. This ranked 13th in US.
Source: USDA National Agricultural Statistical Service: 2007 Census of Agriculture

0.0%1.0%2.0%3.0%4.0%5.0%6.0%7.0%8.0%9.0%
10.0%
Percentage of Total Market Value of Agriculture Salesfrom Direct Sales, New England States and U.S.
2002 and 2007 Census of Agriculture
2002 2007
In 2007 Vermont had $22.9 million dollars worth of agriculture sales that was sold directly to the public. This was 3.45 percent of all agriculture market sales which
ranked 5TH in US
Source: USDA National Agricultural Statistical Service: 2007 Census of Agriculture

In 2007, Vermont had 1,474 farms sell directly to the public. This is 21 percent of all Vermont farms and is the 5th highest percentage in the Nation.
Source: USDA National Agricultural Statistical Service: 2007 Census of Agriculture