M3 lab 120
20
NANO 120A Module 3 Separation of Micro/Nanoparticles via AC Dielectrophoresis in Different Samples of Micropipette Tip Group B – Team 10 Hong Shen Chen A97074642
-
Upload
anderson-chen -
Category
Documents
-
view
12 -
download
0
Transcript of M3 lab 120

NANO 120A
Module 3
Separation of Micro/Nanoparticles viaAC Dielectrophoresis in Different Samples
of Micropipette Tip
Group B – Team 10
Hong Shen ChenA97074642
March 12, 2015

Purpose
In this experiment, particles are separated according to their size and dielectric constant
by an alternating current (AC) dielectrophoretic procedure. A basic setup for the DEP device
consists of a gel filled micropipette tip, and a fluidic chamber adhered to a glass slide. More
importantly, it is necessary to learn how to operate a fluorescent microscope, and to analyze
images because it is the basic tool for all engineers to study materials below several microns. A
quantitative analysis can also be done by using the software Image J, which measures the
intensity of fluoresce. Software AutoCAD and COMSOL are also implemented to simulate the
different geometrical effects of the system, which generates a different gradient of the electric
field.
Background
The separation of micro/nanoparticles for scientific analysis is becoming more and more
important in many fields today, especially in medicine. The ability to isolate micro-particles
from the nano-particles has drawn significant attentions in detecting disease-related DNA
biomarkers for diagnostics and in delivering drug nanoparticles directly in blood for therapies. [2]
Recently, the cancer research has shown a close relationship between cancer cells growing and
the increasing level of cell-free circulating (CFC) DNA along with apoptotic DNA in blood. [2]
However, in order to analyze the DNA fragment of those disease biomarkers, a separation of
high-molecular weight DNA (HMW-DNA), with typical order of 20nm, needs to be separated
first. [2] And for the CFC-DNA, it has an even smaller order than 20nm. Such small particle
requires an even higher conducting condition. [3] Therefore, a unique condition to optimize the
separation of particles needs to be rediscovered; yet, this discovering process can be time
1

consuming and pricy. [4] More importantly, AC dielectrophoresis (DEP) is a more efficient
method to separate the disease-related DNA biomarkers from blood cell compared to DC
electrophoresis. DEP has a better capability to separate a variety range of nanoparticles because
it is size dependent, whereas the electrophoresis, experiencing a DC field, is charge dependent.
This is why we do not adopt electrophoresis to separate the disease-related DNA biomarkers
from blood cells. [1][2] DEP is resulted from the movement of the polarized particles due to a non-
uniform electrical field. Some other possible applications of DEP include cell separation, DNA
isolation, bacteria/virus isolation, and manipulation of nanoparticles; yet, most of them are done
under the low conductance convention. [2] Lately, we discover a new DEP method that now
allows nano-scale of HMW-DNA to be separated from blood in a high conductivity environment
using a different geometry of its design. And this is why in our experiment; we are required to
use AutoCad to design a most suitable geometry between electrodes and samples that generate
both high and low field regions to isolate 200 nm fluorescent beads from 10 μm beads. [1] Also,
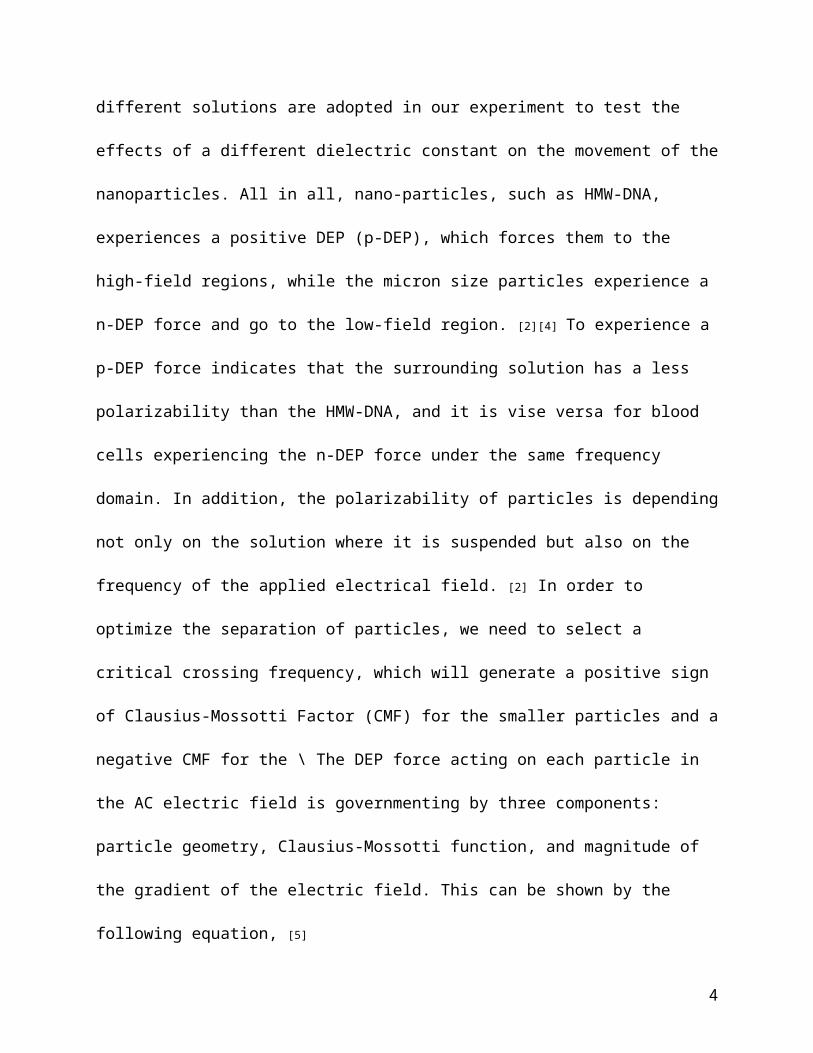
different solutions are adopted in our experiment to test the effects of a different dielectric
constant on the movement of the nanoparticles. All in all, nano-particles, such as HMW-DNA,
experiences a positive DEP (p-DEP), which forces them to the high-field regions, while the
micron size particles experience a n-DEP force and go to the low-field region. [2][4] To
experience a p-DEP force indicates that the surrounding solution has a less polarizability than the
HMW-DNA, and it is vise versa for blood cells experiencing the n-DEP force under the same
frequency domain. In addition, the polarizability of particles is depending not only on the
solution where it is suspended but also on the frequency of the applied electrical field. [2] In order
to optimize the separation of particles, we need to select a critical crossing frequency, which will
generate a positive sign of Clausius-Mossotti Factor (CMF) for the smaller particles and a
2

negative CMF for the \ The DEP force acting on each particle in the AC electric field is
governmenting by three components: particle geometry, Clausius-Mossotti function, and
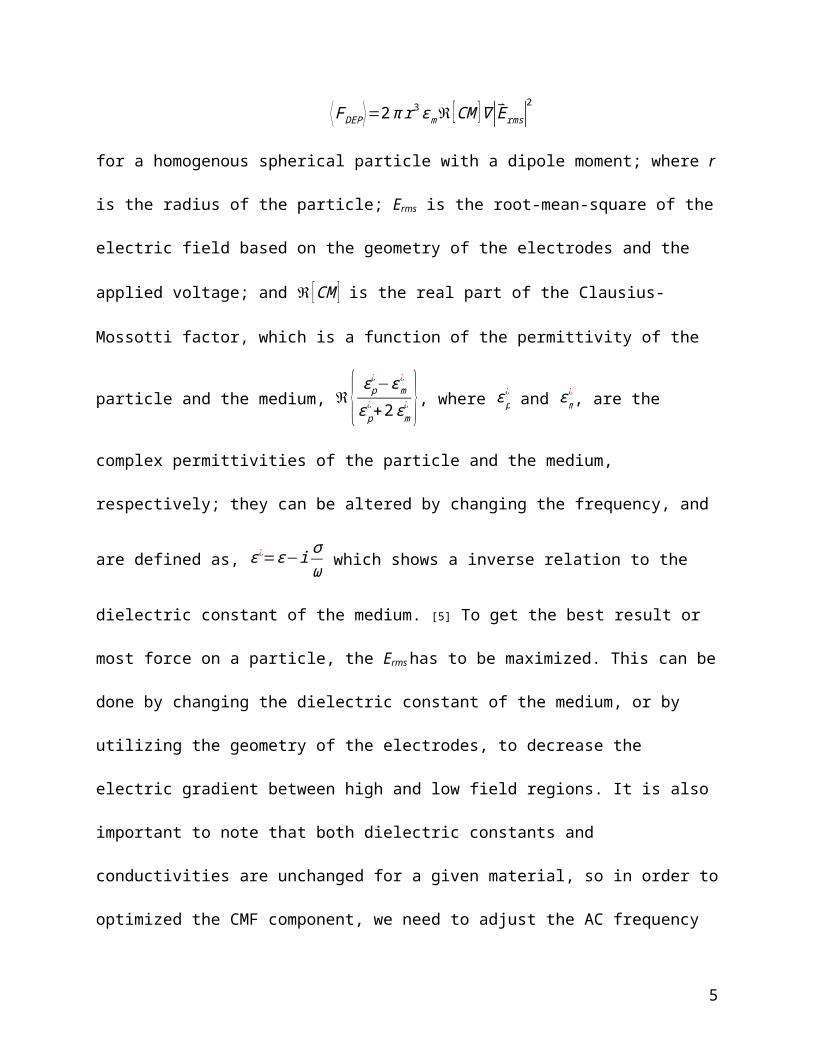
magnitude of the gradient of the electric field. This can be shown by the following equation, [5]
⟨ FDEP ⟩=2π r3 ε m ℜ [ CM ]∇|E⃑rms|2
for a homogenous spherical particle with a dipole moment; where r is the radius of the particle;
Erms is the root-mean-square of the electric field based on the geometry of the electrodes and the
applied voltage; and ℜ [ CM ] is the real part of the Clausius-Mossotti factor, which is a function
of the permittivity of the particle and the medium, ℜ{ ε p¿−ε m
¿
ε p¿ +2 εm
¿ }, where ε p¿ and ε m
¿, are the
complex permittivities of the particle and the medium, respectively; they can be altered by
changing the frequency, and are defined as, ε¿=ε−i
σω
which shows a inverse relation to the
dielectric constant of the medium. [5] To get the best result or most force on a particle, the Erms
has to be maximized. This can be done by changing the dielectric constant of the medium, or by
utilizing the geometry of the electrodes, to decrease the electric gradient between high and low
field regions. It is also important to note that both dielectric constants and conductivities are
unchanged for a given material, so in order to optimized the CMF component, we need to adjust
the AC frequency to obtain the most separation. All in all, different size of the particles will
require a very different condition accordingly to help achieve the most separation. [2]
Methods
First of all, prepare three different 1 mL solutions in micro-centrifuge tubes for the test;
then mix 5 μL of 10 μm carboxylate beads and 5 μL of 200 nm yellow-green fluorescent beads
3
into the solutions of distilled water, 0.1X TBE, and 0.1X PBS. Secondly, prepare a fluidic
chamber by adhering a PDMS well onto a glass slide. (Make sure the gluing surface is clean)
Next, a 5 mL of 2 wt% Agarose gel was prepared in a 20 mL cylinder glass beaker by mixing
~0.1 g of ultra-pure Agarose powder and 5 mL of 10X PBS, and then it was microwaved in 2 to
3 sec at a time, until the solution was completely homogeneous. This can be done by using the
vortex machine. It is also important to make sure there is no precipitation because it can possibly
affect the imaging later. Next, prepare six pipette tips by adding 10 μL of the solution in each
one of them and let them cool and solidify for about a min. The prepared tips were then
submerged in a 50mL beaker with 10mL 10X PBS to keep the gels hydrated. Subsequently,
design a model of the electrode-tip device using AutoCAD (shown in Figure 2) [1] to run the
simulation in COMSOL and to find its predicting particle separating efficiency before testing,
and then attach the fluidic chamber to a microscope using masking tape. Now, begin to prepare
the first sample by adding the solution of distilled water and beads to the fluidic chamber, and
then fill the pipette tips with only 50 μL of distilled water (no beads). It is necessary to ensure
that there is no air bubble showing in the gel when filling the pipette tip. This problem can be
prevent by tapping the sides of it; again the presence of the air bubbles can significantly affect
the clearly when imaging. And then the sample was then positioned at 45° using an arm attached
to the microscope. The bright-field optical microscopy was then adopted to capture a clear image
of the tip in the solution-filled fluidic chamber due to the fluorescence (Shown in figure 1). By
switching the filter to green, and adjusting the exposure, it was possible for us to observe the
4
scatter of yellow-green beads. Take a screenshot before any electric field was applied.
Next, insert one short copper wire to top of the tip inside the sample and another one in
the fluidic chamber. The wires were then
connected to a function generator using
masking tape to stabilize the wires. Close
the shutter, and apply an AC electric field
at a 10 kHz frequency, with a potential
difference of 20 Vpp, for 5 min. Notice
that we do not care about which side is
anode or cathode here due to the AC
convention. Turn off the function generator, and then take another screenshot of the tip again
after having applied the electric field. Lastly, remove the tip and capture a final fluorescent
image. Make sure the shutter was closed once again and let the function generator sweep another
frequency from 10MHz to 1Hz in increments, at 20 Vpp. Repeat the same process for two more
times- for the TBE, and PBS solutions. Make sure the fluidic chamber is filled with the proper
solution of the beads accordingly with either TBE or PBS and the tip was filled with the pure
Figure 1: Bright field micrographs taken before on side - 3ms (left) and after AC DEP (right) procedure in
0.8
4
Figure 2: Schematic of electrode-tip device designed using AutoCAD software (measurements in mm).
5

TBE or PBS solution only. Finally, use the software Image J to analyze the captured
fluorescence images by measuring the average, and maximum brightness.
Reasult
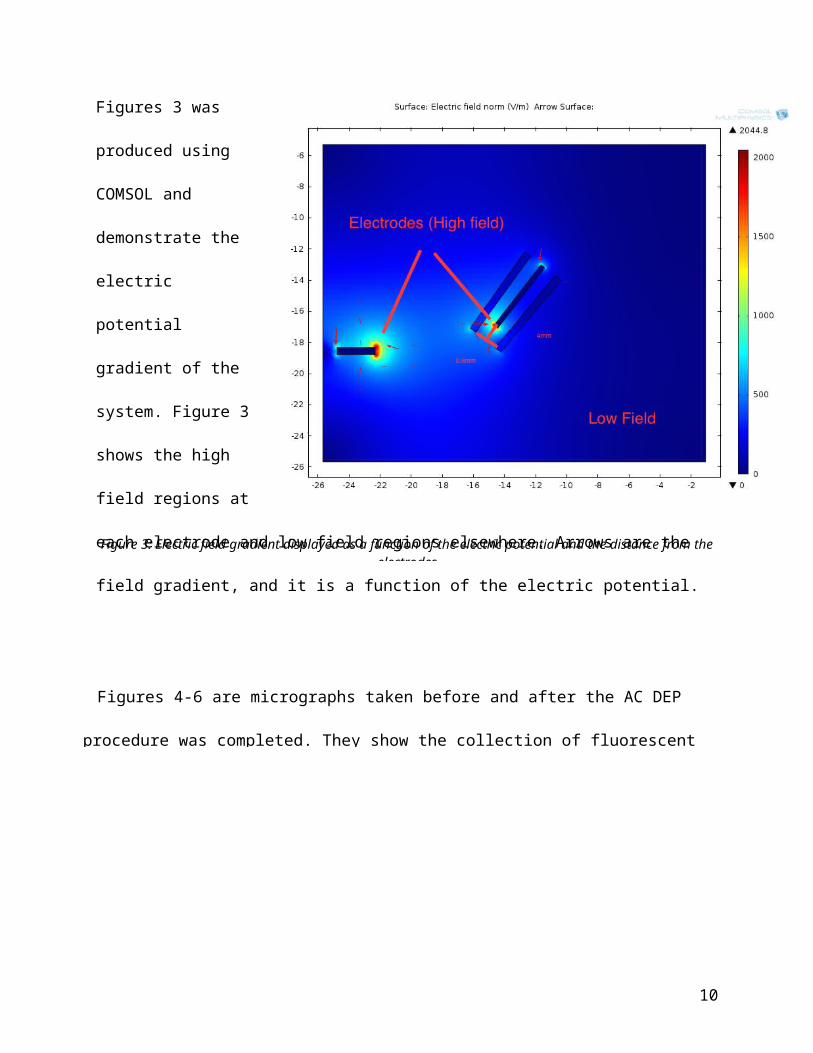
Figures 3 was produced
using COMSOL and
demonstrate the electric
potential gradient of the
system. Figure 3 shows
the high field regions at
each electrode and low
field regions elsewhere.
Arrows are the field
gradient, and it is a
function of the electric
potential.
Figure 3: Electric field gradient displayed as a function of the electric potential and the distance from the electrodes
6

Figure 4: Fluorescent micrographs taken before - 40ms (left) and after AC DEP (right) procedure in DI-water solution for 5 min.
Figure 5: Fluorescent micrographs taken before - 40ms (left) and after AC DEP (right) procedure in TBE solution for 5 min.
Figure 6: Fluorescent micrographs taken before - 40 (left) and after AC DEP (right) procedure in PBS solution for 5 min.
Figures 4-6 are micrographs taken before and after the AC DEP procedure was completed.
They show the collection of fluorescent beads on the tip of the device.
7

Discussion
After comparing the micrographs before and after of the DEP process under the AC
convention, it is intuitive for us to state that the separation of particles was successful overall.
We were able to separate the green-yellow fluorescent particles from the carboxylate beads in
each sample. Yet, it is important to keep in mind that some samples might perform better than
others. When comparing different solutions based on the change in fluorescence after applying
the AC field, we are able to see that particles separated the quickest and the most in H2O sample,
whereas, in PBS solution, it results as the slowest and the least. The result was expected
according to the equation (FDEP equals to 2 π r3 ε m ℜ [CM ]∇|⃑Erms|2). [5] As the dielectric constant
of the medium decreases, the more conducing it will be; therefore, the salinity of the solution
will increase. As a result, less force will be experienced by particles, making DES harder for
separation. Also based on the same force equation mentioned earlier, it shows the larger particle
will experience more force, therefore separating quicker. By analyzing the micrographs using
Image J, we were able to measure a quantitative fluorescence (brightness) of each sample.
Ideally, both values of max and mean have to have a larger number in each sample after the field
Figure 7: Analyzed results of the intensity from Image J, where 1, 2 for the PBS solution, 3, 4 for the TBE solution, and 5, 6 for the DI-water solution. (Odd – before the electrical field is applied; Even - after)
8

is applied, however, according to the figure 7, in water, the mean for the after shows lower. This
contradiction is shown probably because water has the lowest viscosity so it flows fastest. As a
result, it might cleave off some of smaller particles at the tip, and this movement along with the
pushing movement experienced on larger particles can possibly make it happen for water to
experience a lower mean after. Also, theoretically, water should have the greatest max and mean
(most accumulation), than TBE, and than PBS due to the decreasing trend in dielectric constant
of the medium. [5] Yet, in the figure 7, the after max of PBS shows a larger number than the after
max of TBE. This contradiction can be understood by comparing the figure 5 and 6. First, in the
figure 5, we see an overall larger bright area of fluorescence; whereas in the figure 6, the bright
area decreases tremendously. It is important to realize when the bright area we focused are
becoming smaller in PBS sample, the denser the particles are going to be collected due to the
restricting field strength, and therefore the max will show higher because max indicates the
brightest point in image. Brighter points are presented in PBS sample due to more overlapping of
particles. It is also possible that the electrode was inserted to a different depth in each sample
generating a different strength in electrical field, which differs the result from the expected one.
The shorter distance between the electrode and the tip, the stronger field it will generate.
It is also important to sustain the voltage at a Vpp, 20 because an increasing in voltage
would generate more heat on the
electrodes, which could potentially
cause damage. Also, if we altered the
Vpp, a different size of particles can
now be separated. The effect would
also be similar if the frequency were
Figure 8: black line- smaller particle; red line – larger particle; Wcrt – 10kHz (frequency)
9
becoming too high; at that point, the circuit starts to act like a DC circuit and to repulse all
particles to the negative low field region. The separation process stops. On the other hand, at
really low frequencies, such as (10 Hz, 1Hz), we were able to observe a super fast pull in and
pull out movement of particles and to experience a large conductance from the experiment.
Therefore, as the conductance increase, the salinity of the solution increase, thus stopping the
reaction.
Conclusion
This experiment was done to gain an understanding of one method that is quite novel and
a valuable technique useful for the separation and collection of micro/nanoparticles for analysis.
Overall, this laboratory experiment served to demonstrate fundamental principles underlying
dielectrophoresis as well as possible biomedical applications for which it could be used. It was
also useful for introducing essential research and engineering software that can be utilized for
designing a device, for better understanding physical properties of a system, as well as for
analyzing images captured using fluorescent microscopy.
Hypothetically, if a $10,000 grant was provided to improve the efficiency of this device,
it would be essential to create highly accurate simulations to better understand problems, such as
the ability to separate even smaller particles (20 nm) or challenges resulting from highly
conductive solutions resulting from a high salinity. It would also be beneficial to optimize the
geometry of the electrode, and the AC potential difference and frequency to determine how some
of these challenges can be overcome. Understanding the essential elements involved for the
creation of the ideal DEP device such as the effect of using different electrodes or coating them
10

in another material and experimenting with applying the AC power at different phases to
different electrodes.
11

Reference
[1] Song, YJ, Sonnenberg, A, Heaney, Y, Heller, MJ, “Device for dielectrophoretic separation
and collection of nanoparticles and DNA under high conductance conditions”
Electrophoresis (accepted) 2014.
[2] Sonnenberg, A, Marciniak, JY, Krishnan, R, Heller MJ, “Dielectrophoretic Isolation of DNA
and Nanoparticles form Blood”, Electrophoresis V33, 2482-2490, 2012
[3] Krishnan R, Dehlinger DA, Gemmen GJ, Mifflin RL, Esener S and Heller MJ, “Interaction of
nanoparticles at the DEP microelectrode interface under high conductance conditions”,
Electrochemical Communications, V11, #8, 1661-1666, 2009
[4] Krishnan R and Heller MJ, “An AC electrokinetic method for the enhanced detection of
DNA nanoparticles”, J. Biophotonics, V2, #4, pp. 253-261, 2009
[5] Peter R. C. Gascoyne and Jody Vykoukal, “Particle separation by dielectrophoresis”,
Electrophoresis. 2002 July ; 23(13): 1973–1983.
12