
Lars Peter Lindfors 26.3.2014: NEXBTL - Resurssiviisas Diesel

BALTIC SEA ENV I RONME N T PROCEEDINGS
No. 39
AIRBORNE POLLUTION LOAD TO THE BALTIC SEA 1986-1990
0 M ,· v •
•
• • •
•
•
BALTIC MARINE ENVIRONMENT PROTECTION COMMISSION - HELSINKI COMMISSION -

--------------------------------
BALTIC SEA ENVIRONMENT PROCEEDINGS
No. 39
AIRBORNE POLLUTION LOAD TO THE BALTIC SEA 1986-1990
BALTIC MARINE ENVIRONMENT PROTECTION COMMISSION -HELSINKI COMMISSION-
1991

For bibliographic purposes this document should be cited as: HELCOM, 199 1
Airborne Pollution Load to the Baltic Sea 1986-1990, Bait. Sea Environ. Proc. No. 39
Information included in this publication or extracts thereof is free for citing on the condition that the complete reference of the publication is given as stated above
Copyright 1991 by the Baltic Marine Environment Protection Commission
- Helsinki Commission -
ISSN 0357-2994
Helsinki - Government Printing Centre
1.
2.
3.
4.
5.
6.
7.
CONTENTS
PREFACE ... .. ....... .......... ..... ........ ..................... .................... .... .. ........ .
OVERVIEW .................... .... ... ......... ............ .. .. .. ..... ..... .............. ...... .... .
INTRODUCTION .. ... ... ................... .. ..................... ... ....................... .... .
THE BALTIC SEA ....................... ... .... ... ..................... .. ........... . .. ........ . 2.1. Geography ........... ...... ... .... .. ....... ...... ... .. ....... ... ............. ... ....... . 2.2. Climatology ......... . .... ..... ...................... .. ................................. . 2.3 . Air pollution Transport and Deposition ........ .... .................. .. ........ .. .
2. 3 .1. Precipitation over the Baltic Sea ............ .. .............. .... .... .. 2.3.2. Wind Fields in the Baltic Region .. ...... .................. .. .. ...... .
MONITORING NETWORK .......... ....................................................... ... 3 .1 . Statio11s ........ ............... .. ......................................................... . 3.2. Quality Assu'rance ....... .. .......... ..... ..... ........... ... ..... ..... ... ...... ...... . 3.3. Intercomparisons ............................. ..... .................................... .
3.3.1. Intercalibration Exercises ........................ .... .................. . 3.3.2. Results and Conclusions .................................... .. ........ ..
NUMERICAL MODELS .... .. ........... .. ............ .............. ... .............. .. ....... . 4.1. Model Types ................... .. ........ ....... .......... .. ... ....... ........... .. ... . 4.2. Model Inputs ............... ......................... ....... ......... ......... ....... .. . 4.3. Model Outputs ............................................................ .. .......... .
MONITORING RESULTS ............ .. ........................ ... ................. ....... ... . 5.1. Air Concentrations .. .... .. .... .. ........ ... .. .... ....... ....... ....... ........ ... .... . 5.2. Precipitation Concentrations .. .... ....................... .. ............... .. ........ .
NITROGEN DEPOSITION ...... ............ .... .... .. ............ ..... ......... ... .... .. ..... . 6.1. Estimates for Wet Deposition Fluxes .... .... .. .................. ...... .......... ..
6.1.1. Experimental Deposition Fluxes .... ..... .................. ....... .. . . 6. 1.2. Hybrid Deposition Fluxes ... .... ..... ......... .. ............. ... ..... . .
6.2. Experimental Estimates of Wet Deposition ........ .... ........ .............. .. .. 6.3. Dry Deposition .......... .. ................................ .... ............... .... ... .. 6.4. Model Estimates for Total Deposition ............ .. ...... .............. ........ .. 6.5. Assessment of Nitrogen Deposition ...... ........ ........................ .. ...... ..
TRACE METAL DEPOSITION ..... .. ....................... .. .. ............................ . 7 .1. Experimental Estimates .... ... .... ........................... .. ............ ... ...... .
7.2. 7.3.
7 .1.1. Wet Deposition Fluxes ....................... .... ............. ... ...... . 7 .1.2. Wet Deposition Estimates ...... .......... .... .... .................... .. 7 .1. 3. Total Deposition Estimates .............. .. ............................ . Model EstimatL for Lead Deposition ...................... .... ...... .. .......... . Assess~ent of ead Deposition .... ................ .... ....................... . ... .
REFERENCES ...................... ........... ..... ... ........................ ....... ........... .
Page
1
2
7
8 8
11 14 15 19
20 20 20 23 23 23
24 24 25 26
28 28 29
34 34 34 38 40 43 44 46
48 48 48 49 51 52 59
60

Page
APPENDICES . . . . . . . . . . . . . . . . . . . . . . . . . . . . . . . . . . . . . . . . . . . . . . . . . . . . . . . . . . . . . . . . . . . . . . . . . . . . . . . . . . . . . 63
A. Precipitation in the Baltic Sea Area 1987 - 1990 Data from the MSC-W archives . . ......... .... .. . . . . ..... .. . . . . . . ........... ............. .. .. . 65
B. Distribution of Deposition of Oxidized and Reduced Nitrogen to the Baltic Sea in 1988 Based on MSC-W model calculations .. . . . . ......... ................. ..... .. . . . . . . . . . . .. . . . . . . 69
c. Nitrogen Compounds: Results on Concentrations, Fluxes, and Depositions . . . . . . . . . . . . . . . . . . . . . . . . . . . . . . . . . . . . . . . 79
SUPPLEMENT . . . . . . . . . . . . . . . . . . . . . . . . . . . . . . . . . . . . . . . . . . . . . . . . . . . . . . . . . . . . . . . . . . . . . . . . . . . . . . . . . . . 87
Precipitation and Air Chemistry at HELCOM Stations for the Period 1986-1990 Monthly Statistics ................................................................................ . 89
ANNEX 1: Quality assurance protocol HELCOM/EGAP data A short description .............................................................................. . 93
ANNEX 2: Annual statistics on HELCOM/EGAP data 1986 ............................ . 99
ANNEX 3: Annual statistics on HELCOM/EGAP data 1987 ............................ . 111
ANNEX 4: Annual statistics on HELCOM/EGAP data 1988 ............................ . 123
ANNEX 5: Annual statistics on HELCOM/EGAP data 1989............................. 135
ANNEX 6: Annual statistics on HELCOM/EGAP data 1990.................. ........... 147
BALTIC SEA ENVIRONMENT PROCEEDINGS ....................................... . 159
1
PREFACE
Within the framework of the Baltic Marine Environment Protection Commission -the Helsinki Commission - monitoring data on airborne pollution have been collected since 1983 under the supervision of the Group of Experts on Airborne Pollution of the Baltic Sea Area (EC EGAP), according to the programme adopted by the Commission.
The data are collected at a number of monitoring stations in the Baltic region in order to assess the atmospheric pollution load to the Baltic Sea. The most recent assessment covering the period 1983-1986 have been reported in 1989 (HELCOM, 1989).
According to the decision of the Commission that a second pollution load compilation for the Baltic Sea should be compiled and published in 1992, EGAP has compiled the present report on the air pollution load covering the period 1986 - 1990.
The report has been prepared by an editorial group with Denmark acting as lead country and consisting of the following EGAP-members:
Niels Z. Hejdam (Chairman), National Environmental Research Institute, Denmark
Vuokko Karlsson, Ministry of the Environment, Finland
Sabine Mahling-Ennaoui and Jiirgen Pankrath, Federal Environmental Agency, Germany
In this work the editorial group was assisted by the following HELCOM/EGAP consultants:
Ulf Pedersen, Norwegian Institute for Air Research, Norway
Jorgen Saltbones, Norwegian Meteorological Institute, Norway.
In addition separate contributions were received from:
Sylvain Joffre and Virpi Lindfors, Finnish Meteorological Institute, Finland
Gerhard Petersen, GKSS Research Center, Germany.
Bernd Schneider, Institut fiir Meereskunde, Kiel, Germany.
The draft versions of this report have been considered and amended by relevant experts in the framework of EC EGAP prior to release. In the Helsinki Commission Secretariat the editorial work has been coordinated by the Environment Secretary, a.i., Eeva-Liisa Poutanen and the assistant, Teija-Liisa Lehtinen.
413399X
2
OVERVIEW
Summary
It is the purpose of this report to give the best possible estimate of the airborne pollution load of tbe Baltic Sea for the five year period 1986-1990. This pollution load has previously been shown to constitute a considerable fraction of the total marine pollution load, which has afflicted this very vulnerable sea in recent years.
Air pollution released from land based sources are often transported long distances before they are deposited either by dry or wet deposition. Thus also the surfaces of European waters are exposed to deposition of atmospheric pollutants.
The winds over the Baltic are often quite variable but on an annual basis the area is dominated by west-so~thwesterly winds. Many studies have shown that the main sources are the large industrial centres m central and eastern Europe.
The potential importance of atmospheric deposition to the Baltic Sea is revealed by the fact that tbe possibly polluted precipitation accounts for almost 50 % of the net water exchange which constitute only about 2 % of the oceanic volume.
In this report the Baltic Sea is divided into five sub-basins (shown in Table 2.1.2 and Figure 2.1.1.). Where possible the airborne pollution load is estimated for each of these sub-basins, otherwise only for the total sea area of 415 000 km2
•
The EGAP Monitoring Network consists of 26 land-based measuring sites situated in various types of rural areas so as to avoid the influence of local industrial sources. The main purpose of the monitoring network is to produce data that can be used for estimating the deposition of harmful substances to the Baltic Sea. That purpose can only be fulfilled if data reported by the contracting parties are of a high quality.
The monitoring program is based on measurements of routine minimum requirement compounds, additional experimental measurements and a quality assurance procedure. ·
The HELCOM/EGAP monitoring programme calls for determination of the precipitation concentrations of NH, and NO, and, from 1990, Pb, Cd, Cu, Zn as a minimum requirement. The measurements of ambient air concentrations of pollutants is not part of the minimum requirement programme of EGAP and they therefore constitute a voluntary contribution.
The quality assurance protocol for monitored parameters used by the data host is similar to the EMEP Quality Assurance Plan and accordingly EGAP has initiated and participated in a number of intercalibration and intercomparison exercises.
The results showed that ammonium and nitrate are accurately determined but that minor deviations may occur because of the different designs of the precipitation samplers. The results from the trace metal intercomparison showed that at present the trace metal concentrations in precipitation should be viewed with some caution. This is of course also valid for any derived estimates. For these reasons it has been decided to restrict the use of trace metal results in this report to lead.
Precipitation concentrations from stations selected as representative of the various sub-basins are used to calculate basin average concentrations.
~ · 1 u :mu § r :n ·""·
3
The results on ammonium and nitrate are used to calculate the concentration of total nitrogen, defined as the sum
[Tot-N] = [NH,-N] + [NO,-N]
The average value for this component is [Tot-N] = 1.34 mg/1. The results show no trend for TotN over the five years 1986 - 1990 but geographically there is a clear concentration gradient from north to south.
The annual mean concentrations of lead in the Baltic Sea area have been found in the range from 4.8 to 9.1 Jlg Pb/1. The data do, however, contain some very atypical results that mask temporal or geographical tendencies expected from the diminishing use of leaded gasoline.
In general the estimation of the atmospheric pollution load on an ocean surface is difficult because data on airborne pollution concentrations as well as meteorological data such as precipitation are scarce or lacking for the open sea. To compensate for this it is necessary to resort to approximating methods.
Experimental estimates of .the deposition of pollutants to the sea surface has to be based on extrapolation out over the sea of measurements performed at locations on the coast or on islands. However, only the wet deposition can be estimated in this way since the data from the mandatory monitoring programme are confined to precipitation concentrations.
It has not been judged possible to use these data to estimate the dry deposition. Nor are the ambient air data collected on a voluntary basis used for estimating the dry deposition since that can be handled more reliably by models. At any rate the dry contribution is expected to constitute only the minor part of the total deposition. Thus a recent experimental estimate for nitrogen deposition to the Baltic Sea yields an overall dry contribution of 15 %.
The wet deposition is estimated on the basis of the precipitation weighted mean concentrations measured at the stations. To calculate the sub-basin depositions the first step is to obtain the annual deposition flux, i.e. the area specific deposition. Here two different methods are used.
The first, experimental method relies exclusively on measurement data on concentrations and the precipitation recorded at the various coastal stations. The method presupposes that both the concentrations and the precipitation are representative also for the open sea and that is a crude approximation. The results of this method must therefore be viewed with some caution.
The second, hybrid estimation method relies on pollution measurements and both observed and . calculated precipitation amounts. Model calculations are considered more reliable for estimating precipitation over the open sea than extrapolation of actual coastal measurements.
The hybrid fluxes are 10-20 % higher than the experimental ones. But for both types of fluxes there is a clear and consistent tendency for fluxes decreasing from about 1100 kg N/km' in the southern parts of the Baltic Sea, which are closer to the European air pollution sources, to lower fluxes around 650 kg N/km2 in the north.
On the basis of the deposition fluxes the average wet deposition for 1986-1990 to the Baltic Sea has been estimated by the experimental and hybrid methods to be 314 and 330 kT N/yr, respectively.
The values for deposition in 1986 compa<e quite well with earlier estimates but the present estimates are lower in the north with about 20% but higher in the two southern basins with about 10 %. The results show that the wet nitrogen deposition to the Baltic Sea is divided almost equally between

4
oxidized and reduced compounds and that there is no discernible temporal trend during the latter half of the 1980s.
The wet deposition of lead is estimated as for the nitrogen compounds, i.e. on the basis of the precipitation weighted mean concentrations measured at the stations. The calculations proceed by the same two methods used for nitrogen. The data quality is not too good, however, and the average wet deposition oflead to the Baltic Sea in 1986-1990, estimated at 1000-1400 T Pb/yr, should be viewed with some caution.
As a third method for estimating the depositions one can resort to rely exclusively on model calculations. These calculations include the deposition based on fields for both precipitation and concentration. They can be considered quite reliable if good emission data are available. The model results also include dry deposition calculated as the product of airborne concentrations and deposition velocities.
The Lagrangian trajectory model of EMEP's MSC-W was one of the first to be developed for operational use. It is a one-layer model where concentrations are calculated as averages over the well mixed boundary layer. The model is being used on a routine basis for the calculations of transboundary pollution fluxes and deposition of sulphur and nitrogen compounds over Europe. The results show that the concentration and deposition fields are predicted reasonably well.
For routine calculations of horizontal transport of air pollution the MSC-E of EMEP has developed and tested a hybrid Lagrangian-Eulerian model which allows complex atmospheric processes to be included.
The EMEP models calculate concentrations and depositions of nitrogen compounds. Monthly averages are given in 36 emission and deposition domains representing countries and oceans. The models are able to keep track of the domain in which the pollution was emitted which makes it possible to allocate the deposition on the whole Baltic Sea to relevant emitter countries.
For nitrogen deposition it is found that the main contribution of 65 % comes from the Baltic Sea Countries, probably because of their proximity. Other prominent contributors are Great Britain, France and the Netherlands, which are all upwind of the predominant westerly winds in the Baltic and which are also among the major European emitters. Czechoslovakia is another major contributor.
The total dry and wet deposition of nitrogen to the Baltic Sea is found to be between 260 and 285 kT N/yr in the years 1988 to 1990. The nitrogen deposited is divided in the ratio 40/60 % among reduced and oxidized nitrogen.
Model calculations of trace element depositions have been carried out with a trajectory model with a similar structure as that of MSC-W. However, no physical or chemical transformation is assumed. The calculations have been restricted to lead for the period 1980-1985 because emission databases in the EMEP-grid for the metals is still in a very preliminary stage.
·The result is that the total deposition of lead to the Baltic Sea is close to 1400 T Pb/yr. The calculations show that 70 % of the input is caused by the riparian countries around the Baltic Sea, the rest is due to long range atmospheric transport from other areas in Europe.
5
Conclusion
The experimental and hybrid wet deposition estimates Dwx and Dw" and model values D-/' for the total dry and wet deposition of nitrogen compounds to the Baltic Sea area in the period 1988-1990 are summarized in Table I.
Table I. Annual depositions of nitrogen to the Baltic Sea (kT N/yr).
Depos.type
Wet: Dwx
Wet: D,v''
Total: D.,M·w
Total: DrM·E
1988
Red.N Ox.N Tot-N
168 164 331
171 167 338
116 169 285
163
1989
Red.N Ox.N Tot-N
160 136 296
174 152 325
104 158 261
147
1990
Red.N Ox.N Tot-N
183 166 349
184 165 349
107 173 280
It is seen that the wet depositions of nitrogen estimated by both the experimental and the hybrid methods are larger than the total dry and wet deposition calculated by the EMEP-models. This discrepancy is most pronounced for reduced nitrogen (ammonia) where the measurements in agricultural areas may lead to overestimates of the area-wide, oceanic concentrations. In addition, the model calculations for reduced nitrogen are based on unofficial figures for ammonia emissions that have not been updated since 1985.
The assessment of the deposition of nitrogen to the Baltic Sea can be summarized as follows:
The experimental and hybrid values Dwx and Dw" probably overestimate the wet deposition of reduced nitrogen.
The model values DrM probably underestimate the same quantity.
For oxidized nitrogen the deposition estimates Dwx and Dw" are probably overestimates whereas the model estimate Dr M that includes dry deposition is considered fairly realistic.
A reasonable estimate for the total deposition of nitrogen to the Baltic Sea in the latter half of the 1980's thus seems to be
300 000 ± 30 000 Tonnes N/yr

6
The estimates of annual lead depositions to the Baltic Sea as extrapolations of measurements and as model calculations by GKSS are summarized in Table II. The variation of up to 60 % among these results is considerable. The reasons for that are on one hand that the quality of the measurement data is not good enough and that in some cases quite crude approximations have been used to extrapolate measurement results out over the sea and on the other hand that the emission inventories used for model calculations are in need of improvement and updating.
Table II. Annual deposition of lead to the Baltic Sea (T Pb/yr).
Period Type Ref. T/yr
1986-1990
1986-1990
1986-1989
1987
Dwx, wet D 11 wet W•
D./, total
D,X, total
This work 965
This work 1285
Schneider, 1988 1600
Schneider, 1988 1030
1985 D " total T '
Petersen et al., 1989 1400
The assessment of the deposition of lead to the Baltic Sea can be summarized as follows:
The experimental and hybrid values for wet depositions, Dwx and Dw11, are very uncertain.
The experimental values for total deposition, D./, are probably overestimates.
The model value for total deposition, DT M is probably an underestimate.
A reasonable estimate for the total deposition of lead to the Baltic Sea in the latter half of the 1980's thus seems to be
1300 ± 250 Tonnes Pb/yr
7
l. INTRODUCTION
The special characteristic of the Baltic Sea lies in the fact that actually it is neither an ocean nor a lake, but a large brackish water basin with very stable density stratification. The sea is also exceptionally shallow with a mean depth of about 60 m and only connected to the world ocean through the narrow Danish Straits; thus it has a more stagnant than through-flow character. This regional nature, together with the weak circulation and the low salinity of its water make the Baltic Sea extremely vulnerable to pollution.
This short statement excellently describes the precarious state of the Baltic Sea Marine Environment (Voipio, 1981). It makes the need to monitor all pollution pathways to the Baltic Sea quite obvious.
The air pollution load to the Baltic Sea has previously been shown to constitute a considerable . fraction of the total pollution load, which has afflicted this very vulnerable sea in recent years (HELCOM, 1989). Thus, the total nitrogen load to the Baltic Sea in the first half of the 1980s was estimated in the First Baltic Sea Pollution Load Compilation (HELCOM, 1987) at 940 kT N/yr. The
. atmospheric inputs were estimated at about 410 kT N/yr and the remainder 530 kT N/yr derived from riverine and·similar inputs. It is the purpose of this report to give the best possible estimate of the airborne pollution load of the Baltic Sea for the five year period 1986-1990. In this context the load is defined to be the deposition to the surface of the Baltic Sea of atmospheric pollutants measured in the mandatory HELCOM/EGAP monitoring programme.
Several different methods for estimating the depositions are used in this report. The restriction to the pollutants of the mandatory programme entails, however, that only wet deposition by precipitation scavenging can be estimated using these data whereas dry deposition estimates have to be obtained by other means.
Some experimental estimates of the dry deposition of nitrogen have been taken from a research project carried out by the Finnish Meteorological Institute (Lindfors et al., 1991). Some of the deposition results for trace metals have similarly been supplied from a research project at GKSS, Germany (Schneider, 1988).
Other estimates for atmospheric depositions are based on long-range numerical models that describe the continent-wide emission, dispersion, transformation and deposition of atmospheric pollutants. In
. contrast to the experimental methods the model results comprise both dry and wet deposition. As the transport of air pollution knows no borders it is necessary to take account of all significant air pollution sources in Europe. Such models have been constructed and applied in the European cooperative effort EMEP under the UN-ECE Convention on Trans boundary Air Pollution in Europe with which HELCOM has established close cooperative links.
The estimates of the pollution deposition to tlw Baltic Sea are given as a result of this cooperation. By special agreement the EGAP monitoring data are stored at EMEP's Chemical Coordinating Center (CCC) at the Norwegian Institute for Air Research, NILU. The nitrogen model results have been supplied by EMEP's Meteorological Synthesizing Centres West (MSC-W) at the Norwegian Meteorological Institute in Oslo and East (MSC-E) at the Institute of Applied Geophysics, Moscow. The results on trace metals pave been taken from a research project of the German Federal Environmental Agency, carried out by the GKSS Research Center (Petersen et al., 1989).

8
2. THE BALTIC SEA
2.1. Geography
The Baltic Sea is an enclosed sea area, a bay of the Atlantic ocean, extending over the latitudes 54°N-66°N and longitudes 10°E-30°E. Hence the Baltic Sea is a northern and relatively cold sea. The main characteristic data on the Baltic Sea according to Helsinki Commission (1986) is given in Table 2.1.1.
Table 2.1.1. The main characteristic data of the Baltic Sea.
Region
Bothnian Bay Bothnian Sea Gulf of Finland Gulf of Riga Baltic Proper The Sound + Belts Kattegat
Baltic Sea
Discharge area km2
269 950 229 700 419 200 127 400 568 973 27 360 78 650
1 721 233
Sea Volume area km2 km'
36 260 1 481 79 257 4 889 29 498 1 098 17 913 406
209 930 13 045 20 121 287 22 287 515
415 266 21 721
Max. Mean depth depth m m
171 41 294 62 123 37 51 23
459 62 38 14
109 23
459 52
The discharge areas of the Baltic Sea and its sub-basins are the land areas drained by rivers flowing into the Baltic.
In this report the Baltic Sea is divided into the following sub-basins.
Table 2.1.2 The sub-basins of the Baltic Sea.
A, The Gulf of Bothnia A, The Gulf of Finland A, Baltic Proper, North A, Baltic Proper, South A, Belt Sea and Kattegat
Ao Baltic Sea
115 517 km2
29 498 km2
166 842 km2
61 000 km2
42 408 km2
415 266 km'
The geographical extent of the sub-basins are shown in Figure 2.1.1.
9
Figure 2.1 .1. Division of the Baltic Sea into sub-basins and the EGAP monitoring sites.
RAHJA
A 1 Gulf of Bothnia
A 2 Gulf of Finland
A 3 Baltic Proper North
A 4 Baltic Proper South
A 5 Belt Sea and Kattegat

10
The airborne pollution load is estimated only on this sea area of 4 I 5 000 km' whereas the atmospheric pollution load coming via the much larger discharge area is not included in the evaluations. This is because the air pollution deposited on the discharge land areas will eventually enter the draining rivers and become part of the freshwater discharge to the Baltic.
The water balance of the Baltic Sea over an area of 372 858 km2 (with the exclusion of Belt Sea and Kattegat) is, according to the Helsinki Commission (HELCOM, 1986), characterized by the quantities shown in Table 2.1.3.
Table 2.1.3. Water balance parameters for the Baltic Sea, sub-basins A,-A, (km'/yr).
Precipitation
River inflow
Gross fresh-water input Evaporation
Net fresh-water input
Net outflow Storage difference
30-year averages km3/yr
223.6
436.1
659.7 183.9
475.8
471.1 4.7
It can be seen that the permanent circulation of the Baltic Sea water is very weak, only about 2 % of the oceanic volume and it is clearly related to the excess of fresh-water supply. The current velocities are of the order of a few em per second in the surface layer and less than one em per second in the deeper layers. The wind-driven motions of the water are stronger, however, and a clear correlation has been observed between the wind and current velocities especially in the surface layers of the sea (Kullenberg 1981). Thus the wind is an important factor in creating vertical and horizontal mixing of water and pollutants occurring in the water.
The potential importance of atmospheric deposition is revealed by the fact that precipitation accounts for about 35 % of the gross fresh-water input to the Baltic and for almost 50 % of the net in- and outflows.
. "'·---*"
11
2.2. Climatology
The monthly averages of the air temperature T, and water temperature Tw during the years 1980-1986 at three locations in the Baltic Sea are shown in Figure 2.2.1. a-b. The air temperature data are based on 3-hrs meteorological data, while water temperature statistics are taken from monthly reports (Weather and Water) of the Swedish Meteorological and Hydrological Institute. The locations are the stations of Utii in the Finnish Archipelago, Hoburg on the island of Gotland, and Kap Arkona on the German coast, roughly representing conditions in the Northern, Central and Southern Baltic, respectively. We see that the six curves are in phase with a summer maximum in July-August while the winter minimum occurs in February in the air and in March in the water. The geographical gradient is stronger in winter than in summer in both media.
The mixing of air pollutants, i.e. their vertical distribution in the lower atmosphere, and dry deposition rates are closely coupled to the turbulence intensity which depends strongly on the hydrostatic stability in the atmospheric boundary layer. The stability conditions are determined by the air-water temperature difference oT = T, - Tw. The annual trend of this difference is depicted in Figure 2.2.2. Note that oTis positive in spring-summer thus implying stable conditions, i.e. a low boundary layer and small deposition velocities. During the rest of the year (autumn-winter), the conditions are prepOI)derantly unstable yielding a deeper boundary layer and higher deposition velocities.
Almost every winter parts of The Baltic Sea are covered by ice see Figure 2.2.3. The northernmost part of sub-basin A1, the Bothnian Bay, is always covered totally by ice, and very frequently this happens also in the near-coast waters in the Bothnian Sea and the Gulf of Finland. Even off the shores of Kattegat ice is occurring approximately every second winter. Usually the open sea area of the southern Baltic Proper is open in winters. Due to the low salinity of the surface water (1-4 %o in the north and 8 %o in the south) ice is formed most easily in the north (Climatological Ice Atlas, 1982).
The influence of the ice cover on the deposition mechanisms are discussed in the next section.

12
Figure 2.2.1. Air and Sea Surface Temperatures 1980-1986 at three locations in the Baltic Sea.
20
~u a) 15
~
-5
G
'lo ;/
A/ / _0
........ / JZ{ G. !K .·
· .. ·o···
',"
JFMAMJJASOND
Month
Kap Arkona Hoburg Uto - -/:).- . ·····0··
Figure 2.2.2. Temperature difference between air and water 1980-1986.
4
~
u 2
·6
J
' .0 !{/ p
I
·' .. , .. , 0''
• I
F M A M J J
Month
Kap Arkona Hoburg - -6-.
A s 0 N D
U!O . .... 0 .....
13
Figure 2.2.3. Probability of Ice Occurrence in per cent. (Climatological Ice Atlas, 1982).
Probability of ice occurrence (in per cent) in the Baltic Sea
' '
2 413399X
' ' '
II < I I I
'' I \
I ' I \.._~..:"f:J
i!) • ___ _ -!9---

14
2.3. Air Pollution Transport and Deposition
Air pollution released from land based sources are often transported long distances before they are deposited either by dry or wet deposition. Thus also the surfaces of European waters are exposed to deposition of atmospheric pollutants and it has in recent years been recognized that this atmospheric contribution may constitute a considerable fraction of the total marine pollution load.
For trace substances of concern in the Baltic Sea ecosystem consideration must be given to the atmospheric transport on spatial scales ranging from local (a few hundred m to several km) to longrange (hundreds to thousands of km). Meteorological studies as well as the geographical concentration pattern of air pollutants have shown that the main sources are the large industrial centres in central and eastern Europe. The development of emission data bases for Europe has made it possible to relate atmospheric pollutant concentrations over the Baltic to their sources. Various techniques such as enrichment factors and sector analysis as well as atmospheric dispersion models have been used to assess the contribution of emissions from foreign sources to atmospheric concentrations measured in the Baltic Sea area.
Removal processes of gaseous and particulate air pollutants from the atmosphere to sea-surfaces can be grouped into two categories: wet and dry deposition.
Wet deposition takes place by uptake of gases and particles by cloud droplets, followed by precipitation (rain-out) or by scavenging of gases and particles by falling raindrops or snowflakes (washout). The rate of wet deposition over the Baltic can be expected to show a seasonal dependence because precipitation intensity varies during the year. Wet deposition is also a function of the size distribution and chemical composition of the rain or cloud droplets, the diffusion constant and Henry's constant of the gases involved. For particles the scavenging is highly dependent on particle size.
Dry deposition is influenced by a multitude of physical and chemical factors. The significance of these factors varies depending on the physicochemical characteristics of the pollutant, the meteorological conditions of the atmosphere and the properties of the surface. Dry deposition processes over the ocean differ from those over land because of the unique character of the surface and the temperature difference between the air and the ocean. This is of special importance for the Baltic Sea, which is almost every winter partly covered by ice.
The presence of an ice cover on the sea surface has two types of influence:
a.
b.
one direct effect connected with the ability of the surface to uptake depositing gases and particles, and one indirect effect in the sense that stability conditions in the atmosphere are drastically altered when the sea surface is ice-covered.
The transfer of particles to the sea surface is not affected by the presence of the ice cover since particles are equally retained by the water surface or the ice/snow cover which prevents resuspension. On the other hand, soluble gases like S02, NH, and HNO, have a high deposition velocity to the water surface (typically 0.5 - 1.5 cm/s) but probably deposit much slower to an ice/snow surface. Naturally, the deposition velocity rises again if the snow surface is wet or is melting.
As described earlier the stability conditions over open water are unstable in winter, thus enhancing the deposition through increased turbulence. Eventually, as soon as the sea surface is closed by the presence of ice, the surface temperature is driven by thermal molecular processes in the ice/snow cover and thus depends on the changing air temperature in the same way as overland situations. During the dark part of the winter, this mainly implies stable conditions and a low deposition
15
velocity. As the daily cycle becomes more pronounced in February-March stably stratified conditions p1:eva1l at mght and unstable conditions during the day. Also the ice cover may exist until May. High wmd and/or overcast s1tuat10ns generally imply near-neutral stability conditions whatever the type of surface.
In general the estimation of the atmospheric pollution load on an ocean surface is difficult because data on airbcn:ne pollution concentrations as well as meteorological data such as precipitation are scarce or lackmg for the open sea. To compensate for this it is necessary to resort to approximating methods.
2.3.1. PrL>cipitation over the Baltic Sea.
Experimental estimates of the deposition of pollutants to the sea surface has to be based on extrapolation out over the sea of measurements performed at locations on the coast or on islands. However, only the wet deposition can be estimated with some confidence since the data from the mandatory monitoring programn;e are confined to precipitation concentrations. It has not been judged poss1ble to use these data to est1mate the dry deposition, but that is expected to constitute only the
. minor part of the total. deposition.
~f estimates for atmospheric w~t d~position are to be obtained information on occurrence, magnitude, and d1st11butwn of prec1p1tatwn 1s necessary. Whereas extrapolation of concentration values in precipitation at co.astal sites may be carried out with some confidence, the estimation of precipitation over th.e sea 1s qu1te uncertam because meteorological conditions may differ considerably from those preva1Itng at a coastal Site. Th1s method has, nevertheless, been used as one of the methods for estimating the precipitation and deposition over the Baltic Sea. It is presented and discussed in more detail in Appendix A.
The experimental precipitation estimates for the sub-basins are calculated as the mean of the annual precipitation measured at the stations in the basin.
where the sum is over the number Sb of stations in the basin. For the whole Baltic Sea the area weighted average is used
where the sum now runs over the five sub-basins. These experimental estimates labelled accordingly with a superscript of X, are shown in Table 2.3.1. '
16
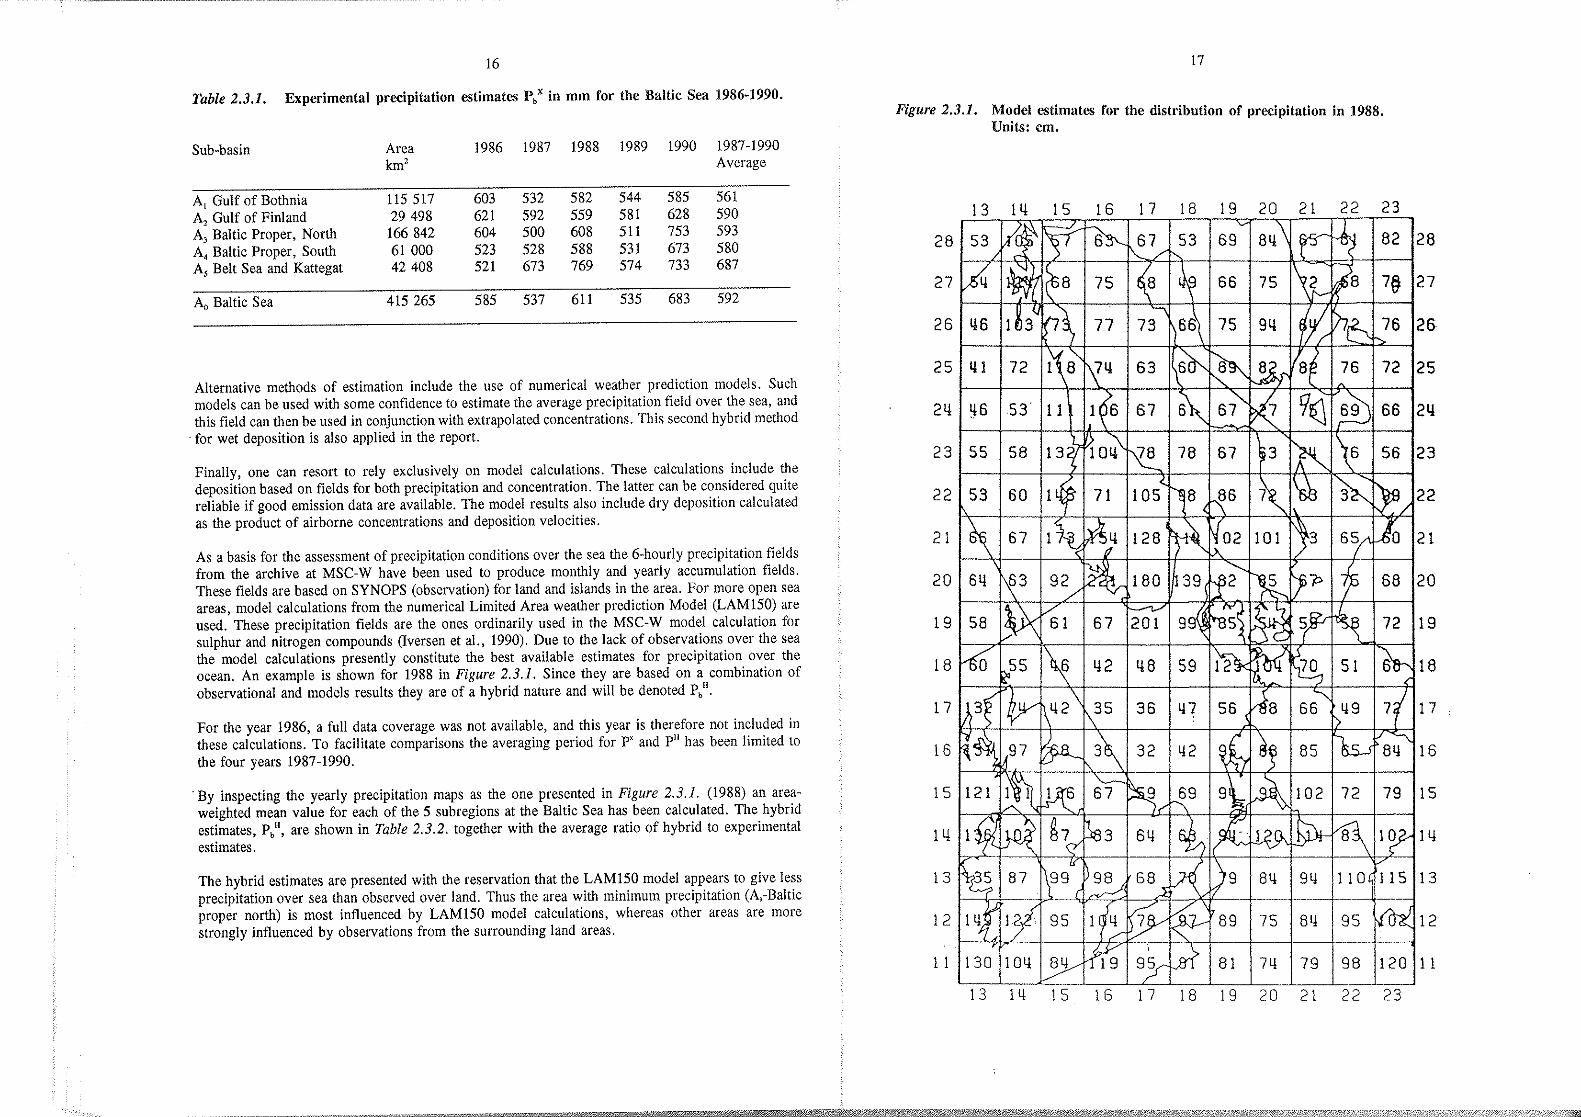
Table 2.3.1. Experimental precipitation estimates P,X in mm for the Baltic Sea 1986-1990.
Sub-basin
A1 Gulf of Bothnia A, Gulf of Finland A, Baltic Proper, North A, Baltic Proper, South A, Belt Sea and Kattegat
Ao Baltic Sea
Area km'
115 517 29 498
166 842 61 000 42 408
415 265
1986 1987
603 532 621 592 604 500 523 528 521 673
585 537
1988 1989 1990 1987-1990 Average
582 544 585 561 559 581 628 590 608 511 753 593 588 531 673 580 769 574 733 687
611 535 683 592
Alternative methods of estimation include the use of numerical weather prediction models. Such models can be used with some confidence to estimate the average precipitation field over the sea, and this field can then be used in conjunction with extrapolated concentrations. This second hybrid method
·for wet deposition is also applied in the report.
Finally, one can resort to rely exclusively on model calculations. These calculations include the deposition based on fields for both precipitation and concentration. The latter can be considered quite reliable if good emission data are available. The model results also include dry deposition calculated as the product of airborne concentrations and deposition velocities.
As a basis for the assessment of precipitation conditions over the sea the 6-hourly precipitation fields from the archive at MSC-W have been used to produce monthly and yearly accumulation fields. These fields are based on SYNOPS (observation) for land and islands in the area. For more open sea areas, model calculations from the numerical Limited Area weather prediction Model (LAM150) are used. These precipitation fields are the ones ordinarily used in the MSC-W model calculation for sulphur and nitrogen compounds (Iversen et al., 1990). Due to the lack of observations over the sea the model calculations presently constitute the best available estimates for precipitation over the ocean. An example is shown for 1988 in Figure 2.3.1. Since they are based on a combination of observational and models results they are of a hybrid nature and will be denoted Pb
11•
For the year 1986, a full data coverage was not available, and this year is therefore not included in these calculations. To facilitate comparisons the averaging period for P' and P11 has been limited to the four years 1987-1990.
·By inspecting the yearly precipitation maps as the one presented in Figure 2.3.1. (1988) an areaweighted mean value for each of the 5 subregions at the Baltic Sea has been calculated. The hybrid estimates, Pb", are shown in Table 2.3.2. together with the average ratio of hybrid to experimental estimates.
The hybrid estimates are presented with the reservation that the LAM150 model appears to give less precipitation over sea than observed over land. Thus the area with minimum precipitation (A,-Baltic proper north) is most influenced by LAM150 model calculations, whereas other areas are more strongly influenced by observations from the surrounding land areas.
17
Figure 2.3.1. Model estimates for the distribution of prt>cipitation in 1988. Units: em.
13 14 15 16 17 18 19 20 21 22 23
25 qJ
24 53 11
23
22
20
19
13 Ill 15

18
Table 2.3.2. Hybrid precipitation estimates P." in mm for the Baltic Sea 1987-1990.
Sub-basin Area 1986* 1987 1988 1989 1990 1987-90 P"JP"
km2 Average
A1 Gulf of Bothnia 115 517 635 606 623 631 679 635 1.13
A, Gulf of Finland 29 498 729 684 706 732 792 729 1.24
A, Baltic Proper, North 166 842 523 499 559 457 575 523 0.88
A, Baltic Proper, South 61 000 679 684 665 625 741 679 1.17
A, Belt Sea and Kattegat 42 408 747 701 758 664 865 747 1.09
Ao Baltic Sea 415 265 614 590 623 571 673 614 1.04
Data from MSC-W archives. *)For 1986 the average values of P" for 1987-1990 have been used.
On the basis of the hybrid estimates in Table 2. 3. 2. the following tentative conclusions can be reached:
I: There is a tendency of more precipitation in the southern/western part of the area than in the middle and northern part.
II: The inter-annual variability is largest around Denmark (area 5) and in the central part of the Baltic (area 3).
Ill: The precipitation over the sea seems to be less, about 60-80 %, than over the surrounding land area.
IV: The ratios of the two types of estimates P" and px show that the hybrid estimates are larger than the experimental ones by 10-20 %, with the exception of sub-basin 3.
Considering that the hybrid estimates are the more reliable ones this difference reveals that the siting . of the monitoring stations is critical for estimation of the precipitation.
To facilitate comparisons of the various methods of estimation without losing the year 1986 completely the missing hybrid precipitations for that year have in all subsequent calculations been replaced by the average sub-basin values for 1987-1990.
19
2.3.2. Wind Fields in the Baltic Region
The winds over the Baltic are often quite variable but on an annual basis the area is dominated by west-southwesterly winds. This can be seen in Figure 2.3.2, which shows the distribution of daily wind sectors at a number of measuring sites in the Baltic region.
The daily wind sectors are selected among the 8 sectors (45°) of the compass. The selection is based on 4 daily trajectories to the measurement sites calculated by MSC-W for the preceding 96 hours. If all trajectories have more than half of their route inside a sector over a distance from 1.500 km to 150 km from the site, that sector is allocated to that day at the station. If this criterion is not met no sector is allocated to the site for that day. The no-sector frequency is given in percentages at the center of the sector plots in Figure 2.3.2. This sector analysis is based on about 4750 trajectories to each site in the period 1978 to 1990.
Figure 2.3.2. ~istribution of wind sectors at the stations: Rorvik, Kap Arkona, Hoburg, Utii, Ahtliri and Virolahti.
Scale:
0 5 10 15 20 25 30%,

20
3. MONITORING NETWORK
The main purpose of the monitoring network is to produce data that can be used for estimating the deposition of harmful substances to the Baltic Sea. That purpose can only be fulfilled if data reported by the contracting parties are of a high quality. The monitoring stations shall be representative for the larger area and should not be significantly influenced by local pollution sources. The sampling and analytical methods shall be reliable and comparable.
3.1. Stations
The EGAP Monitoring Network consists of 26land-based measuring sites (see Figure 2.1.1). They are situated in various types of rural areas as listed in Table 3.1.1. so as to avoid the influence of local industrial sources. Measurements may nevertheless be influenced by local contributions and may, especially for ammonia, vary considerably depending on the surroundings of the sampling site.
. The monitoring program is based on measurements of routine minimum requirement compounds, additional experimental measurements and a quality assurance procedure. These compounds and the corresponding data coverage are shown in Table 3.1.2. Further details are given in the Supplement to this report.
3.2. Quality Assurance
The quality assurance protocol for monitored parameters used by the data host is similar to the EMEP Quality Assurance Plan (Schaug 1988). It is described in the Supplement to this report and can be summarized as follows.
Statistical tests are used to compare new measurements of gaseous, aerosol or precipitation compounds with previous data of each component already stored in the data base. The tests are carried out in order to identify possible outliers and erroneous results. They are based upon the assumption that the data possess a lognormal distribution and comprise comparisons with cumulative frequency distributions.
The data are split according to different seasons (i.e. winter and summer). Data outside three or four times the standard deviation have to be reconsidered by comparison with other components and concentrations at neighbouring stations.
In some cases the data deviate from a theoretical lognormal distribution, especially in the low concentration range where all concentrations below the detection limit are set equal to a small value. However, minor deviations from the theoretical function are acceptable.
Ion Balance Computations are also used as a tool. If all predominant species in precipitation are measured correctly the sum of positive and negative ionic concentrations should be balanced. Accordingly, the ratio between anion and cation concentrations should be close to one. The effect of minor constituents e.g. phosphates and organic acids, which are not included in the analysis is usually negligible in "acid precipitation". During sample storage soil dust, organic materials etc. might be dissolved, or biological processes might occasionally occur. Indications for these processes have to be suspected if deviations of the ionic sum from zero are found. In addition, precipitation samples sometimes seem to be supersaturated with carbon dioxide (compared to the concentration in air) and therefore contain more bicarbonate than expected. If a complete chemical analysis is performed the ionic balance test is useful for aerosol samples as well.
21
The ionic balance check should be carried out as soon as possible in order to be able to repeat the chemical analysis, if necessary.
In addition the conductivity of the precipitation samples is measured and compared with values calculated from the measured concentrations using equivalent ionic conductivities. Any data which appear uncertain should lead to a reinvestigation of the sample, if possible.
Table 3.1.1. The HELCOM network stations
Sub-basin
Gulf of Bothnia
Gulf of Finland
Baltic Proper, North
Baltic Proper, South
Belt Sea and Kattegat
* EMEP stations
Station
Hailuoto'' Rahja RickleA Sulva Ylimarkku Korppoo Jomala
Virolahtib' Haapasaari Vanhankylanmaa Sipoo Lahemaa· Tvarminne
Utii" Aspvreten· Syrve· Hoburg· Rucava·
Nida· Arup Leba Kap Arkona·
Rorvik.
Vavihill. Keldsnor· Dan. Nienhof
(FI) (FI) (SE) (FI) (FI) (FI) (FI)
(FI) (FI) (FI) (FI) (SU) (FI)
(FI) (SE) (SU) (SE) (SU)
(SU) (SE) (PL) (DD)
Surrounding area
open sandy seashore forest land
agricultural land agricultural and forest land forest land agricultural land
agricultural land rocky terrain, forest rocky terrain agricultural land forest land forest land
rocky terrain, island forest land land, sea cultivated land cultivated land
sea, forest forest land meadow
(SE) cultivated land, forest
(SE) (DK) (DE)
water forest area cultivated land, beach forest area
a) b)
data are from two different stations in this municipality: bulk monthly + wet monthly data are from two different stations in this municipality: bulk monthly + bulk daily

22
Table 3.1.2. Development of the measuring activities 1986-1990
Constituents No. of measuring stations
1986 1987 1988
A. Nitrogen compounds, routine minimum requirements
NO,- precipitation 25 26 25
NH,• precipitation 25 26 25
B. Nitrogen compounds in air, voluntary/experimental basis
NO, gas 9 8 12
HNO,- gas + 7 6 7
NO,- - particles
NH,- gas + 8 6 7
NH, • - particles
c. Trace metals, voluntary/experimental basis *)
Pb precipitation 6 7 7
Cd precipitation 5 6 6
Zn precipitation 6 7 7
Cu precipitation 0 0 0
D. Quality assurance
SO z- precipitation 25 26 24 4
Na• precipitation 20 19 21
Mg'• precipitation 19 18 20
cr precipitation 19 19 18
*) Routine minimum requirement from 1990
1989
25
25
10
8
8
6
6
6
0
25
19
14
20
1990
25
25
9
8
8
4
4
4
0
25
23
22
21
23
3.3. Intercomparisons
3.3.1. lnten~libration Exercises
In order to ensure the quality and comparability of the data collected EGAP has initiated and participated in a number of intercalibration and intercomparison exercises which have all been organized by Sweden. The first exercise was in its first stage concerned with the analytical methods used for the determination of trace metals, nitrate and ammonium in atmospheric precipitation (Ross, 1989). EGAP decided to emphasize the trace metal portions of this intercalibration because not all of the laboratories carry such analyses out routinely. The control of atmospheric trace metals has become essential because toxic metals such as Cd, As, Pb and Hg are known to contribute strongly to the pollution of the Baltic via atmospheric input. This first stage was carried out in 1986.
The outcome of the first stage justified the start of the second stage, an intercomparison of procedures for precipitation sampling, but for ammonium and nitrate only. It took place during 1987-1988. The results and conclusions from this first intercomparison are summarized below (HELCOM, 1991).
A comprehensive prqgramme containing both intercalibration of analytical methods for trace metals in precipitation as well as an intercomparison of precipitation collectors was carried out in 1990. It was initiated by the Paris Commission (PARCOM) for the quality insurance within the Comprehensive Atmospheric Monitoring Programme. Following an invitation to all HELCOM countries many laboratories participated in the exercise. However, at the time being there is no report on results available.
3.3.2. Results and Conclusions
The Ammonium and Nitrate Intercalibrations in 1986 and 1987-1988 showed that each of the 6 participating laboratories could accurately determine the contents of ammonium and nitrate in the 4 samples sent out. It was also concluded that systematic analytical errors could occur, but that they usually were smaller than the sampling errors arising from the use of different collectors.
The intercomparison of prL>cipitation sampling procedures in 1987-1988 showed that the main causes for mutual deviations were the different designs rather than the use of bulk or wet-only samplers or the length of the sampling periods. The maximum difference between different collectors were below 20 % for most components usually monitored at the stations.
With respect to estimation of depositions over the Baltic Sea it can be noted that this maximum difference in concentrations corresponds to a distance in Sweden of about 100 km. This is of no real significance since the difficulties in estimating the dry deposition at present contribute a much larger uncertainty.
The minimum participation for the trace metal intercalibration in 1986 required the analysis of Pb, Cu and Zn. Other metals determined on an optional basis were Cd, Fe and Mn. Various methods were used to test if the laboratories had control of contamination in the 6 samples that were sent out and the results from the 5 participating laboratories were found to contain a wide spread. It was concluded that for these components much additional work was needed. This could include a standardization of the analytical methods, as well as sample collection and handling procedures to reduce sample contamination inside the laboratory. These topics were discussed further at a special workshop on 'Collection and Analysis of Atmospheric Trace Metals' in Sweden in 1989 (National Swedish Environmental Protection Board, 1989).
The results from the trace metal intercomparison show that at present the trace metal concentrations in precipitation should be viewed with some caution. This is of course also valid for any derived estimates. For these reasons it has been decided to restrict the use of trace metal results in this report to lead.

24
4. NUMERICAL MODELS
4.1. Model Types
Recent studies have suggested, that North European marginal seas such as the North Sea and the Baltic are significantly affected by the atmospheric long range transport of man made emissions of pollutants. If control strategies for the reduction of the atmospheric deposition fluxes of pollutants to the Baltic Sea have to be developed, the only way of delineating the atmospheric transport pathways and hence the emitter-receptor relationship is through numerical modelling. However, due to the complexity of the physical and chemical processes to be treated in these models, a compromise between complexity and operational demands has to be found depending on the computer capacities, available input data and the spatial and temporal scales involved.
For long range transport of atmospheric pollutants and long term averages of concentration and deposition fields, Lagrangian models have proved to be an appropriate tool. In this type of models horizontal dispersion is represented by a large number of trajectories and a uniform vertical distribution is assumed in the atmospheric boundary layer. The mass balance for pollutants is calculated for air parcels following the motion along air pathway trajectories.
The model of MSC-W, as described by Eliassen and Saltbones (1983), was one of the first in this category to be developed for operational use (Iversen et al., 1989, 1990). It is a one-layer model where concentrations are calculated as averages over the well mixed layer and it is receptor oriented, since every six hours 4-day trajectories terminating at selected receptor points are calculated. After comprehensive tests and validations there are now 10 chemical components in the model [NO, NO,,
·PAN', HNO,, NO,-, NH,NO,, NH,, SO,, so;·, ( (NH,),SO,+NH,HSO,) I 2 = (NH,)uSO,].
The model is being used on a routine basis for the assessment of transboundary pollution fluxes ~nd deposition of sulphur and nitrogen compounds over Europe. The results show that the concentratiOn and deposition fields are predicted reasonably well. The model has in slightly modified form been used to calculate deposition of trace metals to the North Sea and the Baltic Sea, the difference being that no chemical or physical transformation is assumed for these pollutants (Petersen et al., 1989).
Eulerian models constitute another valuable model approach in which calculations are carried out in 3-dimensional grid points. The main advantages of complex Eulerian modelling are that complex atmospheric processes can be investigated in detail, that episodic events can be modelled, and that it is the appropriate frame for nesting mesoscale models required for evaluating specific environmental
control measures.
Eulerian models, therefore, constitute a sophisticated supplement to the Lagrangian approach as research tools for improving the reliability of model calculations. With the rapid advances in computers and database management systems they are likely to be introduced over the next few years as routine tools for abatement strategies. As has been shown recently (EMEP-Workshop on PhotoOxidant Modelling for Long-Range Transport in Relation to Abatement Strategies, Berlin, 16-19 April 1991) less sophisticated versions of Eulerian models already now constitute a practical and appropriate
tool for such purposes.
The MSC-E has developed and tested a hybrid Lagrangian-Eulerian model for routine calculations of horizontal transport of air pollution. The application of the Eulerian scheme is useful for modelling the non-linearity of chemical processes, of washout, and of vertical wind variation.
*) PAN = Peroxy - Acetyl - Nitrate
25
4.2. Model Inputs
Calculations of air quality and deposition of air pollutants require basic input information of two categories: meteorology and emissions.
The meteorological information needed differs a little between the two EMEP-models. The MSCE model uses real meteorological observational data comprising the horizontal winds at the 850 and 1000 hPa levels, precipitation amounts, and surface temperature.
The main meteorological input data for the MSC-W model are the horizontal wind fields precipitation and mixing height fields. The data are generated from objectively analyzed observation~ and from the Limited Area weather prediction Model of the Norwegian Meteorological Institute. The trajectories are calculated from the 925 hPa ( ~ 800 m altitude) windfield, which is considered to be representative for the horizontal advection in one-layer transport models.
Most of the meteorological data needed are taken from the Numerical Weather Prediction model (NWP). Through data assimilation in time and space meteorological observations are combined in an optimal way with short-term model predictions. The data assimilation cycle is 6 hours, and geopotential-.-height, horizontal wind, and relative humidity are analyzed from observations. Thus, observations are included in a way that does not counteract the physical laws of Nature. The NWP
. model carries prognostic equations for surface pressure, wind, temperature, water vapour, and liquid water, and a diagnostic equation (the hydrostatic equation) for the height of the coordinate surfaces. In the version employed in the EMEP-work, it is run with 150 km grid resolution with the EMEPgrid as a sub-grid. The model has 10 layers in the vertical, and includes a physical package with turbulent diffusion in the atmospheric boundary layer, stratiform and convective precipitation, and short- and long-wave radiation.
Precipitation is one of the key pa~ameters for atmospheric deposition, since wet depositions due to m-cloud and below-cloud scavengmg may account for more that 70% of the total annual deposition rates of some airborne pollutants in Europe. However, precipitation from single convective clouds as well as from large frontal systems is very intermittent and spatially varying when compared to the dens.it~ in. space and time of the synoptic rain collector network. Over continental regions six-hourly preCipitatiOn amounts are analyzed from observations. However, synoptic observations can be insufficient for a 6 h analysis in the model domain, especially for sea areas where almost no observations are available. Therefore precipitation fields over sea are derived from the NWP model.
The height of the atmospheric boundary layer defines the layer within which pollutants are dispersed and mostly sc~venged. It is determined from radio soundings taken daily at 1200 GMT, which in Europe approximates the afternoon maximum mixing height. Such soundings are however very sparse above the Baltic Sea. Joffre (1985) and Salmi & Joffre (1988) have shown that the marine at~ospheric boundary ~ayer height can vary significantly from 200 m in summer to 1500 m in early
. wmter before sea freezmg. The boundary layer heights over the Baltic used with the MSC-W model sometimes do not show this trend. Therefore this input parameter, like the precipitation fields over sea, is still an uncertain estimate, which should be the subject of further research.
The other set of essential input data for both EMEP models is the field of European emissions of both anthropogenic and natural pollptants. The assessment of emissions from anthropogenic sources and ~eir spatial ?istribution in Europe is a key requirement for modelling the atmospheric input of mtrogen species and trace metals to the Baltic Sea. The major source of nitrogen oxides (NO = NO + NO,) is the high temperature combination of atmospheric nitrogen and oxygen in co~bustion processes in power plants and petrol-fuelled road vehicles. The budget calculations of nitrogen also require data on emissions of ammonia (NH,) for which the major source is agricultural activity. Trace
26
metals are emitted into the atmosphere due to their volatility during high temperature process in power plants, smelters, mines, incinerators, steel and iron factories, and gasoline combustion.
Emission surveys for NO, and NH, (Iversen et al., 1989, 1990) and for several trace metals (Pacyna, 1983) from various anthropogenic sources have been developed in the EMEP-grid system. The emissions of nitrogen oxides are taken from official national inventories submitted regularly within the EMEP cooperation and based on emission factors and statistical information. If not available the emission estimates of Semb and Amble (1981) are used. For ammonia official emission estimates are only available for one country. In all other cases the estimates of Buijsman et a/.(1985, 1987) are used, but multiplied with a factor of 1.2 according to advice from these authors.
Thus, great efforts are spent on ensuring the quality and reliability of the emission data, since this is a prerequisite for reliable model results. Nevertheless, the emission data employed are of a varying quality and interpolations are often required to cover the whole grid net used in the model.
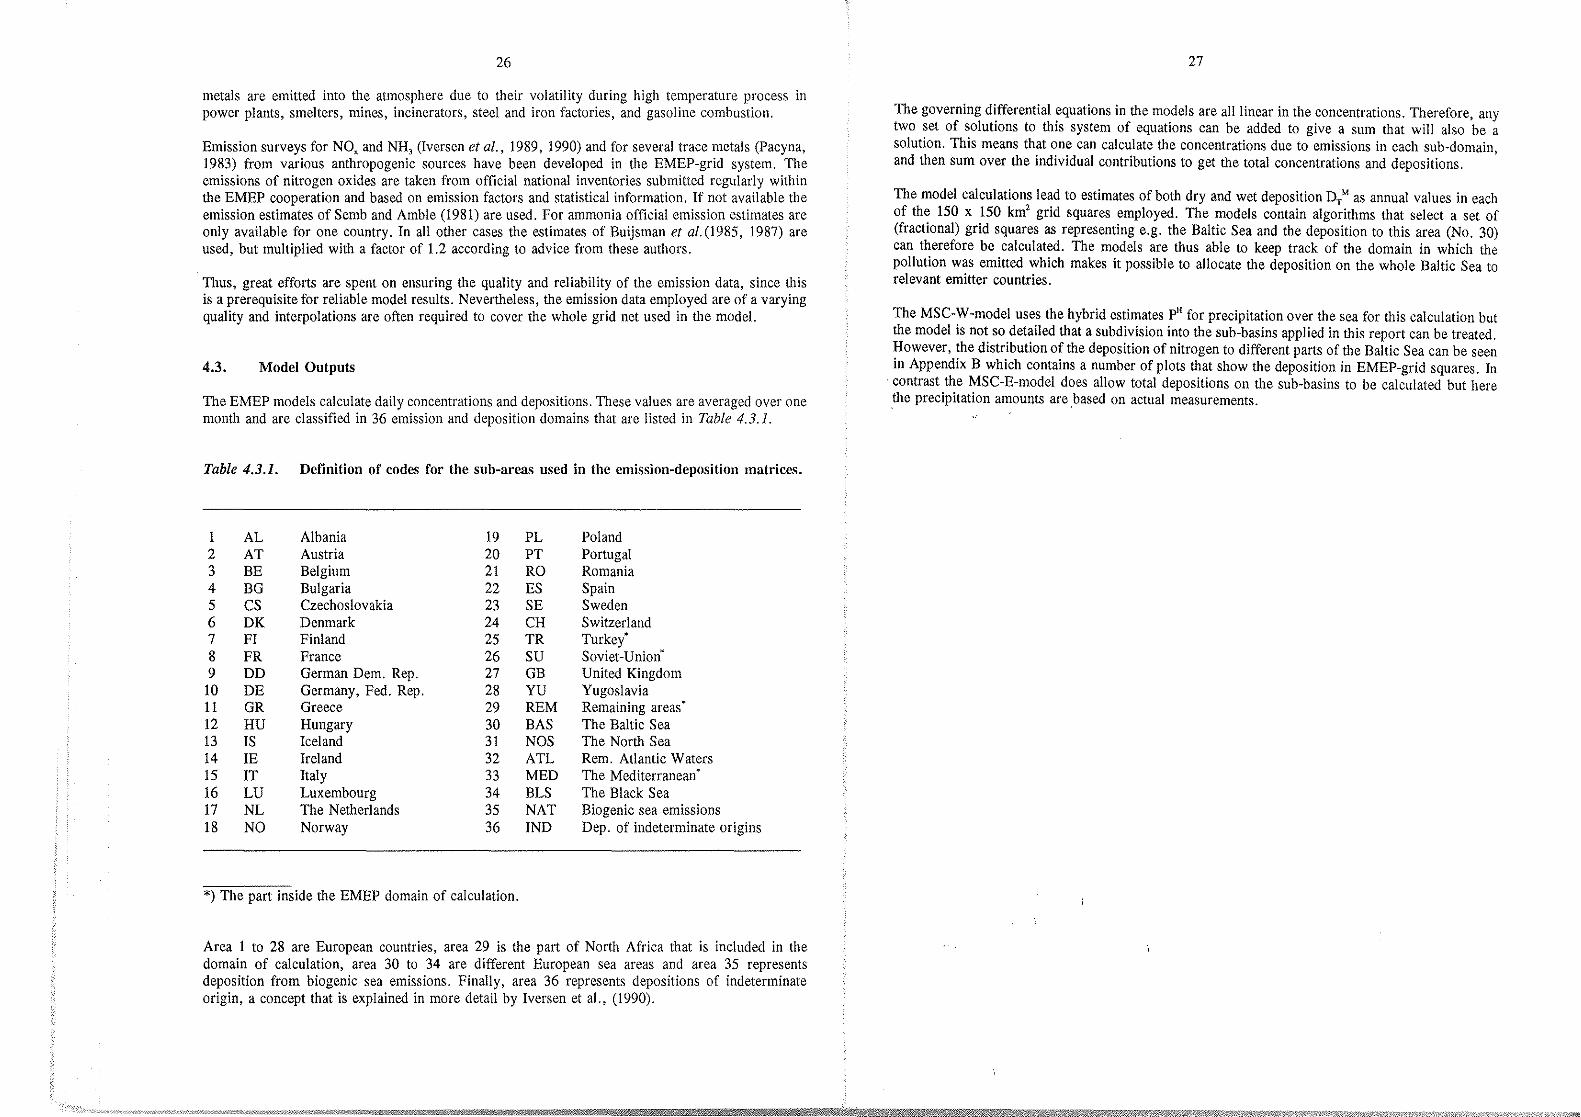
4.3. Model Outputs
The EMEP models calculate daily concentrations and depositions. These values are averaged over one month and are classified in 36 emission and deposition domains that are listed in Table 4.3.1.
Table 4.3.1. Definition of codes for the sub-areas used in the emission-deposition matrices.
1 AL Albania 19 PL Poland 2 AT Austria 20 PT Portugal 3 BE Belgium 21 RO Romania 4 BG Bulgaria 22 ES Spain 5 cs Czechoslovakia 23 SE Sweden 6 DK Denmark 24 CH Switzerland 7 PI Finland 25 TR Turkey
. 8 FR France 26 su Soviet-Union· 9 DD German Dem. Rep. 27 GB United Kingdom
10 DE Germany, Fed. Rep. 28 YU Yugoslavia 11 GR Greece 29 REM Remaining areas
. 12 HU Hungary 30 BAS The Baltic Sea 13 IS Iceland 31 NOS The North Sea 14 IE Ireland 32 ATL Rem. Atlantic Waters 15 IT Italy 33 MED The Mediterranean
. 16 LU Luxembourg 34 BLS The Black Sea 17 NL The Netherlands 35 NAT Biogenic sea emissions 18 NO Norway 36 IND Dep. of indeterminate origins
*) The part inside the EMEP domain of calculation.
Area 1 to 28 are European countries, area 29 is the part of North Africa that is included in the domain of calculation, area 30 to 34 are different European sea areas and area 35 represents deposition from biogenic sea emissions. Finally, area 36 represents depositions of indeterminate origin, a concept that is explained in more detail by Iversen et al., (1990).
27
The governing differential equations in the models are all linear in the concentrations. Therefore, any two set of solutions to this system of equations can be added to give a sum that will also be a solution. This means that one can calculate the concentrations due to emissions in each sub-domain and then sum over the individual contributions to get the total concentrations and depositions. '
The model calculations lead to estimates of both dry and wet deposition DTM as annual values in each of the 150 x 150 km' grid squares employed. The models contain algorithms that select a set of (fractional) grid squares as representing e.g. the Baltic Sea and the deposition to this area (No. 30) can therefore be calculated. The models are thus able to keep track of the domain in which the pollution was emitted which makes it possible to allocate the deposition on the whole Baltic Sea to relevant emitter countries.
The MSC-W-model uses the hybrid estimates P" for precipitation over the sea for this calculation but the model is not so detailed that a subdivision into the sub-basins applied in this report can be treated. However, the distribution of the deposition of nitrogen to different parts of the Baltic Sea can be seen in Appendix B which contains a number of plots that show the deposition in EMEP-grid squares. In
· contrast the MSC-E-model does allow total depositions on the sub-basins to be calculated but here .the precipitation amounts are based on actual measurements.
28
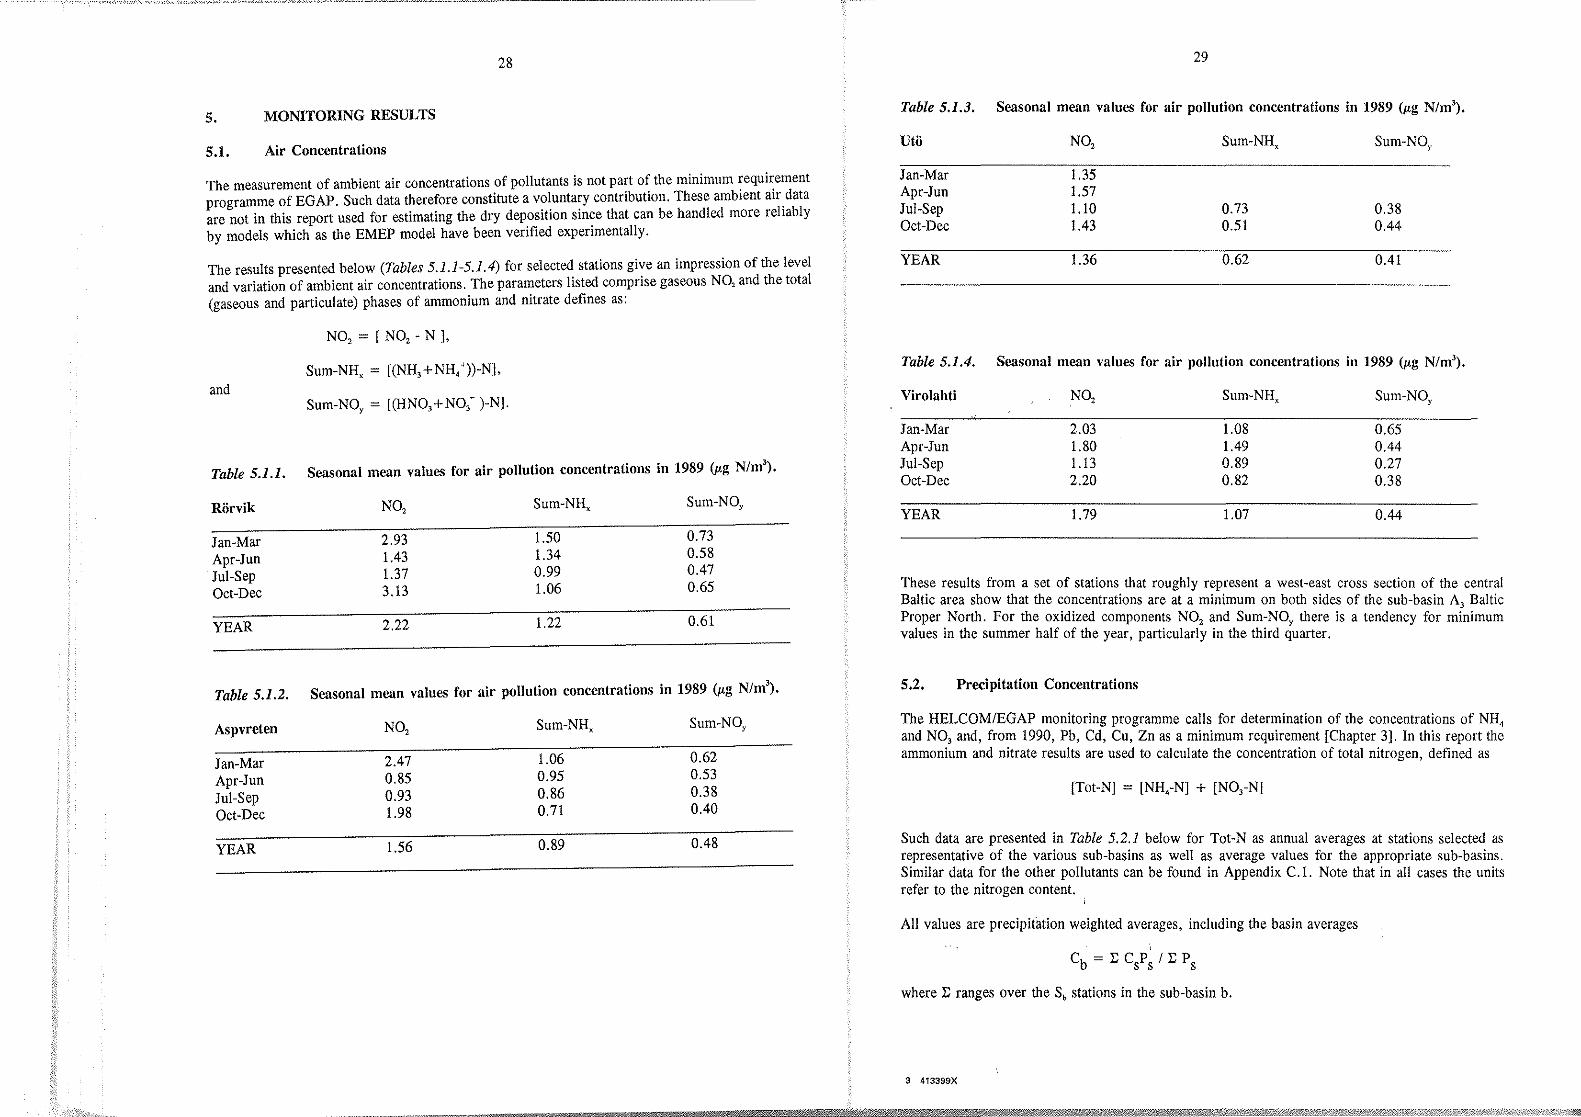
5. MONITORING RESULTS
5.1. Air Concentrations
The measurement of ambient air concentrations of pollutants is not part of the minimum requirement programme of EGAP. Such data therefore constitute a voluntary contribution. These ambient air data are not in this report used for estimating the dry deposition since that can be handled more reliably by models which as the EMEP model have been verified experimentally.
The results presented below (Tables 5.1.1-5.1. 4) for selected stations give an impression of the level and variation of ambient air concentrations. The parameters listed comprise gaseous NO, and the total (gaseous and particulate) phases of ammonium and nitrate defines as:
and
NO, = [ NO, - N ],
Sum-NH, = [(NH,+NH/))-N],
Sum-NO,= [(HNO,+NO,- )-N].
Table 5.1.1. Seasonal mean values for air pollution concentrations in 1989 {Jtg N/m').
Riirvik
Jan-Mar Apr-Jun Jul-Sep Oct-Dec
YEAR
NO,
2.93 1.43 1.37 3.13
2.22
Sum-NH, Sum-NO,
1.50 0.73 1.34 0.58 0.99 0.47 1.06 0.65
1.22 0.61
Table 5.1.2. Seasonal mean values for air pollution concentrations in 1989 {Jtg N/m').
Aspvreten
Jan-Mar Apr-Jun Jul-Sep Oct-Dec
YEAR
N02
2.47 0.85 0.93 1.98
1.56
Sum-NH, Sum-NO,
1.06 0.62 0.95 0.53 0.86 0.38 0.71 0.40
0.89 0.48
29
Table 5.1.3. Seasonal mean values for air pollution concentrations in 1989 {Jtg N/m').
Utii
Jan-Mar Apr-Jun Jul-Sep Oct-Dec
YEAR
N02
1.35 1.57 1.10 1.43
1.36
Sum-NH,
0.73 0.51
0.62
Sum-NO,
0.38 0.44
0.41
Table 5.1.4. Seasonal mean values for air pollution concentrations in 1989 (l'g N/m').
Virolahti
Jan-Mar Apr-Jun Jul-Sep Oct-Dec
YEAR
N02
2.03 1.80 1.13 2.20
1.79
Sum-NH, Sum-NO,
1.08 0.65 1.49 0.44 0.89 0.27 0.82 0.38
1.07 0.44
These results from a set of stations that roughly represent a west-east cross section of the central Baltic area show that the concentrations are at a minimum on both sides of the sub-basin A Baltic Proper. North. For the oxidized components N02 and Sum-NO, there is a tendency for mlnimum values m the summer half of the year, particularly in the third quarter.
5.2. Precipitation Concentrations
The HELCOM/EGAP monitoring programme calls for determination of the concentrations of NH 4
and N~, and, fro~ 1990, Pb, Cd, Cu, Zn as a minimum requirement [Chapter 3]. In this report the ammomum and mtrate results are used to calculate the concentration of total nitrogen, defined as
[Tot-N] = [NH,-N] + [NO,-N]
Such data are presented in Table 5.2.1 below for Tot-N as annual averages at stations selected as r~pr~entative of the various sub-basins as well as average values for the appropriate sub-basins. Similar data for the other pollutants can be found in Appendix C.l. Note that in all cases the units refer to the nitrogen content.
All values are precipitation weighted averages, including the basin averages
cb = r; Cl ~ n:; P s
where 1: ranges over the Sb stations in the sub-basin b.
3 413399X

30 31
Table 5.2.1. Annual mean concentrations of Tot-N in precipitation (mg N/1).
For all nitrogen compounds Tables 5.2.2- 5.2.4 summarize annual basin average concentrations as well as area-weighted overall averages for the whole Baltic Sea. The five-year average concentration of Tot-N in precipitation is seen to be 1.34 mg/1. There does not appear to be any temporal trend in the concentrations of the two types of nitrogen compounds. Geographically, however, there is a clear concentration gradient from north to south, presumably due to the varying distance to continental European sources. These features are also illustrated in Figure 5.2.1 with annual concentration results from the most northern and southern sub-basins.
Figure 5.2.1. Annual average nitrogen concentrations in A., Gulf of Bothnia, and in A, Kattegat and Belt Sea.
mg N /I 2.0
1.5
1.0
0.5
Nitrogen Concentrations in Precipitation
North and South Baltic 1986 - 1990
A1 A5 A1 A5 A1 A5 A1 A5 A1 A5 A1 A5 Basin
1986 1987 1988 1989 1990 8690
Form ~'Sl Oxidized l22Z2Z3 Reduced
Gulf of Bothnia
Hailuoto Rahja Ricklea Sulva Ylimarkku Korppoo Jomala
Basin average:
Gulf of Finland
Virolahti Haapasaari
· Vanhankylanmaa . Sipoo Lahemaa Tvarminne
Basin average:
Baltic Proper, North
Uto Aspvreten Syrve Hoburg Rucava
Basin average:
Baltic Proper, South
Nida Arup Leba Kap Arkona
Basin average:
Belt Sea and Kattegat
R6rvik Vavihill Keldsnor Kiel Bight Danisch-Nienhof
Basin average:
1986 1987 1988
1.10 0.91 1.33 0.86 0.55 0.69 0.84 0.84 1.40 0.85 0.63 1.39 1.59 1.23 1.28 1.02 1.50 1.25 1.83 1.48
1.15 1.10 1.19
1986 1987 1988
1.40 1.30 1.00 1.40 1.05 1.23 1.74 1.13 1.47 1.36 1.13 1.22 0.47 0.91 0.65 1.23 1.35 1.32
1.42 1.17 1.16
1986
1.90 0.92 0.91 1.66 1.23
1.30
1986
1.24 1.38
1.72
1.47
1986
1.67 1.55 1.59 3.18
1.60
1987
1.09 0.76 1.20 1.52 0.90
1.06
1987
1.53 1.03 1.63 2.63
1.68
1987
1.21 1.15 1.88
1.22
1.29
1988
1.57 1.01 1.16 2.34 0.82
1.27
1988
2.05 1.31 1.20 1.80
1.45
1988
1.51 1.30 1.82
1.75
1.56
1989 1990
0.82 0.87 0.53 0.52 0.88 1.00 1.18 1.44 1.41 1.28 0.91 1.46 1.22
1.07 1.08
1989 1990
1.13 0.89 1.77 1.70
1.00 0. 79 0.89 0.56 1.42 0.99
1.18 0.94
1989
1.53 1.23 1.45 2.32 1.26
1.50
1989
1.65 1.23 1.66
1.52
1989
1.47 1.97 1.56
1.87
1.75
1990
1.32
1.22 2.61 0.98
1.41
1990
1.38
1.06 1.52
1.30
1990
1.27 1.87 1.81
1.62
1986-90
1.00 0.62 0.81 1.00 1.40 1.19 1.41
1.12
1986-90
1.14 1.38 1.44 1.10 0.76 1.24
1.17
1986-90
1.49 0.96 1.19 2.12 1.04
1.32
1986-90
1.45 1.33 1.27 1.87
1.47
1986-90
1.42 1.55 1.74 3.18 1.35
1.56

32
Table 5.2.2. Annual mean sub-basin concentrations of Tot-N in precipitation (mg N/1).
Sub-basin 1986 1987 1988 1989 1990 1986-90
A, Gulf of Bothnia 1.15 1.10 1.19 1.07 1.08 1.12 A2 Gulf of Finland 1.42 1.17 1.16 1.18 0.94 1.17 A, Baltic Proper, North 1.30 1.06 1.27 1.50 1.41 1.32 A, Baltic Proper. South 1.47 1.68 1.45 1.52 1.30 1.47 A, Belt Sea and Kattegat 1.60 1.29 1.56 1.75 1.62 1.56
A0 Baltic Sea Average 1.38 1.26 1.34 1.40 1.29 1.34
Table 5.2.3. Annual mean sub-basin concentrations of NO, in precipitation (mg N/1).
Sub-basin 1986 1987 1988 1989 1990 1986-90
A, Gulf of Bothnia 0.49 0.51 0.57 0.47 0.49 0.51 A, Gulf of Finland 0.67 0.50 0.60 0.53 0.49 0.57 A3 Baltic Proper, North 0.73 0.57 0.64 0.76 0.70 0.67 A, Baltic Proper, South 0.72 0.92 0.73 0.68 0.62 0.76 A, Belt Sea and Kattegat 0.76 0.62 0.77 0.80 0.66 0.74
A0 Baltic Sea Average 0.67 0.62 0.67 0.65 0.60 0.64
Table 5.2.4. Annual mean sub-basin concentrations of NH, in precipitation (mg N/1).
Sub-basin 1986 1987 1988 1989 1990 1986-90
A, Gulf of Bothnia 0.66 0.59 0.63 0.61 0.59 0.62 A2 Gulf of Finland 0.74 0.67 0.56 0.65 0.45 0.66 A, Baltic Proper, North 0.57 0.49 0.64 0.74 0.71 0.61
. A, Baltic Proper, South 0.75 0.76 0.72 0.83 0.68 0.77 A, Belt Sea and Kattegat 0.84 0.67 0.79 0.95 0.96 0.81
Ao Baltic Sea Average 0.71 0.64 0.68 0.76 0.69 0.70
Measurement of lead and other metals in precipitation are not available from all stations and as results on Cd and Zn are not considered sufficiently reliable (cf. Chapter 3) data are given for lead only and in slightly different form in Table 5.2.5. All values are precipitation weighted averages.
33
Table 5.2.5. Annual mean concentration of lead in precipitation {fig/1).
1986 1987 1988 1989 1990 1986-90
Hailuoto 2.59 1.96 2.93 5.23 15.63 5.20 Haapasaari 5.32 4.50 4.73 22.50 9.94 8.58 Vanbankylanmaa 5.44 2.94 5.48 4.59 Aspvreten 4.46 2.98 3.69 4.24 3.84 Arup 7.51 2.96 3.44 3.38 3.26 Leba 13.13 14.34 7.17 11.14 Danisch-Nienbof 5.55* 4.90 4.10 3.99** 4.90
Baltic Sea Average 5.22 3.57 4.79 9.10 6.86 5.84
* only May to December ** only January and February
The results contain some very large concentrations that confirm the suspicions regarding the quality of this type of data. These atypical results mask any temporal or geographical tendency that otherwise might have been apparent.
Apparent trends of annual mean concentrations of lead at two Swedish and Finnish stations are shown in Figure 5.2.2 for the years 1984-1988. However, the downward trend is broken in 1988 and the data in Table 5.2.5 indicate a rise into 1989 and 1990. Thus, neither the data, nor their quality allow any definite conclusions on trends to be drawn.
Figure 5.2.2. Relative annual mean concentrations of lead in bulk deposition during 1984-1988. Results are normalized to the 5-year mean at the corresponding station.
2.0 Pb
1.6 '\ .......-\ .,.,....... \
' ">- \ !.0 ' "-
'\,.....::~ /' ' .... ~ ..
,/ ,P --~ s 1 Arup ·--- ~-:--
.6 s 2 o-- --o Aspvreten •,
·v
SF 1 <r-•--<> Van hanky lanmaa SF 2 ¢-•·---.a Hai1uoto
0
83 84 86 86 87 88

36
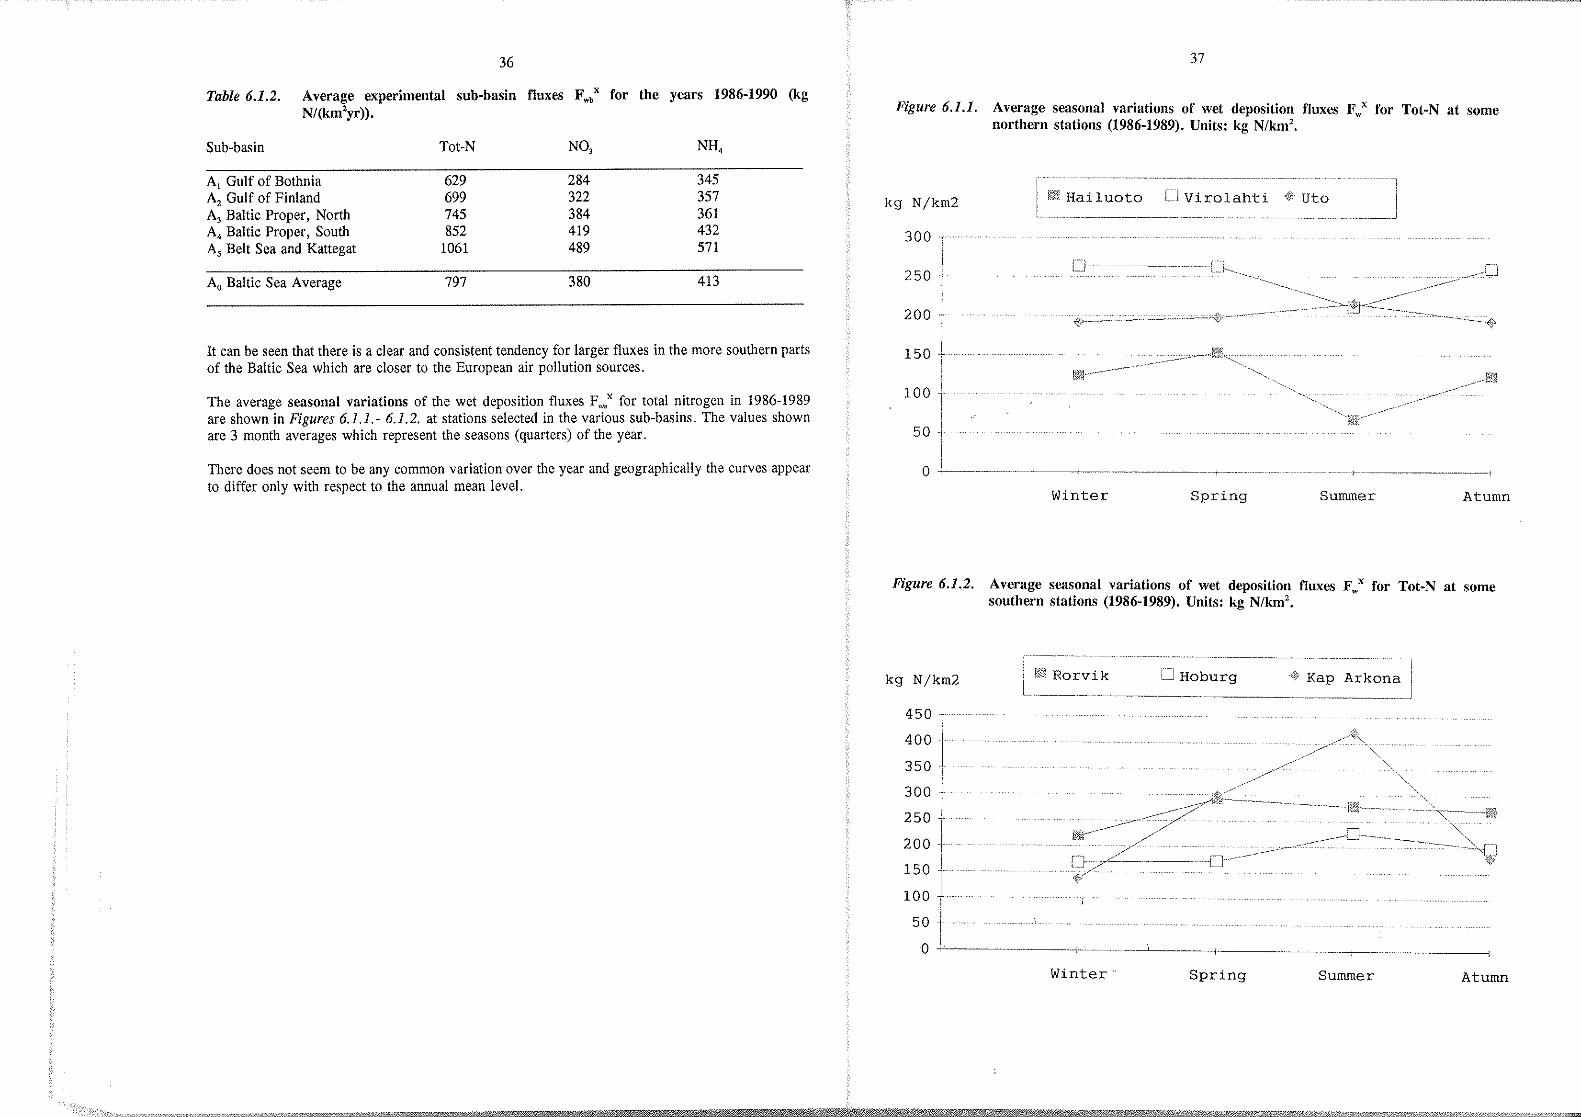
Table 6.1.2. Average experimental sub-basin fluxes Fw,X for the years 1986-1990 (kg N/(km2yr)).
Sub-basin Tot-N NO, NH,
A, Gulf of Bothnia 629 284 345 A, Gulf of Finland 699 322 357 A, Baltic Proper, North 745 384 361 A, Baltic Proper, South 852 419 432 A, Belt Sea and Kattegat 1061 489 571
A0 Baltic Sea Average 797 380 413
It can be seen that there is a clear and consistent tendency for larger fluxes in the more southern parts of the Baltic Sea which are closer to the European air pollution sources.
The average seasonal variations of the wet deposition fluxes F~x for total nitrogen in 1986-1989 are shown in Figures 6.1.1.- 6.1.2. at stations selected in the various sub-basins. The values shown are 3 month averages which represent the seasons (quarters) of the year.
There does not seem to be any common variation over the year and geographically the curves appear to differ only with respect to the annual mean level.
37
Figure 6.1.1. Average seasonal variations of wet deposition fluxes Fwx for Tot-N at some northern stations (1986-1989). Units: kg N/km'.
l<g N/km2
300
I 250 '
200 l 150 ·~ 100 i
1 I
50 I
I 0 ~--·--·-
Et~ Hailuoto LJ Virolahti '1\c· Uto
---"---- --------1-----~------··---j
Winter Spring Summer Atumn
Figure 6.1.2. Average seasonal variations of wet deposition fluxes Fwx for Tot-N at some southern stations (1986-1989). Units: kg N/km'.
kg N/km2
4so T 400 J
350 I I
300 + 250 1 200 i
I 1so 1
100 + i
f!il Rorvik LJ Hoburg i?i Kap Arkona
so+ I
0 ,~-·~---- ····-~·-;-· ---····~----·+--~-· ··-----+--····-~-..
Winter·· Spring Summer Atumn

38
6.1.2. Hybrid Deposition Fluxes
The second estimation method relies on hoth measurement data and model calculations. As noted earlier the hybrid estimates of precipitation over the sea are considered more reliable than extrapolation of coastal measurements. These estimates of annual precipitation fluxes are given for all sub-basins in Table 2.3.2. With the basin average concentrations in Table 5.2.2. - 5.2.4 denoted by c" the hybrid estimate of the basin flux is
The 5-year average fluxes are shown in Table 6.1.3. for Tot-N, N03, and NH, as well as the ratios of hybrid to experimental fluxes.
Table 6.1.3. Average hybrid sub-basin fluxes Fwb" for the years 1986*-1990 (kg Nl(km' yr)).
Sub-basin Tot-N NO, NH, F"IFx w w
A, Gulf of Bothnia 703 318 385 1.12 A, Gulf of Finland 854 406 448 1.22 A, Baltic Proper, North 676 351 325 0.91 A, Baltic Proper, South 1007 496 511 1.18 A5 Belt Sea and Kattegat 1164 536 628 1.10
Ao Baltic Sea Average 881 421 459 1.11
*)For 1986 the average values of P" for 1987-1990 have been used.
·These fluxes exhibit the same north-south gradient as do the experimental fluxes in Table 6.1. 2. The hybrid fluxes are, however, larger than the experimental ones, except for sub-basin A,. The ratios (F w" I F :J are essentially the same for all the nitrogen compounds but they vary geographically with an overall value for the Baltic Sea as a whole of about 1.1 and with a minimum in the central sub-basin, the Baltic Proper, North. These ratios are the same as the corresponding precipitation ratios (P" 1 Px) in Table 2.3.2. and the flux differences can therefore be ascribed mainly to the differences in the precipitation estimates.
The two sets of fluxes are also shown in Figure 6.1.3 from which it is evident that the gradient is more pronounced for reduced than for oxidized nitrogen.
39
Figure 6.1.3. Average wet fluxes of nitrogen to the Baltic sub-basins for 1986-1990.
Wet Fluxes to the Baltic Nitrogen 1986 - 1990
kg N I km2.yr 1200
iOOO
800
600
400
200
XH
AO
Form
·X H XH XH XH
A1 A2 A3 A4
~Oxidized IZ222Z3 Reduced
X H Method
A5 Basin

40
6.2. Experimental Estimates of Wet Deposition
On the basis of the deposition fluxes the wet deposition to the basins can now be estimated by the
two methods.
Dx=A·Fx wb b wb
and D 11 =A·c ·P 11 =A ·F 11 wb b"'b b b wb
Here the experimental deposition Dw x is based on extrapolation of measurements of both concentrations and precipitation at the EGAP stations. The hybrid deposition Dw" is based on concentration measurements at the EGAP stations and on NWP model calculations for precipitation over the sea. The wet depositions for Tot-N are shown for all years and all basins in Tables 6.2.1 -6.2.2. Similar results for the depositions of nitrate and ammonium are shown in Appendix C.3.
Table 6.2.1. Annual wet sub-basin depositions Dwbx of Tot-N (kT N/yr).
Sub-basin 1986 1987 1988 1989 1990 1986-90
A, Gulf of Bothnia 80 67 80 67 68 73
A2 Gulf of Finland 26 20 19 20 17 21
A, Baltic Proper, North 131 88 129 117 155 124
A, Baltic Proper, South 47 54 52 49 57 52
A, Belt Sea and Kattegat 44 37 51 43 50 45
A0 Baltic Sea Total 329 267 331 296 349 314
Table 6.2.2. Annual wet sub-basin depositions Dwbn of Tot-N (kT N/yr).
Sub-basin 1986* 1987 1988 1989 1990 1986*-90
A, Gulf of Bothnia 85 77 86 78 80 81
A2 Gulf of Finland 30 24 24 26 22 25
A, Baltic Proper, North 114 88 119 114 127 112
· A, Baltic Proper, South 61 70 59 58 61 62
A, Belt Sea and Kattegat 51 38 50 49 60 50
Ao Baltic Sea Total 340 297 338 325 349 330
*)For 1986 the average values of P" for 1987-1990 have been used.
The values for deposition in 1986 compare quite well with the estimates published earlier (HELCOM 1989, Part II, Tables 4 and 5) but the present estimates are lower in the north with about 20% but higher in the two southern basins with about 10 %. For the total Baltic Sea area the present value of Dw' is almost equal to the previous one of 326 kT N.
41
The total annual ?epositions to the Baltic Sea, split into oxidized and reduced nitrogen (Appendix ~·3!,. are shown m Fzgure 6.2.1. These results show that the nitrogen deposition to the Baltic Sea IS divided almost equally between oxidized and reduced compounds. There is no discernible temporal
·trend during the latter half of the 1980s.
The.average sub-basin depositions in 1986-1990 as well as the area weighted deposition to the whole Baltic Sea are summarized in Tables 6.2.3-6.2.4 for all three nitrogen compounds.
Figure 6.2.1. Estimates for annual wet deposition of nitrogen to the Baltic Sea 1986-1990.
Wet Depositions to the Baltic Nitrogen 1986 - 1990
kTN/~ ,-----------------------------~ 400
300
XH XH XH XH XH XH
1986 1987 1988 1989 1990 8690
Form ~'J Oxidized vz:z:::;;J Reduced
Method

42
Table 6.2.3. Average experimental wet depositions Dw,x for the years 1986-1990 (kT N/yr).
Sub-basin Tot-N NO, NH,
A, Gulf of Bothnia 73 33 40 A, Gulf of Finland 21 9 11 A, Baltic Proper, North 124 64 60 A, Baltic Proper, South 52 26 26 A, Belt Sea and Kattegat 45 21 24
A, Baltic Sea Total 314 !53 161
Table 6.2.4. Average hybrid wet depositions Dw," for the years 1986*-1990 (kT N/yr).
Sub-basin Tot-N NO, NH, D 11 /Dx w w
A, Gulf of Bothnia 81 37 44 1.11 A, Gulf of Finland 25 12 13 1.22 A, Baltic Proper, North 112 58 54 0.90 A, Baltic Proper, South 62 30 31 1.19 A, Belt Sea and Kattegat 50 23 27 1.10
·A. Baltic Sea Total 330 160 170 1.05
*)For 1986 the average values of P11 for 1987-1990 have been used.
The average ratio of hybrid to experimental estimates of the deposition is included in Table 6. 2.4. As was the case for the precipitation and the fluxes the hybrid method leads to estimates which are larger by about 10 % than the purely experimental method and the deposition ratios have a similar geographical variation.
As already noted this is probably an effect of the dependence of the calculations on the siting of the measurement stations. That this dependence is actually quite critical is emphasized by the tendency of the hybrid method to yield less precipitation over sea than over land.
43
6.3. Dry Deposition
The dry deposi~ion of gaseous and par~iculate nitrogen compounds to the Baltic Sea is not expected to be very stgmficant partly due to thetr relatively low air concentrations in this area and partly due to their low dry deposition velocities.
On f:be basis of .measurements from selected stations in the Baltic area Lindfors eta!., (1991) have obtam.~ ~e estt~ates for deposition rates for inorganic nitrogen shown in Table 6.3.1. The dry deposttlon lS d.ommated by the gaseous components and it is divided almost equally between oxidized and reduced nitrogen compounds. The uncertainty involved is judged to be less than 50 %. It is seen that the dry contribution to the nitrogen deposition is less than 25 % in the southern sea areas and of th~ or~er of 10 % in the central and northern parts of the Baltic Sea, resulting in an overall dry contnbut!On of about 15 %. The wet deposition estimated for the whole Baltic Sea is about 10 % larger than the wet depositions in Tables 6.2.1. and 6.2.2.
Table 6.3.1. Experimental estimates for deposition rates to the Baltic Sea 1980-1986 (kg N/km' yr)). (From Lindfors eta!., 1991).
Area Dry Wet Total km2 (gas & aerosol)
A. Northern Baltic 185 000 84 650 734 13. Central Baltic 128 000 84 910 994 C. Southern Baltic 102 000 349 1140 1489
Baltic Sea Total 415 000 149 850 1000
Deposition, kT I yr 62 353 415

44
6.4. Model Estimates for Total Deposition
With the EMEP-models it is as explained earlier possible to calculate the total dry and wet deposition to the Baltic Sea and to allocate this deposition to the various emitter countries given in Table 4. 3.1.
The source split deposition estimates D1M.w calculated by the MSC-W-model are given for the nitrogen compounds in Table 6.4.1. It should be noted, however, that only very few countries have supplied official emission data for ammonia. In all other cases unofficial estimates from 1985 have been used. In addition, results for 1990 must be considered as preliminary in accordance with the reporting routine of annual emissions from the participating countries (Iversen et al., 1990).
Similar deposition estimates D1M·E calculated by MSC-E are shown in Table 6.4.2. but for oxidized nitrogen only. The agreement for this component is quite good among the two sets of results.
Table 6.4.1. Total (wet and dry) deposition D/'.w of nitrogen-compounds to the Baltic Sea (kT N/yr). Model results from MSC-W (Iversen et al. 1990). HELCOM member countries are marked with an asterisk (*). DD"') Not Contracting Party after the German unification by 3 October 1990.
1988 1989 1990 Red.N Ox.N Tot-N Red.N Ox.N Tot-N Red.N Ox.N Tot-N
BE 1.1 2.9 4.0 1.2 2.9 4.1 1.3 3.4 4.7
cs 2.0 6.6 8.6 1.7 5.9 7.6 1.1 4.5 5.6 * DK 13.1 7.5 20.1 14.1 8.6 22.7 14.9 8.9 23.8 * FI 2.7 5.8 8.5 2.2 4.8 7.0 2.6 5.7 8.3
FR 3.3 6.9 10.2 3.2 7.5 10.7 4.0 8.4 12.4 DD*1 > 9.6 14.3 23.9 9.2 13.8 23.0 9.4 13.3 22.7
* DE 9.5 33.2 42.7 8.6 30.6 39.2 10.1 34.7 44.8
NL 5.1 6.8 11.9 4.7 6.7 11.4 6.0 8.4 14.4
NO 0.6 1.8 2.4 0.7 2.2 2.9 0.7 2.2 2.9 * PL 15.5 18.8 34.3 13.8 15.6 29.4 11.0 12.7 23.7 * SE 6.1 10.4 16.5 6.5 11.2 17.7 6.4 11.5 17.9 * su 25.7 12.8 38.5 16.9 6.7 23.6 16.2 8.3 24.5
GB 3.8 17.1 20.9 3.7 17.6 21.3 5.3 25.0 30.3
BAS 0.0 2.7 2.7 o.o 2.7 2.7 0.0 2.8 2.8
NOS 0.0 2.2 2.2 0.0 2.3 2.3 0.0 2.7 2.7
XEUR 3.1 4.3 7.5 3.0 4.1 7.1 2.3 4.4 6.7
IND 14.8 15.2 30.0 14.4 14.3 28.7 15.8 16.3 32.1
SUM 116.1 169.3 285.4 103.7 157.5 261.2 107.1 173.2 280.3
XEUR: Minor contributors < 1000 tonnes.
45
Table 6.4.2. Total (wet and dry) deposition D,.''·E of oxidized nitrogen to the Baltic Sea (kT N/yr). Model results from MSC-E. HELCOM member countries are marked with an asterisk (*). +) Including contributions from Ukraine and Byelorussia.
1988 1989
BE 2.7 2.3 cs 8.0 6.7 DK* 7.3 6.5 FI* 5.4 4.1 FR 7.9 8.2 DD* 9.7 8.8 DE* 33.9 28.9 NL 6.3 5.6 NO 3.2 3.3 PL* 16.4 13.0
..·SE* 11.9 10.9 SU* 8.0 + 5.1 GB 21.9 24.3 BAS 2.1 1.7 NOS 1.1 1.2 XEUR 10.3 4.5 IND 7.0 6.9
SUM 163.1 146.6
XEUR: Minor contributors < 1000 tonnes.
The model calculations show that the main contribution of about 60 % comes from the Baltic Sea Countries, probably because of their proximity. Other prominent contributors are Great Britain France .and the Netherlands, whi.ch are all upwind of the predominant westerly winds in the Balti~ and which are also among the maJor European emitters. Czechoslovakia is another major contributor.
Th.e .depos~tions to the various sub-basins of the Baltic Sea have been estimated by MSC-E but for oxidized mtrogen only. The results are given in Table 6.4.3.
Th~ variations among the annual depositions may be a consequence both of varying emissions and of Interannual meteorological variability.
4 413399X

46
Table 6.4.3. Total (wet and dry) deposition nt·E of oxidized nitrogen to the sub-basins of the Baltic Sea (kT N/yr). Model results from MSC-E.
Sub-basin 1988 1989
A, Gulf of Bothnia 28.0 23.7
A, Gulf of Finland 13.0 13.6 A, Baltic Proper, North 55.5 49.9
A4 Baltic Proper, South 45.8 40.2 A, Belt Sea and Kattegat 20.8 19.2
A0 Baltic Sea Total 163.1 146.6
6.5. Assessment of the Nitrogen Deposition
The wet deposition estimates D x and Dw" and the total dry and wet deposition D./' of nitw_gen compounds to the Baltic Sea are; in 1988-1990 are sum~arized in Table 6.5.1. The dry deposi!lons have been taken from the experimental values of FMI given m Table 6.3.1.
"' bl 6 5 1 Annual depositions of nitrogen to the Baltic Sea (kT N/yr). ,a e ...
1988 1989 1990
Depos.type Red.N Ox.N Tot-N Red.N Ox.N Tot-N Red.N Ox.N Tot-N
Dry: D, X ') 60 60 60
Wet: Dwx 168 164 331 160 136 296 183 166 349
Wet: Dwn 171 167 338 174 152 325 184 165 349
Total: D.,M-w 116 169 285 104 158 261 107 173 280
I D M·E Tota: T • 163 147
*) Valid for 1980-1986
It is remarkable that the wet depositions of nitrogen estimated by both the experimental and ~e hybrid methods are larger than the total dry and wet deposition calculated by the EME~-models: T I~ discrepancy is enhanced if the experimental dry depositions are _also mcluded. A previous ~e~s10n o
1 the MSC-W-model (Iversen et al., 1989) gave the somewhat higher esl!mate of 315 kT or tota nitrogen deposition in 1988.
The discrepancy may be a direct effect of the use of coastal concentration data ~or esti;nating wet de ositions over the sea. This method which is used in both types of w~t depOSillon estn~ates may acftially yield overestimations because no account is taken of precipitatwn scavengmg pnor to the actual deposition.
<? -de -;-{.
',•'··.·····~·
47
A closer look at Table 6.5.1 shows that the main discrepancy between model results and the deposition estimates based on extrapolation of measurements is found for the depositions of reduced nitrogen. For this component the model results DT M-w are only 60 % of the Dwx and Dw" estimates. For oxidized nitrogen, on the other hand the three types of estimates agree quite well within about 5 % although D./' also includes the dry deposition.
For ammonia, NH,, it should be recalled that most measurements are placed in rural surroundings to minimize the influence from local industrial activity. The sources of ammonia are, however, predominantly ground-level agricultural areas and the sites may therefore often be located in surroundings with significant emissions. The measurements can thus lead to an overestimation for the larger region. In addition ammonia is efficiently dry and wet deposited and so a very steep gradient in ammonia concentrations develops in coastal areas.
It is, therefore, questionable to extrapolate land-based measurements of reduced nitrogen concentrations and give them extended representativity over the sea. For these reasons the extrapolation estimates D,: and Dw" are likely overestimations.
The reliability of model res)Jlts is in general dependent on the quality of the input data. The better the model -·the higher the requirement for good and reliable data. It is difficult to give an overall range of uncertainty for the results, but since the uncertainty of the input data over sea areas is larger than for land, the same must be true for the model results. In addition, the present models tend to overestimate depositions in Central Europe relative to measured depositions and to underestimate them in the fringe areas such as Scandinavia.
As for the calculations of reduced nitrogen it should be recalled that the main part of the emission data for ammonia is based on unofficial estimates that have not been updated since 1985. lt should also be noted on one hand that the model underestimates the ammonium concentration in precipitation for some sites in the Baltic region (Iversen et.al., 1989) even though the bulk of the measurement sites compare well with the model concentrations. On the other hand the MSC-W-model does calculate the coastal ammonia concentration gradient.
With these comments and reservations on the various methods of estimation the nitrogen deposition to the Baltic Sea may be assessed as follows:
The experimental and hybrid values Dwx and Dw" probably overestimate the wet deposition of reduced nitrogen.
The model value DTM-w probably underestimates the same quantity.
For oxidized nitrogen the deposition estimates D: and D,}' are probably overestimates whereas the model estimate n.t that includes dry deposition is considered fairly realistic.
A reasonable estimate for the total deposition of nitrogen to the Baltic Sea in the latter half of the 1980's thus seems to be
300 000 ± 30 000 Tonnes N/yr
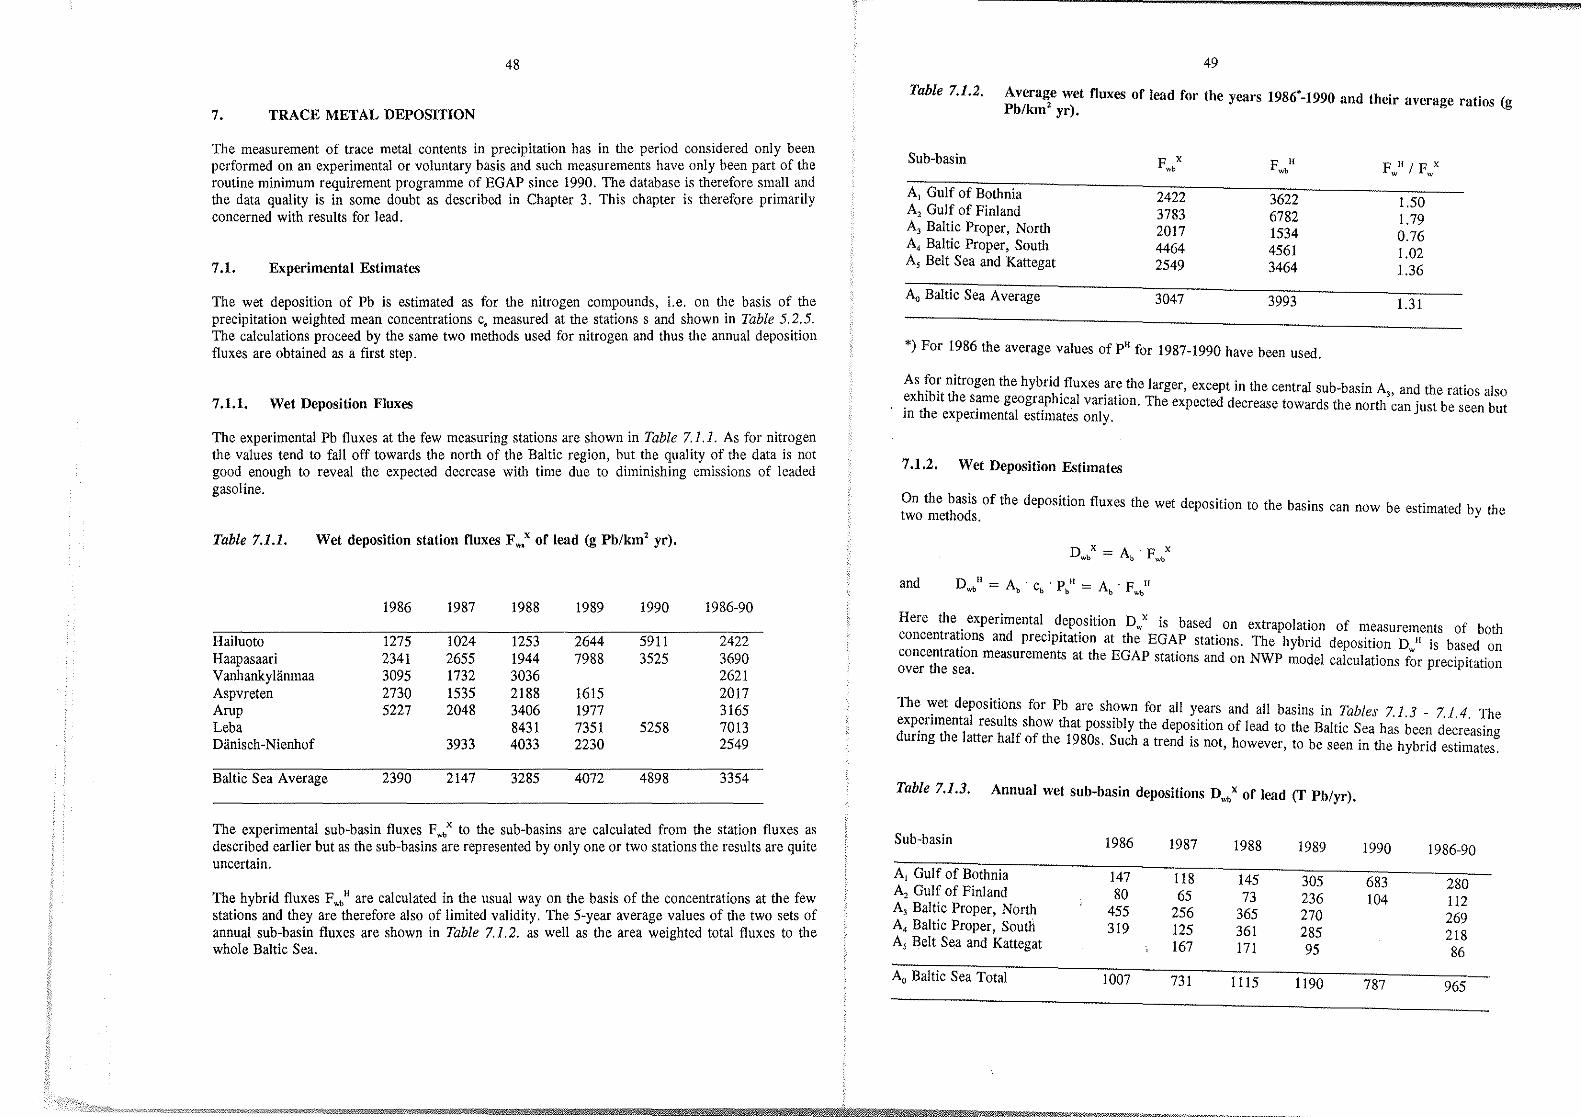
48
7. TRACE METAL DEPOSITION
The measurement of trace metal contents in precipitation has in the period considered only been performed on an experimental or voluntary basis and such measurements have only been part of the routine minimum requirement programme of EGAP since 1990. The database is therefore small and the data quality is in some doubt as described in Chapter 3. This chapter is therefore primarily concerned with results for lead.
7 .1. Experimental Estimates
The wet deposition of Pb is estimated as for the nitrogen compounds, i.e. on the basis of the precipitation weighted mean concentrations c, measured at the stations sand shown in Table 5.2.5. The calculations proceed by the same two methods used for nitrogen and thus the annual deposition fluxes are obtained as a first step.
7.1.1. Wet Deposition Fluxes
The experimental Pb fluxes at the few measuring stations are shown in Table 7.1.1. As for nitrogen the values tend to fall off towards the north of the Baltic region, but the quality of the data is not good enough to reveal the expected decrease with time due to diminishing emissions of leaded gasoline.
Table 7.1.1. Wet deposition station fluxes F~x of lead (g Pb/km' yr).
Hailuoto Haapasaari Vanhankyliinmaa Aspvreten Arup Leba Danisch-Nienhof
Baltic Sea Average
1986
1275 2341 3095 2730 5227
2390
1987
1024 2655 1732 1535 2048
3933
2147
1988
1253 1944 3036 2188 3406 8431 4033
3285
1989
2644 7988
1615 1977 7351 2230
4072
1990
5911 3525
5258
4898
1986-90
2422 3690 2621 2017 3165 7013 2549
3354
The experimental sub-basin fluxes F wbx to the sub-basins are calculated from the station fluxes as described earlier but as the sub-basins are represented by only one or two stations the results are quite uncertain.
The hybrid fluxes F w: are calculated in the usual way on the basis of the concentrations at the few stations and they are therefore also of limited validity. The 5-year average values of the two sets of annual sub-basin fluxes are shown in Table 7.1.2. as well as the area weighted total fluxes to the whole Baltic Sea.
49
Table 7.1.2. Avera~e wet fluxes of lead for the years 1986'-1990 and their average ratios (g Pb/km yr).
Sub-basin F X F II FH/Fx wb wb w w
A, Gulf of Bothnia 2422 3622 1.50 A, Gulf of Finland 3783 6782 1.79 A, Baltic Proper, North 2017 1534 0.76 A, Baltic Proper, South 4464 4561 1.02 A, Belt Sea and Kattegat 2549 3464 1.36
A0 Baltic Sea Average 3047 3993 1.31
*)For 1986 the average values of P11 for 1987-1990 have been used.
As ~o~ nitrogen the hybrid. fluxes ~r~ the larger, except in the central sub-basin A,, and the ratios also ~xh1b1t the s~me geogr~ph1c~l vanatwn. The expected decrease towards the north can just be seen but m the expenmental esumates only.
7.1.2. Wet Deposition Estimates
On the basis of the deposition fluxes the wet deposition to the basins can now be estimated b th two methods. Y e
Dx-A.Fx wb - b wb
and D 11 =A ·c ·P 11 =A ·F 11 wb bbb bwb
Here the. experimental . dep?sition Dwx is based on extrapolation of measurements of both concentrat~ons and prec1p1tatwn at the EGAP stations. The hybrid deposition D 11 is based on concentratwn measurements at the EGAP stations and on NWP model calculations f;r precipitation over the sea.
The ~et depositions for Pb are sh?wn for all years and all basins in Tables 7.1. 3 _ 7.1. 4. The exp~nmental results show that poss1bly the deposition of lead to the Baltic Sea has been decreasing durmg the latter half of the 1980s. Such a trend is not, however, to be seen in the hybrid estimates.
Table 7.1.3. Annual wet sub-basin depositions Dwb x of lead (I' Pb/yr).
Sub-basin 1986 1987 1988 1989
A, Gulf of Bothnia 147 118 145 305 A, Gulf of Finland 80 65 73 236 A, Baltic Proper, North 455 256 365 270 A, Baltic Proper, South 319 125 361 285 A, Belt Sea and Kattegat 167 171 95
Ao Baltic Sea Total 1007 731 1115 1190
1990 1986-90
683 280 104 112
269 218 86
787 965

50
Table 7.1.4. Annual wet sub-basin depositions Dw•" of lead (f Pb/yr).
Sub-basin 1986' 1987 1988 1989 1990 1986'-90
A, Gulf of Bothnia 190 137 211 381 1226 429 A, Gulf of Finland 116 75 107 486 232 203 A, Baltic Proper, North 389 248 344 323 261 A, Baltic Proper, South 311 124 294 324 324 275 A, Belt Sea and Kattegat 169 158 115 146 117
A0 Baltic Sea Total 1005 747 1114 1630 1929 1285
*)For 1986 the average values of P" for 1987-1990 have been used.
The discrepancies between the annual values of these two sets of deposition estimates are considerable, emphasizing the questionable quality of the data.
The average sub-basin depositions Dwx and Dw" for the 5 years 1986-1990 are shown in Table 7.1.5.
Table 7.1.5. Average depositions of lead for the years 1986'-1990 and their average ratios (f Pb/yr).
Sub-basin DwbX D II wb
D"!Dx w w
A, Gulf of Bothnia 280 429 1.53 A, Gulf of Finland 112 203 1.82 A, Baltic Proper, North 269 261 0.97 A, Baltic Proper, South 218 275 1.26 A, Belt Sea and Kattegat 86 117 1.35
A0 Baltic Sea Total 965 1285 1.33
*)For 1986 the average values for 1987-1990 have been used.
The ratios vary geographically as seen before and it is therefore presumably an effect of the methods used to estimate precipitation over the sea. But the ratios are considerably larger than for nitrogen, reflecting the uncertainty of the results and possibly also bias introduced by representing the subbasins with only one or two stations.
51
7.1.3. Total Deposition Estimates
Estimates of the type Dx have been calculated for total deposition of a number of trace metals in 1985-1987 by Schneider (1988). The method differed slightly from the ones used above and dry deposition was accounted for either by using bulk deposition data when available or by assuming that dry deposition amounts to 25 % of the total. This latter approximation is very crude. The deposition over the sea was approximated by multiplication of depositions at the stations with model derived extrapolation factors. The same method has been applied to newer data so the results are valid for the years 1986-1989. Both sets of results are shown below in Table 7.1.6. The differences are considerable, the largest ones are found in the Baltic Proper South and they may reflect the uncertainties introduced by these approximations.
Table 7.1.6. Annual total deposition D/ of atmospheric trace metals to the Baltic Sea (T/yr). (Calculations by Schneider 1988, and personal communication).
Pb Cd Zn Cu Sub-basin 1987 1986- 1985- 1986- 1985- 1986- 1985-
89 87 89 87 89 87
A, Gulf of Bothnia 183 270 II 14 1652 2660 508 A, Gulf of Finland 80 101 9 9 315 286 245 A, Baltic Proper, North 427 560 19 27 1361 1295 175 A, Baltic Proper, South 148 416 7 17 607 1058 62 A, Belt Sea and Kattegat 189 255 10 10 806 598 215
A0 Baltic Sea Total 1027 1600 57 77 4741 5900 1205
A comparison with Tables 7.1.3.-7.1.5 shows that the total deposition derived from bulk measurements leads to considerably higher values in the two wide sub-basins, Baltic Proper North and South.

52
7.2. Model Estimates for Lead Deposition
Model calculations of trace element depositions have been carried out by the German research institute GKSS (Petersen et al., 1989). The model is a trajectory model with a similar structure as that of MSC-W. However no physical or chemical transformation is assumed. The calculations have been restricted to lead for the period 1980-1985 because emission databases in the EMEP-grid for other metals is still in a very preliminary stage. Emission data have been set up for lead in a R & D project of the German Environmental Agency carried out by Dornier with support of the EMEP Chemical Coordinating Center.
Annual means of atmospheric lead concentrations and dry, wet, and local deposition fluxes for the year 1985 are shown in Figures 7.2.1 - 7.2.4. Because of the predominantly low emission heights (automobiles) it has been assumed that 15 % of the emitted lead is deposited in the local emission grid square. The result is that the total deposition of lead to the Baltic Sea is close to 1400 t Pb/year.
The monthly total, wet, dry, and local deposition of lead to the Baltic Sea during 1985 is shown in Figure 7.2.5. The monthly variation of the total lead input is mainly due to the variation of precipitation because wet deposition is the dominant pathway.
The annual deposition of lead to the Baltic Sea due to emissions in 1984-1985 from different European countries is shown in Table 7.2.1. About 70 % of the input is caused by the riparian countries around the Baltic Sea, the rest is due to long range atmospheric transport from other areas in Europe.
Model results have been checked with the available data for lead concentrations in precipitation from the representative EGAP-monitoring stations for the five sub-basins. The stations have been implemented into the model as arrival points for trajectories so that a direct comparison between measured and calculated data could be performed.
However, at present the time series of measured precipitation and monthly mean bulk concentrations can be compared on a limited basis only due to gaps in the data from the monitoring stations. An example is shown in Figure 7.2.6. The overall agreement in terms of mean annual concentrations is reasonable but it seems that at most stations the model is unable to predict the concentration peaks. There is a tendency to increased model underpredictions from south to north i.e. from areas relative close to the sources to remote locations.
Measurement data on lead concentrations in air and dry deposition fluxes are not available from stations reporting to HELCOM in 1985, so that those two model output parameters could not be verified for that year. Measured and calculated air concentrations at Kiel Bight for 1982, however, showed a good agreement even on a weekly mean basis (Petersen et al., 1989).
53
Figure 7.2.1. Concentrations of lead in air 1985.
r- --·----"- --:
29 .
BALllC SEA 14,hg/rn3
' ·-\
\\
'~\;~/ 9
--< +'-- ' s 11 13 16 '--+ '
\)5 18 • '

54 55
Figure 7.2.2. Dry deposition of lead in 1985. Figure 7.2.3. Wet deposition of lead in 1985.
. .......... ~- -I
' i :" I ············.... / i
2.7SE/ mg/t 12
/,sz VY(j(;
·-~~ I
~J/ 5 ··.. lc
·····... . (; ·.. ~

56
Figure 7.2.4. Local deposition of lead in 1985.
/ i
4.6
·,. t \. +······· + • 'tw\ o.o o.o
··< ;·.. + +
NORTH SEA
BALTlC SEA
291 VY
164,Vy
/// ···················// ... ·
. .......__,......_
······•··············•··· .. ~ ' .
e~_:/'/~ ~ ....
57
Figure 7.2.5. Monthly total, wet and dry deposition of lead to the Baltic Sea in 1985.
300
200
100
deposition of leod
! If month I
dry deposition wet deposition locol deposftion total depos1tion
1388 tly (100%) me on: 1ZS t I month
.r - 863 t/y l 62'%) meow. 7211 month
361t!y 126%) meon: 30 1/ month 16St/y 112%1 mean· 1~ t.Lmonth_
JAN FEB MAR APR MAY JUN JUL AUG SEP OCT NOV DEC
Table 7.2.1. Contributions of European countries to the lead deposition in the Baltic Sea in 1984-1985 (f Pb/yr) • HELCOM member countries are marked with an asterisk (*).
T Pb/yr
BE 44 DK* 57 FI* 104 FR 96 DD* 101 DE* 205 NL 82 NO 14 PL* 118 SE* 139 SU* 221 GB 130 Others . 76
SUM 1387

58
Figure 7.2.6. Monthly precipitation amounts and concentrations of lead in bulk deposition. Aspvreten 1985.
precipitation [mm]
Aspvreten 1985
100~-.--.--,--r-.--.--.--r--r-.--.--,
901--f--~~-+--~4-H~--~4--+--~
z ro a: a: >- z _J (') a. f- > 0 <{ w <{ a. <{ :::> :::> :::> w 0 0 w --, u.. :::: <{ :::: --, --,
<{ (f) 0 z 0
concentration in precipitation [ f!9 1'1]
30
20
A
II\ 25
J 1\ " v \ I
I
A
" ' ' ~~ / I
I \ r ~ I ' ' II
15
10
5 v -
0
Ill s1ation 460 mm a -1
lillJ model 541 mm a -1
station bulk 9.2 ~g 1·1
model bulk 5.9 ~g 1·1
59
7.3 Assessment of Lead Deposition
The estimates of annual lead deposition to the Baltic Sea as extrapolations of measurements and as model calculations by GKSS are summarized in Table 7.3.1. The variation of up to 60 % among these results is considerable. Tbe reasons for that are on one hand that the quality of the measurement data is not good enough and that in some cases quite crude approximations have been used to extrapolate measurement results out over the sea and on the other hand that the emission inventories used for model calculations are in need of improvement. Thus, the emission inventory used must be considered obsolete since it probably contains lead emission figures from the early 1980s when the use of leaded gasoline was still widespread. More consistent deposition estimates obviously require additional refinements in extrapolation techniques for measurement data and model parameterizations.
The comparison of model results and measured concentrations in bulk deposition has shown that the model tends to underestimate this parameter and hence total deposition. On the other hand the extrapolation method used to derive sub-basin dry and wet deposition fluxes from precipitation concentrations at individual stations may very well overestimate the total deposition D/.
Table 7.3.1. Annual depo$ition of lead to the Baltic Sea.
Period Type Ref. t/yr
1986-1990 Dwx, wet This work 965
1986-1990 D n wet w, This work 1285
1986-1989 D./, total Schneider, 1988 1600
1987 D.,X, total Schneider, 1988 1030
1985 DTM• total Petersen et al., 1989 1390
With these comments and reservations on the various methods of estimation the lead deposition to the Baltic Sea may be assessed as follows:
The experimental and hybrid values for wet depositions, D"x and Dwn• are very uncertain.
The experimental values for total deposition, D.,X, are probably overestimates.
The model value for total deposition, DT M is probably an underestimate.
A reasonable estimate for the total deposition of lead to tbe Baltic Sea in the latter half of the 1980's thus seems to be
1300 ± 250 Tonnes Pb/yr

60
REFERENCES
Buijsman, E., Maas, J.F.M. and Asman, W.A.H., 1985. Ammonia emissions in Europe. lnstituut voor Meteorologie en Oceanografie, Rijksuniversiteit Utrecht. Report IMOU-R-85-2.
Buijsman, E., Maas, J.F.M. and Asman, W.A.H., 1987. Anthropogenic NH, emissions in Europe. Atmos. Environ. 21, 1009-1022.
Climatological Ice Atlas, 1982. Swedish Meteorological and Hydrological Institute, Norrkiiping, and Institute of Marine Research, Helsinki. 220 pp.
Eliassen, A. and Saltbones, J., 1983. Modelling of Long-Range Transport of Sulphur over Europe: A Two-Year Model Run and Some Model Experiments. Atmospheric Environment 17, 1457-1473.
HELCOM, 1986. Water balance of the Baltic Sea. Bait. Sea Environ. Proc. No. 16: 1-174.
HELCOM, 1987. First Baltic Sea Pollution Load Compilation. Bait. Sea Environ. Proc. No. 20.
HELCOM, 1989. Deposition of Airborne Pollutants to the Baltic Sea Area 1983-1985 and 1986. Bait. Sea Environ. Proc. No. 32.
HELCOM, 1991. Intercomparison of precipitation collectors for chemical analyses, HELCOM intercalibration- 2nd stage, Aspvreten, Sweden; Winter 1987- Autumn 1988. (manuscript)
Iversen, T., Saltbones, J., Sanders, H., Eliassen, A. and Hov, CJ., 1989. Airborne Transboundary Transport of Sulphur and Nitrogen over Europe: Model Descriptions and Calculations. EMEP-MSC-W Report 2/89.
Iversen, T., Halvorsen, N.E., Saltbones, J. and Sandnes, H., 1990. Calculated Budgets for Airborne Sulphur and Nitrogen in Europe. EMEP/MSC-W. Report 2/90.
Joffre, S.M., 1985. The structure of the marine atmospheric boundary layer: a review from the point of view of diffusivity, transport and deposition processes. Techn. Report No. 29, Finnish Meteorol. Inst., Helsinki, 119 pp.
Kullenberg, G., 1981. Physical oceanography. In: Voipio. A (ed.). The Baltic Sea. Elsevier Oceanographic Series 30. Elsevier Scientific Publishing Company, Amsterdam. pp. 133-181.
Lindfors, V., Joffre, S.M. and Damski, J., 1991. Determination of the wet and dry deposition of sulphur and nitrogen compounds over the Baltic Sea using actual meteorological data. Finnish Meteorological Contributions No. 4. Finnish Meteorological Institute.
National Swedish Environmental Protection Board, 1989. Atmospheric Trace Metals. Workshop on their Collection and Analysis. SNV Report 3597.
Pacyna, J.M., 1983. Trace element emission from anthropogenic sources in Europe. Norwegian Institute for Air Research, Report No. 10/92.
61
Petersen, G., Weber, H. and Grassl, H., 1989. Modelling the Atmospheric Transport of Trace Metals from Europe to the North Sea and the Baltic Sea. In: J.M. Pacyna and B. Ottar (eds) Control a.nd Fat~ of Atmospheric Trace Metals. NATO AS! Series. Series C: Mathematicai and Physical Sciences - Vol 268, pp. 57-83. Kluwer Academic Publishers.
Ross, H.B., 1989. Report on the Intercalibration of Analytical Methods for the Determination of Tra~e Metals, ~Itr.ate and Ammoniu~ i~ the Atm.os~here within the Framework of the Baltic Manne. CommiSSIOn of the Helsmki CommiSSIOn. National Swedish Environmental Protection Board. Report No. 3597, pp. 61-76.
Salmi, T. and Joffre •. S.~., 1988. Airborne pollutant measurements over the Baltic Sea: Meteorological Interpretation. Reports 1988: 3. Finnish Meteorol. Jnst., Helsinki, pp. 55.
Schaug, J., 1988. Quality Assurance Plan for EMEP. EMEP CCC Report 1/88.
Schneider, B., 1988. Input of Atmospheric Trace Metals to the Baltic Sea Area _ An Estimate Based on the EGAP (HELCOM) Monitoring Data. (mimeogr.)
Semb, A. and Amble, E., 1981: Emission of Nitrogen Oxides from Fossil Fuel Combustion in Europe. NILU Techmcal Report 13/80. Lillestriim. Norway.
Voipio, A., e~., !981. The Baltic Sea. Elsevier Oceanographic Series 30. Elsevier Scientific Pubhshmg Company, Amsterdam.
b 413399X

:[:1{~\<~iWflti@%~%&~11· ------------------------------------~------------------------------------
62 63
AIRBORNE POLLUTION LOAD TO THE BALTIC SEA 1986-1990
APPENDICES
A. Precipitation in the Baltic Sea Area 1987 - 1990 Data from the MSC-W archives
B. Distribution of Deposition of Oxidized and Reduced Nitrogen to the Baltic Sea in 1988 Based on MSC-W model calculations
C. Nitrogen Compounds: Results on Concentrations, Fluxes, and Depositions

64 65
APPENDIX A:
Precipitation in the Baltic Sea Area 1987 - 1990 Data from the MSC-W archives
In the assessment of the deposition of air pollutants to the Baltic Sea, it is of great importance to get a reliable picture of the precipitation amount and also the spatial and temporal variation.
A large fraction of the deposition load follows the wet-deposition route to the sea surface and to a first approximation, the deposition load will be proportional to the precipitation amount.
There are very few measurement stations with long records of observations over the open sea. In addition, it is very difficult to get reliable and representative measurements in wind-exposed conditions. Research programmes aimed at reducing the uncertainty in precipitation measurements over sea areas, should be given high priority. Remote sensing techniques, such as use of radar and micro-wave observations from satellites, and observations from oil rigs may in future give more -reliable estimates and with lower uncertainty.
The best estimates that can be given at the moment, are based on a combined procedure using routine weather observations (SYNOPS) from measurement sites at islands and nearby land areas, together with model calculations for the more open sea regions. At the Meteorological Synthesizing CentreWest of EMEP, this procedure is used to construct the precipitations fields used in the EMEP/MSCW model calculations for transboundary fluxes of suiphur and nitrogen compounds in Europe.
The precipitation fields are represented by grid squares, ISO x 150 km', and the values should give a representative value for that area. If a grid square is dominated by land-areas, the value for the precipitation amount is taken from the field constructed on the basis of the routine weather observations (SYNOPS). If, on the other hand, the grid square covers mostly sea areas, the value for the precipitation amount is taken from the field constructed by the LAMI50 (Limited Area Model, 150 km grid resolution) numerical weather prediction model.
LAMI50 is a numerical weather prediction model, run in routine mode at the Norwegian Meteorological -Institute. The data produced by this model, form the basis for the archive of meteorological data used/stored by the MSC-W of EMEP.
From these archived 6 hourly precipitation fields, monthly and yearly precipitation fields have been constructed for the period 1987-1990. For the 4 years, the procedure of producing these fields has been unchanged and the data produced are uniform with no gaps or discontinuities.
Figure A.l shows an example of the result of the accumulation of such precipitation fields, covering the year 1988.

66
Figure A.l. Model estimates for the distribution of precipitation in 1988. Units: em.
67
A.l. Yearly Precipitation Amount in 5 Sub-Regions of the Baltic
The sub-regions are denoted as Area 1, 2, 3, 4, 5. Area-weighted mean yearly values for each subregion, (), have been calculated from the yearly precipitation maps. The assess the interannual variability, the differences found between these four yearly values, have also been calculated, c,, as well as the relative difference,L'>/(} The results are given in Table A.l.
Table A.l.
Area 1
Area 2
Area 3
Area 4
Area 5
Total Baltic Sea Area
Precipitation Amount in the Baltic Sea Period: 1987-1990
Mean Difference Relative Difference
0 c, L'>/C) [mm] [mm] %
635 73 12
729 108 15
523 118 23
679 116 17
747 201 27
615 106 17
Area 1988-values Size
[10' km2] [mm]
-115.15 623
- 29.5 706
-166.8 559
- 61 665
- 42.4 758
415.3 623
68
A.2. Annual Variation in Monthly Precipitation
To assess the variation in precipitation amount over the year, one grid square in each of the 5 subregions has been taken out to exemplify the conditions in that region, and monthly values have been calculated for the period.
Comments and conclusions
From Table A.l. it is seen that -25% more precipitation is falling in the southern and western parts of the Baltic Sea (areas 4 and 5), than in the northern and central parts (areas 1 and 3).
The inter-annual variability is largest around Denmark (area 5, with 27%) and in the central part of the Baltic (area 3, with 23% ), see Table A.l.
Less precipitation is falling over the sea then over nearby land area, -15% less. Most pronounced is this effect in area 3, with about 2/3 of the precipitation in nearby land area.
From Table A.l. it may be seen that 1988 was a typical year concerning precipitation in the Baltic Sea area, and also in the sub-areas.
In general April-May are the months giving the smallest amount of precipitation, -30 mm/month. July-September is the wettest part of the year, -75 mm/month.
Some reservations: It is suspected that the LAM150 model gives slightly less precipitation than observed. It is difficult to verify this statement because reliable data representative for open sea areas are lacking. The area with minimum precipitation (A, - Central Baltic) is the area most influenced from the model calculations. The other areas are more strongly influenced by observations from surrounding land areas.
69
APPENDIX B:
Distribution of Deposition of Oxidized and Reduced Niti·ogen to the Baltic Sea in 1988 Based on MSC-W model calculations

20 20
181 3 5 18
17 18 23
TOTAL DEP. OF OXIDIZED NITROGEN ! MG/M2 AS N l CONTRIBUTION FAOH - DENMARK - OK THE HHOLE rEAR - 1988, EHEP/HSC-H ACID HODEL
17 18 19 20 21 22 23
"' 35 I 36 ! lJ 0 1 8 28
271 :~LI- ! :-tt..t I W'-1 1~ 27
9 2S
2li 2Y
23 23
22 22
2; I 21
20
18 19
l8
17 18 19 20 21 22 23
TOTAL DEP. OF OXlD!ZED NITROGEN I MG/M2 AS N l COHTRIBUTlON FROH - FINLAND - FI THE WHOLE YEAR - 1988, EHEP/HSC-W ACID HODEL
20
18 1 s
11 18 19 20 21 22 23
TOTAL OEP. OF REDUCED NITROGEN r MG/M2 AS N l CONTRIBUTION fROM - DENMARK - OK THE WHOLE YEAR - !988, EHEP/MSC-H ACID HODEL
17 , l B 19 20 21 22 23
28 js2l6o\j 94 I lJ 128
27 173 ! 67 ll(LJpi I (\) 127
i
25 126
25 5 lzs
24 3 l2l!
23 2 23
22 22
21 Ai 21
20
1S 18
18 0 0
17 18 19 20 2l 22 23
TOTAL DEP. OF REDUCED NITROGEN ! HG/H2 AS N l CONTRIBUTION fROM - FINLAND - fl THE HHOLE rEAR - 1988, EHEP!MSC-H ACID HODEL
.... ~ ;:: ~ b:;
~
__,

22 23 17 18 19 20 21
28ll J '! llU~1U 1f' I 2 Ill 128
27 1 ):> I "\ I I I 1 1 I '\1.-4( ~ I lf} I" 261 I ~ t5 \ I 0 I 1 J I /)'A"~~" 251 11 1\ 9 'tJ ~ ~ .:lr I "" I 22 "
"' 1'± I 1 ~ i 1<> ~ I '~1(1 I ~I c.u I'" 23
"
211 2 6
20 1 1 1 120
19
191 5 1B
'' 18 19
1DTAL DEP. 6F OXIDIZED NITROGEN C HG/M2 RS N l CONTRIBUTION FROM - GERMAN DEMOCRATIC REP- DO THE WHOLE YEAR - !988, EMEP/HSC-W ACID HODEL
17 1B 19 20 2l 22 23
19 28
27 3\!) 27
26 26 26
I± I± 25
"
75 23
221 hLI I 'I/ I /S I 7? I RJ1 I S!k 11\l, 1 l22
201)01
tSI143
18llJ3 18
17 1B 19
TOTAL DEP. OF 6XIDI2ED »1TR6GEN C MG/H2 AS N l CONTRIBUTION FROM - GERMANT, fEDERAL REP.- DE THE WHDLE TEAR - 1988, EMEP/HSC-W ACID HODEL
17 1B 19 20 21 22 23
26 I 2 I 3 I 5 1 u \118={\ I 5 128
,I ~ I \ I 3 I 5 1\Q ~ 1 1t '"
,1 _,\.,\I " I 7 i k/1/\i.._ 1 4 '"
2J 1± If'>---~ I , , II, .< I a Ia l25
'"I 5 I ~ I c; ~ I ¥71\ I 1 1\1 9 124
,~sv 1 7 \r ~~*=8 r 22 .~1.~. I 1 ! :;.>:;>
20 56 {20
19
1BI 3 lj 18
17 18 19
16TRL DEP. DF REDUCED NITROGEN I HG/M2 AS N l CO»TR!BUTION FROM - GERMAN DEMOCRATIC REP- DD THE WHOLE !ERR - 1988, EMEP/MSC-W ACID MODEL
22 23
28
26
25
8 ''" R n ~~~" .. - ~.- ' ~ '- ' ' 22
20 20
lSI 10 \JLJ 1B
17 18 19 20 21
TOTAL OEP. 6F REDUCED NITROGEN C MG/M2 AS N I CONTRIBUTION FROM - GERMANI, FEDERAL REP.- DE THE HHBLE YEAR - 1988, EHEP/HSC-H AClD HeOEL
~ ;:: ~
!"' ;->
_, t0
~ ;:: ~
!"' ~
_, "'

~ @} O'Q ~ ;:: l! ~
n 1e ts 20 21 23 17 ts 1s 20 21 22 23 ~
281 14 I 7 l 1 ~ 28 281 6 I L! I 6 I 6 \j ~ 11 8 128 ~
271 R ! 1 L! I 1 9 z 5 ~27 271 ~ 1 i ~ i 6 i 1 1 I ~ LJ#5 I 1 {} 127
281 l.i i\<" ll l I I c'l I 'Jt./ I/ 'if.'--. i l!O 128 28 8
251 1 lj :0 1 25 25 111 ?"-I 1 ~ I Y:l II U Pl I '1 R I ~ 1 125
'"I 1 2 7 1 " " 7 I Q '--. I ? 1 1-,.% o; i ? Q \ I U? \I U U l2<
"18 8LJ 23
,~1 I I[ 16~~ I , ::ni I = .oo~_Lj" , ~~ ~n ! _.," I~ 1\,\, I~""" ~ " 31 n \ 7nJJ:n \,1
"" 20
18
101 LJ 18 "I 2 jll 1 ??Yr«'? r~:>1 1 :>n illl'hhs
17 18 17 18 jS 20 21 22 23
10TAL DEP. DF OX!DllED NITROGEN f MG/M2 AS N l TOTAL DEP. OF REDUCED NITROGEN f MG/M2 AS H I CONTfilBUTION FROM - POLAND - fL CONTRIBUTION FROM - POLAND - PL THE WHOLE rEAR - 1988, EMEP/MSC-H ACID HODEL lHE WHOLE YEAR - !988, EMEP/MSC-H RClD MBDEL
l7 18 19 20 21 " 23
2a1 23 I 17 I 18 1 5 128
27 I 1f1 12'
251 31_
241 33
;23
22 22
14 120
7 119
181 2 2 18
!7 18 l9 20 21
TOTAL DEP. OF OXlDIZED NITROGEN ! MG/M2 AS N l CONTAJBUT!ON FROM - SWEDEN - SE THE WHOLE YEAR - 1988, EHEf/MSC-H ACID M6DEL
28
27
26
22
21
20
!9
18
!7
TOTAL DEP. OF REDUCED NITROGEN I MG/M2 AS N l CONTRIBUTION FROH - SHEDEN - SE THE HHOLE TEAR - 1988, EMEP/MSC-H ACID HODEL
~ ~ ~
""
__, (A

0>
~
;;; w ~ ~ X
28
"
28
25
121.!
23
22
21
20
l9
IS
TOTAL DEP. OF OXIDIZED NITROGEN I HG/H2 AS N l CONTRIBUTJON FROM - USSR !EUROPERNl - SU THE HHBLE YEAR - !988, EHEF/MSC-H RCJD HODEL
22 23 17 18 19 " 21
I 3W \1 ;ru:~ I UQ I,. I ;>Q I 31 281 ?Q
ll§ '" 26128 ll27l I '1U I ?.o I ,{ ,; 1), 7 I "" I"
251 27 I\2N Th l UQ ifu ¢< I n c: I"" l,
241 26 I 2& I ?R we:; I /(:z{\ I II ?'11 Q() 1,.
23
:nJ ~u lf<n I 11n I ""'
I \,\-- I ~'>.. I>..
'" "137 1'11-7~J~L!5 i 5 1 I '!f2 l36Mll 1'1
20 I c:;;, II u, L 111l-.: 1 K,, ~ I ,(.., IllS j2o
19
181 2ll 127 ~~~\tb IIIQ 1~1,. 17 18 19 20 21 22 23
TOTAL DEP. OF OXIDllED NJTAOGEN ( HG/H2 AS N l lNATTRlBUTABLE CONTR!BUIJONS
l NO THE HHBLE YEAR - 1988, EHEP/HSC-H ACID MODEL
~ " ~
" " 23 ?" 17 18 19 20 ;-.>
I 97 \1~1 13ll6lze zel -~H I :-Hl I 57 -51 I Q" I /-R n I btfi -~ i U 'rl-1 127
\~ \ I 2BI2s~:;n\7, I Rt:; 11 DVI I.U2~ iS c.;;;.; 12s
-251 26 llR7'-.I U"- I 7?. IDLV'i IU 1/ IU /Y 12s
-241 23 I s~r'tUirlll ~~ r
" __, a-
"
21
J 11:; l? T I I/, n;:q:;; n ~J l r;-;-t
19
IS~ l 1 QY1 1'-A. 'iL R I " I h~hs
17 18
TOTAL DEP. OF REDUCED NITROGEN I HG/M2 AS N l CONTRlBUTJON FROM - USSR IEUROFERNI - su THE HHOLE YEAR - 1988, EMEF/MSC-H AClD HODEL
~ " ~ ?" Co
17 18 19 21 22 . I~ 28 26 27 35 28
128 I "u I "t~ !~J f blh (21
281 '- '-' l\'- 1 {i..JC::.. I .JO 1 \Ill 1/::xi.. I ::01-i I2G
"I 26 1\'-' t-.._C..U"-..1 .Jj ..-..V :Jj::: I::>::> 1 ::,:-1 125
'" 23
I lll! 23 23
__, 22
__, 22
21 29
"~ r· fl.:t" I ~1)'6-' I 71 i _jC, 120
19 65
18121 12ll IU~UJ. 1'-tl " i ,j .:::5 I ""'l1s 17 18 " 20 21 22 23
TOTAL DEP. OF REDUCED NITROGEN ( HG/M2 AS N J lNATTRIBUTABLE CONTRJBUTIONS - l NO THE HHOLE YEHR - 1988, EHEF/MSC-H RCJD HODEL

I
;7 lB 19 20 " 22 23
2G 28
23
22
18
i7 18 l9 20 2! 22 23
TOTAL DEP. DF OXIDIZED NITROGEN I HG/M2 AS N l GRANO TOTAL !ALL CON1RIBUTION5l - TOT THE .HHGLE YEAR - 1988, EHEF/HSC-H ACID HBDEL
l7 22 23
28 28
26 28
2S]jQlji 25
2Y I 99 "
23
22
21124 1
20
19
lB
l7 l8
10TBL DEP. OF REDUCED NlTRBGEN I MG/H2 AS N l GRANO TOTAL IALL CON1R!BUTION5l - TOT THE WHOLE YEAR - 1988, EHEF/HSC-W ACID HODEL
l7 20 21 .:·2 23
722128
8% (2' v
97 0 125
20
2~
t a
l1 l8 22 23
lOlAL DEPDSITWN OF NITROGEN I HG/H2 AS Nl
~ ;:: ;;; ~ :-<>
GRANO TOTAL !ALL CONTRI8U110N5l - TOT THE HHOLE YEAR - 1988, EHEF/HSC-H ACID HBDEL
~ c it 0
= (") 0
i; z ('!) --= ~ ........_ :: 0 ...... ~ ~ "1:1 e = ~ o M = (") z !!'o 0 "':! 3 --'C ~ ~ 0 ,.... ('!) = \J "' = - c.. ~ ~
= c.. 0 .g 0 C§>
;:;: --0
~
-.1 '-0
-.1 00
'{;ti'f! .!

,,,·.·:·:~;:t~0~t~~;~;j~14~~~~ ·O>~ ~~r~
80 81
C.l. Precipitation concentrations. Table C.1.2. Annual mean concentrations of' NH, in precipitation (mg N/1).
Table C.l.l. Annual mean concentrations of NO, in precipitation (mg Nil). Gulf of Bothnia 1986 1987 1988 1989 1990 1986~90
Gulf of Bothnia 1986 1987 1988 1989 1990 1986~90 Hailuoto 0.68 0.50 0.68 0.38 0.44 0.54
Hailuoto 0.42 0.41 0.65 0.44 0.43 0.47 Rahja 0.52 0.25 0.25 0.20 0.31
Rahja 0.34 0.30 0.28 0.32 0.31 Ricklea 0.36 0.40 0.39 0.49 0.29 0.38
Ricklea 0.33 0.44 0.45 0.39 0.33 0.38 Sulva 0.70 0.41 0.31 0.68 0.69 0.55
Sulva 0.70 0.44 0.32 0.32 0.49 0.45 Ylimarkku 0.89 1.02 0.71 0.92 0.96 0.89
Ylimarkku 0.50 0.57 0.52 0.52 0.45 0.51 Korppoo 0.73 0.52 0.83 0.65 0.44 0.63
Korppoo 0.55 0.50 0.67 0.63 0.47 0.56 Jomala 0.69 0.96 0.74 0.82 0.62 0.75
Jomala 0.56 0.87 0.74 0.64 0.60 0.67 Basin average: 0.66 0.59 0.63 0.61 0.55 0.61
Basin average: 0.49 0.51 0.57 0.47 0.47 0.50
Gulf of Finland 1986 1987 1988 1989 1990 1986-90
Gulf of Finland 1986 1987 1988 1989 1990 1986-90 Virolahti 0.80 0.71 0.51 0.66 0.45 0.62
Virolahti 0.60 0.59 0.49 0.47 0.44 0.52 Haapasaari 0.67 0.66 0.60 0.93 0.96 0.74
Haapasaari 0.73 0.39 0.63 0.84 0.74 0.64 'V anhankyliimnaa 0.88 0.65 0.73 0.75
Vanhankylanmaa 0.86 0.48 0.74 0.69 Sipoo 0.77 0.59 0.58 0.51 0.34 0.56
Sipoo 0.59 0.54 0.64 0.49 0.45 0.54 Lahemaa 0.22 0.60 0.35 0.59 0.26 0.46
Lahemaa 0.25 0.31 0.30 0.30 0.30 0.30 Tviirminne 0.59 0.77 0.56 0.72 0.43 0.60
Tviirminne 0.64 0.58 0.76 0.70 0.56 0.64 Basin average: 0.74 0.67 0.56 0.65 0.45 0.62
Basin average: 0.67 0.50 0.60 0.53 0.49 0.56
Baltic Proper, North 1986 1987 1988 1989 1990 1986-90
Baltic Proper, North 1986 1987 1988 1989 1990 1986-90 Utii 0.63 0.46 0.67 0.81 0.60 0.64
Utii 1.27 0.63 0.90 0.72 0.72 0.86 Aspvreten 0.43 0.34 0.49 0.62 0.37 0.44
Aspvreten 0.49 0.42 0.52 0.61 0.44 0.49 Syrve 0.46 0.57 0.60 0.60 0.47 0.54
Syrve 0.45 0.63 0.56 0.85 0.75 0.66 Hoburg 0.87 0.79 1.49 1.21 1.84 1.28
Hoburg 0.79 0.73 0.85 1.11 0.77 0.84 Rucava 0.55 0.39 0.31 0.65 0.37 0.45
Rucava 0.68 0.51 0.51 0.61 0.61 0.59 Basin average: 0.57 0.49 0.64 0.74 0.66 0.62
Basin average: 0.73 0.57 0.64 0.76 0.67 0.67
Baltic Proper, South 1986 1987 1988 1989 1990 1986-90
Baltic Proper, South 1986 1987 1988 1989 1990 1986-90 Nida 0.65 0.56 1.01 0.66 0.68
Nida 0.59 0.97 1.04 0.72 0.77 Arup 0.69 0.50 0.68 0.87 0.80 0.70
Arup 0.69 0.53 0.63 0.78 0.66 0.65 Leba 0.90 0.49 0.73 0.59 0.67
Leba 0.73 0.71 0.50 0.47 0.60 Kap Arkona 0.89 1.01 0.97 0.90 0.84 0.92
Kap Arkona 0.83 1.62 0.83 0.76 0.68 0.95 Basin average: 0.75 0.76 0.72 0.83 0.72 0.75
Basin average: 0.72 0.92 0.73 0.68 0.63 0.73
Belt Sea and Kattegat 1986 1987 1988 1989 1990 1986-90
Belt Sea and Kattegat 1986 1987 1988 1989 1990 1986-90 Riirvik 0,.82 0.63 0.71 0.68 0.64 0.69
Riirvik 0.85 0.58 0.80 0.79 0.63 0.72 Vavihill 0.85 0.62 0.65 1.14 1.16 0.87
Vavihill 0.70 0.53 0.65 0.83 0.71 0.68 Keldsnor 0.88 1.07 0.95 0.88 1.18 1.00
Keldsnor 0.71 0.81 0.87 0.68 0.63 0.74 Kiel Bight 1.64 1.64
Kiel Bight 1.54 1.54 Danisch-Nienhof 0.57 0.93 1.01 0.70
Danisch-Nienhof 0.65 0.82 0.86 0.65 Basin average: 0.84 0.67 0.79 0.95 0.96 0.84
Basin average: 0.76 0.62 0.77 0.80 0.66 0.72

82 83
C.2. Deposition Fluxes Table C.2.2. Annual wet deposition fluxes F"x of NH, (kg N/(km2 yr)).
Table C.2.1. Annual wet deposition fluxes Fw' of NO, (kg N/(km' yr)).
Gulf of Bothnia 1986 1987 1988 1989 1990 1986 90 Gulf of Bothnia 1986 1987 1988 1989 1990 1986-90
Hailuoto 207 214 278 222 163 217 Hai1uoto 335 261 291 192 166 249
Rahja 167 140 153 103 141 Rahja 256 117 137 65 143
Rickie~ 193 183 197 207 181 192 Rickie~ 210 166 171 261 159 193
Sulva 376 231 194 157 274 246 Sulva 376 215 188 334 385 300
Ylimarkku 308 284 337 304 252 297 Y1imarkku 549 508 461 538 538 519
Korppoo 424 377 455 335 353 389 Korppoo 563 392 564 346 330 439
Jomala 409 475 514 392 563 471 Jomala 504 524 514 503 581 525
Basin average: 298 272 329 253 270 284 Basin average: 399 312 365 330 318 345
Gulf of Finland 1986 1987 1988 1989 1990 1986-90 Gulf of Finland 1986 1987 1988 1989 1990 1986-90
Virolahti 397 382 355 334 304 354 Virolahti 529 460 369 469 311 428
Haapasaari 321 230 259 298 262 274 · Haapasaari 295 389 247 330 340 320
Vanhankylanmaa 489 283 410 394 V anhanky Hi run a a 501 383 404 429
Sipoo 457 316 409 329 341 370 Sipoo 597 345 371 343 257 383
Lahemaa 127 126 184 140 144 Lahemaa 245 147 362 122 219
Tvarminne 423 423 459 388 488 436 Tvarminne 390 562 338 399 375 413
Basin average: 417 293 336 307 307 332 Basin average: 462 397 313 381 281 367
Baltic Proper, North 1986 1987 1988 1989 1990 1986-90 Baltic Proper, North 1986 1987 1988 1989 1990 1986-90
Utii 750 300 453 383 446 466 Uto 372 219 337 431 372 346
Aspvreten 300 216 308 232 224 256 Aspvreten 263 175 291 236 188 231
Syrve 241 305 432 707 421 Syrve 246 276 463 443 357
Hoburg 343 271 350 392 405 352 Hoburg 377 294 614 427 968 536
Rucava 578 332 388 563 465 Rucava 467 254 236 342 325
Basin average: 442 285 386 336 469 384 Basin average: 345 244 388 365 463 361
Baltic Proper, South 1986 1987 1988 1989 1990 1986-90 Baltic Proper, South 1986 1987 1988 1989 1990 1986-90
Nida 187 234 177 537 284 Nida 206 135 172 492 251
Arup 480 367 624 456 515 488 Arup 480 346 673 509 624 526
Leba 460 456 256 345 379 Leba 568 315 374 433 422
Kap Arkona 461 891 456 377 366 510 Kap Arkona 494 555 533 446 453 496
Basin average: 376 488 428 363 441 419 Basin average: 394 401 423 443 500 432
Belt Sea and Kattegat 1986 1987 1988 1989 1990 1986-90 Belt Sea and Kattegat 1986 1987 1988 1989 1990 1986-90
Riirvik 562 426 666 466 537 532 Riirvik '542 463 591 402 546 509
Vavihill 521 454 593 635 587 558 Vavihill 633 531 593 872 959 718
Keldsnor 317 312 441 270 327 333 Keldsnor 392 412 481 350 612 449
Kiel Bight 582 582 Kiel Bight 620 620
Danisch-Nienhof 465 675 468 536 Danisch-Nienhof 408 765 549 574
Basin average: 495 414 594 460 484 489 Basin average: 547 453 608 543 705 571


86 87
SUPPLEMENT
PRECIPITATION AND AIR CHEMISTRY AT HELCOM STATIONS FOR THE PERIOD 1986-1990
Monthly Statistics

88 89
PRECIPITATION AND AIR CHEMISTRY AT HElCOM STATIONS FOR THE PERIOD 1986-1990
1 INTRODUCTION
This report presents data reported to HELCOM during the period
1986-1990. The data are presented as measured (monthly values)
and as annual mean values from each station.
2 THE DATA
Data on precipitation andjor air quality are reported from 25
sites in 1986, from 27 sites in 1987 and from 25 sites in 1988,
1989 and 1990. Two of the Finnish sites (Hailuoto and
Virolahti) have reported two sets of data, one from a bulk and
one from a wet-only sampler.
The location of the measuring sites during this period are
shown in Figure 1.
Most of the reported data are on macroconstituents in preci-
pitation. Data
ported from
on heavy metals in precipitation are few and re
only 6-7 sites every year. Data on sulphur andjor
nitrogen compounds in gases and aerosols are reported from 12
sites in 1986 and 1987, 13 sites in 1988, 11 sites in 1989 and
10 sites in 1990. The data coverage for each component, station
and year are presented in tables in the Data Annexes.
The quality assurance for the reported data with respect to
data checking and storage of HELCOM/EGAP analytical data at
NILU, are based ~n the Quality Assurance Plan for EMEP (EMEP/
CCC-Report 1/88), and a short summary is given in Annex 1.

90
3 MEAN VALUES
The arithmetic annual mean values of gases and components in
aerosols and the precipitation weighted arithmetic annual mean
concentrations together with the measured monthly values are
presented in Annex 2-6 for 1986-90 respectively. The data are
presented in tables covering one station and year showing the
following components:
mm N03 N NH4N so4 s-c Na Mg Pb Cd cu Zn Cl S02S A-S04S N02N T-N03N T-NH4N
- precipitation amount - nitrate - ammonium - sulphate, sea salt corr. - sodium - magnesium - lead - cadmium - copper - zinc - chloride - sulphur dioxide - sulphate - nitrogen dioxide - sum of nitric acid and nitrate
sum of ammonia and ammonium
(mm) (mg N/1) (mg N/1) (mg S/1) (mg/ l) (mg/ l) (~g/1) (~g/1) (~g/1) (~g/1) (mg 1 l) (~gjm3) (~gjm3) (~gjm3) (~g Njm3) (~g Njm3)
The sulphate in precipitation is stored in the data base as re
ported i.e. total sulphate, and as corrected sulphate, i.e.
total sulphate minus sulphate originating from sea salt
particles. The concentration of sulphate from sea salt for one
particular month has been estimated either by using sodium, the
magnesium or the chloride concentration in that order of
preferance:
[804-- - Sc o r r l = [804-- - St o t a 1 l Fak * [X]
when X = Na+ Fak = 0.0837 (Sverdrup et al. , 1942)
" X = Mg++ II = 0.695
" X = Cl- II = 0.0466
A 1 Gulf of Bothnia A 2 Gulf of Finland A3 Baltic Proper North A4 Baltic Proper South A 5 Belt Sea and Kattegat
91
Figure 1: Location' of stations h' the;period 1986-90. w J..ch reported to HELCOM during

4 REFERENCES
Chemical Co-ordinating Assurance Plan for EMEP. 1/88).
92
Centre (1988) J. Lillestrom, NILU
Schaug. Quality (EMEP/CCC-Report
Sverdrup, H.U., Johnson, M.W., Fleming, R.H. (1942) The Oceans, their Physics, Chemistry and General Biology. New York, Prentice Hall.
93
ANNEX 1
Quality assurance protocol HELCOM/EGAP data.
A short description.
7 413399X

:x~'¥Jt?t~\~~,;rul_'l"llllllllllllllll!!!!lll!!!!lll!i!!lll!i!!lll!!!!lll _____ ...,..,.. ____________________ _
94
QuALITY ASSURANCE PROTOCOL HELCOM/EGAP DATA
A short description
The quality assurance protocol used by NILU, for
of HELCOM/EGAP analytical data is based on
Assurance Plan for EMEP (EMEP, CCC-Report 1/88).
data checking
the Quality
A short summary of the quality assurance protocol is given
below.
DATA HANDLING
The data handling includes data reporting, data control and
data management.
Data reporting to NILU
The data reporting forms shall according to paragraph 2 in the
agreement, be described by NILU. The filled-in data forms used
by EGAP/HELCOM so far, can also be used in the future, but the
participants should be encouraged to report their data on
MS-DOS discettes. The required format will be given by NILU.
The full monthly data set shall be delivered to NILU not later
than the first of April each year.
Quality control of the data
The quality control suggested below shall be carried out at the
laboratory producing the data before the data are sent to NILU,
95
as well as at NILU when receiving the data. Any data which may
be in error shall result in a new analysis of the sample when
possible.
At NILU the data shall be checked after keypunching the data in
the forms, or after having read the discette from the partici
pant. Any data which may be questionable shall be returned to
the participant without delay in order to have them compared
with the journals and reanalysed if necessary and possible.
statistical tests
The statistical tests compare new measurements with data
already stored in the database. The tests are carried out in
order to identify possible outliers and results which may be
wrong. They can be based upon assumptions about the data dis
tributions i.e. a lognormal distribution, or they can be based
on comparisons with cumulative frequency distributions.
Gaseous, aerosol or precipitation
with all earlier data for each
lognormal distributions. The data
data from different seasons or into
components may be compared
component making use of
should then be split into
winter and summer data.
Data outside three or four times the standard deviations should
be inspected manually by comparison with other components, and
concentrations at neighbouring stations.
The distributions of the different types of data may deviate
from a theoretical lognormal
particularily notable in the
distribution. The
low concentration
concentrations less than
deviation may be
part of the dis
the detection tribution where all
limit will have to be set equal to a small value. since the
tests are used only to identify measurements which should be
inspected more closely, minor deviations from a theoretical
distribution function can be accepted.

(}W(}fo---------------------~~"-
96
Ion balance computation
If the precipitation programme includes measurements of all the
main components in the precipitation, the sum of positive and
negative ion concentrations expressed in microequivalents pr.
litre shall then be zero. Alternatively, the ratio between the
anion and cation concentrations expressed in microequivalents
pr. litre shall be close to one.
The effect of minor components
acids, which are not included in
negligible in "acid precipitation".
e.g. phosphates and organic
the analysis, is usually
Assuming equilibrium between carbon dioxide in air and carbonic
acid in precipitation, the bicarbonate concentration is
negligable when the pH is below 5 and will only contribute 5
~e/1 at pH=6. Bicarbonate iones dissociate into carbonate ions,
but this is negligible below pH=8 (at 25°c, EPA, 1985). How
ever, precipitation samples sometimes seem to be supersaturated
with carbon dioxide and will then contain more bicarbonate than
expected.
During storage, soil dust, organic material etc. may be dis
solved, or biological processes may occur under unfavorable
conditions. Deviations in the ionic sum from zero may indicate
this.
The ionic balance check should be carried out as soon as
possible, while the chemical analysis can still be repeated. If
a complete chemical analysis is performed, the ionic balance
test is equally useful for aerosol samples.
Conductivity computations
The conductivity of the precipitation samples should be
measured, and compared with values calculated from the measured
concentrations by adding the equivalent ionic conductivities.
97
The conductivity measurements should be carried out at defined temperature i.e. 25oc.
a well
It should be noted, however, that at low pH values (pH ~ 4.0)
the conductivity of the solution will be dominated by the
hydrogen ions. Errors in the concentrations of other ionic species will then not be easily detected.
The test should therefore be used together with the ionic balance test.
Other methods for data check
Graphical plots and ratios between components which have a
simple relationship, for instance sea salt components, should be utilized.
Rejection of data
No data should be rejected automatically by use of computer
programmes alone, manual inspection should be carried out before this step is taken.
Data carrying other types of information, as for instance
contamination by insects, careless handling of samples etc.,
should only be accepted in the data base when the effect of the contamination is considered to be negligible.

W!fb;1;'!flf;'!li, ;'!;'!,' ____________ ............... ._ ............... ...., .... ---------------
98 99
ANNEX 2
Annual statistics on HELCOM/EGAP data 1986

,,,,,,.!!, _______ ..................................................... -------------------
"' z : : ' : ' : ' : ' : ' ' ' ' '
1!:: X z ' ' : ' : ' ' ' : ' :
' ' ' ' ' ' ' I-
"' <)'
0: 0 ' ' : ' : : : ' ' ' ' ' ' ' ' ' 4: z " N 0
0 ' ' : ~ ' ~ ' ' ' ' ' ' ' ' ' ' ' ' ' {f)
N N N
0 ' ' : ~ ' ~ : ' ' ' : ' ' ' ' ' '
{f)
0 "' 00 "' 0 0 0 0
' ~ : ~ ~ : ~ ~ ~ ~ 0 '
"' l() 1'--~ : ' ' ' ' ' ' : c ' ' ' ' ' '
N
=> ' ' : ' : ' : : ' ' : ' ' ' ' ' '
0 N l() 00
·o ~ : ' : ' ' ' ' ' ' ' ' ' ' ' ()
"' lO 1'--.D. ~ ' ' ' : : ' : ' ' ' ' ' '
(L z N ()) l() N (]) ~ 00 C)) (]) C)) "' QE ,- ~ ~
!;(,~
!:: "' C)) ()) C)) m C)) co
' : ' ' : ~z ' ' '
[rl~ N 0 l() N 0 N co 0 0 0 0)
0: 0 ~ ~ ~ ~ ~ ~ ~ ~
(L {f)
<)' N 0 lO "' ~ N "' 0 6 Ol 0
I ~ ~ ~ ~ ~ ~ ~ ~
z (") N ~ l() N ~ N 00 0 0 0) "' 0 ~ ~ ~ ~ ~ ~ ~
z N N l() "' N N 00 N "' N N
E ~ ~ ~ ~ ~ ~ ~ ~ ~
E
' 2 2 2 0 2 0 2 2 2 2 2 ' CD CD 5: CD CD CD 5: CD CD CD aJ
~ N N (") (") "' l() (!) 1'-- 00 m ~ ~ ,- ~ ~ ~ ~ ~ ~ ~ ~ .
(!) <0 0) ~ :;: w CJ 2 [1 z
:5 (( w w ?,; z ::)
> 0 0 i= i= :;: >:::
8 z
z 1-- I- I I
~ 2 :5 >:::
<( 0 0 :5 :5 <( 0: <( :c ::) ::) 0: <( ...., <(
. ..J -" 0 0 Q l!( 2 1-- z :;: 2 I <( <( 4: 4: 0: 0: 1- ~ 0 [1 :::; 0 > I :c > > ::) :c ...., >--
u .. u_ IL u_ IL IL IL IL IL IL IL {f) U) (f) U) (f) {f) {f) (f) {f) {f) {f)
100
--··------ ---~ ~ "'
<)' ~) "' l() ~
' : : : ~ : ~ ~ : : ' ~ ' ' ______________ , _______
.-- ..-N o;;;tl.()>q"l.()
' : ' : ~ ' ,- ·-·· : : ' : ' ' ' '
Q) N N "' ()) r• 0 co : ' ' ' ' ~ ~ ~ ~ ~ : ' :
' ' ' ' '
"' 0) ()) 0) <)' lO " l() ~ ~
' ' ' : ~ : ~ : ~ ' ' '
N N N N 0 N 0 00 "' ~
' : ' ' ~ ' ~ ~ ~' ~ ~ ~ ~ ' ~ ' ' ' ' '
0 0 0 "' N "' ~ ' N N ~ N ~ ~ ~ ~ ~ ~ ~ ~ ~ ' ' ' : ~ ~ ~ ' ' '
N ~ " ' : ' ~ ~ ' : ' : ' ' ' : ' ' ' ' ' ' ' ' ' ' '
: ' ' ' : ' : ' : ' ' ' : : ' : ' ' ' ' ' ' ' ' '
N r-
' : ' ~ r- ' : : : ' ' : : : ' : ' ' ' ' ' '
N ~ " : ' : ~ ~ ' ' : ' : ' ' ' ' ' ' ' ' ' ' ' ' ' '
0 ()) C)) N N ~ ~ ~ N N ~ ~ ~ ,- ~
, .. ~ ' : ' : ~ ' ' ' ' ' ' ---
0 m C)) N N .- ~ r- N 0 ~ N "' N ~ ~ ~ ~ ~ ~ ~ ~ .- ~ ~ ' : '
0 0 0 N N "' ~ ~ N 0 ~ N 00 N ~ N ~ ~ ~ ,- r· ,- ~ ~ ,- ~ ~ ~ r·· ~ , ..
0 0 0 N N N ' ~ N 0 ~ N "' "' "' N ~ ~ ~ ~ ~ ~ ~ ~ ~ ~ ~ ~
~ ~
0 0 0 "' "' N ~ ~ N 0 ~ N "' N r- "' ~ ~ ~ ~ ~ ,- ~ ~ ~ ~ ~ ~ ~ ~ ,-
N N N N N N r- ~ "' 0 ~ "' "' "' ~ "' ~ ~-, .. ~ ~ ~ , .. ~ ~ ~ ~ ~ ~ ~ ~
::> 2 2 2 2 2 0 0 0 0 0 0 0 ~ ~ 0 CD CD CD 3• 5: CD 5: 5: 5: CD CD aJ CD 5: 0 c;; "' o; N (") " l() (!)
"" N (") "' rc; ;:::: «)
N '" (") "" (') (") (") " " "' ----
<( z z I- 0: 0 ILl 0
luU] ~ :;: :c 0 0 _j
>::: (j >::: CJ z
0 <( (L
o:_j =' 0: w 2 0: ro {f)
::; (L (L [r><: :c 6: ::) 6: {f) UJ <( 0
~ 0: - CD <( I- _j ::) ;;;: I (L _j
::) 0 0: {f)Q Q 0 0 >- ::) :5 ;'2 w w (jj {f) >::: <( <( 0: > 0: I z {f) a: ;;z ><:
IL IL IL w U.J lJ.J w UJ LLI ::) ::) ::) ::) 0 w ><: U) {f) U) {f) {f) {f) {f) (f) U) {f) {f) {f) U) 0 0 0
-
M ~OI zz + + (')
OM z:c IZ 11 II X >, zz I-I-
101
Country : FINLAND Station : VANI-WKYIJ>IIoi'A Satjller type : BU.K Year : 1986 Satj>ling period: f'ONTrt.Y
rrm 003N NH4N S04S-C Na
JAN 29.0 1.00 .67 3.69 FEB 12.0 1.51 .55 2.93 fAA 24.0 1.07 .99 3.85 APR 44.0 .74 1.67 2.91 W!Y 35.0 1.43 2.45 5.09 J[J; 10.0 .52 .28 1.55 Jll 44.0 .41 .25 1.61 ALJ3 108.0 .26 .56 .94 SEP 72.0 .47 .26 1.65 OCT 69.0 1.16 1.41 3.13 NOV 69.0 1.06 1.07 2.27 DEC 53.0 1.77 .47 1.48
YEAA 569.0 .86 .88 2.28
Pb Cd
.30 5.90 .15
.25 5.60 .13
.21 6.40 .25
.13 4.60 .18
.30 8.30 .36
.22 .50 .16
.13 2.00 .09
.08 1.50 .04
.65 1.60 .12
.24 8.20 .62
.18 10.80 .60
.32 9.80 .78
.25 5.44 .31
Cu Zn
- 17.00 - 23.00
14.00 15.00 31.00 16.00 13.00 10.00 27.00 23.00 19.00 60.00
- 22.29
Country : FINLAND Station : K'\ILLOTO Satj>ler type : BU.K Year : 1986 Satj>ling period : f'ONTrt.Y
rrm 003N NH4N S04S-C Na Pb Cd Cu Zn
JAN 8.1 .60 FEB 3.0 .50 .50 1.82 2.20 .40 fAA U.8 I.80 3.50 6.~ 1.~ .W APR 20.1 W!Y 53.9 .50 1.70 2.30 JUN 25.1 .01 .70 .97 .30 .10 a 44.4 .m -~ 1.~ .sc .w AU3 I20.9 .10 .20 .47 .30 .04 SEP 40.3 .10 .10 .27 .30 .ffi OCT 56.8 .50 .50 .86 .50 .05 D 80.8 .50 -~ .77 -~ .ffi DEC 16.2 2.20 2.20 3.58 I.40 .20
YEAA 492.4 .42 .68 1.29 .48 .08
Country : FINLAND Station : K'\ILLOTO Year : 1986
Satj>ler type : WET ONLY Satj>ling period : f'ONTrt.Y
rrm 003N NH4N S04S-G
JAN FEB fAA APR MAY J[J; Jll ALJ3 121.0 SEP 40.0 OCT 57.0 NOV 80.0 DEC 16.0
-· .12 <.01 .47 .13 .IO -~ .30 .24 .59 .33 .15 .49 .53 .08 .46
YEAA 314.0 .23 .16 .48
Na Pb Cd
.05 <.50 .ffi
.03 uo <.01
.02 2.40 .23
.02 3.50 .29
.06 2.40 .13
.ffi 2.59 .15
Cu Zn
11.00 31.00 62.00 50.00 20.00
- 33.20
Cl SC2S A-S04S NC2N T -003N T -NH4N
Cl SC2S A-S04S N02N T-003N T-NH4N
3.80 .80
.70
.60 1.00
.40
.30
.60
.50 2.40
.65
Cl SC2S A-S04S N02N T-003N T-NH4N

·.:yce;qg~!l!~c~~'············----------""'----------------------
Country : FINLAND Station : VIROLAHTI Year : I986
11111 tmN NH4N S04S-C Na
102
S3l1Jl er twe : BUJ(
S3l1Jling period : DAILY
Pb Cd Cu Zn Cl S02S A-S04S NC2N T-tmN T-NH4N
--------------------------------------------------------------------------------------------------------------------1.10 13.00 3.00 .70 11.00 3.00 .60 6.00 4.00
<.10 3.00 2.00
JAN 78.3 FEB 9.0 fWl 39.7 APR 54.I W\Y 34.2 J~ 13.8 JLI_ 40.5 AIJ3 74.6 SEP 94.2 OCT 72.0 NOV 64.6
.80 .60 !.63
.50 .10 .53
.80 .80 !.08
.70 1.50 2.53
.90 !.90 3.03
.40 .50 .83
.20 .40 .63
.50 1.00 2.43
.20 .30 .73
.70 .90 !.63
.80 1.00 2.66
.60 .40 .73
.10
.10
.60
.10
.10
.10
.10
.10
.10
.10
.20
.10
<.10 3.00 1.00 <.10 2.00 1.00 <.10 2.00 1.00
.10 2.00 !.00
.10 2.00 1.00
.70 3.00 1.00 1.40 2.00 1.00
.90 10.00 2.00 DEC 65.9 --------------------------------------------------------------------------------------------------------------------.70 4.92 1.75 YEAA 660.9 .60 .80 !.68 =------
Country : FINLAND Station : VIROLAHTI Year : 1986
11111 tmN NH4N S04S-C
.14
Na
S3l1Jl er t we : BLI_K
S3l1Jling period : MONTHLY
Pb Cd Cu Zn Cl S02S A-S04S N02N T-tmN T-NH4N
--------------------------------------------------------------------------------------------------------------------.70 67.9 1.00 .40 2.07 .40 .20
65.0 .10 .50 28.0 1.60 1.80 3.53 .80 .30 53.3 33.9 .90 !.50 3.00 10.6 .01 .10 2.19 2.50 .30 34.8 .10 .40 .97 .40 .10 •. 2 .w .60 1.~ .~ .10 68.5 .20 .06 .64 .70 .10 80.6 .70 .80 2.24 3.10 1.00 96.0 1.00 1.40 2.62 .90 .20
1.30
.50
.50
.50 !.30
!.50 4.00
JAN FEB fWl APR I'AY Jll'l JLI_
AIJ3 SEP OCT NOV DEC 66.7 .70 .60 1.47 1.50 .40
------------------------------------------------------------------------------------------------------------YEAA 719.5 .59 .72 1.92 !.11 .31~=========1=.3=6==========
Country : FINLAND Station : UTO Year : 1986
11111 tmN NH4N S04S-c
---------------------------------59.1 1.50 2.2 3.10
28.0 1.80 57.9 .70 51.3 1.20 21.5 .30 31.0 .80 99.7 2.90 70.9 .30 56.8 .60 66.9 .90 45.1 1.50
1.30 1.56 1.20 3.90 1.40 2.56
.80 1.66
.80 1.83
.90 .67
.80 1.64
.30 .93
.20 .52
.40 .93
.60 1.16
.50 2.38
Na
S3l1Jler twe : BLI_K
S3l1Jling period: DAILY
Pb Cd Cu Zn Cl S02S A-S04S N02N T-N03N T-NH4N
-----------------------------------------------------------------------------------.20
.20
.20
.10
.90
.80
.10
.40
.10
.20
.60
5.30 7.00 2.00 7.80 9.00 2.00 4.40 4.00 3.00
.30 4.00 1.00
.10 2.00 1.00
.10 3.00 1.00 1.20 3.00 1.00
.20 2.00
.70 2.00 .90 2.40 3.00 1.00 1.50 3.60 2.00 1.00 1.50 8.80 7.00 2.00 1.50
JAN FEB fWl APR I'AY Jll'l JlJ_
AIJ3 SEP OCT NOV occ --------------------------------------------------------------------------------------------------------------------
- 2.30 4.00 1.50 1.35 YEAA 590.4 1.27 .63 1.35 .28
Country : FINLAND Station : HAAPASAARI Yea1' : 1986
11111 N03N NH4N S04S-C
JAN FEB fWl 24.0 .77 .64 1.72 APR MAY 35.0 1.44 2.56 4.76 J~ 10.0 .46 .33 6.06 JlJ_
AIJ3 108.0 .22 .32 .76 SEP 72.0 .23 .14 .45 CCT 69.0 .65 .75 1.33 NCV 69.0 .47 .35 1.14 DEC 53.0 2.45 1.25 4.64
YEAA 440.0 .73 .67 1.82
Country : FINLAND Station : TVARMINNE Year : 1986
11111 tmN NH4N S04S-C
Na
Na
JAN 70.3 1.20 1.10 1.62 .90 FEB 4.2 fWl 28.7 1.40 1.20 2.43 .80 APR 35.1 MAY 47.1 .90 1.10 2.60 JUN 20.1 .40 .90 1.82 .90 JlJ_ 62.7 .40 .30 1.37 .40 AIJ3 109.5 .30 .60 1.23 .80 SEP 83.8 .20 .02 .68 1.40 OCT 50.7 .70 .40 1.39 1.30 NOV 90.7 .70 .50 .91 1.10 DEC 58.1 .90 .60 1.07 2.60
103
S3l1Jler twe : I.I'T OOLY S3l1Jl i ng period : MONTI-l Y
Pb Cd
.11 7.10 1.34
.20 9.90 .29
.35 .50
.06 4.10 .03
.07 5.70 .03
.10 4.30 .36
.09 2.90 .18 1.09 7.90 .76
.22 5.32 .30
Cu Zn
45.00
24.00
11.00 7.00 4.00
10.00 41.00
- 15.70
S3l1Jler twe : BLI_K
S3l1Jl ing period : MONTIH
.10
.10
.20
.10
.10
.20
.20
.10
.40
Pb Cd Cu Zn
YEAA 661.0 .64 .59 1.34 1.15 .16
Country : FINLAND Station : J:WILA Year : 1986
11111 tmN NH4N S04S-C
JAN 66.5 .40 1.00 1.23 FEB 4.3 fWl 50.1 1.50 2.40 2.91 APR 54.3 MAY 37.7 .70 1.10 2.00 JUN 18.2 .50 .70 2.07 JlJ_ 81.2 .20 .20 .83 AIJ3 143.7 .20 .20 .67 SEP . 78.6 .30 .20 .52 OCT 45.3 .80 .80 1.23 NOV 71.3 1.00 .90 1.33 DEC 79.5 .80 .80 1.05
Na
.80
1.10
.30
.80
.30 1.00
.80
.80 1.80
.10
.20
.10
.10
.04
.10
.10
.10
.20
YEAA 730.7 .56 .69 1.16 .85 .11
S3l1Jler twe : BLI_K
Sampling period : MONTHLY
Pb Cd Cu Zn
Cl 5015 A-S04S N02N T-N03N T-NH4N
Cl S02S A-S04S NC2N T-N03N T-NH4N
1.30
1.30
.50 1.60 .40
1.20 2.50 2.10 1.80 4.00
1.69
Cl S02S A-S04S NC2N T-N03N T-NH4N
1.50
1.70
.40
.50 1.20 1.30 1.70 1.30 1.40 2.00
1.41

Country : FINLAND Statioo : RAHJA Year : 1986
mn 003N NH4N S04S-C Na
104
Sall>ler type : BUK Sal\>1 ing period : I'OOTH..Y
Pb Cd Cu Zn C1 SC2S A-S04S NC2N T-N03N T-NH4N --------------------------------------------------------------------------------------------------------------------
JAN FEB W>R APR I'AY JW JLL AIJ3 SEP OCT NOV DEC
17.2 2.8
25.0 31.6 53.0 6.8
78.1 98.8 58.4 44.7 58.1 17.7
.50 .30 .45
1.30 1.50 2.84
.30 1.40 .10
.90 1.41
.30
.10
.10
.40
.40 1.00
.30 1.44
.20 .64 .47
.30
.30 .B5 .36
.90 1.69
.60
1.90
1.10 .70 .70 .40 .60 .50
1.30
.10
.30
.30
.10
.10
.20
.30
.03
.10 -------------
1.00
2.30
.30 1.70
.90
.80
.80 1.00
.50 2.00
-------------------------------------------------------------------------------------------------------YEAA 492.2 .34
Country : FINLAND Station : YLIMARKKU Year : 1986
.52 .93
mn 003N NH4N S04S-C
.72 .14
Na
.89
Sal\>1er type : BLLK Sall>1ing period : I'OOTH..Y
Pb Cd Cu Zn Cl S02S A-S04S N02N T -003N T -NH4N ------------------------------------------------------------------------------------------------------------
JAN FEB W>R APR I'AY JUN JUL AIJ3 SEP OCT NOV DEC
29.1 B.D
44.2 39.1 34.2 6.1
52.1 76.6 93.6 65.8
114.2 53.6
.60 .70 .78
1. 20 1.50 1.96
.90 1.60 2.60 .40
.30
.30
.20
.60
.50
1.10 .50
1.95 1.08
.70 .96
.90 1.35
.50 .67 1.60 1.76
.20
.50
.60
.20
.50
.60
.40
.50
.10
.10
.10
.04
.05
.10
.04
.10
.30
.90
.50 2.00 1.00
.20
.60 1.00
--------------
.60 1.60 ------------------------------------------------------------------------------------------------------
YEAA 616.6 .50
Country : F I NLANO Station : SIPOC Year : 1986
mn N03N
.89 1.30 .44 .07
NH4N S04S-C Na
.74
Sarp1er type : BLLK Sa11>1ing period : I'OOTH..Y
Pb Cd Cu Zn Cl S02S A-S04S N02N T-NC3N T-NH4N
------------------------------------------------------------------------------------------------------------JAN FEB W>R APR I'AY JUN JUL AlG SEP OCT NOV DEC
76.7 6.5
28.1 41.2 40.0 31.2 82.3
140.7 74.9 87.7
108.2 57.6
.80 .70 1. 57
1.60 1.90 3.05
.90
.20
.30
.20
.20
.70 1.00
.70
1.70 3.00 .10 .10 .20 .10
1.30 1.80
.50
1.87 .87 .87 .76
1.35 2.22 1.02
.40 2.10
.60
.30
.30
.30
.50
.60
.90
.90
.10
.20
.10
.20
.10
.10
.10
.20
.10
.10
----------------------------------------------YEAA 775.1 .59 .77 1.45 .54 .12
------------------------------
.70
1.10
.80
.50
.30
.40
.90 1.00 1.60 1.30
---------------.85
-------------------------
105
Sal\>1er type : BUK Country : FINLAND Statioo : SLLVA Year : 1986 Sal\lling period : I'OOTH..Y
mn 003N NH4N S04S-( Na
JAN 31.9 .90 .80 1.07 .40 .10 FEB 5.2 W>R 16.8 5.00 4.20 3.13 3.20 1.90 APR 35.1 I'AY 28.5 .60 J~ 29.2 .01 JLL 69.7 .20 AIJ3 73.5 .20 SEP 82.6 .10
.80 1.70
.20 2.37
.80 1.17
.40 .87
.04 .45
.30
.40
.30
.60
.30
.10
.10
.10 OCT 47.1 .50 .20 1.34 .70 .60 NOV 67.0 .60 .40 .65 .60 .10 DEC 40.7 1.70 1.40 2.47 2.80 .70
YEAA 537.3 .70 .70 1.26 .84 .32
Pb Cd Cu Zn C1 502S A-S04S N02N T-N03N T-NH4N
.60
7.20
.40
.60
.50
.30
.90 1.50 1.00 6.00
1.52
Country : FINLAND Statioo : KORPPOC Sal\>1er type : BLLK Year : 1986 Sal\>1 ing period : 1'0011-L Y
mn 003N NH4N S04S-c Na Pb
JAN 86.9 .80 .70 1.17 .40 .10 FEB 4.8 W>R 41.1 1.10 1.70 2.37 .40 .10 APR 63.2 I'AY 42.5 .90 1.60 2.70 D ~.8 .01 .W 1.~ 1.~ .W JUL 47.1 .30 .80 1.22 1.00 .20 AIJ3 145.7 .20 .20 .87 .30 .04 & 82.4 .so 1.60 .80 1.~ .~
OCT 62.1 .80 .60 1.25 .60 .10 NOV 106.9 .80 .80 1.25 .60 .06 DEC 72.7 .50 .30 .50 1.20 .10
YEM 771.2 .55 .73 1.19 .68 .10
Cd Cu Zn C1 502S A-S04S NC2N T-N03N T-NH4N
.60
.70
.70 1.70 1.80
.30 2.00 1.00 1.10 1.20
.98
Country : SI.£0CN Statioo : Mll' Year : 1986
Sal\>1er type : 1.£1 ONLY Sal\>1 i ng peri ad : I'OOTH.. Y
mn 003N NH4N S04S-C Na Pb Cd
JAN 53.0 .47 .33 .60 1.22 .15 6.84 .11 FEB 11.0 .80 .16 .98 .64 .14 4.65 .22 W>R 70.0 1.02 1.31 1.72 .44 .07 14.80 .22 APR 52.0 .99 1.10 2.10 .39 .09 17.60 .19 I'AY 55.0 .90 .89 1.72 ' .23 J~ 30.0 .64 .82. 1.73 .10 JUL 72.0 .59 .57 1.25 .15 AIJ3 .51.0 .56 .57 1.34 .29 SEP 59.0 .44 .62 .94 1.06 OCT 89.0 .62 .56 .95 .54
.06 12.20
.05 6.79
.03 4.75
.05 ;6.18
.13 2.00
.07 3.99
.18
.12
.05
.09
.07
.13 o m.o .m .~ .ro .60 .08 4.~ .M ~ m.o .68 .m .84 2.12 .TI 6.60 .D
YEM 696.0 .69 .69 1.22 .76 .11 7.51 .14
Cu Zn C1 502S A-S04S N02N T-NC3N T-NH4N
16.30 1.72 40.70 1.29 30.00 .98 23.70 .81 31.00 .47 21.70 .27 7.50 .38
15.00 .62 8.20 2.10
11.30 1.18 11.00 1.40 12.00 4.71
- 16.62 1.45

Country : SWEDEN Station : ASPVRETEN Year : 1986
Na
106
SaJvler t)lle : WETOOLY SaJvl ing pericxl : f!JNHLY
Pb Cd Cu Zn Cl SC2S A-S04S N02N T-003N T-NH4N mn 003N NH4N S04S-C --------------------------------------------------------------------------------------------------------------------
.86
.79
.74
.37
.70
.35
.37
.14
.20 1.03
.73
.48 1.23
.51 1.15
.86 1.58
.37 .93
.74 1.19
.57 1.26
.42 1.17
.05 .41
.09 .41
.69 1.44
.45 .84
.53
.27
.39
.06
.14
.03
.06
.13
.32
.65
.36
.40
.07 6.99
.06 6.80
.06 6.13
.02 5.55
.03 6.36
.04 6.99
.02
.02 3.01
.04 .83
.10 3.86
.05 5.46
.06 2.23
.16
.18
.13
.07
.09
.07
.04
.03
.19
.17
.12
19.60 25.30 14.30 6.20
11.30 - 11.30
4.40 5.50
21.00 12.30 7.70
.98 3.35 1.05
.47 3.61 .92
.70 2.67 2.07
.19 .92 .70
.30 2.04 1.97
.16 2.36 2.18
.17 .71 .76
.28 .42 .59
.65 .28 .20 1.27 1.83 1.13
.74 1.07 .61
.86 2.18 .92
1.24 1.09
.73
.63
.59
.31
.27
.79 1.87
.60
.46 1.19
.43
.62
.39
.29
.27
.11
.18
.39
1.06 .89
2.94 1.11 1.30
.99
.94
.78
.39
.71
.92
JAN FEB M'R APR W\Y J~
Jl.l AIJ3 SEP OCT NOV DEC
26.0 17.0 34.0 58.0 62.0 43.0 72.0 67.0 47.0 24.0 59.0
103.0 .46 .3B .BB --------------------------------------------------------------------------------------------------------------------
- 10.27 .52 1.79 1.09 .84 .45 1.09 YEM 612.0 .49 .43 .97 .25 .04 4.46 .10
Country : SWEDEN Station : RICKLEA Year : 1986
SaJvler t)lle : Bl.lK SaJvling pericxl: f!JNTflY
mn 003N NH4N S04S-C Na Pb Cd Cu Zn Cl SC2S A-S04S N02N T-003N T-NH4N
--------------------------------------------------------------------------------------------------------------------JAN 41.0 FEB 3.0 M'R 60.0 APR 26.0 W\Y 52.0 J~ 11.0 Jl.l 49.0 AIJ3 136.0 SEP 77.0 OCT 73.0 NOV 34.0
.37 1.08
.11 .82
. 76 1.32
.90 1.34
.53 1.02
.39 1.26
.24 1.29
.34 .92
.05 .36
.32 .89
.23 .59
.11
.24
.13
.13
.08
.19
.16
.42
.38
.25
.80
.03
.04
.07
.03
.08
.05
.03
.05
.05
.03
.11
.20
.86
.49
.18
.20
.20
.33
.30
.84
.75
.51 1.50
DEC 22.0
.63
.27
.62
.40
.34
.03
.30
.18
.07
.44
.42
.33 .12 .66 --------------------------------------------------------------------------------------------------------------------YEM 584.0 .33 .36 .93 .25 .04
Country : SWEDEN Station : VAVIH!Ll Year : 1986
Na
.49
SaJvler t)lle : WET OOLY SaJvling pericxl : OAILY
Pb Cd Cu Zn Cl S02S A-S04S N02N T-N03N T-NH4N mn 003N NH4N S04S-C
--------------------------------------------------------------------------------------------------------------------JAN FEB M'R APR W\Y J~
Jl.l AU3 SEP OCT f{)V DEC
67.0
54.0 32.1 45.6 17.9 96.8 71.6 81.7 95.4 90.2 92.1
.61 .52 .74
1.22 2.84 2.17 .97 1.15 2.23
1.19 1.08 2.92 .62 1.18 2.68 .53 .56 1.63 .58 .58 1.45 .34 .44 .90 .63 .70 .96 . 76 .73 .84 .76 .76 1.01
1.95
.97
.31
.52
.21
.58
.21 1.13
.47
.84 1.43
.23
.14
.11
.24
.07
.09
.04
.14
.06
.08
.17
-----------------------------------------------------------------------YEAR 744.4 .70 .85 1.36 .85 .12
4.00 7.70 1.49 5.30 1.09
1.60 8.70 2.53 1.10 3.40 1.67 1.30 2.60 .90
.50 2.00 .78 1.40 1.70 1.01
.70 1.30 .92 2.20 1.30 .58
.90 3.80 1.30 3.70 2.30 7.20
2.30 1.10 .60 .61 2.30 2.52 2.48
.90 1.51 2.44 1.00 1.09 2.49
.70 .54 2.22
.80 .77 2.56
.80 .65 1.85 1.20 .36 1.01 2.30 1.35 2.64 3.10 1.19 2.14 2.30 .75 1.70
---------------------------------------------1.66 4.06 1.22 1.57 1.03 2.01
107
Country : SWEDEN Station : ROOVIK SaJvler t)lle : WET ONLY Year : 1986
mn 003N NH4N S04S-C Na
JAN FEB M'R APR W\Y J~
Jl.l AIJ3 SEP OCT NOV DEC
48.9 .63
79.6 1.07 28.0 1.24 82.3 1.03 9.7 1.07
39.8 1.42 98.5 .70 34.7 .36 85.2 .58 94.1 .84 60.0 .78
.43 .57 5.92
1.07 1.39 .81 .89 2.24 .44
1.17 2.29 .96 1.31 3.74 1.09 1.58 4.01 .88
.74 1.55 2.06
.03 .54 3.84
.75 .97 2.46
.73 .83 2.25
.58 .89 5.22
.69
.13
.09
.15
.19
.20
.28
.46
.31
.36
.47
YEM 660.8 .85 .82 1.47 2.36 .30
SaJvling pericxl : OAILY
Pb Cd Cu Zr Cl S02S A-S04S N02N T -003N T -NH4N
8.50 6.80 5.70
- 2.00 6.10 1.30 2.90 1.80 2.20 1.40 2.30 2.70 2.10 4.50 1.10 7.80 .90 5.70 3.60 5.30 3.00 8.40 5.70
1.49 2.70 1.18 2.10 2.72 2.00 1.14 1.40 1.40 1.30 2.18 .90 1.85 .80
.78 .80
.45 1.30 2.10 2.20 2.30
.60 .98
.61 1.19 2.12 2.46
.90 1.90 1.30 2.59
.72 2.12
.73 2.03
.55 1.35
.33 .72 1.19 1.94
.94 1.51
.59 1.40
- 4.67 3.53 1.47 1.66 .86 1.68
Country : SWEDEN Station : fmRG SaJvler t)lle : WET ONLY Year : 1986
JAN FEB M'R APR W\Y J~
Jl.l AlJ3 SEP OCT f{)V
DEC
mn 003N NH4N S04S-C Na
35.3 1.14 .60 1.14 1.41 3.8 2.58 1.50 3.07 1.22
25.9 1.48 1.53 2.43 2.65 45.7 .43 .56 2.01 .17 39.6 1.40 1.67 4.48 .28 13.3 .97 3.25 2.94 .76 50.5 .~ .69 .89 .48 70.1 .41 .93 1.54 .37 22.4 .35 .38 .72 1.63 43.1 .52 .38 1.07 1.09 43.9 1.05 . 70 1.07 1.33 40.4 1.02 .53 1.17 2.02
SaJvling pericxl : OAILY
.16
.20
.35
.03
.13
.26
.08
.11
.20
.15
.13
.20
Pb Cd Cu
YEAR 433.9 .79 .87 1.70 .98 .14
Country : USSR Station : NIOA Year : 1986
JAN FEB M'R APR W\Y J~
Jl.l AIJ3 SEP OCT f{)V DEC
mn 003N NH4N S04S-c Na
9.2 6.1
27.5 2.1 8.3
44.8
36.7 26.6
1.03 .53 .74 1.69 .76 .06 .3B .61
1.60 1.46 2.08 1.82 1.08 2.50 3.38 2.00 1.15 .84 1.53 1.76 .25 1.15 1.30 1.47
.84 .80 1.04 3.33
.21 .05 .17 5.64
.73 .52 1.78 7.20
.18 .81 1.27 2.20
YEM 317.5 .59 .65 1.03 3.81
Sa1v 1 er t)lle : Bl.lK SaJvling pericxl : OAILY
Pb Cd Cu
Zn
Zn
Cl S02S A-S04S NC2N T-N03N T-NH4N
2.30 4.90 1. 50 5.70 4.70 2.90
.40 1.30
.80 1.30 2.50 1.10 1.40 .80 1.40 .70 3.50 .40 2.00 1.80 1.50 2.20 2.90 5.30
.75 1.20 1.12 .60 1.50 1.20
.83 .70
.46 .60
.44 .60
.65 .50
.54 .50
.26 .60 1.60 2.70 2.70
1.86 2.37 .73 1.12
C1 502$ A-S04S N02N T -003N T -NH4N
1.71 5.19 2.83
.50
.16
.05 <.02
.26 7.84 4.87
.53 2.67 2.80 5.67
.12
.11
.05
.18
.12
.08
.10
.16
.25
.94 1.31
.60 1.36
.53 2.99 1.07 5.01
1.56 5.26 .13 .78 2.67

Country : USSR Statioo : SYRVE Year : 1986
nm 003N NH4N $04$-C Na
108
$alp l er type : BllK Salpling pericd : IY\JLY
Pb Cd Cu Zn Cl S02S A-S04S
------------------------------NC2N T-003N T-NH4N
--------------------------------------------------------------------------------------JAN FEB 1-Wl APR WiY JL,!; JlJ_ AUS SEP OCT NCV occ
39.3
25.0 49.1 35.0 26.1 70.9 55.1 72.4 56.4 63.4 42.5
.75
1.00 .53 .67 .38 .41 .28 .24 .21 .53 .50
.51 .44
.96 1.13 .70
1.65 1.25 <.02
.76
.73 1.07
.79
.29 .80 .25
1.65
1.23 .37 .92 .78
2.17 .69
2.03 .12 .06 .15 .37
.37 1.27
.66 1.73
.09 2.01
----------------------------------------------YEAA 535.2 .45
Country : USSR Statioo : RUTSAVA Year : 1986
nm 003N
.46 .65 1.44
NH4N S04S-C Na
<.02 <.02 <.02 <.02 <.02 <.02 <.02
.17 <.02 <.02
- <.02 .10
1.44 .95 .23 .41 .61
--------------------------------------------------
Salpler type : &.I.K Salpling pericd : lV\JLY
.13 .73
2.20 3.83 2.71 1.81 1.26
.84
.31
.12 1.20 1.40 1.50
.16
.12
.13
.13
.10
.07
.14
.56
.48
.69 --------------------
1.56 .13 .39
Pb Cd Cu Zn Cl S02S A-$04$ NC2N T-NC3N T-NH4N --------------------------------------------------------------------------------------------------------------------
JAN FEB 1-Wl APR WiY JL,!; JLI. AUS SEP OCT NCV
73.0 2.4
47.9 41.6 41.1 84.7 37.3
177.5 146.6 72.5
1.09 1.35 1.32
.58
.67
.54
.62
.29
.44
.81 1.00
.61 1.02
.70 2.30 1.15 1.09
.40 1.00
.56
.30
.20
.31
.81
1.73 1.34 1.18 1.43 1.64
.54
.37
.68
1.29 1.83
.58
.28
.29
.12 .78 .33
1.08 .70
2.87 1.01
.50
.42
.29
.43
.14
.45
.63 2.40
.68 1.78
2.94 1.11 1.82 2.27 1.97 1.05
.49
.16 1.29 2.00 1.99 2.70
.27 .31
.76 1.69 1.03 2.94
.62 2.71 occ
!19.3 26.0 1.08 .55
.94 1.31
.92 3.07 --------------------------------------------------------------------------------------------------------------------
YEAA 849.9 .68 .55 .89 .81
Country : USSR Station : LAHEWiA Year : 1986
Salpler type : &.I.K Sampling period : DAILY
.91 1.43 1.65 .67 1.91
Na Pb Cd Cu Zn Cl $02$ A-$04$ N02N T-NCGN T-NH4N nm 003N NH4N $04$-C
----------------------JAN FEB 1-Wl APR WiY JL,!; JLI. AUS SEP OCT NCV occ
10.5 43.4
103.1 101.3 37.1 36.6 20.0 42.8
.36
.11
.12
.14
.18 .70 .59 .44
--------------
.48 1.22
.06 1.00
.10 .56
.16
.10 .27 .90 .52
.71
.32 .49 .84
1.14
------------------
.20
.20
.32
.06
.29
.14
.25
.63
--------------------------------------------------
1.71 .65 .48 .15 .16 .30 .30 .85
. 71
.54
.85
.52 1.11
.67
.37 2.22
.19
.33
.40 .60
1.26
-----------------------------------------------------------------------------------------------YEAA 394.8 .25 .22 . 71 .25 .58 .75 .75
------------
.59
.22
.14 .10
.15
.04
.34
.40 .18 1.34
-------------.25 .45
Country : IXR Station : KAP .ARKC:Xil\ Year : 1986
JAN FEB 1-Wl APR WiY JLW JlJ_ AUS SEP OCT NCV occ
nm 003N NH4N S04S-C Na
66.1 .70 .50 1.59 1.30 17.5 1.60 .80 3.88 5.00 31.5 1.30 2.10 3.53 .80 37.3 1.20 1.80 3.03 .80 48.9 1.10 1.30 3.26 .50 31.5 .60 .80 2.66 .50 83.7 .50 .80 1.57 .40 40.0 1.70 1.30 5.59 1.30 48.8 .40 .30 1.01 1.10 74.6 .60 .60 2.47 1.60 36.1 .70 .80 2.42 1.00 39.5 .70 .50 2.23 2.00
.20
.90
.20
.20
.10
.10
.10
.40 2.60 .30 .20 .40
109
Salpler type : \.U ONLY $alp l i ng peri cd : 1.\'EKL Y
Pb Cd Cu Zn Cl S02S A-S04S N02N T-NCGN T-NH4N
2.60 7.20 1.60 10.10 1.40 !.50 5.00 3.50 1.60 3.20 2.60 1.40 2.10 1.60
.70 1.50 2.30
.80 1.40 2.30 3.10 2.10 1.50 2.10 1.60 1.00 3.20 7.80 3.10 1.70 7.20 3.00 4.40 7.70 2.90
YEAA 555.5 .83 .89 2.53 1.16 .45 - 2.36 4.02 2.31
Country : FRG Statioo : KIEL BIGHT Year : 1986
mn 003N NH4N 504$-C
JAN 66.9 1.40 .96 FEB 1-Wl !6.2 3.00 7.55 APR 32.7 1.90 2.28 MAY 36.1 1.10 1.80 2.33 JLXl 60.3 1.00 .64 2.48 JLI. 38.5 1.90 2.30 3.42 AUG 24.0 1.30 1.70 1.14 SEP !7.8 .89 .96 1.09 OCT 36.1 1.30 1.90 1.97 NOV 32.9 l.BO 1.60 2.40 occ 16.6 3.00 3.10 4.84
YEAA 378.! 1.54 1.64 2.39
Country : OCfl.lllRI(
Station : KELDSNOR Year : 1986
mn 003N NH4N S04S-C
JAN 58.0 .47 .39 .69 FEB .5 3.92 .94 3.80 1-Wl 33.0 .86 1.44 1.52 APR 27.2 1.30 2.02 2.08 MAY 27.1 1.20 1.34 1.98 JLXl 27.0 .76 1.19 1.45 JUL 66.6 .79 1.06 1.25 AUS 30,9 1.37 1.60 2.01 SEP 37.4 .37 .42 .92 OCT 43.5 .40 .42 .79 NCV 44.1 .5! .47 .79 DEC 50.7 .46 .46 .81
YEAR 446.0 .71 .88 1.19
*) Report i ng NH4+
8 413399X
Na
Na
Salpler type : 1.\'T OOLY $alp l i ng peri cd : 1.\'EKL Y
Pb Cd Cu Zn Cl S02S A-$04$ N02N T-NCGN T-NH4N
!0.20 12.20 12.40 25.60
- 13.07
15.90
20.30 2.60 1.50
40.70 2.50 - 29.80 3.90
21.70 7.80 56.60 11.00
35.00 21.50 42.00
- 36.51 12.92
$alp l er type : 1.\'T OOL Y Salpling pericd : lV\llY
Pb Cd Cu Zn Cl S02S A-S04S NC2N T-003N T-NH4N*
7.71 7.30 2.21 59.29 6.47 2.88 3.4! 3.09 3.58 1.88 2.98 2.74 1.33 2.83 1.85
.68 1.94 2.12 1.60 .90 1.59 3.20 .90 .67 3.10 .35 .57 5.16 4.17 7.06 2.60 7.08 6.83 2.17
- 4.00 3.70 2.09
2.50 2.84 4.57 4.00 2.74 1.81 1.83
.70
. 21
- 3.70 - 2.43
- 2.48

110 111
ANNEX 3
Annual statistics on HELCOM/EGAP data 1987

112
r-~.-----------------------------------~--~,~~-~N~------,----m--~------------
I:Z : : : : I : : : l : / y·- y-
1:::: --------------X z 1- -------------"N---0J . f'-~-------------- N N N N ,--- 0 m 0 N ~~~~~ ~ a:o
:o-z
" 0 (f)
N 0 (f)
N
N0J('..Jy·-OCOO N .-..--..-..-r- ..-
" : "0~---~~------~,n~-------------c>N-~N~--------------------
N ..-· ..-
(J'_·----~c-------7-;c-----------------;;--------------------------.:r;-«)----~ N ~ NN , , ,
;- ,.- : : : : : : : : I ( I
M~~NNNN~~~~~~~~N~W~~~~~~~~~ o~~~~~~ ~ ~~~-~~
<ON
z
~'-- H---------------------------- ------------------"' 0)
w G r? w > 8
' + (") "' O:r: zz + +
8"' z:r: :r:z H II X ;>. zz
1--1--
~' ' '
_;,. "<il 0
(_)
Country : FINLAND Station : VANfWI<YLMWVI Year : 1987
nm 003N NH4N S04S-C Na
113
~1er type : llW(
~1 it9 f>'riod : ftl'iTit.Y
Pb Cd Cu Zn
JAN 23.0 .41
C1 S02S A-S04S tKl2N T -003N T -NH4N --------------------------------------------------------------------------------------------------------------------
FEB 40.0 .70 MAR 24.0 1.48 APR 7.0 1.14 1-\1\Y 34.0 .74 JUN 77.0 .51 Jll 52.0 .05 All3 129.0 .25 SEP 101.0 .30 OCT tKJV 67.0 .72 DEC 35.0 .63
.12 .53
.49 2.00
.96 4.28
.81 1.77 1.74 2. 56 1.03 2.19 .41 1.21 .35 1.13
1.12
. 75 2.47
.37 1.22
.10 .50
.15 5.10 .32 .60 .18 5.50 .20 1.20 .16 5.00 .13 .50 .10 1.80 .11 1.80
.18 6.30
.12 5.00
.48
.20
.19
.40
.18
.40
.15
.12
.18
.36
.16
37.00 15.00 9.00
47.00 16.00 15.00 9.00 7.00 7.00
13.00 23.00
--------------------------------------------------------------------------------------------------------------------YEM 569.0 .48 .65 1.70
Country : FINLAND Station_: W\ILIXJTO Year : 1987
nm 003N NH4N S04S-C Na
.14 2.94 .23 - 12.65
~1er type : BU.K ~ 1 i t9 f>'ri od : ftl'iTfl Y
Pb Cd Cu Zn --------------------------------------------------------------------------------------------------------------------JAN 5.1
C1 S02S A-S04S NC2N T-tKJ3N T-NH4N
FEB 20.4 .40 .28 .69 MAR 33.2 .94 .70 1.14 APR 12.5 .72 .74 1.83 1-\1\Y 22.2 .51 1.60 1.95 JUN 110.5 .22 .26 .99 Jll 63.8 .01 .10 .46 All3 81.4 .16 .39 .79 SEP 79.2 .20 .24 .55 OCT 58.8 1.33 1.50 2.36 OOV 7.2 .61 .52 .90 DEC 30.2 .66 .23 .99
.50
.39 .50 .26 .15 .17 .43 .18 .81
.90
.06
.06 .26 .08 .03 .02 .06 .02 .13
.34
.70
.40
.40
.20
.10
.10
.60
.10 1.10
.60 1.20
--------------------------------------------------------------------------------------------------------------------YEM 522.5 .41 .50 1.03 .36 .07
Country : FINLAND Station : HA1LUOTO Year : 1987
nm 003N NH4N S04S-C Na
~1er type : I.U ONLY ~1il"9 f>'riod : ftl'iTflY
Pb Cd Cu Zn
.41
C1 S02S A-S04S NC2N T -003N T -NH4N --------------------------------------------------------------------------------------------------------------------JAN 12.0 .12 FEB 51.0 .45 MAR 27.0 .39 APR 7.0 1.27 1-\1\Y 18.0 .50 JUN 72.0 .21 JUL 84.0 .07 All3 93.0 .22 SEP 43.0 .17 OCT . 24.0 .90 NCV 17.0 1.08 DEC 14.0 .22
.05 .12
.18 .48
.55 .98
.25 1.17
.85 1.19
.36 .87
.02 .39
.43 .88
.07 .27
.85 2.34
.78 1.21
.08 .17
.11 <1.00 .10
.03 2.00 .08
.03 5.00 .14
.05 2.20 .16
.02 4.40 .17
.05 1.70 .12 .01 .70 .05 .03 .40 .11 .04 .80 <.01 .08 •6.70 .25 .13 7.50 .16 .05 .70 .11
9.00 16.00 23.00 47.00 24.00 7.00 9.00
4.00
18.00 23.00
--------------------------------------------------------------------------------------------------------------------YEM 462.0 .31 .32 .76 .04 1.96 .11 - 12.66

Country : FJNLMD Station : VJRCUHTI Year : 1987
mn l\ll3N NH4N 504S-C Na
114
SiJTTller type : BLLK SiJTTll ing period : DAILY
Pb Cd Cu Zn Cl 502S A-504S N02N T-l\ll3N T-NH4N --------------------------------------------------------------------------------------------------------------------
.30 9.50 1.50
.50 6.50 1.90
.70 9.00 4.20
.50 3.70 1.90
.60 1.90 1.60
.20 1.90 1.60
.30 1.70 1.00
.20 1.60 1.10
.50 1.00 .60
.80 3.00 2.10
.40 5.00 1.60
.60 3.00 1.00
JAN 30.2 .30 FEB 49.4 .70 M'R 26.9 1.10 N'R 6.1 1.10 W\Y 38.0 .80 JLI< 71.4 1.40 Jll 59.8 .20 AUG 107.1 .20 SEP 116.0 .30 OCT 34.7 1.00 NOV 73.2 .70
.30 .50
.60 1.73 1.20 3.23
.90 2.03 1.50 2.73
.90 1.43
.40 .83
.70 1.00
.40 .93 1.40 2.76
.80 1.33
<.10 .10 .10 .10 .10 .10 .10
<.10 .10 .20 .10
<.10 DEC 35.0 .60 .30 .90 --------------------------------------------------------------------------------------------------------------------
.41 3.98 1.67 YEM 647.B .59 .71 1.38
Country : FJNLMD Station : V1RCUHTI Year : 1987
nm l\ll3N NH4N 504S-C
.11
Na
SiJTTll er type : BLLK SiJTTlling period : f!JNTfLY
Pb Cd Cu Zn Cl 502S A-504S NC2N T-l\ll3N T-NH4N --------------------------------------------------------------------------------------------------------------------
JAN 20.7 FEB 48.7 M'R 31.5 N'R B.O W\Y 53.9 Jl-1' 95.3 Jll 55.7 AUG 150.1 SEP 119.8 OCT 56.1 NOV 66.7 DEC 53.8
.74 1.38 1.07 .86 2.82 1.86 2.13 5.10 1. 55 .47
.86 1.70 2.B5
.49 1.60 2.85
.20 .24 1.44
.28 .56 1.45
.25 .13 1.10 1.05 1.20 3.83
.97 1.50 2.16
.79 .77 1.73
.54
.60
.84
.23
.23
.37
.23
.36
.49
.49
.51
.11
.24
.29
.18
.18
.10
.OB
.06
.30
.10
.22
1.00 1.10 1.30
.80
.40
.30
.40
.20
.40 1.20
.70
.80 --------------------------------------------------------------------------------------------------------------------
.57 YEM 762.3 .63 .93 2.16 .38 .15
Country : FINLAND Station : UTO Year : 1987
mn l\ll3N NH4N 504S.C Na
SiJTTller type : BLLK SiJTTlling period : DAILY
Pb Cd Cu Zn Cl 502S A-504S N02N T-NC3N T-NH4N
--------------------------------------------------------------------------------------------------------------------14.70
.40 1.50 2.30 1.80
.50
.40
.30
.30
.40
.60
.90
.10 1.00
.40 1.49 1.20 2.03
.30 2.48
.50 1.13
.50 1.13
.20 .63
.20 .56
.40 .86
.60 1.13
.70 1.16
<.10 .30 .10 .60 .10 .10 .10 .20 .20 .10 .20 .30
4.20 1.20 2.10 11.30 4.90 3.80 1.50 3.30 1.50 2.10 1.40 2.00 2.80 1.60 3.60 1.30 1.50 3.00 2.40 4.00 4.60 3.00
4.40 3.50 1.80 1. 20 1.50 1.00 1.00
.60 1.80 1.00
.60
JAN FEB M'R N'R W\Y Jl-1' Jll AUG 5EP OCT NOV DEC
21.9 25.6 15.6 1.6
40.8 57.1 31.6 50.0 80.7 50.2 69.2 32.1 .70 .30 .89
--------------------------------------------------------------------------------------------------------------------- 3.11 3.33 1.67
YEM 476.4 .63 .46 1.03 .17
Country : FINLMD Station : HAAPASAARI Year : 1987
mn l\ll3N NH4N 504S-C
JAN FEB M'R N'R W\Y 34.0 .77 1.94 2.67 JUN 77.0 .49 .63 2.21 Jll 52.0 .29 .41 1.03 AUG 129.0 .27 .59 1.23 SEP 101.0 .39 .47 1.04 OCT NOV DEC
YEM 393.0 .39 .66 1.47
Country : FINLMD Station : TVARMINNE Year : !987
mn l\ll3N NH4N 504S-C
JAN FEB M'R N'R W\Y JUN Jll AUG SEP OCT NOV DEC
15.5 .76 33.3 1.28 21.0 1.85 5.4
63.6 .71 117.6 .39 44.4 .40
123.0 .16 105.5 .25 79.5 1.03 82.4 .83 38.6 .60
.25 1.14
.89 1.87 1.19 2.56
.96 1.85 1.80 1.65
.35 1.32
.03 .68
.18 .64 1.40 2.27
.79 1.44
.26 1.21
Na
Na
.66
.69
.79
.22
.20
.54
.20
.40
.67
.72 1.07
115
SiJTTller type : I.£T ONLY Sampling period : f!JNTfLY
Pb Cd
.18 2.50 .20
.13 5.80 .15
.10 3.00 .15
.10 4.00 .16
.09 5.60 .12
.11 4.50 .15
Cu Zn
16.00 16.00 15.00 24.00 8.00
- 16.44
SiJTTller type : BLLK
.13
.12
.16
.OB
.09
.13
.06
.18
.19
.12
.17
SiJTTll ing period : f!JN]fl_ Y
Pb Cd Cu Zn
YEM 729.8 .56 .77 1.38 .46 .12
Country : FINLMD Station : .nw.A Year : 1987
nm l\ll3N NH4N 5045-C
JAN 8.8 FEB 32.0 1.16 1.50 1.81 MAR 31.8 2.84 2.54 3.42 N'R 2.3 W\Y 43.8 .79 1.30 1.81 Jl-1' 72.1 .63 .99 1.64 JU. 17.4 AUG 1.2 SEP 130.4 .38 OCT . 40.3 1.26 NOV 115.7 . 78 DEC 50.5 1.02
.29 1.83
.40 .86 1.30 1.82
.91 1.07
.83 1.31
Na
1.18 .21
1.34
.26
.39
.46
.43 1.27
.76 1.11
.14
.03
.15
.05
.07
.08
.06
.23
.07
.12
YEM 546.3 .87 .96 1.44 .66 .09
SiJTTller type : BLLK SiJTTlling period : f!JNHI.Y
Pb Cd Cu Zn
Cl 502S A-504S N02N T-l\ll3N T-NH4N
Cl 502S A-5045 N02N T-NC3N T-NH4N
1.30 1.20 1.10
.30
.30
.70
.20
.50 1.10 1.10 1.70
.68
Cl 5025 A-5045 NC2N T-NC3N T-NH4N
1.40 1.30
.30
.60
.60
.60 1.90 1.00 1.70
.95

Coontry : FINLAND Station : RAKJA Year : 1987
nm N03N NH4N SQ4S-c Na
116
Sarp 1 er type : BUJ(
Sarp1ing period : ~Tl-LY
Pb Cd Cu Zn C1 S02S A-S04S N02N T-N03N T-NH4N --------------------------------------------------------------------------------------------------------------------
JAN FEB fiOR APR W>.Y JW Jll. AIJ3 SEP OCT NOV DEC
11.9 35.1 29.2 5.8
28.3 100.5 49.7 82.8 68.0 18.0 20.2 16.6
.37
.38
.95
.51
.18
.01
.16
.16 1.29
.44
.25
.27
.20
.44
.90
.09
.01
.01
.23 1.40
.11
.71
.75 2.65
.66 .82 1.92 .61
1.54 .41 .57 .38 .42 .17 .91 .72 .41 .27
<.10 1.06 .60 1.19 .27 1.18
.31
.07
.05
.06
.05
.07
.11
.05
.55
.14
.10
4.70 1.20
.40
.40
.50
.20 1.30
.30 2.20 1.70 1.80
--------------------------------------------------------------------------------------------------------------------.90
YEPR 466.1 .30 .25 .74 .60 .10 -~==~"===============
Coontry : FINLAND Station : YL!f\ORKKU Year : 1987
Na
Sarp1er type : BU.K Sarp1ing period : ~TIU
Pb Cd Cu Zn C1 S02S A-S04S N02N T-N03N T-NH4N nm N03N NH4N 5045-c --------------------------------------------------------------------------------------------------------------------
13.1 .31 21.6 .67 37.0 1.21 28.0 .89 32.7 .63 45.7 .28 11.7 81.9 .47
102.5 .23 43.9 1.39 43.9 .55 36.3 .30
.47 .77
.96 1.40
.97 1.60 1.90 2.97 1.60 2.58 1.10 1.38 1.80 2.68
.97 2.21
.79 1.18 1.20 2.63
.81 .77
.50 .48
.68
.33
.36
.36
.28
.27
.62
.25
.26
.78
.37
.62
.12
.06
.06
.16
.11
.06
.23
.10
.12
.16
.06
.06
.80
.50
.50
.30
.20 1.00
.20
.30 1.40
.40
.70
JAN FEB fiOR APR W>.Y JUN Jll. AIJ3 SEP OCT NOV DEC
--------------------------------------------------------------------------------------------------------------------YEPR 498.3 .57 1.01 1.67 .38 .10
Coont ry : F I NLANO Station : SIPOO Year : 1987
nm N03N NH4N S04S-C Na
.48
Sarp1er type : BU.K S"fP 1 i ng period : ~TH.. Y
Pb \.d Cu Zn C1 501S A-5045 N02N T -N03N T -NH4N --------------------------------------------------------------------------------------------------------------------
JAN 15.4 .52 .40 .90 .80
FEB 31.8 .75 .66 1.26 .53
fiOR 39.2 1.94 1.61 2.00 1.14
APR 1.7 W>.Y 53.9 .76 1.00 1.81 .98
JW 95.8 .36 .51 1.65 .20
Jll 58.7 .37 .33 1.37 .34
AIJ3 65.2 .23 .18 .85 .21
SEP 143.6 .24 .31 .84 .38
OCT 18.3 .86 1.10 2.18 .65
NOV 48.9 .73 .94 2.53 .44
.09
.06
.15
.08
.08
.11
.07
.06
.24
.16
.11
1.10 .90
1.50
.40
.30
.40
.10
.50 1.20
.80 1.70
DEC 11.5 .59 .70 .91 1.04 --------------------------------------------------------------------------------------------------------------------
.59 YEPR 585.0 .54 .59 1.41 .48 .09
------
117
Sarpler type : BUJ(
Country : FINLAND Station : SllVA Year : 1987 Sarp1ing period: ~TH..Y
nm N03N NH4N S04S-c Na
JAN 8.1 .76 1.20 1.40 FEB 20.7 .63 .65 .92 .59 .12 fiOR 22.5 1.54 1.04 1.65 .58 .12 APR 10.5 .64 .20 W>.Y 35.4 .60 .42 1.48 .23 .08 JUN 63.1 .28 .05 1.02 .15 .08 Jll 36.1 .01 .41 .93 .42 .20 AIJ3 117.5 .24 .21 .88 .27 .06 SEP 102.4 .13 .21 .55 .20 .05 OCT 20.6 2.49 1.70 4.66 2.00 1.18 NOV 55.7 .60 .67 .74 .30 .08 DEC 31.9 .28 .38 .35 .57 .07
YEPR 524.5 .44 .41 1.02 .37 .13
Pb Cd Cu Zn C1 S02S A-S04S N02N T-N03N T-NH4N
1.70 1.20
.70
.20
.20
.70
.30
.20
.40
.80
Coontry : .FINLAND Station : KDRPPOO Sarpler type : BU.K Year : 1987
mn N03N NH4N S04S-C
JAN 17.3 .58 .16 .92 FEB 28.6 1.30 1.10 1.75 fiOR 25.8 1.78 1.36 2.13 APR 4.6 W>.Y 57.2 .50 .25 1.15 JUN 66.8 .43 1.40 1.75 Jll 52.1 .17 .46 1.18 AIJ3 110.1 .11 .07 .43 SEP 159.4 .29 .17 .73 OCT 34.2 1.03 1.50 2.07 NOV 150.1 .66 .57 .98 DEC 46.8 .53 .33 .69
Na
.59
.60
.51
.22
.29
.58
.42
.50
.75
.63
.84
YEPR 753.0 .50 .52 1.04 .52
Country : SWEDEN Station : Mll' Year : 1987
mm N03N NH4N S04S-C Na
JAN 35.0 .59 .68 .86 1.51 FEB 46.0 .42 .57 .87 .45 fiOR 34.0 1.09 1.00 1.55 1.22 APR 37.0 .80 .98 1.18 .11 1'1\Y 57.0 .77 .65 1.37 .27 JUN 104.0 .45 .29 1.08, .29 Jll 98.0 .35 .37 1.04 .45 AIJ3 54.0 .36 .27 .78 .59 SEP 69.0 .39 .21 .86 .61 OCT. 34.0 .96 .95 2.01 .30 NOV 67.0 .51 .58 1.05 .30 DEC 57.0 .42 .38 .80 .41
Sarp1ing period : ~Tit.Y
Pb Cd Cu Zn Cl 5025 A-S04S N02N T -N03N T -NH4N
1.10 1.00
.90
.20
.50
.70
.60
.60
.90
.90 1.10
.71
Sarp1er type : WET ONLY Sarp1ing period: ~TH..Y
Pb
.19 2.13
.06 4.15
.16 5.40
.04 4.20
.05 1.87
.04 1.82
.09 1.00
.08 1.98
.09 1.10
.10' 7.63
.04 4.13
.06 2.94
Cd
.11
.16
.12
.12
.11
.07
.07
.09
.08
.31
.12
.14
Cu Zn C1 S02S A-S04S N01N T -N03N T -NH4N
10.00 2.84 11.80 1.01 21.10 2.45 11.30 .45 14.30 .66 10.90 .64 7.60 .86 8.40 1.17 8.50 1.16
27.60 .65 11.10 .64 13.90 .89
YEPR 692.0 .53 .50 1.08 .49 .08 1.96 .11 - 12.11 1.01

... 0,~~-•:.a.~•••-----------------------
Country : SWEDEN Station : ASPVRETEN Year : 1987
nm N03N NH4N 5045-c Na
118
Salp1er typ:l : I.U ONLY Salp1ing period : f.IJNTH-Y
Pb Cd cu Zn C1 5025 A-5045 N02N T-N03N T-NH4N
--------------------------------------------------------------------------------------------------------------------1.30 6.11
.56 3.18
.62 5.56
.97 1.79
.76 1.30 .17 .39 .83 .59 .37 .33 .27 .28
.54
.84 1.41 1.56 1.37 1.25
.83
JAN FEB f.Wl APR I'AY J~
Jll NJ3 SEP OCT NOV DEC
11.0 .39 17.0 .73 18.0 1.14 5.0 1.24
54.0 .62 63.0 .39 47.0 .07 63.0 .22 64.0 .38 41.0 .61 60.0 .56 72.0 .20
.17 .67
.53 .88
.98 1.41 1.75 2.97
.56 1.18
.23 1.14 .32
.11 .80
.25 .66
.56 1.16
.30 .81
.14 .30
.87
.22
.28
.31
.06
.09
.05
.09
.23
.30
.43
.11
.12 2.70
.05 5.81
.05 4.74
.08 5.71
.02 3.33
.02 1.69
.01 .79
.12 1.90
.03 2.24
.08 3.45
.06 4.95
.02 3.53
.11
.18
.22
.21
.10
.06
.04
.04
.06
.17
.11
.14
- 8.10 14.00 20.90
- 21.70 9.80
- 7.80 5.40 4.50 7.10
16.10 8.60
- 12.80
.59 1.42
.24 .80
.22 .69
.17 .51
.21 .66
.47
.62 1.51
.81 1.27
.40 1.02
1.87 .92 1.21 .85
.84 .B7 1.14 .84
.74 .47
.77 . 70 .73
1.53 1.11 .83 2.18 .46 2.16
1.07 .40 .30
.55
2.07 .63 .25
---------------------YEAA 515.0 .42 .34 .82 .19 .05 2.98 .10
- 9.56 .42 2.07 1.01 1.16 .45 1.03 -----------------------------------------------------------------------------------------------
Country : 51/EDEN Station : R1Cl<LEA Year : 1987
nm N03N NH4N 5045-C Na
Salp1er typ:l : 1/ET ONLY Salp1ing period : f!JNTIU
Pb Cd cu Zn C1 SC2S A-5045 N02N T-N03N T-NH4N --------------------------------------------------------------------------------------------------------------------
JAN FEB 31.0 f.Wl 33.0 APR 6.0 I'AY 24.0 J~ 63.0 Jll ALJ3 63.0 SEP 63.0 OCT 53.0 NOV 61.0
.32 .27 .55
.99 .69 1.21
.28 .15 .64
.54 .67 1.77
.12 .09 .51
.33 .14 .08 .44 .72 1.15 1.79 .56 .37 1.01
.01 .27
.04
.17
.20
.03
.07
.15
.08
.42
.22
.28
.01
.03
.04
.02
.01
.02
.01
.07
.03
.03
.08
.40
.37
.15
.11
.29
.15
.82
.41
.40 DEC 18.0 --------------------------------------------------------------------------------------------------------------------
.32 YEAA 415.0 .44 .40 .83 .16 .03
Country : 51/EDEN Station : VAVIHILL Year : 1987
nm N03N NH4N 5045-C Na
Salp1er typ:l : 1/ET ONLY Salp1ing period: DAILY
Pb Cd cu Zn C1 5025 A-SC4S N02N T-N03N T-NH4N
--------------------------------------------------------------------------------------------------------------------JAN 36.0 FEB 44.1 f.Wl 35.5 APR 54.3 I'AY 71.8 J~ 117.3 Jll 133.7 ALJ3 82.6 SEP 83.3 OCT 37.3 NOV 79.5 DEC 80.7
.44 .34 .62
.69 .93 1.40 1.26 1.22 1.72
.72 .89 1.15
.75 .68 1.05
.36 .43 .98
.28 .50 .94
.12 .41 .63
.46 .49 .90
.88 .86 2.21
.74 .72 1.57
.64 .73 1.51
1.41 1.23 1.09
.26
.33
.37
.70
.68 1.03 1.22
.50
.62
.16
.15
.14
.03
.04
.06
.15
.12
.15
.11
.07
.08
---------------------------------------------------------YEAR 856.1 .53 .62 1.14 .70 .10
2.50 10.60 2.00 17.80 2.00 9.90
.60 5.20 1.50 2.20 1.40 1.80 1.60 1.70 1.50 1.90 2.10 1.60 1.00 6.20 1.00 3.80 1.40 3.80
1.80 .75 1.77 4.00 1.23 2.03 1.60 1.53 2.51 1.10 !.97 3.67
.60 .84 1.77 1.00 .68 1.69
.70 .59 1.69
.90 .82 2.42
.90 .68 1.85 1.40 1.56 2.61 1.80 .87 1.85 2.10 .66 1.50
-----------------------------------------------------------1.51 5.54 1.49 1.02 2.11
Country : 51/EDEN Station : RffiVIK Year : 1987
nm N03N NH4N 5045-C Na
JAN FEB f.Wl APR I'AY J~
JLl ALJ3 SEP OCT NOV DEC
6.8 41.6 37.5 28.1 64.5
117.7 108.2 59.6 78.0 59.3 83.1 50.3
.96
.63
.73 1.26
.31
.43
.25
.49
.68 1.04
.73
.50
.72 1.84 1.51
.43 .92 1.30
.65 .71 3.41 1.50 2.10 .35
.37 .65 .39
.41 .95 !.51
.47 .77 .37
.88 .89 1.79
.89 1.71 1.63 1.05 2.42 1.58
.57 1.35 2.04
.34 1.14 .64
.19
.16
.34
.04
.05
.20
.07
.26
.27
.25
.27
.07
YEAA 734.7 .56 .63 1.19 1.33 .18
Country : 51/EDEN Station : HOBURG Year : 1987
nm N03N NH4N 5045-C Na
JAN 6.4 1.17 .71 2.14 4.85 .71 FEB 21.0 1.12 .62 1.44 3.22 .46 f.Wl 12.2 2.27 1.41 3.18 2.37 .42 APR 10.3 2.~ 2.D 4.00 2.G .62 MAY 49.2 .87 1.26 1.87 .37 .10 Jll'< 51.6 .10 .24 .28 .09 .04 Jll 14.4 .26 .35 .72 .30 .16 ALJ3 8.3 .54 1.46 1.02 1.83 .42 ~ ~.7 .m 1.53 1.~ 2.16 .~
OCT 57.9 .60 .87 1.41 .29 .09 NOV 77.1 .61 .38 1.15 .81 .12 DEC 30.6 .77 .30 1.36 1.27 .19
YEAA 371.6 .73 .79 1.38 1.02 .20
119
Sa1p 1 er t Yf" : 1/ET ONLY Salp1ing period : DAILY
Pb Cd Cu Zn
Sa1p 1 er typ:l : 1/ET ONLY Salp1ing period : ll'IILY
Pb Cd Cu Zn
Country : USSR Station : N1DA Year : 1987
Salp1er typ:l : BLlK SalJ'1ing period : DAILY
JAN FEB f.Wl APR W\Y J~
JLl ALJ3 SEP OCT NOV DEC
nm N03N NH4N 5045-C Na
7.2 1.51 .60 3.11 2.31 12.6 1.85 1.07 1.84 2.56 10.2 1.52 1.07 2.46 .57 5.9 2.78 2.69 4.27 3.63
32.0 1.61 .74 1.90 3.34 49.4 .41 .52 1.09 ' .69
.5 .35 .90 5.17 13.2 1.47 .22 .91 13.61 27.9 .21 .08 1.11 6.13
.77 .80 1.28 .53 72.4 .73 .35 1.20 1.81
YEAA 241.3 .97 .56 1.49 3.01
Pb Cd cu Zn
C1 5015 A-SC4S N02N T-N03N T-NH4N
3.20 7.30 2.30 6.00 5.00 5.80
.70 3.30
.60 .90 2.80 1.10 .80 1.20
3.50 1.00 3.30 .80 3.00 3.00 3.90 2.30 1.20 2.20
2.46 2.91
2.60 2.00 2.10 1.30
.90
.90
.60 1.10 1.10 2.00 2.20 2.60
.50 1.45
.96 1.53 1.26 2.38 1.53 2.76
.69 1.44
.65 1.35
.56 1.28
.72 1.55
.48 1.10 1.28 2.28
.63 1.15
.55 1.09
1.62 .82 1.61
C1 5025 A-5045 N02N T-N03N T-NH4N
12.90 4.60 5.30 4.00 2.00 4.70 2.10 1.90
.50 .80
.10 1.30
.30 .90 3.40 .70 3.80 .50
.50 1.70 1.40 2.40 2.10 1.70
1.69 2.10
.80 2.30
.80
.80
.50
.70
.50
.40
.40
.70 1.20 1.20
.86
C1 S02S A-5045 N02N T -N03N T -Nil4N
5.53 4.05 5.06 2.03
.94
.55
.34
.03
.04
.10
.12
1.71
. 21
.19
.10
.12
.12
.08
.04
.05
.05
.08
.06
.10

Country : USSR Station : SYRVE Year : 1987
120
Sal!Jler type : BLLK Sal!Jlir>;J period : OAILY
tm1 003N NH4N S04S-C Na Pb Cd Cu Zn Cl S02S A-S04S N02N T-003N T-NH4N
-------------------------------------------------------------------------------JAN FEB fW< APR M'IY J~ JLJ_ AW SEP OCT NOV DEC
14.7 2.12 37.4 1.07 14.1 2.61
70.5 1.00 55.8 .33 47.9 .05 92.3 .11 62.2 .21 22.8 .83 66.6 .88
1.60 1.81 11.18 .94 1.44 1.41
1.78 2.89 1.78
1.15 1.60 .85 .70 .99 1.19 .02 .86 .91 .16 .46 .57 .17 .64 1.13 . 23 1.76 2.75 .60 .91 2.38
-------------------------------------.26 .60 .10 .52 .30 2.19
.22 .08 .40 .06 .49 .05 .53 .12 .39 .04 .38 .12 .00 .08 .16
1.66 .90
1.17
.68
.59
.50
.38
.73
.07
.06
.04
.05
.03
.06
.01
.02
.05
.02
.03
.06
.07
.40
.48
.18
.30
.36
.25
.24
.45
.20
.18
.17
--------------------------------------------------------------------------------------------------------------------YEAA 484.3 .63 .57 1.06 1.56
Country : USSR Station : RUTSAVA Year : 1987
tm1 003N NH4N S04S-C Na
----------------------------------------JAN 24.5 1.06 .43 FEB 30.8 1.40 .92 fW< 11.0 2.36 5.68 APR 9.5 1.52 2.15 M'IY 46.7 1.30 .72 J~ 68.8 .54 .52 JLJ_ 75.5 .00 .07 AW 141.0 .28 .15 SEP 100.8 .20 .12 OCT 19.1 1.01 .97 1.43 NOV 123.4 .31 .07 .87 OEC
.52
.55
S001>ler type : BlLK Sal!Jlir>;J period : OAILY
Pb Cd Cu Zn
--------------------------------------
.12 .54 .67 .04 .29
Cl 502S A-S04S N01N T-003N T-NH4N
--------------------------------------12.47 2.59 5.00 .62 3.04
3.61 3.15 1.94 .97 9.60
.40 .48 1.71 .00 .55
1.47 .21 1.39 .24 .57 1.37 .13 .62 .25 .52 1.44 .04 .60
.17 .35 1.27 .10 .40
.36 .88 1.16 .35 1.21
.75 .71 1.58 .22 .86
--------------------------------------------------------------------------------------------------------------------YEAR 651.1 .51 .39 .95 .55
Country : USSR Station : LAHEM'IA Year : 1987
Na
S001>ler type : BlLK 5001'ling period : DAILY
Pb Cd Cu
2.28 1.19 1.93 .30 2.03
Zn Cl 502S A-S04S N02N T-N03N T-NH4N tm1 003N NH4N S04S-C
--------------------------------------------------------------------------------------------------------------------.00 .11
.93
.89 .91 .92
5.00 1.29 1. 21 1.48
JAN 9.6 FEB 15.1 fW< 6.7 APR 8.1 M'\Y 65.0 J~ 43.0 JLJ_ AW 129.0 SEP 92.4 OCT 6.3 NOV 32.9 OEC
.95 .79 1.88 1.04
.82 6.31 1.30 1.11 1.51 5.04 6.05 .48
.12 .04 .56 .38
.74 1.18 1.48 .11
.27 .23 .99 .07
.03 .03 .69 .55
.07 .01 .34 .29
.55 .32 .56 .25
.62 .41 1.33 .75
-----------------------------------------------------------------------------YEAA 408.1 .31 .60 .95 .41
13.55 1.38 1.24
.48
.47
.38
.21
.14
.14
.24
.76
.88
.94
1.27 .39 .21
.63
.24
.47
.65
.65
.70
.11
.06
.08
.00
.05
.88
.63
.62
.10
.17
---------------------------------------1.82 .79 1.23 .08 .62
Country : ?OLANO Station : LEM Year : 1987
JAN FEB fW< APR M'IY J~ JLJ_ AW SEP OCT NOV OEC
tm1 003N NH4N S045-C Na
18.3 29.2 36.7 82.8 76.1
100.1 97.4 63.5 76.4 S0.3
1.45 .56 1.18 .19 .81 .66 1.76 .32
1.48 1.13 2.39 .24 .62 1.17 1.13 .52 .76 1.22 2.16 .53 .67 1.07 2.13 .50 .47 .82 1.91 .71 .73 .82 1.26 .23 .61 .28 1.48 .85 .77 .89 1.33 1.56
.00
.13
.12
.08
.15
.18
.17
.10
.11
.22
YEAR 630.8 .73 .90 1.81 .61 .14
121
Sal!Jler type : !.£T ONLY 5001lling period : DAILY
Pb Cd Cu Zn
Country : !XR Station : KAP ARKONA Sal!Jler type : !.£T ONLY Year : 1987 Sal!Jlir>;J period : !.£EKLY
tm1 003N NH4N S04S-C Na Pb Cd Cu Zn
JAN 25.4 .70 .30 1.70 2.40 .40 FEB 26.4 .40 .40 1.76 .50 .20 fW< 21.5 1.40 2.20 4.23 .80 .30 APR 98.9 .60 1.m 1.86 .50 .w MAY 36.8 1.70 2.60 4.48 1.40 2.60 D 88.5 8.80 1.~ 2.56 .SO .W JUL 111.1 .40 .80 1.68 1.40 .20 AUG 36.4 1.10 1.20 2.00 1.20 .20 SEP 84.5 .40 .50 1.41 .90 .10 OCT 4.5 o 66.5 .so .60 1.~ z.m .50 ~ 34.3 .~ .60 2.~ 1.00 .w
YEAA 549.8 1.62 1.01 2.11 1.25 .38
Country : FRG Station : KIEL BIGHT Sal!Jler type : !.£T ONLY Year : 1987
JAN FEB fW< APR M'IY J~ JLJ_ AW SEP OCT NOV OEC
1m1 003N NH4N S04S-C
45.0 35.0 32.0 9.0
21.0
YEAA 142.0
Na
Sa1plir>;J period : !.£EKLY
Pb
8.30 11.30 7.30
)6.70 40.30
- 14.08
Cd Cu Zn
5.00 19.90 10.40
- 11.20
Cl 502S A-S04S N02N T-N03N T-NH4N
1.08 1.39 1.07
.89 1.62 1. 57 1.84 1.01 1.59 2.88
1.53
Cl 502S A-S04S N02N T-N03N T-NH4N
4.60 9.50 3.60 1.10 15.00 3.60 2.00 4.SO 4.60
.80 3.00 4.SO 1.40 1.20 2.10
.90 .50 4.20 2.00 .70 1.70 1.80 1.60 2.80 1.40 .90 1.90
3.90 1.90 5.10 3.20 1.30 1.80 7.80 3.80
2.15 4.32 3.17
Cl S01S A-S04S N02N T -003N T -NIWI

Country : FRG Station : OANISCH-N!ENHOF Year : 1987
nm N03N NH4N 5045-C
JAN FEB 1-Wl APR W\Y 107.0 .10 .11 .14 J~ 98.0 .00 .15 1.35 JlJ_ 81.0 1.05 .97 1.63 ALB 74.0 .47 .54 .82 5EP 112.0 .81 .80 1.44 OCT 82.0 .74 .59 1.54 NOV 91.0 1.17 .61 2.07 OEC 70.0 .97 .96 .70
YEAA 715.0 .65 .57 1.21
Country : OENIIAAK Station : KELD5NOR Year : 1987
122
Salpler type : I.I'T CRY Sarp 1 i ng period : I.I'EKL Y
Na l'g Pb Cd Cu Zn Cl 5025 A-5045 N02N T -N03N T -NH4N
2.49 .06 - 7.43 1.13 4.91 .07 10.70 2.30 4.10 .05 11.53 1.59 2.10 .04 - 7.40 1.12 4.32 1.42 - 3.25 1.39
- 9.61 .41 3.52 1. 67 8.08 .49 3.36 8.14
10.39 .83 - 9.11 12.22
- 5.55 .44 - 6.88 3.42
Salpler type : I.I'T OOLY Salpl ing period : DAILY
nm N03N NH4N S04S-C Na l'g Pb Cd Cu Zn Cl 5025 A-5045 N02N T-N03N T-NH4N
JAN 7.5 .65 .55 1.00 - 13.86 7.42 2.62 FEB 12.2 1.71 1.21 2.02 2.28 9.19 3.27 1-Wl 10.6 1.67 1.42 1.70 1.57 5.29 3.07 APR 34.1 1.19 1.56 1.38 1.44 2.78 3.41 I'AY 28.1 .95 1.24 1.45 - 1.86 1.88 1.47 J~ 64.8 .82 .87 1.35 1.49 .97 1.68 JlJ_ 59.5 .47 .76 1.35 2.50 1.39 1.86 ALB 39.9 .74 1.44 1.15 1.47 1.32 2.20 SEP 56.4 .68 1.08 1. 21 2.27 .85 1.71 OCT 31.1 .94 1.28 1.87 3.39 8.01 3.22 NOV 23.7 .56 .57 .81 10.85 4.06 2.17 DEC 16.7 .60 .86 1.43 5.95 4.41 2.02
YEAA 384.8 .81 1.07 1.36 - 2.98 3.96 2.39
123
ANNEX 4
Annual statistics on HELCOM/EGAP data 1988

124
(~ (\J N C\.J NN ~'
:~
(j
"'"' ~ .-r- l c: ...... l ·-----------------,~ --··-------------------- • +
"'" OI zz + +
"' Oco
~~ H ll X >, :zz. 1- 1-
125
Country : FINLAND Station : VANfWl<YLAf!.\1\A ~ler twe : BU.K Year : 1988 ~ling period : frnTI-tY
ITI11 I\03N NH4N S04S-l:
JAN FEB ~
APR W\Y J~
JLl All3 SEP OCT
42.0 1.40 39.0 1.30 58.0 .90 31.0 .78 7.0 .58
27.0 .37 33.0 1.18 94.0 .44 91.0 .30 52.0 1.12
NOV 19.0 .81 DEC 61.0 .48
.69 3.84
.76 3.53
.63 2.13 1.06 2.90 1.38 1.94
.66 1.32 1.71 4.66
.90 1.73
.39 .85
.69 2.02
.62 1.34
.22 1.66
YEPR 554.0 .74 .73 2.14
Na Pb
.37 11.40
.25 10.60
.10 7.80
.15 5.10
.23 1.10
.11 .50
.17 1.70
.10 3.80
.07 3.80
.40 10.10
Cd
.26
.15
.21
.17
.17
.12
.11
.17
.08
.21 .37 6.60 .15 .20 1.70 .06
.18 5.48 .15
Cu Zn
27.00 14.00 17.00 16.00 15.00 15.00 6.00
12.00 11.00 -1.00 14.00 8.00
- 13.45
Country : FINLAND Station : fi\Ill.OTO SalJller t)1l0 : BLlK Year : 1988 ~ling period: frnTflY
1TI11 I\03N NfMN S04S-l: Na Pb Cd Cu Zn
JAN 56.6 1.44 .83 1.62 .92 .25 FEB 24.2 1.20 1.00 1.83 .83 .10 ~ 28.0 1.96 2.00 3.83 .80 .16 APR 13.8 1.52 1.70 !.30 1.19 .12 MAY 14.5 1.22 2.30 3.B7 .36 .15 D w.7 .m .m 1.m .m .w JLl 72.0 .10 .44 .48 .25 .05 All3 67.8 .17 .28 .79 .15 .02 SEP 38.6 .31 .43 .76 .42 .07 OCT 32.6 .44 .35 .85 .64 .W NOV 14.8 .82 l.W 1.31 1.09 .14 DEC 44.0 .40 .26 .44 .66 .17
YEPR 427.6 .65 .66 1.23 .55 .11
Country : FINLAND Station : fi\Ill.OTO Year : 1988
~ler tl?' : l>fT ONLY ~ling period : frnTflY
1TI11 I\03N NH4N S04S-C
JAN 57.0 .45 FEB 24.0 .64 ~ 28.0 .70 APR 14.0 1.13 MAY 15.0 .97 JUN 21.0 1.00 JLl 72.0 .35 All3 66.0 .13 SEP . 39.0 .26 OCT 33.0 .24 NOV 15.0 .20 DEC 44.0 .26
YEPR 430.0 .42
9 413399X
.16 .49
.29 .69
.29 .78
.98 1.74 1.54 2.86
.01 4.00
.02 .99
.15 .59
.47 .78
.15 .47
.13 .42
.03 .17
.23 .90
Na Pb Cd
.02 3.50 .08
.02 4.80 .17
.03 6.20 .10
.08 7.90 .25
.06 13.70
.15 7.70
.02 .50
.02 .50
.03 1.20
.05 '1.90
.12 5.00
.05 .90
.38
.23
.06
.07
.10
.04
.55
.29
.04 2.93 .14
Cu Zn
13.00 18.00 21.00 66.00 63.00 27.00
- 19.00 17.00 16.00 -1.00 19.00 7.00
- 20.07
Cl 502S A-S04S N02N T -N03N T ·NH4N
Cl S02S A-S04S N02N T -1103N T -NH4N
1.10 .60 .50
1.00 .50 .20 .20 .20 .60
1.40 1.60
.90
.65
Cl S02S A-S04S N02N T -110311 T--NH4N

Country : FINLMO Station : V!ROLAHTI Year ; 1988
rrm truN NH4N S04S-C Na
126
Sal]:ller type : BLtK Sal]:lling period : ll'I1LY
Pb Cd Cu Zn
----------------------------------------- ----------------------------------JAN FEB W>R APR MI\Y J~
Jlt AIJ3 SEP OCT oov DEC
49.0 47.0 72.0 25.0 9.0
41.0 42.0
149.0 152.0 61.0 22.0 55.0
.66 1.21 1.05
.53 1.00
1.16 3.17
.96 2.69 1.38 1.39
.63 .74
.63 2.41
.17
.24
.28
.26
.51
.49
.49
.19
.44
.44
.19
.47
.30
.27
.38
.69
.99
.68
.93
.69
.77
.47
.40
.17
.19
.14
.19
.13
.15
.27
.81 1.33
.38
.09
.18
.13
.06
.23
.02
.06
.06
.05
.16
.15
.06
Cl SOZS A-S04S NOZN T-003N T-NH4N -----------------------------------------
.90 1.00
.60
8.10 7.60 7.80
.50 2.70
.50 2.00
.20 !.SO
.30 1.60
1.10 2.60 3.80 1.20 1.60 1.30 1.60
.30 1.70 1.10
.50 1.70 !.00 1.60 2.30 .90 1.20 2.40 2.40 .80 1.40
.70 5.00 1.00 2.20 --------------------------------------------------------------------------------------------------------------------
YEAR 724.0 .49
Country : FINLMO Station : V!ROLAHTI Year : 1988
mn 003N
.51 1.19 .33
NH4N S04S-C Na
---------------------------------JAN FEB W>R APR MI\Y J~
Jlt AIJ3 SEP OCT NOV DEC
67.5 46.9 81.7 26.4 11.9 47.5 59.1
111.6 174.1 66.1 27.4 83.0
.92 1.87 1.34 !.04 1.07
.01
.31
.28
.24
.63
.50
.57
.84 1.70
.17 2.20 1.90
.17
.80
.23
.24
.62
.05
.46
1.75 2.01
.67 3.34 3.66
.67
.96
.99
.78 1.23
.62
.86
.64 1.02
.34
.69
.49
.37
.45
.17
.24
.83 1.01
.44
---------------------------------YEAR 804.2 .61
Country : FINLMD Station : UTO Year : 1988
mn NC3N
.54 1.13 .46
NH4N S04S-C Na
.09
SallJler type : BllK Sal]:lling period : IIOOTflY
Pb ---------------
.15
.19
.16
.21
.42
.08
.12
.06
.07
.19
.13
.07 ---------------
.11
Cd Cu ---------------
---------------
Sal]:ller type : BllK SallJling period : DAILY
Pb Cd Cu
.67 3.70 1.58 1.60
Zn Cl S02S A-S04S NC2N T-003N T-NH4N ---------------------------------------------
.90 1.90 .so .70 .80 .40 .50 .40 .30
2.20 1.60
.70
--------------.76
Zn Cl
--------------------------------
SOZS A-S04S NOZN T-003N T-NH4N
--------------------------------------------------------------------------------------------------------------------JAN FEB W>R APR MI\Y J~
JLJ_ AIJ3 SEP OCT NCV DEC
33.0 17.0 32.0 23.0 13.0 35.0 68.0 53.0 45.0 67.0 28.0 69.0
1.37 1.17 1.18 1.19
.72
.35
.51
.54
.42
.83
.97
.75
1.31 3.30 3.58 1.03 2.89 2.52
.95 1.44 1.86 1.12 2.57 1.51 1.19 2.46 .41
.43 1.16 .43
.75 2.03 .80
.38 .94 .76
.35 .68 1.47
.59 .89
.~ 1.38
.36 .73
3.68 8.56 3.21
------------------------------------------YEAR 503.0 .90 .67 1. 51 1.33
.50
.31
.14
.16
.17
.10
.12
.09
.19
.41
.94
.37
----------------.28
---------------
7.60 4.60 5.00 5.00 3.10 6.00 2.70 3.20
.80 2.00
.80 2.90 1. 50 1.70 1.30 1.80 3.00 1.00 6.50 1.40
14.90 3.00 5.90 3.00
----------------- 4.30 3.13
1.70 1.40 1.70 1.10 1.30 1.40 1.90
.80 1.10
.60
.70
1.00 1.10 1.80 3.50 2.40 4.50 1.20 3.40 2.40 1.10
.80 1.10
--------------1.43 2.18
-------------
127
Country : FINLMO Station : HAAPASAARI Year : 1988
SallJler type : I.£T ~LY SallJl i ng period : IIOOTH.. Y
mn 003N NH4N S04S-C Na
JAN 41.0 .50 .53 1.07 FEB 39.0 .93 .56 2.29 W>R 58.0 .85 .60 1.74 APR 31.0 1.26 1.56 4.36 MI\Y 7.0 .87 1.79 3.21 J~ 17.0 .35 <.01 1.44 JLt 33.0 .76 .43 3.34 AIJ3 94.0 .40 .59 1.45 SEP OCT oov 19.0 .59 .55 1.08 DEC 61.0 .37 .19 1.11
YEAR 411.0 .63 .60 1.87
Pb Cd
.19 6.80 .11
.16 8.20 .15
.08 6.10 .11
.10 9.10 .32
.26 1.00 .12
.08 2.90 .10
.08 1.40 .08
.07 3.20 .20
.31 8.30 .13
.13 1.70 .06
.13 4.73 .16
Cu Zn
35.00 12.00
- 19.00 30.00
- 21.00 36.00 11.00 18.00
12.00 9.00
- 19.73
Cl SOZS A-S04S NOZN T-NC3N T-NH4N
Country : FINLAND Station : TVARM!NNE Sal]:ller type : BllK Year : 1988
mn NC3N NH4N S04S-C Na
JAN S2.9 1.28 .75 1.67 1.60 .25 FEB 36.2 1.89 1.30 2.27 1.60 .31 W>R 40.5 1.57 .79 2.33 .83 .15 APR ~.9 .00 1.W 2.06 .~ .W MI\Y 34.9 .59 J~ 8.5 .01 JUL 77.0 .57 AIJ3 71.3 .38
.90 1.98 .21
.23 1.80
.25 1.76 .46
.27 1.08 .23
.12
.15
.07 SEP 61.5 .39 .32 .84 .73 .13 OCT 71.2 .58 .70 .86 1.70 .26 NCV 31.2 .82 .47 1.46 1.70 .26 DEC 86.7 .55 .31 .91 .93 .13
YEAR 603.8 .76 .56 1.43 .91 .17
SiJljlling period : 11JNTH..Y
Pb Cd Cu
Country : FINLMO Station : .xw.L.A Sal]:ller type : BllK Year : 1988 SiJljlling period : ~THLY
mn NC3N NH4N S04S-C Na Pb Cd Cu
JAN 45.3 1.46 1.30 1.91 1.10 .14 FEB 45.3 1.50 1.30 2.08 1.43 .18 W>R 56.9 1.W 1.W 2.~ .64 .W APR 36.6 .91 1.40 1.97 .39 .06 MI\Y 11.5 1.11 1.70 2.53; .84 .14 JIM 37.4 .95 .79 1.66 .42 .14 Jlt 58.5 .45 .15 1.06 .44 .05 AUG. 133.5 .18 .17 .57 .36 .03 SEP 31.3 .47 .36 .83 .83 .13' OCT 87.3 .42 .37 .61 1.05 .05 NCV 74.7 1.27 1.44 1.10 1.40 .30 DEC 75.7 .47 .41 .38 1.42 .17
YEAR 694.0 .74 .74 1.10 .96 .11
Zn
Zn
Cl S02S A-S04S NOZN T-NC3N T-NH4N
2.50 1.80
.90
.70
.10
.90
.60
.30 1.30 3.00 1.80 1.40
1.45
Cl SCZS A-S04S NOZN T-NC3N T-NH4N
1.70 - 1.00
.70
.50 1.10
.40
.50
.40 1.30 1.70 4.10 2.50
1.48

Country : FINLAND Station : YLIMARKKU Year : 1988
mn N03N NH4N S04S-C Na
128
Sarpler type : llllK Sa110ling peritxl : I{)NTI1..Y
Pb Cd Cu Zn Cl SC2S A-S04S hQ2N T -NQ1N T -NH4N ------------------------------------------------------------------------------------------------------- ------------
JAN FEB 1-wl N'R K~Y
JIJN JUL AUG SEP OCT NDV DEC
54.7 48.7 27.9 20.4 42.4 39.3
!32.9 100.6 71.0 49.7 15.3 37.9
.90 .92 1.15 1.11 .98 1.34 !.50 1.70 2.14 1.37 1.60 1.65
.59 .97 1.87
.51 .47 1.64
.14 .12 .57 .53
1.00 .75
.78 1.37
.87
.58
.73
.67
.54
.32
.70
.32
.24
.37
.35
.20
.32
.40
.97 1.48 2.60
.55 .87 . 71 1.02
.00
.11
.14
.13
.10
.10
.03
.03
.16
.13
.21
.13
.80 1.00
.60
.60
.30
.30
.30
.30
.40 1.10 3.70 1.60
------------------------ ---------------------------- ----------------------- --------------------------- ----YEM 648.8 .52 . 71 1.10 . 51 .09
========·-----"" -
Country : FINLAND Station : SIPOO Year : 1988
m11 003N NH4N S04S-C Na
Sarpler type : llllK S.,-pl ing pericd : I{)NlR Y
Pb Cd Cu --------------------------------- --------------------------------------
JAN FEB fWl APR MAY JIJN JUL AIJS SEP OCT NDV DEC
4.6 65.2 65.5 29.1 9.6
25.0 68.0
106.8 105.5 78.2 11.2 70.7
1.00 1.52 l.5C
.82
.44
.51
.32
.31
.35
.48
.41
.88 1.10 2.10
.84 3.70
.12
.15
.10
.31
.23
1.63 2.23 3.00 1.85 1.60 1.61 1.55 1.06
.86
.76 .68 1.40 .20 .55
.78
.81
.62
1.02 .61 .42 .45 .43
.55
.13
.13
.15
.18
.15
.07
.14
.11
.06
.65
Zn Cl ------------
1.60 1.50 1.30
.BC
1.10 .BC .70 .70
l.BC 3.20
.BC
SC2S A-S04S NC2N T-NC3N T-NH4N
---------------------------------
--------- ----------------------------------------------------------------------------------------------------YEM 639.4 .64 .58 1.38 .55 .11
=============~=====
Country : FINLAND Station : SU..VA Year : 1988
mn tmN NH4N S04S-C Na
-----------------------------------JAN FEB fWl APR ~y
JLW JUL AIJS SEP OCT OOV DEC
45.5 43.1 26.4 22.6 28.0 41.9
112.2 114.9 78.0 43.4 15.4 33.6
.89
.95
.58
.52
.35
.01
.17
.19
.09
.72
.56
.69
.74
.64
.53
.93 1.16 1.36 1. 07
.55 1.48
.10 1.28
.04 .59 .68 .57
.78
.43
.47
.39
.25
.18
.15
.20
.31 .20 .09 .05
1.07 .91 1.10
1.30 2.40 .59 .40 1.24
Sarpler type : BlJ..K Sarpling period : MONTHLY
Pb --------------
.18
.06
.07
.07
.10
.09
.09
.04
.07
.47
.37
.16
Cd Cu ---------------
1.08
Zn Cl
-------------1.20
.50 4.00
.40
.30
.20
.30
.20
.50 2.40 4.20 2.00
SC2S A-S04S NC2N T-ND3N T-NH4N
--------------------------------
-------------------------------------------------------------------------------------------------------------------- .89 .12 .46 .84 .31 .32 YEM 605.0 -----~
Country : FINLAND Station : KffiPPOO Year : 1988
129
Sarpler type : llllK Sarpling period : I{JNTJJ.Y
rrm N03N NH4N S04S-C Na Pb Cd Cu Zn Cl SC2S A-S04S ND2N T-N03N T-NH4N
JAN 52.6 1.57 1.50 2.69 1.31 .22 FEB 43.6 1.52 1.20 2.01 1.03 .15 fWl 45.8 1.04 .76 1.45 .56 .00 APR 32.6 .84 1.20 1.87 .37 .00 MAY 29.9 .70 .92 2.17 .35 .14 JU1 23.6 .68 - 3.57 .41 .58 JUL 100.0 .26 1.50 .86 .53 .02 AUG 100.7 .25 .38 .68 .25 .02 SEP 65.0 OCT 58.9 .66 .58 1.12 .96 .29 NDV 46.4 .33 .25 .42 .95 .12 DEC 72.3 .57 .29 .54 .66 .00
YEM 679.4 . 67
Country : SWEDEN Station : AAL.fl Year 1988
.83 1. 29 6, .
. 0 .12
Sarp l er type : WET ONLY Sarpling pericd : I{)Nlfl..Y
2.30 1.60
.60
.50
.30
.80
.80
.30
1.70 1.50
.90
.99
mn N03N NH4N S04S-C Na Pb Cd Cu Zn Cl S02S A--S04S ND2N T--N03N T -NH4N
JAN 120.0 .71 .68 1.13 .56 FEB 139.0 .68 .63 1.11 .98 fWl 61.0 .83 .53 .82 1.00 APR 38.0 .76 1.11 1.41 .88 ~y 14.0 .90 1.07 2.52 .29 Jllj 76.0 .47 .78 1.26 .12 Jll 154.0 .60 .71 1.20 .17 AIJS 73.0 .81 .94 1.09 .63 SEP 107.0 .53 .49 .84 .66 OCT 86.0 .53 .64 .89 .83 NDV 37.0 .53 .64 .72 1.98 DEC 85.0 .49 .51 .76 1.81
.00 4.35
.12 2.98
.12 2.69
.13 3.52
.12 3.12
.04 3.33
.04 3.49
.09 4.18
.09 3.74
.12 2.73
.23 2.14
.21 3.71
.21
.14
.12
.20
.46
.13
.11
.13
.11
.15
.IS
.12
12.60 1.12 13.10 1.10 10.10 1.75 15.00 1.78 48.60 .50 12.40 .18 11.20 .31 10.50 1.20 8.5C 1.29 8. 70 1.55
10.00 3.89 8.90 3.24
YEM 990.0 .63 .68 1.06 .76 .10 3.44 .14 - 11.53 1.41
Country : SWEDEN Station : ASPVRETEN Year : 1988
mn NC3N NH4N S04S-C
JAN 57.0 .89 .96 1.57 FEB 6C.O 1.22 1. 09 1. 64 fWl 17.0 1.12 .87 1.95 APR 25.0 .55 . 61 1.16 ~y 59.0 .24 .18 .52 JIJN 33.0 .35 .43 .98, JUL 122.0 .38 _.49 1.00 AUG 31.0 .39 :32 .77 SEP. 43.0 .52 .53 1.12 OCT 43.0 .46 .32 .64 NCV 29.0 .18 .05 .24 DEC 74.0 .24 .14 .33
Na
.50
.5C
.53
.10
.03
.07
.10
.14
.36
.44
.!3
.22
So110ler type : \H ONLY Sarpling period : MONTHLY
Pb Cd Cu Zn Cl S02S A-S04S NC2N T -ND3N T -NH4N
.00 5.72
.00 6.42
.10 4.78
.04 3.20
.01 2.01
.09 1.43
.00 3.35
.03 4.52
.06 5.09
.06 3.00
.02 1.26
.03 2.86
.31
.28
. 22
.07
.09
.05
.08
.26
.17
.17
.00
.15
19.70 .93 4.38 1.97 1.93 29.50 1.00 3.71 1.82 1.78 18.10 .95 2.42 2.51 1.33 7.70 .17 1.16 1.09 1.26
15.60 .09 .64 .99 1.22 7.40 .13 .42 1.23 2.69 7.50 .19 .38 1.40 .65
13.40 .29 .31 .69 14.60 .69 .58 .79 11.30 .82 .55 1.20 .88 8.00 .28 1.25 .60 1.86 9.60 .37 1.43 .53 2.01
.86 1.36
.78 1.31
.60 1.32
.53 1.01
.43 .95
.28 .72
.42 . 71
.29 .65
.37 .86
.50 1.03
.40 .57
.26 .26
YEM 593.0 .52 .49 .95 .24 .05 3.69 .16 - 13.40 .46 1.44 1.24 1.56 .48 .90

"·;t:'f,:¥;''"'~4iff' "' ''{0,.f ' · ;& &L
Country : S\.£DEN Station : RICKLEA Year : 1988
mn 003N NH4N S04S-C
JAN 64.0 .73 .65 1.26 FEB 69.0 . 79 .42 .95 I'M 32.0 .62 .41 1.40 APR 11.0 .50 .79 1.52 I'AY 11.0 .46 1.17 2.14 Jl!i 35.0 .50 .82 1.39 Jll 79.0 .15 .15 .56 ALJ3 SEP 73.0 .20 .22 .53 OCT 17.0 .57 .46 .98 NCV 8.0 .15 .08 .21 DEC 39.0 .22 .06 .19
Na
.23
.35
.11
.22
.19
.09
.17
.03
.05
.03
.07
.06
.03
.03
.16 .02
.38 .08
.40 .05
.31 .04
YEAA 438.0 .45 .39 .89 .22 .04
130
SaJT>ler type : BltK SaJT>ling peri<Xi : fllNTfLY
Pb Cd Cu Zn Cl
.39
.65
.16
.27
.23
.15
.23
.35
.61
.66
.53
.38
S02S A-S04S N02N T-NC3N T-NH4N
Country : SWEDEN Station : VAVIHILL SaJT>ler type : \.£T ONLY Year : 1988
JAN FEB I'M APR I'AY JW Jll ALJ3 SEP OCT NCV DEC
nm 003N
I39.0 .71 108.0 .77 52.0 1.30 38.0 .79 18.0 .67 79.0 .34
113.0 .55 70.0 .64 99.0 .61 74.0 .52 37.0 .60 86.0 .53
NH4N S04S-C Na
.56 1.47 .77
.49 1.23 1.64 1.01 1.68 1.56 1.17 1.84 1.13
.92 2. 04 .49
.56 1.03 .20
.48 .86 .27
.86 1.09 1.60
.58 1.02 1.34
.57 1.04 2.16
.91 .BO 2.26
.61 .86 2.29
.10
.21
.19
.16
.20
.07
.05
.19
.14
.24
.25
.26
Sa'l'ling peri<Xi : DAILY
Pb Cd Cu
YEAA m.o .86 .86 1.v 1.m .18
Country : SWEDEN Station : RORVIK Year : 1988
JAN FEB I'M APR W\Y JW Jll ALJ3 SEP OCT NOV DEC
mn 003N
140.0 .69 87.0 .89 40.0 1.45 50.0 1.35 24.0 .99 13.0 1.05
156.0 .52 72.0 1.00 79.0 .62 92.0 .70 30.0 .99 50.0 .70
NH4N S04S-C Na
.38 1.13 1.24
.52 1.26 3.10 1.02 1.86 1.31 2.06 2.52 1.11
.90 1.98 .60 1.31 2.30 1.02
.66 1.10 1.05
.83 1.23 1.53
.54 .89 2.49
.65 .98 4.44
.82 .90 1.94
.45 1.06 3.53
SaJT>ler type : WET ONLY SaJT>l ing peri <Xi : DAILY
.15
.39
.16
.16
.10
.17
.15
.18
.28
.52
.21
.38
Pb Cd Cu
YEAA 833.0 .80 .71 1.26 2.03 .25
Zn Cl S02S A-S04S N02N T-NC3N T-NH4N
1.30 8.50 1.90 2.50 1.16 1.81 - 3.00 5.30 1.59 1.50 .82 1.40
3.40 3.90 1.87 1.10 .84 1.96 - 2.40 4.20 1.81 .80 1.12 2.13
1.00 1.80 1.45 .70 .83 1.91 .70 1.10 1.53 .70 .69 2.26 .50 2.60 1.92 .60 1.65 .73
2.30 3.10 1.20 .80 .85 1.67 1.90 3.30 1.35 1.10 .65 2.46 3.30 3.80 1.37 1.10 .91 2.15 3.00 5.10 1.43 2.20 .87 1.46 4.30 4.10 .71 1.90 .51 1.00
- 2.16 3.90 1.51 1.25 .91 1.75
Zn Cl 502S A-S04S N02N T-003N T-NH4N
- 2.30 4.90 1.87 6.40 3.80 1.58 2.00 3.40 1.73 2.30 2.30 1.73 1.40 1.60 1.54 2.70 1.30 1.40 1.80 1.60 1.86 2.20 1.80 1.46 3.70 3.00 1.73 7.00 3.10 3.45 3.10 4.20 2.93
- 8.10 2.90 2.68
2.80 1.80 1.90 1.50 1.30 1.10
.90 1.40 1.50 2.20 4.00 2.80
.90 1.38
.69 1.06
.56 1.23
.97 1.67
.78 1.79
.67 1.13
.73 1.62
.65 1.39
.44 1.00
.63 1.39
.52 1.07
.31 .50
- 3.62 2.82 2.00 1.93 .65 1.27
Country : SWEDEN Station : lm.RG Year : 1988
mn NC3N NH4N S04S-C Na
131
SaJT>ler type : WET ONLY Sampling period : DAlLY
Pb Cd Cu Zn Cl S02S A-S04S NC2N T -003N T -NH4N ------------------------------------------------------------------------------------------------------- ------------
3.40 7.10 2.48 2.20 3.90 4.10 2.13 1.20 1.80 2.50 1.96 .60 .80 1.20 1.08 .70 .40 1.20 1.16 .60 .20 .80 1.25 .40 .70 1.20 1.33 .30
2.30 .80 .98 .30 3.70 1.80 1.83 .40 5.10 1.90 1.32 .80 2.90 2.40 .74 1.20 4.50 2.60 .60 1.00
JAN 34.0 1.86 1.30 2.92 2.32 .34 FEB 30.0 1.80 .97 2.29 2.81 .40 I'M 15.0 1.80 1.86 2.85 1.50 .23 APR ~.o .m .~ 2.~ .56 .m ~ V.O .~ .66 1.~ .M 04 JUN 61.0 .38 1.23 1.38 .16 .11 Jll 96.0 .48 2.06 1.55 .60 .14 ALJ3 29.0 .55 3.74 1.35 .86 .11 SEP 36.0 .85 1.77 1.45 2.53 .39 OCT 18.0 1.25 .56 1.41 3.32 .51 NOV 19.0 .76 .28 .64 2.07 .25 DEC 22.0 .95 .53 .66 3.08 .33 --------------------------------------------------------------------------------------------------------------------YEAA 412.0 .85 1.49 1.66 1.34 .22
Country : USSR Station : NIOA Year 1988
mn 003N NH4N 504S-C Na
SaJT>ler type : I<£T ONLY Sa!T>l ing peri <Xi : DAILY
Pb Cd Cu Zn
1.98 2.30 1.40 .81
Cl S02S A-504S N02N T -oo:JN T -NH4N* --------------------------------------------------------------------------------------------------------------------JAN ~.8 1.rn .~ 1.m 600 FEB 3.1 1.10 .70 1.28 1.40 I'M 22.4 1.30 .70 1.~ 1.20 APR 27.7 .90 .40 1.28 20.60 I'AY 11.2 .~ 1.30 2.47 1.50 Jl!i 23.8 .70 .78 1.40 Jll 10.2 .10 7.20 1.54 .70 AUG 3.6 .90 .10 1.01 11.80 SEP I5.6 1.~ 1.00 3.14 3.10 OCT 19.6 1.00 .20 .76 19.60 NOV 5.0 3.10 1.60 <.89 53.60 DEC 12.4 .80 .20 .76 14.80
.30 1.40 .10
.~ 2.30 .20
.60 2.IO .20
.10 1.00 .10
.20 1.40 .10
.rn 1.40 .2o 1.40 .10
.10 .90 .10
.10 .70 .10
.40 .80 .10 1.10 .80 . rn .40 .80 .10
.30 1.10
.40 2.80
.40 1.30
.40 1.10
.30 1.30
.20 .80
.20 1.10
.10 .40
.10 .40
.40 .90
.30 .90
.20 .60 --------------------------------------------------------------------------------------------------------------------YEAA 170.4 1.04 1.01 1.44 9.86
*) ReJX)rting NH4+
Country : USSR Station : SYRVE Year : 1988
mn NC3N NH4N S04S-C Na
.35 1.25 .12 .27 1.06
SaJT>ler type : WET ONLY Sampling period : DAILY
Pb Cd Cu Zn Cl 5025 A-S04S N02N T-NC3N T-NH4N* --------------------------------------------------------------------------------------------------------------------JAN 27.7 .60 .20 .44 3.10 FEB 13.9 3.60 2.20 2.60 8.40 I'M 21.1 1.60 1.80 2.24 6.70 APR 19.8 1.~ 1.40 2.17 2.70 I'AY I3.6 Jl!i 16.1
1.60 .80 2.61, 1.10 .10 1.70 3.42 .90
Jll 358.7 .40 '.70 .75 .60 ALJ3 86.6 .20 .10 .61 l.W 5EP 63.6 .50 .40 .36 .~ OCT 48.4 .50 .30 .77 2.70 NOV 31.6 .70 .40 .56 5.20 DEC 70.6 .60 .20 .17 3.90
.10 . 70 .10 .20 .90 .10 .20 1.60 .10 .40 .80 .20 .20 .70 .10 .~ .40 .10 .50 .30
.50 .30
.50 1.30 2.50
.10
.10
.10
.10
.20
.10
.20
.20
.20
.20
.20
. 20
.10
.60
-------------------------------------------------------------------------------------------------------------------YEAA 771.7 . 56 . 60 . 83 1.74 .12 .56 .78 .10 .21
========-"" *) Reporting NH4+

Coontry : USSR Station : RUTSAVA Year : 1988
nm tmN NH4N 504S-G Na
132
Sal!> l er type : I.£T OOL Y Sal!> l i ng period : llli!L Y
Pb Cd cu Zn Cl SOZS A-504S NC2N T-N03N T-NH4N*
--------------------------------------------------------------------------------------------------------------------JAN FEB WR APR MI\Y J~
Jll AlG SEP OCT NCV DEC
36.6 .70 29.8 1.40 39.7 .50 32.0 .60 19.3 .50 70.8
150.6 .20 30.9 .30 92.4 .50 70.4 .50
105.8 .70 82.5 .50
.60 2.02 2.20
.40 .99 1.30
.10 1.11 1.10
.60 .80 1.20
.20 1.56 .50
.30 .67 .40
.20 1.06 .50
.10 1.33 .80
.20 .57 1.50
.20 .32 1.00
.50 .69 1.30
.40 1.03 2.00
- 3.30 1.40 1.70 .30 1.60 - 7.00 1.40 1.40 .40 1.40
2.30 1.40 1.80 .20 1.30 .70 .80 1.50 .10 .80 .60 .90 1.80 .20 .90 .20 .60 1.80 .20 .70 .10 .90 2.00 .20 .70 .10 .60 1.50 .10 .50 .10 .50 1.50 .10 .50 .50 1.30 1.40 .20 .60 .70 .50 1.60 .10 .30 .90 3.90 1.70 .10 .40
--------------------------------------------------------------------------------------------------------------------YEAR 760.8 .51 .31 .90 1.12
*) Rep:lrting NH4+
Coontry : USSR Station : LAI£W\A Year : 1988
nm tmN NH4N 504S-C Na
1.38 1.18 1.64 .18 .81
5al!>ler type : I.£T OOLY Sal!>ling period : GAILY
Pb Cd Cu Zn Cl 502S A-504S N02N T-NC3N T-NH4N*
--------------------------------------------------------------------------------------------------------------------JAN 2.1 2.20 FEB 5.5 .50 WR 36.3 .70 APR 24.2 .30 MI\Y 19.9 .80 J~ 10.1 .10 JUL 107.1 .10 AlG 57.5 .20 SEP 34.8 .30 OCT 41.0 .40 NCV 39.0 .20 DEC 41.9 .30
1.20 3.51 1.10 .10 2.27 .30 .40 1.55 .60 .10 .52 1.00
1.30 1.86 .50 1.07 .40
.10 1.08 .20
.60 1.77 .30
.30 .76 .50
.30 .57 .30
.40 .37 1.50 .30 1.20
.80 .90 .80 1.30 1.60 1.40
.90 1.90 1.40
.40 1.00 1.40
.30 . 70 .70
.20 .80 .60
.20 .60 1.20
.10 .50 .70
.10 .50
.10 .30 2.80
.20 .30 1.90
.50 .20 1.40
.10 1.10
.20 1.30
.10 1.40
.10 .80
.10 .50
.10 .70
.10 .30 .30 .30
.10 .40
.50 .20 .20
--------------------------------------------------------------------------------------------------------------------YEAR 419.4 .30 .35 1.03 .57
*) Reporting NH4+
Coontry : PQANO Station : LE!l'. Year : 1988
nm tmN NH4N 504S-C Na
5al!>ler type : BllK 5al!>ling period : GAILY
Pb Cd cu
.43 .77 1.30 .16 .62
Zn Cl 502S A-504S N02N T-NC3N T-NH4N
--------------------------------------------------------------------------------------------------------------------JAN 39.2 FEB 29.7 WR 35.6 APR 35.2 MI\Y 26.2 J~ 59.0 Jll 225.0 AlG 40.9 SEP 64.5 OCT 17.7 NCV 42.8 DEC 56.3
.71 .49 1.17 .64
.76 .48 1.51 1.20
.72 .47 1.47 1.15
.66 .90 2.17 1.01
.63 2.74 4.41 .44
.30 .90 1.11 .24
.35 .88 1.50 .lB
.92 1.32 2.18 .63
.53 .67 1.16 1.07 1.12 .70 2.32 3.21
.85 .39 .88 3.63
.67 .30 1.30 1.42
.10 9.70
.16 10.00
.14 19.00
.14 14.50
.10 7.60
.07 6.00
.05 14.00
.12 22.00
. 17 15.00
.31 17.00
.42 11.00
.16 11.00
48.00 1.33 25.60 2.39 33.00 2.12 28.00 2.03 4.10 .30 1.80 36.60 1.18 4.20 .80 1.30 27.70 .83 3.20 .20 1.50 36.00 1.02 9.00 1.40 1.30
- 109.00 2.47 6.00 .40 1.80 - 44.00 2.60 11.00 . 50 .70 - 135.00 5.14 15.00 .50 .80 - 78.00 6.40 11.50 .40 .80 - 24.50 2.67 9.50 .60 1.00
--------------------------------------------------------------------------------------------------------------------YEAR 672.1 .56 .82 1.57 .88 .13 13.13 - 44.49 2.03 8.17 .57 1.22
Coontry : IXJl Station : KAP ARKOOA Year : 1988
nm tmN NH4N 504S-C Na
133
5al!>ler type : I.£T OOLY Sal!> l i ng period : I.£EKL Y
Pb Cd cu Zn Cl 502S A-504S NC2N T-NC3N T-NH4N --------------------------------------------------------------------------------------------------------------------JAN FEB WR APR MI\Y J~
Jll AlG SEP OCT NCV DEC
82.3 .60 42.0 .90 35.9 1.30 28.3 1.30 33.1 1.00 31.8 .70 95.0 .70 28.4 1.10 61.8 .50 45.4 1.20 28.8 .90 36.8 .60
.50 2.34 .70
.90 2.42 2.20 1.10 2.90 1.20 3.50 5.09 1.30 1.30 3.07 .40
.70 1.66 .50
.60 1.65 .60 1.70 2.32 1.00
.60 1.49 1.30 1.50 3.67 1.60 .70 2.17 1.50 .50 1.86 6.40
.20
.40
.30
.30
.10
.10
.10
.20
.20
.30
.30
.90
2.00 9.80 4.50 3.90 4.60 3.40 1.50 1.30 2.20 4.30 2.50 1.00 3.30 2.90 1.50 1.70 1.00 1.60 1.50 1.40 .80 .80 2.20 1.20
1.10 1.30 2.30 1.30 1. 50 1.10 1.40 1.40 2.20 1.70 1.30 1.70 3.20 3.80 1.90 2.60 2.90 4.30 1.20 3.00
- 11.90 2.20 1.00 2.90 -----------------------------------------------------------------------------------------------------------------YEAR 549.6 .83 .97 2.38 1.41 .26 - 2.80 3.10 1.90 1.95
Coontry : FRG Station : lll\NISCH-N!ENHDF Sal!>ler type : I.£T OOLY Year : 1988 S<>!Jlling period : I.£EKLY
nm tmN NH4N 504S-C Na Pb Cd Cu Zn Cl S02S A-504S N02N T-NC3N T-NH4N --------------------------------------------------------------------------------------------------------------------JAN FEB WR APR MI\Y J~
Jll AlG SEP OCT NCV DEC
104.0 .67 .93 2.41 81.0 .55 .69 2.97 67.0 .76 1.09 1.29 10.0 1.83 1.72 2.63 76.0 .81 .73 .70 37.0 .72 .94 .94
124.0 .92 .81 1.12 42.0 .83 .77 .87 89.0 .90 .83 1.16 78.0 1.00 .91 1.39 48.0 1.41 1.12 1.11 67.0 .37 1.56 .87
-----------------------------------------YEAR 823.0 .82 .93 1.44
Coontry : DEfi'W1K Station : KELOSNOR Year : 1988
nm tmN NH4N 504S-C Na
7.73 4.30 4.34
- 2.43 1.97 2.20 4.89 4.31 6.22 5.63
- 7.12 3.23
.14
.24
.20
.70
.11
.16
.08
.17
.13
.27
.17
.97
6.64 6.33 7.40 4.37 9.21 7.70 8.26 10.00 5.37 3.53 4.89 1.20 6.05 .91 5.11 1.19 7.10 3.52 5.62 5.10 6.44 5.63 4.35 11.85
---------------------------------------------------------------------------- 4.90 .23 6.34 4.71
5al!>ler type : I.£T OOLY Sal!>ling period : GAILY
Pb Cd cu Zn Cl 502S A-504S NC2N T -tmN T -NH4N --------------------------------------------------------------------------------------------------------------------
69.5 46.3
.81
.86 58.9 .88 3.4 4.81
42.5 .88 .57 .81
. 71 1.16 4.58
.78 1.14 8.91
.78 1.06 3.00
.52
.97
.36 5.11 1.25
.75
B.17 26.50 1.59 2.03 5.89 .63
1.04
JAN FEB WR APR MI\Y J~
Jll Ali; SEP
27.6 81.6 8.3 1.72 2.71
1.05' 1.12 1.86
.92 1.50 2.05
.16
.21
.32 1.1
OCT . . 4.3
NCV DEC
16.2 22.8
1.20 .95 .55
7.62 1.25 2.20 15.35
.64 1.21 5.34
.69 1.03 12.49
1. 22 . 1.93'
.84 1.50
8.14 5.80 2.62 14.18 3.81 1.81 4.19 3.92 2.54
47.33 3.48 2.80 10.16 1.68 2.28 1. 93 1.19 1.12 2.57 1.65 1.91 3.83 1.59 1.65
2.50 1.82 23.60 4.74 2.83 10.96 4.96 1.60 21.79 1.78 1. 03
--------------------------------------------------------------------------------------------------------------------YEAR 382.5 .87 .95 1.31 4.86 .56 - 8.21 3.09 2.00

134 135
ANNEX 5
Annual statistics on HELCOM/EGAP data 1989

136
N N ,·- : ....- :
c -------------~·--------------------------
8 --"'C'C------;;-;-------------N N r- ~
~ -~1----------------0l
11J (~
r?. UJ
8
N ,--·
' + (') o;;j'
Or zz + +
"' 0 (") z.:r IZ !I !l
~Jp 1- r=
~· ' '
Country : Station Year
FINLMO W\ILLOTO 1989
137
Sa1pler type : llli.K Saipling perio.J : IIONTii.Y
mn NC3N NH4N 5045-C llg Pb Cd Cti Zn Cl 5015 A-5045 N01N T-N03N T-NH4N -------------------------------------------------------------------------------------------------------------------------JAN 57.2 .78 .48 .85 .63 .11 FEB 46.1 1-Wl 59.1 APR 19.2 HAY 52.9 JLW 15.3 Jlt 45.1 ALG 71.8 SEP 18. 7 OCT 39.3 NOV 54.6 DEC 16.3
.53 .29 .57 .41 .07
.67 .37 1.07 .31 .04
.97 1.60 2.44 .67 .11
.32 .11 .78 .29 .05
.23 _04 .78 .24 .04
.03 .01 .38 .26 ,06
.11 .07 .69 .14 .03
.79 2.60 2.14 .74 .11
.16 .11 .78 .15 .44
.36 .n .n .38 .o5
.84 ,82 1.41 1.08 .15
_go _40
AO _40
.20
.10
.30
.10
.80
.30
.30 1.70
--------------------------------------------------------------------------------------------------------------------YEAR 505.6 .44 .38 .89 .38 .09
Coontry : F!NLMO Station : HA!LLOTO Year : 1989
mn NC3N NH4N 5045-C
.43
Sall)Ier type : llli.K Sa1pling period : W!'EKLY
Pb Cd Cu Zn Cl 5015 A-5045 N01N T-NC3N T-NH4N ---------------------------------------------------------------------------------------------------------------------JAN 31.0 .39 .07 .35 FEB 33.7 .43 .19 .50 1-Wl 41.6 .75 .38 1.05 APR 6.0 1.40 1.75 6.55 HAY 30.1 .34 .19 1.09 JLI< 8.7 .56 .57 .56 Jlt 18.4 .13 .16 .53 ALG 65.1 .31 .48 .85 SEP 4.9 .76 .71 1.96 OCT 29.4 .29 .18 .64 NOV 31.7 .41 .13 .70 DEC 10.4 .44 .18 .41
.04 1.90 .08
.04 5.30 .10
.03 7.10 .15
.16 19.5C .68
.04 7.30 .17
.09 3.70 .11
.05 3.00 .11
.04 3.50 .07
.07 8.90 .36
.03 2.SC .09
.05 4.80 .17
.07 7.80 .14
- 49.00 - 171.00 - 97.00 - 135.00 - 129.00
19.00 - 15.00 - 11.00 - 359.00
19.00 - 19.00 - 34.00
YEAR 312.2 .35 .86 --------------------------------------------------------------------------------------------------------------------
.46
Coontry : FINLMO Station : VIROLAHTI Year : 1989
mn NC3N NH4N 5045-C
.05 5.23 .14 - 65.90
Salj)Ier type : llli.K Salj)ling period : DAILY
Pb Cd Cu Zn Cl SC1S A-5045 N02N T-N03N T-NH4N --------------------------------------------------------------------------------------------------------------------JAN 41. 5 .67 .43 .95 FEB 44.4 1-Wl 38.1 APR 28.4 HAY 36.1 JLW 49.5 JQ 66.9 ALG 196.5 SEP 24.0 OCT 80.6 NOV 44.5 DEC 60.2
.81 .74 1.10 1.13 1.53 1.38 .55 1.53 1.88 .57 1.07 1.68 .46 .57 1.11; .11 .33 .87 .29 '.58 .98 .69 .90 1.79 .18 .31 . 76 .sc .92 1.47 .46 .40 .89
.73
.85
.51
.08
.14
.11
.09
.10
.31
.34
.32
.37
.08
.13
.17
.07
.11
.08
.07
.03
.16
.06
.07
.07
1.13 1.44 1.17 .29 .35 .15 .35 .14 .70 .69 .68 . 71
.56 .75
. 74 1.41
.61 1.08
.41 1.07
.29 1.31
.10 .73 .11 .89 .40 1.04 .33 .79 .43 1.04
1.30 1.20 1.60 1.10 1.90 1.40 1.10 1.00 1.30 1.70 1.90 3.00 .38 .63
.66 1.16 --------------------------------------------------------------------------------------------------------------------YEAR 710.9 .47 .28 .07 .58 1.79 .41 1.01

Coontry : FINLAND Station : VIRcx..AHTI Year : 1989
mm 003N NH4N S04S-C Na
138
Sa'Vler lYJ>' : BU.K 5a'1' 1 i ng peri cxl : f!JNTfl Y
Pb Cd Cu Zn Cl SC2S A-S04S N02N T-N03N T-NH4N ------------ - -----------------------------------------------------------------------------------------------------
JAN 41.5 FEB 44.4 f.Wl 38.2 APR 2B.4 MI\Y 36.2 Jll'< 49.5 JLt 86.9 AIJ3 196.5 SEP 24.0 OCT 80.6 NOV 44.5 occ 60.2
.91 .72 1.22 1.12 1.30 1. 54 1.41 1.80 2.76
.B5 2.00 2.58
.80 .B5 2.17
.31 .23 1.08
.05 .09 1.08
.36 .54 1.2B
.69 1.70 2.16
.38 .23 1.06
.82 1.30 2.35
.76 .39 1.34
.95
.76
.49
.25
.32
.22
.23
.2D
.43
.43
.60
.69
.12
.15
.19
.13
.19
.10 '10 .08 .21 .17 .13 .10
1.10 1.30 1.10
.4D
.50
.20
.4D
.30
.80
.80
.80 1.00
--------------------------------------------------------------------------------------------------------------------YEAA 710.9 .58 .71 1.52 .41 .12
Coontry : FINLAND Station : UTO Year : 1989
mm N03N NH4N S04S-C Na
5a'1'ler tYJ>' : BU.K Sa'Vling pericxl : DAILY
Pb Cd Cu
.63
Zn Cl SC2S A-S04S N02N T-N03N T-NH4N
------------------------------------------------------------------------------------------------------------JAN FEB f.Wl APR MI\Y Jll'< JLt AIJ3 SEP OCT NOV occ
19.0 1.29 31.3 1.34 45.7 1.19 43.4 .72 25.1 1.14 53.9 .39 77.7 .29 49.0 .73 16.B .54 55.5 .75 69.0 .60 45.9
.54 1.06 3.17
.98 1.79 3.82
.86 1.22 2.11 1.38 2.27 .58 1.38 2 '76 1.77
.95 1.43 .52
.52 1.03 .59
.94 1.77 1.32
.30 .9D 1.11
.47 1.02 1.71
.70 .94 2.22
.33
.55
.26 '12 .22 .10 .11 .16 '12 .20 .21
5.44 7.14 4.11 1.06 2.76
.85
.98 2.38 1.82 2.95 2.B7
1.50 1.20 1.70 1.60 1.40 1.10 1.00 1.20 1.40 1.20 1.70
.26
.39
.49
.39
.46
.46
.57
.76
.86
.52
.55
.45
-------------------------------------------------------------------------------------------------------------YEAA 532.3 .72 .B1 1.40 1.54 .20
Coontry : FINLAND Station : f\IW'AWJU Year : 1989
mm N03N NH4N S04S-C Na
2.59 1.36 .41 .62
5a'1'ler lYJ>' : BU.K Sa'Vling period: \.£EKLY
Pb Cd Cu Zn Cl S02S A-S04S N02N T-N03N T-NH4N - ------------------------------------------------------------------------------------------------------------ -
JAN 30.5 .59 .32 .80 FEB 31.0 1.12 .83 1.46 f.Wl 27.7 1.59 1.35 2.92 APR 1B.2 1.38 2.43 4.71 MI\Y 15.2 1.04 2.92 2.86 Jll'< 6.4 1.25 .55 1.29 JUL 35.5 .42 .56 1.51 AIJ3 69.7 .55 1.02 1.84 SEP 10.5 1.1B 1.30 2.91 OCT 54.1 .55 .43 1.37 NOV 20.4 1.42 1.17 4.17 DEC 35.B .74 .36 1.42
.10 6.50 .11
.18 15.90 .2B
.29 19.30 .62
.34 67.50 .81
.25 B.90 .14
.37 13.20 '16
.19 1B.40 .06
.10 49.20 .29
.24 14.00 .22
.14 8.40 .26
.32 20.30 .36
.14 6.00 .19
15.00 - 24.00 - 90.00 - 276.00
13.00 20.00 54.00 97.00 24.00 61.00 99.00 19.00
--------------------------------------------------------------------------------YEAA 355.0 .84 .93 2.00 .1B 22.50 .2B - 67.53
------------------------------
Coontry : FINLAND Statioo : TVARMINNE Year : 1989
mn N03N NH4N S04S-C
JAN FEB f.Wl APR MI\Y Jll'< JLt AIJ3 SEP OCT NOV DEC
39.3 56.9 45.1 41.9 28.4 30.9 25.7 75.2 19.8 54.9 67.3 68.5
.96 .49 1.08
.79 .59 1.06 1.27 .98 1.62
.91 1.50 2.38 1.20 .35 3.54
.28 .14 1.08
.15 .43 .96
.03 .23 1.45
.77 2.60 2.54
.86 .75 1.54 .78 1.20 1.83 .86 .35 .84
Na
1.46 1.70
.99
.25
.67
.23
.51
.55
.71
.76
.81
.76
.19
.23
.15
.16
.24
.07 '17 .16 .33 .12 .11 .12
YEAA 553.9 .70 .72 1.55 .B2 .16
139
Sa110ler lY!>' : IJUX Sa'Vling pericxl : fUNlllY
Pb Cd Cu
Coontry : FINLAND Station : JOMALA Sa'Vler lYJ>' : BU.K Year : 1989 Sa1101ing pericxl : fUNTflY
mm N03N NH4N S04S-C Na
JAN 11.6 1.99 2.20 1.66 1.70 FEB 32.0 1.31 1.60 2.13 2.00 f.Wl 45.5 1.52 1.50 1.53 .B7 APR ~.2 .~ 1.60 2.~ .W MI\Y 21.2 .95 1.40 2.34 .69 D 9.5 .m .60 1.08 .M JLt 50.2 .2B .46 .96 .43 AIJ3 130.5 .40 .41 .94 .70 SEP 26.6 .50 .68 .97 .40 OCT 46.9 .72 .79 1.12 .96 NOV 101.4 .53 .73 1.04 .66 occ 54.5 .m .62 1.69 1.m
.20
.25
.10
.10 '17 .07 .11 .10 .07 .13 .08 .15
YEAA 613.1 .64 .B2 1.29 .77 .11
Pb Cd Cu
Coontry : FlNLAND Station : RAHJA Year : 1989
5a'1'ler lYJ>' : BLtK Sa'Vl ing pericxl : f!JNTIU
mm N03N NH4N S04S-C Na Pb Cd Cu
JAN 65.3 .31 .11 .36 .47 .06 FEB 38.5 .51 .29 .54 .75 .11 f.Wl 39.9 .80 .47 1.~ .30 .06 APR 17.1 .94 1.40 2.99 1.31 .15 MI\Y 39.8 .30 .27 .96 .43 .16 Jll'< 42.2 .16 .37 .96' .44 .08 JLt 96.1 .03 .Q5 .2B .23 .11 AIJ3 90.2 .03 .\7 .39 .17 .06 SEP . 1B.2 .37 .83 1.69 1.34 .79. OCT 40.4 .m .16 .~ .M .06' NOV 43.9 .25 .15 .45 .60 .11 occ 14.7 .89 .13 1.30 7.20 1.24
YEAA 546.3 .2B .25 .67 .62 .14
Zn
Zn
Zn
Cl SC2S A-S04S N02N l I¥1Jil I I#HN
2.50 2.70 1.70
.50
.80
.20
.80
.80 1.10 1.10 1.10 1.30
1.27
Cl 5025 A-S04S N02N T-N03N T-NH4N
2.90 3.20 2.00
.60
.70
.20
.80 1.10 .60
1.30 .70
2.00
1.17
Cl S02S A-S04S N02N T-N03N T-NH4N
.60 1.00
.40 1.60
.50
.50
.20
.40 2.70
.60
.60 11.50
.89

'41''1! ------------------------
Country : FINLAND Station : YLIMARKKU Year : 1989
Na
140
Sarpler twe : BLlK Sarplir(JJ"riod : IWTflY
Pb Cd Cu Zn Cl S02S A-S04S N02N T-tll3N T-NH4N 1!111 tll3N NH4N S04S-C
--------------------------------------------------------------------------------------------------------------------JAN 45,6 .64 .72 .94 .67 .08 FEB 56.3 .70 .79 1.26 .53 .12 f.Wl 65.2 1.04 1.05 1.66 .42 .06 APR 17.1 1.00 1.90 2.86 .44 .12 MAY 43.5 .48 1.40 2.07 .41 .17 JUN 35.B .28 .40 1.18 .23 .10 Jl.t 88.2 .00 .08 .29 .16 .04 AUG 61.8 .33 .91 1.48 .25 .06 SEP 33.6 .4S 2.32 2.07 .36 .00 ~ ~.8 .44 l.W 1.29 .U .06 NOV 58.6 .51 .80 1.03 .79 .06
1.10 .70 .70 .50 .30 .20 .10 .40 .50 .30 .50
2.40 E 29.2 .~ !.SO 1.29 l.E .ill --------------------------------------------------------------------------------------------------------------------YEAA 584.7 .~ .92 1.29 .44 .08
Country : FINLAND Station : SIPOO Year : 1989
1!111 tll3N NH4N S04S-c Na
Sarp 1 er t we : BLlK Sarp1ir(JJ"riod : IWTflY
Pb Cd Cu Zn
-----------------------------------------------------------------------------JAN 32.1 .67 .36 .94 .88 .11
FEB 88.B .67 .80 1.45 .56 .13
f.Wl 65.1 APR 44.4 .64 1.30 1.98 .25 .12
MAY 26.2 .85 1.20 2.86 .48 .32
JUN 26.8 .44 .62 1.38 .24 .07
JUL 82.1 .07 .11 .78 .23 .10
AUG 119.4 .30 .18 .89 .14 .08
SEP 30.5 .53 .55 1.49 .15 .22
OCT 51.4 .37 . 22 1.14 . 71 .14
NOV 44.2 .71 .78 1.44 .77 .13 .65 .11
.55
Cl S02S A-S04S NC2N T-NC3N T-NH4N
---------------------------------------1.20
.80
.40
.70
.20
.30
.20
.80
.90
.80 1.20
DEC 80.7 .73 .48 .95 --------------------------------------------------------------------------------------------------------------------YEAA 67!.7 .49 .51 1.24 .42 .12
Country : FINLAND Station : SULVA Year : 1989
1!111 tll3N NH4N S04S-C Na
.62
Sarpler twe : BLlK Sarplir(JJ"riod : IWTfLY
Pb Cd Cu Zn C1 S02S A-S04S NC2N T-NC3N T-NH4N
--------------------------------------------------------------------------------------------------------------------JAN 32.2 FEB 56.8 f.Wl 55.1 APR 23.3 MAY 45.5 .30 .58 1.14 .76 JUN 14.6 .01 .35 .37 .33 JUL 23.4 .11 .10 .28 .25 AUG 90.2 .03 .29 .48 .23 SEP 14.7 .67 1.00 1.44 .72 OCT 50.2 .37 .77 .77 .30 NCV 63.0 .48 .84 .85 .61
.32
.12
.10
.11
.44
.05
.00
.36
!.40 .70 .30 .40
!.80 .50 .70
4.70 DEC 22.9 1.16 2.40 2.11 2.30 --------------------------------------------------------------------------------------------------------------------YEAA 49!.9 .32 .68 .83 .56 .16 .99
Country : FINLAND Station : KffiPPOO Year : 1989
141
Sarp1er twe : !UK Smpl ir(l period : !WTILY
ll111 tll3N NH4N S04S-C Na Pb Cd Cu Zn C1 S02S A-S04S N02N T-IKJJN I IIHii
JAN 19.0 .90 .52 1.02 .99 .12 FEB 31.3 .93 .98 1.59 1.30 .19 f.Wl 45.7 1.55 1.50 .53 .86 .13 APR 43.4 .n 1.@ 1.98 .~ .12 MAY 25.1 .76 1.20 1.95 .61 .18 JUN 53.9 .27 .45 1.19 .17 .05 JUL 77.7 .40 .29 1.47 .31 .08 AUG 49.0 .55 .51 1.46 .51 .10 SEP 16.8 .38 .80 .96 .45 .06 OCT 55.5 .54 .50 .85 .59 .08 NOV 69.0 .53 .30 1.25 .59 .06 DEC 45.9 .50 ,29 .61 1.05 .12
YEAA 532.3 .63 .65 1.23 .59 .10
Country : SI.£DEN Station : M.!P Year : 1989
Sarpler twe : I.£T ONLY Sarp 1 i r(l J"ri od : !WTIU
1.50 2.20 !.70 .30 .50 .10 .40 .90 .60 .90 .70
!.70
.88
mn tll3N NH4N S04S-C Na Pb Cd Cu Zn C1 S02S A-S04S NC2N T-N03N T-NH4N
JAN ~.0 l.W 1.48 1.53 1.~
FEB 49.0 1.30 1.53 1.49 1.69 f.Wl 93.0 .92 .88 .98 1.82 APR 38.0 .82 1.21 1.89 .25 MAY 20.0 1.03 1.14 1.64 .75 JUN 47.0 1.10 1.55 3.20 .14 JUL 52.0 .32 .31 .58 .81 Al.G 63.0 .47 .32 .90 .33 SEP 31.0 .84 1.12 1.54 .23 OCT ~.0 .59 .65 .Bl .54 NOV 19.0 .61 .71 .95 .70 E 80.0 .hl .50 .69 1.29
.25 7.20 .25
.22 5.32 .43
.22 4.27 .22
.08 5.1B .21
.14 2.13 .17
.05 4.12 .20
.11 .68 .04
.05 2.10 .11
.04 3.07 .14
.08 2.40 .10
.10 3.59 .17
.15 2.35 .10
17.00 3.77 3.63
17.40 3.77 19.40 .57 19.40 !.53 15.50 .33 6.40 !.63
10.90 .73 12.30 .51 7.80 !.lB
12.90 !.46 9.30 2.35
YEAA 585.0 .78 .87 !.24 .93 .13 3.38 .17 - 12.75 !.92
Country : SI.£DEN Station : ASPVRETEN Year : 1989
Sarp 1 er twe : I.£T ONLY Sarp1ing period : !WTfLY
mn tll3N NH4N S04S-c Na Pb Cd Cu Zn C1 S02S A-S04S NC2N T-NC3N T-NH4N
JAN 5.0 .46 .21 .66 .85 FEB 38.0 1.13 1.68 2.02 .63 MAR 47.0 .82 .78 .97 .41 ~ W.O .% 1.U 2.~ .38 MAY 2B.O .63 .34 1.68 .21 JUN 29.0 .16 .79 .05 n w.o .54 .. 82 2.38 .w AUG 53.0 .49 .44 !.20 .11 SEP 20.0 .43 .17 .68 .26 OCT 38.0 .70 .54 1.10 .27 D ~.0 .34 .ll .60 .W DEC 35.0 .53 .17 .56 .33
.41
.18 12.90
.09 5.50
.19 9.00
.07 2.00
. 01 1.10
.04
.03 2.20
.05 1.80
.os 3.70
.03 3.20
.04 1.70
.60
.29
.43
.16
.04
.11
.11
.19
.10
.12
YEAA 38!.0 .61 .62 !.24 .27 .07 4.24 .22
10 413399X '
!.63 40.00 !.16 20.00 .88
.75 20.00 .51 6.00
.32 12.00 .30 10.00 .51 17.00 .54 6.00 .37
1!.00 .66
- 16.!0 .61
3.48 !.96 !.96 !.00
.85
.70
.64
.85 !.30 !.59 2.17 2.18
.51 .79
.58 !.07
.78 !.32
.84 !.75
.38 .55
.38 .54
.38 .80
.38 .81
.42 .96
.39 .76
.45 .70
.35 .67
!.56 .48 .89

Coontry : S\.£DEN Station : RICKLEA Year : 1989
mn 003N NH4N S04S-C Na
142
5a11:>ler type : BllK Salllling perioo : I<JNTflY
Pb Cd Cu Zn Cl S02S A-S04S NC2N T-003N T-NH4N
--------------------------------------------------------------------------------------------------------------------JAN FEB f.Wl APR I'AY J~
Jlt A\Ji SEP OCT NCV DEC
22.0 55.0 50.0 42.0 51.0 51.0 11.0 76.0 25.0 48.0 73.0 28.0
.22
.46
.58
.88
.20
.36
.20
.57
.27
.33
.43
.07 .25
.45 .78
.53 1.00 1.76 2.91 .24 .65 .57 1.04
.56 .23 .54
1.10 1.88 .26 .51 .33 .76 .20 .56
.34
.32
.21
.28
.09
.12
.14
.15
.14
.18
.21
.56
.05
.05
.03
.10
.05
.06
.03
.02
.05
.03
.03
.07
.60
.53
.38
.47
.18
.22
.28
.31
.36
.35
.32
.98
--------------------------------------------------------------------------------------------------------------------YEAR 532.0 .39 .49 .94 .21 .04
Coont ry : SWEDEN Statioo : VAVIHILL Year : 1989
mn 003N NH4N S04S-C Na
.38
5allller type : WET ~LY 5al1:>ling perioo : DAILY
Pb Cd Cu Zn Cl S02S A-S04S NC2N T-003N T-NH4N
1.19 2.65 --------------------------------------------------------------------------------------------------------------------
JAN 20.1 FEB 43.6 f.Wl 90.4 APR 33.4 I'AY 21.3 J~ 55.2 Jlt 123.3 AW 125.9 SEP 53.5 OCT 114.1 NCV 38.9 DEC 45.6
1.69 1.95 1.57 1.60 1.13 1.18 1.32 1.72 1.46 3.99
.91 1. 65
.40 .91
.42 .66
.80 1.06
.74 .92
.86 .91
.85 .76
2.09 3.31 1.75 2.94 1.27 2.41 2.57 .31 2.66 1.84 1.89 .44
.97 1.12
.80 .47 1.37 .44
.95 1.17 1.24 1. 61
.99 2.56
.41
.35
.26
.09
.26
.08
.15
.06
.07
.16
.21
.31
- 5.10 4.90 4.00
.70 3.20
.90 2.00
.80
.90 2.20 2.50 4.10
5.70 4.20 2.80 1.30 1.20 1.10 1.30 1. 70 1.70 2.80 3.60 4.10
1.37 2.45 1.43 2.56
.99 2.86
.78 2.04
.53 1.94
.41 1.98
.76 1.99
.79 2.25 1.00 1.99 1.09 1.37
.76 1.73
--------------------------------------------------------------------------------------------------------------------2.62 .93 2.15
YEAR 765.3 .83 1.14 1.27 1.33 .17
Coontry : SWEDEN Statioo : RORVIK Year : 1989
mn 003N NH4N S04S-C Na
- 2.29
5allller type : WET OOLY 5al1:>ling perioo : DAILY
Pb Cd Cu Zn Cl S02S A-S04S NC2N T-003N T-NH4N
.80 1.61 --------------------------------------------------------------------------------------------------------------------
JAN FEB f.Wl APR I'AY J~
Jlt AW SEP OCT NCV DEC
7.3 2.04 2.33 2.54 9.10 53.8 1.24 .95 1.18 7.71 71.5 .90 .73 .94 4.44 34.5 1.27 1.48 2.77 .58 27.6 1.08 1.10 1.82 2.11 18.4 1.40 .87 1.64 1.65 94.6 .52 .66 1.01 3.13 52.3 .88 .47 1.06 1.89 45.1 .62 .69 1.11 .85
112.2 .46 .31 .54 2.07 18.7 1.20 .83 1.36 3.57 54.5 .46 .28 .44 1.95
1.03 .86 .47 .07 .18 .32 .34 .23 .11 .24 .44 .22
15.40 12.80 7.30 1.40 4.00 6.70 5.00 3.30 2.50 3.60
- 5.80 3.20
4.10 2.50 2.20 1.70 1.40 1.20 1.50 1.20 1.40 2.10 4.20 3.10
.62 1.24
.76 1.65
.70 1.78
.65 1.01
.39 1.24
.39 .99
.55 1.10
.46 .89
.75 1.23
.71 1.11
.48 .83
-------------------------------------------------------------------------------------------------------------------YEAR 590.5 .79 .68 1.08 2.96 .33 - 5.17 - 2.22 .61 1.22
Country : SWEDEN Statioo : trell<G Year : 1989
mn 003N NH4N S04S-C Na
JAN FEB f.Wl APR I'AY J~
JlJ_ A\Ji SEP OCT NCV DEC
7.4 29.7 36.8 6.1
26.0 53.8 6.8
25.4 13.4 71.9 52.8 22.8
2.27 1.43 2.51 1.23 1.54 .99 1.58 2.02
.21 1.34
.60 2.31 1.05 2.39 2.00 2.82
.93 .74
.89 .91
.99 .60
2.14 5.98 1.85 8.59 1.37 2.70 5.14 1.22
1.14 .25 .66 .63
1.94 1.95 3.47 1.83 1.24 1.90 1.40 1.56
.96 4.23
143
SffiJJ ler type : WET ~L Y Sallll ing perioo : DAILY
.76
.95
.35
.31
.05
.12
.34
.37
.24
.21
.53
Pb Cd Cu Zn
YEAR 352.9 1.11 1.21 1.53 2.49 .32
Coontry : USSR Statioo : NIDA Year : 1989
mn 003N NH4N S04S-C Na
JAN FEB f.Wl APR I'AY J~ JlJ._
AW SEP OCT NCV DEC
9.7 15.6
7.3 16.0
64.9 10.9
5.90 .80 -8.33 115.10 1.50 .40 1.70 3.60
.50 6.70 2.47 2.80
.40 -1.95 49.60
.40 .20 .83 5.60 3.84 27.00
YEAR 124.4 1.03 .78 1.42 21.26
*) Reporting NH4+
Country : USSR Statioo : SYRVE Year : 1989
mn 003N NH4N S04S-C Na
JAN 40.0 FEB 76.5 f.Wl 34.7 APR 56.4 I'AY 14.6 J~ 40.6 Jlt 101.6 AW 68.1 SEP 33.8 OCT . 60.6 NCV 6.9 DEC 38.5
1.60 .60 .68 4.80 1.20 .50 .50 6.80 1.30 1.80 2.43 16.10 .80 .80 1.50 l.SO
4.70 4.90 6.14 3.20 .30 .40 1.12, .so .40 .10 1.63 2.70 .50 .60 .45 1.70 .30 .10 1.13 2.10 .50 .20 .32 1.90
1.30 .80 1.86 .30 .90 .30 .49 5.30
YEAR 572.3 .85 .60 1.15 3.85
5al1:>ler type : BltK Salllling perioo : DAILY
Pb Cd Cu
5al1:>ler type : BllK 5al1:>ling perioo : DAILY
Pb Cd Cu
-'
Zn
Zn
Cl S02S A-S04S NC2N T-·003N T -NH4N
7.70 10.60 4.20 1.90
.40 1.70 2.70 3.30 2.80 2.90 7.50
3.70
3.20 2.20 1.40 1.10 .90
1.00 .90 .50 .60 .90
1.00 1.10
1.23
Cl S02S A-S04S N02N T-NC3N T-NH4N*
.20
.20
.10
.10
.10
.10
.10
.10
.10
.20
.30
.30
.20
.10
.10
.10
.10
.10
.10
.10
.60
.60
.50
.40
.30
.20
.10
.10
.20
.20
.20
.20
.12 .15 .30
Cl S02S A-S04S NC2N T-003N T-NH4N

Coontry : USSR Station : RUTSAVA Year : 1989
mn 003N NH4N S04S-C Na
144
Smjller type : BllK Smjll ing pericxl : IJAILY
Pb Cd cu Zn Cl S01S A-504S I\01N T -003N T -NH4N*
--------------------------------------------------------------------------------------------------------------------1.80 1.90 1.90
.30
.40
.40
.10
.90
.90 1.40
.40
JAN FEB ~
APR 1'1\Y JL!i JQ
AUS SEP OCT I\OV DEC
11.1 39.3 56.3 43.7 15.9 85.9 47.4
111.9 33.3
131.8 55.7 76.5
1.80 1.00 1.27 3.90 1.80 .80 1.11 2.30 1.40 .60 1.42 2.10
.60 .50 1.47 .30 2.60 3.10 3.24 .70
.30 .10 1.16 .50
.20 1.00 1.93 .80
.10 11.50 .39 1.30
.10 .10 1.01 1.00
.50 .30 .82 1.00
.70 .30 1.11 1.10
.20 .20 .56 1.70
.10
.30 .40
1.90 1.30 1.00
.40
.80
.70
.10
.30
.20
.10
.10
.20
.10
.20
.40
.40
.70
.50
.80
.70
-------------------------------------------------------------------------------------------------------------------- 1.22 .23 .66 YEAR 718.9 .60 2.21 1.06 1.25
*) Rep:>rting NH4+
Coontry : USSR Station : l.AI£1'1\A Year : 1989
mn 003N NH4N S04S-C Na
Sarpler type : BllK Smjlling pericxl : DAILY
Pb Cd Cu Zn Cl S01S A-504S N01N T-N03N T-NH4N*
--------------------------------------------------------------------------------------------------------------------.90 .60 .40 .50
1.10 .70
.10
.10
.10
.10
.10
.30
.30
.60
.70
.30
.30
.10
.20
.40
.20
.40
.50
JAN 33.1 FEB 42.1 1'1\R 31.6 APR 26.2 1'1\Y 18.7 JL!i 50.6 JlJ_ 69.9 AUS 131.8 SEP 29.3 OCT 94.5 I\OV 45.5 DEC 37.9
.30 .20 .11 .60
.60 .30 .40 1.00
.60 .40 1.01 .60
.50 .50 2.16 .50
.60 .30 1.06 .40
.20 .20 1.07 .40
.10 .92 .50
.20 .30 1.05 .20
.40 .30 1.60 1.00
.20 1.10 <.37 6.90
.40 1.20 .30 .70
.40 .20 .38 .80 --------------------------------
.60
.50
.60 1.00
.30
.10
.10 .10 .10
2.00 .30
------------------------------------------------------------------------------------YEAR 613.3 .30 .59==~·9;:;3~1~.5:1~~=================.6~5=~.29==·~36 *) Reporting NH4+
Coontry : PQAND Station : LEM Year : 1989
mn N03N NH4N 504S-C Na
Sarp l er type : BllK Sarpling pericxl : DAILY
Pb Cd Cu Zn Cl S02S A-504S N02N T-N03N T-NH4N
--------------------------------------------------------------------------------------------------------------------JAN FEB 1'1\R APR 1'1\Y JL!i JlJ_ AUS SEP OCT NOV DEC
15.6 30.1 37.8 26.9 17.2 41.0 71.5 50.6 28.7 86.3 34.1 72.8
.77
.75
.72
.82
.61
.38
.29
.29
. 61
.45
.52 .51
.60 1.40
.49 1.84
.68 1.30
.94 2.24
.88 1.59
.64 1.48
.98 1.73
.61 .85 1.39 1.85
.63 .41
.99 1.00 .39 1.51
1.23 .91 .78 .59 .20 .33
1. 02 1.19
.91 1.35 2.08 1.05
------------------------------------------
.14 19.80 3.14
.13 24.30 2.91 .10 16.10 1.60 .13 18.90 8.43 .07 15.80 5.43 .08 15.00 9.73 .13 24.40 8.60 .14 15.40 8.11 .13 10.30 12.38 .17 3.50 3.30 .26 12.50 9.67 .14 6.50 3.80
51.00 3.19 41.00 1.81 29.00 1.45 42.00 1.17 36.00 .39 27.90 .62 30.00 1.58 19.00 1.89 21.00 1.87 10.00 1.03 56.00 3.21 14.00 1.77
--------------------------------------------------------------------------YEAR 512.6 .50 .73 1.38 1.04 .14 14.34 6.22 - 27.79 1.75
145
Country : !XR Statioo : KI\P /lRKCX'if\ SalJ)ler type : l.fT CRY Year : 1989
mn I\03N NH4N 504S-c Na
JAN FEB 1'1\R APR 1'1\Y
12.0 1.20 18.3 1.50 42.0 21.9
1. 20 1.30
9.3 2.40
1.00 2.24 1.90 .40 1.30 3.28 2.60 .50 1.50 2.00 2.50 .40 2.00 4.51 21.40 2.70 3.20 3.07 1.50 .30
Jl.!l JlJ_
52.8 .90 1.30 2.15 .60 .10 32.5
AUS 112.9 18.6 SEP
OCT I\OV DEC
58.8 30.5 85.8
.50 1.00 1.59 1.30 .30
.40 .60 1.22 2.20 .40
.90 1.10 1.96 1.70 .30
.60
.90
.50
.60 1.01 1.10 .20
.70 1.89 1.30 .20
.30 1.27 1.50 .30
YEAR 495.4 .76 .90 1.75 2.51 .41
Country : FRG
Smjlling pericxl : l.fEKLY
Pb Cd cu Zn Cl SC2S A-504S N02N T-I\03N T-NH4N
3.20 5.10 2.40 5.80 4.60 3.20 3.70 3.30 4.20 3.00 2.80 1.00
39.30 2.40 2.10 1.70 2.90 1.00 1.80 1.20 1.20 .50 2.20 1.30 2.90 .60 1.50 .90 5.90 .80 1.10 .90 3.90 .80 2.60 1.10 1.80 2.40 2.00 1.70 1.50 5.30 2.80 2.60 3.10 5.50 2.80 3.00
5.11 1.56 1.31 1.12
Station : IJANISCH-NIENH:l' SalJller type : l.fT OOL Y Year · 1989
mn N03N NH4N 504S-c
JAN 29.0 .63 FEB 35.0 .91 1'1\R 57.0 .70 APR 52.0 1.37 MAY 6.0 1.30 JUN 54.0 1.21 JlJ_ 70.0 1.37 AUS 101.0 .28 SEP 16.0 1.53 OCT 58.0 .56 I\OV 16.0 .57 OCC 39.0 .69
.81 1.64 1.35 2.13 1.15 1.35 1.80 1.96 1.83 1.76 1.51 1.54
.83 1.82
.48 .51 1.34 1.93 .69 .46 .91 .66 .76 .67
YEAR 544.0 .66 1.01 1.17
Country : OENMf.lRK Statioo : KELDSNCR Year : 1989
mn I\03N NH4N 504S-C
Na
Na
15.30 1.81 JAN FEB ~
APR 1'1\Y Jl.!< Jll AUS SEP OCT NOV DEC
4.4 14.7 29.4 33.6 7.4
14.8 41.3 78.4 32.9 38.6. 6.0
33.1
.60 .57 .87 11.89 1.45
.70 1.06 1.05 8.47 1.00 1.55 1.90 2.84 16.93 2.61 1.73 2.26 3.20 1.47 .28
.63 .47 .99 .62 .12
.61 1.03 1.66 .96 .11
.43 .71 .96 3.46 .40
.80 .89 1.30 .60 .15
.46 .55 .58 3.30 .43
.71 .67 1.23 75.30 1.95
.43 .40 .62 7.38 1.05
YEAR 344.6 .68 .88 1.25 6.50 .74
Sarpling period : \-fEKLY
Pb
4.86 3.37 5.30 7.23 3.71 4.07 5.15 2.18 4.05 3.21 2.45 3.50
Cd
.43
.10
.23
.13
.17
.14
.11
.12
.31
.13
.16
.21
4.10 .19
cu Zn Cl 5015 A-504S N02N T -N03N T -NIMN
7.35 6.10 6.48 4.15 8.14 5.83
11.15 3.41 7.68 2.82 5.60 4.37 5.81 1.24 4.27 9.14 9.49 5.95 7.83 14.10 9.47 10.25 8.56 7.46
7.19 6.63
Sa1pler type : l.fT OOLY Sa!pling pericxl: DAILY
Pb Cd Cu Zn Cl SC2S A-S04S N01N T -N03N T -NIMN
14.31 3.05 2.15 13.16 3.74 1.18 15.16 3.05 2.30 33.57 1.99 1.41 1.16 1.71 1.91
.91 1.52 2.36 1.59 1.11 1.48 6.52 1.57 1.80 1.18 1.68 ·1.88 6.06 1.08 1.52
14.80 5.83 2.00 14.69 5.64 2.55
- 9.56 1.83 2.05

... ,,}·,·---------------------147
146
ANNEX 6
Annual statistics on HELCOM/EGAP data 1990

~ ~ c
148
1.'::!1-------------------------·---------
B ~
I I I I r-IJ I I I I
/Qt--;::----·-;=------------------------ ···-·--~--' ·-· I I I I I 1 I I I I I
'
c 0
2 -~
81/} . ..J ill UJ o. I -a 0 <lJ - t u 0 <lJ 0. t Q) 0 ~ ,,_ U)
[!' <lJ
ro ~ 1d <ll :: ~ -~ >, u:C. c: c "' 0 c E 0--~ 0
-~ill .g- E ~ ~j n. z
' + (") .;;J"
O:r: zz + +
"' 0<:0 z:r: :r:z ll !l
-l?. 2. 1-·· f-·
~' ' '
Country : FINLAAD 5tatioo : fi\ILWTO Year : 1990
149
Smpler t:,pe : lll.LK SaljO l i ng peri cxJ : 1-!JNTii. Y
mn 1\QJN NH4N 5045-C Na Pb Cd Cu Zn Cl 5025 A-5045 NC2N T·IIQJN T·NH4N
JAN FEB WlJl APR W\Y JL!i Jll. ALJ3 5EP OCT NOV DEC
16.6 .98 --------------------------------------------------------------------------------------------------------------------
46.5 .58 31.7 .68 4.5 !.10 7.4 .45
42.7 .47 68.2 .15 59.8 . 15 16.8 .27 25.0 .62 24.6 .37 34.4 .58
.71 !.19
.35 .97
.49 !.13 1.30 2.30 .74 !.15 .65 2.16 .20 .48 .31 .58 .67 .97 .91 1.76 .!B .35 .35 .74
.08
.38
. 79
.59
.43
.20
.19
.41
.47
.61
.68
.15
.44
.05
.02 .07 .09 .06 .09
.90
.50 1.20 .70 .60 .50 .30 .10 .40 .50 .80 .90
--------------------------------------------------------------------------------------------------------------------YEAA 378.2 .43 .44 .99 .40 .11
Country : FINLAAD Statioo : fl\lLWTO Year : 1990
nm 1\QJN NH4N 5045-C Na
Smp ler t:,pe : lll.lK SaljOling pericd : 1.\'EKLY
Pb Cd Cu
.53
Zn Cl 5025 A-5045 NC2N T-1\QJN T·NH4N --------------------------------------------------------------------------------------------------------------------JAN 27.7 .55 .19 .35 FEB 35.9 .59 .26 .61 WlJl 15.3 .58 .30 .76 APR 1.1 1.23 1.17 2.83 W\Y JL!i 5.4 .29 .23 .99 Jll 31.1 .33 .36 .98 ALJ3 23.9 .48 .65 1.27 SEP 4.7 .65 .52 1.70 OCT 10.2 .67 .68 1.85 NOV 13.7 .54 .54 .47 DEC 20.9 .63 . 26 .79
.16 77.10 .10 .04 7.00 .20 .10 7.80 .12 .37 48.80 .64
.08 3.60
.06 2.90
.06 3.70
.12 5.50
.12 5.50
.07 2.90
.13 4.20
.06
.0!3
.0!3
.13
.16
.09
.11
- 22.20 - 141.60
38.80 - 85.90
12.70 - 14.60 - 14.30
10.00 32.90 99.90 46.60
--------------------------------------------------------------------------------------------------------------------YEAA 189.9 .53
Country : FINLAND Statioo : V!R(UHfl Year : 1990
.37 .85
nm 1\QJN NH4N 5045-C Na
.09 15.63 .12 - 52.53
Smpler t:,pe : lll.LK Sallll ing pericd : DAILY
Pb Cd Cu Zn Cl S02S A-5045 N02N T-NOJN T·NH4N --------------------------------------------------------------------------------------------------------------------JAN 93.3 .49 .37 .91 .48 FEB 94.8 .56 .51 1.10 .2B WlJl 40.5 .58 .58 .86 .41 APR 12.0 1.34 2.15 2.89 .41 W\Y 43.7 .36 .40 .86 .13 JIJI 32.7 JUL 139.0
.29 .35 1.33, .11
.17 .36 .67 .06 ALJ3 44.3 .27 .'25 .86 .20 5EP. 57.9 . 26 .41 .99 .20 OCT 36.1 .55 .73 1.2B. .20 NOV 45.0 .45 .28 .81 .27 DEC 5!.2 .92 .57 1.41 .60
.09
.07
.07
.15
.08
.14
.02
.05 .07 . .0!3' .06 .13
.96
.56
.84
.82 .25 .32 .09 .25 .39 .36 .42
1.03
4.20 2.40 1.90 1.80 1.50 1.30
.90 1.20 1.10 1.80 2.30 2.50
.42 .83
.81 1.25
. 72 . 79
.52 1.46
.23 .97
.27 1.00 . 20 1.14 .21 1.26 .15 .71 .37 .81 .22 .44 .52 .81
YEAA 690.5 .44 .45 .98 .26 .07 ---------------------------------------------------------------------------------------------------------------------
1.91 .39 .96
11 413399X
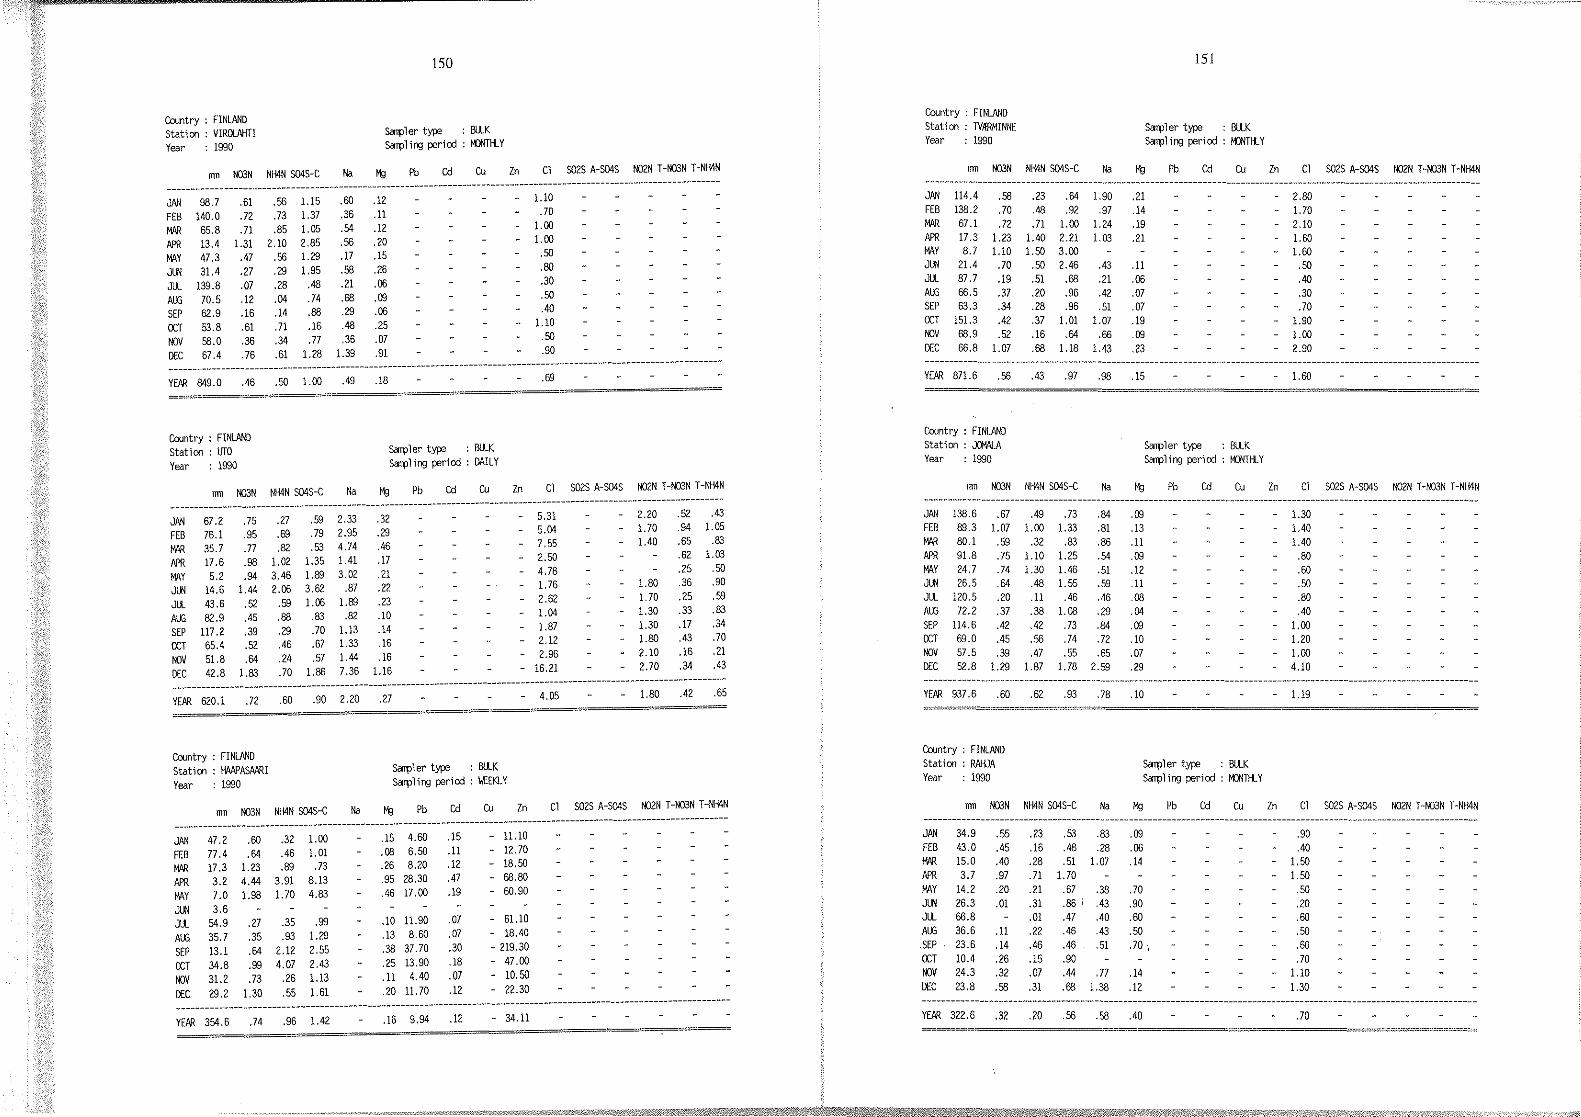
Country : FINLAND Station : VIROLAHTI Year : I990
150
Sffi1>1er type : BLLK 5aJ1> 1 i "il peri cd : fUNTa_ Y
nm 003N NH4N S04S·C Na Pb Cd Cu Zn C1 SC2S A·S04S N02N T-003N T-NH4N
--------------------------------------------------------------------------------------------------------------------JAN FEB fi'R APR WIY JL!; JLL AU3 SEP OCT NOV DEC
98.7 140.0 65.8 13.4 47.3 31.4
139.8 70.5 82.9 53.8 58.0 67.4
.61 .58 1.15 .60
.72 .73 1.37 .36
.71 .85 1.05 .54 1.31 2.10 2.85 .56
.47 .56 1.29 .17
.27 .29 1.95 .58
.07 .28 .48 .21
.12 .04 .74 .68
.16 .14 .88 .29
.61 .71 .16 .48
.36 .34 .77 .36
.76 .61 1.2B 1.39
.12
.11
.12
.20
.15
.26
.06
.09
.06
.25
.07
.91
l.lD .70
1.00 1.00
.50
.80
.30
.50
.40 1.10
.50
.90
--------------------------------------------------------------------------------------------------------------------YEAA 849.0 .46 .50 1.00 .49 .18
Country : FINLAND Station : uro Year : 199D
Sffi1>1er type : BLLK Sffi1>1i"il pericd: DAILY
.69
nm 003N NH4N S04S·C Na Pb Cd Cu Zn C1 SC2S A-S04S N02N T-003N T·NH4N
--------------------------------------------------------------------------------------------------------------------JAN FEB fi'R APR WIY JL!; Jl.l AU3 SEP OCT NOV DEC
67.2 76.I 35.7 17.6 5.2
14.6 43.6 82.9
117.2 65.4 51.8 42.8
.75 .27
.95 .69
.77 .82
.98 1.02
.94 3.46 1.44 2.06
.52 .59
.45 .88
.39 .29
.52 .46
.64 .24 1.83 .70
.59 2.33 .32
.79 2.95 .29
.53 4.74 .46 1.35 1.41 .17 1.89 3.02 .21 3.82 .87 .22 1.06 1.89 .23 .83 .82 .10 .70 1.13 .14 .67 1.33 .16 .57 1.44 .16
1.88 7.36 1.16
5.31 5.04 7.55 2.50 4.78 1.76 2.82 1.04 1.87
- 2.12 2.96
- 16.21
2.20 1.70 1.40
1.80 1.70 1.30 1.30 1.80 2.10 2.70
.52
.94
.65
.62
.25
.36
.25
.33
.17
.43
.16
.34
.43 1.05
.83 1.03
.50
.90
.59
.83
.34
.70
. 21
.43
--------------------------------------------------------------------------------------------------------------------YEAR 620.1 .72 .60 .90 2.20 .27 - 4.05 1.80 .42 .65
Country : FINLAND Station : HAAPASAARI Year 1990
nm 003N NH4N S04S·C Na
Sffi1>1er type : BLLK Sffi1>1i"il pericd : I.£EKLY
Pb Cd Cu Zn C1 S02S A-S04S N02N T -003N T ·NH4N
--------------------------------------------------------------------------------------------------------------------JAN 47.2 .6C .32 1.00 FEB 77.4 .64 .46 1.01 fi'R 17.3 1.23 .89 .73 APR 3.2 4.44 3.91 8.13 MAY 7.0 1.98 1.70 4.83 JLI< 3.6 JLL 54.9 .27 .35 .99 AU3 35.7 .35 .93 1.29 SEP 13.1 .64 2.12 2.55 OCT 34.8 .99 4.07 2.43 NCV 31.2 .73 .26 1.13 DEC 29.2 1.30 .55 1.61
.15 4.6C
.08 6.50
.26 8.20
.95 28.30
.46 17.00
.10 11.90
.13 8.6C
.38 37.70
.25 13.90
.11 4.40
.20 11.70
.15
.11
.12
.47
.19
.07
.07
.30
.18
.07
.12
11.10 12.70 18.50 68.80 60.90
61.10 18.40
- 219.30 47.00
- 10. 50 - 22.30
-----------------------------------------------------------------------------YEAA 354.6 .74 .96 1.42 .16 9.94 .12 - 34.11
---------------------------------------
Country : FINLAND Station : TVI!RMINNE Ye.ar : 1990
mn 003N NH4N S04S·C Na
JAN FEB fi'R APR WIY JL!; JLL AU3 SEP OCT NOV DEC
114.4 138.2 67.1 17.3 8.7
21.4 87.7 66.5 63.3
151.3 68.9 66.8
.58
.70
.72 1.23 1.10
.70
.19
.37
.34
.42
.52 1.07
.23 .64 1.90
.48 .92 .97
.71 1.00 1.24 1.40 2.21 1.03 1.50 3.00
.50 2.46 .43
.51 .68 .21
.20 .96 .42
.28 .96 .51
.37 1.01 1.07
.16 .64 .66
.68 1.18 1.43
.2I
.14
.I9
.21
.11
.06
.07
.07
.19
.09
.23
151
Sffi1>1er type : BLLK Sffi1>1 i"il pericd : fl:lNllU
Pb Cd Cu
YEAA 871.6 .56 .43 .97 .98 .15
Country : FINLAND Station : :KW\l_A Year : 1990
JAN FEB fi'R APR WIY JL!; Jl.l AW SEP OCT NOV DEC
mn 003N NH4N S04S·C Na
138.6 .67 .49 .73 .84 89.3 1.07 1.00 1.33 .81 80.1 .59 .32 .83 .86 91.8 .75 1.10 1.25 .54 24.7 .74 1.30 1.46 .51 26.5 .64 .48 1.55 .59
120.5 .20 .11 .46 .46 72.2 .37 .38 1.08 .29
114.6 .42 .42 .73 .84 69.0 .45 .56 .74 .72 57.5 .39 .47 .55 .65 52.8 1.29 1.87 1.78 2.59
.09
.13
.11
.09
.12
.11
.08
.04
.09
.10
.07
.29
Sa1p 1 er type : BLLK Sffi1>lif'il pericd : I'OOTIU
Pb Cd Cu
YEAA 937.6 .6C .62 .93 .78 .10
Country : F I NLANO Statioo : RAHJA Year : I990
nm 003N NH4N S04S-C Na
JAN 34.9 .55 .23 .53 .83 FEB 43.0 .45 .16 .48 .28 fi'R 15.0 .40 .28 .51 1.07 APR 3.7 .97 .71 1.70 WIY 14.2 .20 .21 .67 .38 JL!; 26.3 .01 .31 .86 ' .43 JLL 66.8 .01 .47 .40 AU3 36.6 .11 .22 .46 .43 SEP · 23.6 .14 .46 .46 .51 OCT 10.4 .26 .15 .90 NOV 24.3 .32 .07 .44 . 77 DEC 23.8 .58 .31 .68 1.38
Sffi1>1er type : BLLK Sffi1> 1 i "il peri cd : I'OOTH.. Y
.09
.06
.14
.70
.90
.6C
.50
.70,
.14
.12
Pb Cd Cu
YEAA 322.6 .32 .20 .56 .58 .40
Zn
Zn
Zn
C1 SC2S A-S04S N02N T·003N T·NH4N
2.80 1.70 2.10 1.60 1.60
.50
.40
.30
.70 1.90 1.00 2.90
1.60
C1 S02S A·S04S NC2N T ·N03N T -NH4N
1.30 1.40 1.40
.80
.60
.50
.80
.40 1.00 1.20 1.00 4.10
1.19
C1 S02S A-S04S N02N T-N03N T·NH4N
.90
.40 1.50 1.50
.50
.20
.60
.50
.60
.70 1.10 1.30
.70

Country : FINLAND Station : YL!MARKKU Year 199D
mn tKBN NfMN S04S-C Na
!52
Sarp l er type : llllK Sarpli~ period : f'ONTfLY
Pb Cd Cu Zn Cl 5025 A-S04S N02N T-tKBN T-NH4N
--------------------------------------------------------------------------------------------------------------------JAN FEB ~
APR W\Y JUN JLI. AIXi SEP CCT NOV DEC
44.3 .53 59.3 .78 41.4 .32 17.8 1.29 20.8 .25 44.8 .21 84.1 .15 63.9 .32 29.8 .40 41.4 . 75 45.0 .32 67.2 .61
.50 .57
.81 1.06
.49 1.07 1.60 3.36
.74 1.27 3.70 1.47
.12 .59
.33 .77 1.10 1.58 1.58 1.86
.75 .58
.81 1.04
.41
.48
.35
.43
.31
.35
.12
.35
.29
.48
.48
.75
.06
.03
.07
.23
.07
.33
.05
.04
.06 '15 .06 .07
.60
.80
.50
.60
.20
.70
.10
.50
.30
.70
.80 1.00
--------------------------------------- --------------------------------------------------------- ------------------YEM 559.9 .45 .96 1.08 .40 .09
--- ----
Country : FINLAND Statioo : SIPOO Year : 1990
Solj)ler type : llllK S.lj)ling period : f'ONTflY
mn N03N NH4N S04S-C Na f'g Pb Cd
.58
Zn C1 502S A-504S NC2N T-N03N T-NH4N
--------------------------------------------------------------------------------------------------------------------JAN 112.9 .62 .43 .84 FEB 116.3 .47 .39 .78 ~ 62.2 .74 .75 .94 APR 15.1 1.13 1.90 2.03 W\Y 33.3 .60 .38 1.06 JUN 42.9 . 19 . 18 .86 JLI. 105.3 .16 .01 .69 AIXi 25.6 .14 .09 1.16 SEP 82.1 .25 .17 .76 OCT 90.6 .41 .31 1.07 NOV 46.2 .35 .17 .57 DEC 24.4 .86 .69 1.36
.68
.27
.67
.83
.46
.43
.12
.49
.48
.38
.38 1.67
.11
.08
.12
.16
.27
.09
.06 '14 .11 .11 .05 .18
1.20 .50
1.20 1.40
.70
.20
.10
.70
.50
.60
.40 2.70
--------------------------------------------------------------------------------------------------------------------YEAR 756.9 .45 .34 .88 .47 .11
Country : FINLAND Station : SLI. VA Year : 1990
mn N03N NH4N S04S-C Na
.70
Sarpler type : llllK SO!j)1i~ period : MONTHLY
Pb Cd Zn Cl 501S A-S04S N02N T-N03N T-NH4N
--------------------------------------------------------------------------------------------------------------------JAN FEB ~
APR f\1\Y JUN JLI. AlG SEP OCT NOV occ
54.8 .69 .19 .26 .53 49.0 1.24 1.40 !.33 .82 31.4 .42 .57 .52 .94 23.2 1.04 2.0C 1.76 .47 11.8 .58 .81 .95 .63 47.2 .16 .25 .57 .38
135.7 .14 .15 .38 .21 74.0 .25 .09 .68 .26 22.5 .35 1.20 .77 .31 26.4 .43 .66 .97 .31 40.0 .43 !.48 .65 .55 42.6 1.07 2.02 1.40 1.21
.08
.18 '17 '15 .25 .10 .05 .06 .13 '12 .05 .16
---------------------------------------------------------------------------YEAA 558.6 .49 .69 .73 .49 .10
1.00 1.40 1.90
.70 1.60
.40
.30
.30
.50
.70
.90 2.10
-----------------------------------------.81
Country : FINLAND Station : KmPPOO Year : 1990
mn tKBN NH4N S04S-C Na
JAN 133.6 .62 .33 .73 .86 FEB 66.8 .87 .67 1.25 .60 ~ 49.4 .43 .35 .55 .58 APR 34.6 l.OC 1.30 1.87 .40 M<\Y 9.5 .71 .66 1.76 .51 JUN 21.3 .59 4.00 3.05 .64 ,JLI. 61.7 .21 .16 .56 .48 AIXi 96.2 .37 .15 .86 .44 SEP 122.9 .22 .09 .55 .60 CCT 95.2 .35 .38 .76 .47 NOV 35.9 .33 .14 .67 .39 DEC 23.1 .80 .59 1.32 1.00
.04
.10
.09
.14
.20
.13
.08
.05
.08
.09
.05
.11
153
s.-.!pl(~!' type : BllK ~~~•lplinq JX~ricd: tJO"'TH..Y
Ph (\J
YEAA 750.2 .47 .44 .89 .59 .08
Country : S\/EOCN Station : AAU' Year 1990
mn N03N NH4N S04S-C Na
JAN 74.0 .90 1.16 1. 52 2.89 FEB 78.0 .69 .85 .96 2.52 ~ 58.0 .63 .89 1.13 2.65 APR 41.0 1.20 1.54 1.78 .69 M<\Y 35.0 .80 1.03 1.36 .59 JUN 58.0 .76 .98 1.81 '11 JLI. 70.0 .26 .52 .68 .26 AIXi 23.0 .56 .51 .91 .54 SEP 122.0 .53 .47 .70 .52 CCT 83.0 .64 .95 1.02 1.00 NOV 99.0 .39 .37 .56 .42 occ 39.0 .79 1. 05 1. 55 1.42
.37
.33
.33
.14
.11
.03
.05
.09
.07
.13
.06
.18
Sarpler type : Bli_K Sarpl ing period : f'ONTI-LY
Pb Cd Cu
YEAA 780.0 .66 .80 1.07 1.15 .16
Country : SI.\'OCN Station : ASPVRETEN Year : 1990
mn tKBN NH4N S04S-C
JAN 51.0 '58 .32 .64 FEB 59.0 .59 .35 .59 ~ 19.0 .18 .07 .27 APR 16.0 1.25 1.88 2.28 M<\Y 12.0 .63 .77 2.14 JUN 21.0 .61 .91 2.03, JLI. 64.0 '17 .03 .42 AlG 15.0 . !8 .11 .35 SEP . 115.0 .35 .44 '79 OCT 56.0 .37 .30 .59 NOV 46.0 .32 .09 .38 occ 34.0 .81 .44 1.21
Na
.63
.37
.30
.19
.20
.14
.09
.19
. 31
.61
.33
.68
SO!j)ler type : \.U au Sarp1ing period : IUHfLY
.08
.05
.04
.09
.06 '12 .01 .03 .06 . .08 .04 .09
Pb Cd Cu
YEAA 509.0 .44 .37 .78 .36 .06
Zn
Zn
Zn
C1 501S A-504S NC2N T-N03N T-NH4N
1.20 1.00 .90 .60 .60
2.70 .20 .30 .80 .70 .40
1.40
.Ill
C1 502S A-S04S NC2N T-tKJ3N T-NH4N
5.25 4.76 5.03 1.55 1.18
.11 .f>O
1.29 1.0~)
1.96 .91
2.87
2.22
Cl 502S A-S04S NC2N T-N03N T -NH4N
1.14 .78 .65 .48 .38 .31 .11 .36 .64
1.22 .80
1.37
.73
2.30 2.60
.80
.80
.60
.40
.40
.60
.80 1.10 1.60 2.30
.46 .70
.84 1.18
.55 .92
.69 1.57
.28 '71
.37 1.11
.18 .38
.38 1.13
.13 .34
.53 1.27
.20 .30
.36 .61
1.19 .41 .85

Country : SI.£DEN Station : RICKLEA Year : 1990
nm N03N NH4N SC4S-C
JAN FEB WR APR W\Y JL!i JLt Alfij SEP OCT NOV DEC
107.0 78.0 28.0 30.0 29.0 27.0 48.0 71. 0 63.0
18.0 38.0
.36
.63
.18
.63
.09
.24
.13
.25
.14
.34
.44
.15 .44
.52 .91
.09 .25
.77 1.69
.03 .42
.60 1.14
.03 .57
.31 .64
.16 .39
.22 .61
.45 .88
Na
.34
.31
.28
.32
.Oil
.07
.11
.09
.23
.24
.54
.04
.04
.05
.09
.02
.07
.02
.01
.03
.03
.06
154
Salpler type : BUK Sa!plil'!l period : 1'/JNHU
Pb Cd Cu
YEAR 547.0 .33 .29 .67 .25 .04
Country : SI.£DEN Station : VAVIHILL Year : 1990
mn N03N NH4N SC4S-C Na
JAN FEB WR APR W\Y JL!i JLt Alfij SEP OCT NOV DEC
86.3 71.3 39.5 54.2 50.5 53.2 83.6 49.4
152.7 89.0 54.1 42.7
1. 03 1.33 .73 .75 . 71 .91 .92 1.61 .59 3.14
1.21 1.69 .33 .48 .71 2.07 . 54 .74 . 70 .74 .46 .85 .90 1.21
1.68 4.33 .91 3.30
1.17 3.71 1.45 1.52 1.49 1.29 2.86 .39 .78 .79
1.32 .79 .72 1.02 .86 1.37 .85 .69
1.82 .53
.47
.39
.48
.25
.21
.17
.10
.11
.12
. 21
.09
.22
S•rpler type : I.£T ONLY Salplii'!J period : DAILY
Pb Cd Cu
YEAR 826.5 .71 1.16 1.22 1.65 .22
Country : SI>£DEN Station : RCRVIK Year : 1990
S.rpler type : I>£T ONLY Salplir!J period: DAILY
Zn
Zn
Cl 5015 A-SC4S N02N T-N03N T-NH4N
.60
.58
.45
.44
.04
.11
.18
.OS
.45
.50
.95
.42
Cl 502S A-S04S N02N T -N03N T -NH4N
6.90 5.40 6.80 3.30 2.40
.80 1.20 1.60 1.70 2.50 1.20 2.40
2.93
4.60 4.50 2.00 1.60 1.40 1.40 1.10 1.70 1.30 2.30 3.00 3.50
.90 1.85 1.45 2.20 1.28 2.55 1.01 1.19
.67 2.11
.85 1.74
.38 1.44
.60 1.14
.51 1.43 1.21 2.93 .47 1.11 .71 1.40
2.37 .84 2.01
nm N03N NH4N SC4S-C Na Pb Cd Cu Zn Cl 5015 A-5045 N02N T-N03N T-NH4N
JAN 100.4 FEB 77.1 WR 23.4 APR 50.2 W\Y 75.0 JL!i 91.6 JLI. 61.9 Alfij 70.2 SEP 106.3 OCT 74.0 NOV 43.4 DEC 79.5
.56 .42 .37 11.36 .94
.81 .58 .79 8.59 1.03
.81 .89 1.01 17.08 1.84
.96 1.25 1.33 2.50 .33
.58 .68 1.63 .46 .Oil
.69 .92 1.51 .44 .07
.48 .48 1.11 1.04 .15
. 71 1. 27 1.16 1.19 .18
.41 .26 .41 1.17 .15
.51 .36 .68 2.68 .33
.53 .28 .63 .88 .10
.79 .88 .93 4.D .50
YEAR 853.0 .63 .64 .93 3.81 .41
13.90 15.80
- 25.90 6.40 .80
1.00 1.90 2.50
- 2.40 - 4.90
1.80 7.60
6.20
2.90 .42 .80 3.70 .76 1.09 1.90 1.07 1.44 1.50 .86 1.89 1.50 .62 1.05 1.00 .57 .98 1.20 .29 .73 1.40 .53 1.28 1.20 .18 .51 2.20 .75 1.50
- 4.20 .39 .85 3.50 .38 .74
2.18 .57 1.07
Country : SI.£DEN Station : HOBURG Year : 1990
nm N03N NH4N SC4S-C Na
155
Salpler type : I>£T ONLY Salplir!J period : DAILY
Pb Cd Cu Zn Cl 502S A-SC4S N02N T -N03N T -NH4N --------------------------------------------------------------------·-----------------------------------------------JAN FEB WR APR W\Y JL!i JLI. Alfij SEP OCT NOV DEC
55.0 34.7 16.8 29.9 25.1 16.5 50.7 30.6
115.7 49.5 88.3 35.5
.88 .46 1.59 3.13 .41 1.26 .64 1.15 6.12 .84 1.14 .75 .89 10.55 1.11
.98 2.24 1.99 2.02 .54
.52 3.04 2.08 .92 .27
.42 15.29 3.31 1.53 .65
.47 3.11 1.05 .86 .18
.72 5.32 1.98 .88 .32
.49 .81 .90 1.20 .21
.99 .80 1.04 3.07 .39
.88 .43 .75 1.24 .15 1.35 .87 1.45 3.70 .44
18.80 10.60 16.00 4.00 1.50 2.90 1.50 2.10 2.00 5.60 2.30 6.00
2.40 2.60 1.30 1.10
.70
.80
.60
.70
.40
.80 1.30 1.70
--------------------------------------------------------------------------------------------------------------------YEAR 526.3 .77 1.84 1.29 2.37 .36
Country : ·usSR Station : NIDA Year : 1990
nm N03N NH4N S04S-C Na
JAN 14.0 FEB WR 52.9 APR 10.1 W\Y 46.1 JL!i 18.9 JLI. 112.6 Alfij 45.9 SEP 201.9 OCT 116.8 NOV 116.4 DEC 10.3
1.70 .60 .58 109.00
1.30 .90 -1.81 88.00 3.30 10.70 4.43 21.10
.50 .50 1.97 .30 2.70 2.30 1.49 2.50 .10 .67 7.50 .50 .90 1.09 1.30 .60 .20 .64 5.50 .90 .70 1.10 8.40 .60 .20 .69 1.50 .80 .20 1.39 13.30
YEAR 746.0 .72 .88 1.00 11.69
*) Reportir!) NH4+
Country : USSR Station : SYRVE Year : 1990
mn N03N NH4N SC4S-C Na
Salpler type : BU_K Sa!plir!J period: DAILY
Pb Cd Cu
Salpler type : BU_K Sa!plir!J period : DAILY
Pb Cd Cu
- 5.49 1.20
Zn
Zn
Cl 502S A-SC4S N02N T -N03N T -NH4W
.30
.10
.30
.10
.10
.10
.10
.10
.10
.20
.50
.50
.10
.10
.20 .10 .10 .10
.10
.10
.10
.10
.30
.20
.40
.30
.20
.20
.10
.10
.20
.30
.40
.30
.11 .11 .25
Cl S02S A-S04S N02N T-N03N T-NH4N --------------------------------------------------------------------------------------------------------------------JAN 284.1 .80 .40 .61 1.10 .20 FEB WR 44.1 2.30 2.70 2.18 18.10 2.10 APR MAY 28.1 1.00 JUN 56.5 .30 JUL 150.1 .10 Alfij 50.7 3.50 SEP 85.2 .10
1.10 1. 57 1. 60 .10 .94 .70 .10 .54' .70
1:00 3.29 1.30 .45 .60
.30
.10
.10
.60
OCT. 79.2 .50 .20 .72 2.10 .10• NOV 121.4 .40 .10 .71 1.10 ~ 43.4 1.00 .m 1.84 4.~
2.00
34.00
- 2.50 1.30
.80 3.80 1.50 3.70 1.80 8.40
--------------------------------------------------------------------------------------------------------------------YEAR 942.8 .75 .47 .93 2.01 .31 - 3.74

Country : USSR Station : RUTSAVA Year : 1990
mn llll3N NH4N S04S..C Na
JAN FEB fWl APR W\Y J~
JU. AUS SEP OCT oov occ
65.3 60.4 42.1
B.O 45.7 60.5 90.0 60.8
146.7 124.3 163.2 56.5
1.40 1.20
.90 1.60 .20 .30 .10 .40 .60 .40 .60 .90
.70 .95 1.80
.80 1.02 2.10 ,40 1.28 5.00
1.10 3.77 1.50 .10 .97 .30 .20 .47 .40 .10 .24 .70 .70 .98 .20 .20 .84 .70 .20 .72 1.00 .40 .85 .60 .60 1.72 2.10
YEAR 923.5 .61 .37 .88 1.11
*) Reporting NH4+
Country : USSR Station : LAHEW\A Year : 1990
mn N03N NH4N S04S-C Na
JAN 58.5 .20 .10 .50 1.20 FEB 79.6 .40 .20 .57 .40 fWl 44.4 .40 .30 .45 .60 APR 13.3 .60 1.00 1.57 .40 W\Y 37.2 .40 .40 .98 .20 J~ 35.5 .20 .10 .97 .30 Jll 24.7 .30 .50 1.17 .40 AUS 41.1 .10 .7B .20 SEP 17.1 .30 .10 1.38 .20 OCT 48.4 .20 .75 .60 NOV 50.2 .20 .47 .30 OEC 17.5 .70 .20 1.08 .20
.10
.10
.10
.10
.10
.10
.10
156
Sro!Jl er t YP' : BllK Sro!Jling r;ericxl: ll'.JLY
Pb Cd Cu
Sro!Jler tl'?' : BllK Sro!Jling r;ericxl : ll'.ILY
Pb Cd Cu
Zn
Zn
Cl S02S A-S04S N02N T-N03N T-NH4N*
5.80 - 3.70
2.70 3.70 3.40
- 4.50 4.30
- 4.70 4.40 4.60 4.70 4.00
.30 .90
.60 1.40
.20 ,30
.20 .90
.10 .60
.10 .60
.10 .30
.10 .30
.20 .50
.40 .70
.20 1.00
.30 1.30
- 4.21 .23 .73
Cl S02S A-S04S N02N T -N03N T -NH4N*
1.40 1.30
.90
.20
.40
.20
.70
.30 1.70
.70
.50
.90
- 10.70 - 3.50
1.70
2.10 1.60 1.60 1.70 3.20 4.40
.10
.20
.10
.10
.10
.10
.10
.20
.30
.60
.30
.50
.30
.20
.60
.40
.60
YEAR 467.5 .30 .26 .75 .47 .10 .82 - 3.39 .12 .42
*) Reporting NH4+
Country : POLAND Station : LEI\I\ Year : 1990
mn N03N NH4N S04S-C Na
JAN 34.1 FEB 47.3 fWl 29.8 APR 28.2 W\Y 52.5 J~ 16.4 Jll 71.6 AUS 64.7 SEP 197.6 OCT 41.6 NOV 109.0 occ 40.5
.47 .53
.52 .62
.48 .97
.50 1.58
.43 .63
.89 2.38
.86 .83
.42 .57
.33 .37
.85 .86
.35 .19
.59 .44
1.02 1.30 1.31 3.86 1.16 2.48 3.15 2.13 1.76 .67 2.76 .31 1.25 .61 .90 .36 .57 .75
1.52 .82 .78 '77
1.19 l.B7
Sffi!>ler tl'?' : BllK Sro!Jling r;ericxl : ll'.JLY
Pb Cd
.22 9.00 3.21
.52 4.90 5.12
.36 8.80 3.79
.34 11.50 6.03
.11 5.70 4.65
.19 8.70 9.89
.07 11.00 10.11
.06
.11 6.20 3.02
.09 5.50 9.06
.08 6.20 4,16
.21 7.70 9.00
Cu Zn Cl S02S A-S04S N02N T -N03N T -NH4N
- 29.00 2.78 26.00 6.55 48.00 4.97 18.00 4.20 21.00 1.69 22.00 1.22 18.00 .61
.36 53.00 1.39 42.00 1.40 25.00 1.35 37.00 3.65
YEAR 733.3 .47 .59 1.11 1.10 .15 7.17 5.32 - 34.93 2.01
Country : om Station : KAP ARKONA Year : 1990
157
Sffi!ller tl'?' : I.£T ONLY Sffi!ll i ng r;eri cxl : I.£EKL Y
mn N03N NH4N S04S-C Na Pb Cd Cu Zn Cl S02S A-S04S N02N T-N03N T-NH4N ----------------------------------------------------------------------------------------JAN 30.5 FEB 24.3 fWl 33.6 APR 22.9 W\Y 20.8 J~ 45.0 Jll 35.5 AUS 69.4 SEP 103.4 OCT 17.6 oov 115.1 occ 20.6
.62 .51 1.32 1.31
.73 .73 2.06 4.86
.57 1.27 1.61 6.13 1.33 2.05 2.45 1.23 .98 .95 1.19 1.09 .96 1.76 3.33 .44 .38 .58 1.32 .73 .85 1.17 1.87 .54 .47 .45 1.16 2.06
1.09 .82 3.48 2.28 .55 .50 1.43 1.13 .52 .39 1.23 2.53
.24
.73
.83
.26
.22 '16 '14 '12 .34 .52 .22 .40
2.43 4.00 10.04 3.60 12.13 2.20 2.45 1.20 1.08 .90 1.30 .90 1.41 1.20
- 4.45 1.20 4.98 2.10
- 2.28 2.40 6.86 2.70
----------------------------
--------------------------------------------------------------------------------------------------------------------YEAR 538.7 . 86 . 84 1.71 1.73 , 30 - 3.65 2.02
Country : FRG Station : ll'.NISCH-NIENHOF Sffi!ller tl'?' : I.£T ONLY Year : 1990 Sffi!lling period : I.£EKLY
mn N03N NH4N S04S-C Na Pb Cd Cu Zn Cl S02S A-S04S 002N T-N03N T-NH4N --------------------------------------------------------------------------------------------------------------------JAN 18.0 FEB 25.0 fWl APR W\Y J~
JU. AUS SEP OCT NOV occ
.40 .90 .70
.40 2.00 1.86 4.80 3.40
.25
.29 9.50 6.50 7.50 9.00
------------------------------------------------------------------------------------------------------YEAR 43.0 .40 1.54 1.27
Country : IJ£NfWlK Station : KELOSNOR Year : 1990
mn N03N NH4N S04S-C Na
--------------- 3.99 .27 - 8.34 7.95
Sffi!ller tl'?' : I.£T ONLY Sffi!lling pericxl : DAILY
Pb Cd Cu Zn Cl S02S A-S04S N02N T-N03N T-NH4N -------------------------------------------------------------------------------------------------------------------JAN 28.4 FEB 32.7 fWl 24.8 APR 20.2 W\Y 18.2 J~ 84.8 JU. 39.4 AUS 52.3 SEP 78.4 OCT · 24.5 NOV 75.3 O£C 39.4
1.60 1.02 2.12 28.90 3.56 .48 .86 1.08 19.54 2.51 .74 1.01 1.37 19.46 2.58 .64 .87 1.40 3.87 .48 .76 1.06 1.58 1.24 .20 .55 .85 1.09 .31 .05 .49 2.44 1.13 '2.86 .30 .41 1.97 .84 2.08 .28 .53 1.19 .99 4.64 .53 .84 1.46 1.97 8.92 1.60 .43 .45 .71 3.11 .40 .85 1.43 1.06 12.29 1.75
47.63 35.08 38.22 5.67 2.56
.86 5.44 4.06 8.32
- 22.09 5.86
21. 54 --------------------------------------------------------------------------------------------------------------------YEAR 51B.4 .63 1.18 1.14 6.91 .91 - 12' 68

Country : OE!fiAAK Station : KELDSNOR Year : 1990
158
Sal\)ler type : 1.£1 OOLY Sal\)lii'(J period: DAILY
nm oo:JN NH4N S04S-C Na Mg Pb Cd CU Zn Cl S02S A-S04S II\12N T -oo:JN T -NH4N
--------------------------------------------------------------------------------------------------------------------JAN 28.4 1.60 1.02 2.12 28.90 3.56 47.63
FEB 32.7 .48 .86 1.08 19.54 2.51 35.08
W>R 24.8 .74 1.01 1.37 19.48 2.58 38.22
APR 20.2 .84 .87 1.40 3.87 .48 5.67
WiY 18.2 .76 1.06 1.58 1.24 .20 2.56
JL!< 84.8 .55 .85 1.09 .31 .05 .66
Jl1. 39.4 .49 2.44 1.13 2.68 .30 5.44
AIJi 52.3 .41 1.97 .84 2.08 .28 4.06
SEP 78.4 .53 1.19 .99 4.64 .53 8.32
OCT 24.5 .84 1.46 1.97 8.92 1.60 22.09
OOV 75.3 .43 .45 .71 3.11 .40 5.86
DEC 39.4 .85 1.43 1.06 12.29 1.75 21.54
--------------------------------------------------------------------------------------------------------------------YEM 518.4 .63 1.18 1.14 6.91 .91 - 12.68
No. 1
159
BALTIC SEA ENVIRONMENT PROCEEDINGS
JOINT ACTIVITIES OF THE BALTIC SEA STATES WITHIN THE FRAMEWORK OF THE CONVENTION ON THE PROTECTION OF TI-lE MARINE ENVIRONMENT OF THE BALTIC SEA AREA 1974-1978 (1979)*
No. 2 REPORT OF THE INTERIM COMMISSION (!C) TO THE BALTIC MARINE ENVIRONMENT PROTECTION COMMISSION (1981)
No. 3 ACTIVITIES OF THE COMMISSION 1980
No.4
No. SA
No. SB
No.6
- Report on the activities of the Baltic Marine Environment Protection Commission during 1980 - HELCOM Recommendations passed during 1980 (1981)
BALTIC MARINE ENVIRONMENT BIBLIOGRAPHY 1970-1979 (1981)
ASSESSMENT OF THE EFFECTS OF POLLUTION ON THE NATURAL RESOURCES OF THE BALTIC SEA, 1980 PART A-1: OVERALL CONCLUSIONS (1981)*
ASSESSMENT OF THE EFFECTS OF POLLUTION ON THE NATURAL RESOURCES OF THE BALTIC SEA, 1980 PART A-1: OVERALL CONCLUSIONS PART A-2: SUMMARY OF RESULTS PART B: SCIENTIFIC MATERIAL (1981)
WORKSHOP ON THE ANALYSIS OF HYDROCARBONS IN SEAWATER Institut fiir Meereskunde an der Universitiit Kiel, Department of Marine Chemistry, March 23 -April 3, 1981
(1982)
No. 7 ACTIVITIES OF THE COMMISSION 1981 Report of the activities of the Baltic Marine Environment Protection Commission during 1981 including the Third Meeting of the Commission held in Helsinki 16-19 February 1982 HELCOM Reconm1endations passed during 1981 and 1982
(1982)
No. 8 ACTIVITIES OF THE COMMISSION 1982 Report of the activities of the Baltic Marine Environment Protection Conunission during 1982 including the Fourth Meeting of the Commission held in Helsinki 1-3 February 1983 HELCOM Recommendations passed during 1982 and 1983
(1983)
No. 9 SECOND BIOLOGICAL INTERCALIBRATION WORKSHOP
* out of print
Marine Pollution Laboratory and Marine Division of the National Agency of Environmental Protection; Denmark, August 17-20, 1982, R0IU1e, Denmark (1983)

No. 10
No. 11
No. 12
No. 13
No. 14
No. 15
No. 16
No. 17A
No. 17B
No. 18
No. 19
No. 20
* out of print
160 101
TEN YEARS AFTER THE SIGNING OF THE HELSINKI CONVENTION National Statements by the Contracting Parties on the Achievements in Implementing the Goals of the Convention on the Protection of the Marine Environment of the Baltic Sea Area (1984)
STUDIES ON SHIP CASUALTIES IN THE BALTIC SEA 1979-1981 Helsinki University of Technology, Ship Hydrodynamics Laboratory, Otaniemi, Finland P. Tuovinen, V. Kostilainen and A. FHimliUi.inen (1984)
GUIDELINES FOR THE BALTIC MONITORING PROGRAMME FOR THE SECOND STAGE (1984)
ACTIVITIES OF THE COMMISSION 1983 Report of the activities of the Baltic Marine Environment Protection Commission during 1983 including the Fifth Meeting of the Commission held in Helsinki 13-16 March 1984 HELCOM Recommendations passed during 1983 and 1984
(1984)
SEMINAR ON REVIEW OF PROGRESS MADE IN WATER PROTECTION MEASURES 17-21 October 1983, Espoo, Finland (1985)
ACTIVITIES OF THE COMMISSION 1984 Report of the activities of the Baltic Marine Environment Protection Commission during 1984 including the Sixth Meeting of the Commission held in Helsinki 12-15 March 1985 HELCOM Recommendations passed during 1984 and 1985
(1985)
WATER BALANCE OF THE BALTIC SEA A Regional Cooperation Project of the Baltic Sea States; International Sununary Report (1986)
FIRST PERIODIC ASSESSMENT OF THE STATE OF THE MARINE ENVIRONMENT OF THE BALTIC SEA AREA, 1980-1985; GENERAL CONCLUSIONS (1986)
FIRST PERIODIC ASSESSMENT OF THE STATE OF THE MARINE ENVIRONMENT OF THE BALTIC SEA AREA, 1980-1985; BACKGROUND DOCUMENT (1987)
ACTIVITIES OF THE COMMISSION 1985 Report of the activities of the Baltic Marine Environment Protection Cormnission during 1985 including the Seventh Meeting of the Commission held in Helsinki 11-14 February 1986 HELCOM Recommendations passed during 1986
(1986)*
BALTIC SEA MONITORING SYMPOSIUM Tallinn, USSR, 10-15 March 1986 (1986)
FIRST BALTIC SEA POLLUTION LOAD COMPILATION (1987)
No. 21
No. 22
No. 23
No. 24
·No. 25
No. 26
No. 27A
No. 27B
No. 27C
No. 27D
No. 28
No. 29
* out of print
SEMINAR ON lW(HILA'!IONS CONTAINED IN ANNEX ll OF MARPOL 73178 AND REGULATIONS 01' ANNiiX IV 011 Tl!E HELSINKI CONVENTION National Swe-di~;h Adminic;tmlion of Shipping and Navigation; 17-18 November 1986, Norrk6pillg, Sweden (1987)
SEMINAR ON OIL POLLUT!Oi~ t)UESTIONS 19-20 November 1986, Nmrk6piHJl,- Swetkn (1987)
ACTIVITIES OF THE COMMISSION 1986 - Report on the activities of Ow lbl!ir fv1afine Environment Protection Commission during 1986
including the Eighth Mecting of Um Commission held in Helsinki 24-27 Febmary 1987 - HELCOM Reconunendatiorw pii!;ncd during 1987 (1987)*
PROGRESS REPORTS ON CAI.>M!UM, MERCURY, COPPER AND ZINC (I 987)
SEMINAR ON WASTEWA'I'EH T!Uii\TMENT IN URBAN AREAS "7-9 September 1986, Visby~ Sweden (1987)
ACTIVITIES OF TilE COMMISSION 1987 - Report on the activities of the Balli(' Mmine Environment Protection Commission during 1987
including the Ninth Meeting of !he Commission held in Helsinki I5-19 February 1988 - HELCOM Recommendations ptt8Me-d during 1988 (1988)
GUIDELINES FOR THE BALTIC MONITORING PROGRAMME FOR THE THIRD STAGE; PART A. INTRODUCTORY CHAPTERS (I 988)
GUIDELINES FOR THE BALTIC MONITORING PROGRAMME FOR THE THIRD STAGE; PART B. PHYSICAL AND CIIEMICAL DETERMINANDS IN SEA WATER (1988)
GUIDELINES FOR THE BAI.:l'Jc MONITORING PROGRAMME FOR THE THIRD STAGE; PART C. HARMFUL SUBSTANCES IN l3JOTA AND SEDIMENTS ( 1988)
GUIDELINES FOR THE BALTIC MONITORING PROGRAMME FOR THE THIRD STAGE; PART D. BIOLOGICAL DETERMINANDS ( 1988)
RECEPTION OF WASTES FROM SHIPS IN THE BALTIC SEA AREA - A MAR POI.- 73178 SPECIAL AREA ( 1989)
ACTIVITIES OF THE COMMISSION 1988 - Report on the activities of the Bailie Marine Environment Protection Commission during 1988
including the Tenth Meeting of the Commission held in Helsinki 14-17 February 1989 - H ELCOM Recommendations passed during 1989 (1989)

No. 30
No. 31
No. 32
No. 33
No. 34
No. 35A
No. 35B
No. 36
No. 37
No. 38
* out of print
162
SECOND SEMINAR ON WASTEWATER TREATMENT IN URBAN AREAS 6-8 September 1987, Vis by, Sweden (1989)
THREE YEARS OBSERVATIONS OF THE LEVELS OF SOME RADIONUCLIDES IN THE BALTIC SEA AFTER THE CHERNOBYL ACCIDENT Seminar on Radionuclides in the Baltic Sea 29 May 1989, Rostock-Wamemiinde, German Democratic Republic (1989)
DEPOSITION OF AIRBORNE POLLUTANTS TO THE BALTIC SEA AREA 1983-1985 AND 1986 (1989)
ACTIVITIES OF THE COMMISSION 1989 - Report on the activities of the Baltic Marine Environment Protection Commission during 1989
including the Eleventh Meeting of the Commission held in Helsinki 13-16 February 1990 - HELCOM Recommendations passed during 1990 (1990)*
STUDY OF THE RISK FOR ACCIDENTS AND THE RELATED ENVIRONMENTAL HAZARDS FROM THE TRANSPORTATION OF CHEMICALS BY TANKERS IN THE BALTIC SEA AREA (1990)
SECOND PERIODIC ASSESSMENT OF THE STATE OF THE MARINE ENVIRONMENT OF THE BALTIC SEA, 1984-1988; GENERAL CONCLUSIONS (1990)
SECOND PERIODIC ASSESSMENT OF THE STATE OF THE MARINE ENVIRONMENT OF THE BALTIC SEA, 1984-1988; BACKGROUND DOCUMENT (1990)
SEMINAR ON NUTRIENTS REMOVAL FROM MUNICIPAL WASTE WATER 4-6 September 1989, Tampere, Finland (1990)
ACTIVITIES OF THE COMMISSION 1990 - Report on the activities of the Baltic Marine Environment Protection Commission during 1990
including the Twelfth Meeting of the Commission held in Helsinki 19-22 February 1991 - HELCOM Recommendations passed during 1991 (1991)
THIRD BIOLOGICAL INTERCALIBRATION WORKSHOP 27-31 August 1990, Visby, Sweden (1991)

Baltic Marine Environment Protection Commission - Helsinki Commission -Manncrhcimintie 12 A SF-00 100 Helsinki
ISSN 0357-2994


![PDF - arXiv · arxiv:1702.07159v1 [math.ap] 23 feb 2017 existence and boundary regularity for degenerate phase transitions paolo baroni, tuomo kuusi, casimir lindfors ...](https://static.fdocuments.in/doc/165x107/5b15dec97f8b9a85498b837f/pdf-arxiv-arxiv170207159v1-mathap-23-feb-2017-existence-and-boundary.jpg)