M. Sundaram Tenn. Tech1 MANAGING PROJECTS USING NETWORK TECHNIQUES.
93
M. Sundaram Tenn. Tech 1 MANAGING PROJECTS USING NETWORK TECHNIQUES
-
Upload
ashlyn-simpson -
Category
Documents
-
view
231 -
download
0
Transcript of M. Sundaram Tenn. Tech1 MANAGING PROJECTS USING NETWORK TECHNIQUES.
M. Sundaram Tenn. Tech 1
MANAGING PROJECTS USING NETWORK TECHNIQUES
M. Sundaram Tenn. Tech 2
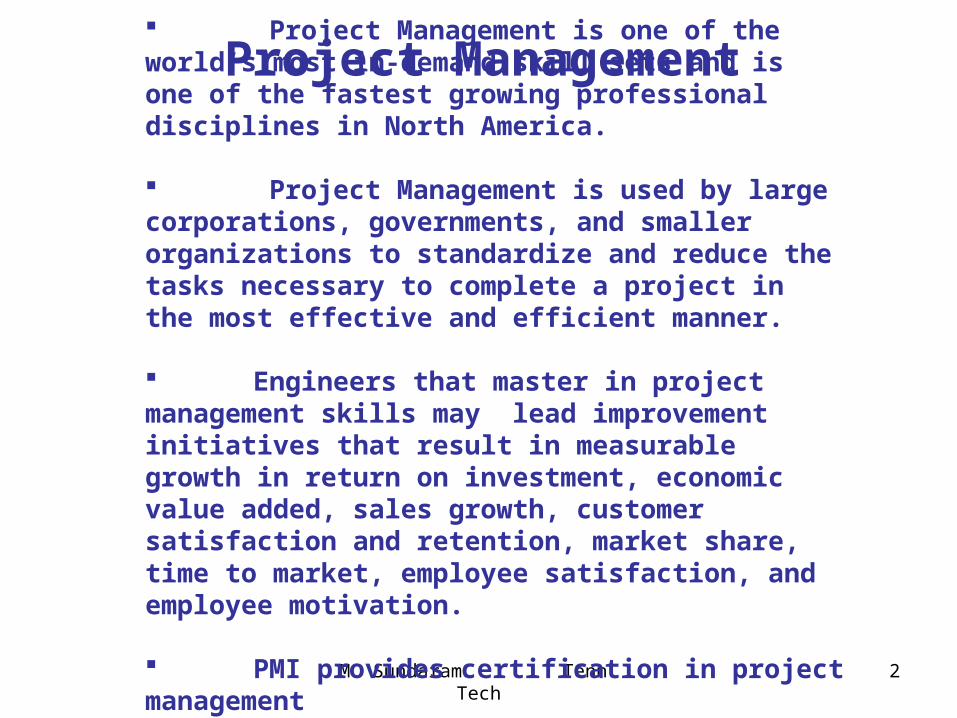
Project Management Project Management is one of the world’s most in-demand skill sets and is one of the fastest growing professional disciplines in North America. Project Management is used by large corporations, governments, and smaller organizations to standardize and reduce the tasks necessary to complete a project in the most effective and efficient manner.
Engineers that master in project management skills may lead improvement initiatives that result in measurable growth in return on investment, economic value added, sales growth, customer satisfaction and retention, market share, time to market, employee satisfaction, and employee motivation.
PMI provides certification in project management
M. Sundaram Tenn. Tech 3
Network based Techniques-Outline
Project Planning – An Introduction Development of Project Network Identifying Critical paths Probabilistic Analysis in PERT Networks How to use the Normal table Project Cost Control Resource Allocation EVA for monitoring progress of Projects
M. Sundaram Tenn. Tech 4
PERT and CPM
• PERT (Program Evaluation Review Technique) was developed by a joint team set up by the U.S. Navy Special Projects Office that included representatives from Lockheed Aircraft Corporation (Prime contractor of the POLARIS program) and from the consulting company Booze, Allen, and Hamilton.
• The objective of this team was to develop an integrated planning and control system for the Polaris missile submarine program which would help avoid the time and cost overruns that had plagued other such development programs.
• An important feature of the PERT approach is its statistical treatment of the
uncertainty in activity time estimate which involved the collection of three separate time estimates and the calculation of probability estimates of meeting specified schedule dates.
• The three estimates used are: Optimistic time, Pessimistic time, and Most likely time.
• PERT networks are usually to manage projects that have several uncertain activities
M. Sundaram Tenn. Tech 5
PERT and CPM- Contd.
• CPM (Critical Path Method) evolved from a parallel joint effort initiated originally at DuPont and later expanded to include Remington Rand Univac and Mauchly Associates.
• The two key differences of this approach from PERT: (1) the use of only one time estimate for each activity (and thus no statistical treatment of uncertainty) and (2) the inclusion, as an integral part of the overall scheme, of a procedure for time/cost tradeoff to minimize the sum of direct and indirect project costs.
• An important common feature of both PERT and CPM is the use of a network diagram for project representation in which arrows represent activities ("activity-on arrow").
• A modification of this approach involves the representation of activities by circles, with arrows indicating precedence ("activity-on-node").
M. Sundaram Tenn. Tech 6
Applications of PERT and CPM
• Construction projects (e.g.) buildings, highways, houses, and bridges.)
• Preparation of bids and proposals for large projects.
• Maintenance planning of oil refineries, ships, chemical plants and other large scale operations.
• Planning for relocating a facility
• Manufacture and assembly of large and complex products such as airplanes, ships, and mainframe computers.
• Simple projects such as home remodeling, moving to a new house, and home cleaning and painting.
• Design and development of new products
• Facilities planning and implementation of new layouts in manufacturing.
• Development of computer Software packages
M. Sundaram Tenn. Tech 7
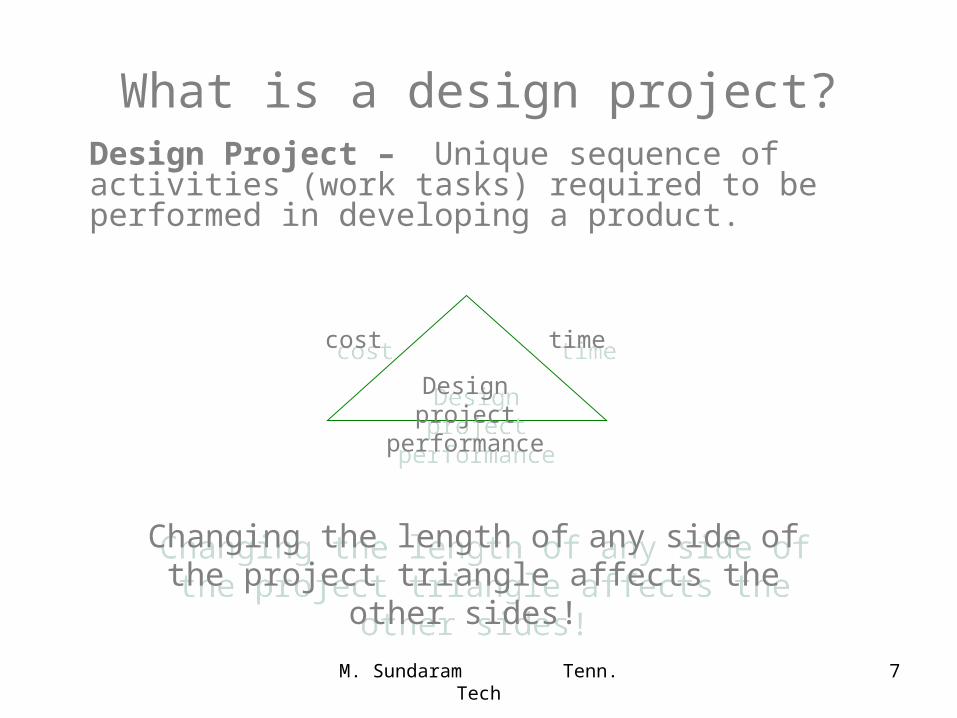
What is a design project?Design Project – Unique sequence of activities (work tasks) required to be performed in developing a product.
costcost
Design projectDesign project
performanceperformance
timetime
Changing the length of any side of the project triangle affects the other sides!
Changing the length of any side of the project triangle affects the other sides!
M. Sundaram Tenn. Tech 8
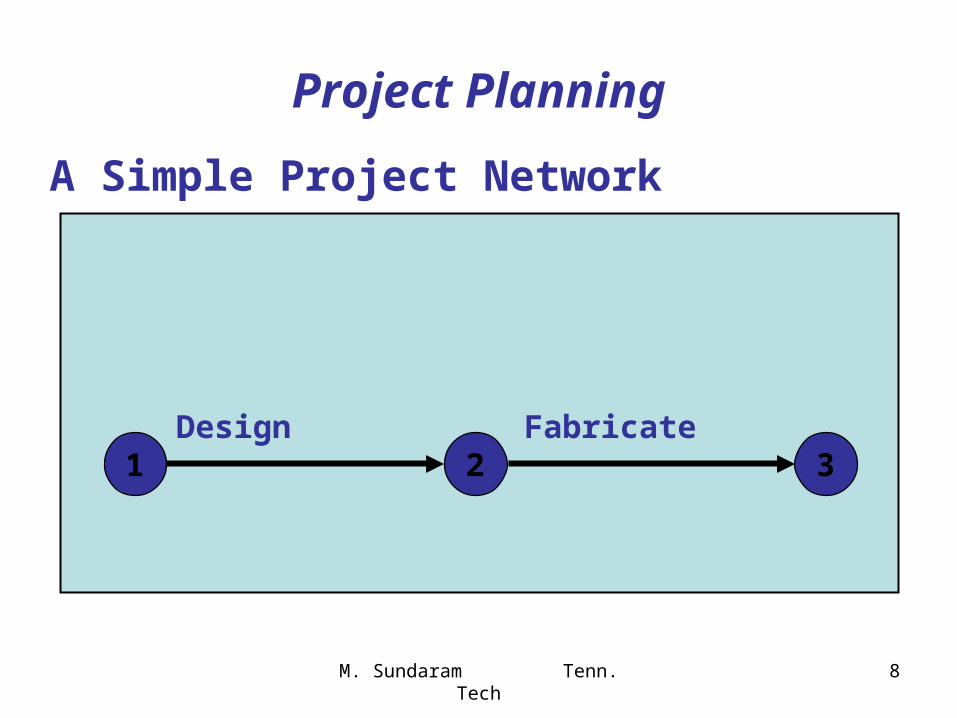
Project Planning
A Simple Project Network
Design Fabricate1 32
M. Sundaram Tenn. Tech 9
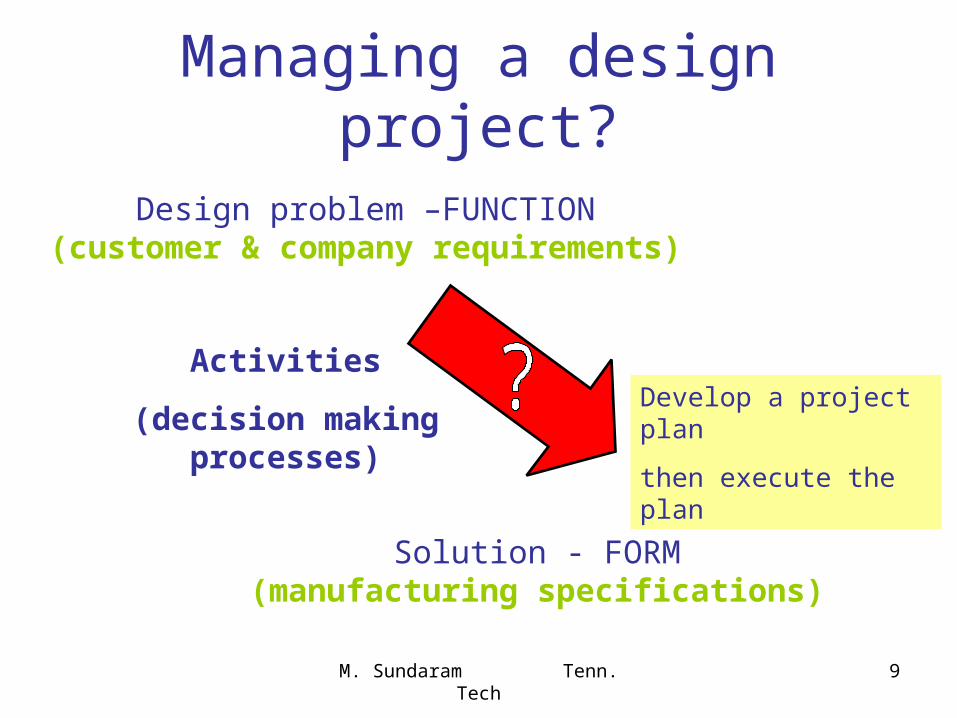
Managing a design project?
Design problem –FUNCTION(customer & company requirements)
Solution - FORM(manufacturing specifications)
Activities
(decision making processes)Develop a project plan
then execute the plan
M. Sundaram Tenn. Tech 10
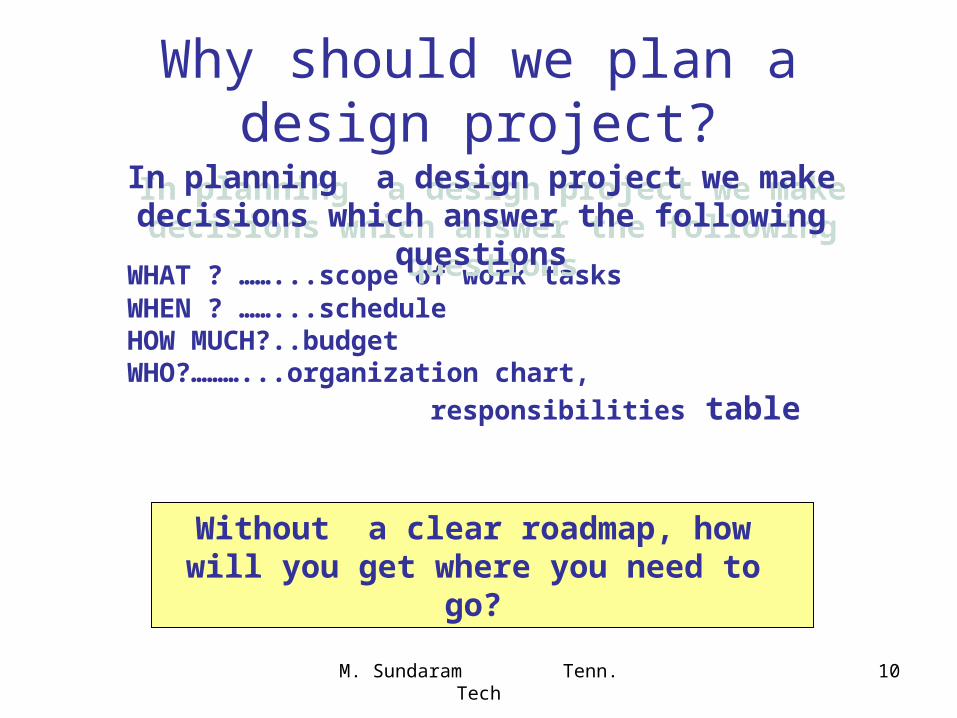
Why should we plan a design project?
WHAT ? ……...scope of work tasksWHEN ? ……...scheduleHOW MUCH?..budgetWHO?………...organization chart,
responsibilities table
Without a clear roadmap, how will you get where you need to go?
In planning a design project we make decisions which answer the following questions
In planning a design project we make decisions which answer the following questions
M. Sundaram Tenn. Tech 11
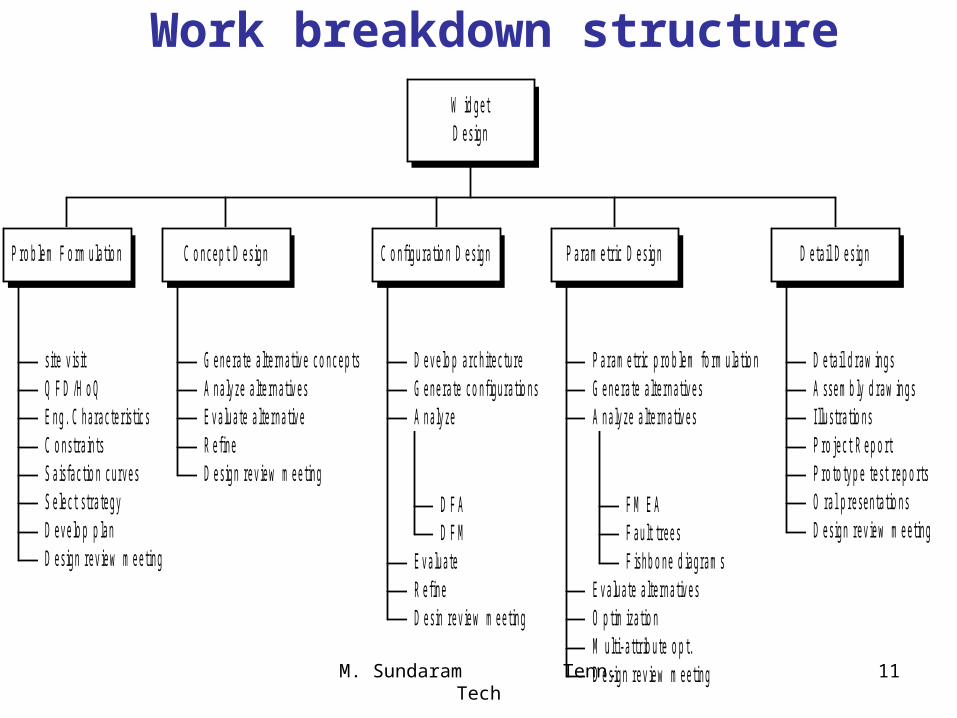
s ite vis itQ F D /H o QE ng. C ha ra c te ris tic sC o ns tra intsS a is fa c tio n c urve sS e le c t s tra te gyD e ve lo p p la nD e s ign re vie w m e e ting
P ro b le m F o rm ula tio n
G e ne ra te a lte rna tive c o nc e p tsA na lyze a lte rna tive sE va lua te a lte rna tiveR e fineD e s ign re vie w m e e ting
C o nc e p t D e s ign
D e ve lo p a rc hite c tureG e ne ra te c o nfigura tio ns
D F AD F M
A na lyze
E va lua teR e fineD e s in re vie w m e e ting
C o nfigura tio n D e s ign
P a ra m e tric p ro b le m fo rm ula tio nG e ne ra te a lte rna tive s
F M E AF a ult tre e sF ishb o ne d ia gra m s
A na lyze a lte rna tive s
E va lua te a lte rna tive sO p tim iza tio nM ulti- a ttrib ute o p t.D e s ign re vie w m e e ting
P a ra m e tric D e s ign
D e ta il d ra w ingsA sse m b ly d ra w ingsIllus tra tio nsP ro je c t R e p o rtP ro to typ e te s t re p o rtsO ra l p re se nta tio nsD e s ign re vie w m e e ting
D e ta il D e s ign
W id ge tD e s ign
Work breakdown structure
M. Sundaram Tenn. Tech 12
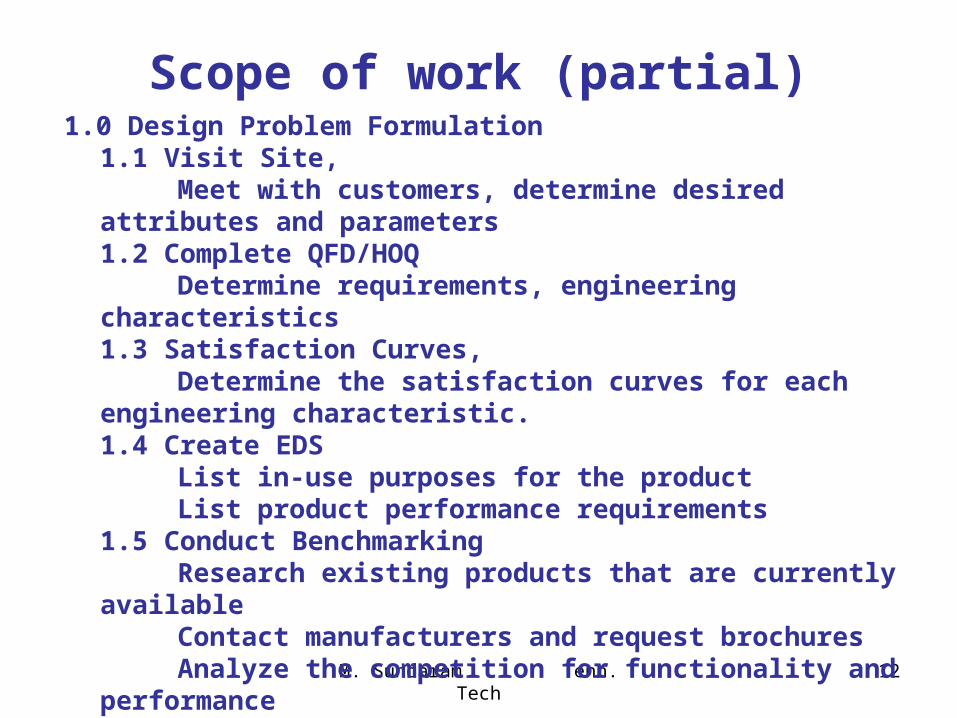
1.0 Design Problem Formulation1.1 Visit Site,
Meet with customers, determine desired attributes and parameters1.2 Complete QFD/HOQ
Determine requirements, engineering characteristics1.3 Satisfaction Curves,
Determine the satisfaction curves for each engineering characteristic.1.4 Create EDS
List in-use purposes for the productList product performance requirements
1.5 Conduct BenchmarkingResearch existing products that are currently availableContact manufacturers and request brochuresAnalyze the competition for functionality and performance
Scope of work (partial)
M. Sundaram Tenn. Tech 13
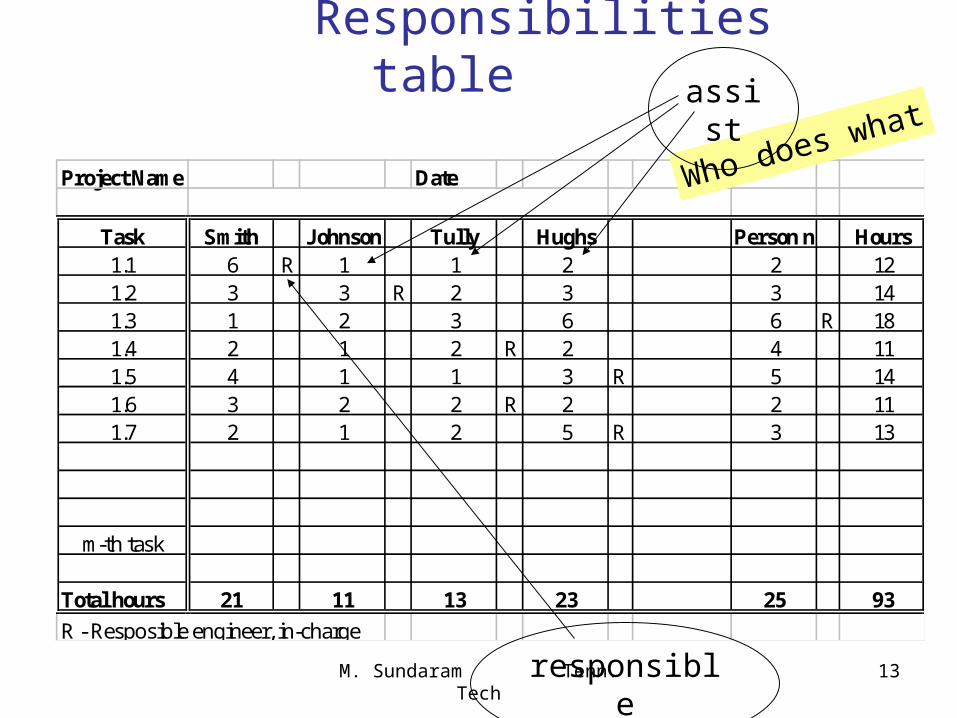
Project Name Date
Task Smith Johnson Tully Hughs Person n Hours1.1 6 R 1 1 2 2 121.2 3 3 R 2 3 3 141.3 1 2 3 6 6 R 181.4 2 1 2 R 2 4 111.5 4 1 1 3 R 5 141.6 3 2 2 R 2 2 111.7 2 1 2 5 R 3 13
m-th task
Total hours 21 11 13 23 25 93
R - Resposible engineer, in-charge
Responsibilities table
Who does whatassist
responsible
M. Sundaram Tenn. Tech 14
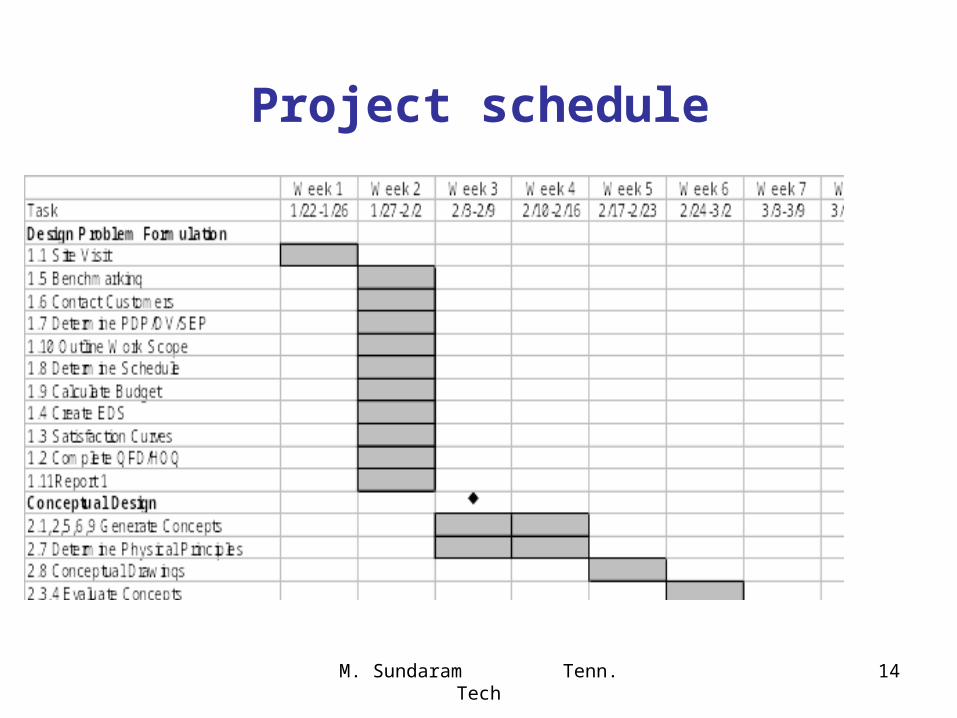
Project schedule
M. Sundaram Tenn. Tech 15
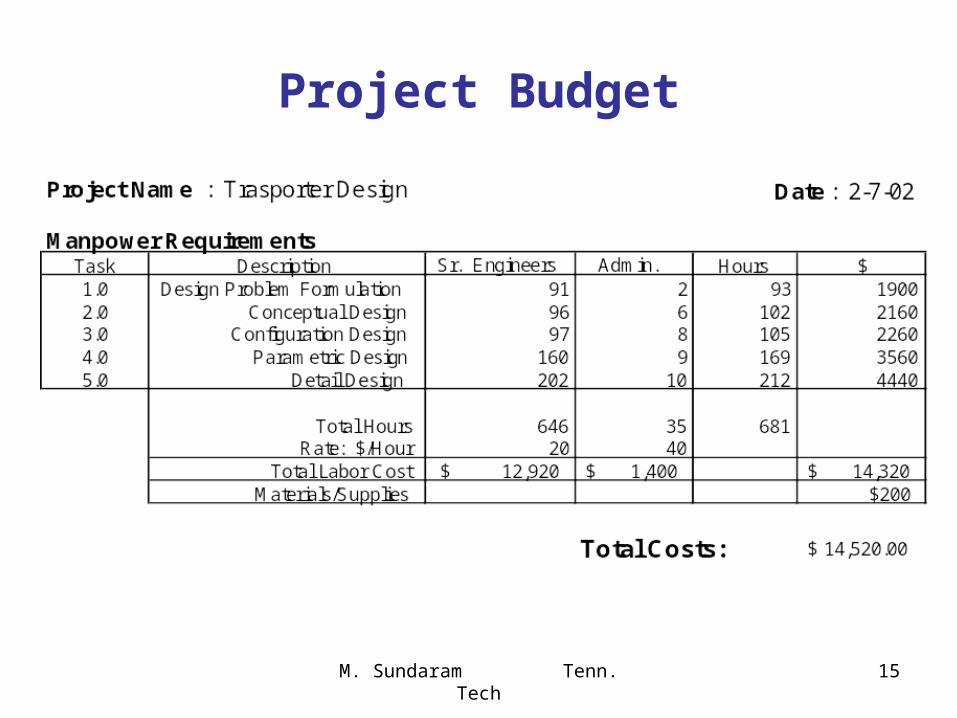
Project Budget
M. Sundaram Tenn. Tech 16
Elements of Project Management
Project team Individuals from different departments within
company
Matrix organization Team structure with members from different
functional areas depending on skills needed
Project manager Leader of project team
M. Sundaram Tenn. Tech 17
Project Planning
Statement of work Written description of goals, work & time
frame of projectActivities require labor, resources &
timePrecedence relationship shows
sequential relationship of project activities
M. Sundaram Tenn. Tech 18
Project Control
All activities identified and included Completed in proper sequence Resource needs identified Schedule adjusted Maintain schedule and
budget Complete on time
M. Sundaram Tenn. Tech 19
A Gantt Chart
Popular tool for project schedulingPopular tool for project schedulingGraph with bar for representing the time Graph with bar for representing the time
for each taskfor each taskProvides visual display of project scheduleProvides visual display of project scheduleAlso shows slack for activitiesAlso shows slack for activities
Amount of time activity can be delayed Amount of time activity can be delayed without delaying projectwithout delaying project
M. Sundaram Tenn. Tech 20
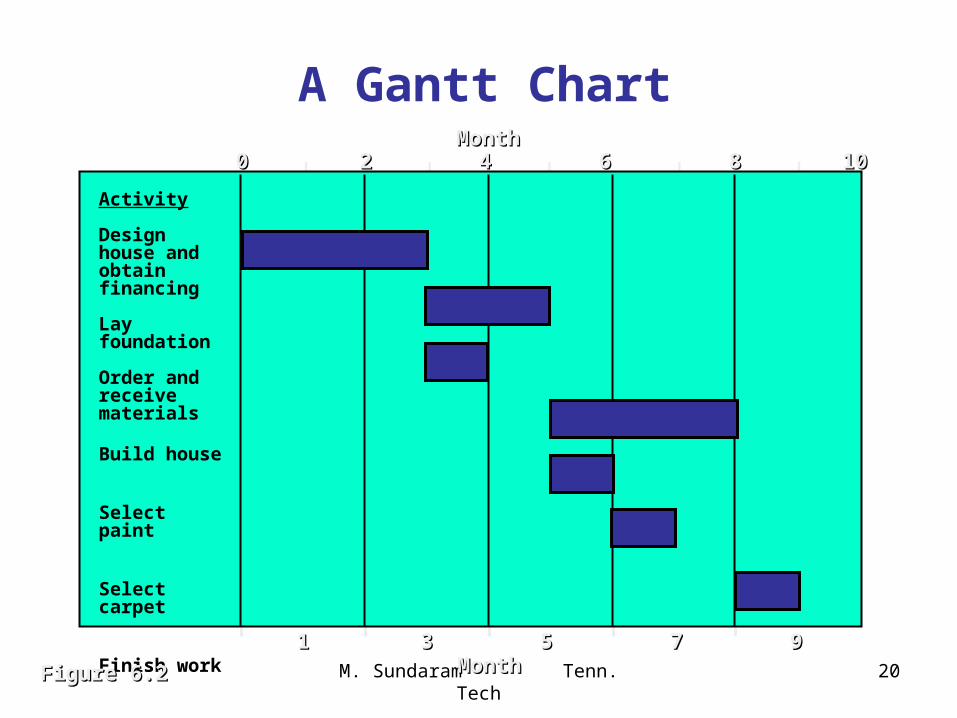
A Gantt Chart
| | | | |Activity
Design house and obtain financing
Lay foundation
Order and receive materials
Build house
Select paint
Select carpet
Finish work
00 22 44 66 88 1010MonthMonth
MonthMonth11 33 55 77 99
Figure 6.2Figure 6.2
M. Sundaram Tenn. Tech 21
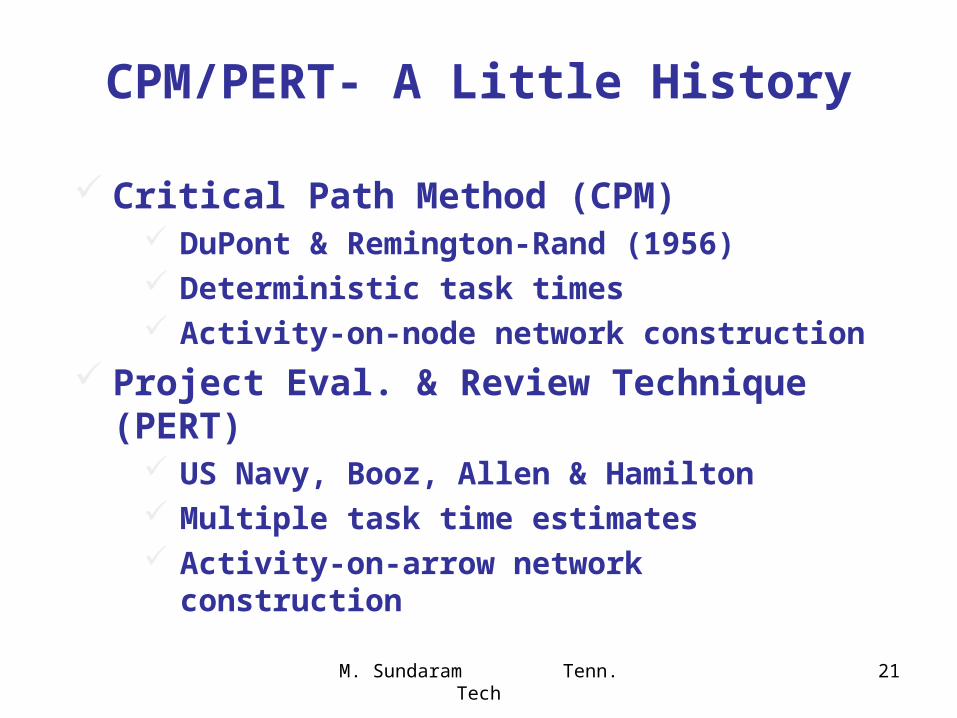
CPM/PERT- A Little History
Critical Path Method (CPM) DuPont & Remington-Rand (1956) Deterministic task times Activity-on-node network construction
Project Eval. & Review Technique (PERT) US Navy, Booz, Allen & Hamilton Multiple task time estimates Activity-on-arrow network
construction
M. Sundaram Tenn. Tech 22
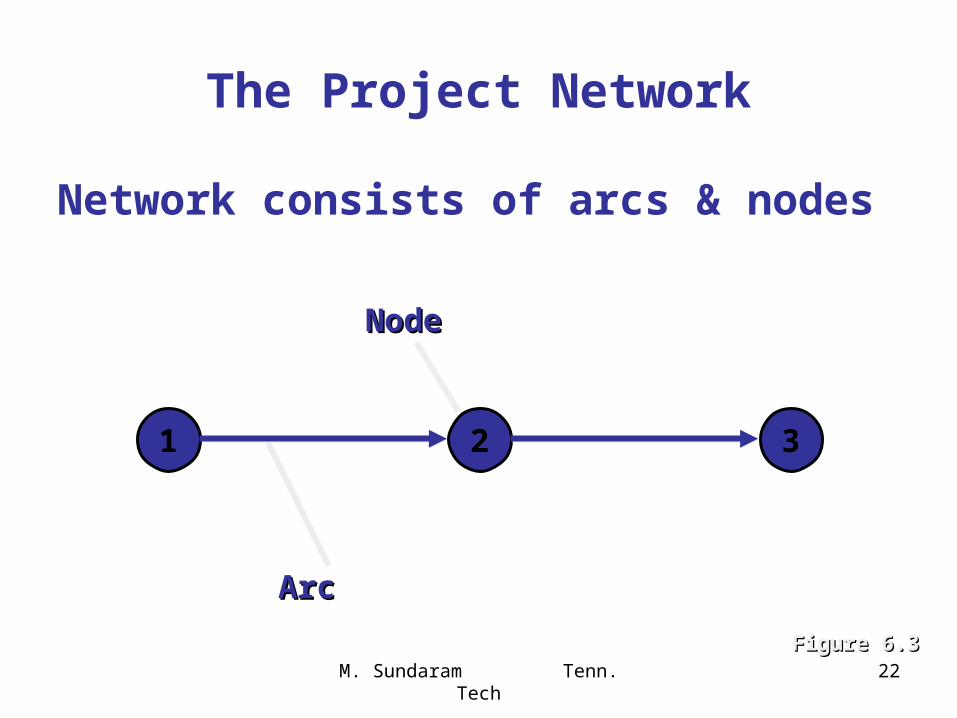
The Project Network
Network consists of arcs & nodes
1 32
ArcArc
NodeNode
Figure 6.3Figure 6.3
M. Sundaram Tenn. Tech 23
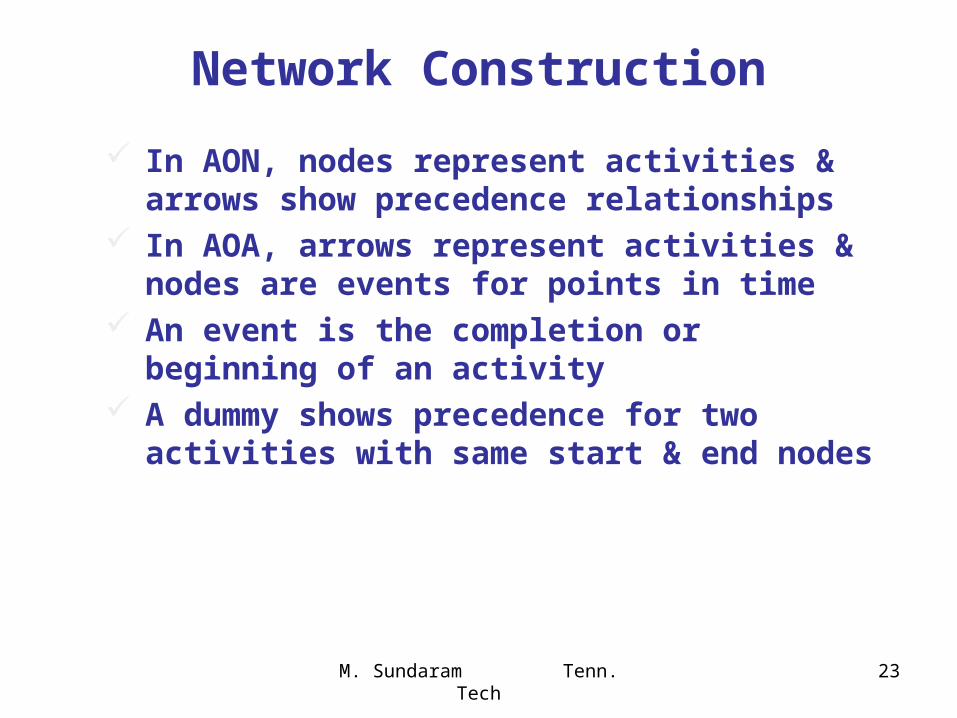
Network Construction
In AON, nodes represent activities & arrows show precedence relationships
In AOA, arrows represent activities & nodes are events for points in time
An event is the completion or beginning of an activity A dummy shows precedence for two activities with
same start & end nodes
M. Sundaram Tenn. Tech 24
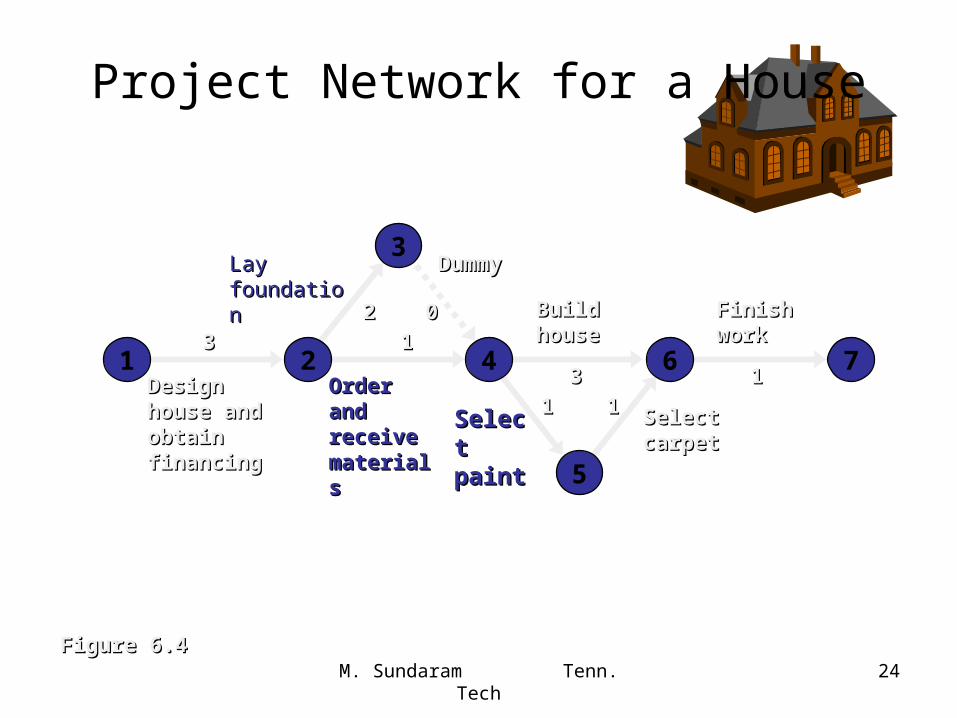
Project Network for a House
3322 00
11
33
11 1111
1 2 4 6 7
3
5
Lay Lay foundationfoundation
Design house Design house and obtain and obtain financingfinancing
Order and Order and receive receive materialsmaterials
DummyDummy
Finish Finish workwork
Select Select carpetcarpet
Select Select paintpaint
Build Build househouse
Figure 6.4Figure 6.4
M. Sundaram Tenn. Tech 25
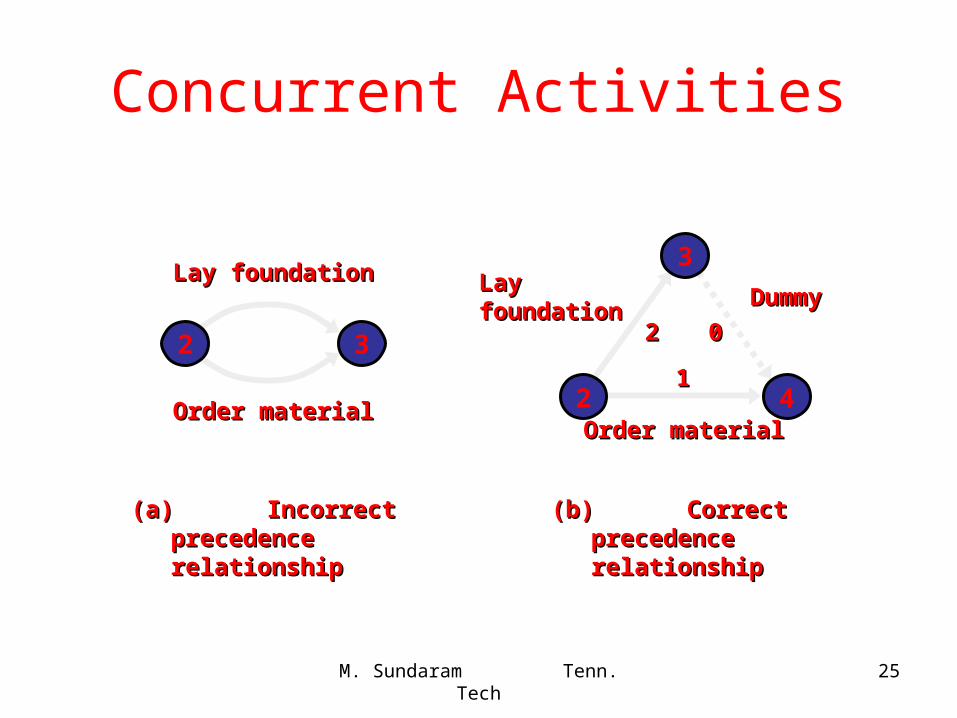
Concurrent Activities
2 3
Lay foundationLay foundation
Order materialOrder material
(a)(a) Incorrect precedence Incorrect precedence relationshiprelationship
(b)(b) Correct precedence Correct precedence relationshiprelationship
3
42
DummyDummyLay Lay foundationfoundation
Order materialOrder material
11
22 00
M. Sundaram Tenn. Tech 26
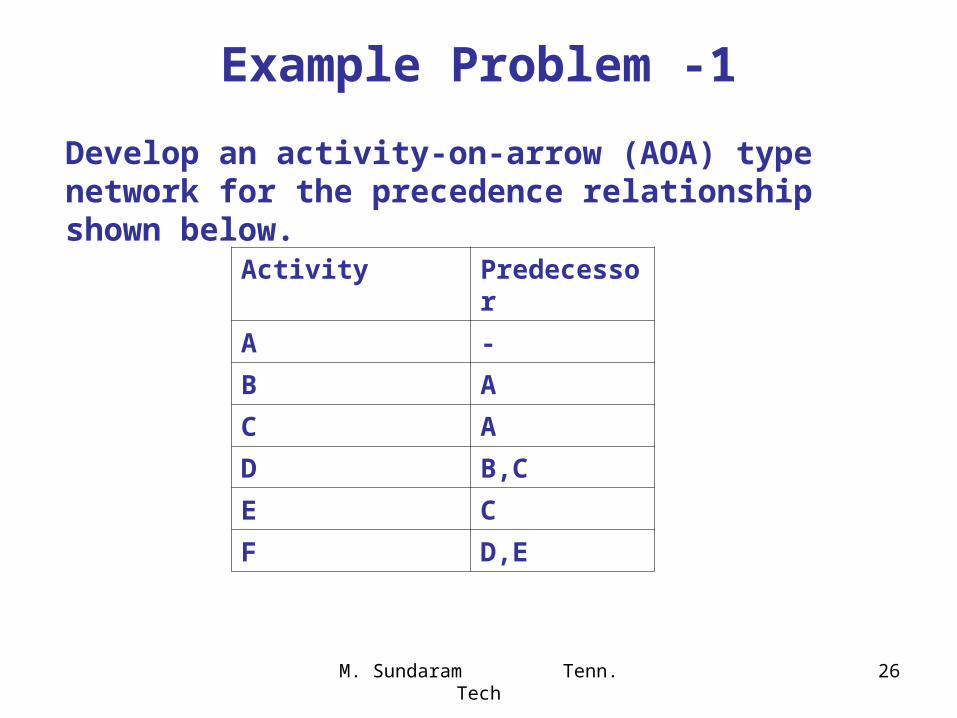
Example Problem -1
Develop an activity-on-arrow (AOA) type network for the precedence relationship shown below.
Activity Predecessor
A -
B A
C A
D B,C
E C
F D,E

M. Sundaram Tenn. Tech 27
Solution
M. Sundaram Tenn. Tech 28
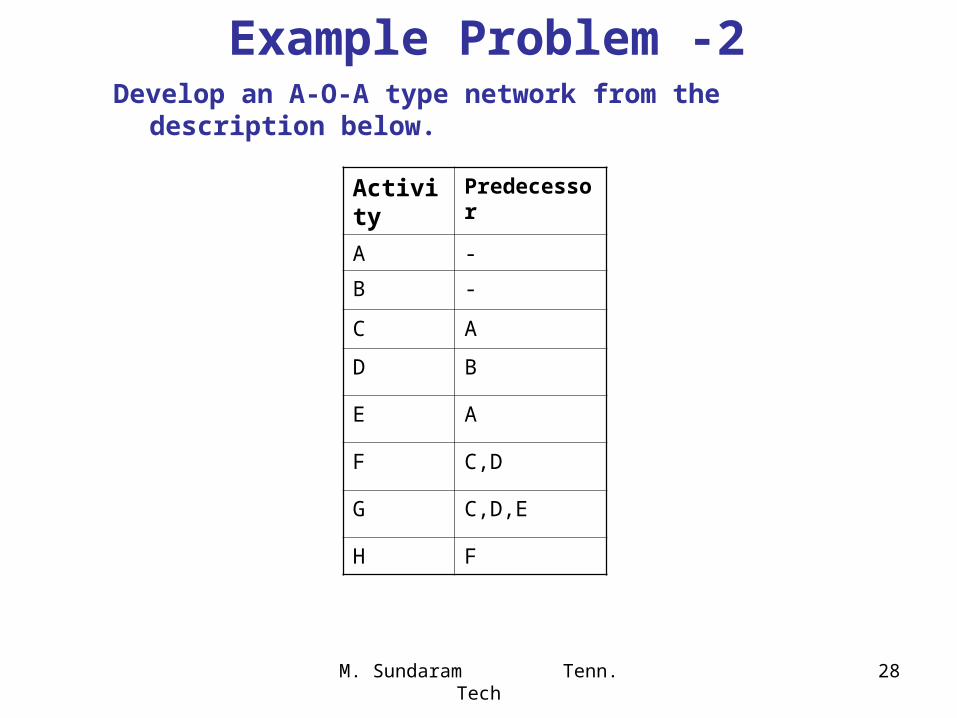
Example Problem -2Develop an A-O-A type network from the description below.
Activity Predecessor
A -
B -
C A
D B
E A
F C,D
G C,D,E
H F
M. Sundaram Tenn. Tech 29
Solution
M. Sundaram Tenn. Tech 30
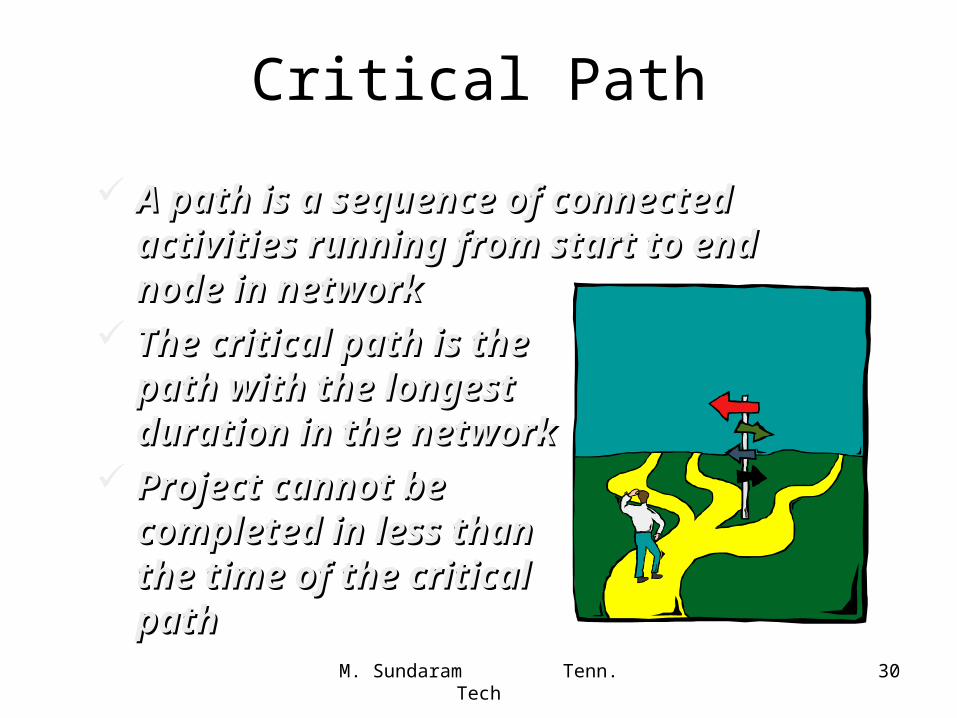
Critical Path
A path is a sequence of connected A path is a sequence of connected activities running from start to end activities running from start to end node in networknode in network
The critical path is the The critical path is the path with the longest path with the longest duration in the networkduration in the network
Project cannot be Project cannot be completed in less than completed in less than the time of the critical the time of the critical pathpath
M. Sundaram Tenn. Tech 31
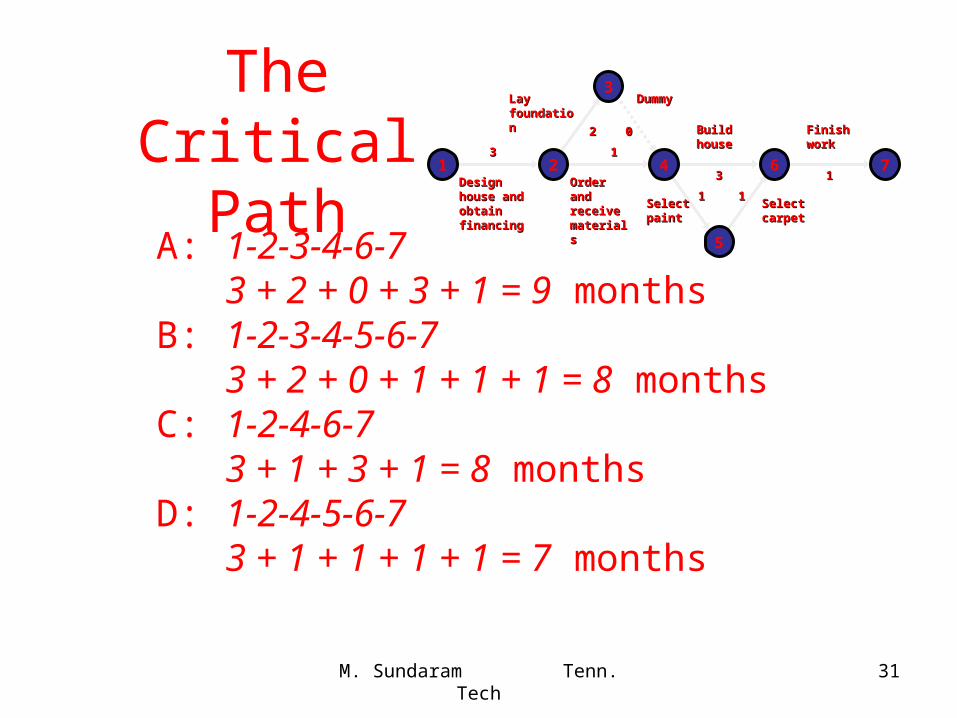
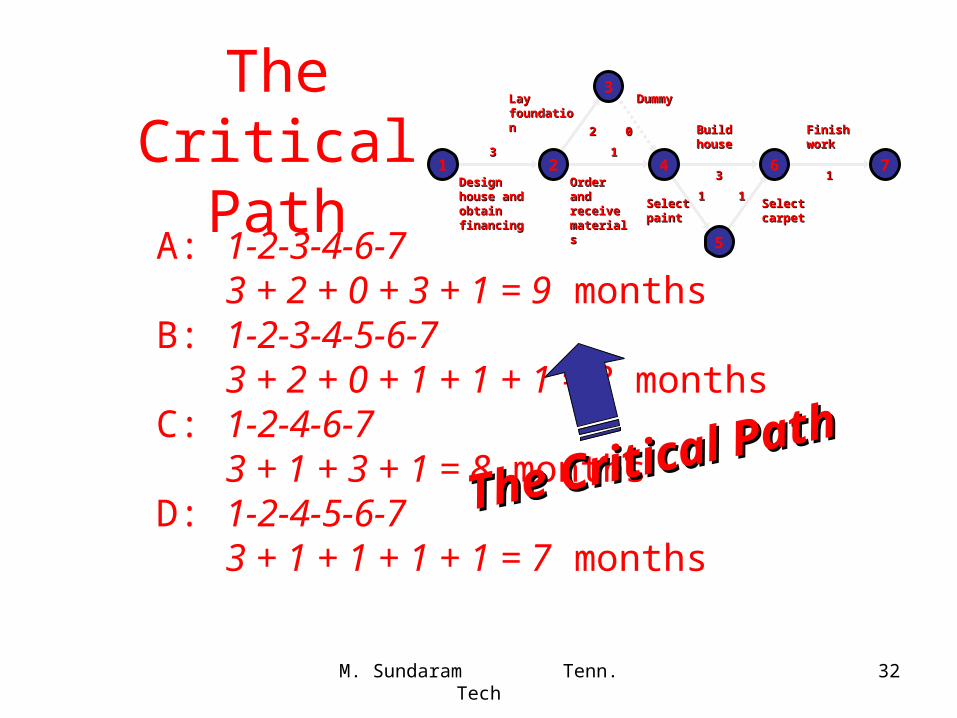
The Critical Path
A: 1-2-3-4-6-73 + 2 + 0 + 3 + 1 = 9 months
B: 1-2-3-4-5-6-73 + 2 + 0 + 1 + 1 + 1 = 8 months
C: 1-2-4-6-73 + 1 + 3 + 1 = 8 months
D: 1-2-4-5-6-73 + 1 + 1 + 1 + 1 = 7 months
33
22 00
11
33
11 11
111 2 4 6 7
3
5
Lay Lay foundationfoundation
Design house Design house and obtain and obtain financingfinancing
Order and Order and receive receive materialsmaterials
DummyDummy
Finish Finish workwork
Select Select carpetcarpet
Select Select paintpaint
Build Build househouse
M. Sundaram Tenn. Tech 32
The Critical Path
A: 1-2-3-4-6-73 + 2 + 0 + 3 + 1 = 9 months
B: 1-2-3-4-5-6-73 + 2 + 0 + 1 + 1 + 1 = 8 months
C: 1-2-4-6-73 + 1 + 3 + 1 = 8 months
D: 1-2-4-5-6-73 + 1 + 1 + 1 + 1 = 7 months
33
22 00
11
33
11 11
111 2 4 6 7
3
5
Lay Lay foundationfoundation
Design house Design house and obtain and obtain financingfinancing
Order and Order and receive receive materialsmaterials
DummyDummy
Finish Finish workwork
Select Select carpetcarpet
Select Select paintpaint
Build Build househouse
The Critical Path
The Critical Path
M. Sundaram Tenn. Tech 33
The Critical Path 33
22 00
11
33
11 1111
1 2 4 6 7
3
5
Lay Lay foundationfoundation
Design house Design house and obtain and obtain financingfinancing
Order and Order and receive receive materialsmaterials
DummyDummy
Finish Finish workwork
Select Select carpetcarpet
Select Select paintpaint
Build Build househouse
1 2 4 6 7
3
5
3
2 0
1
3
1 1
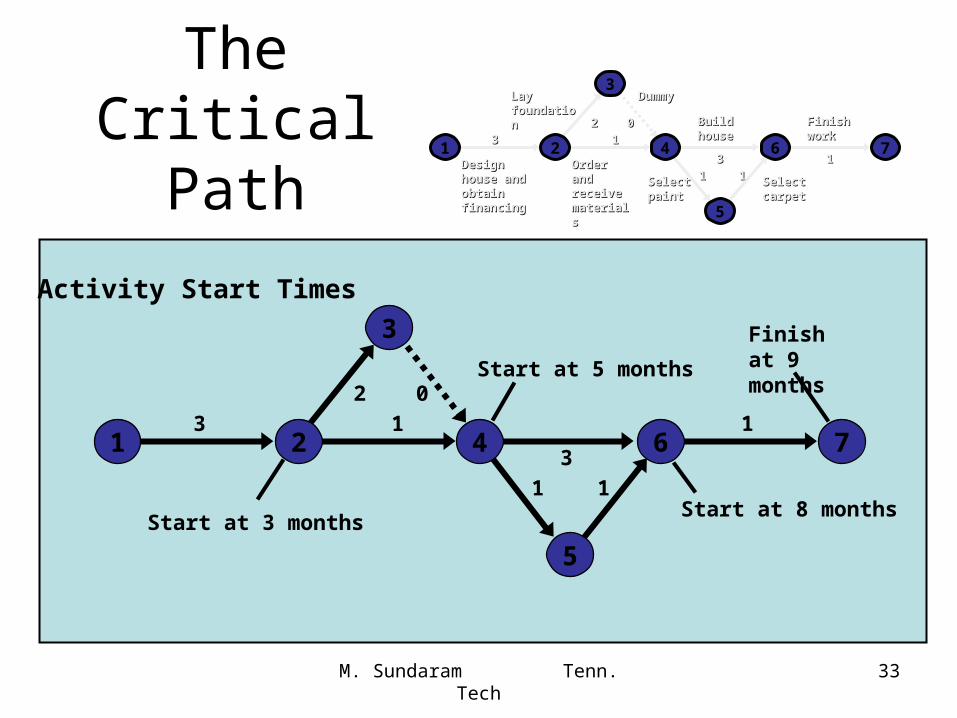
Start at 3 months
Start at 5 months
1
Finish at 9 months
Start at 8 months
Activity Start Times
M. Sundaram Tenn. Tech 34
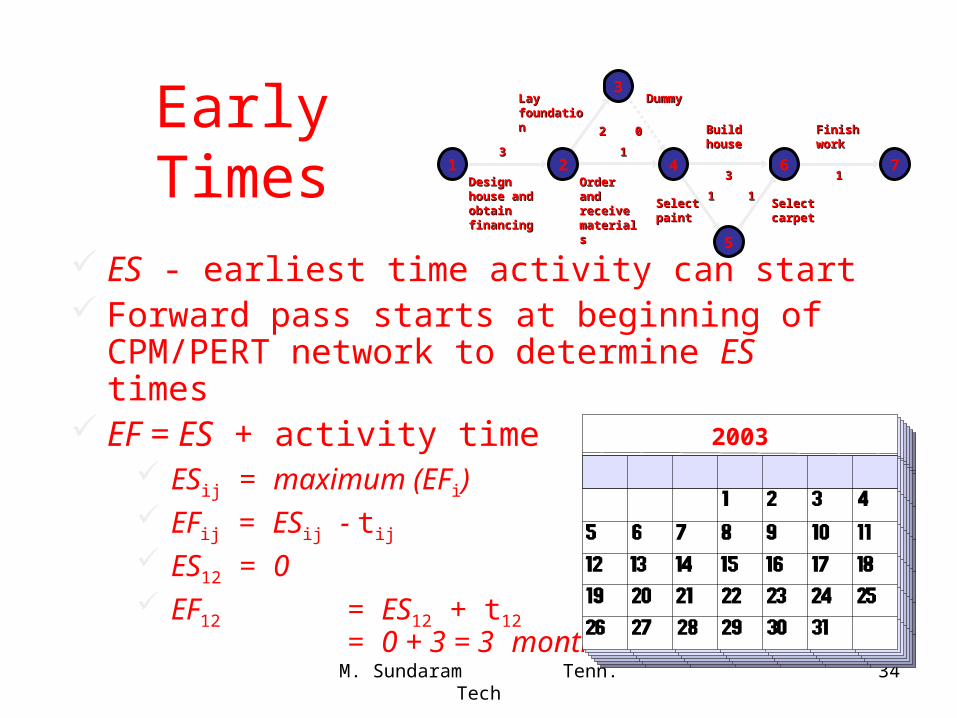
Early Times
ES - earliest time activity can start Forward pass starts at beginning of
CPM/PERT network to determine ES times EF = ES + activity time
ESij = maximum (EFi) EFij = ESij - tij
ES12 = 0 EF12 = ES12 + t12
= 0 + 3 = 3 months
2003
33
22 00
11
33
11 11
111 2 4 6 7
3
5
Lay Lay foundationfoundation
Design house Design house and obtain and obtain financingfinancing
Order and Order and receive receive materialsmaterials
DummyDummy
Finish Finish workwork
Select Select carpetcarpet
Select Select paintpaint
Build Build househouse
M. Sundaram Tenn. Tech 35
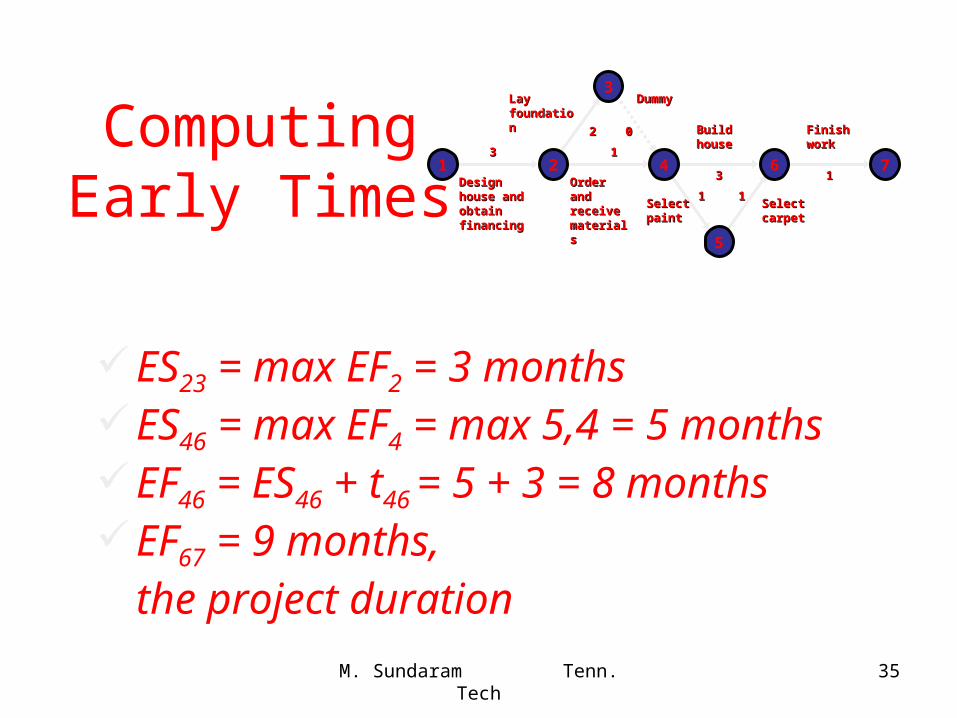
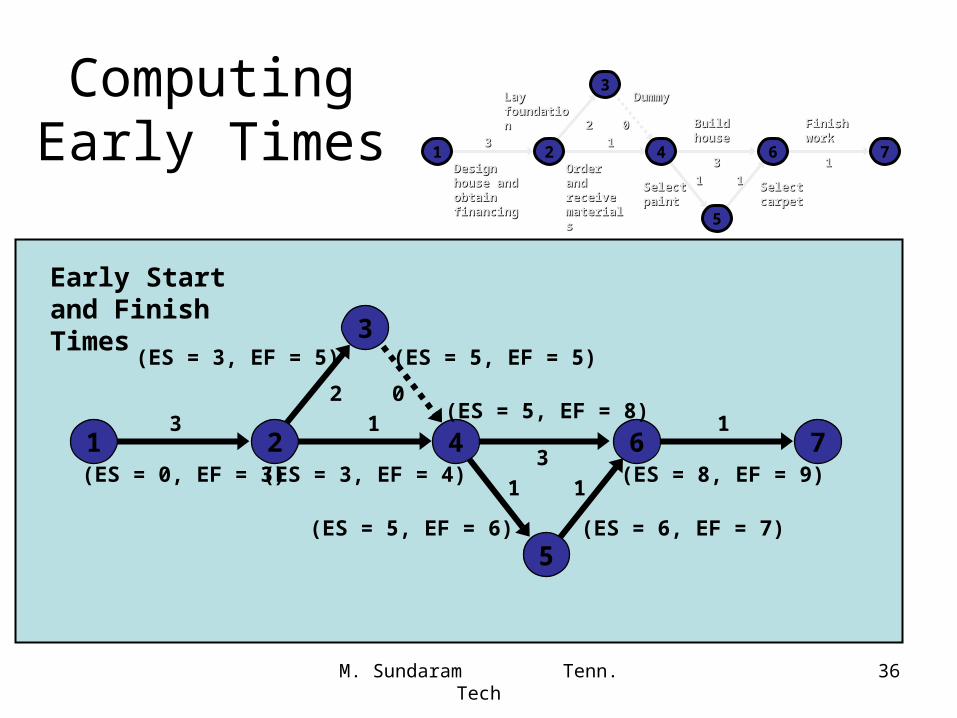
Computing Early Times
ES23 = max EF2 = 3 monthsES46 = max EF4 = max 5,4 = 5 monthsEF46 = ES46 + t46 = 5 + 3 = 8 monthsEF67 = 9 months,
the project duration
33
22 00
11
33
11 11
111 2 4 6 7
3
5
Lay Lay foundationfoundation
Design house Design house and obtain and obtain financingfinancing
Order and Order and receive receive materialsmaterials
DummyDummy
Finish Finish workwork
Select Select carpetcarpet
Select Select paintpaint
Build Build househouse
M. Sundaram Tenn. Tech 36
Computing Early Times 33
22 00
11
33
11 11
111 2 4 6 7
3
5
Lay Lay foundationfoundation
Design house Design house and obtain and obtain financingfinancing
Order and Order and receive receive materialsmaterials
DummyDummy
Finish Finish workwork
Select Select carpetcarpet
Select Select paintpaint
Build Build househouse
1 2 4 6 7
3
5
3
2 0
1
3
1 1
1
(ES = 0, EF = 3)
(ES = 5, EF = 8)
(ES = 3, EF = 5)
(ES = 3, EF = 4)
(ES = 5, EF = 6) (ES = 6, EF = 7)
(ES = 8, EF = 9)
(ES = 5, EF = 5)
Early Start and Finish Times
M. Sundaram Tenn. Tech 37
Late Times
LS - latest time activity can start & not delay project
Backward pass starts at end of CPM/PERT network to determine LS times
LF = LS + activity timeLSij = LFij - tij
LFij = minimum (LSj)
M. Sundaram Tenn. Tech 38
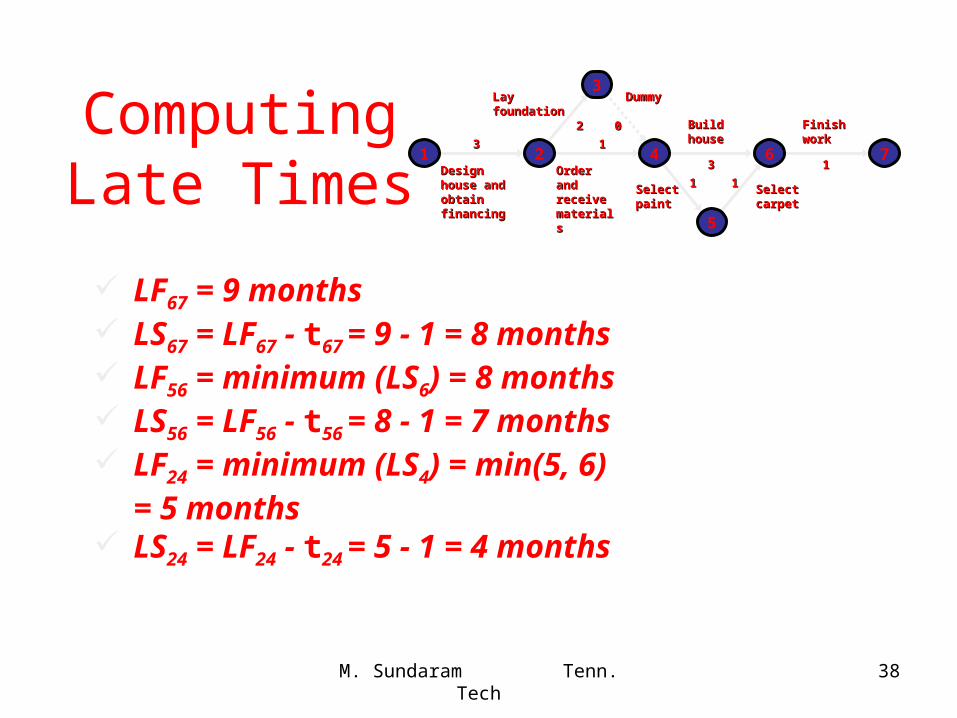
Computing Late Times
LF67 = 9 months LS67 = LF67 - t67 = 9 - 1 = 8 months LF56 = minimum (LS6) = 8 months LS56 = LF56 - t56 = 8 - 1 = 7 months LF24 = minimum (LS4) = min(5, 6)
= 5 months LS24 = LF24 - t24 = 5 - 1 = 4 months
33
22 00
11
33
11 11
111 2 4 6 7
3
5
Lay Lay foundationfoundation
Design house Design house and obtain and obtain financingfinancing
Order and Order and receive receive materialsmaterials
DummyDummy
Finish Finish workwork
Select Select carpetcarpet
Select Select paintpaint
Build Build househouse
M. Sundaram Tenn. Tech 39
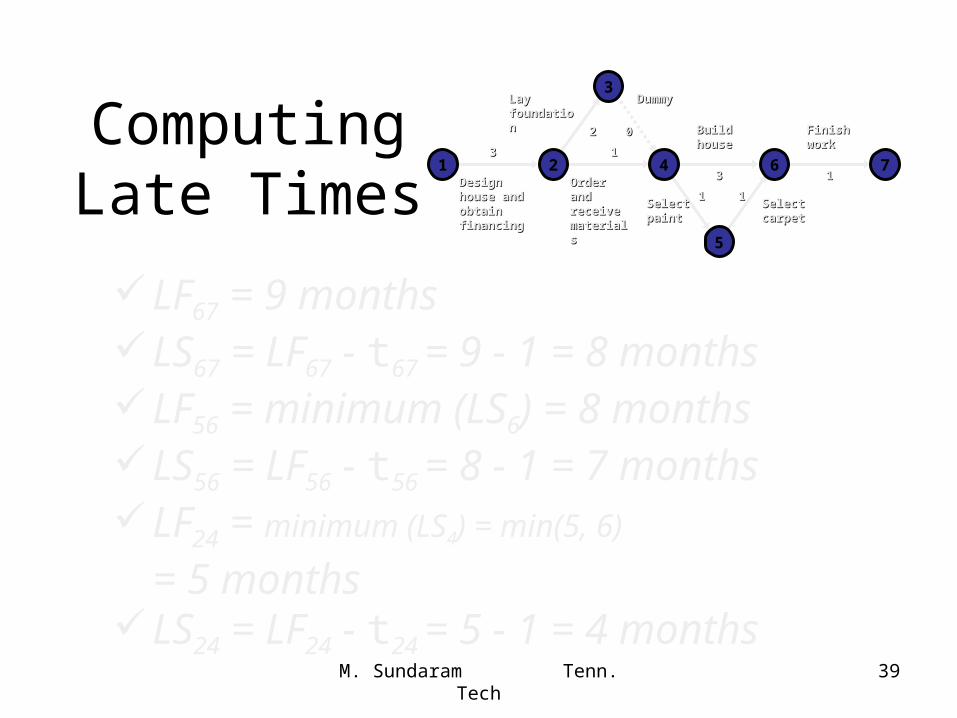
Computing Late Times
LF67 = 9 monthsLS67 = LF67 - t67 = 9 - 1 = 8 monthsLF56 = minimum (LS6) = 8 monthsLS56 = LF56 - t56 = 8 - 1 = 7 monthsLF24 = minimum (LS4) = min(5, 6)
= 5 monthsLS24 = LF24 - t24 = 5 - 1 = 4 months
33
22 00
11
33
11 11
111 2 4 6 7
3
5
Lay Lay foundationfoundation
Design house Design house and obtain and obtain financingfinancing
Order and Order and receive receive materialsmaterials
DummyDummy
Finish Finish workwork
Select Select carpetcarpet
Select Select paintpaint
Build Build househouse
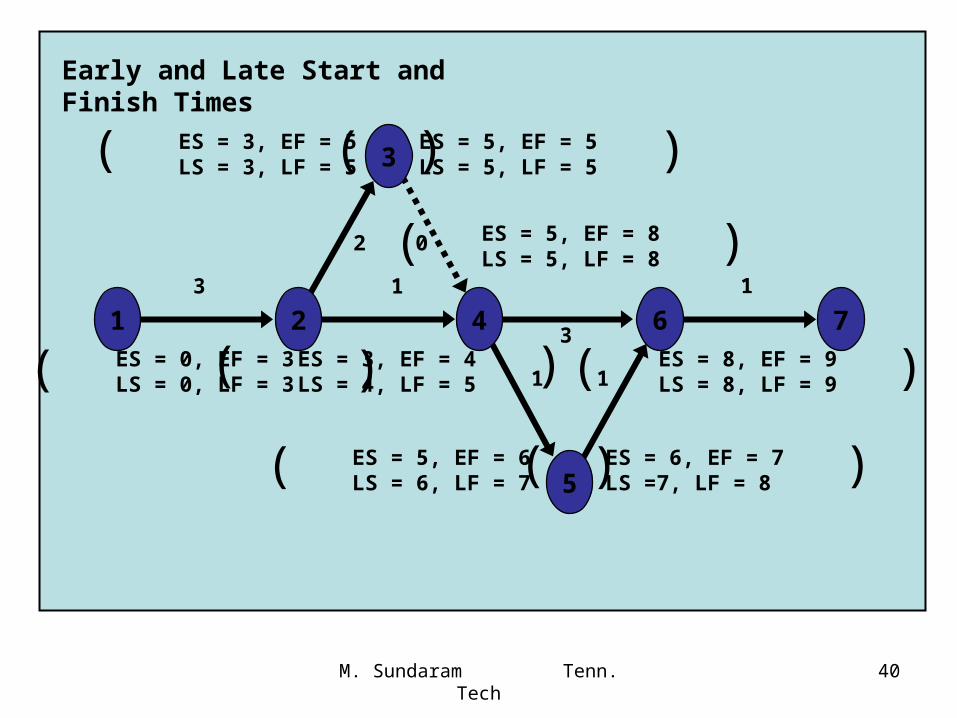
M. Sundaram Tenn. Tech 40
1 2 4 6 7
3
5
3
2 0
1
3
1 1
1
ES = 3, EF = 5LS = 3, LF = 5( )
ES = 5, EF = 8LS = 5, LF = 8( )
ES = 3, EF = 4LS = 4, LF = 5( )ES = 0, EF = 3
LS = 0, LF = 3( )
ES = 5, EF = 5LS = 5, LF = 5( )
ES = 5, EF = 6LS = 6, LF = 7( )
ES = 8, EF = 9LS = 8, LF = 9( )
ES = 6, EF = 7LS =7, LF = 8( )
Early and Late Start and Finish Times
M. Sundaram Tenn. Tech 41
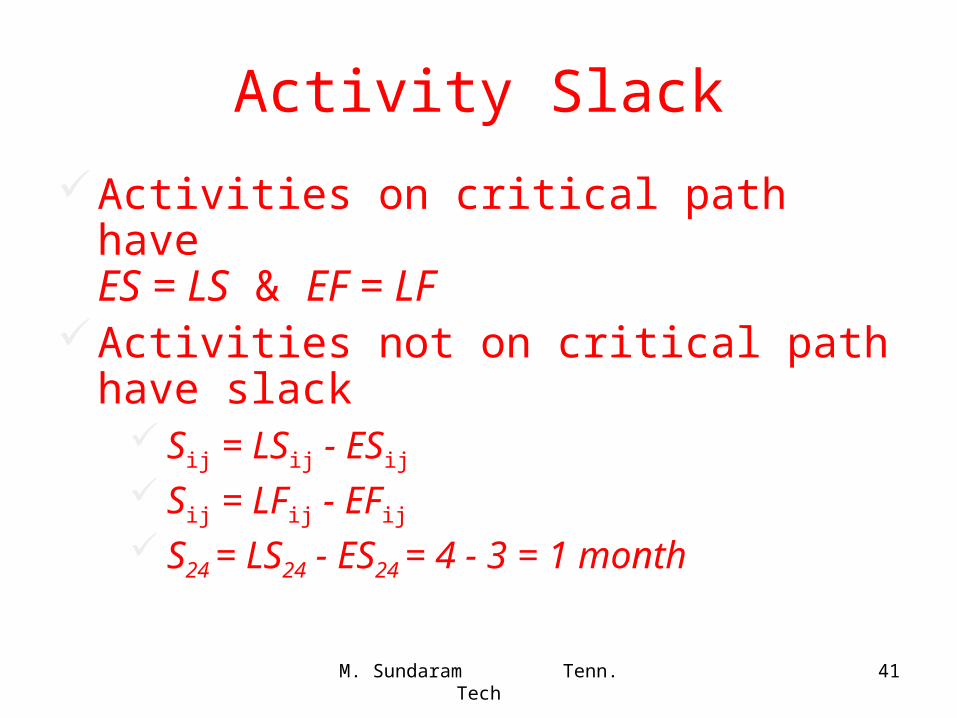
Activity Slack
Activities on critical path have ES = LS & EF = LF
Activities not on critical path have slack Sij = LSij - ESij
Sij = LFij - EFij
S24 = LS24 - ES24 = 4 - 3 = 1 month
M. Sundaram Tenn. Tech 42
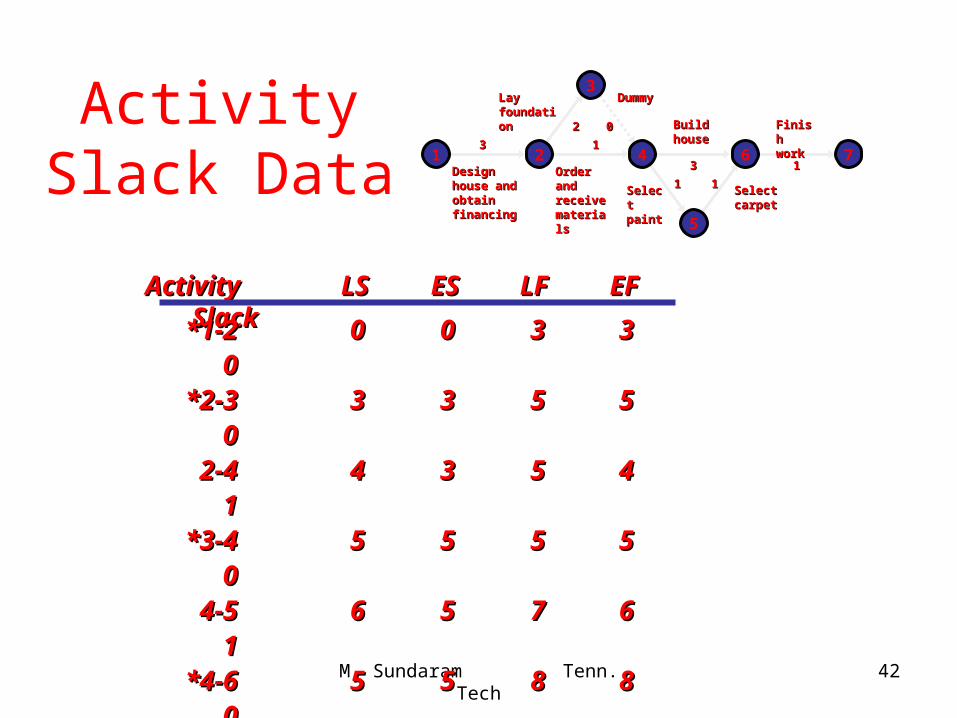
Activity Slack Data
33
22 00
11
33
11 11
111 2 4 6 7
3
5
Lay Lay foundationfoundation
Design Design house and house and obtain obtain financingfinancing
Order Order and and receive receive materialsmaterials
DummyDummy
Finish Finish workwork
Select Select carpetcarpet
Select Select paintpaint
Build Build househouse
Activity Activity LSLS ESES LFLF EFEFSlackSlack*1-2*1-2 00 00 33 33
00*2-3*2-3 33 33 55 55
002-42-4 44 33 55 44
11*3-4*3-4 55 55 55 55
004-54-5 66 55 77 66
11*4-6*4-6 55 55 88 88
005-65-6 77 66 88 77
11*6-7*6-7 88 88 99 99
00* Critical path* Critical path
M. Sundaram Tenn. Tech 43
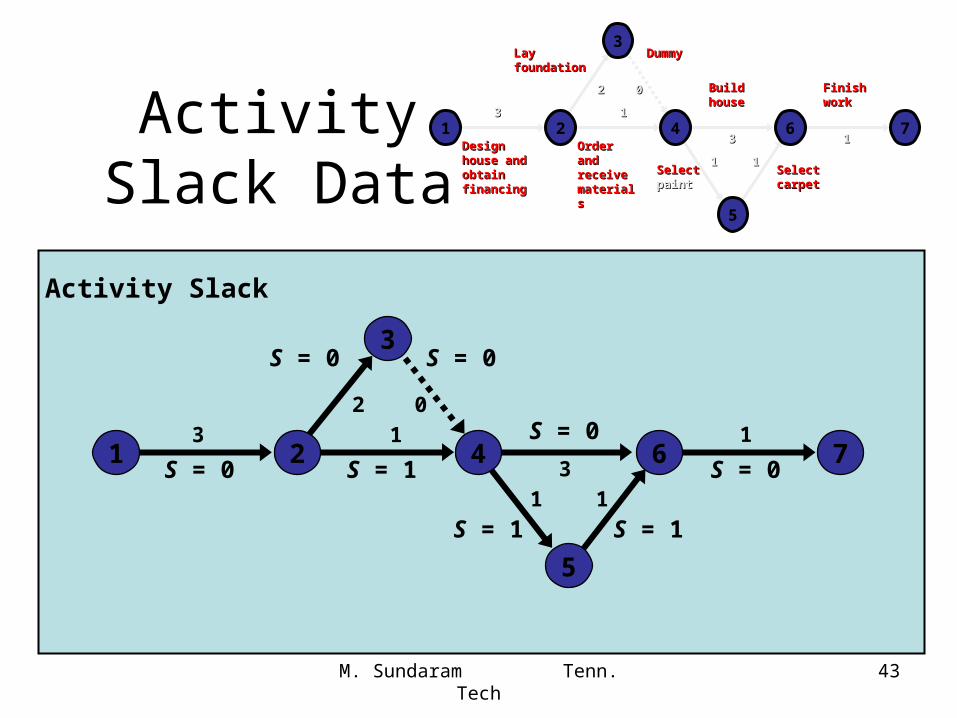
Activity Slack Data
33
22 00
11
33
11 11
111 2 4 6 7
3
5
Lay Lay foundationfoundation
Design house Design house and obtain and obtain financingfinancing
Order and Order and receive receive materialsmaterials
DummyDummy
Finish Finish workwork
Select Select carpetcarpet
SelectSelect paintpaint
Build Build househouse
ActivityActivity LSLS ESES LFLF EFEF SlacksSlacks
*1-2*1-2 00 00 33 33 00*2-3*2-3 33 33 55 55 002-42-4 44 33 55 44 11
*3-4*3-4 55 55 55 55 004-54-5 66 55 77 66 11
*4-6*4-6 55 55 88 88 005-65-6 77 66 88 77 11
*6-7*6-7 88 88 99 99 00* Critical path* Critical path
1 2 4 6 7
3
5
3
2 0
1
3
1 1
1
Activity Slack
S = 0
S = 1S = 1
S = 1
S = 0 S = 0
S = 0
S = 0
M. Sundaram Tenn. Tech 44
Other Methods of Determining the Critical Path
• Simple Method
• Tabular Method
• Enumeration of all paths
M. Sundaram Tenn. Tech 45
Simple Method
M. Sundaram Tenn. Tech 46
Enumeration of all paths
M. Sundaram Tenn. Tech 47
Probabilistic Time Estimates
Reflect uncertainty of activity timesBeta distribution is used in PERT
M. Sundaram Tenn. Tech 48
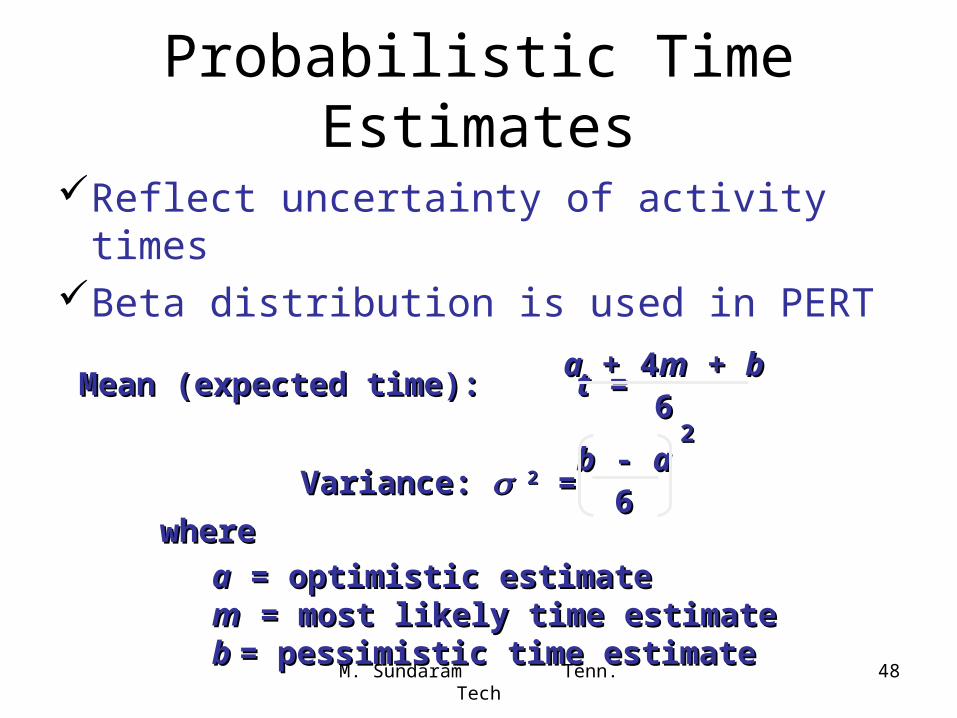
Probabilistic Time Estimates
Reflect uncertainty of activity timesBeta distribution is used in PERT
aa = optimistic estimate = optimistic estimatemm = most likely time estimate = most likely time estimatebb = pessimistic time estimate= pessimistic time estimate
wherewhere
Mean (expected time):Mean (expected time): tt = =aa + 4 + 4mm + + bb
66
Variance:Variance: 22 = =bb - - aa
66
22
M. Sundaram Tenn. Tech 49
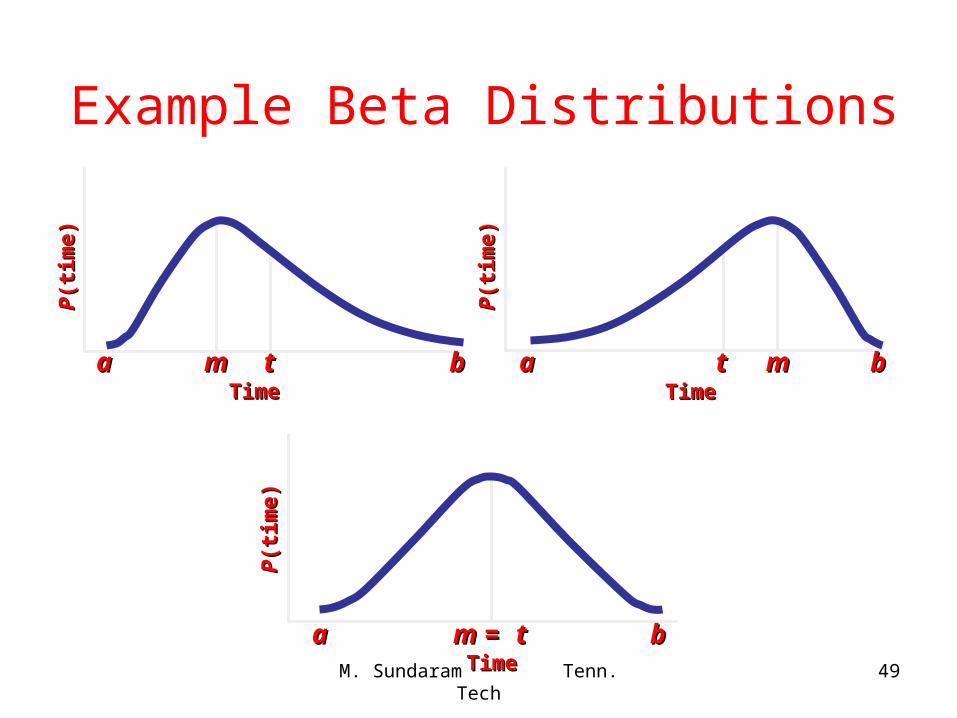
Example Beta Distributions
PP(t
ime)
(tim
e)
PP(t
ime)
(tim
e)
PP(t
ime)
(tim
e)
TimeTimeaa mmtt bbaa mm tt bb
m m = = tt
TimeTime
TimeTimebbaa
M. Sundaram Tenn. Tech 50
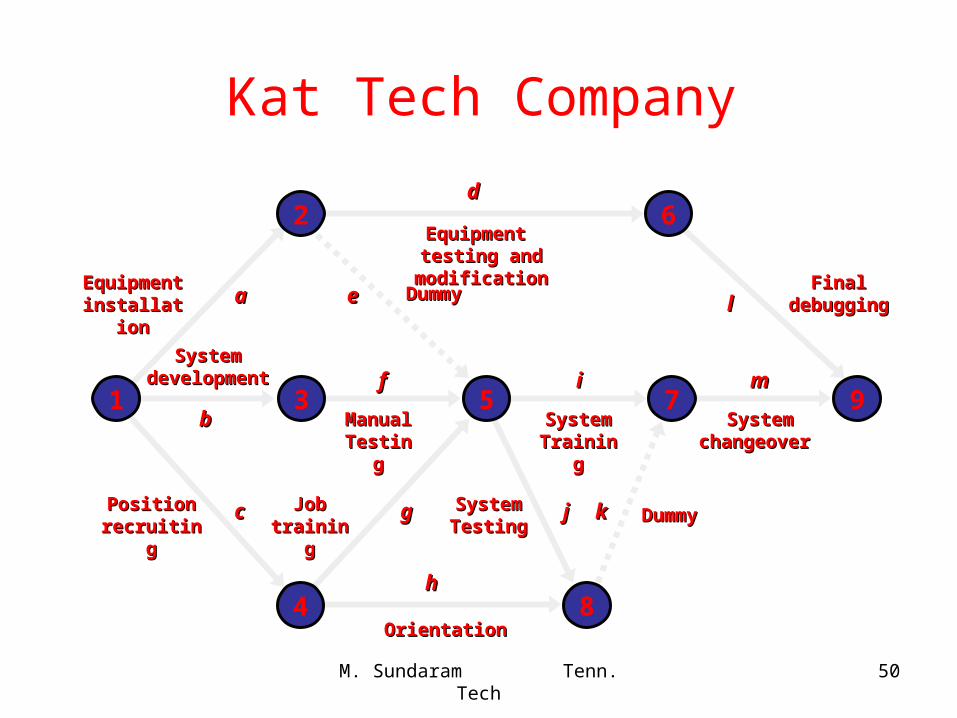
Kat Tech Company
System System changeover changeover
2
4
6
1 73 5 9
8
Manual Manual TestingTesting
DummyDummy
System System TrainingTraining
DummyDummySystem System TestingTesting
OrientationOrientation
Position Position recruitingrecruiting
System System developmentdevelopment
Equipment Equipment installationinstallation
Equipment testing Equipment testing and modificationand modification
Final Final debuggingdebugging
Job Job trainingtraining
aa
bb
cc
dd
ee
ff
gg
hh
ii
jj kk
ll
mm
M. Sundaram Tenn. Tech 51
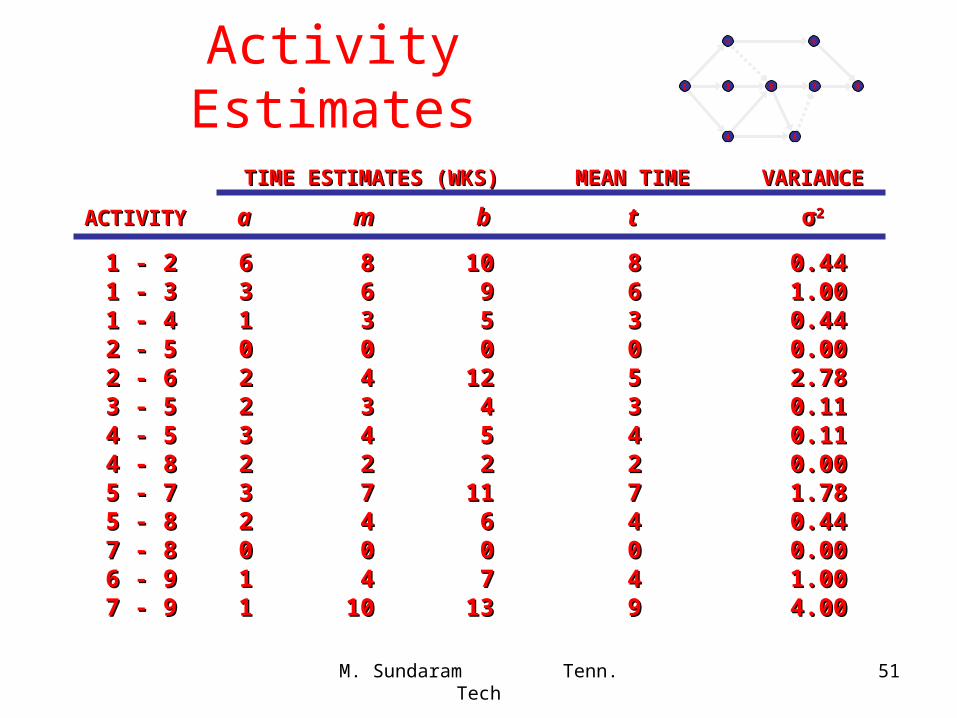
Activity Estimates
1 - 21 - 2 66 88 1010 88 0.440.441 - 31 - 3 33 66 99 66 1.001.001 - 41 - 4 11 33 55 33 0.440.442 - 52 - 5 00 00 00 00 0.000.002 - 6 2 - 6 22 44 1212 55 2.782.783 - 5 3 - 5 22 33 44 33 0.110.114 - 54 - 5 33 44 55 44 0.110.114 - 84 - 8 22 22 22 22 0.000.005 - 75 - 7 33 77 1111 77 1.781.785 - 85 - 8 22 44 66 44 0.440.447 - 87 - 8 00 00 00 00 0.000.006 - 96 - 9 11 44 77 44 1.001.007 - 97 - 9 11 1010 1313 99 4.004.00
TIME ESTIMATES (WKS)TIME ESTIMATES (WKS) MEAN TIMEMEAN TIME VARIANCEVARIANCE
ACTIVITYACTIVITY aa mm bb tt σσ22
2
4
6
1 73 5 9
8
M. Sundaram Tenn. Tech 52
2
4
6
1 73 5 9
8
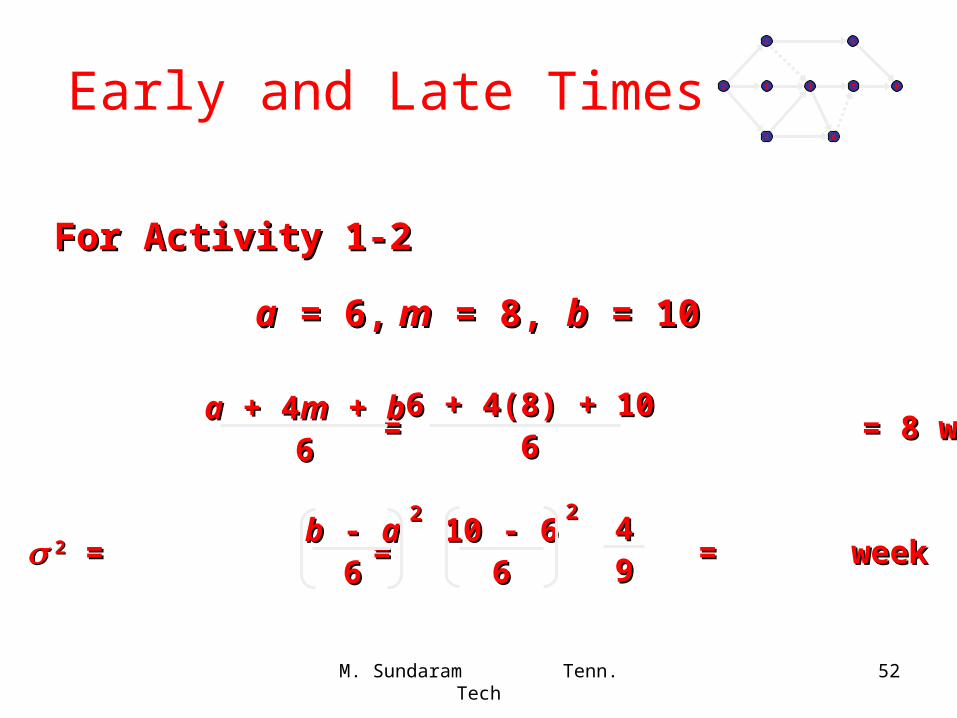
Early and Late Times
For Activity 1-2For Activity 1-2
aa = 6,= 6, m m = 8, = 8, bb = 10 = 10
t t = = = 8 weeks= = = 8 weeksaa + 4 + 4mm + + bb
666 + 4(8) + 106 + 4(8) + 10
66
22 = = = week = = = weekbb - - aa
66
2210 - 610 - 6
66
224499
M. Sundaram Tenn. Tech 53
2
4
6
1 73 5 9
8
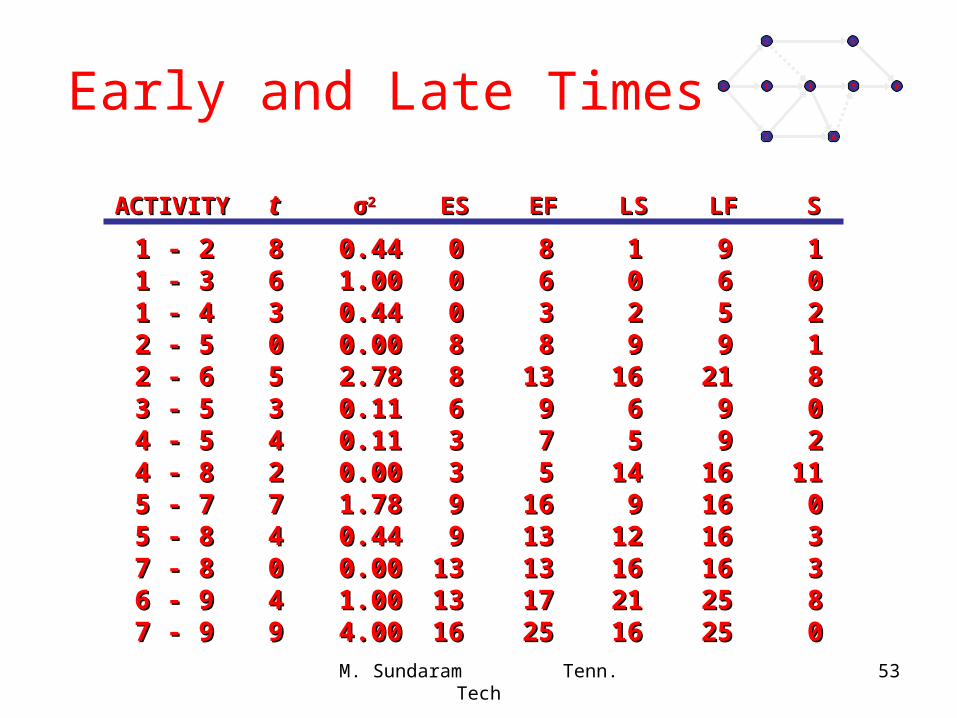
Early and Late Times
ACTIVITYACTIVITY tt σσ22 ESES EFEF LSLS LFLF SS
1 - 21 - 2 88 0.440.44 00 88 11 99 111 - 31 - 3 66 1.001.00 00 66 00 66 001 - 41 - 4 33 0.440.44 00 33 22 55 222 - 52 - 5 00 0.000.00 88 88 99 99 112 - 6 2 - 6 55 2.782.78 88 1313 1616 2121 883 - 5 3 - 5 33 0.110.11 66 99 66 99 004 - 54 - 5 44 0.110.11 33 77 55 99 224 - 84 - 8 22 0.000.00 33 55 1414 1616 11115 - 75 - 7 77 1.781.78 99 1616 99 1616 005 - 85 - 8 44 0.440.44 99 1313 1212 1616 337 - 87 - 8 00 0.000.00 1313 1313 1616 1616 336 - 96 - 9 44 1.001.00 1313 1717 2121 2525 887 - 97 - 9 99 4.004.00 1616 2525 1616 2525 00
M. Sundaram Tenn. Tech 54
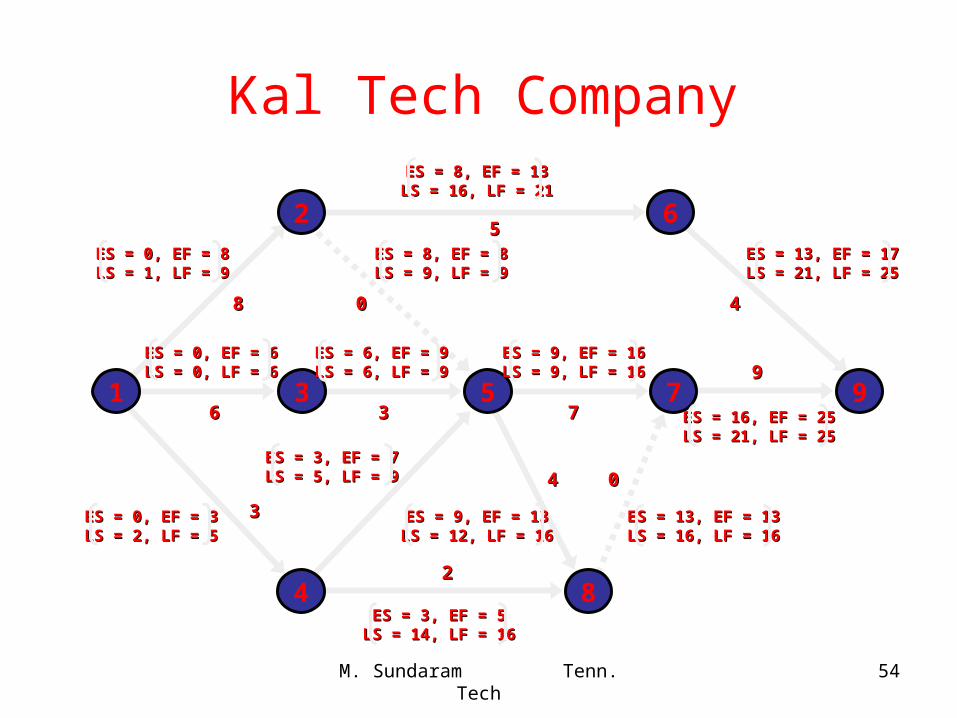
Kal Tech Company
2
4
6
1 73 5 9
8
ES = 9, EF = 16ES = 9, EF = 16LS = 9, LF = 16LS = 9, LF = 16
ES = 0, EF = 8ES = 0, EF = 8LS = 1, LF = 9LS = 1, LF = 9
ES = 0, EF = 6ES = 0, EF = 6LS = 0, LF = 6LS = 0, LF = 6
ES = 6, EF = 9ES = 6, EF = 9LS = 6, LF = 9LS = 6, LF = 9
ES = 0, EF = 3ES = 0, EF = 3LS = 2, LF = 5LS = 2, LF = 5
ES = 3, EF = 7ES = 3, EF = 7LS = 5, LF = 9LS = 5, LF = 9
ES = 9, EF = 13ES = 9, EF = 13LS = 12, LF = 16LS = 12, LF = 16
ES = 8, EF = 8ES = 8, EF = 8LS = 9, LF = 9LS = 9, LF = 9
ES = 13, EF = 13ES = 13, EF = 13LS = 16, LF = 16LS = 16, LF = 16
ES = 3, EF = 5ES = 3, EF = 5LS = 14, LF = 16LS = 14, LF = 16
ES = 16, EF = 25ES = 16, EF = 25LS = 21, LF = 25LS = 21, LF = 25
ES = 13, EF = 17ES = 13, EF = 17LS = 21, LF = 25LS = 21, LF = 25
ES = 8, EF = 13ES = 8, EF = 13LS = 16, LF = 21LS = 16, LF = 21
88
55
44
66 33 77
99
33
22
44 00
00
M. Sundaram Tenn. Tech 55
Kal Tech Company
2
4
6
1 73 5 9
8
ES = 9, EF = 16ES = 9, EF = 16LS = 9, LF = 16LS = 9, LF = 16
ES = 0, EF = 8ES = 0, EF = 8LS = 1, LF = 9LS = 1, LF = 9
ES = 0, EF = 6ES = 0, EF = 6LS = 0, LF = 6LS = 0, LF = 6
ES = 6, EF = 9ES = 6, EF = 9LS = 6, LF = 9LS = 6, LF = 9
ES = 0, EF = 3ES = 0, EF = 3LS = 2, LF = 5LS = 2, LF = 5
ES = 3, EF = 7ES = 3, EF = 7LS = 5, LF = 9LS = 5, LF = 9
ES = 9, EF = 13ES = 9, EF = 13LS = 12, LF = 16LS = 12, LF = 16
ES = 8, EF = 8ES = 8, EF = 8LS = 9, LF = 9LS = 9, LF = 9
ES = 13, EF = 13ES = 13, EF = 13LS = 16, LF = 16LS = 16, LF = 16
ES = 3, EF = 5ES = 3, EF = 5LS = 14, LF = 16LS = 14, LF = 16
ES = 16, EF = 25ES = 16, EF = 25LS = 21, LF = 25LS = 21, LF = 25
ES = 13, EF = 17ES = 13, EF = 17LS = 21, LF = 25LS = 21, LF = 25
ES = 8, EF = 13ES = 8, EF = 13LS = 16, LF = 21LS = 16, LF = 21
88
55
44
66 33 77
99
33
22
44 00
00
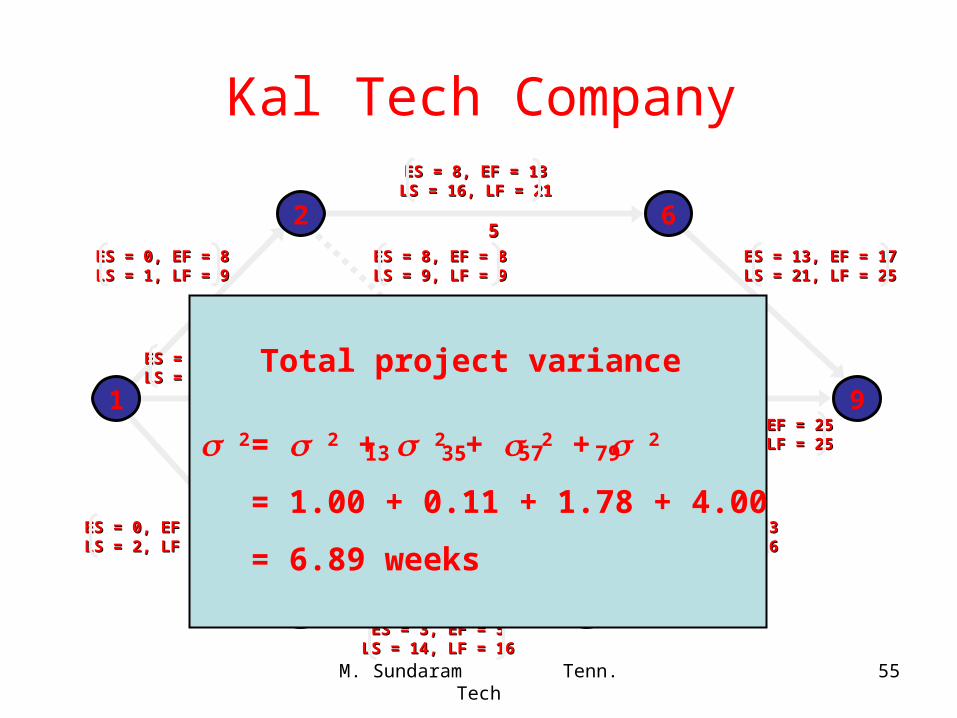
2 = 2 + 2 + 2 + 2
= 1.00 + 0.11 + 1.78 + 4.00
= 6.89 weeks
13 35 57 79
Total project variance
M. Sundaram Tenn. Tech 56
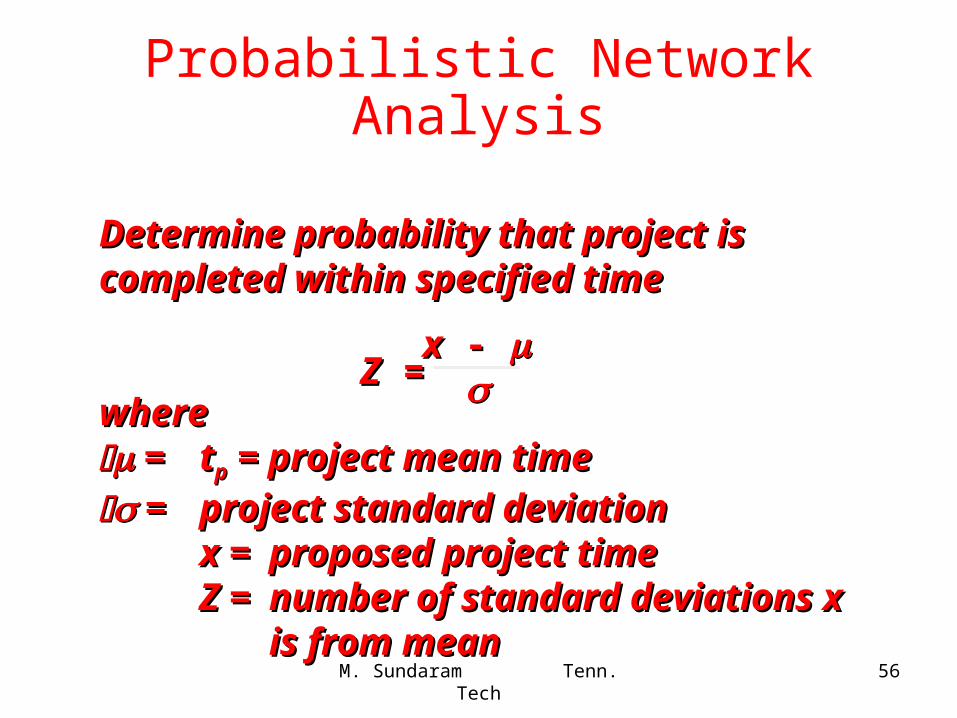
Probabilistic Network Analysis
Determine probability that project is Determine probability that project is completed within specified timecompleted within specified time
wherewhere == ttpp = project mean time = project mean time
== project standard deviationproject standard deviationx x == proposed project timeproposed project timeZZ = = number of standard deviations number of standard deviations xx
is from meanis from mean
ZZ = =xx - -
M. Sundaram Tenn. Tech 57
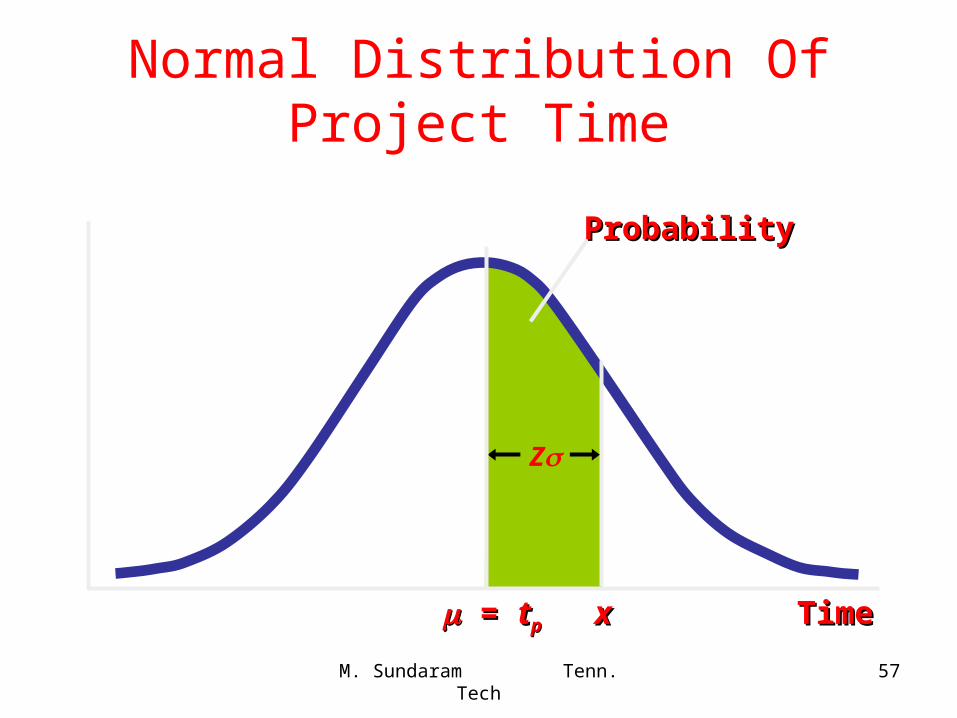
Normal Distribution Of Project Time
= = ttpp TimeTimexx
Z
ProbabilityProbability
M. Sundaram Tenn. Tech 58
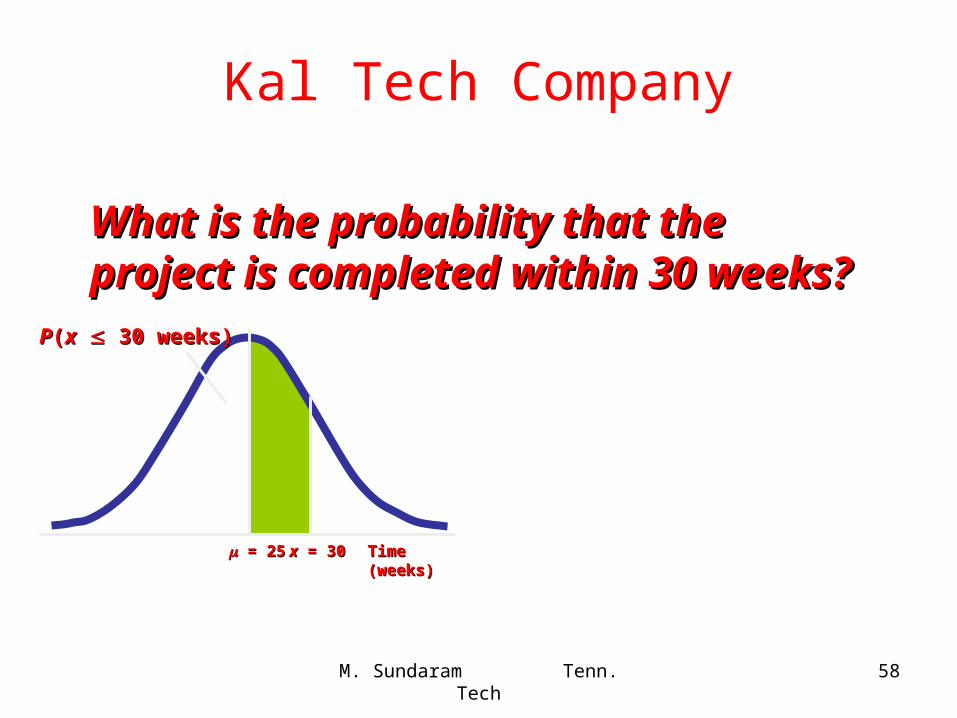
Kal Tech Company
What is the probability that the project What is the probability that the project is completed within 30 weeks?is completed within 30 weeks?
= 25= 25 Time (weeks)Time (weeks)xx = 30 = 30
PP((xx 30 weeks) 30 weeks)
M. Sundaram Tenn. Tech 59
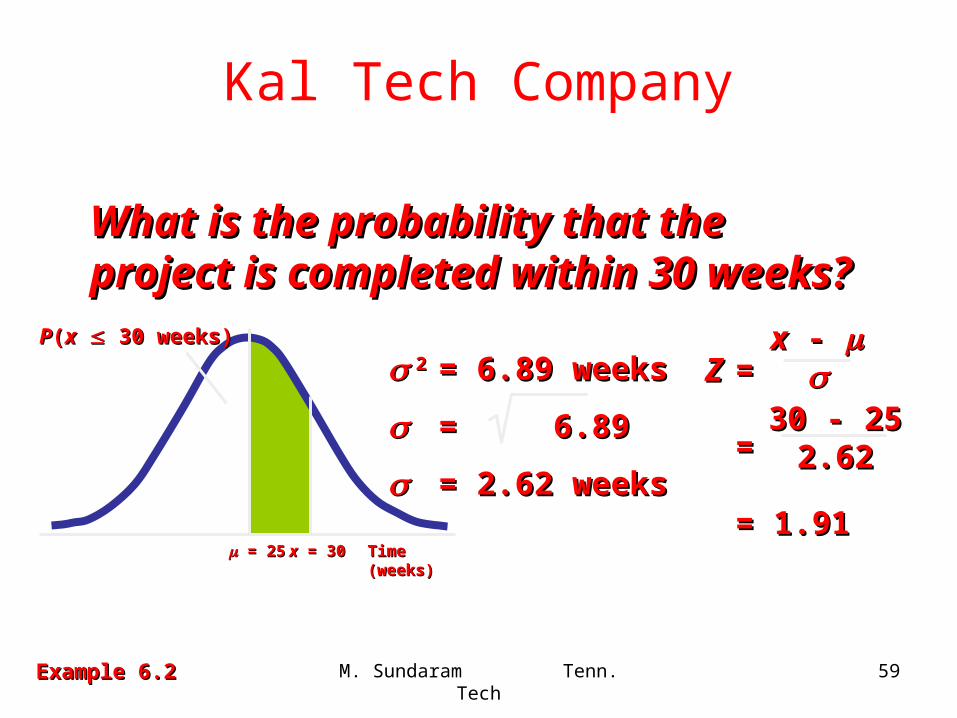
Kal Tech Company
What is the probability that the project What is the probability that the project is completed within 30 weeks?is completed within 30 weeks?
Example 6.2Example 6.2
= 25= 25 Time (weeks)Time (weeks)xx = 30 = 30
PP((xx 30 weeks) 30 weeks)
22 = 6.89 weeks= 6.89 weeks
= 6.89= 6.89
= 2.62 weeks= 2.62 weeks
ZZ ==
==
= 1.91= 1.91
xx - -
30 - 2530 - 252.622.62
M. Sundaram Tenn. Tech 60
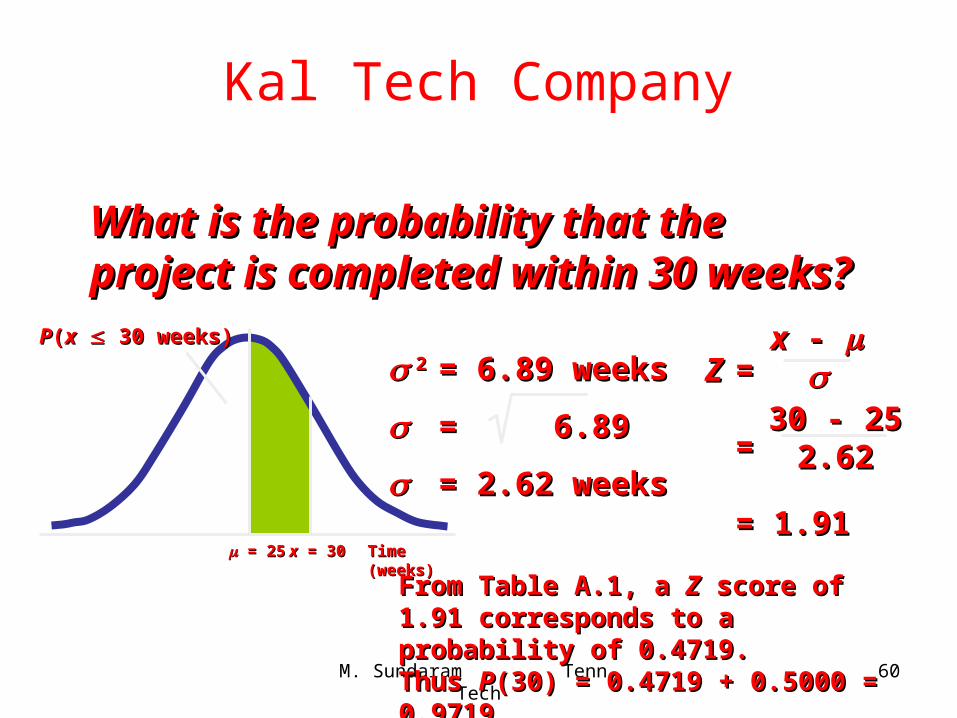
Kal Tech Company
What is the probability that the project What is the probability that the project is completed within 30 weeks?is completed within 30 weeks?
= 25= 25 Time (weeks)Time (weeks)xx = 30 = 30
PP((xx 30 weeks) 30 weeks)
22 = 6.89 weeks= 6.89 weeks
= 6.89= 6.89
= 2.62 weeks= 2.62 weeks
ZZ ==
==
= 1.91= 1.91
xx - -
30 - 2530 - 252.622.62
From Table A.1, a From Table A.1, a ZZ score of 1.91 score of 1.91 corresponds to a probability of 0.4719.corresponds to a probability of 0.4719.Thus Thus PP(30) = 0.4719 + 0.5000 = 0.9719(30) = 0.4719 + 0.5000 = 0.9719
M. Sundaram Tenn. Tech 61
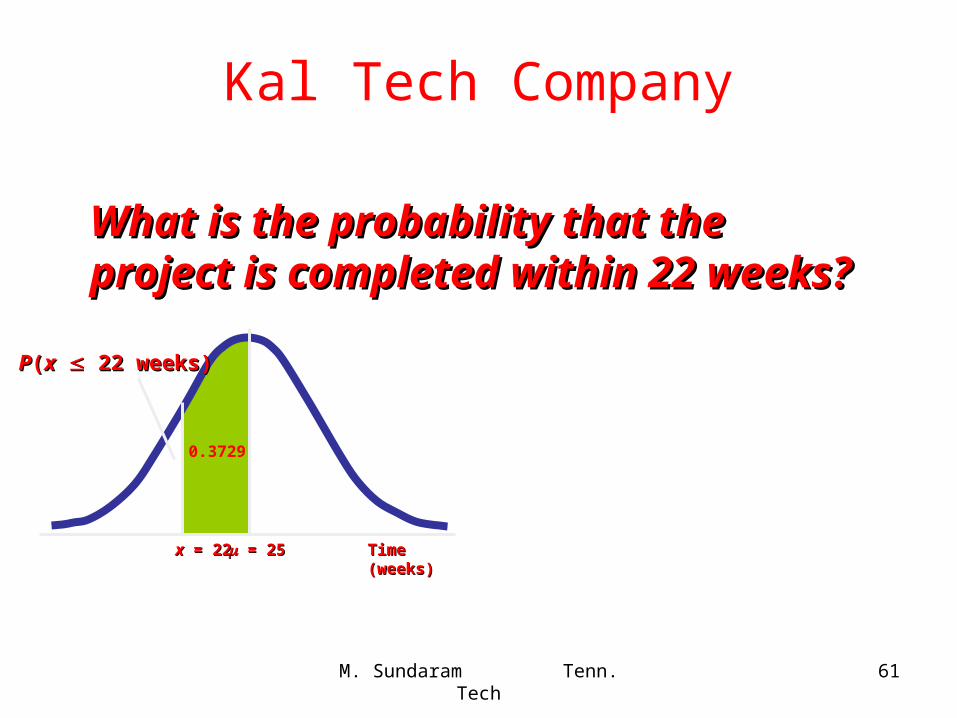
Kal Tech Company
What is the probability that the project What is the probability that the project is completed within 22 weeks?is completed within 22 weeks?
= 25= 25 Time (weeks)Time (weeks)xx = 22 = 22
PP((xx 22 weeks) 22 weeks)
0.3729
M. Sundaram Tenn. Tech 62
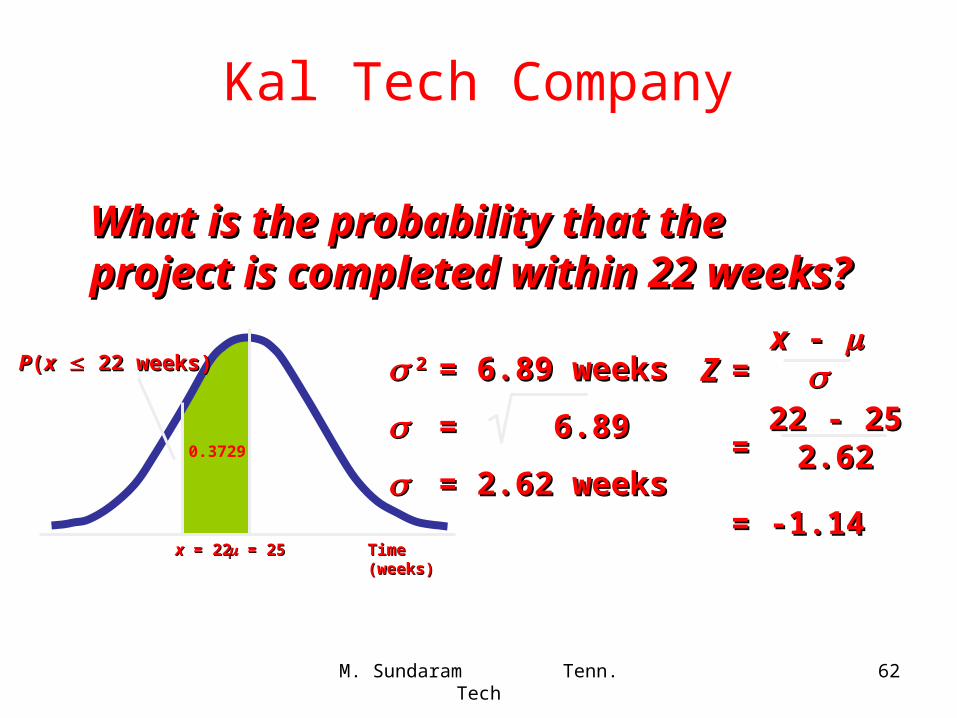
Kal Tech Company
What is the probability that the project What is the probability that the project is completed within 22 weeks?is completed within 22 weeks?
22 = 6.89 weeks= 6.89 weeks
= 6.89= 6.89
= 2.62 weeks= 2.62 weeks
ZZ ==
==
= -1.14= -1.14
xx - -
22 - 2522 - 252.622.62
= 25= 25 Time (weeks)Time (weeks)xx = 22 = 22
PP((xx 22 weeks) 22 weeks)
0.3729
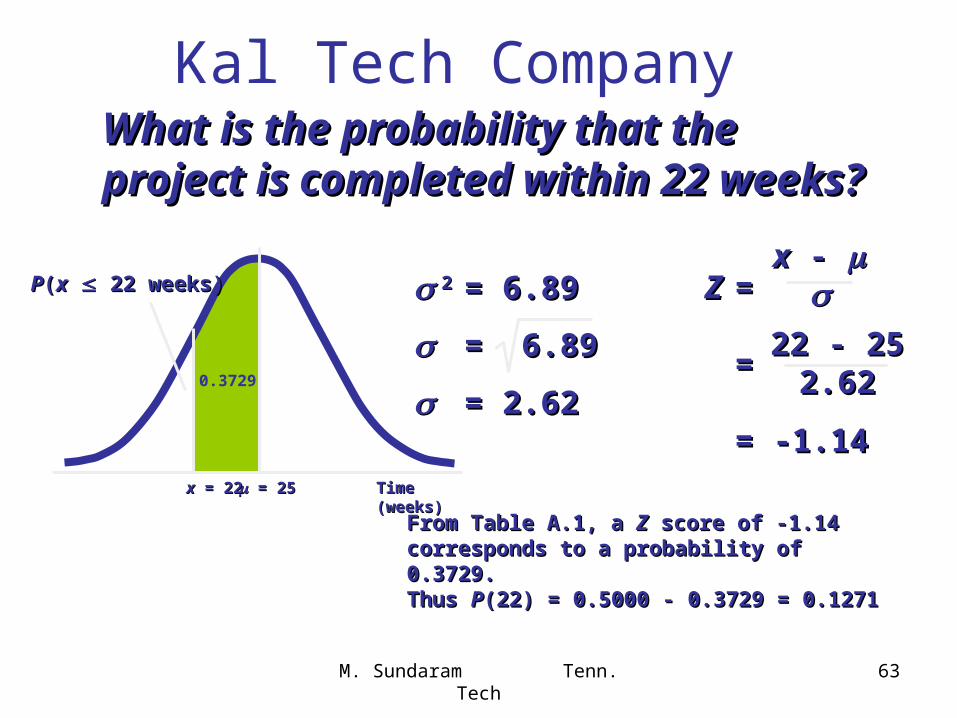
M. Sundaram Tenn. Tech 63
What is the probability that the What is the probability that the project is completed within 22 project is completed within 22 weeks?weeks?
22 = 6.89 = 6.89
= 6.89= 6.89
= 2.62 = 2.62
ZZ ==
==
= -1.14= -1.14
xx - -
22 - 2522 - 252.622.62
From Table A.1, a From Table A.1, a ZZ score of -1.14 corresponds score of -1.14 corresponds to a probability of 0.3729.to a probability of 0.3729.Thus Thus PP(22) = 0.5000 - 0.3729 = 0.1271(22) = 0.5000 - 0.3729 = 0.1271
= 25= 25 Time Time (weeks)(weeks)
xx = 22 = 22
PP((xx 22 weeks) 22 weeks)
0.3729
Kal Tech Company
M. Sundaram Tenn. Tech 64
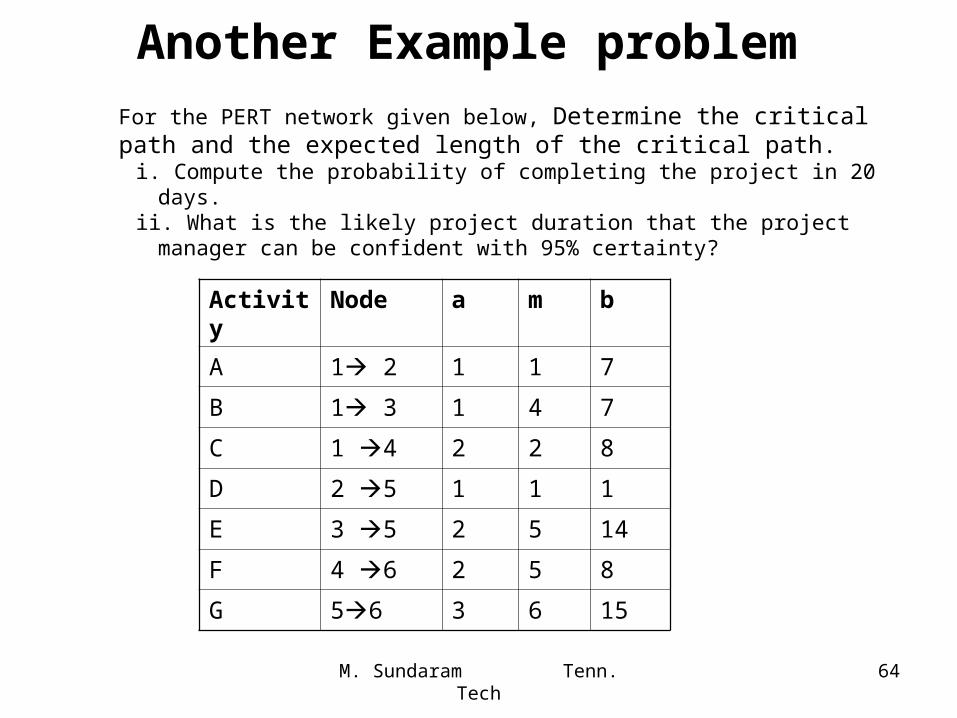
Another Example problemFor the PERT network given below, Determine the critical path and the expected length of the critical path.
i. Compute the probability of completing the project in 20 days. ii. What is the likely project duration that the project manager can be confident with 95%
certainty?
Activity Node a m b
A 1 2 1 1 7
B 1 3 1 4 7
C 1 4 2 2 8
D 2 5 1 1 1
E 3 5 2 5 14
F 4 6 2 5 8
G 56 3 6 15
M. Sundaram Tenn. Tech 65
Solution
M. Sundaram Tenn. Tech 66
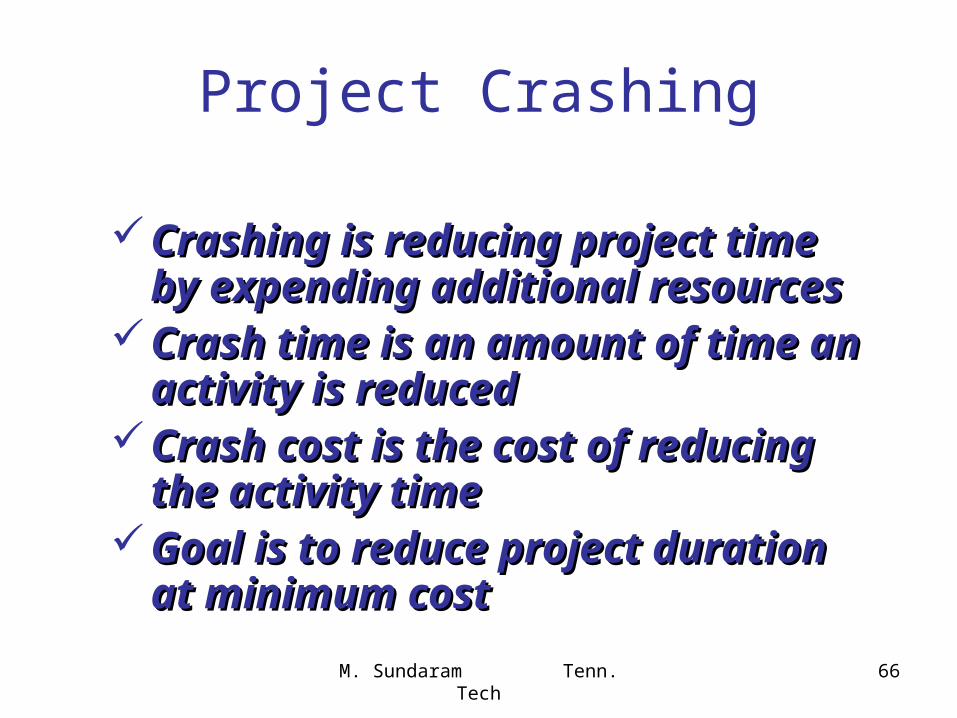
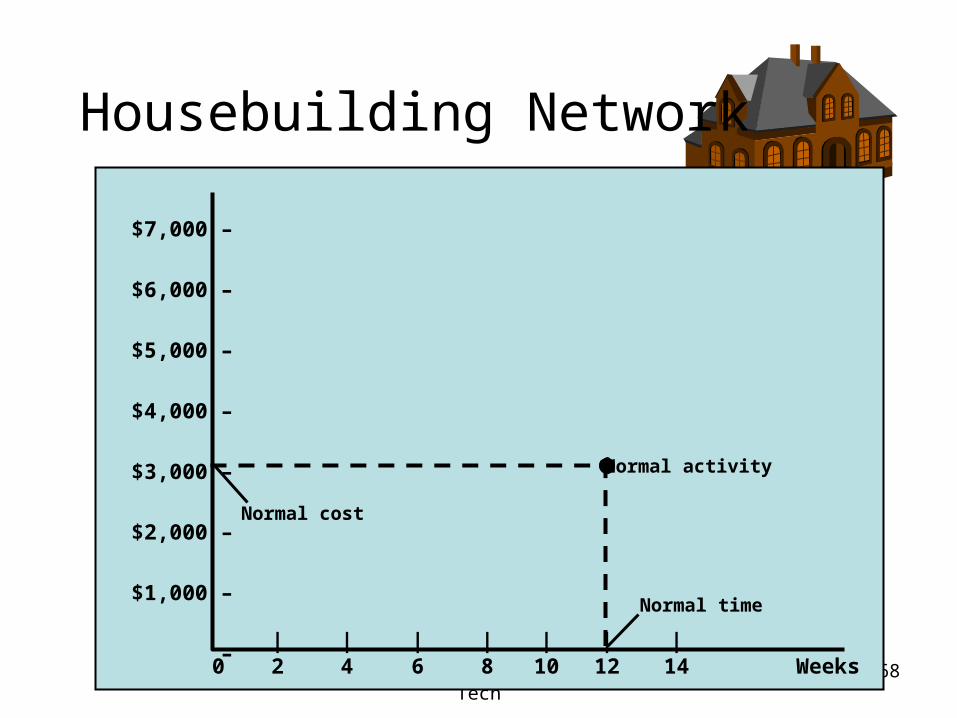
Project Crashing
Crashing is reducing project time Crashing is reducing project time by expending additional resourcesby expending additional resources
Crash time is an amount of time an Crash time is an amount of time an activity is reducedactivity is reduced
Crash cost is the cost of reducing Crash cost is the cost of reducing the activity timethe activity time
Goal is to reduce project duration Goal is to reduce project duration at minimum costat minimum cost
M. Sundaram Tenn. Tech 67
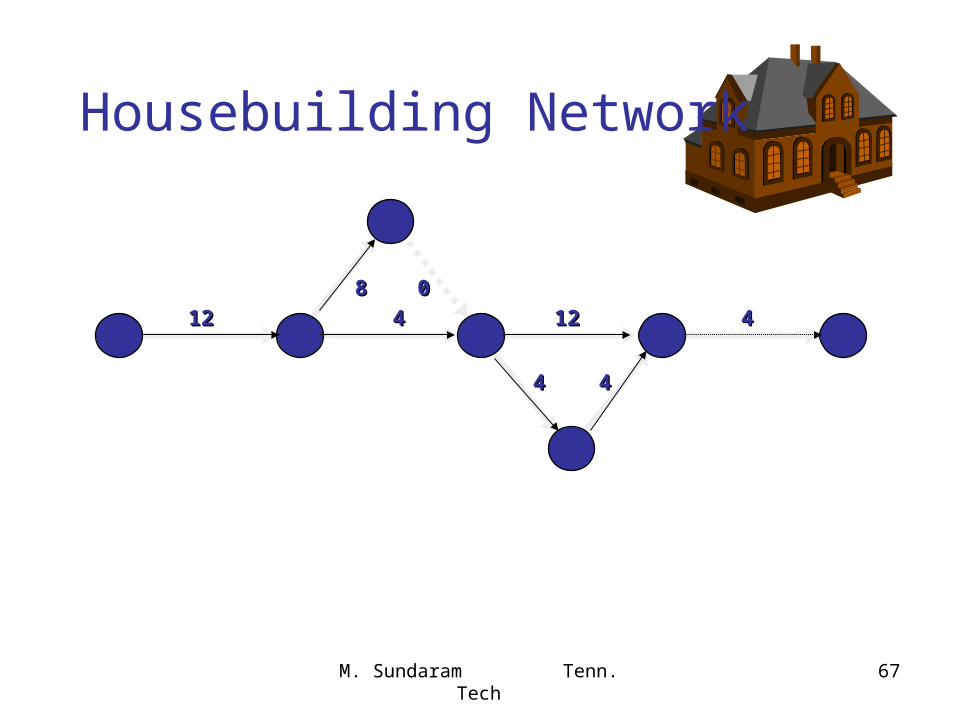
Housebuilding Network
121288 00
44 1212
44 44
441 2 4 6 7
3
5
M. Sundaram Tenn. Tech 68
121288 00
44 1212
44 44
441 2 4 6 7
3
5
Housebuilding Network
$7,000 –
$6,000 –
$5,000 –
$4,000 –
$3,000 –
$2,000 –
$1,000 –
–| | | | | | |
0 2 4 6 8 10 12 14 Weeks
Normal activity
Normal time
Normal cost
M. Sundaram Tenn. Tech 69
121288 00
44 1212
44 44
441 2 4 6 7
3
5
Housebuilding Network
$7,000 –
$6,000 –
$5,000 –
$4,000 –
$3,000 –
$2,000 –
$1,000 –
–| | | | | | |
0 2 4 6 8 10 12 14 Weeks
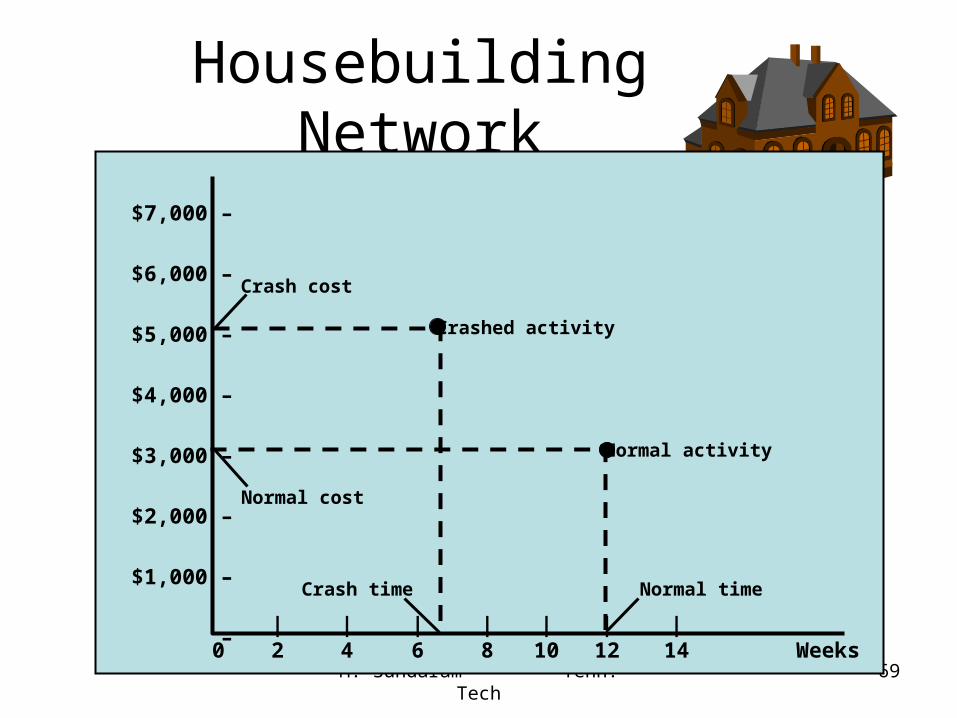
Crash cost
Crashed activity
Normal activity
Normal timeCrash time
Normal cost
M. Sundaram Tenn. Tech 70
Housebuilding Network
$7,000 –
$6,000 –
$5,000 –
$4,000 –
$3,000 –
$2,000 –
$1,000 –
–| | | | | | |
0 2 4 6 8 10 12 14 Weeks
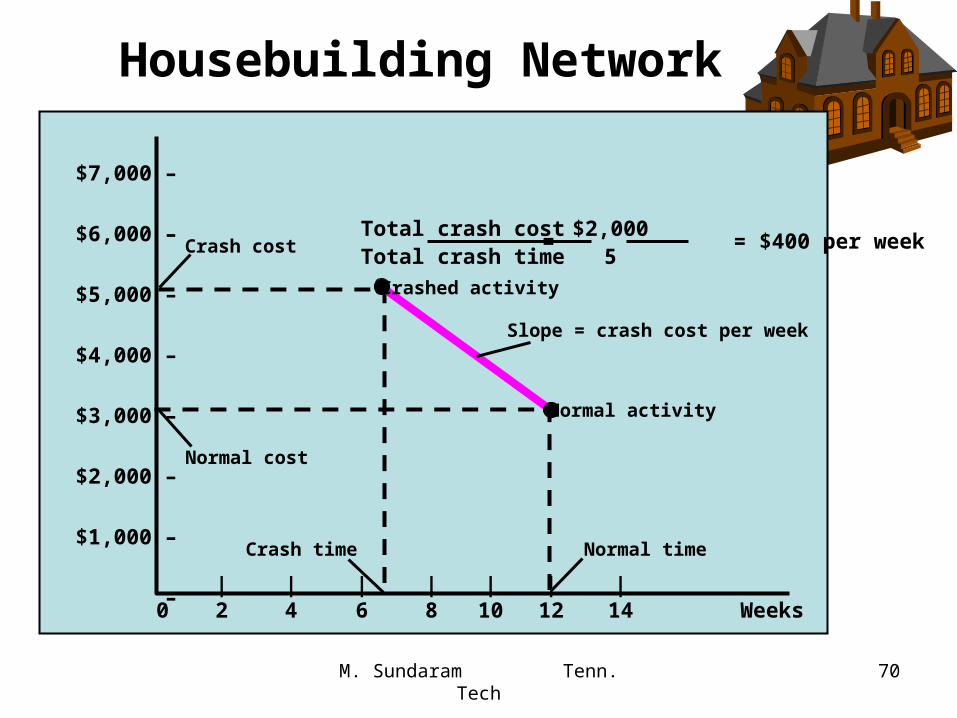
Crash cost
Crashed activity
Normal activity
Normal timeCrash time
Normal cost
Slope = crash cost per week
Total crash cost $2,000Total crash time 5
= = $400 per week
M. Sundaram Tenn. Tech 71
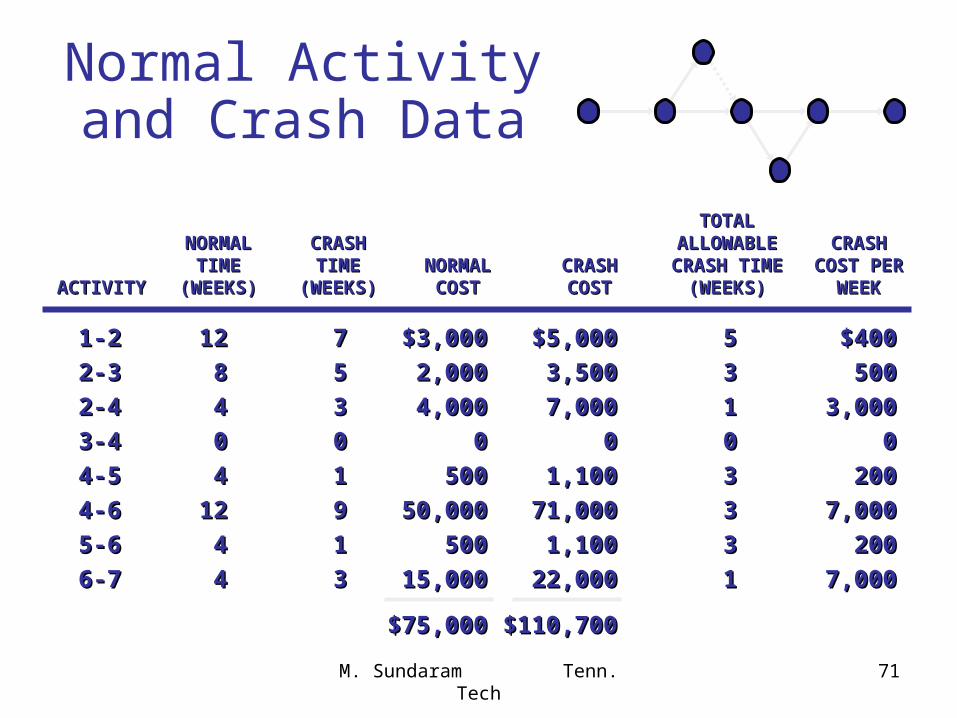
Normal Activity and Crash Data 1 2 4 6 7
3
5
TOTALTOTALNORMALNORMAL CRASHCRASH ALLOWABLEALLOWABLE CRASHCRASH
TIMETIME TIMETIME NORMALNORMAL CRASHCRASH CRASH TIMECRASH TIME COST PERCOST PERACTIVITYACTIVITY (WEEKS)(WEEKS) (WEEKS)(WEEKS) COSTCOST COSTCOST (WEEKS)(WEEKS) WEEKWEEK
1-21-2 1212 77 $3,000$3,000 $5,000$5,000 55 $400$400
2-32-3 88 55 2,0002,000 3,5003,500 33 500500
2-42-4 44 33 4,0004,000 7,0007,000 11 3,0003,000
3-43-4 00 00 00 00 00 00
4-54-5 44 11 500500 1,1001,100 33 200200
4-64-6 1212 99 50,00050,000 71,00071,000 33 7,0007,000
5-65-6 44 11 500500 1,1001,100 33 200200
6-76-7 44 33 15,00015,000 22,00022,000 11 7,0007,000
$75,000$75,000 $110,700$110,700
M. Sundaram Tenn. Tech 72
Normal Activity and Crash Data 1 2 4 6 7
3
5
TOTALTOTALNORMALNORMAL CRASHCRASH ALLOWABLEALLOWABLE CRASHCRASH
TIMETIME TIMETIME NORMALNORMAL CRASHCRASH CRASH TIMECRASH TIME COST PERCOST PERACTIVITYACTIVITY (WEEKS)(WEEKS) (WEEKS)(WEEKS) COSTCOST COSTCOST (WEEKS)(WEEKS) WEEKWEEK
1-21-2 1212 77 $3,000$3,000 $5,000$5,000 55 $400$400
2-32-3 88 55 2,0002,000 3,5003,500 33 500500
2-42-4 44 33 4,0004,000 7,0007,000 11 3,0003,000
3-43-4 00 00 00 00 00 00
4-54-5 44 11 500500 1,1001,100 33 200200
4-64-6 1212 99 50,00050,000 71,00071,000 33 7,0007,000
5-65-6 44 11 500500 1,1001,100 33 200200
6-76-7 44 33 15,00015,000 22,00022,000 11 7,0007,000
$75,000$75,000 $110,700$110,700
12
8 0
4 12
4 4
41 2 4 6 7
3
5
$400
$500
$3,000 $7,000
$200 $200
$7,000
M. Sundaram Tenn. Tech 73
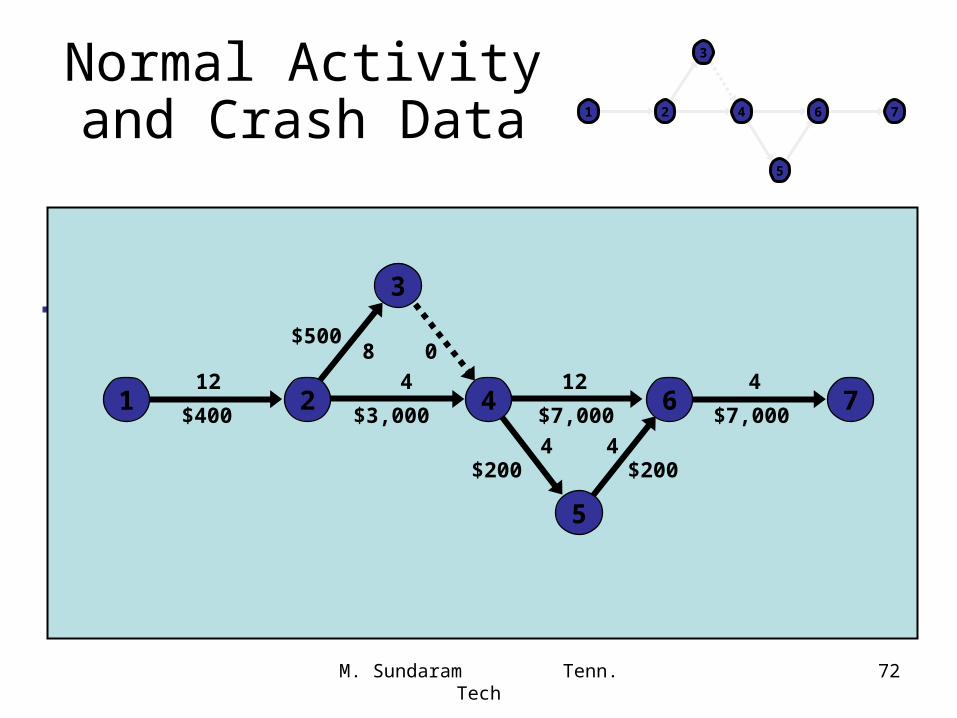
Normal Activity and Crash Data 1 2 4 6 7
3
5
TOTALTOTALNORMALNORMAL CRASHCRASH ALLOWABLEALLOWABLE CRASHCRASH
TIMETIME TIMETIME NORMALNORMAL CRASHCRASH CRASH TIMECRASH TIME COST PERCOST PERACTIVITYACTIVITY (WEEKS)(WEEKS) (WEEKS)(WEEKS) COSTCOST COSTCOST (WEEKS)(WEEKS) WEEKWEEK
1-21-2 1212 77 $3,000$3,000 $5,000$5,000 55 $400$400
2-32-3 88 55 2,0002,000 3,5003,500 33 500500
2-42-4 44 33 4,0004,000 7,0007,000 11 3,0003,000
3-43-4 00 00 00 00 00 00
4-54-5 44 11 500500 1,1001,100 33 200200
4-64-6 1212 99 50,00050,000 71,00071,000 33 7,0007,000
5-65-6 44 11 500500 1,1001,100 33 200200
6-76-7 44 33 15,00015,000 22,00022,000 11 7,0007,000
$75,000$75,000 $110,700$110,700
12
8 0
4 12
4 4
41 2 4 6 7
3
5
$400
$500
$3,000 $7,000
$200 $200
$7,000
M. Sundaram Tenn. Tech 74
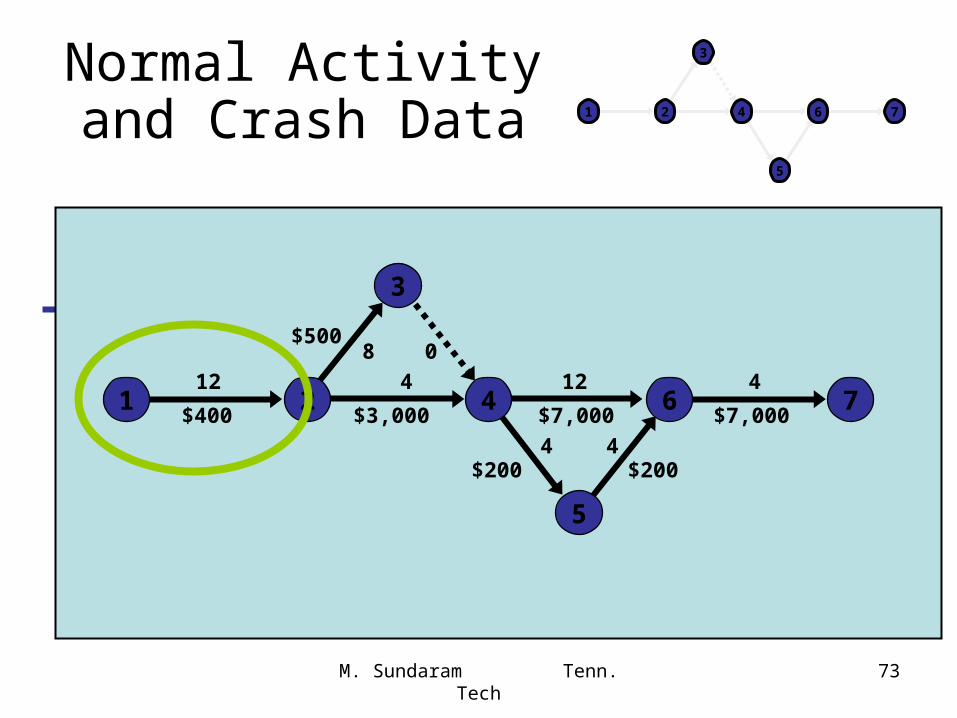
Normal Activity and Crash Data 1 2 4 6 7
3
5
TOTALTOTALNORMALNORMAL CRASHCRASH ALLOWABLEALLOWABLE CRASHCRASH
TIMETIME TIMETIME NORMALNORMAL CRASHCRASH CRASH TIMECRASH TIME COST PERCOST PERACTIVITYACTIVITY (WEEKS)(WEEKS) (WEEKS)(WEEKS) COSTCOST COSTCOST (WEEKS)(WEEKS) WEEKWEEK
1-21-2 1212 77 $3,000$3,000 $5,000$5,000 55 $400$400
2-32-3 88 55 2,0002,000 3,5003,500 33 500500
2-42-4 44 33 4,0004,000 7,0007,000 11 3,0003,000
3-43-4 00 00 00 00 00 00
4-54-5 44 11 500500 1,1001,100 33 200200
4-64-6 1212 99 50,00050,000 71,00071,000 33 7,0007,000
5-65-6 44 11 500500 1,1001,100 33 200200
6-76-7 44 33 15,00015,000 22,00022,000 11 7,0007,000
$75,000$75,000 $110,700$110,700
7
8 0
4 12
4 4
41 2 4 6 7
3
5
$500
$3,000 $7,000
$200 $200
$7,000
Crash cost = $2,000
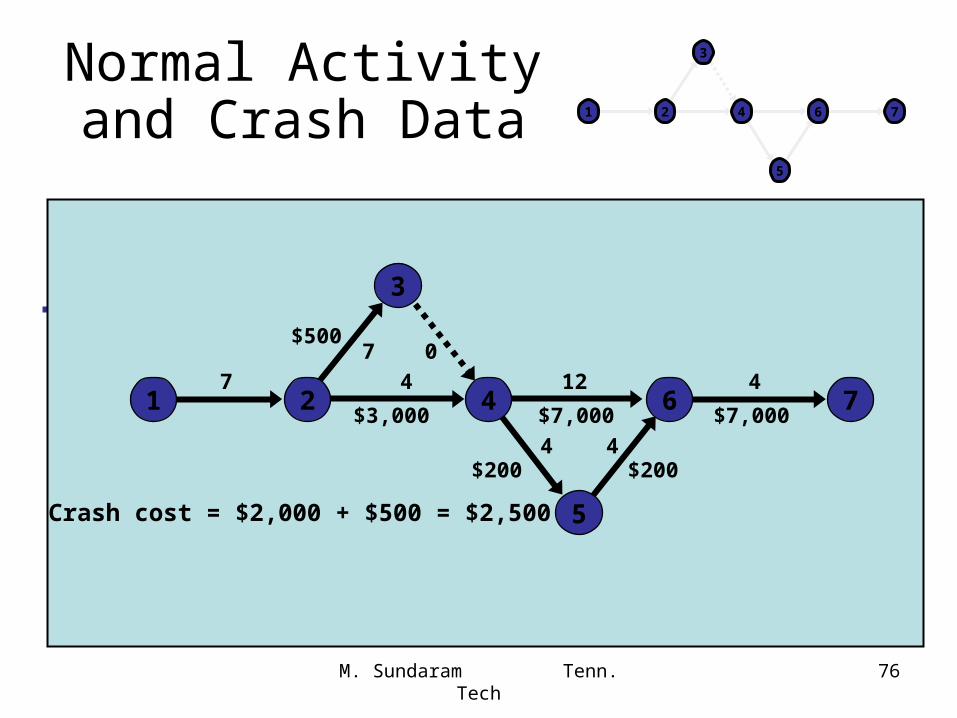
M. Sundaram Tenn. Tech 75
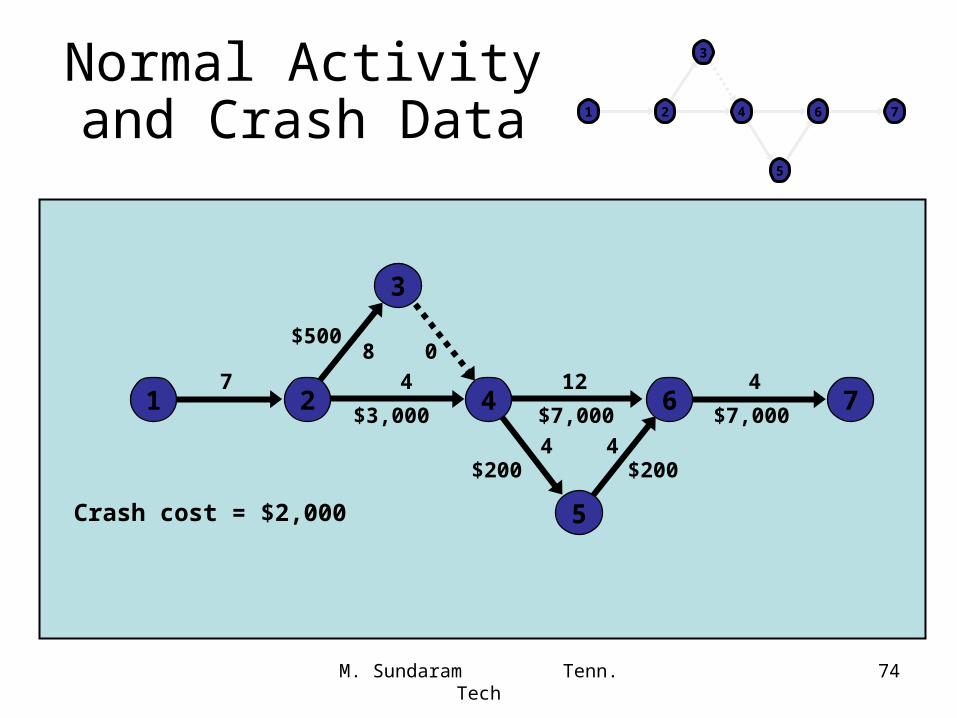
Normal Activity and Crash Data 1 2 4 6 7
3
5
TOTALTOTALNORMALNORMAL CRASHCRASH ALLOWABLEALLOWABLE CRASHCRASH
TIMETIME TIMETIME NORMALNORMAL CRASHCRASH CRASH TIMECRASH TIME COST PERCOST PERACTIVITYACTIVITY (WEEKS)(WEEKS) (WEEKS)(WEEKS) COSTCOST COSTCOST (WEEKS)(WEEKS) WEEKWEEK
1-21-2 1212 77 $3,000$3,000 $5,000$5,000 55 $400$400
2-32-3 88 55 2,0002,000 3,5003,500 33 500500
2-42-4 44 33 4,0004,000 7,0007,000 11 3,0003,000
3-43-4 00 00 00 00 00 00
4-54-5 44 11 500500 1,1001,100 33 200200
4-64-6 1212 99 50,00050,000 71,00071,000 33 7,0007,000
5-65-6 44 11 500500 1,1001,100 33 200200
6-76-7 44 33 15,00015,000 22,00022,000 11 7,0007,000
$75,000$75,000 $110,700$110,700
7
8 0
4 12
4 4
41 2 4 6 7
3
5
$500
$3,000 $7,000
$200 $200
$7,000
Crash cost = $2,000
M. Sundaram Tenn. Tech 76
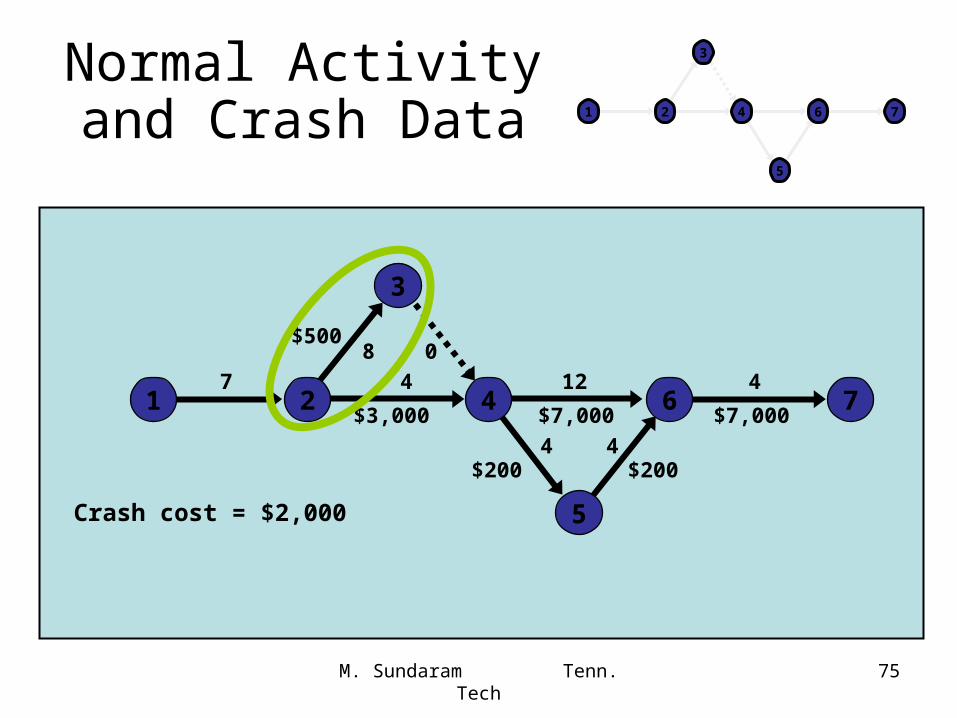
Normal Activity and Crash Data 1 2 4 6 7
3
5
TOTALTOTALNORMALNORMAL CRASHCRASH ALLOWABLEALLOWABLE CRASHCRASH
TIMETIME TIMETIME NORMALNORMAL CRASHCRASH CRASH TIMECRASH TIME COST PERCOST PERACTIVITYACTIVITY (WEEKS)(WEEKS) (WEEKS)(WEEKS) COSTCOST COSTCOST (WEEKS)(WEEKS) WEEKWEEK
1-21-2 1212 77 $3,000$3,000 $5,000$5,000 55 $400$400
2-32-3 88 55 2,0002,000 3,5003,500 33 500500
2-42-4 44 33 4,0004,000 7,0007,000 11 3,0003,000
3-43-4 00 00 00 00 00 00
4-54-5 44 11 500500 1,1001,100 33 200200
4-64-6 1212 99 50,00050,000 71,00071,000 33 7,0007,000
5-65-6 44 11 500500 1,1001,100 33 200200
6-76-7 44 33 15,00015,000 22,00022,000 11 7,0007,000
$75,000$75,000 $110,700$110,700
7
7 0
4 12
4 4
41 2 4 6 7
3
5
$500
$3,000 $7,000
$200 $200
$7,000
Crash cost = $2,000 + $500 = $2,500
M. Sundaram Tenn. Tech 77
Crashing costs increase as project Crashing costs increase as project duration decreasesduration decreases
Indirect costs increase as project Indirect costs increase as project duration increasesduration increases
Reduce project length Reduce project length as long as crashing as long as crashing costs are less than costs are less than indirect costsindirect costs
Time-Cost Relationship
M. Sundaram Tenn. Tech 78
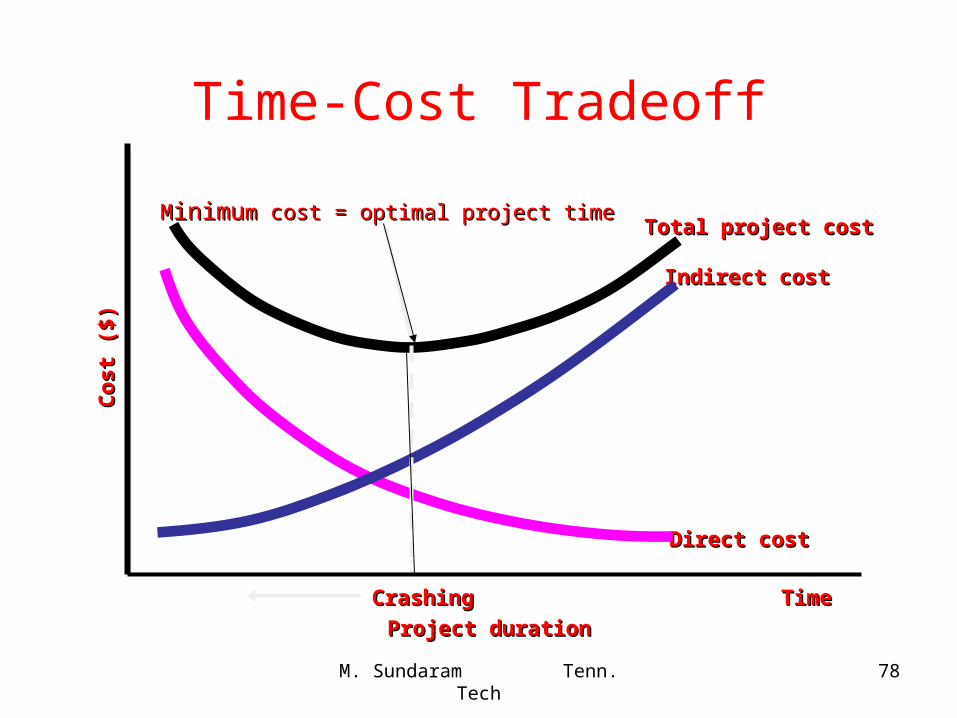
Time-Cost TradeoffC
ost
($)
Co
st (
$)
Project durationProject duration
CrashingCrashing TimeTime
MMinimuinimum cost = optimal project timem cost = optimal project timeTotal project costTotal project cost
Indirect costIndirect cost
Direct costDirect cost
M. Sundaram Tenn. Tech 79
M. Sundaram Tenn. Tech 80
M. Sundaram Tenn. Tech 81
M. Sundaram Tenn. Tech 82
M. Sundaram Tenn. Tech 83
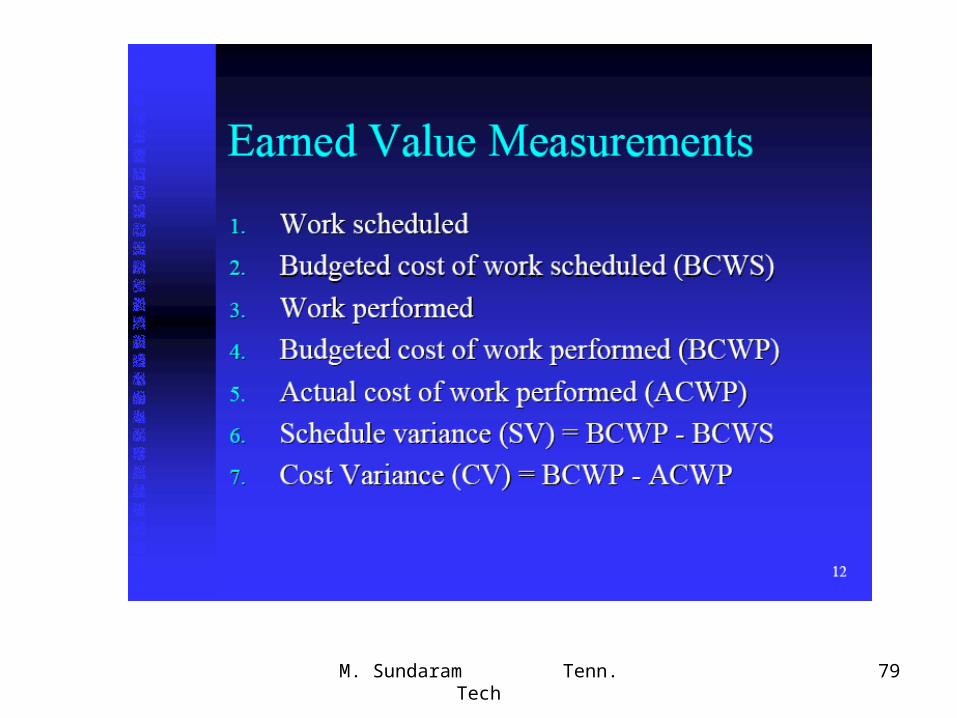
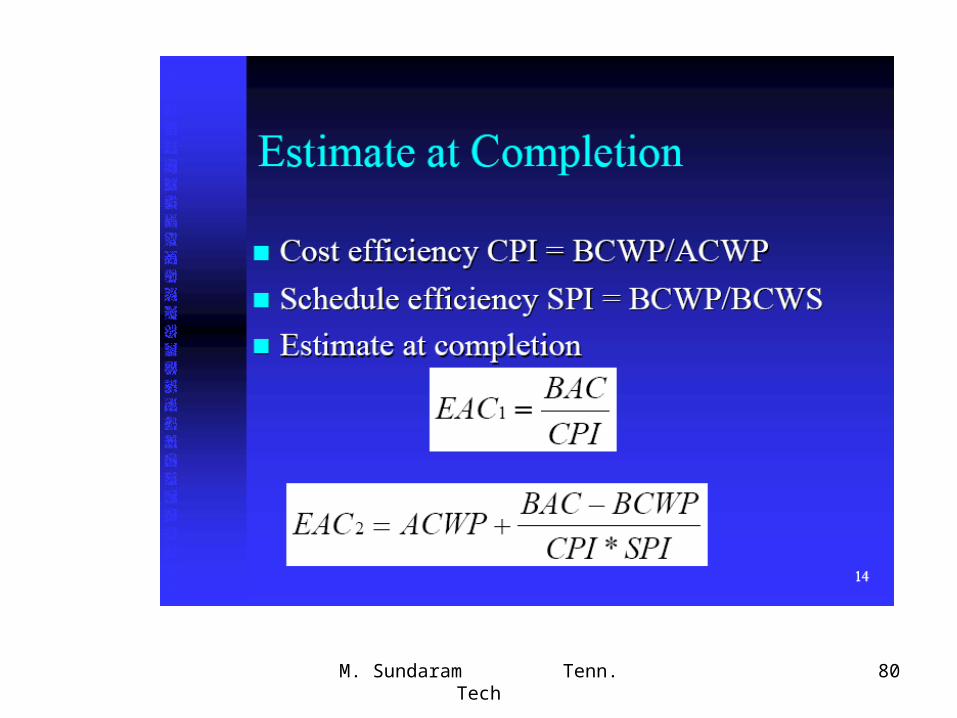
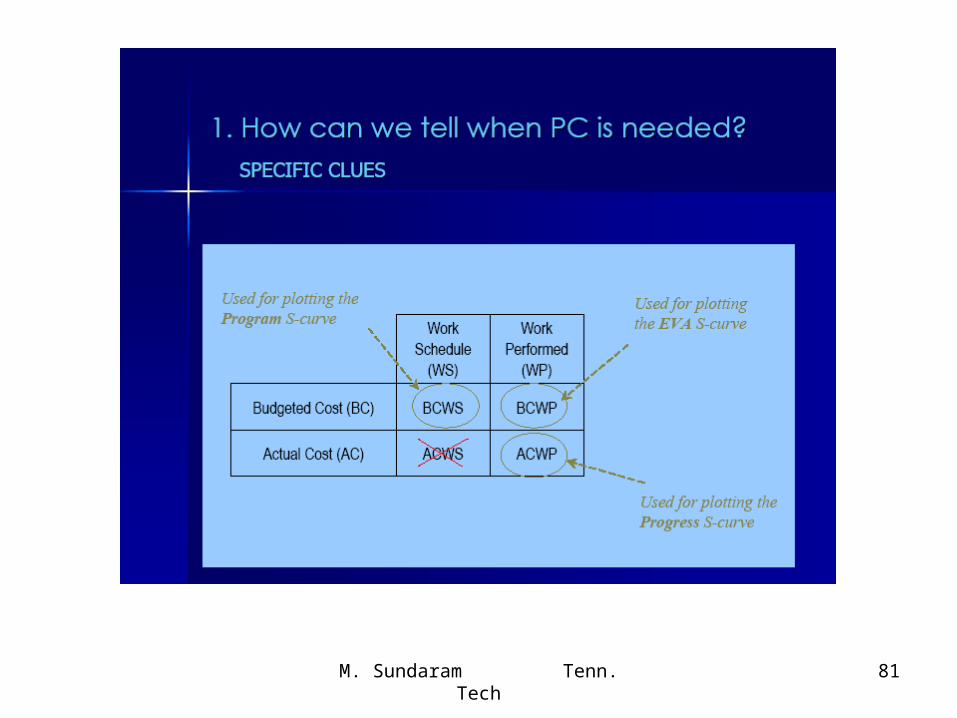
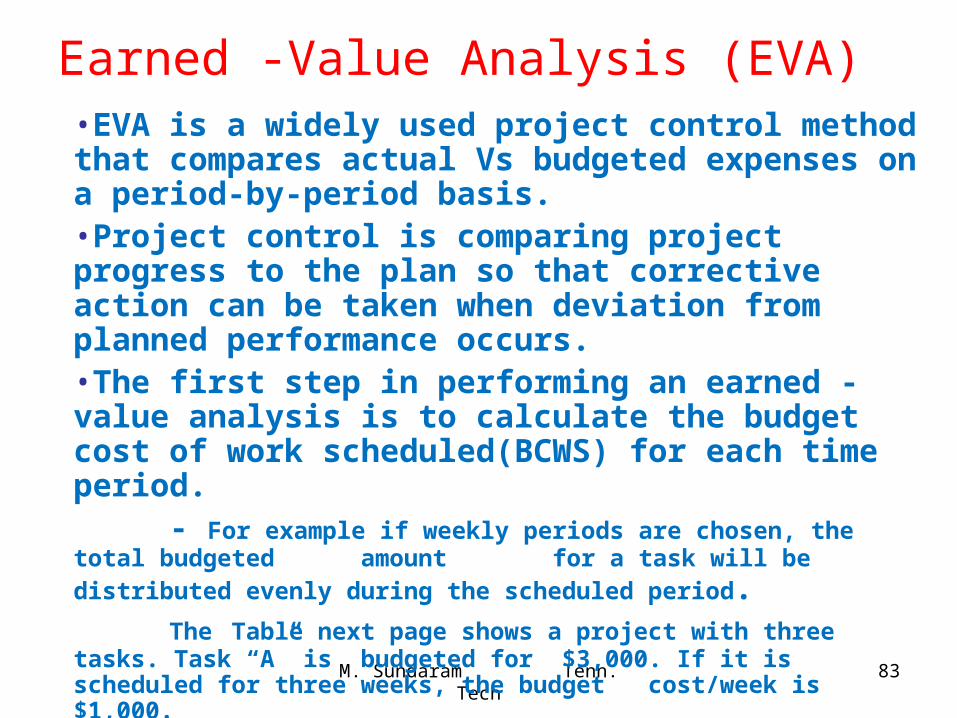
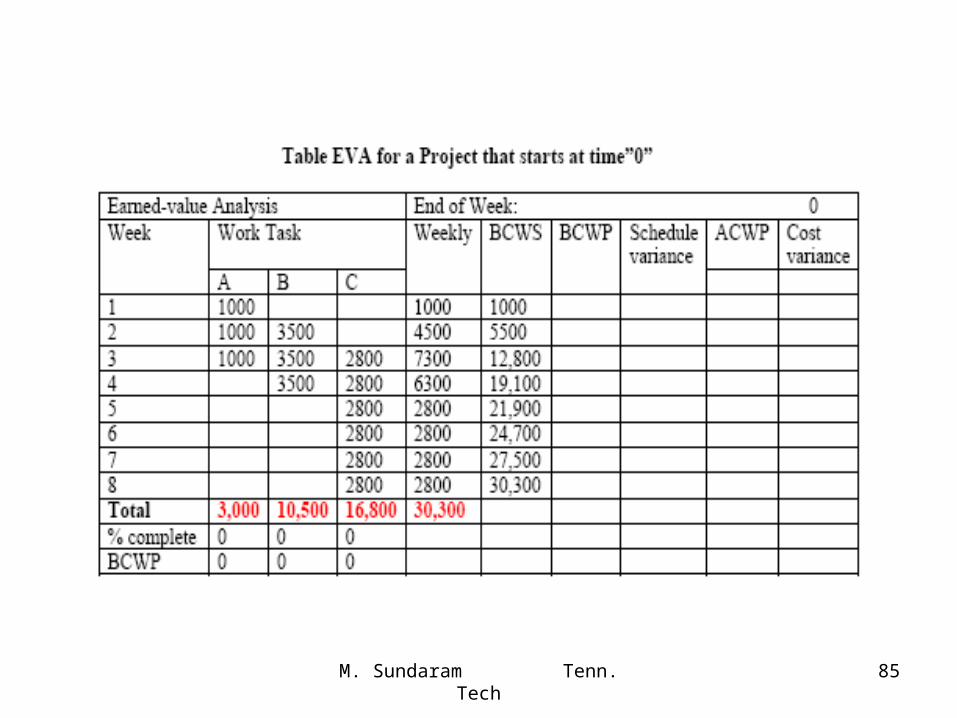
Earned -Value Analysis (EVA)•EVA is a widely used project control method that compares actual Vs budgeted expenses on a period-by-period basis.•Project control is comparing project progress to the plan so that corrective action can be taken when deviation from planned performance occurs.•The first step in performing an earned -value analysis is to calculate the budget cost of work scheduled(BCWS) for each time period.
- For example if weekly periods are chosen, the total budgeted amount
for a task will be distributed evenly during the scheduled period. The Table next page shows a project with three tasks. Task “A” is budgeted for $3,000. If it is scheduled for three weeks, the budget cost/week is $1,000.
M. Sundaram Tenn. Tech 84
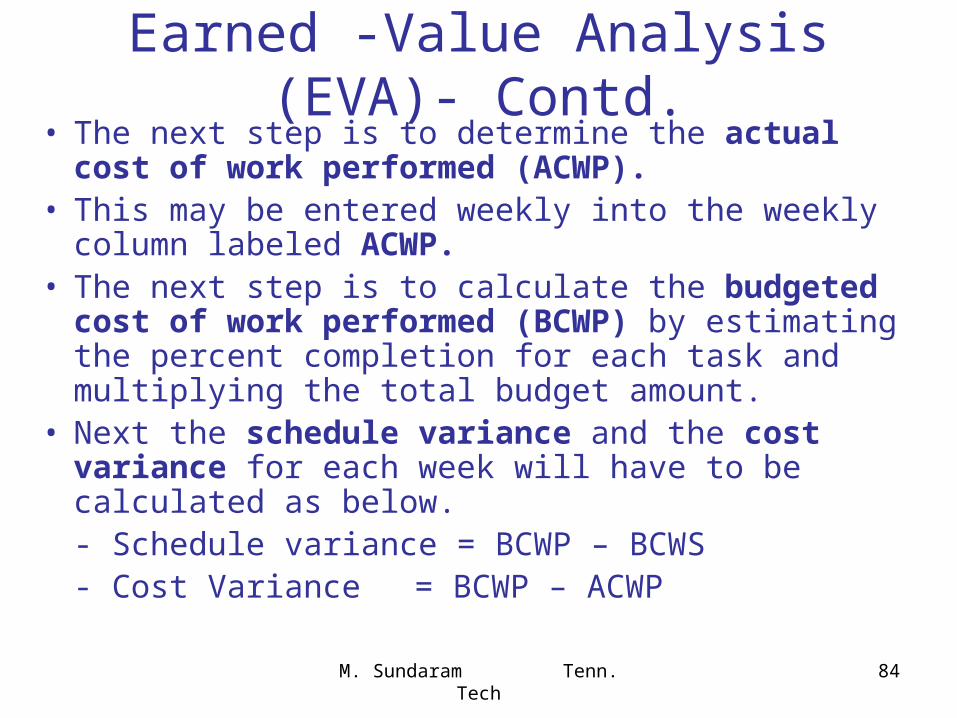
Earned -Value Analysis (EVA)- Contd.• The next step is to determine the actual cost of work
performed (ACWP).• This may be entered weekly into the weekly column
labeled ACWP.• The next step is to calculate the budgeted cost of work
performed (BCWP) by estimating the percent completion for each task and multiplying the total budget amount.
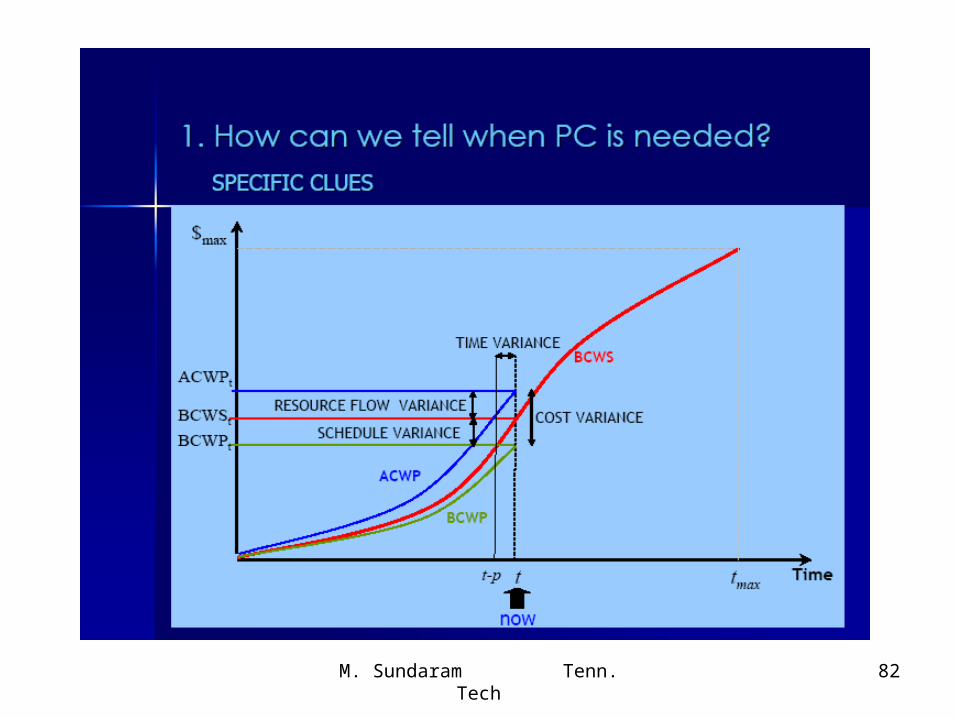
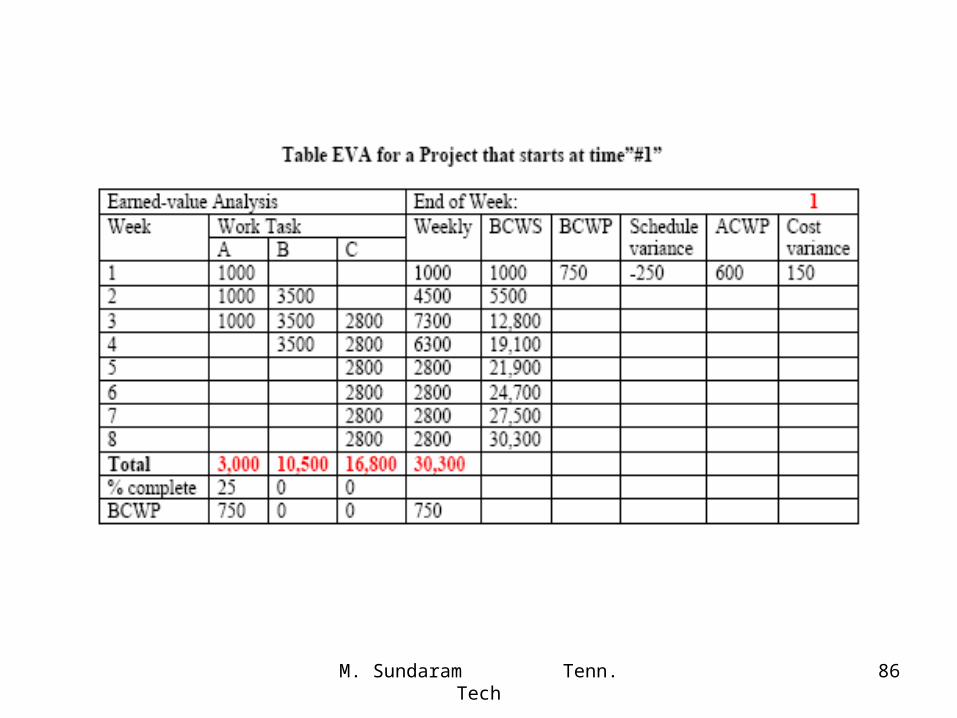
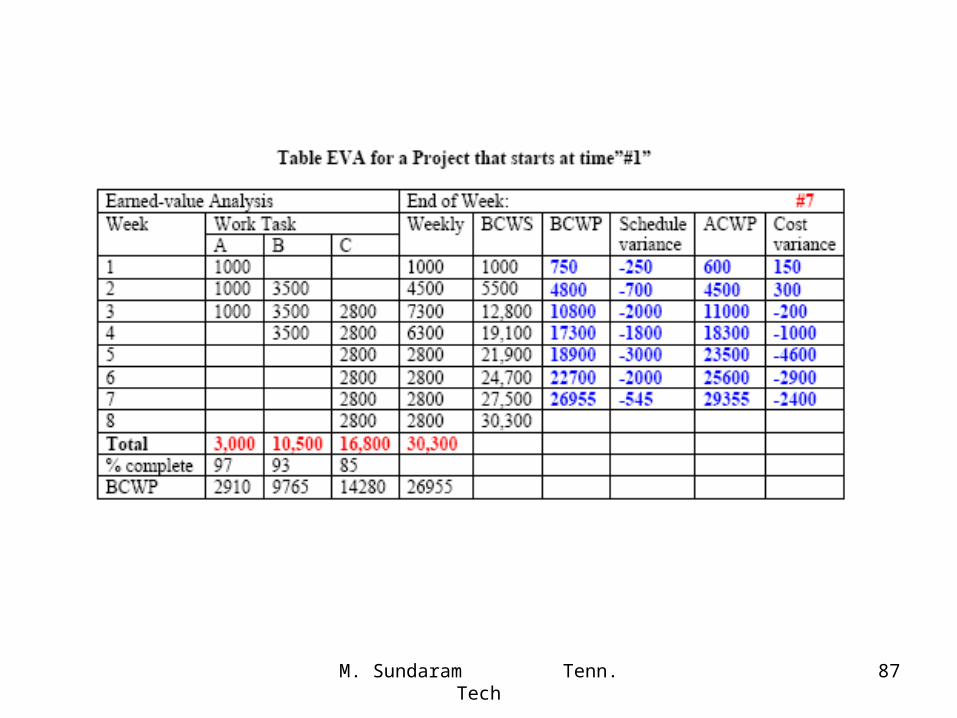
• Next the schedule variance and the cost variance for each week will have to be calculated as below.- Schedule variance = BCWP – BCWS- Cost Variance = BCWP – ACWP
M. Sundaram Tenn. Tech 85
M. Sundaram Tenn. Tech 86
M. Sundaram Tenn. Tech 87
M. Sundaram Tenn. Tech 88
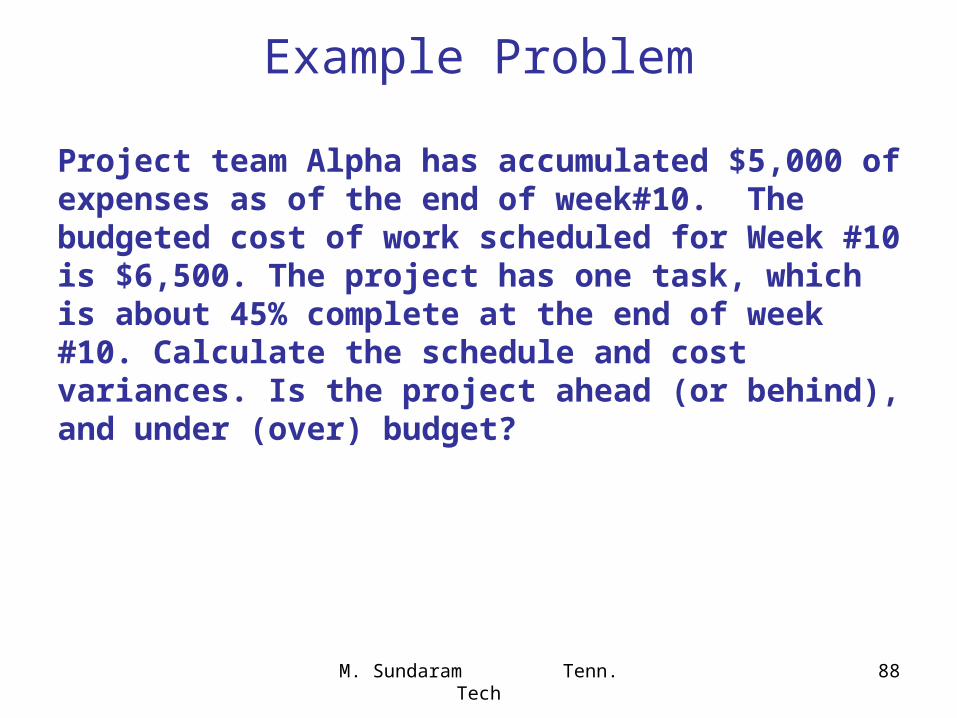
Example Problem
Project team Alpha has accumulated $5,000 of expenses as of the end of week#10. The budgeted cost of work scheduled for Week #10 is $6,500. The project has one task, which is about 45% complete at the end of week #10. Calculate the schedule and cost variances. Is the project ahead (or behind), and under (over) budget?
M. Sundaram Tenn. Tech 89
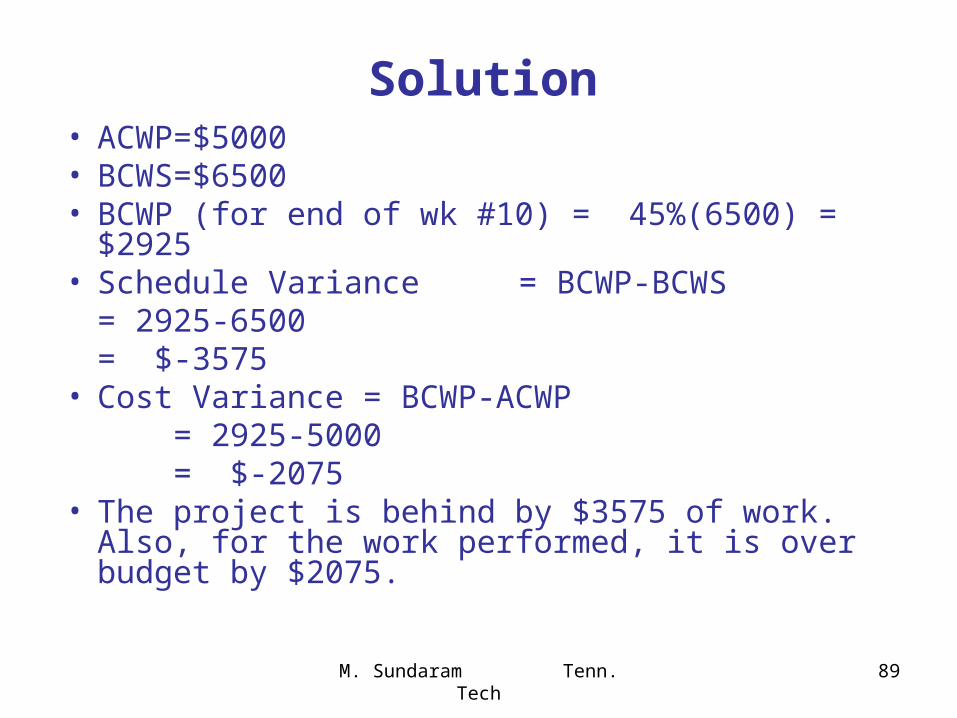
Solution• ACWP=$5000• BCWS=$6500• BCWP (for end of wk #10) = 45%(6500) = $2925• Schedule Variance = BCWP-BCWS
= 2925-6500= $-3575
• Cost Variance = BCWP-ACWP = 2925-5000 = $-2075
• The project is behind by $3575 of work. Also, for the work performed, it is over budget by $2075.
M. Sundaram Tenn. Tech 90
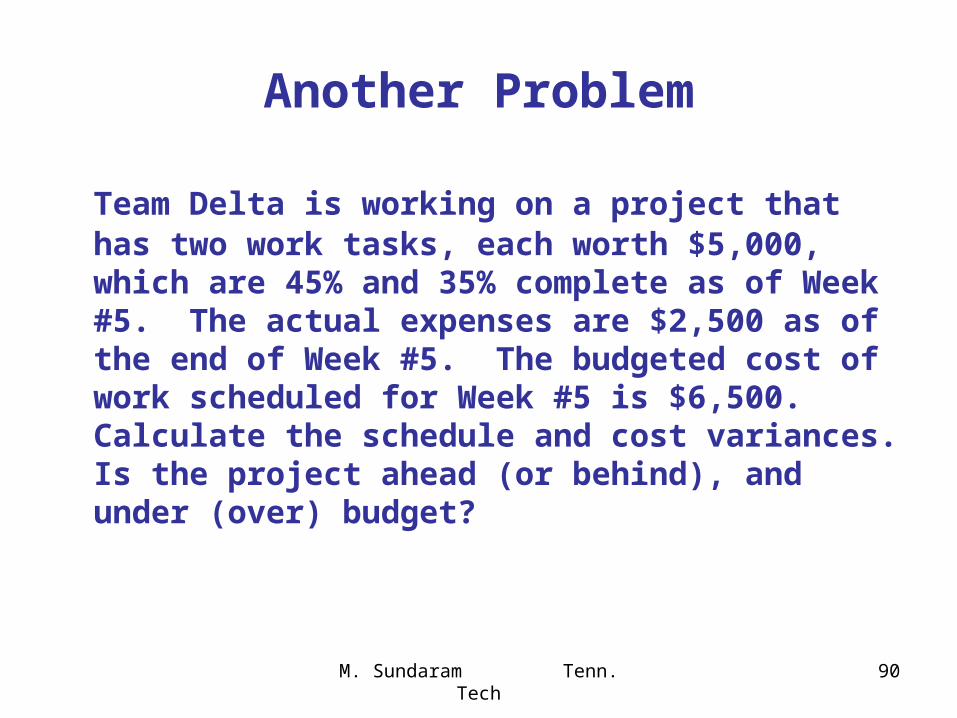
Another Problem
Team Delta is working on a project that has two work tasks, each worth $5,000, which are 45% and 35% complete as of Week #5. The actual expenses are $2,500 as of the end of Week #5. The budgeted cost of work scheduled for Week #5 is $6,500. Calculate the schedule and cost variances. Is the project ahead (or behind), and under (over) budget?
M. Sundaram Tenn. Tech 91
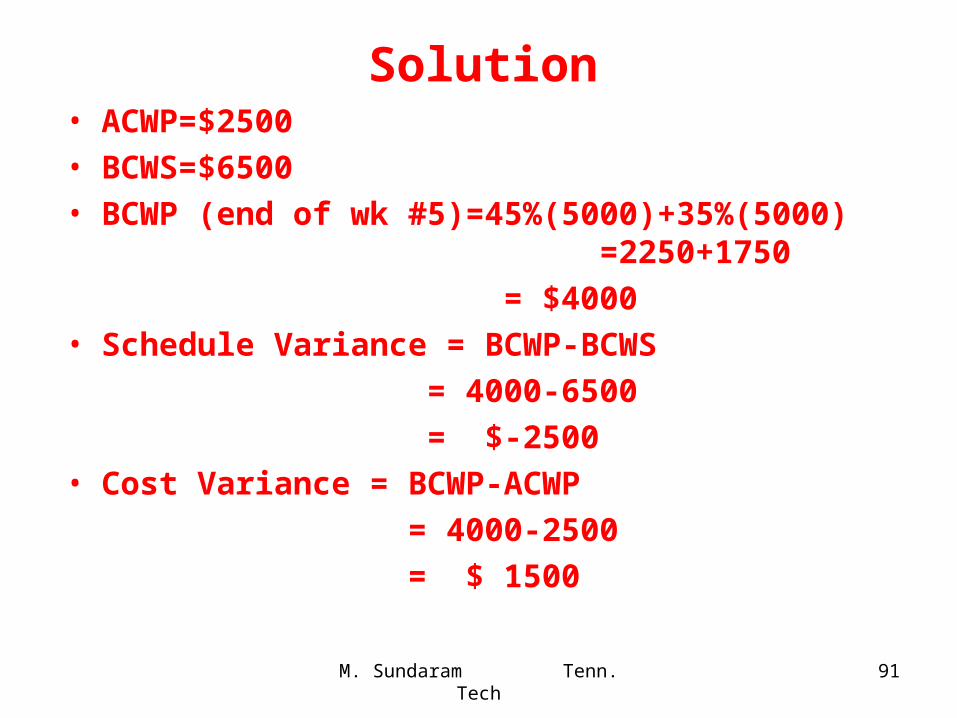
Solution• ACWP=$2500
• BCWS=$6500
• BCWP (end of wk #5)=45%(5000)+35%(5000) =2250+1750
= $4000
• Schedule Variance = BCWP-BCWS
= 4000-6500
= $-2500
• Cost Variance = BCWP-ACWP
= 4000-2500
= $ 1500
M. Sundaram Tenn. Tech 92
Resources
Manpower Money Machines Materials Method
M. Sundaram Tenn. Tech 93
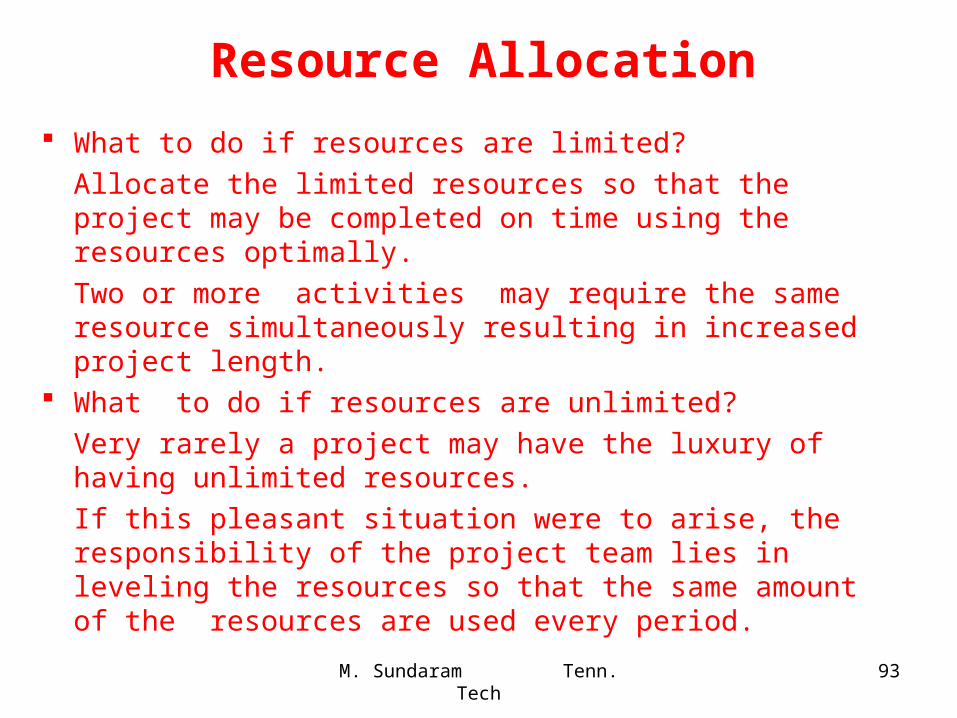
Resource Allocation
What to do if resources are limited?
Allocate the limited resources so that the project may be completed on time using the resources optimally.
Two or more activities may require the same resource simultaneously resulting in increased project length.
What to do if resources are unlimited?
Very rarely a project may have the luxury of having unlimited resources.
If this pleasant situation were to arise, the responsibility of the project team lies in leveling the resources so that the same amount of the resources are used every period.