M SAC 2015 ASTER LAN U P ROJECTS Traffic Impact ….. SAC 2015 FACILITIES MASTER PLAN UPDATE &...
59
MT. SAC 2015 FACILITIES MASTER PLAN UPDATE & PHYSICAL EDUCATION PROJECTS Traffic Impact Study Draft Report Submitted to: Mt. San Antonio College April 1, 2016 17J16‐17A8 Submitted by:
Transcript of M SAC 2015 ASTER LAN U P ROJECTS Traffic Impact ….. SAC 2015 FACILITIES MASTER PLAN UPDATE &...
MT. SAC 2015 FACILITIES MASTER PLAN UPDATE & PHYSICAL EDUCATION PROJECTS Traffic Impact Study Draft Report
Submitted to:
Mt. San Antonio College
April 1, 2016
17J16‐17A8
Submitted by:
TrafficImpactStudyDraftReport
i Mt SAC 2015 FMPU/PEP
TABLE OF CONTENTS
Table of Contents .................................................................................................................................. i
Appendices .......................................................................................................................................... ii
List of Tables ....................................................................................................................................... iii
List of Figures ...................................................................................................................................... iii
1.0 Introduction ............................................................................................................................. 1
1.1 PROJECT DESCRIPTION ........................................................................................................................ 1 1.2 STUDY AREA ..................................................................................................................................... 1 1.3 STUDY PERIODS ................................................................................................................................. 3
2.0 Environmental Setting .............................................................................................................. 3
2.1 ROADWAY CONFIGURATIONS .............................................................................................................. 3 2.2 EXISTING PUBLIC TRANSIT ................................................................................................................... 4 2.3 EXISTING TRAFFIC VOLUMES ................................................................................................................ 4
3.0 Traffic Operations Analysis Methodology ................................................................................. 6
3.1 THRESHOLDS OF SIGNIFICANCE ............................................................................................................ 8
4.0 Existing Conditions ................................................................................................................... 9
5.0 Proposed Project Traffic ......................................................................................................... 12
5.1 PROJECT TRIP GENERATION ............................................................................................................... 12 5.2 PROJECT TRIP DISTRIBUTION ............................................................................................................. 14 5.3 PROJECT TRIP ASSIGNMENT .............................................................................................................. 14
6.0 Existing Plus 2020 Project Conditions ...................................................................................... 18
6.1 EXISTING PLUS 2020 PROJECT INTERSECTION LEVELS OF SERVICE ............................................................ 18 6.2 EXISTING PLUS 2020 PROJECT MITIGATION MEASURES ......................................................................... 22
7.0 Existing Plus 2025 Project Conditions ...................................................................................... 24
7.1 EXISTING PLUS 2025 PROJECT INTERSECTION LEVELS OF SERVICE ............................................................ 24 7.2 EXISTING PLUS 2025 PROJECT MITIGATION MEASURES ......................................................................... 28
8.0 Cumulative Project Conditions ................................................................................................ 30
8.1 CUMULATIVE PROJECT GROWTH ........................................................................................................ 30
9.0 Existing Plus 2020 Cumulative Conditions ............................................................................... 36
10.0 Existing Plus 2020 Project PLUS Cumulative Conditions ........................................................... 38
10.1 EXISTING PLUS 2020 PROJECT PLUS CUMULATIVE INTERSECTION LEVELS OF SERVICE ................................. 38 10.2 EXISTING PLUS 2020 PROJECT PLUS CUMULATIVE MITIGATION MEASURES .............................................. 42
11.0 Existing Plus 2025 Cumulative Conditions ............................................................................... 45
12.0 Existing Plus 2025 Project Plus Cumulative Conditions ............................................................ 47
TrafficImpactStudyDraftReport
ii Mt SAC 2015 FMPU/PEP
12.1 EXISTING PLUS 2025 PROJECT PLUS CUMULATIVE INTERSECTION LEVELS OF SERVICE ................................. 47 12.2 EXISTING PLUS 2025 PROJECT PLUS CUMULATIVE MITIGATION MEASURES .............................................. 51 12.3 FAIR SHARE CONTRIBUTION .............................................................................................................. 53
13.0 Congestion Management Program Analysis (CMP) .................................................................. 54
14.0 Conclusions ............................................................................................................................ 54
APPENDICES
Appendix A: Traffic Count Data Appendix B: LOS Calculation Sheets Appendix C: Cumulative Project Trip Generation Appendix D: Fair‐Share Calculations
TrafficImpactStudyDraftReport
iii Mt SAC 2015 FMPU/PEP
LIST OF TABLES
Table 1: Intersection Level of Service Definitions – ICU Methodology ......................................................... 7 Table 2: Intersection Level of Service Definitions – HCM Methodology ...................................................... 8 Table 3: Intersection Significant Impact Criteria ........................................................................................... 9 Table 4: Existing Intersection Peak Hour Level of Service .......................................................................... 10 Table 5: 2020 Project Trip Generation ........................................................................................................ 13 Table 6: 2025 Project Trip Generation ........................................................................................................ 13 Table 7: Existing Plus 2020 Project Intersection Peak Hour Level of Service ............................................. 19 Table 8: Mitigated Existing Plus 2020 Project Intersection Peak Hour Level of Service ............................. 23 Table 9: Existing Plus 2025 Project Intersection Peak Hour Level of Service ............................................. 25 Table 10: Mitigated Existing Plus 2025 Project Intersection Peak Hour Level of Service ........................... 29 Table 11: 2020 Cumulative Development Projects ..................................................................................... 30 Table 12: 2025 Additional Cumulative Development Projects ................................................................... 32 Table 13: Summary of Future Trip Growth Within Study Area ................................................................... 36 Table 14: Existing Plus 2020 Project Plus Cumulative Intersection Peak Hour Level of Service ................. 39 Table 15: Mitigated Existing Plus 2020 Project Plus Cumulative Intersection Peak Hour Level of Service 44 Table 16: Existing Plus 2025 Project Plus Cumulative Intersection Peak Hour Level of Service ................. 48 Table 17: Mitigated Existing Plus 2025 Project Plus Cumulative Intersection Peak Hour Level of Service 52 Table 18: Project Fair Share Contribution ................................................................................................... 53 Table 19: Summary of Significant Impacts Per Scenario ............................................................................. 55
LIST OF FIGURES
Figure 1: Project Location and Study Intersections ...................................................................................... 2 Figure 2: Existing Peak Hour Intersection Volumes ...................................................................................... 5 Figure 3: Existing Intersection Configurations ............................................................................................ 11 Figure 4: Project Trip Distribution ............................................................................................................... 15 Figure 5: 2020 Project Trip Assignment ...................................................................................................... 16 Figure 6: 2025 Project Trip Assignment ...................................................................................................... 17 Figure 7: Existing Plus 2020 Project Peak Hour Intersection Volumes ....................................................... 21 Figure 8: Existing Plus 2025 Project Peak Hour Intersection Volumes ....................................................... 27 Figure 9: Location of Cumulative Projects .................................................................................................. 33 Figure 10: Trips Generated by 2020 Cumulative Projects .......................................................................... 34 Figure 11: Trips Generated by 2025 Cumulative Projects .......................................................................... 35 Figure 12: Existing Plus 2020 Cumulative Peak Hour Intersection Volumes .............................................. 37 Figure 13: Existing Plus 2020 Project Plus Cumulative Intersection Volumes ............................................ 41 Figure 14: Existing Plus 2025 Cumulative Peak Hour Intersection Volumes .............................................. 46 Figure 15: Existing Plus 2025 Project Plus Cumulative Peak Hour Intersection Volumes .......................... 50
TrafficImpactStudyDraftReport
1 Mt. SAC 2015 FMPU/PEP
1.0 INTRODUCTION
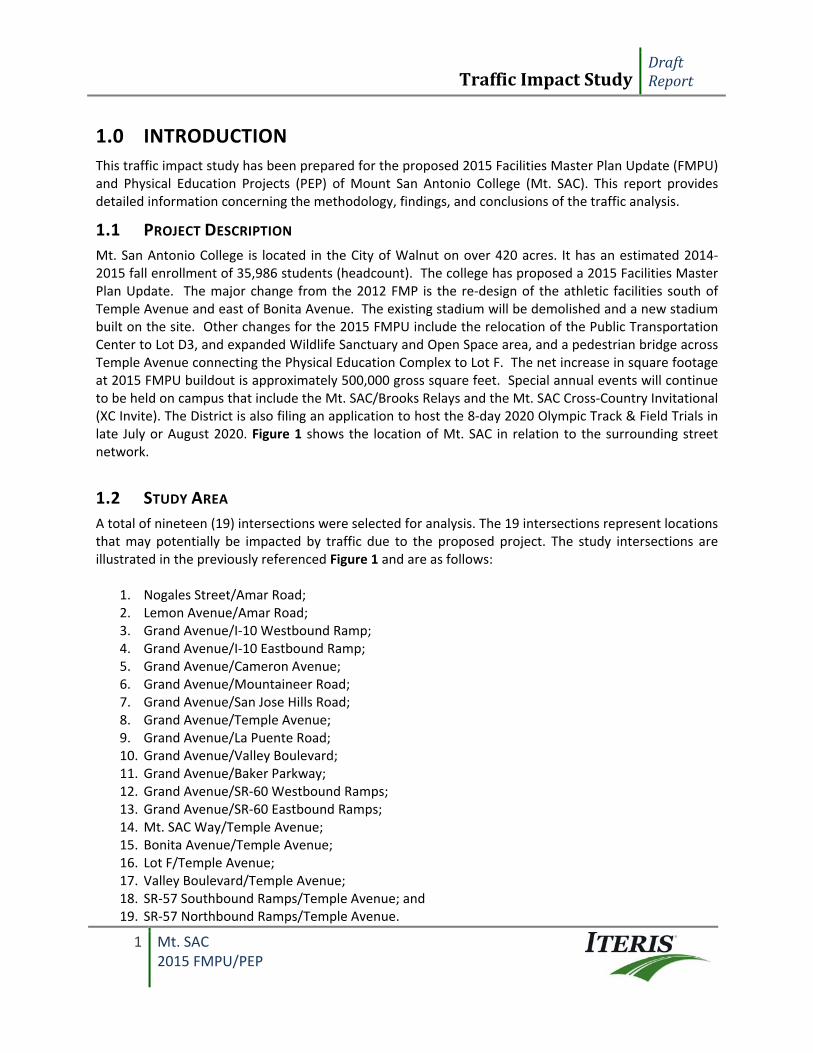
This traffic impact study has been prepared for the proposed 2015 Facilities Master Plan Update (FMPU) and Physical Education Projects (PEP) of Mount San Antonio College (Mt. SAC). This report provides detailed information concerning the methodology, findings, and conclusions of the traffic analysis.
1.1 PROJECT DESCRIPTION
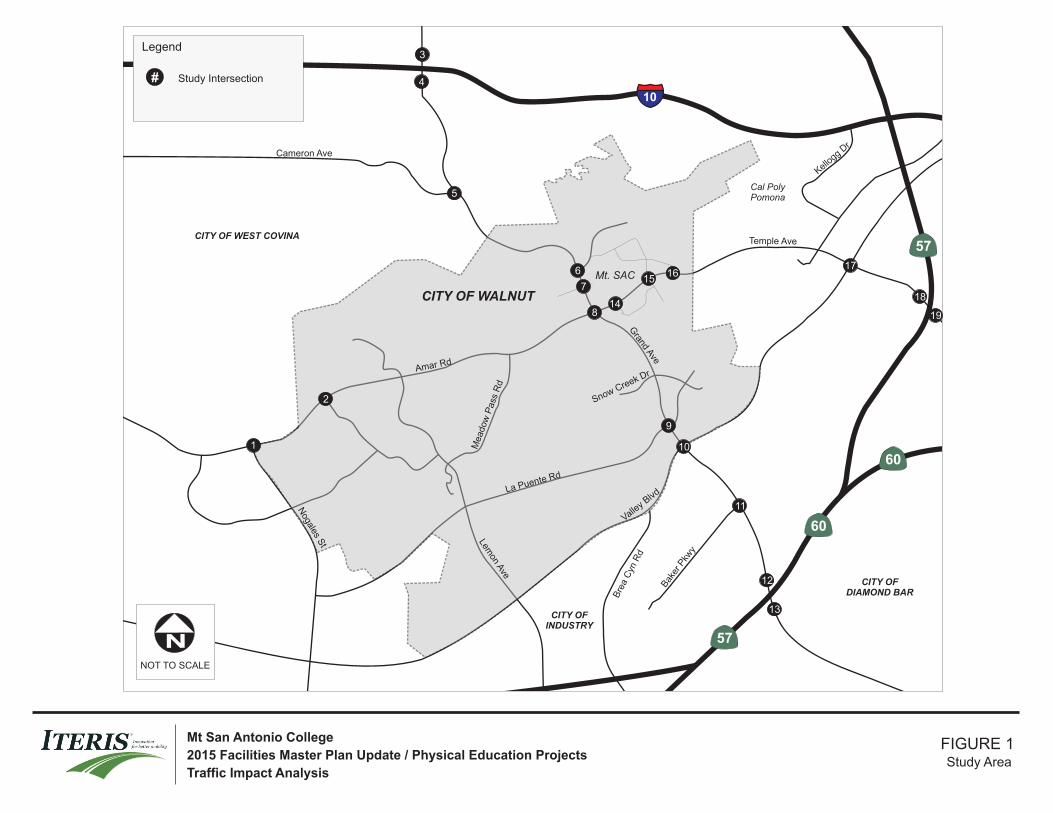
Mt. San Antonio College is located in the City of Walnut on over 420 acres. It has an estimated 2014‐2015 fall enrollment of 35,986 students (headcount). The college has proposed a 2015 Facilities Master Plan Update. The major change from the 2012 FMP is the re‐design of the athletic facilities south of Temple Avenue and east of Bonita Avenue. The existing stadium will be demolished and a new stadium built on the site. Other changes for the 2015 FMPU include the relocation of the Public Transportation Center to Lot D3, and expanded Wildlife Sanctuary and Open Space area, and a pedestrian bridge across Temple Avenue connecting the Physical Education Complex to Lot F. The net increase in square footage at 2015 FMPU buildout is approximately 500,000 gross square feet. Special annual events will continue to be held on campus that include the Mt. SAC/Brooks Relays and the Mt. SAC Cross‐Country Invitational (XC Invite). The District is also filing an application to host the 8‐day 2020 Olympic Track & Field Trials in late July or August 2020. Figure 1 shows the location of Mt. SAC in relation to the surrounding street network.
1.2 STUDY AREA
A total of nineteen (19) intersections were selected for analysis. The 19 intersections represent locations that may potentially be impacted by traffic due to the proposed project. The study intersections are illustrated in the previously referenced Figure 1 and are as follows:
1. Nogales Street/Amar Road; 2. Lemon Avenue/Amar Road; 3. Grand Avenue/I‐10 Westbound Ramp; 4. Grand Avenue/I‐10 Eastbound Ramp; 5. Grand Avenue/Cameron Avenue; 6. Grand Avenue/Mountaineer Road; 7. Grand Avenue/San Jose Hills Road; 8. Grand Avenue/Temple Avenue; 9. Grand Avenue/La Puente Road; 10. Grand Avenue/Valley Boulevard; 11. Grand Avenue/Baker Parkway; 12. Grand Avenue/SR‐60 Westbound Ramps; 13. Grand Avenue/SR‐60 Eastbound Ramps; 14. Mt. SAC Way/Temple Avenue; 15. Bonita Avenue/Temple Avenue; 16. Lot F/Temple Avenue; 17. Valley Boulevard/Temple Avenue; 18. SR‐57 Southbound Ramps/Temple Avenue; and 19. SR‐57 Northbound Ramps/Temple Avenue.
Legend
Study Corridor
NNOT TO SCALE
Sphere of Influence Intersection
Legend
Study Intersection#
Study Roadway Segment
Project Site
#
FIGURE 1 Study Area
Mt San Antonio College
2015 Facilities Master Plan Update / Physical Education Projects
Traffic Impact Analysis
Lemon A
ve
Meadow
Pass
Rd
Temple Ave
Valley B
lvd
10
Bak
er P
kwy
Grand A
ve
Amar Rd
Nogales S
t
La Puente Rd
Bre
a C
yn R
d
Cal PolyPomona
Mt. SAC
Kellogg D
rCameron Ave
CITY OF WALNUT
57
60
57
60
CITY OF WEST COVINA
CITY OF INDUSTRY
CITY OF DIAMOND BAR
Snow Creek Dr
1
2
3
4
5
6
7
8
9
10
11
12
13
15
14
1617
18
19
TrafficImpactStudyDraftReport
3 Mt. SAC 2015 FMPU/PEP
1.3 STUDY PERIODS
Traffic operations were evaluated for each of the following scenarios during the weekday a.m. and p.m. peak hours:
Existing Conditions (2015);
Existing Plus 2020 Project Conditions;
Existing Plus 2025 Project Conditions;
Existing Plus 2020 Cumulative Conditions;
Existing Plus 2025 Cumulative Conditions;
Existing Plus 2020 Cumulative Plus Project Conditions; and
Existing Plus 2025 Cumulative Plus Project Conditions. The official buildout date of the 2015 FMPU and of the PEP is 2020. A year 2025 scenario is included in this analysis in order to coincide with the City and County General Plans.
2.0 ENVIRONMENTAL SETTING
This section presents an overview of the existing roadway and transit system within the study area, and the methodology used to determine existing traffic volumes.
2.1 ROADWAY CONFIGURATIONS
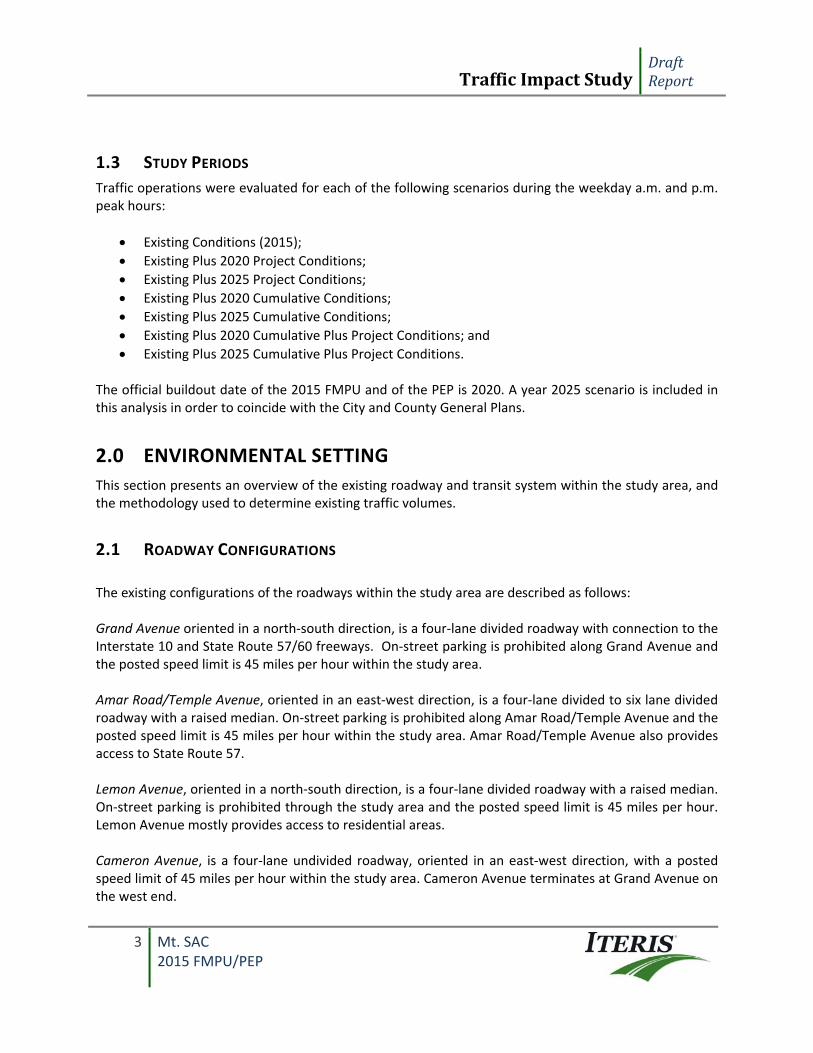
The existing configurations of the roadways within the study area are described as follows: Grand Avenue oriented in a north‐south direction, is a four‐lane divided roadway with connection to the Interstate 10 and State Route 57/60 freeways. On‐street parking is prohibited along Grand Avenue and the posted speed limit is 45 miles per hour within the study area. Amar Road/Temple Avenue, oriented in an east‐west direction, is a four‐lane divided to six lane divided roadway with a raised median. On‐street parking is prohibited along Amar Road/Temple Avenue and the posted speed limit is 45 miles per hour within the study area. Amar Road/Temple Avenue also provides access to State Route 57. Lemon Avenue, oriented in a north‐south direction, is a four‐lane divided roadway with a raised median. On‐street parking is prohibited through the study area and the posted speed limit is 45 miles per hour. Lemon Avenue mostly provides access to residential areas. Cameron Avenue, is a four‐lane undivided roadway, oriented in an east‐west direction, with a posted speed limit of 45 miles per hour within the study area. Cameron Avenue terminates at Grand Avenue on the west end.
TrafficImpactStudyDraftReport
4 Mt. SAC 2015 FMPU/PEP
Mountaineer Road is a four‐lane divided roadway, oriented in an east‐west direction providing local access to residential areas and Mt. SAC. On street parking is prohibited and the posted speed limit is 35 miles per hour within the study area. Mountaineer Road terminates at Grand Avenue on the east end. Baker Parkway is a four‐lane divided roadway currently terminating at Grand Avenue on the west end. Baker Parkway would be extended east of Grand Avenue to provide direct access to the Industry Business Complex. La Puente Road, oriented in an east‐west direction, is a four‐lane divided roadway, with a posted speed limit of 40 miles per hour. La Puente Road mostly provides access to residential areas. Nogales Street is a two‐lane undivided to four‐lane divided roadway, oriented in a north‐south direction. On street parking is prohibited and the posted speed limit is 50 miles per hour within the study area. Valley Boulevard, oriented in an east‐west direction, is a four to six‐lane divided roadway with connection to the Interstate 10 and State Route 57/60 freeways. On‐street parking is prohibited along Valley Boulevard within the study area.
2.2 EXISTING PUBLIC TRANSIT
Metro bus lines 190/194 travel north‐south along Grand Avenue and east‐west along Valley Boulevard through the study area. Foothill Transit lines 195, 289, 480, 482, and 486 travel east‐west along Amar Road/Temple Avenue through the study area.
2.3 EXISTING TRAFFIC VOLUMES
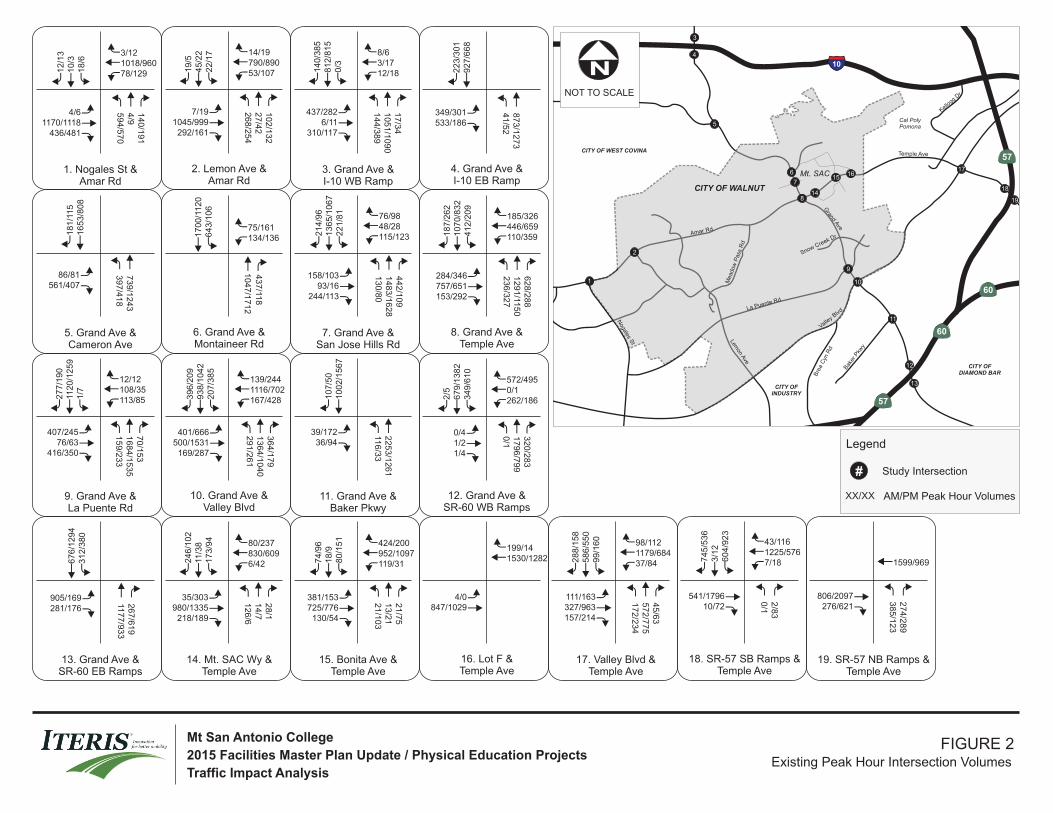
Existing traffic counts at all 19 intersections were conducted in October 2015. All counts were conducted during the a.m. peak period (7:00 – 9:00) and p.m. peak period (4:00 – 6:00). The traffic impact analysis is based on the highest single hour of traffic during each time period at each location. Detailed vehicle turning movement data are included in Appendix A. Figure 2 shows the existing peak hour volumes at the study intersections.
Lemon A
ve
Meadow
Pass
Rd
Temple Ave
Valley B
lvd
10
Bak
er P
kwy
Grand A
ve
Amar Rd
Nogales S
t
La Puente Rd
Bre
a C
yn R
d
Cal PolyPomona
Mt. SAC
Kellogg D
rCameron Ave
CITY OF WALNUT
57
60
57
60
CITY OF WEST COVINA
CITY OF INDUSTRY
CITY OF DIAMOND BAR
Snow Creek Dr
1
2
3
4
5
6
7
8
9
10
11
12
13
15
14
1617
18
19
NNOT TO SCALE
Legend
Study Intersection#
AM/PM Peak Hour VolumesXX/XX
FIGURE 2 Existing Peak Hour Intersection Volumes
Mt San Antonio College
2015 Facilities Master Plan Update / Physical Education Projects
Traffic Impact Analysis
59
4/5
70
4/9
14
0/1
91
18
/61
0/3
12
/13
4/61170/1118
436/481
78/1291018/9603/12
26
8/2
54
27
/42
10
2/1
32
22
/17
45
/22
19
/5
7/191045/999
292/161
53/107790/89014/19
14
4/3
89
10
51
/10
90
17
/34
0/3
81
2/8
15
14
0/3
85
437/2826/11
310/117
12/183/178/6
41
/52
87
3/1
27
3
92
7/6
68
22
3/3
01
349/301533/186
39
7/4
18
73
9/1
24
3
16
53
/80
81
81
/11
5
86/81561/407
10
47
/17
12
43
7/11
8
64
3/1
06
17
00
/11
20
134/13675/161
13
0/8
01
48
3/1
62
84
42
/10
9
22
1/8
11
36
5/1
06
72
14
/96
158/10393/16
244/113
115/12348/2876/98
23
6/3
27
12
91
/115
06
28
/28
8
41
2/2
09
10
70
/83
21
87
/26
2
284/346757/651153/292
110/359446/659185/326
15
9/2
33
16
84
/15
35
70
/15
3
1/7
112
0/1
25
92
77
/19
0
407/24576/63
416/350
113/85108/3512/12
29
1/2
61
13
64
/10
40
36
4/1
79
20
7/3
85
93
8/1
04
23
96
/20
9
401/666500/1531
169/287
167/4281116/702139/244
116
/33
22
53
/12
61
10
02
/15
67
10
7/5
0
39/17236/94
0/1
17
96
/79
93
20
/28
3
34
9/6
10
67
9/1
38
22
/5
0/41/21/4
262/1860/1572/495
1177/9
33
26
7/6
19
312/3
80
676/1
294
905/169281/176
12
6/6
14
/72
8/1
173/9
411
/38
246/1
02
35/303980/1335
218/189
6/42830/60980/237
21/1
03
13/2
121/7
5
80/1
51
18/9
74/9
6
381/153725/776
130/54
119/31952/1097424/200
4/0847/1029
1530/1282199/14
172/2
34
572/7
75
45/6
3
99/1
60
586/5
50
288/1
58
111/163327/963157/214
37/841179/68498/112
0/1
2/8
3
604/9
23
3/1
2745/5
36
541/179610/72
7/181225/57643/116
385
/123
274
/289
806/2097276/621
1599/969
1. Nogales St &Amar Rd
2. Lemon Ave &Amar Rd
5. Grand Ave &Cameron Ave
6. Grand Ave &Montaineer Rd
9. Grand Ave &La Puente Rd
10. Grand Ave &Valley Blvd
15. Bonita Ave &Temple Ave
16. Lot F &Temple Ave
3. Grand Ave &I-10 WB Ramp
4. Grand Ave &I-10 EB Ramp
7. Grand Ave &San Jose Hills Rd
8. Grand Ave &Temple Ave
11. Grand Ave &Baker Pkwy
12. Grand Ave &SR-60 WB Ramps
17. Valley Blvd &Temple Ave
18. SR-57 SB Ramps &Temple Ave
14. Mt. SAC Wy &Temple Ave
13. Grand Ave &SR-60 EB Ramps
19. SR-57 NB Ramps &Temple Ave
TrafficImpactStudyDraftReport
6 Mt. SAC 2015 FMPU/PEP
3.0 TRAFFIC OPERATIONS ANALYSIS METHODOLOGY
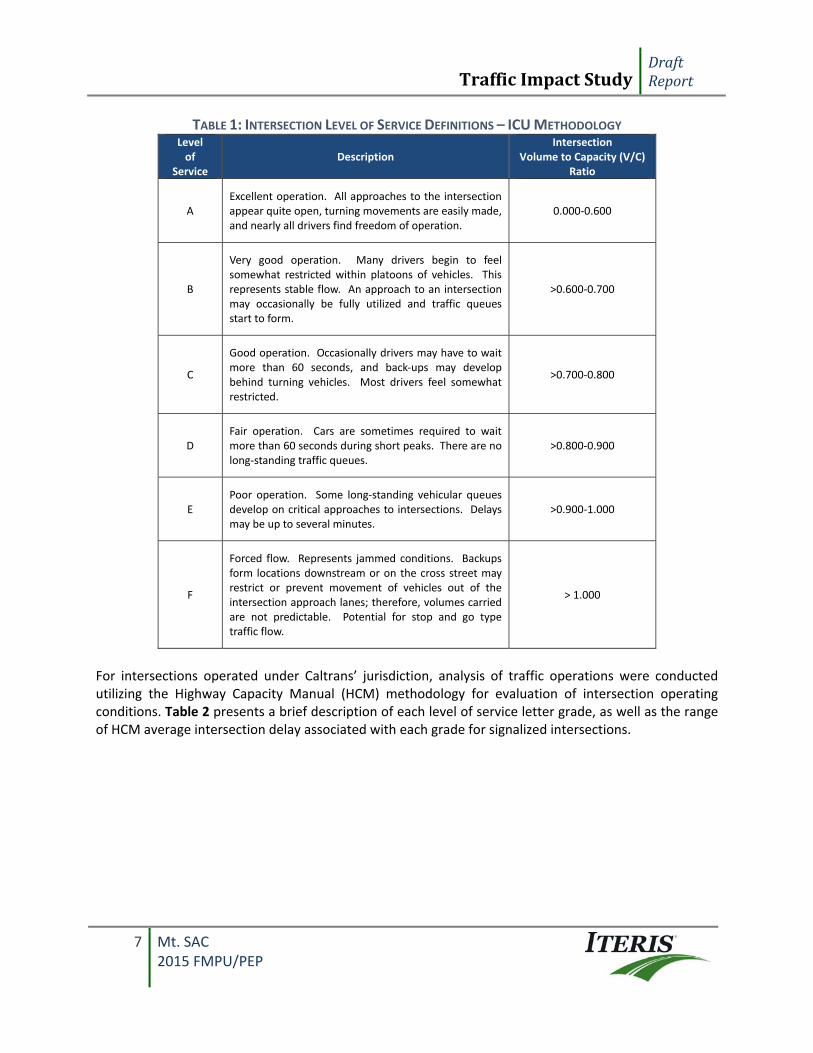
The quality of traffic operations is characterized using the concept of level of service (LOS). Level of service is defined by a range of grades from A (best) to F (worst). At intersections, LOS “A” represents relatively free operating conditions with little or no delay. LOS “F” is characterized by extremely unstable flow conditions and severe congestion with volumes at or near the intersection’s design capacity. This results in long queues backing up from all approaches to intersections. In this report, analysis of traffic operations was conducted according to the Los Angeles County traffic impact analysis guidelines for non‐freeway ramp intersections located within the City of Walnut and City of Pomona. Utilizing these guidelines, intersection operating conditions were quantified using the Intersection Capacity Utilization (ICU) method. Volume‐to‐capacity (V/C) ratios and corresponding levels of service (LOS) were calculated at study intersections during the weekday a.m. and p.m. peak hours. LOS analyses for all study intersections were conducted using TRAFFIX software. Table 1 presents a brief description of each level of service letter grade, as well as the range of V/C ratios associated with each grade for signalized intersections.
TrafficImpactStudyDraftReport
7 Mt. SAC 2015 FMPU/PEP
TABLE 1: INTERSECTION LEVEL OF SERVICE DEFINITIONS – ICU METHODOLOGY Level of
Service Description
Intersection Volume to Capacity (V/C)
Ratio
A
Excellent operation. All approaches to the intersection appear quite open, turning movements are easily made, and nearly all drivers find freedom of operation.
0.000‐0.600
B
Very good operation. Many drivers begin to feel somewhat restricted within platoons of vehicles. This represents stable flow. An approach to an intersection may occasionally be fully utilized and traffic queues start to form.
>0.600‐0.700
C
Good operation. Occasionally drivers may have to wait more than 60 seconds, and back‐ups may develop behind turning vehicles. Most drivers feel somewhat restricted.
>0.700‐0.800
D
Fair operation. Cars are sometimes required to wait more than 60 seconds during short peaks. There are no long‐standing traffic queues.
>0.800‐0.900
E
Poor operation. Some long‐standing vehicular queues develop on critical approaches to intersections. Delays may be up to several minutes.
>0.900‐1.000
F
Forced flow. Represents jammed conditions. Backups form locations downstream or on the cross street may restrict or prevent movement of vehicles out of the intersection approach lanes; therefore, volumes carried are not predictable. Potential for stop and go type traffic flow.
> 1.000
For intersections operated under Caltrans’ jurisdiction, analysis of traffic operations were conducted utilizing the Highway Capacity Manual (HCM) methodology for evaluation of intersection operating conditions. Table 2 presents a brief description of each level of service letter grade, as well as the range of HCM average intersection delay associated with each grade for signalized intersections.
TrafficImpactStudyDraftReport
8 Mt. SAC 2015 FMPU/PEP
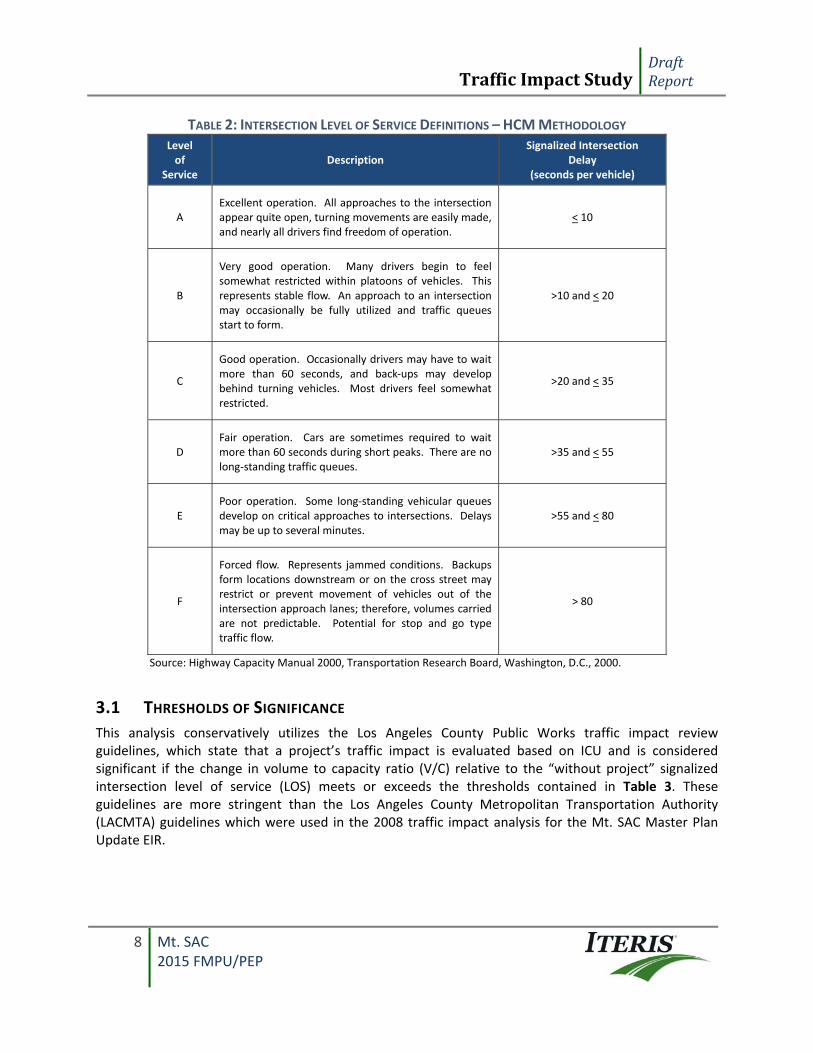
TABLE 2: INTERSECTION LEVEL OF SERVICE DEFINITIONS – HCM METHODOLOGY Level of
Service Description
Signalized Intersection Delay
(seconds per vehicle)
A
Excellent operation. All approaches to the intersection appear quite open, turning movements are easily made, and nearly all drivers find freedom of operation.
< 10
B
Very good operation. Many drivers begin to feel somewhat restricted within platoons of vehicles. This represents stable flow. An approach to an intersection may occasionally be fully utilized and traffic queues start to form.
>10 and < 20
C
Good operation. Occasionally drivers may have to wait more than 60 seconds, and back‐ups may develop behind turning vehicles. Most drivers feel somewhat restricted.
>20 and < 35
D
Fair operation. Cars are sometimes required to wait more than 60 seconds during short peaks. There are no long‐standing traffic queues.
>35 and < 55
E
Poor operation. Some long‐standing vehicular queues develop on critical approaches to intersections. Delays may be up to several minutes.
>55 and < 80
F
Forced flow. Represents jammed conditions. Backups form locations downstream or on the cross street may restrict or prevent movement of vehicles out of the intersection approach lanes; therefore, volumes carried are not predictable. Potential for stop and go type traffic flow.
> 80
Source: Highway Capacity Manual 2000, Transportation Research Board, Washington, D.C., 2000.
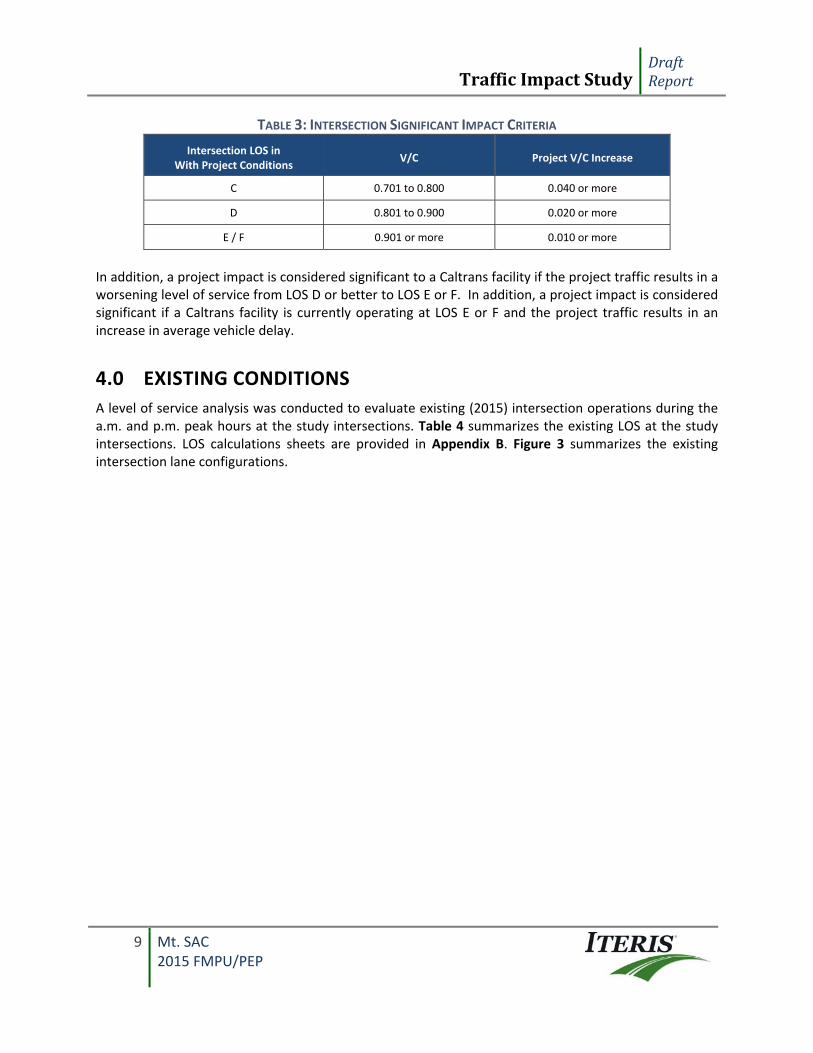
3.1 THRESHOLDS OF SIGNIFICANCE
This analysis conservatively utilizes the Los Angeles County Public Works traffic impact review guidelines, which state that a project’s traffic impact is evaluated based on ICU and is considered significant if the change in volume to capacity ratio (V/C) relative to the “without project” signalized intersection level of service (LOS) meets or exceeds the thresholds contained in Table 3. These guidelines are more stringent than the Los Angeles County Metropolitan Transportation Authority (LACMTA) guidelines which were used in the 2008 traffic impact analysis for the Mt. SAC Master Plan Update EIR.
TrafficImpactStudyDraftReport
9 Mt. SAC 2015 FMPU/PEP
TABLE 3: INTERSECTION SIGNIFICANT IMPACT CRITERIA
Intersection LOS in With Project Conditions
V/C Project V/C Increase
C 0.701 to 0.800 0.040 or more
D 0.801 to 0.900 0.020 or more
E / F 0.901 or more 0.010 or more
In addition, a project impact is considered significant to a Caltrans facility if the project traffic results in a worsening level of service from LOS D or better to LOS E or F. In addition, a project impact is considered significant if a Caltrans facility is currently operating at LOS E or F and the project traffic results in an increase in average vehicle delay.
4.0 EXISTING CONDITIONS
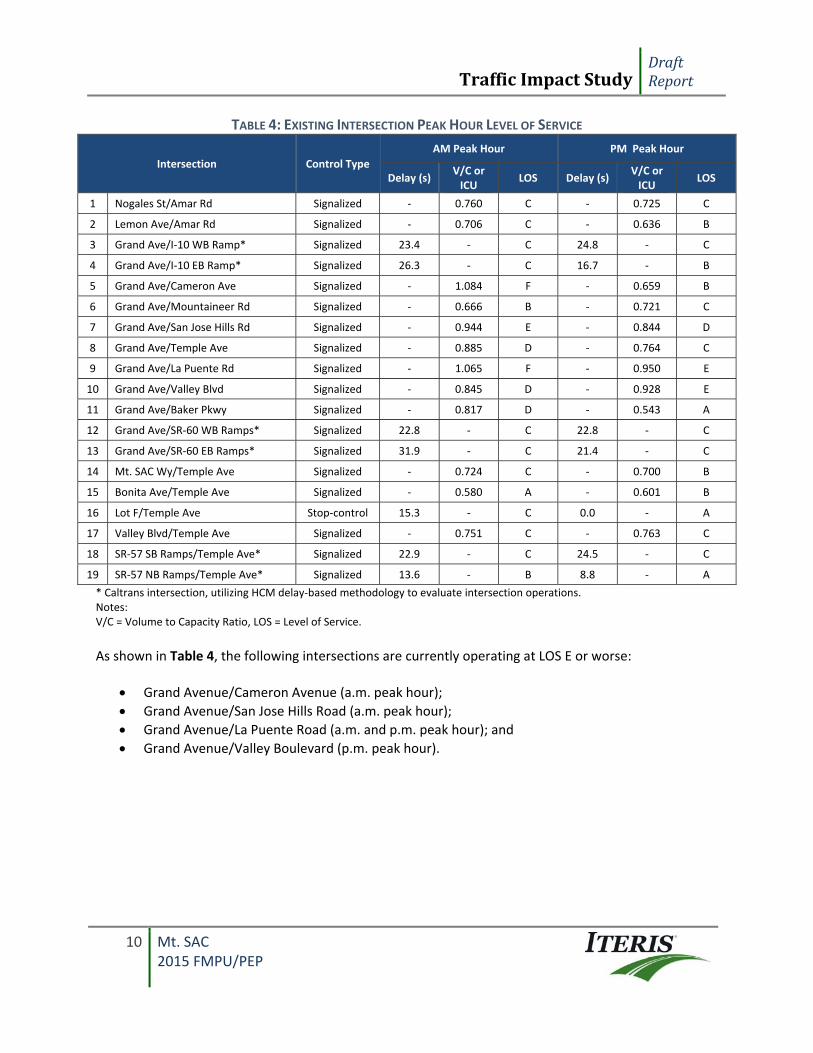
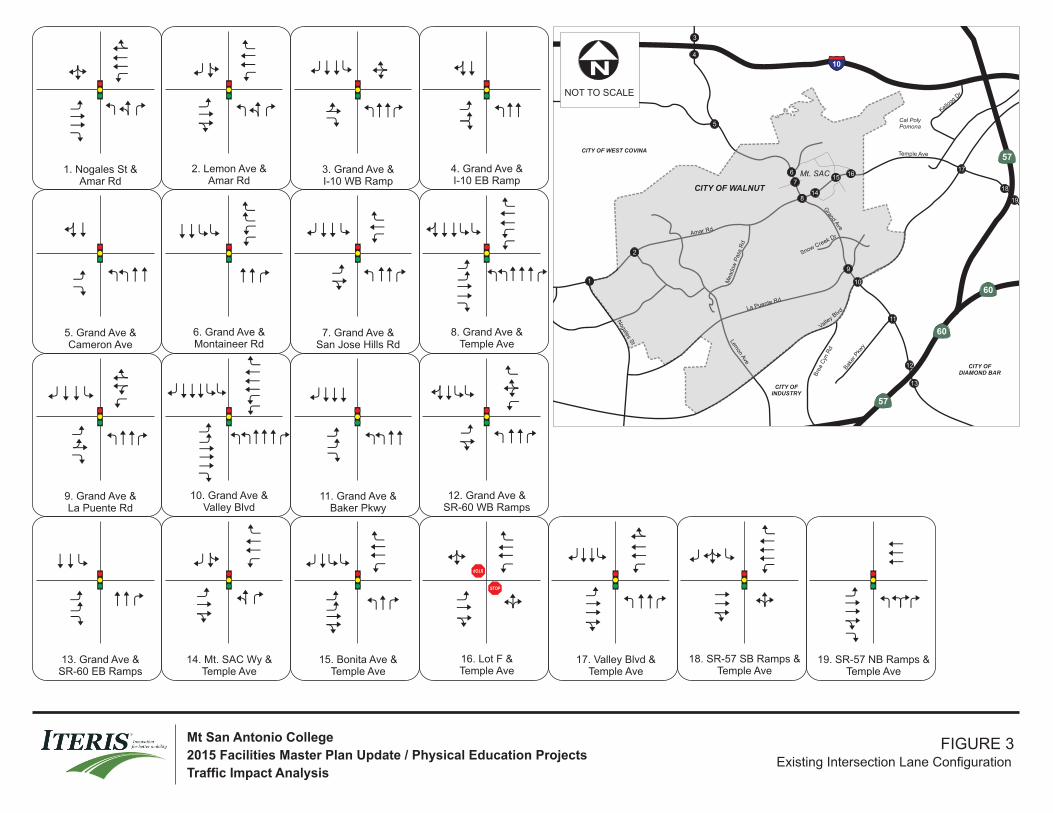
A level of service analysis was conducted to evaluate existing (2015) intersection operations during the a.m. and p.m. peak hours at the study intersections. Table 4 summarizes the existing LOS at the study intersections. LOS calculations sheets are provided in Appendix B. Figure 3 summarizes the existing intersection lane configurations.
TrafficImpactStudyDraftReport
10 Mt. SAC 2015 FMPU/PEP
TABLE 4: EXISTING INTERSECTION PEAK HOUR LEVEL OF SERVICE
Intersection Control Type
AM Peak Hour PM Peak Hour
Delay (s) V/C or ICU
LOS Delay (s) V/C or ICU
LOS
1 Nogales St/Amar Rd Signalized ‐ 0.760 C ‐ 0.725 C
2 Lemon Ave/Amar Rd Signalized ‐ 0.706 C ‐ 0.636 B
3 Grand Ave/I‐10 WB Ramp* Signalized 23.4 ‐ C 24.8 ‐ C
4 Grand Ave/I‐10 EB Ramp* Signalized 26.3 ‐ C 16.7 ‐ B
5 Grand Ave/Cameron Ave Signalized ‐ 1.084 F ‐ 0.659 B
6 Grand Ave/Mountaineer Rd Signalized ‐ 0.666 B ‐ 0.721 C
7 Grand Ave/San Jose Hills Rd Signalized ‐ 0.944 E ‐ 0.844 D
8 Grand Ave/Temple Ave Signalized ‐ 0.885 D ‐ 0.764 C
9 Grand Ave/La Puente Rd Signalized ‐ 1.065 F ‐ 0.950 E
10 Grand Ave/Valley Blvd Signalized ‐ 0.845 D ‐ 0.928 E
11 Grand Ave/Baker Pkwy Signalized ‐ 0.817 D ‐ 0.543 A
12 Grand Ave/SR‐60 WB Ramps* Signalized 22.8 ‐ C 22.8 ‐ C
13 Grand Ave/SR‐60 EB Ramps* Signalized 31.9 ‐ C 21.4 ‐ C
14 Mt. SAC Wy/Temple Ave Signalized ‐ 0.724 C ‐ 0.700 B
15 Bonita Ave/Temple Ave Signalized ‐ 0.580 A ‐ 0.601 B
16 Lot F/Temple Ave Stop‐control 15.3 ‐ C 0.0 ‐ A
17 Valley Blvd/Temple Ave Signalized ‐ 0.751 C ‐ 0.763 C
18 SR‐57 SB Ramps/Temple Ave* Signalized 22.9 ‐ C 24.5 ‐ C
19 SR‐57 NB Ramps/Temple Ave* Signalized 13.6 ‐ B 8.8 ‐ A
* Caltrans intersection, utilizing HCM delay‐based methodology to evaluate intersection operations. Notes: V/C = Volume to Capacity Ratio, LOS = Level of Service.
As shown in Table 4, the following intersections are currently operating at LOS E or worse:
Grand Avenue/Cameron Avenue (a.m. peak hour);
Grand Avenue/San Jose Hills Road (a.m. peak hour);
Grand Avenue/La Puente Road (a.m. and p.m. peak hour); and
Grand Avenue/Valley Boulevard (p.m. peak hour).
Lemon A
ve
Meadow
Pass
Rd
Temple Ave
Valley B
lvd
10
Bak
er P
kwy
Grand A
ve
Amar Rd
Nogales S
t
La Puente Rd
Bre
a C
yn R
d
Cal PolyPomona
Kellogg D
rCameron Ave
CITY OF WALNUT
57
60
57
60
CITY OF WEST COVINA
CITY OF INDUSTRY
CITY OF DIAMOND BAR
Snow Creek Dr
1
2
3
4
5
6
7
8
9
10
11
12
13
15
14
1617
18
19
Mt. SAC
NNOT TO SCALE
Legend
Study Intersection#
AM/PM Peak Hour VolumesXX/XX
FIGURE 3 Existing Intersection Lane Configuration
1. Nogales St &Amar Rd
2. Lemon Ave &Amar Rd
5. Grand Ave &Cameron Ave
6. Grand Ave &Montaineer Rd
9. Grand Ave &La Puente Rd
10. Grand Ave &Valley Blvd
15. Bonita Ave &Temple Ave
16. Lot F &Temple Ave
3. Grand Ave &I-10 WB Ramp
4. Grand Ave &I-10 EB Ramp
7. Grand Ave &San Jose Hills Rd
8. Grand Ave &Temple Ave
11. Grand Ave &Baker Pkwy
12. Grand Ave &SR-60 WB Ramps
17. Valley Blvd &Temple Ave
18. SR-57 SB Ramps &Temple Ave
14. Mt. SAC Wy &Temple Ave
13. Grand Ave &SR-60 EB Ramps
19. SR-57 NB Ramps &Temple Ave
Mt San Antonio College
2015 Facilities Master Plan Update / Physical Education Projects
Traffic Impact Analysis
STOP
STOP
TrafficImpactStudyDraftReport
12 Mt. SAC 2015 FMPU/PEP
5.0 PROPOSED PROJECT TRAFFIC
This section defines the traffic generated by the proposed buildout of the Facilities Master Plan project in a three‐step process including trip generation, trip distribution and trip assignment. The college has proposed a 2015 Facilities Master Plan Update. The major change from the 2012 FMP is the re‐design of the athletic facilities south of Temple Avenue and east of Bonita Avenue. The existing stadium will be demolished and a new stadium built on the site. Other changes for the 2015 FMPU include the relocation of the Public Transportation Center to Lot D3, and expanded Wildlife Sanctuary and Open Space area, and a pedestrian bridge across Temple Avenue connecting the Physical Education Complex to Lot F. The net increase in square footage at 2015 FMPU buildout is approximately 500,000 gross square feet.
5.1 PROJECT TRIP GENERATION
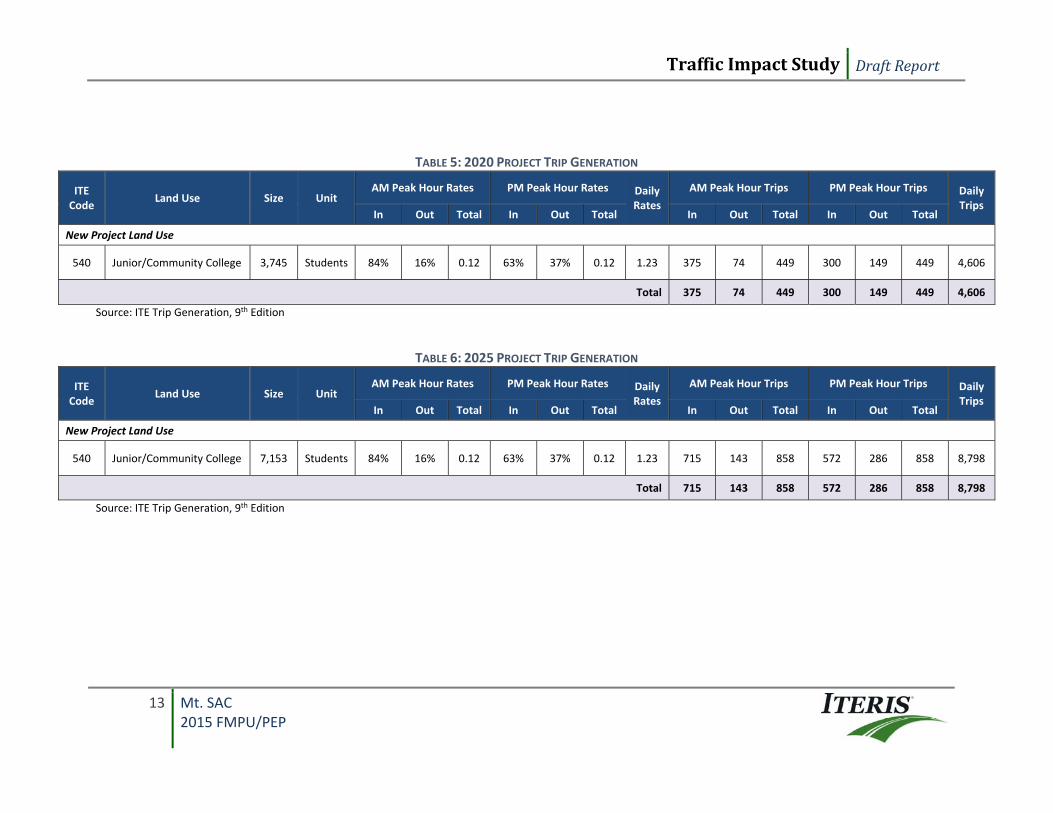
Trip generation rates for the proposed project were calculated based on those published in the Institute of Transportation Engineers (ITE), Trip Generation, 9th Edition. The land use category representing the proposed project was identified as Junior/Community College. The increase in traffic is based on student headcount. In year 2020, it is anticipated that an additional 3,745 students would be enrolled at the college. In year 2025, it is anticipated that an additional 7,153 students would be enrolled at the college when compared to existing conditions. The results of this calculation are shown for 2020 and 2025 in Tables 5 and 6, respectively. As shown in Table 5, the buildout of the 2015 FMPU project in 2020 is forecast to generate 449 new a.m. peak hour trips, 449 new p.m. peak hour trips, and 4,606 new daily trips when compared to existing conditions. As shown in Table 6, by 2025 the project is forecast to generate 858 new a.m. peak hour trips, 858 new p.m. peak hour trips, and 8,798 new daily trips when compared to existing conditions.
TrafficImpactStudy DraftReport
13 Mt. SAC 2015 FMPU/PEP
TABLE 5: 2020 PROJECT TRIP GENERATION
ITE Code
Land Use Size Unit AM Peak Hour Rates PM Peak Hour Rates Daily
Rates
AM Peak Hour Trips PM Peak Hour Trips Daily Trips
In Out Total In Out Total In Out Total In Out Total
New Project Land Use
540 Junior/Community College 3,745 Students 84% 16% 0.12 63% 37% 0.12 1.23 375 74 449 300 149 449 4,606
Total 375 74 449 300 149 449 4,606
Source: ITE Trip Generation, 9th Edition
TABLE 6: 2025 PROJECT TRIP GENERATION
ITE Code
Land Use Size Unit AM Peak Hour Rates PM Peak Hour Rates Daily
Rates
AM Peak Hour Trips PM Peak Hour Trips Daily Trips
In Out Total In Out Total In Out Total In Out Total
New Project Land Use
540 Junior/Community College 7,153 Students 84% 16% 0.12 63% 37% 0.12 1.23 715 143 858 572 286 858 8,798
Total 715 143 858 572 286 858 8,798
Source: ITE Trip Generation, 9th Edition
TrafficImpactStudyDraftReport
14 Mt. SAC 2015 FMPU/PEP
5.2 PROJECT TRIP DISTRIBUTION
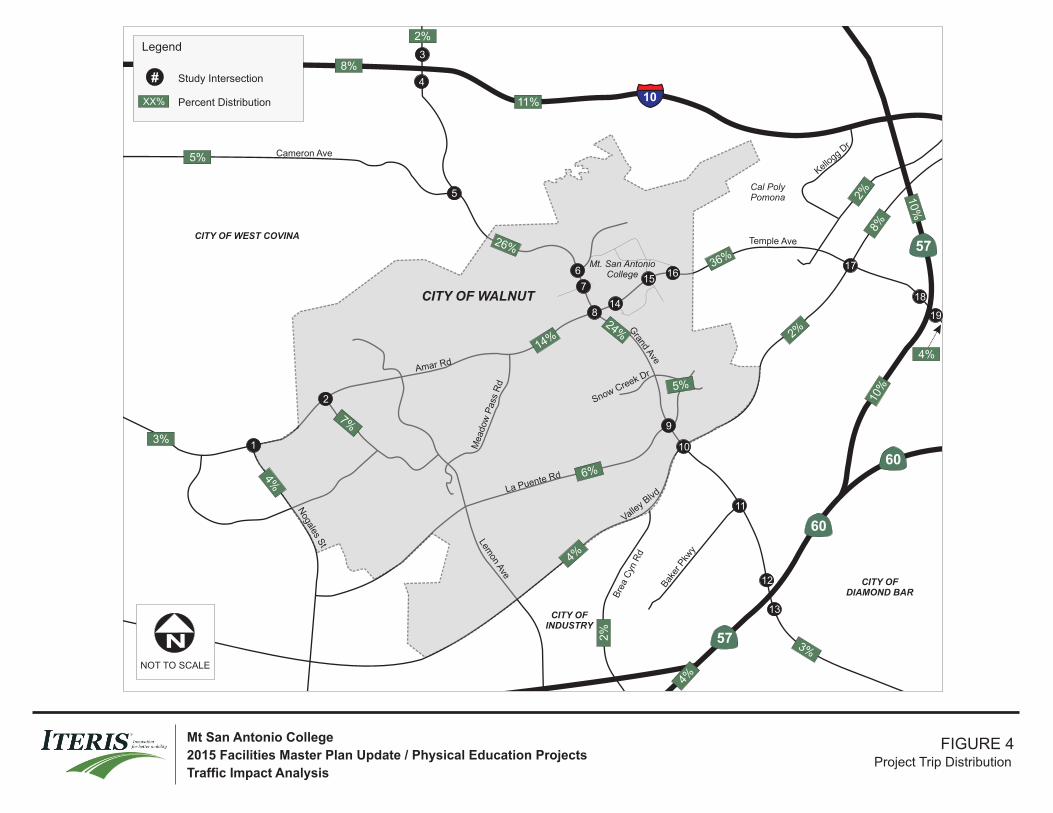
Trip distribution assumptions are used to determine the origin and destination of new vehicle trips associated with the project. The geographic distribution of project trips is based on the locations of local activity centers and the street system that serves the site. The trip distribution routes utilized in this analysis were determined based on the patterns of existing campus traffic and the distribution of student residences provided by Mt SAC. The distribution pattern developed for the project is shown in Figure 4.
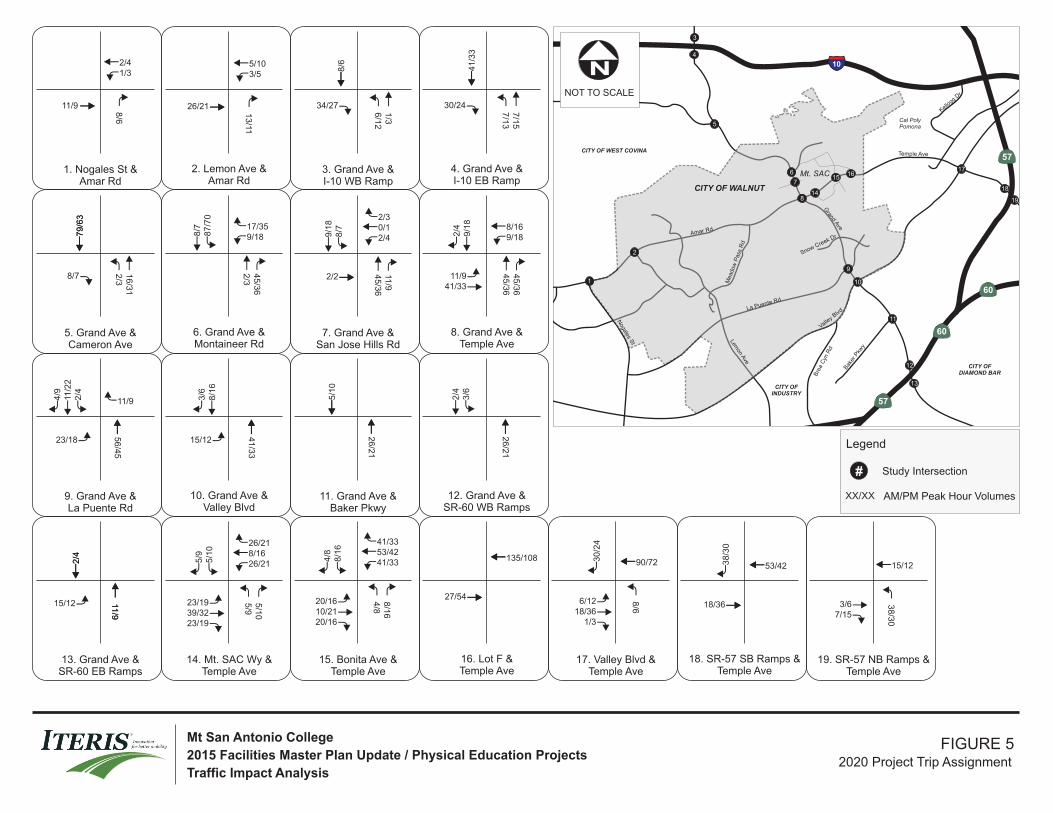
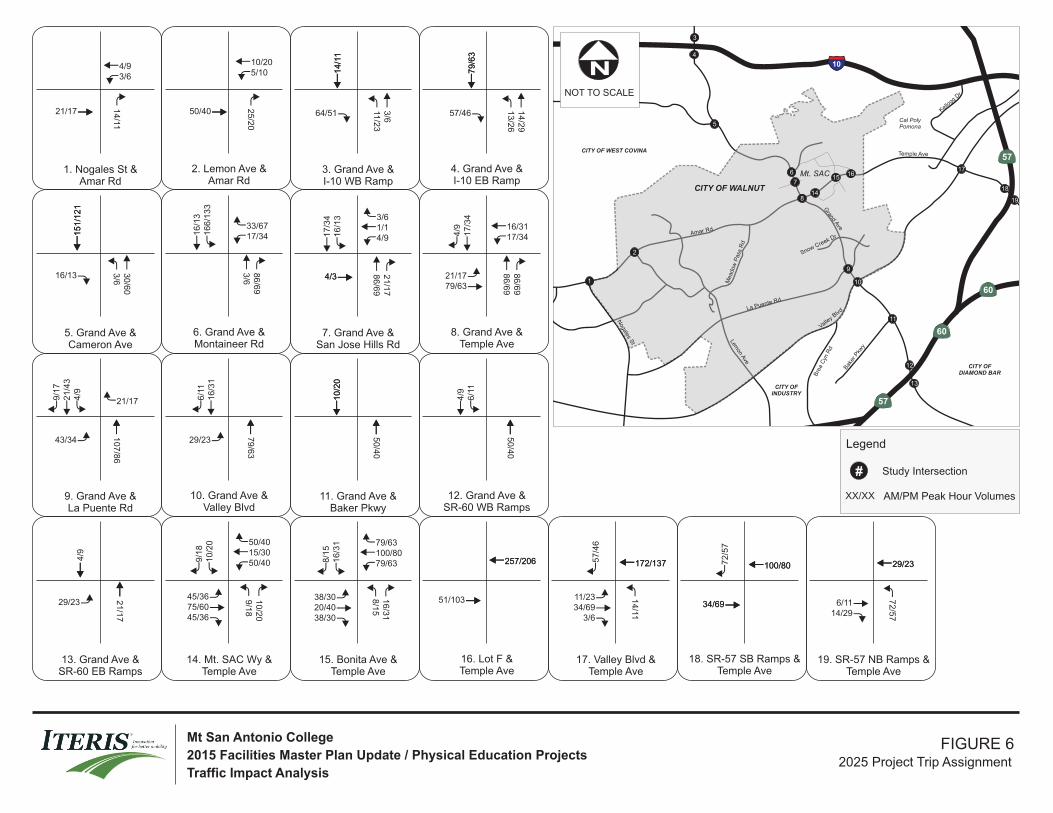
5.3 PROJECT TRIP ASSIGNMENT
Trips generated by the project, as shown in Tables 5 and 6, were assigned to the surrounding roadway system based on the distribution patterns to estimate the project‐related peak‐hour traffic at each of the study intersections. The project trips were assigned based on distribution inputs to the TRAFFIX network. Figure 5 illustrates the a.m. and p.m. peak hour 2020 project trip assignment. Figure 6 illustrates the a.m. and p.m. peak hour 2025 project trip assignment.
Legend
Study Corridor
NNOT TO SCALE
Sphere of Influence Intersection
Legend
Study Intersection#
Study Roadway Segment
Project Site
#
Percent DistributionXX%
FIGURE 4 Project Trip Distribution
Mt San Antonio College
2015 Facilities Master Plan Update / Physical Education Projects
Traffic Impact Analysis
Lemon A
ve
Meadow
Pass
Rd
Temple Ave
Valley B
lvd
10
Bak
er P
kwy
Grand A
ve
Amar Rd
Nogales S
t
La Puente Rd
Bre
a C
yn R
d
Cal PolyPomona
Mt. San AntonioCollege
Kellogg D
rCameron Ave
CITY OF WALNUT
57
60
57
60
CITY OF WEST COVINA
CITY OF INDUSTRY
CITY OF DIAMOND BAR
Snow Creek Dr
1
2
3
4
5
6
7
8
9
10
11
12
13
15
14
1617
18
19
5%
3%
10%
8%
2%
4%
11%
7%
24%
4%
8%
6%
2%
2%
4%
3%
4%
2%
10%
36%
14%
26%
5%
Lemon A
ve
Meadow
Pass
Rd
Temple Ave
Valley B
lvd
10
Bak
er P
kwy
Grand A
ve
Amar Rd
Nogales S
t
La Puente Rd
Bre
a C
yn R
d
Cal PolyPomona
Kellogg D
rCameron Ave
CITY OF WALNUT
57
60
57
60
CITY OF WEST COVINA
CITY OF INDUSTRY
CITY OF DIAMOND BAR
Snow Creek Dr
1
2
3
4
5
6
7
8
9
10
11
12
13
15
14
1617
18
19
Mt. SAC
NNOT TO SCALE
Legend
Study Intersection#
AM/PM Peak Hour VolumesXX/XX
FIGURE 52020 Project Trip Assignment
Mt San Antonio College
2015 Facilities Master Plan Update / Physical Education Projects
Traffic Impact Analysis
8/6
11/9
1/32/4
13
/11
26/21
3/55/10
6/1
21
/3
8/6
34/27 7/1
37
/15
41
/33
30/24
2/3
16
/31
79
/63
79
/63
8/7
2/3
45
/36
87
/70
8/7
9/1817/35
45
/36
11/9
8/7
9/1
8
2/2
2/40/12/3
45
/36
45
/36
9/1
82
/4
11/941/33
9/188/16
56
/45
2/4
11/2
24
/9
23/18
11/9
41
/33
8/1
63
/6
15/12
26
/21
5/1
0
26
/21
3/6
2/4
11/9
11/9
2/4
2/4
15/12 5/9
5/1
0
5/1
05/9
23/1939/3223/19
26/218/1626/21
4/8
8/1
6
8/1
64/8
20/1610/2120/16
41/3353/4241/33
27/54
135/108
8/6
30/2
46/12
18/361/3
90/72 38/3
0
18/36
53/42
38
/30
3/67/15
15/12
1. Nogales St &Amar Rd
2. Lemon Ave &Amar Rd
5. Grand Ave &Cameron Ave
6. Grand Ave &Montaineer Rd
9. Grand Ave &La Puente Rd
10. Grand Ave &Valley Blvd
15. Bonita Ave &Temple Ave
16. Lot F &Temple Ave
3. Grand Ave &I-10 WB Ramp
4. Grand Ave &I-10 EB Ramp
7. Grand Ave &San Jose Hills Rd
8. Grand Ave &Temple Ave
11. Grand Ave &Baker Pkwy
12. Grand Ave &SR-60 WB Ramps
17. Valley Blvd &Temple Ave
18. SR-57 SB Ramps &Temple Ave
14. Mt. SAC Wy &Temple Ave
13. Grand Ave &SR-60 EB Ramps
19. SR-57 NB Ramps &Temple Ave
Lemon A
ve
Meadow
Pass
Rd
Temple Ave
Valley B
lvd
10
Bak
er P
kwy
Grand A
ve
Amar Rd
Nogales S
t
La Puente Rd
Bre
a C
yn R
d
Cal PolyPomona
Kellogg D
rCameron Ave
CITY OF WALNUT
57
60
57
60
CITY OF WEST COVINA
CITY OF INDUSTRY
CITY OF DIAMOND BAR
Snow Creek Dr
1
2
3
4
5
6
7
8
9
10
11
12
13
15
14
1617
18
19
Mt. SAC
NNOT TO SCALE
Legend
Study Intersection#
AM/PM Peak Hour VolumesXX/XX
FIGURE 6 2025 Project Trip Assignment
Mt San Antonio College
2015 Facilities Master Plan Update / Physical Education Projects
Traffic Impact Analysis
14
/11
21/17
3/64/9
25
/20
50/40
5/1010/20
11/2
33
/6
14
/11
14
/11
64/51
13
/26
14
/29
79
/63
79
/63
57/46
3/6
30
/60
15
1/1
21
15
1/1
21
16/13
3/6
86
/69
16
6/1
33
16
/13
17/3433/67
86
/69
21
/17
16
/13
17
/34
4/34/3
4/91/13/6
86
/69
86
/69
17
/34
4/9
21/1779/63
17/3416/31
10
7/8
6
4/9
21
/43
9/1
7
43/34
21/17
79
/63
16
/31
6/1
1
29/23
50
/40
10
/20
10
/20
50
/40
6/1
14
/9
21/1
7
4/9
29/23
9/1
810/2
0
10/2
09/1
8
45/3675/6045/36
50/4015/3050/40
8/1
51
6/3
1
16/3
18/1
5
38/3020/4038/30
79/63100/8079/63
51/103
257/206257/206
14/11
57/4
611/2334/69
3/6
172/137172/137 72/5
7
34/6934/69
100/80100/80
72/5
7
6/1114/29
29/2329/23
1. Nogales St &Amar Rd
2. Lemon Ave &Amar Rd
5. Grand Ave &Cameron Ave
6. Grand Ave &Montaineer Rd
9. Grand Ave &La Puente Rd
10. Grand Ave &Valley Blvd
15. Bonita Ave &Temple Ave
16. Lot F &Temple Ave
3. Grand Ave &I-10 WB Ramp
4. Grand Ave &I-10 EB Ramp
7. Grand Ave &San Jose Hills Rd
8. Grand Ave &Temple Ave
11. Grand Ave &Baker Pkwy
12. Grand Ave &SR-60 WB Ramps
17. Valley Blvd &Temple Ave
18. SR-57 SB Ramps &Temple Ave
14. Mt. SAC Wy &Temple Ave
13. Grand Ave &SR-60 EB Ramps
19. SR-57 NB Ramps &Temple Ave
TrafficImpactStudyDraftReport
18 Mt. SAC 2015 FMPU/PEP
6.0 EXISTING PLUS 2020 PROJECT CONDITIONS
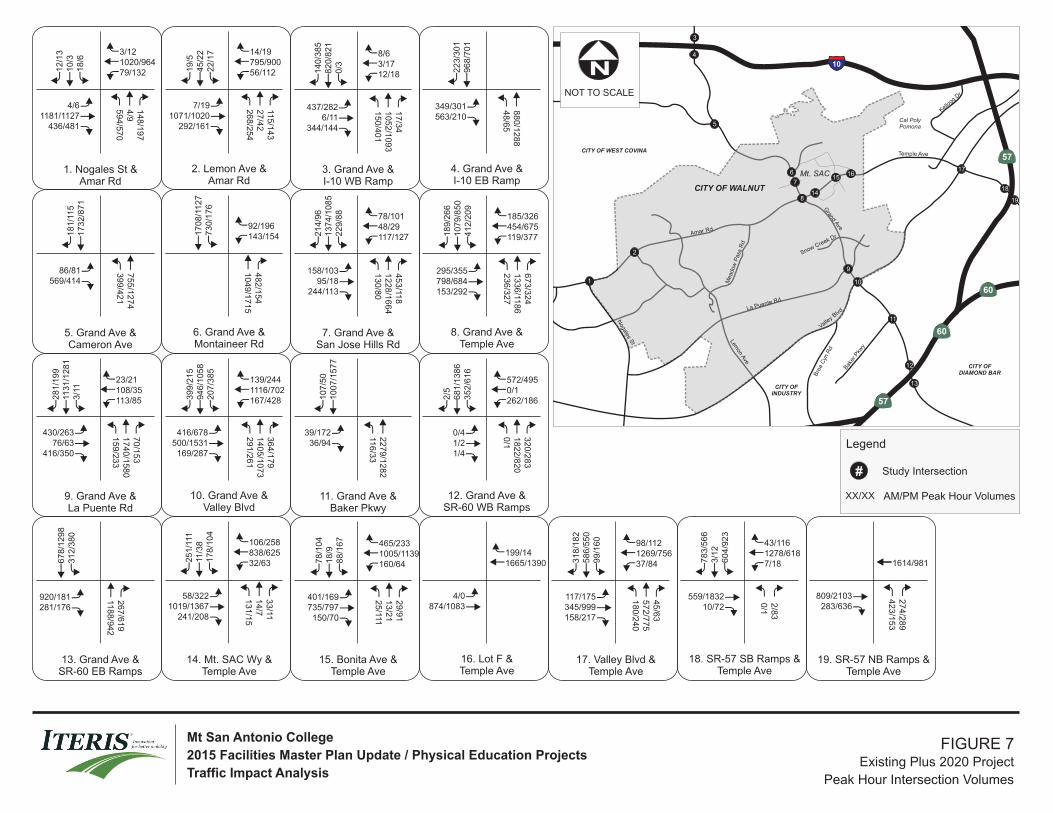
The official buildout date of the 2015 FMPU and of the PEP is 2020. Existing plus 2020 project conditions were developed by adding trips generated by the proposed 2020 project buildout to the existing volumes. Figure 7 illustrates the existing plus 2020 project traffic volumes at the study intersections.
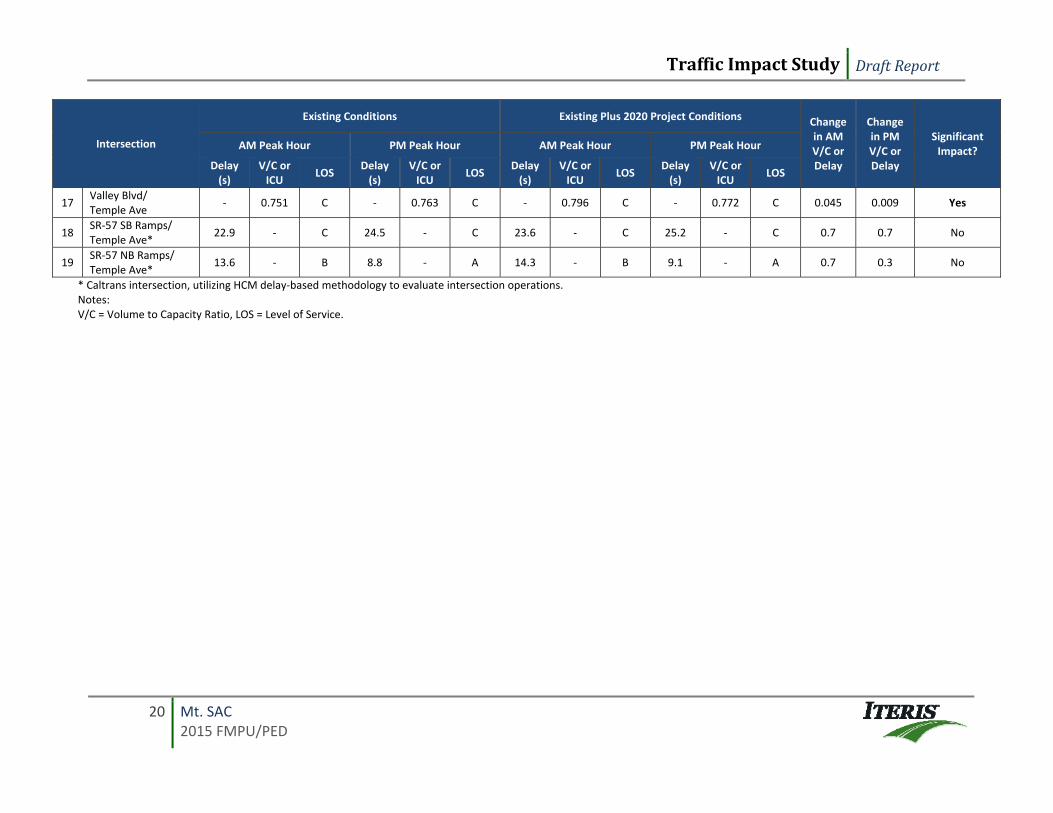
6.1 EXISTING PLUS 2020 PROJECT INTERSECTION LEVELS OF SERVICE
A level of service analysis was conducted to evaluate existing plus 2020 project intersection operations during the a.m. and p.m. peak hours at the study intersections. Table 7 summarizes the existing plus 2020 project level of service at the study intersections. Level of service calculation worksheets are included in Appendix B.

TrafficImpactStudy DraftReport
19 Mt. SAC 2015 FMPU/PED
TABLE 7: EXISTING PLUS 2020 PROJECT INTERSECTION PEAK HOUR LEVEL OF SERVICE
Intersection
Existing Conditions Existing Plus 2020 Project Conditions Change in AM V/C or Delay
Change in PM V/C or Delay
Significant Impact? AM Peak Hour PM Peak Hour AM Peak Hour PM Peak Hour
Delay (s)
V/C or ICU
LOS Delay (s)
V/C or ICU
LOS Delay (s)
V/C or ICU
LOS Delay (s)
V/C or ICU
LOS
1 Nogales St/ Amar Rd
‐ 0.760 C ‐ 0.725 C ‐ 0.764 C ‐ 0.730 C 0.004 0.005 No
2 Lemon Ave/ Amar Rd
‐ 0.706 C ‐ 0.636 B ‐ 0.716 C ‐ 0.646 B 0.010 0.010 No
3 Grand Ave/ I‐10 WB Ramp*
23.4 ‐ C 24.8 ‐ C 23.5 ‐ C 25.1 ‐ C 0.1 0.3 No
4 Grand Ave/ I‐10 EB Ramp*
26.3 ‐ C 16.7 ‐ B 28.0 ‐ C 18.0 ‐ B 1.7 1.3 No
5 Grand Ave/ Cameron Ave
‐ 1.084 F ‐ 0.659 B ‐ 1.116 F ‐ 0.685 B 0.032 0.026 Yes
6 Grand Ave/ Mountaineer Rd
‐ 0.666 B ‐ 0.721 C ‐ 0.698 B ‐ 0.751 C 0.032 0.030 No
7 Grand Ave/ San Jose Hills Rd
‐ 0.944 E ‐ 0.844 D ‐ 0.967 E ‐ 0.865 D 0.023 0.021 Yes
8 Grand Ave/ Temple Ave
‐ 0.885 D ‐ 0.764 C ‐ 0.928 E ‐ 0.785 C 0.043 0.021 Yes
9 Grand Ave/ La Puente Rd
‐ 1.065 F ‐ 0.950 E ‐ 1.089 F ‐ 0.960 E 0.024 0.010 Yes
10 Grand Ave/ Valley Blvd
‐ 0.845 D ‐ 0.928 E ‐ 0.859 D ‐ 0.935 E 0.014 0.007 No
11 Grand Ave/ Baker Pkwy
‐ 0.817 D ‐ 0.543 A ‐ 0.826 D ‐ 0.550 A 0.009 0.007 No
12 Grand Ave/ SR‐60 WB Ramps*
22.8 ‐ C 22.8 ‐ C 23.1 ‐ C 22.9 ‐ C 0.3 0.1 No
13 Grand Ave/ SR‐60 EB Ramps*
31.9 ‐ C 21.4 ‐ C 32.4 ‐ C 21.4 ‐ C 0.5 0 No
14 Mt. SAC Wy/ Temple Ave
‐ 0.724 C ‐ 0.700 B ‐ 0.752 C ‐ 0.741 C 0.028 0.041 Yes
15 Bonita Ave/ Temple Ave
‐ 0.580 A ‐ 0.601 B ‐ 0.618 B ‐ 0.635 B 0.038 0.034 No
16 Lot F/ Temple Ave
15.3 ‐ C 0.0 ‐ A 16.7 ‐ C 0.0 ‐ A 1.4 0.0 No
TrafficImpactStudy DraftReport
20 Mt. SAC 2015 FMPU/PED
Intersection
Existing Conditions Existing Plus 2020 Project Conditions Change in AM V/C or Delay
Change in PM V/C or Delay
Significant Impact? AM Peak Hour PM Peak Hour AM Peak Hour PM Peak Hour
Delay (s)
V/C or ICU
LOS Delay (s)
V/C or ICU
LOS Delay (s)
V/C or ICU
LOS Delay (s)
V/C or ICU
LOS
17 Valley Blvd/ Temple Ave
‐ 0.751 C ‐ 0.763 C ‐ 0.796 C ‐ 0.772 C 0.045 0.009 Yes
18 SR‐57 SB Ramps/ Temple Ave*
22.9 ‐ C 24.5 ‐ C 23.6 ‐ C 25.2 ‐ C 0.7 0.7 No
19 SR‐57 NB Ramps/ Temple Ave*
13.6 ‐ B 8.8 ‐ A 14.3 ‐ B 9.1 ‐ A 0.7 0.3 No
* Caltrans intersection, utilizing HCM delay‐based methodology to evaluate intersection operations. Notes: V/C = Volume to Capacity Ratio, LOS = Level of Service.
Lemon A
ve
Meadow
Pass
Rd
Temple Ave
Valley B
lvd
10
Bak
er P
kwy
Grand A
ve
Amar Rd
Nogales S
t
La Puente Rd
Bre
a C
yn R
d
Cal PolyPomona
Kellogg D
rCameron Ave
CITY OF WALNUT
57
60
57
60
CITY OF WEST COVINA
CITY OF INDUSTRY
CITY OF DIAMOND BAR
Snow Creek Dr
1
2
3
4
5
6
7
8
9
10
11
12
13
15
14
1617
18
19
Mt. SAC
NNOT TO SCALE
Legend
Study Intersection#
AM/PM Peak Hour VolumesXX/XX
FIGURE 7 Existing Plus 2020 Project
Peak Hour Intersection Volumes
Mt San Antonio College
2015 Facilities Master Plan Update / Physical Education Projects
Traffic Impact Analysis
59
4/5
70
4/9
14
8/1
97
18
/61
0/3
12
/13
4/61181/1127
436/481
79/1321020/9643/12
26
8/2
54
27
/42
115
/14
3
22
/17
45
/22
19
/5
7/191071/1020
292/161
56/112795/90014/19
15
0/4
01
10
52
/10
93
17
/34
0/3
82
0/8
21
14
0/3
85
437/2826/11
344/144
12/183/178/6
48
/65
88
0/1
28
8
96
8/7
01
22
3/3
01
349/301563/210
39
9/4
21
75
5/1
27
4
17
32
/87
11
81
/11
5
86/81569/414
10
49
/17
15
48
2/1
54
73
0/1
76
17
08
/11
27
143/15492/196
13
0/8
01
22
8/1
66
44
53
/118
22
9/8
81
37
4/1
08
52
14
/96
158/10395/18
244/113
117/12748/2978/101
23
6/3
27
13
36
/118
66
73
/32
4
41
2/2
09
10
79
/85
01
89
/26
6
295/355798/684153/292
119/377454/675185/326
15
9/2
33
17
40
/15
80
70
/15
3
3/1
111
31
/12
81
28
1/1
99
430/26376/63
416/350
113/85108/3523/21
29
1/2
61
14
05
/10
73
36
4/1
79
20
7/3
85
94
6/1
05
83
99
/21
5
416/678500/1531
169/287
167/4281116/702139/244
116
/33
22
79
/12
82
10
07
/15
77
10
7/5
0
39/17236/94
0/1
18
22
/82
03
20
/28
3
35
2/6
16
68
1/1
38
62
/5
0/41/21/4
262/1860/1572/495
118
8/9
42
267
/619
312/3
80
678/1
298
920/181281/176
13
1/1
51
4/7
33
/11
178/1
04
11/3
8251/1
11
58/3221019/1367
241/208
32/63838/625106/258
25/111
13/2
129/9
1
88/1
67
18/9
78/1
04
401/169735/797
150/70
160/641005/1139465/233
4/0874/1083
1665/1390199/14
18
0/2
40
57
2/7
75
45
/63
99/1
60
586/5
50
318/1
82
117/175345/999158/217
37/841269/75698/112
0/1
2/8
3
604/9
23
3/1
2783/5
66
559/183210/72
7/181278/61843/116
423
/153
274
/289
809/2103283/636
1614/981
1. Nogales St &Amar Rd
2. Lemon Ave &Amar Rd
5. Grand Ave &Cameron Ave
6. Grand Ave &Montaineer Rd
9. Grand Ave &La Puente Rd
10. Grand Ave &Valley Blvd
15. Bonita Ave &Temple Ave
16. Lot F &Temple Ave
3. Grand Ave &I-10 WB Ramp
4. Grand Ave &I-10 EB Ramp
7. Grand Ave &San Jose Hills Rd
8. Grand Ave &Temple Ave
11. Grand Ave &Baker Pkwy
12. Grand Ave &SR-60 WB Ramps
17. Valley Blvd &Temple Ave
18. SR-57 SB Ramps &Temple Ave
14. Mt. SAC Wy &Temple Ave
13. Grand Ave &SR-60 EB Ramps
19. SR-57 NB Ramps &Temple Ave
TrafficImpactStudyDraftReport
22 Mt. SAC 2015 FMPU/PEP
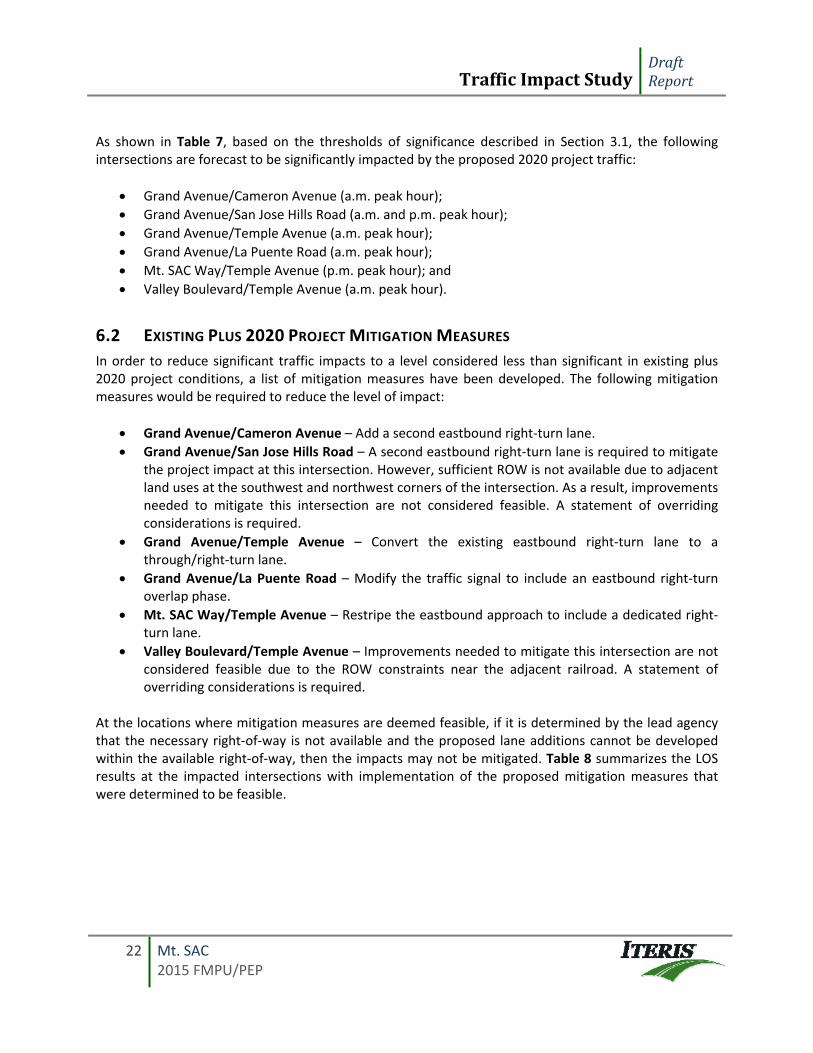
As shown in Table 7, based on the thresholds of significance described in Section 3.1, the following intersections are forecast to be significantly impacted by the proposed 2020 project traffic:
Grand Avenue/Cameron Avenue (a.m. peak hour);
Grand Avenue/San Jose Hills Road (a.m. and p.m. peak hour);
Grand Avenue/Temple Avenue (a.m. peak hour);
Grand Avenue/La Puente Road (a.m. peak hour);
Mt. SAC Way/Temple Avenue (p.m. peak hour); and
Valley Boulevard/Temple Avenue (a.m. peak hour).
6.2 EXISTING PLUS 2020 PROJECT MITIGATION MEASURES
In order to reduce significant traffic impacts to a level considered less than significant in existing plus 2020 project conditions, a list of mitigation measures have been developed. The following mitigation measures would be required to reduce the level of impact:
Grand Avenue/Cameron Avenue – Add a second eastbound right‐turn lane.
Grand Avenue/San Jose Hills Road – A second eastbound right‐turn lane is required to mitigate the project impact at this intersection. However, sufficient ROW is not available due to adjacent land uses at the southwest and northwest corners of the intersection. As a result, improvements needed to mitigate this intersection are not considered feasible. A statement of overriding considerations is required.
Grand Avenue/Temple Avenue – Convert the existing eastbound right‐turn lane to a through/right‐turn lane.
Grand Avenue/La Puente Road – Modify the traffic signal to include an eastbound right‐turn overlap phase.
Mt. SAC Way/Temple Avenue – Restripe the eastbound approach to include a dedicated right‐turn lane.
Valley Boulevard/Temple Avenue – Improvements needed to mitigate this intersection are not considered feasible due to the ROW constraints near the adjacent railroad. A statement of overriding considerations is required.
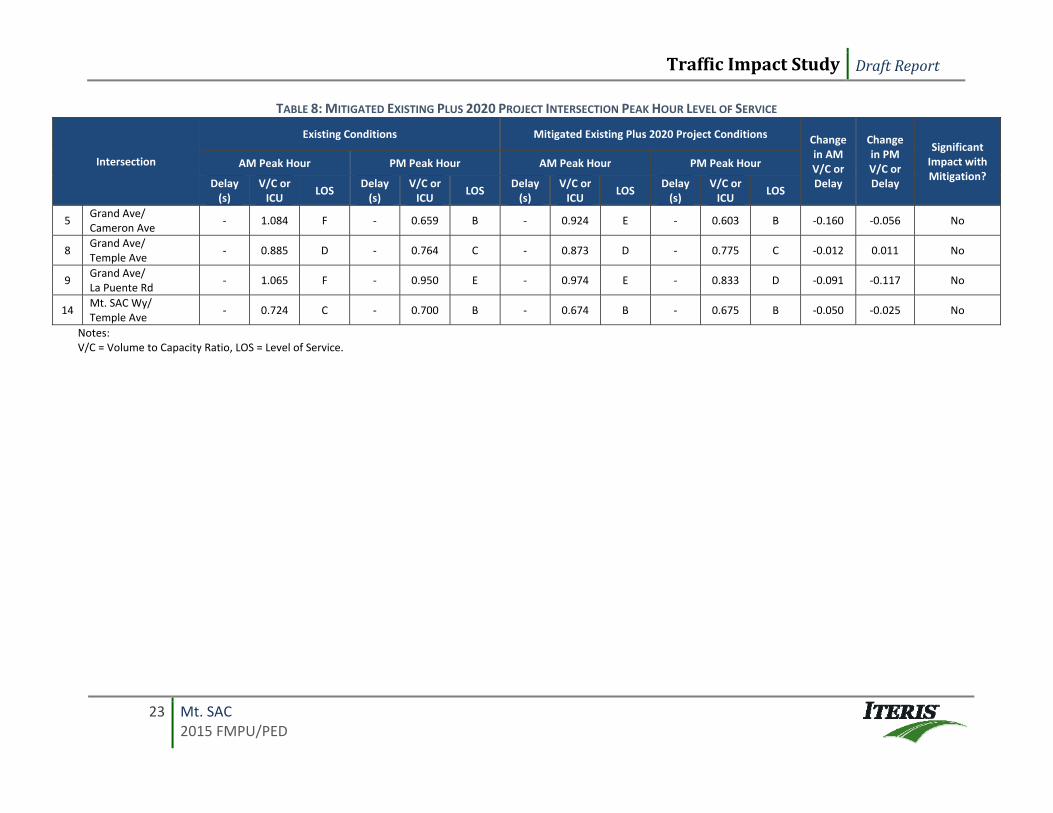
At the locations where mitigation measures are deemed feasible, if it is determined by the lead agency that the necessary right‐of‐way is not available and the proposed lane additions cannot be developed within the available right‐of‐way, then the impacts may not be mitigated. Table 8 summarizes the LOS results at the impacted intersections with implementation of the proposed mitigation measures that were determined to be feasible.
TrafficImpactStudy DraftReport
23 Mt. SAC 2015 FMPU/PED
TABLE 8: MITIGATED EXISTING PLUS 2020 PROJECT INTERSECTION PEAK HOUR LEVEL OF SERVICE
Intersection
Existing Conditions Mitigated Existing Plus 2020 Project Conditions Change in AM V/C or Delay
Change in PM V/C or Delay
Significant Impact with Mitigation?
AM Peak Hour PM Peak Hour AM Peak Hour PM Peak Hour
Delay (s)
V/C or ICU
LOS Delay (s)
V/C or ICU
LOS Delay (s)
V/C or ICU
LOS Delay (s)
V/C or ICU
LOS
5 Grand Ave/ Cameron Ave
‐ 1.084 F ‐ 0.659 B ‐ 0.924 E ‐ 0.603 B ‐0.160 ‐0.056 No
8 Grand Ave/ Temple Ave
‐ 0.885 D ‐ 0.764 C ‐ 0.873 D ‐ 0.775 C ‐0.012 0.011 No
9 Grand Ave/ La Puente Rd
‐ 1.065 F ‐ 0.950 E ‐ 0.974 E ‐ 0.833 D ‐0.091 ‐0.117 No
14 Mt. SAC Wy/ Temple Ave
‐ 0.724 C ‐ 0.700 B ‐ 0.674 B ‐ 0.675 B ‐0.050 ‐0.025 No
Notes: V/C = Volume to Capacity Ratio, LOS = Level of Service.
TrafficImpactStudyDraftReport
24 Mt. SAC 2015 FMPU/PEP
As shown in Table 8, at locations where improvements were considered feasible, project impacts are reduced to less than significant at four intersections.
7.0 EXISTING PLUS 2025 PROJECT CONDITIONS
A year 2025 scenario is included in this analysis in order to coincide with the City and County General Plans. Existing plus 2025 project conditions were developed by adding trips generated by the proposed 2025 project to the existing volumes. Figure 8 illustrates the existing plus 2025 project traffic volumes at the study intersections.
7.1 EXISTING PLUS 2025 PROJECT INTERSECTION LEVELS OF SERVICE
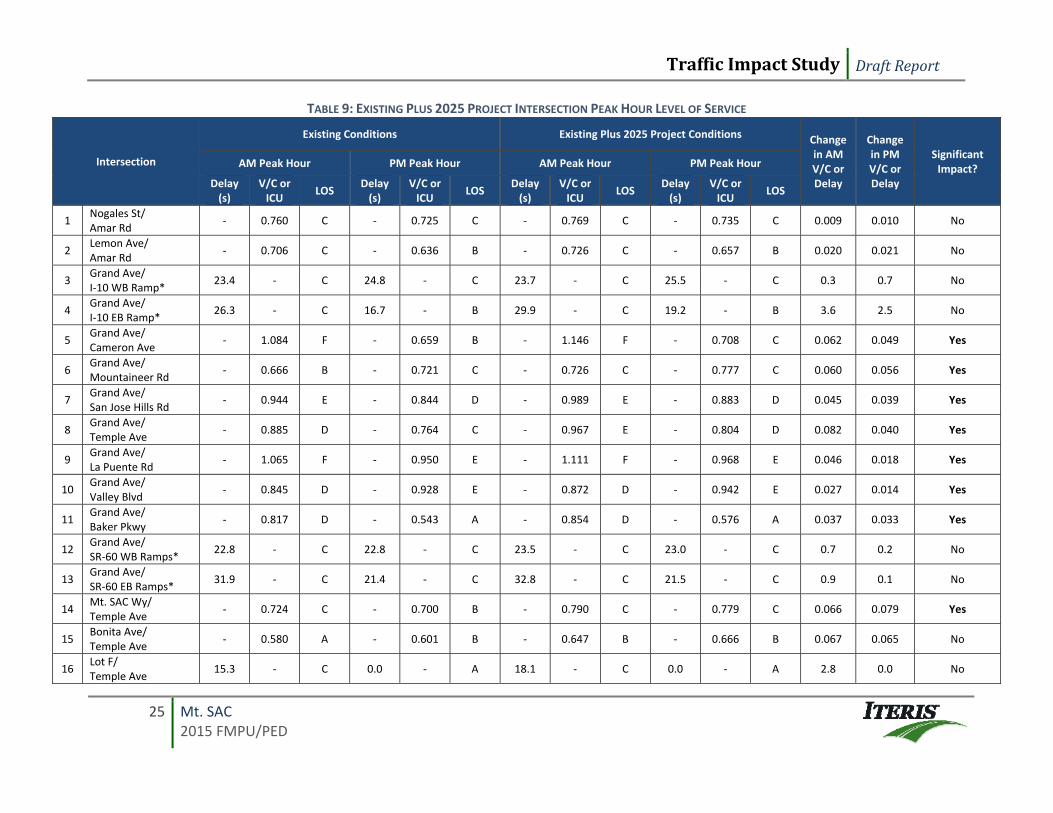
A level of service analysis was conducted to evaluate existing plus 2025 project intersection operations during the a.m. and p.m. peak hours at the study intersections. Table 9 summarizes the existing plus 2025 project level of service at the study intersections. Level of service calculation worksheets are included in Appendix B.
TrafficImpactStudy DraftReport
25 Mt. SAC 2015 FMPU/PED
TABLE 9: EXISTING PLUS 2025 PROJECT INTERSECTION PEAK HOUR LEVEL OF SERVICE
Intersection
Existing Conditions Existing Plus 2025 Project Conditions Change in AM V/C or Delay
Change in PM V/C or Delay
Significant Impact? AM Peak Hour PM Peak Hour AM Peak Hour PM Peak Hour
Delay (s)
V/C or ICU
LOS Delay (s)
V/C or ICU
LOS Delay (s)
V/C or ICU
LOS Delay (s)
V/C or ICU
LOS
1 Nogales St/ Amar Rd
‐ 0.760 C ‐ 0.725 C ‐ 0.769 C ‐ 0.735 C 0.009 0.010 No
2 Lemon Ave/ Amar Rd
‐ 0.706 C ‐ 0.636 B ‐ 0.726 C ‐ 0.657 B 0.020 0.021 No
3 Grand Ave/ I‐10 WB Ramp*
23.4 ‐ C 24.8 ‐ C 23.7 ‐ C 25.5 ‐ C 0.3 0.7 No
4 Grand Ave/ I‐10 EB Ramp*
26.3 ‐ C 16.7 ‐ B 29.9 ‐ C 19.2 ‐ B 3.6 2.5 No
5 Grand Ave/ Cameron Ave
‐ 1.084 F ‐ 0.659 B ‐ 1.146 F ‐ 0.708 C 0.062 0.049 Yes
6 Grand Ave/ Mountaineer Rd
‐ 0.666 B ‐ 0.721 C ‐ 0.726 C ‐ 0.777 C 0.060 0.056 Yes
7 Grand Ave/ San Jose Hills Rd
‐ 0.944 E ‐ 0.844 D ‐ 0.989 E ‐ 0.883 D 0.045 0.039 Yes
8 Grand Ave/ Temple Ave
‐ 0.885 D ‐ 0.764 C ‐ 0.967 E ‐ 0.804 D 0.082 0.040 Yes
9 Grand Ave/ La Puente Rd
‐ 1.065 F ‐ 0.950 E ‐ 1.111 F ‐ 0.968 E 0.046 0.018 Yes
10 Grand Ave/ Valley Blvd
‐ 0.845 D ‐ 0.928 E ‐ 0.872 D ‐ 0.942 E 0.027 0.014 Yes
11 Grand Ave/ Baker Pkwy
‐ 0.817 D ‐ 0.543 A ‐ 0.854 D ‐ 0.576 A 0.037 0.033 Yes
12 Grand Ave/ SR‐60 WB Ramps*
22.8 ‐ C 22.8 ‐ C 23.5 ‐ C 23.0 ‐ C 0.7 0.2 No
13 Grand Ave/ SR‐60 EB Ramps*
31.9 ‐ C 21.4 ‐ C 32.8 ‐ C 21.5 ‐ C 0.9 0.1 No
14 Mt. SAC Wy/ Temple Ave
‐ 0.724 C ‐ 0.700 B ‐ 0.790 C ‐ 0.779 C 0.066 0.079 Yes
15 Bonita Ave/ Temple Ave
‐ 0.580 A ‐ 0.601 B ‐ 0.647 B ‐ 0.666 B 0.067 0.065 No
16 Lot F/ Temple Ave
15.3 ‐ C 0.0 ‐ A 18.1 ‐ C 0.0 ‐ A 2.8 0.0 No

TrafficImpactStudy DraftReport
26 Mt. SAC 2015 FMPU/PED
Intersection
Existing Conditions Existing Plus 2025 Project Conditions Change in AM V/C or Delay
Change in PM V/C or Delay
Significant Impact? AM Peak Hour PM Peak Hour AM Peak Hour PM Peak Hour
Delay (s)
V/C or ICU
LOS Delay (s)
V/C or ICU
LOS Delay (s)
V/C or ICU
LOS Delay (s)
V/C or ICU
LOS
17 Valley Blvd/ Temple Ave
‐ 0.751 C ‐ 0.763 C ‐ 0.838 D ‐ 0.776 C 0.087 0.013 Yes
18 SR‐57 SB Ramps/ Temple Ave*
22.9 ‐ C 24.5 ‐ C 24.4 ‐ C 25.8 ‐ C 1.5 1.3 No
19 SR‐57 NB Ramps/ Temple Ave*
13.6 ‐ B 8.8 ‐ A 14.8 ‐ B 9.4 ‐ A 1.2 0.6 No
* Caltrans intersection, utilizing HCM delay‐based methodology to evaluate intersection operations. Notes: V/C = Volume to Capacity Ratio, LOS = Level of Service.

Lemon A
ve
Meadow
Pass
Rd
Temple Ave
Valley B
lvd
10
Bak
er P
kwy
Grand A
ve
Amar Rd
Nogales S
t
La Puente Rd
Bre
a C
yn R
d
Cal PolyPomona
Kellogg D
rCameron Ave
CITY OF WALNUT
57
60
57
60
CITY OF WEST COVINA
CITY OF INDUSTRY
CITY OF DIAMOND BAR
Snow Creek Dr
1
2
3
4
5
6
7
8
9
10
11
12
13
15
14
1617
18
19
Mt. SAC
NNOT TO SCALE
Legend
Study Intersection#
AM/PM Peak Hour VolumesXX/XX
FIGURE 8 Existing Plus 2025 Project
Peak Hour Intersection Volumes
Mt San Antonio College
2015 Facilities Master Plan Update / Physical Education Projects
Traffic Impact Analysis
59
4/5
70
4/9
15
4/2
02
18
/61
0/3
12
/13
4/61191/1135
436/481
81/1351022/9693/12
26
8/2
54
27
/42
12
7/1
52
22
/17
45
/22
19
/5
7/191095/1039
292/161
58/117800/91014/19
15
5/4
12
10
54
/10
96
17
/34
0/3
82
6/8
26
14
0/3
85
437/2826/11
374/168
12/183/178/6
54
/78
88
7/1
30
2
10
06
/73
12
23
/30
1
349/301590/232
40
0/4
24
76
9/1
30
3
18
04
/92
91
81
/11
5
86/81577/420
10
50
/17
18
52
3/1
87
80
9/2
39
17
16
/11
33
151/170108/228
13
0/8
01
26
9/1
69
74
63
/12
6
23
7/9
41
38
2/1
10
12
14
/96
158/10397/19
244/113
119/13249/2979/104
23
6/3
27
13
77
/12
19
71
4/3
57
41
2/2
09
10
87
/86
61
91
/27
1
305/363836/714153/292
127/393462/690185/326
15
9/2
33
17
91
/16
21
70
/15
3
5/1
611
41
/13
02
28
6/2
07
450/27976/63
416/350
113/85108/3533/29
29
1/2
61
14
43
/110
33
64
/17
9
20
7/3
85
95
4/1
07
34
02
/22
0
430/689500/1531
169/287
167/4281116/702139/244
116
/33
23
03
/13
01
10
12
/15
87
10
7/5
0
39/17236/94
0/1
18
46
/83
93
20
/28
3
35
5/6
21
68
3/1
39
12
/50/41/21/4
262/1860/1572/495
119
8/9
50
267
/619
312/3
80
680/1
303
934/192281/176
135/2
41
4/7
38/2
1
183/1
14
11/3
8255/1
20
80/3391055/1395
263/225
56/82845/639130/277
29/11
81
3/2
13
7/1
06
96/1
82
18/9
82/1
11
419/183745/816
168/84
198/941052/1177503/263
4/0898/1132
1787/1488199/14
18
6/2
45
57
2/7
75
45
/63
99/1
60
586/5
50
345/2
04
122/186361/1032
160/220
37/841351/82198/112
0/1
2/8
3
604/9
23
3/1
2817/5
93
575/186510/72
7/181325/65643/116
457/1
80
274/2
89
812/2108290/650
1628/9921628/992
1. Nogales St &Amar Rd
2. Lemon Ave &Amar Rd
5. Grand Ave &Cameron Ave
6. Grand Ave &Montaineer Rd
9. Grand Ave &La Puente Rd
10. Grand Ave &Valley Blvd
15. Bonita Ave &Temple Ave
16. Lot F &Temple Ave
3. Grand Ave &I-10 WB Ramp
4. Grand Ave &I-10 EB Ramp
7. Grand Ave &San Jose Hills Rd
8. Grand Ave &Temple Ave
11. Grand Ave &Baker Pkwy
12. Grand Ave &SR-60 WB Ramps
17. Valley Blvd &Temple Ave
18. SR-57 SB Ramps &Temple Ave
14. Mt. SAC Wy &Temple Ave
13. Grand Ave &SR-60 EB Ramps
19. SR-57 NB Ramps &Temple Ave
TrafficImpactStudyDraftReport
28 Mt. SAC 2015 FMPU/PEP
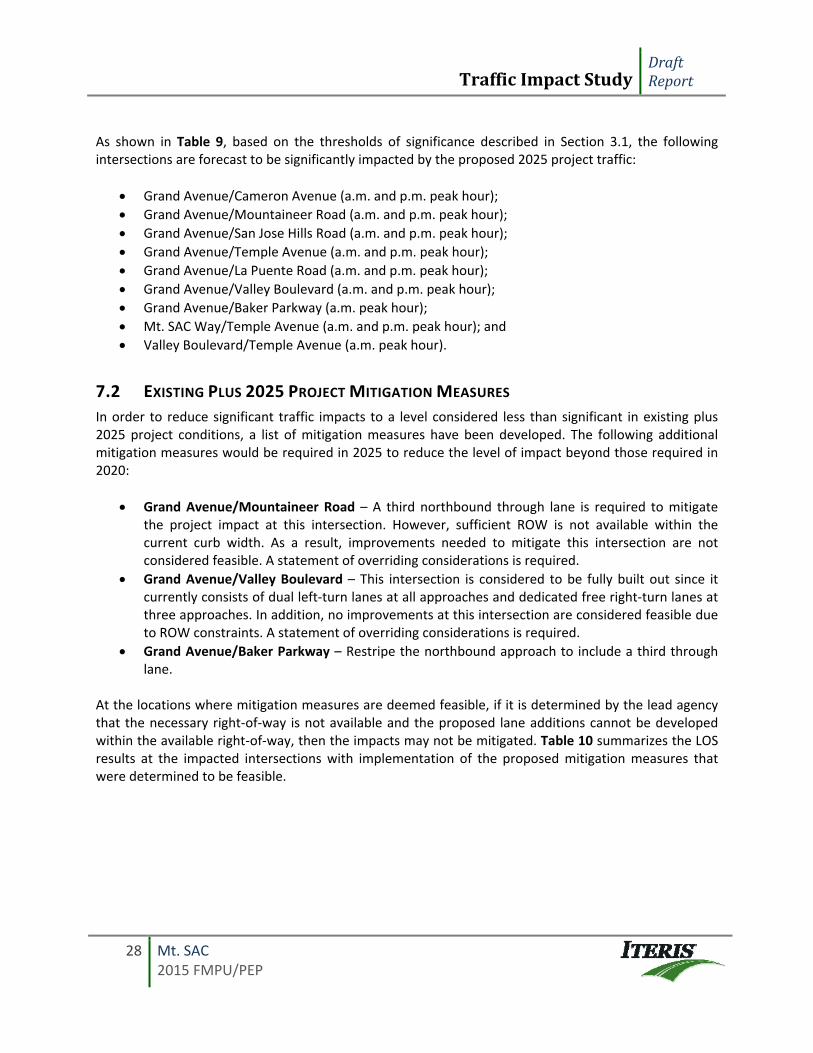
As shown in Table 9, based on the thresholds of significance described in Section 3.1, the following intersections are forecast to be significantly impacted by the proposed 2025 project traffic:
Grand Avenue/Cameron Avenue (a.m. and p.m. peak hour);
Grand Avenue/Mountaineer Road (a.m. and p.m. peak hour);
Grand Avenue/San Jose Hills Road (a.m. and p.m. peak hour);
Grand Avenue/Temple Avenue (a.m. and p.m. peak hour);
Grand Avenue/La Puente Road (a.m. and p.m. peak hour);
Grand Avenue/Valley Boulevard (a.m. and p.m. peak hour);
Grand Avenue/Baker Parkway (a.m. peak hour);
Mt. SAC Way/Temple Avenue (a.m. and p.m. peak hour); and
Valley Boulevard/Temple Avenue (a.m. peak hour).
7.2 EXISTING PLUS 2025 PROJECT MITIGATION MEASURES
In order to reduce significant traffic impacts to a level considered less than significant in existing plus 2025 project conditions, a list of mitigation measures have been developed. The following additional mitigation measures would be required in 2025 to reduce the level of impact beyond those required in 2020:
Grand Avenue/Mountaineer Road – A third northbound through lane is required to mitigate the project impact at this intersection. However, sufficient ROW is not available within the current curb width. As a result, improvements needed to mitigate this intersection are not considered feasible. A statement of overriding considerations is required.
Grand Avenue/Valley Boulevard – This intersection is considered to be fully built out since it currently consists of dual left‐turn lanes at all approaches and dedicated free right‐turn lanes at three approaches. In addition, no improvements at this intersection are considered feasible due to ROW constraints. A statement of overriding considerations is required.
Grand Avenue/Baker Parkway – Restripe the northbound approach to include a third through lane.
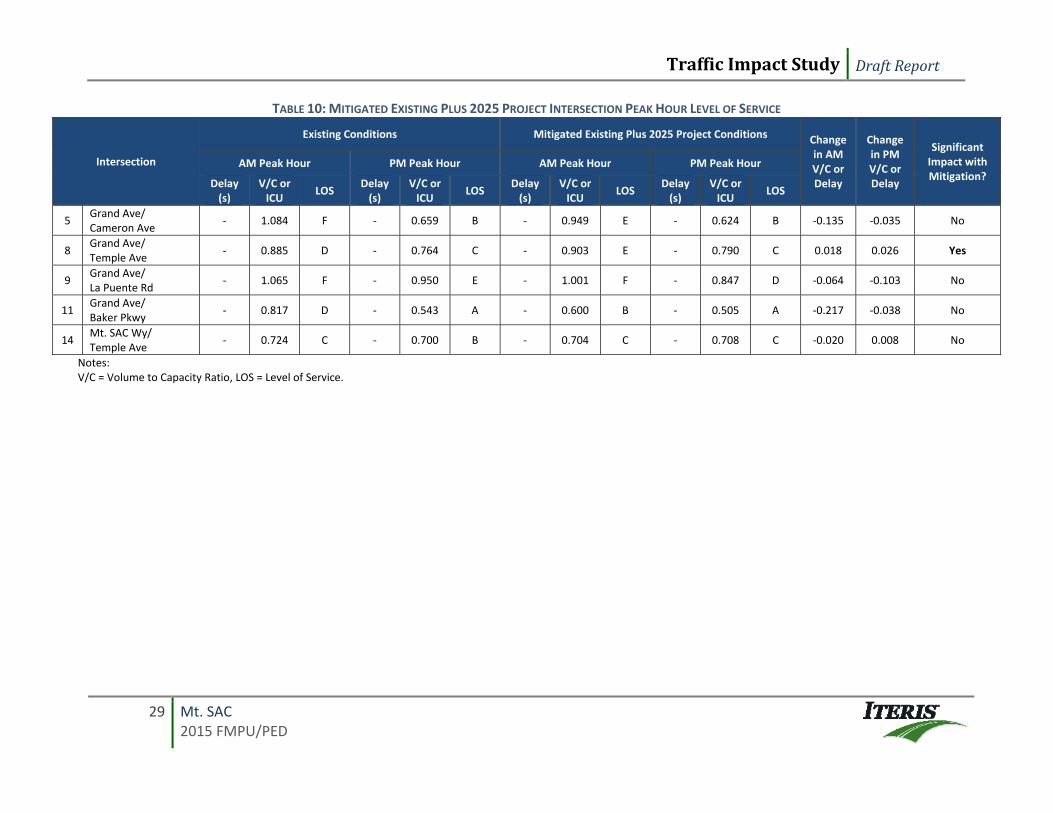
At the locations where mitigation measures are deemed feasible, if it is determined by the lead agency that the necessary right‐of‐way is not available and the proposed lane additions cannot be developed within the available right‐of‐way, then the impacts may not be mitigated. Table 10 summarizes the LOS results at the impacted intersections with implementation of the proposed mitigation measures that were determined to be feasible.
TrafficImpactStudy DraftReport
29 Mt. SAC 2015 FMPU/PED
TABLE 10: MITIGATED EXISTING PLUS 2025 PROJECT INTERSECTION PEAK HOUR LEVEL OF SERVICE
Intersection
Existing Conditions Mitigated Existing Plus 2025 Project Conditions Change in AM V/C or Delay
Change in PM V/C or Delay
Significant Impact with Mitigation?
AM Peak Hour PM Peak Hour AM Peak Hour PM Peak Hour
Delay (s)
V/C or ICU
LOS Delay (s)
V/C or ICU
LOS Delay (s)
V/C or ICU
LOS Delay (s)
V/C or ICU
LOS
5 Grand Ave/ Cameron Ave
‐ 1.084 F ‐ 0.659 B ‐ 0.949 E ‐ 0.624 B ‐0.135 ‐0.035 No
8 Grand Ave/ Temple Ave
‐ 0.885 D ‐ 0.764 C ‐ 0.903 E ‐ 0.790 C 0.018 0.026 Yes
9 Grand Ave/ La Puente Rd
‐ 1.065 F ‐ 0.950 E ‐ 1.001 F ‐ 0.847 D ‐0.064 ‐0.103 No
11 Grand Ave/ Baker Pkwy
‐ 0.817 D ‐ 0.543 A ‐ 0.600 B ‐ 0.505 A ‐0.217 ‐0.038 No
14 Mt. SAC Wy/ Temple Ave
‐ 0.724 C ‐ 0.700 B ‐ 0.704 C ‐ 0.708 C ‐0.020 0.008 No
Notes: V/C = Volume to Capacity Ratio, LOS = Level of Service.
TrafficImpactStudyDraftReport
30 Mt. SAC 2015 FMPU/PEP
As shown in Table 10, at locations where improvements were considered feasible, project impacts are reduced to less than significant at four intersections.
8.0 CUMULATIVE PROJECT CONDITIONS
This section summarizes the forecast increase in traffic due to specific, known development projects in the area surrounding the study locations that may affect traffic circulation. The projected buildout year of the FMPU is 2020 and the County General Plan buildout is 2025. Therefore, year 2020 and 2025 cumulative traffic conditions are assessed.
8.1 CUMULATIVE PROJECT GROWTH
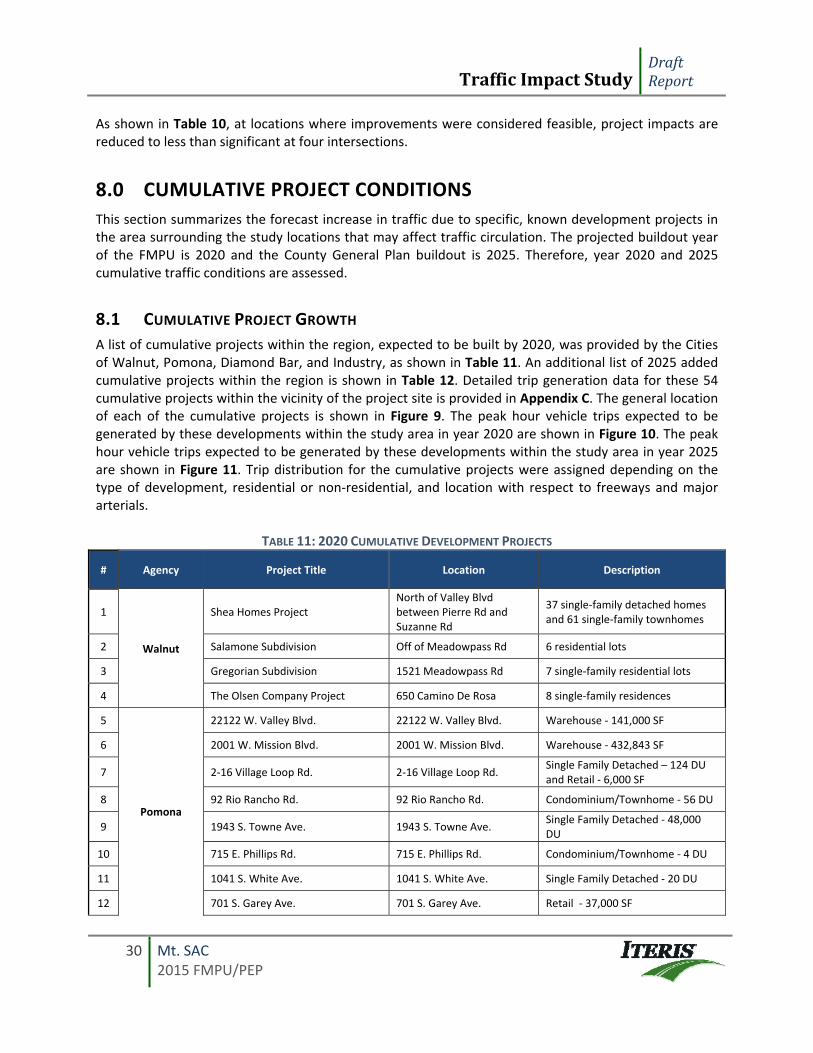
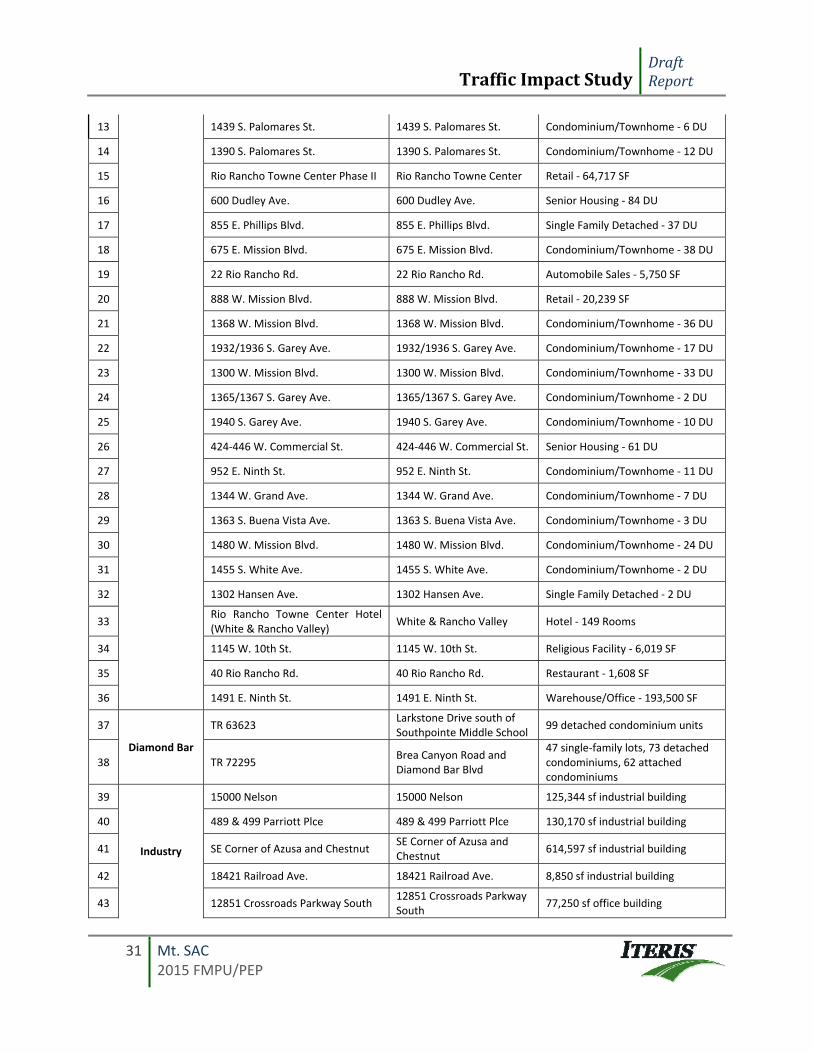
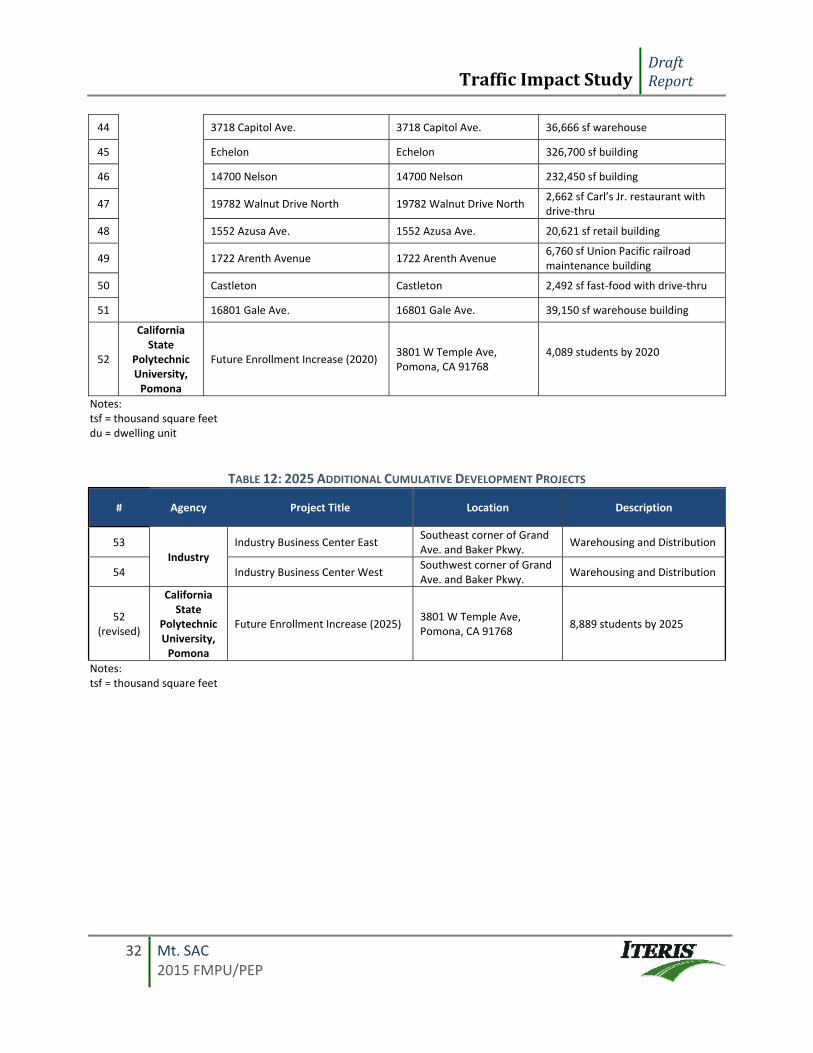
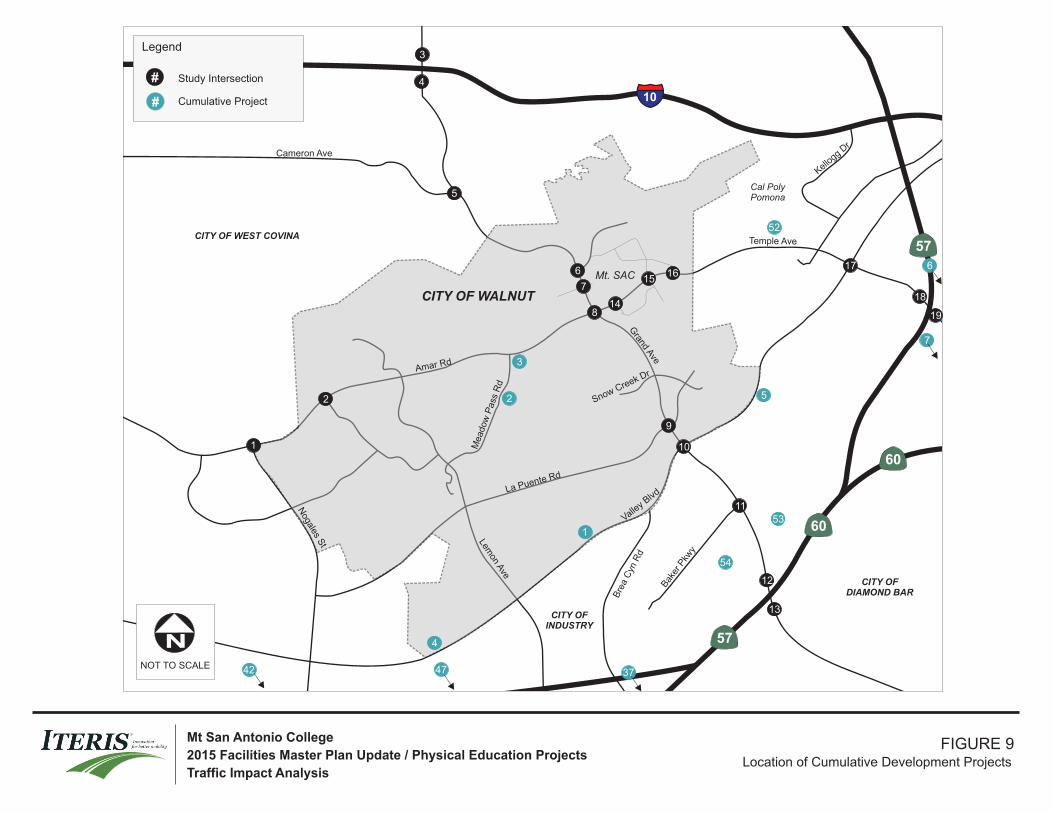
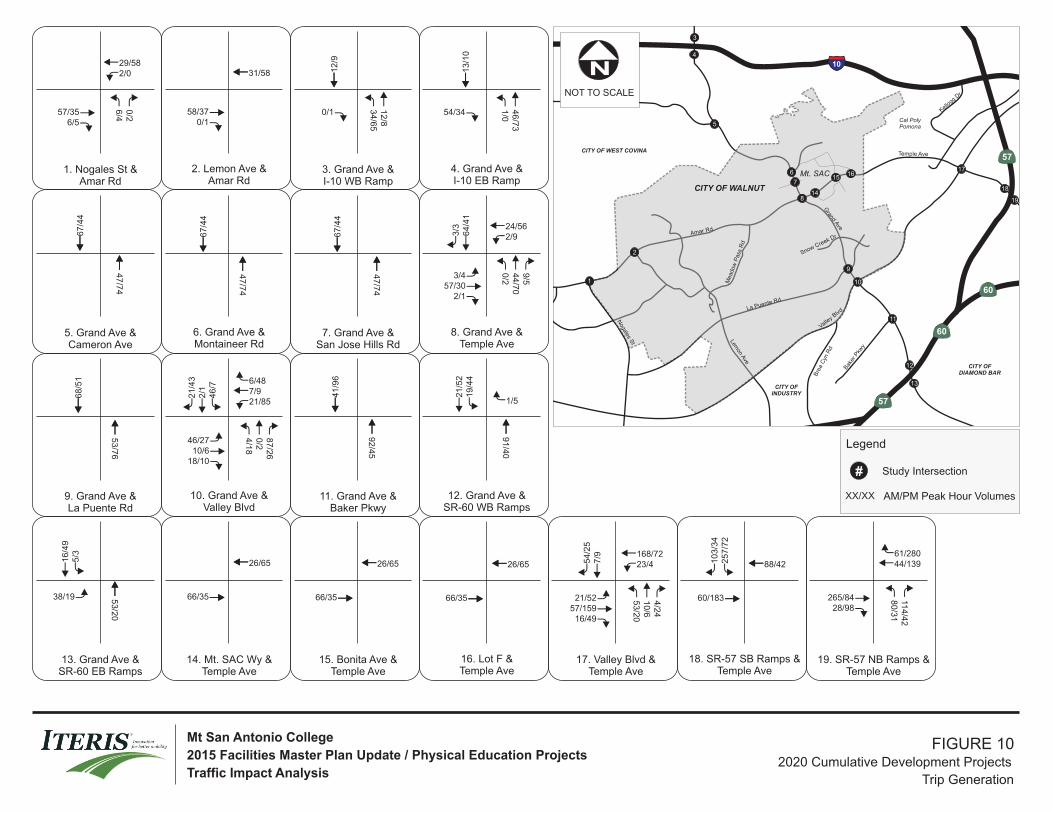
A list of cumulative projects within the region, expected to be built by 2020, was provided by the Cities of Walnut, Pomona, Diamond Bar, and Industry, as shown in Table 11. An additional list of 2025 added cumulative projects within the region is shown in Table 12. Detailed trip generation data for these 54 cumulative projects within the vicinity of the project site is provided in Appendix C. The general location of each of the cumulative projects is shown in Figure 9. The peak hour vehicle trips expected to be generated by these developments within the study area in year 2020 are shown in Figure 10. The peak hour vehicle trips expected to be generated by these developments within the study area in year 2025 are shown in Figure 11. Trip distribution for the cumulative projects were assigned depending on the type of development, residential or non‐residential, and location with respect to freeways and major arterials.
TABLE 11: 2020 CUMULATIVE DEVELOPMENT PROJECTS
# Agency Project Title Location Description
1
Walnut
Shea Homes Project North of Valley Blvd between Pierre Rd and Suzanne Rd
37 single‐family detached homes and 61 single‐family townhomes
2 Salamone Subdivision Off of Meadowpass Rd 6 residential lots
3 Gregorian Subdivision 1521 Meadowpass Rd 7 single‐family residential lots
4 The Olsen Company Project 650 Camino De Rosa 8 single‐family residences
5
Pomona
22122 W. Valley Blvd. 22122 W. Valley Blvd. Warehouse ‐ 141,000 SF
6 2001 W. Mission Blvd. 2001 W. Mission Blvd. Warehouse ‐ 432,843 SF
7 2‐16 Village Loop Rd. 2‐16 Village Loop Rd. Single Family Detached – 124 DU and Retail ‐ 6,000 SF
8 92 Rio Rancho Rd. 92 Rio Rancho Rd. Condominium/Townhome ‐ 56 DU
9 1943 S. Towne Ave. 1943 S. Towne Ave. Single Family Detached ‐ 48,000 DU
10 715 E. Phillips Rd. 715 E. Phillips Rd. Condominium/Townhome ‐ 4 DU
11 1041 S. White Ave. 1041 S. White Ave. Single Family Detached ‐ 20 DU
12 701 S. Garey Ave. 701 S. Garey Ave. Retail ‐ 37,000 SF
TrafficImpactStudyDraftReport
31 Mt. SAC 2015 FMPU/PEP
13 1439 S. Palomares St. 1439 S. Palomares St. Condominium/Townhome ‐ 6 DU
14 1390 S. Palomares St. 1390 S. Palomares St. Condominium/Townhome ‐ 12 DU
15 Rio Rancho Towne Center Phase II Rio Rancho Towne Center Retail ‐ 64,717 SF
16 600 Dudley Ave. 600 Dudley Ave. Senior Housing ‐ 84 DU
17 855 E. Phillips Blvd. 855 E. Phillips Blvd. Single Family Detached ‐ 37 DU
18 675 E. Mission Blvd. 675 E. Mission Blvd. Condominium/Townhome ‐ 38 DU
19 22 Rio Rancho Rd. 22 Rio Rancho Rd. Automobile Sales ‐ 5,750 SF
20 888 W. Mission Blvd. 888 W. Mission Blvd. Retail ‐ 20,239 SF
21 1368 W. Mission Blvd. 1368 W. Mission Blvd. Condominium/Townhome ‐ 36 DU
22 1932/1936 S. Garey Ave. 1932/1936 S. Garey Ave. Condominium/Townhome ‐ 17 DU
23 1300 W. Mission Blvd. 1300 W. Mission Blvd. Condominium/Townhome ‐ 33 DU
24 1365/1367 S. Garey Ave. 1365/1367 S. Garey Ave. Condominium/Townhome ‐ 2 DU
25 1940 S. Garey Ave. 1940 S. Garey Ave. Condominium/Townhome ‐ 10 DU
26 424‐446 W. Commercial St. 424‐446 W. Commercial St. Senior Housing ‐ 61 DU
27 952 E. Ninth St. 952 E. Ninth St. Condominium/Townhome ‐ 11 DU
28 1344 W. Grand Ave. 1344 W. Grand Ave. Condominium/Townhome ‐ 7 DU
29 1363 S. Buena Vista Ave. 1363 S. Buena Vista Ave. Condominium/Townhome ‐ 3 DU
30 1480 W. Mission Blvd. 1480 W. Mission Blvd. Condominium/Townhome ‐ 24 DU
31 1455 S. White Ave. 1455 S. White Ave. Condominium/Townhome ‐ 2 DU
32 1302 Hansen Ave. 1302 Hansen Ave. Single Family Detached ‐ 2 DU
33 Rio Rancho Towne Center Hotel (White & Rancho Valley)
White & Rancho Valley Hotel ‐ 149 Rooms
34 1145 W. 10th St. 1145 W. 10th St. Religious Facility ‐ 6,019 SF
35 40 Rio Rancho Rd. 40 Rio Rancho Rd. Restaurant ‐ 1,608 SF
36 1491 E. Ninth St. 1491 E. Ninth St. Warehouse/Office ‐ 193,500 SF
37
Diamond Bar
TR 63623 Larkstone Drive south of Southpointe Middle School
99 detached condominium units
38 TR 72295 Brea Canyon Road and Diamond Bar Blvd
47 single‐family lots, 73 detached condominiums, 62 attached condominiums
39
Industry
15000 Nelson 15000 Nelson 125,344 sf industrial building
40 489 & 499 Parriott Plce 489 & 499 Parriott Plce 130,170 sf industrial building
41 SE Corner of Azusa and Chestnut SE Corner of Azusa and Chestnut
614,597 sf industrial building
42 18421 Railroad Ave. 18421 Railroad Ave. 8,850 sf industrial building
43 12851 Crossroads Parkway South 12851 Crossroads Parkway South
77,250 sf office building
TrafficImpactStudyDraftReport
32 Mt. SAC 2015 FMPU/PEP
44 3718 Capitol Ave. 3718 Capitol Ave. 36,666 sf warehouse
45 Echelon Echelon 326,700 sf building
46 14700 Nelson 14700 Nelson 232,450 sf building
47 19782 Walnut Drive North 19782 Walnut Drive North 2,662 sf Carl’s Jr. restaurant with drive‐thru
48 1552 Azusa Ave. 1552 Azusa Ave. 20,621 sf retail building
49 1722 Arenth Avenue 1722 Arenth Avenue 6,760 sf Union Pacific railroad maintenance building
50 Castleton Castleton 2,492 sf fast‐food with drive‐thru
51 16801 Gale Ave. 16801 Gale Ave. 39,150 sf warehouse building
52
California State
Polytechnic University, Pomona
Future Enrollment Increase (2020) 3801 W Temple Ave, Pomona, CA 91768
4,089 students by 2020
Notes: tsf = thousand square feet du = dwelling unit
TABLE 12: 2025 ADDITIONAL CUMULATIVE DEVELOPMENT PROJECTS
# Agency Project Title Location Description
53 Industry
Industry Business Center East Southeast corner of Grand Ave. and Baker Pkwy.
Warehousing and Distribution
54 Industry Business Center West Southwest corner of Grand Ave. and Baker Pkwy.
Warehousing and Distribution
52 (revised)
California State
Polytechnic University, Pomona
Future Enrollment Increase (2025) 3801 W Temple Ave, Pomona, CA 91768
8,889 students by 2025
Notes: tsf = thousand square feet
Legend
Study Corridor
NNOT TO SCALE
Sphere of Influence Intersection
Legend
Study Intersection#
Study Roadway Segment
Cumulative Project
#
#
FIGURE 9 Location of Cumulative Development Projects
Mt San Antonio College
2015 Facilities Master Plan Update / Physical Education Projects
Traffic Impact Analysis
Lemon A
ve
Meadow
Pass
Rd
Temple Ave
Valley B
lvd
10
Bak
er P
kwy
Grand A
ve
Amar Rd
Nogales S
t
La Puente Rd
Bre
a C
yn R
d
Cal PolyPomona
Kellogg D
rCameron Ave
CITY OF WALNUT
57
60
57
60
CITY OF WEST COVINA
CITY OF INDUSTRY
CITY OF DIAMOND BAR
Snow Creek Dr
Mt. SAC
1
2
3
4
5
6
7
8
9
10
11
12
13
15
14
1617
18
19
1
2
3
4
5
6
7
3742 47
54
53
52
Lemon A
ve
Meadow
Pass
Rd
Temple Ave
Valley B
lvd
10
Bak
er P
kwy
Grand A
ve
Amar Rd
Nogales S
t
La Puente Rd
Bre
a C
yn R
d
Cal PolyPomona
Kellogg D
rCameron Ave
CITY OF WALNUT
57
60
57
60
CITY OF WEST COVINA
CITY OF INDUSTRY
CITY OF DIAMOND BAR
Snow Creek Dr
1
2
3
4
5
6
7
8
9
10
11
12
13
15
14
1617
18
19
Mt. SAC
NNOT TO SCALE
Legend
Study Intersection#
AM/PM Peak Hour VolumesXX/XX
FIGURE 10 2020 Cumulative Development Projects
Trip Generation
Mt San Antonio College
2015 Facilities Master Plan Update / Physical Education Projects
Traffic Impact Analysis
6/4
0/257/35
6/5
2/029/58
58/370/1
31/58
34
/65
12
/8
12
/9
0/1
1/0
46
/73
13
/10
54/34
47
/74
67
/44
47
/74
67
/44
47
/74
67
/44
0/2
44
/70
9/5
64
/41
3/3
3/457/30
2/1
2/924/56
53
/76
68
/51
4/1
80
/28
7/2
6
46
/72
/12
1/4
3
46/2710/6
18/10
21/857/96/48
92
/45
41
/96
91
/40
19
/44
21
/52
1/5
53
/20
5/3
16/4
9
38/19 66/35
26/65
66/35
26/65
66/35
26/65
53/2
01
0/6
4/2
4
7/9
54/2
5
21/5257/159
16/49
23/4168/72
257/7
2103/3
4
60/183
88/42
80/3
111
4/4
2
265/8428/98
44/13961/280
1. Nogales St &Amar Rd
2. Lemon Ave &Amar Rd
5. Grand Ave &Cameron Ave
6. Grand Ave &Montaineer Rd
9. Grand Ave &La Puente Rd
10. Grand Ave &Valley Blvd
15. Bonita Ave &Temple Ave
16. Lot F &Temple Ave
3. Grand Ave &I-10 WB Ramp
4. Grand Ave &I-10 EB Ramp
7. Grand Ave &San Jose Hills Rd
8. Grand Ave &Temple Ave
11. Grand Ave &Baker Pkwy
12. Grand Ave &SR-60 WB Ramps
17. Valley Blvd &Temple Ave
18. SR-57 SB Ramps &Temple Ave
14. Mt. SAC Wy &Temple Ave
13. Grand Ave &SR-60 EB Ramps
19. SR-57 NB Ramps &Temple Ave
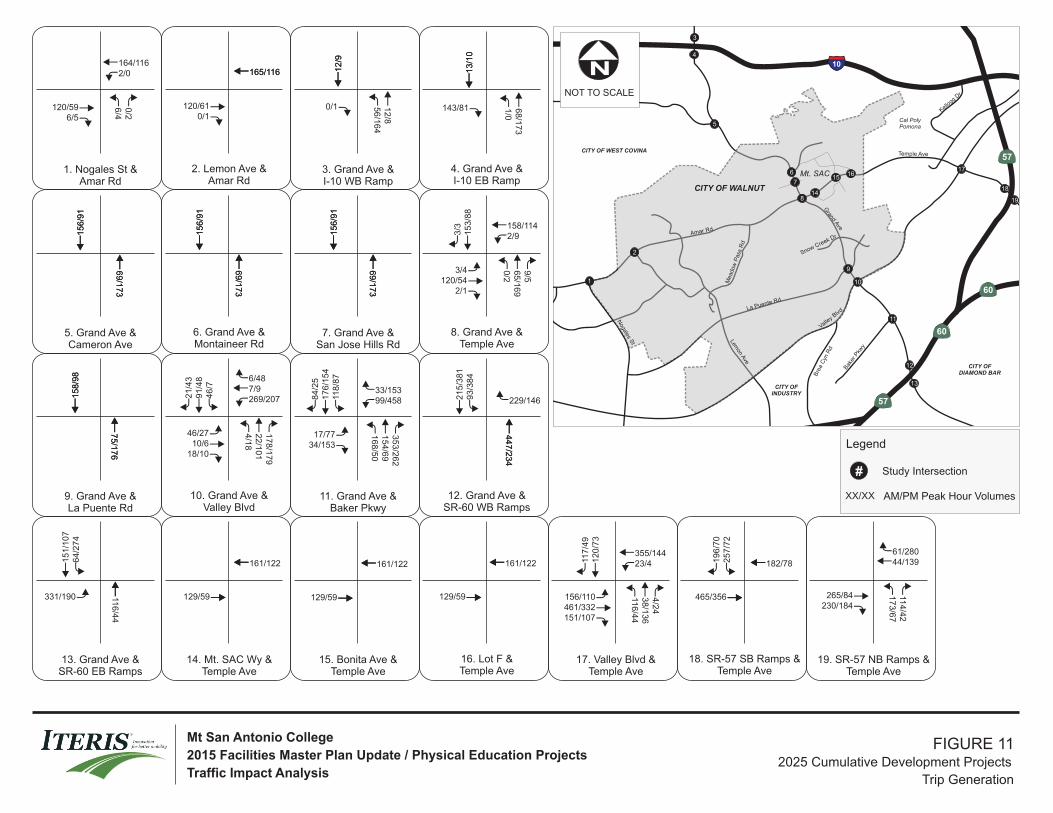
Lemon A
ve
Meadow
Pass
Rd
Temple Ave
Valley B
lvd
10
Bak
er P
kwy
Grand A
ve
Amar Rd
Nogales S
t
La Puente Rd
Bre
a C
yn R
d
Cal PolyPomona
Kellogg D
rCameron Ave
CITY OF WALNUT
57
60
57
60
CITY OF WEST COVINA
CITY OF INDUSTRY
CITY OF DIAMOND BAR
Snow Creek Dr
1
2
3
4
5
6
7
8
9
10
11
12
13
15
14
1617
18
19
Mt. SAC
NNOT TO SCALE
Legend
Study Intersection#
AM/PM Peak Hour VolumesXX/XX
FIGURE 11 2025 Cumulative Development Projects
Trip Generation
Mt San Antonio College
2015 Facilities Master Plan Update / Physical Education Projects
Traffic Impact Analysis
6/4
0/2
120/596/5
2/0164/116
120/610/1
165/116165/116
56
/16
41
2/8
12
/91
2/9
0/1 1/0
68
/17
3
13
/10
13
/10
143/81
69
/17
36
9/1
73
15
6/9
11
56
/91
69
/17
36
9/1
73
15
6/9
11
56
/91
69
/17
36
9/1
73
15
6/9
11
56
/91
0/2
65
/16
99
/5
15
3/8
83
/3
3/4120/54
2/1
2/9158/114
75
/17
67
5/1
76
15
8/9
81
58
/98
4/1
82
2/1
01
17
8/1
79
46
/79
1/4
82
1/4
3
46/2710/6
18/10
269/2077/96/48
16
8/5
01
54
/69
35
3/2
62
118
/87
17
6/1
54
84
/25
17/7734/153
99/45833/153
44
7/2
34
44
7/2
34
93
/38
42
15
/38
1
229/146
116/4
4
64/2
74
151/1
07
331/190 129/59
161/122
129/59
161/122
129/59
161/122
116/4
43
8/1
36
4/2
4
120/7
311
7/4
9
156/110461/332151/107
23/4355/144
257/7
2196/7
0
465/356
182/78
17
3/6
711
4/4
2
265/84230/184
44/13961/280
1. Nogales St &Amar Rd
2. Lemon Ave &Amar Rd
5. Grand Ave &Cameron Ave
6. Grand Ave &Montaineer Rd
9. Grand Ave &La Puente Rd
10. Grand Ave &Valley Blvd
15. Bonita Ave &Temple Ave
16. Lot F &Temple Ave
3. Grand Ave &I-10 WB Ramp
4. Grand Ave &I-10 EB Ramp
7. Grand Ave &San Jose Hills Rd
8. Grand Ave &Temple Ave
11. Grand Ave &Baker Pkwy
12. Grand Ave &SR-60 WB Ramps
17. Valley Blvd &Temple Ave
18. SR-57 SB Ramps &Temple Ave
14. Mt. SAC Wy &Temple Ave
13. Grand Ave &SR-60 EB Ramps
19. SR-57 NB Ramps &Temple Ave
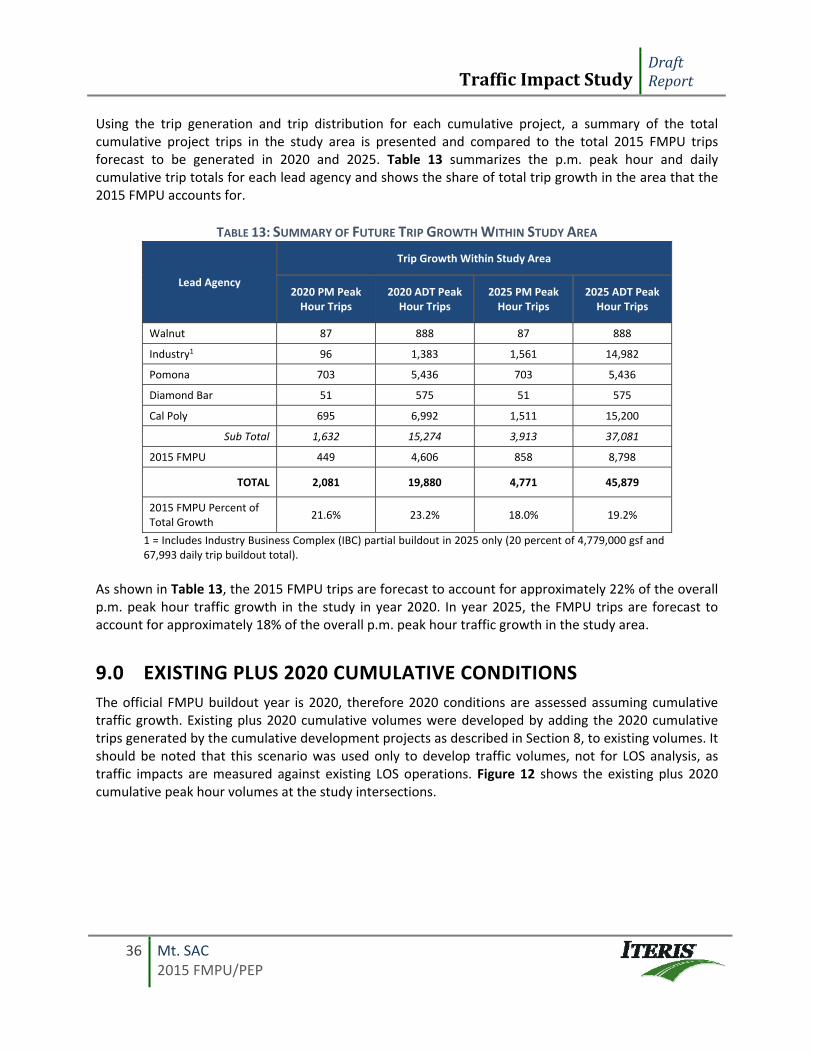
TrafficImpactStudyDraftReport
36 Mt. SAC 2015 FMPU/PEP
Using the trip generation and trip distribution for each cumulative project, a summary of the total cumulative project trips in the study area is presented and compared to the total 2015 FMPU trips forecast to be generated in 2020 and 2025. Table 13 summarizes the p.m. peak hour and daily cumulative trip totals for each lead agency and shows the share of total trip growth in the area that the 2015 FMPU accounts for.
TABLE 13: SUMMARY OF FUTURE TRIP GROWTH WITHIN STUDY AREA
Lead Agency
Trip Growth Within Study Area
2020 PM Peak Hour Trips
2020 ADT Peak Hour Trips
2025 PM Peak Hour Trips
2025 ADT Peak Hour Trips
Walnut 87 888 87 888
Industry1 96 1,383 1,561 14,982
Pomona 703 5,436 703 5,436
Diamond Bar 51 575 51 575
Cal Poly 695 6,992 1,511 15,200
Sub Total 1,632 15,274 3,913 37,081
2015 FMPU 449 4,606 858 8,798
TOTAL 2,081 19,880 4,771 45,879
2015 FMPU Percent of Total Growth
21.6% 23.2% 18.0% 19.2%
1 = Includes Industry Business Complex (IBC) partial buildout in 2025 only (20 percent of 4,779,000 gsf and 67,993 daily trip buildout total).
As shown in Table 13, the 2015 FMPU trips are forecast to account for approximately 22% of the overall p.m. peak hour traffic growth in the study in year 2020. In year 2025, the FMPU trips are forecast to account for approximately 18% of the overall p.m. peak hour traffic growth in the study area.
9.0 EXISTING PLUS 2020 CUMULATIVE CONDITIONS
The official FMPU buildout year is 2020, therefore 2020 conditions are assessed assuming cumulative traffic growth. Existing plus 2020 cumulative volumes were developed by adding the 2020 cumulative trips generated by the cumulative development projects as described in Section 8, to existing volumes. It should be noted that this scenario was used only to develop traffic volumes, not for LOS analysis, as traffic impacts are measured against existing LOS operations. Figure 12 shows the existing plus 2020 cumulative peak hour volumes at the study intersections.
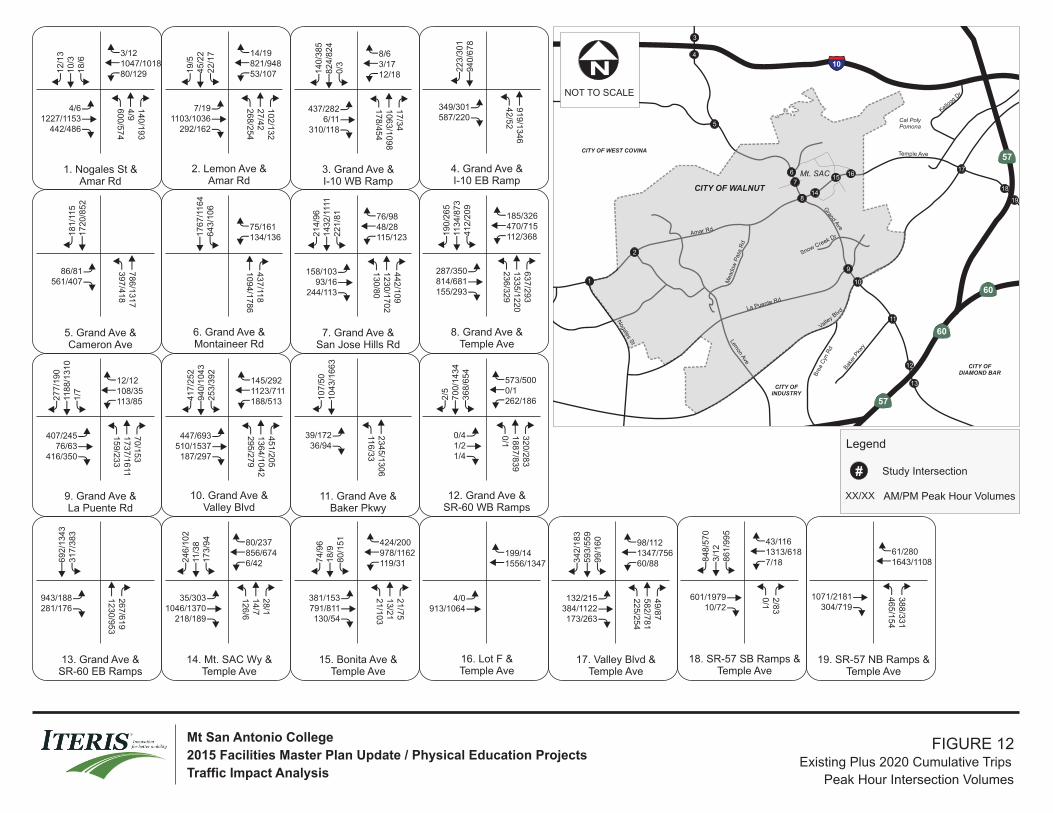
Lemon A
ve
Meadow
Pass
Rd
Temple Ave
Valley B
lvd
10
Bak
er P
kwy
Grand A
ve
Amar Rd
Nogales S
t
La Puente Rd
Bre
a C
yn R
d
Cal PolyPomona
Kellogg D
rCameron Ave
CITY OF WALNUT
57
60
57
60
CITY OF WEST COVINA
CITY OF INDUSTRY
CITY OF DIAMOND BAR
Snow Creek Dr
1
2
3
4
5
6
7
8
9
10
11
12
13
15
14
1617
18
19
Mt. SAC
NNOT TO SCALE
Legend
Study Intersection#
AM/PM Peak Hour VolumesXX/XX
FIGURE 12 Existing Plus 2020 Cumulative Trips
Peak Hour Intersection Volumes
Mt San Antonio College
2015 Facilities Master Plan Update / Physical Education Projects
Traffic Impact Analysis
60
0/5
74
4/9
14
0/1
93
18
/61
0/3
12
/13
4/61227/1153
442/486
80/1291047/10183/12
26
8/2
54
27
/42
10
2/1
32
22
/17
45
/22
19
/5
7/191103/1036
292/162
53/107821/94814/19
17
8/4
54
10
63
/10
98
17
/34
0/3
82
4/8
24
14
0/3
85
437/2826/11
310/118
12/183/178/6
42
/52
91
9/1
34
6
94
0/6
78
22
3/3
01
349/301587/220
39
7/4
18
78
6/1
31
7
17
20
/85
21
81
/11
5
86/81561/407
10
94
/17
86
43
7/11
8
64
3/1
06
17
67
/11
64
134/13675/161
13
0/8
01
23
0/1
70
24
42
/10
9
22
1/8
11
43
2/1
111
21
4/9
6
158/10393/16
244/113
115/12348/2876/98
23
6/3
29
13
35
/12
20
63
7/2
93
41
2/2
09
113
4/8
73
19
0/2
65
287/350814/681155/293
112/368470/715185/326
15
9/2
33
17
37
/16
117
0/1
53
1/7
118
8/1
31
02
77
/19
0
407/24576/63
416/350
113/85108/3512/12
29
5/2
79
13
64
/10
42
45
1/2
05
25
3/3
92
94
0/1
04
34
17
/25
2
447/693510/1537
187/297
188/5131123/711145/292
116
/33
23
45
/13
06
10
43
/16
63
10
7/5
0
39/17236/94
0/1
18
87
/83
93
20
/28
3
36
8/6
54
70
0/1
43
42
/50/41/21/4
262/1860/1573/500
1230
/953
267/6
19
317/3
83
692/1
343
943/188281/176
126/6
14/7
28/1
173/9
411
/38
246/1
02
35/3031046/1370
218/189
6/42856/67480/237
21/1
03
13/2
12
1/7
5
80/1
51
18/9
74/9
6
381/153791/811130/54
119/31978/1162424/200
4/0913/1064
1556/1347199/14
225
/254
582
/781
49/8
7
99/1
60
593/5
59
342/1
83
132/215384/1122173/263
60/881347/75698/112
0/1
2/8
3
861/9
95
3/1
2848/5
70
601/197910/72
7/181313/61843/116
465/1
54
388/3
31
1071/2181304/719
1643/110861/280
1. Nogales St &Amar Rd
2. Lemon Ave &Amar Rd
5. Grand Ave &Cameron Ave
6. Grand Ave &Montaineer Rd
9. Grand Ave &La Puente Rd
10. Grand Ave &Valley Blvd
15. Bonita Ave &Temple Ave
16. Lot F &Temple Ave
3. Grand Ave &I-10 WB Ramp
4. Grand Ave &I-10 EB Ramp
7. Grand Ave &San Jose Hills Rd
8. Grand Ave &Temple Ave
11. Grand Ave &Baker Pkwy
12. Grand Ave &SR-60 WB Ramps
17. Valley Blvd &Temple Ave
18. SR-57 SB Ramps &Temple Ave
14. Mt. SAC Wy &Temple Ave
13. Grand Ave &SR-60 EB Ramps
19. SR-57 NB Ramps &Temple Ave
TrafficImpactStudyDraftReport
38 Mt. SAC 2015 FMPU/PEP
10.0 EXISTING PLUS 2020 PROJECT PLUS CUMULATIVE CONDITIONS
Existing plus 2020 project plus cumulative volumes were developed by adding the trips generated by proposed 2020 project, as described in Section 5, to existing plus 2020 cumulative volumes (without project), as described in Section 9. Figure 13 shows the existing plus 2020 project plus cumulative peak hour volumes at the study intersections.
10.1 EXISTING PLUS 2020 PROJECT PLUS CUMULATIVE INTERSECTION LEVELS OF SERVICE
A level of service analysis was conducted to evaluate existing plus 2020 project plus cumulative intersection operations during the a.m. and p.m. peak hours. Table 14 summarizes the existing plus 2020 project plus cumulative levels of service at the study intersections. Level of service calculation worksheets are included in Appendix B.

TrafficImpactStudy DraftReport
39 Mt SAC 2015 FMPU/PEP
TABLE 14: EXISTING PLUS 2020 PROJECT PLUS CUMULATIVE INTERSECTION PEAK HOUR LEVEL OF SERVICE
Intersection
Existing Conditions Existing Plus 2020 Project Plus Cumulative Conditions Change in AM V/C or Delay
Change in PM V/C or Delay
Significant Impact? AM Peak Hour PM Peak Hour AM Peak Hour PM Peak Hour
Delay (s)
V/C or ICU
LOS Delay (s)
V/C or ICU
LOS Delay (s)
V/C or ICU
LOS Delay (s)
V/C or ICU
LOS
1 Nogales St/ Amar Rd
‐ 0.760 C ‐ 0.725 C ‐ 0.788 C ‐ 0.743 C 0.028 0.018 No
2 Lemon Ave/ Amar Rd
‐ 0.706 C ‐ 0.636 B ‐ 0.736 C ‐ 0.658 B 0.030 0.022 No
3 Grand Ave/ I‐10 WB Ramp*
23.4 ‐ C 24.8 ‐ C 24.0 ‐ C 26.6 ‐ C 0.6 1.8 No
4 Grand Ave/ I‐10 EB Ramp*
26.3 ‐ C 16.7 ‐ B 30.7 ‐ C 18.9 ‐ B 4.4 2.2 No
5 Grand Ave/ Cameron Ave
‐ 1.084 F ‐ 0.659 B ‐ 1.139 F ‐ 0.700 B 0.055 0.041 Yes
6 Grand Ave/ Mountaineer Rd
‐ 0.666 B ‐ 0.721 C ‐ 0.713 C ‐ 0.775 C 0.047 0.054 Yes
7 Grand Ave/ San Jose Hills Rd
‐ 0.944 E ‐ 0.844 D ‐ 0.983 E ‐ 0.889 D 0.039 0.045 Yes
8 Grand Ave/ Temple Ave
‐ 0.885 D ‐ 0.764 C ‐ 0.952 E ‐ 0.804 D 0.067 0.040 Yes
9 Grand Ave/ La Puente Rd
‐ 1.065 F ‐ 0.950 E ‐ 1.108 F ‐ 0.977 E 0.043 0.027 Yes
10 Grand Ave/ Valley Blvd
‐ 0.845 D ‐ 0.928 E ‐ 0.891 D ‐ 0.967 E 0.046 0.039 Yes
11 Grand Ave/ Baker Pkwy
‐ 0.817 D ‐ 0.543 A ‐ 0.856 D ‐ 0.565 A 0.039 0.022 Yes
12 Grand Ave/ SR‐60 WB Ramps*
22.8 ‐ C 22.8 ‐ C 24.8 ‐ C 23.4 ‐ C 2.0 0.6 No
13 Grand Ave/ SR‐60 EB Ramps*
31.9 ‐ C 21.4 ‐ C 34.5 ‐ C 21.5 ‐ C 2.6 0.1 No
14 Mt. SAC Wy/ Temple Ave
‐ 0.724 C ‐ 0.700 B ‐ 0.774 C ‐ 0.752 C 0.050 0.052 Yes
15 Bonita Ave/ Temple Ave
‐ 0.580 A ‐ 0.601 B ‐ 0.626 B ‐ 0.656 B 0.046 0.055 No
16 Lot F/ Temple Ave
15.3 ‐ C 0.0 ‐ A 16.7 ‐ C 0.0 ‐ A 1.400 0.000 No
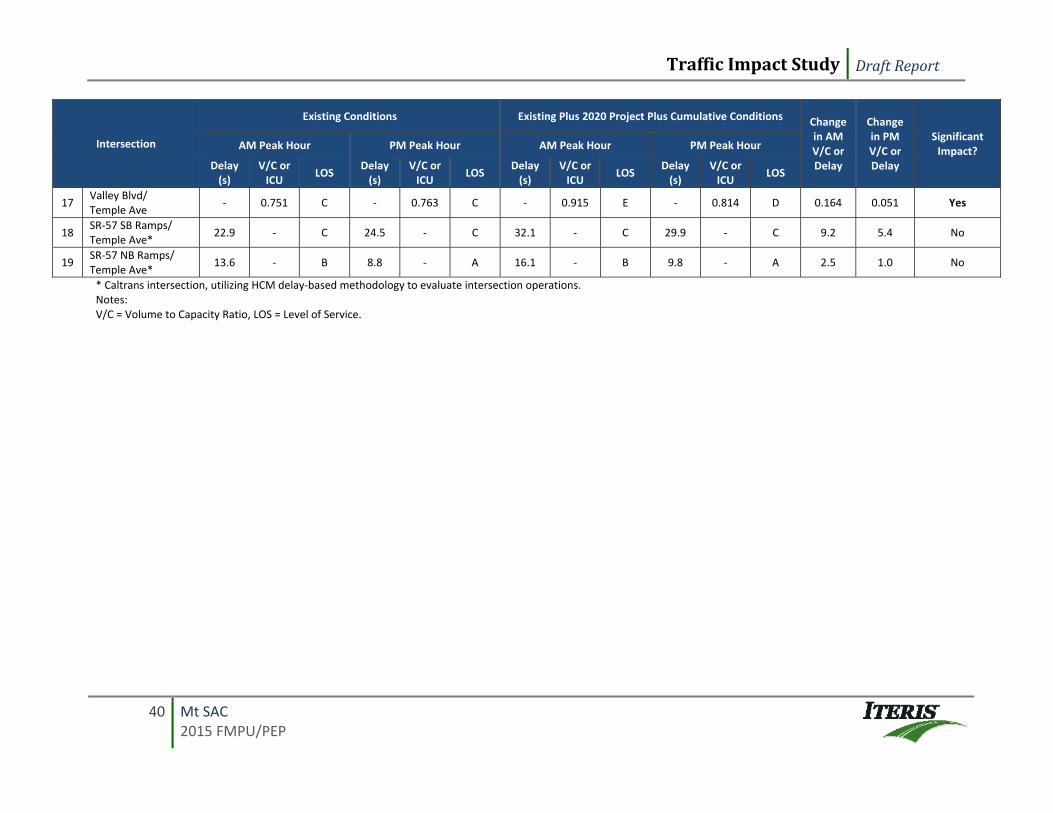
TrafficImpactStudy DraftReport
40 Mt SAC 2015 FMPU/PEP
Intersection
Existing Conditions Existing Plus 2020 Project Plus Cumulative Conditions Change in AM V/C or Delay
Change in PM V/C or Delay
Significant Impact? AM Peak Hour PM Peak Hour AM Peak Hour PM Peak Hour
Delay (s)
V/C or ICU
LOS Delay (s)
V/C or ICU
LOS Delay (s)
V/C or ICU
LOS Delay (s)
V/C or ICU
LOS
17 Valley Blvd/ Temple Ave
‐ 0.751 C ‐ 0.763 C ‐ 0.915 E ‐ 0.814 D 0.164 0.051 Yes
18 SR‐57 SB Ramps/ Temple Ave*
22.9 ‐ C 24.5 ‐ C 32.1 ‐ C 29.9 ‐ C 9.2 5.4 No
19 SR‐57 NB Ramps/ Temple Ave*
13.6 ‐ B 8.8 ‐ A 16.1 ‐ B 9.8 ‐ A 2.5 1.0 No
* Caltrans intersection, utilizing HCM delay‐based methodology to evaluate intersection operations. Notes: V/C = Volume to Capacity Ratio, LOS = Level of Service.

Lemon A
ve
Meadow
Pass
Rd
Temple Ave
Valley B
lvd
10
Bak
er P
kwy
Grand A
ve
Amar Rd
Nogales S
t
La Puente Rd
Bre
a C
yn R
d
Cal PolyPomona
Kellogg D
rCameron Ave
CITY OF WALNUT
57
60
57
60
CITY OF WEST COVINA
CITY OF INDUSTRY
CITY OF DIAMOND BAR
Snow Creek Dr
1
2
3
4
5
6
7
8
9
10
11
12
13
15
14
1617
18
19
Mt. SAC
NNOT TO SCALE
Legend
Study Intersection#
AM/PM Peak Hour VolumesXX/XX
FIGURE 13 Existing Plus 2020 Project Plus Cumulative
Peak Hour Intersection Volumes
Mt San Antonio College
2015 Facilities Master Plan Update / Physical Education Projects
Traffic Impact Analysis
60
0/5
74
4/9
14
8/1
99
18
/61
0/3
12
/13
4/61238/1162
442/486
81/1321049/10223/12
26
8/2
54
27
/42
115
/14
3
22
/17
45
/22
19
/5
7/191129/1057
292/162
56/112826/95814/19
18
4/4
66
10
64
/110
11
7/3
4
0/3
83
2/8
30
14
0/3
85
437/2826/11
344/145
12/183/178/6
49
/65
92
6/1
36
1
98
1/7
112
23
/30
1
349/301617/244
39
9/4
21
80
2/1
34
8
17
99
/91
51
81
/11
5
86/81569/414
10
96
/17
89
48
2/1
54
73
0/1
76
17
75
/11
71
143/15492/196
13
0/8
01
27
5/1
73
84
53
/118
22
9/8
81
44
1/1
12
92
14
/96
158/10395/18
244/113
117/12748/2978/101
23
6/3
29
13
80
/12
56
68
2/3
29
41
2/2
09
114
3/8
91
19
2/2
69
298/359855/714155/293
121/386478/731185/326
15
9/2
33
17
93
/16
56
70
/15
3
3/1
111
99
/13
32
28
1/1
99
430/26376/63
416/350
113/85108/3523/21
29
5/2
79
14
05
/10
75
45
1/2
05
25
3/3
92
94
8/1
05
94
20
/25
8
462/705510/1537
187/297
188/5131123/711145/292
116
/33
23
71
/13
27
10
48
/16
73
10
7/5
0
39/17236/94
0/1
19
13
/86
03
20
/28
3
37
1/6
60
70
2/1
43
82
/5
0/41/21/4
262/1860/1573/500
1241
/962
267/6
19
317/3
83
694/1
347
958/200281/176
131/1
51
4/7
33/11
178/1
04
11/3
8251/1
11
58/3221085/1402
241/208
32/63864/690106/258
25
/1111
3/2
12
9/9
1
88/1
67
18/9
78/1
04
401/169801/832
150/70
160/641031/1204465/233
4/0940/1118
1691/1455199/14
233/2
60
582/7
81
49/8
7
99/1
60
593/5
59
372/2
07
138/227402/1158174/266
60/881437/82898/112
0/1
2/8
3
861/9
95
3/1
2886/6
00
619/201510/72
7/181366/66043/116
50
3/1
84
38
8/3
31
1074/2187311/734
1658/112061/280
1. Nogales St &Amar Rd
2. Lemon Ave &Amar Rd
5. Grand Ave &Cameron Ave
6. Grand Ave &Montaineer Rd
9. Grand Ave &La Puente Rd
10. Grand Ave &Valley Blvd
15. Bonita Ave &Temple Ave
16. Lot F &Temple Ave
3. Grand Ave &I-10 WB Ramp
4. Grand Ave &I-10 EB Ramp
7. Grand Ave &San Jose Hills Rd
8. Grand Ave &Temple Ave
11. Grand Ave &Baker Pkwy
12. Grand Ave &SR-60 WB Ramps
17. Valley Blvd &Temple Ave
18. SR-57 SB Ramps &Temple Ave
14. Mt. SAC Wy &Temple Ave
13. Grand Ave &SR-60 EB Ramps
19. SR-57 NB Ramps &Temple Ave
TrafficImpactStudyDraftReport
42 Mt. SAC 2015 FMPU/PEP
As shown in Table 14, based on the thresholds of significance described in Section 3.1, the following intersections are forecast to be significantly impacted by the proposed 2020 project traffic plus cumulative conditions:
Grand Avenue/Cameron Avenue (a.m. peak hour);
Grand Avenue/Mountaineer Avenue (a.m. and p.m. peak hour);
Grand Avenue/San Jose Hills Road (a.m. and p.m. peak hour);
Grand Avenue/Temple Avenue (a.m. and p.m. peak hour);
Grand Avenue/La Puente Road (a.m. and p.m. peak hour);
Grand Avenue/Valley Boulevard (a.m. and p.m. peak hour);
Grand Avenue/Baker Parkway (a.m. peak hour);
Mt. SAC Way/Temple Avenue (a.m. and p.m. peak hour); and
Valley Boulevard/Temple Avenue (a.m. and p.m. peak hour).
10.2 EXISTING PLUS 2020 PROJECT PLUS CUMULATIVE MITIGATION MEASURES
In order to reduce significant traffic impacts to a level considered less than significant in existing plus 2020 project plus cumulative conditions, a list of mitigation measures have been developed. The following mitigation measures would be required to reduce the level of impact:
Grand Avenue/Cameron Avenue – Add a second eastbound right‐turn lane.
Grand Avenue/Mountaineer Road – A third northbound through lane is required to mitigate the project impact at this intersection. However, sufficient ROW is not available within the current curb width. As a result, improvements needed to mitigate this intersection are not considered feasible. A statement of overriding considerations is required.
Grand Avenue/San Jose Hills Road – A second eastbound right‐turn lane is required to mitigate the project impact at this intersection. However, sufficient ROW is not available due to adjacent land uses at the southwest and northwest corners of the intersection. As a result, improvements needed to mitigate this intersection are not considered feasible. A statement of overriding considerations is required.
Grand Avenue/Temple Avenue – Convert the existing eastbound right‐turn lane to a through/right‐turn lane.
Grand Avenue/La Puente Road – Modify the traffic signal to include an eastbound right‐turn overlap phase.
Grand Avenue/Valley Boulevard – This intersection is considered to be fully built out since it currently consists of dual left‐turn lanes at all approaches and dedicated free right‐turn lanes at three approaches. In addition, no improvements at this intersection are considered feasible due to ROW constraints. A statement of overriding considerations is required.
Grand Avenue/Baker Parkway – Restripe the northbound approach to include a third through lane.
Mt. SAC Way/Temple Avenue – Restripe the eastbound approach to include a dedicated right‐turn lane.
Valley Boulevard/Temple Avenue – Improvements needed to mitigate this intersection are not considered feasible due to the ROW constraints near the adjacent railroad. A statement of overriding considerations is required.
TrafficImpactStudyDraftReport
43 Mt. SAC 2015 FMPU/PEP
At the locations where mitigation measures are deemed feasible, if it is determined by the lead agency that the necessary right‐of‐way is not available and the proposed lane additions cannot be developed within the available right‐of‐way, then the impacts may not be mitigated. Table 15 summarizes the LOS results at the impacted intersections with implementation of the proposed mitigation measures that were determined to be feasible. It should be noted that project conditions with cumulative growth are compared to existing conditions, for significant impact determination, for the purposes of California Environmental Quality Act (CEQA) clearance.
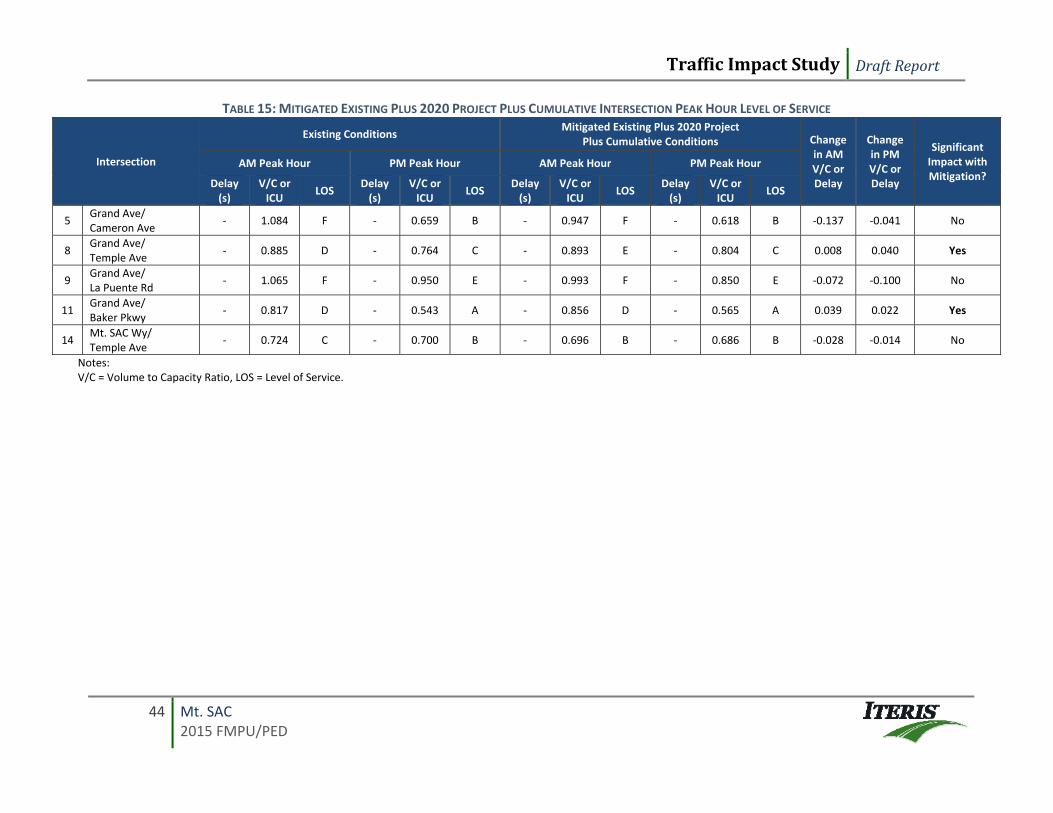
TrafficImpactStudy DraftReport
44 Mt. SAC 2015 FMPU/PED
TABLE 15: MITIGATED EXISTING PLUS 2020 PROJECT PLUS CUMULATIVE INTERSECTION PEAK HOUR LEVEL OF SERVICE
Intersection
Existing Conditions Mitigated Existing Plus 2020 Project
Plus Cumulative Conditions Change in AM V/C or Delay
Change in PM V/C or Delay
Significant Impact with Mitigation?
AM Peak Hour PM Peak Hour AM Peak Hour PM Peak Hour
Delay (s)
V/C or ICU
LOS Delay (s)
V/C or ICU
LOS Delay (s)
V/C or ICU
LOS Delay (s)
V/C or ICU
LOS
5 Grand Ave/ Cameron Ave
‐ 1.084 F ‐ 0.659 B ‐ 0.947 F ‐ 0.618 B ‐0.137 ‐0.041 No
8 Grand Ave/ Temple Ave
‐ 0.885 D ‐ 0.764 C ‐ 0.893 E ‐ 0.804 C 0.008 0.040 Yes
9 Grand Ave/ La Puente Rd
‐ 1.065 F ‐ 0.950 E ‐ 0.993 F ‐ 0.850 E ‐0.072 ‐0.100 No
11 Grand Ave/ Baker Pkwy
‐ 0.817 D ‐ 0.543 A ‐ 0.856 D ‐ 0.565 A 0.039 0.022 Yes
14 Mt. SAC Wy/ Temple Ave
‐ 0.724 C ‐ 0.700 B ‐ 0.696 B ‐ 0.686 B ‐0.028 ‐0.014 No
Notes: V/C = Volume to Capacity Ratio, LOS = Level of Service.
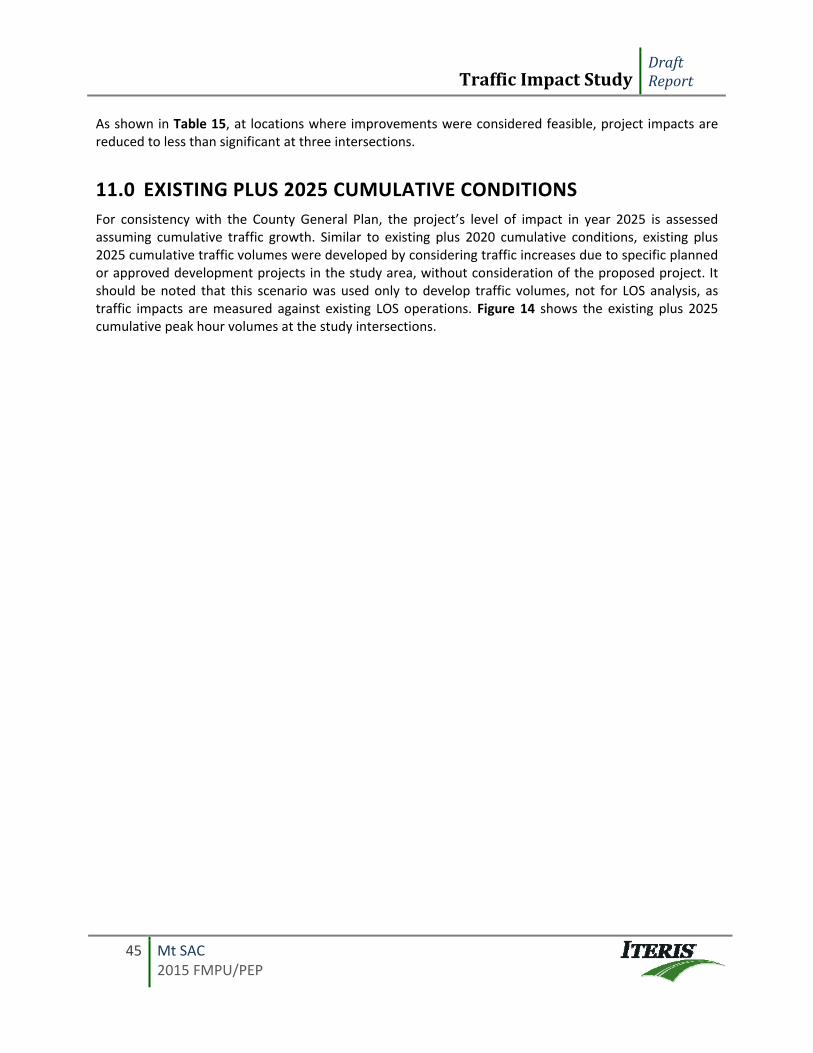
TrafficImpactStudyDraftReport
45 Mt SAC 2015 FMPU/PEP
As shown in Table 15, at locations where improvements were considered feasible, project impacts are reduced to less than significant at three intersections.
11.0 EXISTING PLUS 2025 CUMULATIVE CONDITIONS
For consistency with the County General Plan, the project’s level of impact in year 2025 is assessed assuming cumulative traffic growth. Similar to existing plus 2020 cumulative conditions, existing plus 2025 cumulative traffic volumes were developed by considering traffic increases due to specific planned or approved development projects in the study area, without consideration of the proposed project. It should be noted that this scenario was used only to develop traffic volumes, not for LOS analysis, as traffic impacts are measured against existing LOS operations. Figure 14 shows the existing plus 2025 cumulative peak hour volumes at the study intersections.
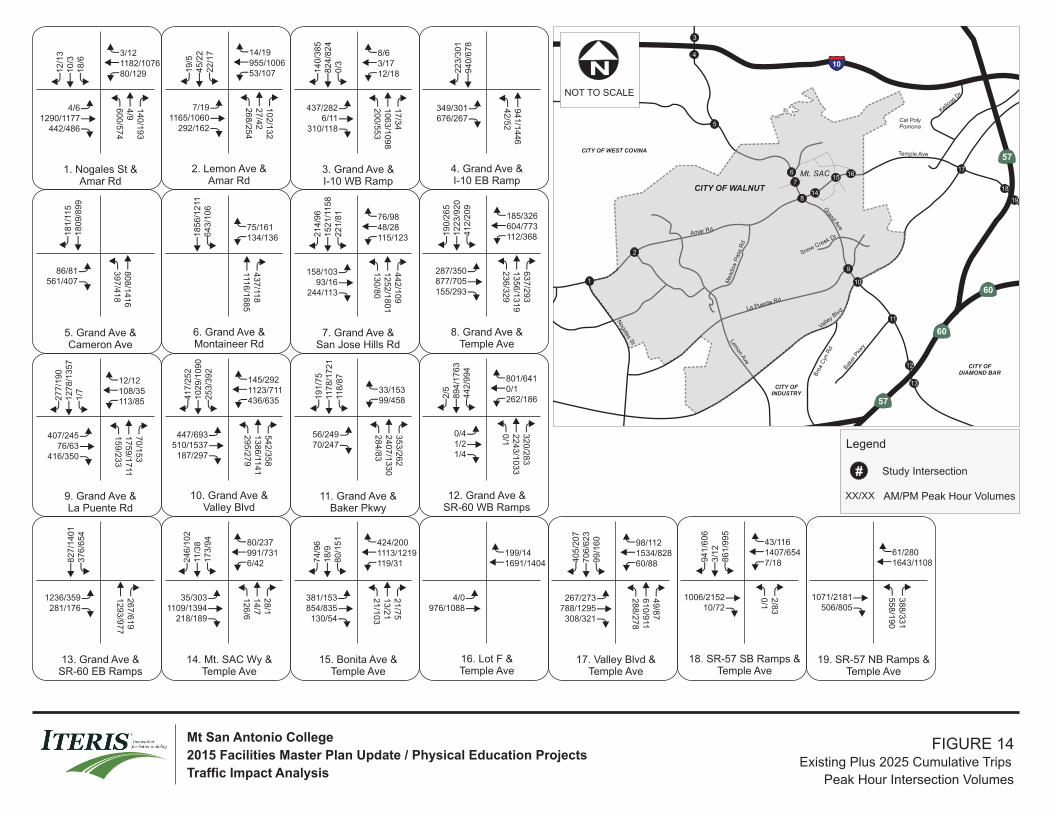
Lemon A
ve
Meadow
Pass
Rd
Temple Ave
Valley B
lvd
10
Bak
er P
kwy
Grand A
ve
Amar Rd
Nogales S
t
La Puente Rd
Bre
a C
yn R
d
Cal PolyPomona
Kellogg D
rCameron Ave
CITY OF WALNUT
57
60
57
60
CITY OF WEST COVINA
CITY OF INDUSTRY
CITY OF DIAMOND BAR
Snow Creek Dr
1
2
3
4
5
6
7
8
9
10
11
12
13
15
14
1617
18
19
Mt. SAC
NNOT TO SCALE
Legend
Study Intersection#
AM/PM Peak Hour VolumesXX/XX
FIGURE 14 Existing Plus 2025 Cumulative Trips
Peak Hour Intersection Volumes
Mt San Antonio College
2015 Facilities Master Plan Update / Physical Education Projects
Traffic Impact Analysis
60
0/5
74
4/9
14
0/1
93
18
/61
0/3
12
/13
4/61290/1177
442/486
80/1291182/10763/12
26
8/2
54
27
/42
10
2/1
32
22
/17
45
/22
19
/5
7/191165/1060
292/162
53/107955/100614/19
20
0/5
53
10
63
/10
98
17
/34
0/3
82
4/8
24
14
0/3
85
437/2826/11
310/118
12/183/178/6
42
/52
94
1/1
44
6
94
0/6
78
22
3/3
01
349/301676/267
39
7/4
18
80
8/1
41
6
18
09
/89
91
81
/11
5
86/81561/407
1116
/18
85
43
7/11
8
64
3/1
06
18
56
/12
11
134/13675/161
13
0/8
01
25
2/1
80
14
42
/10
9
22
1/8
11
52
1/1
15
82
14
/96
158/10393/16
244/113
115/12348/2876/98
23
6/3
29
13
56
/13
19
63
7/2
93
41
2/2
09
12
23
/92
01
90
/26
5
287/350877/705155/293
112/368604/773185/326
15
9/2
33
17
59
/17
117
0/1
53
1/7
12
78
/13
57
27
7/1
90
407/24576/63
416/350
113/85108/3512/12
29
5/2
79
13
86
/114
15
42
/35
8
25
3/3
92
10
29
/10
90
41
7/2
52
447/693510/1537
187/297
436/6351123/711145/292
28
4/8
32
40
7/1
33
03
53
/26
2
118
/87
117
8/1
72
11
91
/75
56/24970/247
99/45833/153
0/1
22
43
/10
33
32
0/2
83
44
2/9
94
89
4/1
76
32
/5
0/41/21/4
262/1860/1801/641
12
93/9
77
26
7/6
19
376/6
54
827/1
401
1236/359281/176
12
6/6
14
/72
8/1
173/9
411
/38
246/1
02
35/3031109/1394
218/189
6/42991/73180/237
21/1
03
13/2
121/7
5
80/1
51
18/9
74/9
6
381/153854/835
130/54
119/311113/1219424/200
4/0976/1088
1691/1404199/14
288/2
78
610/9
114
9/8
7
99/1
60
706/6
23
405/2
07
267/273788/1295
308/321
60/881534/82898/112
0/1
2/8
3
861/9
95
3/1
2941/6
06
1006/215210/72
7/181407/65443/116
55
8/1
90
38
8/3
31
1071/2181506/805
1643/110861/280
1. Nogales St &Amar Rd
2. Lemon Ave &Amar Rd
5. Grand Ave &Cameron Ave
6. Grand Ave &Montaineer Rd
9. Grand Ave &La Puente Rd
10. Grand Ave &Valley Blvd
15. Bonita Ave &Temple Ave
16. Lot F &Temple Ave
3. Grand Ave &I-10 WB Ramp
4. Grand Ave &I-10 EB Ramp
7. Grand Ave &San Jose Hills Rd
8. Grand Ave &Temple Ave
11. Grand Ave &Baker Pkwy
12. Grand Ave &SR-60 WB Ramps
17. Valley Blvd &Temple Ave
18. SR-57 SB Ramps &Temple Ave
14. Mt. SAC Wy &Temple Ave
13. Grand Ave &SR-60 EB Ramps
19. SR-57 NB Ramps &Temple Ave
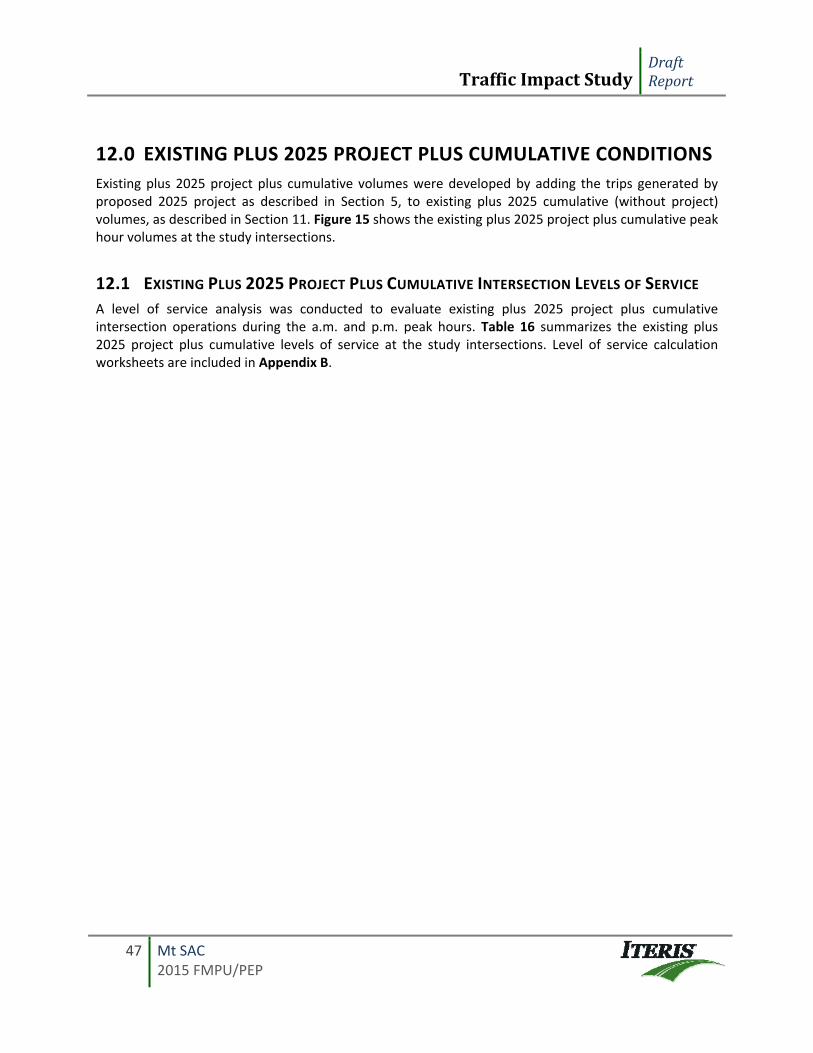
TrafficImpactStudyDraftReport
47 Mt SAC 2015 FMPU/PEP
12.0 EXISTING PLUS 2025 PROJECT PLUS CUMULATIVE CONDITIONS
Existing plus 2025 project plus cumulative volumes were developed by adding the trips generated by proposed 2025 project as described in Section 5, to existing plus 2025 cumulative (without project) volumes, as described in Section 11. Figure 15 shows the existing plus 2025 project plus cumulative peak hour volumes at the study intersections.
12.1 EXISTING PLUS 2025 PROJECT PLUS CUMULATIVE INTERSECTION LEVELS OF SERVICE
A level of service analysis was conducted to evaluate existing plus 2025 project plus cumulative intersection operations during the a.m. and p.m. peak hours. Table 16 summarizes the existing plus 2025 project plus cumulative levels of service at the study intersections. Level of service calculation worksheets are included in Appendix B.
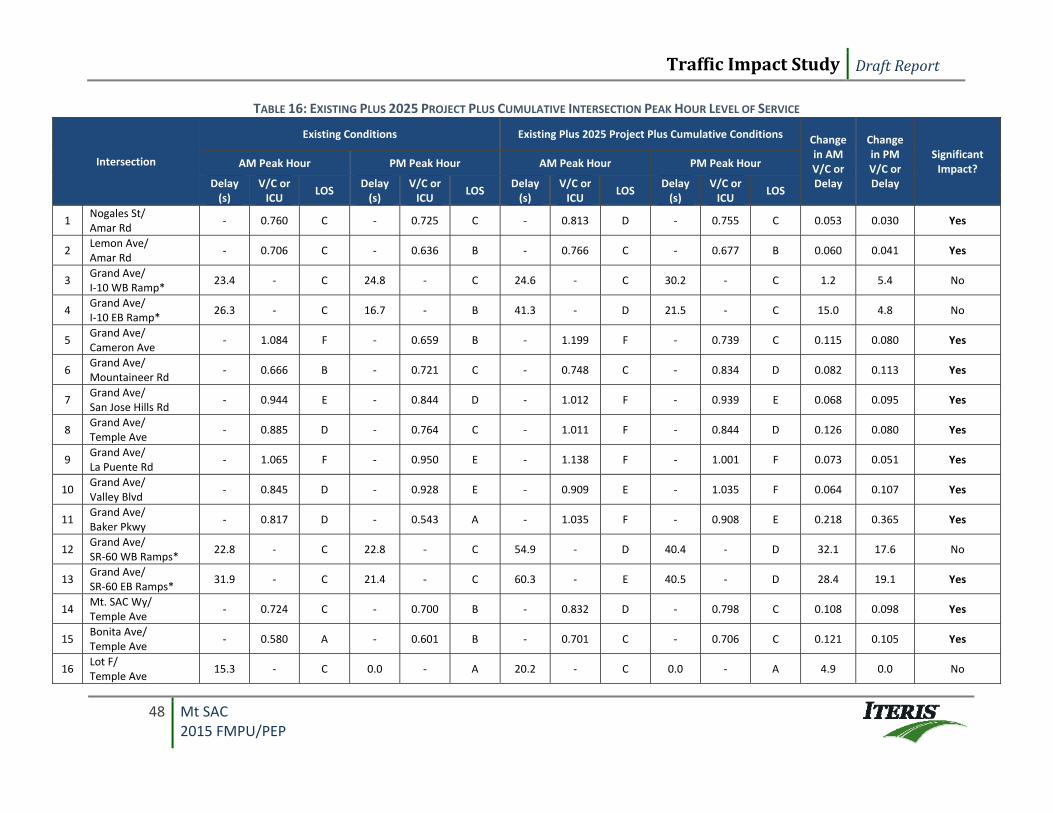
TrafficImpactStudy DraftReport
48 Mt SAC 2015 FMPU/PEP
TABLE 16: EXISTING PLUS 2025 PROJECT PLUS CUMULATIVE INTERSECTION PEAK HOUR LEVEL OF SERVICE
Intersection
Existing Conditions Existing Plus 2025 Project Plus Cumulative Conditions Change in AM V/C or Delay
Change in PM V/C or Delay
Significant Impact? AM Peak Hour PM Peak Hour AM Peak Hour PM Peak Hour
Delay (s)
V/C or ICU
LOS Delay (s)
V/C or ICU
LOS Delay (s)
V/C or ICU
LOS Delay (s)
V/C or ICU
LOS
1 Nogales St/ Amar Rd
‐ 0.760 C ‐ 0.725 C ‐ 0.813 D ‐ 0.755 C 0.053 0.030 Yes
2 Lemon Ave/ Amar Rd
‐ 0.706 C ‐ 0.636 B ‐ 0.766 C ‐ 0.677 B 0.060 0.041 Yes
3 Grand Ave/ I‐10 WB Ramp*
23.4 ‐ C 24.8 ‐ C 24.6 ‐ C 30.2 ‐ C 1.2 5.4 No
4 Grand Ave/ I‐10 EB Ramp*
26.3 ‐ C 16.7 ‐ B 41.3 ‐ D 21.5 ‐ C 15.0 4.8 No
5 Grand Ave/ Cameron Ave
‐ 1.084 F ‐ 0.659 B ‐ 1.199 F ‐ 0.739 C 0.115 0.080 Yes
6 Grand Ave/ Mountaineer Rd
‐ 0.666 B ‐ 0.721 C ‐ 0.748 C ‐ 0.834 D 0.082 0.113 Yes
7 Grand Ave/ San Jose Hills Rd
‐ 0.944 E ‐ 0.844 D ‐ 1.012 F ‐ 0.939 E 0.068 0.095 Yes
8 Grand Ave/ Temple Ave
‐ 0.885 D ‐ 0.764 C ‐ 1.011 F ‐ 0.844 D 0.126 0.080 Yes
9 Grand Ave/ La Puente Rd
‐ 1.065 F ‐ 0.950 E ‐ 1.138 F ‐ 1.001 F 0.073 0.051 Yes
10 Grand Ave/ Valley Blvd
‐ 0.845 D ‐ 0.928 E ‐ 0.909 E ‐ 1.035 F 0.064 0.107 Yes
11 Grand Ave/ Baker Pkwy
‐ 0.817 D ‐ 0.543 A ‐ 1.035 F ‐ 0.908 E 0.218 0.365 Yes
12 Grand Ave/ SR‐60 WB Ramps*
22.8 ‐ C 22.8 ‐ C 54.9 ‐ D 40.4 ‐ D 32.1 17.6 No
13 Grand Ave/ SR‐60 EB Ramps*
31.9 ‐ C 21.4 ‐ C 60.3 ‐ E 40.5 ‐ D 28.4 19.1 Yes
14 Mt. SAC Wy/ Temple Ave
‐ 0.724 C ‐ 0.700 B ‐ 0.832 D ‐ 0.798 C 0.108 0.098 Yes
15 Bonita Ave/ Temple Ave
‐ 0.580 A ‐ 0.601 B ‐ 0.701 C ‐ 0.706 C 0.121 0.105 Yes
16 Lot F/ Temple Ave
15.3 ‐ C 0.0 ‐ A 20.2 ‐ C 0.0 ‐ A 4.9 0.0 No
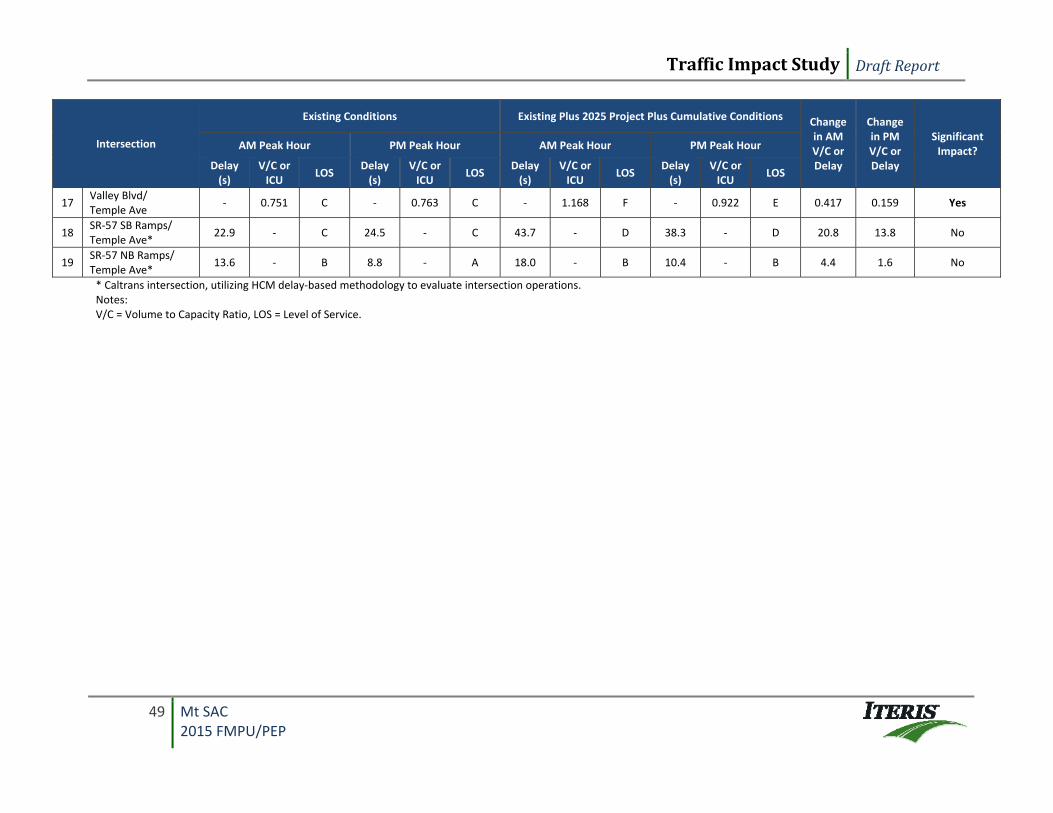
TrafficImpactStudy DraftReport
49 Mt SAC 2015 FMPU/PEP
Intersection
Existing Conditions Existing Plus 2025 Project Plus Cumulative Conditions Change in AM V/C or Delay
Change in PM V/C or Delay
Significant Impact? AM Peak Hour PM Peak Hour AM Peak Hour PM Peak Hour
Delay (s)
V/C or ICU
LOS Delay (s)
V/C or ICU
LOS Delay (s)
V/C or ICU
LOS Delay (s)
V/C or ICU
LOS
17 Valley Blvd/ Temple Ave
‐ 0.751 C ‐ 0.763 C ‐ 1.168 F ‐ 0.922 E 0.417 0.159 Yes
18 SR‐57 SB Ramps/ Temple Ave*
22.9 ‐ C 24.5 ‐ C 43.7 ‐ D 38.3 ‐ D 20.8 13.8 No
19 SR‐57 NB Ramps/ Temple Ave*
13.6 ‐ B 8.8 ‐ A 18.0 ‐ B 10.4 ‐ B 4.4 1.6 No
* Caltrans intersection, utilizing HCM delay‐based methodology to evaluate intersection operations. Notes: V/C = Volume to Capacity Ratio, LOS = Level of Service.
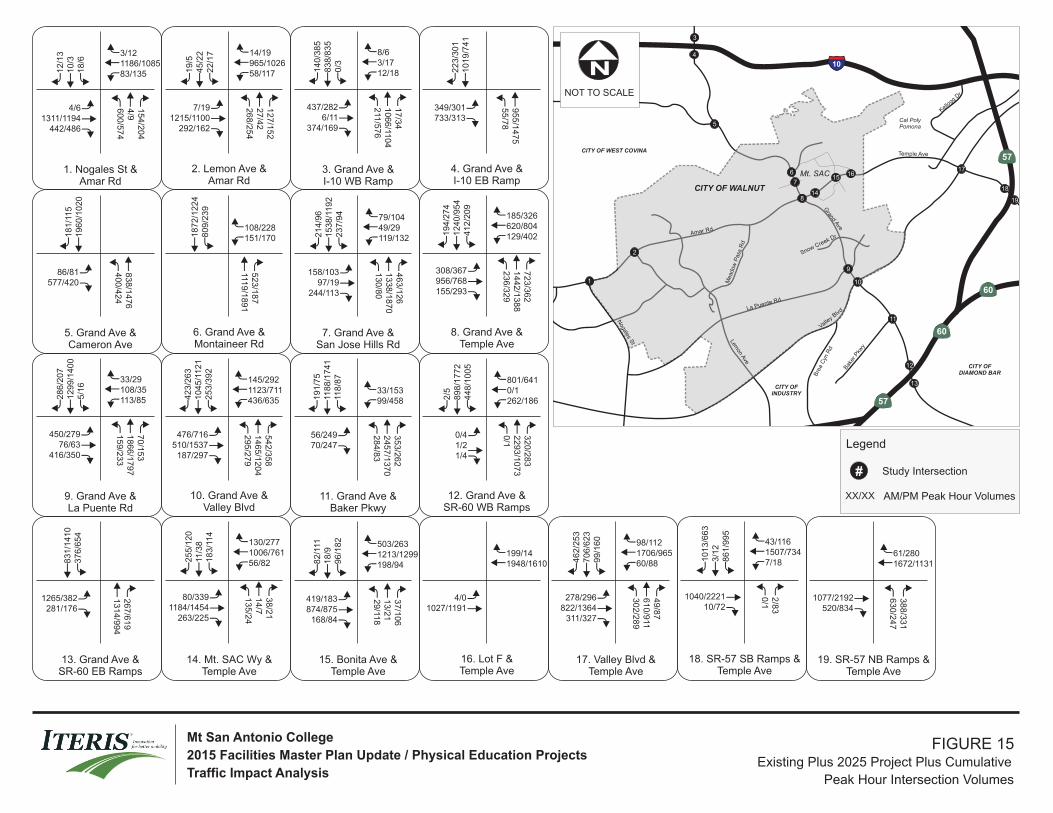
Lemon A
ve
Meadow
Pass
Rd
Temple Ave
Valley B
lvd
10
Bak
er P
kwy
Grand A
ve
Amar Rd
Nogales S
t
La Puente Rd
Bre
a C
yn R
d
Cal PolyPomona
Kellogg D
rCameron Ave
CITY OF WALNUT
57
60
57
60
CITY OF WEST COVINA
CITY OF INDUSTRY
CITY OF DIAMOND BAR
Snow Creek Dr
1
2
3
4
5
6
7
8
9
10
11
12
13
15
14
1617
18
19
Mt. SAC
NNOT TO SCALE
Legend
Study Intersection#
AM/PM Peak Hour VolumesXX/XX
FIGURE 15 Existing Plus 2025 Project Plus Cumulative
Peak Hour Intersection Volumes
Mt San Antonio College
2015 Facilities Master Plan Update / Physical Education Projects
Traffic Impact Analysis
60
0/5
74
4/9
15
4/2
04
18
/61
0/3
12
/13
4/61311/1194
442/486
83/1351186/10853/12
26
8/2
54
27
/42
12
7/1
52
22
/17
45
/22
19
/5
7/191215/1100
292/162
58/117965/102614/19
211
/57
61
06
6/11
04
17
/34
0/3
83
8/8
35
14
0/3
85
437/2826/11
374/169
12/183/178/6
55
/78
95
5/1
47
5
10
19
/74
12
23
/30
1
349/301733/313
40
0/4
24
83
8/1
47
6
19
60
/10
20
18
1/1
15
86/81577/420
1119
/18
91
52
3/1
87
80
9/2
39
18
72
/12
24
151/170108/228
13
0/8
01
33
8/1
87
04
63
/12
6
23
7/9
41
53
8/1
19
22
14
/96
158/10397/19
244/113
119/13249/2979/104
23
6/3
29
14
42
/13
88
72
3/3
62
41
2/2
09
12
40
/95
41
94
/27
4
308/367956/768155/293
129/402620/804185/326
15
9/2
33
18
66
/17
97
70
/15
3
5/1
61
29
9/1
40
02
86
/20
7
450/27976/63
416/350
113/85108/3533/29
29
5/2
79
14
65
/12
04
54
2/3
58
25
3/3
92
10
45
/11
21
42
3/2
63
476/716510/1537
187/297
436/6351123/711145/292
28
4/8
32
45
7/1
37
03
53
/26
2
118
/87
118
8/1
74
11
91
/75
56/24970/247
99/45833/153
0/1
22
93
/10
73
32
0/2
83
44
8/1
00
58
98
/17
72
2/5
0/41/21/4
262/1860/1801/641
131
4/9
94
267
/619
376/6
54
831/1
410
1265/382281/176
13
5/2
414
/738
/21
183/1
14
11/3
8255/1
20
80/3391184/1454
263/225
56/821006/761130/277
29
/118
13
/21
37
/106
96/1
82
18/9
82/1
11
419/183874/875
168/84
198/941213/1299503/263
4/01027/1191
1948/1610199/14
30
2/2
89
61
0/9
1149
/87
99/1
60
706/6
23
462/2
53
278/296822/1364
311/327
60/881706/96598/112
0/1
2/8
3
861/9
95
3/1
21013/6
63
1040/222110/72
7/181507/73443/116
630/2
47
388/3
31
1077/2192520/834
1672/113161/280
1. Nogales St &Amar Rd
2. Lemon Ave &Amar Rd
5. Grand Ave &Cameron Ave
6. Grand Ave &Montaineer Rd
9. Grand Ave &La Puente Rd
10. Grand Ave &Valley Blvd
15. Bonita Ave &Temple Ave
16. Lot F &Temple Ave
3. Grand Ave &I-10 WB Ramp
4. Grand Ave &I-10 EB Ramp
7. Grand Ave &San Jose Hills Rd
8. Grand Ave &Temple Ave
11. Grand Ave &Baker Pkwy
12. Grand Ave &SR-60 WB Ramps
17. Valley Blvd &Temple Ave
18. SR-57 SB Ramps &Temple Ave
14. Mt. SAC Wy &Temple Ave
13. Grand Ave &SR-60 EB Ramps
19. SR-57 NB Ramps &Temple Ave
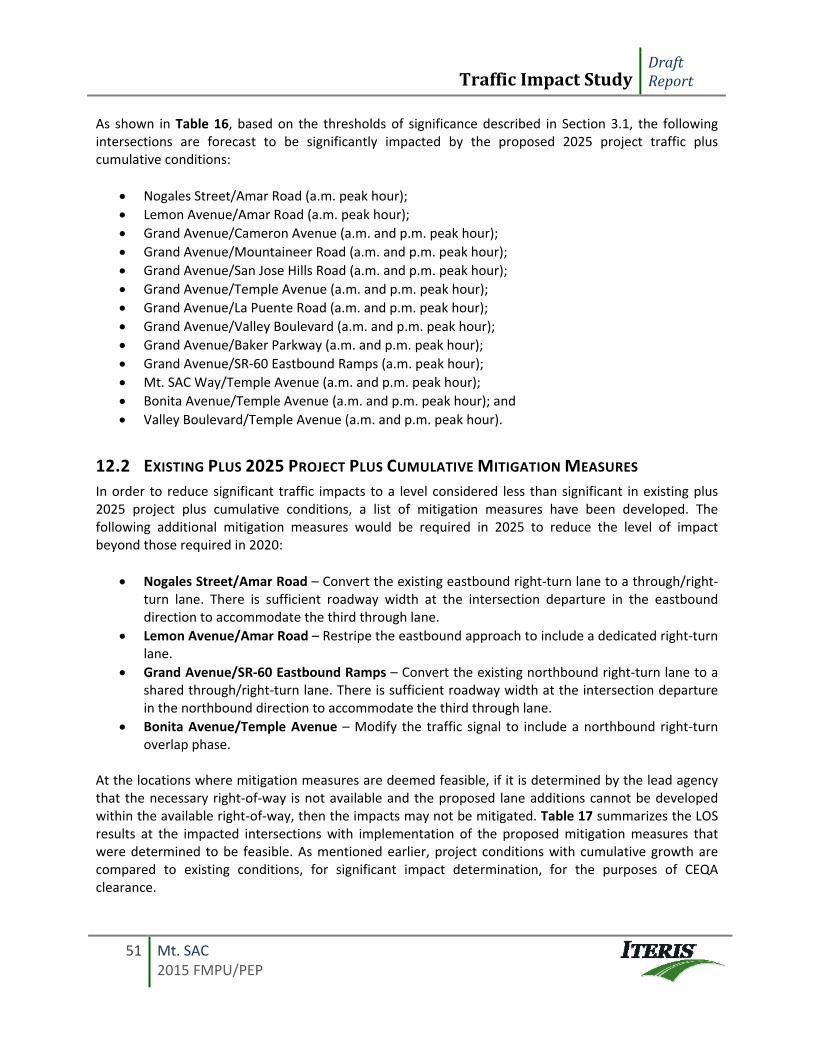
TrafficImpactStudyDraftReport
51 Mt. SAC 2015 FMPU/PEP
As shown in Table 16, based on the thresholds of significance described in Section 3.1, the following intersections are forecast to be significantly impacted by the proposed 2025 project traffic plus cumulative conditions:
Nogales Street/Amar Road (a.m. peak hour);
Lemon Avenue/Amar Road (a.m. peak hour);
Grand Avenue/Cameron Avenue (a.m. and p.m. peak hour);
Grand Avenue/Mountaineer Road (a.m. and p.m. peak hour);
Grand Avenue/San Jose Hills Road (a.m. and p.m. peak hour);
Grand Avenue/Temple Avenue (a.m. and p.m. peak hour);
Grand Avenue/La Puente Road (a.m. and p.m. peak hour);
Grand Avenue/Valley Boulevard (a.m. and p.m. peak hour);
Grand Avenue/Baker Parkway (a.m. and p.m. peak hour);
Grand Avenue/SR‐60 Eastbound Ramps (a.m. peak hour);
Mt. SAC Way/Temple Avenue (a.m. and p.m. peak hour);
Bonita Avenue/Temple Avenue (a.m. and p.m. peak hour); and
Valley Boulevard/Temple Avenue (a.m. and p.m. peak hour).
12.2 EXISTING PLUS 2025 PROJECT PLUS CUMULATIVE MITIGATION MEASURES
In order to reduce significant traffic impacts to a level considered less than significant in existing plus 2025 project plus cumulative conditions, a list of mitigation measures have been developed. The following additional mitigation measures would be required in 2025 to reduce the level of impact beyond those required in 2020:
Nogales Street/Amar Road – Convert the existing eastbound right‐turn lane to a through/right‐turn lane. There is sufficient roadway width at the intersection departure in the eastbound direction to accommodate the third through lane.
Lemon Avenue/Amar Road – Restripe the eastbound approach to include a dedicated right‐turn lane.
Grand Avenue/SR‐60 Eastbound Ramps – Convert the existing northbound right‐turn lane to a shared through/right‐turn lane. There is sufficient roadway width at the intersection departure in the northbound direction to accommodate the third through lane.
Bonita Avenue/Temple Avenue – Modify the traffic signal to include a northbound right‐turn overlap phase.
At the locations where mitigation measures are deemed feasible, if it is determined by the lead agency that the necessary right‐of‐way is not available and the proposed lane additions cannot be developed within the available right‐of‐way, then the impacts may not be mitigated. Table 17 summarizes the LOS results at the impacted intersections with implementation of the proposed mitigation measures that were determined to be feasible. As mentioned earlier, project conditions with cumulative growth are compared to existing conditions, for significant impact determination, for the purposes of CEQA clearance.
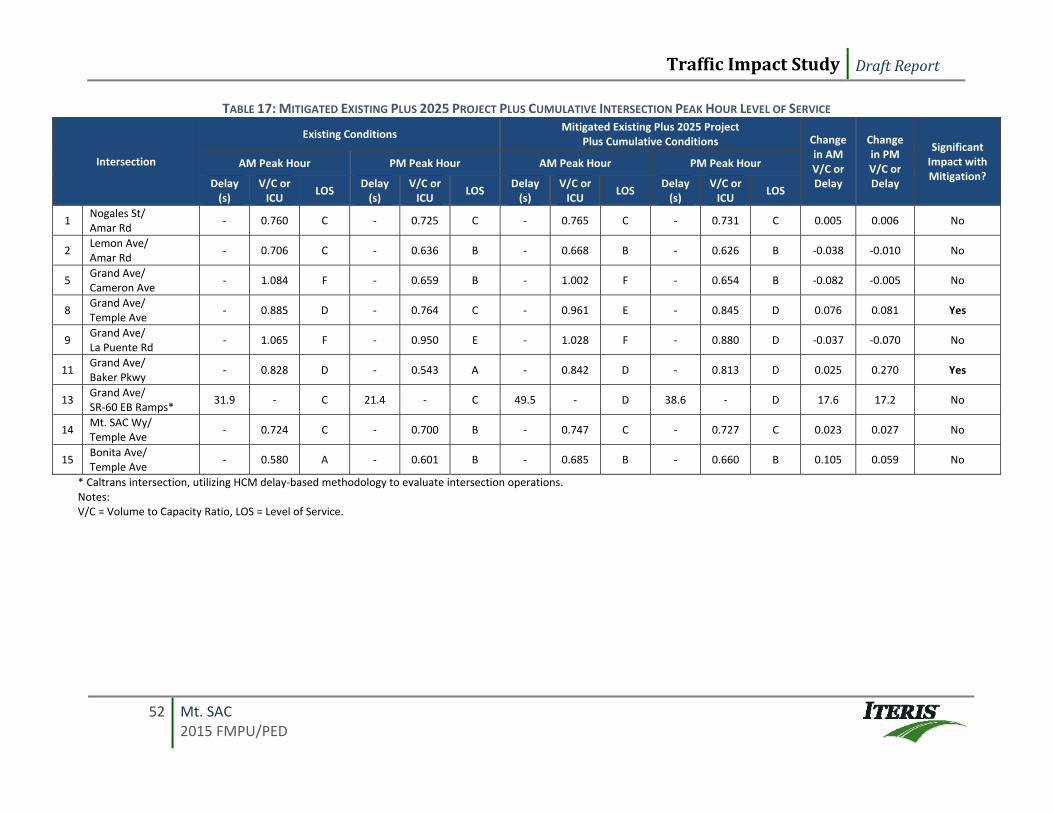
TrafficImpactStudy DraftReport
52 Mt. SAC 2015 FMPU/PED
TABLE 17: MITIGATED EXISTING PLUS 2025 PROJECT PLUS CUMULATIVE INTERSECTION PEAK HOUR LEVEL OF SERVICE
Intersection
Existing Conditions Mitigated Existing Plus 2025 Project
Plus Cumulative Conditions Change in AM V/C or Delay
Change in PM V/C or Delay
Significant Impact with Mitigation?
AM Peak Hour PM Peak Hour AM Peak Hour PM Peak Hour
Delay (s)
V/C or ICU
LOS Delay (s)
V/C or ICU
LOS Delay (s)
V/C or ICU
LOS Delay (s)
V/C or ICU
LOS
1 Nogales St/ Amar Rd
‐ 0.760 C ‐ 0.725 C ‐ 0.765 C ‐ 0.731 C 0.005 0.006 No
2 Lemon Ave/ Amar Rd
‐ 0.706 C ‐ 0.636 B ‐ 0.668 B ‐ 0.626 B ‐0.038 ‐0.010 No
5 Grand Ave/ Cameron Ave
‐ 1.084 F ‐ 0.659 B ‐ 1.002 F ‐ 0.654 B ‐0.082 ‐0.005 No
8 Grand Ave/ Temple Ave
‐ 0.885 D ‐ 0.764 C ‐ 0.961 E ‐ 0.845 D 0.076 0.081 Yes
9 Grand Ave/ La Puente Rd
‐ 1.065 F ‐ 0.950 E ‐ 1.028 F ‐ 0.880 D ‐0.037 ‐0.070 No
11 Grand Ave/ Baker Pkwy
‐ 0.828 D ‐ 0.543 A ‐ 0.842 D ‐ 0.813 D 0.025 0.270 Yes
13 Grand Ave/ SR‐60 EB Ramps*
31.9 ‐ C 21.4 ‐ C 49.5 ‐ D 38.6 ‐ D 17.6 17.2 No
14 Mt. SAC Wy/ Temple Ave
‐ 0.724 C ‐ 0.700 B ‐ 0.747 C ‐ 0.727 C 0.023 0.027 No
15 Bonita Ave/ Temple Ave
‐ 0.580 A ‐ 0.601 B ‐ 0.685 B ‐ 0.660 B 0.105 0.059 No
* Caltrans intersection, utilizing HCM delay‐based methodology to evaluate intersection operations. Notes: V/C = Volume to Capacity Ratio, LOS = Level of Service.
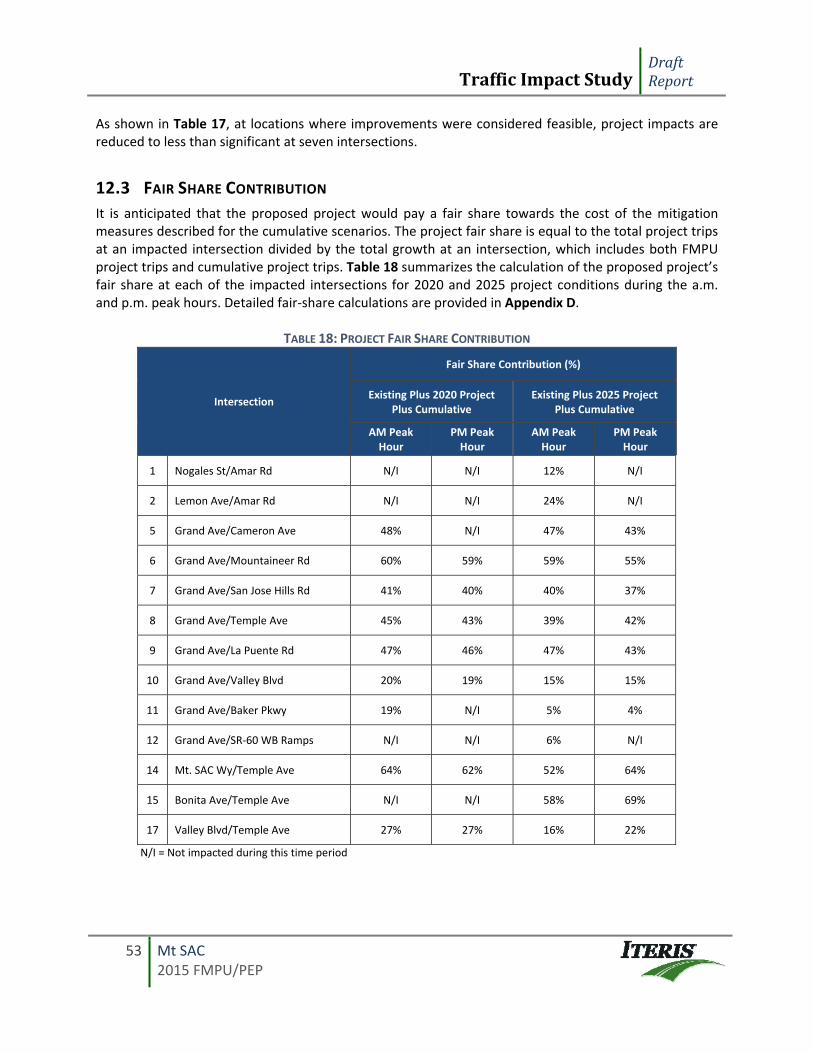
TrafficImpactStudyDraftReport
53 Mt SAC 2015 FMPU/PEP
As shown in Table 17, at locations where improvements were considered feasible, project impacts are reduced to less than significant at seven intersections.
12.3 FAIR SHARE CONTRIBUTION
It is anticipated that the proposed project would pay a fair share towards the cost of the mitigation measures described for the cumulative scenarios. The project fair share is equal to the total project trips at an impacted intersection divided by the total growth at an intersection, which includes both FMPU project trips and cumulative project trips. Table 18 summarizes the calculation of the proposed project’s fair share at each of the impacted intersections for 2020 and 2025 project conditions during the a.m. and p.m. peak hours. Detailed fair‐share calculations are provided in Appendix D.
TABLE 18: PROJECT FAIR SHARE CONTRIBUTION
Intersection
Fair Share Contribution (%)
Existing Plus 2020 Project Plus Cumulative
Existing Plus 2025 Project Plus Cumulative
AM Peak Hour
PM Peak Hour
AM Peak Hour
PM Peak Hour
1 Nogales St/Amar Rd N/I N/I 12% N/I
2 Lemon Ave/Amar Rd N/I N/I 24% N/I
5 Grand Ave/Cameron Ave 48% N/I 47% 43%
6 Grand Ave/Mountaineer Rd 60% 59% 59% 55%
7 Grand Ave/San Jose Hills Rd 41% 40% 40% 37%
8 Grand Ave/Temple Ave 45% 43% 39% 42%
9 Grand Ave/La Puente Rd 47% 46% 47% 43%
10 Grand Ave/Valley Blvd 20% 19% 15% 15%
11 Grand Ave/Baker Pkwy 19% N/I 5% 4%
12 Grand Ave/SR‐60 WB Ramps N/I N/I 6% N/I
14 Mt. SAC Wy/Temple Ave 64% 62% 52% 64%
15 Bonita Ave/Temple Ave N/I N/I 58% 69%
17 Valley Blvd/Temple Ave 27% 27% 16% 22%
N/I = Not impacted during this time period
TrafficImpactStudyDraftReport
54 Mt SAC 2015 FMPU/PEP
13.0 CONGESTION MANAGEMENT PROGRAM ANALYSIS (CMP)
The Congestion Management Program (CMP) was created statewide as a result of Proposition 111 and has been implemented locally by the Los Angeles County Metropolitan Transportation Authority (Metro). The CMP for Los Angeles County requires that the traffic impact of individual development projects of potential regional significance be analyzed. A specific system of arterial roadways plus all freeways comprise the CMP system. A total of 164 intersections are identified for monitoring on the system in Los Angeles County. This section describes the analysis of project‐related impacts on the CMP system. The analysis has been conducted according to the guidelines set forth in the 2004 Congestion Management Program for Los Angeles County. According to the CMP Traffic Impact Analysis (TIA) Guidelines developed by Metro, a CMP traffic impact analysis is required given the following conditions:
CMP arterial monitoring intersections, including freeway on‐ or off‐ramps, where the proposed project would add 50 or more trips during either the a.m. or p.m. weekday peak hours.
CMP freeway monitoring locations where the proposed project would add 150 or more trips, in either direction, during either the a.m. or p.m. weekday peak hours.
The nearest freeway segments are the I‐10, SR‐60, and SR‐57. Based on the project trip generation estimates, the proposed project would add less than 150 new peak hour trips in either direction at the three freeway segments. Therefore, no CMP mainline freeway segment analysis was conducted in this report.
14.0 CONCLUSIONS Mt. SAC has proposed a 2015 Facilities Master Plan Update, for which the major change from the 2012 FMP is the re‐design of the athletic facilities south of Temple Avenue and east of Bonita Avenue. The existing stadium will be demolished and a new stadium built on the site. Other changes for the 2015 FMPU include the relocation of the Public Transportation Center to Lot D3, and expanded Wildlife Sanctuary and Open Space area, and a pedestrian bridge across Temple Avenue connecting the Physical Education Complex to Lot F. The net increase in square footage at 2015 FMPU buildout is approximately 500,000 gross square feet. Traffic operations were assessed for existing conditions, 2020 conditions, and 2025 conditions. Under existing conditions, the following four intersections are operating at LOS E or worse:
Grand Avenue/Cameron Avenue (a.m. peak hour);
Grand Avenue/San Jose Hills Road (a.m. peak hour);
Grand Avenue/La Puente Road (a.m. and p.m. peak hour); and
Grand Avenue/Valley Boulevard (p.m. peak hour). The buildout of the 2015 FMPU project in 2020 is forecast to generate 449 new a.m. peak hour trips, 449 new p.m. peak hour trips, and 4,606 new daily trips when compared to existing conditions. By 2025 the project is forecast to generate 858 new a.m. peak hour trips, 858 new p.m. peak hour trips, and 8,798 new daily trips when compared to existing conditions.
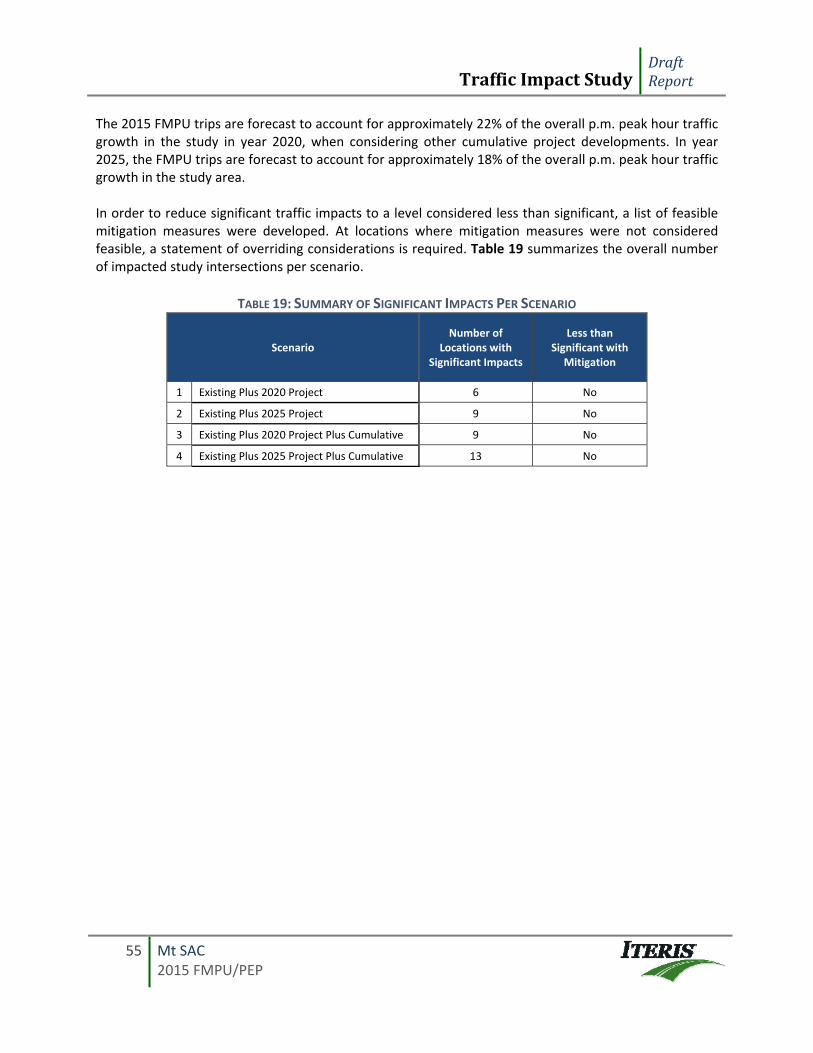
TrafficImpactStudyDraftReport
55 Mt SAC 2015 FMPU/PEP
The 2015 FMPU trips are forecast to account for approximately 22% of the overall p.m. peak hour traffic growth in the study in year 2020, when considering other cumulative project developments. In year 2025, the FMPU trips are forecast to account for approximately 18% of the overall p.m. peak hour traffic growth in the study area. In order to reduce significant traffic impacts to a level considered less than significant, a list of feasible mitigation measures were developed. At locations where mitigation measures were not considered feasible, a statement of overriding considerations is required. Table 19 summarizes the overall number of impacted study intersections per scenario.
TABLE 19: SUMMARY OF SIGNIFICANT IMPACTS PER SCENARIO
Scenario Number of
Locations with Significant Impacts
Less than Significant with
Mitigation
1 Existing Plus 2020 Project 6 No
2 Existing Plus 2025 Project 9 No
3 Existing Plus 2020 Project Plus Cumulative 9 No
4 Existing Plus 2025 Project Plus Cumulative 13 No