M-REAL YEAR 2004 - Euroland · 3 M-real’s year 2004 ... such as: beauty care, health care, foods,...
88
Annual financial report M-REAL YEAR 2004
Transcript of M-REAL YEAR 2004 - Euroland · 3 M-real’s year 2004 ... such as: beauty care, health care, foods,...
Annual fi nancial report
M-REAL YEAR2004

M-real Corporation publishes the following fi nancial reports in 2005 ■
on Friday 4 FebruaryFinancial results for fi nancial year 2004
on Thursday 28 April Interim report for January–March
on Friday 29 July Interim report for January–June
on Friday 28 OctoberInterim report for January–September
Annual General Meeting ■ The Annual General Meeting of
M-real Corporation will be held at the company’s Head Offi ce, Revontulentie 6, 02100 Espoo, on Monday, 14 March 2005, beginning at 2 p.m. Finnish time.
Shareholders wishing to take part in the Annual General Meeting and to exercise their right to vote must be registered in the list of shareholders kept by Finnish Central Securities Depository Ltd by 4 March 2005 at the latest and should announce their intention to attend the meeting before 4 p.m. Finnish time on 10 March 2005, either by tele-phoning Mrs Eija Niittynen on +358 10 469 4530, by sending a telefax to Mrs Eija Niittynen on +358 10 469 4529 or an e-mail message to [email protected] or by writing to M-real Cor-poration, Mrs Eija Niittynen, Revontulentie 6, 02100 Espoo, Finland. It is requested that any proxies be submitted during the advance registration.
The Board of Directors proposes that a dividend of euros 0.12 per share for the 2004 fi nancial year be paid on 24 March 2005 to shareholders who are entered by 17 March 2005 at the latest in the list of share holders kept by the Finnish Central Securities Depository Ltd.
Share register ■ Shareholders are requested to inform the
book-entry register which holds their book entry account of any changes in name, address or share ownership.
Additional information to shareholders and investors ■ Additional informa-
tion to shareholders and investors is available in the section Shares and shareholders on pages 56 through 61 and M-real’s fi nancial communication and investor relations on page 84.
Information to shareholders

Contents
■ M-real briefl y 2 Business areas 3 M-real’s year 2004
4 President’s review
■ Financial statement 5 Report of the Board of Directors 14 Consolidated Profi t and Loss Account 15 Profi t analysis 16 Consolidated Balance Sheet 18 Balance sheet analysis 19 Cash fl ow statements 20 Cash fl ow analysis 21 Parent Company Profi t and Loss Account 22 Parent Company Balance Sheet 24 Accounting principles 27 Notes to the Accounts 46 Corporate Governance General issues
52 M-real Board of Directors 54 Corporate Executive Board
56 Shares and shareholders 62 Ten years in fi gures 63 Calculation of key ratios 64 Board’s proposal for the distribution of profi ts 65 Auditor’s report
■ Additional information 66 Strategy 67 Financial targets 68 Operating environment 70 Resources 72 Risk management
76 Business operations 2004 76 Cartons 77 Graphics Products and Speciality Papers 78 Offi ces 79 Map Merchant Group 80 Quarterly data 82 Production capacities
84 M-real’s fi nancial communications and investor relations
1

M-real briefl y
■ M-real is one of the leading producers of fi ne paper and paperboard in Europe. The company focuses on four core businesses: Consumer Packaging, Publishing, Commercial Printing and Offi ce Papers. M-real’s global clientele consists mainly of publish-ers, printers, paper merchants, offi ces and well-known consumer product manufacturers as well as carton printers.
M-real aims at enhancing its customers’ busi-nesses by providing excellent wood fi bre based solutions for consumer packaging, communications and advertising purposes. Together with customers and partners, M-real develops new innovations for demanding applications, such as magazines, art books, brochures, direct mail and offi ce papers, as well as cartons for beauty and health care products, cigarettes, branded food and consumer durables. M-real’s brands include Galerie, Euro Art, Data Copy
M-real briefl y
Business areas■ M-real renewed its organisation in August 2004 and
also the new business areas were formed. They are introduced here. However, the fi nancial statement information for 2004 is reported in accordance with the old business area structure. The old business areas are: Cartons, Graphics Products and Speciality Paper, Offi ces and Map Merchant Group.
Consumer Packaging ■ The Consumer Packaging business area offers high performance paper-boards, packaging solutions and related services to carton printers and brand owners in industries such as: beauty care, health care, foods, cigarettes and consumer durables. The product range also includes high quality graphic boards, wallpaper base and papers for fl exible packaging, labelling and self-adhesive laminates.
Publishing ■ The Publishing business area provides a coated paper range of Galerie Papers for demand-ing applications, such as magazines, product cata-logues, direct mail and sales promotion materials. Galerie Papers have an excellent reproduction quality, even in very low weights, and are highly regarded by leading publishers, printers and brand owners around the world.
Commercial Printing ■ The Commercial Printing business area produces added value fi ne papers for promotion and corporate communications. Art books, brochures, annual reports, direct mailings, fl yers, inserts, leafl ets are characteristic products made of this choice paper. The end users are primarily professionals working in marketing and corporate communications. The products are typi-cally sold through merchant partners.
Offi ce Papers ■ The Offi ce Papers business area focuses on high quality offi ce papers used in the business environment. The product portfolio meets the needs of all types of users, from the smallest home offi ces through to large corporations and government institutions. The products are designed to provide the highest performance in various print-ing technologies applications.
Map Merchant Group ■ Map Merchant Group is the third largest merchant group in Europe and is made up of 24 individual merchant companies, active in 22 countries with links across the globe. It serves some 50 000 customers, principally print-ers, publishers, advertising agencies, banks and retail chains throughout Europe. Map supplies both M-real’s and other manufacturers’ paper grades.
and Logic fi ne papers, and Carta and Avanta boards.M-real has 26 production units in nine Euro-
pean countries; Austria, Belgium, Finland, France, Germany, Hungary, Sweden, Switzerland and the UK. Total annual production capacity amounts to about 4.7 million tonnes of paper and 1.0 million tonnes of paperboard.
M-real has an extensive sales network with offi ces and representatives in more than 70 countries and a merchanting arm, Map Merchant Group, with offi ces in 22 European countries. M-real’s four technology centres in Finland, Germany and Sweden focus on the development of new products and services to meet customers’ needs in specifi c areas.
M-real Corporation, which generated a turnover of 5.5 billion euros in 2004, employs nearly 16 000 peop le. Headquartered in Finland, M-real Corpora-tion is listed on the Helsinki Stock Exchange.
2
M-real briefl y
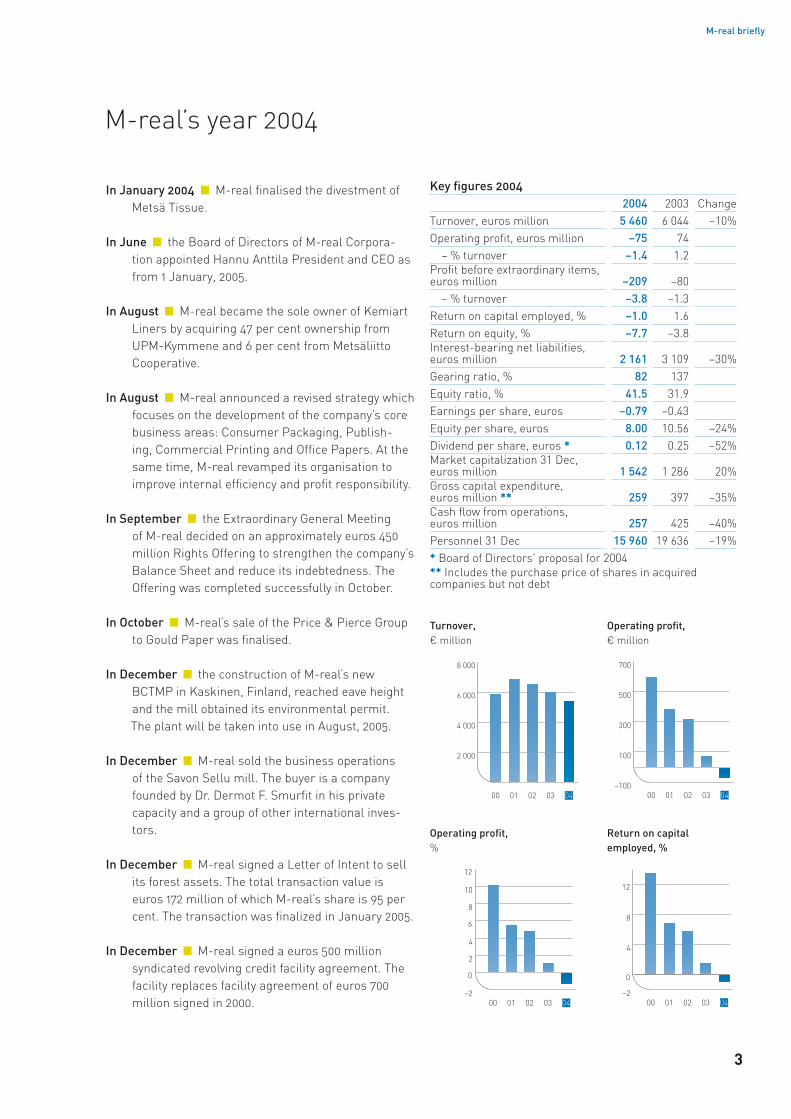
Key fi gures 20042004 2003 Change
Turnover, euros million 5 460 6 044 –10%Operating profi t, euros million –75 74 – % turnover –1.4 1.2Profi t before extraordinary items, euros million –209 –80 – % turnover –3.8 –1.3Return on capital employed, % –1.0 1.6Return on equity, % –7.7 –3.8Interest-bearing net liabilities, euros million 2 161 3 109 –30%Gearing ratio, % 82 137Equity ratio, % 41.5 31.9Earnings per share, euros –0.79 –0.43Equity per share, euros 8.00 10.56 –24%Dividend per share, euros * 0.12 0.25 –52%Market capitalization 31 Dec, euros million 1 542 1 286 20%Gross capital expenditure, euros million ** 259 397 –35%Cash fl ow from operations, euros million 257 425 –40%Personnel 31 Dec 15 960 19 636 –19%* Board of Directors’ proposal for 2004** Includes the purchase price of shares in acquired companies but not debt
M-real’s year 2004
In January 2004 ■ M-real fi nalised the divestment of Metsä Tissue.
In June ■ the Board of Directors of M-real Corpora-tion appointed Hannu Anttila President and CEO as from 1 January, 2005.
In August ■ M-real became the sole owner of Kemiart Liners by acquiring 47 per cent ownership from UPM-Kymmene and 6 per cent from Metsäliitto Cooperative.
In August ■ M-real announced a revised strategy which focuses on the development of the company’s core business areas: Consumer Packaging, Publish-ing, Commercial Printing and Offi ce Papers. At the same time, M-real revamped its organisation to improve internal effi ciency and profi t responsibility.
In September ■ the Extraordinary General Meeting of M-real decided on an approximately euros 450 million Rights Offering to strengthen the company’s Balance Sheet and reduce its indebtedness. The Offering was completed successfully in October.
In October ■ M-real’s sale of the Price & Pierce Group to Gould Paper was fi nalised.
In December ■ the construction of M-real’s new BCTMP in Kaskinen, Finland, reached eave height and the mill obtained its environmental permit. The plant will be taken into use in August, 2005.
In December ■ M-real sold the business operations of the Savon Sellu mill. The buyer is a company founded by Dr. Dermot F. Smurfi t in his private capacity and a group of other international inves-tors.
In December ■ M-real signed a Letter of Intent to sell its forest assets. The total transaction value is euros 172 million of which M-real’s share is 95 per cent. The transaction was fi nalized in January 2005.
In December ■ M-real signed a euros 500 million syndicated revolving credit facility agreement. The facility replaces facility agreement of euros 700 million signed in 2000.
Operating profi t,%
Return on capital employed, %
Turnover, ¤ million
Operating profi t, ¤ million
3
President’s review
Dear Shareholder, ■ M-real’s fi nancial year 2004 was
remarkable for its exceptionally large number of major changes.
The European paper markets improved substan-tially during the second half of the year, following a prolonged period of sluggish demand. This positive change in the market situation made it possible for us to start implementing price increases during the last quarter, although in some sectors these were smaller than planned. Taking the steep decline of the US dollar into consideration, the average euro-equivalent price levels in some sectors even declined during the last few months of the year.
A fundamental change was carried out at the beginning of September when M-real reverted to a line organisation in which responsibilities of busi-ness areas are defi ned by customers.
The restructuring, along with a sharper deline-ation of areas of responsibility, has had a posi-tive impact on customer orientation, operational effi cienceies and even to some extent on fi nancial results. I strongly believe that also our cost reduc-tion and effi ciency improvement programmes, in conjunction with our current operating model, will enable us to enhance our profi tability and attain estimated savings of at least 200 million euros by 2007.
With regard to M-real’s operational abilities and development, it was also of utmost importance that we reduced company indebtedness and strength-ened our capital base. The divestments made so far and the rights offering of nearly 450 euros in the autumn enable us to continue to develop M-real into a more effi cient and profi table company. We have a great deal of know-how and good market positions, and now we also have suffi cient fi nan-cial resources to make better use of our earnings potential.
President’s review
Our objectives for the future are clear. Naturally, our main target must be to make M-real a profi t-able company again – as soon as possible. To accomplish this, resolute action will be needed, both to increase revenue and especially to improve cost effi ciency. We will therefore continue to free up capital and invest in those areas of business that will provide a quick return. The size of these investments will be aimed at the further reduction of net debt.
I would like to thank our customers and busi-ness partners for the excellent cooperation in 2004. I would also like to thank our employees for their commitment to the implementation of these changes. Finally, I would like to express my thanks to my predecessor, Jouko M. Jaakkola, for his dedicated work and to wish him a happy retirement.
Hannu AnttilaPresident and CEO
4
M-real Financial statements 2004
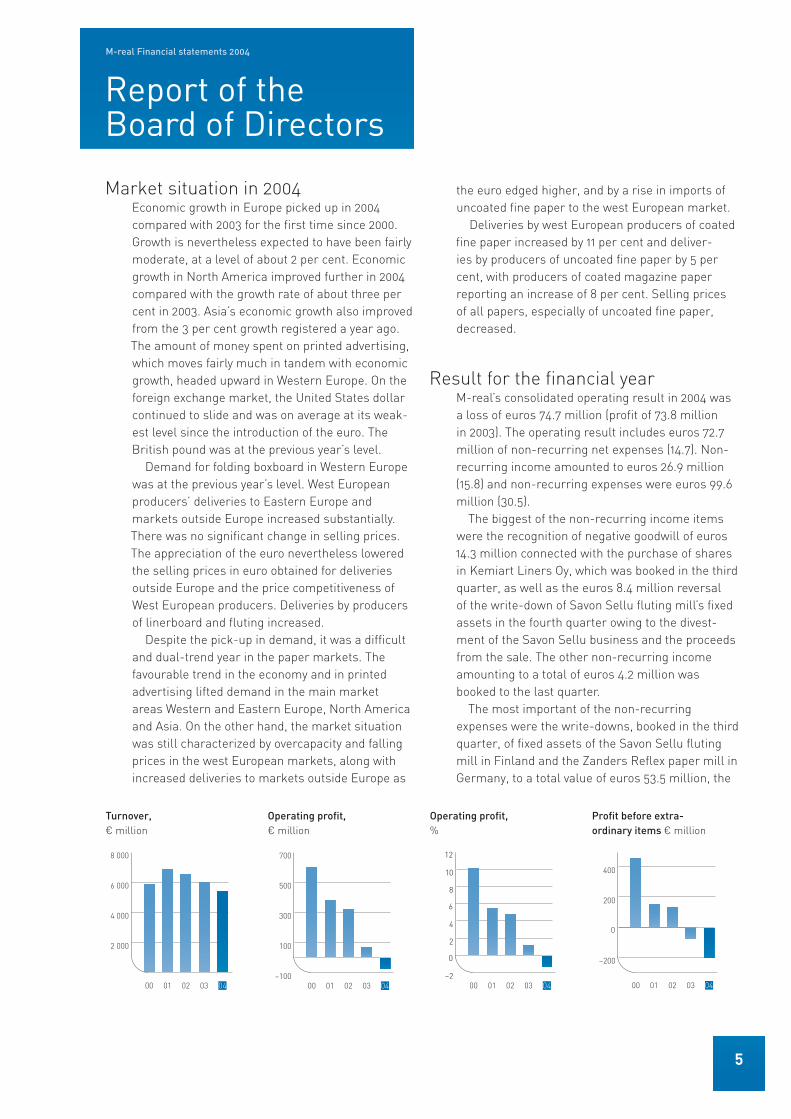
Market situation in 2004Economic growth in Europe picked up in 2004 compared with 2003 for the fi rst time since 2000. Growth is nevertheless expected to have been fairly moderate, at a level of about 2 per cent. Economic growth in North America improved further in 2004 compared with the growth rate of about three per cent in 2003. Asia’s economic growth also improved from the 3 per cent growth registered a year ago. The amount of money spent on printed advertising, which moves fairly much in tandem with economic growth, headed upward in Western Europe. On the foreign exchange market, the United States dollar continued to slide and was on average at its weak-est level since the introduction of the euro. The British pound was at the previous year’s level.
Demand for folding boxboard in Western Europe was at the previous year’s level. West European producers’ deliveries to Eastern Europe and markets outside Europe increased substantially. There was no signifi cant change in selling prices. The appreciation of the euro nevertheless lowered the selling prices in euro obtained for deliveries outside Europe and the price competitiveness of West European producers. Deliveries by producers of linerboard and fl uting increased.
Despite the pick-up in demand, it was a diffi cult and dual-trend year in the paper markets. The favourable trend in the economy and in printed advertising lifted demand in the main market areas Western and Eastern Europe, North America and Asia. On the other hand, the market situation was still characterized by overcapacity and falling prices in the west European markets, along with increased deliveries to markets outside Europe as
the euro edged higher, and by a rise in imports of uncoated fi ne paper to the west European market.
Deliveries by west European producers of coated fi ne paper increased by 11 per cent and deliver-ies by producers of uncoated fi ne paper by 5 per cent, with producers of coated magazine paper reporting an increase of 8 per cent. Selling prices of all papers, especially of uncoated fi ne paper, decreased.
Result for the fi nancial yearM-real’s consolidated operating result in 2004 was a loss of euros 74.7 million (profi t of 73.8 million in 2003). The operating result includes euros 72.7 million of non-recurring net expenses (14.7). Non-recurring income amounted to euros 26.9 million (15.8) and non-recurring expenses were euros 99.6 million (30.5).
The biggest of the non-recurring income items were the recognition of negative goodwill of euros 14.3 million connected with the purchase of shares in Kemiart Liners Oy, which was booked in the third quarter, as well as the euros 8.4 million reversal of the write-down of Savon Sellu fl uting mill’s fi xed assets in the fourth quarter owing to the divest-ment of the Savon Sellu business and the proceeds from the sale. The other non-recurring income amounting to a total of euros 4.2 million was booked to the last quarter.
The most important of the non-recurring expenses were the write-downs, booked in the third quarter, of fi xed assets of the Savon Sellu fl uting mill in Finland and the Zanders Refl ex paper mill in Germany, to a total value of euros 53.5 million, the
Report of the Board of Directors
Operating profi t, ¤ million
Operating profi t, %
Profi t before extra -ordinary items ¤ million
Turnover, ¤ million
5

Foreign subsidiaries Exports from Finland Turnover in Finland
Liabilities Equity
Financial assets Inventories Fixed assets Capital employed (average)
Report of the Board of Directors
euros 24 million expense provision connected with the profi tability improvement programme launched at Zanders’ Gohrsmühle and Refl ex mills and booked to the last quarter as well as the euros 5.3 million of expense provision for the restructuring of the operations of Modo Merchants Ltd and James McNaughton Paper Group Ltd, which was likewise booked to the last quarter. The other non-recurring expenses amounting to a total of euros 16.8 million were booked to the last quarter.
The operating result, excluding non-recurring items, was a loss of euros 2.0 million (a profi t of 88.5 million). The main reasons for the drop in the operating result were the fall in the selling price of paper and the appreciation of the euro. The operat-ing result was also reduced by the divestment of Metsä Tissue in January 2004.
Apart from Cartons and Map Merchants, all the businesses reported a weaker operating result, excluding non-recurring items.
Deliveries of paperboard to customers totalled 1 155 000 tonnes (1 007 000 tonnes). Production was curtailed by 82 000 tonnes in line with demand (163 000). The operating rate was 89 per cent (84). Kemiart Liners is included in its entirety in the second-half fi gures for 2004.
The total volume of paper deliveries was 4 129 000 tonnes (3 857 000). Production curtailments amounted to 351 000 tonnes (597 000). The operat-ing rate of the paper mills was 88 per cent (83).
The effect of currency hedging on the operating result was euros 9.5 million positive (24.2). At the end of 2004 the exchange rate of the euro against the United States dollar was 7.8 per cent lower than at the end of 2003, and the exchange rate of
the British pound was at the same level as at the end of 2003. On average, the dollar was down 9.9 per cent and the pound strengthened by 2.0 per cent.
Turnover was euros 5 460.3 million (6 044.1). Turnover was lowered by the same factors which impacted the operating result. Comparable turno-ver was up 1.2 per cent. Sales to Finland accounted for 6 per cent of turnover.
Net fi nancial expenses were euros 134.3 million (154.0 million). These items included net inter-est and other fi nancial expenses of euros 146.8 million (174.7) as well as foreign exchange gains on fi nancial items of euros 12.5 million (20.7). Other fi nancial expenses include a non-recurring entry in the last quarter of euros 17.2 million of expenses for the share offering carried out in September and October as well as an entry of euros 2.9 million of expenses connected with the new euros 500 million revolving credit facility.
Other operating income amounted to euros 86.3 million (73.8). The sum does not include non-recur-ring items.
The consolidated result before extraordinary items was a loss of euros 209.0 million (a loss of 80.2 million). The result includes non-recurring net expenses of euros 89.9 million (42.7). The result before extraordinary items net of non-recurring items was a loss of euros 119.1 million (a loss of 37.5).
A capital gain of euros 194.0 million on the sale of Metsä Tissue was booked to extraordinary income as well as euros 4.2 million from discharging the unused portion of the expense provision for termi-nating the Price&Pierce trading business, which was entered in 2003.
Earnings per share, euros
Turnover, ¤ million
Financial structure, ¤ million
Assets and capital employed (average), ¤ million
6
Financial statements
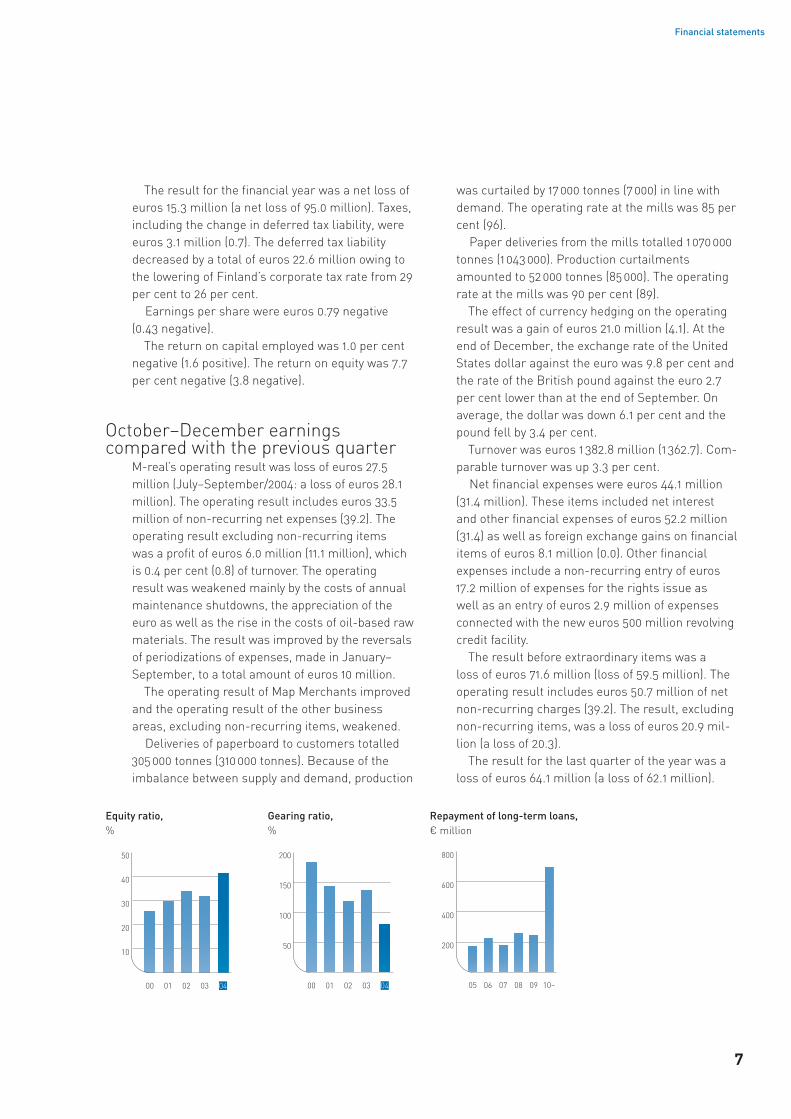
The result for the fi nancial year was a net loss of euros 15.3 million (a net loss of 95.0 million). Taxes, including the change in deferred tax liability, were euros 3.1 million (0.7). The deferred tax liability decreased by a total of euros 22.6 million owing to the lowering of Finland’s corporate tax rate from 29 per cent to 26 per cent.
Earnings per share were euros 0.79 negative (0.43 negative).
The return on capital employed was 1.0 per cent negative (1.6 positive). The return on equity was 7.7 per cent negative (3.8 negative).
October–December earnings compared with the previous quarter
M-real’s operating result was loss of euros 27.5 million (July–September/2004: a loss of euros 28.1 million). The operating result includes euros 33.5 million of non-recurring net expenses (39.2). The operating result excluding non-recurring items was a profi t of euros 6.0 million (11.1 million), which is 0.4 per cent (0.8) of turnover. The operating result was weakened mainly by the costs of annual maintenance shutdowns, the appreciation of the euro as well as the rise in the costs of oil-based raw materials. The result was improved by the reversals of periodizations of expenses, made in January– September, to a total amount of euros 10 million.
The operating result of Map Merchants improved and the operating result of the other business areas, excluding non-recurring items, weakened.
Deliveries of paperboard to customers totalled 305 000 tonnes (310 000 tonnes). Because of the imbalance between supply and demand, production
was curtailed by 17 000 tonnes (7 000) in line with demand. The operating rate at the mills was 85 per cent (96).
Paper deliveries from the mills totalled 1 070 000 tonnes (1 043 000). Production curtailments amounted to 52 000 tonnes (85 000). The operating rate at the mills was 90 per cent (89).
The effect of currency hedging on the operating result was a gain of euros 21.0 million (4.1). At the end of December, the exchange rate of the United States dollar against the euro was 9.8 per cent and the rate of the British pound against the euro 2.7 per cent lower than at the end of September. On average, the dollar was down 6.1 per cent and the pound fell by 3.4 per cent.
Turnover was euros 1 382.8 million (1 362.7). Com-parable turnover was up 3.3 per cent.
Net fi nancial expenses were euros 44.1 million (31.4 million). These items included net interest and other fi nancial expenses of euros 52.2 million (31.4) as well as foreign exchange gains on fi nancial items of euros 8.1 million (0.0). Other fi nancial expenses include a non-recurring entry of euros 17.2 million of expenses for the rights issue as well as an entry of euros 2.9 million of expenses connected with the new euros 500 million revolving credit facility.
The result before extraordinary items was a loss of euros 71.6 million (loss of 59.5 million). The operating result includes euros 50.7 million of net non-recurring charges (39.2). The result, excluding non-recurring items, was a loss of euros 20.9 mil-lion (a loss of 20.3).
The result for the last quarter of the year was a loss of euros 64.1 million (a loss of 62.1 million).
Equity ratio, %
Gearing ratio, %
Repayment of long-term loans,¤ million
7

Other capital expenditure Acquisitions
Report of the Board of Directors
PersonnelThe number of personnel at the end of December was 15 960 employees (19 636 employees at 31 December 2003), of whom 4 912 employees worked in Finland (5 835). The net reduction in personnel was 3 676 employees. Acquisitions and divestments resulted in a net decrease of 3 260 employees in the reduced headcount.
The Group’s personnel includes 47 per cent of Metsä-Botnia’s employees.
Capital expendituresCapital expenditures for fi xed assets in 2004 totalled euros 239 million (2003: 232). In addition, euros 20 million was paid for the shares of compa-nies that were acquired. In 2003, euros 165 million was paid for the shares of companies that were acquired.
The investment project in the new BCTMP mill in Kaskinen, which will have a total price tag of euros 180 million, is progressing according to plans. Installations of the main equipment are under way and training of the personnel has been started. The mill will have an annual capacity of 300 000 tonnes of bleached chemithermal mechanical pulp (BCTMP) and is set to come on stream in August 2005.
Acquisitions, divestments and restructuring
At the beginning of January, a 66 per cent stake in Metsä Tissue was sold to Metsäliitto Coopera-tive. In addition, 17 per cent was sold to the Tapiola
Group. At the end of January, the remaining 17 per cent was sold to Varma Mutual Pension Insurance Company (9.86 per cent) and Sampo Life Insurance Company Limited (7.14 per cent). Each transaction was carried out on the same terms and conditions and were based on a debt-free value of euros 570 million. The after-tax capital gain on the disposals was about euros 173 million.
At the beginning of August, the company bought the holdings of Metsäliitto Cooperative and UPM-Kymmene in Kemiart Liners Oy, a total stake of 53 per cent. The purchase price of the shares was about 13 million euros, in addition to which the M-real Group’s interest-bearing net liabilities increased by about 23 million euros. The nega-tive goodwill of euros 14.3 million that arose as a consequence of the transaction was recognized as income in the third quarter.
In a deal that entered into effect at the end of September, the Price & Pierce trading business was sold to Gould Paper Corporation. The trans-action did not have a major economic impact on M-real.
At the end of December, an agreement was signed on sale of the Savon Sellu business to a company owned by Dr Dermot F. Smurfi t as a pri-vate individual, and a group of other international investors. The purchase price was about euros 20 million, of which some euros 12 million was allo-cated to fi xed assets. Savon Sellu has a production capacity of 245 000 tonnes a year and about 250 people are employed at the mill. The transaction entered into force on 1 January 2005. A write-down of euros 22.4 million was made on the fi xed assets of Savon Sellu in the third quarter. On the basis of
Gross capital expenditure, ¤ million
Gross capital expenditure, % of turnover
Internal fi nancing ofcapital expenditure, %
Return on capital employed, %
8
Financial statements
the disposal of the business and the proceeds from it, a euros 8.4 million reversal of the write down was made in the fourth quarter.
At the end of December, a Letter of Intent was signed on sale of forestland to a company to be founded, called Forestia Holding Oy, which is to be owned by Metsäliitto Cooperative, with a share of 49.9%, Suomi Mutual Life Assurance Company, with a share of 39.7% and the Central Union of Agricultural producers and Forest owners, with a share of 10.4%. The total purchase price accord-ing to the Letter of Intent was euros 172 million, of which M-real’s share was 95 per cent. The transac-tion does not have a material impact on M-real’s fi nancial result.
Research and developmentResearch and development costs in 2004 were euros 28 million, or 0.7 per cent of turnover, excluding the Map Merchants paper merchanting business. The number of patents applied for grew by 50 per cent.
The research and development focus areas were the characteristics and behaviour of fi bre in various production processes, process know-how as well as the development of the optical characteristics of paper and paperboard. In recent years M-real has strengthened its expertise in the area of chemith-ermal mechanical pulp (CTMP), thereby making possible the development of new and competitive grades of paper and paperboard.
At M-real’s mills, efforts were made to improve production effi ciency. Productivity improvements were achieved at nearly every production unit.
EnvironmentDuring 2004, preparations were made for the start of EU emissions trading in 2005. Furthermore, product-specifi c reporting of chain of origin infor-mation was started, old environmental liabilities were ascertained and soil investigations were launched at the mills in operation.
The guidelines for M-real’s climate strategy were fi nalized in the spring 2004. An investment project aiming at increasing the use of biofuels was started at the Hallein mill and a similar project moved
ahead at Biberist as well. The production units have obtained the emissions permits and allowances for start-up of EU emissions trading in accord-ance with the national legislation and regulations. Assessments of energy effi ciency were continued with the aim of mapping out areas were energy can be saved. M-real’s carbon dioxide emissions increased by approximately 1 per cent (the emissions of Metsä Tissue excluded) on the previous year.
All M-real’s production plants have an environ-mental system that is certifi ed under the ISO 14001 standard as well as objectives and programmes for improving operations. Total emissions increased by approximately 1 per cent (the emissions of Metsä Tissue excluded) compared with the previous year. The most important capital expenditure was the Husum waste water treatment plant, which went into operation in autumn 2004. The total capital expenditure was approximately euros 40 million. The extension to the waste water treatment plant at the Kyro paperboard mill reduced waste water effl uents markedly below the terms and conditions set out in the mill’s permit.
The provisions made for attending to M-real’s environmental liabilities amounted to euros 7 mil-lion at the end of 2004. Clean-up of the soil at the Kolho impregnation plant located in Vilppula will be carried out in 2005. M-real’s share of the costs is about euros 2 million. The production units in operation started soil investigations in their plant areas in order to map any polluted areas. The results will be ready in spring 2005.
M-real has committed to using wood raw mate-rial that comes from sustainably managed silvi-cultural forests and to promoting the certifi cation of forests and the use of certifi ed wood and fi bre in its products. In 2004 reporting of the origin of wood used in the manufacture of M-real’s prod-ucts was started on the Annex pages to the Paper Profi le environmental product declaration sheets. Thomesto Oy, which is responsible for M-real’s wood procurement outside Finland, has increased inspections of logging areas in Russia and last year 62 per cent of the wood volume came from inspected sites.
M-real will publish a separate Social Responsi-bility Report for 2004, which will include sections dealing with environmental responsibility issues.
9

Report of the Board of Directors
FinancingInterest-bearing net liabilities amounted to euros 2 161 million at the end of December (Dec. 2003: 3 109 million).
The equity ratio at the end of the period was 41.5 per cent (Dec. 2003: 31.9) and the gearing was 82 per cent (Dec. 2003: 137).
Liquidity is good. Liquidity at the end of Decem-ber was euros 1 798 million, of which 1 556 million consisted of binding long-term credit commitments and 242 million was liquid funds and investments. In addition, to meet its short-term fi nancing needs, the Group had at its disposal non-binding domestic and foreign commercial paper programmes and credit facilities amounting to about euros 600 mil-lion.
At the end the report period an average of 4 months of the net foreign currency exposure was hedged. The degree of hedging during the report period has varied between 4 and 5 months. At the end of the report period, about 98 per cent of the shareholders’ equity not in euros was hedged. At the end of the period the Group’s liabilities were tied to fi xed interest rates for a period of 23 months. During the report period the interest rate maturity has varied from 18 to 25 months.
At the close of the year, 7 per cent of the Group’s long-term loans were not denominated in euros. Of these loans, 32 per cent was subject to variable interest rates and the rest to fi xed interest rates. The average interest rate on the loans was 4.2 per cent at the end of 2004 and the average maturity of long-term loans was 4.0 years.
In April, Standard&Poor’s changed the outlook for M-real’s long-term loans rating, BB+, from stable to negative.
In July Moody’s Investors Services placed M-real on Credit Watch Negative for a possible lowering of the credit rating.
In November, Moody’s Investors Services lowered M-real’s credit rating from Ba1 to Ba2, with a stable outlook.
In December, M-real signed a euros 500 million syndicated revolving credit facility agreement. The facility will be used to refi nance the euros 700 mil-lion credit agreement signed in 2000. The term of the facility is fi ve years. A total of 21 banks partici-pated in the arrangement.
During the year, seven bond issues to a total amount of about euros 172 million were imple-mented within the framework of an international bond programme.
SharesThe highest share issue-adjusted price of the M-real Series B share on the Helsinki Stock Exchange last year was euros 6.43, and the low was euros 4.18, with an average share price of euros 5.59. In 2003 the average price was euros 6.11. The price of the Series B share was euros 4.70 at the end of the report period on 31 December 2004.
Turnover of the Series B share was euros 1 013 million, or 62 per cent of the total shares outstand-ing after the rights offering. The market value of the Series A and B shares at 31 December 2004 totalled euros 1 542 million.
At 31 December 2004 Metsäliitto Osuuskunta owned 38.6 per cent of M-real Corporation’s shares and the voting rights conferred by these shares was 60.5 per cent. International investors owned 38.3 per cent of the shares.
On 7 September 2004, the Board of Directors decided, on the basis of an authorization granted by the extraordinary meeting of shareholders on 6 September 2004, to arrange a rights offering to an amount of euros 447 498 561. The subscription period for the shares commenced on 15 September 2004 and ended on 1 October 2004. The subscrip-tion price was euros 3.00 per share. Each M-real shareholder was entitled to subscribe for fi ve (5) new Series B shares for each six (6) Series A or B shares which the shareholder owned on the record date, 10 September 2004. The subscrip-tion warrants were traded publicly on the Helsinki Stock Exchange from 15 to 24 September 2004 and turnover in them amounted to euros 63 million, or 49 million warrants. The high for the subscrip-tion warrant was euros 1.60 and the low euros 1.11. According to the fi nal outcome of the rights offer-ing, 148 633 415 Series B shares were subscribed for on the basis of the subscription warrants in the primary offering, corresponding to 99.64 per cent of the total amount of offered shares. In addition, subscription commitments for 31 098 942 Series B shares were submitted in the secondary offer-
10
Financial statements
ing, exceeding the number of shares being offered (532 772 shares) nearly 60-fold.
The shares subscribed for in the primary offering were accepted for public trading on the Helsinki Stock Exchange as interim shares on 4 October 2004 (“M-real B new shares”). The correspond-ing increase in the share capital was entered in the Trade Register and the interim M-real B New Shares were combined with M-real’s present Series B share class on 7 October 2004. The increase in share capital corresponding to the subscriptions accepted in the secondary offering was entered in the Trade Register on 13 October 2004.
Following the registration of the shares sub-scribed for in the secondary offering, M-real’s share capital is euros 557 881 540.40 and consists of 328 165 612 shares, of which 36 340 550 are Series A shares and 291 825 062 are Series B shares.
The net increase in shareholders’ equity after expenses resulting from the rights offering was euros 430 million. The share capital rose by euros 253.6 million to euros 557.9 million.
The proceeds of the rights offering have been used to pay down the company’s debt.
The Board of Directors does not have current authorizations to carry out share issues or issues of convertible bonds or bonds with warrants.
Board of Directors and AuditorsThe Annual General Meeting held on 15 March 2004 elected the following persons to seats on M-real’s Board of Directors for a term extending up to the next Annual General Meeting: Antti Oksanen, Presi-dent of Metsäliitto Group, Arimo Uusitalo, Titular Farming Counsellor, Kim Gran, President and CEO of Nokian Tyres plc, Timo Haapanen, Titular Farm-ing Counsellor, Asmo Kalpala, President of the Tapiola Group, Erkki Karmila, Executive Vice Presi-dent of Nordic Investment Bank, Runar Lillandt, Titular Farming Counsellor, and Antti Tanskanen, CEO of the OP Bank Group.
At its organization meeting, the Board of Direc-tors elected Antti Oksanen as its Chairman and Arimo Uusitalo as its Vice Chairman.
Elected as auditors were Göran Lindell, Author-ized Public Accountant, and PricewaterhouseCoop-ers Oy, Authorized Public Accountants fi rm, with
Ilkka Haarlaa, M.Sc. (Econ.), Authorized Public Accountant, as responsible auditor and Björn Renlund, Authorized Public Accountant, and Jouko Malinen, Authorized Public Accountant, as the deputy auditors.
The term of offi ce of the auditors and deputy auditors lasts until the end of the next Annual General Meeting.
Corporate GovernanceIn accordance with the new Helsinki Stock Exchange recommendation on the corporate gov-ernance of listed companies, M-real Corporation’s Board of Directors decided at the beginning of April to set up an Audit Committee, a Compensation Committee and a Nomination Committee. Each committee assists the Board of Directors in prepar-ing matters within its own area of responsibility. The Board has confi rmed written rules of procedure for the committees.
The members of the Audit Committee are Asmo Kalpala (chairman), President of the Tapiola Group, Kim Gran, President and CEO of Nokian Tyres plc and Erkki Karmila, Executive Vice President of Nordic Investment Bank.
The members of the Compensation Committee are Antti Oksanen (chairman), President of Metsä-liitto Group, Erkki Karmila, Executive Vice President of Nordic Investment Bank, and Arimo Uusitalo, Titular Farming Counsellor.
The members of the Nomination Committee are Arimo Uusitalo (chairman), Titular Farming Coun-sellor, Runar Lillandt, Titular Farming Counsellor, and Antti Tanskanen, CEO of the OP Bank Group.
New President and CEOIn June M-real’s Board of Directors appointed Hannu Anttila, 49, M.Sc. (Econ.), as the company’s new President and CEO. Mr Anttila took over as M-real’s Senior Executive Vice President on 1 July 2004. He became Chief Operating Offi cer on 1 Sep-tember 2004 and President and CEO on 1 January 2005, following the retirement of the former CEO, Jouko M. Jaakkola.
11

Report of the Board of Directors
Revised strategy, new organization and corporate executive board
The revised business strategy and renewed busi-ness area and organizational structure were announced in August.
The core business areas are Consumer Packag-ing, Publishing, Commercial Printing and Offi ce Papers. The development possibilities of the Map Merchant paper merchanting business and the related potential for carrying out ownership arrangements are being assessed.
The company’s main objective over the next few years is to achieve a clear improvement in profi t-ability and internal effi ciency.
The fi nancial targets set were an average return on capital employed of at least 10 per cent over the business cycle and a gearing ratio not to exceed 100 per cent. Total capital expenditures, including any acquisitions, will come to a maximum of about the amount of depreciation in 2005 and 2006.
According to the revised business area and organizational structure, the management of each business area has total responsibility for the opera-tions of its own business area, including sales, marketing and production. In addition, the heads of the business areas are responsible for implement-ing each business area’s strategy as well as for profi tability and the return on capital employed.
Within the new organization, the heads of the business areas are members of the Corporate Executive Board. The tasks of the Corporate Execu-tive Board are, among other things, to assess the strategy of each business area and strategic invest-ments, taking into account the company’s fi nancial targets.
The new organization came into force on 1 Sep-tember 2004.
Financial reporting in 2005M-real’s fi nancial reporting will change in line with the business area structure as from the beginning of 2005. The comparative fi gures according to the new business area structure will be published in the fi rst half of April 2005.
Adoption of international fi nancial reporting standards (IFRS)
M-real adopted International Financial Reporting Standards (IFRS) as from 1 January 2005. In August the company published a preliminary estimate of the effects of the transition on the opening balance sheet prepared according to IFRS as of 1 January 2004. According to the estimate, the transition to IFRS will reduce the Group’s shareholders’ equity by euros 320 million. Of this amount, the effect of impairment charges for property, plant and equipment as well as goodwill is euros 110 million, the effect of defi ned benefi t pension arrangements euros 141 million and the effects of other changes in accounting principles total euros 69 million. Total assets are estimated to increase by about euros 70 million and interest-bearing liabilities will grow by about euros 60 million.
The estimate of the decrease in sharehold-ers’ equity (euros 320 million) includes euros 40 million of the disability pension liability under the Finnish pension plan (TEL). After the preliminary estimate was made public, the Finnish authorities have approved changes in the principles applied in calculating disability pension contributions, which will come into force on 1 January 2006. As a consequence of the changes, and as a departure from the previous interpretation, the disability pen-sion arrangement will be considered as a defi ned contribution plan. Accordingly, provisions will be entered in the opening IFRS balance sheet only up to an amount that is suffi cient to cover disability pension contributions that are estimated to be paid during 2004 and 2005. This is estimated to be around 20 per cent of the original sum of euros 40 million.
In the fi rst half of April 2005, M-real will publish a separate announcement setting out its account-ing policies in accordance with IFRS, their principal effects as well as reconciliations between the IFRS fi gures and the fi nancial statements prepared according to Finnish accounting practices for 2004.
Investigations by the EU Commission’s competition authorities
On 25 May 2004 the EU Commission’s competition authorities made a visit of inspection at M-real’s
12

Financial statements
offi ces. The visit was connected with the com-petition authorities’ investigations into alleged cooperation with producers of fi ne paper in the fi ne paper segment.
M-real has commissioned Herbert Smith, an international law fi rm, to examine the documents that were handed over to the competition authori-ties during the visit of inspection and to carry out the internal investigations, which are continuing.
Class actions related to the matter have been brought against M-real in the United States.
Events after the close of the fi nancial period
At the end of January the sale of forest assets to Forestia Holding Oy was completed in accord-ance with the Letter of Intent signed at the end of December. The total purchase price was euros 172 million, of which M-real’s share was euros 163 million. The transaction does not have a material impact on M-real’s result.
Outlook for the current yearEuropean economic growth picked up in 2004 com-pared with 2003. The growth is estimated to have remained at a moderate level of about 2 per cent. Economic growth in North America and Asia also improved compared with the previous year. In 2005 economic growth is generally forecast to slow down in Europe and North America as well as in Asia. The amount of money spent on printed advertising, which moves fairly much in tandem with economic growth, is estimated to increase in Western Europe at last year’s rate. A continued weakening of the United States dollar would have a negative impact on the price competitiveness of dollar-based exports by the west European forest industry.
Paper demand held up well in the last quarter of 2004. Apart from uncoated fi ne paper, M-real’s paper deliveries to all the main markets grew. Production capacity was nevertheless still underu-tilized. M-real’s deliveries of paperboard were at the previous quarter’s good level. Demand for paper and paperboard is expected to remain good provid-ing that the general economic trend and the growth in printed advertising remain favourable.
Average prices of coated fi ne paper, coated magazine paper and folding boxboard are forecast to be at a somewhat higher level at the close of the fi rst quarter than they were in the last quarter of 2004.
M-real’s fi rst-quarter result before taxes and excluding non-recurring items is forecast to be slightly in the red.
Espoo, 4 February 2005
BOARD OF DIRECTORS
13

M-real Financial statements 2004
Euros million
Consolidated Profi t and Loss Account
Note 1 Jan–31 Dec 2004 % 1 Jan–31 Dec 2003 %
Turnover 1 5 460.3 100.0 6 044.1 100.0Change in stocks of fi nished goods and in work in progress 5.2 –8.6Share of profi t from associated companies 2 –7.4 –5.2Other operating income 3 86.3 73.8
Materials and servicesRaw materials and consumables 27 3 158.0 3 286.1Costs of external services 224.8 278.0
Employee costs 4, 27 917.3 1 044.3Depreciation 5, 27 461.5 481.0Other operating expenses 27 857.5 5 619.1 940.9 6 030.3
Operating profi t –74.7 –1.4 73.8 1.2
Financial income and expense 6, 7Interest income from Group companies 0.8 0.2Income from other fi nancial investments 2.0 1.9Other interest and similar income 15.5 15.9Net exchange gains/losses 12.5 20.7Interest expense and similar charges –165.1 –134.3 –192.7 –154.0
Profi t before extraordinary items –209.0 –3.8 –80.2 –1.3
Extraordinary items 8Extraordinary income 198.2 0.9Extraordinary expenses 0.0 198.2 –16.0 –15.1
Profi t before taxes –10.8 –0.2 –95.3 –1.6
Tax expense 9 –3.1 –0.7Profi t before minority interest –13.9 –0.3 –96.0 –1.6
Minority interest –1.4 1.0
Profi t for the fi nancial period –15.3 –0.3 –95.0 –1.6
14

Cartons Graphics Products and
Speciality Papers Offi ces Map Merchant Group
Financial statementsConsolidated Profi t and Loss Account
Turnover ■ Consolidated turnover was euros 5 460 million (6 044 million in 2003). Turnover generated by companies acquired in 2004 was euros 19 million whereas the turnover of companies divested was euros 665 million. Divestments affecting turnover were not made in 2003. Comparable turnover thus increased by about euros 60 million, or 1.2 per cent.
Operating result ■ M-real’s consolidated operating result was
down euros 149 million to operating loss euros 75 million. The operating result includes euros 73 million of non-recurring net expenses (15). Non-recurring income amounted to euros 27 million (16) and non-recurring expenses were euros 100 million (31). The operating result net of non-recurring items was a loss of euros 2 million (a profi t of 89 million). The operating result was weakened by the fall in the price of paper and the appreciation of the euro. The operating result was also reduced by the divestment of Metsä Tissue in January 2004.
Apart from Cartons and Map Merchants, all the businesses reported a weaker operating result, excluding non-recurring items.
The improved profi tability of the Cartons busi-ness and Map Merchants was attributable to the growth in delivery volumes as well as to the posi-tive effects of the implemented cost savings and effi ciency improvement measures.
The profi tability of the Graphics products and speciality papers and Offi ces businesses’ were weakened by the fall in the average selling price and the appreciation of the euro.
Result before extraordinary items ■ The result before extraordinary
items was a loss of euros 209 million (a loss of 80 million). The result includes non-recurring net expenses of euros 90 million (43). Net fi nancial expenses excluding foreign exchange gains as well as non-recurring items were euros 130 million (147). The interest expenses were reduced by the euros 948 million reduction in net interest bearing debt. The average interest rate was at the previous year’s level. Foreign exchange gains on fi nancial items were euros 12 million (21).
Extraordinary items ■ Extraordinary income include a capital gain
of euros 194 million on the sale of Metsä Tissue as well as a euros 4.2 million gain from discharging the unused portion of the expense provision for terminating the Price & Pierce trading business, which was entered in 2003.
Taxation and minority interestThe Group’s total direct taxes were euros 3 mil-
lion (1), of which euros 55 million represented taxes payable for the fi nancial year.
Profi t analysis
Turnover by business area,%/¤ mill. Operating result by business area, ¤ mill.
Cartons 17%, € 880 mill.
Graphics Products and Speciality Papers 44%, € 2 378 ml
Offi ces 13%, € 670 mill
Map Merchant Group, 26%, € 1 368 mill .
15
M-real Financial statements 2004
Euros million
Consolidated Balance Sheet
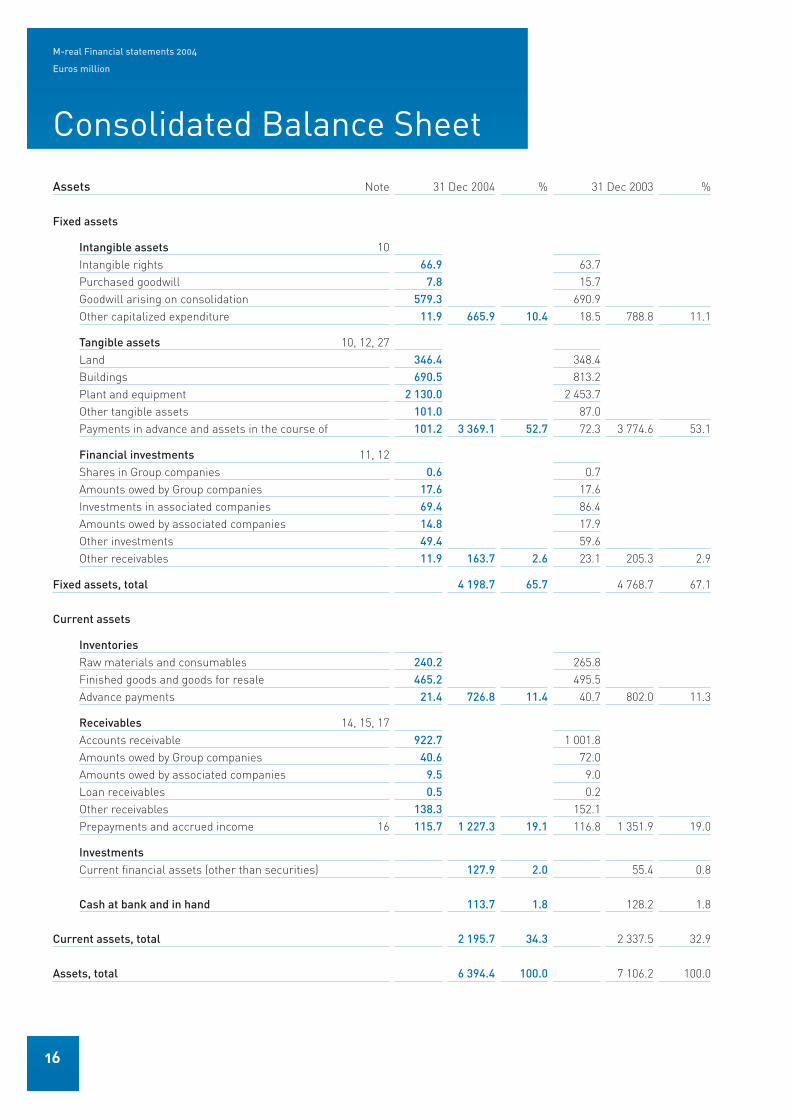
Assets Note 31 Dec 2004 % 31 Dec 2003 %
Fixed assets
Intangible assets 10Intangible rights 66.9 63.7Purchased goodwill 7.8 15.7Goodwill arising on consolidation 579.3 690.9Other capitalized expenditure 11.9 665.9 10.4 18.5 788.8 11.1
Tangible assets 10, 12, 27Land 346.4 348.4Buildings 690.5 813.2Plant and equipment 2 130.0 2 453.7Other tangible assets 101.0 87.0Payments in advance and assets in the course of 101.2 3 369.1 52.7 72.3 3 774.6 53.1
Financial investments 11, 12Shares in Group companies 0.6 0.7Amounts owed by Group companies 17.6 17.6Investments in associated companies 69.4 86.4Amounts owed by associated companies 14.8 17.9Other investments 49.4 59.6Other receivables 11.9 163.7 2.6 23.1 205.3 2.9
Fixed assets, total 4 198.7 65.7 4 768.7 67.1
Current assets
InventoriesRaw materials and consumables 240.2 265.8Finished goods and goods for resale 465.2 495.5Advance payments 21.4 726.8 11.4 40.7 802.0 11.3
Receivables 14, 15, 17Accounts receivable 922.7 1 001.8Amounts owed by Group companies 40.6 72.0Amounts owed by associated companies 9.5 9.0Loan receivables 0.5 0.2Other receivables 138.3 152.1Prepayments and accrued income 16 115.7 1 227.3 19.1 116.8 1 351.9 19.0
Investments Current fi nancial assets (other than securities) 127.9 2.0 55.4 0.8
Cash at bank and in hand 113.7 1.8 128.2 1.8
Current assets, total 2 195.7 34.3 2 337.5 32.9
Assets, total 6 394.4 100.0 7 106.2 100.0
16

Consolidated Balance Sheet
Financial statements
Shareholders’ equity and liabilities Note 31 Dec 2004 % 31 Dec 2003 %
Shareholders’ equity 18Share capital 557.9 304.3Share premium account 666.8 472.9Revaluation reserve 104.6 104.6Other reserves 1.7 1.7 Retained earnings 1311.1 1 456.8Profi t for the fi nancial period –15.3 2 626.8 41.1 –95.0 2 245.3 31.6
Minority interest 23.9 0.4 18.9 0.3
Provisions for liabilities and charges 19, 27 58.1 0.9 77.4 1.1
Liabilities 20, 21
Long-term liabilities 23Bonds and debentures 875.7 940.2Loans from fi nancial institutions 482.0 1 310.7Pension premium loans 97.1 123.8Deferred tax liabilities 22 378.7 431.9Other liabilities 174.7 214.1Accruals and prepaid income 25 11.6 2 019.8 31.5 9.9 3 030.6 42.6
Short-term liabilities 24Bonds and debentures 132.5 10.0Loans from fi nancial institutions 69.2 188.1Pension premium loans 15.9 16.4Advance payments 0.7 2.2Accounts payable 302.5 367.7Bills of exchange payable 14.3 13.0Amounts owed to Group companies 356.8 415.7Amounts owed to associated companies 86.0 84.3Other liabilities 343.5 270.5Accruals and prepaid income 25 344.4 1 665.8 26.1 366.1 1 734.0 24.4
Liabilities total 3 685.6 57.6 4 764.6 67.0
Shareholders’ equity and liabilities, total 6 394.4 100.0 7 106.2 100.0
17

Consolidated Balance Sheet
Assets and capital employed ■ The Group’s total assets stood
at euros 6 394 million, which is about 712 million euros lower than at the end of the previous year. The changes that took place in the Group’s balance sheet structure were:
euros millionCapital expenditure on fi xed asset 239Depreciation –462Fixed assets and consolidation goodwill of Metsä Tissue –330Fixes assets less negative goodwill of Kemiart Liners +26Shares in associated companies and other shares –27Inventories * –75Accounts receivable * –79Liquid funds +58Other items * –62Changes, total –712
* includes the effects of acquired and divested companies
Total assets were increased mainly by capi-tal expenditures on fi xed assets as well as the purchase of the shares in Kemiart Liners Oy. By contrast, total assets were reduced by the sale of Metsä Tissue, depreciation that was greater than capital expenditures on fi xed assets as well as by decreased inventories and accounts receivable. Accounts receivable were reduced by lower sales in euros. The Group’s liquid funds amounted to euros 242 million (184). Capital expenditures during the fi nancial year are discussed in the Report of the Board of Directors. At the end of the year, capital employed totalled euros 5 135 million. Its break-down by business is shown in the table below.
Balance sheet analysis
Return on capitalemployed, %
Equity ratio, %
Gearing ratio, %
Financing ■ Consolidated shareholders’ equity net of minority interests was euros 2 627 million at the end of the year (2 245). Shareholders’ equity was increased by the net funds of euros 430 million raised in the rights offering. Interest-bearing liabilities stood at euros 2 484 million, a decrease of euros 940 million compared with the fi gure a year earlier. The debt was paid down by the proceeds from the rights offering as well as from the sale of Metsä Tissue
Interest-bearing net liabilities (= interest-bearing liabilities less liquid funds and other interest-bear-ing receivables) amounted to euros 2 161 million at the end of the fi nancial year (3 109).
Key ratios ■ The return on capital employed fell as a con-
sequence of weakened profi tability and was –1.0 per cent (1.6). The equity ratio was 41.5 per cent (31.9) and the gearing ratio was 82 per cent (137).
Return on capital employedeuros million 2004 2003 changeCartons 913 882 +31Graphics products and 2 592 2 850 –258Offi ces 854 839 +15Map Merchant Group 388 383 +5Others 388 734 –346Group total 5 135 5 688 –553
18

M-real Financial statements 2004
Euros million
Cash fl ow statements
Group Parent company2004 2003 2004 2003
Funds from operationsOperating profi t * –67.3 78.9 –19.1 –26.2Depreciation according to plan 461.5 481.0 119.1 119.2Change in provisions for liabilities and charges 4.7 –4.9 –4.2 8.8Net fi nancial items * –133.9 –117.8 194.5 241.5Taxation * –27.5 –19.9 –22.0 –5.1
Total 237.5 417.3 268.3 338.2
Change in working capitalInventories (increase –, decrease +) 24.2 14.4 8.1 0.9Current receivables (increase –, decrease +) –20.6 101.4 –42.6 –42.9Non-interest-bearing current liabilities (increase +, decrease –) 16.0 –108.0 9.0 –7.3
Total 19.6 7.8 –25.5 –49.3
Cash fl ow from operations 257.1 425.1 242.8 288.9
Change in fi xed assetsGross capital expenditures –258.8 –396.7 –154.6 –61.0Disposals and other changes in fi xed assets 434.2 –2.5 –15.5 107.4
Cash fl ow after capital expenditures 432.5 25.9 72.7 335.3
FinancingShare issue 447.5 447.5Change in interest-bearing liabilities (increase +, decrease –) –940.1 62.7 –517.5 –412.6Interest-bearing net liabilities of companies acquired and divested 121.5 –8.5Change in interest-bearing long-term receivables (increase –, decrease +) 50.2 11.0 –42.8 228.1Dividend –53.7 –107.4 –53.7 –107.4Group contribution 100.1 11.7Other changes –4.2 –36.5
Change in liquid funds 57.9 –16.3 2.1 18.6
Group31 Dec 2004 Change 31 Dec 2003 Change
Interest-bearing net liabilities 2 484.1 –940.1 3 424.2 62.7Interest-bearing receivables –81.3 50.2 –131.5 11.0Liquid funds –241.5 –57.9 –183.6 16.3
Interest-bearing liabilities 2 161.3 –947.8 3 109.1 90.0
* For the Group stated after elimination of the effect of associated company accounting.
19

Cash fl ow statements
Cash fl ow from operations ■ Cash fl ow from operations, net
of the effect of acquisitions and divestments, fell clearly and was euros 257 million (425). Funds from operations decreased by 43 per cent to euros 238 million (417). The drop in funds from operations was attributable to the euros 166 million decrease in the operating margin (operating profi t plus deprecia-tion) adjusted for interests in associated companies, the euros 16 million increase in fi nancial expenses as well as the euros 8 million increase in taxes. Against this, funds from operations were slightly increased by the euros 10 million more favourable change in the provisions for liabilities and charges.
Inventories decreased by euros 24 million, accounts receivable and other current receivables increased by euros 21 million and interest free liabilities increased by euros 16 million. As a conse-quence the reduction in working capital, excluding the effects of acquisitions and divestments, freed up cash fl ow of euros 20 million.
Capital expenditures and other changes in fi xed assets ■ The Group’s gross
capital expenditures amounted to euros 259 million, of which euros 239 million went for fi xed assets and euros 20 million represented the purchase price of shares in acquired companies.
Capital fi nancing ■ The rights offering increased equity by
euros 448 million. Interest-bearing liabilities were decreased by euros 940 million. The company paid a dividend of euros 0.25 per share, or euros 54 million.
Interest-bearing net liabilities ■ Despite the weak cash fl ow from oper-
ations the funds received from the sale of Metsä Tissue and the funds raised in the rights offering the interest bearing net liabilities decreased by euros 948 million and totalled euros 2 161 million at the end of the fi nancial year.
euros Cash fl ow form operations 257Divestments and other changes 434Rights offering 448
1 139Capital expenditures on fi xed assets –239Acquisitions and share purchases –20Dividend –54Interest bearing net liabilities of acquired and divested companies 122Increase of interest bearing net liabilities –948
Cash fl ow analysis
Funds from operations,€ million
20
M-real Financial statements 2004
Euros million
Parent Company Profi t and Loss Account
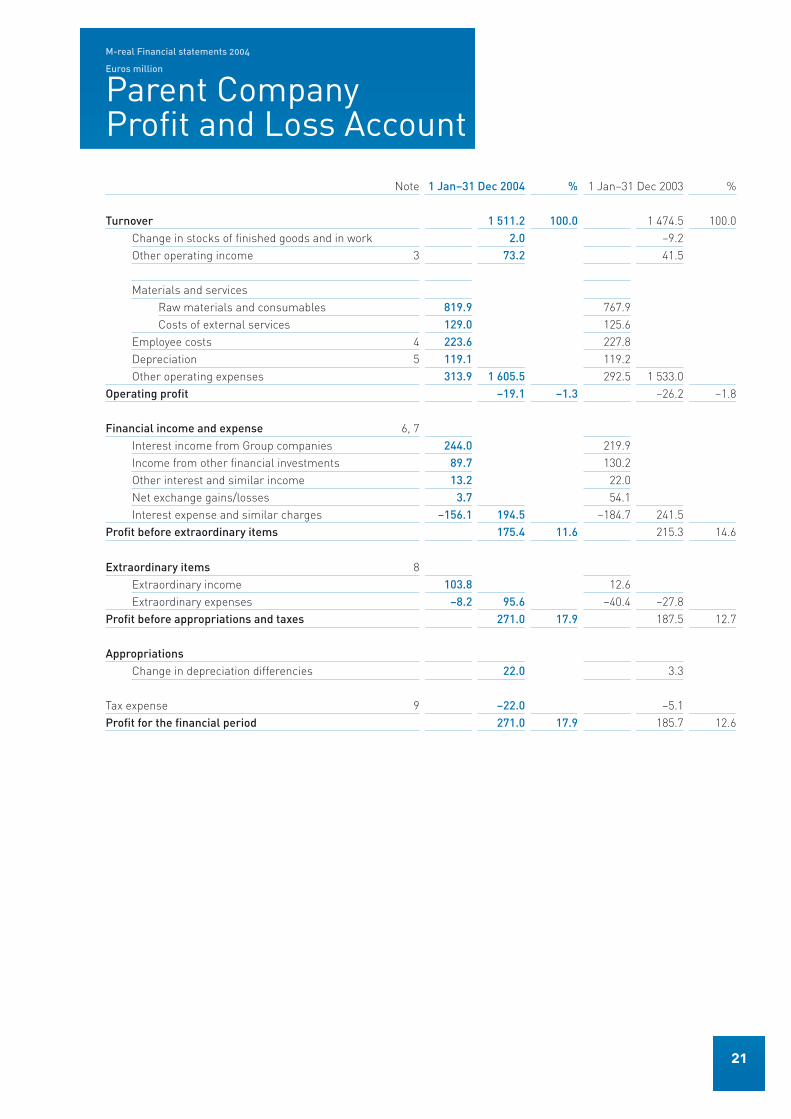
Note 1 Jan–31 Dec 2004 % 1 Jan–31 Dec 2003 %
Turnover 1 511.2 100.0 1 474.5 100.0Change in stocks of fi nished goods and in work 2.0 –9.2Other operating income 3 73.2 41.5
Materials and servicesRaw materials and consumables 819.9 767.9Costs of external services 129.0 125.6
Employee costs 4 223.6 227.8Depreciation 5 119.1 119.2Other operating expenses 313.9 1 605.5 292.5 1 533.0
Operating profi t –19.1 –1.3 –26.2 –1.8
Financial income and expense 6, 7Interest income from Group companies 244.0 219.9Income from other fi nancial investments 89.7 130.2Other interest and similar income 13.2 22.0Net exchange gains/losses 3.7 54.1Interest expense and similar charges –156.1 194.5 –184.7 241.5
Profi t before extraordinary items 175.4 11.6 215.3 14.6
Extraordinary items 8Extraordinary income 103.8 12.6Extraordinary expenses –8.2 95.6 –40.4 –27.8
Profi t before appropriations and taxes 271.0 17.9 187.5 12.7
AppropriationsChange in depreciation differencies 22.0 3.3
Tax expense 9 –22.0 –5.1Profi t for the fi nancial period 271.0 17.9 185.7 12.6
21
M-real Financial statements 2004
Euros million
Parent Company Balance Sheet
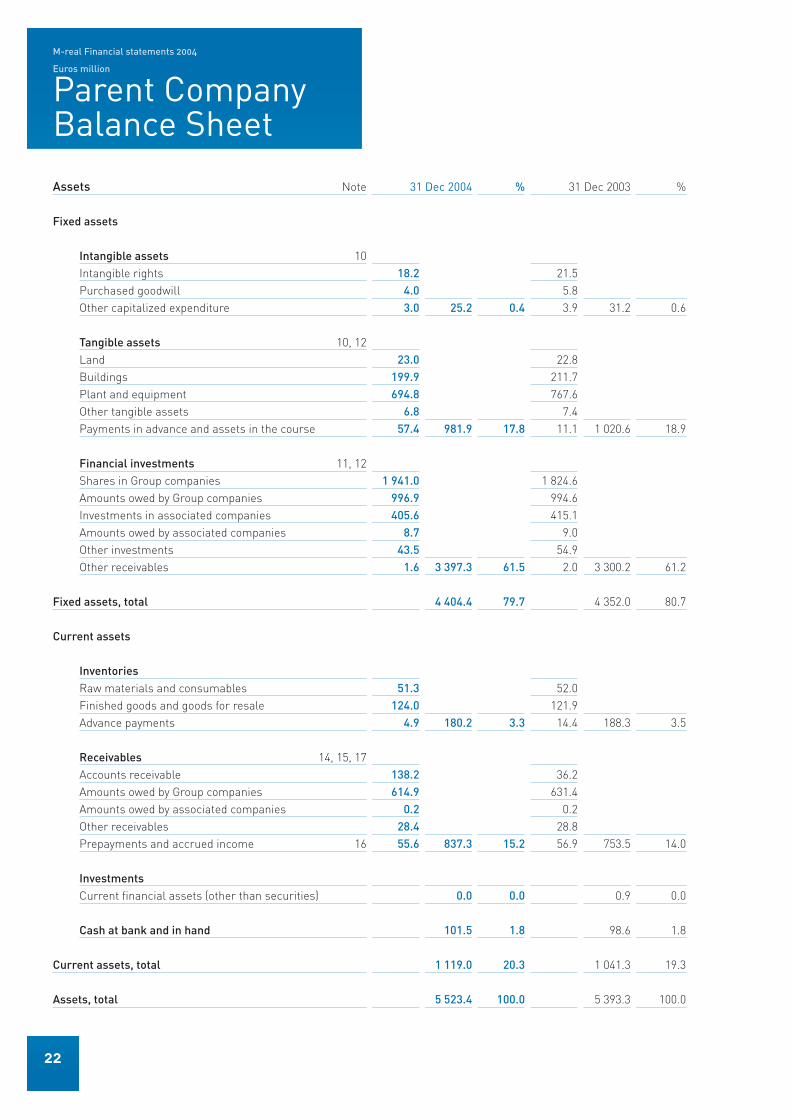
Assets Note 31 Dec 2004 % 31 Dec 2003 %
Fixed assets
Intangible assets 10Intangible rights 18.2 21.5Purchased goodwill 4.0 5.8Other capitalized expenditure 3.0 25.2 0.4 3.9 31.2 0.6
Tangible assets 10, 12Land 23.0 22.8Buildings 199.9 211.7Plant and equipment 694.8 767.6Other tangible assets 6.8 7.4Payments in advance and assets in the course 57.4 981.9 17.8 11.1 1 020.6 18.9
Financial investments 11, 12Shares in Group companies 1 941.0 1 824.6Amounts owed by Group companies 996.9 994.6Investments in associated companies 405.6 415.1Amounts owed by associated companies 8.7 9.0Other investments 43.5 54.9Other receivables 1.6 3 397.3 61.5 2.0 3 300.2 61.2
Fixed assets, total 4 404.4 79.7 4 352.0 80.7
Current assets
InventoriesRaw materials and consumables 51.3 52.0Finished goods and goods for resale 124.0 121.9Advance payments 4.9 180.2 3.3 14.4 188.3 3.5
Receivables 14, 15, 17Accounts receivable 138.2 36.2Amounts owed by Group companies 614.9 631.4Amounts owed by associated companies 0.2 0.2Other receivables 28.4 28.8Prepayments and accrued income 16 55.6 837.3 15.2 56.9 753.5 14.0
Investments Current fi nancial assets (other than securities) 0.0 0.0 0.9 0.0
Cash at bank and in hand 101.5 1.8 98.6 1.8
Current assets, total 1 119.0 20.3 1 041.3 19.3
Assets, total 5 523.4 100.0 5 393.3 100.0
22
Financial statements
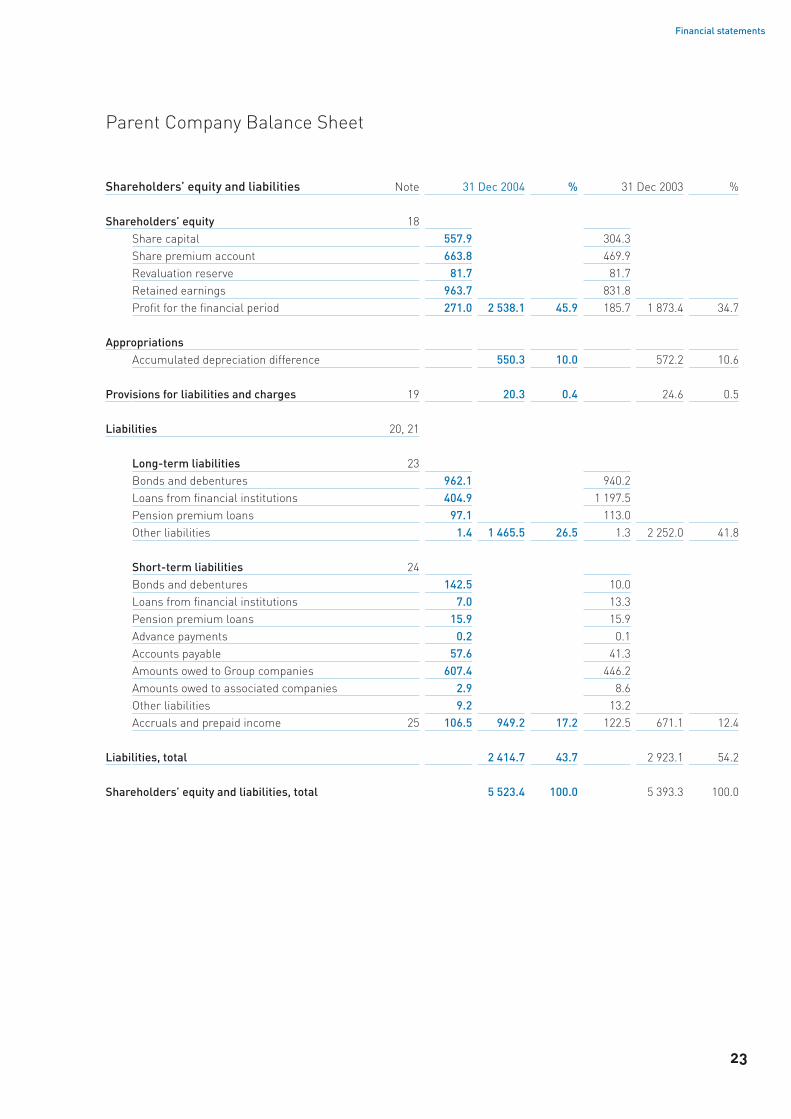
Shareholders’ equity and liabilities Note 31 Dec 2004 % 31 Dec 2003 %
Shareholders’ equity 18Share capital 557.9 304.3Share premium account 663.8 469.9Revaluation reserve 81.7 81.7Retained earnings 963.7 831.8Profi t for the fi nancial period 271.0 2 538.1 45.9 185.7 1 873.4 34.7
AppropriationsAccumulated depreciation difference 550.3 10.0 572.2 10.6
Provisions for liabilities and charges 19 20.3 0.4 24.6 0.5
Liabilities 20, 21
Long-term liabilities 23Bonds and debentures 962.1 940.2Loans from fi nancial institutions 404.9 1 197.5Pension premium loans 97.1 113.0Other liabilities 1.4 1 465.5 26.5 1.3 2 252.0 41.8
Short-term liabilities 24Bonds and debentures 142.5 10.0Loans from fi nancial institutions 7.0 13.3Pension premium loans 15.9 15.9Advance payments 0.2 0.1Accounts payable 57.6 41.3Amounts owed to Group companies 607.4 446.2Amounts owed to associated companies 2.9 8.6Other liabilities 9.2 13.2Accruals and prepaid income 25 106.5 949.2 17.2 122.5 671.1 12.4
Liabilities, total 2 414.7 43.7 2 923.1 54.2
Shareholders’ equity and liabilities, total 5 523.4 100.0 5 393.3 100.0
Parent Company Balance Sheet
23
M-real Financial statements 2004
Accounting principles
■ The fi nancial statements of M-real Corporation and the Group have been prepared in accordance with Finnish accounting practice. The fi gures are stated in euro.
Principles of consolidationCompanies belongingto the same group ■ The companies within the same
group are, in addition to M-real Corporation and its subsidiaries, M-real Corporation’s parent company, Metsäliitto Osuuskunta and its other subsidiaries.
Subsidiaries ■ The consolidated fi nancial statements include the accounts of M-real Corporation and all those subsidiaries in which the parent company controlled, directly or indirectly, over 50 per cent of the voting rights at 31 December 2004, with the exception of housing and property companies. These companies do not have a material effect on the Group’s result of operations and fi nancial posi-tion as set forth by the fi nancial statements.
The fi nancial period of all companies ended on December 31, 2004.
Subsidiaries acquired or established during the fi nancial period have been consolidated from the date of their acquisition. Companies in which a controlling interest has been given up during the fi nancial year are included in the consolidated fi nancial statements up to the time of relinquishing control.
The accounts of subsidiaries outside Finland have been consolidated using the unifi ed account-ing principles applied by the Group, which are based on Finnish accounting practice.
The purchase method of consolidation has been adopted. Goodwill, being the excess of purchase consideration over the net assets of an acquired company, is allocated to the fi xed assets of the company in the cases where the fair value exceeds the carrying value of asset in question. This portion of goodwill is amortized in accordance with the depreciation principles of the assets in question. The unallocated portion of the goodwill is shown under intangible assets in the balance sheet. The goodwill arising from the purchase of production capacity or a signifi cant market share is amor-tised on a straight-line basis over the estimated
economic life not exceeding ten years, and other goodwill over fi ve years and, in special situations, over maximum of 20 years.
All intra-Group transactions, unrealized margins on internal deliveries, internal receivables and liabilities as well as internal distribution of profi ts have been eliminated.
Minority interests have been disclosed separately from the Group’s profi t and shareholders’ equity and stated as a separate item.
Resource companies ■ The profi t and loss account and balance
sheet items as well as the notes to the accounts of the resource company Oy Metsä-Botnia Ab and its subsidiaries along with Kemiart Liners Oy have been consolidated using the line-by-line method proportionate to the M-real Group’s holding. Kemi-artliners Oy has been consolidated as subsidiary from July 1 since it became a wholly owned subsidi-ary of M-real.
Associated companies ■ The main associated companies, in which M-real Corporation’s holding and number of votes either directly or indirectly is 20–50 per cent, are consolidated according to the equity method. M-real’s share of the results of associated companies is stated in the profi t and loss account on the line “Share of Profi ts from Associated Companies.”
Goodwill arising on investments in associated companies is amortized over fi ve years or a longer estimated period of its useful life not exceeding ten years. Straight-line depreciation of goodwill is stated in the profi t and loss account on the line
“Share of Profi ts from Associated Companies.”A list of major associated companies is given in
the share specifi cation under “Shares and invest-ments” on pages 42.
TurnoverTurnover is calculated after deduction of indirect sales taxes, trade discounts and refunds. Turno-ver also includes exchange differences arising on translation of trade receivables and derivative contracts relating to the hedging of sales revenues.
24

Financial statements
Transactions and balance sheet items in foreign currency
In translating items denominated in foreign cur-rency, the European Central Bank middle rate has been applied.
The profi t and loss accounts of subsidiaries out-side the euro-zone have been translated into euro amounts at the average rate during the fi nancial year and the balance sheets at the rate on the closing date. Translation differences arising on the elimination of intra-Group shareholdings have been entered in shareholders’ equity. The Group partially hedges the foreign currency-denominated share-holders’ equity amounts of its subsidiaries outside the euro-zone by means of loans denominated in foreign currency and foreign exchange derivatives.
Transactions in foreign currencies are recorded at the rates of exchange prevailing on the date of the transaction. Receivables and liabilities denomi-nated in foreign currency have been translated into euro amounts at the exchange rate on the balance sheet date.
Exchange rate differences arising from derivative contracts used to hedge sales or pur-chases have been entered as an adjustment to the corresponding item in the profi t and loss account. Foreign exchange gains and losses on denominated out in foreign currencies have been booked to exchange gains/losses under fi nancial income and expense. The net exchange gains and losses arising are periodized over the period to be hedged. The exchange rate differences of derivative contracts as well as loans that are classifi ed as instruments hedging future cash fl ows have been entered to profi t and loss account concurrently with the hedged cash fl ow in accordance with the principles of hedge accounting.
Pensions and pension fundingStatutory pension cover for employees of the parent company and its subsidiaries in Finland is provided by payments to insurance companies. In addition, some salaried employees have supplementary pension arrangements, which are either funded (by contributors to insured schemes or to the Metsä-liitto Employees’ Pension Foundation) or held at the employer`s own risk.
The Metsäliitto Employees’ Pension Foundation is fully funded based on the current value of its assets.
Pension insurance premiums have been perio-dized to correspond to the accrual-based wages and salaries included in the profi t and loss account. The uncovered pension liability in Finland, which is the employer’s own responsibility, has been stated in the balance sheet as the pension liability under long-term liabilities.
Pension arrangements in subsidiaries outside Finland have been made in accordance with local practice.
Pension costs and liabilities have been included in the consolidated fi nancial statements accounted in accordance with the local rules of each country.
Establishment costs, research and development
Establishment costs as well as research and devel-opment costs are expensed as incurred.
InventoriesInventories are valued at cost, including the variable costs of manufacture and an appropriate portion of the fi xed costs of their procurement and manufacture. However the value of items of inven-tories must not exceed the probable net realizable value or replacement value.
Tangible fi xed assets and depreciation
Fixed assets are stated at historical cost less accu-mulated depreciation according to plan and value adjustments. In addition, the balance sheet value includes certain revaluations of land areas, shares and buildings.
Depreciation charged in the profi t and loss account is calculated on a straight-line basis so as to write off the cost of fi xed assets over their expected useful lives. The useful lives of fi xed assets, broken down by the type of asset, are:
Buildings and constructions 20–40 yearsHeavy machinery of power plants 20–40 yearsOther heavy machinery 20 yearsLight machinery and equipment 5–15 yearsOther items 5–10 years
25
Accounting principles
Depreciation is not recorded on the purchase cost of land and water areas and on revaluations.
LeasingAs a rule, leasing payments are treated as rental
expenses. Major assets held under fi nance leases are included in fi xed assets and the capital ele-ment of the leasing commitments is included under liabilities.
Environmental expenditureEnvironmental expenditure comprises the specifi -able expenses of environmental protection meas-ures aiming primarily at combating, remedying or alleviating environmental damage.
Extraordinary income and expenses
Substantial income and expenses arising on trans-actions of an abnormal nature, such as the divest-ment of businesses, are presented in the profi t and loss account as extraordinary items.
AppropriationsIn Finland and certain other countries tax regula-tions allow a portion of profi t before taxation to be transferred to untaxed reserves in the balance sheet. These appropriations are deductible for tax purposes only if they are recorded in the company’ s fi nancial statements. The most substantial of these appropriations is the depreciation difference of fi xed assets. These items are presented in the appropriations in the profi t and loss account.
Changes in the appropriations included in the fi nancial statements of group companies are divided into the change in deferred tax liability and the profi t for the fi nancial period in the consoli-dated profi t and loss statement.
Accumulated appropriations in the consolidated balance sheet have been divided into deferred tax liabilities and shareholders’ equity and the portion belonging to minority interest has been separated out.
Future costs and lossesFuture costs and losses to which the Group is committed and which are likely to be realized are
included in the profi t and loss account under the appropriate expense heading and in the balance sheet under provisions whenever the precise amount and the time of occurrence is not known and in other cases they are included in accrued liabilities.
Income taxesTaxes included in consolidated profi t and loss account are based on the taxable profi ts of group companies for the fi nancial period calculated in accordance with the local tax regulations. Taxes also include tax adjustments for previous periods and the change in deferred taxes.
The requirements of the Finnish Accounting Act have been observed in stating deferred taxes. Deferred tax liabilities and assets have been cal-culated on all the material timing differences and consolidation measures which refl ect a difference between taxation and the fi nancial statements and have an impact on earnings as well as from appropriations, applying the tax rate for subsequent years, which has been confi rmed on the balance sheet date. The balance sheet includes deferred taxes in their entirety and deferred tax assets in the estimated probable amount of the future tax benefi t.
26
M-real Financial statements 2004
Euros million
Notes to the Accounts
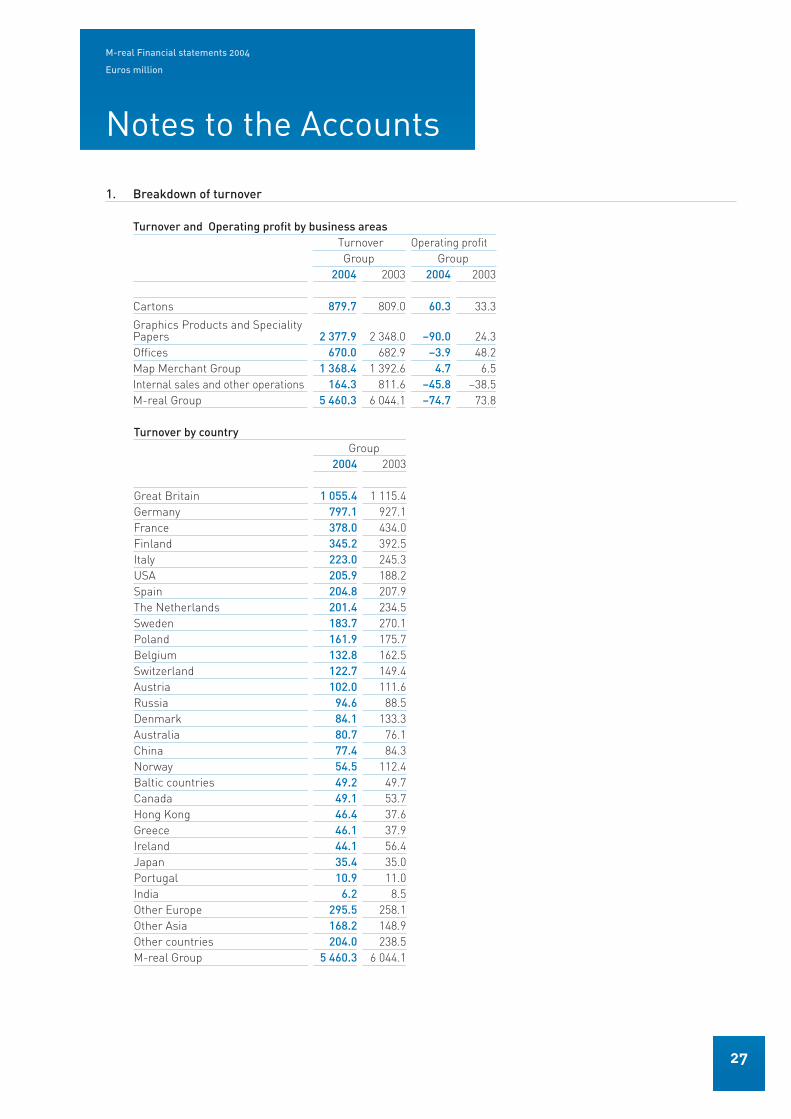
1. Breakdown of turnover
Turnover and Operating profi t by business areas Turnover Operating profi t Group Group2004 2003 2004 2003
Cartons 879.7 809.0 60.3 33.3
Graphics Products and Speciality Papers 2 377.9 2 348.0 –90.0 24.3Offi ces 670.0 682.9 –3.9 48.2Map Merchant Group 1 368.4 1 392.6 4.7 6.5Internal sales and other operations 164.3 811.6 –45.8 –38.5M-real Group 5 460.3 6 044.1 –74.7 73.8
Turnover by country Group
2004 2003
Great Britain 1 055.4 1 115.4Germany 797.1 927.1France 378.0 434.0Finland 345.2 392.5Italy 223.0 245.3USA 205.9 188.2Spain 204.8 207.9The Netherlands 201.4 234.5Sweden 183.7 270.1Poland 161.9 175.7Belgium 132.8 162.5Switzerland 122.7 149.4Austria 102.0 111.6Russia 94.6 88.5Denmark 84.1 133.3Australia 80.7 76.1China 77.4 84.3Norway 54.5 112.4Baltic countries 49.2 49.7Canada 49.1 53.7Hong Kong 46.4 37.6Greece 46.1 37.9Ireland 44.1 56.4Japan 35.4 35.0Portugal 10.9 11.0India 6.2 8.5Other Europe 295.5 258.1Other Asia 168.2 148.9Other countries 204.0 238.5M-real Group 5 460.3 6 044.1
27

Notes to the Accounts
2. Share of results of associated companiesPercentage
holding%
Share ofprofi t
Goodwillamor-
tization
Share ofprofi ts of the
companiesGoodwill
remainingMyllykoski Paper Oy 35.0 –0.6 –8.6 –9.2 19.5Other associated companies 1.8 1.8
1.2 –8.6 –7.4 19.5
The unamortized amount of consolidated goodwill for associated companies at 31 Dec. 2003 was euros 19.5 million (2003: 28.2 ); none of the Group reserves was left uncredited to income (2003: EUR 0.0).
Group Parent Company2004 2003 2004 2003
3. Other operating incomeRental income 3.4 4.0 2.6 2.7Gains on disposal of fi xed assets 14.3 11.1 4.4 4.6Service revenues 12.3 12.2 55.9 15.7Other items 56.3 46.5 10.3 18.5
86.3 73.8 73.2 41.5
4. Employee costsWages and salaries for working hours 629.9 713.5 128.6 127.4Pension expenses 83.4 82.5 30.0 36.7Other employee expenses 204.0 248.3 65.0 63.7
917.3 1 044.3 223.6 227.8
Salaries and emoluments paid to managementManaging directors and their alternates 10.6 11.3 0.4 0.6Members of the board and deputies 0.5 0.9 0.4 0.3
11.1 12.2 0.8 0.9
Pension commitments to management
Management pension commitments exist only for the Group’s German companies for which the items have been charged to earnings and entered as a liability in the balance sheet. The Group has no off balance-sheet pension liabilities on behalf of management.
The President of the parent company as well as certain other members of the Group’s management have the right to retire on a pension at the age of 62 years.
The parent company has no commitments on behalf of persons belonging to the above-mentioned bodies or who have previously belonged to them.
Personnel by business area, average Group
2004 2003
Cartons 2 842 2 970
Graphics products and Speciality papers 6 670 6 957Offi ces 2 036 2 107Map Merchant Group 2 528 2 554Other operations 2 414 5 784M-real Group 16 490 20 372
Personnel at year end Group
2004 2003
Finland 4 912 5 835Germany 2 873 4 148Great Britain 1 832 1 875Sweden 1 691 2 334Austria 872 871France 824 884Switzerland 570 577Hungary 543 575Belgium 392 407The Netherlands 342 361Poland 169 795Other countries 940 974M-real Group 15 960 19 636
28282828
Financial statements
Group Parent Company2004 2003 2004 2003
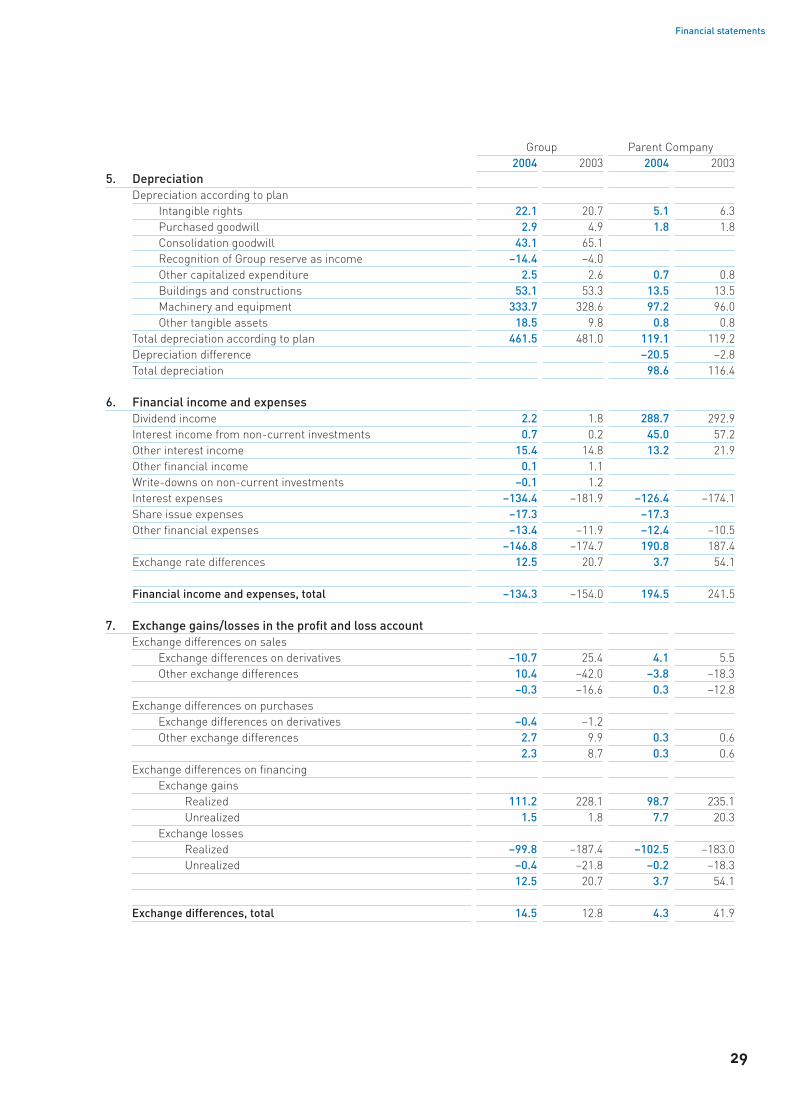
5. DepreciationDepreciation according to plan
Intangible rights 22.1 20.7 5.1 6.3Purchased goodwill 2.9 4.9 1.8 1.8Consolidation goodwill 43.1 65.1Recognition of Group reserve as income –14.4 –4.0Other capitalized expenditure 2.5 2.6 0.7 0.8Buildings and constructions 53.1 53.3 13.5 13.5Machinery and equipment 333.7 328.6 97.2 96.0Other tangible assets 18.5 9.8 0.8 0.8
Total depreciation according to plan 461.5 481.0 119.1 119.2Depreciation difference –20.5 –2.8Total depreciation 98.6 116.4
6. Financial income and expensesDividend income 2.2 1.8 288.7 292.9Interest income from non-current investments 0.7 0.2 45.0 57.2Other interest income 15.4 14.8 13.2 21.9Other fi nancial income 0.1 1.1Write-downs on non-current investments –0.1 1.2Interest expenses –134.4 –181.9 –126.4 –174.1Share issue expenses –17.3 –17.3Other fi nancial expenses –13.4 –11.9 –12.4 –10.5 –146.8 –174.7 190.8 187.4Exchange rate differences 12.5 20.7 3.7 54.1
Financial income and expenses, total –134.3 –154.0 194.5 241.5
7. Exchange gains/losses in the profi t and loss accountExchange differences on sales
Exchange differences on derivatives –10.7 25.4 4.1 5.5Other exchange differences 10.4 –42.0 –3.8 –18.3
–0.3 –16.6 0.3 –12.8Exchange differences on purchases
Exchange differences on derivatives –0.4 –1.2Other exchange differences 2.7 9.9 0.3 0.6
2.3 8.7 0.3 0.6Exchange differences on fi nancing
Exchange gainsRealized 111.2 228.1 98.7 235.1Unrealized 1.5 1.8 7.7 20.3
Exchange lossesRealized –99.8 –187.4 –102.5 –183.0Unrealized –0.4 –21.8 –0.2 –18.3
12.5 20.7 3.7 54.1
Exchange differences, total 14.5 12.8 4.3 41.9
29
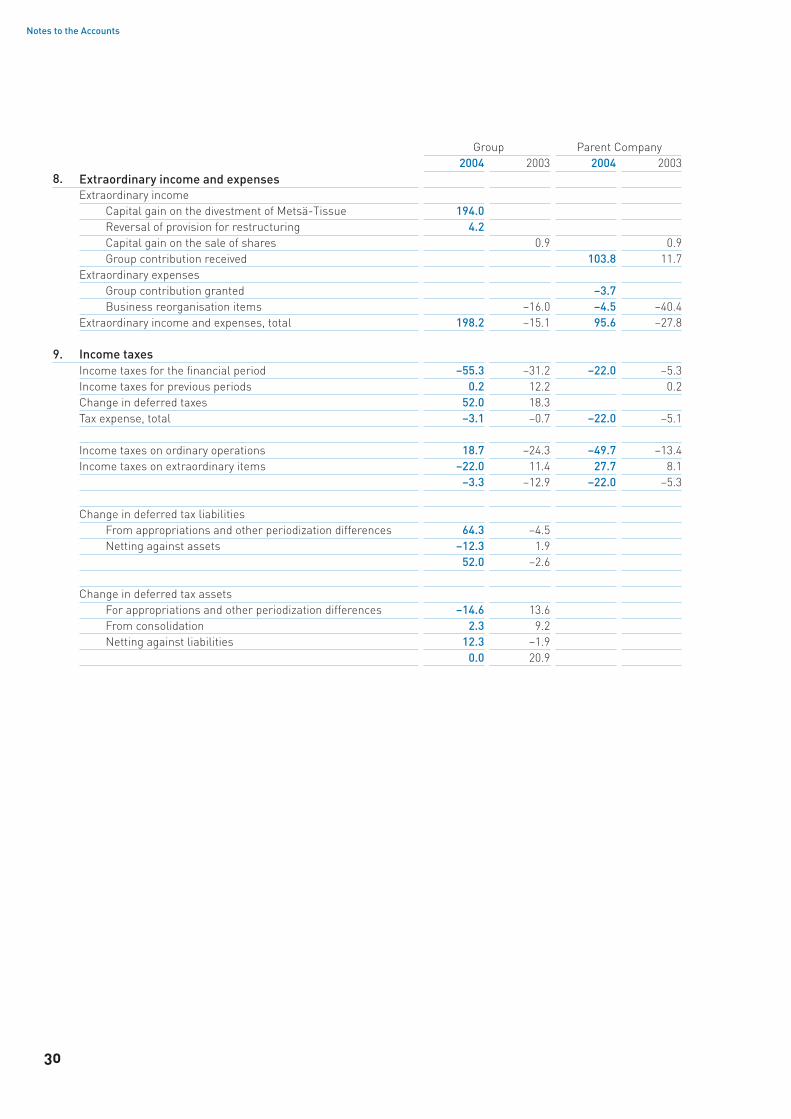
Notes to the Accounts
Group Parent Company2004 2003 2004 2003
8. Extraordinary income and expensesExtraordinary income
Capital gain on the divestment of Metsä-Tissue 194.0 Reversal of provision for restructuring 4.2Capital gain on the sale of shares 0.9 0.9Group contribution received 103.8 11.7
Extraordinary expensesGroup contribution granted –3.7Business reorganisation items –16.0 –4.5 –40.4
Extraordinary income and expenses, total 198.2 –15.1 95.6 –27.8
9. Income taxesIncome taxes for the fi nancial period –55.3 –31.2 –22.0 –5.3Income taxes for previous periods 0.2 12.2 0.2Change in deferred taxes 52.0 18.3Tax expense, total –3.1 –0.7 –22.0 –5.1
Income taxes on ordinary operations 18.7 –24.3 –49.7 –13.4Income taxes on extraordinary items –22.0 11.4 27.7 8.1
–3.3 –12.9 –22.0 –5.3
Change in deferred tax liabilitiesFrom appropriations and other periodization differences 64.3 –4.5Netting against assets –12.3 1.9
52.0 –2.6
Change in deferred tax assetsFor appropriations and other periodization differences –14.6 13.6From consolidation 2.3 9.2
Netting against liabilities 12.3 –1.90.0 20.9
3030

Financial statements
10. Intangible and tangible assets
Intangiblerights
Purchasedgoodwill
Con-solidation
goodwill
Othercapitalized
expenditure Land BuildingsPlant and
equipment
Other tangible
assets
Construc-tion in
progressGroupAcquisition costs, 1 Jan 135.2 40.7 956.4 59.6 220.2 1 412.3 5 960.3 170.3 72.3Increases during the period 24.4 0.1 1.6 0.9 11.1 8.4 117.1 29.2 100.9Transfers between items 3.7 –3.7 0.1 0.8 21.9 3.9 –26.7Decreases during the period –8.4 –12.9 –116.2 –5.0 –13.1 –153.7 –469.9 –5.0 –45.3Acquisition costs, 31 Dec 2004 154.9 27.9 841.8 51.8 218.3 1 267.8 5 629.4 198.4 101.2
Accumulated depreciation 1 Jan –71.5 –25.0 –265.5 –41.1 –1.9 –635.3 –3 506.6 –83.3Accumulated difference ondeductions and transfers 5.6 7.8 31.7 3.7 75.4 340.9 4.4Depreciation for the period –22.1 –2.9 –28.7 –2.5 –0.1 –53.0 –333.7 –18.5Accumulated depreciation 31 Dec 2004 –88.0 –20.1 –262.5 –39.9 –2.0 –612.9 –3 499.4 –97.4
Revaluations, 1 Jan 130.1 36.2Reduction in revaluations –0.5Revaluations, 31 Dec 130.1 35.7
Book value, 31 Dec 2004 66.9 7.8 579.3 11.9 346.4 690.6 2 130.0 101.0 101.2Book value, 31 Dec 2003 63.7 15.7 690.9 18.5 348.4 813.2 2 453.7 87.0 72.3
Increases/decreases include fi xed assets of subsidiaries acquired/sold. Accumulated depreciation include accumulated depre-ciation of acquired subsidiaries. The “Plant and equipment” account includes euros 2 113 million for production machinery and equipment.
Intangiblerights
Purchasedgoodwill
Othercapitalized
expenditure Land BuildingsPlant and
equipment
Other tangible
assets
Construc-tion in
progressParent CompanyAcquisition costs. 1 Jan. 51.6 20.0 36.0 22.8 314.5 1 499.7 14.0 11.1Increases during the period 1.8 0.3 1.9 19.5 0.2 54.2Transfers between items 0.8 –0.5 3.1 –4.5Decreases during the period –1.3 –1.1 –0.1 –1.0 –3.1 –3.4Acquisition costs, 31 Dec 2004 52.9 20.0 34.9 23.0 314.9 1 519.2 14.2 57.4
Accumulated depreciation 1 Jan –30.1 –14.2 –32.1 –102.9 –732.1 –6.6Accumulated difference ondeductions and transfers 0.5 0.9 1.4 4.9Depreciation for the period –5.1 –1.8 –0.7 –13.5 –97.2 –0.8Accumulated depreciation 31 Dec 2004 –34.7 –16.0 –31.9 –115.0 –824.4 –7.4
Book value, 31 Dec 2004 18.2 4.0 3.0 23.0 199.9 694.8 6.8 57.4Book value, 31 Dec 2003 21.5 5.8 3.9 22.8 211.7 767.6 7.4 11.1
The “Plant and equipment” account includes euros 662.9 million for production machinery and equipment.The undepreciated portion of capitalized interest expenses for the Group and the parent company under the balance sheet item “Buildings and constructions” at 31 Dec. 2004 was euros 1.7 million (2003: 2.9) and under the balance sheet item “Plant and equipment” it was for the Group euros 2.1 million (2003: 3.2 million) and for the Parent company euros 2.1 million (2003: 3.2 million) and “Construction in Progress” both in the Group and the Parent Company it was euros 0.5 million (2003: 0.0). The capitalization of interest expenses during the 2004 fi nancial year was euros 0.5 million ( 2003: 0.0).
31

Notes to the Accounts
11. Investments
Shares inGroup
companies
Shares inassociatedcompanies
Othershares
and partici-pations
Receiv-ables from
Groupcompanies
Receiv-ables fromassociatedcompanies
Othernon-current
receiv-ables Total
GroupAcquisition costs. 1 Jan 2004 0.7 86.4 57.3 17.6 17.9 23.1 203.0Increases during the period 1.2 1.2Decreases during the period –0.1 –17.0 –11.4 –3.1 –11.2 –42.8Acquisition costs, 31 Dec 2004 0.6 69.4 47.1 17.6 14.8 11.9 161.4
Revaluations, 1 Jan 2004 2.3 2.3Increases during the periodRevaluations, 31 Dec 2004 2.3 2.3
Book value, 31 Dec 2004 0.6 69.4 49.4 17.6 14.8 11.9 163.7
Parent companyAcquisition costs, 1 Jan 2004 1 689.5 413.4 55.0 994.6 9.0 2.0 3 163.5Increases during the period 94.8 39.4 0.5 550.9 685.6Decreases during the period –0.9 –26.4 –12.0 –436.5 –0.3 –0.4 –476.5Transfers between items 22.5 –22.5 –112.1 –112.1Acquisition costs, 31 Dec 2004 1 805.9 403.9 43.5 996.9 8.7 1.6 3 260.5
Revaluations 1 Jan / 31 Dec 135.1 1.7 136.8
Book value, 31 Dec 2004 1 941.0 405.6 43.5 996.9 8.7 1.6 3 397.3
12. Revaluations1 Jan Increases Decreases 31 Dec
GroupLand 130.1 130.1Buildings 36.2 –0.5 35.7Shares 2.3 2.3
168.6 –0.5 168.1
Parent companyShares 136.8 136.8
136.8 136.8
Revaluations are based on estimates by independent valuers of the current value of assets at the dates of valuation.
The deferred tax liability for revaluations was euros 44.0 million for the Group and euros 35.6 million for the parent company when calculated according to local tax bases.
13. Loan receivables from managementThere are no loan receivables from the managing directors of Group companies. members of the Board of Directors and their deputies as well as persons belonging to similar bodies.
3232

Financial statements
Group Parent company2004 2003 2004 2003
14. Current assets / long-term receivablesReceivables from Group companies 0.0 0.0Amounts owed by others
Loan receivables 0.3 0.1Other current receivables 4.6 4.6
Tax assets 25.5 22.130.4 26.8
15. Current assets / short-term receivables
Amounts owed by Group companiesAccounts receivable 7.4 1.6 118.8 174.7Loan receivables 33.1 69.8 398.7 301.5Other current receivables 0.0 0.6 67.8 116.9Prepayments and accrued income 29.6 38.3
Amounts owed by associated companiesAccounts receivable 2.3 1.5 0.1Loan receivables 7.1 7.5 0.2 0.1
Amounts owed by othersAccounts receivable 922.7 1 001.8 138.2 36.2Loan receivables 0.2 0.1Other current receivables 108.4 125.4 28.4 28.8Prepayments and accrued income 115.7 116.8 55.6 56.9
1 196.9 1 325.1 837.3 753.5
16. Prepayments and accrued incomeInterest 24.3 16.7 0.1Insurance 3.7 7.0 1.9 5.0Taxes 53.4 43.5 43.8 40.2Discounts 2.2 3.1 1.3Others 32.1 46.5 9.9 10.3
115.7 116.8 55.6 56.9
17. Interest-bearing receivablesLoan receivables and other non-current assets 39.9 53.7 1007.2 1005.6Liquid funds and other current assets 282.9 261.4 559.0 515.8
322.8 315.1 1 566.2 1 521.4
33

Notes to the Accounts
Group Parent company2004 2003 2004 2003
18. Shareholders’ equityShare capital, 1 Jan
Series A shares 61.8 61.8 61.8 61.8Series B shares 242.5 242.5 242.5 242.5
Total 304.3 304.3 304.3 304.3
Increase in share capitalSeries B shares 253.6 253.6
Total 253.6 253.6
Share capital, 31 DecSeries A shares 61.8 61.8 61.8 61.8Series B shares 496.1 242.5 496.1 242.5
Total 557.9 304.3 557.9 304.3
Share premium account, 1 Jan 472.9 472.9 469.9 469.9Share issue 193.9 193.9Share premium account, 31 Dec 666.8 472.9 663.8 469.9
Revaluation reserve, 1 Jan / Dec 31 104.6 104.6 81.7 81.7
Reserve funds and reserves stipulated by the Articles of Association at 1 Jan 1.7 1.7 0.0 0.0
Retained earnings, 1 Jan 1 361.8 1 577.5 1 017.5 939.2Dividends paid –53.7 –107.4 –53.7 –107.4Change in translation differences on consolidation 3.2 –13.5Other increase/decrease –0.2 0.2
Profi t for the fi nancial period –15.3 –95.0 271.0 185.7Other reserves and retained earnings, 31 Dec 1 295.8 1 361.8 1 234.8 1 017.5
Shareholders’ equity, total 2 626.8 2 245.3 2 538.1 1 873.4
Distributable fundsRetained earnings 1 295.8 1 361.8Untaxed reserves in shareholders’ equity –550.7 –587.9Other undistributable items –23.2 –23.2
Distributable funds, total 721.9 750.7
Untaxed reserves, 31 Dec Accumulated depreciation difference 954.7 990.1
Other reserves 1.6 41.5956.3 1 031.6
Deferred tax liability in untaxed reserves –261.3 –306.9695.0 724.7
Minority interest in untaxed reserves –1.3 –1.3 693.7 723.4Reserves at the date of acquisition –143.0 –135.5Untaxed reserves in shareholders’ equity, 31 Dec 550.7 587.9
3434
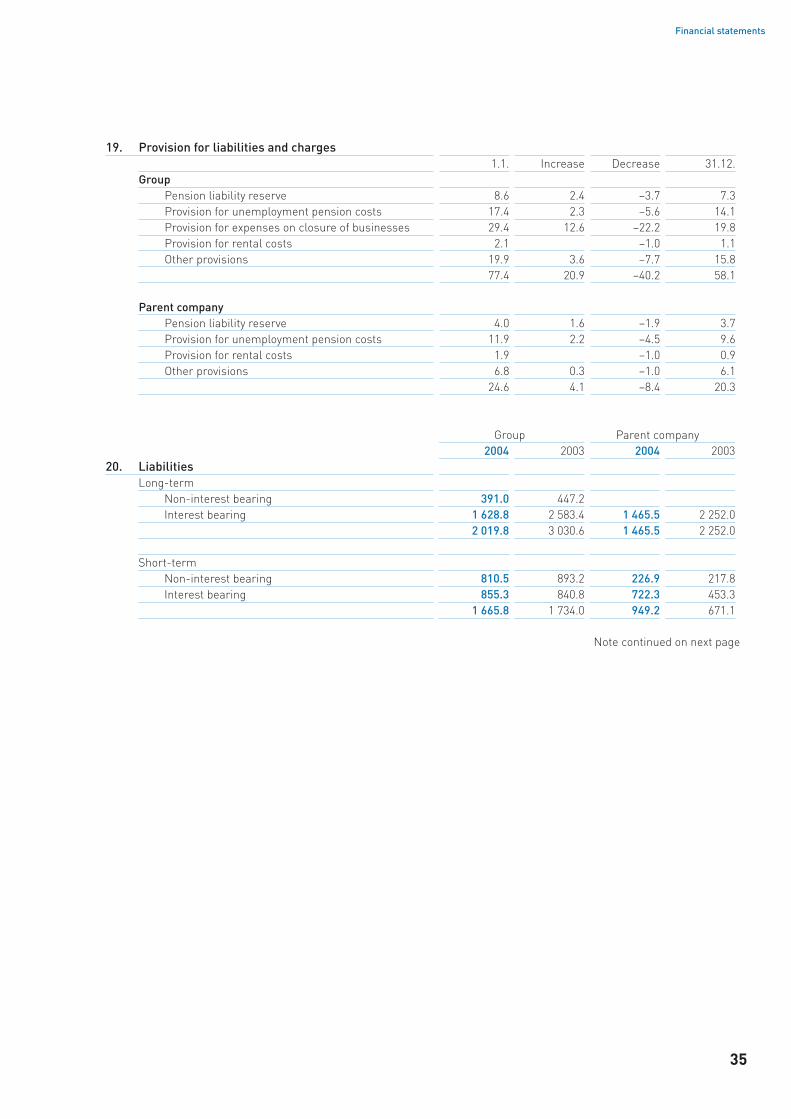
Financial statements
19. Provision for liabilities and charges1.1. Increase Decrease 31.12.
GroupPension liability reserve 8.6 2.4 –3.7 7.3Provision for unemployment pension costs 17.4 2.3 –5.6 14.1Provision for expenses on closure of businesses 29.4 12.6 –22.2 19.8Provision for rental costs 2.1 –1.0 1.1Other provisions 19.9 3.6 –7.7 15.8
77.4 20.9 –40.2 58.1
Parent companyPension liability reserve 4.0 1.6 –1.9 3.7Provision for unemployment pension costs 11.9 2.2 –4.5 9.6Provision for rental costs 1.9 –1.0 0.9Other provisions 6.8 0.3 –1.0 6.1
24.6 4.1 –8.4 20.3
Note continued on next page
Group Parent company2004 2003 2004 2003
20. LiabilitiesLong-term
Non-interest bearing 391.0 447.2Interest bearing 1 628.8 2 583.4 1 465.5 2 252.0
2 019.8 3 030.6 1 465.5 2 252.0
Short-termNon-interest bearing 810.5 893.2 226.9 217.8Interest bearing 855.3 840.8 722.3 453.3
1 665.8 1 734.0 949.2 671.1
35

Notes to the Accounts
Group Parent company2004 2003 2004 2003
Bonds Interest-%1999–2004 2.76 10.0 10.01999–2006 4.88 120.9 199.8 199.9 199.82000–2005 2.68 35.0 35.0 35.0 35.02000–2005 2.91 5.6 10.0 10.0 10.02000–2005 2.86 5.0 5.0 5.0 5.02000–2007 3.03 34.9 34.9 34.9 34.92000–2008 3.00 17.9 17.9 17.9 17.92001-2006 4.00 3.7 5.4 3.7 5.42001–2006 3.74 7.3 7.9 7.3 7.92001–2006 3.85 7.3 7.9 7.3 7.92001–2006 3.54 11.7 10.0 11.7 10.02001–2006 3.87 15.0 15.0 15.0 15.02002–2005 6.29 16.0 16.0 16.0 16.02002–2005 3.75 4.4 10.0 10.0 10.02002–2005 7.25 33.0 33.0 33.0 33.02002–2005 7.21 33.3 33.0 33.3 33.02002–2009 8.89 101.7 107.5 101.7 107.52002–2012 9.20 112.3 112.3 112.3 112.32002–2014 9.40 131.8 131.9 131.8 131.92003–2006 5.24 22.6 30.0 30.0 30.02003–2008 4.31 98.4 98.0 98.4 98.02003–2008 4.08 19.8 19.7 19.8 19.72004–2008 4.32 49.0 49.02004–2009 4.42 29.5 29.52004–2009 5.91 39.8 39.82004–2011 4.48 29.9 29.92004–2011 4.65 10.0 10.02004–2011 4.73 12.4 12.4
Total 1 008.2 950.2 1 104.6 950.2
3636
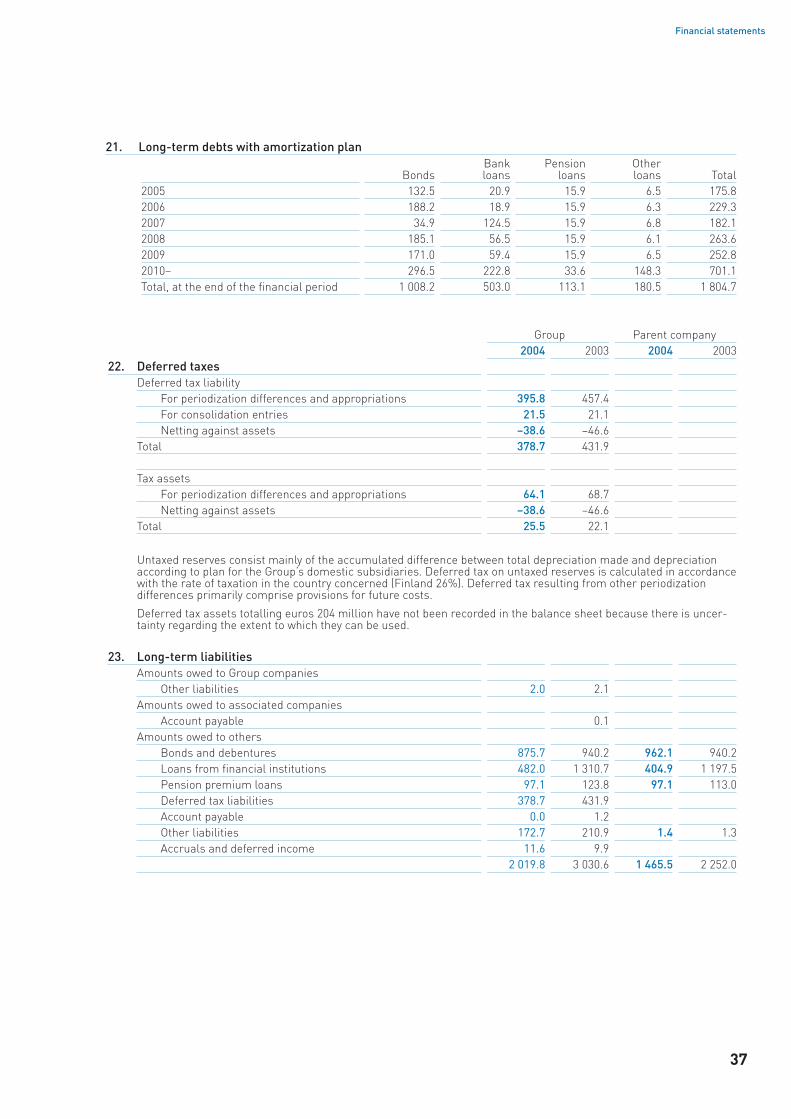
Financial statements
21. Long-term debts with amortization plan
BondsBankloans
Pensionloans
Otherloans Total
2005 132.5 20.9 15.9 6.5 175.82006 188.2 18.9 15.9 6.3 229.32007 34.9 124.5 15.9 6.8 182.12008 185.1 56.5 15.9 6.1 263.62009 171.0 59.4 15.9 6.5 252.82010– 296.5 222.8 33.6 148.3 701.1Total, at the end of the fi nancial period 1 008.2 503.0 113.1 180.5 1 804.7
Group Parent company2004 2003 2004 2003
22. Deferred taxes Deferred tax liability
For periodization differences and appropriations 395.8 457.4For consolidation entries 21.5 21.1Netting against assets –38.6 –46.6
Total 378.7 431.9
Tax assets For periodization differences and appropriations 64.1 68.7
Netting against assets –38.6 –46.6Total 25.5 22.1
Untaxed reserves consist mainly of the accumulated difference between total depreciation made and depreciation according to plan for the Group’s domestic subsidiaries. Deferred tax on untaxed reserves is calculated in accordance with the rate of taxation in the country concerned (Finland 26%). Deferred tax resulting from other periodization differences primarily comprise provisions for future costs.
Deferred tax assets totalling euros 204 million have not been recorded in the balance sheet because there is uncer-tainty regarding the extent to which they can be used.
23. Long-term liabilitiesAmounts owed to Group companies
Other liabilities 2.0 2.1Amounts owed to associated companies
Account payable 0.1Amounts owed to others
Bonds and debentures 875.7 940.2 962.1 940.2Loans from fi nancial institutions 482.0 1 310.7 404.9 1 197.5Pension premium loans 97.1 123.8 97.1 113.0Deferred tax liabilities 378.7 431.9Account payable 0.0 1.2Other liabilities 172.7 210.9 1.4 1.3Accruals and deferred income 11.6 9.9
2 019.8 3 030.6 1 465.5 2 252.0
37
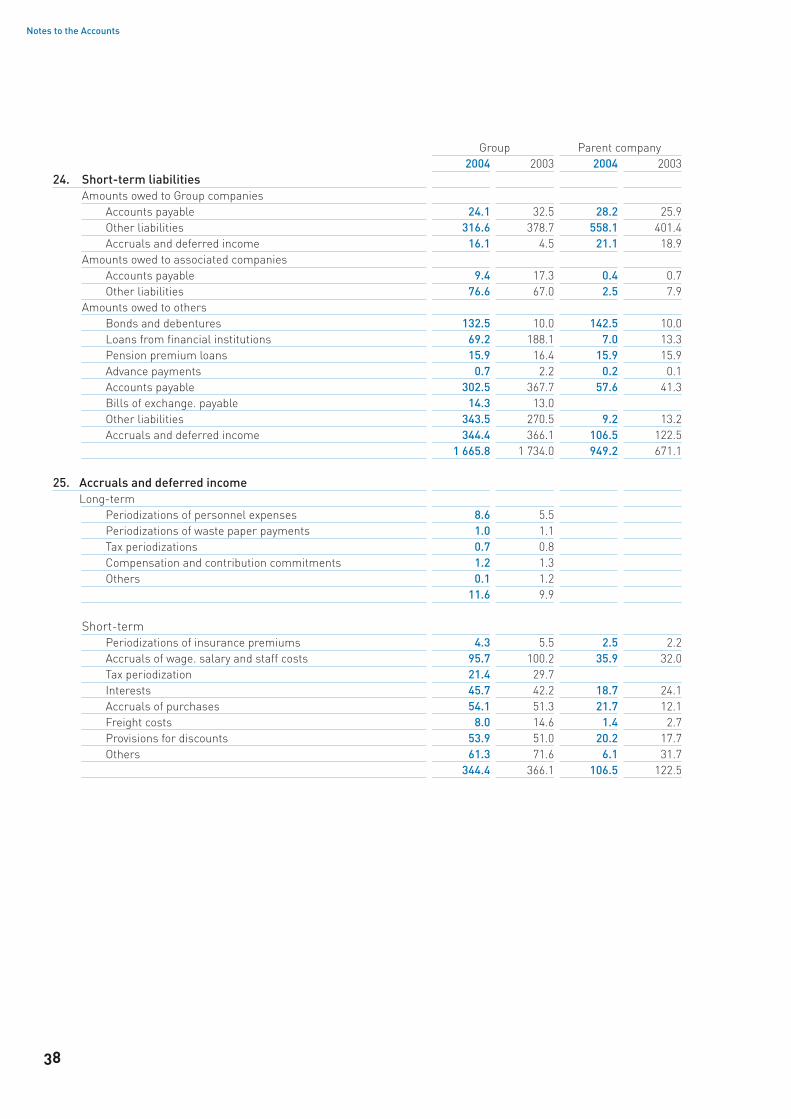
Notes to the Accounts
Group Parent company2004 2003 2004 2003
24. Short-term liabilitiesAmounts owed to Group companies
Accounts payable 24.1 32.5 28.2 25.9Other liabilities 316.6 378.7 558.1 401.4Accruals and deferred income 16.1 4.5 21.1 18.9
Amounts owed to associated companiesAccounts payable 9.4 17.3 0.4 0.7Other liabilities 76.6 67.0 2.5 7.9
Amounts owed to othersBonds and debentures 132.5 10.0 142.5 10.0Loans from fi nancial institutions 69.2 188.1 7.0 13.3Pension premium loans 15.9 16.4 15.9 15.9Advance payments 0.7 2.2 0.2 0.1Accounts payable 302.5 367.7 57.6 41.3Bills of exchange. payable 14.3 13.0Other liabilities 343.5 270.5 9.2 13.2Accruals and deferred income 344.4 366.1 106.5 122.5
1 665.8 1 734.0 949.2 671.1
25. Accruals and deferred incomeLong-term
Periodizations of personnel expenses 8.6 5.5Periodizations of waste paper payments 1.0 1.1Tax periodizations 0.7 0.8Compensation and contribution commitments 1.2 1.3Others 0.1 1.2
11.6 9.9
Short-termPeriodizations of insurance premiums 4.3 5.5 2.5 2.2Accruals of wage. salary and staff costs 95.7 100.2 35.9 32.0Tax periodization 21.4 29.7Interests 45.7 42.2 18.7 24.1Accruals of purchases 54.1 51.3 21.7 12.1Freight costs 8.0 14.6 1.4 2.7Provisions for discounts 53.9 51.0 20.2 17.7Others 61.3 71.6 6.1 31.7
344.4 366.1 106.5 122.5
3838

Financial statements
Note continued on next page
Group Parent company2004 2003 2004 2003
26. Contingent liabilitiesFor own liabilities
Liabilities secured by pledges Loans from fi nancial institutions 6.7Other liabilities 39.5 39.5
Pledges granted 1.4 46.7 39.5Liabilities secured by mortgages
Loans from fi nancial institutions 131.8 173.8 60.2 89.7Other liabilities 6.9 8.5
Real-estate mortgages 140.4 170.3 60.2 89.7Liabilities secured by mortages on movable property
Loans from fi nancial institutionsOther liabilities 1.3
Mortgages on movable property 2.9On behalf of Group companies
Real-estate mortgages 3.7 3.7 3.7 3.7Guarantee liabilities 1.1 1.2 1 833.2 1 597.2
On behalf of associated companiesGuarantee liabilities 1.0 0.7
On behalf of othersGuarantee liabilities 10.1 13.5 8.2 8.1
Other liabilitiesAs security for own commitments 0.1As security for other commitments 1.1 1.2
Leasing commitmentsPayments due in following year 13.0 18.2 4.5 4.5Payments due in subsequent years 37.3 48.4 14.1 16.4
TotalReal estate mortgages 144.1 174.0 63.9 93.4Mortgages on movable property 2.9Pledges 1.4 46.7 39.5Guarantees 12.2 15.4 1 841.4 1 605.3Promissory notes 0.4 0.7Other liabilities 1.1 1.3Leasing liabilities * 50.3 66.6 18.6 20.9
209.5 307.6 1 923.9 1 759.1
* Leasing liabilities do not include the fi nancial lease liabilities itemized below
39

Notes to the Accounts
Group2004 2003
Financial lease agreementsValue of assets in the consolidated balance sheet
Land 0.3 0.8Buildings 3.0 4.9Plant and equipment 64.3 71.4
67.6 77.1Financial lease liabilities
Short-term 4.1 5.1Long-term 57.9 63.6
62.0 68.7Future leasing payments
Year 2004 5.1Year 2005 4.1 4.7Year 2006 3.2 3.7Year 2007 2.1 2.6Year 2008 2.2 2.7Year 2009 2.2 2.7Next years 48.2 49.5
Future leasing payments, total 62.0 71.0
Group 2004 2003 Gross Going Gross GoingLiabilities due to open derivative contracts amount value amount valueI Interest rate derivatives
Forward agreements 6 339.3 –0.1 2 861.9 –0.1Options
Purchased 2 190.0 –5.4 3 800.0 –1.4Sold 3 230.0 4.0 4 400.0 –4.7
Interest rate swap agreements 3 505.4 –15.2 1 955.1 –12.1II Currency derivatives
Forward agreements 4 340.7 12.0 2 129.5 11.8Options
Purchased 898.3 13.7 920.7 8.6Sold 1 181.3 –6.2 1 316.3 –3.7
Currency swap agreements 220.4 234.8III Other derivatives
Forward agreements 8.7 –1.2 0.0 0.0Derivative contracts, total 21 914.1 1.6 17 618.3 –1.6
Also include other closed contracts to a total amount of euros 13 876.8 million
4040

Financial statements
Group Parent company2004 2003 2004 2004
27. Environmental affairsProfi t and loss account
Raw materials and consumables 25.9 27.3 5.1 5.9Employee costs
Wages and fees 6.5 7.4 1.5 1.6Social expenses 1.9 2.6 0.9 1.1
Depreciation 16.6 16.7 3.2 2.7Other operating expenses 16.1 24.1 5.1 5.9
67.0 78.1 15.8 17.2Balance sheet
Tangible assetsAcquistion costs, 1 Jan 443.3 435.0 53.6 52.5Increases 58.7 8.6 3.3 1.0Decreases –12.0Depreciation –277.2 –266.9 –23.9 –20.7Book value, 31 Dec. 212.8 176.7 33.0 32.8
Obligatory provisionsOther obligatory provisions 6.9 7.2 6.1 6.8
Conditional environmental-related liabilities 0.7 0.9
41

Notes to the Accounts
CountryNumber of
shares
Parent company’s holding, %
Group’s holding, % Currency
Nominal value of shares thousand Currency
Book value
thousandShares and participations owned by the same group
Metsäliitto Osuuskunta Finland 179 171 EUR 603 EUR 607
Shares in subsidiariesIn Finland
Alakoski Oy Finland 5 278 52.78 52.78 EUR 1 EUR 27Oy Board International Ab Finland 796 100.00 100.00 EUR 13 EUR 115Oy Hangö Stevedoring Ab Finland 150 100.00 100.00 EUR 126 EUR 3 919M-real International Oy Finland 10 000 100.00 100.00 EUR 169 EUR 3 347M-real Tissue Oy Finland 100 100.00 100.00 EUR 8 EUR 10Forestia Oy Finland 1 500 000 94.51 94.51 EUR 15 000 EUR 164 740Metsä Group Financial Services Oy Finland 25 500 51.00 51.00 EUR 4 289 EUR 5 147Kemiart Liners Oy Finland 2 000 000 100.00 100.00 EUR 20 000 EUR 22 676M-real Service Oyj Finland 19 800 000 66.00 100.00 EUR 51 000 EUR 225 259Takon Kotelotehdas Oy Finland 330 001 100.00 100.00 EUR 5 550 EUR 6 352Äänevoima Oy * Finland 4 500 000 45.00 45.00 EUR 4 500 EUR 4 500
In other countriesM-real Deutsche holding GmbH Germany 100.00 100.00 EUR 26 EUR 375 620M-real Fine B.V. The Netherlands 1 000 100.00 100.00 EUR 454 EUR 3 047M-real Holding France SAS France 12 786 663 100.00 100.00 EUR 194 931 EUR 70 357M-real IBP Deals Americas Ltd USA 50 100.00 100.00 USD 0 EUR 0M-real IBP Deals Europe S.A. Belgium 999 99.90 100.00 EUR 3 000 EUR 3 692M-real NL Holding B.V. The Netherlands 15 350 100.00 100.00 EUR 6 054 EUR 4 493M-real Petöfi Ltd Hungary 1 100.00 100.00 HUF 1 707 142 EUR 47 253Metsä Group Schweiz AG Switzerland 188 100.00 100.00 CHF 94 EUR 24M-real Sverige AB Sweden 4 950 000 49.50 100.00 SEK 1 000 000 EUR 1 116 773M-real ServiceS.p.Z.o.o Poland 400 100.00 100.00 PLN 200 EUR 286M-real UK Holdings Ltd Great Britain 146 750 000 100.00 100.00 GBP 146 750 EUR 147 939Map Merchant Holdings B.V. The Netherlands 6 000 100.00 100.00 EUR 4 727 EUR 206 033
Associated companiesFinncao Oy Finland 798 28.00 28.00 EUR 16 EUR 72Grovehurst Energy Ltd Great Britain 50 0.00 50.00 GBP 50 GBP -144Kirkniemen Kartano Oy Finland 27 408 48.00 48.00 EUR 27 408 EUR 2 714Oy Metsä-Botnia Ab Finland 42 222 47.00 47.00 EUR 84 442 EUR 277 135Metsäliitto-Yhtymän Tehdasmittaus Oy Finland 132 33.00 33.00 EUR 22 EUR 29Metsämannut Oy Finland 35 30.00 34.70 EUR 6 EUR 46MMM Logisware Oy Finland 2 250 50.00 50.00 EUR 378 EUR 2 358More Pulp Tech AB Sweden 24 000 40.00 40.00 SEK 2 400 SEK 1 009Myllykoski Paper Oy Finland 105 000 35.00 35.00 EUR 2 100 EUR 53 432Plastiroll Oy Finland 39 39.00 39.00 EUR 7 EUR 3 836
* A controlling interest of over 50% under the shareholders’ agreement1 A list of all shares and participations is kept at the headquarters of M-real Corporation
28. Major Group companies and other shareholdings 1
4242

Financial statements
CountryNumber of
shares
Parent company’s holding, %
Group’s holding, % Currency
Nominal value of shares thousand Currency
Book value
thousand
Subgroups in FinlandM-real Service Oyj
M-real Service GmbH Germany 100.00 100.00 EUR 100 EUR 1 406M-real Service AB Sweden 100 000 100.00 100.00 SEK 10 000 EUR 52 979
M–real International OyBFT-Baltic Forest Terminals Ltd Poland 200 96.00 100.00 PLN 96 EUR 168M-real Benelux B.V. The Netherlands 400 100.00 100.00 EUR 18 EUR 20M-real Benelux n.v./s.a Belgium 2 921 100.00 100.00 EUR 142 EUR 140
M-real CZ, s.r.o.Czech
Republic 100.00 100.00 CZK 100 EUR 3M-real Deutschland GmbH Germany 1 100.00 100.00 EUR 55 EUR 425M-real France S.A. France 8 211 100.00 100.00 EUR 125 EUR 219M-real Hellas Ltd Greece 306 50.00 51.00 EUR 9 EUR 9M-real Hong Kong Ltd Hong Kong 100 99.00 100.00 HKD 10 EUR 1
M-real Shanghai Ltd China 100.00 100.00 CNY 1 159 HKD 1 093M-real Ibéria S.A. Spain 147 772 99.00 100.00 EUR 148 EUR 156M-real Ibèrica Lda Portugal 80.00 100.00 EUR 5 EUR 5M-real Ireland Ltd Ireland 5 000 100.00 100.00 EUR 6 EUR 6M-real Italia s.r.l. Italy 100 000 100.00 100.00 EUR 52 EUR 51Nihon M-real KK Japan 200 100.00 100.00 JPY 10 000 EUR 74M-real Kft Hungary 30 90.00 100.00 HUF 3 000 EUR 14M-real (Middle East & North Africa) Ltd Cyprus 742 105 100.00 100.00 CYP 742 EUR 214M-real Polska Sp. Z o.o. Poland 232 100.00 100.00 PLN 116 EUR 55M-real Nordic A/S Denmark 36 100.00 100.00 DKK 715 EUR 64
M-real Nordic AB Sweden 1 000 100.00 100.00 SEK 100 DKK 41M-real Singapore Pte Ltd Singapore 10 000 100.00 100.00 SGD 10 EUR 4M-real Slovakia, S.r.o. Slovakia 100.00 100.00 SKK 200 EUR 6M-real UK Ltd Great Britain 2 400 100.00 100.00 GBP 2 EUR 264M-real USA Corporation USA 180 100.00 100.00 USD 0.18 EUR 4
Subgroups in other countriesM-real Sverige AB
Örnsköldsviks Stuveri AB Sweden 5 400 100.00 100.00 SEK 540 SEK 5 185M-real Logistics GmbH Germany 100.00 100.00 EUR 26 SEK 249M-real Reinsurance AG Switzerland 19 995 100.00 100.00 SEK 11 596 SEK 11 546
M-real Holding France SASM-real Alizay SAS France 5 015 710 100.00 100.00 EUR 80 251 EUR 167 692
M-real Alizay SNC France 39 999 999 99.99 100.00 EUR 40 000 EUR 60 980M-real PSM SA France 1 502 495 99.99 100.00 EUR 22 537 EUR 40 750
M-real Deutsche Holding GmbHCN Papiervertriebs GmbH Germany 85.00 85.00 EUR 320 EUR 1 538M-real Sverige AB Sweden 5 050 000 100.00 100.00 SEK 1 269 404 EUR 413 528M-real Zanders GmbH Germany 2 800 000 0.00 100.00 EUR 71 596 EUR 123 286
M-real New Jersey Service Co. USA 100.00 100.00 USD 5 311 EUR 0Zanders Italia S.r.l Italy 100.00 100.00 EUR 208 EUR 212Zanders Fine Papers Ltd Great Britain 100.00 100.00 GBP 50 EUR 57
M-real Stockstadt GmbH Germany 5 100.00 100.00 EUR 40 100 EUR 400 013Chemische Werke Zell-Wildshausen GmbH Germany 100.00 100.00 EUR 562 EUR 558M-real Hallein AG Austria 70 100.00 100.00 EUR 70 EUR 0
43

Notes to the Accounts
Subgroups in other countries. continued CountryNumber of
shares
Parent company’s holding.%
Group’s holding.% Currency
Nominal value of shares thousand Currency
Book value
thousandMap Merchant Holdings BV
Map Merchant Netherlands B.V. The Netherlands 50 000 000 100.00 100.00 EUR 50 000 EUR 225 918Amerpap Oy Finland 5 600 100.00 100.00 EUR 4 709 EUR 25 000Grafi sch Papier B.V. The Netherlands 570 100.00 100.00 EUR 129 EUR 29 600
Printec B.V. The Netherlands 80 100.00 100.00 EUR 18 EUR 0Uniepapier Flevoland B.V. The Netherlands 400 51.00 51.00 EUR 18 EUR 0Uniepapier Zwolle B.V. The Netherlands 400 51.00 51.00 EUR 18 EUR 0Uniepapier Randstad B.V. The Netherlands 400 51.00 51.00 EUR 18 EUR 0
GPG Papier N.V. Belgium 300 000 100.00 100.00 EUR 7 437 EUR 6 000Map Merchant Group Ltd. Great Britain 95 015 743 100.00 100.00 GBP 95 016 EUR 148 390
Hedsor Ltd. Great Britain 495 000 100.00 100.00 GBP 495 GBP 5 527James McNaughton Paper Group Ltd. Great Britain 10 000 000 100.00 100.00 GBP 10 000 GPB 57 306
James McNaughton Paper Merchants Ltd. Great Britain 75 000 100.00 100.00 GBP 75 GPB 67James McNaughton Agencies Ltd. Great Britain 40 000 100.00 100.00 GBP 10 GPB 10McNaughton Publishing Papers Ltd. Great Britain 100 100.00 100.00 GBP 0 GPB 0McNaughton Paper Ireland Ltd. Ireland 157 135 98.90 98.90 GBP 157 GPB 622McNaughton Paper Ireland Manufacturing Ltd. Ireland 1 000 98.90 98.90 GBP 1 GPB 0McNaughton Paper N.I Ltd Great Britain 1 060 98.80 98.80 GBP 0 GBP 132Printall Display Ltd. Great Britain 50 000 100.00 100.00 GBP 50 GPB 489County Paper Company Ltd. Great Britain 182 100.00 100.00 GBP 0 GPB 857Carefree Paper Company Ltd. Great Britain 100 100.00 100.00 GBP 0 GPB 29Brian J . Small ( Paper) Ltd.. Great Britain 52 185 100.00 100.00 GBP 52 GPB 0Ingram Group Ltd. Great Britain 50 000 100.00 100.00 GBP 50 GPB 0
Paper Management Services Ltd Great Britain 2 100.00 100.00 GBP 0 GPB 855
OnForm Reels Ltd. Great Britain 150 000 33.33 100.00 GBP 150 GBP 150Modo Merchants Ltd Great Britain 400 000 100.00 100.00 GBP 18 400 GBP 20 300
GM2 Logistics Ltd. Great Britain 125 000 50.00 100.00 GBP 250 GBP 125Talk Paper Ltd. Great Britain 125 000 50.00 100.00 GBP 250 GBP 125
Premier Paper Group Ltd. Great Britain 10 000 001 100.00 100.00 GBP 18 000 GBP 46 200Map Merchant Holdings GmbH Germany 40 100.00 100.00 EUR 16 873 EUR 36 800
PVV Deutschland GmbH Germany 18 000 100.00 100.00 EUR 900 EUR 3 876IT-Papier Austria 32 200 100.00 100.00 EUR 1 610 EUR 3 705ECCO-Papier Spolka z oo Poland 17 524 100.00 100.00 PLN 8 762 EUR 13 627Schramm/Papirgros A/S Denmark 48 000 100.00 100.00 DKK 4 800 EUR 12 306ECCO Hungaria Kft. Hungary 100.00 100.00 HUF 187 500 EUR 1 279Map Merchant Romania s.rl. Romania 1 584 88.00 88.00 ROL 380 160 EUR 875Interpapir d.o.o. Slovenia 100.00 100.00 SIT 68 138 EUR 678
ECCO Paper CZ s.r.o. Czech
Republic 99.90 100.00 CZK 29 970 EUR 4 827ECCO Paper Yugoslavia Export-Import DOO Yugoslavia 100.00 100.00 EUR 17 EUR 0ECCO Paper SK s.r.o. Ruzomberok / Slowakei Slovakia 100.00 100.00 SKK 6 000 EUR 1 156MODO PAPER d.o.o. Croatia 100.00 100.00 KUNA 500 EUR 74
Map Merchant Sweden AB Sweden 19 000 100.00 100.00 SEK 19 000 EUR 2 000ZAO Modo Paper Moscow Russia 500 100.00 100.00 RUR 256 SEK 0Map Eesti AS Estonia 8 491 100.00 100.00 EEK SEK 5 003Map Latvia AS Latvia 2 101 605 90.70 100.00 LVL 3 418 SEK 25 582Modo Paper Lietuva Lithuania 36 980 18.49 100.00 LTL SEK 0Oy Map Merchant Ab Finland 500 100.00 100.00 EUR 50 SEK 455UAB Map Lietuva Lithuania 20 000 100.00 100.00 LTL 3 257 SEK 0Svenskt Papper AB Sweden 400 000 100.00 100.00 SEK 40 000 SEK 474 000
Basberg Papir A/S Norway 10 000 100.00 100.00 NOK 1 000 SEK 870Modo Paper Distribucion S.A. Spain 225 114 95.98 100.00 EUR 1 410 EUR 5 739
4444
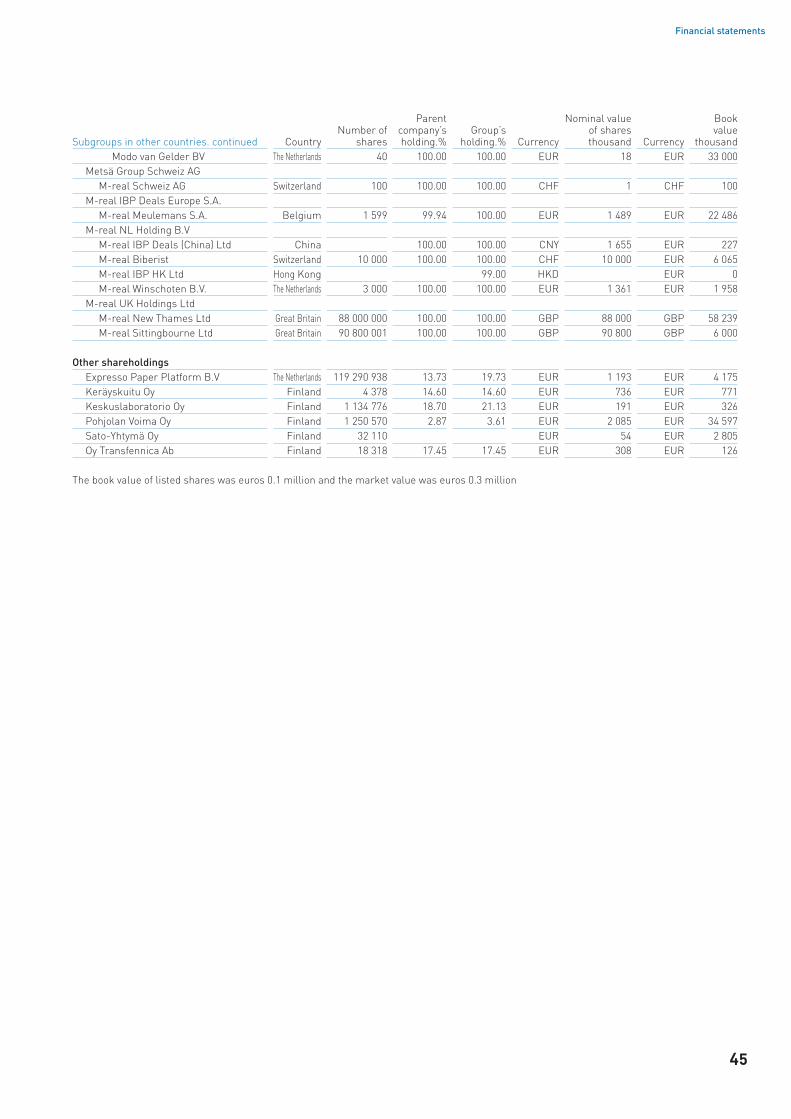
Financial statements
Subgroups in other countries. continued CountryNumber of
shares
Parent company’s holding.%
Group’s holding.% Currency
Nominal value of shares thousand Currency
Book value
thousandModo van Gelder BV The Netherlands 40 100.00 100.00 EUR 18 EUR 33 000
Metsä Group Schweiz AGM-real Schweiz AG Switzerland 100 100.00 100.00 CHF 1 CHF 100
M-real IBP Deals Europe S.A.M-real Meulemans S.A. Belgium 1 599 99.94 100.00 EUR 1 489 EUR 22 486
M-real NL Holding B.VM-real IBP Deals (China) Ltd China 100.00 100.00 CNY 1 655 EUR 227M-real Biberist Switzerland 10 000 100.00 100.00 CHF 10 000 EUR 6 065M-real IBP HK Ltd Hong Kong 99.00 HKD EUR 0M-real Winschoten B.V. The Netherlands 3 000 100.00 100.00 EUR 1 361 EUR 1 958
M-real UK Holdings LtdM-real New Thames Ltd Great Britain 88 000 000 100.00 100.00 GBP 88 000 GBP 58 239M-real Sittingbourne Ltd Great Britain 90 800 001 100.00 100.00 GBP 90 800 GBP 6 000
Other shareholdingsExpresso Paper Platform B.V The Netherlands 119 290 938 13.73 19.73 EUR 1 193 EUR 4 175Keräyskuitu Oy Finland 4 378 14.60 14.60 EUR 736 EUR 771Keskuslaboratorio Oy Finland 1 134 776 18.70 21.13 EUR 191 EUR 326Pohjolan Voima Oy Finland 1 250 570 2.87 3.61 EUR 2 085 EUR 34 597Sato-Yhtymä Oy Finland 32 110 EUR 54 EUR 2 805Oy Transfennica Ab Finland 18 318 17.45 17.45 EUR 308 EUR 126
The book value of listed shares was euros 0.1 million and the market value was euros 0.3 million
45

Shareholders’ MeetingBoard of Directors Auditors
Internal Auditing
External Auditing
Board CommitteesFinancial and Audit Committee
Compensation Committee
Nomination Committee
CEO
Deputy CEO Corporate Executive Board (CEB)
Insider Guidelines
Corporate Governance
The duties of the various corporate bodies within M-real Corporation (M-real or the Company) are determined based on Finnish Companies Act and Finnish Securities Market Act as well as other relevant laws of Finland. The Company applies the rules and recommendations of the Helsinki Stock Exchanges. This corporate governance policy is decided by the Board of directors (Board).
M-real has prepared its annual and interim fi nancial accounts conforming Finnish Accounting Standards. The Company started to apply to Inter-national Financial Reporting Standards (IFRS) from the beginning of the year 2005. These Audit reports are published in Finnish and English.
The Company’s head offi ce is in Espoo, Finland.
The decision-making bodies with responsibility for managing the Company are the Board of Direc-tors, CEO and Deputy CEO. The operations of the Company are co-ordinated through the Corporate Executive Board (CEB).
M-real’s new organization became valid as of 1 September 2004. According to new organizational structure functions and responsi-bilities of each Busi ness areas are defi ned more clearly and business areas are responsible for its sales as well as production. M-real has following Business areas: Consumer Packaging, Publishing, Commercial Printing (including Specialities) and Offi ce papers. Day-to-day operational responsibil-ity rests with the Business areas’ management and operation teams supported by Corporate Strategy & Sales Services, Industrial Development and Resources and Map Merchant Group. Other supporting corporate-level functions are Finance, Control & Legal Affairs, Human Resources & Com-munications and Corporate Public Affairs.
Annual General MeetingAnnual General Meeting of the Shareholders is held each year on a day determined by the Board before end of June.
The Company’s highest decision-making body is the Annual General Meeting of the shareholders. According to Finnish Companies Act the Annual General Meeting decides following issues among other things: – possible changes to Company’s Articles of
Association – accepts Company’s profi t and loss account and
balance sheet – decides on payable dividend – elects the members of Board of Directors and
decides remunerations for Board members and for members of Board Committees
– appoints auditors of the Company and decides their compensation
The Shareholder is entitled to get any issue on the agenda of Annual General Meeting provided that he requests that in writing so much advance that the
issue can be disclosed to notice of Annual General Meeting. Each Shareholder which has registered to shareholders’ registry at least 10 days before Annual General Meeting, has right to participate to the meeting.
M-real has appointed two regular auditors and two deputy auditors as appointed by the sharehold-ers at the Annual General Meeting (AGM).
Board of DirectorsM-real is managed under corporate governance recommendation given by Helsinki Stock Exchange.
According to the Company’s Articles of Associa-tion, the Board consists of 5 to 8 ordinary members appointed by the shareholders at the Annual General Meeting (AGM) for a one-year period at the time. Currently, the Board has eight ordinary members.
All directors are required to act at arm’s length basis with the Company and its subsidiaries and to disclose any circumstances that might be perceived as a confl ict of interest.
The shareholders at the AGM decide regularly the remuneration of the Board members including the remuneration of the members of the Board committees.
Corporate Governance Bodies in M-real Corporation
Corporate Governance General issues
46
Financial statements
The Board supervises the operations and management of M-real and decides on signifi cant matters relating to strategy, investments, organi-sational structure and fi nancing. The Board is responsible for overseeing management and for the proper organisation of the Company operations. It is likewise responsible for overseeing the proper supervision of accounting and control of fi nancial matters.
The Board has defi ned a working order which is published on M-real’s website (www.m-real.com).
Decisions in the matters, which are signifi cant and unusual in the scope and nature of the Com-pany’s operations, belong to the Board of Directors. Such matters are for example: – to elect a Managing Director for the Company
and approve of the election of members to Corporate Management Board and to supervise that the Managing Director leads administration of the Company in compliance with instructions and orders given by the Board of Directors;
– to elect the members of the Audit Committee and to approve of the Charter of the Audit Committee;
– to elect the members of the Nomination Committee and to approve of the Charter of the Nomination Committee;
– to elect the members of the Compensation Committee and to approve of the Charter of the Compensation Committee;
– to consider and approve of the Company’s strategy and its main principles;
– to approve of the annual business plan; – to supervise a proper organisation of the
Company’s book-keeping, fi nancial management and risk management;
– to decide on signifi cant investments, acquisitions, divestitures of business operations;
– to decide on considerable investments and fi nancing arrangements;
– to decide on assignment and pledging of signifi cant fi xed assets of the Company;
– to decide on granting of donations of money or authorize the Managing Director in regard to such;
– to grant and revoke the Company’s proxy holders; – to supervise compliance with the Company’s
Articles of Association, to convene the Annual
General Meeting of Shareholders, and to supervise implementation of resolutions passed by the Annual General Meeting of shareholders;
– to sign and present the fi nancial statements of approval by the Annual General Meeting of Shareholders and to present a proposal for dividend distribution;
– to approve of central manuals and instructions guiding the Company’s business operations;
– to decide which persons are permanent insiders in the Company and to approve of the Company’s insider rules;
– for the Stock Exchange’s information, to publicize such circumstances that tend to affect the value of Company shares, or that must otherwise be publicized by the Company as pro-vided by the Securities market Act.
The Board elects the Chairman and the Vice Chair-man among the Board members and appoints the CEO, Deputy CEO and members of Corporate Executive Board. The Board approves the organisa-tional structure of the Company.
The Board evaluates its performance annually. The Board also reviews the corporate governance policy annually and amends it when required.
The Board’s work is supported through its com-mittees the Audit Committee, the Nomination Com-mittee and the Compensation Committee (formed on 8.4.2004). Each committee’s chairman and members will be appointed by the Board annually.
The Board meets regularly during the year. The Board held 22 meetings out of which 5 was held as telephone conference during the year 2004. On average the members of Board attended 94 per cent of the meeting.
Board committeesFinal decisions are made by Board of Directors based on preparatory work of Board Committees.
Audit Committee ■ The Board has formed an Audit Committee to support the Board in maintaining the integrity of the Company’s fi nancial reporting and the Board’s control functions. Audit Committee regularly reviews the system of internal control, management and reporting of fi nancial risk and the audit process in addition Audit Committee reviews assessment of the Company’s risk management
47

Corporate Governance
and central risk areas, and review assessment of the compliance with laws. It makes recommenda-tions regarding on the appointment of external auditors for the Company. Audit Committee annu-ally reviews annual plan of Internal Auditing as well as reviews material audit reports.
The Committee is comprised of three (3) inde-pendent, non-executive Members of the Board. The committee members must have a fi nancial exper-tise and experience in accounting and accounting principles applicable to the Company. The Audit Committee meets regularly at least four times a year. The Committee members meet the auditors of the Company without the members of the manage-ment being present in connection with its meet-ings. The Chairman of the Committee presents a report based on each Audit Committee meeting to the Board. The tasks and responsibilities of the Audit Committee are defi ned in its charter, which is approved by the Board. The Audit Committee members may receive compensation solely based on their role as directors and the compensation is decided upon by the shareholders at AGM.
The Audit Committee is chaired by Asmo Kalpala (chairman), President of the Tapiola Group, and the members are Kim Gran, President and CEO of Nokia Tyres plc and Erkki Karmila, Executive Vice President of Nordic Investment Bank.
Present in the meetings of Audit Committee has also been Company’s Auditor, CEO, CFO and other members of the management, when needed. Audit Committee had six meetings during the year 2004.
The Charter of Audit Committee can be seen on M-real’s website (www.m-real.com).
Nomination Committee ■ The Board has a Nomination Committee that is responsible for giving a recom-mendation to the shareholders regarding the com-position of the Board of Directors and remuneration of Board members. The Committee is comprised of three (3) Members of the Board. The Nomination Committee meets at least once a year. The Chair-man of the Committee presents the proposals of the Nomination Committee to the Board. The task and responsibilities of the Nomination Committee
are defi ned in its charter, which has been approved by the Board.
The Nomination Committee is chaired by Arimo Uusitalo (chairman), Titular Farming Counsellor, and the members are Runar Lillandt, Titular Farm-ing Counseller, and Antti Tanskanen, CEO of the OP Bank Group.
The Charter of Nomination Committee can be seen on M-real’s website (www.m-real.com)
Compensation Committee ■ The Board has a Compen-sation Committee that is responsible of evaluating and approving nomination and compensation exec-utives of evaluating the performance and compen-sation of the CEO, and making recommendations to the Board relating to management compensation issues generally. The Board approves the compen-sation of the CEO. The Committee is comprised of three (3) Members of the Board. The Compensa-tion Committee meets regularly at least once a year. The Chairman of the Committee presents a report on each Compensation Committee meeting to the Board. The tasks and responsibilities of the Compensation Committee are defi ned in its charter, which has been approved by the Board.
The Compensation Committee is chaired by Antti Oksanen (chairman), President of Metsäliitto Group, and the members are Erkki Karmila, Executive Vice President of Nordic Investment Bank, and Arimo Uusitalo, Titular Farming Counsellor. The Compen-sation Committee held one meeting during 2004.
The Charter of Compensation Committee can be seen on M-real’s website (www.m-real.com).
Chief Executive Offi cer (CEO)
The CEO is in charge of the day-to-day manage-ment of the Company in accordance with instruc-tions and orders issued by the Board. It is the duty of the CEO to ensure that the Company’s accounting methods comply with the laws and that fi nancial matters are handled in a reliable and professional manner.
Chief Operating Offi cer has a written Managing Directors Service Contract. The Board of Directors shall conduct an annual evaluation of performance and working methods of CEO.
The CEO is directly in charge of monitoring and coaching Consumer Packaging, Publishing,
48

Financial statements
Commercial Printing and Offi cer Papers business areas, Corporate Strategy & Sales Services unit, Industrial Development & Resources unit and Map Merchant Group as well as the Corporate functions supporting business functions of the Company. The Corporate functions are Finance, Control & Legal Affairs, Human Resources & Communication, and Corporate Public Affairs. In addition, CEO super-vises decisions regarding key personnel and other important operational matters.
Deputy Chief Executive Offi cer (Deputy CEO)
The Deputy CEO acts as deputy to the CEO. The Deputy CEO is the head of Publishing business area as well as Industrial Development & Resources.
Corporate Executive Board (CEB)In managing M-real, the President and CEO is assisted by the Corporate Executive Board (CEB), which comprised Jouko M. Jaakkola (until 31. 12. 2004), Hannu Anttila and the executives reporting to Mr. Anttila: Aarre Metsävirta, Hannu Kottonen, Jarmo Salonen, Peter Sandberg, Seppo Puotinen, Ari Himma and Juhani Pöhö. The Chair-man of the CEB was Hannu Anttila, Vice Chairman was Jouko M. Jaakkola (until 31. 12. 2004) and Matti Mörsky, Senior Vice President of Business Develop-ment, acted as secretary to the CEB.
The CEB’s tasks and responsibilities are plan-ning of investment and follow-up, preparation of strategic guidelines, allocation of resources, review of signifi cant day-to-day operations and operational decisions, preparatory work with regard to Board meetings.
The CEB meets regularly, approximately every second month, and always when required.
Operational Committees
Investment Committee ■ The Investment Committee is chaired by the Deputy CEO and it has members of each Business Area as well as members of Com-pany’s Management. The Committee’s members are appointed by the CEO.
The tasks and responsibilities of the Investment Committee are co-ordination of the investment planning and approval process, co-ordination of the
investment completion audit and follow-up proc-ess, participation in the planning and execution of large investment projects in the Company’s various geographical areas, and the drawing-up of recom-mendations on funds available for Investments.
The Investment Committee meets as required.
Risk Management Committee ■ Risk Management Committee is chaired by CFO. The members of the Committee are appointed by the CEO.
Risk Management Committee is responsible for continuous development of risk management proc-ess, defi ning operating principles and overall proc-ess. It evaluates fi ndings and the result of executed risk surveys and risk reporting and prepares a summary of risk surveys based on its evaluation for the CEO.
Risk management Committee held fi ve meetings during year 2004, and meets as required.
Research and Development (R&D) Committee ■ The R&D is chaired by the Deputy CEO. The Commit-tee’s members, representing the R&D organisation and the product areas, are appointed by the CEO.
The tasks of the R&D Committee are: to secure a group perspective on R&D in the Company with regard to the relevance of R&D and its quality and effi ciency, to initiate R&D policy and strategy at Group level, to monitor group R&D and to supervise Company-fi nanced R&D undertaken externally. In order to facilitate these tasks, the R&D Commit-tee must monitor technology and future-oriented product development.
The R&D Committee meets regularly as required.
Salaries, fees and other benefi ts of the Board of Directors and Senior Management
In accordance with a decision made by year’s 2004 Annual General Meeting, the Chairman of the Board of Directors received a fee of euros 61 200 per annum, the Vice Chairman euros 51 600, and the members euros 40 800. In addition, a meet-ing attendance fee of euros 450 was paid to those present at each meeting of the Board of Direc-tors and its standing committees. The fees paid to the members of the Board of Directors in 2004 totalled euros 421 950. The annual salaries, emolu-
49
Corporate Governance
ments in kind and fees paid to Jouko M. Jaakkola, President & CEO (until 31. 12. 2004) in 2004 totalled euros 456 435. The annual salaries, emoluments in kind and fees paid to the other members of the Corporate Executive Board in 2004 totalled euros 1 298 748.
Hannu Anttila, the Company’s President and CEO starting at 1. 1. 2005, receives a monthly salary of euros 32 000, including benefi ts in kind in the form of a car and a telephone. Under the Compa-ny’s profi t-sharing and incentive scheme for top management, an amount equivalent of up to six months’ salary may be paid to the President and CEO as profi t-sharing based on his overall per-formance. The retirement age of the President and CEO, as stated in the Managing Directors Service Contract, is 62. In the event that the President and CEO is dismissed, or in situations where control of the Company changes, he has the right to receive compensation corresponding to 18 months’ salary. The period of notice is 6 months.
The shares and options held by the members of the Board of Directors and the Corporate Executive Board are detailed on pages 52–55.
At 31 December 2004, the Company’s President and CEO, the Deputy CEO or the members of the Board of Directors had no loans outstanding from the Company or its subsidiaries.
AuditorsThe shareholders elect two auditors and two deputy auditors according to M-real’s Article of Associa-tion at the AGM annually. The Audit Committee gives to the Board its recommendation as to who should serve as auditor and to the shareholders at the AGM. The auditor shall be an authorised public accounting fi rm or fi rms, which then appoints the auditors of Company.
During 2004 Company’s Auditors were Göran Lindell, Authorized Public Accountant and Pricewa-tehouseCoopers Oy represented by Ilkka Haarlaa, Authorized Public Auditor. The Company has paid audit fees to PricewaterhouseCoopers Oy euros 1 942 000 and other audit fi rms of the subsidiary companies euros 817 000. Additionally the Company has paid fees for non-audit services to Pricewater-housCoopers euros 1 633 000.
Internal AuditingThe Internal Auditing in M-real is taken care by PwC internal auditing group. PwC internal auditing group monitors the adequacy and effectiveness of systems, internal controls and accounting of the Company. Annual plan of Internal Auditing is reviewed by Audit Committee.
The Internal Auditing Group of Pricewaterhouse-Coopers reports its fi ndings to the management, the external auditors and the Audit Committee. Internal auditing reports to the CFO on a functional basis, CEO, and has direct access to the Chairman of the Audit Committee.
Risk ManagementThe risk management department is in charge of developing and executing the Company’s risk management process as well as co-ordinating the risk management work within the Company.
The Corporate risk management department employs a comprehensive and holistic approach that is carried out as a continuous process. The objective of the risk management work is to identify measure and control risks, which if they materi-alise, can jeopardise the Company’s operations and the achievement of the targets that have been set. The head of the Corporate Risk Management department reports to the CFO.
The risk management committee, which is chaired by the CFO, reports on a regular basis to the Audit Committee, the Corporate Executive Board and the Board of Directors.
Detailed information regarding M-real’s risk management is recorded in the Company’s Risk Management Policy and Manual.
More detailed description of risk management is on page 72.
Insider GuidelinesThe Company complies with the insider guidelines of the Helsinki Exchanges.
The Company’s internal insider guidelines are published and regularly distributed throughout the organisation. The Company expects all of its employees to act as required of an insider.
All information that relates to the Company’s present and future business operations is expected to be kept strictly confi dential. The Company’s
50

Financial statements
insider register is publicly available and is main-tained by the Finnish Central Securities Depository.
Permanent insiders are members of the Board of Directors, the CEO and Deputy CEO, and the auditors. The CEO has decided that other perma-nent insiders shall be the members of Corporate Executive Board and nominated persons in legal, fi nancial, accounting, R&D, communications and investor relations functions.
Persons, who participate in the development and preparation of a project, including mergers or acquisitions, are considered project-specifi c insid-ers. A separate project-specifi c insider register is maintained when considered necessary.
Each year the Company decides on so-called “Closed windows” i.e. specifi c periods of time then insiders are barred from trading in shares and options issued by the Company as well as warrants related to the Company. In 2004 the Closed Win-dows were 1 January to 5 February 2004 (relating to Annual Report of 2003) and 1 to 29 April 2004, 1 to 26 July 2004 and 1 to 29 October 2004 relating to 2004 Interim Reports.
M-real’s organization 1 January 2005
Corporate Public AffairsA. Temmes
President & CEOHannu Anttila
Corporate Strategy & Sales ServicesS. Puotinen
Finance, Control & Legal AffairsJ. Pöhö
Human Resources & CommunicationsA. Himma
Industrial Development & ResourcesA. Metsävirta
Consumer PackagingH. Kottonen
PublishingA. Metsävirta
Commercial PrintingJ. Salonen
Offi ce PapersP. Sandberg
MAPK-J. Lindborg
51

Corporate Governance
Antti Oksanen, (1944) ■ Chairman of the Board since 1995
Member of the Board since 1993Master of Science in ForestryCounsellor of MiningPresident of Metsäliitto Group,President & CEO of Metsäliitto CooperativeMember of the Board of the Finnish Forest
Industries Federation since 1995,Member of the Council of the Confederation of
Finnish Industry and Employers TT since 1996, Member of the supervisory Board in Vapo Oy since
2002, Member of the Council in Research Foundation of
the University of Helsinki since 2002, Vice Chairman of the Board of Metsäliitto
Cooperative, Chairman of the Board of Finnforest Corporation and several other Metsäliitto Group companies,
Vice Chairman of the Supervisory Board of the Tapiola Mutual Pension Insurance Company
Shares owned in M-real Corporation: 130 B shares
Arimo Uusitalo, (1942) ■ Vice Chairman of the Board since 1994
Member of the Board since 1994Master of Science in AgricultureCounsellor of AgricultureFarmerChairman of the Board of Metsäliitto Cooperative,Vice Chairman of the Board of Finnforest
Corporation,Member of the Board of Oy Metsä-Botnia Ab,Chairman of the Board of Raisio Group since 2001,Chairman of the Executive Board of Osuuspankki
Kantrisalo 1977Shares owned in M-real Corporation: 110 A shares
and 2 710 B shares
Kim Gran, (1954) ■ Member of the Board since 2004
Bachelor of Science in EconomicsPresident and CEO of Nokian Tyres plcChairman of the Board of the Rubber
Manufacturers’ Association of Finland since 2001Member of the Council of the Confederation of
Finnish Industry and Employers TT since 2002Member of the Board of Nokian Tyres plc since
2002Member of the Board of Kuusakoski Oy and
Kuusakoski Group Oy since 2004Shares owned in M-real Corporation: no ownership
Timo Haapanen, (1939) ■ Member of the Board since 2000
AgronomistCounsellor of AgricultureFarmerMember of the Board of Metsäliitto Cooperative
since 1995Shares owned in M-real Corporation: 4 580 B
shares
Asmo Kalpala, (1950) ■ Member of the Board since 1990
Master of Science in EconomicsChairman of the Boards and President of the
Tapiola GroupMember of the Board of the Federation of Finnish
Insurance Companies since 1988,Member of the Board of the Insurance Employers’
Association since 1988Member of the Board of YIT Corporation since 2000,Member of the Board of LTT Research Ltd since
1998Member of the Board of Finnish Cultural
Foundation since 2001Shares owned in M-real Corporation: no ownership
Corporate GovernanceM-real Board of Directors
52

Financial statements
Erkki Karmila, (1942) ■ Member of the Board since 1992
Master of Laws (trained on the bench) Master of Laws 1968, Harvard UniversityExecutive Vice President of the Nordic Investment
BankDeputy Managing Director, Finnish Export Credit
1981–1982 and Managing Director 1982–1983Executive Vice President of Kansallis-Osake-
Pankki, 1983–1991,Director of the Invest in Finland Bureau, 1992Shares owned in M-real Corporation: no ownership
Runar Lillandt, (1944) ■ Member of the Board since 1999
Agricultural school graduateCounsellor of AgricultureFarmerChairman of the Supervisory Board of Metsäliitto
Cooperative since 1999,Member of the Board of SLC since 1988,Chairman of the Supervisory Board of Pohjanmaan
Liha since 1994 and Chairman of the Board in 2002,
Member of the Board of A-tuottajat 2001,Member of the Board of Suupohjan Osuuspankki
since 1997,Member of the Board of Atria Corporation since
2002,Chairman of the Board of Moelven Industrier ASA
since 2002Shares owned in M-real Corporation: 7 545 B
shares
Antti Tanskanen, (1946) ■ Member of the Board since 1992
Ph.D. in EconomicsChairman and CEO, OP Bank Group,Chairman of the Executive Boards of OP Bank
Group Central Cooperative and OKO Bank since 1997
Professor in Economics at Jyväskylä University 1979–1996 and Rector 1988–1991,
Chairman and President of the Academy of Finland 1992–1996
Member of the Unico Banking Group’s Steering Committee since 1996,
Member of the Board of the Central Chamber of Commerce since 1999, chairman since 2004
Member of the Board of Employers’ Confederation of Service Industries since 2003
Shares owned in M-real Corporation: no ownership
53

Corporate Governance
Hannu Anttila ■ President and CEOBachelor of Science in Economics, born in 1955
Hannu Anttila’s career began in 1979, when he became an Internal Auditor at Oy Silja Line Ab. From 1980 to 1985, he worked for Oy Metsä-Botnia Ab, from 1980 to 1982 as the Assistant Controller at the Kaskinen Mill and then as the Director of Administration at Botnia’s Äänekoski Mill. From 1985 to 1986, Mr Anttila was the SVP, Finance and Admin-istration and Deputy CEO, of Suomen Kuitulevy Oy, which was at that time part of the Enso Group. Mr Anttila returned to Metsä-Botnia in 1987, assuming the position of Financial Director, and then, in 1990, transferred to Metsä-Serla Corporation (now M-real Corporation), where he became SVP, Financial Control. In 1992, he was appointed as Metsä-Serla’s SVP, Finance and as a Member of the Corporate Executive Board and in 1996 as Financial Director. In 1997, Mr Anttila became the Senior Executive Vice President of Oy Metsä-Botnia Ab. In 1998, Mr Anttila assumed the position of Chief Executive Offi cer at Metsä Tissue Corporation, remaining in the position until spring 2003, when he was appointed as Metsäliitto Group’s SVP and Chief Financial Offi cer. In 2004 Mr Anttila returned into M-real Corpo-ration’s employ: as he was appointed in June as M-real Corporation’s Senior Executive Vice President effective 1 July, as Chief Operating Offi cer as from 1 September and as President and CEO as from 1 January 2005.
Shares owned in M-real Corporation: 12 690 B shares
Aarre Metsävirta ■ Senior Executive Vice President Deputy CEOIndustrial Development & ResourcesPublishingMaster of Science in Engineering, born in 1945
Aarre Metsävirta has made his entire business career in the forest industry. From 1972 on he held various posi-tions in the pulp and paper industry of A. Ahlström Oy, his last position being Director of Research. In 1983 he joined Rauma-Repola Oy, where he was Technical Director and later Senior Vice President of the Paper Division. He left to become Executive Vice President of Tampella Ltd in 1988 and in 1991 President of Tampella Forest Inc. In 1994 Mr Metsävirta became Chairman of the Board of Veitsiluoto Oy. In 1996 Mr Metsävirta was appointed Executive Vice President of Metsä-Serla Corporation (now M-real Corpo-ration), head of the Paper Group and member of the Cor-porate Executive Board. In the new organization of 2001 Mr Metsävirta was appointed head of Operations & Sourcing with responsibility for the production of the paper and board mills, Corporate Energy, Corporate Purchasing, Research
Corporate GovernanceCorporate Executive Board
& Development and Environment functions. In 2003 the name of his responsibility area was changed into Opera-tions and it was added further by logistics and IT. Further-more, Mr Metsävirta was appointed Senior Executive Vice President and Deputy CEO of M-real in 2003. In 2004 the name of Mr Metsävirta’s responsibility area was changed into Industrial Development & Resources consisting of the following functions: Corporate Energy, Corporate Pur-chasing, Corporate R & D, Environmental Affairs, Techni-cal Projects and Pulp. In addition, Mr Metsävirta was also appointed SEVP of the Publishing business area.
Shares owned in M-real Corporation: 1 000 A shares and 8 170 B shares
Juhani Pöhö ■ Executive Vice President & Chief Financial Offi cer (EVP&CFO)Finance, Control & Legal AffairsBachelor of Science in Economics, born in 1951
Juhani Pöhö began his career as Assistant District Manager in Alko in the years from 1974 to 1976. He worked from 1976 to 1983 as Manager of Internal Auditing and Administrative Manager in Oy Sinebrychoff Ab, and in Wicanders Oy from 1983 to 1986 as Financial Manager. From 1986 to 1990 Mr Pöhö was Financial Director of Koskisen Oy. He left the company to join Tampella Group where his fi rst position was Senior Vice President, Internal Auditing and thereafter from 1993 to 1996 Senior Vice President and Chief Financial Offi cer. Mr Pöhö joined Metsä-Serla Corporation (now M-real Corporation) in 1996 as Financial Director of the Kirkniemi mill. In addition, he was appointed Business Controller of Metsä-Serla’s Publishing Business area in 1999. Mr Pöhö worked as Kirkniemi Mill manager from 2001 to 2004. In 2004 Mr Pöhö was appointed M-real’s Senior Vice President and Chief Financial Offi cer. In the new organisation of August 2004, Mr Pöhö was appointed Executive Vice President and Chief Financial Offi cer and member of the Corporate Executive Board.
Shares owned in M-real Corporation: 1 835 B shares
Ari Himma ■ Senior Vice President (SVP)Corporate Human Resources & Corporate CommunicationsMaster of Science in Social Sciences, born in 1959
Ari Himma worked as Kone Corporation’s Human Resources Development Manager from 1987 to 1994. He joined MacGregor Oy as Human Resources Director in 1994. From 1995 to 1999 he worked as Vice President, Human Resources, at Neles Controls Group, where he
54

Financial statements
was a member of the Executive Board. In 1999 Mr Himma became Vice President, Human Resources, for Metso Automation Ltd. In 2001 Mr Himma was appointed Senior Vice President, Human Resources for the M-real Group. In 2003 he was appointed Senior Vice President, Corporate services. In 2004 Mr Himma was appointed Executive Vice President, Corporation Human Resources & Corporate Communications.
Shares owned in M-real Corporation: 2 500 B shares
Seppo Puotinen ■ Executive Vice President (EVP)Corporate Strategy & Sales ServicesLicentiate in Technology, born in 1955
Seppo Puotinen worked at University of Oulu from 1981–1985 as an Assistant in applied mechanics and as a researcher at the Finnish Pulp and Paper Research Institute during the years 1985 and 1986. Mr Puotinen joined Metsä-Serla Corporation (now M-real Corporation) in 1986 and worked in various positions with business development, marketing and operational responsibility for 13 years. He was appointed as Vice President, Cartons Division, Corrugated and Folding Carton operations in 1999. In 2000, Mr Puotinen joined SCA Packaging as Man-aging Director for Finland, Russia and the Baltic countries and was appointed as President of SCA’s Containerboard Division located in Brussels in 2002. In September 2004, he was appointed Executive Vice President of Corporate Strategy & Sales Services of M-real and began in October 2004. Mr Puotinen holds a Master of Science degree in Engineering as well as a Licentiate of Engineering degree.
Shares owned in M-real Corporation: 1 000 A shares and 2 750 B shares
Hannu Kottonen ■ Executive Vice President (EVP), Consumer PackagingMaster of Science in Economics, born in 1957
Hannu Kottonen worked as Controller of TSP Suunnittelu Oy from 1979 to 1983. In 1983, he joined Huhtamäki Group, where he worked in various positions relating to fi nance and control until 1995 and as the Chief Financial Offi cer from 1995 to 1998. From 1998 to 2003, Mr Kottonen held several manager and director positions in Huhtamäki Group’s divisions for trade packaging, fresh foods and molded fi ber before being appointed Chief Financial Offi cer of the Huhtamäki Group in 2003. In January 2004, he left Huhtamäki Group to join M-real Corporation and was appointed Senior Vice President and General Man-ager of the Cartons business. In the new organisation of
August 2004, Mr Kottonen was appointed Executive Vice President of M-real’s Consumer Packaging business area and member of the Corporate Executive Board.
Shares owned in M-real Corporation: 7 353 B shares
Jarmo Salonen ■ Executive Vice President (EVP)Commercial PrintingMaster of Science in Engineering, born in 1951
Jarmo Salonen worked as Technical advisor at Finnish Papermills Association from 1978 to 1982. In 1982, he transferred to Ahström Corporation Varkaus mills to serve as the Manager of technical customer service. From 1985 to 1987, Mr Salonen worked as the Mill manager of Varkaus fi ne paper mills of Ahström / Enso Corporations. From 1987 to 1993, he worked at Rettig Group Finland as the Managing Director of Bore Line Oy Ab. In 1993, he transferred to Metsä-Serla Corporation (now M-real Corporation) to serve as Mill manager of Äänekoski and Kangas paper mills. From 1999 to 2000, Mr Salonen worked as the Director of fi ne paper division and Manag-ing Director of M-real’s UK Paper in Kent, UK. In 2000, he was appointed Senior Vice President of Commercial Printing, located in Amsterdam. In 2002, he returned to Finland as he was appointed Senior Vice President of M-real’s Corporate Purchasing. In 2003, he was appointed Senior Vice President of M-real’s Production. In the new organisation of August 2004, Mr Salonen was appointed Executive Vice President of M-real’s Commercial Printing business area and member of the Corporate Executive Board.
Shares owned in M-real Corporation: 3 677 B shares
Peter Sandberg ■ Executive Vice President (EVP)Offi ce PapersMaster of Science in Economics, born in 1967
From 1994–1996 Peter Sandberg worked in various management positions within the Modo Pulp Sales Organisation. In 1998 he was appointed Commercial Director for the Offi ce Paper Division of Modo Paper. In 2000 Mr Sandberg was assigned Vice President Sales for the Metsä-Serla Corporation (now M-real Corporation) Home & Offi ce business area, and in 2002 Senior Vice President, General Manager for the M-real Home & Offi ce business area based in Amsterdam. In the new organisa-tion of August 2004, Mr Sandberg was appointed Executive Vice President of M-real’s Offi ce Papers business area and member of the Corporate Executive Board.
Shares owned in M-real Corporation: no ownership
55
M-real Financial statements 2004
Share capital and shares at 31 December 2004 ■ The company’s paid-in
share capital on the balance sheet date was euros 557 881 540.40 and consisted of 328 165 612 shares. The company has two series of shares, Series A shares and Series B shares. The number of Series A shares was 36 340 550 and the number of Series B shares 291 825 062.
All shares have a nominal value of euros 1.70. Each Series A Share entitles its holder to twenty (20) votes at a General Meeting of Shareholders, and each Series B Share entitles the holder to one (1) vote. All shares carry the same right to receive a dividend.
The company’s issued share capital may not be less than euros 255 000 000.00 and not more than euros 1 020 000 000.00. The issued share capital may be increased or decreased within these limits without amendments to the Articles of Association.
Rights Offering ■ M-real raised new equity capital through an underwritten rights offering of euros 447 498 561. A total of 149 166 187 new series B shares were issued.
In the offering each shareholder was entitled to subscribe for fi ve (5) new series B shares for every six (6) series A and/or B shares held on the record date, September 10, 2004.
The subscription period started 15 September 2004 and continued until 1 October 2004. The subscription price was euros 3.00 per share. The primary subscription rights were traded on the Helsinki Stock Exchange from 15 September 2004 through 24 September 2004.
The lowest price of the B share during the trad-ing period was euros 4.42 and the highest price euros 4.79. The average price was euros 4.61. The trading volume was euros 201 496 882 or 43 699 468 shares. The shares traded represented 24 per cent of the outstanding shares before the new shares were issued.
The lowest price for the subscription right during the trading period was euros 1.11 and the highest euros 1.60. The average price was euros 1.30. A total of 48 514 485 rights were traded.
The most signifi cant changes in the owner-ship structure prior and post of the issue were the increase in the non-Finnish ownership and the decrease in the households’ ownership. The
Shares and shareholders
former increased from 36.7 per cent to 38.6 per cent and the latter decreased from 11.1 per cent to 9.6 per cent of the shares. The changes in the other ownership sectors were not signifi cant. Metsäliitto exercised their rights in the offering and subscribed its pro rata share (38.5 per cent of shares).
Although some changes within the biggest share-holders took place, most of the 20 biggest share-holders remained as shareholders. However, as a result of the active trading of the subscription rights number of investors became M-real’s shareholders.
Stock Exchange listings and share prices ■ M-real’s Series A and Series B shares are listed on the Helsinki Stock Exchange.
The highest price of M-real’s Series B on Helsinki Stock Exchange during the fi nancial year was euros 6.43 and the lowest price euros 4.18. The average share price was euros 5.59. In 2003 the average share price was euros 6.11. The price of the Series B share was euros 4.70 at the end of the fi nancial year on 31 December 2004.
Turnover of the series B share was euros 1 013 million, or 62 per cent of the shares outstanding. The market capitalization of the Series A and B shares at 31 December 2004 totalled euros 1 542 million.
At 31 December 2004 Metsäliitto Cooperative owned 38.6 per cent of M-real Corporation’s shares and 60.5 per cent of the voting rights conferred by these shares. International investors owned 38.3 per cent of the shares.
Directors’ interest ■ Shareholdings of the Board of directors and the management are presented on pages 52–55.
Board of Directors’ authority to issue shares ■ The Board of Directors does not have valid authoriza-tions to carry out a share issue or issues of convert-ible bonds or bonds with warrants.
Dividend policy ■ M-real’s dividend policy is stable and rewarding to shareholders, and aims at paying a dividend of at least 1/3 of the Company’s earnings per share on average over the business cycle, none-theless taking into account the Company’s gearing target.
56
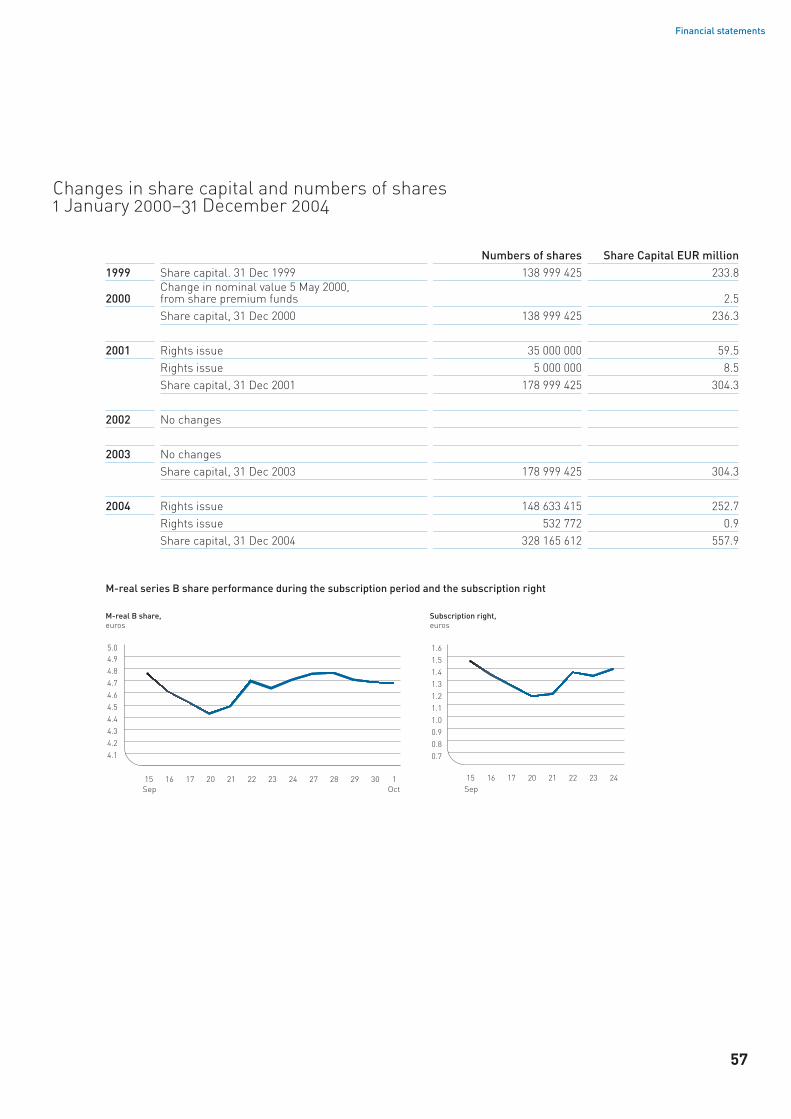
Financial statements
Changes in share capital and numbers of shares 1 January 2000–31 December 2004
M-real series B share performance during the subscription period and the subscription right
M-real B share,euros
Subscription right,euros
Numbers of shares Share Capital EUR million1999 Share capital. 31 Dec 1999 138 999 425 233.8
2000Change in nominal value 5 May 2000, from share premium funds 2.5Share capital, 31 Dec 2000 138 999 425 236.3
2001 Rights issue 35 000 000 59.5Rights issue 5 000 000 8.5Share capital, 31 Dec 2001 178 999 425 304.3
2002 No changes
2003 No changesShare capital, 31 Dec 2003 178 999 425 304.3
2004 Rights issue 148 633 415 252.7Rights issue 532 772 0.9Share capital, 31 Dec 2004 328 165 612 557.9
57
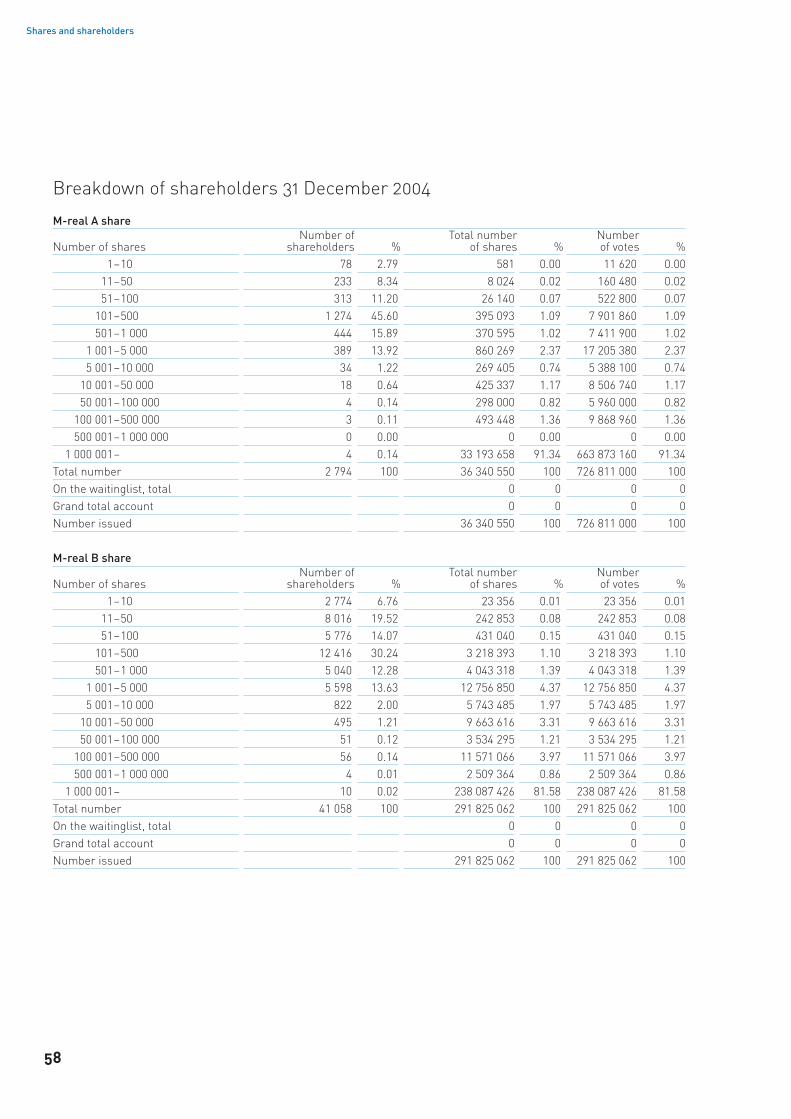
Breakdown of shareholders 31 December 2004
M-real A share
Number of sharesNumber of
shareholders %Total number
of shares %Numberof votes %
1–10 78 2.79 581 0.00 11 620 0.0011–50 233 8.34 8 024 0.02 160 480 0.0251–100 313 11.20 26 140 0.07 522 800 0.07
101–500 1 274 45.60 395 093 1.09 7 901 860 1.09501–1 000 444 15.89 370 595 1.02 7 411 900 1.02
1 001–5 000 389 13.92 860 269 2.37 17 205 380 2.375 001–10 000 34 1.22 269 405 0.74 5 388 100 0.74
10 001–50 000 18 0.64 425 337 1.17 8 506 740 1.1750 001–100 000 4 0.14 298 000 0.82 5 960 000 0.82
100 001–500 000 3 0.11 493 448 1.36 9 868 960 1.36500 001–1 000 000 0 0.00 0 0.00 0 0.00
1 000 001– 4 0.14 33 193 658 91.34 663 873 160 91.34Total number 2 794 100 36 340 550 100 726 811 000 100On the waitinglist, total 0 0 0 0Grand total account 0 0 0 0Number issued 36 340 550 100 726 811 000 100
M-real B share
Number of sharesNumber of
shareholders %Total number
of shares %Numberof votes %
1–10 2 774 6.76 23 356 0.01 23 356 0.0111–50 8 016 19.52 242 853 0.08 242 853 0.0851–100 5 776 14.07 431 040 0.15 431 040 0.15
101–500 12 416 30.24 3 218 393 1.10 3 218 393 1.10501–1 000 5 040 12.28 4 043 318 1.39 4 043 318 1.39
1 001–5 000 5 598 13.63 12 756 850 4.37 12 756 850 4.375 001–10 000 822 2.00 5 743 485 1.97 5 743 485 1.97
10 001–50 000 495 1.21 9 663 616 3.31 9 663 616 3.3150 001–100 000 51 0.12 3 534 295 1.21 3 534 295 1.21
100 001–500 000 56 0.14 11 571 066 3.97 11 571 066 3.97500 001–1 000 000 4 0.01 2 509 364 0.86 2 509 364 0.86
1 000 001– 10 0.02 238 087 426 81.58 238 087 426 81.58Total number 41 058 100 291 825 062 100 291 825 062 100On the waitinglist, total 0 0 0 0Grand total account 0 0 0 0Number issued 291 825 062 100 291 825 062 100
Shares and shareholders
58

Financial statements
Share register 31 December 2004 A share B share Total % of votes % of shares1 Metsäliitto Cooperative 25 751 535 100 978 057 126 729 592 60.5 38.62 Ilmarinen Mutual Pension Insurance Company 3 534 330 5 428 211 8 962 541 7.5 2.73 Varma Mutual Pension Insurance Company 2 203 544 1 341 113 3 544 657 4.5 1.14 Central Union of Agricultural Producers and
Forest Owners 1 704 249 1 597 750 3 301 999 3.5 1.05 Etra-Invest Oy Ab 2 000 035 2 000 035 0.2 0.66 Etera Mutual Pension Insurance Company 120 000 1 286 080 1 406 080 0.4 0.47 Mutual Insurance Company Pension-Fennia 1 100 705 1 100 705 0.1 0.38 Insurance Fund, Turku City 145 678 627 049 772 727 0.3 0.29 Pohjola Finland Value Fund 770 000 770 000 0.1 0.2
10 Metsäliitto Employees’ Pension Fund 16 070 577 900 593 970 0.1 0.211 Polaris Pension Fund 227 770 311 505 539 275 0.5 0.212 Pensionsförsäkringsaktiebolaget 534 415 534 415 0.1 0.213 HEX25 index share Special Mutual Fund 465 307 465 307 0.0 0.114 Veikko Laine Oy 453 000 453 000 0.0 0.115 Sampo Finnish Equity Fund 449 120 449 120 0.0 0.116 Alfred Berg Finland Mutual Fund 411 680 411 680 0.0 0.117 Insurance Group Pohjola 13 000 366 665 379 665 0.1 0.118 Avenir Special Mutual Fund 375 000 375 000 0.0 0.119 Elit Capital Oy 62 500 295 095 357 595 0.2 0.120 Rantanen Yrjö 350 871 350 871 0.0 0.1
Biggest Shareholders
Non-profi tmaking organizations2.7%
Insurance companies 0.3%
Public communities 5.7%
Households 9.8%
Financial institutions 1.4%
Metsäliitto 38.6%Other companies
3.2%
Non-Finnish nationals38.3%
Non-profi tmaking organizations4.4% Insurance companies
0.2%
Public communities 13.7%
Households 6.4%
Financial institutions 0.7%
Metsäliitto 60.5%
Other companies1.4%
Non-Finnish nationals12.7%
Breakdown of M-real’s shareholders 31 December 2004
Breakdown of M-real’s voting rights 31 December 2004
59
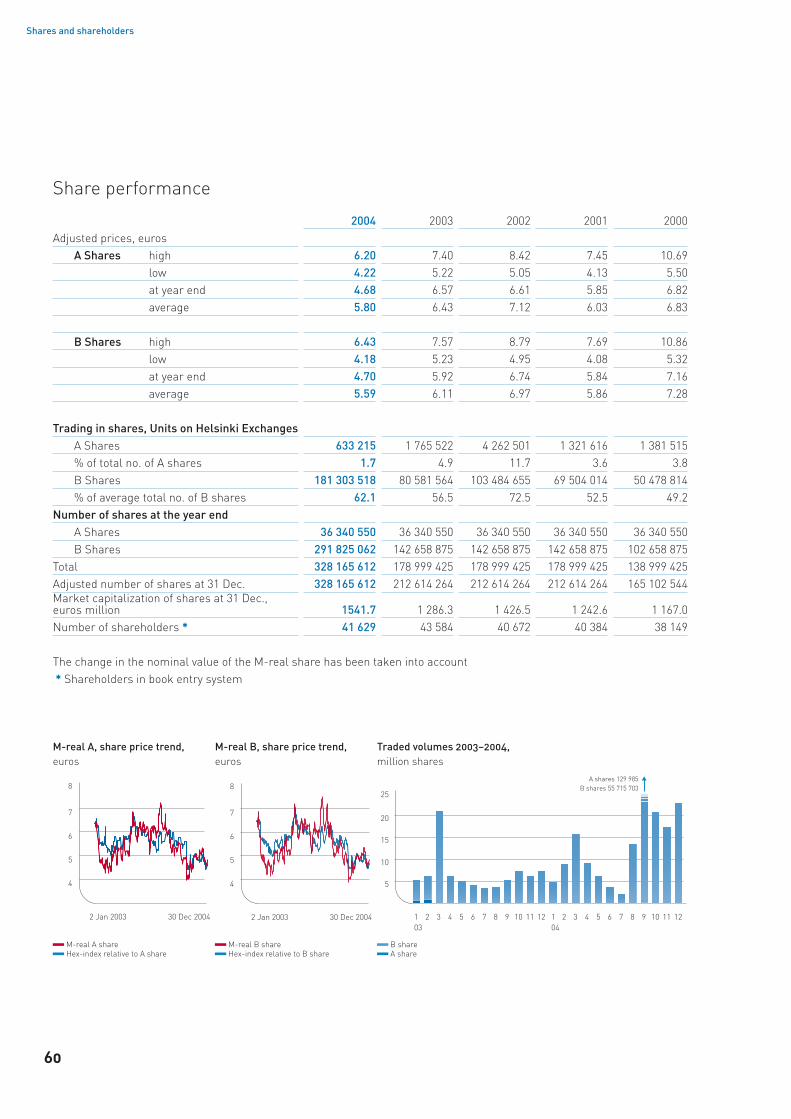
Share performance
Shares and shareholders
2004 2003 2002 2001 2000Adjusted prices, euros
A Shares high 6.20 7.40 8.42 7.45 10.69low 4.22 5.22 5.05 4.13 5.50at year end 4.68 6.57 6.61 5.85 6.82average 5.80 6.43 7.12 6.03 6.83
B Shares high 6.43 7.57 8.79 7.69 10.86low 4.18 5.23 4.95 4.08 5.32at year end 4.70 5.92 6.74 5.84 7.16average 5.59 6.11 6.97 5.86 7.28
Trading in shares, Units on Helsinki ExchangesA Shares 633 215 1 765 522 4 262 501 1 321 616 1 381 515% of total no. of A shares 1.7 4.9 11.7 3.6 3.8B Shares 181 303 518 80 581 564 103 484 655 69 504 014 50 478 814% of average total no. of B shares 62.1 56.5 72.5 52.5 49.2
Number of shares at the year endA Shares 36 340 550 36 340 550 36 340 550 36 340 550 36 340 550B Shares 291 825 062 142 658 875 142 658 875 142 658 875 102 658 875
Total 328 165 612 178 999 425 178 999 425 178 999 425 138 999 425Adjusted number of shares at 31 Dec. 328 165 612 212 614 264 212 614 264 212 614 264 165 102 544Market capitalization of shares at 31 Dec., euros million 1541.7 1 286.3 1 426.5 1 242.6 1 167.0Number of shareholders * 41 629 43 584 40 672 40 384 38 149
The change in the nominal value of the M-real share has been taken into account * Shareholders in book entry system
M-real A, share price trend, euros
Traded volumes 2003–2004, million shares
M-real B, share price trend, euros
M-real A share Hex-index relative to A share
M-real B share Hex-index relative to B share
B share A share
60
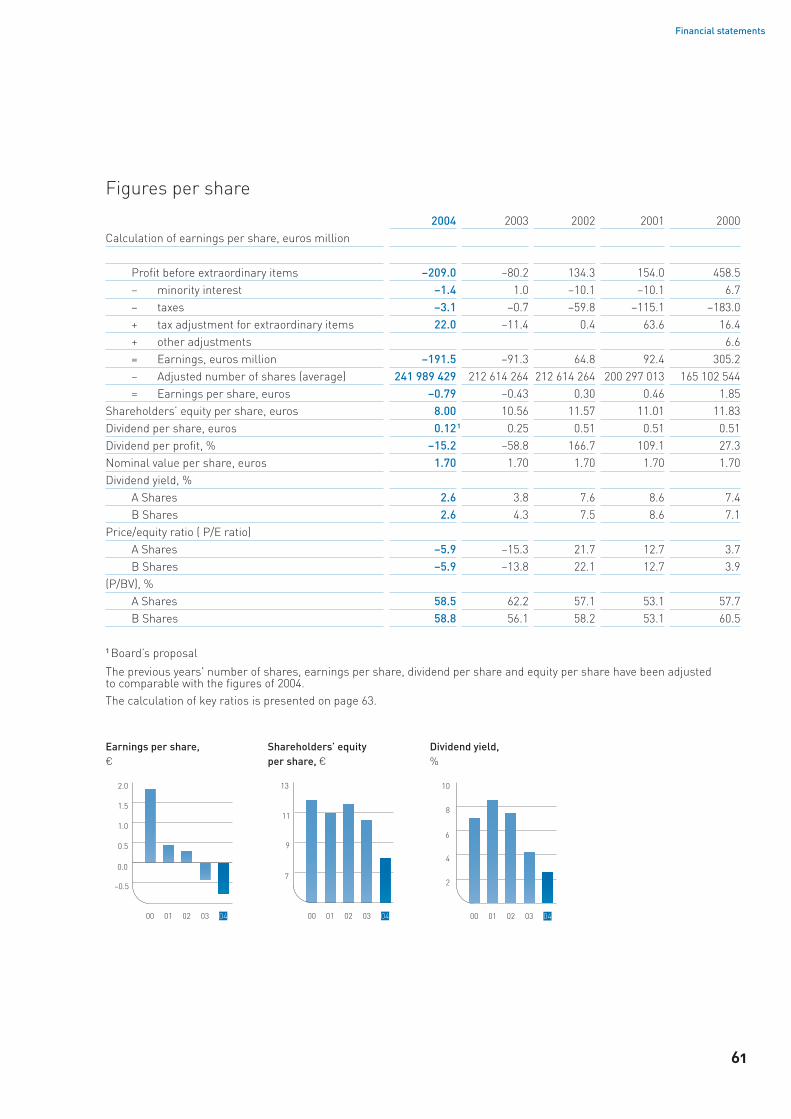
Financial statements
Figures per share
2004 2003 2002 2001 2000Calculation of earnings per share, euros million
Profi t before extraordinary items –209.0 –80.2 134.3 154.0 458.5– minority interest –1.4 1.0 –10.1 –10.1 6.7– taxes –3.1 –0.7 –59.8 –115.1 –183.0+ tax adjustment for extraordinary items 22.0 –11.4 0.4 63.6 16.4+ other adjustments 6.6= Earnings, euros million –191.5 –91.3 64.8 92.4 305.2 – Adjusted number of shares (average) 241 989 429 212 614 264 212 614 264 200 297 013 165 102 544= Earnings per share, euros –0.79 –0.43 0.30 0.46 1.85
Shareholders’ equity per share, euros 8.00 10.56 11.57 11.01 11.83Dividend per share, euros 0.121 0.25 0.51 0.51 0.51Dividend per profi t, % –15.2 –58.8 166.7 109.1 27.3Nominal value per share, euros 1.70 1.70 1.70 1.70 1.70Dividend yield, %
A Shares 2.6 3.8 7.6 8.6 7.4B Shares 2.6 4.3 7.5 8.6 7.1
Price/equity ratio ( P/E ratio)A Shares –5.9 –15.3 21.7 12.7 3.7B Shares –5.9 –13.8 22.1 12.7 3.9
(P/BV), %A Shares 58.5 62.2 57.1 53.1 57.7B Shares 58.8 56.1 58.2 53.1 60.5
1 Board’s proposal
The previous years' number of shares, earnings per share, dividend per share and equity per share have been adjusted to comparable with the fi gures of 2004.The calculation of key ratios is presented on page 63.
Dividend yield,%
Shareholders’ equity per share, €
Earnings per share, €
61

M-real Financial statements 2004
2004 2003 2002 2001 2000 1999 1998 1997 1996 1995Profi t and loss account, € mill.Turnover 5 460 6 044 6 564 6 923 5 898 4 044 3 320 3 014 2 313 2 240 – change% –9.7 –7.9 –5.2 14.8 45.9 21.8 10.1 30.3 3.2 40.6Exports from Finland 1 642 1 653 1 714 1 743 1 719 1 805 1 704 1 595 1 326 1 267Exports and foreign subsidiaries 5 145 5 652 6 173 6 438 5 376 3 603 2 893 2 598 2 012 1 760Operating profi t –75 74 324 389 604 352 340 283 143 401 – % of turnover –1.4 1.2 4.9 5.6 10.2 8.7 10.2 9.4 6.2 17.9Profi t before extraordinary items –209 –80 134 154 459 268 262 128 55 322 – % of turnover –3.8 –1.3 2.0 2.2 7.8 6.6 7.9 4.3 2.4 14.4Profi t before taxes and minority interests –11 –95 279 337 516 295 273 358 120 322 – % of turnover –0.2 –1.6 4.2 4.9 8.7 7.3 8.2 11.9 10.4 14.4
Balance sheet, € mill.Balance sheet total 6 394 7 106 7 410 8 005 7 798 4 608 4 419 4 423 3 474 3 123Shareholders’ equity 2 627 2 245 2 461 2 341 1 953 1 711 1 555 1 427 1 195 1 147Interest-bearing net liabilities 2 161 3 109 3 019 3 482 3 693 1 471 1 397 1 154 1 361 1 109
Dividens and fi gures per share *Dividens, € mill. 39.41 53.7 107.4 107.4 83.4 63.1 60.8 42.1 23.4 32.7Dividend per share, € 0.121 0.25 0.51 0.51 0.51 0.38 0.37 0.26 0.14 0.20Dividend/profi t, % –15.21 –58.8 166.7 109.1 27.3 34.0 33.7 51.3 61.3 16.0Earnings per share, € –0.79 –0.43 0.30 0.46 1.85 1.13 1.09 0.50 0.23 1.24Shareholders’ equity per share, € 8.00 10.56 11.57 11.012 11.832 10.342 9.202 8.642 7.24 6.94
Profi tabilityReturn on capital employed, % –1.0 1.6 5.8 6.9 13.5 10.5 10.8 10.5 6.8 18.8Return on equity, % –7.7 –3.8 3.0 4.72 15.52 10.62 11.32 5.32 2.9 22.0
Financial positionEquity ratio, % 41.5 31.9 34.2 30.02 25.72 38.42 36.92 34.12 35.0 42.4Gearing ratio, % 82 137 119 1452 1842 832 862 772 113 86Funds from operations, € mill. 238 417 521 608 692 440 449 401 303 409Internal fi nancing on capital expenditure;% 92 105 168 82 32 112 130 122 38 82Net interest expenses, € mill. 118.4 166.9 142.3 194.3 131.7 73.8 83.8 70.9 70.4 84.5Interest cover 3.0 3.5 4.7 4.1 6.3 7.0 6.4 6.7 5.3 5.8
Other informationGross capital expenditure, € mill. 259 397 310 740 2 150 394 344 329 787 492 – % of turnover 4.7 6.6 4.7 10.7 36.5 9.7 10.4 10.9 34.0 21.9R&D expenditure, € mill. 28 27 26 27 25 17 15 14 15 15 – % of turnover 0.5 0.4 0.4 0.4 0.4 0.4 0.5 0.4 0.7 0.7Personnel, average 16 490 20 372 21 070 22 237 17 351 15 572 13 885 12 637 11 463 10 106 – which in Finland 5 263 6 178 6 328 6 406 6 584 6 966 7 208 7 248 7 006 7 162
1 Board’s proposal2 The convertible subordinated capital notes are included in liabilities* The change in the nominal value of the M-real share, made on 11 April 1996, has been taken into accountThe previous years' earnings per share, dividend per share and equity per share have been adjusted to comparable with the fi gures of 2004.The 1993-1995 fi gures for the resource companies Metsä Botnia and Metsä Rauma have not been adjusted for comparability according to the new consolidation policy. Deferred tax has not been included under provision since 1993.
Ten years in fi gures
62

M-real Financial statements 2004
Return on equity (%)
Return on capital employed (%)
Equity ratio (%)
Gearing ratio (%)
Earnings per share
Shareholders’ equity per share
Dividend per share
Dividend per profi t (%)
Dividend yield (%)
Price/earnings ratio (P/E ratio) (%)
P/BV (%)
Adjusted average share price
Market capitalization
Internal fi nancing of capital expenditure (%)
Interest cover
Funds from operations
=
=
=
=
=
=
=
=
=
=
=
=
=
=
=
=
Profi t before extraordinary items – direct taxes Shareholders’s equity + minority interest (average)
Profi t before extraordinary items + interest expenses,net exchange gains/losses and other fi nancial expensesTotal assets – non-interest-bearing liabilities (average)
Shareholders’s equity + minority interest Total assets – advance payments received
Interest-bearing liabilities – liquid funds – interest-bearing receivablesShareholders’s equity + minority interest
Profi t before extraordinary items- minority interests- direct taxesShareholders’s equity + minority interest
Shareholders’s equity Adjusted number of shares at 31 December
DividendsAdjusted number of shares at 31 December
Dividend per shareEarnings per share
Dividend per shareShare price at 31 December
Adjusted share price at 31 DecemberEarnings per share
Adjusted share price at 31 DecemberShareholders’ equity per share
Total traded volume per share (EUR)Average adjusted number of shares traded during the fi nancial year
Number of shares x market price at 31 December
Funds from operationsGross capital expenditure
Funds from operations + net interest expensesNet interest expenses
Funds from operations in the cash fl ow
Calculation of key ratios
63

M-real Financial statements 2004
Board’s proposal for the distribution of profi ts
Espoo 4 February 2005
Antti Oksanen Arimo Uusitalo
Kim Gran Timo Haapanen Asmo Kalpala
Erkki Karmila Runar Lillandt Antti Tanskanen
Hannu AnttilaPresident & CEO
eurosThe Group’s distributable funds according to the balance sheet at 31 December 2004 721 946 000.00
Non-restricted shareholders’ equity in the parent company balance sheet at 31 December 2004Retained earnings 963 777 131.09Net profi t for 2004 270 959 835.88
Total 1 234 736 966.97
The Board of Directors proposes the following to the Annual General MeetingA dividend of euros 0.12 per share to be paid on the 328 165 612 A and B shares 39 379 873.44To be transferred to the Retained earnings account 1 195 357 093.53
1 234 736 966.97
64
M-real Financial statements 2004
To the shareholders of M-real Corporation
We have audited the accounting, the fi nancial statements and the corporate governance of M-real Corporation for the period 1 January to 31 Decem-ber 2004. The fi nancial statements, which include the report of the Board of Directors, consolidated and parent company income statements, balance sheets and notes to the fi nancial statements, have been prepared by the Board of Directors and the President and CEO. Based on our audit we express an opinion on these fi nancial statements and on corporate governance of the parent company.
We have conducted the audit in accordance with Finnish Standards on Auditing. Those standards require that we perform the audit to obtain rea-sonable assurance about whether the fi nancial statements are free of material misstatement. An audit includes examining on a test basis evidence supporting the amounts and disclosures in the fi nancial statements, assessing the accounting principles used and signifi cant estimates made by the management as well as evaluating the overall
fi nancial statement presentation. The purpose of our audit of corporate governance is to examine that the members of the Board of Directors and the President and CEO of the parent company have legally complied with the rules of the Companies’ Act.
In our opinion the fi nancial statements have been prepared in accordance with the Accounting Act and other rules and regulations governing the preparation of fi nancial statements. The fi nancial statements give a true and fair view, as defi ned in the Accounting Act, of both the consolidated and parent company’s result of operations as well as of the fi nancial position. The fi nancial statements with the consolidated fi nancial statements can be adopted and the members of the Board of Directors and the President and CEO of the parent company can be discharged from liability for the period audited by us. The proposal by the Board of Direc-tors regarding the distribution of retained earnings is in compliance with the Companies’ Act.
Auditor’s report
Espoo 17 February 2005
PricewaterhouseCoopers Oy Authorised Public Accountants
Göran Lindell Ilkka Haarlaa Authorised Public Accountant Authorised Public Accountant
65

M-real Annual fi nancial report 2004
Strategy■ M-real’s objective is to strenghten its position
as one of the leading producers and suppliers of paper, board and packaging solutions in Europe. In its core business areas M-real aims at being its customers’ primary choice as a provider of high-quality products and solutions.
Focus on core business areas. ■ M-real’s confi rmed core business
areas are Consumer Packaging, Publishing, Com-mercial Printing and Offi ce Papers. The group’s most important growth areas are high-quality packaging and graphic products, into which M-real intends to prioritise its most substantial develop-ment investments.
Enhancement of the Offi ce Papers business area will mainly take place on the basis of its present operational framework.
In the long run it is strategically important to maintain and develop good relationships with paper merchants because a substantial part of all fi ne paper sales in Europe is conducted through paper merchants.
The development of Map Merchant Group is continued primarily as a part of M-real.
Organising the production, sales and marketing by core business area. ■ The objective of
the organisation and management structure, which came in force on 1 September 2004, is to improve internal effi ciency and increase profi t responsibility by organising the production, sales and marketing by core business area.
M-real continues to emphasize its customer-focused marketing approach by developing and improving its products and services in order to support its customers’ business needs. In-depth understanding of customers’ businesses provides the basis for further innovation and new product introductions, which also aims at promoting the profi tability of our customers’ business.
Directing investments in potential growth areas. ■ The competitiveness of
M-real’s existing business operations is maintained and improved through investments with the aim to enhance product quality, production effi ciency and cost competitiveness of the core business areas.
In the near-term, M-real intends to direct its development investments in Consumer Packaging, Publishing and Commercial Printing. Specifi c focus will be on investments that retain and improve the
Additional information
66

Additional information
Financial targets■ With regard to fi nancial objectives,
– the group’s minimum ROCE target through the business cycle is minimum 10 per cent on average while
– keeping the corporate net gearing below 100 per cent.
competitiveness of M-real’s assets and for which the expected payback time is short.
M-real is not planning to carry out any major corporate acquisitions in the near future. The market shares of selected business areas and other basic prerequisites for operations provide a good basis for more effi cient utilisation of their profi tability potential.
Divestments of selected non-core assets. ■ During the past few years
M-real has divested substantial assets to reduce its high indebtedness. The group has also identi-fi ed other non-core assets which can be divested as and when appropriate. At the moment, strategic alternatives concerning three carton plants are being evaluated.
Cost savings and effi ciency improvement ■ In early 2004, M-real pub-
lished a new cost savings programme, which aims at approx. euros 230 million annual cost savings and improvements in production effi ciency. The intention is to complete the programme by the end of 2006. The impact of the programme on cash fl ow will be realised fully from early 2007.
Gearing ratio Target max 100%
Return on capital employed
Target 10%
67

Europe USA
Million tonnes in average during past years
Consumer packaging materials Coated magazine paper Uncoated fi ne paper Coated fi ne paper
Additional information
Operating environment
■ The paper and paperboard industry can be divided into two broad sectors: printing and writing papers, comprising fi ne papers, magazine papers and news-print, and the packaging sector, which encompasses various types of paperboard and raw materials for corrugated board. M-real has focused on coated and uncoated fi ne papers and coated magazine papers as well as virgin fi bre-based folding boxboard and raw materials for corrugated board.
The industry is cyclical, global, capital-intensive, fi ercely competitive and still quite fragmented.
Generally, paper and packaging products are sold directly to publishers, printers and manufac-turers of packaging or to merchants. Paper mer-chants buy fairly large volumes of paper from paper producers, usually stock the paper and sell it in smaller lots, offering high-calibre local service and short delivery times. Because a large proportion of fi ne paper customers are small-sized companies
– mainly printing houses, offi ces and households
– paper merchants are an important sales channel for fi ne papers. In Europe almost 80 per cent of fi ne paper is sold through paper merchants. About half of M-real’s paper and board production (a total of about 5.3 million tonnes in 2004) is sold via paper merchants.
The long-term growth in demand for paper and paperboard depend primarily on the growth of the world economy, demographic trends and tech-nological development. In the years ahead, paper demand in Europe is forecasted to grow by about 2–3 per cent, depending on the grade, with demand for paperboard rising by about 1 per cent (Source: Jaakko Pöyry Consulting). The earnings trend in the industry is cyclical because business cycles have an impact on consumption and pricing and thereby affect the balance of supply and demand for individual products.
In terms of its capacity, M-real is Europe’s second largest producer of coated and uncoated
M-real paper and board deliveriesEstimate of print advertising expenditure, %-change in US dollars (current prices)
Source: Zenith
68
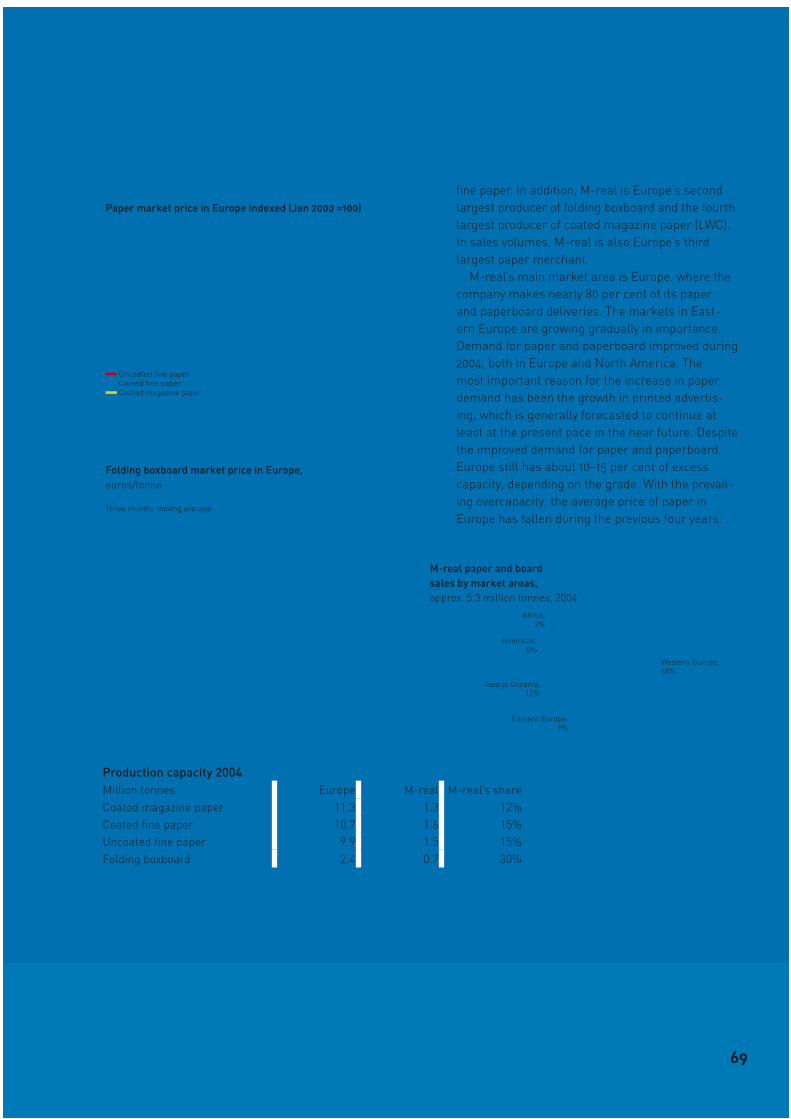
Additional information
Africa, 3%
Eastern Europe, 9%
Asia ja Oceania, 12%
Americas, 8%
Western Europe, 68%
fi ne paper. In addition, M-real is Europe’s second largest producer of folding boxboard and the fourth largest producer of coated magazine paper (LWC). In sales volumes, M-real is also Europe’s third largest paper merchant.
M-real’s main market area is Europe, where the company makes nearly 80 per cent of its paper and paperboard deliveries. The markets in East-ern Europe are growing gradually in importance. Demand for paper and paperboard improved during 2004, both in Europe and North America. The most important reason for the increase in paper demand has been the growth in printed advertis-ing, which is generally forecasted to continue at least at the present pace in the near future. Despite the improved demand for paper and paperboard, Europe still has about 10–15 per cent of excess capacity, depending on the grade. With the prevail-ing overcapacity, the average price of paper in Europe has fallen during the previous four years.
Uncoated fi ne paper Coated fi ne paper Coated magazine paper
Paper market price in Europe indexed (Jan 2000 =100)
Three months moving average
Folding boxboard market price in Europe, euros/tonne
M-real paper and board sales by market areas,approx. 5.3 million tonnes, 2004
Production capacity 2004Million tonnes Europe M-real M-real’s share Coated magazine paper 11.3 1.3 12%Coated fi ne paper 10.7 1.6 15%Uncoated fi ne paper 9.9 1.5 15%Folding boxboard 2.4 0.7 30%
69

Source: Jaakko Pöyry Consulting
Source: Jaakko Pöyry Consulting
Finland Germany Sweden Austria
Finland Sweden Latvia Austria Germany
–500
0
500
1 000
1 500
2 000
2 500
Pulp comsumption
External sales
Share of Metsä-
Botnia
Externalpurchases
Own production
Additional information
Wood in use 2004 million m3 %
Finland Direct 2.7 19Share of wood use of Metsä-Botnia’s pulp 5.9 41
Elsewhere in Europe 5.7 40Total 14.3
of which about 56 per cent came from M-real’s own electricity generation, 16 per cent from Pohjolan Voima’s generation plants and 28 per cent was purchased from external suppliers. Accordingly, M-real’s degree of self-suffi ciency in electricity was 52 per cent in Finland and 64 per cent outside Finland. Fuel use for heat production at the mills was 27 000 GWh in 2004, of which wood-based fuels accounted for 61 per cent.
The chemicals used by M-real are largely inorganic elements and compounds such as oxygen, ozone, hydrogen peroxide and chlorine dioxide, which are used in pulp bleaching, as well as calcium carbonate, latex, optical brighteners and starch, which are used in the paper production process.
Additional information on procurement is given in the M-real’s Corporate responsibility report 2004.
Resources
Procurement ■ The main raw materials M-real uses are wood, pulp, energy and chemicals. M-real’s total consumption of roundwood last year was about 14 million cubic metres (m3) (including the share of Metsä-Botnia’s wood use) and pulp con-sumption amounted to 2.5 million tonnes. M-real’s pulp procurement is based on its own production, pulp purchased from Metsä-Botnia and market pulp purchased from selected suppliers. M-real is nevertheless in practice self-suffi cient in pulp, because the pulp resources it is able to deploy largely meet its pulp requirement. The pulp con-sumption chart below gives an overview of M-real’s pulp procurement.
M-real uses both energy produced by its own mills and energy bought from outside suppliers. M-real’s total energy consumption in 2004 was 35 000 GWh. Electricity consumption was 7 000 GWh,
Stumpage price of spruce pulpwood, ¤/m3
Stumpage price of hardwood pulpwood, ¤/m3
Pulp consumption 2004,tonnes
70

Additional information
Personnel ■ At the end of 2004, M-real had a payroll of 15 960 employees, of whom about 31 per cent worked in Finland. M-real’s personnel strategy centres on developing core competencies and management resources, strengthening the man-agement system and building a unifi ed corporate culture. The staff’s development is monitored by means of regular PMD (Performance Makes the Difference) discussions between supervisors and their staff.
Additional information on the personnel is given in the Corporate responsibility report.
Electricity consumption and use of fuelsElectricity
consump tion GWh/a
Change 03–04%
Self-suffi ciency in electricity, %
Use of fuels, GWh/a
Change 03–04%
Proportion of biofuels, %
Finland 3 940 3 52 13 800 4 64Other countries 3 020 6 64 13 500 –1 58Total 6 960 5 57 27 300 2 61
Total energy, fuels used
2004GWh
2004%
2003%
2002%
2001%
Wood-based 17 716 50 48 46 45Natural gas 7 710 22 22 22 21Coal 2 870 8 9 9 10Nuclear power 2 775 8 8 9 9Hydropower 2 056 6 6 6 6Peat 939 3 4 4 3Oil 1 179 3 3 4 5Total 35 245
Personnel by country 31 DecemberGroup
2004 2003Finland 4 912 5 835Germany 2 873 4 148Great Britain 1 832 1 875Sweden 1 691 2 334Austria 872 871France 824 884Switzerland 570 577Hungary 543 575Belgium 392 407The Netherlands 342 361Poland 169 795Other countries 940 974Total 15 960 19 636
71

Additional information
Risk management
Principles and objectives of risk management ■ Risk management is
part of M-real’s strategic and operational planning, daily decision making and monitoring of operations. It is also part of the internal control system.
The aim of the risk management process is to identify and assess systematically and to manage through cost-effective measures risks that can have an impact on achievement of the company’s objectives. A concurrent aim is to take into account risk-related opportunities and, after due appraisal, to exploit them.
M-real adheres to a policy of prudent risk-tak-ing, and decisions must be based on an adequate assessment of factors such as the company’s risk-bearing ability and the upside-downside ratio.
The main objective of risk management work is – to ensure that all identifi ed risks affecting
personnel, customers, products, the public image, property, intellectual capital, social responsibility and the company’s ability to operate are always attended to as prescribed by law and otherwise justifi ably in the light of the best available knowledge and the prevailing economic conditions.
– to meet the expectations of different stakeholders
– to ensure the undisturbed continuity of business operations
– to optimize the upside-downside ratio – to ensure management of the company’s overall
risk position and minimize overall risk.The responsibilities connected with risk manage-
ment and other more detailed operating principles are defi ned in the company’s Risk Management Policy and Risk Management Principles.
Risk environment ■ Risks connected with M-real’s opera-
tions are assessed and reported on regularly. The development of risks is monitored and various measures are undertaken to prepare for and come to grips with them. The following key risk areas were arrived at in the risk assessment that was carried out during 2004: – strategic choices – major global changes in demand – competitiveness of production plants – optimizing supply chain effi ciency
– the customer management process – price fl uctuations in main products and
commodities – abrupt and unforeseeable changes in the
fi nancial markets – threats to corporate security – key employees and organizational effi ciency – proper functioning of key processes – risks involving dependencies and the suspension
of operations – public image and reputation
Preparing for and transferring risks ■ Risks are met by applying the
information and knowledge that are available to the company itself or to external experts and partners. In addition to risk assessments that are carried out at regular intervals in different subareas of opera-tions, the company has formulated continuity and recovery plans connected especially with produc-tion, but also other business operations, in order to support the planning of crisis management at the company and unit-level.
Risks have been transferred, notably, by means of insurance agreements, derivatives contracts and otherwise through clauses written into general agreements.
The transfer of risks through insurance agree-ments is done as a rule by means of global insur-ance agreements covering the most common non-life risks. These agreements comprise – a property and loss-of-profi ts insurance
programme – an operational and product liability insurance
programme – a liability insurance programme covering
management and corporate governance bodies – a transport insurance programme
During 2004 major instances of damage in excess of the relevant deductible did not occur within the above-mentioned insurance pro-grammes.
Management of fi nancial risks ■ The Group’s fi nancial position is
discussed in the report of the Board of Directors.Financing risks involved in business operations
are managed in accordance with the fi nancing
72
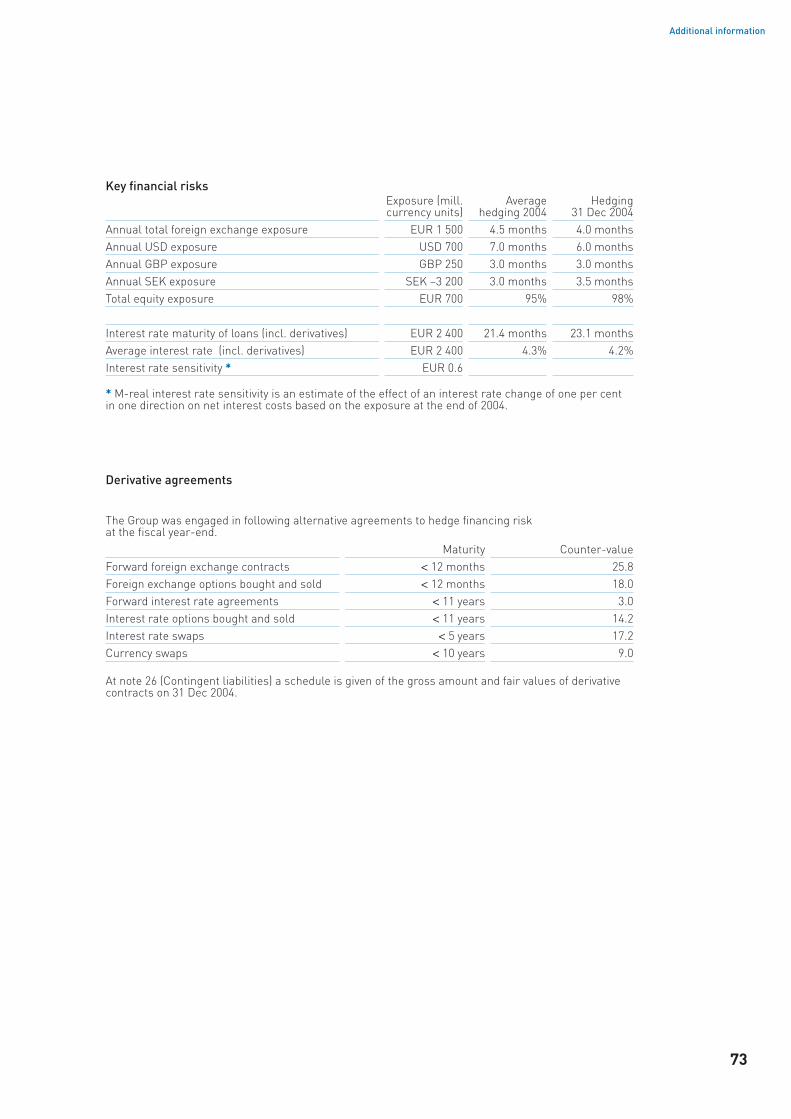
Additional information
Derivative agreements
The Group was engaged in following alternative agreements to hedge fi nancing risk at the fi scal year-end.
Maturity Counter-valueForward foreign exchange contracts < 12 months 25.8Foreign exchange options bought and sold < 12 months 18.0Forward interest rate agreements < 11 years 3.0Interest rate options bought and sold < 11 years 14.2Interest rate swaps < 5 years 17.2Currency swaps < 10 years 9.0
At note 26 (Contingent liabilities) a schedule is given of the gross amount and fair values of derivative contracts on 31 Dec 2004.
Key fi nancial risksExposure (mill. currency units)
Average hedging 2004
Hedging 31 Dec 2004
Annual total foreign exchange exposure EUR 1 500 4.5 months 4.0 monthsAnnual USD exposure USD 700 7.0 months 6.0 monthsAnnual GBP exposure GBP 250 3.0 months 3.0 monthsAnnual SEK exposure SEK –3 200 3.0 months 3.5 monthsTotal equity exposure EUR 700 95% 98%
Interest rate maturity of loans (incl. derivatives) EUR 2 400 21.4 months 23.1 monthsAverage interest rate (incl. derivatives) EUR 2 400 4.3% 4.2%Interest rate sensitivity * EUR 0.6
* M-real interest rate sensitivity is an estimate of the effect of an interest rate change of one per cent in one direction on net interest costs based on the exposure at the end of 2004.
73

EUR/USD EUR/GBP
OtherDKK
AUD
SEK
GBP
USD
Additional information
policy confi rmed by the Company’s Board of Direc-tors and management. This policy defi nes detailed operating instructions for the management of fac-tors such as foreign exchange, interest rate, liquid-ity and counterparty risk as well as for the use of derivative instruments. The aim is to hedge against signifi cant fi nancing risks, to balance the cash fl ow and to give the business units time to adjust their operations to changed conditions.
Foreign exchange risks ■ The M-real Group’s for-eign exchange risk consists of the risk connected with foreign currency fl ows and the risk of convert-ing foreign currency-denominated shareholders’ equity amounts.
Most of the Group’s costs are generated in the eurozone, but a large part of the sales income is obtained in non-domestic currencies. This means
that due to changes in foreign exchange rates, trade receivables can fl uctuate whilst production costs remain unchanged. Similarly, products are often priced in a non-domestic currency. This foreign currency exposure includes foreign cur-rency-denominated accounts receivable, accounts payable, orders booked as well as a certain part of the budgeted net foreign currency cash fl ow.
The main currencies for the Group’s currency fl ow exposure are the United States dollar, the British pound and the Swedish krona. The appre-ciation in the dollar and pound has a positive effect on the Group’s earnings and, correspondingly, their weakening has a negative impact. A depreciating Swedish krona has a positive effect on the Group’s earnings.
The hedging policy is to hedge on average a three-month foreign exchange fl ow, but the
Exchange rates against euro at 31 December2004 2003 2002 2001 2000
GBP 0.7051 0.7048 0.6505 0.6085 0.6241USD 1.3621 1.2630 1.0487 0.8813 0.9305SEK 9.0206 9.0800 9.1528 9.3012 8.8313NOK 8.2365 8.4141 7.2756 7.9515 8.2335DKK 7.4388 7.4450 7.4288 7.4365 7.4631
Foreign currency breakdown of
currency exposureCurrency breakdown of loans
Other
USD
SEK
EUR
Exchange rate trends
74
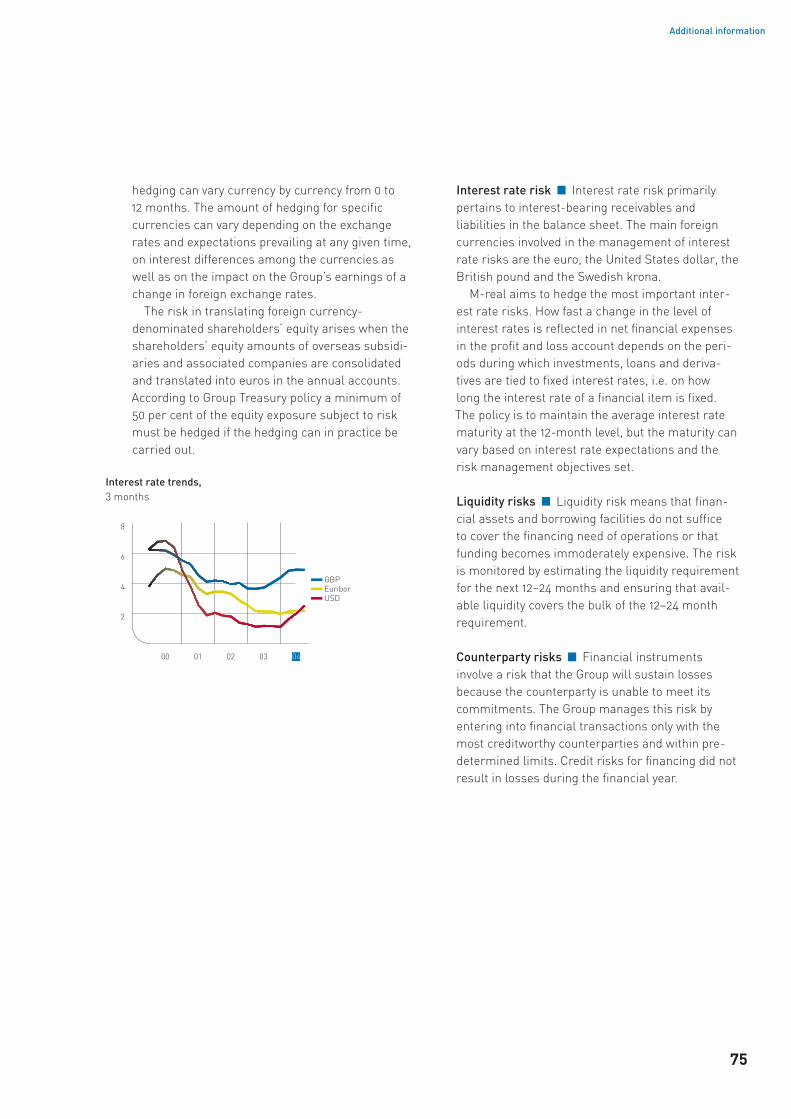
GBP Euribor USD
Additional information
hedging can vary currency by currency from 0 to 12 months. The amount of hedging for specifi c currencies can vary depending on the exchange rates and expectations prevailing at any given time, on interest differences among the currencies as well as on the impact on the Group’s earnings of a change in foreign exchange rates.
The risk in translating foreign currency-denominated shareholders’ equity arises when the shareholders’ equity amounts of overseas subsidi-aries and associated companies are consolidated and translated into euros in the annual accounts. According to Group Treasury policy a minimum of 50 per cent of the equity exposure subject to risk must be hedged if the hedging can in practice be carried out.
Interest rate risk ■ Interest rate risk primarily pertains to interest-bearing receivables and liabilities in the balance sheet. The main foreign currencies involved in the management of interest rate risks are the euro, the United States dollar, the British pound and the Swedish krona.
M-real aims to hedge the most important inter-est rate risks. How fast a change in the level of interest rates is refl ected in net fi nancial expenses in the profi t and loss account depends on the peri-ods during which investments, loans and deriva-tives are tied to fi xed interest rates, i.e. on how long the interest rate of a fi nancial item is fi xed. The policy is to maintain the average interest rate maturity at the 12-month level, but the maturity can vary based on interest rate expectations and the risk management objectives set.
Liquidity risks ■ Liquidity risk means that fi nan-cial assets and borrowing facilities do not suffi ce to cover the fi nancing need of operations or that funding becomes immoderately expensive. The risk is monitored by estimating the liquidity requirement for the next 12–24 months and ensuring that avail-able liquidity covers the bulk of the 12–24 month requirement.
Counterparty risks ■ Financial instruments involve a risk that the Group will sustain losses because the counterparty is unable to meet its commitments. The Group manages this risk by entering into fi nancial transactions only with the most creditworthy counterparties and within pre-determined limits. Credit risks for fi nancing did not result in losses during the fi nancial year.
Interest rate trends,3 months
75

Stora Enso
M-real
Holmen
Cascades
Mayr-Melnhof
Capacity, 1000 tSource: M-real
Additional information
■ The operating environment of the Cartons business in 2004 was characterised by moderate growth in the European economy and a strengthening euro. All the main product groups enjoyed increasing demand. Demand grew in Eastern Europe, North America and Asia.
The business posted an operating profi t in 2004 of euros 60.3 million (2003: 33.3). The operating profi t includes non-recurring net expenses of euros 5.4 million (4.0), the largest of which were the euros 22.4 million write-down of Savon Sellu’s fi xed assets as well as the recognition of negative good-will of euros 14.3 million connected with the pur-chase of shares in Kemiart Liners Oy. In the fourth
quarter a euros 8.4 million reversal was made on the write-down of Savon Sellu’s fi xed assets owing to the disposal of the Savon Sellu business and the proceeds from the sale. The operating result, excluding non-recurring items, was euros 65.7 mil-lion (37.3). Profi tability was improved mainly by the growth in delivery volumes in all product groups as well as by the cost savings that were realized. The strengthening of the euro depressed the selling price in euros within all product groups. The aver-age operating rate of the paperboard machines was 89 per cent (84). The average order book at the end of December was about three weeks. Kemiart Liners is included in its entirety in the second-half
fi gures.Deliveries by west European folding
boxboard producers were up 6 per cent com-pared with 2003. Deliveries by the producers to Western Europe were unchanged. M-real’s deliveries of folding boxboard grew by 13 per cent. The biggest growth was seen in deliver-ies to Western and Eastern Europe as well as North America. The average selling price of folding boxboard fell, largely in the wake of a strengthening euro.
Delivery volumes of linerboard were up slightly, stripping out the growth in delivery volumes due to the acquisition of Kemi-art Liners. The appreciation of the euro depressed selling prices.
The volume of fl uting deliveries increased. The company succeeded in raising the deliv-ery volume and selling price, especially in the lower profi tability markets outside Europe. The average selling price nevertheless fell in step with the strengthening euro.
Business operationsCartons
Turnover,€ million
Largest producers of folding boxboard in Europe 2004
Operating profi t,€ million
Operating profi t,%
Cartons2004 2003 Change
Turnover ¤ million 879.7 809.0 9%Internal sales, Group ¤ million –15.5 –17.0
Turnover, external ¤ million 864.2 792.0 9%
Operating profi t ¤ million 60.3 33.3 81%Operating profi t % 6.9 4.1
Capital employed (average) ¤ million 897.8 901.9 –1%Capital turnover rate 1.0 0.9Return on capital employed % 7.6 3.9
Personnel (average) 2 842 2 970 –4%Investment in fi xed assets ¤ million 18.3 24.3 –25%
Mill deliveries 1 000 t 1 155 1 007 15%Production 1 000 t 1 111 913 22%Capacity operating rate of board mills % 89 84
Equals to M-real’s ownership (47% in Kemiart Liners until QII 2004 and 100% as from QIII 2004)
76

UPM-Kymmene
Stora Enso
Burgo
M-real
Myllykoski
Stora Enso
Lecta
UPM-Kymmene
M-real
Additional information
■ There was a dual trend market situation for the main product groups of the Graphics Products and Speciality Papers business in 2004. The positive trend in printed advertising lifted demand in the main market areas in Western and Eastern Europe, North America and Asia. By contrast, selling prices in Europe fell, and the appreciation of the euro lowered the selling price in euros received by west European producers for dollar-based exports.
The business’ operating loss was euros 90.0 million (a profi t of 24.3 million). The operating result includes euros 56.2 million of non-recurring net expenses (6.4), the biggest of which were the euros 31.0 million write-down of the fi xed assets
of the Zanders Refl ex mill in Germany booked in the third quarter, as well as the euros 24 million expense provision connected with the profi tability improvement programme launched at Zanders’ Gohrsmühle and Refl ex mills and booked in the fourth quarter. The operating result, excluding non-recurring net expenses, was a loss of euros 33.8 million (a loss of 30.7). Profi tability was weakened mainly by the fall in the average selling price.
Deliveries by west European producers of coated fi ne paper rose by 11 per cent and deliveries by producers of coated magazine paper by 8 per cent. M-real’s volume of coated fi ne paper delivered rose by 10 per cent and the volume of coated magazine
paper fell by 5 per cent. M-real’s delivery volume for speciality paper increased.
The operating rate of the paper machines was 88 per cent (84). The order book at the end of December was just over two weeks.
The average price of coated fi ne paper fell by 5 per cent and coated magazine paper was down 3 per cent. Prices of speciality paper declined slightly on average. The strengthen-ing in the euro depressed the average selling price within all product groups.
Business operationsGraphics Products and Speciality Papers
Largest producers of coated magazine in Europe 2004
Turnover,€ million
Operating profi t,€ million
Operating profi t,%
Capacity, 1000 tSource: M-real
Capacity, 1000 tSource: M-real
Graphics Products and Speciality Papers2004 2003 Change
Turnover ¤ million 2 377.9 2 348.0 1%Internal sales, Group ¤ million –236.3 –228.8
Turnover, external ¤ million 2 141.6 2 119.2 1%
Operating profi t ¤ million –90.0 24.3Operating profi t % –3.8 1.0
Capital employed (average) ¤ million 2 720.6 2 871.4 –5%Capital turnover rate 0.9 0.8Return on capital employed % –3.4 1.0
Personnel (average) 6 670 6 957 –4%Investment in fi xed assets ¤ million 80.4 86.2 –7%
Mill deliveries 1 000 t 3 168 2 965 7%Production 1 000 t 3 169 2 912 9%Capacity operating rate % 88 84
Largest producers of coatedfi ne paper in Europe 2004
Sappi Europe
77
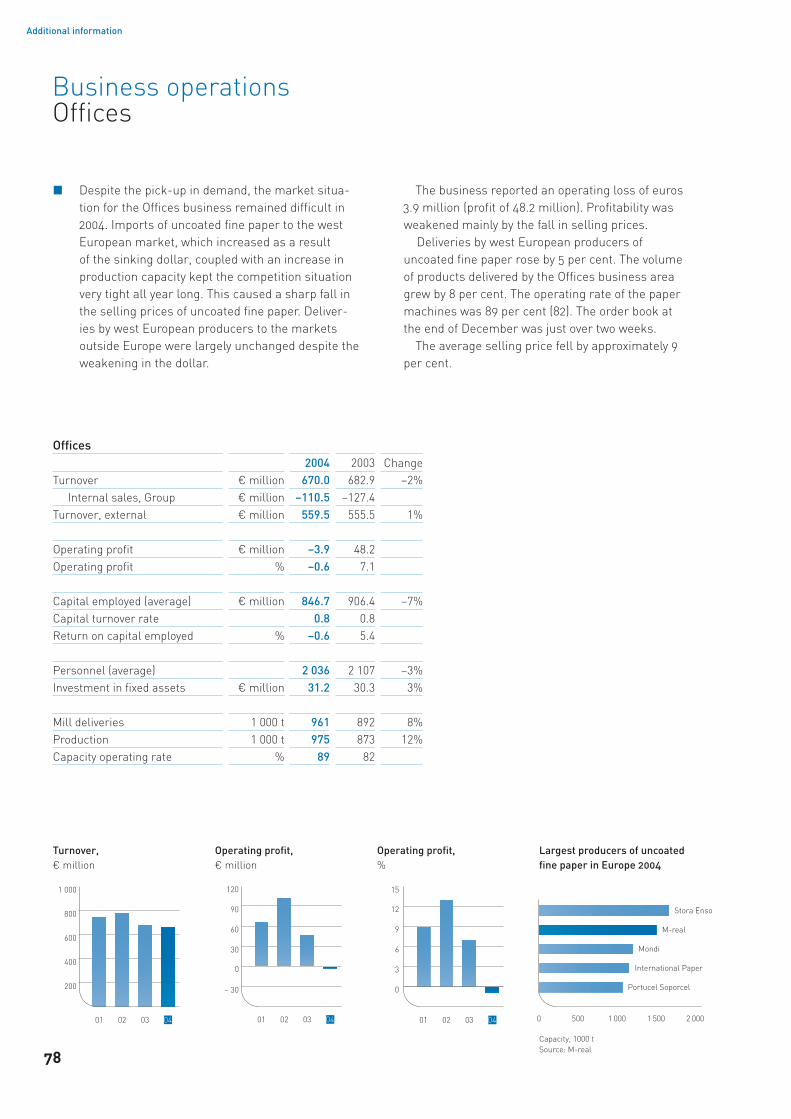
Stora Enso
M-real
Mondi
International Paper
Portucel Soporcel
Additional information
■ Despite the pick-up in demand, the market situa-tion for the Offi ces business remained diffi cult in 2004. Imports of uncoated fi ne paper to the west European market, which increased as a result of the sinking dollar, coupled with an increase in production capacity kept the competition situation very tight all year long. This caused a sharp fall in the selling prices of uncoated fi ne paper. Deliver-ies by west European producers to the markets outside Europe were largely unchanged despite the weakening in the dollar.
The business reported an operating loss of euros 3.9 million (profi t of 48.2 million). Profi tability was weakened mainly by the fall in selling prices.
Deliveries by west European producers of uncoated fi ne paper rose by 5 per cent. The volume of products delivered by the Offi ces business area grew by 8 per cent. The operating rate of the paper machines was 89 per cent (82). The order book at the end of December was just over two weeks.
The average selling price fell by approximately 9 per cent.
Business operationsOffi ces
Turnover,€ million
Operating profi t,€ million
Operating profi t,%
Largest producers of uncoated fi ne paper in Europe 2004
Capacity, 1000 tSource: M-real
Offi ces2004 2003 Change
Turnover ¤ million 670.0 682.9 –2%Internal sales, Group ¤ million –110.5 –127.4
Turnover, external ¤ million 559.5 555.5 1%
Operating profi t ¤ million –3.9 48.2Operating profi t % –0.6 7.1
Capital employed (average) ¤ million 846.7 906.4 –7%Capital turnover rate 0.8 0.8Return on capital employed % –0.6 5.4
Personnel (average) 2 036 2 107 –3%Investment in fi xed assets ¤ million 31.2 30.3 3%
Mill deliveries 1 000 t 961 892 8%Production 1 000 t 975 873 12%Capacity operating rate % 89 82
78
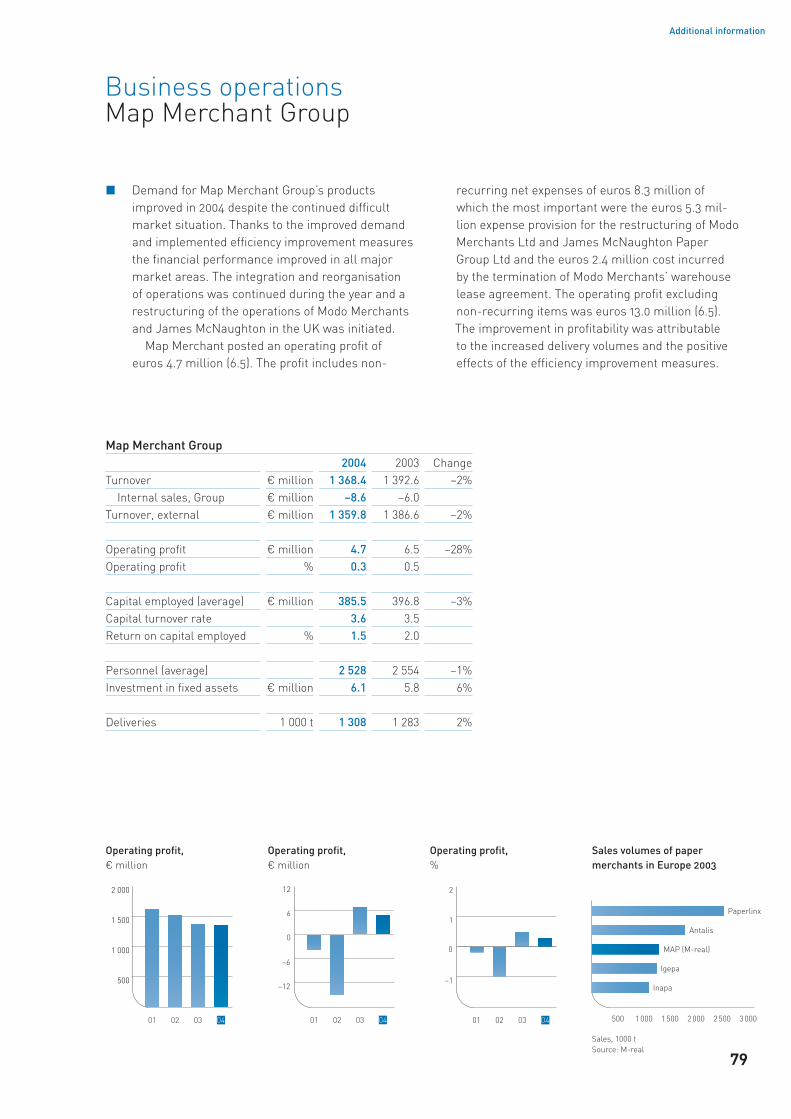
Paperlinx
Antalis
MAP (M-real)
Igepa
Inapa
Additional information
■ Demand for Map Merchant Group’s products improved in 2004 despite the continued diffi cult market situation. Thanks to the improved demand and implemented effi ciency improvement measures the fi nancial performance improved in all major market areas. The integration and reorganisation of operations was continued during the year and a restructuring of the operations of Modo Merchants and James McNaughton in the UK was initiated.
Map Merchant posted an operating profi t of euros 4.7 million (6.5). The profi t includes non-
recurring net expenses of euros 8.3 million of which the most important were the euros 5.3 mil-lion expense provision for the restructuring of Modo Merchants Ltd and James McNaughton Paper Group Ltd and the euros 2.4 million cost incurred by the termination of Modo Merchants’ warehouse lease agreement. The operating profi t excluding non-recurring items was euros 13.0 million (6.5). The improvement in profi tability was attributable to the increased delivery volumes and the positive effects of the effi ciency improvement measures.
Business operationsMap Merchant Group
Operating profi t,€ million
Operating profi t,€ million
Operating profi t,%
Sales, 1000 tSource: M-real
Sales volumes of papermerchants in Europe 2003
Map Merchant Group2004 2003 Change
Turnover ¤ million 1 368.4 1 392.6 –2% Internal sales, Group ¤ million –8.6 –6.0Turnover, external ¤ million 1 359.8 1 386.6 –2%
Operating profi t ¤ million 4.7 6.5 –28%Operating profi t % 0.3 0.5
Capital employed (average) ¤ million 385.5 396.8 –3%Capital turnover rate 3.6 3.5Return on capital employed % 1.5 2.0
Personnel (average) 2 528 2 554 –1%Investment in fi xed assets ¤ million 6.1 5.8 6%
Deliveries 1 000 t 1 308 1 283 2%
79

Additional information
Business operationsQuarterly data
Full year QuarterlyTurnover 2004 2003 2004 2003€ million IV III II I IV III II ICartons 1 879.7 809.0 227.9 237.6 210.1 204.1 196.2 200.3 196.9 215.6Graphics Products and Speciality Papers 2 377.9 2 348.0 616.2 589.5 581.1 591.1 572.6 578.7 574.6 622.1Offi ces 670.0 682.9 164.1 167.1 158.5 180.3 169.5 151.3 170.5 191.6Map Merchant Group 1 368.4 1 392.6 342.8 332.4 339.2 354.0 347.6 332.5 345.0 367.5Internal sales and other operations 164.3 811.6 31.8 36.1 44.4 52.0 188.3 204.4 220.8 198.1Group total 5 460.3 6 044.1 1 382.8 1 362.7 1 333.3 1 381.5 1 474.2 1 467.2 1 507.8 1 594.9
Full year QuarterlyOperating profi t and result 2004 2003 2004 2003€ million IV III II I IV III II ICartons 1 60.3 33.3 25.8 10.7 9.8 14.0 –2.3 15.1 2.5 18.1Graphics Products and Speciality Papers –90.0 24.3 –47.4 –33.2 –11.9 2.5 –12.8 10.0 –2.1 29.1Offi ces –3.9 48.2 –1.2 0.0 –6.2 3.5 8.6 3.9 13.9 21.8Map Merchant Group 4.7 6.5 –2.9 0.9 3.0 3.8 0.4 –2.7 3.4 5.4Other operations –45.8 –38.5 –1.8 –6.5 –14.5 –23.0 –31.2 2.6 –2.9 –7.0Operating profi t –74.7 73.8 –27.5 –28.1 –19.9 0.8 –37.3 28.9 14.8 67.4% of turnover –1.4 1.2 –2.0 –2.1 –1.5 0.1 –2.5 2.0 1.0 4.2Net exchange gains/losses 12.5 20.7 8.1 0.0 –0.8 5.2 9.7 –0.5 5.3 6.2Other fi nancial income and expenses –146.8 –174.7 –52.2 –31.4 –28.9 –34.3 –77.6 –32.3 –29.8 –35.0Profi t before extraordinary items –209.0 –80.2 –71.6 –59.5 –49.6 –28.3 –105.2 –3.9 –9.7 38.6% of turnover –3.8 –1.3 –5.2 –4.4 –3.7 –2.1 –7.1 –0.3 –0.6 2.4
Full year QuarterlyOperating profi t and result 2004 2003 2004 2003% IV III II I IV III II ICartons 1 6.9 4.1 11.3 4.5 4.7 6.9 –1.2 7.5 1.2 8.4Graphics Products and Speciality Papers –3.8 1.0 –7.7 –5.6 –2.1 0.4 –2.2 1.7 –0.4 4.7Offi ces –0.6 7.1 –0.7 0.0 –3.9 2.0 5.1 2.6 8.2 11.4Map Merchant Group 0.3 0.5 –0.8 0.3 0.9 1.1 0.1 –0.8 1.0 1.5Group total –1.4 1.2 –2.0 –2.1 –1.5 0.1 –2.5 2.0 1.0 4.2
80
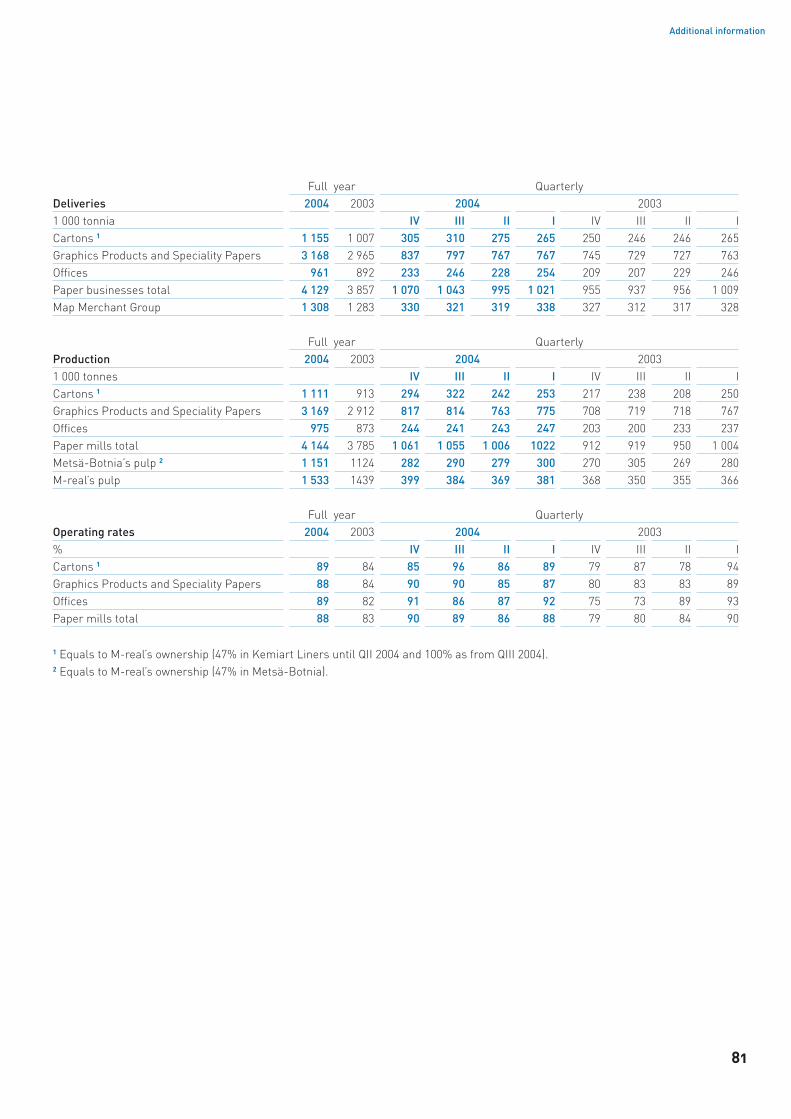
Additional information
Full year QuarterlyDeliveries 2004 2003 2004 20031 000 tonnia IV III II I IV III II ICartons 1 1 155 1 007 305 310 275 265 250 246 246 265Graphics Products and Speciality Papers 3 168 2 965 837 797 767 767 745 729 727 763Offi ces 961 892 233 246 228 254 209 207 229 246Paper businesses total 4 129 3 857 1 070 1 043 995 1 021 955 937 956 1 009Map Merchant Group 1 308 1 283 330 321 319 338 327 312 317 328
Full year QuarterlyProduction 2004 2003 2004 20031 000 tonnes IV III II I IV III II ICartons 1 1 111 913 294 322 242 253 217 238 208 250Graphics Products and Speciality Papers 3 169 2 912 817 814 763 775 708 719 718 767Offi ces 975 873 244 241 243 247 203 200 233 237Paper mills total 4 144 3 785 1 061 1 055 1 006 1022 912 919 950 1 004Metsä-Botnia’s pulp 2 1 151 1124 282 290 279 300 270 305 269 280M-real’s pulp 1 533 1439 399 384 369 381 368 350 355 366
Full year QuarterlyOperating rates 2004 2003 2004 2003% IV III II I IV III II ICartons 1 89 84 85 96 86 89 79 87 78 94Graphics Products and Speciality Papers 88 84 90 90 85 87 80 83 83 89Offi ces 89 82 91 86 87 92 75 73 89 93Paper mills total 88 83 90 89 86 88 79 80 84 90
1 Equals to M-real’s ownership (47% in Kemiart Liners until QII 2004 and 100% as from QIII 2004).2 Equals to M-real’s ownership (47% in Metsä-Botnia).
81

Additional information
Business operationsProduction capacities
Paper mills
Location Country Machines
Coated magazine
paperCoated
fi ne paperUncoated
fi ne paperSpeciality
paper TotalKirkniemi Finland 3 730 730Äänekoski Finland 1 180 180Kangas Finland 2 320 320Simpele Finland 1 55 55Kyröskoski Finland 1 100 100Stockstadt Germany 2 215 210 425Bergisch Gladbach Germany 4 330 330Düren Germany 4 100 100Husum Sweden 3 250 415 665Wifsta Sweden 1 165 165Alizay France 1 300 300Pont Sainte Maxence France 2 120 120Biberist Switzerland 3 380 70 450Sittingbourne Great Britain 2 200 200New Thames Great Britain 1 230 230Hallein Austria 2 315 315Total 33 1 300 1 620 1 510 255 4 685
Board mills
Mill Country MachinesFolding
boxboard Kraftliner TotalTampere Finland 3 240 240Kyröskoski Finland 1 130 130Äänekoski Finland 1 165 165Simpele Finland 1 170 170Kemi Finland 1 340 340Total 7 705 340 1 045
Carton plants
Plant Country Cartons TotalTampere Finland 20 20Petöfi Hungary 30 30Meulemans Belgium 20 20Total 70 70
(1000 tonnes)
(1000 tonnes)
(1000 tonnes)
82

Additional information
Pulp mills
Mill Country Chemical pulp BCTMP CTMP TotalStockstadt Germany 160 160Husum Sweden 700 700Alizay France 310 310Hallein Austria 160 160Joutseno Finland 260 260Lielahti Finland 110 110Total 1 330 260 110 1 700
Metsä-Botnia*
Mill Country Chemical pulp TotalÄänekoski Finland 485 485Kemi Finland 560 560Kaskinen Finland 425 425Rauma Finland 570 570Joutseno Finland 600 600Total 2 640 2 640
* M-real’s share is 47% of the capacity
Other shareholdings
Softwood and hardwood pulp 340 Sunila Oy, (interest 17,5%), FinlandCoated magazine paper 180 Myllykoski Paper Oyj, (interest 35%), FinlandUncoated magazine paper 380 Myllykoski Paper Oyj, (interest 35%), Finland
(1000 tonnes)
(1000 tonnes)
(1000 tonnes)
83

Additional information
M-real’s fi nancial communications and investor relations
Shares ■ The company has a total of 328 165 612 shares. All shares have a nominal value of EUR 1.70. Infor-mation on M-real Corporation’s shares is given in the fi nancial statements part of the Annual Report.
M-real’s Series A and Series B shares are quoted on the Helsinki Stock Exchange. The trading codes of the shares are MRLAV and MRLBV, respectively.
Investor relations objectives ■ M-real is committed to generating
shareholder value. In line with its strategy, M-real is seeking to improve its market position, cost structure and profi tability, whilst streamlining its functions and organization.
M-real endeavours to offer up-to-date and easily utilizable information on the company regularly and openly. The company aims to produce reliable and factual information concerning its operations and fi nancial position as well as the near-term outlook.
Financial information ■ Financial reports and surveys appear
in Finnish and English. Annual Reports and other publications can be obtained from M-real Corporation, Corporate Communications, Revontulentie 6, 02100 Espoo, Finland, tel. +358 10 469 4552 and fax +358 10 469 4531 or by
e-mail at: [email protected] M-real’s mainly English-language Internet
pages, material of most interest to investors is brought together under the heading Investor Rela-tions. Stock exchange announcements, interim reports and fi nancial information on these pages are updated in real time. The pages give a com-pany presentation that is regularly updated when fi nancial reports are published. Information on subjects such as the Group’s products, customer cases, organization, sales network and environ-mental issues can also be found on the Internet pages. Also, Group publications can be ordered and feedback sent via the Internet.
The address of M-real’s website is www.m-real.com and its general e-mail address is [email protected].
Financial reporting and Closed window periods in 2005 ■ M-real does not
comment on its fi nancial performance or similar issues from the close of each reporting period up to the publication of the report for said period, except for information on a change in the market situation and the rectifi cation of incorrect information.
M-real will publish its fi nancial reports in 2005 as shown in the table below.
Equity investorsDebt investors and banker relationships
Juhani Pöhö Juha Laine Thomas Ekström Aapo NikunenTel. +358 10 469 5283 Tel. +358 10 469 4335 Tel. +358 10 469 4962 Tel. +358 10 469 4255GSM +358 50 598 7607 GSM +358 50 346 0350 GSM +358 50 381 [email protected] [email protected] [email protected] aapo.nikunen@metsafi nance.com
General questions and comments on investor relations can be sent to the address: [email protected]
Closed window Financial report Publication date1 January to 4 February Financial Results for year 2004 Friday, 4 February1 to 28 April Interim Report January–March Thursday, 28 April1 to 29 July Interim Report January–June Friday, 29 July1 to 28 October Interim Report January–September Friday, 28 October
Contact information
84
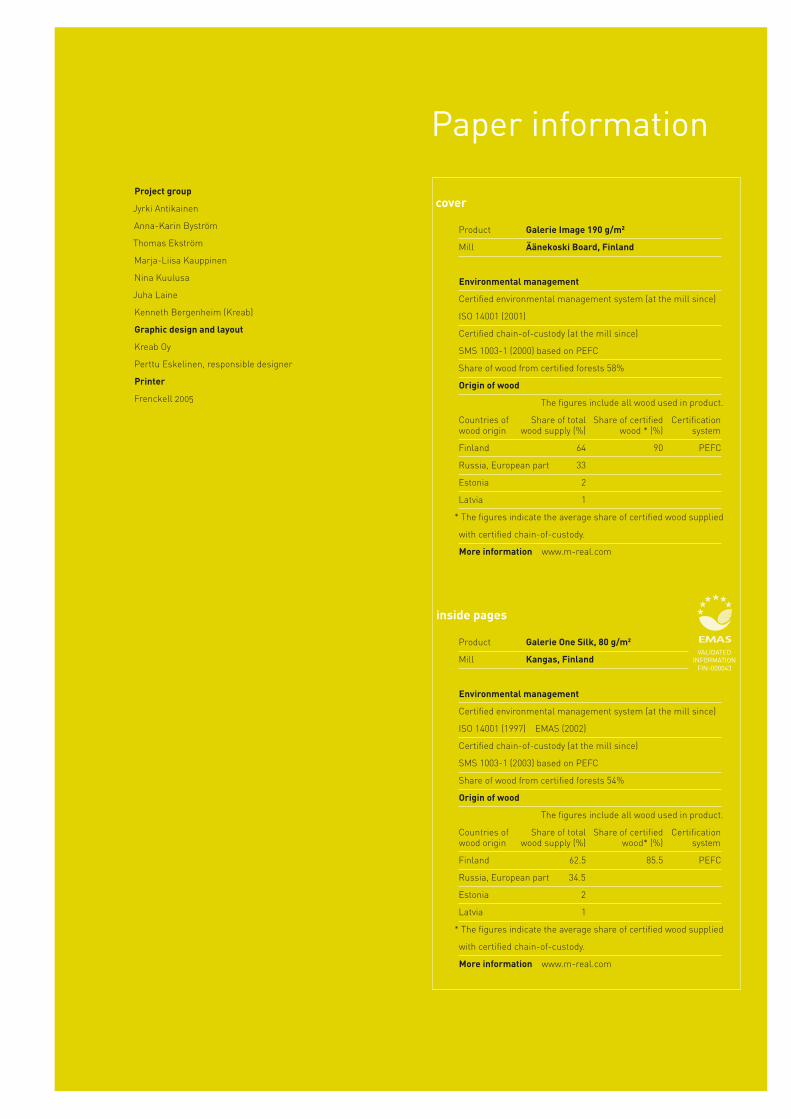
cover
Product Galerie Image 190 g/m2
Mill Äänekoski Board, Finland
Environmental management
Certifi ed environmental management system (at the mill since)
ISO 14001 (2001)
Certifi ed chain-of-custody (at the mill since)
SMS 1003-1 (2000) based on PEFC
Share of wood from certifi ed forests 58%
Origin of wood
The fi gures include all wood used in product.
Countries of Share of total Share of certifi ed Certifi cation wood origin wood supply (%) wood * (%) system
Finland 64 90 PEFC
Russia, European part 33
Estonia 2
Latvia 1
* The fi gures indicate the average share of certifi ed wood supplied
with certifi ed chain-of-custody.
More information www.m-real.com
inside pages
Product Galerie One Silk, 80 g/m2
Mill Kangas, Finland
Environmental management
Certifi ed environmental management system (at the mill since)
ISO 14001 (1997) EMAS (2002)
Certifi ed chain-of-custody (at the mill since)
SMS 1003-1 (2003) based on PEFC
Share of wood from certifi ed forests 54%
Origin of wood
The fi gures include all wood used in product.
Countries of Share of total Share of certifi ed Certifi cation wood origin wood supply (%) wood* (%) system
Finland 62.5 85.5 PEFC
Russia, European part 34.5
Estonia 2
Latvia 1
* The fi gures indicate the average share of certifi ed wood supplied
with certifi ed chain-of-custody.
More information www.m-real.com
VALIDATED INFORMATION
FIN-000043
Paper information
Project group
Jyrki Antikainen
Anna-Karin Byström
Thomas Ekström
Marja-Liisa Kauppinen
Nina Kuulusa
Juha Laine
Kenneth Bergenheim (Kreab)
Graphic design and layout
Kreab Oy
Perttu Eskelinen, responsible designer
Printer
Frenckell 2005

The complete M-real annual reporting 2004 consists of three parts:
Annual review ■ available in English, Finnish, French, German and Swedish
Corporate responsibility report ■ available in English and Finnish
Annual fi nancial report ■ available in English, Finnish and Swedish
Additional copies are available from:
M-real CorporationCorporate CommunicationsP.O. Box 20FI-02020 METSÄFinlandTel. +358 1046 94552Fax +358 1046 94531E-mail: [email protected]
The publications are also available as pdf fi les on the websitewww.m-real.com